The Role of the Care Economy in Promoting Gender ...
257
PROGRESS OF WOMEN IN THE ARAB STATES 2020 THE ROLE OF THE CARE ECONOMY IN PROMOTING GENDER EQUALITY
-
Upload
khangminh22 -
Category
Documents
-
view
0 -
download
0
Transcript of The Role of the Care Economy in Promoting Gender ...

PROGRESS OF WOMEN IN THE ARAB STATES 2020
THE ROLE OF THE CARE
ECONOMY IN PROMOTING
GENDER EQUALITY

This report has been produced within the framework of the UN Women–ILO Joint Programme “Promoting
productive employment and decent work for women in Egypt, Jordan and Palestine” funded by the Swedish
International Development Cooperation Agency (Sida) and “Production of a regional companion report to
UN Women’s Progress of the World’s Women report on ‘Families in a changing world: public action for wom-
en’s rights’” programme, funded by the Swiss Development Cooperation.

3
Foreword
Moez Doraid, PhD
Regional Director, a.i.,
UN Women Regional Office for Arab States
The year 2020 was to be one of transformation,
a year of ‘Generation Equality’, calling for the
realization of women’s rights for an equal future.
The importance of this year for gender equality
around the world is accentuated by the 25th
anniversary of the Beijing Declaration and
Platform for Action, the 20th anniversary of
United Nations Security Council resolution 1325,
on women, peace and security, the five–year milestone of the 2030 Agenda and Sustainable
Development Goal 5 on gender equality, as well
as the decennial of UN Women itself.
Yet, as we embarked into the year, the
COVID–19 pandemic unfolded and, without a deliberately gender–sensitive response, the COVID–19 crisis has put gains achieved over the last decades at risk. The pandemic found
the Arab States facing persistent gender gaps
and has further deepened the pre–existing and compounded inequalities, exposing vulnerabilities in social, political and economic
spheres.
Many outlooks anticipate the worst economic
crisis since the Great Depression, projecting
that over 170 countries will experience negative per capita economic growth in 2020, losses
of millions of jobs in the Arab region alone,
and decades worth of reversals in human
development. Critically, women’s employment
and income generation are gravely affected, as women are overrepresented in high–risk sectors, tend to work more in occupations which are less
“tele–commutable”, and are more likely to work in the informal economy.
In the midst of the crisis, women are at the
forefront of the response as health–care workers, teachers, as well as performing the majority
of the ever–rising amount of paid and unpaid care work. Rising demand for care in the context of the pandemic has deepened the existing inequalities in the gender division of labour. The
availability of affordable and quality care is key and an enabler for women, as well as men,
to allocate time to the paid labour market and
contribute to economic growth.

4
In every crisis, there is opportunity. We indeed
have the chance to build back better by making
sustained investments in the care economy and
reducing long–standing gender inequalities by valuing, supporting and equally sharing
care work. Investments in social protection
and care services can drive economic recovery
by stimulating aggregate demand, creating
employment in people–centred sectors and opening up training as well as employment
opportunities for women and men who have
lost their jobs as a result of the crisis. Quality
and affordable care also has effects across generations, developing human capital for
the future. A major employer for women, the
paid care sector in the Arab States constitutes
an important part of their economies. As we
see in this publication, the growth in the paid
care sector has outpaced growth in non–care sectors, which is a clear signal of the potential
of this economic segment, underlining the
need for smart investments to ensure that the
jobs created are decent and the care services
provided are affordable, accessible and of high–quality in order to redistribute the burden of care and positively impact the labour force
participation of women in the region.
With this in mind, it is my pleasure to introduce
Progress of Women in the Arab States 2020: the
role of the care economy in promoting gender
equality, as a companion piece to UN Women’s
Foreword
global flagship report: Progress of the World’s
Women 2019–2020: Families in a Changing World.
In addition to the in–depth analysis of the care economy in the Arab States, this publication lays
out key evidence–based policy recommendations for investing in this domain in the region.
I would like to thank our partners in Egypt,
Jordan, the State of Palestine and Tunisia for
their engagement and cooperation, as well as
UN Women country offices for their oversight of the process, including the UN Women Egypt
Country Office which, on behalf of the Regional Office, led coordination of the production of the report. Finally, UN Women is grateful to the
Government of Sweden and the Government
of Switzerland for financially supporting the production of this important report.
Through these partnerships, we are able to
generate such an essential and timely research
product that reaffirms the commitment of UN Women to promoting and supporting
evidence–based transformative action for the empowerment of women towards the
achievement of gender equality in the Arab
region and around the world.
Moez Doraid, PhD
Regional Director, a.i.,
UN Women Regional Office for Arab States

5
Foreword
Ibrahim Elbadawi, PhD
Managing Director,
Economic Research Forum (ERF)
This joint report by the Economic Research
Forum (ERF) builds on our partnership with UN
Women to conduct research and provide policy
recommendations on the care economy in the
Arab States. Policymakers in the region have
become increasingly aware of the tremendous
growth of the care economy, as the demand for
childcare and elder care grows in many countries
of the region. The ongoing COVID–19 pandemic has also highlighted critical gaps in current
systems of care provision around the world.
Making up for these gaps overwhelmingly falls
on women and girls in the form of unpaid care
work, contributing to global gender inequality.
This report takes a broad view of the state of
the care economy, bringing together research,
evidence and policy recommendations on the
spectrum of paid and unpaid care work in the
Arab States. The opening chapter reflects on the context of care across the Arab States, while the following four chapters present detailed
case studies of the distribution of unpaid care
work and the characteristics and growth of the
paid care economy in each of Egypt, Jordan,
Palestine and Tunisia. The case study analyses
build on original microdata analysis of paid
and unpaid care work, in many cases using data
from ERF’s Open Access Micro Data Initiative
(OAMDI). This collaboration with UN Women
thus builds on ERF’s focus on strengthening
data availability and evidence–based policy recommendations in the region.
The report demonstrates that the ratio of
women’s to men’s time spent in unpaid care
reaches as high as 19:1 in some countries of the region. This level of inequality in the
performance of unpaid care work contributes
to the region’s substantial levels of gender
inequality in labour force participation, among
other economic and social domains. Women are
also overrepresented in the paid care sector
across the region. Investments in this sector
could thus contribute to growth in women’s
employment, as well as expand the availability of quality early childhood care and education
and elder–care services. Yet employment in the private, paid care sector is vulnerable to
informality, gender wage gaps and low worker
qualifications. It is essential to find solutions to these challenges for workers in the care
economy, particularly to provide more equal
opportunities for women in the workforce and to
tackle the emerging health and economic issues
associated with the global pandemic. Overall,

6
Foreword
concerted policy efforts are needed in countries across the region to develop comprehensive
national care strategies that address the needs
of care receivers and of caregivers, both paid
and unpaid.
I would like to take this opportunity to thank
everyone who has contributed to the production
of this report. I am grateful to all contributors,
reviewers and discussants for patiently working
through a number of revisions of the chapters to
bring them to their current form. This research
offers important insights that expand the scope and depth of data and research on the care
economy and will, I hope, ultimately contribute
to shaping better and more informed policies
and solutions across the region. Finally, I am
grateful to the Government of Sweden and the
Government of Switzerland for their financial support for the production of this important
report.
Ibrahim Elbadawi, PhD
Managing Director,
Economic Research Forum (ERF)

7
UN Women staff
Egypt Country Office: Mariam Tabatadze,
Engy Amin, Gielan Elmessiri
Jordan Country Office: Hazar Asfoura,
Diya Nanda, Ana Lukatela
Palestine Country Office: Maryse Guimond,
Hadil Naser, Inas Margieh, Mira Salameh
Tunisia and Libya Country Office:
Ahlem Bousserwel, Maria Begona Lasaga-
baster Olazabal, Saskia Binet
Regional Office for the Arab States:
Yllka Gerdovci Cancel, David Svab, Donia
Abou–Taleb, Mai ElGammal, Shatha
Mahmoud
External reviewers
Valeria Esquivel, Jacques Charmes,
Ipek Ilkkaracan, Magued Osman, Caroline
Krafft, Breigheith O. Breigheith,
Acknowledgments
ERF report team
Principal Investigator: Maia Sieverding
Senior advisor: Ragui Assaad
Lead quantitative analyst: Irene Selwaness
Chapter authors:
Chapter 1: Maia Sieverding,
Marina Hesham, Racha Ramadan,
Ragui Assaad
Chapter 2: Irene Selwaness,
Imane Helmy
Chapter 3: Ibrahim AlHawarin,
Nasma Berri, Irene Selwaness, Maia Siev-
erding
Chapter 4: Belal Fellah
Chapter 5: AbdelRahmen El Lahga,
Mohammed Amara
Policy boxes contributors: Daryn Howland,
Imane Helmy, Moundir Lassassi, Marina Hesh-
am
Research assistants: Nasma Berri,
Marina Hesham
Programme coordinators: Yasmine Fahim,
Eman El–Hadary
Communication and policy outreach
coordinator: Sherine Ghoneim
Production and outreach
Copy editing: Jen Ross
Report graphic design: Namees Nabeel

ContentsForeword by the UN regional office 3
Foreword by the ERF 5
Acknowledgments 7
Acronyms and abbreviations 25
Glossary 27
Executive summary 30
THE CARE ECONOMY IN THE ARAB STATES 37
1.1 Introduction to the Report 38Scope and outline of the report 39
Defining paid and unpaid care work 40
1.2 Report methodology 42
1.3 The context of care in the Arab States 45Demographic trends will change care needs 46
Unpaid care is a barrier to women’s labour force participation 48
Social norms and the (re)distribution of care work 50
1.4 An overview of care policies and services 56Paid care leaves 56
Care services 62
1.5 Key comparative Findings from the country
case studies 66The ratio of women’s to men’s time on unpaid care work 66
1.6 Recommendations 76Adopt coordinated national strategies on the care economy 76
Invest in national time–use surveys 76
Bring maternity leave policies 77
Expand Early Childhood Care and Education 77
Start to plan for a range of long–term care options 78
Address professionalization and job quality 78
Seek to change gender norms 79
1

The evolution of paid and unpaid care work in Egypt 802.1 Overview 82
2.2 Care policies and services in Egypt 83
Early childhood care and education 83
Elder care 87
Labour market regulations and care–related provisions 88
2.3 Recognizing unpaid care work 90Gender and marital status are key determinants of time \spent in unpaid care
work 90
Women’s time in unpaid care work and socioeconomic characteristics 93
The effect of children and the elderly 95
on women’s time in unpaid care 95
2.4 Characteristics and growth of the paid care economy 99Increasing private sector care provision 100
Feminization of the paid care sector 100
The care sector has driven the increase in women’s private sector
employment 101
The feminization of the private sector 104
Worsening job quality in paid care sectors 104
2.5 From key fΙndings to informed policy recommendations 106Summary of key findings 106
Policy recommendations 108
Implement family-friendly labour market regulations for care leave and
flexible work 110
Promoting quality early childhood care and education in Egypt 112
2

THE CARE ECONOMY IN JORDAN 114
3.1. Overview 116
3.2 Care policies and services in Jordan 118
Early childhood care and education (ECCE) 118
3.3 Unpaid care work 125Women do the vast majority of care work in Jordan 125
Women’s time spent on care work does not decrease 126
Variation in women’s time spent in care work 127
The effect of children, elderly and disabled household members
on women’s time in unpaid care 129
3.4 The paid care sector 132The size of the paid care sector 132
Care sectors are a major source 134
of employment for women 134
Employment growth in paid care 135
sectors 135
The quality of care jobs 138
Characteristics of care workers 140
3.5 Towards policy interventions 142
Key findings 142
Policy recommendations 143
Maternity leave - and its financing in Jordan 146
THE CARE ECONOMY IN PALESTINE 149
4.1 Overview 151
4.2 Brief overview of the Palestinian context 151
4.3 Care policies and services in Palestine 153Early childhood care and education (ECCE) 153
3
4

4.4 Unpaid care work in Palestine 157Women assume the responsibility for unpaid care 157
Marriage is a key determinant of women’s time spent on unpaid care 158
Women’s time allocation 161
4.5 Characteristics of the Palestinian paid care sector 167Educators and health–care workers 167
The paid care sector Establishment–level analysis 168
4.6 Formality and compliance 172Formality levels are lowest for private sector and social care workers 172
Compliance with minimum wage 174
Enhance compliance with the national minimum wage 175
4.7 Conclusions and policy recommendations 175Summary of main findings 175
Policy recommendations 176
Lessons from the 2017–2022 National Strategy - on Early Childhood Development in Palestine 178
THE CARE ECONOMY IN TUNISIA 181
5.1 Overview 183
5.2 Care policies and services in Tunisia 184Early Childhood Care and Education (ECCE) 184
Elder care 186
Paid leaves 187
5.3 Unpaid care work in Tunisia 187Gender disparities in unpaid care work 187
Regional disparities in unpaid care work 189
Unpaid care work by age and marital status 191
More educated women 192
Distribution of unpaid care work 194
Household structure and women’s time spent in unpaid care work 195
5

5.4 Paid care work 197The contribution of the care sector to the overall economy 198
Women have a strong role in the paid care economy 200
Role of the public sector 202
Age and education structure of care workers 203
The quality of paid care jobs is variable 203
5.5 Key fΙndings and 205policy recommendations 205
Key findings: Unpaid care 205
Key findings: The paid care sector 206
Policy recommendations 206
The expansion of preschool education in Algeria 209
Appendix 1: Methodological appendix 212
Appendix 2: Supplementary tables 220
Appendix 3: List of national labour laws consulted 231
Endnotes 232
References 249

List of Boxes, Figures, and Tables
BoxesBox 1.1: Recognition begins with measurement 43
Box 1.2: Migrant domestic workers in the Arab States 44
Box 1.3: Care work during the covid–19 pandemic 75
Box 2.1: Data and methods 90
Box 3.1: Data and methods 124
Box 4.1: Data and methods 157
Box 4.2: Redistributing responsibility for unpaid care: raising awareness
regarding gender equality 162
Box 4.3: Options for expanding ECCE in Palestine: Highlights
from international experience 165
Box 5.1: Data and methods 187
Figures
Figure 1.1: The relationship between care workers and care sectors 42
Figure 1.2: Total young– and old–age dependency ratios in selected Arab States, 2020,
2035 and 2050 47
Figure 1.3: Share of the population under the age of 5, 2010–2050, Arab States 47
Figure 1.4: Share of the population aged 65 and older, 2010–2050, Arab States 48
Figure 1.5: Female labour force participation rate by world region, 2000–2019 49
Figure 1.6: Percentage of men and women preferring that women have a paid a job, that
women only do care work at home, or that women do both 51
Figure 1.7: Percentage agreeing that men should have priority when jobs are scarce
(panel a) and that being a housewife is as fulfilling as working for pay (panel b), by
gender, selected arab and other LMICs
52
Figure 1.8: Percentage agreeing that men should have priority when jobs are scarce
(panel a) and that being a housewife is as fulfilling as working for pay (panel b), by
gender, selected arab countries over time 53

Figure 1.9: Support for husbands helping their working wives with direct and indirect care
activities, egypt and jordan 54
Figure 1.10: Fathers’ participation in direct care activities in the month prior to the survey,
egypt, morocco, lebanon and palestine 55
Figure 1.11: Participation in indirect and direct care activities when age 13–18, men and
women in egypt, morocco and palestine, 2016–2017 55
Figure 1.12: Paid maternity leave duration in the arab states, in weeks 57
Figure 1.13: Paternity leave duration in the arab states, in days 60
Figure 1.14: Period after birth during which paid breastfeeding breaks are provided
(months), selected arab states 61
Figure 1.15: Gross enrolment ratios for pre–primary education, 2005–2018, selected arab
states 63
Figure 1.16: The chances of the most and least advantaged children to attend ecceselected
arab countries 64
Figure 1.17: Conditions for establishing nursery services in the workplace 65
Figure 1.18: Cross–national comparison of weekly hours spent in direct and indirect care
work, by sex and marital status 67
Figure 1.19: Total weekly hours of work performed by women and men 68
Figure 1.20: Percentage of total hours in a week spent on all forms of work, employed men
and women 70
Figure 1.21: The effect of different household structures on married women’s time spent in
unpaid care work 70
Figure 1.22: The share of care sectors in total employment in selected Arab States 72
Figure 1.23: Employment in care sectors as a percent of total male
and female employment 72
Figure 1.24: Share of workers that are women, by occupation 73
Figure 2.1: Net enrolment ratio in pre–primary education, ages 3–5, egypt, 1999–2018 86
Figure 2.2 Average weekly hours of paid work and unpaid care work (direct and indirect) by
sex and marital status, ages 15–64, elmps 2006 and 2012 91
Figure 2.3: Weekly hours of paid work and unpaid care work (direct and indirect) by sex,
employment and marital status, ages 15–64, elmps 2006 and 2012 92
Figure 2.4: Percentage of weekly time spent on different types of work by sex, ages 15–64,
elmps 2006 and 2012 93
Figure 2.5 Weekly hours of paid work and unpaid care work (direct and indirect) by marital
status and age group, ages 15–64, elmps 2006 94
Figure 2.6: Weekly hours of paid work and unpaid care work (direct and indirect) by
marital status and education, ages 15–64, elmps 2006 95
Figure 2.7: Weekly hours of paid work and unpaid care work (direct and indirect) by
marital status and wealth quintiles, among women, ages 15–64, elmps 2006 96
Figure 2.8: Weekly hours of paid work and unpaid care work (direct and indirect) by
marital status and hiring a domestic worker, ages 15–64, elmps 2012 96
Figure 2.9: Predicted additional weekly hours of care work with a child under age 3 in the
household, by education, married women age 15–64, elmps 2006 97
Figure 2.10: Predicted additional weekly hours of care work with a child (3–5 years) in the
household, by education, married women aged 15–64, elmps 2006 98
Figure 2.11: Predicted additional weekly hours of care work with a child (6–17 years) in the
household, by education, married women aged 15–64, elmps 2006 98
Figure 2.12: Predicted additional weekly hours of care work with an elderly in the
household, by marital status, women aged 15–64, elmps 2006 99
Figure 2.13: The size of the care sector as a percentage of total employment by institutional
sector, lfs 2009–2017 100
Figure 2.14: The size of the care sector as a percentage of total employment by institutional
sector, LFS 2009–2017 100
Figure 2.15: The sectoral composition of paid employment by industry, LFS 2009–2017 101
Figure 2.16: The proportion of women by care sector/occupation and institutional sector,
ages 15–64, lfs 2015–2017 102
Figure 2.17: Annual employment growth rate by industry group and institutional sector for
men and women between 2009–2017, LFS 103
Figure 2.18: The proportion of those who are married among employed women by industry
section and institutional sector, lfs 2009–2017 104
Figure 2.19: The proportion of formally employed workers by sex and industry section in
the private sector, LFS 2009–2017 105

Figure 2.20: Proportion of formal workers by sex and by care occupations in the private
sector, LFS 2009–2017 106
Figure 3.1: Distribution of Jordanian women aged 15+, by economic activity status and area
of residence, 2018 116
Figure 3.2: Number of kg2 classes and student enrolments in Jordan, by sector of provision,
2013–2016 119
Figure 3.3: Weekly hours of paid and unpaid (direct and indirect) work among Jordanians
aged 15–64, 2016 125
Figure 3.4: Weekly hours of paid and unpaid work by marital and employment status and
by sex, Jordanians aged 15–64, 2016 126
Figure 3.5: Percentage of time spent on different types of work per week, by marital status
and sex, Jordanians aged 15–64, 2016 127
Figure 3.6: Hours of paid and unpaid (direct and indirect) work by age, region and locality,
Jordanian women aged 15–64, 2016 128
Figure 3.7: Hours of paid and unpaid (direct and indirect) work, by education and marital
status, Jordanian women 15–64, 2016 129
Figure 3.8: Hours of paid and unpaid (direct and indirect) work, by household hiring of
domestic help and by marital status, Jordanian women 15–64, 2016 129
Figure 3.9: Predicted additional weekly hours of unpaid care work with a child under 3 in
the household, married Jordanian women aged 15–64, 2016 130
Figure 3.10: Predicted additional weekly hours of unpaid care work with an elderly or
disabled/chronically ill household member, by marital status, Jordanian women aged
15–64, 2016 131
Figure 3.11: The percentage of care and non–care sectors in total employment, by
institutional sector, 2005–2018 132
Figure 3.12: Sectoral composition of jobs by institutional sector, 2005–2018 133
Figure 3.13: Composition of care occupations by institutional sector, 2015–2018 133
Figure 3.14: Distribution of workers in Jordan by sex, in care and non–care occupations,
public sector, 2005–2018 134
Figure 3.15: Distribution of workers by sex, in care and non–care sectors, private sector,
2005–2018 135

Figure 3.16: Proportion of Jordanian workers who are women, by occupation and
institutional sector, 2015–2018 136
Figure 3.17: Average annual employment growth (percentage) in care and non–care
activities, Jordanian workers, 2005–2017 136
Figure 3.18: Average annual employment growth (percentage) in care and non–care
activities by institutional sector, Jordanian workers, 2005–2017 137
Figure 3.19: Proportion of private sector workers who are formal, by gender and
occupation, 2017 139
Figure 3.20: Distribution of workers in Jordan, by weekly working hours and occupation,
2015–2018 139
Figure 3.21: Distribution of workers in Jordan, by age and occupation, 2015–2018 140
Figure 3.22: Distribution of women workers in Jordan, by marital status and occupation,
2015–2018 142
Figure 4.1: Weekly time spent in unpaid care work (hours per week), men and women by
region and locality, 2012/2013, Palestine 159
Figure 4.2: Weekly time spent in unpaid care work (hours per week) among men and
women, age 15–64, 2012/2013, Palestine 159
Figure 4.3: Weekly time spent in unpaid care work among men and women, age 15–64, by
marital status and employment status, 2012/2013, Palestine 160
Figure 4.4: Percentage of total weekly time spent in unpaid care work among men and
women, age 15–64, by marital status and employment status, 2012/2013, Palestine 161
Figure 4.5: Weekly time spent on unpaid care work (hours per week), by women,
according to household size and marital status, 2012/2013 162
Figure 4.6: Time spent on unpaid care work (hours per week), by women, according to
household income category and marital status, 2012/2013 163
Figure 4.7: Weekly time spent on unpaid care work for women, by age structure and
marital status, 2012/2013 164
Figure 4.8: Weekly time spent on unpaid care work for women, by educational level,
2012/2013 164
Figure 4.9: Predicted additional weekly hours of unpaid care work with a child of different
age groups in the household, married women, 2012/2013 166

Figure 4.10: Predicted additional weekly hours of unpaid care work with a child of different
age groups in the household, married women, by educational attainment 2012/2013 166
Figure 4.11: Distribution of paid care workers by occupation and women, 2017 167
Figure 4.12: Educational distribution of workers, by paid care occupation, 2017 169
Figure 4.13: Distribution of establishments and employment across the paid care sector,
2017 170
Figure 4.14: Women’s share of employment in paid care sectors, 2017 170
Figure 4.15: Annual growth rate in the number of establishments across paid care and non
care sectors, 2007–2017, Palestine 171
Figure 4.16: Annual employment growth rate across paid care and non–care sectors, 2007–
2017, Palestine 171
Figure 4.17: Prevalence of formality by type of employer and type of paid care occupation,
2017, Palestine 172
Figure 4.18: Prevalence of formality in paid care sector and non–care sectors, 2017,
Palestine 173
Figure 4.19: Minimum wage share in the paid care sector and non–care sectors, 2017, West
Bank 174
Figure 5.1: Distribution of children aged 0–5 years by ECCE enrolment, 2015 185
Figure 5.2: Percentage of weekly time spent in different types of work, by gender and
marital status, age 15–64 189
Figure 5.3: Percentage of weekly time spent in different types of work by gender, marital
and working status, age 15–64 190
Figure 5.4: Weekly hours spent in paid work and unpaid care work (direct and indirect)
among women, by region and area of residence, age 15–64 190
Figure 5.5: Weekly hours spent in paid work and unpaid care work (direct and indirect)
among women, by region and marital status, age 15–64 191
Figure 5.6: Weekly hours spent in paid work and unpaid care work (direct and indirect)
among women, by age group and marital status 192
Figure 5.7: Weekly hours spent on paid work and unpaid care work (direct and indirect)
among women, by education and marital status 193

Figure 5.8: Weekly hours of paid and unpaid care work (direct and indirect) by sex,
working and marital status, ages 15–64 194
Figure 5.9: Weekly hours of paid and unpaid care work performed by women, by marital
status and type of employment, ages 15–64 195
Figure 5.10: Predicted additional weekly hours of unpaid care work with a child under 3 in
the household, by education, Tunisian married women 15–64 196
Figure 5.11: Predicted additional weekly hours of unpaid care work with a child aged 3–5 in
the household, by education, Tunisian married women 15–64 196
Figure 5.12: Predicted additional weekly hours of unpaid care work with a child aged 6–17
in the household, by education, Tunisian married women 15–64 197
Figure 5.13: The distribution of care and non–care sectors in total employment, by
institutional sector, 2010–2019 199
Figure 5.14: Average annual employment growth by occupation, 2010–2019 200
Figure 5.15: Share of women in different economic sectors, 2010–2019 201
Figure 5.16: Share of total employment in care and non–care sectors, by institutional
sector, among women, 2010–2019 201
Figure 5.17: Percentage of employment in the public sector,
by economic sector, 2010–2019 202
Figure 5.18: Composition of paid care occupations, by age group, 2019 203
Figure 5.19: Composition of paid care occupations, by education level, 2019 204
Figure 5.20: Share of workers that are formal, by occupation, 2019 204
Figure 5.21: Share of workers that are formal, by occupation, women, 2019 205

Tables
Table 1.1: Typology of the care economy 41
Table 2.1: Evolution in the number of children aged 0–3 versus the supply
of day–care establishments, egypt, 1996, 2006, 2017 84
Table 2.2: Pre–primary enrolment data by type of kg provision and gender 85
Table 3.1: Distribution of nurseries by type of nursery and location, Jordan, 2017 121
Table 3.2: Distribution of those who left their work, by reason and gender, 2018 138
Table 4.1: Kindergarten enrolments by region, for scholastic years 2014–2019 154
Table 4.2: Time allocated to unpaid care at the national level (hours per week),
2012/2013 158
Table 4.3: Distribution of waged employment across paid care work, 2017 168
Table 4.4: Prevalence of formality by gender, type of employer and type of paid
care occupation, 2017, Palestine 173
Table 5.1: Distribution of ECCE professionals by education level 185
Table 5.2: Average time spent on direct and indirect care work by sex and marital
status, Tunisians aged 15–64, TLMPS 2014 188
Table 5.3: Occupational distribution in Tunisia 2010–2019, Tunisians (age 15–64) 198
Table 5.4: Economic activities distribution 2010–2019 199
Table M1: Classification of activities captured in the LMPS surveys, according to
ICATUS care work definitions 214
Table M2: Sample sizes of the surveys used for the unpaid care analysis 216

Table A1: Dependency ratios in the Arab States, 2020, 2035 and 2050 220
Table A2: Female labour force participation rates (percentage of women aged
15–64) in the Arab States, 2000–2019 221
Table A3: Maternity leave provisions in the Arab States 222
Table A3 (Continued): Maternity leave provisions in the Arab States 223
Table A3 (Continued): Maternity leave provisions in the Arab States 224
Table A4: Paternity leave provisions in the Arab States 225
Table A5: Legal provisions for paid breastfeeding breaks in the Arab States 226
Table A5 (continued): Legal provisions for paid breastfeeding breaks in the Arab
States 227
Table A6: Childcare leave provisions in the Arab States 228
Table A7: Leave provisions for children’s health needs in the Arab States 229
Table A8: Requirements for the establishment of nurseries in workplaces in the
Arab States 230

25
Acronyms and abbreviations
CAPMAS Central Agency for Public Mobilization and Statistics (Egypt)
CBJ Central Bank of Jordan
CBO Community–based organization
CSO Civil society organization
DoS Department of Statistics (Jordan)
ECES Employment and Compensations of Employees Survey (Jordan)
ECCE Early Childhood Care and Education
ECD Early Childhood Development
EGP Egyptian Pounds
ELMPS Egypt Labour Market Panel Survey
ERF Economic Research Forum
EUS Employment and Unemployment Surveys (Jordan)
FLFP Female labour force participation
GDP Gross Domestic Product
GER Gross enrollment ratio
ICATUS International Classification of Activities for Time Use Statistics
ILO International Labour Organization
INS National Institute of Statistics (Tunisia)
ISCO International Standard Classification of Occupations
ISIC International Standard Industrial Classification of all Economic Activities
JLMPS Jordan Labour Market Panel Surveys
JNCW Jordanian National Commission for Women
JOD Jordanian Dinars
KG Kindergarten
LFS Labour Force Survey
LMICs Low and middle–income countries
LMPS Labour Market Panel Survey
LTC Long–term care
MENA Middle East and North Africa
MoE Ministry of Education
MoETE Ministry of Education and Technical Education (Egypt)
MoH Ministry of Health
MoL Ministry of Labour (Palestine)
MoSD Ministry of Social Development (Jordan)
MoSS Ministry of Social Solidarity (Egypt)
MWFCS Ministry of Women, Family, Childhood and Seniors (Tunisia)
NCD Non–communicable disease

26
Acronyms and abbreviations
NCFA National Council for Family Affairs (Jordan)
NGOs Non–governmental organizations
PCBS Palestine Central Bureau of Statistics
SDGs Sustainable Development Goals
TBSWM Time–Budget Survey of Women and Men in Tunisia
TLMPS Tunisia Labour Market Panel Survey
UAE United Arab Emirates
UNRWA United Nations Relief and Works Agency for Palestine Refugees in the Near East
WHO World Health Organization
WVS World Values Survey

27
Glossary
Care sectors: Encompass the major sectors of
economic activity, as defined by the International
Standard Industrial Classification (ISIC), that
produce care. These are: education, health, social
care and domestic work.
Care policies: Care policies allocate resources
towards the recognition, redistribution or reduction
of unpaid care work.
Care services: Encompass paid services that
provide care for children, disabled persons, the
elderly or the ill. Care services can be provided
through the public, private and nonprofit sectors.
Care workers: All of the professions that engage
in indirect or direct paid care activities, regardless
of whether the employment is based in the public,
private or non–profit sector.
Care workers in care sectors: Persons who
engage in paid jobs that provide care, (such as
teachers, nurses and helpers for the elderly), that
work in establishments in care sectors.
Care workers in non–care sectors: Persons
who engage in paid jobs that provide care, but
who work in an establishment outside the care
sector. For example, a nurse who works in a private
construction company.
Direct care work: The personal, relational
activities of taking care of another person, such as
nursing a baby, reading to a child or helping an
elderly person to dress or take a bath.
Early Childhood Care and Education (ECCE): All programmes supporting the
development and learning of children from their
birth until their entry into primary school, including
early childhood development programmes for
children under 3 years of age and preprimary
education for children aged 3 until the enrolment
age for primary school.
Elderly population: The population aged 65
years or older.
Employer–liability system: An employer–
liability system is a system of financing paid leaves
in which the cost of the income provided to workers
during their leave is borne by the employer.
Income replacement level: The share of monthly
earnings (cash benefits) that is paid during a paid
leave.
Indirect care work: Consists of tasks that do
not involve face–to–face interaction, but that are
needed to sustain direct care, including cleaning,
cooking, shopping for household items and
maintenance work within the home.
International Classification of Activities for Time Use Statistics (ICATUS): A standard
international classification of all the activities
that an individual may perform within a day. It is
developed and maintained by the United Nations
Statistics Division and is a primary reference for
time–use data. The ICATUS classification includes
nine major categories of activity, each of which is
further divided into subcategories. In this report,
ICATUS is used to identify activities related to direct
and indirect care work.

28
Glossary
International Standard Industrial Classification of all Economic Activities (ISIC): ISIC is the international reference
classification of all productive activities. It is
developed and updated by the United Nations
Department of Economic and Social Affairs. ISIC
is designed for the purpose of producing unified
descriptions of the economic activity of an entity,
such as a private company or a public service
point, like a school. Economic activity is described
by sector, and each sector is subdivided into
subcategories indicated by digits; the greater the
number of digits, the more detailed the category. In
this report, the ISIC classification is used to develop
standard definitions for establishments operating
in the care sector, i.e. establishments whose main
economic activity is education, health, social care
or domestic work.
International Standard Classification of Occupations (ISCO): ISCO is developed
and maintained by the International Labour
Organization. It facilitates the process of
compiling comparable statistics on employment
by categorizing occupations according to an
internationally agreed–on set of tasks for each
job. Jobs are organized by major groups and sub–
groups according to digits. As with ISIC, more digits
indicates greater specificity of the type of job. In
this report, ISCO is used to identify care workers in
education, health, social care and domestic work,
regardless of the type of establishment they work
in.
Labour force participation rate: The
proportion of the working age population that
is active in the labour market, whether they are
working or they are looking for work (unemployed).
Non–care workers in care sectors: Staff
who support care work by accomplishing tasks
such as finance, administration, accounting and
transportation within establishments in care
sectors.
Old age dependency ratio: The ratio
between the elderly population and the working
age population in the country. Higher old age
dependency ratios are a result of population aging.
Paid care work: Consists of direct or indirect care
work that is performed for pay or profit.
Paid care leaves: Give individuals the right to
time and income to temporarily leave the labour
market in order to care for a child, elderly, disabled
or ill family member.
Social care: Encompasses economic activities,
or professions, related to providing residential and
non–residential care for the elderly or disabled, as
well as childcare services.
Total dependency ratio: The ratio between
the sum of the dependent population (the
population aged less than or equal to 14 years old
and the elderly population) and the working age
population.
Unpaid care work: The provision of direct or
indirect care without remuneration, carried out
within the household. Unpaid care work is typically
measured, as in this report, through the amount of
time that individuals spend per week or per day in
performing care activities.

29
Glossary
Social insurance: A social insurance system
guarantees a minimum level of income for
workers in the case of retirement, or temporary
absence from work due to injury, illness, maternity
and paternity leave or other paid leaves. Social
insurance systems are one means of financing paid
care leaves.
Wealth quintile: Is a way to categorize the
economic status of a population. Wealth quintiles
based on household ownership of durable assets
are commonly used when income data are
inaccurate or unavailable. The total population is
divided into five equal groups (quintiles). The 1st
quintile represents the 20% of the population with
the lowest wealth. The 5th quintile represents the
20% of the population with the highest wealth.
Working age population: The population
aged 15 through 64 years old.
Young age dependency ratio: The ratio
between the population aged 14 or less and
the working age population. The young age
dependency ratio is typically higher in countries
with high fertility rates.

CARE ECONOMY AND PROMOTING GENDER EQUALITY
30
This report posits that care is a public good that
is fundamental to our societies and economies,
with benefits that extend beyond those who
receive it.1 Yet although care is a public good,
in most societies the responsibility for providing
care falls overwhelmingly on families. Within
families, it falls predominantly on women and
girls, restricting their opportunities to engage in
paid employment, education, leisure and self–
care. The availability of care services and public
policies that could redistribute some of the care
burden remain underdeveloped in many countries,
including in the Arab States.2 At the same time,
changing demographic trends, including declining
fertility rates, population aging and the increasing
nuclearization of families, are challenging care–
provision systems that rely on women’s unpaid
labour.3 Perhaps more than any other event in
recent history, the ongoing COVID–19 pandemic has
exposed the wide gaps in care policies and services
that leave women and their families vulnerable to
negative social, economic and health outcomes.4
Addressing these gaps will require concerted policy
efforts across the region.
Women play an outsized role in the care economy
in the Arab States, performing 4.7 times more
unpaid care work than men – the highest female–
to–male ratio anywhere in the world.5 Furthermore,
while fewer than a quarter (22 per cent) of women
in the region are in the paid labour force,6 over half
(53 per cent) of employed women work in care–
related jobs, also the highest of any world region.7
Tapping into the potential of the paid care economy
– a sector that has received relatively little policy
focus in the region – could thus be an important
way to support women’s economic empowerment.
This report is the Arab States regional companion
to UN Women’s global report Progress of the World’s
Women 2019–2020: Families in a changing world.
Building on unique analysis of the care economy
in the region, it produces evidence–based policy
recommendations for investing in the care economy
in the Arab States. It details the demographic and
social context of care provision in the Arab States,
the status of key care policies and services related
to paid leave, Early Childhood Care and Education
(ECCE) and elder care, and includes four country
case studies – from Egypt, Jordan, the State of
Palestine and Tunisia – that provide in–depth data
analysis on both unpaid and paid care work and
make national policy recommendations.
Report methodology and analytical approach
This report takes a comprehensive view of the
care economy, which is the total of all unpaid
and paid care work. Case studies rely on multiple
data sources – including time–use data and
national labour force surveys – to present a
comprehensive analysis of both unpaid and paid
care work. Statistical definitions and analyses
were standardized to the degree possible to
allow for cross–national comparisons of the care
economy in the region. The analyses are linked
conceptually through the “5R” framework – which
aims to recognize, reduce and redistribute unpaid
care work while rewarding paid care work and
increasing the representation of care workers in the
determination of their working conditions.8
The context of care in the Arab States
Demographic, economic and social characteristics
play an important role in shaping care needs and
the distribution of the unpaid and paid care work
that meets those needs. Although dependency
ratios in the Arab States region are projected to
Executive summary
EXECUTIVE SUMMARY
31
decline slightly by 2050, they will shift substantially
– with young children aged 0–5 representing a
smaller percentage of the population, and the
elderly population aged 65+ growing.9 These
trends reveal the need for dual investment in
ECCE and elder–care services. Investments in
paid care services are particularly important to
support women’s labour force participation in
the Arab States, which is currently the lowest of
any world region.10 Reasons for the low labour
force participation rate relate in part to women’s
unpaid care responsibilities, and the lack of care
services and policies that could help reconcile these
responsibilities with paid employment. Gender role
attitudes favouring a ‘male–breadwinner/female–
caregiver’ division of labour also prevail in the
region and show little sign of substantial change.
The state of care policies and services in the Arab region
Care policies allocate resources towards the
recognition, redistribution and reduction of unpaid
care work.11 While many countries in the region
implement selected care policies, national–level
coordination is often lacking. This leads to gaps in
both legal and effective coverage of care services
and benefits, exacerbating the vulnerabilities of
those with the least access to resources to support
care needs.12
Paid care leaves
The Arab States are the only major world region
where no country meets all three standards for
maternity leave set by the International Labour
Organization (ILO).13 Although nearly all countries
meet the standard of replacing at least two–
thirds of usual income, only four provide the
recommended 14 weeks of maternity leave. Most
countries in the region fund maternity leave
through employer–liability systems rather than
the social insurance system, which can create
a disincentive for employers to hire and retain
women.14 Only four countries in the region provide
paternity leave, which is paid for only 2–3 days,
insufficient time for fathers to establish caregiving
roles. Several countries also allow women to take
unpaid childcare leaves for young children, varying
from three months to two years. Other more flexible
forms of paid care leaves in cases of illness of a
child or care for elderly relatives are uncommon.
There are also substantial coverage gaps in all
forms of leave due to high informality in the private
sector, which means that women (and men) often
do not benefit from leaves to which they are legally
entitled. Shifting to a social insurance model of
leave financing would not only reduce disincentives
to hiring women, but could also be accompanied
by measures to expand coverage of maternity and
other care leaves to workers in the informal sector.
Early Childhood Care and Education
The report reveals that having a child under the
age of 3 in the household significantly increases
women’s time spent on unpaid care work. Along
with greater participation of men in care giving,
ECCE services can help redistribute some of this
time, allowing women more time for employment
or other activities.15 Analyses show that some of
the cost of public investment in universal, high–
quality ECCE services can be offset by returns
from increased employment, particularly among
women.16 As ECCE also has important benefits for
the social, cognitive and health outcomes of young
children, universal, quality ECCE could reduce
inequalities in early childhood outcomes.17 Yet
currently, pre–primary education is not compulsory

CARE ECONOMY AND PROMOTING GENDER EQUALITY
32
in any of the 17 Arab States.18 Several countries
have seen improvements in ECCE enrolment, but
most had gross enrolment rates of 30–60 per cent
in 2018, well below universal.19 While cross–national
data are not available by age, data from the case
study countries indicate that enrolment rates
among younger children (under 3) are considerably
lower than those of pre–primary age (age 3 – 5).
There are also severe inequalities in ECCE access,
with children from wealthier households much more
likely to attend than those from poor households.20
To avoid exacerbating these inequalities, public
investments are needed in universal ECCE. Drawing
from international experience, a variety of delivery
models (public, private, non–profit and mixed)
should be explored. While data on the quality of
ECCE in the region is generally thin, the country
case studies also point to quality issues that affect
both children and workers in this sector, the latter
being predominantly women with lower education
than other care workers. Investments in ECCE must
therefore address regulation and quality as well as
increased access.
Elder care services
Aging has not yet figured on the policy agendas
of many Arab States. Only seven countries
have national strategies or legal frameworks to
improve the situation of older persons.21 Social
care services for the elderly, including residential
and non–residential long–term care (LTC) are
underdeveloped. Additionally, the region lacks
trained workers to provide social–care services.22
The report shows that social–care workers tend to
be less educated and suffer from poorer working
conditions as compared to education and health–
care workers. Although a few countries have begun
initiatives to establish residential or non–residential
LTC services, these remain scattered and limited
in relation to the growing elderly population. In
addition to placing the responsibility for unpaid
care for the elderly on family members, usually
women, the lack of LTC services in the region will
disproportionately affect elderly women who have
longer life expectancy and higher rates of non–
communicable diseases than men.23
Key comparative findings from the country case studies
The ratio of women’s to men’s time on unpaid care work reaches as high as 19:1.
Women in the four countries studied spent 17–34
hours per week on unpaid care work while men
usually spent just a few hours per week. The ratio
of women–to–men’s time spent on unpaid care
work reaches 19:1 in Jordan, 12:1 in Egypt, 7:1 in
Palestine and 6:1 in Tunisia. The goal of more equal
distribution of unpaid care thus remains a long way
off in the region. Marriage is the key predictor of
how much time women spend on unpaid care, and
married women consistently spent more than twice
as much time on unpaid care work as unmarried
women.
The gender gap in total work highlights the drastic undervaluation of women’s economic contributions.
Women’s time spent on unpaid care does not
decrease when they engage in paid employment.
Even when women have paid employment outside
the home, they spend the same amount of time
in unpaid care as women who are not employed.
In short, women’s unpaid care responsibilities are

EXECUTIVE SUMMARY
33
not reduced or redistributed. Women therefore
spend more total hours on work (paid and unpaid)
than men. Married, employed women spend the
most time working – at over 65 hours per week
in Egypt, Jordan and Palestine, and 49 hours per
week in Tunisia – while married, employed men
spend between 44–53 hours per week working. The
gender gap in total work highlights the degree to
which focusing only on low rates of female labour
force participation in the region gives a misleading
impression that women are economically inactive.
Recognition of the hidden value of women’s unpaid
care work for both social and economic functions
in the region is thus critical to bringing the care
economy higher up on the policy agenda.
Care services can play an important role in redistributing women’s unpaid care work.
Having a child age 0–3 was the strongest predictor
of time spent on unpaid care work among married
women. This is in part due to the needs of this age
group but it is likely also affected by the low rates of
ECCE enrolment among children under 3 compared
to those aged 4–5. The expansion of ECCE services
therefore has great potential to redistribute some
unpaid care work from the household to the public
sphere.
Paid care sectors constitute an important part of regional economies.
The paid care sector contributes substantially to
employment in the region, constituting between
12–15 per cent of total employment in Egypt,
Palestine and Tunisia, and 18 per cent in Jordan.
The role of the paid care sector is largest in the
public sector, which is driven by employment in
education and to a lesser degree health care. In the
private sector, paid care represents a much smaller
share of employment, but in several countries this
share has been growing over time. There is thus
substantial room to encourage further investment in
expanding private sector care services, particularly
ECCE and social care, where the public sector’s role
tends to be smaller.
The paid care sector is a major employer for women but job quality is critical.
Employed women in the region are concentrated
in paid care sectors. In the public sector, paid care
work accounts for 65 per cent or more of women’s
employment, versus only 14–31 per cent of men’s.
The paid care sector constitutes a much smaller
percentage of women’s private sector employment;
however, women make up a greater share of
private sector care workers (60 per cent). Although
lower than other countries,24 these levels are striking
given women’s low labour force participation rates
overall in the region. By comparison, in non–care
sectors, women’s share of employment ranges from
10–17 per cent. The gap in women’s care versus
non–care employment illustrates the degree to
which care employment is attractive to women. At
the same time, the concentration of women in care
sectors reflects occupational sex–segregation and
barriers to women’s entry into non–care sectors.
This concentration may also leave them vulnerable
to changing employment conditions in times of
crisis, such as the ongoing COVID–19 pandemic.
Each country case study notes concerns about job
quality in the care sector, particularly in private
sector – including deteriorating levels of formality
in Egypt, gender wage gaps in Jordan, lack of
adherence to minimum wage policy in Palestine,
and high levels of informality in the social–care
CARE ECONOMY AND PROMOTING GENDER EQUALITY
34
sectors in Tunisia and Jordan, and in the ECCE
sector in Tunisia. Any investments in expanding
private care services must be accompanied by
standards and regulations to ensure decent
conditions for care workers as well as quality
services for care recipients.
Growth in the paid care sector has outpaced growth in non–care sectors.
Beyond representing a source of growth for
women’s employment, the paid care sector has the
potential to power overall economic growth across
the region. In recent years, employment growth in
the care sector has outpaced that in the non–care
sector. This is particularly true for women and for
the private sector. Investments in expanding paid
care services can thus provide multiple benefits:
offering families options to redistribute some of
women’s unpaid care responsibilities; developing
high–quality care services that support the needs
of children, the elderly and the disabled; expanding
employment opportunities for women; and
contributing to overall economic growth.
Recommendations: Invest in the care economy as a path towards gender equality
Regional analysis of the care economy and the
current state of care policies points to cross–
cutting priorities across the Arab States in order
to recognize, reduce and redistribute unpaid
care work while fostering the growth of decent
employment in the paid care sector.
Adopt coordinated national strategies on
the care economy.
Countries in the Arab region have policies and
public services – of varying comprehensiveness
– that implicitly address the recognition and
redistribution of unpaid care work. However,
these are largely uncoordinated and fall under
the jurisdiction of different ministries, leading
to serious gaps in legal and effective coverage.
Adopting a national, coordinated strategy on the
care economy is therefore a first step for Arab
States to invest wisely in this critical sector. Such a
strategy should be based on the guiding principle
of equality – both in who provides care and who
receives it.25 Given the low levels of female labour
force participation and high levels of employment
informality, countries must not only enact care
policies but also effectively monitor and enforce
their implementation. It is also critical that policies
do not unintentionally discourage employers from
hiring women. Models of care service–provision
that do not ensure widespread financial and
geographic access also risk deepening inequalities
in who receives care.
Invest in national time–use surveys and other sources of data on the care economy.
Recognizing the extent of women’s unpaid care
work is another fundamental step towards an
evidence–based national care strategy. Full time–
use surveys remain very limited in the region.26
Investment in collecting and disseminating
time–use surveys should therefore be a priority.
This report also highlights other critical evidence
gaps related to the care economy in the region.
Regularly collected, standardized data are needed
on essential care policies and services, including
rates of coverage and uptake of care leaves, and
EXECUTIVE SUMMARY
35
supply– and demand–side data on ECCE and
elder–care services. Data on domestic workers are
also critical to assess and address the needs of this
highly vulnerable care sector.
Bring maternity leave policies in line with ILO recommendations and introduce paternity or parental leave.
Although maternity leave is the most widely
implemented care leave policy in the region, in
most countries it does not meet the standards of
ILO Convention 183. There is a need for the region
to move towards international best practices
and finance maternity leave through the social
insurance system. This would also be an opportunity
to expand maternity leave coverage to women
who are self–employed or working in the informal
sector. Although a long–term goal, implementation
of paternity leave through legal provisions and
accompanying campaigns to encourage men to
use paternity leave are important to change norms
around caregiving roles and protect men’s right to
be involved in care for their young children.
Expand Early Childhood Care and Education.
Public investment is needed to expand ECCE,
exploring delivery models through the public,
private and non–governmental sectors. In order
to avoid widening socioeconomic inequalities in
access to ECCE, several key factors should be taken
into consideration. Universal, free ECCE is more
likely to achieve higher enrolment, particularly
among disadvantaged groups.27 If ECCE expansion
is driven by the private sector, some form of public
financing or subsidization is necessary to keep
costs within reach for the majority of families.
ECCE provision also requires effective government
regulation and oversight in order to maintain the
quality of services for children and decent working
environments for workers. Given the low quality of
public primary education in a number of countries
of the region,28 quality is a cross–cutting concern
that must be addressed. The quality of ECCE
provision is also essential to encouraging its uptake
by households.
Start to plan for a range of long–term care options.
Although the share of the elderly population is
currently small in many countries, as is time spent
on unpaid care for the elderly, this will change
rapidly in coming decades. Now is the time to plan
for LTC systems to meet the diverse needs of the
elderly, including residential and non–residential
care options and dedicated care leaves for family
members.29 As with ECCE, the costs of these services
cannot fall exclusively on households, or they will
remain inaccessible to most, and ensuring quality is
essential if families are to entrust their loved ones to
LTC services.
Address professionalization and job quality in particularly vulnerable care sectors.
Expanding ECCE and elder–care coverage in the
region also depends on the quality of services
and employment in these sectors. Social care
and ECCE have the most vulnerable employment,
as measured by levels of informality and the
education levels of workers. Professionalization
and regulation of these sectors is important
to ensure service quality, job quality and to
change social views that devalue these forms

CARE ECONOMY AND PROMOTING GENDER EQUALITY
36
of paid care work. Professionalization requires
formal degree programmes and on–the–job
training opportunities, as well as regulation and
enforcement of quality and working standards.
These measures, which are critical for the safety
and well–being of care recipients and care workers,
will also likely increase the willingness to entrust
loved ones to these services.
Seek to change gender norms.
Greater participation of men in unpaid care work
is a fundamental aspect of redistribution. Yet until
prevailing views that caregiving is ‘a woman’s role’
change, redistribution will be an uphill battle and
women will continue to shoulder the double burden
of paid and unpaid work. There are a number of
innovative approaches to addressing gender norm
change, including providing accurate information
about the beliefs of others in the community.30
Normative change is a slow and complex process,
evidenced by the fact that nowhere in the world
do men perform as much unpaid care work as
women.31 Yet it is a prerequisite to achieving true
gender equality that cannot be overlooked in a
comprehensive approach to the care economy.

1THE CARE ECONOMY IN THE ARAB STATES
1.1 Introduction to the Report
1.2 Report methodology
1.3 The context of care in the Arab States
1.4 An overview of care policies and services in the Arab States
1.5 Key comparative Findings from the country case studies
38
42
45
56
66
1.6 Recommendations 76

CARE ECONOMY AND PROMOTING GENDER EQUALITY
38
1.1 Introduction to the Report
Care is fundamental to our societies and
economies. While families are a key site for giving
and receiving care, the implications of who
provides care and who receives it extend beyond
the family sphere. Care is a public good, meaning
that its benefits extend beyond those to whom it
is directly provided.32 Care for young children is
a critical investment in the health, education and
productivity of future generations while care for the
elderly helps ensure dignity, longer–lasting health
and well–being for those who have contributed to
their families and societies. Care for the temporarily
or permanently ill and disabled is likewise a way
that societies ensure greater health and economic
security for all.
Yet although care is a public good, the current
responsibility for providing it falls overwhelmingly
on families. Within families, this responsibility falls
predominantly on women and girls. Care is an
important dimension of family life and providing
it is often a rewarding experience that family
members want to and should perform. However,
families should also be supported by services and
public policies that give them options in terms of
who provides care and how much is provided inside
versus outside the household in times of need.33 The
provision of such services and the implementation
of public policies that could alleviate or redistribute
some of the care burden for women and families
remain underdeveloped in many countries.
In fact, the very organization of care work is a
driver of gender inequality on a global scale. It
is estimated that 16.4 billion hours are spent on
unpaid care work each day, time that if valued
at national hourly minimum wage levels would
amount to USD 11 trillion. Three–quarters of this
unremunerated time is spent by women and
girls.34 When this amount of time is devoted to
essential, yet unpaid tasks for the production
and reproduction of families, it props up global
economies on a massive scale.35 But this unpaid
labour comes with other costs. The time that
women and girls spend on unpaid care can come
at the expense of their education, participation in
paid employment outside the home, and time for
leisure and self–care. The unequal distribution of
unpaid care work thus restricts women’s and girls’
educational and economic opportunities relative
to men and boys. Time poverty – when individuals
do not have enough time for rest or leisure due to
paid or unpaid work – can also negatively impact
women and girls’ health and well–being.36
Inequalities in the provision of care may also be
exacerbated in times of crisis, a dynamic that the
ongoing COVID–19 pandemic has highlighted on
a global scale.37 During the pandemic, care needs
have increased due to factors including the closure
of schools and nurseries, illness, more limited
access to health and social–care facilities, and the
closure of services that can substitute for women’s
unpaid time spent on housework. As women
already shoulder the majority of unpaid care work,
it predominantly falls on them to take on these
additional care responsibilities.38 The pandemic
has thus exposed the urgency of addressing
widespread gaps in care policies and services
that leave women and their families vulnerable to
negative social, economic and health outcomes.
Just as women perform the bulk of unpaid care
work, they are overrepresented in paid care–
related employment outside the home. Globally,
paid care work employs 381 million people, 65 per
cent of whom are women. Whereas paid care work
makes up 6.6 per cent of global male employment,
it constitutes 19.3 per cent of global female
employment.39 The care sector is thus a major

CHAPTER 1 – THE CARE ECONOMY IN THE ARAB STATES
39
source of demand for female labour. At the same
time, the conditions of work in the paid care sector
vary widely and this can negatively impact women
workers, particularly those in vulnerable forms of
employment, such as domestic work.
Recognizing the extent and value of unpaid
care work, reducing the unpaid care work
burden on women and girls, and redistributing
the responsibility for care work across women
and men, as well as families and the State, has
huge potential to further gender equality. With
the appropriate policies, this redistribution can
also generate economic growth and decent
employment opportunities for women. Ultimately,
investment in high–quality growth in the care
economy can improve health and well–being, both
for those who provide care and those who receive
it. This report focuses on what such investment
in the care economy could achieve in the Arab
States, encompassing the 17 countries covered by
the UN Women Regional Office for the Arab States,
namely: Algeria, Bahrain, Egypt, Iraq, Jordan,
Kuwait, Lebanon, Libya, Morocco, Oman, Palestine,
Qatar, Saudi Arabia, Syria, Tunisia, the United Arab
Emirates and Yemen.
Scope and outline of the report
The recognition, reduction and redistribution of
unpaid care work is a pressing issue for gender
equality in the Arab States, which has the highest
female–to–male ratio of time spent on unpaid care
work of any world region. Women across the Arab
region spend on average 4.7 times more time on
unpaid care work than men, compared to 4.1 times
more in Asia and the Pacific, 3.4 times more in
Africa, and 1.7 times more in the Americas.40
The amount of unpaid care work that is undertaken
by women and girls in the region is a key
contributor to the fact that the region also has
the world’s lowest rate of female labour force
participation. Women who are employed are
concentrated in care–related economic sectors.
Fewer than a quarter (22 per cent) of women in
the region are in the paid labour force,41 but over
half (53 per cent) of them work in care–related
jobs.42 This is the highest share of any world region.43
Tapping into the potential of the paid care economy
– a sector that has received relatively little policy
focus in the region – could thus be an important
source of employment for women, while there is
a simultaneous need to ensure that women have
better access to employment in non–care sectors.
Changing demographic trends, including declining
fertility rates, population aging and the increasing
nuclearization of families, are also challenging
systems of care–provision that rely on women’s
unpaid labour.44 Satisfying unmet needs for care
for young children, the elderly, ill and disabled will
require investments in the development of paid
care services.
Care is also critical for the Arab region’s ability to
achieve the 2030 Sustainable Development Goals
(SDGs). The implications of care for the SDGs
go well beyond indicator 5.4 to “recognize and
value unpaid care and domestic work through
the provision of public services, infrastructure and
social protection policies and the promotion of
shared responsibility within the household and
the family as nationally appropriate.” The care
economy impacts the region’s ability to achieve a
number of other SDGs targeting gender equality
(Goal 5), early childhood education (Goal 4), health
and well–being at all ages (Goal 3), and productive
employment and decent work for all (Goal 8).
Investments in the care sector may thus lead to
benefits across a wide range of related goals.
This report aims to provide evidence–based
recommendations to guide investments in the care

CARE ECONOMY AND PROMOTING GENDER EQUALITY
40
economy in the Arab States. Through a combined
analysis of unpaid care, paid care sectors and
care–related policies, it highlights commonalities
and differences across the region in terms of care
needs and promising policy approaches to meeting
these needs. Chapter 1 provides an overview of the
concept of the care economy and the demographic
and social context of care–provision in the Arab
States. It also reviews the status of key care policies
and services related to paid leave, Early Childhood
Care and Education (ECCE) and elder care across
the region. Subsequent chapters present country
case studies of the care economy in Egypt (Chapter
2), Jordan (Chapter 3), the State of Palestine45
(Chapter 4) and Tunisia (Chapter 5), with in–depth
analysis of national data. A cross–national synthesis
of the key findings and recommendations from the
case studies concludes this chapter.
Throughout the report, the analysis takes a life–
course perspective on care needs and provision.
This perspective recognizes that a person’s
individual capacities and social roles change with
age.46 Over certain periods of life – such as early
childhood and old age, as well as temporary
periods of illness – people may be in greater need
of care. At other points in the life course, social
expectations and individual ability to provide care
may be greater, for example after marriage (for
women). Changes over time in individual need
for and ability to provide care intersect in the
family, which in its diverse forms is a key site for
care across societies. Although the family plays
an important role in providing mutual care for its
members across the different stages of the life
course, families should not be left on their own in
doing so. Recognizing that care is a public good,
key policy measures should be enacted to support
individuals and families during periods when their
care needs are too great or when meeting those
needs comes at the expense of quality of life.
As governments in the region explore new care
policies to support families, those policies should
be guided by the principle of promoting greater
gender equality in care work and greater equality
among all people in accessing its benefits across
the life course.
Defining paid and unpaid care work
This report takes a comprehensive view of the care
economy, which is the total of all unpaid and paid
care work.47 Care includes all activities between
a caregiver and a care–receiver that sustain the
recipient and develop their capabilities, including
their health and skills.48 Both paid and unpaid
care work can be further divided into direct and
indirect care. Direct care work encompasses the
personal, relational activities of taking care of
another person, such as nursing a baby, reading
to a child or helping an elderly person to dress or
take a bath. Indirect care work consists of tasks
that do not involve face–to–face interaction, but
that are needed to sustain direct care, including
cleaning, cooking, shopping for household items
and maintenance work within the home.49
Unpaid care work is direct or indirect care
provided without remuneration, the majority of
which is carried out by women and girls within
the household. It is restricted to “services” such as
minding children, cooking and cleaning. It does
not include producing or processing goods for
household use, such as growing vegetables, raising
livestock or making clothes at home,50 activities
that in some contexts also consume a large portion
of women’s time. Unpaid care work is typically
measured, as in this report, in terms of the amount
of time that individuals spend per week, or per day,
performing care activities.
Paid care work consists of direct or indirect care
work that is performed for pay or profit.51 Care
services that are provided privately or by public
institutions can complement or substitute unpaid
care work within the home. Paid direct care work
is comprised of those services that contain the
relational aspect of direct care work – namely

CHAPTER 1 – THE CARE ECONOMY IN THE ARAB STATES
41
education, health care and social care. Social
care includes residential and non–residential care
for the elderly and disabled as well as childcare.
Care workers encompass all of the professions
that engage in indirect or direct care activities,
regardless of whether the employment is based in
the public, private or non–profit sector. Domestic
workers who work in homes are also paid care
workers, and often perform a combination of
indirect and direct care work activities. Table 1.1
summarizes the four–way categorization of unpaid
and paid, direct and indirect care work that makes
up the care economy.
Paid care work can also be thought of in terms of
the nature of a person’s job (e.g. teacher) or the
economic activity of their place of employment
(e.g. a school). Not all people in care professions
work in care sectors (education, health, social
care and domestic work), and not all people
who work in care sectors are in care professions.
Figure 1.1 elaborates on the overlap between paid
care workers and care sectors. Care workers in
care sectors are people employed in both a care
profession and an establishment where the main
economic activity is care–provision. There are also
administrative, managerial and other staff in most
schools and health–care facilities who are not care
professionals but who work in care sectors and are
part of their job growth over time. Such workers
are examples of non–care workers in care sectors.
Conversely, care professionals who work outside
the care sector, for example nurses employed by
companies in the industrial sector, are referred to
as care workers in non–care sectors.52
The scarcity of evidence on the size and
characteristics of the paid care economy in the
Arab States limits efforts to understand and invest
in this sector’s potential. This report thus examines
both paid care sectors and paid care workers.
Their characteristics are also often compared with
non–care workers or non–care sectors, respectively,
to give a more complete picture of how paid care
work differs from other segments of the economy.
Table 1.1: Typology of The care economy
Direct care work Indirect care work
Unpaid “Personal and relational” care per-formed within the household for children, the elderly, the disabled and the ill
Unpaid activities performed within the household to support direct care work (e.g. housework)
Paid Paid employment in education, health, social care or domestic work
Paid employment in domestic work
Source: Authors’ elaboration, based on the International Labour Organization (ILO) 2018. Care Work and Care Jobs for the
Future of Decent Work. Geneva: ILO.
Notes: Voluntary care services provided to people outside the household also fall within the definition of unpaid care services but are not captured in this report due to the limitations of the data sources used. Voluntary care services to others constitute a
very small portion of total time spent in unpaid care cross–nationally.174 Domestic workers often perform both indirect and direct
care, and are thus included in both categories of paid care work.

CARE ECONOMY AND PROMOTING GENDER EQUALITY
42
A full view of the gendered dynamics of the care
economy in the Arab States requires analysing
the relationships between unpaid and paid care
work. Investment in the care economy has multiple
implications for women. Paid care services, such
as ECCE or care services for the elderly, can be
an important substitute for women’s unpaid care
work that frees up their time for other activities.
Paid domestic workers can also alleviate some of
women’s unpaid time in indirect care work. At the
same time, many of the workers who take on these
care responsibilities for pay are also women. The
size and trajectory of the paid care sector and its
working conditions thus have disproportionate
impacts on work opportunities, conditions and
wages for women.
Historically, the feminization of care work and its
association with women’s unpaid labour has led it
to be devalued. This is particularly true for domestic
work, a sector that suffers from poor and unstable
figure 1.1: The relaTionship beTween care workers and care secTors
Care workers in care sectors
Care workers in non–care
sectors
Non–care workers in care
sectors
Non–care workers in non–care sectors
Care sectors
Care
w
ork
ers
Source: Authors’ elaboration based on definitions from ILO 2018.
working conditions in many contexts.53 Investments
in developing the paid care sector must therefore
focus on providing high–quality, safe, socially
protected and fairly paid employment in order
to foster women’s economic empowerment.
Investment in high–quality care jobs is also a
virtuous circle; better working conditions in paid
care sectors are associated with higher–quality
services for those being cared for. The quality of
services in the paid care sector may in turn serve as
an incentive for households to use these services in
place of women’s unpaid labour.
1.2 Report methodology
This report generates unique evidence on the
state of the care economy in selected Arab States
through original microdata analysis related to
both unpaid and paid care work. Following this
overview chapter are four detailed case studies
of the care economy in Egypt, Jordan, Palestine
and Tunisia. These four countries were selected
in order to provide a broad representation of the
Arab States, in terms of subregional characteristics,
national economic structures, care dependency
and the implementation of recent care policies. All
four countries are also among those in the region
in which female labour force participation (FLFP)
rates have been persistently low (see Section 3.2).
The selection of countries was also driven by data
availability. A key barrier to the detailed analysis of
the care economy in many countries of the region
is the lack of available data – particularly time–use
data that can be used to quantify time spent in
unpaid care work (see Box 1.1).
Each country case study relies on multiple data
sources to present a comprehensive analysis of
both unpaid and paid care work. In the absence
of time–use surveys, the country case studies on
Egypt, Jordan and Tunisia rely on the Labour Market

CHAPTER 1 – THE CARE ECONOMY IN THE ARAB STATES
43
of time spent on total care is also disaggregated
between time spent on direct versus indirect care
in most analyses. Each chapter also presents the
percentage of total time (out of a 168–hour week)
spent on unpaid care. Women and men’s time spent
doing unpaid care work is compared with their time
spent in paid work, to calculate measures of the
total time spent on all forms of work. Descriptive
analyses of differences in the distribution of
unpaid care work are presented by sex, marital
status and other key individual– and household–
level characteristics, including age, education,
employment status and household wealth. Analysis
of the impact of having children of different ages
(0–3 years, 3–5 years and 6–17 years) in the
household on women’s unpaid care work is also
presented using multivariate regression analysis,
which is further described in the Methodological
Appendix.
Analyses of the paid care economy are based
primarily on the Labour Force Surveys (LFS) of
Egypt, Jordan and Tunisia, conducted by their
respective national statistical offices. The analysis
for Palestine relies primarily on the 2007 and
Panel Surveys (LMPS) conducted by the Economic
Research Forum (ERF) in collaboration with
national statistical offices in the region.54 The LMPS
surveys do not include a full time–use module, but
targeted data based on the respondent’s recall of
time spent in direct and indirect care work activities
in the week prior to the survey. The surveys also
contain measures of time spent in paid work. A
detailed discussion of the LMPS methodology and
its limitations for time–use analysis can be found
in the Methodological Appendix. Standardized
classifications for activities included under direct
and indirect unpaid care work were developed
for use across the four countries, based on
the definitions above and the International
Classification of Activities for Time–Use Statistics
(ICATUS) 2016.55 Although the standardized
approach increases comparability across countries,
it is worth recalling that the methodology for the
data collection in Palestine was very different from
the other three countries.
The key indicator used to measure unpaid care
work is the number of hours per week that
individuals spend in these activities. The amount
box 1.1: recogniTion begins wiTh measuremenT
A first step towards a comprehensive approach to unpaid care work is recognizing the amount and value of time spent on this work.175 Recognition begins with measurement. Producing estimates of the value and opportunity cost of unpaid care work relies on accurate measurement of the amount of time that individuals spend on care activities – time that is thus not available for paid work, education, leisure and self–care.
The best methodology for measuring time spent on unpaid care work is a time–use survey. These surveys col-lect detailed data on all the activities that individuals carry out over the course of a specified time period. This methodology is important for capturing the full extent of time spent on care work, as such work is often deemed unimportant and thus underreported in more traditional survey formats. Time–use surveys can also be designed to capture how care activities are often carried out in combination with other activities (e.g. minding a child while cooking dinner).176
Unfortunately, time–use data are lacking in the Arab region. Only 7 of the 17 countries covered by this report have ever conducted a national time–use survey,177 and several are now quite dated or unavailable for public use. Only Palestine has conducted multiple time–use surveys, in 1999–2000 and 2012–2013.178 Investment in time–use surveys is thus a critical first step towards greater recognition of unpaid care in the region.

CARE ECONOMY AND PROMOTING GENDER EQUALITY
44
specific subsectors of interest, for example ECCE,
are also analysed separately, but the ability to do
so depended on data availability in each country.
A notable shortcoming of the analysis is that in
several of the countries it was not possible to
accurately distinguish domestic workers based
on the LFS data. This important care sector is thus
largely left out of the analysis (see Box 1.2).
The descriptive analyses of paid care work
presented in the country chapters focus on the size
of the paid care sector as a percentage of total
employment in each country, the representation
of women in paid care employment, and the
characteristics of paid care workers. Growth of
the paid care sector, relative to other economic
2017 Establishment Censuses. Each survey is also
described in detail in the Methodological Appendix.
Following the definitions laid out in Section 1.2,
the measures of the different forms of paid care
work were standardized across the four country
case studies to the extent possible in order to
allow comparisons of how paid care work differs.
The classification of care workers is based on
the International Standard Classification of
Occupations (ISCO)56 definitions of workers in the
education, healthcare, social care and domestic
work fields, and the classification of care sectors
is based on the International Standard Industrial
Classification of all Economic Activities (ISIC)57
definitions of the education, health–care, social
care and domestic work sectors. Where possible,
box 1.2: migranT domesTic workers in The arab sTaTes
Domestic work is a heavily feminized paid care sector. In 2013, the ILO estimated that 80 per cent of the 67 mil-lion domestic workers worldwide were women.179 Of the estimated 3.8 million domestic workers in the Arab region, 3.16 million (83 per cent) were migrants, including 73 per cent of all female domestic workers.180 Domestic workers in the region increasingly perform not only indirect care activities, such as cleaning and cooking, but also provide direct care for children and the elderly. Demand for domestic workers is in part driven by the weakness of institu-tional care services in the region.181
A combination of gender– and migration–related factors make female migrant domestic workers a particularly vulnerable segment of the labour force. Globally, domestic work is characterized by low wages, vulnerability to exploitation and abuse, and poor working conditions.182 Domestic workers in general are excluded from the labour laws of many Arab States, and – when covered by regulations – are often provided fewer protections than other workers.183 In many countries of the region, migrant domestic workers, like other migrant workers, are regulated by the kafala system, in which their legal residency and employment status is tied to an individual employer. This system typically prevents them from changing employers or entering and/or leaving the country without permis-sion from their employer,184 leaving them vulnerable to exploitation and to becoming irregular migrants if they leave their employer. In the absence of effective regulation, a recent set of studies by the ILO found widespread violations of migrant domestic workers’ contract provisions – such as having one day off per week – in Lebanon, Jordan and Kuwait.185 Stigma and negative social norms around domestic work, as well as biases towards foreign workers, can also affect working conditions for migrant domestic workers.186
Although the working conditions of domestic workers are a hugely important issue for care provision and gender quality in the Arab States, domestic work is not comprehensively treated in this report. With the exception of Jor-dan, the four focus countries are not among those in the region that have large migrant domestic worker popula-tions. In most of the countries, including Jordan, limitations of the LFS data also preclude a rigorous analysis of the domestic work sector and the characteristics of domestic workers.

CHAPTER 1 – THE CARE ECONOMY IN THE ARAB STATES
45
fundamental to improving women’s economic
opportunities and achieving gender equality.60
The remaining two ‘Rs’ in the framework focus on
the conditions of paid care workers. Rewarding
paid care work is essential for ensuring decent work
and pay for all care workers, as well as for creating
safe and attractive work environments. Protection
of migrant care workers is also critical to this
dimension. Finally, the principle of representation
aims to recognize the right of care workers to
freedom of association and collective bargaining,
as well as to ensure women’s involvement in all
levels of decision–making related to the care
economy.61
1.3 The context of care in the Arab States
Care is delivered within a social, economic,
demographic and policy context. This context
is changing rapidly in many parts of the world,
including the Arab region. As demographic trends
change, the profile of who needs care, now and
in the future, as well as other social and economic
factors, affect who provides care at a family level
as well as within the paid care sector. There is
considerable diversity within the Arab region in
how these dynamics shape the care economy,
which will continue to evolve. However, there are
also important commonalities in care needs and
some of the challenges that countries in the region
face in meeting those needs. Many have a current
need to expand ECCE services, and a growing
medium–term need to develop care services for
the elderly. FLFP is also low throughout the region,
and redistribution of care work is hindered by
persistently strong adherence to the traditional
‘male–breadwinner/female–caregiver’ gender role
model.
sectors, is also calculated for approximately the
past 10 years, depending on data availability in
each country. The growth of the care economy is an
important indicator of demand for and investment
in care services, as well as the potential of the care
sector to contribute to overall national economic
performance. Finally, the chapters consider
available data on working conditions in paid care
versus other economic sectors. Job quality in the
care sector has important implications for women’s
employment due to the overrepresentation of
women in paid care work, as well as for the quality
of care services that are delivered.
The analyses of the unpaid and paid components of
the care economy are linked conceptually through
the “5R” framework, which aims to recognize,
reduce and redistribute unpaid care work while
rewarding paid care work and increasing the
representation of care workers in the determination
of their working conditions.58 The 5R approach,
widely used internationally in the study of unpaid
care and gender inequality, provides not only an
analytical framework, but can serve to organize a
comprehensive policy strategy towards care work.59
Recognizing unpaid care work is a necessary
condition for reduction and redistribution. It entails
understanding and valuing unpaid care as a form
of work that underpins all other economic activities.
Recognition also entails acknowledging that both
unpaid and paid care labour constitute the care
economy, which is critical to overall human well–
being. Reducing unpaid care work aims to lessen
the burden on women of providing unpaid care,
particularly domestic work that entails drudgery,
such as fetching water or firewood. Reducing
unpaid care work also relates to redistributing
unpaid care work to the paid care sector, but
related policies should not lead to inequities or
compromises in the quality of care provided.
Redistributing care work between the public
(as paid care services) and household spheres,
and between women and men within homes, is

CARE ECONOMY AND PROMOTING GENDER EQUALITY
46
Whereas in 2020, the share of the population
under 5 was nearly 14 per cent in Iraq, the State of
Palestine and Yemen, by 2050 this share is projected
to decline to below 10 per cent. Among countries
where the share of the very young is already low,
such as the UAE and Qatar, it is projected to remain
stable or increase slightly. Since the presence of
young children in the household is a key predictor
of women’s time spent on unpaid care work (as
detailed in the country case studies), the decline
in the share of small children in the population,
coupled with the expansion of quality ECCE services,
has great potential to reduce and redistribute
women’s time spent on unpaid care work.
At the same time, the share of the population aged
65 and older will increase over the coming decades.
Aging will be particularly pronounced in certain
countries of the region, with the share of the elderly
population exceeding 15 per cent in Algeria, Kuwait,
Lebanon, Morocco, Saudi Arabia, Tunisia and
the UAE by 2050 (Figure 1.4). The vast majority of
countries in the region will begin the aging transition
by 2040, and corresponding care services need to
be planned for.66 The elderly have specific needs
and abilities that differ from those of dependent
children. Whereas some become more physically
dependent, others may have different degrees of
financial dependence.67
Currently, spending on health and social protection
sectors in the region is low, resulting in coverage for
only a small fraction of older persons with old–age
pensions. Access to essential services for women –
who comprise the majority of the elderly population
– is particularly weak. Additionally, the region lacks
sufficient residential and non–residential care
services for the elderly, trained care workers to
provide social–care services and gerontologists to
provide specialized medical care for the elderly.68
In the absence of these services, female family
members – especially spouses, daughters and
daughters–in–law – provide the bulk of unpaid care
for the elderly.69
Demographic trends will change care needs
The need for care relative to the population
available to provide it is expressed through
dependency ratios – the ratio of persons aged
0–14 and 65+ per 100 persons of working age
(15–64). The total dependency ratio in the Arab
region is projected to decrease slightly over the
next decades, from just under 63 in 2010 to 56 by
2050, due to projected declines in fertility rates.62
However, changing demographics will shift the
composition of the dependent population and the
nature of care needs. Whereas the region’s young–
age dependency ratio is projected to fall, from 54 in
2020 to 40 in 2050, the old–age dependency ratio
will double, from just under 8 to 16.5.63
Demographic shifts will affect countries in the
region differently, depending on the pace of aging
and changes in fertility rates. Currently, there are
more young–age than old–age dependents in
most countries of the region. As of 2020, the ratio
of children aged 0–14 to every 100 working–age
people ranged from a high of over 65 in Palestine
and Yemen to a low of 18 in the United Arab
Emirates (UAE) and 16 in Qatar.64 The ratio of
elderly to working–age population, by contrast, only
exceeded 10 in four countries (Algeria, Lebanon,
Morocco and Tunisia). By 2050, dependency in the
region will change considerably, with young–age
dependency ratios exceeding 40 only in Palestine,
Egypt and Iraq, and half of the region’s countries
experiencing old–age dependency ratios above
20. Figure 1.2 illustrates the shift in dependency
ratios from today until 2050 for the four case study
countries.65
Changes in the regional population structure
have important implications for care services.
For example, ECCE services in most countries
target children under 5. The share of the under–5
population is projected to decline in most countries
in the region over the next 30 years (Figure 1.3).

CHAPTER 1 – THE CARE ECONOMY IN THE ARAB STATES
47
figure 1.2: ToTal young– and old–age dependency raTios in selecTed arab sTaTes, 2020, 2035 and 2050
65
58
71
50
5652
66
36
96 6
13
56
48
58
51
46
38
50
29
11 108
22
57
5052
61
42
32
41
29
1518
12
33
0
10
20
30
40
50
60
70
80
Egypt Jordan Palestine Tunisia Egypt Jordan Palestine Tunisia Egypt Jordan Palestine Tunisia
Total dependency (0 – 14 plus 65+) Young -age dependency (0 – 14) Old-age dependency (65+)
Dependency
ratio
2020 2035 2050
Source: Authors’ elaboration from UN–DESA (United Nations Department of Economic and Social Affairs). 2019. World
Population Prospects 2019, Online Edition. Rev. 1. New York: DESA, Population Division.
figure 1.3: share of The populaTion under The age of 5, 2010–2050, arab sTaTes
Source: Authors’ elaboration from UN–DESA 2019.
0
2
4
6
8
10
12
14
16
18
2010 2015 2020 2025 2030 2035 2040 2045 2050
Share
of
tota
l popula
tion (
per
cent)
Year
Algeria
Bahrain
Egypt
Iraq
Jordan
Kuwait
Lebanon
Libya
Morocco
Oman
Qatar
Saudi Arabia
State of Palestine
Syrian Arab Republic
Tunisia
United Arab Emirates
Yemen

CARE ECONOMY AND PROMOTING GENDER EQUALITY
48
The care needs of the elderly population in the Arab
region are also likely to be affected by the high
burden of non–communicable diseases (NCDs)
– such as cancer, diabetes, and cardiovascular
diseases – which cause 75 per cent of mortality in
the region. This share varies from less than 60 per
cent in Yemen and Iraq to more than 80 per cent in
Tunisia, Egypt and Lebanon.72 By 2030, the number
of older persons in the Arab region with an NCD is
projected to rise to nearly 1.3 million.73 Many NCDs
are chronic conditions that can require years of
care. The increase in the elderly population with
chronic health needs is likely to lead to growing
elder–care responsibilities for women in the region
in the absence of care policy supports.
Unpaid care is a barrier to women’s labour force participation
Globally, some of the most profound changes
in how societies distribute and support care
Population ageing will also increase the need for
care for the disabled and chronically ill. Although
not all elderly individuals are dependent in terms
of health needs, rates of disability tend to rise
with age. Unfortunately, the Arab region lacks
reliable and consistent age–disaggregated data
on disability that could better gauge these future
needs. The reported total prevalence of disability
varies across countries, ranging from 0.4 per cent
in Qatar to 4.6 per cent in Palestine.70 These low
rates compared to other countries suggest that
most Arab countries are using a narrow definition
of disability that only captures the most severe
functional limitations. Analyses in specific countries
using an expanded definition of disability may
reveal much higher rates of potential care needs
among the disabled elderly. For example, in Egypt,
by age 65, about 40 per cent of men and half
of women report having at least some difficulty
walking or climbing stairs and 20 per cent of
the elderly of both genders report at least some
difficulty in remembering or concentrating.71
figure 1.4: share of The populaTion aged 65 and older, 2010–2050, arab sTaTes
Source: Authors’ elaboration from UN–DESA 2019.
0
2
4
6
8
10
12
14
16
18
20
22
2010 2015 2020 2025 2030 2035 2040 2045 2050
Share
of
popula
tion (
%)
Year
Algeria
Bahrain
Egypt
Iraq
Jordan
Kuwait
Lebanon
Libya
Morocco
Oman
Qatar
Saudi Arabia
State of Palestine
Syrian Arab Republic
Tunisia
United Arab Emirates
Yemen

CHAPTER 1 – THE CARE ECONOMY IN THE ARAB STATES
49
work have been driven by women’s increasing
participation in the paid labour market.74 The
relationships between women’s paid work and their
unpaid care work are complex. On the one hand,
women in many countries have increasingly taken
on paid employment outside the home, which has
increased recognition of the unequal distribution of
unpaid care work.
Growing evidence has emerged of the extent to
which women work a “double shift” of unpaid
care work at home, even when they also engage
in paid work outside the home.75 This second shift
has negative impacts on women’s well–being, time
poverty, family dynamics and gender equality more
broadly. In some countries, both social movements
and policy efforts have emerged to address these
gender imbalances in unpaid work.
On the other hand, unpaid care responsibilities
remain one of the greatest barriers to women’s
participation in the labour force. Globally, an
estimated 606 million women are out of the
paid labour market due to care responsibilities,
compared to 41 million men. This constitutes 42 per
cent of all women who are out of the labour force.76
Engaging in paid work versus staying at home
full–time to care for family members is a choice,
and a choice that should be available to all women
and men, regardless of their circumstances. Yet
when women do not have the option of engaging in
paid work because of unpaid care responsibilities,
this disadvantages them economically. They not
only lose out on independent income but are
often excluded from employment–based social
protection systems that provide benefits, such as
unemployment insurance, maternity leave and old
age pensions.
The issue of unpaid care responsibilities as a
barrier to women’s employment is a particular
concern in the Arab States, which have the lowest
FLFP rate of any world region (Figure 1.5).77 FLFP
ranges from a high of nearly 60 per cent of
working–age women in several Gulf States to
a low of 6 per cent in Yemen, although for most
Arab countries it ranges between 13–30 per cent.78
Labour force participation among women has also
been stagnant over the past several decades, and
in some countries has even declined, despite the
fact that the gender gap in education has nearly
closed.79
figure 1.5: female labour force parTicipaTion raTe by world region, 2000–2019
0
5
10
15
20
25
30
35
40
45
50
55
60
65
70
75
2000 2001 2002 2003 2004 2005 2006 2007 2008 2009 2010 2011 2012 2013 2014 2015 2016 2017 2018 2019
Arab World
East Asia &Pacific
Latin America& Caribbean
South Asia
Sub-SaharanAfrica
World
Central Europeand the Baltics
Source: Authors’ elaboration from World Bank. 2019. World Development Indicators. Washington, D.C.: World Bank Group.

CARE ECONOMY AND PROMOTING GENDER EQUALITY
50
There are several reasons behind the low FLFP rate
in the Arab States. Some are related to the labour
market, including the prevalence of informal jobs,
occupational sex–segregation, sexual harassment
and unsafe transportation, limited access to
productive assets, and discriminatory laws and
regulations.80 Other reasons relate directly to
women’s care responsibilities, including gender
roles and social norms that favour women’s
household roles.81 Other factors include the limited
accessibility, cost and poor quality of childcare,
inadequate leave policies (both explored later in
this chapter) and the amount of time that women
spend on unpaid care. The limited literature on
this in the region demonstrates that women’s time
spent on unpaid care work increases substantially
after marriage. Countries with the heaviest unpaid
care work burden correspondingly saw the largest
decline in women’s employment upon marriage,
particularly in the private sector.82 The ability to
balance unpaid care work and paid employment
is one reason women prefer public sector jobs,
which typically have shorter hours than jobs in the
private sector. However, public sector employment
has become less available in the past decades,
especially for younger women entering the labour
market.83 Women thus face a limited range of
employment opportunities that are reconcilable
with care responsibilities, which has contributed to
the stagnation of FLFP rates in the region.
Social norms and the (re)distribution of care work
Social norms play a strong role in shaping the
distribution of unpaid care within the home.
Attitudinal data from across the Arab region show
consistent prioritization of women’s caregiving
roles and men’s paid employment.84 Cross–regional
comparisons suggest that norms favouring
women’s care roles over paid employment are
stronger than in other regions and countries.85
Furthermore, there is mixed evidence, as shown
below, as to whether attitudes are becoming more
egalitarian over time.
Men’s and women’s gendered economic roles
Based on data from 14 Arab States, a recent
Gallup/ILO poll reported the percentage of men
and women preferring that women in their families
work in paid jobs, that women only do household
work, or that they do both.86 The results revealed
that Arab men in particular are considerably more
likely to prefer that women focus only on care work
at home, and less likely to support women’s paid
employment outside the home (Figure 1.6). The
results for women were more mixed, with women
in North Africa showing higher rates of preference
for paid employment, and those in Asian Arab
countries preferring that women take on both paid
employment and household caregiving roles.
Wave 6 of the World Values Survey (WVS),
conducted between 2010–2014 in 12 Arab countries,
is another source of data on gender role attitudes in
the region that has the added advantage of being
comparable to data from other Low– and Middle–
Income Countries (LMICs) outside the region.87 The
WVS results similarly show that men in the region
consistently express greater support for gender
roles conforming to the male– breadwinner/
female–caregiver model than do women. However,
there is considerable variation across countries. The
percentage of men supporting the statement that
men should have priority in obtaining jobs ranged
from 45 per cent in Lebanon to 85 per cent in Egypt
and 88 per cent in Yemen (Figure 1.7).

CHAPTER 1 – THE CARE ECONOMY IN THE ARAB STATES
51
Another important question is whether gender
attitudes supporting traditional household roles
are changing in the region over time. Figure 1.8
presents some of the very limited data available to
assess this question, from WVS Wave 6 (2010–2014)
and Wave 5 (2005–2009).88 This comparison can
only be made for the four Arab countries included
in Wave 5.
The percentage of men in Egypt, Iraq and Jordan
agreeing that they should have the priority in
obtaining jobs declined somewhat over both
periods, by 6–8 percentage points, whereas it rose
in Morocco. Women’s support for the statement
similarly declined in Egypt, Jordan, and most
notably Iraq; however, it increased in Morocco
from 36 to 47 per cent. In terms of whether being
a housewife is as fulfilling as having a paid job,
support for the statement declined somewhat
among men and women in Egypt; however, it was
stagnant or increased in the other three countries.
Although most women also agreed that men
should have the priority in obtaining jobs, there was
considerable variation, from 36 per cent in Lebanon
to 81 per cent in Egypt. In many countries, there was
a clear gender attitudinal gap, with a 20– to 30–
percentage point difference in women’s and men’s
support of the statement. On the whole, attitudes in
the region were also more conservative than those
outside the region, with the exception of Malaysia.
Men’s agreement with the question of whether
being a housewife is as fulfilling as having a paid
job was consistently higher than women’s, with 65–
86 per cent of men in Arab States agreeing with the
statement, compared to 50–79 per cent of women.
Somewhat more egalitarian attitudes prevail in
countries such as Lebanon and Kuwait, whereas
Egypt, Jordan and Yemen show more conservative
attitudes among both genders. Further research
is needed to understand the reasons for these
important within–region differences in gender
attitudes.
figure 1.6: percenTage of men and women preferring ThaT women have a paid a job, ThaT women only do care work aT home, or ThaT women do boTh
24
36
51
32
23
31
17 17
45
36 35
45
28 29 2927
3841
0
10
20
30
40
50
60
Men Women Men Women Men Women
Prefer that women have a paid job Prefer that women only do care work at home Prefer that women do both
Per
cent
African Arab countries Asian Arab countries World average
Source: Authors compilation from Gallup and ILO 2017. Towards a Better Future for Women and Work: Voices of Women and
Men. Geneva: ILO and Gallup.

CARE ECONOMY AND PROMOTING GENDER EQUALITY
52
figure 1.7: percenTage agreeing ThaT men should have prioriTy when jobs are scarce (panel a) and ThaT being a housewife is as fulfilling as working for pay (panel b), by gender, selecTed arab and oTher lmics
Source: Authors’ compilation from Inglehart, R., and others. 2014b. “World Values Survey: Round Six.” Madrid:
JD Systems Institute.
(panel a)
20
59
70
19
37
35
88
83
71
77
75
80
45
68
84
80
85
69
14
43
42
15
24
27
63
59
68
54
47
56
37
50
78
49
81
47
0 50 100
Brazil
India
Malaysia
Mexico
South Africa
Thailand
Yemen
Tunisia
Qatar
Palestine
Morocco
Libya
Lebanon
Kuwait
Jordan
Iraq
Egypt
Algeria
Women Men
45
57
48
57
55
44
84
83
83
72
64
65
58
68
84
79
86
69
44
60
50
60
54
42
71
76
79
60
57
52
56
50
81
69
79
59
0 50 100
Brazil
India
Malaysia
Mexico
South Africa
Thailand
Yemen
Tunisia
Qatar
Palestine
Morocco
Libya
Lebanon
Kuwait
Jordan
Iraq
Egypt
Algeria
Women Men
(panel b)

CHAPTER 1 – THE CARE ECONOMY IN THE ARAB STATES
53
what care work men currently do – and what both
men and women believe they should do – at home.
Available data from countries in the region
indicate that men participate, and are more
willing to participate, in direct rather than indirect
care activities. In Egypt, over 80 per cent of
women and men agreed than men should help
their working wives with raising the children, but
only 60–67 per cent of women and 50 per cent of
men agreed that men should help their working
wives with household chores (Figure 1.9).
figure 1.8: percenTage agreeing ThaT men should have prioriTy when jobs are scarce (panel a) and ThaT being a housewife is as fulfilling as working for pay (panel b), by gender, selecTed arab counTries over Time
Source: Authors’ compilation from the World Values Survey Waves 5 and 6.
Although these data only capture a short time
period and a limited number of countries, they
suggest that attitudinal change regarding gender
roles in region is mixed.
Men’s participation in unpaid care work
One fundamental aspect of the redistribution of
unpaid care is the greater participation of men in
indirect and direct care activities at home. Given
the current, highly unequal ratio of women’s to
men’s time spent on unpaid care work, initiatives
to promote men’s greater involvement in care are
essential. To this end, it is useful to have a picture of
9385 86
80
9184
64
75
8581
78
49
8578
36
47
0
10
20
30
40
50
60
70
80
90
100
Wave 5 Wave 6 Wave 5 Wave 6 Wave 5 Wave 6 Wave 5 Wave 6
Egypt Iraq Jordan Morocco
Men
Women
9286
64
7982 84
5964
90
79
69 6966
81
56 57
0
10
20
30
40
50
60
70
80
90
100
Wave 5 Wave 6 Wave 5 Wave 6 Wave 5 Wave 6 Wave 5 Wave 6
Egypt Iraq Jordan Morocco
Men
Women
(panel a)
(panel b)

CARE ECONOMY AND PROMOTING GENDER EQUALITY
54
In Jordan, 68–69 per cent of men said that
husbands should help their working wives with
either raising children or household chores, but
women had much higher rates of agreement with
both statements. Change in attitudes was again
mixed over time. Support for men’s help in direct
and indirect care work rose among women over
both time periods in Egypt but fell among women in
Jordan.
More favourable attitudes towards men’s
participation in direct care work appear to
correspond with the tasks that men actually
perform. Figure 1.10 presents data extracted from
the 2016–2017 IMAGES survey, which captured the
percentage of fathers in Egypt, Morocco, Lebanon
and Palestine who reported participating in specific
direct care activities in the month prior to the
survey.89 The results show a strong pattern across
figure 1.9: supporT for husbands helping Their working wives wiTh direcT and indirecT care acTiviTies, egypT and jordan
Source: Authors’ calculations from the ELMPS 2006 and 2018 and the JLMPS 2010 and 2016.
Note: Measures were not collected from men in Egypt in 2006 or Jordan in 2010.
all countries, in which fathers were more likely to
participate in educational or leisure activities with
their child but had very low rates of participation in
other care activities, such as changing diapers or
bathing children.
The IMAGES data also demonstrate that the
gendered division of unpaid care starts early in
life. Both men and women aged 18–59 reported
which activities they did when aged 13–18 (Figure
1.11). Although there was some national variation,
in general, boys were least likely to do indirect care
activities within the home, such as cleaning the
bathroom, washing clothes and cleaning the home,
which only 16 to 20 per cent did. Boys were much
more likely to participate in shopping, an activity
outside the home, and taking care of other children.
Girls had much higher rates of participation in care
activities as adolescents.
8089
80
95
82
6960
67
50
8883
68
4
8
11
2
9
14
6
15
16
410
15
16
39
39
17
34
19
34
8 7
16
0
10
20
30
40
50
60
70
80
90
100
Women2006
Women2018
Men 2018 Women2010
Women2016
Men 2016 Women2006
Women2018
Men 2018 Women2010
Women2016
Men 2016
Egypt Jordan Egypt Jordan
The husband should help his working wife raise their children. The husband should help his working wife with household chores.
Per
cent
Agree Neutral Disagree

CHAPTER 1 – THE CARE ECONOMY IN THE ARAB STATES
55
figure 1.10: faThers’ parTicipaTion in direcT care acTiviTies in The monTh prior To The survey, egypT, morocco, lebanon and palesTine
Source: Authors’ elaboration from Promundo and UN Women 2017. Understanding Masculinities: Results from the International
Men and Gender Equality Survey (IMAGES) – Middle East and North Africa. New York: UN Women.
813
45
23
33
75
15 17
41
35
49
59
24 2521
5358
73
12 14
3942 44
81
0
10
20
30
40
50
60
70
80
90
100
Changing the child’s diapers orclothes
Bathing the child Daily routine care includingfeeding and supervising the
child
Helping the child withhomework
Dropping off or picking up thechild at school or daycare
Playing with the child orenjoying leisure activities
together
Per
cent
Egypt Morocco Lebanon Palestine
figure 1.11: parTicipaTion in indirecT and direcT care acTiviTies when age 13–18, men and women in egypT, morocco and palesTine, 2016–2017
Source: Authors’ elaboration from Promundo and UN Women 2017.
11
92
28
96
29
9388
63
19
28
55
70
32
94
35
96
44
93
6865
4945
63
80
24
85
51
95
56
82 80
36
54
7369
83
0
10
20
30
40
50
60
70
80
90
100
Men Women Men Women Men Women Men Women Men Women Men Women
Washed clothes Cleaned the house Prepared food Shopped for householditems
Helped children withhomework
Took care of children
Per
cen
t
Egypt Morocco Palestine
The early establishment of gendered care roles in
the home also leads to the early establishment of a
gendered time gap. Sixty–three per cent of women
in Egypt and 44 per cent in Morocco agreed that
they and their sisters had less free time as children
because they were expected to do care work at
home.90 The time that girls spend on unpaid care
during childhood and adolescence can restrict their
CARE ECONOMY AND PROMOTING GENDER EQUALITY
56
in this report aims to build on this momentum
to identify promising areas for continued
development. In recognizing care as a public good,
and to capitalize on its economic potential, all
countries in the region will need to move towards
a comprehensive and unified approach to closing
gaps in existing care policies and services.
Paid care leaves
Paid care leaves give individuals the time and
income to temporarily leave the labour market in
order to care for a child or an elderly, disabled or
ill family member. Care leaves are a critical policy
instrument for promoting the health and well–being
of women and their families while maintaining
women’s participation in the labour market. Yet the
existence of care leaves in laws alone will not yield
these positive outcomes. Gaps in the legal coverage
of care leaves (which types of workers are entitled)
as well as effective coverage (the percentage
of workers who actually benefit from leaves to
which they are entitled) can reinforce existing
inequalities in the labour market. For example, the
ILO estimates that while nearly all countries have
legal maternity leave provisions, globally only 45
per cent of employed women are covered by these
laws and only 41 per cent of employed mothers with
newborns actually receive maternity benefits.95 This
is particularly concerning in the Arab States, where
labour markets are characterized by high levels of
informality and weak labour law enforcement.
Eligibility for and financing of paid leaves can
also reinforce gender biases. In some countries,
only women workers are eligible for certain types
of care leave, which reinforces social norms that
privilege women’s unpaid caregiving roles and
provide little flexibility for men to exercise such
roles. When care leaves are financed by employers,
based only on the number of female employees or
benefits provided to women workers, this can also
create a disincentive to hire women, or incentives
time for education and recreational activities, with
negative long–term consequences for their human
capital development and well–being. Gender roles
established early in life are also likely to persist
into adulthood. Changing norms and practices
around unpaid care in the region thus requires
interventions that address the gendered care gap
early in life.
1.4 An overview of care policies and services in the Arab States
Care policies allocate resources towards the
recognition, redistribution and reduction of unpaid
care work.91 A comprehensive approach to investing
in the care economy requires addressing national
care needs across the life course, while ensuring
quality of services and employment conditions
in the paid care sector. While many countries
implement selected care policies, national–level
coordination is often lacking. This leads to gaps in
both legal and effective coverage of care services
and benefits, exacerbating the vulnerabilities of
those with the least access to resources to support
care needs.92
This section provides an overview of key care
policies to support women and their families in the
Arab States. These policies include care leaves,
ECCE and elder–care services. Care policies can
also be conceptualized more broadly93 to include
health–care services, primary and secondary
education, care–related infrastructure, social
protection transfers related to care94 and flexible
work arrangements. The three focus areas for
care policies in this report were selected based on
an assessment of regional needs and discussions
regarding priority policy areas for the four case
study countries. Several countries in the region
have also made recent investments or reforms in
these policy areas, particularly ECCE; the analysis

CHAPTER 1 – THE CARE ECONOMY IN THE ARAB STATES
57
to let women employees go when they marry or
get pregnant. Important gaps in these aspects
of the coverage and structuring of paid leaves
exist throughout the Arab States, which limit their
efficacy.
Maternity leave
Maternity leave is essential for promoting maternal,
as well as newborn and infant, health.96 Sufficient
paid maternity leave may also reduce drop–out
from the labour force when women have a child,
by protecting their right to temporarily leave
work around childbirth.97 Conversely, insufficient
maternity leave provisions, or lack of enforcement
of those provisions, may contribute to women
withdrawing from the labour market upon marrying
or having children – a common pattern in the Arab
States.
The ILO has several conventions aimed at
guaranteeing sufficient maternity leave for
working women. The first (No. 103), issued in 1952,
recommended that maternity leave should be of
at least 12 weeks duration.98 In 2000, the ILO issued
Convention No. 183, raising the minimum length of
paid maternity leave to 14 weeks. It also stipulated
that the income–replacement rate during maternity
leave should be at least two–thirds of earnings
and that at least two–thirds of the income paid to
women during the leave should be supported by
the social security system.99 The Arab States are the
only major world region in which no country meets
all three standards of Convention 183.100
Globally, maternity leave duration is less than the
Convention 183 standard of 14 weeks in 47 per cent
of countries.101 Among the 17 Arab States, only four
countries (24 per cent) meet this standard: Algeria,
Libya, Morocco and Iraq (Figure 1.12).102
Regional performance on Convention 183’s
income–replacement standard is much better, with
all 17 countries providing a minimum two–thirds of
wages. In fact, 16 countries provide 100 per cent
income–replacement – the only exception being
Tunisia, which provides only 66 per cent for women
in the private sector.
figure 1.12: paid maTerniTy leave duraTion in The arab sTaTes, in weeks
Source: Authors’ compilation from US Social Security Administration (2016, 2018 and 2019) and national labour laws.
See Appendix Table A3.
7 7 78 8
10 10 10 10 10 10
1213
14 14 14 14
0
2
4
6
8
10
12
14
16
Om
an
Qata
r
United A
rab E
mirate
s
Bahra
in
Tunisia
Kuw
ait
Lebanon
Pale
stin
e
Jord
an
Saudi A
rabia
Yem
en
Egyp
t
Syr
ia
Alg
eria
Lib
ya
Moro
cco
Iraq
Num
ber
of
Weeks
Convention 103Convention 183

CARE ECONOMY AND PROMOTING GENDER EQUALITY
58
private sectors of many Arab countries. Women
working in the informal sector are unlikely to
benefit from legal employment entitlements such
as maternity leave, even where these exist by law.
Data from Egypt and Jordan illustrate this effective
gap: 40 and 67 per cent, respectively, of working
women in the private sector took maternity leave
during their last pregnancy.106 Shifting to a social
insurance system for funding maternity, as well
as other paid leaves, is thus also an opportunity
to expand coverage of these leaves to women
outside the formal sector.107 Countries including
Chile and Uruguay have taken measures to extend
maternity leave coverage to women who are self–
employed or have only intermittently contributed
to the social insurance scheme.108 In Chile, self–
employed women who have accumulated one year
of contributions to the social insurance system,
including six months in the year prior to leave, are
eligible for maternity benefits. The calculation of the
wage replacement is based on invoices issued in
the three months prior to the leave.109
South Africa extends maternity coverage to
domestic and seasonal workers, who are often
informal, through the Unemployment Insurance
Fund, and other countries allow informal workers
to voluntarily enrol in the social insurance scheme.110
International evidence indicates that it is important
to take into account the financial ability of
informal workers to contribute to social insurance.
Subsidization of both workers’ and employers’
contributions may help overcome access barriers,
as well as measures to simplify administrative
procedures.111
Some countries provide women who meet eligibility
criteria with replacement income during pregnancy
and the immediate post–childbirth period through
non–contributory cash–transfer schemes funded
through the public budget. These programmes
have the disadvantage, however, that they are
often not part of national legislation and do not
have as stable a legal basis as social insurance
In contrast, on the maternity leave financing
standard, only four Arab countries (Algeria,
Morocco, Tunisia and Jordan) cover paid maternity
leaves through the social security system. Egypt
applies a mixed system in which 75 per cent of
the leave cost is covered by social insurance and
25 per cent by the employer. All of the remaining
countries have systems that place the full cost
of maternity leave on private employers. This
form makes women workers more expensive and
can discourage employers from hiring women,
particularly those of reproductive age.103
Jordan is an example of a country in the region that
has recently changed its maternity leave financing
from an employer–liability to a social insurance
system. After a 2010 reform to the social insurance
law, employers now contribute 0.75 per cent of their
total payroll (for both men and women employees)
to the social security system for maternity
insurance.104 Evaluation of this reform’s impact
on compliance with the law, employer attitudes
towards hiring women and women’s employment
rates is needed to provide lessons learned and
encourage similar reforms across the region.
There are other important gaps and inequalities in
maternity leave provisions around the region. A few
Arab countries have better coverage for women
in the public sector, which creates a gap between
the private and public sectors. For example, in
Egypt, maternity leave is generally 12 weeks, but
as of 2016, certain public sector workers receive
16 weeks.105 In Jordan, maternity leave is nearly 13
weeks long (90 days) in the public sector versus 10
weeks in the private sector. In Tunisia, the income–
replacement level for women working in the public
sector is 100 per cent but it is only 66 per cent for
those working in the private sector. In addition,
most Arab countries do not extend maternity leave
benefits to self–employed women.
The public–private sector gap is further
exacerbated by the high level of informality in the

CHAPTER 1 – THE CARE ECONOMY IN THE ARAB STATES
59
schemes. Transfer amounts and targeting criteria
can also vary substantially with such programmes.112
Paternity and parental leave
There is growing global recognition of the need to
encourage fathers to provide care for newborns
and infants through paternity or parental leave.
Paternity leave specifically allows fathers to stay
home with a newborn or young child. Parental
leave may be taken by either parent.
Studies from high–income countries show positive
impacts of paternity and parental leave on fathers’
involvement in unpaid care.113 Evidence also
shows that fathers’ greater involvement in care
during this early period tends to persist later in
the child’s life. The early establishment of paternal
involvement helps to set a more gender–balanced
division of childcare within the household. Greater
involvement in childcare also has positive benefits
for the health and well–being of both the child and
the father.114
Providing paternity and parental leave may
also benefit women’s employment, because
when leaves are provided (and taken) more
equally between men and women, this lessens
employers’ disincentives to hire and retain women.115
Nevertheless, legal provisions for paternity or
parental leave are lacking in many countries and
there is no international standard for these types
of leave. As of 2014, among 167 countries, 53 per
cent did not have a paternity leave policy and 21
per cent allowed a paternity leave of just one to
six days. An additional 23 per cent of countries
provided for paternity leave of 7–15 days and only 3
per cent for 16 days or more.116
In the Arab States, only four countries (Jordan,
Tunisia, Morocco and Saudi Arabia) provide
paternity leave. However, this leave is provided for
only a few days, which is too short to allow fathers
to establish a caregiving role for a newborn child
(Figure 1.13).117 Morocco has the longest allowed
leave (15 days), but the paid portion is only three
days. This may prevent fathers from taking the
full leave possible, due to financial reasons. No
countries in the region have a parental leave law.
Another challenge to implementing paternity and
parental leave around the world is low uptake of
leave rights among men.118 In the Arab region, there
is no available data on the extent to which men
in these few countries actually use their paternity
benefits, or the extent to which they spend leave
time caring for the newborn child. Given the strong
social norms around caregiving roles, research is
needed around men’s use of paternity leave and
what might motivate them to take advantage of
it, when it exists. This research could build on the
attitudinal data presented above that shows more
positive attitudes towards men’s involvement in
childcare relative to indirect care work. Innovative
approaches adopted by some countries, such as
“daddy quotas” that reserve and label some paid
leave time for fathers – leave time that is lost to the
couple if the father does not take it – have been
shown to increase men’s uptake of parental leave.119
Such approaches could be tested to assess their
potential to encourage men to take paid childcare
leave in the region, particularly in the public sector,
where coverage of paid leaves is currently higher
than in the private sector.
Breastfeeding breaks
Breastfeeding greatly improves early childhood
health, and the World Health Organization (WHO)
recommends six months of exclusive breastfeeding
for all newborns. However, maternity leaves in
many countries are shorter than six months, which
means employed women’s ability to continue
breastfeeding after returning to work depends
on having appropriate time and facilities for
breastfeeding breaks.

CARE ECONOMY AND PROMOTING GENDER EQUALITY
60
Comprehensive maternity protection policies,
including such breaks, improve economic
opportunities for women and their attachment to
the labour market.120
Breastfeeding breaks, or shortened work hours
to accommodate breastfeeding, are included
in Convention 183.121 However, their number and
duration is left to national labour laws. As of 2014,
about 75 per cent of countries around the world
provided paid or unpaid breastfeeding breaks or
reduced working hours.122 Although the Convention
does not have a recommended duration for such
breastfeeding breaks, about half of the world’s
countries allow breastfeeding breaks for 12–23
months after childbirth.123
Fourteen of the 17 Arab States allow breastfeeding
breaks at work – the exceptions being Lebanon,
Oman and Yemen.124 In all countries for which data
are available, women are allowed two paid breaks
per day, each lasting half an hour. The duration of
such breastfeeding breaks differs across countries,
but generally conforms to the global average of
12–23 months. Only Tunisia and Bahrain allow
breastfeeding breaks for less than a year.
Childcare leave
Leave to care for children beyond the immediate
postnatal period can give parents the flexibility to
balance work and family needs. When such leaves
are paid, they can also allow families to care for
sick children without jeopardizing needed income,
which can positively impact the child’s health.125
Childcare leaves take different forms across the
region. Eight of the 17 Arab States allow employed
women to take additional unpaid leave to care
for children under a certain age. The conditions
vary according to the labour laws of each country.
Morocco provides the shortest leave, of up to three
unpaid months. Bahrain permits an unpaid leave
of up to six months that can be taken a maximum
of three times. Palestine, Iraq, Syria and Jordan
allow an unpaid leave for childcare for up to one
year. Egypt provides the longest unpaid leave, at a
maximum of two years, for up to three times in the
public sector and two times in the private sector.
In Egypt’s private sector, unpaid leaves are also
restricted to women in establishments with more
than 50 workers.
figure 1.13: paTerniTy leave duraTion in The arab sTaTes, in days
Source: Authors’ compilation from US Social Security Administration (2016, 2018 and 2019) and national labour laws.
See Appendix Table A4.
Note: Paternity leave in Tunisia is two days in the public sector. In the private sector, it is only one day.
3
15
32
3 3 32
0
2
4
6
8
10
12
14
16
Jordan Morocco Saudi Arabia Tunisia
Num
ber
of
days
Leave duration Days of salary paid
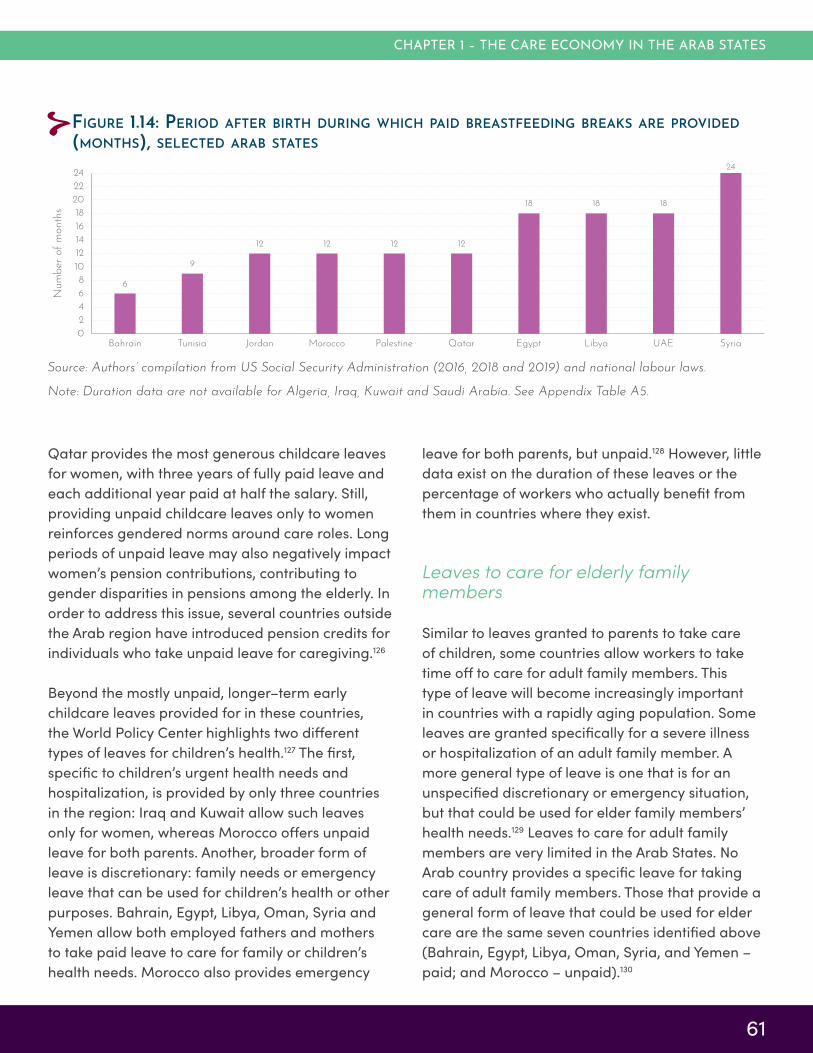
CHAPTER 1 – THE CARE ECONOMY IN THE ARAB STATES
61
Qatar provides the most generous childcare leaves
for women, with three years of fully paid leave and
each additional year paid at half the salary. Still,
providing unpaid childcare leaves only to women
reinforces gendered norms around care roles. Long
periods of unpaid leave may also negatively impact
women’s pension contributions, contributing to
gender disparities in pensions among the elderly. In
order to address this issue, several countries outside
the Arab region have introduced pension credits for
individuals who take unpaid leave for caregiving.126
Beyond the mostly unpaid, longer–term early
childcare leaves provided for in these countries,
the World Policy Center highlights two different
types of leaves for children’s health.127 The first,
specific to children’s urgent health needs and
hospitalization, is provided by only three countries
in the region: Iraq and Kuwait allow such leaves
only for women, whereas Morocco offers unpaid
leave for both parents. Another, broader form of
leave is discretionary: family needs or emergency
leave that can be used for children’s health or other
purposes. Bahrain, Egypt, Libya, Oman, Syria and
Yemen allow both employed fathers and mothers
to take paid leave to care for family or children’s
health needs. Morocco also provides emergency
leave for both parents, but unpaid.128 However, little
data exist on the duration of these leaves or the
percentage of workers who actually benefit from
them in countries where they exist.
Leaves to care for elderly family members
Similar to leaves granted to parents to take care
of children, some countries allow workers to take
time off to care for adult family members. This
type of leave will become increasingly important
in countries with a rapidly aging population. Some
leaves are granted specifically for a severe illness
or hospitalization of an adult family member. A
more general type of leave is one that is for an
unspecified discretionary or emergency situation,
but that could be used for elder family members’
health needs.129 Leaves to care for adult family
members are very limited in the Arab States. No
Arab country provides a specific leave for taking
care of adult family members. Those that provide a
general form of leave that could be used for elder
care are the same seven countries identified above
(Bahrain, Egypt, Libya, Oman, Syria, and Yemen –
paid; and Morocco – unpaid).130
figure 1.14: period afTer birTh during which paid breasTfeeding breaks are provided (monThs), selecTed arab sTaTes
Source: Authors’ compilation from US Social Security Administration (2016, 2018 and 2019) and national labour laws.
Note: Duration data are not available for Algeria, Iraq, Kuwait and Saudi Arabia. See Appendix Table A5.
6
9
12 12 12 12
18 18 18
24
0
2
4
6
8
10
12
14
16
18
20
22
24
Bahrain Tunisia Jordan Morocco Palestine Qatar Egypt Libya UAE Syria
Num
ber
of
month
s

CARE ECONOMY AND PROMOTING GENDER EQUALITY
62
Care services
Early Childhood Care and Education
Early childhood extends well beyond infancy, and
children’s care needs are substantial throughout
this period. As shown in the next section, having
a child under the age of 3 in the household is one
of the main predictors of women’s time spent
on unpaid care work. ECCE services can help
redistribute some of this unpaid care, allowing
parents more time for employment, education or
other activities. ECCE is a highly effective policy tool
for promoting women’s labour force participation.131
The benefits of redistributing time in early
childhood care may also extend to older siblings,
typically older sisters, who often contribute to
childcare activities, as shown earlier, in Figure 1.11.
ECCE also has important benefits for the
social, cognitive and health outcomes of young
children. Particularly for children from the most
disadvantaged households, universal, quality
ECCE can be part of an approach that reduces
inequalities in children’s learning and cognitive
development.132 Accessible, affordable and
high–quality ECCE is thus a critical element of a
comprehensive care policies package.
ECCE is typically divided into two stages. Early
Childhood Development (ECD) programmes, such
as nurseries, in most countries target children aged
0–2. Pre–primary education, such as kindergarten,
typically spans age 3 until the official age of
primary–school entry. However, data – particularly
on the ECD period – are not available for many
countries in the region. As of 2015, pre–primary
education generally began from age 3 and was
not compulsory in any of the 17 Arab States, with
compulsory schooling beginning at age 6 in all
countries.133 However, in 2019, Jordan made pre–
primary education compulsory for children aged 5
and above, beginning in the 2020–2021 academic
year. 134
Coverage of ECCE is typically assessed by
enrolment rates. Figure 1.15 shows gross enrolment
ratios for pre–primary education over time in those
countries in the region for which data is available.
Overall, the Arab region has seen an increase in
pre–primary enrolment from 16 per cent in 2005
to 27 per cent in 2018 – an increase of 68 per cent,
although from very low levels. There is also wide
variation across countries. A number of countries,
including Egypt, Jordan and Saudi Arabia, have
seen very slow growth in ECCE at low levels of
enrolment. Even among countries with gross
enrolment ratios of 30–60 per cent in 2018, progress
over the past decades has been slow and these
enrolment rates remain well below universal. A few
countries have, in contrast, improved enrolment
ratios since 2005, including Palestine and most
notably, Algeria. Algeria’s gross enrolment rates
among 5–year–olds increased dramatically (from
6 per cent in 2006 to 80 per cent by 2009) through
the expansion of public pre–primary education that
is attached to primary schools.135
Since ECCE is neither compulsory nor universally
provided, it may exacerbate inequalities between
children – and those who care for them – if
disadvantaged children are less likely to attend.
These social and economic inequalities may persist
throughout the life course. Although pre–primary
enrolment rates have improved in the region
overall, there are severe inequalities in ECCE access
(Figure 1.16).136 Whereas the most advantaged
children across seven Arab countries had an 18 to
97 per cent chance of attending ECCE, the least
advantaged had chances ranging from 0 to 13
percent.137 This means that even where chances
of attending ECCE are most equal, in Palestine,
the most advantaged children are five times more
likely to attend ECCE than the least advantaged.
These inequalities may relate in part to the costs of
ECCE. Although systematic data are not available,
an analysis in Jordan found that the mean monthly
cost of childcare was equivalent to 88 per cent of
women’s mean monthly wages.138

CHAPTER 1 – THE CARE ECONOMY IN THE ARAB STATES
63
In addition to curtailing children’s opportunities to
attend, the financial and in some cases geographic
inaccessibility of childcare facilities – including
both distance and lack of safe, adequate public
transportation – affects women’s ability to engage
in paid employment.
Beyond coverage, the quality of ECCE also has
important implications for children’s development
as well as families’ willingness to enrol their
children. Quality is also a reflection of the level of
investment in and regulation of ECCE, which in
turn affects the working conditions of care workers
in this sector. Smaller pupil–teacher ratios are an
indicator of higher quality, as this allows teachers
more time to focus on each child. Overall, the Arab
States averaged 19 children per ECCE teacher in
2005 and 21 children per teacher in 2018. As of 2018,
the pupil–teacher ratio ranged from 8 (Kuwait)
to 26 (Egypt) in the eight countries for which
data were available.139 Teacher qualifications are
another important indicator of the quality of ECCE.
The share of trained ECCE teachers in the region
overall declined from 93 per cent in 2005 to 83 per
cent in 2017, but data were only available for a few
countries.140 Besides improving coverage of ECCE,
investments in quality are equally important to
ensure both the health and safety of children and
decent conditions for care workers in this sector.
Establishment of nurseries in workplaces
ECCE services are provided by the public, private
and non–profit sectors. Having such facilities in or
near workplaces can make it easier for mothers to
return to work.
figure 1.15: gross enrolmenT raTios for pre–primary educaTion, 2005–2018, selecTed arab sTaTes
Source: Authors’ elaboration from World Bank 2019.
Note: The gross enrolment ratio is the total number of children enrolled in the level of schooling, regardless of age, over the
total number of children who are of age to be in that level, multiplied by 100. The ratio can therefore exceed 100.
0
10
20
30
40
50
60
70
80
90
100
2005 2006 2007 2008 2009 2010 2011 2012 2013 2014 2015 2016 2017 2018
Gro
ss e
nro
lment
ratio
Algeria
Bahrain
Egypt, Arab Rep.
Jordan
Kuwait
Morocco
Oman
State of Palestine
Qatar
Saudi Arabia
Syrian ArabRepublic
Tunisia
United ArabEmirates

CARE ECONOMY AND PROMOTING GENDER EQUALITY
64
A number of Arab States have provisions in their
labour law that require employers to establish
nurseries or arrange for a professional nanny
or external nursery if certain conditions are
met regarding number and characteristics of
employees. An important issue with the formulation
of such policies is that in most cases they are based
on the number of female employees only, which
may dissuade employers from hiring women.
Seven Arab States require nurseries in the
workplace when certain conditions are met.141 In
most, the requirement begins when the employer
hires a minimum of 50 or 100 women. An important
exception is Jordan, which bases the establishment
of nurseries on the number of children of all
employees, not just women. The standard that all
employees of the establishment have a minimum
of 15 children aged 5 or below to require a nursery
service aims to avoid discouraging employers from
hiring women.
Regardless of the requirement to establish
workplace–based nurseries, these provide only
figure 1.16: The chances of The mosT and leasT advanTaged children To aTTend ecce-selecTed arab counTries
Source: Authors’ elaboration from El Kogali, Safaa and Caroline Krafft. 2015. Expanding Opportunities for the Next Genera-
tion: Early Childhood Development in the Middle East and North Africa. Washington, DC: World Bank.
a small share of ECD care. For example, they
account for less than 2 per cent of nurseries in
Egypt and 4 per cent in Jordan.142 Nurseries based
in workplaces are also inaccessible to the large
population of women who do not work, or who
work in the informal sector and/or in smaller
establishments that do not meet the threshold
number of workers for requiring a nursery. In
parallel with labour law reforms to encourage the
establishment of nurseries or childcare services by
employers, parallel initiatives are therefore needed
to expand ECD services through other delivery
models that can encourage more universal access.
These may include expanding public provision of
ECCE, as in Algeria, or investing in expanding and
accrediting nurseries, as in Egypt. Other models,
adopted by countries such as Ecuador, expanded
ECCE coverage and improved quality through
agreements between local governments and civil
society organizations (CSOs) that directly provided
services.143
10
05
1
13
2 4
63
22
44
18
58
69
97
0
10
20
30
40
50
60
70
80
90
100
Egypt Iraq Jordan Libya Palestine Syria Tunisia
Least advantaged Most advantaged
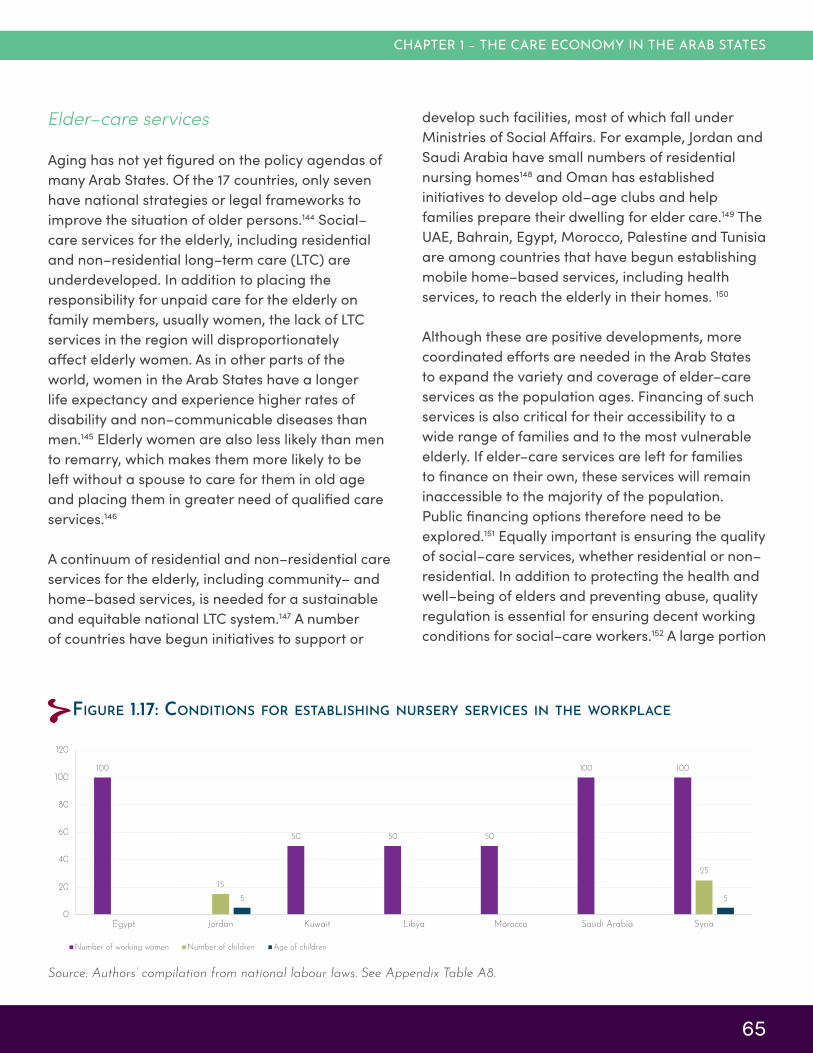
CHAPTER 1 – THE CARE ECONOMY IN THE ARAB STATES
65
Elder–care services
Aging has not yet figured on the policy agendas of
many Arab States. Of the 17 countries, only seven
have national strategies or legal frameworks to
improve the situation of older persons.144 Social–
care services for the elderly, including residential
and non–residential long–term care (LTC) are
underdeveloped. In addition to placing the
responsibility for unpaid care for the elderly on
family members, usually women, the lack of LTC
services in the region will disproportionately
affect elderly women. As in other parts of the
world, women in the Arab States have a longer
life expectancy and experience higher rates of
disability and non–communicable diseases than
men.145 Elderly women are also less likely than men
to remarry, which makes them more likely to be
left without a spouse to care for them in old age
and placing them in greater need of qualified care
services.146
A continuum of residential and non–residential care
services for the elderly, including community– and
home–based services, is needed for a sustainable
and equitable national LTC system.147 A number
of countries have begun initiatives to support or
develop such facilities, most of which fall under
Ministries of Social Affairs. For example, Jordan and
Saudi Arabia have small numbers of residential
nursing homes148 and Oman has established
initiatives to develop old–age clubs and help
families prepare their dwelling for elder care.149 The
UAE, Bahrain, Egypt, Morocco, Palestine and Tunisia
are among countries that have begun establishing
mobile home–based services, including health
services, to reach the elderly in their homes. 150
Although these are positive developments, more
coordinated efforts are needed in the Arab States
to expand the variety and coverage of elder–care
services as the population ages. Financing of such
services is also critical for their accessibility to a
wide range of families and to the most vulnerable
elderly. If elder–care services are left for families
to finance on their own, these services will remain
inaccessible to the majority of the population.
Public financing options therefore need to be
explored.151 Equally important is ensuring the quality
of social–care services, whether residential or non–
residential. In addition to protecting the health and
well–being of elders and preventing abuse, quality
regulation is essential for ensuring decent working
conditions for social–care workers.152 A large portion
figure 1.17: condiTions for esTablishing nursery services in The workplace
Source: Authors’ compilation from national labour laws. See Appendix Table A8.
100
50 50 50
100 100
15
25
5 5
0
20
40
60
80
100
120
Egypt Jordan Kuwait Libya Morocco Saudi Arabia Syria
Number of working women Number of children Age of children

CARE ECONOMY AND PROMOTING GENDER EQUALITY
66
of the social–care workforce in the region consists
of women, often with lower levels of education than
other care workers (see country chapters). Investing
in the capacities of these workers will benefit both
the elderly and the growing care workforce that will
be needed in this sector in the decades to come.
1.5 Key comparative Findings from the country case studies
The four country case studies highlight broad
similarities across the region in terms of women’s
prominent role in the care economy, which includes
near exclusive responsibility for unpaid care work
as well as a high level of participation in the paid
care sector.
The ratio of women’s to men’s time on unpaid care work reaches as high as 19:1
As found by global comparisons with the Arab
region,153 the distribution of unpaid care work in
the four selected countries is highly unequal. Data
from LMPS surveys indicate that women in Egypt,
Jordan and Tunisia perform on average 24, 19 and
17 hours of unpaid care work, respectively, each
week (Figure 1.18). Total hours spent on unpaid
care work are highest in Palestine, where women
reported doing 34 hours per week of unpaid care
work – although the estimates from Palestine are
the only ones drawn from a full time–use survey,
and it is therefore possible that they are higher due
to the survey methodology, and not necessarily
to differences in actual time spent on such work.
LMPS surveys may underestimate women’s time
in unpaid care work compared to a full time–use
approach.154 Notably, 66 – 75 per cent of women’s
unpaid care time was spent in indirect care work,
which while somewhat lower than other estimates
from the region,155 points to the potential for time–
saving household devices to lower women’s unpaid
care time.
Across all countries, men, in contrast, spend only
a few hours per week on unpaid care work. The
figure is again highest in Palestine, but at only five
hours per week, followed by Tunisia at three hours
per week. The country–level analyses therefore
find that the ratio of women’s to men’s time
spent on unpaid care work reaches 12:1 in Egypt,
19:1 in Jordan, 6:1 in Tunisia and 7:1 in Palestine.
The strongly gendered division of unpaid care
labour is also likely to mean that when added
care responsibilities arise, these fall primarily on
women. Estimations of the impact of the COVID–19
pandemic on women’s unpaid time in Jordan have
indicated that this may increase by 18–24 hours per
week, compared to 1–3 hours for men.156 The goal
of more equal distribution of unpaid care remains a
long way off in the region.
Married women also consistently spend more time
on unpaid care work than unmarried women. In all
countries, married women spend around twice as
much time on unpaid indirect work as unmarried
women and at least seven times as much time in
direct care work, which is largely driven by caring
for children. Yet there were also differences across
countries. Women’s hours in unpaid care were
lowest in Tunisia, which may be due in part to lower
fertility rates and higher rates of ECCE enrolment
(Figure 1.15) as compared to Jordan and Egypt. The
greater amount of time that Palestinian women
spend on unpaid care, particularly direct care,
may also reflect the higher fertility rate in Palestine
compared to the other countries, as well as the
methodological issues noted above.

CHAPTER 1 – THE CARE ECONOMY IN THE ARAB STATES
67
figure 1.18: cross–naTional comparison of weekly hours spenT in direcT and indirecT care work, by sex and mariTal sTaTus
Sources: ELMPS 2012; JLMPS 2016; Tunisia Labour Market Panel Survey (TLMPS) 2014; Palestine Central Bureau of Statistics
(PCBS) Time– Use Survey 2012/2013.
panel a: women
panel b: men
127 9
1522 20 18
32
1915 14
271
11
1
77 9
12
5
4 3
7
0
5
10
15
20
25
30
35
40
45
50
Egypt Jordan Tunisia Palestine Egypt Jordan Tunisia Palestine Egypt Jordan Tunisia Palestine
Unmarried Married Total
Hours
per
week
Indirect care work Direct care work
0 0 2 0 1 04
2 0 0 0 1
2
0
03 3
11
4
2 13 4
0
5
10
15
20
25
30
35
40
45
50
Egypt Jordan Tunisia Palestine Egypt Jordan Tunisia Palestine Egypt Jordan Tunisia Palestine
Unmarried Married Total
Hours
per
week
Indirect care work Direct care work
The gender gap in total work highlights the drastic undervaluation of women’s economic contributions.
Reduction or redistribution of women’s unpaid care
responsibilities does not occur even when they have
paid employment outside the home. Employed and
non–employed women spend the same amount
of time in unpaid care. Across the four case–
study countries, this results in a higher amount
of total time spent in work (paid and unpaid) for
women than for men, regardless of marital and
employment status (Figure 1.19). Married, employed
women spend the greatest total time in work of
any population group – at over 65 hours per week
in Egypt, Jordan and Palestine, and 49 hours per
week in Tunisia. The lower total work hours among
married, employed women in Tunisia is due both to
fewer hours spent on unpaid care work and shorter
paid working hours, averaging 29 hours per week
(similar to the 30 hours per week in Palestine) as
compared to 37 hours for employed women in
Egypt and Jordan.
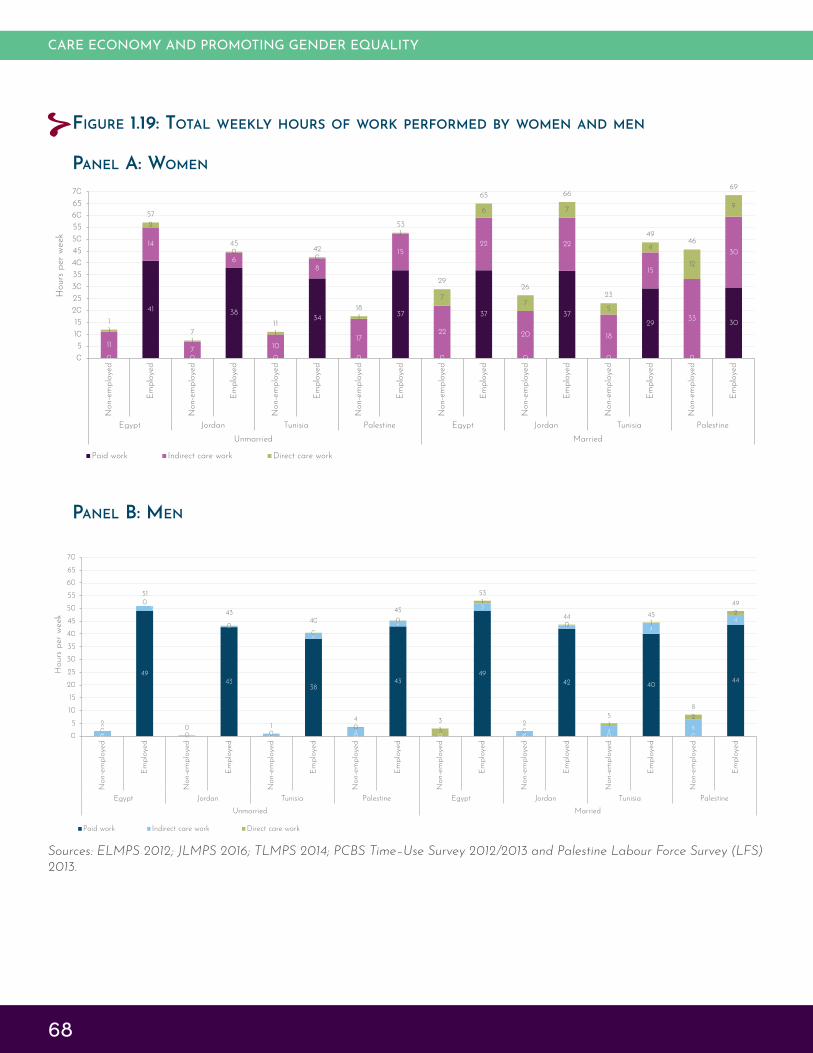
CARE ECONOMY AND PROMOTING GENDER EQUALITY
68
figure 1.19: ToTal weekly hours of work performed by women and men
panel a: women
panel b: men
Sources: ELMPS 2012; JLMPS 2016; TLMPS 2014; PCBS Time–Use Survey 2012/2013 and Palestine Labour Force Survey (LFS)
2013.
0
41
0
38
0
34
0
37
0
37
0
37
0
29
0
30
11
14
7
6
10
8
17
15
22
22
20
22
18
15
33
30
1
2
1
0
1
0
1
1
7
6
7
7
5
4
12
9
1
57
7
45
11
42
18
53
29
65
26
66
23
4946
69
0
5
10
15
20
25
30
35
40
45
50
55
60
65
70
Non-e
mplo
yed
Em
plo
yed
Non-e
mplo
yed
Em
plo
yed
Non-e
mplo
yed
Em
plo
yed
Non-e
mplo
yed
Em
plo
yed
Non-e
mplo
yed
Em
plo
yed
Non-e
mplo
yed
Em
plo
yed
Non-e
mplo
yed
Em
plo
yed
Non-e
mplo
yed
Em
plo
yed
Egypt Jordan Tunisia Palestine Egypt Jordan Tunisia Palestine
Unmarried Married
Hours
per
week
Paid work Indirect care work Direct care work
0
49
0
43
0
38
0
43
0
49
0
42
0
40
0
44
2
2
0
0
1
2
3
2
0
3
2
1
4
4
6
4
0
0
0
0
0
0
0
0
3
1
0
0
1
1
2
2
2
51
0
43
1
40
4
45
3
53
2
44
5
45
8
49
0
5
10
15
20
25
30
35
40
45
50
55
60
65
70
Non-e
mplo
yed
Em
plo
yed
Non-e
mplo
yed
Em
plo
yed
Non-e
mplo
yed
Em
plo
yed
Non-e
mplo
yed
Em
plo
yed
Non-e
mplo
yed
Em
plo
yed
Non-e
mplo
yed
Em
plo
yed
Non-e
mplo
yed
Em
plo
yed
Non-e
mplo
yed
Em
plo
yed
Egypt Jordan Tunisia Palestine Egypt Jordan Tunisia Palestine
Unmarried Married
Hours
per
week
Paid work Indirect care work Direct care work

CHAPTER 1 – THE CARE ECONOMY IN THE ARAB STATES
69
The difference in paid work hours between
unmarried and married women in Tunisia and
Palestine suggests that there may be more
opportunities in these countries to engage in
part–time and flexible work that allows married
women to reconcile paid work and family
responsibilities. Despite lower hours in both unpaid
and paid work, the FLFP in Tunisia (27 per cent) is
not substantially higher than Egypt (25 per cent),
where employed women have longer total work
weeks. There is evidence, however, that Tunisian
married women are more able to return to private
sector employment after childbearing than either
Egyptian or Jordanian married women.157
Total weekly hours of work did not exceed 53 hours
among married, employed men in Egypt and
are lower in the other three countries. Although
employed men spend somewhat more time in paid
work per week than employed women, their very
minimal contributions to unpaid care work means
that their total hours of work are consistently lower.
This applies equally to a comparison between
unmarried men and women as to one between
married men and women, but much more in the
case of the latter. Since men who are not employed
also contribute very minimally to unpaid care
work, there is a substantial gender gap in total
working hours, even among those not active in
the labour force. This persistent gender gap in
total work highlights the drastic undervaluation of
women’s economic contributions in the Arab region,
where the focus on low rates of FLFP can give the
impression that women are economically inactive.
Recognition of the hidden value of women’s unpaid
care work for both social and economic functions
in the region is thus critical to bringing the care
economy higher up on the policy agenda.
It is also important to recognize the opportunity
cost of the time that women spend on unpaid care
work. Figure 1.20 shows time spent on all forms
of work among employed women and men as a
percentage of the week. Employed, married women
in Egypt, Jordan and Palestine spend around
40 per cent of their week in some form of work,
compared to 24–33 per cent of the week among
employed, unmarried men and women and among
employed, married men. The time crunch facing
employed married women reflects the “double
shift” of unpaid care work they perform, and is an
important disincentive for women to engage in
the paid labour market. It is also a marker of time
poverty, which restricts women’s ability to engage
in other activities that are important for health and
well–being.
Care services can play an important role in redistributing women’s unpaid care work
Married women consistently bear the heaviest
responsibility for unpaid care work in the region,
but there are variations in household structure
that influence the amount of time they spend.
These variations have important implications for
the potential role of care services in redistributing
some of that responsibility. Across the four focus
countries, having a child under the age of 3 was
the strongest predictor of time spent on unpaid
care work among married women, leading to 5–10
more hours per week of care work (Figure 1.21). By
contrast, having a child aged 3–5 only significantly
increased women’s time in care work in Egypt (by 7
hours) and Palestine (by 3 hours). The greater time
associated with having a very small child is likely
in part due to the needs of this age group. Higher
rates of ECCE enrolment among 4–5–year–olds
may also partly explain the lesser additional time
associated with having a child in this age group,
and points to the importance of encouraging
the expansion of ECCE services as part of efforts
to redistribute some unpaid care work from
households to the public sphere.

CARE ECONOMY AND PROMOTING GENDER EQUALITY
70
figure 1.20: percenTage of ToTal hours in a week spenT on all forms of work, employed men and women
Sources: ELMPS 2012; JLMPS 2016; TLMPS 2014; PCBS Time–Use Survey 2012/2013 and Palestine LFS 2013.
Note: Percentage of time is expressed in terms of hours out of a total 168 hours in a week.
25 2422
2022 23
18 17
2927
2623
2926 26
24
7
4 9
5
13 12
18
9
1
01
1
2
1 2
2
1
0
0
0
4 45
3
0
0 0
0
0
0
1
0
33
28
31
25
39 39
41
2930
27 27
24
31
27
29
26
0
5
10
15
20
25
30
35
40
45
50
Egypt Jordan Palestine Tunisia Egypt Jordan Palestine Tunisia Egypt Jordan Palestine Tunisia Egypt Jordan Palestine Tunisia
Unmarried Married Unmarried Married
Women Men
Perc
enaget
of
tota
l tim
e in a
week
Paid work (workers only) Indirect care work Direct care work
figure 1.21: The effecT of differenT household sTrucTures on married women’s Time spenT in unpaid care work
Sources: ELMPS 2012; JLMPS 2016; TLMPS 2014; PCBS Time–Use Survey 2012/2013.
Notes: Estimates presented are marginal effects based on a regression model that controls for individual and household–level
characteristics (see Methodological Appendix). Missing estimates for the effect of children indicate that the estimate was statis-
tically insignificant. The effect of having an elderly person in the household could not be calculated for Palestine due to sample size, and was insignificant for Tunisia.
9
7
2
55
-5
10
3
5
6
4
-8
-6
-4
-2
0
2
4
6
8
10
12
Child <3 Child aged 3-5 Child aged 6-17 ElderlyHours
per
week
Egypt
Jordan
Palestine
Tunisia
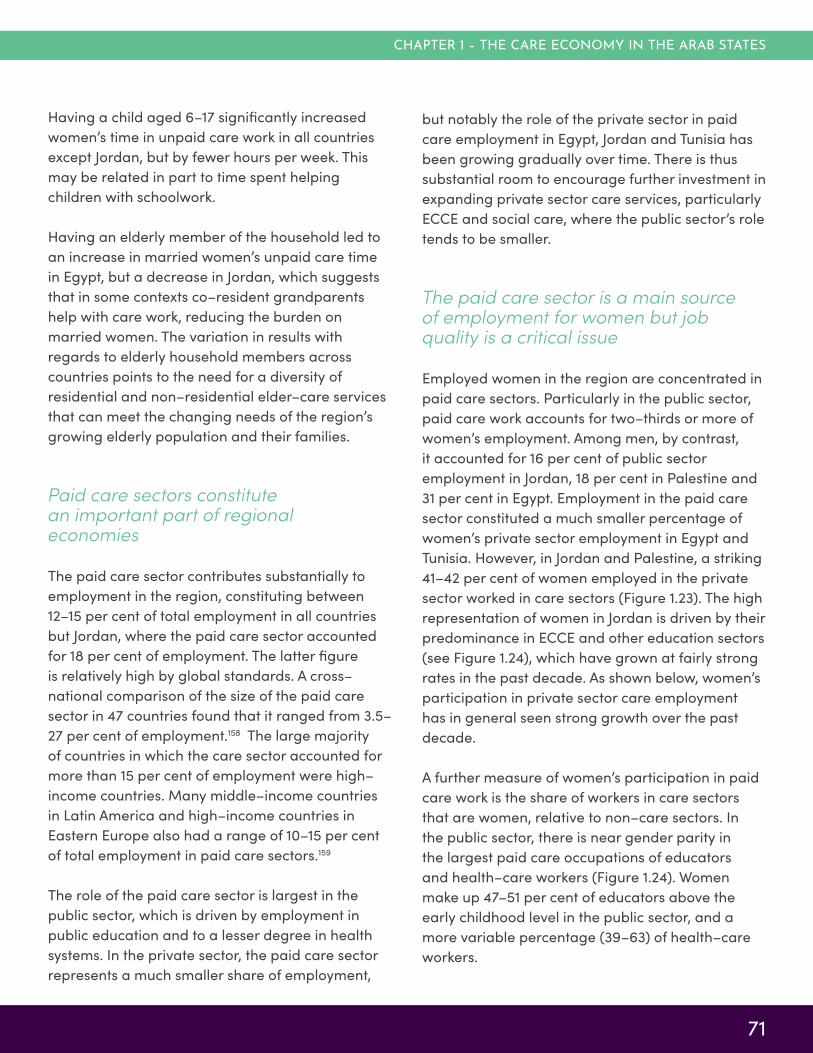
CHAPTER 1 – THE CARE ECONOMY IN THE ARAB STATES
71
Having a child aged 6–17 significantly increased
women’s time in unpaid care work in all countries
except Jordan, but by fewer hours per week. This
may be related in part to time spent helping
children with schoolwork.
Having an elderly member of the household led to
an increase in married women’s unpaid care time
in Egypt, but a decrease in Jordan, which suggests
that in some contexts co–resident grandparents
help with care work, reducing the burden on
married women. The variation in results with
regards to elderly household members across
countries points to the need for a diversity of
residential and non–residential elder–care services
that can meet the changing needs of the region’s
growing elderly population and their families.
Paid care sectors constitute an important part of regional economies
The paid care sector contributes substantially to
employment in the region, constituting between
12–15 per cent of total employment in all countries
but Jordan, where the paid care sector accounted
for 18 per cent of employment. The latter figure
is relatively high by global standards. A cross–
national comparison of the size of the paid care
sector in 47 countries found that it ranged from 3.5–
27 per cent of employment.158 The large majority
of countries in which the care sector accounted for
more than 15 per cent of employment were high–
income countries. Many middle–income countries
in Latin America and high–income countries in
Eastern Europe also had a range of 10–15 per cent
of total employment in paid care sectors.159
The role of the paid care sector is largest in the
public sector, which is driven by employment in
public education and to a lesser degree in health
systems. In the private sector, the paid care sector
represents a much smaller share of employment,
but notably the role of the private sector in paid
care employment in Egypt, Jordan and Tunisia has
been growing gradually over time. There is thus
substantial room to encourage further investment in
expanding private sector care services, particularly
ECCE and social care, where the public sector’s role
tends to be smaller.
The paid care sector is a main source of employment for women but job quality is a critical issue
Employed women in the region are concentrated in
paid care sectors. Particularly in the public sector,
paid care work accounts for two–thirds or more of
women’s employment. Among men, by contrast,
it accounted for 16 per cent of public sector
employment in Jordan, 18 per cent in Palestine and
31 per cent in Egypt. Employment in the paid care
sector constituted a much smaller percentage of
women’s private sector employment in Egypt and
Tunisia. However, in Jordan and Palestine, a striking
41–42 per cent of women employed in the private
sector worked in care sectors (Figure 1.23). The high
representation of women in Jordan is driven by their
predominance in ECCE and other education sectors
(see Figure 1.24), which have grown at fairly strong
rates in the past decade. As shown below, women’s
participation in private sector care employment
has in general seen strong growth over the past
decade.
A further measure of women’s participation in paid
care work is the share of workers in care sectors
that are women, relative to non–care sectors. In
the public sector, there is near gender parity in
the largest paid care occupations of educators
and health–care workers (Figure 1.24). Women
make up 47–51 per cent of educators above the
early childhood level in the public sector, and a
more variable percentage (39–63) of health–care
workers.

CARE ECONOMY AND PROMOTING GENDER EQUALITY
72
figure 1.22: The share of care secTors in ToTal employmenT in selecTed arab sTaTes
Sources: Egypt LFS 2015–2017; Jordan LFS 2015–2018; PCBS Population, Housing and Establishments Census 2017;
Tunisia LFS 2019.
Notes: Share of employment is calculated at the sectoral level, except for Palestine, which is calculated at the occupation level.
Figures for Jordan and Tunisia do not include domestic work.
figure 1.23: employmenT in care secTors as a percenT of ToTal male and female employmenT
Source: Egypt LFS 2015–2017; Jordan LFS 2015–2018; Palestine Population, Housing and Establishments Census 2017;
Tunisia LFS 2019.
Notes: Share of employment is calculated at the sectoral level, except for Palestine, which is calculated at the occupation level.
Figures for Jordan and Tunisia do not include domestic work.
42
28 28
41
5
1011
4
13
18
15
12
0
5
10
15
20
25
30
35
40
45
50
Egypt Jordan Palestine Tunisia
Per
cent
of
tota
l em
plo
yment
Public sector Private sector Total
31
67
16
72
18
60
65
2
14
4
42
5
41
13
8
32
10
59
8
60
26
0
10
20
30
40
50
60
70
80
90
100
Men Women Men Women Men Women Women
Egypt Jordan Palestine Tunisia
Perc
ent
of
tota
l em
plo
yment
Public sector Private sector Total

CHAPTER 1 – THE CARE ECONOMY IN THE ARAB STATES
73
figure 1.24: share of workers ThaT are women, by occupaTion
Sources: Egypt LFS 2015–2017; Jordan LFS 2015–2018; Palestine Population, Housing and Establishments Census 2017; Tunisia
LFS 2019.
Note: Percentage of workers is calculated at the occupational level.
22
20
17
63
99
47
17
97
31
41
98
66
12
52
53
67
47
10
90
48
87
63
100
50
39
61
51
100
100
50
81
47
23
95
67
61
94
56
0 20 40 60 80 100
Non-care occupations
Social care workers
Childcare workers
Personal care workers
Healthcare workers
Early childhood educators
Other educators
Per cent of workers
Tunisia(National)
Palestine(Private sector)
Palestine(Public sector)
Jordan (Privatesector)
Jordan (Publicsector)
Egypt (Privatesector)
Egypt (Publicsector)

CARE ECONOMY AND PROMOTING GENDER EQUALITY
74
However, women are overrepresented in the
private care sector, particularly in Egypt and
Jordan, where they comprise over 60 per cent of
educators above the early childhood level. In all
countries, the vast majority of early childhood
educators and childcare workers in the private
sector are women (as well as social–care workers in
Jordan, where childcare workers and personal care
workers are not disaggregated).
Women’s overall share of paid care employment
in the region is somewhat low by international
standards, as in many high– and middle–income
countries women’s share of paid care employment
is over 70 per cent.160 Nevertheless, women’s share
of paid care employment is striking given their
low levels of participation in the labour market. In
non–care sectors, women’s share of employment
is much lower, ranging from 10–23 per cent across
the public and private sectors. By comparison, in
many other countries, women’s share of non–care
employment ranged from 30–50 per cent.161 The
substantial gap in women’s care versus non–care
employment illustrates the degree to which care
employment is attractive to women and one of the
few avenues of employment that is accessible to
them, especially in the private sector.
Although the paid care sector is a key area for
women’s employment, it is also important to
consider the potential downsides of women’s
concentration in this sector. Women tend to make
up a greater share of employment in education
(particularly ECCE) and social–care sectors, as
opposed to health. Concentration of women in
certain sectors may reflect occupational sex–
segregation and barriers to women’s entry into the
health–care sector (such as longer working hours)
and non–care sectors. The concentration of women
in care sectors may also leave them vulnerable to
changing employment conditions in times of crisis,
including during the ongoing COVID–19 pandemic
(see Box 1.3).
The feminization of economic activities, including
social care and domestic work, is also often
associated with the devaluation of these forms
of work.162 Each country chapter notes concerns
about job quality in the care sector, and particularly
private sector care work, including deteriorating
levels of formality in Egypt (Chapter 2), gender
wage gaps in Jordan (Chapter 3), lack of adherence
to minimum wage policy in Palestine (Chapter
4), and high levels of informality in the social–
care sectors in Tunisia and Jordan (Chapters 5
and 3) and in the ECCE sector in Tunisia (Chapter
5). Efforts to expand private care services,
particularly in social care and ECCE, where worker
education levels also tend to be lower, must take
into consideration the need for decent working
conditions. Job quality is recognized as a key
determinant of women’s occupational choices, so
promoting decent work in the paid care sector is
essential to encouraging women’s employment, as
well as to improving the quality of services for care
recipients.
Growth in the paid care sector has outpaced growth in non–care sectors
Beyond representing a source of growth for
women’s employment, the paid care sector has
the potential to power overall economic growth
across the region. Analyses from the country
case studies show that employment growth in
the paid care sector has generally been stronger
than in non–care sectors over the past decade.
This is particularly true for women and for the
private sector. Egypt, for example, saw remarkable
employment growth in the private paid care sector,
at 12.9 per cent annually from 2009–2017 (17.1 per
cent for women). This was compared to a growth
rate of 1.8 per cent the private non–care sector
and a small contraction (–0.3 per cent growth per
annum) in the public care sector (see Chapter 2).

CHAPTER 1 – THE CARE ECONOMY IN THE ARAB STATES
75
box 1.3: care work during The covid–19 pandemic
Existing inequalities in the provision and receipt of care may be exacerbated in times of crisis, a fact that the ongoing COVID–19 pandemic has highlighted on a global scale. The impacts of the pandemic are widespread and gendered.187 Although rigorous data to measure its impacts on the care economy in the Arab States are not yet available, the pandemic is likely to have numerous implications for paid and unpaid care work.
Emerging evidence from around the world indicates that unpaid care responsibilities have increased during the pandemic.188 A key contributing factor is school and nursery closures, and disruption of informal childcare arrangements (such as leaving children with grandparents). Families may also face added care responsibilities for elderly or other members who fall sick during the pandemic.189 Particularly given the highly unequal division of unpaid care work that currently prevails in the Arab region, the majority of these increased care responsibilities are likely to fall on women.190 The consequences of increased time spent on unpaid care during the pandemic are likely to include greater time poverty and lower well–being among women. They may also include job losses or reduced paid work hours for employed women who do not benefit from care leaves and/or cannot maintain their normal work schedules due to their increased care responsibilities at home.
Women are also vulnerable to the effects of COVID–19 and associated lockdown measures because of their high levels of participation in the paid care workforce. Globally, women make up a large percentage of the health workforce and particularly front–line health–care workers, which puts them at greater risk of contracting the virus.191 The analysis in this report has shown that women’s share of employment in the health–care sector in the Arab States is lower than this global average. Nevertheless, women make up a larger share of the health workforce than of the labour force overall. Women are also heavily represented among private sector education, ECCE and childcare workers. This sector is expected to experience losses due to closures during the pandemic, and, for example, in Jordan, employers in the sector have been accused of not paying employees.192 Domestic workers are also at risk of job losses due to lockdown and social distancing measures.193 Some of the most vulnerable care workers in the region may therefore disproportionately bear the economic effects of the pandemic.
The impact of COVID–19 on both women’s unpaid and paid care work in the region is exacerbated by the low levels of coverage of care leaves and institutionalized flexible work arrangements. As shown in this chapter, few countries in the region provide legal provisions for dedicated leaves for the care of sick children or elderly family members. Although some countries in the region have implemented temporary care leave measures during the pandemic, these are unlikely to apply to the large number of women (and men) working in the informal sector and may therefore exacerbate existing labour market inequalities. Some temporary care leave provisions also only apply to women, which reinforces gendered norms around care roles. In Egypt, for example, exceptional paid leaves were granted for working mothers with children aged 12 and under during the pandemic, but not for working fathers.194 Work–from–home and other flexible work arrangements are also uncommon in the Arab States.195 While some countries and employers have again instituted temporary measures for flexible work during the pandemic, these types of provisions may not be applicable to some of the most vulnerable forms of care work that are based on face–to–face contact (e.g. personal care and childcare services).
The global crisis prompted by the COVID–19 pandemic and the gaps it has revealed in current care systems can serve as a catalyst for a more comprehensive approach to the care economy.196 As recommended in this report, in the Arab States this should begin with concerted efforts to develop national strategies on the care economy. These strategies should build on detailed analysis of current gaps in not only legal but also effective coverage of key care policies and services, including paid care leaves and childcare services. The expansion of social protection systems to cover both employed women and men in the formal and informal sectors with more flexible care leave options is also critical to supporting families to meet their care needs. Finally, institutionalization of provisions for flexible working arrangements as part of national labour laws should be explored.

CARE ECONOMY AND PROMOTING GENDER EQUALITY
76
Tunisia saw annual growth rates of 5–6 percent in
the private health and educator sectors from 2010–
2019, and rapid growth in childcare workers in both
the public (16.3 per cent) and private sectors (19.1
per cent; see Chapter 5). Investments in expanding
paid care services can thus provide multiple
benefits: offering families options to redistribute
some of women’s unpaid care responsibilities;
developing high–quality care services that support
the needs of children, the elderly and the disabled;
expanding employment opportunities for women;
and contributing to overall economic growth.
1.6 Recommendations: Investment in the care economy as a path towards gender equality
Regional analysis of the care economy and the
current state of care policies points to cross–
cutting priorities across the Arab States in order
to recognize, reduce and redistribute unpaid care
work while fostering the growth of decent and
adequately rewarded employment in the paid care
sector.
Adopt coordinated national strategies on the care economy
Countries in the Arab region do have a set
of policies and public services – of varying
comprehensiveness – that implicitly address the
recognition and redistribution of unpaid care
work. However, the policies and services in place
are largely uncoordinated and fall under the
jurisdiction of different ministries, leading to serious
gaps in their legal and effective coverage. Adopting
a national, coordinated strategy for the care
economy is therefore a first step for Arab States to
invest wisely in this critical sector. Previous policy
analyses by UN Women have highlighted that such
national strategies should be based on the guiding
principle of equality. This entails both equality
in care provision – through co–responsibility of
women and men, the State and families – and
equality in the care received – through universal
access to quality care services.163 As highlighted by
the findings and subsequent recommendations of
this report, coordinated national care strategies
should also adopt a life course approach to
meeting the care needs of individuals and families,
and place critical emphasis on the interrelated
issues of the quality of care services and the quality
of employment in the care sector.
Given the low levels of female labour force
participation and high levels of employment
informality, national care strategies must not only
enact care policies but also effectively monitor
and enforce their implementation. It is critical
that policies avoid disincentivizing women’s
employment, as is currently the case with some
care leave policies in the region, or further
exacerbating coverage gaps between the public
and private sectors. Policies that do so may have
unintended negative consequences on women’s
employment. Models of care service–provision
that do not ensure widespread financial and
geographic access also risk deepening inequalities
in who receives care.
Invest in national time–use surveys and other sources of data on the care economy
Developing an evidence–based national care
strategy requires data. This report demonstrates
the potential for data to reveal women’s hidden
economic contributions through measurement
of unpaid care work. At the same time, the LMPS
data point to some of the limitations of using
standard survey methodologies to develop time–
use estimates. Accurate estimation and valuation
of the care economy requires national time–use

CHAPTER 1 – THE CARE ECONOMY IN THE ARAB STATES
77
data. Regularly collected time–use data is also
essential for measuring the impact of changes in
care policies or services on women’s time in unpaid
care work. Time–use surveys remain very limited
in the region,164 and some of those that have been
conducted are not publicly available. Investment
in collecting and disseminating time–use surveys
should therefore be a priority for national statistical
offices and their partners throughout the region.
This report also highlights other critical evidence
gaps related to the care economy in the region.
Regularly collected, standardized data are needed
on essential care policies and services, including
rates of coverage and uptake of maternity leave,
enrolment rates in ECCE by level and children’s
age, and use of elder–care services. Provider–level
data on ECCE and elder–care services, particularly
in the private sector, are also critically needed in
order to provide a basis for monitoring the growth
and quality of these establishments, as well as
the characteristics of their employees. Data on
domestic workers in the region are also a critical
gap to addressing the needs of workers in this
highly vulnerable care sector.
Bring maternity leave policies in line with ILO recommendationsand introduce paternity or parental leave
Although maternity leave is the most widely
implemented care leave policy in the region, in
most countries it does not meet the standards
of ILO Convention 183. In addition to increasing
the length of maternity leave in some countries,
its financing is a major barrier to achieving
international standards. There is a need for the
region to move towards international best practices
and adopt the ILO recommendation to finance
maternity leave through the social insurance
system. Measures also need to be explored for
expanding coverage of maternity leave to women
who are self–employed or working in the informal
sector, building on the experiences of other
countries that have taken steps in this direction.
The implementation of paternity leave in the
region is a long–term goal to promote men’s
greater involvement in caregiving. It requires, first,
that countries enact paternity leave of sufficient
duration to allow men to establish a caregiving role
for their child. As demonstrated by international
evidence,165 effectively implementing paternity
leave also requires targeted communication and
advocacy to encourage men to take the leave to
which they are entitled and to actually use it to
contribute to care activities at home. These efforts
are part of a broader approach to addressing
gender norms around care roles, discussed further
below.
Expand Early Childhood Care and Education
Governments should invest in expanding ECCE,
which can have multiple positive effects that
are critical to achieving the SDGs, including:
improved early childhood development outcomes;
redistribution of some of women’s unpaid care
responsibilities; and expansion of an economic
sector that provides job opportunities for women.
Analyses from other middle–income countries show
that a substantial proportion of the costs of public
investment in universal, high–quality ECCE services
are offset by returns from increased employment,
particularly among women.166
ECCE expansion can take multiple forms,
with provision through public, private, non–
governmental or civil society organizations. In order
to avoid widening the substantial socioeconomic
inequalities in access to ECCE, several key
principles should be taken into consideration.
Evidence indicates that universal, free ECCE is
more likely to achieve higher levels of enrolment,

CARE ECONOMY AND PROMOTING GENDER EQUALITY
78
particularly among disadvantaged groups.167 Thus,
if ECCE expansion takes the form of private
sector provision, some form of public financing or
subsidization is necessary in order to keep costs
within reach of the majority of families. ECCE
provision through the private or non–profit sectors
also requires effective government regulation and
oversight in order to maintain the quality of services
for children and decent working environments for
ECCE workers.168 Given the low quality of public
primary education in a number of countries of the
region, quality is a cross–cutting concern for the
expansion of ECCE that must be addressed through
any provision model.
In terms of impacts on women’s labour force
participation, the structure of ECCE provision is
also important. Half–day pre–primary education
or nursery schedules may conflict with working
hours such that ECCE expansion does not
facilitate women’s employment.169 The flexibility
of ECCE provision – as well as flexibility of work
arrangements – should also be considered in
expansion strategies.
Start to plan for a range of long–term care options
The elder–care sector remains highly
underdeveloped in the Arab region. Although the
share of the elderly population is currently small
in many countries, and time spent on unpaid care
for the elderly is low, this will change rapidly over
the coming decades. Now is the time to plan for
long–term care systems that can meet the diverse
needs of older persons and their families. In the
absence of LTC options, the responsibility for elder
care will likely add to women’s unpaid care time.
LTC systems should involve a range of residential
and non–residential care options, including
home–based nursing services and day centres for
the elderly. They should also include supports for
family members to care for the elderly when this is
the best option for the family, including paid care
leaves for elder care.170 As with ECCE, the costs of
these services cannot fall exclusively on households,
or they will remain inaccessible to the vulnerable
elderly who need them most.
Address professionalization and job quality in particularly vulnerable care sectors
The expansion of ECCE and elder–care coverage in
the region also depends on the quality of services
and employment in these sectors. Social care and
ECCE have the most vulnerable employment, as
measured by levels of informality and the education
levels of workers. Professionalization and regulation
of these sectors is important to ensure service
quality, job quality and for changing social views
that devalue these forms of paid care work.
Professionalization of ECCE and elder–care services
requires establishing corresponding areas of
specialization as degree programmes in post–
secondary education institutions.171 Professional
certifications and on–the–job training opportunities
also need to be available to individuals entering or
interested in entering these fields.
Efforts to professionalize ECCE and elder–care
services will be reinforced by the regulation and
enforcement of quality and working standards,
including formality (contracts and social insurance
registration). These measures are critical for the
safety and well–being of care recipients and care
workers. The quality of care services is also likely
to influence households’ willingness to entrust their
loved ones to these services, and so will affect
demand as well as supply.
Finally, domestic work, although not a focus
area of this report, is one of the most vulnerable

CHAPTER 1 – THE CARE ECONOMY IN THE ARAB STATES
79
employment sectors globally and in the region. As a
sector that employs large numbers of women, and
particularly migrant women, improving the rights
and employment conditions of domestic workers
must be part of any agenda to address gender
equality in the care economy.
Seek to change gender norms
The stark gender division in unpaid care work in
the Arab States is driven by social norms as well
as economic incentives. Until prevailing views that
caregiving is ‘a woman’s role’ change, redistribution
will be an uphill battle and women will continue
to bear the brunt of the double burden of paid
and unpaid work. Changing trends in women’s
economic roles – such as increased FLPF – may
drive normative change, but it is likely a two–way
street, where changing norms will also accelerate
changes in behaviour. Efforts to address gender
norms around caretaking roles are therefore
needed to accompany policy initiatives.
There are a number of innovative approaches to
addressing gender norm change. Several recent
studies have found that both men and women in
the region sometimes overestimate the rigidity of
norms in their communities. When presented with
evidence about the level of support for women’s
employment in the community, for example,
individuals may be more willing to express similar
support or change behaviours.172 Normative change
is a slow and complex process, evidenced by the
fact that nowhere in the world do men perform
as much unpaid care work as women.173 Yet it is
a prerequisite to achieving true gender equality
that cannot be overlooked in a comprehensive
approach to the care economy.

THE NEED TO RECOGNIZE,
REDISTRIBUTE AND SUBSIDISE
2THE EVOLUTION
OF PAID AND UNPAID CARE WORK IN EGYPT
2.1 Overview
2.2 Care policies and services in Egypt
2.3 Recognizing unpaid care work
2.4 Characteristics and growth of the paid care economy
2.5 From key fΙndings to informed policy recommendations
106
82
83
90
99

2 KEY MESSAGES
In Egypt, married women spend seven times as much time on unpaid care
work as married men; while unmarried women spend 6.5 times as much as
unmarried men.
1
Women spend almost the same amount of time on unpaid care work
whether or not they are employed.2
There is a mismatch between care needs and existing services, which limits the ability to redistribute unpaid care responsibilities.3Between 2009–2017, private sector employment grew faster in paid care sectors (education, health and social work) than in the rest of the economy.4
Within care jobs, the private sector has become more feminized than the
public, while seeing rising informality and declining job quality.5
There is a need to expand quality early childhood care and education services, ensuring affordability and decent working conditions.6Implement family-friendly labour market regulations for care leave and
flexible work. Labour market provisions that only apply to women can be costly to employers and might discourage employers from recruiting women.
7
Change in gender roles and traditional attitudes is essential to the success
of other policies and interventions to redistribute unpaid care work. 8
82
CARE ECONOMY AND PROMOTING GENDER EQUALITY
2.1 Overview Egypt continues to face challenges to achieving
gender equality, especially in terms of economic
participation and opportunity. As of 2020, Egypt
has made progress in closing the gender gap197 in
education. However, the gender gap in labour force
participation remains large, with Egypt ranking
143rd out of 153 countries.198 199 Around 76 per cent of
working–age men (15–64 years) are in the labour
force compared to only 21 per cent of working–age
women.200
There is a trade–off between paid work and
unpaid domestic work. Countries with significant
gender imbalances in unpaid work also see low
female labour force participation, and Egypt is no
exception.201 202 Because of the gendered division
of labour inside the household, women perform
the overwhelming majority of unpaid care work,
leaving them with little time for paid employment.
In 2018, around 88 per cent of women aged 15–64
years old were involved in unpaid domestic care
work, compared to 29 per cent of men.203 Moreover,
Egyptian women spend 22.4 per cent of their day
on unpaid domestic chores, more than nine times
what men spend (2.4 per cent).204 Correspondingly,
about 60 per cent of Egyptian women describe
their primary economic activity as “housewife”.205
The relationship between unpaid care work in the
household and economic participation in the labour
market is complex. Unpaid domestic responsibilities
that fall primarily on women have been one of the
major factors explaining women’s weak economic
participation.206 At the same time, reduced women’s
employment is identified as an important cause
of rising fertility;207 the latter, in turn, may lead to
women performing more unpaid care work for
young children. Therefore, understanding the
drivers of unpaid and paid care work in Egypt
is a first step towards advancing gender and
economic equity. Such an understanding should
nurture policy–level and social norm changes
that recognize and redistribute unpaid care work,
and reward paid care work to enable women to
participate fully in the Egyptian economy. Without
proper investment in the paid care economy –
through promoting more and decent work for care
workers, investing in social care infrastructure,
especially quality care services – and guaranteeing
care workers’ representation, gender imbalances in
both unpaid care work and paid work will continue,
taking their toll on human capital, social justice and
economic growth.
The gendered distribution of unpaid care work
has been associated with gender norms, fertility
rates, dependency ratios (explained below), and
the availability of quality care services. All of
these aspects contribute to the amount of unpaid
domestic work, as well as the different degrees
of women’s and men’s involvement in paid work
versus unpaid care.
Key social ingredients in the gendered division of
household labour are gender roles and attitudes
towards women’s employment and unpaid care
roles. In Egypt, women are more likely to be
confined to reproductive roles and domestic work.
A recent survey of Egyptians’ perceptions found
that 44 per cent of respondents thought women’s
employment has a negative impact on family.208 A
further two–thirds (68 per cent) of respondents
thought the household duties that women perform
should not be compensated.209 This finding reflects
a lack of awareness and recognition of the value of
unpaid care work in Egyptian society. Recognition
of its value and its important role is a pivotal step
towards gender equality.210
Attitudes towards women’s employment and care
roles remain highly gendered and differ between
men and women. For instance, men are less likely
than women to support the idea of husbands’
help in unpaid care work. While 80 per cent of
men supported the idea of husbands helping their

CHAPTER 2 – THE EVOLUTION OF PAID AND UNPAID CARE WORK IN EGYPT
83
CHAPTER 2 – THE EVOLUTION OF PAID AND UNPAID CARE WORK IN EGYPT
working wives in raising children, 89 per cent of
women did. There was less agreement among
men and women about whether or not a husband
should help with household chores. Again, men (50
per cent) were less supportive of husbands’ help in
domestic chores than were women (69 per cent).211
A sizeable share of the Egyptian population is
likely to need care both now and in the future. A
first indicator of that magnitude is the dependency
ratio.212 In 2018, there were 64 dependents (children
under the age of 14 or seniors above age 65) for
every 100 persons of working age (15–64 years).
However, since gender norms assign women as
the primary caregivers, a more accurate measure
compares the number of dependents to the number
of women (aged 15–64) who are most likely to
provide care. For every 100 working–age women,
there were around 129 dependents in 2018.
The reduction in fertility rates achieved in the
past three decades (down from 4.1 in 1991 to 3.1
in 2018) has played an important role in reducing
the number of dependents (from as high as 80
dependents for every 100 persons of working–age
in 1991 to 64 dependents in 2018).213 214 However,
Egypt’s fertility rate remains high, contributing to
high dependency ratios and care needs for young
children.
These needs are coupled by a limited, although
growing, supply of childcare facilities and a
much lower number of nursing homes or special
assistance alternatives for the elderly and
disabled. The mismatch between care needs and
the availability and adequacy of care services
in the market limits the ability of women and of
households to redistribute some of their unpaid
care responsibilities to the market. Developing such
alternatives to unpaid domestic care is critical to
reducing women’s unpaid care burden.
This analysis presents a comprehensive view of
the care economy in Egypt by analysing both the
amount and distribution of unpaid care work within
households and the extent to which the paid care
sector and care policies match the magnitude of
the country’s care needs. In this respect, the paid
care sector is strategic for two reasons. First, it
provides important services, including childcare
and elder care, that can substitute some of the
unpaid care work performed inside households.
Second, the care sector is by far the largest
employer of working women.215 The expansion of
the care sector, and assurance of decent working
conditions, therefore has the potential not only
to reduce unpaid care work but also to offer
alternatives for women to join the labour force.216
The analysis begins with an overview of care
policies in Egypt, including early childhood care
and education, care for the elderly and the legal
framework for paid leaves, while identifying
coverage gaps in each of these areas. It then
analyses unpaid care work while the fourth section
examines the size, characteristics and growth of
the paid care sector. The chapter concludes with
policy recommendations for redistributing some of
women’s unpaid care responsibilities and growing
the paid care economy in Egypt.
2.2 Care policies and services in Egypt
Early childhood care and education
Egypt distinguishes between nurseries and
kindergartens as providers of early childhood care
and education (ECCE). Article 31 of the Egyptian
Child Law of 1996 defines a nursery as a designated
place to provide childcare services for children
under the age of 4. The same article indicates
that the Ministry of Social Solidarity (MoSS) is the
supervisory body that technically and financially

84
CARE ECONOMY AND PROMOTING GENDER EQUALITY
monitors nurseries. Children aged 4 to 6 years old
are entitled to join preschool education institutions,
referred to as kindergartens (KGs),217 which fall
under the responsibility of the Ministry of Education
and Technical Education (MoETE).
There is no consolidated data on the number of
childcare institutions and the number of enrolled
children. As such, this section builds on many
data sources, including establishment censuses,
household surveys and data reported by MoSS
and MoETE. The number of childcare institutions
in Egypt is limited and has grown considerably
slower than the number of children. The number
of children aged 0–3 grew rapidly between 2006
and 2017, at an annual rate of 3.6 per cent, to reach
over 11 million children by 2017 (Table 2.1).218 This
was much faster than the 0.8 per cent annual
growth in the preceding decade (1996–2006). By
comparison, the number of childcare facilities in
the private sector exhibited the opposite pattern of
growth, with a much faster increase during 1996–
2006 than 2006–2017.219 The number of childcare
facilities expanded from around 790 to 18,088
establishments from 1996–2006, growing at an
annual rate of 31.3 per cent. Yet, from 2006–2017,
the number of nurseries only increased by 1.2 per
cent per year, to reach 20,679 establishments.
There were around 0.01 nurseries for every 100
children aged 0–3 in 1996, which improved to 0.25
nurseries/100 children in 2006, then deteriorated to
0.19 in 2017, due to the more accelerated growth of
children aged 0 through 3 compared to the number
of nurseries. This limited number of childcare
facilities relative to the number of potential children
needing care yields a very low ECCE enrolment rate
among children aged 0–3. According to MoSS,220
registered nurseries serve around 847,423 children
aged 0–3221 – which results in an enrolment rate
of around 8 per cent.222 Less than 2 per cent of
registered nurseries were provided by employers
while the majority were private sector nurseries (56
per cent) or nurseries operated by NGOs (42 per
cent).223
It is not clear why private childcare facilities
exhibited this inverted U–shaped growth. This
pattern could be associated with rising female
labour force participation in the first period – from
21 per cent in 1998 to 27 per cent in 2006 – followed
by a decline in the second period – to reach 23
Table 2.1: evoluTion in The number of children aged 0–3 versus The supply of day–care esTablishmenTs, egypT, 1996, 2006, 2017
YearChildren aged 0–3
(in thousands)
Annual growth rate in the number of children aged 0–3
(%)
Non–residential social care
establishments in the private sector
(units)
Annual growth rate in number
of establishments(%)
Nursery establishment per
100 children
1996 6,545.7 0.8 790 31.3 0.012
2006 7,110.6 3.6 18,088 1.2 0.254
2017 10,608.434 20,679 0.195
Source: Column 1 is retrieved from United Nations World Population Prospects.291 Column 2 is retrieved from Establishment
Census data 1996, 2006 and 2017. Columns 2, 4, and 5 are authors’ calculations. Column 5 is the result of dividing column 3 on
column 1.
Note: Non–residential social care establishments in the private sector give an approximate number of childcare facilities in
Egypt. Census data show that there was only one establishment in this industry group in 2006 and 2017 that belonged to the
public sector.292

CHAPTER 2 – THE EVOLUTION OF PAID AND UNPAID CARE WORK IN EGYPT
85
CHAPTER 2 – THE EVOLUTION OF PAID AND UNPAID CARE WORK IN EGYPT
per cent in 2012 and 20 per cent in 2018.224 The
direction of causality is two–way. The expansion of
childcare can be a driver for, or a result of, women’s
increased labour supply.225 This represents an
important area of future research. Another reason
is that childcare facilities are not easily profitable,226
with many nurseries risking closure in their first five
years. This could be the case for Egypt, yet there is
no evidence to support this idea.
In addition to registered nurseries, a number of
informal, home–based nurseries exist. There is
a multi–layered structure with different types of
nurseries, even among those that are registered.
Yet little is known about the different modalities of
nurseries, cost and variation in access. A market
study of ECCE, including informal nurseries, is
strongly needed to bridge the gap in knowledge
and to better inform policymaking in this area.
Enrolment rates for KG–aged children (age 4–6)
are much higher than for children aged 0–3.
Nationally, there are 11,250 schools with KG classes
serving 1,244,052 children in this age range.227 This
results in an enrolment rate of around 26 per cent,
for a total of 4,797,821 children aged 4–6 years
in 2017. Pre–primary education is integrated in
the education system and KG classes are within
schools. In 2017, Table 2.2 shows that the majority of
schools with KG classes were public (79.6 per cent),
whereas the rest belong to the private sector (20
per cent).228 Consequently, the majority of children
enrolled in pre–primary education (75 per cent
in 2017) went to public kindergartens (Table 2.2).
Public school fees for children in KG were about
EGP 145 yearly (USD 9) in 2019.229 In comparison,
little is known about the fee structure of private
schools, which varies by type of school and region,
but is generally way higher than public school fees.
Figure 2.1 demonstrates that the enrolment rate
in pre–primary education increased substantially,
from 11 per cent in 2000 to peak at 26 per cent in
2017–2018. This increase reflects the expansion of
pre–primary education in Egypt, with boys slightly
more likely to attend KGs than girls. Despite this
increasing trend in enrolment, there is a severe
shortage of KGs, especially in poor and rural areas
of Upper and Lower Egypt.230 KG–aged children
in these areas are often enrolled in nurseries for
younger ages, because they cannot find schools
with KG classes in their proximity. Both the supply of
KGs and the fee structure are important obstacles
for children in poor or rural areas to attend. Even
where there is public provision, children from
poorer families are considerably less likely to attend
KGs (4 per cent) than children from wealthier
families (10 per cent), due to the question of fee
affordability.231
Type of pre–primary provision
Number of students enrolled
in pre–primary education
Share of all students (%) Number of schools
Share of schools (%)
Public school 932,879 75.0 8,955 79.6
Private school 311,173 25.0 2,295 20.4
Gender
Boys 645,172 51.9
Girls 598,880 48.1
Total 1,244,052 100.0 11,250 100.0
Source: Constructed by the authors based on data from The World Bank, 2018.
Table 2.2: pre–primary enrolmenT daTa by Type of kg provision and gender

86
CARE ECONOMY AND PROMOTING GENDER EQUALITY
This leads to a strong variation in access by region
and wealth. In short, nursery enrolment for children
age 0–3 is around 8 per cent, while pre–primary
education enrolment for children aged 4–6 is
nearly 26 per cent, although increasing. Given
that Egypt has a 92 per cent net enrolment rate
in primary education for children aged 6+,232 this
shows an important coverage gap due to a lack of
supply in nurseries and kindergartens.
The affordability of ECCE is another crucial
determinant, especially in a context of striking
inequality in access to early childhood education
in Egypt.233 Most advantaged children coming
from wealthier families in urban governorates with
educated parents are six times more likely to attend
ECCE than the least advantaged ones, coming
from poorer families in rural Upper Egypt with
uneducated parents.234
In addition to availability and affordability, the
quality of ECCE represents another key challenge.
Although information about the quality of ECCE in
Egypt does not exist, it is expected that pre–primary
education, especially in public schools, would
suffer from the same quality issues as the overall
figure 2.1: neT enrolmenT raTio in pre–primary educaTion, ages 3–5, egypT, 1999–2018
9.1 9
.9
11.4
11.5 12
.4
15.2 16
.4
16.3
20
.9 22.1 22.7
27.
1
26.7
25.7
25.6
8.7 9
.5
10.9
10.9 11.8
14.5 15
.7
15.5
20
.1 21.4 21.9
26.6
26.3
25.4
25.6
8.9 9
.7
11.1
11.2 12
.1
14.9 16
.1
15.9
20
.5 21.7 22.3
26.9
26.5
25.5
25.6
0
5
10
15
20
25
30
1999 2000 2001 2002 2003 2005 2006 2007 2009 2011 2012 2014 2016 2017 2018
Net
enro
lment
ratio, pre
-prim
ary
educa
tion
Males Females Total
Source: Constructed by the authors, adapted from UNESCO Institute for Statistics (UIS).293
Accessed 28 February 2020. http://data.uis.unesco.org/#
education system. The quality of primary education
in Egypt is ranked 133rd out of 137 countries –
according to the Global Competitiveness Index
2017–2018.235
Facing this shortage in nurseries, MoSS adopted a
national early childhood development programme
to extend the scale of educational services to
children aged 0–4 years.236 This programme is in
line with Sustainable Development Goal target
4.2, which aims to provide quality early childhood
development, care or pre–primary education to all
girls and boys under age 5. The MoSS programme
aims to improve the quality of nurseries – in terms
of curricula, accreditation, staff, educators and
infrastructure. It is also reviewing regulation and
licensing procedures to encourage the registration
of nurseries, while promoting and encouraging the
establishment of private sector nurseries, especially
through Nasser Social Bank funding initiatives.237
The Government of Egypt also introduced a recent
education reform programme in 2018 that aims
to expand access to kindergartens and enhance
the quality of kindergarten education, among
other goals. The programme includes training

CHAPTER 2 – THE EVOLUTION OF PAID AND UNPAID CARE WORK IN EGYPT
87
CHAPTER 2 – THE EVOLUTION OF PAID AND UNPAID CARE WORK IN EGYPT
for kindergarten educators, along with updating
curricula and developing strong quality assurance.238
The 2019/2020 budget specifies, for the first time,
the amount of public spending targeted to pre–
primary education (KGs) – EGP 4.2 billion (USD
265 million), representing 0.26 per cent of GDP.
This has never been explicitly stated in the state
budget. This amount was allocated to increase the
number of kindergarten classrooms, especially in
disadvantaged areas in Upper Egypt and to fund
programmes to develop the cognitive abilities of
children. The 2020/2021 budget highlights that
EGP 1.5 billion (USD 95 million) will be allocated to
improve the conditions of teachers and inspectors
in kindergarten and first and second grades.239
Such reforms are greatly needed to encourage
the expansion of childcare facilities. Quality and
affordability remain two key challenges. There is
strong evidence that early childhood education
is essential for developing cognitive, physical,
social, emotional skills and school readiness.240 The
expansion of quality ECCE serves the dual goals of
supporting children’s development and women’s
ability to join and remain in the labour force. Yet
employed women face difficulties arranging for
childcare,241 because high–quality facilities are
either not available or not affordable. Employed
women were less likely to rely on nurseries for
childcare between 2006 and 2018,242 which is
consistent with the finding that the supply of
childcare facilities did not keep up with the
increased population of small children.
Reforms to develop early childhood education
must ensure that all children are offered equal
opportunities to learn and thrive. Therefore,
expanding quality and affordable ECCE is
necessary for Egypt to fuel its children’s potential,
but also to advance towards social justice goals
and equality of opportunities.
Elder care
Information about elder care in Egypt is scarce
and at times contradictory. As in other countries
in the region, elder care supply has received
relatively little attention, and thus remains quite
underdeveloped. This is a critical gap in the
evidence base, as the elderly population in Egypt is
growing. The population over 65 years of age grew
at 2.0 and 2.6 per cent per year between 1996–
2006 and 2006–2017, respectively – rising from
3,750,475 in 2006 to 5,003,431 individuals by 2017.
The share of the elderly population is also projected
to continue growing.243
Elder-care services fall under the responsibility
of MoSS. As of June 2020, there were around
169 active and formal elder–care organizations
in Egypt,244 which served around 2 per cent
of the elderly population.245 Given the size of
this population, this reflects a very low rate of
development and use of elder-care services.
The main channels of income support for
the elderly in Egypt are employment–related
contributory pension schemes. Around 63 per cent
of individuals aged 65 and above receive this type
of pension, and slightly more are elderly men (66
per cent) than women (60 per cent).246 However, the
percentage of workers covered by social insurance
has declined since 2006, reaching only 32 per cent
of all workers;247 hence, the proportion of elderly
receiving employment–related pensions is expected
to drop substantially in the coming years.
In addition, several non–contributory schemes aim
to cover the poor elderly, such as the unconditional
cash–transfer programme “Karama” (dignity) and
the comprehensive scheme (Ma’ash al–daman)
formerly known as Sadat/Mubarak pensions.248
Nevertheless, these programmes cover just 8.5 per
cent of individuals aged 65+.249 Importantly, these
pensions can also serve as a means of financial
support for elderly persons’ primary caregivers,

88
CARE ECONOMY AND PROMOTING GENDER EQUALITY
who in the absence of formal care services are
mostly daughters or wives, who live with them in
the household and who do not have other income.
Labour market regulations and care–related provisions
Historically, public employment policies and their
associated benefits have strongly influenced
women’s employment preferences in Egypt.250 251
Women prefer to work in public sector jobs as
they provide safer workplaces and require shorter
working hours that suit care responsibilities, which
make them compatible with the social obligations
on women to be dedicated to do housework and
to raise children.252 The public sector also provides
job security, and various care–related benefits,
including maternity leave and paid vacations, as
explained in this section. Whereas private sector
workers are legally entitled to some of the same
benefits, they are much less likely to have access
to any of these benefits in reality, due to the high
level of informal employment (i.e. employment
with neither legal contract nor social security
coverage). In 2018, two–thirds of women employed
in the private sector had informal jobs.253 This is
why private sector employment is considered
inhospitable to women, relative to the public sector.
Thus, reduced public sector hiring since the 1990s
and the lack of decent jobs in the private sector
has reinforced weak labour force participation
among women.254 This, in turn, has contributed to
rising fertility rates,255 which fuel care needs. Thus,
labour market policies and regulations play an
important role in women’s engagement in paid
work. They also shape the extent to which unpaid
care responsibilities can be redistributed through
benefits available to working parents. The quality
of jobs, including care jobs, is another component
that labour market policies and regulations can
determine. Job quality is one of the most important
determinants for women’s employment.
Care–related provisions
The Labour Law of 2003 and the Child Law of 1996
combine several provisions for working mothers,
including paid maternity leave, unpaid childcare
leave, the right to paid daily nursing breaks or
shortened hours of work, arrangement of childcare
facilities, and a guaranteed right to return to
work.256 Exceptions from these entitlements include
domestic workers, dependent family members
of the employer and agricultural workers.257 The
Labour Law applies to private sector employees,
while government workers have different provisions
under the public sector labour law.
Maternity and unpaid care leave
Both public and private sector workers are entitled
to paid maternity leave through Child Law no.12 of
1996 (amended by Law no. 126 of 2008), but public
sector employees benefit from more generous
provisions. Women who have spent more than 10
months in a particular job (i.e. who contributed to
the social insurance scheme during that time) are
entitled to paid maternity leave, which can be taken
twice throughout the worker’s period of service.
During paid maternity leave, wages are fully paid
by the employer. The maternity leave duration is 12
weeks.258 It is worth mentioning that there are no
provisions for paternity leave.
In addition, employed women in private sector
establishments with more than 50 workers and all
public sector employees are entitled to an unpaid
leave to care for young children, for a period of up
to two years.259 260 While public sector workers have
the right to claim this leave up to three times during
their period of service, private sector workers have
the right to claim it up to two times.261 Employed
women in firms with less than 50 workers are
excluded from this right.

CHAPTER 2 – THE EVOLUTION OF PAID AND UNPAID CARE WORK IN EGYPT
89
CHAPTER 2 – THE EVOLUTION OF PAID AND UNPAID CARE WORK IN EGYPT
There are also specific provisions for pregnant
women. Starting from their sixth month, they can
have their daily working hours reduced by (at least)
one hour.262 The law does not provide for part–time
work after childbirth. However, it gives women the
right to take two paid daily breaks of 30 minutes
each, which can be combined into one one–hour
break, for the purpose of breastfeeding for the 24
months following childbirth.263
These maternity benefits only apply to formal
employees, so a limited share of employed women
in the private sector take advantage of them. Only
40 per cent of women who worked in the private
sector at the time of their first pregnancy took paid
maternity leave,264 versus 92 per cent of women
who worked in the public sector. With regards to
paid vacations, the situation is even worse: only 28
per cent of women working in the private sector
have access to paid leave, as opposed to a majority
of public sector workers (92 per cent).265
Childcare provisions
According to the law, employers who hire 100
female workers or more in the same establishment
are required to either found a nursery or
commission another nursery for the children of
their female employees.266 These nurseries are to
be supervised by the concerned ministry.267 Again,
as with other benefits, clauses related to nursery
facilities do not apply to agricultural workers.
As mentioned, employer–initiated nurseries
represent just 2 per cent of overall registered
nurseries. Several factors could explain this. It is
possible that employers do not comply with this
labour law provision even when they hire more
than 99 female workers, reflecting weak labour
law enforcement in Egypt. It is also possible that
employers avoid employing more than 99 women
to begin with, in order to avoid establishing
nurseries. Both propositions relate to the cost (and
responsibility) of establishing and monitoring these
nurseries. Some employers might also believe that
the productivity of their female employees would be
affected if they have their kids in the same location.
This is an area that requires further research into
employer compliance with the nursery requirement.
Egyptian labour law also lacks sufficient measures
to prevent discrimination against pregnant women
employees. The law requires employers to do
a medical examination on their future workers;
however, it does not prohibit pregnancy testing.
Thus, private sector employers could use this clause
to discriminate against hiring pregnant women
if they discover that they are pregnant as part of
this medical check. Employers may avoid hiring
pregnant women because they incur higher costs
(maternity leave). Moreover, while the law prohibits
the employer from firing a female worker during
her maternity leave, the law does not prevent
employers from terminating a pregnant woman’s
employment before giving birth. Together with
women’s low propensity to benefit from maternity
leave in the private sector, these factors help to
explain why women are much more likely to end
their employment in the private than in the public
sector before giving birth.268 Exiting the labour force
may be a voluntary decision from women who
expect not to be able to take maternity leave, or a
decision forced by their employer to avoid paying
the full salary during the paid maternity leave.
As seen above, care provisions, whether in the
labour law or the child law, are only specific
to mothers. Paternity leave is not stipulated by
law, but there is a practice of granting fathers
three paid parental leave days after childbirth.
This practice is limited to formal employment
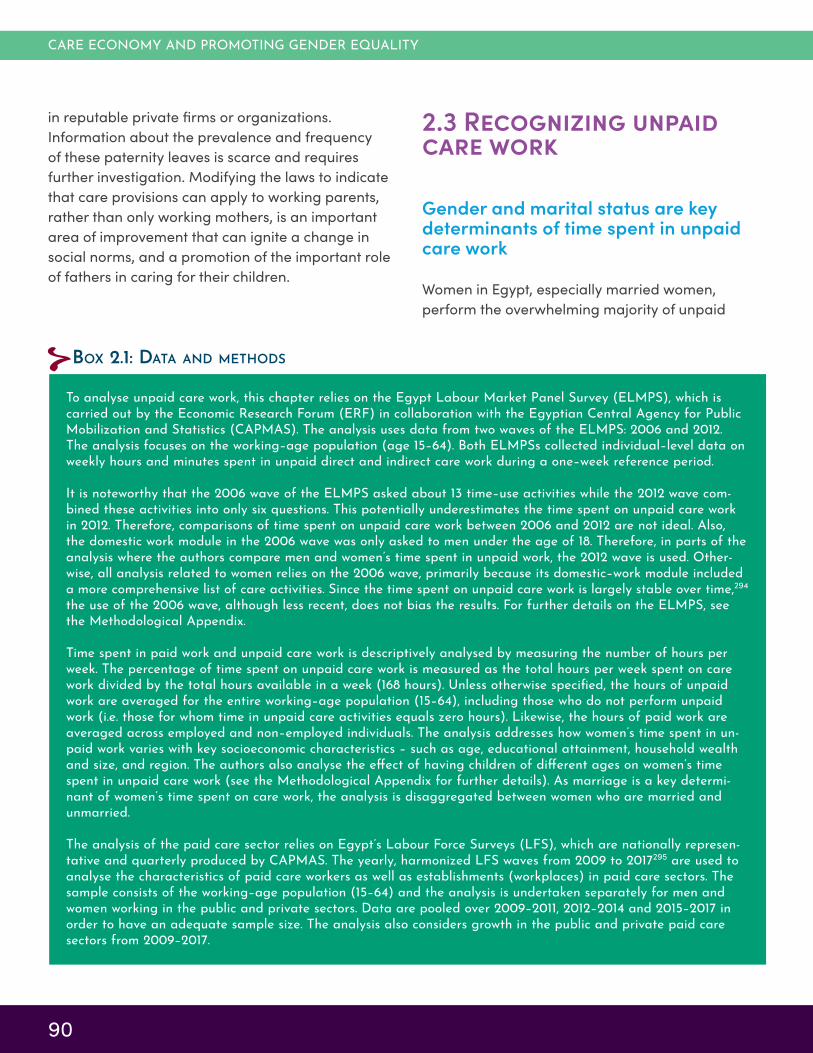
90
CARE ECONOMY AND PROMOTING GENDER EQUALITY
in reputable private firms or organizations.
Information about the prevalence and frequency
of these paternity leaves is scarce and requires
further investigation. Modifying the laws to indicate
that care provisions can apply to working parents,
rather than only working mothers, is an important
area of improvement that can ignite a change in
social norms, and a promotion of the important role
of fathers in caring for their children.
box 2.1: daTa and meThods
To analyse unpaid care work, this chapter relies on the Egypt Labour Market Panel Survey (ELMPS), which is carried out by the Economic Research Forum (ERF) in collaboration with the Egyptian Central Agency for Public Mobilization and Statistics (CAPMAS). The analysis uses data from two waves of the ELMPS: 2006 and 2012. The analysis focuses on the working–age population (age 15–64). Both ELMPSs collected individual–level data on weekly hours and minutes spent in unpaid direct and indirect care work during a one–week reference period.
It is noteworthy that the 2006 wave of the ELMPS asked about 13 time–use activities while the 2012 wave com-bined these activities into only six questions. This potentially underestimates the time spent on unpaid care work in 2012. Therefore, comparisons of time spent on unpaid care work between 2006 and 2012 are not ideal. Also, the domestic work module in the 2006 wave was only asked to men under the age of 18. Therefore, in parts of the analysis where the authors compare men and women’s time spent in unpaid work, the 2012 wave is used. Other-wise, all analysis related to women relies on the 2006 wave, primarily because its domestic–work module included a more comprehensive list of care activities. Since the time spent on unpaid care work is largely stable over time,294 the use of the 2006 wave, although less recent, does not bias the results. For further details on the ELMPS, see the Methodological Appendix. Time spent in paid work and unpaid care work is descriptively analysed by measuring the number of hours per week. The percentage of time spent on unpaid care work is measured as the total hours per week spent on care work divided by the total hours available in a week (168 hours). Unless otherwise specified, the hours of unpaid work are averaged for the entire working–age population (15–64), including those who do not perform unpaid work (i.e. those for whom time in unpaid care activities equals zero hours). Likewise, the hours of paid work are averaged across employed and non–employed individuals. The analysis addresses how women’s time spent in un-paid work varies with key socioeconomic characteristics – such as age, educational attainment, household wealth and size, and region. The authors also analyse the effect of having children of different ages on women’s time spent in unpaid care work (see the Methodological Appendix for further details). As marriage is a key determi-nant of women’s time spent on care work, the analysis is disaggregated between women who are married and unmarried.
The analysis of the paid care sector relies on Egypt’s Labour Force Surveys (LFS), which are nationally represen-tative and quarterly produced by CAPMAS. The yearly, harmonized LFS waves from 2009 to 2017295 are used to analyse the characteristics of paid care workers as well as establishments (workplaces) in paid care sectors. The sample consists of the working–age population (15–64) and the analysis is undertaken separately for men and women working in the public and private sectors. Data are pooled over 2009–2011, 2012–2014 and 2015–2017 in order to have an adequate sample size. The analysis also considers growth in the public and private paid care sectors from 2009–2017.
2.3 Recognizing unpaid care work
Gender and marital status are key determinants of time spent in unpaid care work
Women in Egypt, especially married women,
perform the overwhelming majority of unpaid

CHAPTER 2 – THE EVOLUTION OF PAID AND UNPAID CARE WORK IN EGYPT
91
CHAPTER 2 – THE EVOLUTION OF PAID AND UNPAID CARE WORK IN EGYPT
care work. On average, women spent 33 hours per
week doing unpaid care work in 2006 (Figure 2.2).
Comparison between women’s and men’s time–use
shows that whereas women, on average, spent 24
hours per week on unpaid care work in 2012, men
spent only two hours per week.269 Most of the time
spent on such work is on indirect care activities
(e.g. cooking, cleaning). In 2006, women spent
around 26 hours per week in indirect care work,
as opposed to seven hours per week in direct care
work (e.g. caring for children and elderly).
By contrast, men spent considerably more hours
on paid work than women. Men spent an average
of 44 hours per week on paid work in 2006, which
declined to 38 hours per week in 2012. Women, on
the other hand, spent nine hours per week in paid
work in 2006, which similarly declined to seven
hours in 2012.270 These hours of paid work are
averaged across non–employed and employed
individuals, which explains why women’s time in
paid work tends to be low, since the majority of
women are not employed. The sharp differences in
figure 2.2 average weekly hours of paid work and unpaid care work (direcT and indirecT) by sex and mariTal sTaTus, ages 15–64, elmps 2006 and 2012
9 10 9
32
54
44
7 7 7
25
45
3817
32
26
0
0
0
12
2219
2
3
2
1
10
7
0
0
0
1
7
50
1
0
27
52
42
32
54
44
20
36
31
27
48
40
0
10
20
30
40
50
60
Unmarried Married Total Unmarried Married Total Unmarried Married Total Unmarried Married Total
Women Men Women Men
2006 2012
Weekl
y H
ours
of
work
(re
f. p
eriod 7
days
)
Paid work Indirect care work Direct care work
Source: Authors’ calculation, based on ELMPS 2006 and 2012.
Note: There is no available data on the time that men spent in unpaid care work in 2006.
women’s and men’s time spent on unpaid care work
and paid work reflect the continued adherence
in Egypt to traditional ‘male breadwinner–female
caregiver’ gender roles.
Time spent on unpaid care work also varies
substantially with marital status. Married women
spent much more time on unpaid care work than
unmarried women (Figure 2.3). In 2006, married
women spent 42 hours per week doing unpaid care
work, while unmarried women spent just 18 hours
a week. In 2012, married men spent twice as much
time on unpaid care work (4 hours per week) as
unmarried men (2 hours per week), although at
much lower levels than women who spent 29 hours
per week on unpaid care work when married, and
13 hours per week when unmarried. Thus, in 2012,
in terms of the gender gap in unpaid care work,
married women spent seven times as much time
on unpaid work as married men. This difference
slightly drops to 6.5 times for unmarried women
and men.

92
CARE ECONOMY AND PROMOTING GENDER EQUALITY
For paid work, there was little variation in the hours
of work between married and unmarried women,
with unmarried women doing slightly fewer hours
of paid work in 2006 (9 hours for unmarried women
and 10 hours for married women). For men, marital
status strongly affects the number of hours of paid
work, with married men spending much longer
hours on paid work than unmarried men. In 2006,
whereas married men spent 54 hours on paid
work per week, unmarried men spent 32. In 2012,
paid work hours decreased for both married and
unmarried men, while maintaining the same gap.
Married men did approximately 20 more hours of
paid work per week than unmarried men.
Another striking feature of the gendered division
of unpaid care work is that women’s time spent
on such work does not vary much whether or
not they are employed (Figure 2.3). In 2006,
employed women spent 34 hours per week while
non–employed women spent 33 hours per week
on unpaid care work. Unpaid care work thus acts
as a rigid constraint on women’s time use. When
women engage in paid employment, their hours
of total work peak, reaching 75 hours per week in
2006, while employed men worked only 60. This
demonstrates the “double shift” that employed
women face.271 As a result, employed married
women spend somewhat fewer hours on paid work
per week than employed, unmarried women. Even
for women who remain in the labour market after
marriage, unpaid care work responsibilities thus
serve as a limitation on paid economic activity.
Expressing the results in terms of the percentage of
total time spent on all types of work demonstrates
the extent to which unpaid care responsibilities also
impinge upon women’s time for other activities,
including leisure and self–care, relative to men
(Figure 2.4).
figure 2.3: weekly hours of paid work and unpaid care work (direcT and indirecT) by sex, employmenT and mariTal sTaTus, ages 15–64, elmps 2006 and 2012
0 0 0
48
39 42
0 0 0
6358 60
0 0 0
4137 38
0 0 0
49 49 49
17
3226
1931 28
0 0 0
0
0 0
11
2219
14 22 20
2 3 2
2 3 3
1
11
7
2
86
0 0 0
0
0 0
1
7
5
2
65
0 0 0
0 1 0
18
43
33
69
7875
0 0 0
63
58 60
12
30
24
57
6563
2 3 2
51 53 52
0
10
20
30
40
50
60
70
80
Unm
arr
ied
Marr
ied
Tota
l
Unm
arr
ied
Marr
ied
Tota
l
Unm
arr
ied
Marr
ied
Tota
l
Unm
arr
ied
Marr
ied
Tota
l
Unm
arr
ied
Marr
ied
Tota
l
Unm
arr
ied
Marr
ied
Tota
l
Unm
arr
ied
Marr
ied
Tota
l
Unm
arr
ied
Marr
ied
Tota
l
Non-employed Employed Non-employed Employed Non-employed Employed Non-employed Employed
Women Men Women Men
2006 2012
Weekl
y hours
of
work
(re
f. p
eriod 7
days
)
Paid work Indirect care work Direct care work
Source: Authors’ calculation based on ELMPS 2006 and 2012.

CHAPTER 2 – THE EVOLUTION OF PAID AND UNPAID CARE WORK IN EGYPT
93
CHAPTER 2 – THE EVOLUTION OF PAID AND UNPAID CARE WORK IN EGYPT
Married women spent the highest percentage of
weekly time on unpaid care work (17 per cent in
2012). The share of time men spent on unpaid work,
irrespective of their marital status, was negligible.
In contrast, the percentage of total time per week
devoted to paid work was higher among men
than among women, mainly because few women
engage in paid work. However, employed married
women spent 23 per cent of their weekly time on
paid work, in addition to their unpaid care work
responsibilities (39 hours) which accounted for
almost the same amount of their weekly paid time
(23 per cent). Hours spent on work thus represent
46 per cent of employed, married women’s total
time in a week (not limited to waking hours). This is
an important indicator of “time poverty”272 among
employed, married women, which limits their ability
to engage in other activities, and may be a reason
for leaving the labour market.
Women’s time in unpaid care work and socioeconomic characteristics
While marital status is the key determinant
of women’s time in unpaid care work, other
characteristics of women and their households also
impact their care responsibilities.273 Unpaid care
work is strongly predicted by women’s age. Married
women aged 25–39 spent the longest hours per
week on unpaid care work, at around 49 hours (35
hours on indirect care work and 14 hours on direct
care work). Young married women aged 15–24
spent the same number of hours in direct care work
(14 hours per week). These age groups cover the
peak childbearing years, making them more likely
to have small children in the household and thus
spend the greatest amount of time on direct care.
By contrast, unmarried women in the 25–39 age
group spent considerably more time in paid work
and less time on unpaid care work, again indicating
the extent to which unpaid care responsibilities are
a barrier to women’s employment.
Married women aged 40–54 spent more time
in paid work compared to their married peers in
younger or older age groups (14 hours in 2006). This
is likely due to the higher propensity of this cohort of
women to have public sector employment. Another
reason is that children of married women aged 40–
54 are probably older, which considerably reduces
their hours of unpaid work to 35 hours (Figure 2.5).
figure 2.4: percenTage of weekly Time spenT on differenT Types of work by sex, ages 15–64, elmps 2006 and 2012
Source: Authors’ calculation based on ELMPS 2006 and 2012.
Note: Percentage of time is reported out of total hours available in the week (168 hours).
11
25
19
0 0 0
8
17
14
1 2 2
10
19
16
0 0 0
7
1311
1 2 21
64
0 0 1
43
0 0 0
5 6 6
18
31
25
4 4 4
15
27
22
27
2324
3534 34
25
22 23
29 29 29
0
5
10
15
20
25
30
35
40
Unmarried Married Total Unmarried Married Total Unmarried Married Total Unmarried Married Total
Women Men Women Men
2006 2012
Per
cent
of
tota
l w
eekl
y tim
e Unpaid carework
Indirect carework
Direct carework
Paid work
Paid work forthe employedonly

94
CARE ECONOMY AND PROMOTING GENDER EQUALITY
This also eases the time crunch for this age group
and enables them to join the labour market.
Time allocation between paid and unpaid work also
varies by education level (Figure 2.6). Women with
tertiary education spent longer hours per week on
paid work, irrespective of their marital status. This
reflects the higher propensity to engage in paid
work among women with a university education or
above.274 Moreover, consistent with the literature,
the amount of time that married women spent in
direct care work (caregiving for children or elderly)
is positively correlated with their education level.275
Married women with secondary and tertiary
education spent more time on direct caregiving (14
and 12 hours per week, respectively) than married
women with less than secondary (10 hours) or their
peers with no education (8 hours). These results
could reflect that when the level of education rises,
mothers become more aware of the importance of
spending time with their children and consequently
spend more time on caregiving. It is also possible
that more educated women report more precisely
the number of hours spent on such activities.276 An
additional reason could be that mothers with
higher education spend more time with children on
schoolwork.
Given the strong association between household
wealth and education, participation in unpaid
care work and paid work also varied by wealth.
Married women from wealthier households, who
are likely to have more education, spent more time
on paid work (9 hours per week and 14 hours per
week, respectively) than those in the middle wealth
quintiles. Married women from the lowest wealth
quintile (poorest households) also spent longer
hours on paid work (11 hours), likely due to the need
to engage in paid employment. Married women
from higher wealth quintiles reported spending
more time on unpaid care work than women in
the first and second quintiles (Figure 2.7). This
figure 2.5 weekly hours of paid work and unpaid care work (direcT and indirecT) by mariTal sTaTus and age group, ages 15–64, elmps 2006
Source: Authors’ calculation based on ELMPS 2006.
6
2015
6 410
147
15
22
25
16
31
3530
241
33
1
14
14
5
3
21
4642
23
49
58
49
34
0
10
20
30
40
50
60
70
80
15-24 25-39 40-54 55-64 15-24 25-39 40-54 55-64
Unmarried Married
Weekl
y hours
of
work
(re
f. p
eriod 7
days
)
Paid work Indirect care work Direct care work Total work

CHAPTER 2 – THE EVOLUTION OF PAID AND UNPAID CARE WORK IN EGYPT
95
CHAPTER 2 – THE EVOLUTION OF PAID AND UNPAID CARE WORK IN EGYPT
can be attributed to the difference in household
composition across wealth quintiles. Poorer
households might be bigger, with more female
members who can help with some of the domestic
activities. These differences could also reflect better
reporting of hours of unpaid care work among
women in wealthier families.
One might expect wealthier households to have
greater ability to substitute women’s unpaid
care labour with paid care substitutes, including
domestic work. However, hiring a domestic worker
was not common among ELMPS respondents, this
being the case in only 2 per cent of households in
2012. Having a domestic worker was associated
with fewer hours of indirect care work among
women in the household (Figure 2.8). Married
women who hired a domestic helper spent, on
average, 19 hours per week on indirect care work
and 5 hours on direct care work, compared to
22 hours and 7 hours per week among married
women with no domestic help, respectively. It is
worth noting that in the context of Egypt, many
domestic workers are probably not full–time.
The effect of children and the elderly on women’s time in unpaid care
This section examines the effect of household
structure and the presence of potential care
recipients on women’s unpaid work. All analyses
were conducted by marital status, since unmarried
women may spend time caring for younger siblings
as well as elderly household members. However,
none of the results for the impact of having children
in the household on unmarried women’s time in
unpaid care work were statistically significant,
so for these analyses only the results for married
women are presented.
Having a child under the age of 3 in the household
had the biggest impact on women’s time spent in
unpaid care work (Figure 2.9). For married women,
it increased that time by 9 hours per week. This
additional care time varied by education levels
and was particularly great among women with
secondary or university education.
Source: Authors’ calculation based on ELMPS 2006.
figure 2.6: weekly hours of paid work and unpaid care work (direcT and indirecT) by mariTal sTaTus and educaTion, ages 15–64, elmps 2006
104
9
21
95
10
18
20
14
17
20
29 34
34
34
2
1
2
1 810
14
12
31
19
28
4245
48
58
65
0
10
20
30
40
50
60
70
No schooling Less than secondary Secondary Tertiary No schooling Less than secondary Secondary Tertiary
Unmarried Married
Weekl
y hours
of
work
(re
f. p
eriod 7
days
)
Paid work Indirect care work Direct care work

96
CARE ECONOMY AND PROMOTING GENDER EQUALITY
Source: Authors’ calculation based on ELMPS 2006
figure 2.7: weekly hours of paid work and unpaid care work (direcT and indirecT) by mariTal sTaTus and wealTh quinTiles, among women, ages 15–64, elmps 2006
Source: Authors’ calculation based on ELMPS 2012.
Note: The 2012 ELMPS is used because the 2006 wave did not include data on hiring domestic workers.
figure 2.8: weekly hours of paid work and unpaid care work (direcT and indirecT) by mariTal sTaTus and hiring a domesTic worker, ages 15–64, elmps 2012
9 9 8 9 911
8 79
14
18 1718 18
15
29
30 32
33
342 1 2 1
1
910
12
11
9
2928 28 28
24
4948
50
54
57
0
10
20
30
40
50
60
Lowest Second Third Fourth Fifth Lowest Second Third Fourth Fifth
Unmarried Married
2006
Weekl
y hours
(re
f. p
eriod 7
days
)
Paid work Indirect care work Direct care work
7
14
711
12
8 22191
3
7 5
19
26
3635
0
5
10
15
20
25
30
35
40
45
No Yes No Yes
Unmarried Married
2012
Weekly
Hours
(re
f. p
eriod 7
days)
Hiring domestic help
Paid work Indirect care work Direct care work
A married woman with no education and one child
aged 0–3 spent 5.9 hours per week more on care
work than a married woman with no education and
no children of that age. By comparison, married
women with secondary or university education who
have one child aged 0–3 spent 13 hours per week
more on care work than a married woman with the
same education but no children of that age. So,
holding all factors constant, women with secondary
or higher education spend more time caring for
small children than those with below secondary or
no education.

CHAPTER 2 – THE EVOLUTION OF PAID AND UNPAID CARE WORK IN EGYPT
97
CHAPTER 2 – THE EVOLUTION OF PAID AND UNPAID CARE WORK IN EGYPT
Having one child aged 3–5 in the household also
significantly increased married women’s hours of
care work (Figure 2.10). But the additional time
was less than that resulting from the presence of a
child under 3, especially for women with secondary
or university education. Having a child age 3–5
increased time spent on unpaid work by 8.5 hours
per week for women with secondary education and
by 6.5 hours per week for women with university
education – much less than the 13 additional hours
for those with one child aged 0–3. The fact that
university–educated women spent less additional
time than women with secondary education could
reflect their greater propensity to enrol their
children in nurseries (for those under 4 years), and
preschool education (4–5 years). ECCE enrolment
may also explain the somewhat lower impact of
children aged 3–5 on women’s unpaid care time, as
well as the different care needs of this age group.
The effect of having one child of school age (6–17)
on women’s time spent in unpaid care work was
significant only for women with university education
(Figure 2.11). They spent 7.1 hours per week more on
unpaid care work than their peers with no children
in this age group, holding all factors constant.
This supports the idea that women with university
education are more likely than women with lower
educational attainment to spend more time
assisting their children in schoolwork. The impact
of having children in this age group on women’s
unpaid care time may otherwise be small, in part
because older children also help out with domestic
care tasks.
For both married and unmarried women, time
spent on unpaid care work increased significantly
if one elderly member (aged 65+) lived in the
household (Figure 2.12). Their presence increased
the time spent on unpaid care work by 4.5 hours
per week among married and 3.6 hours per
week among unmarried women. As the elderly
population in Egypt is projected to increase
substantially over the coming decades, the impact
of elder care on women’s unpaid care work will
become increasingly important, particularly given
the dearth of paid care services for the elderly.
Source: Authors’ predictions using ELMPS 2006.
Note: The grey bars indicate 95 per cent confidence intervals on the estimates of additional time.
figure 2.9: predicTed addiTional weekly hours of care work wiTh a child under age 3 in The household, by educaTion, married women age 15–64, elmps 2006
34.4
40.841.7 41.7
40.8
5.9 7.2 13.0 13.1 9.10
5
10
15
20
25
30
35
40
45
No schooling Below secondary Secondary University and above Total
Weekly
hours
of
unpaid
work
Predicted average time with no children aged under 3 Predicted additional time with a child aged under 3

98
CARE ECONOMY AND PROMOTING GENDER EQUALITY
Source: Authors’ predictions using ELMPS 2006.
Note: The grey bars indicate 95 per cent confidence intervals on the estimates of additional time.
figure 2.10: predicTed addiTional weekly hours of care work wiTh a child (3–5 years) in The household, by educaTion, married women aged 15–64, elmps 2006
34.3
41.644.5 44.1
39.8
5.9 6.08.6 6.5
6.7
0
5
10
15
20
25
30
35
40
45
50
No schooling Below secondary Secondary University and above Total
Weekl
y hours
of
unpaid
work
Predicted average time with no children aged 3–5 Predicted additional time with a child aged 3–5
Source: Authors’ predictions using ELMPS 2006.
Note: The grey bars indicate 95 per cent confidence intervals on the estimates of additional time.
figure 2.11: predicTed addiTional weekly hours of care work wiTh a child (6–17 years) in The household, by educaTion, married women aged 15–64, elmps 2006
33.8
42.245.1 44.1
39.8
1.5 0.22.5
7.1
2.4
-7
3
13
23
33
43
53
No schooling Below secondary Secondary University and above Total
Weekl
y hours
of
unpaid
work
Predicted average time with no children aged 6-17 Predicted additional time with a child aged 6-17

CHAPTER 2 – THE EVOLUTION OF PAID AND UNPAID CARE WORK IN EGYPT
99
CHAPTER 2 – THE EVOLUTION OF PAID AND UNPAID CARE WORK IN EGYPT
2.4 Characteristics and growth of the paid care economy
This section examines the paid care economy –
which consists of education, health, social care
and domestic work – analysing the size and
characteristics of these sectors. The generally
strong growth in the private care sector between
2009–2017 may indicate that it is increasingly
providing alternatives to public care services in
education, health and social work. This trend
has important implications not only for women’s
employment opportunities, but also the availability
Source: Authors’ predictions using ELMPS 2006.
Note: The grey bars indicate 95 per cent confidence intervals on the estimates of additional time.
figure 2.12: predicTed addiTional week-ly hours of care work wiTh an elderly in The household, by mariTal sTaTus, women aged 15–64, elmps 2006
41.7
18.0
4.53.6
0
5
10
15
20
25
30
35
40
45
Married Unmarried
Wee
kly
hours
of
unpaid
work
Predicted average time with no elderly
Predicted additional time with an elderlyhousehold member
of paid care services. The upside of this trend is the
potential role of care jobs as a job–creation engine
in the private sector, especially for women. Yet, it
seems that unmarried women are the most likely
to benefit from this growth in private sector care
jobs, possibly because of deteriorating working
conditions and job quality. Thus, the focus should be
on how to improve working conditions in the private
sector. Also, the greater role of the private sector in
care–provision would benefit those who can afford
these paid services, whereas poorer families would
potentially be left out, leading to rising inequalities.
This raises the question: What are adequate forms
of State intervention to strengthen care services
and create decent jobs for women?
Employment in Egypt’s paid care sector hovered
around 12–13 per cent of total employment between
2009 and 2017.277 Care employment makes up a tiny
share in the private sector (2–5 per cent), whereas
it represents around two–fifths (39–42 per cent) of
public sector employment (Figure 2.13).
Disaggregating by sex reveals that women were
almost four times more likely than men to work
in the paid care sector. Between 2009 and 2017,
around 28–32 per cent of employed women worked
in the paid care sector, compared to around 8 per
cent of employed men (Figure 2.14). Men employed
in the paid care sector represent less than a third
of the public sector male workforce (around 29–31
per cent), compared to around 1–2 per cent of the
private sector male workforce. Meanwhile, two–
thirds of women employed in the public sector work
in the paid care sector (64–67 per cent) compared
to 6–14 per cent of women employed in the private
sector. It is noteworthy that women employed in the
private sector became twice as likely in 2015–2017
to work in paid care jobs (14 per cent) than in 2009–
2011 (6 per cent). This notable growth suggests
that the care sector can be an important source of
private sector job opportunities.278

100
CARE ECONOMY AND PROMOTING GENDER EQUALITY
cent a year, followed by health and social work
which grew at 10.1 per cent.
Feminization of the paid care sector took place faster in the private sector
Within paid care employment, women became
more concentrated in the private sector than in the
public sector due to such rapid growth in private
sector care jobs.
Source: Authors’ calculations based on LFS 2009–2017.
figure 2.13: The size of The care secTor as a percenTage of ToTal employmenT by insTiTuTional secTor, lfs 2009–2017
32
1
9
33
1
10
32
2
9
8
1
3
8
1
3
10
1
3
1
1
1
1
0
2
1
39
2
12
41
3
13
42
5
13
0
5
10
15
20
25
30
35
40
45
Public Private National Public Private National Public Private National
2009-11 2012-14 2015-17
Education Health & social work Domestic work
Increasing private sector care provision
Most paid care jobs (75 per cent) are concentrated
in the public sector. Yet the share of the private
sector in total care jobs grew substantially from
13 to 25 per cent during 2009–2017 (Figure 2.15).
Moreover, private sector employment grew faster
in paid care sectors (by 13 per cent per year) than
in non–care sectors (which grew 1.8 per cent per
year). Among paid care sectors, it was education
that exhibited the fastest growth, rising at 15 per
Source: Authors’ calculations based on LFS 2009–2017.
figure 2.14: The size of The care secTor as a percenTage of ToTal employmenT by insTiTuTional secTor, lfs 2009–2017
24
16
25
16
25
16
49
3
21
51
4
23
49
8
21
5
0
1
5
0
2
6
1
2
15
3
7
15
3
8
18
4
9
1
0
1
0
0
1
1
0
1
1
0
1
1
0
3
229
1
8
30
2
8
31
2
8
64
6
28
66
8
31
67
14
32
0
10
20
30
40
50
60
70
Public Private National Public Private National Public Private National Public Private National Public Private National Public Private National
2009-11 2012-14 2015-17 2009-11 2012-14 2015-17
Men Women
Per
cent
Education Health & social work Domestic work

CHAPTER 2 – THE EVOLUTION OF PAID AND UNPAID CARE WORK IN EGYPT
101
CHAPTER 2 – THE EVOLUTION OF PAID AND UNPAID CARE WORK IN EGYPT
Source: Authors’ calculations based on LFS 2009–2017.
figure 2.15: The secToral composiTion of paid employmenT by indusTry, lfs 2009–2017
93
80
1
87
1827
8371 75
1523
7
20
99
13
8273
1729
100
25
8577
0
10
20
30
40
50
60
70
80
90
100
Education Health & socialwork
Domestic work Total caresectors
Other non-caresectors
National Education Health & socialwork
Domestic work Total caresectors
Other non-caresectors
National
2009-11 2015-17
Per
cent
Public Private
Not only was the proportion of women in care jobs
higher than average in the private sector, it also
became higher than that in the public sector. In
2015–2017, while women represented around 18
per cent of overall private sector employees, they
represented 63 per cent of the care workforce in the
private sector (up from 49 per cent in 2009–2011).
Conversely, the proportion of women employed in
the public care sector hovered around 48 per cent
(Figure 2.16).
In the private paid care sector, women were mostly
employed in pre–primary and primary education
mainly as early childhood educators and childcare
workers, likely because this sector better suits
their domestic responsibilities in terms of hours of
work, the nature of workplaces, and eventually
regular vacations. It is also possible that this sector
indirectly offers women the opportunity to arrange
for childcare, since women can enrol their children
in pre–primary and primary education institutions.
Employers may also prefer to hire women for
positions in pre–primary and primary education
due to the stereotypical association of childcare
with women’s gendered care roles. Health,
nurseries and domestic work represented the next–
largest care sectors, after education, where women
were most likely to be employed in the private
sector. While concentrated in education for young
children, women do participate in a range of care
occupations and sectors that have potential for
growth.
The care sector has driven the increase in women’s private sector employment
Women experienced faster employment growth
in the private sector than men over the 2009–
2017 period, primarily due to their accelerated
employment growth in care jobs (Figure 2.17).
Women’s employment in the private paid care
sector increased at an annual rate of 17.1 per cent,
compared to an annual growth rate of 2.0 per
cent in non–care sectors. Figure 2.17 shows the
care industry groups that exhibited the fastest
employment growth among men (Panel A) and
women (Panel B). There was particularly rapid
growth in women’s employment in higher education
(35.4 per cent per year), secondary education (21.1
per cent), pre–primary and primary education
(17.5 per cent) and domestic work (23 per cent). For
men, the number of jobs in the private sector also
expanded faster in the paid care sector (at 7.5 per
cent yearly) than non–care sectors (at 1.8 per cent).
Yet, overall, men’s employment in the private sector
grew at 1.9 per cent a year, versus 3.5 per cent for
women.

102
CARE ECONOMY AND PROMOTING GENDER EQUALITY
Source: Authors’ calculations based on LFS 2009–2017.
figure 2.16: The proporTion of women by care secTor/occupaTion and insTiTuTional secTor, ages 15–64, lfs 2015–2017
98
66
41
97
31
96
64
17
72
65
45
63
16
18
99
47
63
20
17
51
22
46
57
48
17
30
0 10 20 30 40 50 60 70 80 90 100
Early child educators
Other educators
Health workers
Child care workers
Personal care workers
Domestic helpers
Total care occupations
Other occupations
Education
Health & social work
Domestic work
Total care sectors
Other non-care sectors
National
Occ
upations
Indust
ry s
ect
ors
Per cent
Public sector Private sector

CHAPTER 2 – THE EVOLUTION OF PAID AND UNPAID CARE WORK IN EGYPT
103
CHAPTER 2 – THE EVOLUTION OF PAID AND UNPAID CARE WORK IN EGYPT
figure 2.17: annual employmenT growTh raTe by indusTry group and insTiTuTional secTor for men and women beTween 2009–2017, lfs
panel a: men panel b: women
Source: Authors’ calculations based on LFS 2009–2017.
-1.3
1.5
-2.5
-18.7
0.7
-13.4
5.1
-16.6
-28.4
-18.7
-0.5
-2.1
-1.6
6.9
11.4
6.2
11.8
8.2
1.9
12.2
4.1
16.1
6.9
7.5
1.8
1.9
-0.7
1.7
-1.6
-2.1
1.7
0.0
6.1
-3.4
9.9
6.8
0.8
1.2
1.1
-40 -30 -20 -10 0 10 20
Pre-primary and primaryeducation
Secondary education
Higher education
Other education
Hospital activities
Medical and dentalpractice activities
Other human healthactivities
Residential care activities
Social care activitieswithout accommodation
Domestic work
Total care sectors
Other non-care sectors
National
Annual employmentgrowth rate (%)
Public Private National
-1.2
1.0
-2.4
-6.3
3.2
-18.0
3.3
-18.5
-17.2
0.0
-0.1
-2.7
-1.0
17.5
21.1
35.4
27.3
13.1
6.3
17.1
-13.7
13.7
23.0
17.1
2.0
3.5
2.0
2.0
2.5
10.3
4.4
2.4
5.3
-14.3
11.1
23.0
3.6
1.1
1.9
-40 -20 0 20 40
Pre-primary and primaryeducation
Secondary education
Higher education
Other education
Hospital activities
Medical and dentalpractice activities
Other human healthactivities
Residential care activities
Social care activitieswithout accommodation
Domestic work
Total care sectors
Other non-care sectors
National
Annual employmentgrowth rate (%)
Public Private National

104
CARE ECONOMY AND PROMOTING GENDER EQUALITY
The feminization of the private sector happened mostly among unmarried women
Married women are not likely to benefit from
the increased propensity for women to work in
the private sector overall, and in the paid care
sector in particular. While the proportion of female
employees in the private sector increased, the
proportion of those who are married among
employed women declined substantially, from 73
per cent in 2009–2011 to 64 per cent in 2015–2017
(Figure 2.18). Women employed in the private paid
care sector are much less likely to be married (from
51 to 50 per cent between 2009–2011 and 2015–
2017) than women in the public paid care sector
(77 to 75 per cent). This means that the increase
in women’s employment in the private sector in
general, and in the paid care sector in particular,
happened mostly among unmarried women,
while there are still barriers to married women’s
employment in the sector.
Worsening job quality in paid care sectors
The lower participation of married women in
private sector care work may be related to job
quality, which is an important determinant of
employment decisions among married women in
particular.279 One important indicator of job quality
is formality, defined through the presence of a work
contract or social insurance enrolment. Private
sector jobs are more formal in the paid care sector
than in non–care sectors. Figure 2.19 shows the
proportion of formally hired workers by industry in
the private sector only, since almost 100 per cent
of workers in the public sector are formal. By 2015–
2017, around 51 per cent of workers in the paid care
sector were formally employed, versus 23 per cent
of private sector workers in non–care sectors.
The proportion of workers who were formally
employed in the private sector as a whole was
higher among men (25–33 per cent) than among
women (16–18 per cent).
figure 2.18: The proporTion of Those who are married among employed women by indusTry secTion and insTiTuTional secTor, lfs 2009–2017
Source: Authors’ calculations based on LFS 2009–2017.
7873
7774 76
79
67
7571
74
50 49
61
51
74 73
4743
67
50
6764
76
6861
73 74 7471
6067 68 68 68
0
10
20
30
40
50
60
70
80
90
Education
Health &
socia
l w
ork
Dom
est
ic w
ork
Tota
l care
secto
rs
Oth
er
non-c
are
secto
rs
National
Education
Health &
socia
l w
ork
Dom
est
ic w
ork
Tota
l care
secto
rs
Oth
er
non-c
are
secto
rs
National
2009-11 2015-17
Per
cent
Public Private National

CHAPTER 2 – THE EVOLUTION OF PAID AND UNPAID CARE WORK IN EGYPT
105
CHAPTER 2 – THE EVOLUTION OF PAID AND UNPAID CARE WORK IN EGYPT
labour market, in anticipation of increased child
responsibilities, given that they expect to receive no
benefits in a highly informalized work environment.
Another factor relates to differences in labour
law enforcement or compliance rates across
industries. Care sectors were much more likely than
other sectors to offer formal jobs as of 2009–2011,
indicating that establishments in these sectors
might be more compliant with labour laws. In light
of labour market regulations, the recruitment of
married women is associated with higher costs
for employers than the recruitment of unmarried
women. Therefore, employers who comply with
labour law may prefer not to hire married women
due to the associated costs. Another possibility is
that employers still expect women to quit when they
marry.
It is important to note that job quality varies
substantially within care jobs (Figure 2.20). Some
groups of workers are considerably less likely
to have formal work, such as domestic women
workers (only 3 per cent), personal care workers
(19 per cent), and childcare workers (35 per cent).
This reflects the vulnerability of these groups of
care workers, not all of whom enjoy good working
conditions or better job quality.
In care sector jobs, the proportion of formal workers
was much higher for both men and women (66 and
73 per cent respectively in 2009–2011). Yet over time,
women experienced a sharp drop in their chances
of getting a formal job. The proportion of formal
female workers fell to 51 per cent during 2015–2017
– a drop of almost 20 percentage points. Pre-
primary, primary and higher education experienced
one of largest declines in the proportion of formal
workers over time, even though these were the
fastest-growing industry groups. Social care
activities without accommodation, being the third–
largest employer of women in the private care
sector, also became much less likely to offer formal
jobs.
Although women became more likely to work in
the private paid care sector, which increased their
participation in the private sector overall, these
expanding industries became less likely to offer
formal jobs. Meanwhile, the proportion of married
women in these expanding industries fell, also
below the national average.
A number of factors could explain these findings.
The deterioration of job quality in care jobs
may lead married women to withdraw from the
figure 2.19: The proporTion of formally employed workers by sex and indusTry secTion in The privaTe secTor, lfs 2009–2017
Source: Authors’ calculations based on LFS 2009–2017.
88 86
36
66
33 33
82
66
12
50
25 25
89
74
14
73
1216
61
47
28
51
1318
88
79
31
69
29 30
67
54
19
51
23 24
0
10
20
30
40
50
60
70
80
90
100
Education Health &social work
Domestic work Total caresectors
Other non-care sectors
National Education Health &social work
Domestic work Total caresectors
Other non-care sectors
National
2009–11 2015–17
Per
cent
Men Women All

106
CARE ECONOMY AND PROMOTING GENDER EQUALITY
indirect care activities (e.g. cooking, cleaning).
Marriage is the key determinant of how much
time women spend on unpaid care activities, with
married women spending twice as much time as
unmarried women. This reflects social obligations
on married women and the widespread adherence
to ‘male breadwinner–female caregiver’ inspired
gender roles.
Another critical finding is that women spend almost
the same amount of time on unpaid care work
when they are employed in the paid labour force
as when they are not. This demonstrates the double
burden that employed married women face in
Egypt.280 Employed married women perform the
highest number of hours per week of total work
(between paid work and unpaid care work), far
exceeding the number of hours of their male peers.
The double burden is thus an important barrier to
women’s participation in the labour force and will
continue to be unless policy measures are taken to
reduce indirect care work and redistribute women’s
unpaid care responsibilities.
Women’s time spent on unpaid care work also
depends on family structure and the presence
Without appropriate measures to improve the
working conditions and to ensure decent work,
increasing reliance on private care services would
lead to more women abstaining from the labour
market.
2.5 From key fΙndings to informed policy recommendations
Summary of key findings
Unpaid care work
Women in Egypt perform the vast majority of
unpaid care work, which consumes an important
proportion of their time that could be allocated to
paid work, education, leisure, self–care activities,
or other pursuits. Women also spend considerably
more time than men on unpaid care, reaching up
to 33 hours per week in 2006, which is nearly the
equivalent of a standard paid working week. Most
of the time spent on unpaid care work is spent on
figure 2.20: proporTion of formal workers by sex and by care occupaTions in The privaTe secTor, lfs 2009–2017
Source: Authors’ calculations based on LFS 2009–2017.
44
7579
52
26
3
75
28 29
47
8075
35
19
6
62
1316
47
78 77
36
24
6
67
26 27
0
10
20
30
40
50
60
70
80
90
100
Early childeducators
Other educators Health Childcare workers Personal careworkers
Domestic helpers Total careoccupations
Other occupations Total
Per
cent
Men Women All

CHAPTER 2 – THE EVOLUTION OF PAID AND UNPAID CARE WORK IN EGYPT
107
CHAPTER 2 – THE EVOLUTION OF PAID AND UNPAID CARE WORK IN EGYPT
sector employment in paid care grew considerably
between 2009–2017, from 13 to 25 per cent of all
care–sector jobs. During this period, private sector
employment grew faster in paid care sectors than
in the rest of the economy. This led to an expansion
in the share of care employment in the private
sector and demonstrates the potential for the
care sector to be a major driver of private sector
employment growth.
Within care jobs, the private sector became
more feminized than the public sector. Not only
is the proportion of women in care occupations
higher than average in the private sector, it is
also higher than that in the public sector. Over
time, the proportion of women employed in the
private sector has also grown faster in paid care
sectors than in non–care sectors. Given the weak
participation of women in Egypt’s private sector in
general, the care economy can be an important
source of expanding job opportunities for women.
Yet, while being the largest employer of women and
the one with highest formality rates, the care sector
experienced deteriorating job quality – captured
by rising informality. Thus, any expansion of the
paid care sector must focus on job quality. Efforts
to reverse the trend of declining job quality are
critically needed to encourage the expansion of
decent care jobs. Also, there is a strong association
between working conditions in paid care jobs and
the quality of service provided. While there is little
information on the quality of ECCE and elder–
care services, worsening job quality may indicate
heightened quality issues in ECCE provision as well.
Another development is that the proportion of
married women in the expanding private paid care
sector fell. This is either because labour market
regulations lead to higher costs to employers when
they recruit a married woman than an unmarried
one, or because married women abstain more from
the labour market as they fail to find formal jobs in
the private sector. Thus, reforms should be centred
around how to improve private sector working
of care recipients such as young children or the
elderly. The largest effect on married women’s
time use results from having a child aged 0–3 or
3–5 in the household. This is an area that needs
further research, but that highlights the potential
for expansion of quality ECCE services, not only to
improve children’s development outcomes but to
redistribute some of the responsibility for unpaid
care towards paid care services.
Efforts to increase pre–primary education for
children aged 4–6 have been successful in Egypt,
as demonstrated by increasing net enrolment
rates in ECCE for this age group. This trend has
had a positive effect on the size of the care sector,
where employment in pre–primary education in
the private sector has rapidly increased. Yet, the
enrolment rate of children aged 4–6, at 26 per
cent in 2017, is far from universal. Furthermore, the
number of nurseries grew more slowly than the
number of children under 3. Little is known about
the reasons of such slow growth and generally the
different modalities of nurseries, cost structure,
and variation in access. A market study of ECCE,
including informal nurseries, is strongly needed
to bridge the gap in knowledge and better
inform policymaking on how to expand quality
childcare facilities. Developing ECCE provisions,
through quality nurseries and pre–primary
education, can have positive child effects, but
also can enable women to engage in paid work
through redistributing their time in care work or by
providing employment opportunities for women in
the ECCE sector.
The paid care sector
As women perform most of the unpaid care
work, they are also more likely to perform paid
care work. Women were almost four times more
likely than men to be employed in the paid care
sector. Employment in paid care sectors is mostly
concentrated in the public sector. However, private
108
CARE ECONOMY AND PROMOTING GENDER EQUALITY
to a loss of human capital and skills that will also
take its toll on the growth of the economy.283
Expand quality Early Childhood Care and Education services
In addition to its importance in children’s
development and potentially improving future
educational outcomes, expanding quality ECCE is
necessary to redistribute the amount of unpaid care
work undertaken by women, which is most intensive
when women have young children. Expanding
quality ECCE services would give women choices
for childcare, thus enabling them to join the labour
market, while providing nurturing care for young
children.284 The challenges that women currently
face in arranging for childcare due to lack of quality
or affordability, especially for children aged 0–5,
will eventually push more employed women to
leave their jobs, and discourage non–employed
ones from seeking employment. Without careful
policy design of ECCE provisions and without
guaranteeing a minimum level of quality, efforts
to expand ECCE could lead to undesirable effects.
In Algeria, rapid mandatory expansion of public
KG2 classes actually reduced female labour force
participation. 285 This was likely because public
pre–primary education was introduced as a half–
day shift and thus did not match the needs and
schedules of employed women.286
A strong regulatory framework, in terms of quality,
monitoring and governance, can play an important
role in reducing unpaid care work and creating
an enabling environment for the private sector
to invest in high–quality ECCE services. Such a
framework is much needed to create decent
job opportunities for women in the ECCE sector,
with equitable wages and working conditions.
Accordingly, the Government of Egypt should
build on the ongoing reforms introduced by MoSS
conditions and job quality – including working
hours, care provisions, social security benefits
and safety of workplaces – to make such work
more hospitable to women, and reconcilable with
domestic care responsibilities and social values.
There are many dimensions to ensuring decent
work in the labour market generally, and in the
paid care sector particularly. It is crucial to fix the
structural problems of the labour market, namely
deterioration of the business climate, high taxes/
social security contribution rates, and limited access
to finance that micro–, small– and medium–sized
enterprises suffer – as these types of enterprises
are likely to constitute the majority of nurseries and
elder-care facilities. Also, interventions to ensure
quality in nurseries are needed, a reform that MoSS
has already started piloting.
Policy recommendations
Addressing gender imbalances in unpaid care work
and investing in the paid care sector is expected
to affect women’s economic empowerment and
reduce gender disparity in the Egyptian labour
market. It is estimated that increasing female
employment rates in Egypt to match male
employment rates would result in an increase
of 34 per cent in the Gross Domestic Product
(GDP).281 The policy actions suggested by this
chapter provide a framework for accelerating the
achievement of SDG 5 “Achieve gender equality
and empower all women and girls”. The policies
are structured under the ‘5R Framework for Decent
Care Work’, which seeks to: recognize, reduce
and redistribute unpaid care work; reward paid
care work, by promoting more and decent work
for care workers; and guarantee care workers’
representation.282 Failing to recognize and
redistribute unpaid care work, reduce indirect care
work, and promote decent care jobs, will affect
women’s participation in the labour force, leading
CHAPTER 2 – THE EVOLUTION OF PAID AND UNPAID CARE WORK IN EGYPT
109
CHAPTER 2 – THE EVOLUTION OF PAID AND UNPAID CARE WORK IN EGYPT
interventions could also ensure that reliance on
private services does not exacerbate gender or
socioeconomic inequalities.
Develop a national strategy for elder care
Public and private provision of elder care in Egypt
is quite underdeveloped (as it currently reaches
just 2 per cent of the elderly population). Moreover,
information and data about this sector is scarce
and often contradictory. Yet, it is one of the most
important areas of improvement because the elder
population will continue to grow considerably in
Egypt in the coming decades. Without policies
to develop adequate elder-care services, this
expected increase will lead to higher unpaid care
workloads. This chapter demonstrates that this
workload will fall primarily on both married and
unmarried women, whose additional unpaid care
time rises significantly with the presence of an
elderly member in the household. More efforts are
thus needed to develop and strengthen policies
to support the growing elderly population. First,
it is important to address the falling rates of
workers covered by social insurance to ensure
a decent level of pension coverage in old age.
The new social insurance scheme, introduced in
2019,289 is the first reform measure to curb the rising
proportion of socially uncovered workers. Second,
there is a strong need to expand high–quality
residential and non–residential care services for
the elderly. This could be achieved by encouraging
the private sector to invest in these services by
improving the business climate, simplifying tax
procedures, and providing access to adequate
funding. Another area of action is to encourage and
promote professional nursing, so as to increase the
availability of quality home–based care services.
to review regulations and licensing procedures
for nurseries, while adopting and maintaining a
rigorous monitoring and accreditation system to
check their quality standards.
Direct public ECCE provision is not promising in
this area, given the low quality of Egypt’s public
education, as measured by the WEF Global
Competitiveness Index 2017–2018. Countries that
have adopted public provision in ECCE services
(e.g. Chile in 2006) ranked much better in the
quality of primary education (Chile was ranked
103rd, compared to Egypt’s 133rd ranking among
137 nations). Thus, the success of public provisions
strongly hinges on the quality of public education.
Yet, public financing is certainly important. A
key policy action is to create programmes that
incentivize private sector investment in care
institutions and encourage businesses to establish
nurseries at workplaces through tax deductions or
preferential pricing of utilities. This could also help
the private sector provide better quality jobs by
alleviating hiring costs.
Moreover, any expansion in the number of
childcare institutions should be accompanied
with means to facilitate access of children from
poor families. This is crucial to reduce gender
and social inequalities and break the cycle of
intergenerational poverty. Subsidizing quality
childcare for the poor is an important area for
public interventions to support the outreach of
ECCE services to different vulnerable groups.
Children from wealthier families are six times
more likely to enrol in pre–primary education than
those from poorer families, negatively affecting
the latter’s chances for strong early childhood
development and the opportunities of their mothers
to engage in paid employment.287 Evidence
from Kenya shows that offering subsidized
early childcare can positively affect women’s
employment and economic participation.288 Such

110
CARE ECONOMY AND PROMOTING GENDER EQUALITY
the work of pregnant women. The solution to these
policy gaps is not to add more provisions that apply
to women only, as this would further discourage
women’s employment. Rather, solutions should be
geared towards resolving the main bottleneck – the
cost of hiring women – by encouraging the private
sector to invest in care but maintain the quality of
jobs and promote work arrangements compatible
with care roles and responsibilities. Care leaves
and related provisions should be offered to all
employees, regardless of gender, to avoid further
reinforcing the prevailing norm that care work is
exclusively women’s work.
Changing attitudes
Involving men in unpaid care work is instrumental
in redistributing unpaid care work. Increasing men’s
involvement will require intensive communication
and advocacy campaigns to address the barriers
related to attitudes and stereotypes towards
women and gender roles in Egypt and to promote
behavioural change. More research on gender
norms is required to understand the drivers of these
attitudes and how to change them.
Conduct regular, national time–use surveys
This analysis showed the importance of data in
recognizing unpaid care work in Egypt. The ELMPS
provides a reliable and rich source of data on
domestic work. It allowed for an exploration of
the linkages between unpaid care work and other
economic and social indicators, such as labour
force participation, individual and household
characteristics. Unpaid care work could also be
analysed in correlation with GDP, inequalities and
time poverty. Accordingly, the significance of data is
magnified during times of crisis, like the COVID–19
pandemic, when it is more crucial than ever to
Implement family-friendly labour market regulations for care leave and flexible work
Women’s care responsibilities shape their
decisions regarding paid employment. As a result,
family-friendly policies aimed at redistributing
unpaid care work should include labour market
regulations that promote flexible and part–time
work arrangements to improve work–life balance,
particularly for married women. However, labour
market provisions that only apply to women can
be costly to employers and might discourage
employers from recruiting women. For example,
the current labour law stipulates that employers
must establish a nursery once they hire 100 female
workers or more. This may be one of the reasons
that the share of employer–initiated nurseries does
not exceed 2 per cent of total nurseries, as this
policy has probably disincentivized employers from
hiring more than 99 female workers. Thus, although
the policy aimed to help employed women, it
actually may have unintentionally curtailed their
chances of employment. A reform such as that
recently implemented in Jordan, which based the
requirements for opening a nursery on the total
number of young children of all employees, rather
than just female employees, could help to reduce
this disincentive.290
Care leaves, including paternity or parental
leave, constitute an important pillar for any
comprehensive approach to care policy. Maternity
leaves, which are currently financed by the
employer, may also discourage employers from
hiring women. Accordingly, there is room to
restructure the financing scheme of maternity leave
to move from a system that puts the main liability
on employers and reduces incentives for hiring
women, to a maternity insurance system. Yet, such
reforms still have to be evaluated. Moreover, some
legal provisions could leave room for discrimination
against hiring pregnant women, or to terminate

CHAPTER 2 – THE EVOLUTION OF PAID AND UNPAID CARE WORK IN EGYPT
111
CHAPTER 2 – THE EVOLUTION OF PAID AND UNPAID CARE WORK IN EGYPT
examine its impact on the care economy and on
women’s unpaid care roles, specifically. Therefore,
it is critical to conduct regular national time–use
surveys, to accurately measure and recognize
the amount and value of unpaid domestic work.
Time–use surveys will serve to measure the scope
of unpaid work and how its distribution is evolving
among men and women. Furthermore, providing
data on unpaid care work is a prerequisite for
placing a value on it, which can contribute to
policy efforts to adequately reward care work and
properly count it within the GDP. An additional
data gap identified by this chapter is updated
information on the coverage of childcare facilities,
fee structures, types of nurseries and enrolment
patterns, as well as elder–care services.

112
CARE ECONOMY AND PROMOTING GENDER EQUALITY
Promoting quality early childhood care and education in egyPt
Expanding access to quality Early Childhood Care and Education
(ECCE) can have multigenerational impacts, by improving child
development and learning outcomes, increasing women’s employment
and boosting investment in human capital. In Egypt, nurseries provide
care for children under the age of 4 under the supervision of the
Ministry of Social Solidarity (MoSS).296 The number of nurseries
currently available in Egypt is limited, with enrolment rates of around 8
per cent.297
To address this remarkable coverage gap and lack of supply in quality
ECCE services, MoSS initiated the policy reform process by launching
a national early childhood development programme in 2018. It aims to
improve the quality of early childhood care services through multiple
avenues, including the development of a national standard curriculum
for nurseries as well as offering trainings to build a qualified childcare
workforce. The programme includes a pillar related to renovating
the infrastructure of nurseries, particularly in rural and deprived
areas, in addition to setting national quality assurance standards and
accreditation criteria. Raising awareness among parents about the
importance of enrolling children in nurseries during this early stage of
their life is another pillar of the programme.298
In order to map early childhood care facilities, MoSS created a
national geographic database documenting information and quality
measures for both formal and informal nurseries. Fieldwork and data
collection took place in different governorates to synthesize evidence
and identify policy solutions to stimulate the growth of the sector and
reduce informality.
A key challenge identified was the need to simplify licensing
regulations and procedures. Accordingly, MoSS is working with
different entities on reviewing regulation and licensing procedures

CHAPTER 2 – THE EVOLUTION OF PAID AND UNPAID CARE WORK IN EGYPT
113
in addition to automating the process for
obtaining licenses. Creating a supportive
regulatory environment is expected to
encourage the registration of nurseries,
especially in the private sector.299
Providing access to finance is another
important aspect addressed by the
programme, to entice investment in ECCE
services. Through the “Hadanaty” (My
Nursery) initiative, managed by Nasser
Social Bank, MoSS is providing soft loans
with lenient terms for the establishment
of new nurseries. For existing nurseries,
loans are offered for the purpose of
renovating the space or satisfying licensing
requirements and accreditation criteria to
facilitate the transition to formality.300
The affordability of ECCE is a crucial
aspect, given the noticeable inequality in
access to ECCE in Egypt.301 The potential
role of home–based childcare in deprived
areas is being considered. However, there
are various challenges to this model, mostly
related to quality assurance criteria and
awareness of the importance of nurseries.
Moreover, MoSS is offering grants and
subsidies to selected nurseries managed
by NGOs.302 Consequently, there is a need
to explore further opportunities and design
delivery models that provide affordable
early childcare solutions for low–income
families in rural areas or urban slums.
Engaging multiple stakeholders was a
key element of national efforts to expand
ECCE services. In addition to working
with governmental entities on regulatory
frameworks, MoSS partnered with
international organizations and the private
sector, such as McDonald’s and Alex Bank,
to support the national early childhood
development programme. Additionally,
MoSS signed different agreements with
civil society organizations, including Sawiris
Foundation, Misr El Kheir, Sonaa El Hayah
and Kheir wa Baraka. These agreements
aimed to improve the infrastructure of more
than 1,000 nurseries and offer trainings to
staff to improve outreach in poor and rural
areas.303
Expanding early childcare services requires
a comprehensive approach to develop
a sustainable system and an enabling
environment that can ensure the quality
and affordability of the expansion. Setting
a supportive regulatory framework,
monitoring quality and ensuring equitable
access to early childcare services for low–
income households are essential roles
played by the Government. Furthermore,
the private sector could substantially
support innovation in service–provision and
scaling–up facilities. Multiple opportunities
could be leveraged to assess and recognize
the potential positive effects of expanding
access to childcare in Egypt, including
the improvement of child development
outcomes and female employment.
Accordingly, these recent efforts by MoSS
should be sustained and supported by
evaluations to assess the impact of the
programme on key outcomes.

TOWARDS POLICY INTERVENTIONS
TO RECOGNIZE AND REDISTRIBUTE
UNPAID CARE WORK
3THE CARE ECONOMY
IN JORDAN
3.1 Overview
3.2 Care policies and services in Jordan
3.3 Unpaid care work
3.4 The paid care sector
3.5 Towards policy interventions to recognize and redistribute unpaid care work
116
118
125
132
142

3 KEY MESSAGES
Women in Jordan, and particularly married women, bear nearly all of the
responsibility for unpaid care work.1
Women’s time in unpaid care does not vary by their employment status,
so employed women face a “double shift” of housework after their paid workday.
2
The paid care sector is significant to Jordan’s economy, constituting over a quarter of public sector employment and a growing share of private sector
jobs.
3
The expansion of employment in the paid care sector is of particular importance to women, for whom it represents nearly 60 per cent of total
employment.
4
Efforts to invest in the care economy should be underpinned by programmes and campaigns to address gender norms regarding women’s roles. 5
Monitoring and evaluation of recent reforms to maternity leave, paternity
leave and childcare provision in workplace policies are essential. 6The care economy has substantial potential for growth and could absorb
some new labour–market entrants, particularly if investments in the sector are made.
7

CARE ECONOMY AND PROMOTING GENDER EQUALITY
116
3.1. Overview
Jordan has one of the lowest female labour force
participation (FLFP) rates in the Arab States. FLFP
was 14.2 per cent in 2019, placing Jordan 182nd out
of 185 countries in terms of women’s participation
in the labour market.304 Such low labour force
participation rates, even by regional standards,
constitute a substantial challenge to national
development as well as a key barrier to women’s
economic empowerment.
Unpaid care work is a key contributor to low FLFP
rates. Just over half of Jordanian women aged 15
years and above (51.3 per cent) are engaged in
domestic household work as their primary activity,
compared to only 11.5 per cent who are employed
and 17.9 per cent who are studying or in training
(Figure 3.1).305 Household work was women’s most
common economic activity across both rural and
urban areas. Both social norms about women’s
roles in paid work versus unpaid care work
and the time constraint posed by unpaid care
responsibilities play a role in shaping low FLFP
rates and women’s high dedication to housework.
Women’s time spent on unpaid care work increases
substantially upon marriage in Jordan and does not
vary based on whether or not they are employed.306
The double burden of paid employment and unpaid
care work is thus an important disincentive for
women to enter and remain in the labour market.
This dynamic may be further intensified in periods
of crisis, such as the ongoing COVID–19 pandemic,
when demands on women’s unpaid care time tend
to increase.307
At the same time, attitudes regarding men and
women’s roles in paid work versus unpaid care
work are conservative in Jordan. About 5 per
cent of Jordanian women do not engage in paid
employment because members of their household
think they should stay home (Figure 3.1). Jordan
is also one of the countries in the region where
support for giving men priority in obtaining jobs
is highest (84 per cent of men and 81 per cent of
women agreed with the statement), as well as
support for the opinion that being a housewife is as
fulfilling as employment (84 per cent of men and 78
per cent of women agreed with the statement).308
figure 3.1: disTribuTion of jordanian women aged 15+, by economic acTiviTy sTaTus and area of residence, 2018
Source: Authors’ elaboration, based on data from the Department of Statistics 2018b.
51.2 52.1 51.3
4.6 5.3 4.7
17.9 17.1 17.9
11.4 12.0 11.5
4.15.4 4.2
2.21.0 2.1
6.6 5.5 6.51.9 1.5 1.8
0
10
20
30
40
50
60
70
80
90
100
Urban Rural Total
Per
cent
Other
Injury or illness
Retired
Unemployed
Employed
Study/training
Family members believe theperson should stay home

CHAPTER 3 – THE CARE ECONOMY IN JORDAN
117
Previous studies have shown that job characteristics
strongly influence attitudes about women’s work;
for example, whereas 96 per cent of Jordanians
(men and women) thought it was acceptable for
women to work in general, only 38 per cent thought
it was acceptable for them to work in mixed–
gender environments.309 As discussed further below,
such attitudes about women’s employment have
important implications for their participation in the
paid care sector.
Even when women do work, there is mixed support
for men taking on greater care roles at home. This
is especially true among men themselves. In 2016,
69 per cent of men and 82 per cent of women
agreed that a husband should help his working wife
in raising their children, and 68 per cent of men and
83 per cent of women agreed that a man should
help his working wife with housework.310 Support
for women working also decreases when they are
married, and when working would mean that they
have to leave a child under age 5 with relatives.311
Recognizing, reducing and redistributing the
responsibility for unpaid care on Jordanian women
will be critical to encouraging higher FLFP rates
in the future. The demand for care in Jordan is
likely to grow in the coming decades, both for the
very young and older populations. Fertility rates
remain high, at over 3.5 children per woman until
recently, when the total fertility rate declined to 2.7
children per woman in 2018.312 The percentage of
the population under the age of 5 is thus projected
to decline only slowly in the coming decades, from
10.4 per cent in 2020 to 6.8 per cent in 2050.313 At
the same time, increasing life expectancy, which
reached 74.4 years in the 2007–2013 period, has led
to an increase in the number of elderly persons.314
As of 2020, the population aged 60+ made up 6.1
per cent of the total Jordanian population, and the
population aged 65+ 4.0 per cent. These figures
are expected to rise rapidly over the next decades,
such that by 2050, 16.6 per cent of the population
is projected to be 60+ and 11.8 per cent will be
65+.315 Correspondingly, between 2020 and 2050,
the number of young–age (age 0–14) dependents
per 100 working–age population is projected to
decline from 52 to 32, whereas the old–age (age
65+) dependency ratio is expected to increase from
6 to 18 during the same period.316 Thus, while there
will be a continued need for investment in early
childhood care and education services, Jordan will
also face a growing need for care services and
policies to support the elderly. In the absence of
policy developments, the increased need for care is
likely to fall on women.
Faced with the need to address care as a policy
priority, Jordan has implemented a number of
initiatives to expand early childhood care and
education, provide a stronger care system for
the elderly and reform care leave policies. This
chapter begins with an overview of these recent
policy initiatives before turning to an analysis of
time spent on unpaid care work among men and
women in Jordan. The analysis of unpaid care
focuses in particular on how marital status, paid
employment and household composition affect
women’s time in unpaid care work. The chapter
then analyses the characteristics and dynamics
of the paid care sector in Jordan. The growth of
this sector is critical not only for the availability
of services that can redistribute some of the
responsibility for unpaid care, but also for women’s
employment opportunities. The chapter conclusions
focus on further policy directions to support the
care economy and measures to strengthen the
implementation and evaluation of recent policy
reforms.

CARE ECONOMY AND PROMOTING GENDER EQUALITY
118
3.2 Care policies and services in Jordan
Early childhood care and education (ECCE)
Jordan is committed to delivering quality
education to its citizens and has been enhancing
its education system for the past 30 years. As
part of its educational reform, Jordan included
Early Childhood Development (ECD) on its
policy agenda.317 ECD in the Kingdom consists of
nursery for children aged three months to 4 years,
Kindergarten (KG)1 for children aged 4–5 years
and KG2 for children aged 5–6 years. The nursery
and KG1 levels are voluntary and are under the
supervision of the Ministry of Social Development
(MoSD). KG2 falls under the responsibility of the
Ministry of Education (MoE), including quality
assurance, licensing and supervision of private KG2
classes. In 2017, MoE and UNICEF launched a plan
to universalize KG2 access318 , and in December
2019, MoE announced that KG2 would become
compulsory for children aged 5+, beginning in the
2020–2021 academic year.319
KG1 and KG2
Jordan’s first National Early Childhood Development
Strategy was launched in December 2000.320 The
strategy covered numerous aspects of child
development, including care for children in
nurseries, preschool education, basic education in
the first three primary years, children with special
needs, curricula and programmes for KG2 and
school health–care services, child culture, the
role of the media in ECD and human resources.
The strategy aimed to identify the needs of young
children in Jordan, improve ECD, and increase
family and community awareness about ECD.321
A number of large scale–initiatives have
subsequently been implemented in Jordan to
promote ECCE, enhance institutional capacity
and professional development, and encourage
parent and community engagement in promoting
ECCE.322 In its 2018–2022 Strategic Plan, MoE
integrated objectives from the National Strategy for
Human Resource Development (2016–2025), Jordan
Vision 2025 and the 2030 Agenda for Sustainable
Development.323 It has placed greater emphasis on
ECCE by increasing the preschool enrolment rate,
especially in the most densely populated areas.
The Kingdom expects an increase in demand for
KG2 due to the increasing population, increased
awareness of the importance of ECD, and more
working mothers.
The current Government strategy sets the year
2025 as the target for all children to have access to
quality early childhood learning and development
experiences that promote primary school readiness,
ensure healthy lives and promote their future well–
being. The current national economic stimulus plan,
for 2018–2022, is based on the National Strategy for
Human Resource Development, with investments
in health and education. The stimulus plan seeks
to construct new KG2 classes and schools in order
to achieve a better level of human development.
Specifically, by 2025, the Government plans to
build 2,800 new KG2 classes and 600 basic and
secondary schools with a total budget amounting
to almost 1.25 billion Jordanian Dinars (JOD) –
USD 1.76 billion.324 The plan incorporates other
measures related to early childhood education,
notably developing better curricula and quality
training for teachers. MoE is the governmental
entity responsible for fulfilling the parts of the plan
pertaining to public education.325
Despite this increasing policy attention, there are
continued challenges to ECCE access and provision
in Jordan. The majority of KG provision (82 per cent)
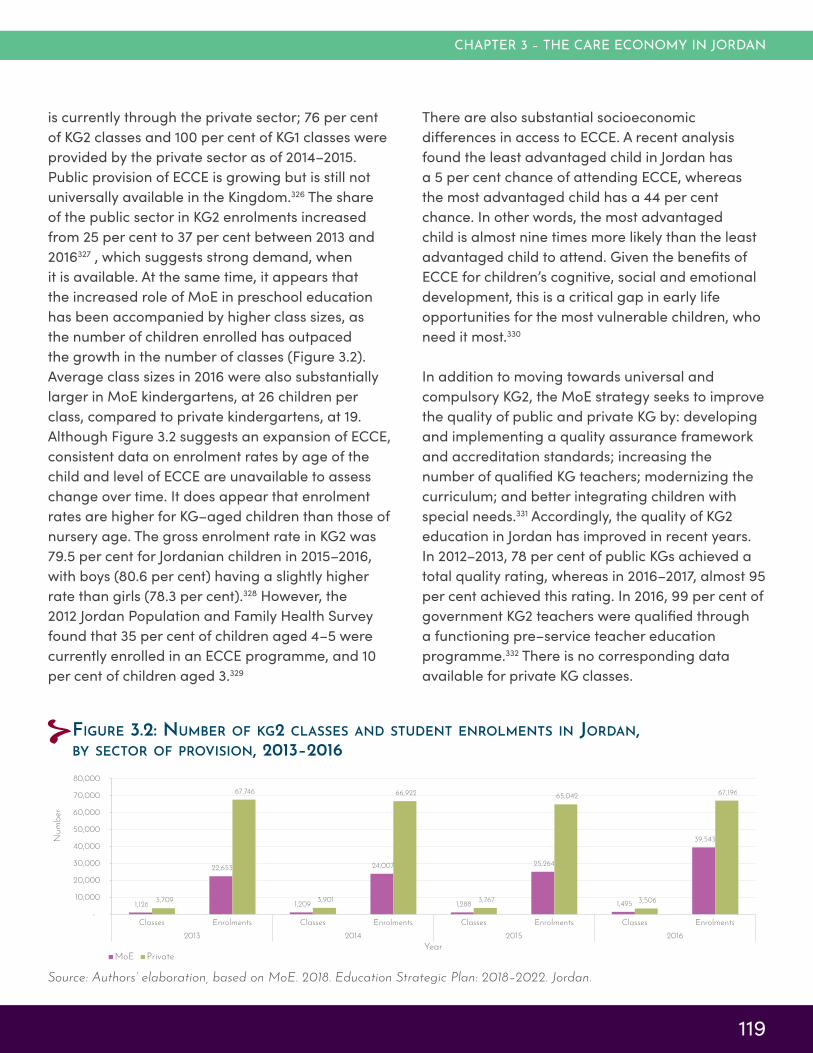
CHAPTER 3 – THE CARE ECONOMY IN JORDAN
119
There are also substantial socioeconomic
differences in access to ECCE. A recent analysis
found the least advantaged child in Jordan has
a 5 per cent chance of attending ECCE, whereas
the most advantaged child has a 44 per cent
chance. In other words, the most advantaged
child is almost nine times more likely than the least
advantaged child to attend. Given the benefits of
ECCE for children’s cognitive, social and emotional
development, this is a critical gap in early life
opportunities for the most vulnerable children, who
need it most.330
In addition to moving towards universal and
compulsory KG2, the MoE strategy seeks to improve
the quality of public and private KG by: developing
and implementing a quality assurance framework
and accreditation standards; increasing the
number of qualified KG teachers; modernizing the
curriculum; and better integrating children with
special needs.331 Accordingly, the quality of KG2
education in Jordan has improved in recent years.
In 2012–2013, 78 per cent of public KGs achieved a
total quality rating, whereas in 2016–2017, almost 95
per cent achieved this rating. In 2016, 99 per cent of
government KG2 teachers were qualified through
a functioning pre–service teacher education
programme.332 There is no corresponding data
available for private KG classes.
is currently through the private sector; 76 per cent
of KG2 classes and 100 per cent of KG1 classes were
provided by the private sector as of 2014–2015.
Public provision of ECCE is growing but is still not
universally available in the Kingdom.326 The share
of the public sector in KG2 enrolments increased
from 25 per cent to 37 per cent between 2013 and
2016327 , which suggests strong demand, when
it is available. At the same time, it appears that
the increased role of MoE in preschool education
has been accompanied by higher class sizes, as
the number of children enrolled has outpaced
the growth in the number of classes (Figure 3.2).
Average class sizes in 2016 were also substantially
larger in MoE kindergartens, at 26 children per
class, compared to private kindergartens, at 19.
Although Figure 3.2 suggests an expansion of ECCE,
consistent data on enrolment rates by age of the
child and level of ECCE are unavailable to assess
change over time. It does appear that enrolment
rates are higher for KG–aged children than those of
nursery age. The gross enrolment rate in KG2 was
79.5 per cent for Jordanian children in 2015–2016,
with boys (80.6 per cent) having a slightly higher
rate than girls (78.3 per cent).328 However, the
2012 Jordan Population and Family Health Survey
found that 35 per cent of children aged 4–5 were
currently enrolled in an ECCE programme, and 10
per cent of children aged 3.329
figure 3.2: number of kg2 classes and sTudenT enrolmenTs in jordan, by secTor of provision, 2013–2016
Source: Authors’ elaboration, based on MoE. 2018. Education Strategic Plan: 2018–2022. Jordan.
1,126
22,653
1,209
24,007
1,288
25,264
1,495
39,543
3,709
67,746
3,901
66,922
3,767
65,042
3,506
67,196
-
10,000
20,000
30,000
40,000
50,000
60,000
70,000
80,000
Classes Enrolments Classes Enrolments Classes Enrolments Classes Enrolments
2013 2014 2015 2016
Num
ber
YearMoE Private

CARE ECONOMY AND PROMOTING GENDER EQUALITY
120
six children under the age of 1, one caregiver per
eight children aged 1–2 years, and one caregiver
per 10 children aged 2–4 years. Eligible caregivers
need to work exclusively at the nurseries, be older
than 20, have reached the secondary level of
education, and have a training certificate or similar
in special education.340
The attention to expanding nurseries responds
partly to continued low rates of child enrolment in
this form of ECCE. The Queen Rania Foundation
did a situation analysis of ECD in Jordan through
a nationally representative survey of nurseries
registered by MoSD in 2015, which found that only
2 per cent of children aged 3 months to 4 years
of age were enrolled.341 Another recent survey
explored the reasons why children are not enrolled
in nurseries, with the most common response
being: that the mother is a housewife (73 per cent),
nurseries are expensive (12 per cent), a family
member can take care of the child at home (4 per
cent), and not feeling safe in nurseries (3 per cent).342
The situation analysis found a variety of registered
nursery types in Jordan: private independent
nurseries (38 per cent); MoE school–based
nurseries located in public schools and run by the
school teachers for their own children only (50 per
cent); workplace–based or institutional nurseries
established by private institutions for the children
of their female employees (4 per cent); community–
based organization (CBO) nurseries operated by
charities that sometimes offer free or subsidized
care (7 per cent); and nurseries based in private
schools (2 per cent).343
The distribution of nurseries also showed a
geographic bias towards urban areas – particularly
the large cities of Amman and Irbid (Table 3.1) –
although a somewhat larger proportion of CBO–
based nurseries were in rural areas and more
underserved governorates.
In sum, for many young children and their families,
Nurseries
MoSD sets the regulations to license nurseries in
Jordan – on areas ranging from infrastructure, to
health and safety, learning resources, student ages,
caregiver and director qualifications, inspection
visits, and issuance of warnings. In 2018, licensing
bylaws for nurseries in different sectors were
replaced by a revised and unifying bylaw for all
providers, regardless of sector.333 The bylaw also
dictates that nurseries should integrate children
with disabilities.334 In 2019, an electronic registration
system for nurseries was introduced to reduce
registration times.335 MoSD is currently drafting a
bylaw for the licensing of home daycares.336
Similar to the national strategy for KG, the National
Council for Family Affairs (NCFA), in collaboration
with UNICEF and through the Early Childhood
Development Strategy, aims to improve nursery
quality and access, including guaranteeing equal
access to children from different backgrounds and
geographic areas.337 The expansion of nurseries
in Jordan has received increased attention, both
as part of the ECD strategy and as a way to
encourage FLFP. At a government level, a JOD 3.5
million (USD 4.9 million) project was announced in
2018 to build 80 nurseries across all governorates
by 2020. In addition to encouraging women to join
the labour market by offering childcare services,
the nurseries were expected to create 700 jobs
directly. 338
In 2019, Jordan also amended Article 72 of the
Labour Law, which mandated private employers
to establish a nursery when they had at least 20
female employees in the workplace. To remove
disincentives this policy might create to hiring
women, the 2019 amendment revised the criteria
such that any private company whose employees
(male or female) collectively have at least 15
children aged 5 or under must provide a nursery in
the workplace.339 These nurseries should follow the
regulations set by MoSD, to have one caregiver per

CHAPTER 3 – THE CARE ECONOMY IN JORDAN
121
Table 3.1: disTribuTion of nurseries by Type of nursery and locaTion, jordan, 2017
Private MoE–based Work–based CBO–based
Area Type
Urban 83.6% 74.3% 70.6% 64.5%Rural 16.4% 25.7% 29.4% 35.5%
Region
Middle 80.7% 54.1% 64.7% 32.3%
North 16.4% 25.7% 29.4% 35.5%
South 2.9% 20.2% 5.9% 32.3%
Governorate
Amman 57.9% 31.7% 52.9% 16.1%
Zarqa 8.2% 13.8% 11.8% 6.5%
Balqa 10.5% 6.0% – 6.5%
Madaba 4.1% 2.8% – 3.2%
Irbid 14.6% 20.2% 17.6% 12.9%Jarash – 0.5% – 6.5%
Mafraq 1.2% 2.8% 5.9% 6.5%
Ajloun 0.6% 2.3% 5.9% 9.7%Karak – 1.4% 5.9% 9.7%Tafelh – 10.1% – 12.9%Ma'an 1.8% 3.7% – 6.5%
Aqaba 1.2% 5.0% – 3.2%
Total number 171 218 17 31
Source: Ghawi and others 2017. “Nurseries in Jordan: Findings from The Queen Rania Foundation National Early Childhood
Development Survey 2015.” Jordan: Queen Rania Foundation.
nursery care remains geographically inaccessible.
The cost of nurseries is also a key factor in whether
families can take advantage of this important care
service. The mean monthly cost of childcare in
Jordan is equivalent to 88 per cent of the median
monthly wage for women, and over 100 per cent
of the median monthly wage for women with a
secondary degree or less.344 Without subsidization
of nurseries, the costs of childcare thus offset
income gains through women’s work, further
disincentivizing women’s employment.
There is also a need for further professional
development of nursery caregivers. The MoSD
standard is that they should hold either a two–
year post–secondary diploma in an ECCE–related
field, or secondary–level education with two
years of experience. Yet an estimated 38 per
cent of caregivers do not meet these standards.
Furthermore, the majority of caregivers had not
specialized in ECCE–related fields at a post–
secondary level, which is likely to negatively
affect the quality of service. The Jordanian
education system discourages high–performing
students from selecting ECCE as a career, such

CARE ECONOMY AND PROMOTING GENDER EQUALITY
122
that nursery caregiving may become a chosen
profession due to lack of other options.345 Although
there are Bachelors degree programmes in
ECCE, there is only one private university that
offers post–graduate training in ECCE. Between
70–90 per cent of caregivers at different types of
nurseries reported not receiving any professional
development opportunities in the previous two
years, and more than 60 per cent reported not
receiving any pre–service training. Other quality
issues include that there is no national curriculum
for nurseries, or KG1.346
Elder care
The increasing demand for elder care projected
in Jordan is particularly important since a large
proportion of the elderly report being financially
independent, although they are no longer
working.347 This independence is related to the
increasing nuclearization of households in Jordan,
meaning that the elderly are more likely to live on
their own or with elderly spouses, rather than in
intergenerational households.348 The prevalence
of disability among the elderly is 2.8 per cent, and
approximately 86 per cent of the elderly suffer
from chronic disease, most of which are non–
communicable diseases.349 Almost half of the elderly
are covered by some type of health insurance, with
military insurance being the most common, but the
remaining half lack health insurance.350 There is
thus a substantial need for care among the elderly
population, as well as a lack of financial protection
against health complications for many. The
scarcity of research and data on elderly–related
issues – such as income, poverty, employment and
education – also undermines efforts to develop
policies that meet their needs.351
In 2008, Jordan began addressing these issues
when it launched the National Strategy for Senior
Citizens, which was the first of its kind to address
their needs in–depth and to tackle the formulation
of national policies to improve the lives of senior
citizens.352 The strategy promotes interventions to
improve quality of life and reduce dependence
among senior citizens, provide appropriate medical
and social services and raise awareness about
issues related to the elderly population.353
In addition, a key national policy priority in Jordan
has been reform of the retirement system.354 A
2010 special legislation on retirement, further
amended in 2014, sought to reduce the incidence of
early retirement and increase participation in the
pension system. The reform increased the required
number of years of pension contributions, modified
accrual rates, and raised the early retirement
age. Importantly, the reforms also implemented
unemployment and maternity insurance, discussed
further below, and extended voluntary coverage of
the social insurance system to the self–employed
and housewives.355 The Government has also taken
the initiative to create a senior citizens’ fund. It is
crucial to set up a national plan for social security
and pensions, as many seniors are receiving
pensions below the poverty line and there are
even more with no retirement pensions.356 As of
2016, social insurance coverage rates were 59 per
cent among male workers and 78 per cent among
female workers.357 Thus, there are a substantial
number of workers who are uncovered by the
pension system, in addition to the fact that the large
majority of Jordanian women do not work and thus
will not have a contributory pension. Whereas 38.3
per cent of men aged 65+ received a contributory
pension in 2016, only 20.1 per cent of elderly women
did.358
Steps have also been taken to improve health
services for the elderly. Senior health care in Jordan
is governed by the Ministry of Health (MoH), under
Public Health Law No. (47) of 2008, which requires
the MoH to organize elderly health–related
activities and monitor centres and their associated
entities.359 In 2007, senior citizens were included in
the civil health insurance programme.360 In 2017,
the Prime Minister exempted all seniors (70+) from
CHAPTER 3 – THE CARE ECONOMY IN JORDAN
123
annual health insurance fees.361 The following year,
health coverage and government–subsidized
medication were extended to people aged 60–69
who were without pension benefits or insurance
and attending public hospitals.
National strategies also seek to expand and
improve residential and nursing care services for
the elderly.362 Regulations regarding the licensing
and supervision of elderly nursing homes and
daytime elderly clubs (by MoSD), were updated in
2014.363 The national Jordan 2025 document aims
to strengthen existing elderly nursing homes based
on international best practices, and in 2016 an
in–house health–care accreditation system was
established for institutions.364
Jordan’s nursing homes, nevertheless, are scarce
and concentrated in Amman. As of 2008, there
were 11 across the country for both sexes, six
of which were run by the voluntary sector and
five by the private sector, serving a total of 282
elderly persons.365 MoSD pays for some of the
centres run by the voluntary sector to care for
underprivileged elderly.366 In 2016, there were only
10 establishments, none of which were public.
However, the Government supports this service by
devoting monthly payments (JOD 260, or USD 367)
to support poor elderly residents of nursing homes.367
There is very little information available on
caregiving arrangements for the elderly in Jordan,
whether inside or outside of institutional settings.
One study in Amman found that the vast majority
(86 per cent) of caregivers for elderly relatives were
women, primarily daughters or spouses, but also
sisters or daughters–in–law, of the person receiving
care.368 The role of women in providing elder care
for family members in Jordan is thus an area where
further research is needed.
Home health–care services are operated by
the private sector, and there are about 51
institutions registered and licensed by MoH.
There is a shortage of specialized home–care
service–providers and the high cost of these
services, coupled with the fact that they are
typically not covered by insurance, puts them out
of reach for many.369 Furthermore, these services
are not monitored, and quality standards are not in
place.370
Paid leaves
Jordanian Labour Law No. (8) of 1996 is the major
legislation governing the employment relationship,
amended by Law No. (14) of 2019. Labour laws in
Jordan provide for a variety of leaves, including
maternity and paternity leave. However, it is worth
noting that, as of 2016, 17 per cent of Jordanian
workers were employed in the informal sector and
an additional 14 per cent were self–employed.371
These workers may not benefit from social security
and labour law regulations. Among non–Jordanians
working in Jordan, 68 per cent were employed
in the informal sector,372 making this a group
particularly vulnerable to the lack of paid leave
and social insurance. Whether workers benefit
from such regulations also depends partly on
government enforcement.
Maternity leave in Jordan is 10 weeks with full pay
in the private sector and 90 days in the public
sector. Of this period, a minimum of six weeks
should be post–partum while the other weeks could
be allocated to maternal rest pre–birth. After the
end of her maternity leave, a mother is allowed
a maximum of one hour off, or two half–hour
breaks per day for the next year, for nursing her
newborn. If a working mother is employed by an
establishment with more than 10 employees, she
is entitled to one–year of unpaid leave to care for
her children.373 However, whether women benefit
from these paid leaves is again a question of
adherence to the labour law. Among women who
were employed in the private sector during their
first pregnancy, 33 per cent did not take any paid
maternity leave, whereas 35 per cent reported
taking less than six weeks.374

CARE ECONOMY AND PROMOTING GENDER EQUALITY
124
As part of its social security reform in 2010, Jordan
changed the structure of maternity benefit
financing from an employer–liability system, in
which the cost of maternity leave falls entirely or
primarily on the employer, to a social–insurance
system.375 Women on maternity leave receive their
benefits at 100 per cent of their salary for the
mandated 10 weeks. Employers contribute 0.75
per cent of their total payroll (for both men and
women employees) to the social security system
for maternity insurance; with any deficit covered
by the Government.376 By shifting the financing of
maternity leave to an all–employee–based, rather
than female–employee–based system, the reform
aimed to reduce financial disincentives to hiring
women.377 In addition to increasing compliance to
maternity leave law, the reform aimed to increase
FLFP rates.378
As a new initiative, the 2019 Amended Law also
gives new fathers three days of leave from work
with full pay after the birth of a child. Previously,
Jordan had no paternity leave provisions.
Monitoring of adherence and uptake of the new
paternity law will be essential to assess whether it
increases men’s involvement in unpaid care work.
However, due to a shortage in labour and social
security inspectors, Jordan is characterized by weak
enforcement of social security and labour laws in
general.379
box 3.1: daTa and meThods
Time–use surveys are the preferred data source for analysing the amount and distribution of unpaid care work in a society. They are thus an important tool for recognizing and valuing unpaid care. However, no time–use survey has been conducted in Jordan to date. This chapter therefore relies on the Jordan Labour Market Panel Surveys (JLMPS) 2016, conducted by the Economic Research Forum in collaboration with Jordan’s Department of Statistics (DoS).423 The JLMPS do not follow standard time–use methodology. Rather, the surveys ask respondents how many hours they spent in the past week on indirect and direct care activities. How the report categorizes the JLMPS data is further detailed in the Methodological Appendix.
The analysis of unpaid care focuses on the Jordanian working–age population (aged 15–64) and does not include non–Jordanians because this population changed substantially over recent years due to the arrival of a large Syrian refugee population. Most of the analyses are presented as the hours per week that men and women spend on unpaid care work. Since marital status is a key determinant of women’s overall time spent in care work, all of these analyses are disaggregated by marital status. Due to the very small amount of time that men spend in unpaid care work in Jordan, only results for women are presented for some analyses.
The analysis of the paid care economy relies primarily on Jordan’s Employment and Unemployment Surveys (EUS), conducted by DoS, for 2005–2018.424 The EUS are carried out four times annually and collect data on different aspects of the labour market in Jordan. Using this data, this chapter analyses the characteristics of paid care workers as well as of establishments (workplaces) in paid care sectors. To assess change and growth in the paid care economy, the analysis is divided into three periods: 2005–2009, 2010–2014 and 2015–2018. An important limitation of the EUS is that it is not representative of non–Jordanian workers, who comprise the majority of Jordan’s domestic workers. The analysis therefore excludes the domestic work subsector of the paid care economy. For further details on the EUS, see the Methodological Appendix.
To analyse employment growth in care and non–care sectors, the chapter relies on data from the DoS Employment and Compensations of Employees Survey (ECES) database. The ECES is designed to survey economic establishments in the private and public sectors. It collects data from all large establishments, whether private or public, and from a representative sample of smaller establishments. The ECES therefore provides annual aggregate numbers of workers across all economic activities.

CHAPTER 3 – THE CARE ECONOMY IN JORDAN
125
The country has a small number of labour
inspectors (214 as of 2018) compared to the
number of registered establishments.380 This is
coupled with insufficient financial and other
resources for inspection, as well as insufficient
training opportunities and technology, which
constrain inspectors’ ability to enforce the law.381 Of
additional importance to the care economy is that
the domestic work sector in particular suffers from
lack of proper labour inspection.382
3.3 Unpaid care work
Women do the vast majority of care work in Jordan
Analysis of the 2016 JLMPS reveals that the
overwhelming responsibility for unpaid care work
in Jordan lies with women, and particularly married
women. Whereas women spent on average 19
hours on unpaid care work per week in 2016, men
spent only 1 hour per week (Figure 3.3). Women
spent the majority of their unpaid care time on
indirect care work, at nearly 15 hours per week on
average as compared to about 4 hours spent on
unpaid direct care work.
Marital status strongly affects the number of hours
in unpaid care work for women. In 2016, married
women spent 27 hours per week on unpaid care
work while unmarried women spent only 7 hours.
Involvement in both direct and indirect care work
increases for married women. For direct care
work, this is due to childcare. Both married and
unmarried women spent an average of only 0.1
hours per week on elder care in 2016, whereas
unmarried women spent an average of 0.3 hours
on childcare – likely for younger siblings – and
married women spent 6 hours. By contrast,
marriage was not a strong determinant of time
spent in care work among men. Men’s time in direct
care work, whether for children or the elderly, was
minimal in both periods.
The degree to which the male breadwinner–female
caregiver model prevails in Jordan is reflected in
time spent on paid and unpaid work by gender.
Women in Jordan spend little time in paid work – 4
hours on average – with unmarried women doing
slightly more compared to married women.
These numbers average over all women and
therefore are strongly affected by the fact that
most women in Jordan do not perform paid work.
figure 3.3: weekly hours of paid and unpaid (direcT and indirecT) work among jordanians aged 15–64, 2016
Source: Authors’ calculations based on the JLMPS 2016.
4.2 4.0 4.1
14.5
30.7
23.2
0.6
6.6
4.1
0.1
0.3
0.2
6.7
20.1
14.70.3
1.4
0.9
11
31
23
15
32
24
0
5
10
15
20
25
30
35
Unmarried Married Total Unmarried Married Total
Women Men
Weekl
y H
ours
(re
f. p
eriod 7
days
)
Paid work Direct care work Indirect care work

CARE ECONOMY AND PROMOTING GENDER EQUALITY
126
By contrast, married men spent an average of
about 30 hours per week on paid work, whereas
unmarried men spent 15.
Women’s time spent on care work does not decrease if they are employed
In 2016, employed Jordanian women were engaged
in approximately the same number of unpaid care
work hours as non–employed women (20 hours
and 19 hours, respectively; Figure 3.4). In addition
to the hours spent on unpaid care work, employed
women did an average of 37 hours of paid work
per week. Employed women thus spent an average
of 57 hours per week on paid and unpaid work
combined, considerably more than men, who spent
on average 44 hours per week in work, the vast
majority of which was paid.
Due to the association of marriage with increased
care responsibilities for women, employed married
women thus spent the greatest total time in work,
at 65 hours per week, compared to unmarried
employed women (45 hours per week) and married
employed men (44 hours per week). Unmarried,
non–employed women spent the least amount of
time in overall work (7 hours) among women, and
men who were not employed spent almost no time
in any form of work, regardless of marital status.
The strong gendered division of care labour is
likely to be exacerbated when additional demands
are placed on women’s unpaid care time, such as
by the ongoing COVID–19 pandemic. Estimations
based on the JLMPS suggest that married women
with children may spend 18 to 24 additional hours
on unpaid care work during the pandemic, due
to the combination of school closures, additional
care needs of elderly or ill household members,
and closures of services that can substitute indirect
care work (e.g. food–delivery services). For men,
by contrast, the estimated increases in unpaid care
time range from only 1–3 hours per week.383
figure 3.4: weekly hours of paid and unpaid work by mariTal and employmenT sTaTus and by sex, jordanians aged 15–64, 2016
Source: Authors’ calculations based on the JLMPS 2016.
38 37 3743 42 42
1
0
7
7
4
4
0
0
0
0
0
0
7
6
20
22
15
16
0
0
2
1
1
1
7
45
26
65
19
57
0
43
2
44
1
44
0
10
20
30
40
50
60
70
Non-employed Employed Non-employed Employed Non-employed Employed Non-employed Employed Non-employed Employed Non-employed Employed
Unmarried Married Total Unmarried Married Total
Women Men
Weekly
Hours
(re
f. p
eriod 7
days)
Paid work Direct care work Indirect care work Total work

CHAPTER 3 – THE CARE ECONOMY IN JORDAN
127
Variation in women’s time spent in care work
Although women spend much more time in
care work than men in Jordan, women are not a
homogenous group and their time spent may be
affected by the composition of their households,
as well as characteristics such as education or
wealth. This section examines how participation in
unpaid direct and indirect care work varies with
the characteristics of women and their households,
focusing on the most recent data from 2016. Due to
the minimal participation of Jordanian men in care
work, this section presents results for women only.
Women’s time spent in unpaid care work varied
little by urban versus rural residence but was higher
in northern and southern regions as opposed to the
middle region (Figure 3.6). Access to basic services
such as improved water and sanitation is nearly
universal throughout Jordan,384 which may partly
explain the lack of urban versus rural variation in
time spent in indirect care work.
The gap in women’s and men’s time spent on
different forms of work can also be expressed in
terms of percentage of total time (hours) in a week
(Figure 3.5). Married women spent 16 per cent of
their total time in care work, compared to 4 per
cent among unmarried women and less than 1 per
cent among men. Across gender and marital status,
employed Jordanians spent between 23 and 27 per
cent of their total time in paid work. For married
women who were employed, the combination of
unpaid care work and paid work thus constituted
39 per cent of their total time. The considerable
amount of time that married, employed women
spent in work overall has negative implications for
time poverty, including women’s ability to engage
in leisure and self–care activities. The lack of
redistribution of unpaid care work when married
women engage in paid work is also an important
disincentive for labour force participation, which
substantially increases women’s overall time spent
working.
figure 3.5: percenTage of Time spenT on differenT Types of work per week, by mariTal sTaTus and sex, jordanians aged 15–64, 2016
Source: Authors’ calculations based on the JLMPS 2016. The percentage of time is calculated out of a total 168 hours in a week
and is thus not limited to waking hours.
0
43
0 0 0
4
12
9
0 1 1
4
16
11
0 1 13 2 2
9
18
14
2423 23
27 26 26
0
5
10
15
20
25
30
35
40
Unmarried Married Total Unmarried Married Total
Women Men
2016
Perc
enta
ge o
f to
tal w
eekl
y tim
e
Direct care work Indirect care work Total unpaid care work Paid work Paid work (for only workers)

CARE ECONOMY AND PROMOTING GENDER EQUALITY
128
with higher education also spent more time on
direct care work (5 hours per week) and women
with no education the least (3 hours per week), but
women with below–secondary education spent
somewhat more time on direct care work than
those with secondary education. These overall
patterns were driven primarily by the greater time
spent on unpaid care work among more educated
married women. Among unmarried women, time
spent on unpaid care work was low across all
educational categories and unmarried women with
the least education spent the most time on indirect
care work (8 hours per week).
The greatest difference in women’s time spent on
unpaid care work, however, is seen in the small
percentage of households (around 1.3 per cent) that
report hiring domestic help. In these households,
married women performed on average 0.3
hours per week of direct care work and 3 hours
of indirect care work, as compared to women
without domestic help who performed 7 and 21
hours, respectively. Among unmarried women,
the presence of domestic help reduced their
contribution to care work to nearly zero.
There may also be other differences in the
composition of households in Jordan’s regions,
including size and wealth, that affect time in unpaid
care work; for example, rural households tend to
be larger, which may allow women to distribute
unpaid care work between family members.
Among married women, time spent on care work
peaked in the 25–39 age group, at 31 hours per
week. Married women in the 15–24 and 25–39 age
groups, who are more likely to have small children
living at home with them, spent the greatest
amount of time on direct care work, at 11 and 10
hours per week, respectively. Unmarried women in
these age groups spent considerably less time on
care work, but unmarried women aged 25–39 and
40–54 spent more time on paid work, which likely
reflects a greater propensity of unmarried women
of these ages to participate in the labour market.
Older women, aged 55–64, spent the most time on
indirect care, regardless of marital status.
Consistent with previous literature,385 women with
university education and above were much more
likely to engage in paid work (Figure 3.7). Women
figure 3.6: hours of paid and unpaid (direcT and indirecT) work by age, region and localiTy, jordanian women aged 15–64, 2016
Source: Authors’ calculations based on the JLMPS 2016.
2
7
5
1
4
4
5
4
4
3
7
3
1
3
6
4
4
4
8
18
20
13
12
19
18
14
15
0 5 10 15 20 25 30 35
15-24
25-39
40-54
55-64
Middle
North
South
Rural
Urban
Age g
roup
Regio
nLoca
lity
Tota
l w
om
en
Hours per weekPaid work Direct care work Indirect care work

CHAPTER 3 – THE CARE ECONOMY IN JORDAN
129
The effect of children, elderly and disabled household members on women’s time in unpaid care
To further examine how household structure and
women’s education affect their time use, this
section analyses Jordanian women’s time spent on
In the absence of substantial contributions towards
care work among men, the main way in which
families achieve reallocation of care work within
the household therefore appears to be by hiring
a domestic worker who takes over most of these
tasks. Yet that option is only available to households
with sufficient resources.
figure 3.7: hours of paid and unpaid (direcT and indirecT) work, by educaTion
and mariTal sTaTus, jordanian women 15–64, 2016
Source: Authors’ calculations based on the JLMPS 2016.
1
1
4
13
1
1
4
13
2
2
4
13
3
5
4
5
5
8
6
8
1
1
1
0
14
15
15
15
17
22
22
20
8
7
6
7
18
21
23
33
23
31
32
40
10
9
11
20
0 5 10 15 20 25 30 35 40 45
No schooling
Below secondary
Secondary
University and above
No schooling
Below secondary
Secondary
University and above
No schooling
Below secondary
Secondary
University and above
Tota
l w
om
en
Marr
ied w
om
en
Unm
arr
ied
wom
en
Paid work Direct care work Indirect care work Total work
figure 3.8: hours of paid and unpaid (direcT and indirecT) work, by household hiring of domesTic help and by mariTal sTaTus, jordanian women 15–64, 2016
Source: Authors’ calculations based on the JLMPS 2016.
4
6
4
7
4
6
4
0
7
0
1
0
15
2
20
3
7
0
23
9
31
10
12
6
0 5 10 15 20 25 30 35 40 45
No
Yes
No
Yes
No
Yes
Tota
lw
om
en
Marr
ied
wom
en
Unm
arr
ied
wom
en
Paid work Direct care work Indirect care work
Source: Authors’ calculations based on the JLMPS 2016.

CARE ECONOMY AND PROMOTING GENDER EQUALITY
130
having a child under 3 in the household increased
married women’s time in unpaid care work by 5.2
hours per week. Thus, while a married woman
with no children under 3 spent on average 25.1
hours per week on unpaid care, a married women
with the same characteristics but one child under
3 spent 30.3 hours. The analysis does not suggest
that women with more education invested more
time in care work for small children. The additional
time spent on care work among unmarried women
living in households with a child under age 3 varied
considerably by education, but overall was an
additional 3.6 hours per week (results not shown).
The effect of having a child aged 3–5 or 6–17 on
women’s time use was not statistically significant,
holding other factors constant, whether for married
or unmarried women. This may be because the 3–5
age group starts to overlap with the recommended
ages for KG1 and particularly KG2, when ECCE
enrolment increases substantially among Jordanian
children. Having children in ECCE likely lowers
the time spent on unpaid care work among both
mothers and potentially older siblings.
care work based on the presence of children in their
households. The results are based on the marginal
effects analysis described in Chapter 1 and the
Methodological Appendix. Holding all other factors
constant, including women’s household wealth,
household size, region and age, the analyses show
the average effect on women’s time in unpaid care
work of having one child aged 0–3, 3–5, and 6–17
in the household. The analysis is disaggregated
by marital status, since the effects likely differ for
married women, who tend to perform the bulk of
childcare, and unmarried women, who may spend
time caring for younger siblings. The analysis is
also disaggregated by women’s education to
further explore why women with higher educational
attainment appear to spend more time on care
work. If this is because more educated women tend
to invest greater time in childcare and education,
having children should more greatly impact their
time.
The largest and most consistent effect on women’s
time spent in care work results from having a child
under age 3 in the household (Figure 3.9). Overall,
figure 3.9: predicTed addiTional weekly hours of unpaid care work wiTh a child under 3 in The household, married jordanian women aged 15–64, 2016
Source: Authors’ calculations based on the JLMPS 2016.
Note: The grey bars indicate 95 per cent confidence intervals on the estimates of additional time.
20.9
27.626.7 26.7
25.1
5.46.2
3.7
5.6
5.2
0
5
10
15
20
25
30
No schooling Below secondary Secondary University and above Total
Weekl
y hours
of
unpaid
work
Predicted average hours with no children under 3 Predicted additional hours with a child under age 3
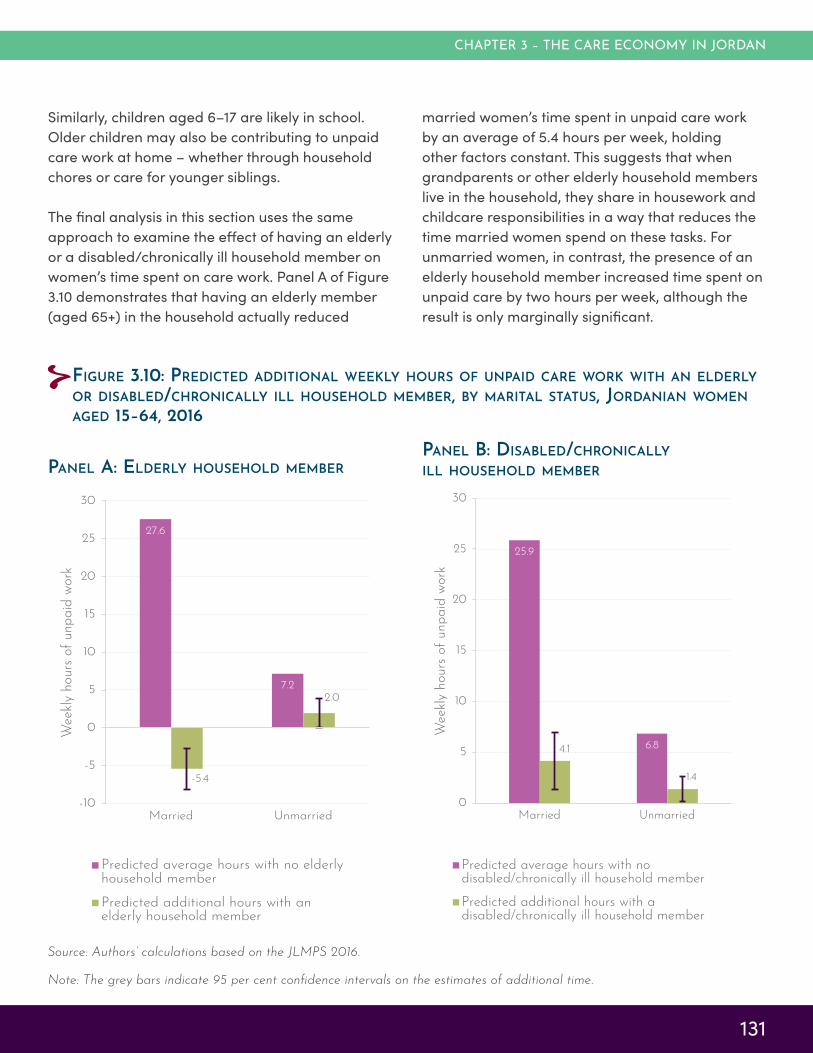
CHAPTER 3 – THE CARE ECONOMY IN JORDAN
131
married women’s time spent in unpaid care work
by an average of 5.4 hours per week, holding
other factors constant. This suggests that when
grandparents or other elderly household members
live in the household, they share in housework and
childcare responsibilities in a way that reduces the
time married women spend on these tasks. For
unmarried women, in contrast, the presence of an
elderly household member increased time spent on
unpaid care by two hours per week, although the
result is only marginally significant.
Similarly, children aged 6–17 are likely in school.
Older children may also be contributing to unpaid
care work at home – whether through household
chores or care for younger siblings.
The final analysis in this section uses the same
approach to examine the effect of having an elderly
or a disabled/chronically ill household member on
women’s time spent on care work. Panel A of Figure
3.10 demonstrates that having an elderly member
(aged 65+) in the household actually reduced
figure 3.10: predicTed addiTional weekly hours of unpaid care work wiTh an elderly or disabled/chronically ill household member, by mariTal sTaTus, jordanian women aged 15–64, 2016
Source: Authors’ calculations based on the JLMPS 2016.
Note: The grey bars indicate 95 per cent confidence intervals on the estimates of additional time.
panel a: elderly household member
panel b: disabled/chronically ill household member
25.9
6.84.1
1.4
0
5
10
15
20
25
30
Married Unmarried
Weekl
y hours
of
unpaid
work
Predicted average hours with nodisabled/chronically ill household member
Predicted additional hours with adisabled/chronically ill household member
27.6
7.2
-5.4
2.0
-10
-5
0
5
10
15
20
25
30
Married Unmarried
Wee
kly
hours
of
unpaid
work
Predicted average hours with no elderlyhousehold member
Predicted additional hours with anelderly household member

CARE ECONOMY AND PROMOTING GENDER EQUALITY
132
care sector hovered around 18 per cent of total
employment between 2005 and 2018, excluding
domestic workers (Figure 3.11). This share is high
relative to the average in other countries in the
region. The International Labour Organization
(ILO) reports that the total contribution of the care
sector to employment is 16.5 per cent in the Arab
States, including domestic workers.386 The share
of employment in care sectors was also higher
in Jordan than in Egypt, Tunisia or Palestine. The
prominent role for the care sector in Jordan is
due to the fact that the country has a large public
sector, which is comprised mainly of education
and health services in a service–based economy.
Although decreasing slightly over time, care
activities’ share of total public sector employment
exceeded 27 per cent.387
Among care sectors, at the national level, education
represented almost 13 per cent of total employment,
whereas health and social care sectors represented
around 5 per cent together. Overall, the size of
the care workforce in education, health and social
care – across private and public establishments
– amounted to 292,310 workers in 2017.388 Care
sectors’ share in private sector employment was
considerably smaller but grew steadily between
2005–2018, particularly in private education.
In these cases, younger female household members
may spend more time caring for elderly relatives.
For both married and unmarried women, the
presence of a chronically ill or disabled household
member increased the average time spent on
care work per week. For married women, the
added effect was 4.1 hours per week, and for
unmarried women, 1.4 hours per week. This finding
is particularly important as the burden of chronic,
non–communicable diseases in Jordan is high and
likely to increase with population aging.
3.4 The paid care sector
Affordable, quality paid care services are a critical
measure to redistribute the responsibility for
unpaid care work, which overwhelmingly rests on
women in Jordan. This section analyses the size and
characteristics of the paid care economy in Jordan,
focusing on the education, health and social work
sectors.
The size of the paid care sector
The care economy constitutes a substantial share
of employment in Jordan. Nationally, the paid
figure 3.11: The percenTage of care and non–care secTors in ToTal employmenT, by insTiTuTional secTor, 2005–2018
Source: Authors’ calculations based on the EUS 2005–2018.
92.4
70.582.4
91.1
71.081.9
90.1
72.281.8
4.822.2 12.8 5.8
22.0 13.2 6.720.8 13.2
2.8 7.3 4.9 3.1 7.0 4.9 3.3 7.0 5.0
0
10
20
30
40
50
60
70
80
90
100
Private Public Total Private Public Total Private Public Total
2005-09 2010-14 2015-18
Per
cent
Other non-care sector Education Health and social work

CHAPTER 3 – THE CARE ECONOMY IN JORDAN
133
Thus, the private sector has gradually taken on an
increasing role in providing care services.
Primary school and early childhood educators,
regardless of sector, represent a considerable
share of care occupations, at around 40 per cent in
2015–2018. Educators at other levels of education
similarly constituted nearly 40 per cent of care
employment in the public sector, but less than 20
per cent in the private sector (Figure 3.13). Health–
care workers made up a larger proportion of
private sector care jobs (around 35 per cent) than
of public sector jobs (22–24 per cent).
The evolution of the role of Jordan’s public and
private sectors in care employment, contrasted
with non–care sectors, can be seen in Figure 3.12.
In 2005–2009, public sector care establishments
employed 79.5 and 68.8 per cent of those working
in the education and health and social work
sectors, respectively, compared to 39.2 per cent of
workers in non–care sectors. Still, the role of the
private sector in care services has been increasing
gradually over time. The public sector’s share in
education and in health and social work decreased
by 6.5 and 3.7 percentage points, respectively,
between 2005–2009 and 2015–2018 (Figure 3.12).
figure 3.12: secToral composiTion of jobs by insTiTuTional secTor, 2005–2018
Source: Authors’ calculations based on the EUS 2005–2018.
79.5
68.8
39.2
45.8
76.1
65.6
39.6
45.7
73.0
65.1
41.046.4
20.5 31.2 60.8 54.2 23.9 34.4 60.4 54.3 27.0 34.9 59.0 53.6
0
10
20
30
40
50
60
70
80
90
100
Education Health andsocial work
Other non-caresector
Total Education Health andsocial work
Other non-caresector
Total Education Health andsocial work
Other non-caresector
Total
2005-09 2010-14 2015-18
Per
cent
Public Private
figure 3.13: composiTion of care occupaTions by insTiTuTional secTor, 2015–2018
Source: Authors’ calculations based on the EUS 2015–2018.
34.8 24.3 27.3
5.6
2.13.1
43.2
37.9
39.4
16.4
35.830.3
0
10
20
30
40
50
60
70
80
90
100
2015-18 2015-18 2015-18
Private Public Total
Per
cent
Other educators
Primary school and earlychild educators
Social care workers
Health workers

CARE ECONOMY AND PROMOTING GENDER EQUALITY
134
Social care was by far the smallest of the care
sectors in terms of employment. Out of the 5.6 per
cent share of social–care activities in the private
sector, personal care workers were the majority (4.2
per cent). The remaining 1.4 per cent were childcare
workers. In the public sector, the share of childcare
workers (1.8 per cent) was larger than the share of
personal care workers (0.3 per cent). This may be a
result of the growth in public nurseries.
Care sectors are a major source of employment for women
Care sectors are the primary source of employment
for women in Jordan, which is particularly important
given women’s overall low rate of labour force
participation. Overall, between 2005–2018, the
proportion of care workers in the public care
sector ranged from 20–21 per cent (Figure 3.14). An
additional 9 per cent of workers were either non–
care workers employed in care sectors (about 8 per
cent) or care workers in non–care sectors (about 1
per cent). Yet for women, care work in care sectors
constituted well over half of female employment
in the public sector, and non–care work in care
sectors an additional 15 per cent. The role of care
work in women’s employment in the public sector
declined slightly over time, but by 2015–2018 still
accounted for nearly one in four working women in
the public sector. Among men, by contrast, the care
sector overall accounted for less than 20 per cent of
public sector employment.
The role of care work in women’s employment
in the private sector is perhaps even more
important given the substantial barriers to
women’s participation in private employment
documented throughout the region. In the private
sector, care work in care sectors accounted for an
increasing proportion of female employment over
time, reaching nearly one–third of private sector
employment in 2015–2018, compared to about 5
per cent of male employment in the private sector
(Figure 3.15). There was also some increase in the
percentage of women employed in non–care jobs
in care sectors.
Among the reasons behind the high concentration
of women in care sectors, and the public sector
specifically, is that such occupations are viewed as
socially more appropriate in Jordan.
figure 3.14: disTribuTion of workers in jordan by sex, in care and non–care occupaTions, public secTor, 2005–2018
Source: Authors’ calculations based on the EUS 2005–2018.
11.7 61.6 20.8 11.4 57.4 20.9 10.7 55.9 20.2
7.0
16.0
8.7
6.3
15.1
8.1
5.6
15.2
7.6
80.7
21.5
69.981.5
25.8
70.082.8
27.0
71.1
0
10
20
30
40
50
60
70
80
90
100
Men Women Total Men Women Total Men Women Total
2005-09 2010-14 2015-18
Per
cent
Care workers in care sectors Care workers in non-care sectors Non-care workers in care sectors Non-care workers in non-care sectors

CHAPTER 3 – THE CARE ECONOMY IN JORDAN
135
While the strong role for women in paid care
sectors indicates that the care economy can
be an important source of growth for women’s
employment, the persistence of high gender
occupational segregation may also have some
negative implications for women’s labour force
participation. Women’s concentration in the paid
care sector may indicate that they face challenges
in entering other, potentially better–paid,
occupations. Feminization of the paid care sector
is also associated with this sector’s devaluation
globally.391 The conditions of work in paid care
sectors, explored further below, are thus critically
important for women’s economic opportunities.
Employment growth in paid care sectors
Growth in paid care sectors can be an important
source of employment generation for women, as
well as a driver of economic growth overall. Over
the last two decades, economic growth in Jordan
has fluctuated considerably. After a period of
expansion from 2004–2008, the economy stalled,
particularly after the Arab Spring and the Syrian
conflict in 2011.
figure 3.15: disTribuTion of workers by sex, in care and non–care secTors, privaTe secTor, 2005–2018
Source: Authors’ calculations based on the EUS 2005–2018.
1.9
25.0
4.6 2.2
29.6
5.6 2.0
32.1
6.42.2
9.7
3.12.3
10.4
3.32.3
10.7
3.5
95.5
62.9
91.7 95.2
57.5
90.495.2
54.2
89.2
0
10
20
30
40
50
60
70
80
90
100
Men Women Total Men Women Total Men Women Total
2005-09 2010-14 2015-18
Per
cent
Care workers in care sectors Care workers in non-care sectors Non-care workers in care sectors Non-care workers in non-care sectors
Women and their relatives tend to be deterred
from jobs that involve mixing with men, fieldwork,
working at night and long working hours.389 In
addition, the share of women workers with jobs
requiring vocational education or apprenticeship
is minimal.390 The concentration of women in jobs
that align with socially ascribed gender roles is thus
an important consideration for investment in the
care sector. While such investment can increase
job opportunities for women, it is also important to
address barriers to women’s entry into jobs that are
seen as less socially acceptable, which may include
certain care professions – such as in the health–
care sector – that do not offer preferred conditions
for women’s employment.
There is a particularly high level of feminization of
care work in the social care and ECCE subsectors
(Figure 3.16). For example, in the private sector,
women comprised 90 per cent of social–care
workers and 87 per cent of ECCE workers. Women
also constituted around half of health–care workers
in both the public and private sectors, and about
half of other educators in the public sector. In the
private sector, women constituted over 60 per cent
of educators at other levels.

CARE ECONOMY AND PROMOTING GENDER EQUALITY
136
According to the Central Bank of Jordan, economic
growth declined dramatically, from as high as
8.2 per cent in 2005 to 5.5 per cent in 2009, and
finally to 2.1 per cent in 2017. The average annual
economic growth for the period 2005–2017 stood at
4.4 per cent.392
Against this general picture of sluggish economic
growth, care sectors appear to have outperformed
non–care sectors in job growth – measured
as annual percentage change in the number
of workers from 2005–2017 (Figure 3.17). This
is particularly true for the female workforce.
Employment growth in the health and social
work sector was 2.9 per cent per year during this
period, and 3.2 per cent in education, compared
to 2.2 per cent in non–care sectors. Only women’s
employment in care sectors grew at a rate near
that of overall economic growth, likely due to the
fact that women cluster in such activities.
figure 3.16: proporTion of jordanian workers who are women, by occupaTion and insTiTuTional secTor, 2015–2018
Source: Authors’ calculations based on the EUS 2005–2018.
63
87
48
90
10
47
67
53
52
12
0 10 20 30 40 50 60 70 80 90 100
Oth
ered
ucato
rs
Prim
ary
scho
ol a
ndea
rly
child
hood
educ
ato
rsH
ealth
wor
kers
Soc
ial c
are
wor
kers
Non
-care
occu
pation
s
Per cent
Public Private
figure 3.17: average annual employmenT growTh (percenTage) in care and non–care acTiviTies, jordanian workers, 2005–2017
2.0
3.8
2.9
2.3
3.9
3.2
2.2
3.9
3.1
2.1
2.8
2.2
0.0
0.5
1.0
1.5
2.0
2.5
3.0
3.5
4.0
4.5
Men Women Total
Per
cent
per
annum
Health & social work Education
Total care sectors Non-care sectors
Source: Authors’ calculations based on the ECES database
(2005–2017).

CHAPTER 3 – THE CARE ECONOMY IN JORDAN
137
The demographic shock caused by the Syrian
refugee influx may have contributed to this trend,
as it fuelled increased demand for schooling and
thus for teachers. This may also be the case for
health–care services. The important role of care
sectors in job growth over the past decade is
confirmed by DoS, which reported the total net
number of jobs created in Jordan in 2017 based
on the Job Creation Survey.393 Education activities
contributed to about 16 percent of total net job
creation. On the other hand, the contribution of
health and social care subsectors stood at almost 8
per cent of new jobs.
Growth in the care sector from 2005–2017 followed
different patterns for the public and private sectors.
First, the public sector contributed relatively more
to employment growth among women than among
men. However, across both public and private
sectors, employment growth in care sectors was
higher for women than it was for men. Private
sector employment growth in care sectors also
outpaced employment growth in non–care sectors,
with the exception of the education sector for
men. These findings again confirm the importance
the care economy in job growth, particularly for
women.
Second, while the public sector drove employment
growth in educational activities, the influence of the
private sector was stronger in creating health and
social care jobs. As the public sector salary ladder
is rigid, the public health sector suffered from staff
drain to the private sector during this period. In
MoH’s Strategic Plan for 2018–2022, this factor was
considered among the main threats facing public
health provision.394 In 2018, MoH reported that of
the 30,336 physicians in Jordan, 80 per cent were
men, whereas the distribution in nursing was less
imbalanced (men accounted for almost 43 per cent
of the 30,625 nurses).395 That men tend to be more
occupationally mobile and are overrepresented
among physicians offers a possible explanation as
to why men’s employment growth in public health
activities was almost nonexistent (0.03 per cent
in Figure 3.18). Men are more likely to get better
job opportunities and wages in the private health
sector, inducing them to leave the public sector.
Private sector employment growth among men in
health and social care services amounted to 4.1 per
cent. Bearing in mind that the labour market offers
limited opportunities and less mobility to women,
growth in employment generated by health
activities for women did not vary much between the
public and private sectors.
figure 3.18: average annual employmenT growTh (percenTage) in care and non–care acTiviTies by insTiTuTional secTor, jordanian workers, 2005–2017
Source: Authors’ calculations based on the ECES database 2005–2017.
4.13.8
3.9
0.0
3.7
1.9
1.4
3.7
2.9
2.5
4.0
3.3
2.12.3
2.11.8
4.3
2.2
0.0
0.5
1.0
1.5
2.0
2.5
3.0
3.5
4.0
4.5
Men Women Total Men Women Total
Private Public
Perc
enta
ge p
oin
t
Health and social work Education Non-care sectors

CARE ECONOMY AND PROMOTING GENDER EQUALITY
138
The quality of care jobs
Growth in the care economy alone is not sufficient
to improve either women’s overall economic
position or to redistribute care work from the
household to the public sphere. The quality of
jobs in the care sector has huge implications for
women’s well–being, given their overrepresentation
in this sector, as well as for the quality of care
services and families’ willingness to use them.396
Quality, decent employment includes factors
such as social insurance coverage, hours of
work, commuting time, occupational safety, work
schedules, rest periods, wages and the overall
workplace environment. Gender equality lies at
the heart of job quality, as women globally are less
likely to have jobs and access to decent work.397
Generally speaking, working conditions are of
concern in Jordan. One in two workers who lost or
left their job in 2018 reported work conditions as
the reason (Table 3.2). Among women, about 40
per cent identified work conditions as the reason
for leaving, which may reflect women’s limited
opportunities for other employment and their
concentration in the public sector. Marriage was
also a reason for leaving work among women
Table 3.2: disTribuTion of Those who lefT Their work, by reason and gender, 2018
Reasons for leaving work Men Women Total
Economic 6.8 3.1 6.1
Incentives 6.9 8.4 7.2
Working conditions 52.4 40.3 50.0
Social 0.7 1.7 0.9Personal 5.6 13.4 7.1
Marriage 0.0 3.3 0.7
Retirement 12.6 14.7 13.0
Health 6.7 5.3 6.4Others 8.4 9.9 8.7
Total jobs left 57 258 14 003 71 261
Source: Author’s calculations based on DoS. 2018a. “Distribution of Those Who Left Their Work by Reason and Gender 2018
[in Arabic].”
(3.3 per cent), although not among men, which
further illustrates the role of care responsibilities in
dampening women’s employment.
The remainder of this section uses the EUS data
to elaborate further on two dimensions of job
quality among care and non–care workers –
namely, formality and working hours. The EUS of
2017 and 2018 asked respondents whether their
establishments or employers were registered
with the social security system, and whether the
employee had signed a written contract with their
employer.398 A worker is considered ‘formal’ if they
have a written contract and/or a social security
account. Since social security coverage is nearly
universal in the public sector, the analysis considers
only care workers in the private sector.
Compared to non–care occupations, paid care
jobs enjoy higher levels of formality, exceeding 93
per cent in education, regardless of year or gender
(Figure 3.19). In 2017, 83 per cent of women health
workers had formal jobs versus 69 per cent of male
health workers in the same year. The prevalence of
formality among women improved further in 2018,
to around 86 per cent. By contrast, women social–
care workers were considerably less likely to have
formal jobs (67 per cent in 2017).

CHAPTER 3 – THE CARE ECONOMY IN JORDAN
139
imply underutilization of labour resources and
result in lower income, particularly if workers are
involuntarily working fewer hours.
Of those working more than 45 hours/week, care
workers appeared to have shorter hours compared
with their non–care counterparts (Figure 3.20).399
This was particularly true for education, where
workers were concentrated in the 36–hours–per–
week–or–fewer category, which may explain part
of the attraction of this field to women. Among care
occupations, health workers were those most likely
to work longer hours. However, the proportion of
health–care workers working more than 45 hours/
week has declined over time.
Among care workers, those in the social–care
subsector had the least job formality.
Although care workers in Jordan enjoy relatively
high levels of formality, that does not necessarily
guarantee job quality. Hours of work are a key
element of job quality, especially in emotionally
and at times physically intensive work such as
care professions. Longer working hours may
come at the expense of free time and family
responsibilities, including unpaid care work. Jobs
with long working hours may correspondingly
discourage women from participating in the labour
market. On the other hand, low working hours may
figure 3.19: proporTion of privaTe secTor workers who are formal, by gender and occupaTion, 2017
Source: Authors’ calculations based on the EUS 2017.
75
83
67
94 94
47
69
52
9598
50
76
65
95 96
0
10
20
30
40
50
60
70
80
90
100
Non-care occupations Health workers Social care workers Primary school and early childhoodeducators
Other educators
Per
cent
Women Men Total
figure 3.20: disTribuTion of workers in jordan, by weekly working hours and occupaTion, 2015–2018
Source: Authors’ calculations based on the EUS 2015–2018.
20.3 21.5
39.2
67.161.4
54.862.6
54.1
30.335.5
24.915.9
6.7 2.5 3.0
0
10
20
30
40
50
60
70
80
90
100
Non-care occupations Health workers Social care workers Primary school and early childhood educators Other educators
Per
cent
<36 36-48 >48

CARE ECONOMY AND PROMOTING GENDER EQUALITY
140
words, care workers are aging. This may arise from
the difficulties Jordan faces in creating jobs for new
labour–market entrants, in both care and non–care
sectors. The mismatch between the skills required
in the labour market and educational outcomes
results in prolonged structural unemployment,
making the youth unemployment rate in Jordan
among the world’s highest (39.2 per cent).400 The
prevalence of this pattern in care sectors requires
additional analysis, but a possible explanation
is the large share of the public sector in the care
economy, and the inability of the Government
to create new jobs. The limited public sector
jobs in Jordan are distributed through a queue
system, applying date of graduation as a main
determinant of employment. This is of concern
because older graduates queueing long periods
for such opportunities may suffer skill decay. This
may ultimately affect the quality of care services
provided by the public sector.
Education
Jordanians working in health and education jobs
are well–educated overall.
Those working longer hours in non–care sectors,
which are dominated by men, revolved around one
quarter in the period (2015–2018). This is another
impediment to equal sharing of domestic work
between women and men in the household.
Characteristics of care workers
Age structure
The distribution of care and non–care occupations
reflects Jordan’s demographic structure, as youth
and the early–middle–aged (under 40) are the
majority of the population. Around 70 per cent
of employed individuals were under 40 (Figure
3.21). Early childhood educators (63.4 per cent)
and health–care workers (60.2 per cent) were
mostly aged 25–39, whereas social–care workers
and other educators tended to be a bit older. The
same general age patterns held for both men and
women care workers.
The distribution of care workers by age appears
to have shifted over time in favour of older
generations, particularly in education. In other
figure 3.21: disTribuTion of workers in jordan, by age and occupaTion, 2015–2018
Source: Authors’ calculations based on the EUS 2015–2018.
18.7
11.7
10.9
7.0
4.2
47.3
60.2
45.4
63.4
57.1
29.2
22.8
40.2
27.8
34.3
4.8
5.3
3.5
1.9
4.4
0 10 20 30 40 50 60 70 80 90 100
Non-c
are
occ
upations
Health
work
ers
Soci
al ca
rew
ork
ers
Prim
ary
school and
early
child
hood
educa
tors
Oth
er
educa
tors
Per cent
15-24 25-39 40-54 55-64

CHAPTER 3 – THE CARE ECONOMY IN JORDAN
141
possible explanation for this pattern is the limited
female leadership in both sectors. Other evidence
suggests that women are more likely than men
to earn less than the minimum wage in Jordan,
particularly in education occupations.403 Thus, while
women constitute a large share of early childhood
education workers, women workers in private
primary schools and kindergartens do not have
equal and transparent wage policies. For example,
during the COVID–19 pandemic, private schools
and kindergartens were among the main sectors
accused of delaying, and in some cases not paying,
the salaries and compensations of teachers.
Marital status
As demonstrated, marriage increases time spent on
unpaid care work for Jordanian women. This is likely
one of the reasons why research has consistently
found that women in Jordan and across the region
leave the labour market, and particularly private
sector employment, at high rates upon marriage.404
The fact that married women participate in
paid care work at higher rates that other sectors
suggests that it may be more compatible with
their household roles. Compared with non–care
workers, women care workers were more likely to
be married (Figure 3.22). This was particularly true
for women in the education sector. Importantly,
the proportion of married women in health and
social–care sectors was lower than that among
women working in education activities. In the most
recent period, the difference stood at nearly 16
percentage points. These patterns may result from
individual preferences towards marriage among
workers in different sectors, the inability of women
in such sectors to reconcile domestic responsibilities
with work, and negative social beliefs about women
engaging in health careers.
Nearly all health–care workers, primary and
early childhood educators and other educators
had a university degree (99 per cent), compared
to 25.5 per cent of those employed in non–care
occupations in 2015–2018. The educational
attainment of care workers has also improved over
time. An abundance of educated care providers,
if matched with better quality of education, leads
to better care services. On the other hand, only
10.9 per cent of social workers had a university
degree, and 44.9 per cent had a secondary–level
degree. This may be due in part to the older profile
of social–care workers (particularly women), the
hiring practices of employers in the social–care
sector, or the desirability of social–care jobs among
women.
At the aggregate level, the number of graduates
with majors in care fields has grown exponentially
over the last two decades, resulting in increased
unemployment among new graduates. This
problem even extends to graduates with health
specializations. As many nursing departments and
colleges have been established, the number of
trained nurses outnumbers available vacancies in
public and private institutions.401
Although women care workers are as educated as
men, a considerable wage gap exists in the care
economy, a traditionally female–oriented sector.
DoS reports average wages of women and men
workers in various economic sectors covered by
social security. In 2018, men working in health and
social–care professions earned on average JOD
689 compared to 741 among those in education
(USD 972 and 1,045, respectively). Women earned
considerably less: JOD 507 on average in health
and social care and 416 JOD in education (USD
715 and 587, respectively).402 This translated into
around 26 per cent and 44 per cent wage gaps
in the aforementioned sectors, respectively. One

CARE ECONOMY AND PROMOTING GENDER EQUALITY
142
figure 3.22: disTribuTion of women workers in jordan, by mariTal sTaTus and occupaTion, 2015–2018
Source: Authors’ calculations based on the EUS 2015–2018.
47.256.9 57.1
72.6 73.0
52.843.1 42.9
27.4 27.0
0
10
20
30
40
50
60
70
80
90
100
Non-care occupations Health workers Social care workers Primary school and early childhoodeducators
Other educators
Per
cent
Currently Married Unmarried
3.5 Towards policy interventions to recognize and redistribute unpaid care work
Key findings
Unpaid care
Women in Jordan, and particularly married women,
bear nearly all of the responsibility for unpaid care
work, including both direct care for children and
the elderly and indirect care for the household.
Meanwhile, men make almost no contribution to
unpaid care work. Women’s time in unpaid care
work does not vary by their employment status,
such that employed women continue to work a
full “double shift”405 of housework after their paid
workday. Employed, married women therefore
spend the greatest total hours in all forms of work,
at 65 hours per week, as opposed to 44 hours
per week among employed, married men. The
responsibility for unpaid care is therefore a strong
disincentive for women to participate in the labour
market, particularly after marriage, contributing to
Jordan’s very low FLFP rate.
In addition to marital status, there are a number
of household–level factors that predict women’s
time spent on unpaid care work and point to
the importance of developing care services to
redistribute some of this responsibility to the public
or private sectors. Having a child aged 0–3 in the
household is one of them; although there is no
such effect for having a child aged 3–5 or 6–17
(which may reflect the expansion of ECCE for
children aged 3–5 and school enrolment for older
children). The presence of an elderly household
member reduced married women’s time on
unpaid care work, which suggests that co–resident
grandparents help with children and housework,
a form of support that is being lost with the
increasing nuclearization of households in Jordan.
Finally, the presence of a disabled or chronically ill
household member increased time in unpaid care
work for both married and unmarried women. With
the aging of Jordan’s population and increasing
prevalence of chronic illness, this will become an
area of increasing concern and need for policy
attention to develop care services for the elderly.
The paid care economy
The paid care sector is a highly significant sector
of the Jordanian economy, constituting over a

CHAPTER 3 – THE CARE ECONOMY IN JORDAN
143
quarter of public sector employment and a small
but growing share of private sector employment
in Jordan. Employment in care sectors, particularly
for women, also grew faster than in other sectors
of the economy between 2005–2017. This growth
reflects the increased demand for care services,
and particularly for education. Policy measures
to expand care services may further stimulate
employment growth.
The expansion of employment in the paid care
sector is of particular importance to women, for
whom it represents nearly 60 per cent of total
employment. This level of feminization is striking,
given the very low FLFP rate among women in
Jordan in general and in the private sector in
particular. The quality of jobs in the paid care
sector is also of particular importance to women
given their overrepresentation in the sector. Care
work may be attractive to women because of its
relatively high levels of formality compared to other
sectors, as well as shorter working hours, especially
in education. However, there is a substantial wage
gap in care sectors, and women are more likely
than men to earn below the minimum wage,
particularly in education.406 This pattern may reflect
overall devaluation of paid care work – particularly
in highly feminized subsectors that are often low–
paid because of their association with women’s
unpaid care work.407 Ensuring fair wages in care
sectors, including the domestic work sector, is
therefore an important priority.
Policy recommendations
Jordan has made considerable care–related
policy efforts in recent years, particularly in
expanding ECCE and reforming paid care leaves.
However, there is little evidence as to whether the
maternity leave reform has increased women’s
labour force participation, which may be linked to
Jordan’s economic situation and persistent gender
inequalities in attitudes towards unpaid care work.
Evaluation of this and other more recent reforms
are greatly needed. For care policies to be effective,
implementation and monitoring mechanisms are
needed, as well as communication strategies to
address the social norms surrounding unpaid care.
Implement programmes and campaigns to address gender roles
Social norms and practices in Jordan contribute
to lower female labour force participation,408 and
to strong imbalances in the division of unpaid
care work. The country needs to adopt serious
efforts to gradually change adherence to gender–
stereotyped roles, by focusing on education
curricula and social development programmes
as well as policies. Research has shown that
Jordanians also tend to overestimate the level
of social disapproval of women’s employment,
relative to their own general support for women
engaging in paid work.409 Campaigns that aim to
provide accurate information about public opinion
regarding women’s employment, as well as those
that address specific barriers to employment – such
as working hours, gender–mixing and the impact of
employment on women’s caregiving roles, may thus
begin shifting attitudes towards more egalitarian
gender roles.410
Conduct a national time–use survey and strengthen other data sources on the care economy
Recognition of the extent of unpaid care, its role
in supporting other areas of social and economic
life, and the value of unpaid care to the economy
requires measurement.411 The best source of data
for a full accounting of unpaid care and particularly
the value of women’s unpaid care work is a time–
use survey. The UN Women Jordan Country Office
and DoS are planning to conduct the country’s first
time–use survey in 2021, which will be an important

CARE ECONOMY AND PROMOTING GENDER EQUALITY
144
source of data on the care economy. Additional
initiatives to strengthen data collection on key care
sectors – including ECCE, social care and domestic
work sectors – should also be undertaken as part
of a national effort to support the policy initiatives
discussed below with additional data should be a
key priority.
Monitor and evaluate reforms to maternity and paternity leave policies and implement supporting programming to address social norms
Although reform of the financing mode for
maternity insurance was a positive step, it is
unclear whether it has had the intended effect of
reducing employers’ disincentives to hire women
and increasing FLFP. A rigorous evaluation of the
reform is needed in order to understand its impacts
on both labour supply (women’s choices) and
demand (employer’s hiring practices). This will help
determine whether amendments are needed and
provide evidence for other countries that might
consider moving to a social–insurance–based
maternity–financing scheme.
The recent adoption of a paternity leave policy
is also very positive and places Jordan among
pioneering countries in the region. Yet evidence
from countries that have implemented paternity
or parental leave policies demonstrates that
their availability does not guarantee that men
will use them.412 Given the persistence of norms
that discourage men’s involvement in childcare,
efforts are needed to normalize the idea of men
taking paternity leave. It is also unclear whether
men will actually invest their paternity leave in
care activities. Its duration, at only three days, is
insufficient to establish a more equal unpaid care
distribution within the household in the long–term.
Nevertheless, communication efforts to promote the
importance of involvement in early childcare, for
both children and their fathers, may help to support
the adoption, and potential future expansion, of
paternity leave.
Enforcement and monitoring similarly needs to
be improved to ensure that new maternity and
paternity leave laws are followed. The Government
and the Social Security Corporation need to
enhance their capabilities by recruiting more
labour inspectors and investing in on–the–job
training.
Continue to expand Early Childhood Care and Education
Expanding quality ECCE services has the
potential to improve early childhood development
outcomes, redistribute some of women’s unpaid
time in childcare, and increase employment
opportunities for women, who dominate this sector.
Correspondingly, the recent policy decision to
make kindergarten mandatory for children aged
5+ should be evaluated for its impact not only on
children but also on women’s time spent on unpaid
care and the FLFP rate.
Efforts are also needed to increase the
participation of younger children in ECCE, as
enrolment rates in nursery are much lower than
in KG. At the same time, a large proportion of
families do not enrol their young children in
nurseries because the mother is a housewife.413
Encouraging ECCE enrolment therefore requires
a combined approach to improve the supply,
quality and affordability of nurseries, while also
testing innovative ways to encourage households
to use these services. In Kenya, a pilot intervention
that provided women with vouchers to pay for
early childcare successfully increased women’s
employment rates.414 Yet evidence also shows that
the structure of ECCE is important; short pre–
primary school days may conflict with mothers’
working schedules.415
CHAPTER 3 – THE CARE ECONOMY IN JORDAN
145
workers, are the most vulnerable private sector
care workers, with lower levels of education and job
formality than other care sectors.
Invest in the care economy more broadly as a potential source of economic growth
Policies to encourage a more equal division of
unpaid work, coupled with enhanced market–
based care services, may broaden women’s labour
market opportunities. These could be catalysts to
improve labour market opportunities for women,
if the country invests more in decent employment
in the care sector. Investment in the care economy
may also serve as an overall driver of economic
growth, by increasing demand in other, non–care
sectors (e.g. construction and materials for new
facilities). The Jordanian economy as a whole
requires higher economic growth and job creation
in order to absorb the number of people entering
the labour market every year. The unemployment
rate, which has been in the double–digits since
1990, reached 18.6 per cent in 2018.421 But the
rate was twice as high among youth, and a
considerable share of youth (28.7 per cent in 2015)
are not in education, employment or training.422
This analysis demonstrates that the care economy
could absorb some of these labour–market
entrants, particularly if investments in the sector
are made in combination with efforts to encourage
young people to be trained in and enter care
professions. Improved professionalization of care
occupations must be accompanied by measures to
match graduates to labour market opportunities, in
order to improve the qualifications of care workers
and the quality of care services.
The recent policy requiring employers to establish
nurseries for the small children of their employees
is a positive development, particularly in its
formulation based on the number of children of
all female and male employees. Enforcement
and monitoring of the policy are nevertheless
required to determine how employers react to its
implementation and their degree of compliance.
Furthermore, institutional nurseries constitute only
a small percentage of all nurseries416 and even
with an increase in FLFP, will only be available to
a relatively small number of women given their
low labour force participation rates. Expansion of
institutional nurseries is therefore unlikely to be
sufficient to increase ECCE enrolment rates at a
national level. Innovative examples in countries
such as Ecuador, which expanded ECCE coverage
and improved quality through a coordinated
programme with agreements between local
governments and civil society organizations,417
could be a model for expanding nurseries in Jordan.
Regardless of the delivery model, investment in
achieving universal coverage of ECCE is needed.
The reallocation of funds from maternity insurance
revenues away from investment in childcare
services during the COVID–19 pandemic418 is a
setback in this regard and should be restudied.419
Expand elder care
Investment in elder–care services is particularly
important given Jordan’s ageing population and
the impact of having a disabled or chronically ill
household member on women’s time in unpaid
care. As in most countries of the region, elder–care
services are underdeveloped in Jordan. To meet
the diverse needs of a growing elderly population,
investment in both residential and non–residential
elder–care services is needed.420 These investments
should also focus on the quality of elder–care
services, which is closely linked to the quality of
jobs in this sector. Social–care workers, which
include elder–care workers as well as some ECCE
146
CARE ECONOMY AND PROMOTING GENDER EQUALITY
maternity leave and its financing in Jordan
Maternity leave is one of the essential paid leaves promoting the
health of infants and mothers. Sufficient maternity leave can also
reduce dropout rates of working mothers.
International Labour Organization (ILO) Convention No. 183 requires
a minimum duration of maternity leave of 14 weeks and an income
replacement rate of at least two–thirds; however, Jordan’s Labour Law
provides just 70 days (10 weeks) of fully paid maternity leave for the
private sector and 90 days (13 weeks) for the public sector. As for the
financing scheme, the ILO specifies that maternity leave could rely on
a social security system – optimally – or an employer liability system.
Yet, applying an employer liability system often discourages employers
from hiring women to avoid the related costs.
A national dialogue was launched in 2008 to discuss potential
maternity leave reforms aimed at reducing the burden on employers
for the financing of maternity leave. The Jordanian National
Commission for Women (JNCW) led the initiative, in cooperation with
various stakeholders, including the Ministry of Labour (MoL), MoSD,
labour unions and civil society organizations.425
As a result of this process, in 2011, the employer liability system was
transformed into a social security system. A Maternity Insurance Fund
was created, to which employers contributed 0.75 per cent of their
total payroll, regardless of whether they hired women or not, as a
translation of the social solidarity principle. Such a mechanism sought
to mitigate any potential increase in the inequality of opportunities
between men and women in the labour market. All employers are
charged a significantly smaller percentage of their payroll than the
cost of financing 70 days of maternity leave.
Consequences of the policy change
Altering the source of financing for Jordanian maternity leave aimed
to improve the FLFP rate and modify employers’ perceptions of

CHAPTER 3 – THE CARE ECONOMY IN JORDAN
147
women workers as a financial burden.426
Hence, employers could take advantage
of women’s capabilities and experience
without having to incur any additional costs
compared to employing men.
Yet, according to the Secretary General of
the JNCW, Salma Nims, the policy change
in question did not significantly increase
women’s labour force participation.427
She attributed this to the persistence of
stereotypical gender roles that prohibit
women from increasing their time in
paid work due to their unpaid care
responsibilities. She equally blames the
absence of decent work environments,
which often oblige women to face sexual
harassment with no policies in place to
protect them – especially in small and
medium–sized enterprises, which represent
95 per cent of Jordan’s private sector.
Meanwhile, the gender wage gap pushes
many women to leave the labour market.
Nims also suggested that women cannot
keep full–time paid jobs after returning
from maternity leave due to the non–
enforcement of the Nurseries Establishment
Law at many workplaces.
Moreover, she said the unequal duration
of maternity leave between the public and
private sectors discourages many women
from working in the private sector. Nims
said there has been discussion about the
possibility of extending the duration of
maternity leave in the private sector to 90
days (as in the public sector), and it has
been suggested that this could be covered
by the Maternity Insurance Fund, although
there are no concrete plans to this effect.
The aforementioned outcomes have
driven the Jordanian Government, through
the JNCW, to work on a more integrated
framework based on the Women’s
Economic Empowerment Action Plan 2019.
This has entailed launching additional
programmes and policies, including:
• different JNCW campaigns to raise
women’s awareness of their rights in
private sector working environments
while encouraging them to take on
different leading roles.
• collaboration with the World Bank
on additional campaigns to address
stereotypical social norms towards
women and supporting positive gender
relations within the family.
• MoL issued a new law requiring any
company with more than 10 workers to
implement policies to respond to sexual
harassment.
• the Jordanian National Committee
for Pay Equity was formed to reduce
inequalities between men and women in
the labour market in 2011.
• the regulation on childcare in the
workplace was amended in 2019 to
oblige employers to establish a nursery
in the workplace whenever its workers
(male or female) collectively have at
least 15 children under the age of 5.
Hence, it has become a family– rather
than a woman–related service, as it
is no longer based on the number of
employed women.

CHAPTER 3 – THE CARE ECONOMY IN JORDAN
148
older than age 5.429 However, it is not known
whether this measure will be extended
beyond the pandemic and further studies
will be needed to understand its impact.
• paternity leave of three days – instead
of a suggested leave of 10 days – was
introduced in 2019 to highlight the
responsibility and the right of fathers to
care for their newborns.
The Maternity Insurance Fund and COVID–19
In the light of the deteriorated economic
situation due to COVID–19, in March
2020, Defence Order No. 1 declared that
50 per cent of Maternity Insurance Fund
resources would be utilized to finance
in–kind assistance to the most vulnerable
Jordanians (day–wage workers, the elderly,
etc.).428 According to Nims, there has also
been discussion of allowing the Maternity
Insurance Fund to provide vulnerable
women with specific funds to cover the
cost of nursery fees for a limited period in
the absence of nurseries in the workplace.
Temporary assistance for childcare was
introduced on 20 October 2020. Under the
new plan, mothers working in the private
sector who can obtain maternity leave
benefits are allowed to receive an amount
ranging from JOD 25 to 60 monthly (USD
35 to 85) for a maximum of 6 months to
pay for childcare services at home or at
a nursery – with the higher end of these
subsidies directed towards women with
lower earnings who opt for nursery care,
and the lower end for mothers who choose
to care for their children at home. Finally,
these benefits are available for children no

EXPLORATORY ANALYSIS
AND POLICY IMPLICATIONS
4THE CARE ECONOMY
IN PALESTINE
4.1 Overview
4.2 Brief overview of the Palestinian context
4.3 Care policies and services in Palestine
4.4 Unpaid care work in Palestine
4.5 Characteristics of the Palestinian paid care sector
151
151
153
157
167
4.6 Formality and compliance with minimum wage regulation in paid care occupations
172
4.7 Conclusions and policy recommendations 175

4 KEY MESSAGESUnpaid care in Palestine is disproportionately performed by women.
Time spent on unpaid care varies among women by demographic and
socioeconomic characteristics, with marital status as the most influencing factor.
1
Palestine lacks universal access to early childhood care and education
services, particularly for children aged three and younger. This represents a
main obstacle to reducing time–use imbalances, as married and employed women spend substantially more hours in total paid and unpaid work.
2
The paid care sector employs about 15 per cent of total workers and half of
employed women. By gender, over half of paid care workers are women.3Most paid care workers in Palestine are formal. However, the prevalence
of formality, as well as wages, are lower among employed women in the
private sector, reflecting lower–quality care and jobs among private care providers.
4
The Government should enforce the newly ratified education law to make kindergarten (KG) education universal and expand nursery services, both in the private and public sector.
5
In collaboration with stakeholders, the Government should raise awareness
about gender equality to encourage the redistribution of the responsibility
of unpaid care work from women to men.
6
To improve working conditions in the private sector and at the same time
reduce the associated costs, the currently frozen social security scheme
should be renegotiated to pave the way for a widespread approval by
employers and employees. Compliance with the minimum wage law should
also be enhanced.
7

CARE ECONOMY AND PROMOTING GENDER EQUALITY
151
4.1 Overview
Similar to other countries in the Arab States, the
Female Labour Force Participation (FLFP) rate in
the State of Palestine430 is low. FLFP has stalled over
the past decade at around 20 per cent.431 Existing
literature cites weak labour market demand in
Palestine and other countries in the Middle East
and North Africa (MENA) as a main determinant of
low FLFP.432 However, sociocultural factors also likely
contribute to women’s low levels of employment
outside the home. There is widespread support for
attitudes that frame men’s roles as breadwinners,
while women are primarily viewed as caregivers.
Findings from a recent report published by UN
Women documenting the attitudes and perceptions
of individuals from Palestine on gender roles and
gender equality, show that 80 per cent of men and
60 per cent of women agree that women’s most
important role is taking care of the home.433
There is also a highly gendered division of labour
in Palestine. For instance, labour force participation
is much higher for men, at 82 per cent, than for
women. In addition, differences in FLFP between
married and never–married women are substantial
(21 versus 47 per cent, respectively),434 which is in
part related to the role of unpaid care, as more
housekeeping responsibilities are expected from
the former. The link between marital status and
lower female labour force participation is well
documented in countries in the MENA region.435 For
example, commitment to children’s education may
sway women’s decision to take up paid full–time
work.436 Research therefore suggests that the
responsibility for unpaid care is a main barrier for
women to join the labour market in MENA countries.
In this respect, lack of sufficient care services that
could reduce time women spend engaged in care
responsibilities is likely another detrimental factor.
This analysis explores the scope and distribution
of unpaid care work in Palestine, with a focus
on estimating the extent of time allocated to
unpaid care work by gender, employment status,
and by other demographic and socioeconomic
characteristics. It also explores the size and
characteristics of the paid care sector (education,
health and social care services) and examines the
extent to which this sector provides decent jobs, a
necessary condition to ensure that care services
provided are of high quality. The findings of the
analysis set the stage to recommend policies to
reduce and redistribute unpaid care work as well
as to promote decent employment within the
paid care sector. They also help explore policies
supporting the expansion of the paid care economy
to promote women’s economic empowerment
through employment.
To present the broader context for care needs and
provision, the following section presents the main
economic and demographic characteristics of
Palestine. Section three then reviews the current
state of care policies and services. Section four
presents the findings regarding time spent on
unpaid care and explores underlying differences
by region as well as by household and individual–
level characteristics. Section five addresses the
characteristics of the paid care sector and section
six compares working conditions in the care and
non–care sectors. Section seven discusses policy
recommendations stemming from the analysis.
4.2 Brief overview of the Palestinian context: Economic and demographic factors
The economic and demographic situation of
Palestine is shaped by its unique geopolitical
context. According to the World Bank’s ranking,
Palestine belongs to the lower–middle income
countries.437 In 2018, GDP amounted to $16,276
million. Over the past decade, real GDP

CHAPTER 4 – THE CARE ECONOMY IN PALESTINE
152
– measured using 2015 constant prices – grew at
an average annual rate of 5.2 per cent. However,
given Palestine’s high annual population growth
rate – about 2.7 per cent – real GDP per capita has
grown at an annual rate of 0.9 per cent, leveling
at $4,292 in 2018. Unlike any other country in the
world, the performance of the Palestinian economy
has been largely driven by impediments created by
a prolonged Israeli occupation. These include trade
barriers, restrictions of movement, expansion Israeli
settlements, and economic inaccessibility of area
“C”.438
Participation in the labour market in Palestine is
gendered. Labour market outcomes for women
also differ substantially based on educational
attainment, where FLFP for educated women (those
with tertiary education)439 was 67 per cent in 2018
compared to 10 per cent for the less–educated.440
The corresponding unemployment rate was 54
per cent and 44 per cent, respectively. For men, by
contrast, labour market outcomes are not highly
correlated with education and differences in labour
force participation between the educated and
less–educated are not substantial (87 per cent vs.
81 per cent, respectively). The same holds for the
unemployment rate (21 per cent for the educated
versus 27 per cent for the less–educated).
Despite their relatively high LFP rates, the lack of
employment opportunities for educated women
are related to the decrease in employment demand
from the public sector, which has been the main
employer of this group.441 Generally, educated
women prefer to seek employment in this sector
to benefit from shorter working hours and other
work benefits that are not well enforced in the
private sector (see the discussion below), including
paid vacations and maternity leave. Such working
conditions are more aligned with societal and
family values framed for women in Palestine, as in
many other Arab countries.
The weak labour demand from the public sector
is directly linked to the fiscal stress that the
Palestinian Government has encountered over
the past years. Chronically, the Government has
depended on international aid to finance its
budget. In 2010, the contribution of international
aid represented 34 per cent of Government
expenditures, which plummeted to 18 per cent in
2017.442 Also, the Government finances about two–
thirds of the budget from trade (import taxes),
mainly with Israel. The Protocol on Economic
Relations, signed in 1994 by the Israeli Government
and the Palestinian Liberation Organization (PLO),
entails that Israel collects import taxes on behalf
of the Palestinian Authority (PA). This arrangement
has exposed the PA to recurrent pressure from
Israel, often in the form of freezing tax transfers.
The population of Palestine is 4.78 million, with
2.88 million residing in the West Bank (including
east Jerusalem) and 1.9 million in the Gaza Strip.
The Palestinian population has grown, since 2014,
at an annual growth rate of 2.6 per cent; about 0.5
percentage points greater than the rate of the Arab
States. While still high, population growth has been
declining, from about 3 per cent in 2000, while
household size has decreased from an average of
6.4 members in 1997 to 5.1 members in 2017.443
Palestine is a young nation, such that the share
of individuals younger than 30 years old in 2017
was 68 per cent, with a median age of 27. The
total dependency ratio is 74, which is mainly
accounted for by a high child dependency ratio
of 67, versus 7 for the old–age dependency ratio.
Future shifts in age structure will slightly increase
old–age dependency rates while child dependency
will continue to dominate care needs.444 This
dependency pattern helps to explain the time
Palestinians spend on unpaid care, as shown
below, in which little time is allocated to care for the
elderly as opposed to caring for children.445 This is

CARE ECONOMY AND PROMOTING GENDER EQUALITY
153
one indication of the need to expand care services,
such as KGs and nurseries, mainly for young
children. The current dependency ratio for the 0–4
age group stands at 24.
4.3 Care policies and services in Palestine
Early childhood care and education (ECCE)
Palestine’s first national Early Childhood
Development and Intervention Strategy and
Implementation Framework was only adopted
in 2017, for the period from 2017–2022, through
collaboration between the Ministries of Education
(MoE), Health (MoH), and of Social Development
(MoSD), in partnership with regional and
international NGOs and UN agencies. The main
challenges facing ECCE in Palestine include low
enrolment rates and lack of qualified kindergarten
teachers. The national strategy identified these
weaknesses as stemming in part from inadequate
coordination and engagement among the different
agencies and ministries with an interest in early
childhood development (ECD), and the lack
of financial and technical resources allocated
by the State to this sector.446 With the aim of
improving ECCE in Palestine, the ECD strategy
aims to ensure sustainable access and equity to
all children receiving education while upholding
quality services; capacity–building of service–
providers for families with children under age 6;
supporting innovative services for early childhood
development and interventions; and developing
a monitoring and evaluation system for early
childhood development and intervention services.447
Nurseries
Nursery licences are granted by MoSD. In
collaboration with the MoH, Ministry of Public
Works, Ministry of Local Government, Civil Defense
and Governor’s Office in each governorate,
MoSD oversees service–delivery based on the
nurseries’ bylaws of 2011.448 These bylaws set
the physical, environmental, educational and
personnel qualifications for nurseries to legally
operate. Under the law, nurseries in Palestine must
accommodate children aged 0 to 4 years, including
those with disabilities, and have a specified number
of caregivers per child based on age group.
Caregivers need to have at least passed the Tawjihi
exam and have some qualifications in ECCE or a
degree in early childhood education or a similar
field. Continuous training of caregivers on child
education and children with special needs is the
responsibility of MoSD, as per the bylaws.449
The absence of adequate and accurate data
remains among the major challenges facing this
sector.450 Based on the most recent available data,
there were 94 licensed nurseries in 2005. The
number increased to 111 in 2010 and declined to 95
in 2014. The sector also faces quality challenges. In
reality, caregivers in nurseries often do not meet
qualification requirements. Furthermore, some
nurseries, such as home–based nurseries, operate
without a license and do not meet the criteria set by
the bylaws. At a macro level, there is a shortage of
personnel to monitor nurseries, as MoSD lacks the
logistics of transportation and other procedures for
nursery inspection and licensing committees.451
Kindergarten (KG)2
Early childhood care and education in Palestine is
provided by multiple organizations, including the

CHAPTER 4 – THE CARE ECONOMY IN PALESTINE
154
data on the number of KGs and total children
enrolled also show consistent increases since
2014 (Table 4.1).458 Nevertheless, enrolment rates
remain below universal. Parents’ low awareness
of the importance of preschool education and the
absence of free preschools in the non–public sector
contribute to low enrolment rates.459
Elder care
Although Palestine will experience some population
aging over the coming decades, it remains one
of the younger countries in the region, and the
proportion of the population above age 65 is
not projected to exceed 8 per cent by 2050.460
According to the 2017 Census, 15.9 per cent of
households were headed by an elderly person
aged 60 or above (16.8 per cent in the West Bank
private sector, community–based organizations
(CBOs), religious organizations, as well as NGOs
and government agencies.452 KG targets children
aged 4–6. Both the MoE and MoH are responsible
for developing specifications and criteria for KGs
and to grant licences.453 While KGs are mostly
managed by the private sector and NGOs/
CBOs, the MoE’s role is to provide pedagogical
supervision, staff training and development of
relevant curricula.454 A newly ratified law in 2017
stipulated that KG is part of the formal education
system, and parents should enrol their children in
this level of education for a maximum of two years
prior to elementary education.455 For this reason,
the MoE took the initiative to open some KG classes
in public schools.456
Nationally, about 54 per cent of children between
3 and 5 years old are enrolled in KGs.457 Official
Table 4.1: kindergarTen enrolmenTs by region, for scholasTic years 2014–2019
Number of kinder-gartens
Total number of children enrolled
Average number of students per class
Palestine
2014/2015 1,620 135,117 23.92015/2016 1,665 141,396 23.92016/2017 1,808 146,833 ..
2017/2018 1,954 150,850 22.7
2018/2019 2,017 148,253 22.4West Bank
2015/2016 1,147 78,721 21.7
2016/2017 1,195 79,908 21.2
2017/2018 1,263 81,316 20.8
2018/2019 1,332 82,066 20.7
Gaza Strip
2015/2016 518 62,675 27.6
2016/2017 613 66,925 ..
2017/2018 691 69,534 25.42018/2019 685 66,187 24.9
Source: Palestinian Central Bureau of Statistics (PCBS) 2019.
Notes: The source does not clarify whether the kindergartens are public or private.

CARE ECONOMY AND PROMOTING GENDER EQUALITY
155
home. Furthermore, it purchased residential and
day services for the elderly from local community
institutions and was able to accommodate another
70 people in this way.467
According to MoSD, there is a need for legislation
that addresses poverty reduction and pensions,
healthcare, abuse and neglect, literacy and
education, care for people with disabilities, tax
exemption, long–term care and other issues
related to the elderly.468 In 2010, the 2010–2015
Strategic Plan for the Elderly in Palestine was
launched, including a mission, vision, strategic
goals and initiatives that were determined by
a set of identified challenges. Revision of the
strategy has shown that the achievements are very
modest and include the formation of the National
Committee for the Elderly, which is almost inactive,
and preparing an elderly draft law which has not
been approved yet. The most prominent challenges
were lack of political prioritization and the lack of
financial and human resources to carry out the
actual implementation of the proposed activities in
addition to the weak interest of funders.469
MoSD renewed its will to restore the strategic
planning process for the 2016–2020 period. For this
purpose, it relied on its Analysis of the Situation of
Rights of Older People in Palestine 2015, in addition
to drawing on the previous Strategic Plan for the
care of the elderly in Palestine 2010–2015.470 The
goals of the strategy are to: create a legal and
legislative environment that guarantees the rights
of the elderly, especially autonomy, participation
and decent living; build a society that harnesses all
its energies and capabilities in serving the issues of
the elderly; provide comprehensive and integrated
quality services for the elderly; and build alliances
at regional and international levels on issues of the
elderly in Palestine. These objectives were coupled
with targets and indicators to monitor progress.471
and 14.4 per cent in the Gaza Strip). The proportion
of those who support themselves financially among
the elderly was 11.6 per cent, whereas 29.8 per cent
supported themselves and others and 58.6 per cent
were supported exclusively by others.461 The income
sources of the elderly vary, but reliance on family is
a very common phenomenon, as the family is the
broader framework for their care.462 Poor elderly
may also benefit from the general cash assistance
programme, based on qualification criteria that are
set and administered by the MoSD. The number of
elderly people in the programme reached about
71,000 in 2017, who constituted about 31 per cent
of the total elderly in Palestine, and 10.3 per cent
of the total beneficiaries of the programme.463 Yet
data indicate that financial support for the elderly
is not necessarily sufficient. In 2017, poverty affected
27 per cent of the total elderly population (18 per
cent in the West Bank against 47 per cent in the
Gaza Strip), which is equivalent to 5 per cent of the
total number of poor people in Palestine.464
The Elderly Department of MoSD is responsible
for caring for the elderly in Palestine, but this
department lacks financial and human resources,
as the director is its sole employee. There are a
small number of other governmental, private or
international organizations that provide care for
the elderly, including housing services, day clubs,
and some in–kind and cash assistance.465 As per
a MoSD survey in 2015, there were 24 registered
non–governmental institutions (21 in the West Bank
and three in the Gaza Strip) concerned with the
elderly. These were mainly charities and religious
institutions that provided overnight long–term
care services (15 institutions) or day services
(nine institutions). It is worth noting that half of
governorates lacked these services.466 In 2017,
MoSD was working to provide service packages
for the elderly suffering from difficult social,
health and economic conditions. It was able to
accommodate 60 elderly in a government care

CHAPTER 4 – THE CARE ECONOMY IN PALESTINE
156
In 2012, the minimum wage was set at 1,450 New
Israeli Shekel per month (approximately USD 423)
– 65 shekels per day and 8.5 shekels per hour.474
Major shortcomings noted of the labour law are
that it excludes large segments of the Palestinian
labour force, including self–employed workers,
seasonal workers, unpaid family workers, domestic
workers and those involved in unpaid domestic
care and reproductive work at home.475 Surveys of
working conditions have revealed that enforcement
of the law is extremely lax, with large numbers
of workers not being paid minimum wage nor
receiving other protections.476
Social security law
A framework for a new social security system was
developed in 2013 by the National Social Security
Committee, in consultation with workers’ and
employers’ organizations, representatives from line
ministries, and members of civil society. As a result,
a Social Security Law for private sector workers and
their family members was endorsed in September
2016.477 This law provided for the first time a legal
framework for the first private sector social security
system.
In 2016, the Palestinian President ratified the social
security law, which is based on a cost–sharing
principle by employer and employees, covering
safety, retirement and maternity insurance. Wages
are utilized as a base to calculate the contribution
of employers (8.5 per cent) and employees (7.5 per
cent) in order to cover the cost of these mandated
benefits. The period of maternity leave under the
law would increase to 12 weeks (with a maximum of
five weeks prior to delivery and a minimum of seven
weeks post–delivery) at an income replacement
level equal to the average monthly wage for the
three months of contributions prior to the birth. This
is conditional on the payment of three contributions
in the year that preceded the maternity leave.478
Paid leaves and employment benefits
Palestinian Labour Law No. 7 was adopted in 2000
to govern the employment relationship in both
the West Bank and Gaza Strip as part of reforms
to unify the fragmented legal systems in the State
of Palestine. The law covers paid leaves as well
as numerous other aspects of the employment
relationship.472
The Law provides for paid maternity leave of 10
weeks, including at least six weeks post–delivery. It
is granted for pregnant women who have spent 180
days at work prior to each delivery. Breastfeeding
mothers are entitled to breastfeeding breaks during
work hours, the total of which shall not be less than
one hour per day for a period of one year after the
date of delivery. This breastfeeding hour is to be
counted as part of the daily working hours. Also,
the law prohibits additional working hours during
pregnancy and during the first six months after
delivery or during night hours, except as approved
by the Council of Ministers.473
Workers are also entitled to a number of other
benefits. These include a pension/end of service
bonus for workers who complete a year at work,
the amount of which shall be one month’s wage for
each year of service. Workers are entitled to two
weeks of annual paid leave and three weeks if they
are working in hazardous or health–damaging
occupations, as well as for those workers who have
spent five years or more at the institution. Workers
are also entitled to 14 days of paid sick leave each
year and an additional 14 days of sick leave at half
the wage. Finally, there are provisions in the labour
law that prohibit the employment of women under
the following conditions: 1. Dangerous or hard work,
as defined by the Minister. 2. Extra working hours
during pregnancy and during the first six months
after delivery. 3. During night hours, except for work
defined by the Council of Ministers.

CARE ECONOMY AND PROMOTING GENDER EQUALITY
157
However, the State of Palestine halted the
implementation of the law after months of civil
protests. A wide spectrum of workers has raised
reservations regarding a number of issues,
including employees’ contribution, maturity time
for workers to receive the benefits, and the terms of
benefits to legal heirs.
4.4 Unpaid care work in Palestine
Women assume the responsibility for unpaid care
The average time allocated to unpaid care work
at the national level is displayed in Table 4.2. The
box 4.1: daTa and meThods
To explore the characteristics of unpaid care work, the analysis relies on the most recent time–use survey from 2012/2013, which was conducted by the Palestine Central Bureau of Statistics (PCBS).489 This nationally represen-tative survey collected data on individuals’ time allocation on a given day following a daily time record, which col-lected information on activities performed in 10–minute intervals. To make comparison easier with other countries included in the report, the daily time–use data (minutes per day) are aggregated to the weekly level (hours per week). These time estimates reflect the average time use of the entire population – both those who spent time on unpaid care and those who did not.
Descriptive analysis is presented in terms of the average time spent on unpaid care by individuals, covering direct and indirect care work across a number of household and individual characteristics. The latter include age, edu-cational attainment, marital status, employment status, number of hours worked and sector of employment. The time–use analysis is also presented by region (the West Bank vs. Gaza Strip) and by type of locality (urban, rural and refugee camp). The analysis is disaggregated by gender and marital status, two key predictors of time spent on unpaid care work and is limited to the working–age population (aged 15–64).
The analysis further examines the amount of time that married women of different education levels allocate to unpaid care work based on the presence of children of different ages in the household. The underlying method-ology utilizes a multivariate regression technique to estimate the additional time spent on care work based on having children of different ages, holding other demographic and socioeconomic characteristics constant. The methodology for this analysis is described in further detail in the Methodological Appendix.
The analysis of the paid care sector relies on the PCBS Population, Housing and Establishments Census from 2007 and 2017.490 The size and characteristics of the paid care sector, encompassing education, health care, social care and domestic work, are examined both at occupation and establishment levels. The establishment–level anal-ysis includes establishments (firms) providing care services in the public, private and NGO sectors, as well as the United Nations Relief and Works Agency for Palestine Refugees in the Near East (UNRWA). The establishment–level data include employers, the self–employed, waged employees and unpaid family workers. In this context, the establishment–level data explore the full extent of the paid care sector, encompassing those who are directly involved in the paid care activities (care workers) as well as those in supporting roles (non–care workers in care sectors). The establishment–level analysis also addresses growth of the paid care sector over the past decade.
The occupation–level analysis is limited to waged workers and focuses on the size of employment and distribution by gender, education and formality status. Informal workers are identified as those who are not entitled to sever-ance payment, paid vacation, paid sick leave, and maternity leave for women.491 In this respect, formality status serves as a proxy for job quality.
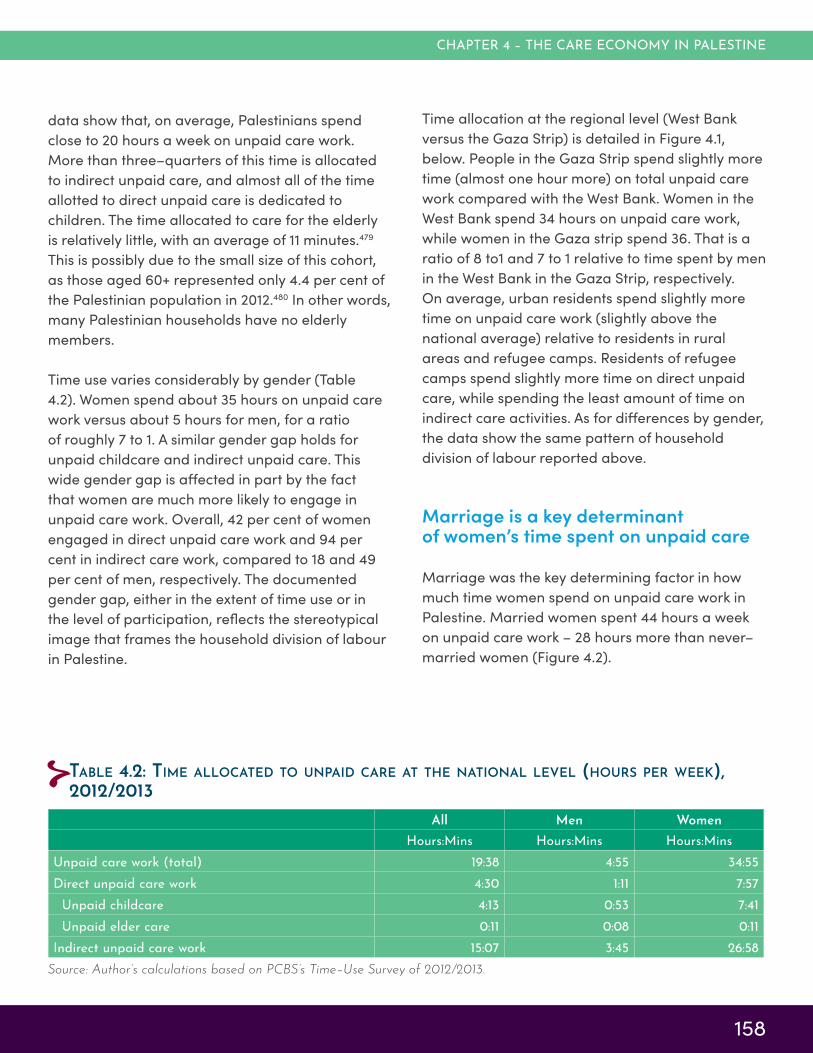
CHAPTER 4 – THE CARE ECONOMY IN PALESTINE
158
data show that, on average, Palestinians spend
close to 20 hours a week on unpaid care work.
More than three–quarters of this time is allocated
to indirect unpaid care, and almost all of the time
allotted to direct unpaid care is dedicated to
children. The time allocated to care for the elderly
is relatively little, with an average of 11 minutes.479
This is possibly due to the small size of this cohort,
as those aged 60+ represented only 4.4 per cent of
the Palestinian population in 2012.480 In other words,
many Palestinian households have no elderly
members.
Time use varies considerably by gender (Table
4.2). Women spend about 35 hours on unpaid care
work versus about 5 hours for men, for a ratio
of roughly 7 to 1. A similar gender gap holds for
unpaid childcare and indirect unpaid care. This
wide gender gap is affected in part by the fact
that women are much more likely to engage in
unpaid care work. Overall, 42 per cent of women
engaged in direct unpaid care work and 94 per
cent in indirect care work, compared to 18 and 49
per cent of men, respectively. The documented
gender gap, either in the extent of time use or in
the level of participation, reflects the stereotypical
image that frames the household division of labour
in Palestine.
Time allocation at the regional level (West Bank
versus the Gaza Strip) is detailed in Figure 4.1,
below. People in the Gaza Strip spend slightly more
time (almost one hour more) on total unpaid care
work compared with the West Bank. Women in the
West Bank spend 34 hours on unpaid care work,
while women in the Gaza strip spend 36. That is a
ratio of 8 to1 and 7 to 1 relative to time spent by men
in the West Bank in the Gaza Strip, respectively.
On average, urban residents spend slightly more
time on unpaid care work (slightly above the
national average) relative to residents in rural
areas and refugee camps. Residents of refugee
camps spend slightly more time on direct unpaid
care, while spending the least amount of time on
indirect care activities. As for differences by gender,
the data show the same pattern of household
division of labour reported above.
Marriage is a key determinant of women’s time spent on unpaid care
Marriage was the key determining factor in how
much time women spend on unpaid care work in
Palestine. Married women spent 44 hours a week
on unpaid care work – 28 hours more than never–
married women (Figure 4.2).
Table 4.2: Time allocaTed To unpaid care aT The naTional level (hours per week), 2012/2013
All Men Women
Hours:Mins Hours:Mins Hours:MinsUnpaid care work (total) 19:38 4:55 34:55Direct unpaid care work 4:30 1:11 7:57 Unpaid childcare 4:13 0:53 7:41 Unpaid elder care 0:11 0:08 0:11Indirect unpaid care work 15:07 3:45 26:58
Source: Author’s calculations based on PCBS’s Time–Use Survey of 2012/2013.

CARE ECONOMY AND PROMOTING GENDER EQUALITY
159
While a marital–status gap is also documented for
men, the time difference is much smaller (two and
a half hours). Markedly, indirect unpaid care work
takes up most of the time allocated to total unpaid
care work, particularly for men and never–married
women.
Married women who are employed spend an
average of 39 hours a week on unpaid care work,
about six hours less than married women who are
not employed (those who seek employment or are
out of the labour force; Figure 4.3).481 The former
group spends close to three hours more on both
childcare and indirect unpaid care, respectively.
Never–married women who are not employed
spend about 17 hours on indirect care activities; two
hours more than those who are employed. Both
groups spend about the same time, one hour, on
childcare. As for men, the data show no substantial
differences by employment status, although
married men who are not employed contribute
more to unpaid care work (8 hours per week) than
other men.
Figure 4.3 also shows the average number of hours
spent on paid work by employment and gender.482
figure 4.2: weekly Time spenT in unpaid care work (hours per week) among men and women, age 15–64, 2012/2013, palesTine
Source: Author’s calculations based on PCBS Time–Use
Survey of 2012/2013.
3 4
15
32
0
1
1
12
0
5
10
15
20
25
30
35
40
45
50
Nevermarried
Married Nevermarried
Married
Men Women
Hou
rs p
er w
eek
Direct unpaid care work
Indirect unpaid care work
figure 4.1: weekly Time spenT in unpaid care work (hours per week), men and women by region and localiTy, 2012/2013, palesTine
Source: Author’s calculations based on PCBS’s Time–Use Survey of 2012/2013.
3
27
3
27
3
27
4
27
3
26
3
24
1
7
1
7
1
9
1
8
1
7
1
8
0
5
10
15
20
25
30
35
40
Men Women Men Women Men Women Men Women Men Women Men Women
Palestine West Bank Gaza Strip Urban Rural Refugee camps
Hou
rs p
er w
eek
Indirect unpaid care work Direct unpaid care work

CHAPTER 4 – THE CARE ECONOMY IN PALESTINE
160
unmarried men and women, and married men
(Figure 4.4). This gap is indicative of time poverty
among women, which may detract from their ability
to engage in other activities.
Notably, men’s allocation of time to unpaid care
work shows little variation not only by employment
status and marital status, but also by other
demographic characteristics. For example, men
with high school education spend about four hours
on unpaid care work compared to five hours for the
higher–educated. The following analyses therefore
focus on married and never–married women and
emphasizes how their allocation of time to unpaid
care work varies by other individual and household
characteristics.
Unmarried women spend about seven hours more
in paid work than married women, whereas the
difference among men is minor. This suggests
that married women may reduce their paid work
hours, or seek employment with shorter work hours,
at least in part due to their care responsibilities.
Overall, the allocation of time to paid and unpaid
work reveals substantial imbalances in time
allocation. Married women who are employed
spend nearly 20 more hours in total work (caring
for the household and earning a living) than
married men who are employed. This gap is also
documented for the never–married, but to a lesser
extent (eight hours difference).
Expressed as a percentage of total time in a week,
married, employed women spend 41 per cent of
their weekly hours in all forms of work combined,
compared to 27–31 per cent of the week among
figure 4.3: weekly Time spenT in unpaid care work among men and women, age 15–64, by mariTal sTaTus and employmenT sTaTus, 2012/2013, palesTine
Source: Author’s calculations based on the PCBS Time–Use Survey of 2012/2013 and the Palestine LFS 2013.
43 4437
30
0
0
1
2
1
1
9
12
2
3
4
6
15
17
30
33
45
4
49
8
53
18
68
46
0
5
10
15
20
25
30
35
40
45
50
55
60
65
70
Employed Non-employed Employed Non-employed Employed Non-employed Employed Non-employed
Never married Married Never married Married
Men Women
Hours
per
week
Paid work Direct unpaid care work Indirect unpaid care work

CARE ECONOMY AND PROMOTING GENDER EQUALITY
161
they are more able to rely on the market to satisfy
their care needs. To address this, the sample of
households is split into three income categories:
a low–income category for those earning 2,400
shekels (approximately USD 700) or less per month;
a middle–income category earning 2,401–5,000
shekels (USD 700–1,457); and an upper–income
category – earning more than 5,000 shekels (USD
1,457).
Women, whether married or unmarried, in upper–
income households do in fact spend less time on
unpaid care work (Figure 4.6). Interestingly, the
distribution across types of unpaid activities differs
by marital status. Married women in upper–income
households spend less time on unpaid childcare,
whereas their never–married peers spend
less time on indirect unpaid care work. It is not
straightforward to explain this finding. Wealthier
households might be smaller or tend to buy the
associated services from the market; i.e. children
in wealthier households might be more likely to be
enrolled in ECCE.
figure 4.4: percenTage of ToTal weekly Time spenT in unpaid care work among men and women, age 15–64, by mariTal sTaTus and employmenT sTaTus, 2012/2013, palesTine
Source: Author’s calculations based on the PCBS Time–Use Survey of 2012/2013 and the Palestine LFS 2013.
Note: Percentage of time is calculated out of a total 168–hour week.
2729
31
41
26 26
22
18
1 2
9
18
0 1 0
5
0
5
10
15
20
25
30
35
40
45
Never married Married Never married Married
Men Women
Perc
enta
ge o
f to
tal tim
e in a
week
Total work
Paid work(employed only)
Indirect care work
Direct care work
Women’s time allocation varies by demographic and socioeconomic characteristics
Differences in time allocated to unpaid care work
are analysed according to household size in Figure
4.5. This variable classifies women into those living
in: 1) households with fewer than five members;
2) households with five to seven members; and 3)
households with more than seven members. The
findings show that married women in the smallest
households spend 38 hours on unpaid care work,
8–10 hours less than those in the other groups. An
opposite pattern holds among unmarried women;
women with the smallest households spend 19
hours on unpaid care work – about two hours more
than the two other groups. The results also show
that indirect, unpaid care work accounts for these
differences.
Level of income is another factor that could
explain differences in time allocation to unpaid
care work. It is expected that women in wealthier
households spend less time on unpaid care, as

CHAPTER 4 – THE CARE ECONOMY IN PALESTINE
162
box 4.2: redisTribuTing responsibiliTy for unpaid care: raising awareness regarding gender equaliTy
Redistributing part of the responsibility for unpaid care work from women to men is key to enhancing gender equity and women’s linkages to the labour market. To this end, paternity leave is commonly used, for example in European Union countries, to promote shared childcare responsibilities between women and men. Nevertheless, the short–term efficacy of a paternity leave policy in Palestine is questionable, as the stereotypical image of men as breadwinners and women as caregivers is deeply rooted. Literature from Europe and North America has demonstrated that paternity leave policies need to be accompanied by measures to induce normative change so that men actually take advantage of the leaves offered to them.492 Put differently, introducing paternity leave regulation first requires instilling a structural change in social norms regarding the household division of labour. In this respect, introducing policies to promote gender equality in the household, workplace and society would be the first step towards achieving such a change.
The Palestinian Government, represented by the Ministry of Women’s Affairs and the Ministry of Labour (MoL), can cooperate with civil society organizations, businesswomen’s associations, and international institutions such as UN Women, on public awareness campaigns and capacity–building to redistribute unpaid care work and make it more gender–balanced. This may include highlighting the benefits of men further sharing unpaid care responsibilities with women, the societal returns of economically empowering women and the significant contributions of employed women to family income. Experiences from other countries show that using a mix of traditional and online media is most effective to convey these messages to the public.493 Awareness–raising should also target younger generations, introducing gender equality and the redistribution of unpaid care work within curricula at various educational levels.
These efforts can capitalize on various positive attitudes that have recently surfaced in Palestinian society. Findings from a recent UN Women report494 show that although women hold more gender–egalitarian attitudes than men in Palestine, about three–quarters of women and half of men agree that married women should have the same right as men to join the labour market. The report also shows that fewer than 20 per cent of men and women think that men’s engagement in caring for children is shameful. Consistent with the need to change women’s perceived roles in the household, about three–quarters of men and close to 90 per cent of women agree that Palestinians need to do more to promote gender equality. Greater awareness–raising could further sway men towards gender equality.
figure 4.5: weekly Time spenT on unpaid care work (hours per week), by women, according To household size and mariTal sTaTus, 2012/2013
Source: Author’s calculations based on PCBS’s Time–Use Survey of 2012/2013.
18 17 16
27
34 3610 1
11
1212
0
5
10
15
20
25
30
35
40
45
50
Fewer than 5 5 to 7 More than 7 Fewer than 5 5 to 7 More than 7
Never married Married
Hours
per
week
Indirect unpaid care work Direct unpaid care work
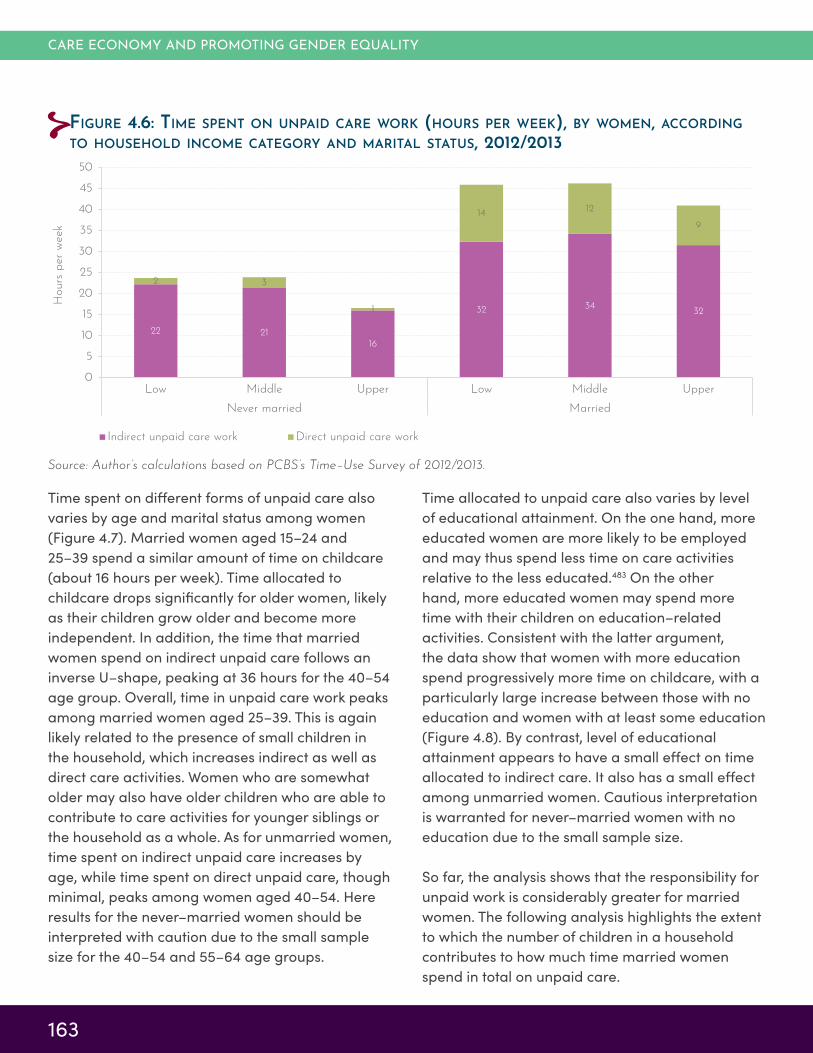
CARE ECONOMY AND PROMOTING GENDER EQUALITY
163
Time spent on different forms of unpaid care also
varies by age and marital status among women
(Figure 4.7). Married women aged 15–24 and
25–39 spend a similar amount of time on childcare
(about 16 hours per week). Time allocated to
childcare drops significantly for older women, likely
as their children grow older and become more
independent. In addition, the time that married
women spend on indirect unpaid care follows an
inverse U–shape, peaking at 36 hours for the 40–54
age group. Overall, time in unpaid care work peaks
among married women aged 25–39. This is again
likely related to the presence of small children in
the household, which increases indirect as well as
direct care activities. Women who are somewhat
older may also have older children who are able to
contribute to care activities for younger siblings or
the household as a whole. As for unmarried women,
time spent on indirect unpaid care increases by
age, while time spent on direct unpaid care, though
minimal, peaks among women aged 40–54. Here
results for the never–married women should be
interpreted with caution due to the small sample
size for the 40–54 and 55–64 age groups.
figure 4.6: Time spenT on unpaid care work (hours per week), by women, according To household income caTegory and mariTal sTaTus, 2012/2013
Source: Author’s calculations based on PCBS’s Time–Use Survey of 2012/2013.
22 2116
32 3432
2 3
1
14 12
9
0
5
10
15
20
25
30
35
40
45
50
Low Middle Upper Low Middle Upper
Never married Married
Hours
per
week
Indirect unpaid care work Direct unpaid care work
Time allocated to unpaid care also varies by level
of educational attainment. On the one hand, more
educated women are more likely to be employed
and may thus spend less time on care activities
relative to the less educated.483 On the other
hand, more educated women may spend more
time with their children on education–related
activities. Consistent with the latter argument,
the data show that women with more education
spend progressively more time on childcare, with a
particularly large increase between those with no
education and women with at least some education
(Figure 4.8). By contrast, level of educational
attainment appears to have a small effect on time
allocated to indirect care. It also has a small effect
among unmarried women. Cautious interpretation
is warranted for never–married women with no
education due to the small sample size.
So far, the analysis shows that the responsibility for
unpaid work is considerably greater for married
women. The following analysis highlights the extent
to which the number of children in a household
contributes to how much time married women
spend in total on unpaid care.
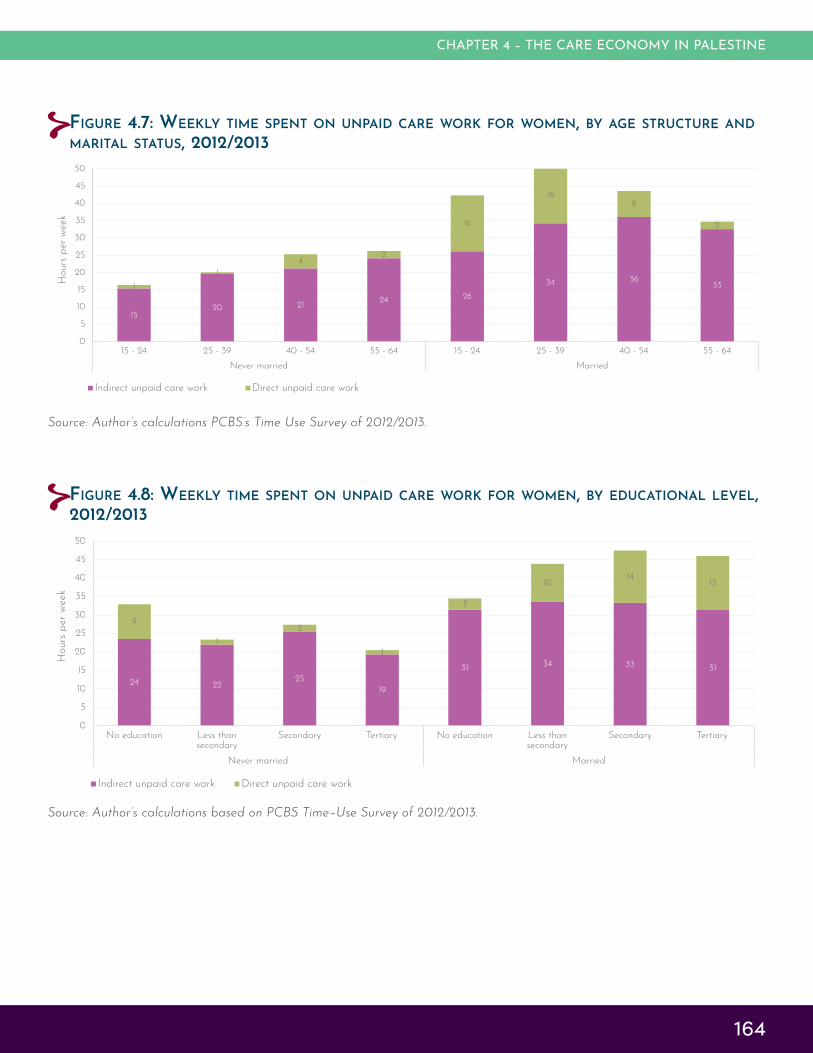
CHAPTER 4 – THE CARE ECONOMY IN PALESTINE
164
figure 4.7: weekly Time spenT on unpaid care work for women, by age sTrucTure and mariTal sTaTus, 2012/2013
Source: Author’s calculations PCBS’s Time Use Survey of 2012/2013.
1520 21
24 26
34 36331
1
42
16
168
2
0
5
10
15
20
25
30
35
40
45
50
15 - 24 25 - 39 40 - 54 55 - 64 15 - 24 25 - 39 40 - 54 55 - 64
Never married Married
Hours
per
week
Indirect unpaid care work Direct unpaid care work
figure 4.8: weekly Time spenT on unpaid care work for women, by educaTional level, 2012/2013
Source: Author’s calculations based on PCBS Time–Use Survey of 2012/2013.
24 2225
19
31 34 33 31
9
1
2
1
3
1014
15
0
5
10
15
20
25
30
35
40
45
50
No education Less thansecondary
Secondary Tertiary No education Less thansecondary
Secondary Tertiary
Never married Married
Hours
per
week
Indirect unpaid care work Direct unpaid care work

CARE ECONOMY AND PROMOTING GENDER EQUALITY
165
The analysis groups children by age: under 3,
3–5 and 6–17 years old. It estimates the average
time spent on unpaid care work among married
women with no children belonging to each of
these age groups. Then, predictions show by how
much, on average, time in unpaid care increases,
based on having a child in each age group (see
the Methodological Appendix of the report for full
details on the multivariate analysis approach).
The predictions show that married women with
no children spend an average of 40 hours a week
on unpaid care work (Figure 4.9). Compared to
this group, married women with one child below
3 years of age spend an extra 10 hours on total
unpaid care, as opposed to three hours for women
with a child 3–5 years old, and five hours for
women with a child between 6 and 17 years old.
The lower additional time spent for children aged
3–5 may be related to the higher ECCE enrolment
rates among this group, as well as needs of children
this age.
box 4.3: opTions for expanding ecce in palesTine: highlighTs from inTernaTional experience
Expanding early childhood education is often used as a policy to reduce the burden of unpaid care work and induce more women to join the labour market. For many countries, ECCE is a public good, as the economic and social benefits it generates accrue to children as well as society at large.495 Also, ECCE is often considered as a child’s right and thus should not be conditioned on characteristics such as parents’ income and employment status.496 On this ground, countries like Brazil, China and France finance ECCE using public funding. Other countries, like Germany, adopt cost–sharing schemes whereby families cover between 15–30 per cent, depending on income, number of children and type of ECCE services. Nonetheless, other countries, like Indonesia and South Korea, do not consider ECCE part of formal education and ECCE financing is privately paid by households.497
As noted above, the Palestinian President recently ratified a new Education Law, which extended mandatory education to cover KG for a maximum of two years prior to elementary education. According to data from PCBS’s 2017 Population, Housing and Establishments Census, about 54 per cent of children between 3 and 5 years old are enrolled in KGs. Within this group, the enrolment rate increases by age – rising from 15 per cent for the 3–year–old group to 67 and 79 per cent, respectively, for the 4– and 5–year–old groups. Enrolment data on younger children are not available, but similar to 3–year–olds, it is expected to be low.
It can thus be concluded that while enrolment of KG–age children is still below universal and warrants increase, only a fraction of younger children benefit from nursery services. Households with children 3 years old or younger, that wish to receive childcare (nursery) services may not have access to relevant nurseries due to lack of such services or because they lack the financial resources to cover associated expenses.
Establishing public KG facilities, as stipulated in the new education law, will help expand ECCE coverage. Still, establishing nursery facilities by the public sector or/and the private sector is a necessary prerequisite to reduce responsibilities of unpaid childcare, increase women’s linkages to the labour market, and improve early childhood development. Notably, the low enrolment rate of children aged 0–3 suggests that the market (private sector) has failed to expand care services for this child cohort. Correcting for this market failure warrants government intervention to expand nursery services.
The provision of nursery services can be channeled via the public and private sector. For the private sector, incentive mechanisms, such as subsidies or tax cuts, can be provided to privately owned nurseries or those administered by NGOs. Importantly, the Palestinian Government has faced chronic fiscal challenges and given the country’s high–young dependency ratio, which warrants mobilizing substantial resources to meet the ECCE need. the question is how to finance the expansion of KGs nursery services. Various financing mechanisms need to be explored in order to determine how to expand nurseries in a manner that will ensure equitable access to quality services.

CHAPTER 4 – THE CARE ECONOMY IN PALESTINE
166
figure 4.9: predicTed addiTional weekly hours of unpaid care work wiTh a child of differenT age groups in The household, married women, 2012/2013
Source: Author’s calculations based on PCBS Time–Use Survey of 2012/2013.
Note: All estimates for additional time are statistically significant.
40
10
43
3
41
5
0
5
10
15
20
25
30
35
40
45
50
Predicted average timewith no children in the
age group
Predicted additional timewith a child in the age
group
Predicted average timewith no children in the
age group
Predicted additional timewith a child in the age
group
Predicted average timewith no children in the
age group
Predicted additional timewith a child in the age
group
< 3 3-5 6-17
Hours
per
week
The predictions also show that the additional
time associated with having a child in each age
group increases linearly by the mother’s level
of education, ranging from 8 to 12 hours for a
woman with one child younger than 3 years old
(Figure 4.10). The findings are similar for the other
age groups of children, but the magnitude of the
additional time is much smaller.
figure 4.10: predicTed addiTional weekly hours of unpaid care work wiTh a child of differenT age groups in The household, married women, by educaTional aTTainmenT 2012/2013
Source: Author’s estimations based on PCBS Time–Use Survey of 2012/2013.
Note: All estimates for additional time are statistically significant.
40
8
42
2
40
4
41
10
45
4
44
5
38
12
44
4
42
6
0
5
10
15
20
25
30
35
40
45
50
Predicted average time withno children in the age group
Predicted additional time witha child in the age group
Predicted average time withno children in the age group
Predicted additional time witha child in the age group
Predicted average time withno children in the age group
Predicted additional time witha child in the age group
< 3 3-5 6-17
Hours
per
week
Less than secondary Secondary Tertiary

CARE ECONOMY AND PROMOTING GENDER EQUALITY
167
These findings are again consistent with the
argument that more educated women spend more
time on education–related activities with their
children. Time spent in schoolwork may explain,
for example, why the added time of having a child
aged 6–17 is greater than that for a child aged 3–5.
4.5 Characteristics of the Palestinian paid care sector: A main employer of educated women
Educators and health–care workers comprise the majority of paid care workers
According to the PCBS Population, Housing and
Establishments Census in 2017, the total number of
paid care workers in Palestine is 98,000, comprising
15 per cent of the overall waged workers. The
majority of paid care workers (73 per cent) are
educators, including primary school and early
childhood educators and all other educators
(Figure 4.11). In total, educators and health
workers constitute 97 per cent of total paid care
occupations, whereas social care and domestic
workers constitute only 3 per cent combined.
Domestic workers constituted less than 1 per cent
of paid care workers. About 57 per cent of the
paid care workers are women. Except for health
occupations, women represent the majority in each
of the paid care occupations. In fact, about half of
all employed women are paid care workers.
The Palestinian Government hires half of all paid
care workers (50 per cent), followed respectively by
the private sector (34 per cent), UNRWA (11 percent)
and the ‘other’ sector, which mainly includes NGOs
(5 per cent). The distribution of paid care workers
across type of employers (sectors) and type of
occupation is documented in Table 4.3. In terms
of distribution by gender, the majority of early
childhood educators are women, while the gender
distribution in the other occupations differs by type
of employer.
figure 4.11: disTribuTion of paid care workers by occupaTion and women, 2017
Source: Author’s calculations based on 2017 PCBS Population, Housing and Establishments Census.
25
11
30
15
43
29
2 21
00 00
5
10
15
20
25
30
35
40
45
50
Total Women
Per
cent
Healthcare workers
All other educators
Early childhoodeducators
Childcare workers andteachers’ aides
Personal care workersin health services
Domestic workers
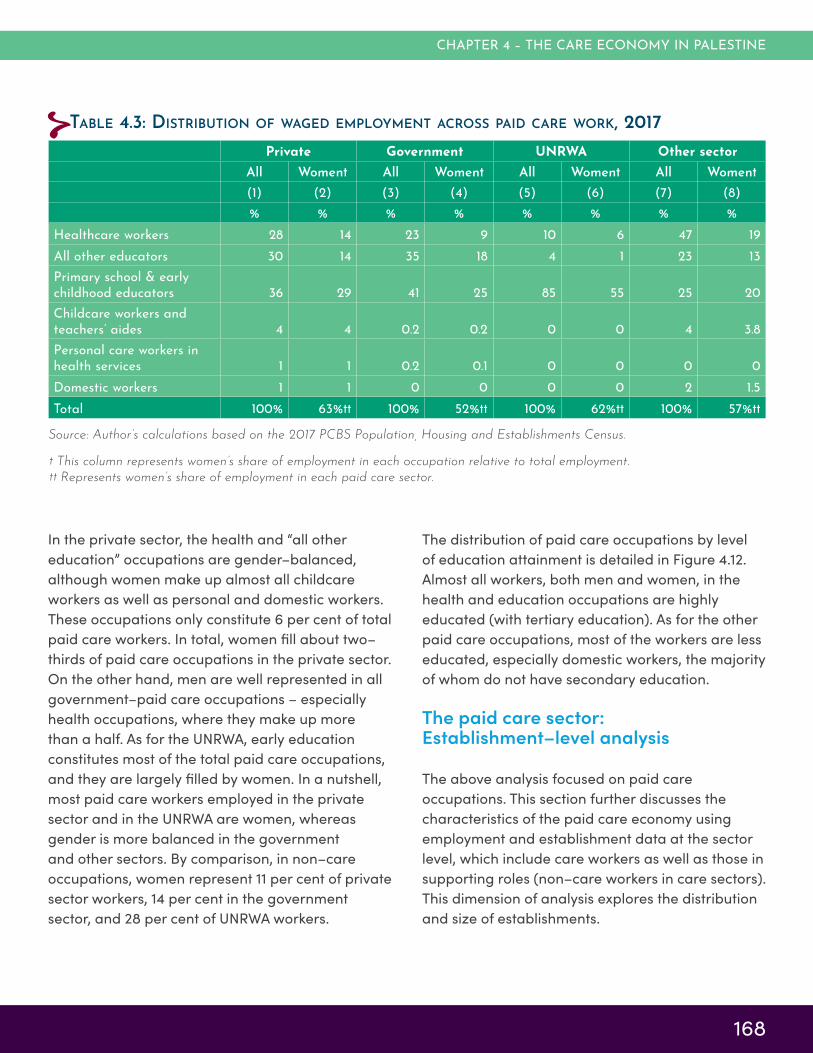
CHAPTER 4 – THE CARE ECONOMY IN PALESTINE
168
In the private sector, the health and “all other
education” occupations are gender–balanced,
although women make up almost all childcare
workers as well as personal and domestic workers.
These occupations only constitute 6 per cent of total
paid care workers. In total, women fill about two–
thirds of paid care occupations in the private sector.
On the other hand, men are well represented in all
government–paid care occupations – especially
health occupations, where they make up more
than a half. As for the UNRWA, early education
constitutes most of the total paid care occupations,
and they are largely filled by women. In a nutshell,
most paid care workers employed in the private
sector and in the UNRWA are women, whereas
gender is more balanced in the government
and other sectors. By comparison, in non–care
occupations, women represent 11 per cent of private
sector workers, 14 per cent in the government
sector, and 28 per cent of UNRWA workers.
The distribution of paid care occupations by level
of education attainment is detailed in Figure 4.12.
Almost all workers, both men and women, in the
health and education occupations are highly
educated (with tertiary education). As for the other
paid care occupations, most of the workers are less
educated, especially domestic workers, the majority
of whom do not have secondary education.
The paid care sector: Establishment–level analysis
The above analysis focused on paid care
occupations. This section further discusses the
characteristics of the paid care economy using
employment and establishment data at the sector
level, which include care workers as well as those in
supporting roles (non–care workers in care sectors).
This dimension of analysis explores the distribution
and size of establishments.
Private Government UNRWA Other sector
All Women† All Women† All Women† All Women†
(1) (2) (3) (4) (5) (6) (7) (8)
% % % % % % % %
Healthcare workers 28 14 23 9 10 6 47 19All other educators 30 14 35 18 4 1 23 13
Primary school & early childhood educators 36 29 41 25 85 55 25 20
Childcare workers and teachers’ aides 4 4 0.2 0.2 0 0 4 3.8
Personal care workers in health services 1 1 0.2 0.1 0 0 0 0
Domestic workers 1 1 0 0 0 0 2 1.5
Total 100% 63%†† 100% 52%†† 100% 62%†† 100% 57%††
Source: Author’s calculations based on the 2017 PCBS Population, Housing and Establishments Census.
† This column represents women’s share of employment in each occupation relative to total employment.
†† Represents women’s share of employment in each paid care sector.
Table 4.3: disTribuTion of waged employmenT across paid care work, 2017

CARE ECONOMY AND PROMOTING GENDER EQUALITY
169
figure 4.12: educaTional disTribuTion of workers, by paid care occupaTion, 2017
Source: 2017 PCBS Population, Housing and Establishments Census.
1 0 0
36
46
89
2 1 1
50 30
9
97 99 99
14
24
2
0
10
20
30
40
50
60
70
80
90
100
Healthcare workers Primary school and earlychildhood educators
All other educators Child care workers andteachers’ aides
Personal care workers inhealth services
Domestic workers
Per
cent
Less than secondary Secondary Tertiary
It also allows the examination over time of changes
in the paid care sector.
The total number of paid care establishments,
covering private, NGO and government
establishments, amounted in 2017 to 10,300
establishments, an increase of 57 per cent over
the previous decade. Paid care establishments
constituted 7 per cent of all establishments. Paid
care establishments employ approximately 60,000
workers, about 47 per cent more relative to the
past decade. The findings also show that women
in these establishments comprise 64 per cent of all
employees. Over the past decade, the total number
of employed men and women has grown by 59 and
69 per cent, respectively.
In terms of employment distribution within the
paid care sector, Figure 4.13 shows that the ‘all
other education’ category is the largest employer,
followed by a narrow margin by health and
early childhood education. As for the number
of establishments, the health and social work
subsector constitutes half of total paid care
establishments, followed by primary and early
childhood education and ‘all other education’,
which together make up 40 per cent of total paid
care establishments. Social care is the smallest
subsector, representing 8 per cent of establishments
and 10 per cent of employment (Figure 4.13).
Women’s share of employment in the different
paid care subsectors varied considerably. Most of
those employed in the primary and early childhood
education sector and social care sector are
women, constituting 80 per cent and 57 per cent,
respectively (Figure 4.14). Yet, men represent the
majority in the ‘all other education’ sector (58 per
cent), as well as the health and social work sector
(61 per cent).
Over the past decade, employment in the ‘all other
education’ sector has grown the most (by 95 per
cent), followed by primary and early childhood
education (60 per cent), social care (57 per cent),
and health and social work (44 per cent).

CHAPTER 4 – THE CARE ECONOMY IN PALESTINE
170
figure 4.13: disTribuTion of esTablishmenTs and employmenT across The paid care secTor, 2017
Source: 2017 PCBS Population, Housing and Establishments Census.
20 20
51
8
26
3330
10
0
10
20
30
40
50
60
Primary and early childhoodeducation
All other education Health and social work Social care
Per
cent
Share of care establishments Share of paid care employment
figure 4.14: women’s share of employmenT in paid care secTors, 2017
Source: Author’s calculations based on the 2017 PCBS Population, Housing and Establishments Census.
57
39
42
80
43
61
58
20
0 10 20 30 40 50 60 70 80 90 100
Social care
Health and social work
All other education
Primary and early childhood education
Per cent
Women Men
As for the number of establishments, ‘all other
education’ has grown the most (by 140 per cent),
followed by social care work (81 per cent), health
and social work (42 per cent), and early childhood
education (39 per cent). Figure 4.15 shows the
annual growth rate and compares it to the non–
care sector, assuming constant yearly growth, in the
number of establishments per paid care sector over
the past decade.

CARE ECONOMY AND PROMOTING GENDER EQUALITY
171
figure 4.15: annual growTh raTe in The number of esTablishmenTs across paid care and non care secTors, 2007–2017, palesTine
Source: Author’s calculations based on the 2007 and 2017 PCBS Population, Housing and Establishments Census.
7
4
13
4
8
4
0
2
4
6
8
10
12
14
Education Primary and earlychildhood education
All other education Health and socialwork
Social care Non-care
Per
cent
per
annum
figure 4.16: annual employmenT growTh raTe across paid care and non–care secTors, 2007–2017, palesTine
Source: Author’s calculations based on the 2007 and 2017 PCBS Population, Housing and Establishments Census.
8
10
7
1
9
4
8
5
14
0
45
0
2
4
6
8
10
12
14
16
Education Primary and earlychildhood education
All other education Health and social work Social care Non-care
Per
cent
per
annum
Men Women
Interestingly, employment growth has been highest
for men in the early childhood education and social
care sectors (Figure 4.16). For women, employment
growth was strongest in the ‘other education’
sector. There was very minimal employment growth
in the health and social work sector for men during
this period, and zero employment growth for
women. Notably, the annual employment growth
rate for the main paid care occupation (education)
exceeded that of non–care employment.

CHAPTER 4 – THE CARE ECONOMY IN PALESTINE
172
4.6 Formality and compliance with minimum wage regulation in paid care occupations
This section estimates the prevalence of formality
among paid care workers and explores employers’
compliance with minimum wage regulations.
As outlined in the data and methods box,
formal workers are identified as those receiving
retirement/severance payment, annual paid leave,
paid sick leave and maternity leave for women. The
outcome of this exercise helps to assess the quality
of working conditions in paid care occupations,
a matter that is vital to ensure high quality of
provided services as well as the well–being of
women workers, who are overrepresented in care
sectors.
Formality levels are lowest for private sector and social care workers
The findings show that most paid care workers
(85 per cent) in Palestine are formal. By type of
employer, the share of formal workers is lowest in
the private sector (70 per cent) and in the ‘other’
sector (77 per cent), as compared to 95 per cent in
the government and 93 per cent in UNRWA. Workers
who are informally employed in UNRWA are likely
hired on temporary contracts. The prevalence of
formality across paid care occupations differs
little among those employed in the government
and UNRWA (Figure 4.17). However, there was
considerable variation in the private sector, where
the prevalence of formality is lowest among
childcare and personal care workers.
The prevalence of formality was slightly lower for
women employed in care work (82 per cent for
women as opposed to 89 per cent for men). The
gender gap is more prevalent in the private sector,
mainly among those employed in the education
sector which make up most of those employed
in paid care work (see Table 4.4). Overall, 79 per
cent of men in private sector care occupations
were formally employed, versus just 65 per cent of
women.
Employment formality among paid workers is
compared to the rest of the Palestinian economy
(non–care activities) in Figure 4.18.
figure 4.17: prevalence of formaliTy by Type of employer and Type of paid care occupaTion, 2017, palesTine
Source: Author’s calculations based on the 2017 PCBS Population, Housing and Establishments Census.
69
80
69
37
43
95 96 95
74
9188
9194
83
67
80 7873
63 63
0
10
20
30
40
50
60
70
80
90
100
Health All other educators Primary and early childhoodeducation
Child care workers andteachers’ aides
Personal care workers in healthservices
Per
cent
Private Government UNRWA Other

CARE ECONOMY AND PROMOTING GENDER EQUALITY
173
Private Government UNRWA Other
Occupation Men Women Men Women Men Women Men Women
Health 70% 69% 94% 95% 89% 88% 80% 80%
All other educators 85% 73% 96% 96% 96% 83% 83% 75%
Primary and early child-hood education 89% 65% 95% 94% 95% 94% 81% 71%
Childcare and teacher aides 76% 36% 100% 68% 94% 50% 43% 64%Personal care in health services 45% 42% 100% 84% 40% 86% 55% 66%
Domestic work 11% 15%
Total 79% 65% 95% 95% 94% 93% 81% 74%Source: 2017 PCBS Population, Housing and Establishments Census.
Table 4.4: prevalence of formaliTy by gender, Type of employer and Type of paid care occupaTion, 2017, palesTine
figure 4.18: prevalence of formaliTy in paid care secTor and non–care secTors, 2017, palesTine
Source: Author’s calculations base on the 2017 PCBS Population, Housing and Establishments Census.
79
65
21
50
95 95 94
85
94 93
79 81
0
10
20
30
40
50
60
70
80
90
100
Men Women Men Women
Paid care sector Rest of the economy
Per
cent
Private Government UNRWA
The prevalence of formality is modestly higher
among women employed in paid care compared
to women in the rest of the economy in the
government and UNRWA sectors. The same
conclusion also holds for men. However, the
difference between paid care work and non–care
work in the private sector is substantial, with paid
care workers of both genders experiencing higher
rates of formality, particularly among men.
To ensure widespread coverage of these benefits
(expand employment formality), one option the
Government may undertake is to widely enforce
the imposition of sanctions on non–compliance, as
stipulated in Palestinian labour law. However, such
an intervention might come at a cost, mainly for less
productive firms.
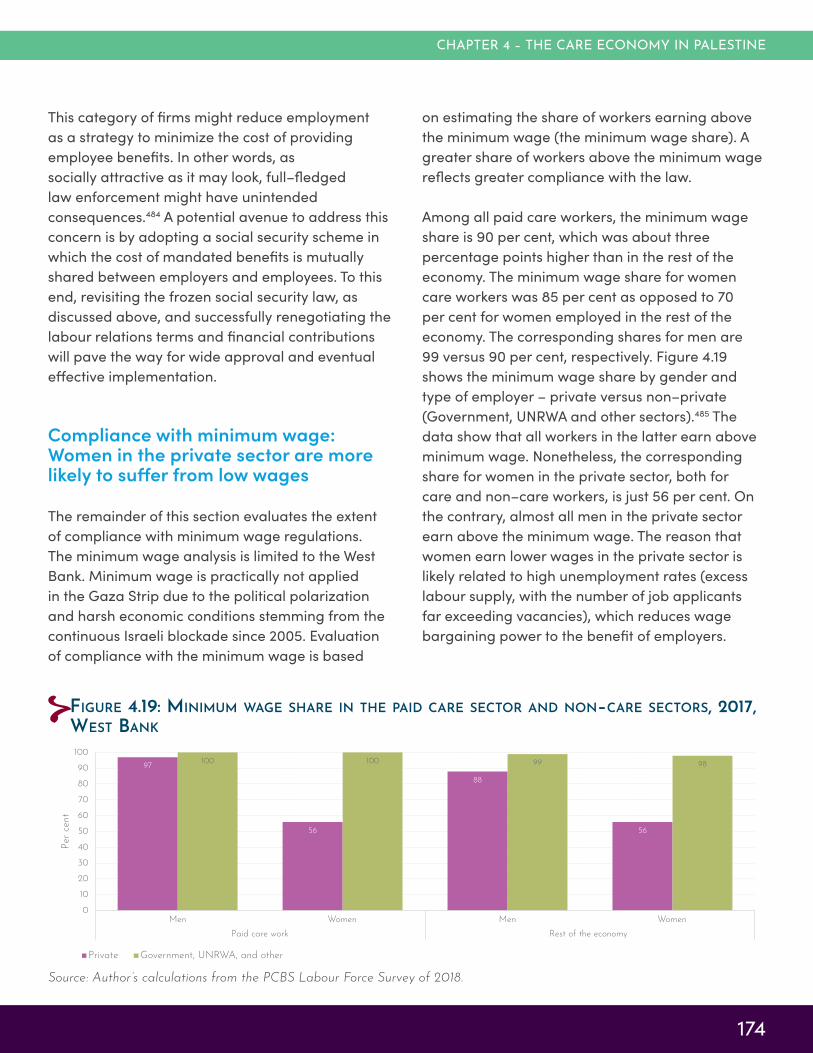
CHAPTER 4 – THE CARE ECONOMY IN PALESTINE
174
on estimating the share of workers earning above
the minimum wage (the minimum wage share). A
greater share of workers above the minimum wage
reflects greater compliance with the law.
Among all paid care workers, the minimum wage
share is 90 per cent, which was about three
percentage points higher than in the rest of the
economy. The minimum wage share for women
care workers was 85 per cent as opposed to 70
per cent for women employed in the rest of the
economy. The corresponding shares for men are
99 versus 90 per cent, respectively. Figure 4.19
shows the minimum wage share by gender and
type of employer – private versus non–private
(Government, UNRWA and other sectors).485 The
data show that all workers in the latter earn above
minimum wage. Nonetheless, the corresponding
share for women in the private sector, both for
care and non–care workers, is just 56 per cent. On
the contrary, almost all men in the private sector
earn above the minimum wage. The reason that
women earn lower wages in the private sector is
likely related to high unemployment rates (excess
labour supply, with the number of job applicants
far exceeding vacancies), which reduces wage
bargaining power to the benefit of employers.
This category of firms might reduce employment
as a strategy to minimize the cost of providing
employee benefits. In other words, as
socially attractive as it may look, full–fledged
law enforcement might have unintended
consequences.484 A potential avenue to address this
concern is by adopting a social security scheme in
which the cost of mandated benefits is mutually
shared between employers and employees. To this
end, revisiting the frozen social security law, as
discussed above, and successfully renegotiating the
labour relations terms and financial contributions
will pave the way for wide approval and eventual
effective implementation.
Compliance with minimum wage: Women in the private sector are more likely to suffer from low wages
The remainder of this section evaluates the extent
of compliance with minimum wage regulations.
The minimum wage analysis is limited to the West
Bank. Minimum wage is practically not applied
in the Gaza Strip due to the political polarization
and harsh economic conditions stemming from the
continuous Israeli blockade since 2005. Evaluation
of compliance with the minimum wage is based
figure 4.19: minimum wage share in The paid care secTor and non–care secTors, 2017, wesT bank
Source: Author’s calculations from the PCBS Labour Force Survey of 2018.
97
56
88
56
100 100 99 98
0
10
20
30
40
50
60
70
80
90
100
Men Women Men Women
Paid care work Rest of the economy
Per
cent
Private Government, UNRWA, and other

CARE ECONOMY AND PROMOTING GENDER EQUALITY
175
recommended that the Government issue a decree
obliging employers to pay salaries via cheques/
bank deposits and grant MoL inspectors access to
firms’ payroll records. This would allow for direct
spotting of non–compliance.
To conclude, the analysis shows that, as far as
working conditions are concerned, most of those
employed in care work enjoy some employment
rights. However, more efforts should be exerted to
expand coverage in the private sector. Low pay,
mainly among women, is the main caveat. The last
section of this chapter recommends a number of
measures to mitigate the gender wage gap in paid
care work and in the rest of the economy.
4.7 Conclusions and policy recommendations
Summary of main findings
This chapter explored the scope and distribution of
the care economy, with an emphasis on estimating
the extent of time allocated to unpaid care work by
gender, employment status, education level, income
level, and other demographic and socioeconomic
characteristics. It also explored the size and
characteristics of the paid care sector (education,
health and social care services), mainly focusing
on working conditions and the extent to which this
sector provides decent jobs.
The findings show that unpaid care in Palestine
is disproportionately the responsibility of women.
Markedly, time spent on unpaid care varies among
women by demographic and socioeconomic
characteristics showing, for example, differences by
income, level of education, employment status, and
age of children. Still, marital status is considered the
most influencing factor. The findings also show that
little time is allocated to care for the elderly. The
Enhance compliance with the national minimum wage
Existing literature shows that low compliance with
minimum wage regulations in the West Bank can be
attributed to a lack of government enforcement.486
In particular, the Ministry of Labour has lacked
sufficient human capital and the logistical
capacity to ensure high compliance rates and
has not applied stringent penalties for violating
the minimum wage law. While the law states that
non–compliance is subject to immediate sanctions
(fines), inspectors often issue a warning and only
use sanctions as the last option. Furthermore,
the fine (USD 70 to 100 per employee paid
below the minimum wage) is insufficient to deter
non–compliance.487
In light of this section’s findings of weak
compliance with the minimum wage, mainly for
women employed in the private sector, a key
recommendation to enhance compliance is for
MoL to strictly implement sanctions, as mandated
by the labour law. It is also vital to raise the cost
of sanctions to a level that would eventually deter
non–compliance. Previous estimates indicate that
an optimal fine should be 2,400 shekels (USD 700)
per employee.488 In parallel to law enforcement, a
dialogue should be reinitiated with private sector
representatives to encourage employers to comply
with minimum–wage rules.
In addition to strictly enforcing sanctions, MoL
should cooperate closely with civil society
organizations and labour unions to raise awareness
about fair pay and mobilize the local community
to denounce minimum wage violations. It is also
crucial to raise employees’ awareness regarding
their rights, including to a minimum wage, and
encourage them to file complaints against
non–complying employers. Nevertheless, many
unempowered employees, particularly women,
may choose not to do so for fear of retaliation
and potential job loss. To address this, it is

CHAPTER 4 – THE CARE ECONOMY IN PALESTINE
176
Expand ECCE to reduce the time married women allocate to unpaid care
This is vital to boost women’s participation in
the labour market. It is recommended that the
Government mobilize resources to enforce
the newly ratified education law, such that KG
education becomes universal. Furthermore, since
the market has failed to expand nursery services,
as only a fraction of young children are enrolled
in nurseries, the Government should intervene to
expand this sector – either by establishing more
public nurseries or providing financial incentives
to the private sector and NGOs to deliver these
services. Given Palestine’s high young–age
dependency ratio, the financial resources needed
to expand ECCE are likely substantial. In this
respect, given the fiscal challenges facing the
Palestinian Government, different provision models
and financing options should be explored.
Improve working conditions for women in the care sector
Expanding coverage of minimum wage and other
work benefits, including maternity leave, severance
payment, paid vacation, and health coverage, is
vital to enhance women’s linkages to the labour
market and ensure a high quality of service
provided by the paid care sector. This is particularly
important given the overrepresentation of working
women in the paid care sector as compared to
other forms of employment.
To this end, the frozen social security law should
be revisited, with renegotiated terms to ensure
widespread approval of employers and workers.
Social security allows cost–sharing of work benefits
and thus provides incentive to employers in the
private care sector to hire more women. It is also
recommended that the Government impose higher
sanctions on employers who violate the minimum
wage law. Furthermore, initiating dialogue with
reason is possibly related to the age composition of
the Palestinians, in which elderly represents a small
fraction of the population.
This chapter also shows that while enrolment in
KG education is relatively high, mostly provided
by non–public institutions, Palestine lacks early
childhood care services, especially for children
younger than 4 years old. This obstacle likely
contributes to the extensive time that married
women spend in unpaid care. Reflecting time–use
imbalances, married and employed women spend
many more hours than married and employed men
earning a living and caring for the family.
The paid care sector employs about 15 per cent
of total employment and half of all employed
women, and the majority of paid care workers
are educators. Except for health occupations,
women represent the majority in each of the paid
care occupations. The findings also show that the
Government hires half of all paid care workers,
followed by the private sector, and the UNRWA.
Most of the paid care employees in Palestine are
formal, though formality is lower in the private
sector relative to the public sector and the UNRWA.
Barriers in regulation and weak enforcement are
key factors. Most notably, only half of women, as
opposed to almost all men, employed in the care
sector earn above the minimum wage.
Policy recommendations
Based on these findings, this chapter provides a
number of policy recommendations that aim to
reduce and redistribute time allocated to unpaid
care, and improve working conditions in the paid
care sector. For ease of exposition, the rationale
and nature of these recommendations were
discussed separately in the corresponding parts of
the chapter. This section provides a brief summary
of these recommendations.

CARE ECONOMY AND PROMOTING GENDER EQUALITY
177
employers to encourage compliance and raise
workers’ awareness of their minimum wage rights
is expected to enhance the coverage of minimum
wage.
Work to change gender norms around care work
Redistributing the responsibility of unpaid care
work from women to men is key to enhancing
gender equality. To this end, paternity leave policy
is commonly utilized other countries. Although
such a policy might be ineffective in Palestine
in the short–term, as the gender labour division
is deeply rooted, it could be effective in the
long–run, if coupled with structural change. A
key recommendation is for the Government to
cooperate with local and international stakeholders
to embark on public awareness campaigns and
introduce capacity–building initiatives to promote
gender equality. Awareness–raising should also
target younger generations, introducing gender
equality within curricula at various educational
levels.

178
CARE ECONOMY AND PROMOTING GENDER EQUALITY
lessons from the 2017–2022 national strategy on early childhood develoPment in Palestine
Effective early childhood development is an essential component for
the well–being and healthy development of children and can have
significant implications on long–term development trajectories. Yet,
the ECCE services offered in Palestine are not always complete or well
coordinated among the different ministries and relevant stakeholders.
As a result, Palestinian children in early childhood face inequality in
the access to and quality of available ECCE services. According to the
2017 Population, Housing and Establishments Census, only 54 per cent
of children aged 3–5 were enrolled in kindergartens. These enrolment
rates increased by age, with only 15 per cent of 3–year–olds enrolled
in kindergarten, compared to 67 per cent for 4–year–olds and 79 per
cent for 5–year–olds.498 Furthermore, data indicate acute disparities
in ECCE access between the least and most advantaged children.499
Evidence from ECD interventions indicate that investments in the
cognitive development of children aged 5 and under have high
rates of return in terms of educational, behavioural and health
outcomes and also help to improve equity by mitigating disparities
in development trajectories that stem from a child’s socioeconomic
background.
Given that the 0–5 age bracket constitutes roughly 14 per cent of the
population in Palestine, large–scale investment in ECCE could redirect
development trajectories and enhance human capital formation,
while reducing costs by mitigating the incidence of later health and
social problems. To capitalize on this opportunity, the Government
of Palestine launched the 2017 National Strategy for Early Childhood
Development and Intervention in order to prioritize investment in
ECD, increase momentum towards policy intervention and accelerate
progress on ECD outcomes. The Strategy calls for a multisectoral
service–delivery system that is capable of providing high–quality,
CHAPTER 4 – THE CARE ECONOMY IN PALESTINE
179
accessible, integrated services to children
and families.500 Mothers are mentioned as
a specific target group, as well as women
of reproductive age, and a special focus is
placed on marginalized poor families and
families with children with development
delays and disabilities.501
Given the interdisciplinary nature of
ECD, progress on outcomes requires
an integrated and comprehensive
array of interventions across the health,
education, and protection sectors. MoSD
spearheaded the effort, in partnership
with MoH and MoE, and worked together
with nurseries and kindergartens (in
cities, villages and camps), universities,
NGOs and international organizations.
This cooperation between government
agencies and civil society organizations,
including local and international NGOs and
community–based organizations (CBOs),
was paramount to the successful design
and adoption of the strategy.502
The ECD National Strategy provides
a framework for coordination and
collaboration across the diverse range
of stakeholders in order to streamline
interventions and administrative processes
and ensure adequate advancement of
early childhood development throughout
the country. The Strategy enumerates five
strategic objectives to guide multisectoral
action and intervention on ECCE services.
These objectives include: 1) to ensure
access to equitable and comprehensive
services; 2) offer high–quality services;
3) ensure sustainable delivery of services
through strengthened commitment and
partnerships among relevant stakeholders;
4) design policies and regulations; 5)
develop an effective monitoring and
evaluation system for services. Under
each of these strategic objectives, the
implementation framework identifies
several specific practical objectives, and
outlines the interventions, target outputs
and designated actors responsible for
carrying them out (including the three
government ministries, NGO sector,
civil society organizations and relevant
international organizations).
Given the high levels of inequality in
ECCE services and outcomes, ensuring
inclusivity in the policymaking process
was an essential feature of the successful
design and adoption of the ECD Strategy.
A full participatory approach was
used to design and adopt the Strategy
and provide a framework for further
intervention. It engaged all of the target
groups – including children, youth councils,
NGOs, civil society actors and women –
and involved a wide array of workshops
and discussions with all partners. This
participatory approach ensured that the
resulting Strategy reflected the needs of
different groups of children and helped to
ensure the participation of marginalized
voices.
The adoption of the Strategy has helped
to accelerate action to develop new ECD
activities. Several initiatives and tools
have been developed since the adoption
of the Strategy, including the creation
CHAPTER 4 – THE CARE ECONOMY IN PALESTINE
180
of the national ECD Working Group,
establishing a database for monitoring
ECD indicators, training of education and
health professionals, publishing of a guide
for developmental behavioural scales and
educational materials for parents and
educators, among others.503
The monitoring and evaluation framework
outlines a range of specific indicators under
each objective to assess the impact and
results of the interventions, to be carried
out in coordination between the three
main ministries responsible for collecting
the data for the agreed indicators. The
adoption of the Strategy led to the creation
of the Palestinian National ECD committee,
comprised of members from the three
relevant ministries (MoSD, MoE, MoH), in
order to institutionalize the coordination
mechanisms outlined in the Strategy’s
implementation framework.
Yet, the ministries still face significant
obstacles to fully implementing the
Strategy’s objectives and improving the
efficacy of interventions. One of the primary
challenges hindering its effectiveness is
the lack of sufficient human and financial
resources to implement and evaluate
its interventions. Without sufficient data
collection and monitoring, interventions
cannot be adequately assessed,
implemented and improved in order to
have meaningful impact. The challenges
faced in implementing the National
Strategy indicate the benefits of starting at
the micro level with small pilot programmes
that can generate more robust evidence of
impact. By focusing attention and resources
on one specific geographic area, resources
can be maximized throughout the process
of designing, implementing, monitoring and
evaluating the results of the intervention,
and the policy toolkit can be refined while
more funding is generated to scale–up the
successful elements of the pilot to other
regions.
While evidence on the effects of these
ECD interventions is still limited, given
difficulties with monitoring and data
collection, it is clear that the adoption of
the National Strategy for Early Childhood
Development has galvanized State efforts
to improve outcomes and established ECD
as an important priority within Palestine’s
national development agenda. Developing
a national strategy has helped raise
awareness among the community and
relevant stakeholders about the importance
of quality ECCE services and has brought
significant momentum towards addressing
ECD challenges. The success of the process
relied on the relevant agencies and
ministries agreeing to work together and
build effective partnerships with external
organizations in order to develop a unified
vision and coherent implementation
framework capable of achieving
development targets.

MAIN PATTERNS AND FUTURE CHALLENGES
5THE CARE ECONOMY
IN TUNISIA
5.1 Overview
5.2 Care policies and services in Tunisia
5.3 Unpaid care work in Tunisia
5.4 Paid care work
5.5 Key fΙndings and policy recommendations
183
184
187
197
205

5 KEY MESSAGES
The ratio of women’s–to–men’s time spent on unpaid care work per week in Tunisia is nearly 6:1.1Despite their low overall participation in the labour market, women are
highly represented in paid care sectors.2Most paid care–sector jobs are in the public sector, primarily in education and health, while the private sector dominates in personal care and early
childhood education.
3
The care sector suffers two major limitations that require government intervention: 1) the quality of services (reflected by the qualifications of its workers), and 2) the poor quality of employment (reflected by levels of informality).
4
There is a need for a coordinated national care strategy to identify
priorities in terms of the care economy and to coordinate investment in this
critical sector.
5
CARE ECONOMY AND PROMOTING GENDER EQUALITY
183
5.1 Overview
In 2010, Tunisia was one of very few countries
in the Arab States that had reached the peak
of its demographic dividend, with nearly 2.3
working–age individuals for every dependent.
The beginning of this new phase of population
aging marks an increase in the dependency ratio,
which will bring its share of new challenges to a
country struggling to find a path towards economic
growth. Over the past decade, Tunisia has faced
substantial economic challenges. According to
the published official numbers by the National
Institute of Statistics (INS), economic growth has
not exceeded 2 per cent over the past decade. The
unemployment rate, which has been stagnant at
around 15 per cent since 2013, particularly affects
young people and women.504 The last decade has
also been marked by a deterioration in the quality
of public services in the health and education
sectors.505
Despite these challenges and the growing need
to improve and extend education and health
services to the entire population, Tunisia lacks a
comprehensive national care policy based on an
objective assessment and identification of national
needs. Indeed, a review of public programmes
reveals scattered strategies managed by several
ministries, without clear linkages and objectives to
address the care sector as a whole. Care services
are little known and not well studied in Tunisia.
The impact of care provision on the well–being of
the population is little discussed, despite strong
empirical evidence linking the well–being of several
population groups to the availability of quality care
services in several countries.506 Investment in the
care economy could be an effective channel for
poverty reduction. By providing households with the
necessary social care services, women’s chances
of engaging in income–generating activities would
increase considerably. At the same time, better–
quality care would strengthen the conditions for the
accumulation of children’s human capital.
The lack of a comprehensive national care strategy
has important implications for the economy. The
low participation of women in the labour market is
strongly determined by social norms that impose
a gendered pattern of time use within the family.
Unpaid domestic work and care for the family are
tasks that fall on women, which greatly reduces
their opportunity to engage in income–generating
activity outside the home. The labour market
participation rate of married women does not
exceed 19 per cent compared to the national
average of 27 per cent.507 Moreover, inequalities
begin very early in childhood and are largely
determined by the economic and social conditions
in which people grow up. Access to quality early
childhood education and health services determine
children’s chances for human development and
affects them through their adult lives. Investment in
these forms of care thus has long–term implications
for the country’s development.
It is important to reconsider the care sector from
a development perspective in order to determine
policy priorities, identify appropriate solutions
to meet the aspirations of the population, and
capitalize on the potential of the care sector to
create more and good quality jobs in the future.
Indeed, unemployment poses one of the most
pressing challenges for Tunisia. Official data
from INS show that the total number of people in
the labour force increased from 3.7 million to 4.1
million from 2008–2019. The unemployment rate
has recorded a notable increase since 2005 and
remains fairly high at 15.4 per cent (21.7 per cent for
women and 12.1 per cent for men).508 Meanwhile,
investment in the care economy has the potential
to generate employment while providing essential
services for the population.
This analysis of the care economy in Tunisia
includes an overview of the current state of care
policies and services, followed by an analysis of
time spent on unpaid care work among women
CHAPTER 5 – THE CARE ECONOMY IN TUNISIA
184
and men, including differences in unpaid care
work according to the characteristics of women
and their households. It focuses on the paid care
sector, assessing the size of public and private
paid care sectors, the prevalence of informality,
and the sociodemographic characteristics of
workers in care sectors. Finally, it concludes with
policy recommendations for investment in the care
economy in Tunisia.
5.2 Care policies and services in Tunisia
Early Childhood Care and Education (ECCE)
A multisectoral national strategy for early childhood
development for 2017–2025 was developed by
the Ministry of Women, Family, Childhood and
Seniors (MWFCS) and adopted by the Ministerial
Council in 2018. The strategy outlines a vision for
early childhood development (ECD) to ensure
integrated physical and cognitive development
services for all young children, especially the most
disadvantaged. It is based on five strategic goals,509
namely: development of early childhood services
through the equitable and large–scale expansion
of integrated and quality services in health,
nutrition and ECCE; fostering a favourable family
environment, primarily through parental education;
strengthening the institutional environment and
the skills and competencies of professionals in
the early childhood sector; promoting community
approaches to ECD; and monitoring, evaluation,
governance and financing for implementing the
strategy.
Specifically, ECCE exists in various forms in Tunisia,
with services according to children’s ages and
needs. Kindergarten (KG) 1 and 2 are provided
for children aged 0–3 years and 3–6 years,
respectively, administrated by the MWFCS. Koranic
schools are also available for children aged 3–5
for initiation to learning the Koran, reading and
writing, but they fall under the jurisdiction of the
Ministry of Religious Affairs. Preparatory classes for
children aged 5–6 years (similar to KG2) are offered
in public, non–governmental and private primary
schools, which fall under the Ministry of Education
(MoE). Preparatory classes for 5–year–old children
are an integral part of basic education and strongly
recommended, but they are not compulsory.
Although multiple options are available for ECCE, it
is actually not mandatory for children of any age.
One third of Tunisian children were not enrolled in
any form of ECCE (Figure 5.1).
Enrolment rates are very low among the youngest
children – with only 1 per cent of children aged
0–3 years who are eligible for KG1 services actually
enrolled. By comparison, 32 per cent of children
aged 3–6 are in KG2. Also, for the latter age group,
25 per cent of children were enrolled in public
preparatory classes and 10 per cent were in Koranic
schools.
There are significant regional disparities in access
to KG2. For kindergartens, MWFCS data indicate
that in 2017 enrolment varied from 10 to 60 per
cent across the 24 administrative governorates of
Tunisia. In addition to regional disparities, strong
socioeconomic inequalities are observed in access.
Whereas 13.1 per cent of children from the poorest
households attend ECCE, the rate increases to
81 per cent of children in the richest households.
Striking inequalities are also observed in the
availability of teaching materials at home and adult
support for early learning. According to the Tunisia
Multiple Indicator Cluster Survey, 82.8 per cent of
children in the richest wealth quintile had more
than three books at home, compared to only 30.2
per cent in the poorest quintile. Among the children
in the latter group, 60.6 per cent received parental
help with their homework, compared to 86.9 per
cent in the former group.510

CARE ECONOMY AND PROMOTING GENDER EQUALITY
185
As of 2015, there were 313 KG1, 4,118 KG2, 1,497
Koranic, and 2,000 preparatory classes nationally.
Kindergarten is predominantly provided by the
private sector (90 per cent of all classes), 9 per cent
of classes are public (managed by municipalities)
and 1 per cent are managed by civil society
organizations (CSOs). The relevant ministries
establish the quality standards for ECCE, curricula,
minimum qualifications of ECCE professionals,
and the infrastructure. The number of educators
required is based on the children’s age group: 15
children per educator for the 0–2 age group, 20
children per educator for the 3–5 age group, and
figure 5.1: disTribuTion of children aged 0–5 years by ecce enrolmenT, 2015
Source: Authors’ elaboration based on the World Bank 2015.526
32
25
32
1
10
0
5
10
15
20
25
30
35
Not attending ECCE Preparatory classes KG 2 KG 1 Koranic school
Perc
ent
25 children per educator for the 5–6 age group.
KG1 and KG2 institutions have two unannounced
inspection visits per year, and Koranic schools have
one (often announced) visit per year.
The actual qualifications of ECCE professionals
are not aligned with the minimum qualifications
required – which is to have a university degree in
ECD – as more than 44 per cent of those working
in the sector had a secondary level education
or less in 2015 (Table 5.1). Another 32 per cent of
practitioners had a vocational training diploma and
only 19 per cent had a university degree.
Number of professionals Per cent
Primary education 260 2
Secondary education lower cycle 6 072 42Secondary education upper cycle 758 5
Vocational training in ECD 4 684 32
University degree (general) 2 383 16
University degree (specializing in ECD) 404 3
Total 14 561 100
Source: World Bank 2015.527
Table 5.1: disTribuTion of ecce professionals by educaTion level

CHAPTER 5 – THE CARE ECONOMY IN TUNISIA
186
Of all the teachers, only 3 per cent had a university
degree specializing in ECD.
The ECCE sector faces a range of challenges,
including price regulation, quality of services
and availability across locations. Numerous
establishments in the sector do not comply with
the required standards and authorizations. Hence,
the MWFCS has published a list of authorized
kindergartens and nurseries by governorates
to enable parents to check the legal status of
establishments before enrolling their children.
Elder care
At the demographic level, population ageing is
accelerating in Tunisia. The proportion of people
aged 60 and over has increased from 9.3 per cent
in 2004 to 11.7 per cent in 2014. It will rise to 17.8 per
cent by 2030 and reach 24.2 per cent of the total
population in 2044. The old–age dependency ratio
will rise from 1.8 in 2014 to 2.2 in 2020, reaching 3
in 2030 and 4.2 in 2044, according to population
projections of the INS.
The prevalence of non–communicable diseases
(NCDs) is high and is becoming the main cause
of morbidity and mortality. The prevalence of
hypertension is 63.9 per cent for people aged 60 to
69 years and 73.4 per cent for people aged 70 and
over.511 The prevalence of diabetes is respectively
37.5 per cent and 36.3 per cent for these same age
groups. Thus, in addition to an increasing elderly
population, Tunisia faces a substantial health
burden among the elderly that is likely to affect
their care needs.
In Tunisia, national health policies, strategies and
plans include care for elderly people with a loss of
autonomy and the strengthening of community–
based care, including home visits and home care
for the elderly or seriously ill. The reform of the
social protection system undertaken by the Tunisian
Government, through the establishment of the
National Social Protection Fund in accordance
with ILO Recommendation 202 of 2012,512 includes
a minimum income for the elderly and universal
health coverage for all Tunisians. In Tunisia, there
are 12 residential care centres, with a capacity of
830 beds, in which indigent elderly persons without
family support are placed. Others may be placed
with foster families for a monthly allowance of
TND 150 dinars (approximately USD 50) paid to the
family. The programme is managed by the MWFCS.
Nevertheless, Tunisia’s health and social protection
systems face several challenges to adequately
meet the needs of the elderly in the face of the
country’s demographic and epidemiological
transition. The health insurance system in Tunisia
covers nearly 90 per cent of the population
through its contributory and non–contributory
components.513 Poor households headed by elderly
persons and households with limited incomes
benefit respectively from free medical assistance
or medical assistance at reduced rates, allowing
them access to public health services. Chronic
diseases are fully covered by the health insurance
scheme. However, the system does not cover
citizens fairly in terms of the quality of services
and the costs incurred. Several illnesses are not
covered by health insurance, especially for those
receiving free medical assistance. There are strong
regional disparities in terms of access to university
hospitals, which are generally better equipped and
offer better–quality services. Despite widespread
coverage by the health insurance system, these
gaps lead to a relatively high level of direct costs
incurred – out–of–pocket expenditures account
for 38 per cent of spending on health514 – exposing
households to the risk of falling into poverty.

CARE ECONOMY AND PROMOTING GENDER EQUALITY
187
Paid leaves
In the public sector, mandatory maternity leave of
two months is paid at 100 per cent of the salary,
with the possibility of maternity leave paid at half
the salary, not exceeding four months. Two breaks
of half an hour each during working hours are
allowed for breastfeeding for up to nine months
after childbirth. In the private sector, maternity
leave is 60 days, part of which is paid by social
security funds, with the rest borne by the worker
(i.e. the income replacement level from social
security is less than 100 per cent). Paternity leave
is two days in the public sector and one day in the
private sector.515
box 5.1: daTa and meThods
The statistical analysis herein is based on two data sources. The first is the 2014 Tunisia Labour Market Panel Survey (TLMPS), which was conducted by the Economic Research Forum (ERF) in collaboration with the INS.528 The TLMPS includes information on time spent in unpaid care activities during the week prior to the interview. Time–use surveys are considered the optimal data source to analyse the distribution of paid and unpaid work among household members. In the case of Tunisia, a single time–use survey, the Time Budget Survey of Women and Men in Tunisia 2005–2006 (TBSWM) was carried out in 2005 by the MWFCS and INS with the support of UN Women Tunisia. Unfortunately, only the aggregate statistics from the report,529 published by the MWFCS, are available. The chapter compares the published TBSWM estimates with the analysis of the TLMPS, where appropriate.
The TLMPS data are used to estimate the time devoted by women and men of working age (15–64) to unpaid care work. The data distinguish between direct and indirect care work but cannot distinguish between direct care work provided for children versus elderly or disabled members of households. Patterns of unpaid care work are analysed by several factors that affect the division of roles between men and women, such as the place of residence, region, age, level of education, the number of children in the household, the number of dependent elderly persons, and household wealth.
The other main data source used is the Tunisian Labour Force Survey (LFS). The survey is conducted on a quarterly basis by the INS and allows for an accurate estimation of labour market indicators and characteristics of the labour force. The analysis focuses on the working–age population, aged 15–64 years. It considers four years: 2010, 2012, 2016 and 2019. The first year reflects the situation just before the political change in 2011, and the following periods reflect the situation during the political and economic transition that the country is experiencing. Analysis of the LFS focuses on the size, characteristics and growth rate of the paid care economy in Tunisia, including the health, education and social care sectors. It is important to note that in the case of Tunisia, the data did not make it possible to distinguish the occupations of domestic workers from those working as cleaners in public and private enterprises. Domestic work is therefore not included in the analysis.
5.3 Unpaid care work in Tunisia
Gender disparities in unpaid care work.
On average, Tunisians aged 15–64 spent 10.2 hours
per week on unpaid care activities (Table 5.2).
A small part of this time was devoted to caring
activities for children and the elderly or disabled
(1 hour, 42 minutes per week). The largest share of
time was devoted to indirect care activities, in which
Tunisians spent about 8.6 hours per week. The most
time–intensive indirect care activities were washing
dishes, laundry and cleaning the house (6.3 hours
per week) and travel related to domestic activities,
particularly shopping and accompanying a family
member (2 hours per week).

CHAPTER 5 – THE CARE ECONOMY IN TUNISIA
188
Men Women Total
Indicator Married Unmarried Total Married Unmarried Total Total
Average hours spent on direct care work per week for children/sick/elderly 0.6 0.0 0.3 4.7 0.7 3.0 1.7
Average hours spent on indirect care work per week 4.0 1.6 2.9 17.8 9.3 14.2 8.6
Average hours spent on grocery–shop-ping/ accompanying family members per week 3.1 1.0 2.2 2.1 1.4 1.8 2.0
Average hours spent on maintenance activities per week 0.2 0.2 0.2 0.1 0.1 0.1 0.2
Average hours spent on cooking, dishes, laundry, cleaning the house per week 0.5 0.3 0.4 15.3 7.6 12.0 6.3
Average hours spent collecting water/firewood/other fuel per week 0.1 0.1 0.1 0.3 0.2 0.3 0.2
Total average hours spent on care work per week 4.6 1.6 3.2 22.4 10.1 17.2 10.2
Average hours spent on paid work per week 32.6 17.1 25.3 5.3 7.8 6.4 15.7
Number of observations 2 180 1 673 3 853 2 567 1 919 4 486 8 339
Source: Authors’ calculations based on the TLMPS 2014.
Table 5.2: average Time spenT on direcT and indirecT care work by sex and mariTal sTaTus, Tunisians aged 15–64, Tlmps 2014
Although the TLMPS data are not fully comparable
with data from the TBSWM 2005, the results
relating to direct care provided to household
members are in line. The TBSWM data showed
that Tunisians devoted 1.98 hours per week to
direct care work (17 minutes per day), compared
to 1.7 hours in the TLMPS 2014. However, a
considerable gap was observed in indirect care
activities between 2005 and 2014. The 2005 survey
showed that household tasks took up an average
of 19 hours per week, compared to 12.7 hours per
week in the TLMPS 2014. However, these numbers
must be compared with caution given that the
2005 survey covered a full 24–hour time–use
calendar. It is possible that the TLMPS methodology
underestimates time spent on unpaid care work
relative to a full time–use methodology (see
Chapter 1).
The most striking feature of the unpaid work
distribution is the gender disparity. Despite the
political, social, economic and family changes that
have taken place in Tunisia,516 tasks traditionally
assigned to women (childcare and domestic work)
are still performed mainly by women. The results
obtained were similar to other Arab States, where
women devoted more time than men to these
activities. Men spent only 0.3 hours on direct care
work compared to 3 hours per week (around 26
minutes per day) among women. The results also
showed that the time spent by women on indirect
care work is five times higher than that of men (14.2
hours per week compared to only 2.9 hours per
week).
For all unpaid care work together, women spent
an average of 17.2 hours compared with only 3.2
hours per week for men. Although the numbers

CARE ECONOMY AND PROMOTING GENDER EQUALITY
189
reported in TBSWM 2005 were higher than those of
the TLMPS 2014, the gender gap in terms of unpaid
work remained almost unchanged. The TBSWM
found that women spent more than six times as
many hours on care work as men (37 hours/week
for women compared to 5 hours/week for men).
Marital status is a key determinant of time spent
in care work. Married women spent 13 per cent of
their week (168 hours) on unpaid work compared
to 6 per cent among unmarried women (Figure
5.2). The largest share of this work was devoted
to indirect care work, which took up 11 per cent
of married women’s and 6 per cent of unmarried
women’s time. These results are very similar to
those reported for the Egyptian case study (see
Chapter 2), which showed that time spent by
married women on unpaid care work is almost
twice the time spent by unmarried women.
When it comes to paid work, married men spent six
times more hours working than married women (19
per cent of weekly hours compared to only 3 per
cent). These figures are strongly influenced by the
fact that the majority of women are not employed,
and suggest that unpaid care work responsibilities,
which are mainly assumed by women (especially
married ones), reduce women’s presence in the
formal labour market and allow men to have
relatively more time for paid work. This finding is
confirmed by Figure 5.3. Employed women spent 19
per cent of their week on paid work compared to 23
per cent for employed men. Women’s involvement
in paid work reduced somewhat their time in
unpaid care work. Among employed women, care
work represented 9 per cent of their weekly time
compared to 11 per cent for non–employed women.
Nevertheless, employed married women spent a
larger percentage of their total weekly time on work
(29 per cent of weekly hours on paid and unpaid
work combined) than employed married men (27
per cent of weekly hours).
Regional disparities in unpaid care work
Despite success on many fronts, Tunisia still faces
persistent regional disparities.517 Development
levels in the country’s coastal areas, which include
56 per cent of the population and 92 per cent of
figure 5.2: percenTage of weekly Time spenT in differenT Types of work, by gender and mariTal sTaTus, age 15–64
Source: Authors’ calculations based on the TLMPS 2014.
Notes: Percentage of total weekly time is calculated based on a 168–hour week.
3
54
19
10
15
3 0 2 0 0 0
11
6
8
2 1 2
13
6
10
3 1 20
5
10
15
20
25
Married Unmarried Total Married Unmarried Total
Women Men
Per
cent
of
tota
l w
eekl
y tim
e
Paid work Direct care work Indirect care work Care work
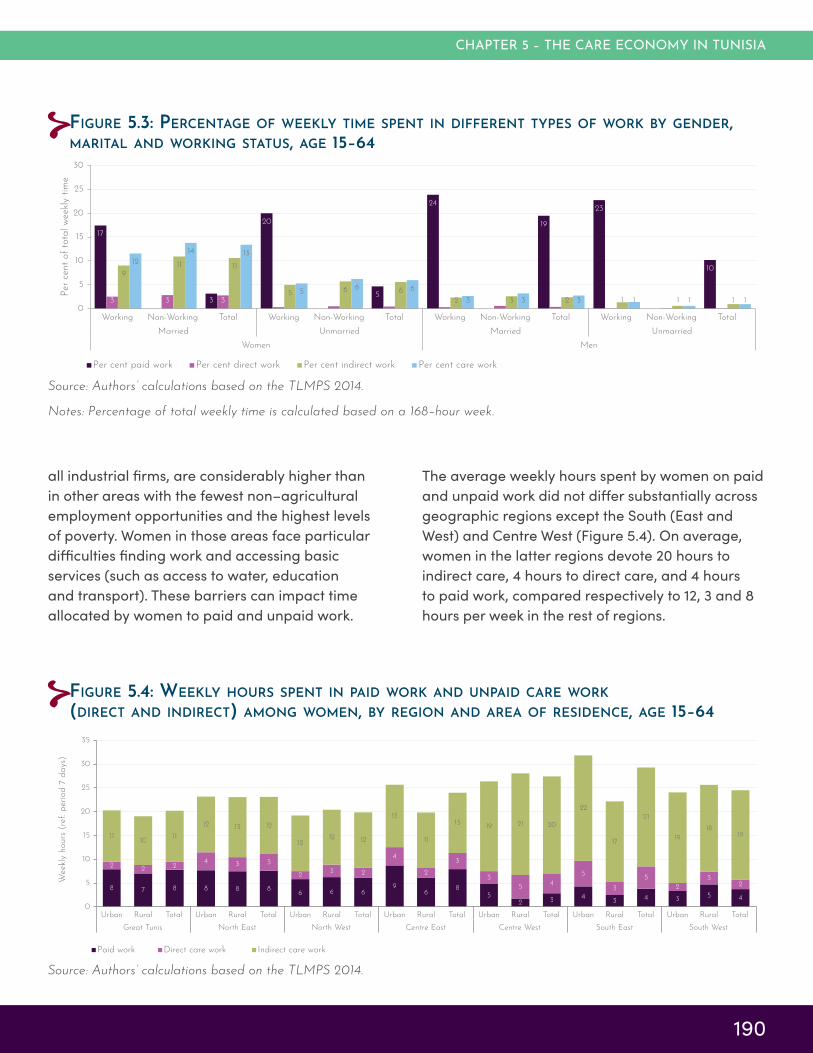
CHAPTER 5 – THE CARE ECONOMY IN TUNISIA
190
figure 5.3: percenTage of weekly Time spenT in differenT Types of work by gender, mariTal and working sTaTus, age 15–64
Source: Authors’ calculations based on the TLMPS 2014.
Notes: Percentage of total weekly time is calculated based on a 168–hour week.
17
0 3
20
05
24
0
19
23
0
10
3 3 3 0 0 0 0 1 0 0 0 0
911 11
5 6 6
2 3 2 1 1 1
12
14 13
56 6
3 3 3 1 1 10
5
10
15
20
25
30
Working Non-Working Total Working Non-Working Total Working Non-Working Total Working Non-Working Total
Married Unmarried Married Unmarried
Women Men
Per
cent
of
tota
l w
eekl
y tim
e
Per cent paid work Per cent direct work Per cent indirect work Per cent care work
all industrial firms, are considerably higher than
in other areas with the fewest non–agricultural
employment opportunities and the highest levels
of poverty. Women in those areas face particular
difficulties finding work and accessing basic
services (such as access to water, education
and transport). These barriers can impact time
allocated by women to paid and unpaid work.
The average weekly hours spent by women on paid
and unpaid work did not differ substantially across
geographic regions except the South (East and
West) and Centre West (Figure 5.4). On average,
women in the latter regions devote 20 hours to
indirect care, 4 hours to direct care, and 4 hours
to paid work, compared respectively to 12, 3 and 8
hours per week in the rest of regions.
figure 5.4: weekly hours spenT in paid work and unpaid care work (direcT and indirecT) among women, by region and area of residence, age 15–64
Source: Authors’ calculations based on the TLMPS 2014.
8 7 8 8 8 86 6 6
96
85
2 34
3 4 3 5 4
22 2
4 3 3
23 2
4
2
3
3
54
5
3
5
2
32
1110
11
12 13 12
1212 12
13
11
1319 21 20
22
17
21
19
1819
0
5
10
15
20
25
30
35
Urban Rural Total Urban Rural Total Urban Rural Total Urban Rural Total Urban Rural Total Urban Rural Total Urban Rural Total
Great Tunis North East North West Centre East Centre West South East South West
Weekl
y hours
(re
f. p
eriod 7
days
)
Paid work Direct care work Indirect care work

CARE ECONOMY AND PROMOTING GENDER EQUALITY
191
figure 5.5: weekly hours spenT in paid work and unpaid care work (direcT and indirecT) among women, by region and mariTal sTaTus, age 15–64
Source: Authors’ calculations based on the TLMPS 2014.
69 8 6
108 7 5 6 6
118
3 3 3 35 4 2
5 4
2
12 5
0 33
12
5
13
61
48
1 54
1 2
15
611
16
6
12 15
7
12
16
813
26
13
20
25
16
21
21
1619
0
5
10
15
20
25
30
35
40
Marr
ied
Unm
arr
ied
Tota
l
Marr
ied
Unm
arr
ied
Tota
l
Marr
ied
Unm
arr
ied
Tota
l
Marr
ied
Unm
arr
ied
Tota
l
Marr
ied
Unm
arr
ied
Tota
l
Marr
ied
Unm
arr
ied
Tota
l
Marr
ied
Unm
arr
ied
Tota
l
Greater Tunis North East North West Centre East Centre West South East South West
Weekl
y H
ours
(re
f. p
eriod 7
days
)
Paid Work Direct care work Indirect care work
Differences in paid and unpaid work distributions
could be explained in part by the labour market
patterns in each region, and the availability of
care services. However, such conclusions should
be taken with caution, as women’s behaviour is
strongly shaped by other individual characteristics,
such as age, marital status, the presence of children
in the household, etc. The role of each factor in
the allocation of women’s time will be discussed in
more details below.
Regional gaps in women’s paid and unpaid work
were stronger when considering marital status
(Figure 5.5). The time spent on unpaid work by
married women living in coastal regions (Great
Tunis, North East or Centre East – the fastest-
growing areas in economic terms) reached around
17 to 21 hours per week, compared to 32 hours for
married women living in the Centre West region. On
the other hand, the time spent on paid work among
all women (married and unmarried) in the Centre
West region did not exceed 3 hours per week,
compared to 6 hours per week for married and 9
to 11 hours per week for unmarried women living in
coastal regions. The lack of job opportunities in the
economically lagging areas, which are mainly the
western regions, compared to the spatial clustering
of firms along the coast may explain the observed
gap in time spent on paid work.
Unpaid care work by age and marital status
Globally, working–age adults in general (both
sexes), spend more time not only on paid work but
also on unpaid care work, than both their younger
and older counterparts.518 This is true for women
in Tunisia, as there was an inverse U–shaped
relationship between age and time spent on paid
and unpaid care work (Figure 5.6). For married
women, the peak time spent on direct care work
was reached in the 25–39 age group, at 8 hours per
week, compared to 5 hours for youth aged 15–24
years and only 3 hours for the 40–54 age group.
The higher number of hours spent in direct care
work by the 25–39 age group is likely due to the
fact that a large proportion of married women at
this age have dependent children. Married women
aged 55–64 spend on average one hour per week
on direct care.

CHAPTER 5 – THE CARE ECONOMY IN TUNISIA
192
for women with no education. Differences were
even greater when considering marital status. For
instance, married women with tertiary education
spent 8.4 hours per week on direct care work, more
than three times that spent by married women with
no education (2.8 hours per week).
The positive relationship between time spent on
direct care and level of education may reflect a
higher value placed by those with higher education
on interaction with children and other household
members in need of care, and potentially greater
time spent supporting children’s educational
activities, among more educated parents. A
growing body of research has found that higher–
educated parents spend more time with their
children.519 For example, Guryan et al. (2008) used
American Time–Use Surveys to show that mothers
with a college education or greater spend roughly
4.5 hours more time per week on childcare than
mothers with a high school degree or less, despite
the fact that they engage in more hours of paid
work.520
Older women are generally expected to spend
time caring for grandchildren and other household
members. However, with changes in the living
arrangements of young couples and increasing
rates of independent households, time devoted to
caring for children among older women is greatly
reduced. Contrary to direct care work, the peak
of indirect care work was observed for married
women aged 15–24 years (22 hours per week).
When it comes to paid work, however, unmarried
women spent more time than married women,
regardless of the age group (Figure 5.6).
More educated women spend more time on direct care work but less time on indirect care work
The time devoted to care for children and other
dependent family members increases with the level
of education (Figure 5.7). Women with university–
level education spent on average 3.3 hours per
week on direct care work, compared to 2.4 hours
figure 5.6: weekly hours spenT in paid work and unpaid care work (direcT and indirecT) among women, by age group and mariTal sTaTus
Source: Authors’ calculations based on the TLMPS 2014.
36 6
35
139
3
5
8
3
10
1
2
1
22
18
18
16
6
1116
14
0
5
10
15
20
25
30
35
15-24 25-39 40-54 55-64 15-24 25-39 40-54 55-64
Married Unmarried
Women
Weekl
y hours
(re
f. p
eriod 7
days
)
Paid Work Direct care work Indirect care work

CARE ECONOMY AND PROMOTING GENDER EQUALITY
193
figure 5.7: weekly hours spenT on paid work and unpaid care work (direcT and indirecT) among women, by educaTion and mariTal sTaTus
Source: Authors’ calculations based on the TLMPS 2014.
3
5
3
5
11
7
7
8
7
10
7
8
3
1
2
5
1
3
6
1
3
8
0
3
17
12
16
17
13
17
18
8
12
18
6
11
0 5 10 15 20 25 30 35 40
Married
Unmarried
Total
Married
Unmarried
Total
Married
Unmarried
Total
Married
Unmarried
Total
No s
choolin
gLess
than
seco
ndary
Seco
ndary
Tert
iary
Weekly hours (ref. period 7 days)
Paid Work Direct care work Indirect care work
In contrast to direct care work, the time spent on
indirect care work is inversely related to women’s
level of education. Women with no education
spent more time on housework (15.5 hours per
week) compared to women with a university
education (10.6 hours). Unmarried women with no
education spent about twice the time on indirect
work compared to unmarried women with tertiary
education (12.3 hours per week compared to 6.4
hours).
The inverse relationship between women’s level
of education and the time allocated to household
activities can be explained by the fact that more
educated women are more involved in paid
work. The time spent on paid work by educated
women was more than twice as much as that
spent by uneducated women (8.2 hours per
week as opposed to 3.4 hours for women with no
education). Conversely, married women spent
three times as much – with married women with a
tertiary education spending 10.5 hours per week on
paid work in comparison to 3 hours per week for
married women with no education.
The results of the 2005 TBSWM similarly found
that the most highly educated women performed
much less domestic work than less–educated
women (26 hours per week for women with tertiary
education, as opposed to 40 hours for women with
primary education). The decrease in time devoted
to indirect unpaid care work for women with
higher education could be explained by the fact
that education is highly correlated with household
wealth. More educated, wealthier women are likely
to have greater access to time–saving devices (i.e.
electrical appliances) and greater opportunities to
use market services to reduce their own time spent
on unpaid care (i.e. domestic workers).

CHAPTER 5 – THE CARE ECONOMY IN TUNISIA
194
Distribution of unpaid care work by labour market status
The time spent on unpaid work was shaped more
by women’s marital status than their employment
status (Figure 5.8). The difference between
employed and non–employed women in time
spent on unpaid work per week was less than
2 hours for unmarried women and 4 hours for
married ones. The time spent on unpaid work by
married, working women remained twice that of
unmarried women, regardless of their working
status. Conversely, employed married women spent
less time on paid work than employed women who
were unmarried (29 hours per week compared to
34 hours). This indicates that married women may
seek out forms of employment that require shorter
working hours to allow for time for unpaid care
work. Nevertheless, the total hours of work (paid
and unpaid) completed by employed, married
women in a week exceeded that of all other groups.
Employed, married women spent a total of 48
total hours in work, compared to 42 hours among
employed, unmarried women and 45 hours among
employed, married men.
A large body of literature suggests that time spent
on paid and unpaid care work are closely related
to household economic well–being.521 As observed
in many developing countries, the poor spend a
lot of time (paid or unpaid) on work to meet their
needs (water collection, fuel wood collection, etc.)
and hope to escape poverty.522 However, more time
spent working in paid and unpaid work means
less time for leisure and therefore a greater risk of
suffering from ‘time poverty’.523
Women employed in the private sector,
independent of their marital status, devoted
substantially more hours to paid work, and fewer
hours to unpaid care work, compared to those
in the public sector or who were self–employed
or unpaid family labourers (Figure 5.9). Married
women working in the public sector or in unpaid
family labour, and those without jobs, spend more
time on unpaid work (22 to 23 hours per week)
compared to unmarried women in similar roles (10
to 13 hours per week).
Source: Authors’ calculations based on the TLMPS 2014.
figure 5.8: weekly hours of paid and unpaid care work (direcT and indirecT) by sex, working and mariTal sTaTus, ages 15–64
2934 31
0 0 0
40 38 39
0 0 0
40 2
51 3
10
0
1 0 0
158
12
18
10
15
42
3
41 20
10
20
30
40
50
60
Married Unmarried Total Married Unmarried Total Married Unmarried Total Married Unmarried Total
Employed Non-employed Employed Non-employed
Women Men
Weekl
y H
ours
(re
f. p
eriod 7
days
)
Paid work Direct care work Indirect care work

CARE ECONOMY AND PROMOTING GENDER EQUALITY
195
Source: Authors’ calculations based on the TLMPS 2014.
figure 5.9: weekly hours of paid and unpaid care work performed by women, by mariTal sTaTus and Type of employmenT, ages 15–64
1
27
38
40
23
2
21
35
41
30
5
4
3
3
7
1
1
2
0
1
18
18
15
14
15
9
12
15
7
10
0 10 20 30 40 50 60 70
No job
Unpaid familylabour
Self-employed
Private wage
Public
No job
Unpaid familylabour
Self-employed
Private wage
Public
Marr
ied
Unm
arr
ied
Weekly hours (ref. period 7 days)
Paid Work Direct care work Indirect care work
Household structure and women’s time spent in unpaid care work
Although women, and especially married women,
perform the bulk of unpaid care work, different
household structures can affect the distribution and
amount of time spent on these activities. Caring
for dependents, including care for children in
different age groups, the elderly and ill or disabled
persons has different implications on women’s time,
based on the needs of each group. This section
describes the effect of household structure on
women’s time spent on unpaid care work, using the
multivariate methodology described in Chapter 1
and the Methodological Appendix. The analysis is
disaggregated by marital status, since the effects
of having children in the household likely differ for
married and unmarried women, who may spend
time caring for younger siblings. The analysis is also
disaggregated by women’s education, to further
explore the finding above that more educated
women have different patterns of time use in
direct and indirect care work than women with less
education.
Adding one child under 3 years of age increased
the weekly hours married women spent on care
work by an average of 6 hours per week across
all educational levels (no significant effect was
detected for unmarried women). A child under age
3 increased the weekly hours devoted to unpaid
care work by married women with no education by
11 hours, and by 10 hours for married women with
secondary education (Figure 5.10). The presence of
children under age 3 had a lower impact (5 hours
per week) on the weekly hours of unpaid care work
among married women with tertiary education
(although the result was not statistically significant).
The time allocated by married women to unpaid
care work decreased with the age of their children
(no significant effect was detected for unmarried
women for children of any ages) (Figures 5.11 and
5.12).

CHAPTER 5 – THE CARE ECONOMY IN TUNISIA
196
Source: Authors’ estimations based on the TLMPS 2014.
Note: The grey bars indicate 95 per cent confidence intervals on the estimates of additional time.
figure 5.10: predicTed addiTional weekly hours of unpaid care work wiTh a child under 3 in The household, by educaTion, Tunisian married women 15–64
17.7
23.5
21.022.9
21.1
10.5
-1.7
9.9
5.0 5.5
-10
-5
0
5
10
15
20
25
No schooling Less thansecondary
Secondary University Total
Pre
dic
ted w
eekl
y hours
of
unpaid
work
Predicted average hours with no child age < 3 Additional hours with a child age < 3
Source: Authors estimations based on the TLMPS 2014.
Note: The grey bars indicate 95 per cent confidence intervals on the estimates of additional time.
figure 5.11: predicTed addiTional weekly hours of unpaid care work wiTh a child aged 3–5 in The household, by educaTion, Tunisian married women 15–64
19.2
21.623.2
25.7
21.7
-0.3
6.8
-0.3
1.3 2.3
-15
-10
-5
0
5
10
15
20
25
30
No schooling Less thansecondary
Secondary University Total
Pre
dic
ted w
eekl
y hours
of
unpaid
work
Predicted average hours of no children aged 3-5 Additional hours with a child aged 3-5

CARE ECONOMY AND PROMOTING GENDER EQUALITY
197
Source: Authors’ estimations based on the TLMPS 2014.
Note: The grey bars indicate 95 per cent confidence intervals on the estimates of additional time.
figure 5.12: predicTed addiTional weekly hours of unpaid care work wiTh a child aged 6–17 in The household, by educaTion, Tunisian married women 15–64
15.5
19.5 20.1
25.7
19.1
5.33.8
5.5
-1.3
4.2
-7
-2
3
8
13
18
23
28
No schooling Less thansecondary
Secondary University Total
Pre
dic
ted w
eekl
y hours
of
unpaid
work
Predicted average hours of no children 6-17 Additional hours with a child aged 6-17
Adding one child aged 3–5 years increased hours
of unpaid care work only for women with primary
education (by 7 hours per week on average).
Meanwhile, the presence of children aged 6–17
in the household increased the time spent on
unpaid work for uneducated married women (by
5 hours per week) and for women with secondary
education (by 6 hours per week). The use of
childcare centres provided by the private and
public sectors may explain such patterns, especially
for children between 3 and 5 years of age.
For married women, the presence of elderly or ill/
disabled persons in the household had a relatively
lower effect (2 hours per week) on hours of unpaid
care work compared to the presence of children;
the effects were also not statistically significant.
5.4 Paid care work
This section examines the characteristics of the
paid care sector, which covers education, health
and social work. The composition of the care sector
in terms of size, the role of the private and public
sectors, the sociodemographic characteristics of
workers, and the role of women are compared with
the rest of the economy (non–care sectors). The
analysis emphasizes the quality of employment
in the care sector, focusing on social security
coverage. The analyses presented are mainly
based on the distribution of care workers by
occupation, but some are based on the sector of
activity.
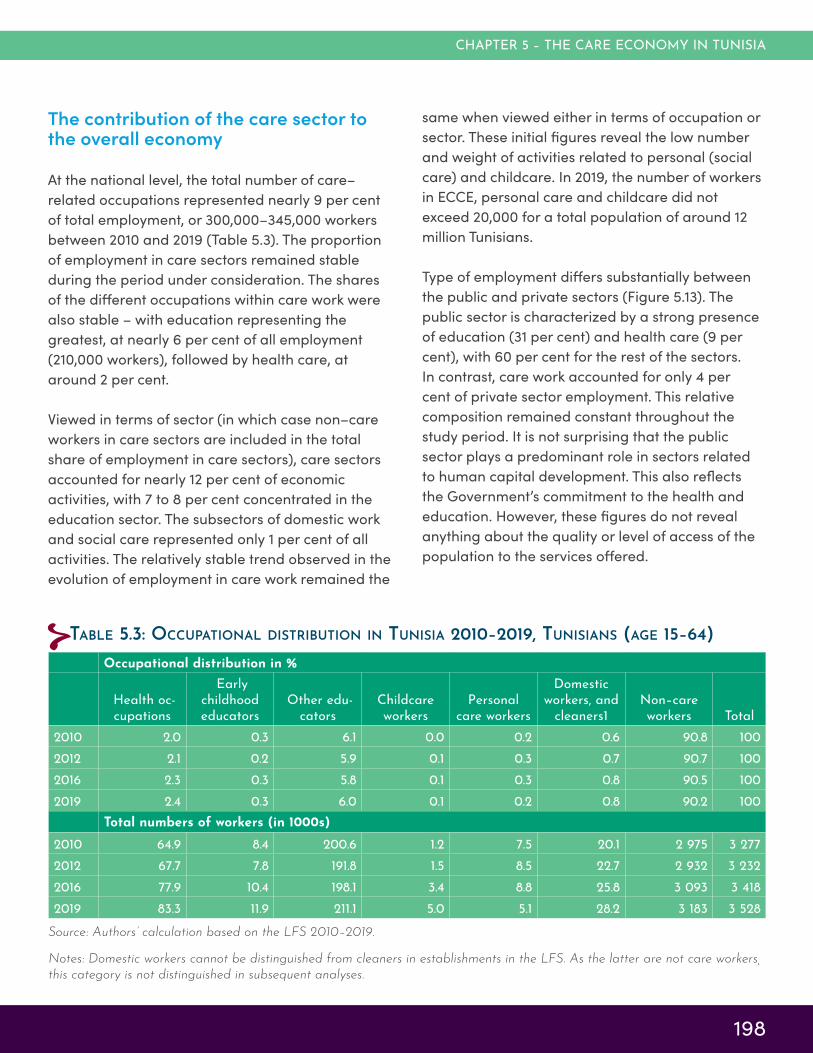
CHAPTER 5 – THE CARE ECONOMY IN TUNISIA
198
The contribution of the care sector to the overall economy
At the national level, the total number of care–
related occupations represented nearly 9 per cent
of total employment, or 300,000–345,000 workers
between 2010 and 2019 (Table 5.3). The proportion
of employment in care sectors remained stable
during the period under consideration. The shares
of the different occupations within care work were
also stable – with education representing the
greatest, at nearly 6 per cent of all employment
(210,000 workers), followed by health care, at
around 2 per cent.
Viewed in terms of sector (in which case non–care
workers in care sectors are included in the total
share of employment in care sectors), care sectors
accounted for nearly 12 per cent of economic
activities, with 7 to 8 per cent concentrated in the
education sector. The subsectors of domestic work
and social care represented only 1 per cent of all
activities. The relatively stable trend observed in the
evolution of employment in care work remained the
Occupational distribution in %
Health oc-cupations
Early childhood educators
Other edu-cators
Childcare workers
Personal care workers
Domestic workers, and
cleaners1Non–care workers Total
2010 2.0 0.3 6.1 0.0 0.2 0.6 90.8 100
2012 2.1 0.2 5.9 0.1 0.3 0.7 90.7 100
2016 2.3 0.3 5.8 0.1 0.3 0.8 90.5 100
2019 2.4 0.3 6.0 0.1 0.2 0.8 90.2 100
Total numbers of workers (in 1000s)
2010 64.9 8.4 200.6 1.2 7.5 20.1 2 975 3 277
2012 67.7 7.8 191.8 1.5 8.5 22.7 2 932 3 232
2016 77.9 10.4 198.1 3.4 8.8 25.8 3 093 3 4182019 83.3 11.9 211.1 5.0 5.1 28.2 3 183 3 528
Source: Authors’ calculation based on the LFS 2010–2019.
Notes: Domestic workers cannot be distinguished from cleaners in establishments in the LFS. As the latter are not care workers,
this category is not distinguished in subsequent analyses.
Table 5.3: occupaTional disTribuTion in Tunisia 2010–2019, Tunisians (age 15–64)
same when viewed either in terms of occupation or
sector. These initial figures reveal the low number
and weight of activities related to personal (social
care) and childcare. In 2019, the number of workers
in ECCE, personal care and childcare did not
exceed 20,000 for a total population of around 12
million Tunisians.
Type of employment differs substantially between
the public and private sectors (Figure 5.13). The
public sector is characterized by a strong presence
of education (31 per cent) and health care (9 per
cent), with 60 per cent for the rest of the sectors.
In contrast, care work accounted for only 4 per
cent of private sector employment. This relative
composition remained constant throughout the
study period. It is not surprising that the public
sector plays a predominant role in sectors related
to human capital development. This also reflects
the Government’s commitment to the health and
education. However, these figures do not reveal
anything about the quality or level of access of the
population to the services offered.

CARE ECONOMY AND PROMOTING GENDER EQUALITY
199
Distribution of economic activities in %
Early Childhood Education
All other education Health Social care
Non–care sectors Total
2010 0.1 7.5 2.6 0.4 89.4 100
2012 0.1 7.3 2.7 0.4 89.5 100
2016 0.3 7.3 3.1 0.5 88.9 100
2019 0.3 7.3 3.1 0.4 88.9 100
Distribution of employment by economic activities (in 1,000s)
2010 4.6 244.8 84.8 13.2 2,930 3,277
2012 4.1 234.4 88.3 13.7 2,891 3,232
2016 9.2 248.8 104.2 17.8 3,038 3,4182019 11.5 258.4 107.8 15.5 3,135 3,528
Source: Authors’ calculation based on the LFS 2010–2019.
Table 5.4: economic acTiviTies disTribuTion 2010–2019
Source: Authors’ calculation based on the LFS 2010–2019.
figure 5.13: The disTribuTion of care and non–care secTors in ToTal employmenT, by insTiTuTional secTor, 2010–2019
1
31
81
31
71
30
81
31
83
9
4
3
9
4
3
9
4
3
10
4
97
60
8897
60
8996
61
8896
59
88
0
10
20
30
40
50
60
70
80
90
100
Private Public Total Private Public Total Private Public Total Private Public Total
2010 2012 2016 2019
Per
cent
Education Health care Non-care sectors
Such an analysis is beyond the scope of this report,
but requires further study. During the 2010–2019
period, employment growth in Tunisia was
relatively low. In the public sector, employment
grew at an average annual rate of 1.4 per cent,
compared to 0.8 per cent in the private sector. This
modest growth in employment reflects the weak
performance of the Tunisian economy during the
past decade of political and economic transition.
However, the growth rate varied greatly by type of
occupation and in the public versus private sectors
(Figure 5.14).

CHAPTER 5 – THE CARE ECONOMY IN TUNISIA
200
Source: Authors’ calculation based on the LFS 2010–2019.
figure 5.14: average annual employmenT growTh by occupaTion, 2010–2019
0.8
0.7
0.7
19.1
6.1
5.7
6.2
1.4
2
-2.2
16.3
-0.2
7.4
1.2
-5 5 15 25
Total
Non-care workers
Personal care workers
Childcare workers
Other educators
Early childhoodeducators
Health occupations
Public Private
Occupations in the private health and ‘other’
education sector grew by almost 6 per cent per
year, compared to 1.2 per cent and –0.2 per cent
respectively in the public sector. These contrasting
patterns likely reflect the recruitment freeze in the
public sector, which affected several vital sectors,
such as education and health. Employment growth
for early childhood educators and especially
childcare (nursery) workers was strong in both
the public and private sectors, which may reflect
growing investment in and demand for ECCE.
Although employment growth in care occupations
was on average higher compared to other
occupations, the absolute increase (in terms of
number of jobs) remained small due to their low
impact on the economy.
Women have a strong role in the paid care economy
Women held 26 per cent of jobs in Tunisia in 2019,
reflecting their low participation in the labour
market, which has not changed much over the past
decade (Figure 5.15). Comparatively, the presence
of women in care sectors was remarkable. The
share of women in health and education sectors
exceeded that of men, at 61 per cent and 56 per
cent, respectively. In addition, almost all ECCE and
social care employment is held by women and
their share has increased over the past decade. In
fact, the strong presence of women, particularly
in the education and health sectors, reflects the
composition of the available workforce. Indeed,
as we shall see later, these two sectors are based
essentially on skilled workers (university graduates).
The latest statistics for the year 2019 show that the
number of postsecondary students in Tunisia stands
at 267,154, of whom 169,096 are women (63.3 per
cent). In the health sector, female students account
for 73 per cent, and in the social services sector they
account for 89 per cent. Thus, the strong presence
of women in university reflects their strong
presence in the education and health sectors. Thus,
alongside unpaid care work, women are also more
involved than men in paid care work.
Another snapshot of the extent to which women
are concentrated in care sectors, particularly
in the public sector, is provided in Figure 5.16.
In total, a quarter of women’s employment was
in the care sector (compared to 12 per cent of
total employment in the care sector, Figure 5.13).

CARE ECONOMY AND PROMOTING GENDER EQUALITY
201
There was a large gap between the public and
private sectors, with care sectors accounting for
65 per cent of women’s employment in the public
sector (46 per cent in education and 18 per cent in
health care) compared to 13 per cent of women’s
Source: Authors’ calculation based on the LFS 2010–2019.
figure 5.15: share of women in differenT economic secTors, 2010–2019
54
93
48
99
56
2225
56
95
48
100
56
2225
63
96
55
89
66
2226
61
94
56
95
67
2326
0
10
20
30
40
50
60
70
80
90
100
Health occupations Early childhoodeducators
Other educators Childcare workers Personal care workers Non-care workers Total
Per
cent
2010 2012 2016 2019
Source: Authors’ calculation based on the LFS 2010–2019.
figure 5.16: share of ToTal employmenT in care and non–care secTors, by insTiTuTional secTor, among women, 2010–2019
3
46
13
1
46
132
46
154
48
157
18
11
8
18
11
10
18
12
9
17
11
91
36
76
91
36
76
88
37
73
87
35
74
0
10
20
30
40
50
60
70
80
90
100
Private Public Total Private Public Total Private Public Total Private Public Total
2010 2012 2016 2019
Per
cent
Education Health care Non-care sectors
employment in the private sector. Yet in the private
sector, the share of women’s employment in care
sectors increased by 4 percentage points between
2010 and 2019.

CHAPTER 5 – THE CARE ECONOMY IN TUNISIA
202
The care sector correspondingly offers a good
opportunity to further integrate women into the
labour market, given the potential demand and
growth in the sector, particularly subsectors that
predominantly employ women. Creating decent
work opportunities remains, however, a major
challenge, as discussed in the subsequent section
on quality of employment in the care sector.
Role of the public sector
Overall, the share of employment in the public
sector has remained constant over the last decade,
at around 21 per cent. The role of the public sector
in non–care employment has also remained
constant, but in some care sectors the share of
public employment has declined, reflecting growth
in the private sector. The public sector’s share in
health sectors has fallen from 66 to 63 per cent,
and in social care from 26 to 24 per cent (Figures
5.17). Most notably, the share of the public sector in
early childhood education dropped from 25 to 14
per cent. This decline was not due to job losses but
rather to the rapid growth in the private sector, as
discussed above.
The weak presence of the private sector in health–
care activities is certainly a weakness, but it also
reveals opportunities to be seized to offer quality
services. Increasing the supply of this type of
employment could reduce acute unemployment
among young graduates and women. These
considerations should be taken into account in any
comprehensive policy addressing the care sector.
Encouraging the growth of the private care sector
does not in any way imply a call for the State to
disengage from the care sector. On the contrary,
the public sector must continue to play an active,
parallel role and ensure equitable access to care
services for different categories of the population
and to different regions, potentially through
financing mechanisms that also cover services
provided in the private sector.
Source: Authors’ calculation based on the LFS 2010–2019.
figure 5.17: percenTage of employmenT in The public secTor, by economic secTor, 2010–2019
25
89
66
26
14
2126
95
70
28
15
2221
94
66
31
16
23
14
90
63
24
14
21
0
10
20
30
40
50
60
70
80
90
100
Early childhood education All other education Health Social care Non-care sectors Total
Per
cent
2010 2012 2016 2019

CARE ECONOMY AND PROMOTING GENDER EQUALITY
203
Age and education structure of care workers
For all sectors, the age distribution of employment
reflects the composition of the labour force, but it
also reveals the absence of young people, who are
more subject to unemployment. Nearly 53 per cent
of the total employed population is 40 years of age
or older. However, occupations related to health,
ECCE and childcare seem to attract more young
people. Slightly more than half of the workers in
these occupations were between the ages of 25
and 39, compared to a national average of 37 per
cent. For health occupations, only 43 per cent of
workers were over 40 years of age (Figure 5.18).
The educational profile of care workers varies
considerably by occupation. In Tunisia, only
20 per cent of the employed population has a
university–level education, and 37 per cent have
secondary education (Figure 5.19). The remaining
43 per cent have a primary level of education or
less. Health and education occupations have the
highest share of care workers with a university
degree, at over three–quarters of workers. This is
consistent with the qualifications required for these
types of occupations. By contrast, only half (52
per cent) of ECCE practitioners have a university
degree according to the LFS data. This result casts
considerable doubt on the quality of these services,
which require a minimum amount of training. Other
negative consequences for students’ later learning
could be caused by inadequate preschool training.
The same applies to childcare and personal care
services, where the majority of workers have a
secondary degree or less. It should be noted that
this distribution did not change significantly from
2010–2019. When focusing only on women care
workers, the same educational distribution was
observed (data not shown).
The quality of paid care jobs is variable
For the economy as a whole, nearly one–
third of jobs are informal, which has negative
consequences in terms of the quality of work,
wage levels, productivity and employment
precariousness.524
Source: Authors’ calculation based on the LFS 2019.
figure 5.18: composiTion of paid care occupaTions, by age group, 2019
6
12
1
14
9
11
10
51
59
35
52
58
37
37
28
24
55
30
23
37
38
15
4
4
9
15
0 10 20 30 40 50 60 70 80 90 100
Health occupations
Early childhood educators
Other educators
Childcare workers
Personal care workers
Non-care workers
Total
Per cent
15-24 25-39 40-54 55-64

CHAPTER 5 – THE CARE ECONOMY IN TUNISIA
204
The care sectors least affected by informality are
health, education and personal care, with rates
of 5.5 and 12 per cent respectively (Figure 5.20).
ECCE services and childcare had very high rates of
informality. These results coupled with the relatively
low level of education of workers in these activities
suggest vulnerability of workers and poor quality
of services offered.525 It is highly doubtful that early
childhood promotion could be effective under the
conditions described in this report. These initial
findings require more analysis and attention from
policymakers.
Moreover, it was surprising that the results did not
reveal significant gender differences in informal
work. Indeed, as can be seen in Figure 5.21, the rate
of informal work for women is around 28 per cent,
less than 4 percentage points below the national
average.
Source: Authors’ calculation based on the LFS 2019.
figure 5.20: share of workers ThaT are formal, by occupaTion, 2019
95
51
95
47
88
66
68
5
49
5
53
12
34
32
0 10 20 30 40 50 60 70 80 90 100
Health occupations
Early childhood educators
Other educators
Childcare workers
Personal care workers
Non-care workers
Total
Per cent
Formal Informal
Source: Authors’ calculation based on the LFS 2019.
figure 5.19: composiTion of paid care occupaTions, by educaTion level, 2019
1
2
1
2
2
9
9
2
11
1
15
9
37
34
20
35
10
50
74
39
37
77
52
88
33
15
14
20
0 10 20 30 40 50 60 70 80 90 100
Health occupations
Early childhood educators
Other educators
Childcare workers
Personal care workers
Non-care workers
Total
Per cent
No education Primary Secondary University

CARE ECONOMY AND PROMOTING GENDER EQUALITY
205
When we consider the different types of activities,
women in the care sector are no more affected
by informality than men and certainly much less
than rural women who are in agriculture, for
example. It would seem that the gender dimension
of informality is less important than other issues of
discrimination or access to work opportunities.
5.5 Key fΙndings and policy recommendations
Tunisia’s demographic structure is characterized
by an increasing proportion of elderly people
and a significant presence of children. These two
population groups have the greatest need for
care, both inside and outside the home, and their
numbers will continue to increase in the coming
years. On the other hand, female labour market
participation remains low, as many women
withdraw from the labour market to care for their
children, due to the lack of, and/or low quality
of, care facilities and the cost of care services.
Similar to the majority of women in Arab States,
fewer than 3 out of 10 women are engaged in
Source: Authors’ calculation based on the LFS 2019.
figure 5.21: share of workers ThaT are formal, by occupaTion, women, 2019
95
50
93
44
86
69
72
5
50
7
56
14
31
28
0 10 20 30 40 50 60 70 80 90 100
Health occupations
Early childhood educators
Other educators
Childcare workers
Personal care workers
Non-care workers
Total
Per cent
Formal Informal
paid economic activities. Women bear the brunt
of combining paid and unpaid work and this
generates obstacles to entering the labour market.
Care provision should not be the sole responsibility
of the family or of women, but rather a public
policy issue with multidimensional individual and
collective implications. The challenge is to create
an institutional environment that recognizes, on
the one hand, the efforts of caregivers and, on the
other hand, the rights of care recipients to access
these services.
Key findings: Unpaid care
Working–aged Tunisian women devoted at least
17 hours per week to unpaid care work. The
responsibility for unpaid care work did not vary
considerably with the place of residence (urban or
rural). Marriage significantly increased the burden
of care work and at the same time reduced the
likelihood of women engaging in paid activities. At
the same time, women’s involvement in the labour
market did not substantially reduce the time spent
on domestic work. Thus, women’s overall time
spent in work was higher than men’s. On the other

CHAPTER 5 – THE CARE ECONOMY IN TUNISIA
206
hand, inequitable access to basic services may
considerably increase the time spent on home care
work and at the same time multiply access barriers
to the labour market.
The time devoted to caring for household members
(especially children) was strongly shaped by
women’s level of education, with more time
invested in direct care work among women with
a higher level of education. These divergent
investments could create a form of inequity
between children whose parents are better
educated and children whose parents have a low
level of education, particularly since children from
more privileged socioeconomic backgrounds are
also more likely to attend ECCE.
The inequitable sharing of unpaid work between
women and men was accentuated by the
presence of children in the household, which may
be particularly the case in areas where there
are no kindergarten services. It is also likely that
the predominance of care provided within the
household reflects a preference for care provided
by the family rather than poor quality paid care
services. The latter statement, however, would merit
further investigation.
Entrenched social norms that care is the
responsibility of women are likely one reason
behind the large gender gap in unpaid care
activities. Another factor that would exacerbate
this problem is that women have little ability to
express themselves and influence public policy. A
pressing issue that arises is how to redistribute the
allocation of time in care work between genders
and population groups.
Key findings: The paid care sector
At another level, the paid care sector was
characterized by a strong public sector presence,
particularly in education and health. The private
sector was more present in personal care and early
childhood education. Women were particularly
dominant in these sectors despite their low overall
participation in the labour market.
Moreover, the weight of the care sector is
relatively small and does not meet the needs of
the population. There is real potential to further
develop care services and provide employment
opportunities for a considerable number of young
graduates. In its current configuration, despite the
low supply of services, the care sector suffers from
two major limitations: 1) the quality of the services
provided (as reflected by the average qualification
of its workers), and 2) the poor quality of
employment (as reflected by levels of informality).
These problems require intervention by public
authorities.
Policy recommendations
Establish a comprehensive national care policy
This chapter has shed light on the care sector
in Tunisia and argued for the need to establish
a comprehensive care policy as part of a new
development model. Such a policy should: (i)
ensure access, at affordable costs, to childcare
and elder–care services and put in place transfers,
fiscal measures and other social protection
benefits for workers with family responsibilities;
(ii) review current labour market legislation to
improve working conditions, which are essential to
provide quality services to care recipients; and (iii)
endeavour to reduce the influence of current social
norms in the sharing of paid and unpaid workloads.
Any new care policy must be based on an objective
and thorough assessment of the current state of
affairs and must answer several fundamental
questions, some of which have been raised in this
report: (i) Who are the care recipients and where
do they live? (ii) What are the conditions of access

CARE ECONOMY AND PROMOTING GENDER EQUALITY
207
to care and what is its cost? (iii) What quality of
care is offered to beneficiaries? (iv) Are there
any disparities or inequities related to gender or
income in access to care? (v) Does fiscal policy
encourage access to care and to what extent can
it alleviate the burden of unpaid work? (vi) What
are the concrete legislative barriers that reduce
women’s participation in the labour market? (vii)
To what extent does the paid care sector comply
with decent work conditions, beyond informality?
Thorough study of these additional questions is
fundamental to developing an evidence–based
and equitable national care policy. Finally, it is
important to note that there is no single model for
promoting the expansion of care services in the
economy. The role of different stakeholders, both
public and private, must arise from an inclusive
dialogue on national care policies.
Establish an inclusive national dialogue on care priorities
Upgrading the care sector and developing a
comprehensive national care policy has a cost
and will require a coherent vision to meet the
growing needs and ensure quality services while
respecting equitable access to these vital services
for the entire population. The firm commitment of
public authorities is indispensable. In particular,
the public sector must continue and increase
its investments in childcare services and early
childhood education, which are key determinants
of human capital accumulation and the reduction
of future inequalities. All these reforms require a
serious and inclusive dialogue bringing together
all stakeholders, especially in the context of the
difficult economic conditions Tunisia is currently
experiencing.
Conduct regular time–use surveys Tunisia is one of the leading countries in the region
in the promotion of women’s rights. However, this
analysis has shown that much remains to be done
to reduce gender inequalities in the area of unpaid
care work and in women’s participation in the
labour market. In order to support these efforts, it
is important to improve the quality of national and
regional statistics to recognize and measure the
burden of unpaid care. Thus, it would be important
to conduct regular time–use surveys similar to the
one conducted in 2005. Specific time–use surveys
would allow a better understanding and monitoring
of the trends in unpaid work.
Address women’s working conditions, particularly in the private sector
The review of the current legislative framework
suggests that working conditions, particularly in
the private sector, are not conducive to decent
conditions for women and do not facilitate an
equitable allocation of unpaid work between
genders and individuals, particularly for women
working in the private sector. Even current activities
do not appear to comply with existing legislation:
for example, in terms of working conditions and the
qualifications of staff in the ECCE sector.
Mobilize resources to develop ECCE and elder–care services
In concrete terms, the State must mobilize more
resources to develop quality ECCE services. This
would generate positive and permanent effects
on children’s human capital, while reducing the
quantity of their mothers’ unpaid work. Making
access to early childhood education compulsory,

CHAPTER 5 – THE CARE ECONOMY IN TUNISIA
208
while ensuring equitable and affordable access for
all, would thus have a double impact on children
and parents. Greater participation of women in the
labour market also means additional household
income, greater women’s empowerment and
improved well–being. Similar arguments can be
developed for the expansion of care services for the
elderly. It has been argued in this report that the
care sector offers real opportunities for economic
growth.
Introduce gender equality in educational programmes and programming
The promotion of gender equality outside and
within the household is a long–term objective and
requires in–depth and long–term work at several
levels, particularly in the education system. Civil
society organizations should be encouraged to take
part in such efforts to address social norms. Efforts
must begin by targeting young people within the
school system. The promotion of gender equality,
respect and equitable sharing of work should also
be introduced into educational programmes and
programming.

209
CARE ECONOMY AND PROMOTING GENDER EQUALITY
the exPansion of Preschool education in algeria
Early childhood is the most important phase of human development
and early childhood care and education (ECCE) improves the health,
cognitive and psychosocial development of children.530 It can equally
act as an equalizer between the poor and the wealthy, insofar as
children from more disadvantaged households benefit more from
ECCE attendance.531 Yet gaps in early childhood care and education
have always been a challenge in the MENA region.
Algeria was the first country in the region to dramatically expand
ECCE in a relatively short period of time. In January of 2008, the
country’s National Education Guideline Law No. 08–04 made
an important recognition of pre–primary education, stating that
preschool education prepares children for primary education by
bringing together the various stages of socio–educational care for
children aged 3 to 4. Under the 2008 law, ‘preparatory education’
refers to the final stage of preschool, which prepares 5–year–old
children to attend primary education. Such preschool education thus
began to be provided in preparatory schools, kindergartens and open
kindergarten classes in primary schools across Algeria.
The State ensures the development of preparatory education and
its generalization with the help of several actors, including the:
Ministry of Education, Ministry of Religious Affairs, Ministry of the
Interior and Local Authorities, Ministry of Solidarity and the private
sector. However, the two most important Ministries are the Ministry
of Education and the Ministry of Religious Affairs. Note that in recent
years, preschool education (for children aged 3 and 4) is offered
mainly by the private sector (56 per cent for the 2015–2016 school
year).
Impact of the policy
Algeria has made enormous progress in ECCE attendance in recent
years. Since the 2008 law on national education, the number of
CHAPTER 5 – THE CARE ECONOMY IN TUNISIA
210
children enrolled in preparatory school has
continued to increase. According to the
Ministry of Education, it has risen steadily
from 7 per cent in 2001 to 21.9 per cent in
2005, then 43.7 per cent in 2008, to finally
exceed 79 per cent in 2019.
Touhami and Lassassi have analysed
the impact of enrolment in preschool
programmes in Algeria, and found a
positive effect on cognitive, emotional and
social development of children enrolled
in preschool. These children score higher
on all development indicators compared
to children not enrolled in preschool.532
Lassassi has also found that preschool has
a positive effect on the quality of parent–
child interactions, which has a direct effect
on child development. As such, children
attending preschool benefit more from
development activities, not only while in
school but also when they have parents at
home, compared to children not attending
preschool.533 This result is particularly
important for raising awareness among
policymakers about the importance of
extending preschool access – especially to
the poorest households, most vulnerable
children and those living in remote areas.
Meanwhile, Krafft and Lassassi examine
whether public pre–primary education
can increase women’s labour force
participation as an indirect effect of the
programme, given the assumption that
women disproportionately care for children.
Thus, policies that offer care alternatives
or lower their cost should theoretically
improve female labour force participation
(FLFP) – which stood at 17.3 per cent in
2019.534 However, Krafft and Lassassi found
that increased pre–primary education did
not have this effect.
The fact that the policy has not increased
women’s labour force participation yet does
not mean that it failed (it is important to
recall that its main objective was to improve
the cognitive development of children), but
that there are other factors constraining
women’s employment in Algeria. This result
may reflect the reality that pre–primary
education is only a half–day long, making it
harder for women to work than if they used
full–day nursery care. The cost and quality
of current preschool programmes may
also be contributing factors, although this
will require further research. This overall
outcome is telling, however, as it underlines
the importance of careful policy design,
and results monitoring, when attempting to
increase FLFP in low–FLFP contexts.535
Recommendations
Algeria’s path–breaking experience with
the expansion of preschool education
can serve both as a good practice and a
lesson learned for other countries before
they implement similar programmes. In
order to yield the most positive impacts of
such policies – on various fronts (cognitive,
emotional, social development of children
and also on increased female labour force

CHAPTER 5 – THE CARE ECONOMY IN TUNISIA
211
participation) – close attention should be
paid to policy design.
To successfully expand preschool
education, various measures are needed,
such as cash transfers to ensure inclusive
preschool services for all eligible children
and to increase enrolment especially for
children from poor households, as well as
measures to facilitate children’s access to
preschool, particularly in rural areas, such
as by providing free transportation.
To increase FLFP, programmes could use a
full–day model, or at least offer the option
to include after–school care for working
mothers. Given the increased reliance on
paid private preschools, cost and quality
are other important considerations to
monitor – both to ensure that children have
equitable access, and so that the cost of
care will not outweigh the earnings and/or
potential benefits of such care for working
mothers (or those who may be considering
paid employment). Furthermore, other
efforts are needed to increase FLFP, such as
public campaigns to challenge and change
traditional gender norms and roles to allow
for a greater redistribution of childcare
responsibilities within the family, as well as
greater engagement of the private sector
to promote the availability and access to
more decent jobs for women.

CARE ECONOMY AND PROMOTING GENDER EQUALITY
212
Each country case study in the report relies on
multiple data sources to present a comprehensive
analysis of the national care economy, including
both unpaid and paid care work. Within the limits of
the available data, definitions, operationalization
of variables, and analyses have been standardized
across countries to ensure comparability to
the greatest extent possible. The details of the
microdata analysis are described in this Appendix,
with a focus on cross–cutting methodological issues
underpinning the report.
Unpaid care work
Definitions
Unpaid care work is defined as the own–use
provision of services. Own–use production of
goods (i.e. subsistence or non–market production)
is not included as unpaid care work, nor are any
activities oriented towards the market.536 Voluntary
care services provided to people outside the
household also fall within the standard definition
of unpaid care services.537 However, unpaid care
work provided to individuals outside the household
is excluded from the definition used in this report
because it is not captured in the data sources used.
Typically, this type of unpaid care work constitutes
a very small portion of total time spent on unpaid
care.538
Standardized classifications for activities included
under direct and indirect unpaid care work
were developed based on the International
Classification of Activities for Time–Use Statistics
(ICATUS) 2016 revision.539 Direct unpaid care work
(ICATUS Major Division 4) consists of “personal
and relational” activities to care for children, the
elderly and the disabled or chronically ill. Common
activities include: childcare and instruction; care
for dependent adults; help to non–dependent
adult household/family members; travelling and
accompanying goods or persons related to unpaid
caregiving services for household and family (e.g.
taking someone to the doctor). Indirect unpaid
care work (ICATUS Major Division 3) consists
of activities that are needed to sustain care for
individuals and households. The ICATUS activities
under indirect unpaid care work include: food and
meals management and preparation; cleaning of
own dwelling and surroundings; maintenance and
repair of own dwelling and surroundings; care and
maintenance of clothes and footwear; household
management for own final use (e.g. household
accounts); shopping for own household and
family members; travelling, moving transporting
or accompanying goods or persons related to
unpaid domestic services for household and family
members.
Derivation of time–use estimates from the Labour Market Panel Surveys (LMPS)
In the absence of full time–use surveys, the country
case studies on Egypt, Jordan and Tunisia rely on
the Labour Market Panel Surveys conducted by the
Economic Research Forum in collaboration with
national statistical offices in the region. The main
LMPS surveys used are: the Egypt Labour Market
Panel Surveys (ELMPS) 2006 and 2012,540 the Jordan
Labour Market Panel Survey (JLMPS) 2016, and the
Tunisia Labour Market Panel Survey (TLMPS) 2014.541
The LMPS surveys do not include a full time–
use module, but targeted data based on the
respondent’s recall of time spent on direct and
indirect care work activities in the week prior to the
survey. These items were administered as part of a
survey module designed to detect subsistence work
among household members. Survey respondents
were asked first whether or not they participated in
the given activity, and then only if the response was
Appendix 1: Methodological appendix

APPENDICES
213
positive, how much time they spent on the activity.
Time spent on the activity for respondents who did
not report participating in it at all is therefore zero.
The format of collecting the care work activities
also varied across the four LMPS surveys used.
As shown in Table M1, the ELMPS 2006 and
JLMPS 2016 collected more activities as separate
items, whereas the ELMPS 2012 and TLMPS 2014
aggregated several items together. The level of
aggregation of different activities may affect
the accuracy of respondents’ recall of time spent
on the activity. Nevertheless, the majority of
activities are common across the surveys. One
exception is fetching water, which is only included
in the ELMPS surveys, and an item in the TLMPS
2014 that included time spent to accompany a
family member, which is classified with indirect
care activities because the survey item also
covers shopping. In principle, the time spent
on accompanying a family member should be
classified in the same category as the activity to
which it relates, but this was not possible given the
way that the data was collected. In addition, for the
ELMPS 2006, the subsistence and domestic work
module was only asked to men if they were under
the age of 18.
Another limitation of the LMPS surveys relates to
the detection of direct unpaid care work. None
of the surveys distinguish between time spent
on elder care versus care for the ill or disabled.
Furthermore, the ELMPS 2012 and TLMPS 2014
combine one item for childcare and care for the
elderly and ill/disabled together, so it is not possible
in those years to distinguish for whom direct care
is being provided. The module also does not follow
a standard time–use methodology in terms of
capturing simultaneous activities, which in many
time–use surveys are recorded for all activities
performed. This is particularly important for
detecting time spent on childcare, which is often
done while doing other tasks. All the LMPS surveys
included a measure of time spent on direct care,
while not performing other activities. The ELMPS
and TLMPS also collected a separate item on time
spent on direct care work, while also doing other
activities. However, to ensure comparability with
the JLMPS, and since the method for collecting
simultaneous activities was not standard, this item
was not included in the estimations of time on
direct care work.
As a result of these limitations in terms of the
one–week recall period, more aggregated activity
categories than a standard time–use survey, and
recording of simultaneous activities, it is possible
that the LMPS surveys underestimate time spent
on unpaid care work. As shown in Chapter 1, the
results of the Palestine time–use survey show a
higher number of hours spent on unpaid care per
week among both sexes, but particularly women. A
cross–national analysis of time–use survey reports
also found that the time spent on unpaid care
work by women in Arab countries (Qatar, Oman,
Palestine, Iraq, Morocco, Algeria and Tunisia) as
well as Turkey were closer to 3.5–5 hours per day,
or 25–35 hours per week, in most contexts.542 This
would support the conclusion that the LMPS
surveys tend to somewhat underestimate women’s
time in unpaid care work, and so the estimates
produced from these surveys should be considered
as a lower range of women’s time spent on unpaid
care. It is also important to note that the extent of
underestimation could vary by country and may
affect direct and indirect care work differently.
The LMPS surveys also contain measures of time
spent on paid work that are derived from the
employment module. These are used to compare
time spent on paid employment and unpaid care
work, but it is important to note that the format of
the question is different. The LMPS surveys include
detailed modules to detect employment, or work for
pay or profit, in a short reference period (one week
prior to the interview) and a long reference period
(three months prior to the interview).

CARE ECONOMY AND PROMOTING GENDER EQUALITY
214
ELMPS 2006 ELMPS 2012 JLMPS 2016 TLMPS 2014
Subsistence work (not care
work)
Agricultural activities for the purpose of your
own household con-sumption Agriculture, processing
Agricultural activities for the purpose of your
own household con-sumption
Agricultural activities, raising poultry/live-
stock, producing ghee/butter/cheese for the purpose of your own
household consumption
Raising poultry/live-stock for the purpose
of your own household consumption
Raising poultry/live-stock for the purpose
of your own household consumption
Producing ghee/butter/cheese for the purpose of your own household
consumption
Producing ghee/butter/cheese for the purpose of your own household
consumption
Indirect care work activities
Collecting firewood or other fuel
Collecting water, fire-wood
Collecting firewood or other fuel
Collecting firewood or other fuel
Collecting water
Cooking Cooking, washing, laun-
dry, cleaning Cooking
Cooking, washing dish-es, doing laundry and ironing, cleaning your
house
Washing dishes Washing dishes
Doing laundry and ironing
Doing laundry and ironing
Cleaning your house Cleaning your house
Helping in construction work or small repairs
for the householdMaintenance, construc-
tionHelping in construction work for the household
Maintenance activities or helping in construc-
tion work
Shopping for food, clothing, household
items Shopping
Shopping for food, clothing, household
items
Shopping for food, clothing, household
items, accompanying family members to
their activities
Direct care work activities
Caring for the sick or the elderly (while not
doing other chores)
Caring for children, sick, elderly (while not
doing other chores)
Caring for the sick or the elderly (while not
doing other chores)
Caring for children, the sick or the elderly (while not doing other
chores)
Taking care of children (while not doing other
chores)
Taking care of children (while not doing other
chores)
Table m1: classificaTion of acTiviTies capTured in The lmps surveys, according To icaTus care work definiTions

APPENDICES
215
These employment–detection modules start with
a direct question about working at least one hour
during the reference period, and in case of a
negative answer, follow up with a question about
being attached to a job but not supplying any hours
during the reference period. This is then followed
by a series of 16 keyword questions about whether
or not the individual has engaged in a long list
of activities that meet the definition of work for
pay or profit, but that many individuals would not
consider employment. If the individual responds in
the affirmative to either the direct questions or the
follow–up questions in the short reference period,
they are asked how many days they worked in
the past week and how many hours they worked
on average on each of these days and the total
number of weekly hours. If the individual answers in
the affirmative to the direct or follow up questions
in either the short or the long reference period, they
are referred to the characteristics of employment
in the past three months module, where a different
set of questions about hours of work is asked to
regular and irregular workers. Regular workers are
asked the number of days they work per week and
the average number of hours they work per day.
Irregular workers are asked separately for each of
the past three months about the number of weeks
of work during the month and the number of hours
per week.
The PCBS 2012/2013 time–use survey
For the analysis of unpaid work in Palestine, the
most recent Palestine Central Bureau of Statistics
(PCBS) time–use survey of 2012/2013 is used.543 The
survey used a time record methodology, in which
respondents’ activities were recorded in 10–minute
intervals. The collection of the time–use data
started at the end of September 2012 and lasted
for a calendar year, including seasonal holidays.
For each household in the sample, two members
with a minimum age of 10 were randomly chosen
to fill the time records of their activities. Thus, the
sampling does not estimate the distribution of
time–use among all household members. In total,
the target sample size of the time–use survey was
5,903 households, with a response rate of 79.6
per cent, leading to a final sample size of 4,605
households. The coding of the activities in the
time–use survey for 2012/2013 is similar to the 2005
version of the ICATUS.544 Unpaid care is divided
into two categories: the first is direct unpaid care
(ICATUS 2005 Major Division 7); the second is
indirect unpaid care (ICATUS 2005 Major Division
6). Time spent in paid work is estimated using
the Palestine Labour Force Survey (LFS) of 2013.
Estimation of time spent in paid work from the LFS
was more straightforward than from the time–use
survey, because the time–use survey collected paid
work time in categories of 1–14 hours, 15–34 hours,
and 35+ hours, and using non–standard categories
of employment for more detailed time estimates.
Sample sizes for time–use estimates
Table M2 summarizes the sample sizes of the
surveys used for the unpaid care analyses. All of the
surveys are nationally representative.
Key indicators
Two key indicators are used to calculate individuals’
time spent on unpaid care work and paid work:
1) hours per week spent in the activity, and 2)
the percentage of total time in a week spent
performing the activity. For comparability, estimates
of time use from the PCBS time–use survey, which
were collected in minutes per day, are converted to
hours per week. As the LMPS surveys do not have
a full 24–hour time–use calendar, the percentage
of time spent in activities is calculated by dividing
time spent on unpaid care or paid work by the total
hours in the reference period (a 168 hour–week).

CARE ECONOMY AND PROMOTING GENDER EQUALITY
216
All analyses of unpaid work are restricted to
the working–age population, aged 15–64. Both
indicators are calculated as population averages,
and so include individuals who did not participate
in the activity in the denominator (and whose
actual hours performed are equal to zero). For
some estimates of time spent on paid work, the
conditional average is presented; in other words,
the amount of time spent only among those who
engaged in paid work. This is to adjust for the
fact that, especially among women, substantial
proportions of the population do not participate in
paid work, which deflates the population averages.
Descriptive and multivariate analyses
Descriptive analyses of differences in the
distribution of unpaid care work are presented by
gender, marital status and other key individual–
and household–level characteristics, including
age, education, employment status and household
wealth. Household wealth is calculated using an
asset index in the LMPS surveys. Households are
then assigned a wealth quintile (from poorest
to richest 20 per cent) based on their position in
the household wealth distribution. For Palestine,
households are categorized into low–, middle– and
upper–income groups using an item in the PCBS
time–use survey that captured household income.
To examine the role of household composition
on women’s time spent on unpaid care work, a
Country Survey Sample Size
Egypt ELMPS (2006) 8,351 households
ELMPS (2012) 12,060 households,
Jordan JLMPS (2016) 4,850 householdsPalestine PCBS TUS (2012/2013) 4,605 householdsTunisia TLMPS (2014) 5,160 households
Table m2: sample sizes of The surveys used for The unpaid care analysis
multivariate analysis using ordinary least squares
regression is conducted to predict women’s time
spent in care work. The results of this analysis
are presented in terms of marginal effects – in
other words, the additional time women spend on
unpaid care work when the household has one
child under the age of 3, a child aged 3–5 and
a child aged 6–17, respectively, as compared to
women in households with no children in these
age groups. Marginal effects are calculated while
controlling for other individual– and household–
level characteristics, including women’s education,
age, household wealth, family size, region and the
number of adult women in the household.
The analyses are disaggregated by marital status,
because while married women perform the
majority of direct care work, unmarried women
may spend time caring for the elderly, ill/disabled,
or their younger siblings. The analyses are also
disaggregated by women’s education, to test in
a multivariate framework the descriptive finding
that in several of the case study countries more
educated women spent more time on care work.
The estimates are presented in a graphical format,
for ease of understanding. The grey bars on the
graphs represent the 95 per cent confidence
intervals for the estimates. Estimates for which the
confidence intervals cross zero are statistically
insignificant; for ease of reading, analyses for which
all estimates were statistically insignificant are not
presented.

APPENDICES
217
Paid care work
Definitions of paid care workers and sectors
The forms of paid care work covered in this report
are employment in the areas of: 1) education; 2)
health care; 3) social care (care for children, elderly,
disabled or ill); and 4) domestic work. Analyses
are conducted both at the occupational level and
the sector level; the latter is based on the main
economic activity (or industry) of the establishment
in which the individual works or the nature of the
activity when the individual does not work in an
establishment.
The identification of care workers is based on
the International Standard Classification of
Occupations (ISCO–2008)545 definitions of workers
in the education, health care, social care and
domestic work fields. When possible, based on
the data sources, the three–digit level of the ISCO
classification is used in order to identify relevant
forms of care work more precisely. The relevant
ISCO codes are:
Education: ISCO 23. Where possible, disaggregated
between:
Early childhood educators (ISCO 2344)
All other educators (all other ISCO 23xx subcodes)
Health: ISCO 22 subcodes 221, 222, 223, 224
and 226 + ISCO subcodes 321, 322, 323, 325 (225
veterinarians and 324 veterinary technicians are
excluded)
Social care: ISCO 53. Where possible,
disaggregated between:
Childcare workers: ISCO 531 “Childcare workers
and teachers’ aides”
Personal care workers: ISCO 532 “Personal care
workers in health services”
Domestic work: ISCO 9111 domestic cleaners.
In some cases, analyses are carried out at the
two–digit level, based on data availability. A key
challenge with regards to the analyses is that
domestic work cannot be distinguished from
cleaners in establishments at the two–digit level.
As this is the only level available in some data sets,
and cleaners in establishments are not considered
to be care workers, domestic work is not included in
most of the analyses.
Care sectors are identified based on the
International Standard Industrial Classification
of all Economic Activities (ISIC, Revision 4)546
definitions of the education, health care, social care
and domestic work sectors. The relevant ISIC codes
are:
Education: ISIC 85. Where possible, disaggregated
between:
Early childhood education: ISIC 851
All other education (ISIC 852 – 855)
Health: ISIC 86 “Human health activities”
Social care: ISIC 87: “Residential care activities”
+ ISIC 88: “Social work activities without
accommodation”
Domestic work: ISIC 97 “Activities of households as
employers of domestic personnel.”
Given the stigma associated with domestic work in
the countries of the region, domestic work is likely
to be severely underreported in the official labour
force surveys used for this analysis. Most women
who engage in domestic work for hire would likely
report themselves as not working.
In a few cases, earlier years of the data sets rely on
earlier versions of the ISCO or ISIC classifications.
These were mapped to the most recent revisions
for comparability. Overlap between care workers
and care sectors is determined through the cross–
tabulation of the individual’s occupation (based
on ISCO) and the sector of economic activity of the
establishment in which s/he works (based on ISIC).

CARE ECONOMY AND PROMOTING GENDER EQUALITY
218
Description of data sources from each country
The majority of the paid care analyses in the report
are based on the Labour Force Surveys (LFS) of the
respective country. The LFS are conducted by the
relevant national statistical offices and vary in their
scope and sampling procedure; each of which is
described in turn.
EgyptThe analysis for Egypt relies on Egypt’s Labour
Force Surveys, which are nationally representative,
carried out quarterly, and produced by the Central
Agency for Public Mobilization and Statistics
(CAPMAS). Yearly harmonized LFS waves from
2009 to 2017, retrieved from the ERF data portal,
were used. 547 The LFS includes: labour force
status, categorized as in–labour–force (employed
or unemployed) or out–of–labour–force; the
employment status, categorized as: wage worker,
employer, self–employed or unpaid family worker;
sector of economic activity (up to the four–digit
level) of the primary job; occupation (up to the
four–digit level) of the primary job; and institutional
sector of primary job, categorized as: government,
public enterprises or private sector. Data are also
collected on formality of employment, captured
through the legal status of the primary job (the
existence of a contract and/or social security
coverage), as well as individual characteristics such
as age, education level, region and gender. In the
Egypt LFS, sectors are defined using ISIC Rev. 4,
while occupations are classified according to the
ISCO–88 – both of which are adopted by CAPMAS.
Data were pooled over 2009–2011, 2012–2014, and
2015–2017 in order to have adequate cell sizes.
JordanThe analysis of the paid care economy in Jordan
relies primarily on Jordan’s Employment and
Unemployment Surveys (EUS) from 2005–2018,
which are conducted by the Department
of Statistics (DoS). The EUS are nationally
representative, carried out quarterly, and collect
data on different aspects of the labour market in
Jordan, including labour force status, employment
status, sector of occupation and economic activity,
and sociodemographic characteristics of the
worker. The yearly, harmonized EUS waves from
2005–2018 retrieved from the ERF data portal were
used.548
The EUS data were pooled into three periods
covering 2005–2009, 2010–2014 and 2015–2018
due to sample size considerations, and because
the data are based on different classification
standards. Until 2010, the EUS followed ISCO–88
for classifying occupations, whereas for years 2010
onwards the EUS used ISCO–08. The data before
2010 also lack some of the important paid care
work types, specifically detailed data on childcare
workers. Furthermore, some dimensions of paid
care work cannot be observed in full in the data
due to sampling or coding considerations. For the
whole period under study, the EUS datasets do not
allow for the identification of domestic workers
separately from other cleaners. The EUS data are
also not representative of non–Jordanian labour
in Jordan; as domestic work positions are typically
occupied by non–Jordanians, domestic work is thus
excluded from the analysis to avoid presenting
underestimated figures.
To analyse employment growth in the care and
non–care sectors, the chapter relies on data from
the Employment and Compensations of Employees
Survey (ECES) database of DoS. The ECES survey
is designed to survey economic establishments in
the private and public sectors. It covers all public
establishments, large private sector establishments
and collects nationally representative data from
the other establishments. The ECES thus provides
annual aggregate numbers of workers across all
economic activities. The ECES data does not include
employment outside fixed establishments.

APPENDICES
219
PalestineThe analysis of the paid care sector in Palestine
relies on the PCBS Population, Housing and
Establishments Census from 2007 and 2017.549 The
size and characteristics of the paid care sector,
encompassing education, health care and social
care, are examined at both the occupation and
establishment level. Domestic work is analysed at
the occupation but not establishment level, due to
coding limitations. The establishment–level analysis
includes establishments providing care services
in the public, private and non–governmental
organization sectors, as well as UNRWA. The
establishment–level data includes employers, the
self–employed, waged employees and unpaid
family workers. The occupation–level analysis is
limited to waged workers and focuses on the size of
employment and distribution by gender, education
and formality status.
TunisiaThe paid care analysis for Tunisia relies on the
nationally representative Tunisian Labour Force
Survey, which is conducted on a quarterly basis
by the National Institute for Statistics (INS). The
analysis uses the second–quarter survey data
for the years 2010, 2012, 2016 and 2019. The
advantage of the second–quarter survey is that it
covers a sample of more than 130,000 households
(compared to only 25,000 households for the
other quarters). The data allow for an accurate
estimation of all labour market indicators and
characteristics of the labour force. These surveys
provide information on labour market status,
categorized as: active (employed or unemployed),
or not active (not in the labour market); the
status of employment (employee, employer, self–
employed, unpaid family worker); the sector of
activity; the occupation; the institutional sector
(categorized as government, public enterprises,
private sector); the legal status of employment
(i.e. formality, measured through existence of a
contract and social security coverage); as well as
individual–level characteristics such as age, level
of education, region and gender. The coding of the
Tunisia LFS does not allow domestic workers to be
distinguished from those working as cleaners in
public and private enterprises, so domestic work is
not included in the analysis.
Analysis
The analysis of paid care sectors is presented
descriptively, disaggregated by sex and public
versus private sectors, to the extent possible.
All analyses cover the working–age population,
15–64 years of age. The analyses address the size
of the paid care sector as a percentage of total
employment in each country and of male and
female employment, respectively; the share of the
public and private sectors in care employment; and
the share of women in care employment. Growth
of the paid care sector, relative to other economic
sectors, is also calculated for approximately the
past 10 years, depending on data availability in
each country. Growth rates are presented as per
cent per annum.
Analyses also cover the characteristics of paid care
workers, including composition of different care
occupations by education and age. Job quality
is another focus of the analysis. The common
measure of job quality used across all chapters is
job formality. In Egypt, Jordan and Tunisia, a formal
job is defined as one in which the employee has
a contract or is registered with social security. In
Palestine, informal workers are identified as those
who are not entitled to retirement/severance
payment, paid vacation, paid sick leave and
maternity leave for women. The presence of a work
contract is not utilized to identify informal workers,
since Palestinian labour law extends workers’ rights
to all workers.

CARE ECONOMY AND PROMOTING GENDER EQUALITY
220
Table a1: dependency raTios in The arab sTaTes, 2020, 2035 and 2050
Total dependency (0–14 plus 65+)
Young age dependency (0–14)
Old age dependency (65+)
2020 2035 2050 2020 2035 2050 2020 2035 2050
Algeria 60.1 52.0 59.5 49.3 36.3 34.1 10.8 15.7 25.4Bahrain 26.5 30.1 35.4 23.1 20.6 17.9 3.4 9.5 17.5
Egypt 64.6 56.4 56.9 55.8 45.6 42.2 8.8 10.8 14.8Iraq 69.9 59.2 55.6 64.1 52.0 44.6 5.9 7.2 11.0
Jordan 58.2 48.3 49.7 52.0 37.9 31.9 6.3 10.4 17.7
Kuwait 32.4 37.4 59.0 28.4 21.9 27.6 4.0 15.4 31.4Lebanon 48.4 52.4 58.8 37.2 30.2 25.5 11.2 22.3 33.3
Libya 47.7 42.0 54.1 41.0 29.9 28.9 6.7 12.1 25.2
Morocco 52.4 52.7 57.2 40.8 33.3 29.8 11.6 19.4 27.4Oman 33.3 32.4 40.2 30.0 24.6 22.2 3.3 7.8 18.0
Qatar 18.1 24.2 33.1 16.1 14.9 14.2 2.0 9.3 18.9Saudi Arabia 39.3 37.4 50.5 34.4 26.1 24.5 4.9 11.3 25.9State of Palestine 71.2 57.7 52.3 65.7 50.0 40.8 5.5 7.7 11.5
Syrian Arab Republic 55.4 48.5 52.9 47.8 37.9 32.3 7.6 10.6 20.6
Tunisia 49.6 51.1 61.1 36.3 29.3 28.5 13.3 21.8 32.5
United Arab Emirates 19.2 28.8 45.2 17.7 18.1 21.8 1.5 10.7 23.4Yemen 71.7 54.7 46.3 66.7 49.1 37.7 5.0 5.6 8.6
Source: UN–DESA, Population Division 2019.
Appendix 2: Supplementary tables

APPENDICES
221
Ta
ble a
2: f
em
ale l
abo
ur f
or
ce p
ar
Tic
ipa
Tio
n r
aTe
s (
pe
rc
en
Ta
ge o
f w
om
en a
ge
d 1
5–64)
in T
he a
ra
b s
Ta
Te
s, 2000–2019
Year
2000
2001
2002
2003
2004
2005
2006
2007
2008
2009
2010
2011
2012
2013
2014
2015
2016
2017
2018
2019
Alg
eria
1313
1313
1414
1414
1515
1516
1818
1717
1616
1616
Bahra
in36
37
38
38
3940
4142
4344
4544
4545
4545
4646
4646
Egypt
22
22
20
21
21
22
23
2423
2424
2424
25
26
2425
25
25
25
Iraq
1011
1111
1212
1313
1313
1313
1313
1313
1313
1313
Jord
an
1313
1413
1313
1316
1616
1616
1615
1515
1515
1515
Kuw
ait
51
50
50
50
50
50
51
51
52
53
55
56
57
58
5960
5959
5959
Lebanon
22
22
22
22
22
23
23
2424
2425
25
25
25
25
26
26
26
26
27
Lib
ya21
21
22
22
23
23
23
23
23
2424
27
2426
28
28
28
27
27
27
Moro
cco
26
27
26
28
28
28
28
28
27
27
27
27
26
26
25
25
2423
23
23
Om
an
2425
25
26
26
26
26
26
27
28
28
2929
30
31
32
32
32
32
32
Pale
stin
e
1411
1113
1414
1516
1616
1517
1818
20
20
20
20
20
21
Qata
r42
4344
4545
4648
4950
50
52
53
55
57
58
60
60
5959
59Saudi
Ara
bia
1717
1717
1819
1919
1818
1921
21
21
22
23
2424
25
25
Syria
21
21
20
20
1817
1615
1614
1414
1413
1313
1313
1313
Tunis
ia25
25
25
25
25
25
26
27
27
27
27
27
28
28
28
28
27
27
27
27
UA
E34
35
35
36
37
38
3940
4243
4546
4748
4950
51
52
52
52
Yem
en
21
20
1917
1615
1413
1211
109
87
66
66
66
Sourc
e: W
orld B
ank
20
19.

CARE ECONOMY AND PROMOTING GENDER EQUALITY
222
Ta
ble a
3: m
aTe
rn
iTy l
eav
e p
ro
vis
ion
s i
n T
he a
ra
b s
Ta
Te
s
A
lgeria
Bahra
inE
gypt
Iraq
Jord
an
Kuw
ait
Maternity leave
Exist
ence
√√
√√
√√
Conditio
ns
Must
have b
een
em
plo
yed f
or
at
least
half
a
month
in t
he last
3 m
onth
s or
for
2
month
s in
the last
12
month
s befo
re
childbir
th.
No r
equired c
ondi-
tions.
–Pri
vate
sect
or
em
-plo
yees
must
have
underg
one c
ontr
i-butions
for
the last
10
month
s – N
o c
onditio
ns
for
public
sect
or.
No r
equired c
ondi-
tions.
–Mus
t hav
e at
le
ast
6 m
onth
s of
cove
red w
ork
be-
fore
childbirth
.
–Mus
t be
work
ing
and p
rovid
e a
med-
ical
cer
tifica
te.
Bene
fits
–10
0%
of
the last
m
onth
ly e
arn
ings
are
paid
, up t
o 1
4
weeks, incl
udin
g
6 w
eeks
befo
re
childbir
th.
–10
0%
of
the s
al-
ary
is
paid
for
60
days. (
9 w
eeks)
–C
ould
be e
xtend-
ed f
or
15 u
npaid
days.
–10
0%
of
the s
al-
ary
is
paid
for
60
days. (
9 w
eeks)
–C
ould
be e
xtend-
ed f
or
15 u
npaid
days.
–100
% o
f the
sa
lary
is
paid
for
14 w
eeks
, inc
ludi
ng
8 w
eeks
befo
re
childbirth
. –C
ould
be
exte
nd-
ed to
9 m
onth
s, in
ca
se o
f m
ultip
le
birth
s or
com
plica
-tions.
–Mat
erni
ty g
rant
: paid
lum
p s
um
for
the m
oth
er
in c
ase
of
leavin
g w
ork
be-
cause
of
pre
gnancy
fo
r one m
onth
for
each
contr
ibution
year.
–100
% o
f the
sal
ary
is p
aid
for
10 w
eeks
in t
he p
riva
te s
ec-
tor a
nd 9
0 da
ys in
th
e p
ublic
sect
or.
–100
% o
f the
sal
-ary
is
paid
for
10
weeks.
–Cou
ld h
ave
4 m
ore
unpaid
m
onth
s.
Covera
ge
–Soci
al in
sura
nce
sy
stem
–Self
–em
plo
yed
pers
ons
are
ex-
cluded; th
ey o
nly
re
ceiv
e m
edic
al
bene
fits.
–E
mplo
yer–
liability
syst
em
.–Self
–em
plo
yed
pers
ons
are
exc
lud-
ed.
–M
ixed (
75%
soci
al
insu
rance
syst
em
, 25%
em
plo
yer)
. –Self
–em
plo
yed
pers
ons
are
exc
lud-
ed.
–Em
ploy
er li
abili
ty
syst
em
–S
elf–
empl
oyed
pe
rson
s ar
e ex
clud
-ed
–Soci
al in
sura
nce
sy
stem
coveri
ng a
ll
em
plo
yees
incl
ud-
ing s
elf
–em
plo
yed
pers
ons.
–Em
ploy
er–l
iabi
lity
syst
em
for
priva
te
sect
or
em
plo
yees.
–Sel
f–em
ploy
ed
pers
ons
are
excl
ud-
ed.
–Spe
cial
sys
tem
s fo
r public
sect
or
em
plo
yees.

APPENDICES
223
Ta
ble a
3 (
co
nTin
ue
d): m
aTe
rn
iTy l
eav
e p
ro
vis
ion
s i
n T
he a
ra
b s
Ta
Te
s
Q
ata
rSaudi A
rabia
Syria
Tunis
iaU
nited A
rab
Em
irate
sYem
en
Maternity leave
Exist
ence
√√
√√
√√
Conditio
ns
–M
ust
have b
een
work
ing f
or
the
sam
e e
mplo
yer
for
at
least
one y
ear.
–M
ust
have b
een
work
ing f
or
the
sam
e e
mplo
yer
for
at
least
one y
ear.
–M
ust
have b
een
work
ing f
or
at
least
6 m
onth
s fo
r th
e s
am
e e
mplo
yer.
–Mus
t hav
e 2
month
s and 2
0
days
of
cove
red
em
plo
ym
ent
in
the f
our
quart
ers
befo
re c
hildbirth
.
–Mus
t hav
e be
en
work
ing f
or
at
least
a y
ear
for
the s
am
e
em
plo
yer.
No r
equired c
ondi-
tions.
Bene
fits
–10
0%
of
the
sala
ry is
paid
for
50 d
ays
(aro
und 7
w
eeks)
.–The leave m
ust
in
clude 3
5 d
ays
aft
er
childbir
th (
5
weeks)
.
–10
0%
of
the s
al-
ary
is
paid
for
10
weeks.
–10
0%
of
the s
al-
ary
is
paid
for
120
days
(17
weeks)
for
the 1
st c
hild, 90
days
(13 w
eeks)
for
the 2
nd c
hild, 75
days
(11
week)
for
the 3
rd c
hild.
–C
ould
have 3
0
additio
nal days
of
unpaid
leave.
–100
% o
f the
sa
lary
is
paid
for
two m
onth
s in
the
public
sect
or
–In
the
priv
ate
sect
or, 6
6.7
% o
f th
e
ave
rage d
aily c
ov-
ere
d w
age is
paid
fo
r 60 d
ays.
–100
% o
f the
sal
ary
is pa
id fo
r 45
days
(6
.5 w
eeks)
.–I
f the
wom
an h
as
been w
ork
ing f
or
less
than o
ne y
ear,
she o
bta
ins
50%
of
the s
ala
ry.
–100
% o
f the
sal
ary
is p
aid
for
70 d
ays
(10 w
eeks)
.–M
ay b
e ex
tend
-ed
to 9
0 da
ys (
13
weeks)
in c
ase
of
multip
le b
irth
s.
Covera
ge
–E
mplo
yer–
liability
syst
em
for
pri
vate
se
ctor
em
plo
yees.
–Self
–em
plo
yed
pers
ons
are
exc
lud-
ed.
–Speci
al sy
stem
s fo
r public
sect
or
em
plo
yees.
–E
mplo
yer–
liability
syst
em
.–E
xclu
des: s
elf
–em
plo
yed p
ers
ons,
house
hold
work
ers
, fo
reig
n w
ork
ers
, fa
mily labour, a
th-
lete
s and a
gri
cul-
ture
work
ers
.
–E
mplo
yer
liability
syst
em
for
pri
vate
se
ctor
em
plo
yees.
–Self
–em
plo
yed
pers
ons
are
exc
lud-
ed.
–Speci
al sy
stem
s fo
r public
sect
or
em
plo
yees.
–Soc
ial i
nsur
ance
sy
stem
for s
elf–
em
plo
yed, priva
te
sect
or
em
plo
yees
and p
ublic
sect
or
em
plo
yees.
–E
mplo
yer
liability
syst
em
.
–Em
ploy
er li
abili
ty
syst
em
.–E
xclu
des:
self–
em-
plo
yed p
ers
ons,
house
hold
work
ers
, fo
reig
n w
ork
ers
, fa
mily labour, a
th-
lete
s, a
gricu
lture
w
ork
ers
.–S
peci
al s
yste
ms
for
public
sect
or
em
plo
yees.

CARE ECONOMY AND PROMOTING GENDER EQUALITY
224
Ta
ble a
3 (
co
nTin
ue
d): m
aTe
rn
iTy l
eav
e p
ro
vis
ion
s i
n T
he a
ra
b s
Ta
Te
s
Lebanon
Lib
yaM
oro
cco
Om
an
Pale
stin
e
Maternity leave
Exist
ence
√√
√√
√
Conditio
ns
–Med
ical
cer
tifica
te
must
be p
rovid
ed.
–If
self
–em
plo
yed,
must
have a
t le
ast
6
month
s of
self
–em
plo
y-
ment
befo
re c
hildbir
th
and 4
month
s of
con-
trib
utions
in t
he last
6
month
s.–If
em
plo
yed, m
ust
pro
vid
e m
edic
al ce
rtif
-ic
ate
.
–M
ust
have a
t le
ast
54
covere
d w
ork
days
in
the last
10 m
onth
s be-
fore
sto
ppin
g w
ork
at
the t
ime o
f ch
ildbir
th.
–Mus
t hav
e be
en
work
ing f
or
the s
am
e
em
plo
yer
for
at
least
12
month
s.
–Mus
t hav
e be
en
work
ing f
or
at
least
18
0 d
ays
for
the s
am
e
em
plo
yer.
Bene
fits
–10
0%
of
the s
ala
ry is
paid
for
10 w
eeks.
–If
self
–em
plo
yed,
100%
of
the last
m
onth
ly c
overe
d
earn
ings
for
3 m
onth
s befo
re c
hildbir
th a
nd
3 a
fter.
–If
em
plo
yed, 10
0%
of
last
month
ly c
overe
d
earn
ings
for
14 w
eeks
incl
udin
g 6
weeks
aft
er
childbir
th.
–10
0%
of
the m
onth
-ly
wage in t
he last
6
month
s befo
re c
hild-
bir
th is
paid
for
14
weeks.
–100
% o
f the
sal
ary
is paid
for
7 w
eeks.
–100
% o
f the
sal
ary
is p
aid
for
10 w
eeks,
incl
udin
g 6
weeks
aft
er
childbirth
.
Covera
ge
–E
mplo
yer
liability
syst
em
.
–Self
–em
plo
yed m
oth
-ers
are
covere
d b
y s
o-
cial in
sura
nce
syst
em
.–E
mplo
yed m
oth
ers
are
covere
d b
y a
n e
m-
plo
yer–
liability s
yst
em
.
–Soci
al in
sura
nce
sy
stem
. –C
ert
ain
self
–em
-plo
yed p
ers
ons
are
exc
luded.
– Em
ploy
er–l
iabi
lity
syst
em
. –E
xclu
sion
of s
elf–
em-
plo
yed p
ers
ons, f
am
ily
labour
and h
ouse
hold
w
ork
ers
. –E
mplo
yer
liability
syst
em
.
Sourc
e: A
uth
ors
’ com
pila
tion u
sing d
ata
fro
m U
SA
Soci
al Secu
rity
Adm
inistr
ation (
20
16, 20
18 a
nd 2
019
), ILO
(20
14), a
nd P
ale
stin
ian L
abour
Law
.

APPENDICES
225
Ta
ble a
4: p
aTe
rn
iTy l
eav
e p
ro
vis
ion
s i
n T
he a
ra
b s
Ta
Te
s
A
lgeria
Bahra
inE
gypt
Iraq
Jord
an
Paternity leave
Exist
ence
xx
xx
√
Bene
fits
–100
% o
f the
sal
ary
is paid
for
3 d
ays.
K
uw
ait
Lebanon
Lib
yaM
oro
cco
Om
an
Exist
ence
xx
x√
x
Bene
fits
–15
days
of l
eave
are
allow
ed.
–A lu
mp
sum
of t
he
daily w
age f
or
3 d
ays
is p
aid
.
Q
ata
rSaudi A
rabia
Syria
Tunis
ia
Yem
en
Exist
ence
x√
x√
x
Bene
fits
–10
0%
of
the s
ala
ry is
paid
for
3 d
ays.
–100
% o
f the
sal
ary
is paid
for
2 d
ays
in t
he
public
sect
or
and 1
day
in t
he p
riva
te s
ect
or
Sourc
e: A
uth
ors
’ com
pila
tion u
sing d
ata
fro
m U
SA
Soci
al Secu
rity
Adm
inistr
ation (
20
16, 20
18 a
nd 2
019
).

CARE ECONOMY AND PROMOTING GENDER EQUALITY
226
Ta
ble a
5: l
eg
al p
ro
vis
ion
s f
or p
aid
br
ea
sTfe
ed
ing b
re
ak
s i
n T
he a
ra
b s
Ta
Te
s
A
lgeria
Bahra
inE
gypt
Iraq
Jord
an
Breast–feeding breaks
Exist
ence
–√
√√
√
Bene
fits
No a
vailable
info
rma-
tion.
–W
om
en a
re a
llow
ed t
o
take t
wo b
reast
feedin
g
bre
aks
duri
ng w
ork
ing
hours
.–E
ach
bre
ak last
s an
hour.
–A
llow
ed f
or
6 m
onth
s aft
er
childbir
th.
–W
om
en a
re a
llow
ed t
o
take t
wo b
reast
feedin
g
bre
aks
duri
ng w
ork
ing
hours
.–E
ach
bre
ak last
s half
an h
our.
–A
llow
ed f
or
18 m
onth
s aft
er
childbir
th.
–Wom
en a
re a
llowe
d to
ta
ke t
wo b
reast
feedin
g
bre
aks
during w
ork
ing
hours
.–E
ach
brea
k la
sts
half
an h
our.
–Wom
en a
re a
llowe
d to
ta
ke t
wo b
reast
feedin
g
bre
aks
during w
ork
ing
hours
.–E
ach
brea
k la
sts
half
an h
our.
–Allo
wed
for 1
2 m
onth
s aft
er
childbirth
.
K
uw
ait
Lebanon
Lib
yaM
oro
cco
Om
an
Exist
ence
√x
√√
x
Bene
fits
–W
om
en a
re a
llow
ed t
o
take t
wo b
reast
feedin
g
bre
aks
duri
ng w
ork
ing
hours
.–E
ach
bre
ak last
s half
an h
our.
–W
om
en a
re a
llow
ed t
o
take t
wo b
reast
feedin
g
bre
aks
duri
ng w
ork
ing
hours
.–E
ach
bre
ak last
s half
an h
our.
–A
llow
ed f
or
18 m
onth
s aft
er
childbir
th.
–Wom
en a
re a
llowe
d to
ta
ke t
wo b
reast
feedin
g
bre
aks
during w
ork
ing
hours
.–E
ach
brea
k la
sts
half
an h
our.
–Allo
wed
for 1
2 m
onth
s aft
er
childbirth
.
Sourc
e: A
uth
ors
’ com
pila
tion f
rom
national la
bour
law
s.

APPENDICES
227
Ta
ble a
5 (
co
nTin
ue
d): l
eg
al p
ro
vis
ion
s f
or p
aid
br
ea
sTfe
ed
ing b
re
ak
s i
n T
he a
ra
b s
Ta
Te
s
Sourc
e: A
uth
ors
’ com
pila
tion f
rom
national la
bour
law
s.
Pale
stin
eQ
ata
rSaudi A
rabia
Syria
United A
rab
Em
irate
sTunis
iaYem
en
Breast–feeding breaks
Exist
ence
√√
√√
√√
x
Bene
fits
Wom
en a
re
allow
ed t
o t
ake
two b
reast
-fe
edin
g b
reaks
duri
ng w
ork
ing
hours
.–E
ach
bre
ak
last
s half
an
hour.
–A
llow
ed f
or
12
month
s aft
er
childbir
th.
–W
om
en a
re
allow
ed t
o t
ake
two b
reast
-fe
edin
g b
reaks
duri
ng w
ork
ing
hours
.–E
ach
bre
ak
last
s half
an
hour.
–A
llow
ed f
or
12
month
s aft
er
childbir
th.
–W
om
en a
re
allow
ed t
o t
ake
two b
reast
-fe
edin
g b
reaks
duri
ng w
ork
ing
hours
.–E
ach
bre
ak
last
s half
an
hour.
–Wom
en a
re
allow
ed t
o t
ake
tw
o b
reast
-fe
edin
g b
reaks
during w
ork
ing
hours
.–E
ach
brea
k la
sts
half
an
hour.
–Allo
wed
for 2
4 m
onth
s aft
er
childbirth
.
–Wom
en a
re
allow
ed t
o t
ake
tw
o b
reast
-fe
edin
g b
reaks
during w
ork
ing
hours
.–E
ach
brea
k la
sts
half
an
hour.
–Allo
wed
for 1
8 m
onth
s aft
er
childbirth
.
–Wom
en a
re
allow
ed t
o t
ake
tw
o b
reast
-fe
edin
g b
reaks
during w
ork
ing
hours
.–E
ach
brea
k la
sts
half
an
hour.
–Allo
wed
for 9
m
onth
s aft
er
childbirth
.

CARE ECONOMY AND PROMOTING GENDER EQUALITY
228
Ta
ble a
6: c
hil
dc
ar
e l
eav
e p
ro
vis
ion
s i
n T
he a
ra
b s
Ta
Te
s
A
lgeria
Bahra
inE
gypt
Iraq
Jord
an
Kuw
ait
Childcare leaves
Exist
ence
x√
√√
√x
Bene
fits
Unpaid
leave p
ro-
vid
ed f
or
moth
ers
fo
r a d
ura
tion o
f 6
month
s.
Unpaid
leave p
ro-
vid
ed f
or
moth
ers
fo
r a d
ura
tion o
f 2
years
.
Unpaid
leave
pro
-vid
ed f
or
moth
ers
fo
r a d
ura
tion o
f 1
year.
Unpaid
leave p
ro-
vid
ed f
or
moth
ers
fo
r a d
ura
tion o
f 1
year.
Covera
ge
Can b
e t
aken a
m
axi
mum
of
thre
e
tim
es.
Can b
e t
aken a
m
axi
mum
of
3
tim
es
in t
he p
ublic
sect
or; t
wic
e in
the p
riva
te s
ec-
tor. In t
he p
riva
te
sect
or, o
nly
ap-
plies
to w
om
en
in e
stablish
ments
w
ith m
ore
than 5
0
work
ers
.
Lebanon
Lib
yaM
oro
cco
Om
an
Pale
stin
e
Qata
r
Exist
ence
xx
√x
√√
Bene
fits
Unpaid
leave p
ro-
vid
ed f
or
moth
ers
fo
r a d
ura
tion o
f 3
month
s.
Unpaid
leave p
ro-
vid
ed f
or
moth
ers
fo
r a d
ura
tion o
f 1
year.
Paid
leave
pro
vid
-ed f
or
moth
ers
for
a d
ura
tion o
f 3
years
.
Covera
ge
Saudi A
rabia
Syria
Tunis
ia
United A
rab E
mir-
ate
s Yem
en
Exist
ence
x√
xx
x
Bene
fits
Unpaid
leave p
ro-
vid
ed f
or
moth
ers
fo
r 1
year.
Covera
ge
Sourc
e: A
uth
ors
’ com
pila
tion f
rom
national la
bour
law
s.

APPENDICES
229
Country Specific for children’s health needs Can be used for children’s health needs
Algeria x x
Bahrain x Paid for both parents
Iraq Only for mothers Only for mothers
Jordan x xKuwait Only for mothers Only for mothers
Lebanon x x
Libya x Paid for both parents
Morocco Unpaid for both parents Unpaid for both parents
Oman x Paid for both parents
Palestine No data No data
Qatar x x
Saudi Arabia x x
Syria x Paid for both parents
Tunisia x x
UAE x x
Yemen x Paid for both parents
Table a7: leave provisions for children’s healTh needs in The arab sTaTes
Source: Authors’ compilation from World Policy Center (2020).
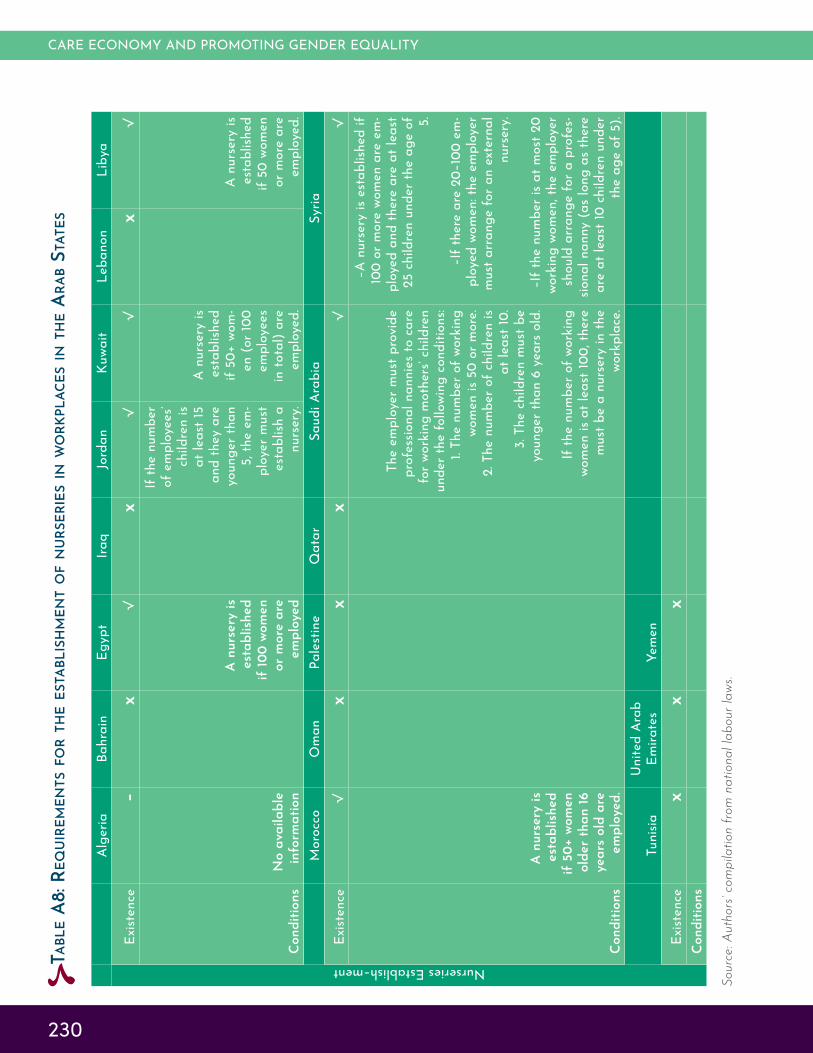
CARE ECONOMY AND PROMOTING GENDER EQUALITY
230
Ta
ble a
8: r
eq
uir
em
en
Ts f
or T
he e
sTa
blis
hm
en
T o
f n
ur
se
rie
s i
n w
or
kpla
ce
s i
n T
he a
ra
b s
Ta
Te
s
Sourc
e: A
uth
ors
’ com
pila
tion f
rom
national la
bour
law
s.
A
lgeria
Bahra
inE
gypt
Iraq
Jord
an
Kuw
ait
Lebanon
Lib
ya
Nurseries Establish–ment
Exist
ence
–x
√x
√√
x√
Conditio
ns
No a
vailable
in
form
ation
A n
urs
ery
is
est
ablish
ed
if 1
00 w
om
en
or
more
are
em
plo
yed
If t
he n
um
ber
of
em
plo
yees’
childre
n is
at
least
15
and t
hey a
re
younger
than
5, th
e e
m-
plo
yer
must
est
ablish
a
nurs
ery
.
A n
urs
ery
is
est
ablish
ed
if 5
0+ w
om
-en (
or
100
em
plo
yees
in t
ota
l) a
re
em
plo
yed.
A n
urs
ery
is
est
ablish
ed
if 5
0 w
om
en
or
more
are
em
plo
yed.
M
oro
cco
Om
an
Pale
stin
eQ
ata
rSaudi A
rabia
Syria
Exist
ence
√x
xx
√√
Conditio
ns
A n
urs
ery
is
est
ablish
ed
if 5
0+ w
om
en
old
er
than 1
6
years
old
are
em
plo
yed.
The e
mplo
yer
must
pro
vid
e
pro
fess
ional nannie
s to
care
fo
r w
ork
ing m
oth
ers
’ ch
ildre
n
unde
r the
follo
wing
con
ditio
ns:
1. T
he n
um
ber
of
work
ing
wom
en is
50 o
r m
ore
.2. T
he n
um
ber
of
childre
n is
at
least
10.
3. T
he c
hildre
n m
ust
be
younger
than 6
years
old
.
If t
he n
um
ber
of
work
ing
wom
en is
at
least
100, th
ere
m
ust
be a
nurs
ery
in t
he
work
pla
ce.
–A n
urse
ry is
est
ablis
hed
if 10
0 o
r m
ore
wom
en a
re e
m-
plo
yed a
nd t
here
are
at
least
25 c
hildre
n u
nder
the a
ge o
f 5.
–If t
here
are
20–
100
em-
ploy
ed w
omen
: the
em
ploy
er
mus
t arr
ange
for a
n ex
tern
al
nurs
ery
.
–If t
he n
umbe
r is
at m
ost 2
0 w
ork
ing w
om
en, th
e e
mplo
yer
should
arr
ange f
or
a p
rofe
s-si
onal nanny (
as
long a
s th
ere
are
at
least
10 c
hildre
n u
nder
the a
ge o
f 5).
Tunis
iaU
nited A
rab
Em
irate
sYem
en
Exist
ence
xx
xC
onditio
ns

APPENDICES
231
ties, Work Code, 2011. http://adala.justice.gov.
ma/production/legislation/ar/Noueautes/%
D9%85%D8%AF%D9%88%D9%86%D8%A9%20
%D8%A7%D9%84%D8%B4%D8%BA%D9%84.pdf.
Accessed 12 May 2020.
Oman, Omani Ministry of Manpower, Labour Law,
2012. https://www.manpower.gov.om/Laborlaw.
Accessed 12 May 2020.
Palestine, Palestinian Bar Association, Palestinian
Labour Law, 2000. https://www.bal.ps/pdf/8.
pdf. Accessed 12 May 2020.
Qatar, Qatari Legal Portal, Labour Law, 2004.
https://www.almeezan.qa/LawArticles.aspx-
?LawTreeSectionID=12652&lawId=3961&lan-
guage=ar. Accessed 12 May 2020.
Saudi Arabia, Ministry of Labour, Work System,
2014. https://hrdf.org.sa/Content/files/labor_
system.pdf. Accessed 12 May 2020.
Syria, Syrian Parliament, Labour Law, 2010. https://
learningpartnership.org/sites/default/files/re-
sources/pdfs/Syria–Labor–Law–2010–Arabic.
pdf. Accessed 12 May 2020.
Tunisia, Presidency of the Government, Work Mag-
azine, 2018. http://www.legislation.tn/sites/de-
fault/files/codes/travailArabe.pdf. Accessed 12
May 2020.
United Arab Emirates, Human Resources and Emi-
ratisation Ministry, Labour Law. https://www.
mohre.gov.ae/en/laws–legislation/labour–law.
aspx. Accessed 12 May 2020.
Yemen, National Information Centre, Labour Law,
2003. https://yemen–nic.info/db/laws_ye/de-
tail.php?ID=11439#. Accessed 12 May 2020.
The following national labour laws were used to
compile the Appendix Tables.550
Bahrain, Labour Market Regulatory Authority, La-
bour Law, 2012. http://lmra.bh/portal/en/page/
show/199. Accessed 12 May 2020.
Egypt, Egyptian Governmental Portal, Labour Law,
2003. https://www.egypt.gov.eg/english/laws/
labour/default.aspx. Accessed 12 May 2020.
Iraq, Iraqi Parliament, Labour Law, 2015. http://arb.
parliament.iq/archive/2015/08/17/%D9%82%D8
%A7%D9%86%D9%88%D9%86–%D8%A7%D9%84%
D8%B9%D9%85%D9%80%D9%80%D9%80%D9%8
0%D9%84/. Accessed 12 May 2020.
Jordan, Jordanian Ministry of Labour, Labour Law,
2019. http://www.mol.gov.jo/ebv4.0/root_stor-
age/ar/eb_list_page/%D9%82%D8%A7%D9%8
6%D9%88%D9%86_%D8%A7%D9%84%D8%B9%
D9%85%D9%84_%D9%86%D8%B3%D8%AE%D8
%A9_2019.pdf. Accessed 12 May 2020.
Kuwait, Kuwaiti Online Government, Labour Law,
2010. https://www.e.gov.kw/sites/kgoArabic/
Forms/KuwaitLaborLaw.pdf. Accessed 12 May
2020.
Lebanon, Lebanese Ministry of Labour, La-
bour Law, 2000. https://www.labor.gov.lb/
Temp/Files/574b61dd–1233–4507–9da1–
d4a3e3a6129a.pdf. Accessed 12 May 2020.
Libya, Ministry of Justice, Labour Law, 1970. http://
itcadel.gov.ly/wp–content/uploads/2016/01/%D
9%82%D8%A7%D9%86%D9%88%D9%86–%D8%A7
%D9%84%D8%B9%D9%85%D9%84.pdf. Accessed
12 May 2020.
Morocco, Moroccan Ministry of Justice and Liber-
Appendix 3: List of national labour laws consulted

CARE ECONOMY AND PROMOTING GENDER EQUALITY
232
Economy. New York: UN Women.
13 ILO 2018.
14 ILO. 2014b. “Maternity and Paternity at Work: Law and Practice across the World.” Geneva: ILO.
15 UN Women 2019.
16 De Henau, Jérôme, and others. 2019. Investing in Free Universal Childcare in South Africa, Turkey and Uruguay: A
Comparative Analysis of Costs, Short–
Term Employment Effects and Fiscal
Revenue. New York: UN Women. 17 El–Kogali, Safaa and Caroline Krafft. 2015. Expanding Opportunities for the
Next Generation: Early Childhood De-
velopment in the Middle East and North
Africa. Washington, D.C.: World Bank Group.
18 UNESCO. 2015. Education for All
2000–2015: Achievements and Chal-
lenges. Paris: UNESCO. However, Jordan recently announced that ECCE will become compulsory for children aged 5 and above starting with the 2020–2021 academic year. See Chapter 3.
19 World Bank 2019.
20 El–Kogali and Krafft 2015.
21 UN–ESCWA. 2018. Population and
Development Report Issue No. 8: Pros-
pects of Ageing with Dignity in the Arab
Region. Beirut: UN–ESCWA. The seven countries are: Iraq, Jordan, Kuwait, Oman, Palestine, Sudan and Tuni-sia.
22 Ibid.
23 Ibid.
24 Duffy, Mignon and Amy Armenia. 2019. “Paid Care Work around the Globe: A Comparative Analysis of 47 Countries Prepared for UN Women.” LIS Working Paper Series.
25 UN Women 2018a.
26 Charmes, Jacques. 2015. “Time Use across the World: Findings of a World Compilation of Time Use Surveys,” Hu-
Executive summary
1 UN Women. 2019. Progress of the
World’s Women 2019–2020: Families in a
Changing World. New York: UN Wom-en.
2 The Arab States as defined in this report encompass the 17 countries cov-ered by the UN Women Regional Office for the Arab States, namely: Algeria, Bahrain, Egypt, Iraq, Jordan, Kuwait, Lebanon, Libya, Morocco, Oman, Palestine, Qatar, Saudi Arabia, Syria, Tunisia, the United Arab Emirates and Yemen.
3 UN–ESCWA (United Nations Econom-ic and Social Commission for Western Asia). 2013. A Review of Literature on
the Changing Role of the Family in Care
Provision in Arab Countries. Beirut: UN–ESCWA.
4 UN Women. 2020. “COVID–19 and the Care Economy: Immediate Action and Structural Transformation for a Gender–Responsive Recovery.” New York: UN Women.
5 ILO. 2018. Care Work and Care Jobs
for the Future of Decent Work. Geneva: ILO.
6 World Bank. 2019. “World Development Indicators.” Washington, D.C.: World Bank Group.
7 ILO 2018.
8 ILO 2018.
9 UN–DESA (United Nations Department of Economic and Social Affairs), Popu-lation Division. 2019. World Population
Prospects: The 2019 Revision. New York: United Nations.
10 World Bank 2019.
11 ILO 2018.
12 See also UN Women. 2018a. Promot-
ing Women’s Economic Empowerment:
Recognizing and Investing in the Care
Endnotes man Development Report Office Back-ground Paper. New York: UNDP.
27 UN Women 2019.
28 World Economic Forum. 2018. Global Competitiveness Index. http://reports.weforum.org/global–competitiveness–index–2018–2017/competitiveness–
rankings/#series=EOSQ129
29 UN–ESCWA 2018.
30 World Bank. 2020b. State of the
Mashreq Women Flagship 1: Women’s
Economic Participation in Iraq, Jordan
and Lebanon (Executive Summary). Washington D.C.: World Bank Group; Bursztyn, Leonardo, Alessandra L. González and David Yanagizawa–Drott. 2018. “Misperceived Social Norms: Female Labor Force Participation in Saudi Arabia.” NBER Working Paper. Cambridge, MA: National Bureau of Economic Research.
31 Charmes 2015.
Chapter 1
32 UN Women. 2019. Progress of the
World’s Women 2019–2020: Families in a
Changing World. New York: UN Wom-en.
33 Ibid.
34 ILO (International Labour Organiza-tion). 2018. Care Work and Care Jobs for
the Future of Decent Work. Geneva: ILO.
35 Oxfam. 2020. Time to Care: Unpaid
and Underpaid Care Work and the
Global Inequality Crisis. Oxford: Oxfam International.
36 Ibid.
37 UN Women. 2020. COVID–19 and the
Care Economy: Immediate Action and
Structural Transformation for a Gen-
der–Responsive Recovery. New York: UN Women.
38 UN Women 2020; UN Women Jordan. 2020a. COVID–19 and Women’s Eco-
nomic Empowerment: Policy Recom-

ENDNOTES
233
Research Forum Working Paper. No. 1186. Cairo: ERF
55 UNSD. 2017. “International Classifi-cation of Activities for Time Use Sta-tistics 2016 (ICATUS 2016).” New York: UNSD.
56 ILO. 2012. “International Standard Classification of Occupations 2008 (ISCO–08): Structure, Group Definitions and Correspondence Tables” Geneva: ILO.
57 UNSD. 2008. “International Standard Industrial Classification of All Econom-ic Activities (ISIC) Rev. 4.” New York: UNSD.
58 ILO 2018.
59 ILO 2018; UN Women 2018a.
60 ILO 2018; UN Women 2018a; Elson, Diane. 2017. “Recognize, Reduce, and Redistribute Unpaid Care Work: How to Close the Gender Gap.” New Labor Forum. 26 (2), pp. 52–61.
61 ILO 2018.
62 UN–ESCWA. 2018. Population and Development Report Issue No. 8: Pros-pects of Ageing with Dignity in the Arab Region. Beirut: UN–ESCWA.
63 Ibid.
64 The young–age dependency ratio is low in the Gulf States because of the presence of many migrant workers who are often unaccompanied by their chil-dren.
65 Dependency ratios for all 17 Arab States are presented in Appendix Table A1.
66 UN–ESCWA 2018.
67 Ibid.
68 Ibid.
69 Ibid.
70 UN–ESCWA. 2014. Disability in the
Arab Region: An Overview. Beirut: UN–
mendations for Strengthening Jordan’s
Recovery. Amman: UN Women Jordan Country Office.
39 ILO 2018.
40 Ibid.
41 The World Bank. 2019. “World Devel-opment Indicators.” Washington, D.C.: World Bank Group.
42 ILO 2018.
43 Ibid.
44 UN–ESCWA (United Nations Econom-ic and Social Commission for Western Asia). 2013. A Review of Literature on
the Changing Role of the Family in Care
Provision in Arab Countries. Beirut: UN–ESCWA.
45 Subsequently, “Palestine.”
46 Elder, Glenn. 1977. “Family History and the Life Course,” Journal of Family
History 2 (4), pp. 279–304.
47 ILO 2018. 48 UN Women 2019.
49 ILO 2018.
50 Ibid.
51 Ibid.
52 ILO 2018. 53 ILO 2018.
54 Barsoum, Ghada. 2007. “Egypt Labor Market Panel Survey 2006: Report on Methodology and Data Collection,” Working Paper 0704. Cairo: Economic Research Forum; Assaad, Ragui and Caroline Krafft. 2013. “The Egypt Labor Market Panel Survey: Introducing the 2012 Round.” IZA Journal of Labor & De-
velopment. 2 (1): 8; Assaad, Ragui and others. 2016. “Introducing the Tunisia Labor Market Panel Survey 2014,” IZA
Journal of Labor & Development. 5 (1): 15; Krafft, Caroline and Ragui Assaad. 2018. “Introducing the Jordan Labor Market Panel Survey 2016,” Economic
ESCWA.
71 Sieverding, Maia and Rasha Hassan. 2019. “Associations between Economic Vulnerability and Health and Well-being in Egypt,” Economic Research Forum Working Paper, No. 1364. Cairo: ERF.
72 World Bank 2019.
73 UN–ESCWA 2018.
74 Olivetti, Claudia and Barbara Petron-golo. 2017. “The Economic Consequenc-es of Family Policies: Lessons from a Century of Legislation in High–Income Countries,” Journal of Economic Per-
spectives. 31 (1), pp. 205–30.
75 Kabeer, Naila. 1994. Reversed Reali-
ties: Gender Hierarchies in Development
Thought. London: Verso Publications.; Hochschild, Arlie and Anne Machung. 1989. The Second Shift: Working Parents
and the Revolution at Home. New York: Viking.
76 ILO 2018.
77 World Bank 2019.
78 Ibid.
79 Assaad, Ragui, and others. 2018. “Explaining the MENA Paradox: Rising Educational Attainment, Yet Stagnant Female Labor Force Participation.” IZA Discussion Paper No. 11385. Bonn: IZA.
80 Moghadam, Valentine M. 2015. “Women, Work and Family in the Arab Region: Toward Economic Citizenship,” DIFI Family Research and Proceedings
2013, Protecting the Arab Family from Poverty: Employment, Social Integra-tion and Intergenerational Solidarity: 7; Nazier, Hanan and Racha Rama-dan. 2018. “What Empowers Egyp-tian Women: Resources versus Social Constraints?,” Review of Economics and
Political Science; Barsoum, Ghada, Ali Rashed and Dahlia Hassanien. 2009. “When There Is ‘No Respect’ at Work: Job Quality Issues for Women in Egypt’s Private Sector,” Gender and Work in the MENA Region Working Paper Series: Poverty, Job Quality and Labor Market Dynamics. Cairo: Population Council;

CARE ECONOMY AND PROMOTING GENDER EQUALITY
234
Paper, No. 1101. Cairo: ERF.
86 Gallup and ILO. 2017. Towards a Bet-
ter Future for Women and Work: Voices
of Women and Men. Geneva: ILO and Gallup. The 14 Arab countries included are: Algeria, Bahrain, Egypt, Iraq, Jor-dan, Kuwait, Lebanon, Libya, Palestine, Morocco, Saudi Arabia, Tunisia, UAE and Yemen.
87 Inglehart, R., and others. 2014. “World Values Survey: Round Five (2005–2009).” Madrid: JD Systems Institute. Accessed 22 May 2020, http://www.worldvaluessurvey.org/WVSDocumentationWV6.jsp.
88 Ibid.
89 Promundo and UN Women. 2017. Understanding Masculinities: Results
from the International Men and Gender
Equality Survey (IMAGES) – Middle East
and North Africa. New York: UN Wom-en.
90 Ibid.
91 ILO 2018.
92 UN Women 2018a.
93 See ILO 2018; UN Women 2018a.
94 Although there are non–contributory social protection programmes in some Arab States that target transfers based on criteria that could be related to a household’s care needs – such as the presence of young children, elderly or disabled household members – none of the countries in the region provide cash transfers specifically for the purpose of caring for those household mem-bers.
95 ILO. 2010. World Social Security
Report 2010/11: Providing Coverage in
Times of Crisis and Beyond. Geneva: ILO. There was insufficient data for the ILO to estimate the effective coverage rate for the Arab region.
96 Heymann, Jody, and others. 2017. “Paid Parental Leave and Family Wellbeing in the Sustainable Develop-ment Era,” Public Health Reviews. 38 (1): 21.
Assaad, Ragui and Melanie Arntz. 2005. “Constrained Geographical Mobility and Gendered Labor Market Outcomes Under Structural Adjustment: Evidence from Egypt,” World Development. 33 (3), pp. 431–54; Duflo, Esther. 2012. “Women Empowerment and Economic Develop-ment,” Journal of Economic Literature. 50 (4), pp. 1051–79.
81 Sieverding, Maia and Rasha Hassan. 2016. ‘Her Future Is Marriage’: Young
People’s Attitudes towards Gender Roles
and the Gender Gap in Egypt. Cairo: Population Council, 2016; Nazier and Ramadan 2018.
82 Assaad, Ragui, Caroline Krafft, and Irene Selwaness. 2017. “The Impact of Early Marriage on Women’s Employ-ment in The Middle East and North Afri-ca,” Economic Research Forum Working Paper, No. 1086. Cairo: ERF.
83 Assaad, Ragui and Fatma El Hamidi. 2009. “Women in the Egyptian Labor Market: An Analysis of Developments, 1988–2006,” In The Egyptian Labor
Market Revisited. Ragui Assaad (Ed.) Cairo: American University in Cairo Press, pp. 117–56; Assaad, Ragui. 2008. “Unemployment and Youth Insertion in the Labor Market in Egypt,” In The Egyp-
tian Economy: Current Challenges and
Future Prospects, ed. Hana Khayr al–Din Cairo: American University in Cairo, pp. 133–78; Assaad and others 2018.
84 Consistent, cross–national attitudinal data on gender roles are scarce in the Arab region. This section therefore relies on data from several international and regional sources. These include a Gallup and ILO poll conducted in 2017, the World Value Surveys Waves 5 (2005–2009) and 6 (2010–2014), the Labour Market Panel Surveys of Jordan (2010 and 2016) and Egypt (2006 and 2018), and the International Men and Gender Equality Surveys (IMAGES) report of 2017. Data for different Arab countries are available in each source, and most attitudinal measures are not compara-ble across the different sources.
85 Diwan, Ishac and Irina Vartanova. 2017. “The Effect of Patriarchal Culture on Women’s Labor Force Participation,” Economic Research Forum Working
97 ILO 2010.
98 ILO. N.D. “Convention C103 – Materni-ty Protection Convention (Revised), 1952 (No. 103).” Accessed 4 May 2020. https://www.ilo.org/dyn/normlex/en/f?p=NORML-EXPUB:12100:0::NO::P12100_INSTRUMENT_ID:312248.
99 ILO. N.D. “Convention C183 – Ma-ternity Protection Convention, 2000 (No. 183),” Accessed 4 May 2020. https://www.ilo.org/dyn/normlex/en/f?p=1000:12100:0::NO::P12100_ILO_CODE:C183.
100 ILO 2018. Figure 3.7.
101 ILO. 2014b. Maternity and Paternity
at Work: Law and Practice across the
World. Geneva: ILO.
102 US Social Security Administration and ISSA (International Social Security Asso-ciation). 2016. Social Security Programs
Throughout the World: Asia, 2016.” Ge-neva: ISSA; US Social Security Adminis-ration and ISSA. 2018. “Social Security Programs Throughout the World: Asia, 2018.” Geneva: ISSA.; US Social Se-curity Administration and ISSA. 2019. “Social Security Programs Throughout the World: Africa, 2019.” Geneva: ISSA. For full details on the maternity leave policies of the Arab States, see Appendix Table A3.
103 Olivetti and Petrongolo 2017.
104 ILO. 2014b; Brodmann, Stephanie, and others. 2014. Social Insurance
Reform in Jordan: Awareness and Per-
ceptions of Employment Opportunities
for Women. Washington, D.C.: World Bank.
105 ILO. N.D. “Egypt – Law No. 18 of 2015 Concerning the Civil Service,” NATLEX Database of national labour, social security and related human rights leg-islation. Accessed 11 June 2020. https://www.ilo.org/dyn/natlex/natlex4.detail?p_isn=102504&p_lang=en.
106 See Chapter 2 for Egypt and Chap-ter 3 for Jordan. Effective coverage of maternity leave in the public sector is nearly 100 per cent.

ENDNOTES
235
126 ILO 2014b.
127 World Policy Center. 2020. “Family,” World Policy Analysis Center. https://www.worldpolicycenter.org/topics/family/policies.
128 For a summary of the three forms of childcare leave and the availability in each country, see Appendix Tables A6 and A7.
129 World Policy Center 2020.
130 Ibid.
131 UN Women 2019.
132 El–Kogali, Safaa and Caroline Krafft. 2015. Expanding Opportunities for the
Next Generation: Early Childhood De-
velopment in the Middle East and North
Africa. Washington, D.C.: World Bank Group.
133 UNESCO. 2015. Education for All
2000–2015: Achievements and Chal-
lenges. Paris: UNESCO.
134 Altarawana, Mahmoud and Alaa Mazhar. 2019. “Razzaz: 50% of capi-tal spending will be on the sectors of education, transportation and health [in Arabic],” Alghad, 24 December. https://alghad.com/–الرزاز–50–من–اإلنفاق ./الرأسمالي–سيكون–عل
135 Krafft, Caroline and Moundir Las-sassi. Forthcoming. “Public Preschool and Maternal Labour Supply in Algeria: Evidence from a Natural Experiment.” Economic Research Forum Working Paper.
136 El–Kogali and Krafft 2015.
137 The most and least advantaged child is defined somewhat differently for each country in this analysis. According to the study authors: “The most–advantaged child is from the wealthiest 20 per cent of households and has parents with secondary (or higher) education, while the least–advantaged child is from the poorest 20 per cent of households and has illiterate parents. Rural/urban and regional differences are country specific, although the least advantaged
107 ILO. 2016a. Maternity Cash Benefits
for Workers in the Informal Economy. Social Protection for All Issue Brief. Ge-neva:.ILO.
108 UN Women 2019.
109 Bosch, M.J. 2019. ‘Chile country note,’ in Koslowski, A. and others. (eds.). Inter-
national Review of Leave Policies and
Research 2019. http://www.leavenetwork.
org/lp_and_r_reports/
110 ILO 2016a.
111 Ibid.
112 Ibid.
113 Rehel, Erin M. 2014. “When Dad Stays Home Too: Paternity Leave, Gender, and Parenting,” Gender & Society. 28 (1), pp. 110–132; OECD. 2016. “Parental Leave: Where Are the Fathers?” OECD Policy Brief. Paris: OECD.; Wray, Dana. 2020. “Paternity Leave and Fathers’ Responsi-bility: Evidence From a Natural Exper-iment in Canada,” Journal of Marriage
and Family. 82 (2), pp. 534–49.
114 OECD 2016.; Heymann and others 2017.
115 OECD 2016.
116 ILO 2014b.
117 For the full details of paternity leave provisions, see Table A4 in the Appen-dix. 118 Heymann and others 2017.
119 OECD 2016.; Heymann and others 2017.
120 ILO 2014b.
121 ILO “Convention C183.”
122 ILO 2014b.
123 Ibid.
124 For full details of the breastfeeding breaks regulations in the 17 countries, see Appendix Table A5.
125 Heymann and others 2017.
child tends to live in a rural area while the most advantaged child tends to live in an urban area. Krafft, Caroline and Safaa El–Kogali. 2014. “Inequalities in Early Childhood Development in the Middle East and North Africa.” Economic Research Forum Working Paper, No. 856. Cairo: ERF.
138 UN Women Jordan. 2020b. Fiscal Poli-cy, Taxation and Gender Equality in Jor-
dan. Amman: UN Women Jordan.
139 World Bank 2019.
140 Ibid.
141 For the full details of the relevant na-tional labour laws, see Appendix Table A8.
142 See Chapter 2 for Egypt and Chapter 3 for Jordan.
143 UN Women 2019.
144 UN–ESCWA 2018. The seven countries are: Iraq, Jordan, Kuwait, Oman, Pales-tine, Sudan and Tunisia.
145 Ibid.
146 UN Women 2019; UN–ESCWA 2018.
147 UN Women 2019.
148 NCFA (National Council for Fami-ly Affairs). 2017. Situation Analysis of
the Elderly in Jordan. Amman: NCFA.; Ministry of Human Resources and Social Development, Kingdom of Saudi Arabia. N.D. “Elderly Care [in Arabic].” Accessed
10 June 2020. https://mlsd.gov.sa/ar/
services/619
149 Ministry of Social Development, Sultanate of Oman. N.D. “The Elderly’s Affairs.” Accessed 10 June 2020. https://mosd.gov.om/index.php/en/social–care–3/the–elderly–s–affairs.
150 UN–ESCWA 2018; United Arab Emir-ates Government Portal. N.D.
151 UN Women 2019.
152 Ibid.

CARE ECONOMY AND PROMOTING GENDER EQUALITY
236
weforum.org/global–competitiveness–in-dex–2017–2018/competitiveness–rankings/ – series=EOSQ129
169 Krafft and Lassassi. Forthcom-ing.
170 UN Women 2019; UN–ESCWA 2018.
171 For a more extensive discussion spe-cific to the professionalization of elder care services, see UN–ESCWA 2018.
172 World Bank. 2020b. State of the
Mashreq Women Flagship 1: Women’s
Economic Participation in Iraq, Jordan
and Lebanon (Executive Summary). Washington D.C.: World Bank Group; Gauri, Varun, Tasmia Rahman and Iman Sen. 2019. “Measuring Social Norms About Female Labor Force Participa-tion in Jordan.” Policy Research Working Paper. Washington, D.C: The World Bank.; Bursztyn, Leonardo, Alessandra L. González and David Yanagizawa–Drott. 2018. “Misperceived Social Norms: Female Labor Force Participation in Saudi Arabia.” NBER Working Paper. Cambridge, MA: National Bureau of Economic Research.
173 Charmes 2019.
174 Charmes, Jacques. 2019. The Unpaid Care Work and the Labour Market. An Analysis of Time Use Data Based on the Latest World Compilation of Time–Use Surveys. Geneva: ILO.
175 UN Women. 2018a. Promoting Women’s Economic Empowerment: Recognizing and Investing in the Care Economy. New York: UN Women.
176 UNSD (United Nations Statistics Di-vision). N.D. “Gender Statistics Manual: Integrating a Gender Perspective into Statistics.” New York: UNSD. Accessed 1 May 2020. https://unstats.un.org/unsd/genderstatmanual/.
177 Charmes, Jacques. 2015. Time Use
Across the World: Findings of a World
Compilation of Time–Use Surveys. Back-ground paper for the Human Develop-ment Report. New York: UNDP.
178 PCBS. 2000. “Time Use Survey
153 Ibid.; Charmes 2019.
154 A cross–national analysis of time–use survey reports (Charmes 2019) also finds that the time spent in unpaid care work by women in Arab countries (Qatar, Oman, Palestine, Iraq, Morocco, Algeria and Tunisia) as well as Turkey tends to be closer to 3.5–5 hours per day, or 25–35 hours per week. This would support the conclusion that the LMPS surveys tend to somewhat underes-timates women’s time in unpaid care work, which is likely due to the format of their data collection, which has a longer (one–week) reference period and less detailed activity categories (see the Methodological Appendix).
155 Charmes 2019.
156 UN Women Jordan 2020a.
157 Assaad, Krafft and Selwaness 2017.
158 Duffy, Mignon and Amy Armenia. 2019. “Paid Care Work around the Globe: A Comparative Analysis of 47 Countries Prepared for UN Women.” LIS Working Paper Series.
159 Ibid.
160 Ibid.
161 Ibid.
162 ILO 2018.
163 UN Women 2018a.
164 Charmes 2015.
165 Heymann and others 2017; OECD 2016.
166 De Henau, Jérôme and others. 2019. Investing in Free Universal Childcare
in South Africa, Turkey and Uruguay: A
Comparative Analysis of Costs, Short–
Term Employment Effects and Fiscal
Revenue. New York: UN Women.
167 UN Women 2019.
168 World Economic Forum. 2018. Global
Competitiveness Index. http://reports.
1999/2000: Key Results [in Arabic]”; PCBS. 2014. “Time Use Survey 2012/2013: Final Results [in Arabic].” Ramallah: PCBS.
179 ILO. 2015. ILO Global Estimates on
Migrant Workers: Results and Methodol-
ogy. Special Focus on Migrant Domestic Workers. Geneva: ILO.
180 Ibid.
181 UN–ESCWA 2013; ILO. 2017a. Domes-
tic Workers and Employers in the Arab
States: Promising Practices and Inno-
vative Models for a Productive Working
Relationship. Beirut: ILO Regional Office for the Arab States.
182 ILO 2018.
183 ILO 2017a.
184 Ibid. 185 Ibid.
186 ILO 2018; ILO 2017a. 187 United Nations. 2020. Policy Brief: The
Impact of COVID–19 on Women. New York: United Nations.
188 Ibid.
189 Ibid.
190 UN Women Jordan 2020a.
191 United Nations 2020.
192 El Hbal, Ayat. 2020. “The nursery sector sees losses during the period of closure due to ‘corona’ [in Arabic],” Al
Masry Al Youm, 21 April . https://www.
almasryalyoum.com/news/details/1970387; see also Chapter 2 on Jordan.
193 UN Women 2020.
194 As per decree No. 719 of 2020.
195 OECD/CAWTAR. 2014. Women in
Public Life Gender, Law and Policy in the
Middle East and North Africa: Gender,
Law and Policy in the Middle East and
North Africa. OECD Publishing.
ENDNOTES
237
Research Forum Working Paper Series, no. 1086; Spierings, Niels, Jeroen Smits, and Mieke Verloo. 2010. “Micro– and Macrolevel Determinants of Women’s Employment in Six Arab Countries,” Journal of Marriage and Family 72, no. 5. pp. 1391–1407.
207 Krafft, Caroline. 2020. “Why Is Fertility on the Rise in Egypt? The Role of Wom-en’s Employment Opportunities,” Journal
of Population Economics, 13 April 2020, https://doi.org/10.1007/s00148–020–00770–w.
208 Osman, Magued. 2019. “Egyptians’ Perception Regarding Women’s Eco-nomic Participation in Egypt.” Cai-ro.
209 Ibid.
210 Marphatia, Akanksha A. and Rachel Moussié. 2013. “A Question of Gender Justice: Exploring the Linkages be-tween Women’s Unpaid Care Work, Education, and Gender Equality,” International Journal of Educational
Development. https://doi.org/10.1016/j.ijedudev.2013.05.005.
211 Authors’ calculations from the ELMPS 2018. See also Chapter 1.
212 A classic measure to calculate the care needs in a given country is the dependency ratio, which reports the number of children (ages 0–14) and of the elderly (ages 65+) to the number of individuals (ages 15–64). Children (ages 0–14) and the elderly (ages 65+) are considered ‘dependents’, who are likely to receive care. Working–age individ-uals (15–64) are more likely to be care providers.
213 For the evolution of dependen-cy ratios in Egypt, see Chapter 1 and UN–DESA (United Nations Department of Social and Economic Affairs). 2019. World Population Prospects. 214 Krafft 2020.
215 World Bank. 2018c. Women Eco-
nomic Empowerment Study. Wash-
ington, D.C.: World Bank, https://doi.
org/10.1596/31351.
196 UN Women 2020.
Chapter 2
197 Egypt ranks 134th out of 153 countries on the 2020 Global Gender Gap Index. World Economic Forum. 2019. “Egypt”. In Global Gender Gap Report 2020: Insight
Report. http://www3.weforum.org/docs/
WEF_GGGR_2020.pdf
198 Ibid.
199 The gender gap in labour force participation is measured as the ratio of female–to–male labour force participa-tion.
200 Krafft, Caroline, Ragui Assaad and Caitlyn Keo. 2019. “Evolution of Labor Supply in Egypt from 1998–2018: A Gendered Analysis.” ERF Working Paper
Series. No. 1358.
201 Ferrant, Gaëlle, Luca Maria Pesando, and Keiko Nowacka. 2014. “Unpaid Care Work: The Missing Link in the Analysis of Gender Gaps in Labour Outcomes,” OECD Development Centre.
202 World Economic Forum. 2019. “Un-paid work includes domestic work and volunteer work, and is expressed as a share in a 24–hours period.” Global
Gender Gap Report 2020: Insight Re-
port.
203 Authors’ calculations from the ELMPS 2012.
204 World Economic Forum. 2019.
205 Authors’ calculations from the ELMPS 2018.
206 Selwaness, Irene and Caroline Krafft. 2018. “The Dynamics of Family Forma-tion and Women’s Work: What Facilitates and Hinders Female Employment in the Middle East and North Africa ?,” Eco-
nomic Research Forum Working Paper
Series (Cairo, Egypt); Assaad, Ragui, Caroline Krafft, and Irene Selwaness. 2017. “The Impact of Early Marriage on Women’s Employment in The Mid-dle East and North Africa,” Economic
216 Duffy, Mignon and Amy Armenia. 2019. “Paid Care Work around the Globe: A Comparative Analysis of 47 Countries Prepared for UN Women,” LIS
Working Paper Series No. 758, https://
doi.org/10.20955/r.85.67.
217 MoSS (Ministry of Social Solidarity). 2020. “The Ministry of Social Solidarity official website”. https://www.moss.gov.eg/
ar–eg/Pages/default.aspx.
218 This is according to the Egypt Pop-ulation Censuses of 1996, 2006 and 2017. Accessed 11 May 2020. https://www.capmas.gov.eg/Pages/StatisticsOracle.aspx?Oracle_id=1966&year=2017&page_id=5109&YearID=23354.
219 This is according to the establishment censuses of 1996, 2006 and 2017. The number of childcare facilities is cap-tured by the number of non–residential social care activities. These include non–residential social work activities without accommodation for the elderly and disabled, which are almost inexistent in Egypt, and other social care activities not classified elsewhere (including day–care facilities, counselling and rehabili-tation, which represent tiny proportions of these activities). Therefore, non–res-idential social care activities provide a good approximation of the number of childcare facilities.
220 UNICEF (United Nations Children’s Fund). 2017. “UNICEF Annual Report 2017: Egypt”.
221 Ibid. It is worth noting that there is a disparity between the number of regis-tered nurseries published by MoSS and the number of childcare institutions list-ed in the establishment census. In 2017, according to MoSS, there were 14,273 licensed and registered nurseries. This is lower than the number of nurseries in the 2017 establishment census (20,679 nurseries, as shown in Table 2.1). The lat-ter tracks all childcare facilities, whether or not they are licensed by and regis-tered with MoSS. This disparity points to the potential presence of some nurser-ies that operate informally or without being registered with MoSS. In addition, it indicates that some nurseries could be
CARE ECONOMY AND PROMOTING GENDER EQUALITY
238
233 El–Kogali and Krafft 2015.
234 Ibid.
235 World Economic Forum. 2018. Global Competitiveness Index. http://reports.weforum.org/global–competitiveness–in-dex–2017–2018/competitiveness–rank-ings/#series=EOSQ129
236 MoSS (Ministry of Social Solidarity). 2020. “The Ministry of Social Solidarity official website”. https://www.moss.gov.eg/
ar–eg/Pages/default.aspx.
237 Based on personal communication with Dina Abdel Wahab, former advisor to the Minister of Social Solidarity. This is also documented in https://www.moss.gov.eg//ar–eg/Pages/program–details.aspx-
?pid=19. [Accessed 24 April 2020.]
238 World Bank 2018a.
239 Ministry of Finance. 2020. The State General Budget. Accessed 16 August 2020. http://www.mof.gov.eg/English/Pa-pers_and_Studies/Pages/The–State–Bud-
get.aspx
240 El–Kogali and Krafft 2015.
241 Constant, Louay et al. 2020. Barriers
to Employment That Women Face in
Egypt: Policy Challenges and Consid-
erations, Rand (RAND Corporation).
https://doi.org/9781977404640.
242 See Table 2.1
243 UN–DESA 2019.
244 MoSS. 2020. Internal Database.
245 Abowd, Maryclaire. 2009. “IN DEPTH: Elderly Care On The Rise,” American Chamber of Commerce in Egypt, July. https://www.amcham.org.eg/publications/business–monthly/issues/115/July–2009/118/
elderly–care–on–the–rise. Data from the establishment census of 2017 shows that there are only 69 homes for the elderly with nursing care and 11 units providing residential care for the elderly, which include homes for the elderly with min-imal nursing care, rest homes without nursing care, or continuing care retire-ment communities.
registered as kindergartens under the supervision of MOETE if, besides serving children age 0 through 3, they can also enrol children 4 through 6.
222 We calculate enrolment rate as the number of enrolled children aged 0–3 (847,423) to the total number of children in this age range in 2017 (10,608,434), multiplied by 100.
223 EBRD and ICRW. 2019. “Policy Report: Making the Case for Care”.
224 Krafft, Assaad and Keo 2019.
225 Grimshaw, Damian and Jill Rubery. 2015. ‘The motherhood pay gap: A review of the issues, theory and interna-tional evidence’, in Conditions of Work and Employment Series No. 57, Geneva: International Labour Office.
226 Staab, Silke. 2016. “Gender Equality, Child Development and Job Creation: How to reap the ‘Triple Dividend’ from Early Childhood Education and Care Services.” UN Women Policy Brief No. 2.
227 World Bank. 2018a. “Project Apprais-al Document on A Proposed Loan for Supporting Egypt Education Reform Project”. (Table E.1)
228 Ibid.
229 Egypt Independent. 2019. “Education minister announces public school fees, exempted groups.” Egypt Independent.
12 September. https://egyptindepen-
dent.com/minister–of–education–is-
sues–public–schools–fess–names–of–
exempted–groups/
230 El–Kogali, Safaa El Tayeb and Car-oline Krafft. 2015. Expanding Oppor-
tunities for the Next Generation: Early
Childhood Development in the Middle
East and North Africa. Washington, DC: World Bank.
231 Ibid. See Figure 6.8
232 UNICEF 2017; World Bank. 2018c.
246 Authors’ calculations from the ELMPS 2018.
247 Selwaness, Irene and Maye Ehab. 2019. “Social Protection and Vulnerabil-ity in Egypt: A Gendered Analysis,” ERF
Working Paper Series No. 1363.
248 Karama was implemented by MoSS and co–financed by the Government of Egypt and the World Bank, to provide unconditional cash assistance to poor elderly (65 years+), as well as orphans and disabled. The benefit level of this programme is 450 EGP per beneficiary with a maximum of three beneficiaries per household. Breisinger, Clemens and others. 2018. “Impact Evaluation Study for Egypt’s Takaful and Karama Cash Transfer Program: Part 1: Quantitative Report,” no. October; ILO. 2017. “Launch-ing the SPF in Egypt: The Egyptian Social Protection Floor Assessment”; Selwaness and Ehab 2019. Karama coverage is still low; around 52,338 poor elderly have been benefiting from it. Kurdi, Sikan-dra and others. 2018. “Targeting Social Safety Nets Using Proxy Means Tests : Evidence from Egypt’s Takaful and Karama Program,” in ReSAKSS Annual
Trends and Outlook Report. Washington, D.C: International Food Policy Research Institute (IFPRI), pp. 135–53; World Bank. 2018b. “The Story of Takaful and Karama Cash Transfer Program.” This is consistent with authors’ estimates, based on ELMPS 2018, that 0.8 per cent of individuals age 65+ received Karama. It is noteworthy that all other non–con-tributory schemes (i.e. Daman) are planned to be dissolved and merged into Karama.
249 Authors’ calculations based on data from ELMPS 2018.
250 Assaad, Krafft and Selwaness 2017; Selwaness and Krafft 2018.
251 Assaad, Ragui. 2014. “Making Sense of Arab Labor Markets: The Enduring Legacy of Dualism.” IZA Journal of Labor
& Development. 3 (1), pp. 1–25. https://doi.
org/10.1186/2193–9020–3–6
252 Assaad, Ragui and Ghada Bar-soum. 2019. “Public Employment in the Middle East and North Africa.” IZA World

ENDNOTES
239
public) of employment of these wom-en at that time. In order to identify the sector of employment of women who worked during their first pregnancy, the authors used retrospective information on women’s job history and the year of their first child’s birth. This allowed them to retrieve the sector of employment during the year of birth (and the year before).
265 Ibid.
266 ILO 2011a.
267 The law does not indicate the specific Ministry. The concerned ministry could be either MoSS if it is a nursery de-signed for children age 0–3, or MOETE if the nursery can enrol children aged 4–6 and thus be eligible for a kinder-garten registration.
268 The authors decided to exclude the most recent ELMPS wave (2018) from the analysis. Although it provides ac-curate information on time spent in indi-rect care work, the time spent in direct care work is quite underestimated. This is because the question about whether the individual has spent time on direct care work included very few respons-es, likely due to a problem during data coding or fieldwork. Due to this prob-lem, it is not possible to have reliable estimates about the participation and amount of time spent in direct care work in 2018.
269 In 2012, women spent less time on unpaid care work (24 hours per week) than in 2006. This is potentially due to combining several activities in the 2012 questionnaire, as explained in the pre-vious section, rather than a real drop in the hours of unpaid care work.
270 This represents the average of hours of paid work for both non–employed women who have zero hours of paid work and employed women whose hours of paid work are different than zero.
271 Kabeer, Naila. 1994. Reversed Real-
ities: Gender Hierarchies in Develop-
ment Thought. London: Verso Publica-tions.
of Labor. 463 (A), pp. 1–9. https://doi.
org/10.15185/izawol.463
253 Authors’ calculations based on data from ELMPS 2018.
254 Assaad, Ragui and others. 2018. “Explaining the MENA Paradox: Rising Educational Attainment, Yet Stagnant Female Labor Force Participation,” IZA
Discussion Paper Series (Bonn, Germa-ny); Assaad and Barsoum 2019; Bar-soum, Ghada. 2015. “Young People’s Job Aspirations in Egypt and the Continued Preference for a Government Job,” in The Egyptian Labour Market in an Era of
Revolution. Ragui Assaad and Caroline Krafft (Eds.). Oxford: Oxford University Press, pp. 108–26; Assaad 2014.
255 Krafft 2020.
256 ILO. 2011a. “ILO Working Conditions
Laws Database. ILO, Geneva.” http://
www.ilo.org/dyn/travail.
257 Ibid.
258 A new law was stipulated in 2015 (Law no. 18) for civil servants (i.e. those employed in the Government, minis-tries, and other State institutions such as taxes authorities, etc.) that provided longer maternity leaves of 16 weeks. Yet, this law does not apply to other public sector workers, such as those in education, health, etc. ILO. N.D. “Egypt – Law No. 18 of 2015 Concerning the Civil Service.”
259 ILO 2011a; World Bank. 2018c.
260 ILO 2011a.
261 Ibid.
262 Ibid.
263 Ibid.
264 Authors’ calculation based on data from ELMPS 2018. The latter included a question on whether women who were employed during their first pregnancy took a maternity leave, and its duration. There was no information, however, on the institutional sector (private/
272 Oxfam. 2020. Time to Care: Unpaid
and Underpaid Care Work and the
Global Inequality Crisis. Oxford: Oxfam International.
273 Women’s time spent on unpaid care work varies little by urban versus rural residence. Women in urban areas spent slightly more time in unpaid work (35 hours per week) than women in rural areas (32 hours per week). A plausible explanation for this is that women in rural areas tend to live in larger families, with more adult female members who can share in household care tasks.
274 Kabeer, Naila, Ashwini Deshpande and Ragui Assaad. 2019. Women’s
Access to Market Opportunities in South
Asia and the Middle East & North Africa:
Barriers, Opportunities and Policy
Challenges. London: London School of Economics and Political Science, De-partment of International Development,
http://eprints.lse.ac.uk/102946/. 275 Hendy, Rana. 2010. “Rethinking Time allocation of Egyptian Women: A Matching Analysis.” Cairo: Economic Re-search Forum Working Paper Series 526, 2010; UN Women. 2019. Progress of the
World’s Women 2019–2020: Families in a
Changing World. New York: UN Women; Budig, M. J. and N. Folbre. 2004. “Activi-ty, Proximity, or Responsibility? Measur-ing Parental Childcare Time.” In Family
Time: The Social Organization of Care. M. Budig and N. Folbre (Eds.). London: Routledge, pp. 51–68.
276 UN Women. 2018b. Turning Prom-
ises Into Action: Gender Equality in the
2030 Agenda for Sustainable Develop-
ment.
277 This is in line with Duffy and Armenia 2019, who found a similar size for the paid care sector in Egypt.
278 The makeup of care sectors is dif-ferent between the public and private sector. Within the public sector, most jobs are concentrated in education (representing around 75 per cent of the public care sector) followed by health, which makes up the rest of the public care sector. Private sector jobs show more diversification. Pre–primary and primary education provides nearly half of jobs for women , and a third of jobs

CARE ECONOMY AND PROMOTING GENDER EQUALITY
240
D.C.: World Bank Group. https://open-knowledge.worldbank.org/bitstream/han-dle/10986/21287/9781464803239.pdf?se-quence=1&isAllo.
288 See Clark, Shelly and others. 2019. “The Impact of Childcare on Poor Urban Women’s Economic Empowerment in Africa.” Demography (56), pp.1247–1272.
289 See the New Social Insurance and Pension Act (Law No. 148 for 2019). Na-tional Organization for Social Insurance, MoSS. 2020. https://www.nosi.gov.eg/ar/Pages/NOSIlibrary/NOSIlibrary.aspx?n-cat=7
290 Stefanie Brodmann, Irene Jillson and Nahla Hassan. 2014. Social Insurance
Reform in Jordan: Awareness and Per-
ceptions of Employment Opportunities
for Women. Washington, D.C.: World Bank.
291 UN–DESA 2019.
292 This is according to the establish-ment censuses of 1996, 2006 and 2017. The number of childcare facilities is captured by the number of non–res-idential social care activities. These include non–residential social work ac-tivities without accommodation for the elderly and disabled, which are almost inexistent in Egypt, and other social care activities not classified elsewhere (in-cluding day–care facilities, counselling and rehabilitation, which represent tiny proportions of these activities). There-fore, non–residential social care activ-ities provide a good approximation of the number of childcare facilities.
293 UNESCO. 2020. “UNESCO Institute for Statistics.” http://data.uis.unesco.org/.
294 We compare the time spent in un-paid care work between the 2006 and 2018 waves, since they have a compa-rable list of time–use activities and since indirect care work in 2018 was accu-rately reported. There was little vari-ation in the time spent in indirect care work in the two waves. Thus, basing this analysis on 2006, although not the most recent, would not bias our results.
295 OAMDI. 2019. Harmonized Labor
for men . In private sector care jobs, the next–largest industry group for wom-en is health care, whose share of jobs fluctuated between 24 and14 per cent from 2009–2017. Social care without accommodation, reflecting nurseries, and domestic work each represented the third–largest activity for women in the paid sector in 2009 (13 per cent). By 2015–2017, the size of social care without accommodation dropped to 11 per cent of jobs in the care sector, while that of domestic work increased to 19 per cent.
279 Dougherty, C. 2014. The Labour Mar-
ket for Youth in Egypt: Evidence from the
2012 School to Work
Transition Survey. Silatech Working Pa-per, No 14–2; Krafft, Caroline and Ragui Assaad. 2015. “Promoting Successful Transitions To Employment For Egyp-tian Youth.” Cairo: Economic Research Forum Policy Perspective No.15; Hendy, Rana. 2015. “Women’s Participation in the Egyptian Labor Market: 1998–2012” Cairo: Economic Research Forum Work-ing Paper Series 907; World Bank 2018c. 280 Kabeer 1994.
281 World Bank 2018c.
282 UN Women. 2018a. Promoting Wom-
en’s Economic Empowerment: Recog-
nizing and Investing in the Care Econo-
my. New York: UN Women.
283 Sultana, N., Gammage, S., Kes, A. 2019. Policy Report: Making the Case for Care. International Center for Research on Women.
284 Constant and others 2020; Duffy and Armenia 2019.
285 Krafft, Caroline and Moundir Las-sassi. Forthcoming. “Public Preschool and Maternal Labor Supply in Algeria: Evidence from a Natural Experiment.” ERF working paper Series.
286 Ibid.
287 El–Kogali, Safaa and Caroline Krafft. 2015. “Expanding Opportu-nities for the Next Generation: Early Childhood Development in the Middle East and North Africa.” Washington,
Force Surveys (HLFS) for 2009–2017– Central Agency for Public Mobilization and Statistics (CAPMAS). Version 1.0 of Licensed Data Files. Egypt: Economic Research Forum (ERF). http://erf.org.eg/data–portal/.
296 Child Law No. 126 of 2008. http://www.nccm–egypt.org/e7/e2498/e2691/info-boxContent2692/ChildLawno126english_eng.pdf
297 UNICEF (United Nations Children’s Fund). 2017. “UNICEF Annual Report 2017: Egypt”.
298 MoSS (Ministry of Social Solidarity). 2020a. The Ministry of Social Solidarity official website. Accessed on 10 October
2020. https://www.moss.gov.eg/ar–eg/
Pages/default.aspx.
299 MoSS. 2020b. The Ministry of Social Solidarity official Facebook page. Accessed on 10 October 2020. https://www.facebook.com/MoSS.Egypt/
posts/2611750438934641 and based on communication with Dina Abdel Wahab, former advisor, ministry of social soli-darity.
300 Nasser Social Bank. 2020. “Nasser Social Bank official website”. Accessed
on 20 October 2020. https://nsb.gov.eg/and based on communication with Atef El Shabrawy, advisor, ministry of social solidarity. 301 El–Kogali, Safaa El Tayeb and Car-oline Krafft. 2015. Expanding Oppor-
tunities for the Next Generation: Early
Childhood Development in the Middle
East and North Africa. Washington, DC: World Bank.
302 Based on communication with Ahmed Ismail, Kheir wa Baraka NGO
303 MoSS. 2020c. The Ministry of Social Solidarity official Facebook page. Accessed on 10 October 2020. https://www.facebook.com/MoSS.Egypt/posts/2796951373747879.

ENDNOTES
241
(Amman and Rockville: DoS and ICF. https://dhsprogram.com/pubs/pdf/FR346/
FR346.pdf.
313 UN–DESA (United Nations Depart-ment of Economic and Social Affairs). 2019. World Population Prospects: The
2019 Revision. New York: UN–DESA, Pop-ulation Division.
314 The Higher Health Council and WHO. 2015. The National Strategy of Health
Sector in Jordan 2015–2019. Jordan. http://www.nationalplanningcycles.org/sites/default/files/planning_cycle_repository/jor-dan/jordan_national_health_sector_strate-gy_2015–2019_.pdf.
315 UN–DESA 2019.
316 UNFPA (United Nations Popula-tion Division). 2019. World Population
Prospects: The 2019 Revision. New York: United Nations.
317 Al–Hassan, Omayya M. 2018. “De-velopments of Early Childhood Educa-tion in Jordan.” Early Years. 38 (4), pp. 351–62. https://doi.org/10.1080/09575146.2018.1512562.
318 Queen Rania Foundation. 2017. “Early Childhood Care and Education in Jordan – Fact Sheet.” Jordan: Queen Rania Foundation. https://www.qrf.org/en/what–we–do/research–and–publications/early–childhood–care–and–education–jor-dan–fact–sheet.
319 Altarawana, Mahmoud and Alaa Mazhar. 2019. “Razzaz: 50% of capi-tal spending will be on the sectors of education, transportation and health [in Arabic].” Alghad, 24 December. https://alghad.com/–الرزاز–50–من–اإلنفاق–الرأسمالي ./سيكون–عل
320 UNICEF and NCFA (National Council for Family Affairs). 2000. Early Child-
hood Development Strategy in Jordan. http://ncfa.org.jo:85/ncfa/sites/default/files/publications/early–childhood–development–strategy–jordan.pdf.
321 Ibid.
322 National Committee for Human Resource Development. 2015. Education
for Prosperity: Delivering Results – A
National Strategy for Human Resource
Development 2016–2025. http://www.mohe.gov.jo/en/Documents/National–HRD–
Chapter 3
304 World Bank. 2019. “World Devel-opment Indicators.” Washington, D.C.: World Bank Group. https://data.worldbank.org/indicator/SL.TLF.TOTL.FE.ZS?locations=-
JO&view=chart.
305 DoS (Department of Statistics). 2018b. “Percentage Distribution of Jordanian Females Aged 15 Years and above by Economic Activity Status and Urban/Rural, 2018 [in Arabic].” Jordan: DoS. http://www.dos.gov.jo/dos_home_e/main/population/wom-an/2018/status8/king.pdf?newurl=sta-tus8&newurl0=0&newur11=%2Fking.pdf.
The response categories were mutually exclusive.
306 Assaad, Ragui, Caroline Krafft and Irene Selwaness. 2017. “The Impact of Early Marriage on Women’s Employ-ment in The Middle East and North Afri-ca.” Economic Research Forum Working Paper.
307 UN Women Jordan. 2020a. “COVID–19 and Women’s Economic Empowerment: Policy Recommen-dations for Strengthening Jordan’s Recovery.” Amman: UN Women Jordan Country Office. https://www2.unwomen.org/–/media/field%20office%20jordan/im-ages/publications/2020/may/covid–19%20and%20womens%20economic%20empow-erment–%20policy%20recommendations%20for%20strengthening%20jordans%20recovery.
pdf?la=en&vs=4619.
308 Inglehart, R., and others. 2014b. “World Values Survey: Round Six.” Ma-drid: JD Systems Institute. Accessed 22 May 2020. http://www.worldvaluessurvey.org/WVSDocumentationWV6.jsp.
309 Gauri, Varun, Tasmia Rahman and Iman Sen. 2019. “Measuring Social Norms About Female Labor Force Participation in Jordan.” Policy Research Working Paper. Washington, D.C: The World Bank.
310 Authors’ calculations from the JLMPS 2016. See also Chapter 1.
311 Gauri et al. 2019.
312 DoS and ICF. 2019. “Population and Family Health Survey 2017–18: Jordan”
Strategy.pdf.
323 MoE (Ministry of Education, Jor-dan). 2018. Education Strategic Plan:
2018–2022. http://www.unesco.org/new/fileadmin/MULTIMEDIA/FIELD/Amman/pdf/
ESP_English.pdf.
324 One JOD is equal to 1.41 US Dol-lars.
325 Council for Economic Policy. 2018. Jordan Economic Growth Stimulus Plan. Amman: Council for Economic Poli-cy.
326 MoE. 2015. “Statistical Report 2014–2015 [in Arabic].” Jordan. http://www.moe.gov.jo/ar/node/18929.
327 MoE 2018.
328 Ibid.
329 DoS and ICF International. 2012. “Jordan Population and Family Health Survey 2012.” Calverton: DoS [Jordan] and ICF International.
330 El–Kogali, Safaa and Caroline Krafft. 2015. Expanding Opportunities for the Next Generation: Early Child-
hood Development in the Middle East
and North Africa. Washington, D.C.: World Bank Group. https://openknowl-edge.worldbank.org/bitstream/han-dle/10986/21287/9781464803239.pdf?se-
quence=1&isAllo.
331 MoE 2018.
332 Ibid.
333 MoSD (Ministry of Social Develop-ment, Jordan). 2019. “Instructions for licensing nurseries and their amend-ments for the year 2019 issued pursuant to Article 95 of the Nursery Law No. 77 of 2018 [in Arabic].” ; MoSD. 2018a. “Nurs-eries Law No. 77 of 2018 [in Arabic].” Jordan. http://www.mosd.gov.jo/UI/Arabic/Templete/hadaneh.pdf??
334 MoSD. 2018b. “Nurseries regulations 2018 [in Arabic].” Jordan. http://www.lob.jo/View_LawContent.aspx?ID=921; Ibáñez Prieto, Ana V. 2018b. “Provisions for Better Integration of Children with Disabilities Included in New Nursery System.” The Jordan Times. 22 June.

CARE ECONOMY AND PROMOTING GENDER EQUALITY
242
2018.” Jordan: NCFA. http://ncfa.org.jo:85/NCFA/sites/default/files/Publications/En-glish–2019–Report–compressed.pdf.
348 Ibid.
349 Higher Health Council and WHO 2015.
350 Ibid.
351 NCFA. 2018a. National Strategy Senior
Citizens 2018–2022: ‘Towards a Society
for All Ages’. Jordan: NCFA. http://ncfa.org.jo:85/NCFA/sites/default/files/Publications/National–Strategy–Senior–Citizens–English–final.pdf.
352 NCFA and others. 2008. The National
Jordanian Strategy for Senior Citizens
(2008).” Jordan. https://www.mindbank.info/item/4966.
353 Ibid.; NCFA. 2018b. “NCFA Annual Report 2018.”
354 NCFA 2018a; NCFA and others 2008.
355 Alhawarin, Ibrahim and Irene Sel-waness. 2019. “The Challenges of Social Security Coverage and Early Retirement in Jordan: What Happened after the 2010 Pension Reform?,” in The Jordanian
Labour Market: Between Fragility and
Resilience. Caroline Krafft and Ragui Assaad (Eds.) Oxford: Oxford University Press, pp. 313–40.
356 NCFA 2018a.
357 Alhawarin and Selwaness 2019.
358 Authors’ estimations based on the JLMPS 2016.
359 MoH (Ministry of Health, Jordan). 2008. “Health Law 47 for the Year 2008 and its Ammendments [in Arabic].” Amman: Ministry of Health. https://www.moh.gov.jo/Echobusv3.0/SystemAs-sets/3be712f0–5ccd–4a7a–879c–2bf-50fa6b231.pdf.
360 NCFA and others 2008.
361 The Jordan Times. 2017. “PM, Dep-uties Discuss Mechanism for Health Insurance for Elderly.” The Jordan Times. 9 January. http://www.jordantimes.com/
http://www.jordantimes.com/news/local/provisions–better–integration–children–disabilities–included–new–nursery–sys-
tem.
335 El Thatha, Hatem. 2019. “Minis-try of Social Development: Electronic services enhance performance and accountability [in Arabic].” Jordan
News Agency. 9 September. https://www.petra.gov.jo/Include/InnerPage.jsp?ID=39492&lang=ar&name=local_news
336 Ibáñez Prieto, Ana V. 2018a. “Instruc-tions for Licensing, Regulation of Home Daycares Being Drafted — Ministry.” The
Jordan Times. 23 July. http://jordantimes.com/news/local/instructions–licensing–regulation–home–daycares–being–draft-
ed–%E2%80%94–ministry.
337 UNICEF and NCFA 2000.
338 Ghazal, Mohammad. 2018. “38 Workplace Nurseries to Be Built by End of Year,” The Jordan Times. 10 April. Accessed 15 November 2019. http://www.jordantimes.com/news/local/38–workplace–nurseries–be–built–end–year.
339 MoL (Ministry of Labour, Jordan). 2019. “Labour law No. 8 of 1996 and its
amendments [in Arabic].” https://bit.
ly/3ea8ekJ
340 MoSD 2018a.
341 Ghawi, Ghalia and others. 2017. “Nurseries in Jordan: Findings From The Queen Rania Foundation National Early Childhood Development Survey 2015.” Jordan: Queen Rania Foundation. https://www.qrf.org/sites/default/files/2019–07/qrf_nurseries_report_en.pdf.
342 NCFA. 2018c. Status of the Jordanian
Family. Jordan. http://ncfa.org.jo:85/NCFA/en/Publications/14.
343 Ghawi and others 2017.
344 UN Women Jordan. 2019. Fiscal Policy,
Taxation and Gender Equality in Jordan. Amman: UN Women Jordan.
345 Ghawi and others 2017.
346 Ibid. 347 NCFA. 2018b. “NCFA Annual Report
news/local/pm–deputies–discuss–mecha-
nism–health–insurance–elderly.
362 NCFA 2018a; NCFA and others 2008.
363 MoSD (Jordan). 2014. “Instructions for licensing residential care for the el-derly for the year 2014 [in Arabic].” http://www.mosd.gov.jo/UI/Arabic/ShowContent.
aspx?ContentId=119; ibid.
364 NCFA 2018a.
365 NCFA and others 2008.
366 Ibid.
367 NCFA. 2017. Situation Analysis of the
Elderly in Jordan.” Amman: NCFA.
368 Abu Kamel, Andaleeb M. 2016. “Who Are the Elder’s Caregivers in Jordan: A Cross–Sectional Study” 6, no. 3 (2016), https://doi.org/10.5430/jnep.v6n3p116.
369 The Higher Health Council and WHO 2015.
370 Ibid.
371 Assaad, Ragui and Colette Salemi. 2019. “The Structure of Employment and Job Creation in Jordan, 2010–2016,” in The Jordanian Labour Market: Between
Fragility and Resilience. Caroline Krafft and Ragui Assaad (Eds.). Oxford: Oxford University Press.
372 Ibid.
373 ILO (International Labour Organi-zation). 2011b. “National Labour Law Profile: Jordan.” http://www.ilo.org/ifpdial/information–resources/national–labour–law–profiles/WCMS_158905/lang––en/index.htm.
374 Authors’ calculations from the JLMPS 2016. The question on maternity leave was asked to women who reported be-ing employed during their first pregnan-cy. Yet, there is no available information on their sector of employment at that time. Thus, we assume that women who worked in the private sector at the time of the survey were also working in the private sector during their first preg-nancy.

ENDNOTES
243
387 During the period 2013–2017, total public expenditure ranged around 30 per cent of GDP. In general, over the same period, the contribution of service–producing sectors to GDP was around two–thirds, with the remainder coming from commodity–producing sectors. CBJ (Central Bank of Jordan). 2018. “The Jordanian Economy in Num-bers 2013–2017 [in Arabic].” Amman: CBJ. https://www.cbj.gov.jo/EchoBusv3.0/SystemAssets/PDFs/2018%20%D8%A7%D9%84%D8%A7%D9%82%D8%AA%D8%B5%D8%A7%D8%AF%20%D8%A7%D9%84%D8%A7%D8%B1%D8%AF%D9%86%D9%8A%20%D9%81%D9%8A%20%D8%A7%D8%B1%D9%82%D8%A7%D9%85.pdf
388 DoS. 2019. “ECES (2019) Results of Employment and Compensations of Employees Survey of 2017 Report [in Ar-abic.” http://dosweb.dos.gov.jo/DataBank/Employment/Employment2017.pdf
389 European Training Foundation. 2016. Increasing Female Participation in Em-
ployment through Vocational Education
and Training in Jordan. Turin: European Training Foundation. https://www.etf.europa.eu/sites/default/files/m/13B3612BD-2694D28C125802000327DE9_PRIME%20
Issues%20Paper%20Jordan.pdf ; MoPIC (Ministry of Planning and International Cooperation) and UNDP. 2011. Jordan Human Development Report 2011. Am-man: MoPIC & UNDP. http://hdr.undp.org/sites/default/files/jordan_nhdr_2011.pdf;
Gauri et al 2019.
390 European Training Foundation 2016.
391 ILO 2018.
392 CBJ. 2020. “Yearly Statistical Report [in Arabic].” http://www.cbj.gov.jo/Pages/
viewpage.aspx?pageID=67.
393 DoS. N.D. “Job Creation Survey Data-
base 2018 [in Arabic]” http://www.dos.gov.jo/dos_home_a/main/linked–html/Job_opp.htm.
394 MoH (Jordan). 2018. “Ministry of Health in Numbers 2018 [in Arabic].” https://www.moh.gov.jo/Echobusv3.0/SystemAssets/435a78d7–40c2–46fe–937f–8694b5a5a8d1.pdf.
395 Ibid.
375 ILO. 2014b. “Maternity and Paternity at Work: Law and Practice across the World.” Geneva: ILO; Brodmann, Steph-anie, Irene Jillson and Nahla Hassan. 2014. Social Insurance Reform in Jordan:
Awareness and Perceptions of Employ-
ment Opportunities for Women. Wash-ington, D.C.: World Bank.
376 ILO 2014b.
377 Ibid.
378 Brodmann et al. 2014.
379 Alhawarin and Selwaness 2019.
380 ILO. 2014a. “Labour Inspection in Arab States: Progress and Challenges.” Working Paper. Beirut: ILO Regional Office for the Arab States. https://www.ilo.org/wcmsp5/groups/public/–––arab-states/–––ro–beirut/documents/publication/wcms_325618.pdf; MoL (Ministry of Labour). 2018. Annual Report. Amman, Jordan. http://www.mol.gov.jo/ebv4.0/root_storage/ar/eb_list_page/%D8%A7%D9%84%D8%AA%D9%82%D8%B1%D9%8A%D8%B1_%D8%A7%D9%84%D8%B3%D9%86%D9%88%D9%8A_2018.pdf
381 Razzaz, Susan. 2017. A Challenging
Market Becomes Even More Challeng-
ing: Jordanian Workers, Migrant Workers
and Refugees in the Jordanian Labour
Market. Beirut: ILO.
382 ILO 2014a.
383 UN Women Jordan 2020.
384 DoS and ICF International 2019.
385 Assaad, Ragui, Caroline Krafft and Caitlyn Keo. 2019. “The Composition of Labor Supply and Its Evolution from 2010 to 2016 in Jordan.” In The Jordanian
Labor Market: Between Fragility and
Resilience, Caroline Krafft and Ragui Assaad (Eds.). Oxford: Oxford University Press.
386 ILO. 2018. Care Work and Care Jobs
for the Future of Decent Work.” Geneva: ILO. http://www.ilo.org/global/publications/books/WCMS_633135/lang––en/index.
htm.
396 ILO 2018.
397 ILO. 2016. Women at Work: Trends
2016.” Geneva: ILO. https://www.ilo.org/wcmsp5/groups/public/–––dgreports/–––dcomm/–––publ/documents/publication/wcms_457317.pdf.
398 Data on informality are not available for earlier years of the EUS.
399 The same patterns with regards to working hours held when focusing only on women.
400 DoS. 2018d. “Statistical Yearbook of Jordan 2018 [in Arabic]”. Jordan. http://dosweb.dos.gov.jo/databank/yearbook/YearBook_2018.pdf.
401 Al–Motlaq, M, N. Azar, and A. Squires. 2017. “Part–Time Employment in Jordan as a Nursing Policy Solution.” Interna-
tional Nursing Review. 64 (1), pp. 69–76. https://doi.org/10.1111/inr.12307; Civil Service Bureau of Jordan. 2018. “Indicators from the ‘Situation of Supply and Demand for Educational Specializations in the Civil Service’ (2017–2018) [in Arabic].” http://www.csb.gov.jo/web/index.php?op-tion=com_k2&view=item&id=649:2017–2018&Itemid=219&lang=ar.
402 DoS. 2018b.
403 Alhawarin, Ibrahim and Fuad Kreis-han. 2017. “Minimum Wage Compliance in the Private Sector: The Case of Wage and Salary Workers in Jordan.” Jordan
Journal of Economic Sciences. 4 (2), pp. 185–207.
404 Assaad, Krafft and Selwaness 2015.
405 Kabeer, Naila. 1994. Reversed Re-
alities: Gender Hierarchies in Develop-
ment Thought. London: Verso Publica-tions.
406 Alhawarin and Kreishan 2017.
407 ILO 2018.
408 European Training Foundation 2016; Gauri et al. 2019.
409 Gauri et al. 2019.

CARE ECONOMY AND PROMOTING GENDER EQUALITY
244
423 OAMDI (Open Access Micro Data Initiative). 2019. “Labor Market Panel Surveys (LMPS).” Version 2.0 of Licensed Data Files. JLMPS 2016. Egypt: Economic Research Forum. http://erf.org.eg/data–portal/.
424 OAMDI. 2019b. “Harmonized Labor Force Surveys (HLFS),” Version 1.0 of Licensed Data Files; EUS 2004–2018 – Department of Statistics (DOS). Jordan. Egypt: Economic Research Forum. http://erf.org.eg/data–portal/.
425 Interview with Eman Akour, Head of the Gender Directorate at MoL. 22 October 2020.
426 Ibid.
427 Interview with Salma Nims, Secre-tary General of the JNCW. 25 October 2020.
428 UNICEF Jordan. 2020. Jordan’s Na-tional Social Protection Response during COVID–19. August. https://www.unicef.org/jordan/media/3921/file/Jordan’s%20National%20SP%20Response%20During%20COVID–%20UNICEF%20%20JSF.pdf
429 Social Security Corporation. 2020. [“The issuance of the social protection system connected to maternity insur-ance and its entry into force: in–cash support to the insured with a value ranging from (25) to (60) dinars per month for a period of six months”.] :الضامن صدور نظام الحامية االجتامعية املرتبط بتأمني األمومة ودخوله حيز التنفيذ دعامً نقدياً للمؤمن عليهن بقيمة ترتاوح من )25( إىل )60( ديناراًشهرياً وملدة ستة أشهرhttps://www.ssc.gov.jo/arabic/%d8%a7%d9%84%d8%b6%d9%85%d8%a7%d9%86–%d8%b5%d8%af%d9%88%d8%b1–%d9%86%d8%b8%d8%a7%d9%85–%d8%a7%d9%84%d8%ad%d9%85%d8%a7%d9%8a%d8%a9–%d8%a7%d9%84%d8%a7%d8%ac%d8%aa%d9%85%d8%a7%d8%b9%d9%8a%d8%a9–%d8%a7/
410 Bursztyn, Leonardo, Alessandra L. González and David Yanagizawa–Drott. 2018. “Misperceived Social Norms: Female Labor Force Participation in Saudi Arabia.” NBER Working Paper. Cambridge, MA: National Bureau of
Economic Research. https://www.nber.
org/papers/w24736.pdf; Gauri et al. 2019.
411 UN Women. 2018a. Promoting Wom-
en’s Economic Empowerment: Recog-
nizing and Investing in the Care Econo-
my. New York: UN Women.
412 Heymann, Jody and others. 2017. “Paid Parental Leave and Family Well-being in the Sustainable Development Era.” Public Health Reviews. 38 (1): 21; OECD. 2016. “Parental Leave: Where Are the Fathers?” OECD Policy Brief. Paris: OECD.
413 Ghawi and others 2017.
414 Clark, Shelley and others. 2019. “The Impact of Childcare on Poor Urban Women’s Economic Empowerment in Africa.” Demography. 56 (4), pp. 1247–1272.
415 Krafft, Caroline and Moundir Las-sassi. Forthcoming. “Public Preschool and Maternal Labour Supply in Algeri: Evidence from a Natural Experiment.” Economic Research Forum Working Paper.
416 Ghawi and others 2017.
417 UN Women. 2019. Progress of the
World’s Women 2019–2020: Families in a
Changing World. New York: UN Wom-en.
418 See the discussion above of Defense Order 1 of 2020.
419 UN Women Jordan 2020.
420 UN Women 2019.
421 DoS. 2018d.
422 OECD Development Centre. 2018. Youth Well–Being Policy Review of
Jordan. Paris: EU–OECD Youth Inclusion Project.
Chapter 4
430 Henceforth “Palestine.”
431 PCBS (Palestinian Central Bureau of Statistics). 2018a. “Labour Force Survey 2018 [in Arabic].” Palestine: PCBS. http://www.pcbs.gov.ps/Downloads/book2433.pdf.
432 Fallah, Belal and others. 2019. “The Effect of Labor–Demand Shocks on Women’s Participation in the Labor Force: Evidence from Palestine.” Part-nership for Economic Policy Working Pa-per No.2019–08. http://dx.doi.org/10.2139/
ssrn.3410521; Krafft, Caroline and Ragui Assaad. 2017. “Employment’s Role in En-abling and Constraining Marriage in the Middle East and North Africa.” Economic Research Forum Working Paper. No. 1080. Cairo: Economic Research Forum. https://erf.org.eg/publications/employ-ments–role–in–enabling–and–constraining–marriage–in–the–middle–east–and–north–africa/
433 Promundo and UN Women. 2017. Understanding Masculinities: Results
from the International Men and Gender
Equality Survey (IMAGES) – Middle East
and North Africa. New York: UN Women. https://www.unwomen.org/en/digital–li-brary/publications/2017/5/understanding–masculinities–results–from–the–images–in–
the–middle–east–and–north–africa.
434 PCBS 2018a.
435 Ragui Assaad, Caroline Krafft and Irene Selwaness. 2017. “The Impact of Early Marriage on Women’s Employ-ment in the Middle East and North Afri-ca.” Economic Research Forum Work-ing Paper. No. 1086. Cairo: Economic Research Forum.
436 Salehi–Isfahani, Djavad and Sara Taghvatalab. 2019. “Education and the Allocation of Time of Married Women in Iran,” Review of Economics of the
Household. 17 (3), pp. 889–921.
437 World Bank. 2020. “West Bank and Gaza.” https://data.worldbank.org/country/
PS. .
438 Based on the Oslo accords, signed by the Government of Israel and the Palestine Liberation Organization in

ENDNOTES
245
448 Institute of Law at Birzeit University. 2011. “Cabinet Resolution No. (11) of 2011: The Regulation of Nurseries 2011”
449 Ibid.
450 MOEHE, MOH and MOSD 2017.
451 Ibid.
452 Ibid.
453 Ibid.
454 Ibid.
455 MoE (Ministry of Education). 2017. Education Law 2017. Palestine: Coun-cil of Ministers. https://www.wattan.net/data/uploads/bafce6842e81cbbeac9fd6a-
7f5a5dfdd.pdf.
456 MOEHE, MOH and MOSD 2017.
457 PCBS. 2018c.
458 PCBS. 2019b. “Selected Indicators for Education in Palestine by Level of Edu-cation and Region for Scholastic Years 1994/1995 – 2018/2019.” http://www.pcbs.gov.ps/Portals/_Rainbow/Documents/Edu-cation–1994–2018–E.html .
459 MOEHE, MOH and MOSD 2017.
460 UN–DESA (United Nations Division of Economic and Social Affairs). 2019. World Population Prospects: The 2019
Revision. New York: UN–DESA Division of Population Affairs; See also Chapter 1.
461 Daeis, Maen, Shahda. 2018. The
Elderly between the Rights Umbrella
and the Neglect Hammer. 96. Palestine: Third Dimension.
462 MoSD (Ministry of Social Devel-opment). 2016. National Strategy for the Elderly in Palestine 2017–2020” [in Arabic]. http://www.mosa.pna.ps/ar/content/%D8%B1%D8%B9%D8%A7%D9%8A%D8%A9–%D8%A7%D9%84%D9%85%D8%B3%D9%86%D9%8A%D9%86
463 MoSD. 2017. “First Annual Statistical Report 2017 [in Arabic].” Palestine. http://www.mosa.pna.ps/en/studies_research_list?title=&field_study_research_date_val-ue%5Bvalue%5D%5Byear%5D=2018.
1993–1995, the West Bank is divided into three areas (“A”, “B”, and “C”). The Palestinian Authority assumes civil and security control of Area A, which encompasses only 18% of the West Bank, representing the main populous areas. The Palestinian Authority also assumes civil control over Area “B”, which is most-ly rural and makes up 22 per cent of the West Bank. On the other hand, Israel assumes security control over area “B” and fully controls Area “C”, which is largely unpopulated and constitutes 60 per cent of the West Bank.
439 The same definition of educated workers is used throughout this pa-per.
440 In this chapter, FLFP is measured excluding those enrolled in educa-tion.
441 Fallah, B. and others 2019.
442 Palestine Economic Policy Research Institute. 2018. “Economic Monitor”. Ramallah: Palestine Economic Policy Research Institute. http://www.mas.ps/files/server/Monitor/monitor%2053%20ara-bic.pdf.
443 PCBS. 2018c. “Population, Housing and Establishments Census 2017 [in Arabic].”Ramallah: Palestine Central Bureau of Statistics. http://www.pcbs.gov.
ps/pcbs_2012/Publications.aspx.
444 UN–DESA (United Nations Depart-ment of Economic and Social Affairs). 2019. World Population Prospects 2019, Online Edition. Rev. 1. New York: DESA, Population Division. 445 Time spent in care for the disabled cannot be distinguished in the data used for this report. However, estimates from the 2017 Census show that only 2 per cent of the population is disabled, so time spent in care for this population group would likely be reported as quite minimal.
446 MOEHE, MOH and MOSD. 2017. The
National Strategy for Early Childhood
Development and Intervention: Pales-
tine. Palestine: UNICEF.
447 Ibid.
464 PCBS. 2019a. “The International Day of Older Persons 2019.” http://www.pcbs.gov.ps/post.aspx?lang=en&ItemID=3563# .
465 Daeis Maen and Shahda 2018.
466 MoSD. 2015. Analysis of the Situation of Rights of Older People in Palestine 2015 [in Arabic]. Palestine. http://www.mosa.pna.ps/en/node/569.
467 MoSD 2017.
468 MoSD 2016.
469 Ibid.
470 Ibid.
471 Ibid.
472 ILO (International Labour Organi-zation) Regional Office for the Arab States. 2018a. The Occupied Palestinian
Territory: An Employment Diagnostic
Study. Beirut: ILO Regional Office for the Arab States. https://www.un.org/uni-spal/wp–content/uploads/2018/04/ILOS-TUDY_040418.pdf.
473 MoL (Ministry of Labour). 2000. “Labour Law No. (7) of 2000.” Palestine. http://legal.pipa.ps/files/server/ENG%20Labour%20Law%20No_%20(7)%20of%202000.
pdf .
474 ILO 2018a.
475 Ibid.
476 ETF (European Training Foundation). 2013. Labour Market and Employment
Policies in Palestine. Palestine: ETF. https://www.etf.europa.eu/sites/default/files/m/49583C88B3C1AD0DC1257CD-1003DA5FC_Employment%20policies_Pales-tine.pdf.
477 ILO Regional Office for the Arab States. 2018b. The Palestinian Decent
Work Programme 2018–2022. ILO. https://www.ilo.org/wcmsp5/groups/public/–––ed_mas/–––program/documents/genericdocu-
ment/wcms_629011.pdf.
478 The Democracy and Workers’ Rights Center. 2017. “Basic Information on The Palestinian Law by Decree No 19 of the Year 2016 Regarding Social Secu-

CARE ECONOMY AND PROMOTING GENDER EQUALITY
246
488 Fallah 2014.
489 PCBS. 2014. “Time–Use Survey 2012/2013: Final Results [in Arabic].” Ramallah: PCBS.
490 PCBS. 2007. “Population, Housing and Establishments Census 2007 [in Arabic].” Palestine. http://www.pcbs.
gov.ps/Downloads/book1313.pdf; PCBS 2018c.
491 The presence of a work contract is not utilized to identify informal workers, since the Palestinian Labour Law ex-tends workers’ rights to all workers.
492 OECD. 2016. “Parental Leave: Where Are the Fathers?,” OECD Policy Brief. Paris: OECD; Heymann, Jody and others. 2017. “Paid Parental Leave and Family Wellbeing in the Sustainable Develop-ment Era.” Public Health Reviews. 38 (1).
493 ILO and OECD. 2019. Gender Equality
in the G20 – Additional Analysis from
the Time Dimension. ILO. http://www.ilo.org/global/about–the–ilo/how–the–ilo–works/multilateral–system/g20/reports/WCMS_713376/lang––en/index.htm.
494 Promundo and UN Women 2017.
495 UN Women. 2019. Progress of the
World’s Women 2019–2020: Families in a
Changing World. New York: UN Wom-en.
496 Committee on Financing Early Care and Education with a Highly Qualified Workforce et al. 2018. Transforming the
Financing of Early Care and Education. La Rue Allen and Emily P. Backes (eds.). Washington, D.C.: National Academies Press. https://doi.org/10.17226/24984.
497 Belfield, Clive R. 2006. “Financing Early Childhood Care and Education: An International Review – UNESCO Digital Library”. UNESCO. https://unesdoc.unesco.org/ark:/48223/pf0000147443.
498 PCBS. 2019b. “Selected Indicators for Education in Palestine by Level of Edu-cation and Region for Scholastic Years 1994/1995 – 2018/2019.”
rity.” Palestine. https://www.dwrc.org/en/1/30/344/The–Palestinian–Law–by–De-cree–no–19–of–the–Year–2016–regarding–
Social–Security.htm.
479 Only 2 per cent of individuals are engaged in unpaid care work for the elderly.
480 PCBS. 2012. “On the Eve of World Elderly Day.” http://pcbs.gov.ps/post.aspx-
?lang=en&ItemID=599#.
481 The time–use data allow time vari-ation to be explored by the number of hours worked per week. The results show that time allocated to unpaid work slightly decreases by this factor in the following fashion: 42 hours for the ‘1–14 hours worked’ group, 39 hours for the ‘15–34 hours worked’ group, and 38 hours for those working more than 34 hours. This pattern is mainly driven by time allocated to indirect paid care. In terms of type of employment (waged worker, employer/self–employed, and unpaid family workers), the data show little time variation in the overall unpaid care work.
482 The source of data is the PCBS LFS of 2013. The time–use survey provides data on the number of hours worked in a categorical fashion, for those working 1 to 14 hours, 15 to 34 hours, and more than 35 hours.
483 According to the LFS of 2018, the share of employed, educated women with tertiary education constitutes two–thirds of all employed women.
484 Fallah, B. 2016. “Labor Market Effi-ciency in Palestine.” Palestine Economic Policy Research Institute.
485 The LFS sample size does not allow estimation of the minimum wage share separately for workers in the Govern-ment, UNRWA and ‘other’ sector.
486 Fallah, Belal. 2014. “Evaluation of Employers’ Compliance to Minimum Regulation in the West Bank.” The extent of Minimum Wage Compliance in West Bank. Palestine Economic Policy Re-search Institute; Fallah 2016.
487 Ibid.
499 PCBS (Palestinian Central Bureau of Statistics). 2015. Palestinian Multiple Indicator Cluster Survey 2014. Ramallah, Palestine. http://mics.unicef.org/news_entries/32.
500 World Bank. 2019. Improving Early Childhood Development in the West Bank and Gaza. 16 January. http://documents1.worldbank.org/curated/en/539691550014651809/pdf/Concept–Proj-ect–Information–Document–PID–Improv-ing–Early–Childhood–Development–in–the–West–Bank–and–Gaza–P168295.pdf
501 State of Palestine. 2017. National Strategy for Early Childhood Devel-opment and Intervention 2017–2022. 22 February. https://reliefweb.int/report/occupied–palestinian–territory/state–pales-tine–national–strategy–early–childhood–de-velopment#:~:text=The%20MOEHE%2C%20MOH%20and%20MOSD,with%20the%20aim%20of%20ensuring
502 Interview with Asem Khamis, General Manager of the ECD/Nurseries Depart-ment at MoSD. Palestine. 24 September 2020.
503 United Nations Children’s Fund (UNICEF). 2017. “New Training Program Designed to Improve Child Health and Development in the State of Pales-tine.” 11 April. https://www.un.org/unispal/document/new–training–program–de-signed–to–improve–child–health–and–de-velopment–in–the–state–of–palestine–unicef–media–release/
Chapter 5
504 INS (National Institute of Statistics). 2020. “Unemployment Rate in Tunisia,” Tunis: INS. http://www.ins.tn/fr/themes/em-ploi.
505 MoH (Ministry of Health). 2016. “La Santé des Tunisiens : Résultats de l’enquête « Tunisian Health Examination Survey–2016 »”. Tunisia: MoH. http://www.santetunisie.rns.tn/images/rapport–final–en-
quete2020.pdf; World Bank. 2014. “Tunisie – Surmonter les obstacles a l’inclusion des jeunes [Tunisia – Breaking the barri-ers to youth inclusion].” Washington, D.C:

ENDNOTES
247
516 Budget Survey of Women and Men in Tunisia].” Tunis: Ministry of Women, Family, Childhood and Seniors. Tunisia had established a solid leg-islative and institutional framework to combat gender discrimination and to promote equality between men and women in the various spheres of economic, social, cultural and political life. In 1956, it adopted the Personal Status Code (CSP) which proclaims the principle of equality of men and women in terms of citizenship. The CSP abolish-es polygamy, institutes judicial divorce and sets the minimum age of marriage at 17 for women. It also opens the door to education, freedom of choice of a spouse and civil marriage. In 1985, Tuni-sia was one of the first Arab countries to ratify the Convention on the Elimination of All Forms of Discrimination against Women (CEDAW). The new Constitution of 27 January 2014 stipulates that male and female citizens are equal in rights and duties. They are equal before the law without any discrimination (Article 21).
517 World Bank. 2014b. “Young Peo-ple in Tunisia Still Frustrated by So-cial and Economic Obstacles.” https://www.worldbank.org/en/news/press–re-lease/2014/10/02/world–bank–report–young–people–tunisia–frustrated–social–economic–obstacles.
518 ILO. 2018. Care Work and Care Jobs
for the Future of Decent Work. Inter-national Labour Organization. http://www.ilo.org/global/publications/books/WCMS_633135/lang––en/index.htm.
519 Dotti, Giulia M., and Judith Treas. 2016. “Educational Gradients in Par-ents’ Child–Care Time Across Countries, 1965–2012: Educational Gradients in Parents’ Child–Care Time.” Journal
of Marriage and Family. 78 (4), pp.
1083–96, https://doi.org/10.1111/jomf.12305; Guryan, Jonathan, Erik Hurst, and Me-lissa Kearney. 2008. “Parental Education and Parental Time with Children,” Jour-
nal of Economic Perspectives. 22 (3), pp. 23–46. https://doi.org/10.1257/jep.22.3.23; Gimenez–Nadal, Jose Ignacio, and Almudena Sevilla. 2012. “Trends in Time Allocation: A Cross–Country Analysis.” European Economic Review. 56 (6), pp. 1338–59. https://doi.org/10.1016/j.euroecor-
ev.2012.02.011.
World Bank. http://documents.worldbank.org/curated/en/120511468305646014/Tu-nisie–Surmonter–les–obstacles–a–linclusion–des–jeunes.
506 See, for example, OECD. 2017. “Car-ing for Quality in Health: Lessons Learnt from 15 Reviews of Health Care Quality.” In OECD Reviews of Health Care Quality. Paris: OECD Publishing. https://www.oecd.org/health/caring–for–quality–in–
health–9789264267787–en.htm.
507 World Bank. 2020. “Labor Force, Fe-male (% of Total Labor Force) – Tunisia,” World Bank Data. https://data.worldbank.org/indicator/SL.TLF.TOTL.FE.ZS?loca-tions=TN.
508 INS 2020.
509 See https://www.onu–tn.org/uploads/actualites/15375266011.pdf for quantitative targets set by the MWFCS.
510 INS and UNICEF. 2018. “Enquête par grappes à indicateurs multiples (MICS).” Tunisia: Ministère du Développementde l’Investissement et de la Coopération Internationale (MDICI). https://mics–sur-veys–prod.s3.amazonaws.com/MICS6/Middle%20East%20and%20North%20Africa/Tunisia/2018/Survey%20findings/MICS%20Tunisia%202018–SFR_French.pdf.
511 MoH 2016.
512 ILO. 2012. “R202 – Social Protection Floors Recommendation, 2012 (No. 202),” https://www.ilo.org/dyn/normlex/en/f?p=NORMLEXPUB:12100:0::NO::P12100_ILO_CODE:R202.
513 Economic Research Forum and National Institute of Statistics. 2005. “Tunisia – National Survey on Household Budget, Consumption and Standard of Living, EBCNV 2005.” http://www.erfdata-portal.com/index.php/catalog/46/study–de-
scription.
514 MoH. 2015. Comptes Nationaux de la Santé. http://www.sante.gov.ma/Publications/Etudes_enquete/Documents/Comptes%20Nationaux%20de%20la%20Sant%C3%A9%20Rapport%202015.pdf
515 Source: Article 122 of the 1966 Labour Code, recently amended in 2017; Article 40(4) of Law No. 83–122 of 12 December 1983.
520 Guryan, Hurst and Kearney 2008.
521 Antonopoulos, Rania and Indira Hir-way. 2020. “Unpaid Work and the Econ-omy.” In Unpaid Work and the Economy
– Gender, Time Use and Poverty in De-
veloping Countries. Rania Antonopou-los and Indira Hirway (Eds.). London: Palgrave Macmillan. https://www.pal-grave.com/gp/book/9780230217300; Charmes, Jacques. 2000. “African Wom-en in Food Processing: A Major, but Still Underestimated Sector of Their Contri-bution to the National Economy.” Inter-national Development Research Centre. https://www.wiego.org/sites/default/files/migrated/publications/files/Charmes_Afri-can_Women_Food_Processing_2000.pdf;
Charmes, Jacques. 2006. “A Review of Empirical Evidence on Time Use in Africa from UN Sponsored Surveys.” Gender, Time Use and Poverty in Sub–Saharan Africa. Washington, DC.: World Bank.; Qi, Liangshu and Xiao–yuan Dong. 2018. “Gender, Low–Paid Status, and Time Poverty in Urban China.” Feminist
Economics. 24 (2), pp. 171–93. https://doi.
org/10.1080/13545701.2017.1404621.
522 Hirway, Indira. 2010. “Understanding Poverty: Insights Emerging from Time Use of the Poor.” In Unpaid Work and the
Economy: Gender, Time Use and Poverty
in Developing Countries. Rania Anto-nopoulos and Indira Hirway (Eds.). Lon-don: Palgrave Macmillan UK, pp. 22–57. https://doi.org/10.1057/9780230250550_2; Bardasi, Elena and Quentin Wodon. 2006. “Measuring Time Poverty and Analyzing Its Determinants: Concepts and Application to Guinea.” World Bank. https://core.ac.uk/download/pdf/213903033.pdf.
523 Time poverty or time stress is defined as “the fact that some individuals do not have enough time for rest and leisure after taking into account the time spent working, whether in the labour market, for domestic work, or for other activi-ties such as fetching water and wood.” Bardasi and Wodon 2006. Bardasi and Wodon (2010) later redefined time pov-erty in a more restrictive way by intro-ducing the ‘freedom of choice’ concept to distinguish between those who work long hours because ‘of need’ rather than because ‘of choice’. Bardasi, Elena and Quentin Wodon. 2010. “Working

CARE ECONOMY AND PROMOTING GENDER EQUALITY
248
Improve Child Development and Affect the Quality of Parent–Child Interaction? Evidence from Algeria.” GLO Discussion Paper Series 557, Global Labor Organi-zation (GLO).
534 Krafft, C. and Lassassi, M. 2020. “Public Preschool and Maternal Labor Supply in Algeria: Evidence from a Nat-ural Experiment.” ERF Working Paper, ERF.
535 Ibid.
Appendcies
536 ILO. 2018. Care Work and Care Jobs
for the Future of Decent Work. Geneva: ILO.
537 Charmes, Jacques. 2019. The Unpaid
Care Work and the Labour Market. An
Analysis of Time Use Data Based on the
Latest World Compilation of Time–Use
Surveys. Geneva: ILO.
538 Ibid.
539 UNSD (United Nations Statistics Di-vision). 2017. International Classification
of Activities for Time Use Statistics 2016 (ICATUS 2016). New York: UNSD.
540 There is a more recent wave of the ELMPS, from 2018, which was excluded from the analysis. Although it provides accurate information regarding time spent on indirect care work, the time spent on direct care work is quite un-derestimated. This is because the ques-tion about whether the individual has spent time on direct care work included very few responses, likely due to a prob-lem during data coding or fieldwork. Due to this problem, it is not possible to have reliable estimates about the participation and amount of time spent on direct care work.
541 Barsoum, Ghada. 2007. “Egypt Labor Market Panel Survey 2006: Report on Methodology and Data Collection,” Working Paper 0704. Cairo: Economic Research Forum; Assaad, Ragui and
Long Hours and Having No Choice: Time Poverty in Guinea.” Feminist Economics. 16 (3), pp. 45–78. https://doi.org/10.1080/13
545701.2010.508574. 524 The results did not reveal significant differences when analysed by occupa-tions or industries; results are therefore presented for occupations only. 525 It should be noted that statistics on educational attainment by sector vary somewhat from one study to anoth-er.
526 World Bank. 2015. “Développement
de la Petite Enfance– Tunisie [Ear-
ly Childhood Development–Tunisia].” System Approach for Better Education Results. Washington, D.C: World Bank Group. http://documents.worldbank.org/curated/en/986461492508159495/pdf/114297–WP–PUBLIC–FRENCH–SA-BER–ECD–Tunisia.pdf.
527 World Bank 2015.
528 Assaad, Ragui, and others. 2016. “Introducing the Tunisia Labor Market Panel Survey 2014,” IZA Journal of Labor
& Development. 5 (1), p. 15. https://doi.org/10.1186/s40175–016–0061–y.
529 Draoui, Mahfoudh, and others. 2011. “Enquête Budget–Temps Des Femmes et Des Hommes En Tunisie. [Time Budget Survey of Women and Men in Tunisia].” Tunis: Ministry of Women, Family, Child-hood and Seniors.
530 Mustard, F., 2007. “Experienced–based brain development: Scientific underpinning of the importance of early child development in a global world.” In M. Young & L. Richardson (Eds.). Early child development: From measurement to action. (pp. 43–86). Washington, D.C.: The World Bank.
531 Irwin, L. G., Siddiqi, A., Hertzman, C., 2007. Early childhood development: A powerful equalizer. Geneva, Switzer-land: World Health Organization.
532 Touhami, A. and Lassassi, M. 2018. “Inequality of Opportunity in Early Childhood Development in Algeria over Time.” ERF Working Paper No. 1254. Economic Research Forum (ERF).
533 Lassassi, M. 2020. “Does Pre–School
Caroline Krafft. 2013. “The Egypt Labor Market Panel Survey: Introducing the 2012 Round,” IZA Journal of Labor &
Development. 2 (1), p. 8.; Assaad, Ragui, and others. 2016. “Introducing the Tuni-sia Labor Market Panel Survey 2014,” IZA
Journal of Labor & Development. 5 (1), p. 15; Krafft, Caroline and Ragui Assaad. 2018. “Introducing the Jordan Labor Market Panel Survey 2016.” Working Pa-per No. 1186. Cairo: Economic Research Forum.
542 Charmes 2019.
543 PCBS. 2014. “Time Use Survey 2012/2013: Final Results [in Arabic].” Ramallah: PCBS.
544 UNSD. 2005. “Guide to Producing Statistics on Time Use: Measuring Paid and Unpaid Work (ICATUS 2005).” New York: UNSD.
545 ILO (International Labour Organi-zation). 2012. “International Standard Classification of Occupations 2008 (ISCO–08): Structure, Group Definitions and Correspondence Tables.” Geneva: ILO.
546 UNSD. 2008. “International Standard Industrial Classification of All Economic Activities (ISIC) Rev. 4.” New York: United Nations Department of Economic and Social Affairs.
547 OAMDI (Open Access Micro Data Initiative). 2019a. “Harmonized Labor Force Surveys (HLFS),” Version 1.0 of Li-censed Data Files; LFS 2009–2017; Cen-tral Agency for Public Mobilization and Statistics. Egypt: Economic Research Forum. http://erf.org.eg/data–portal/.
548 OAMDI. 2019b. “Harmonized Labor Force Surveys (HLFS),” Version 1.0 of Licensed Data Files; EUS 2004–2018 – Department of Statistics (DOS). Jordan. Egypt: Economic Research Forum. http://erf.org.eg/data–portal/.
549 PCBS. 2018. “Population, Housing and Establishments Census 2017 [in Ar-abic].” Ramallah: PCBS. http://www.pcbs.gov.ps/pcbs_2012/Publications.aspx.
550– Algeria’s labour law is unavail-able.

CARE ECONOMY AND PROMOTING GENDER EQUALITY
249
References
Abdel Wahab, Dina. Personal communication with this former
advisor to the Minister of Social Solidarity (Egypt).
Abowd, Maryclaire. 2009. “IN DEPTH: Elderly Care On The
Rise.” American Chamber of Commerce in Egypt. https://
www.amcham.org.eg/publications/business–monthly/is-
sues/115/July–2009/118/elderly–care–on–the–rise.
Abu Kamel, Andaleeb M. 2016. “Who Are the Elder’s Caregiv-
ers in Jordan: A Cross–Sectional Study.” Journal of Nursing
Education and Practice. 6 (3). https://doi.org/10.5430/jnep.
v6n3p116.
Al–Hassan, Omayya M. 2018. “Developments of Early Child-
hood Education in Jordan.” Early Years. 38 (4), pp. 351–62.
https://doi.org/10.1080/09575146.2018.1512562.
Alhawarin, Ibrahim and Fuad Kreishan. 2017. “Minimum Wage
Compliance in the Private Sector: The Case of Wage and
Salary Workers in Jordan.” Jordan Journal of Economic
Sciences. 4 (2), pp. 185–207.
Alhawarin, Ibrahim and Irene Selwaness. 2019. “The Challeng-
es of Social Security Coverage and Early Retirement in
Jordan: What Happened after the 2010 Pension Reform?”
In The Jordanian Labor Market: Between Fragility and Re-
silience, Caroline Krafft and Ragui Assaad (Eds.), Oxford:
Oxford University Press, pp. 313–40.
Al–Motlaq, M., N. Azar and A. Squires. 2017. “Part–Time Em-
ployment in Jordan as a Nursing Policy Solution.” Inter-
national Nursing Review. 64 (1), pp. 69–76. https://doi.
org/10.1111/inr.12307.
Altarawana, Mahmoud and Alaa Mazhar. 2019. “Razzaz: 50%
of capital spending will be on the sectors of education,
transportation and health [in Arabic].” Alghad, 24 Decem-
ber. https://alghad.com/الرزاز–50–من–اإلنفاق–الرأساميل–سيكون–عل/.
Antonopoulos, Rania and Indira Hirway. 2020. “Unpaid Work
and the Economy.” In Unpaid Work and the Economy: Gen-
der, Time Use and Poverty in Developing Countries. Rania
Antonopoulos and Indira Hirway (Eds.) London: Palgrave
Macmillan, pp. 1–21. Accessed 10 June 2020. https://www.
palgrave.com/gp/book/9780230217300.
Assaad, Ragui. 2008. “Unemployment and Youth Insertion in
the Labor Market in Egypt.” In The Egyptian Economy: Cur-
rent Challenges and Future Prospects, Hana Khayr al–Din
(Ed.) Cairo: American University in Cairo, pp. 133–78.
———. 2014. “Making Sense of Arab Labor Markets: The Endur-
ing Legacy of Dualism.” IZA Journal of Labor & Develop-
ment. 3 (1), pp. 1–25. https://doi.org/10.1186/2193–9020–3–
6.
Assaad, Ragui A., and others. 2016. “Introducing the Tunisia
Labor Market Panel Survey 2014.” IZA Journal of Labor &
Development. 5 (1). https://doi.org/10.1186/s40175–016–
0061–y .
———. 2018. “Explaining the MENA Paradox: Rising Educational
Attainment, Yet Stagnant Female Labor Force Participa-
tion,” IZA Discussion Paper. Bonn, Germany: IZA Institute of
Labor Economics.
Assaad, Ragui and Melanie Arntz. 2005. “Constrained Geo-
graphical Mobility and Gendered Labor Market Outcomes
Under Structural Adjustment: Evidence from Egypt.” World
Development. 33 (3), pp. 431–54.
Assaad, Ragui and Ghada Barsoum. 2019. “Public Employment
in the Middle East and North Africa.” IZA World of Labor.
463 (A), pp. 1–9. https://doi.org/10.15185/izawol.463.
Assaad, Ragui and Fatma El Hamidi. 2009. “Women in the
Egyptian Labor Market: An Analysis of Developments,
1988–2006,” In The Egyptian Labor Market Revisited, Ragui
Assaad (Ed.), Cairo: American University in Cairo Press, pp.
117–56.
Assaad, Ragui and Caroline Krafft. 2013. “The Egypt La-
bor Market Panel Survey: Introducing the 2012 Round.”
IZA Journal of Labor & Development. 2 (1). https://doi.
org/10.1186/2193–9020–2–8.
Assaad, Ragui, Caroline Krafft and Caitlyn Keo. 2019. “The
Composition of Labor Supply and Its Evolution from 2010
to 2016 in Jordan.” In The Jordanian Labor Market: Between
Fragility and Resilience. Caroline Krafft and Ragui Assaad
(Eds.). Oxford: Oxford University Press, pp. 11–42.
Assaad, Ragui, Caroline Krafft and Irene Selwaness. 2017. “The
Impact of Early Marriage on Women’s Employment in The
Middle East and North Africa.” Economic Research Forum
Working Paper Series. No. 1086. Cairo: Economic Research
Forum. https://erf.org.eg/publications/the–impact–of–
early–marriage–on–womens–employment–in–the–mid-
dle–east–and–north–africa/
Assaad, Ragui and Colette Salemi. 2019. “The Structure of Em-
ployment and Job Creation in Jordan, 2010–2016.” In The
Jordanian Labor Market: Between Fragility and Resilience.
Caroline Krafft and Ragui Assaad (Eds.). Oxford: Oxford
University Press, pp. 43–78.

REFERENCES
250
Attanasio, O., H. Low, and V. Sanchez–Marcos. 2008. “Ex-
plaining Changes in Female Labor Supply in a Life–Cycle
Model.” American Economic Review. 98, pp. 1517–52.
Bardasi, Elena and Quentin Wodon. 2006. Measuring Time
Poverty and Analyzing Its Determinants: Concepts and
Application to Guinea. World Bank. https://core.ac.uk/
download/pdf/213903033.pdf.
———. 2010. “Working Long Hours and Having No Choice: Time
Poverty in Guinea.” Feminist Economics. 16 (3), pp. 45–78.
https://doi.org/10.1080/13545701.2010.508574.
Barsoum, Ghada. 2015. “Young People’s Job Aspirations in
Egypt and the Continued Preference for a Government
Job.” In The Egyptian Labor Market in an Era of Revolution.
Ragui Assaad and Caroline Krafft (Eds.). Oxford: Oxford
University Press, pp. 108–26.
Barsoum, Ghada, Ali Rashed and Dahlia Hassanien. 2009.
“When There Is ‘No Respect’ at Work: Job Quality Issues for
Women in Egypt’s Private Sector.” Gender and Work in the
MENA Region Working Paper Series: Poverty, Job Quality
and Labor Market Dynamics. Cairo: Population Council.
Belfield, Clive R. 2006. Financing Early Childhood Care and
Education: An International Review. UNESCO. https://unes-
doc.unesco.org/ark:/48223/pf0000147443.
Bick, A. 2015. “The Quantitative Role of Child Care for Female
Labor–force participation and Fertility”. Journal of the Eu-
ropean Economic Association. 14, pp. 639–668.
Bosch, M.J. 2019. ‘Chile country note,’ in Koslowski, A. and
others. (Eds.). International Review of Leave Policies and
Research 2019. http://www.leavenetwork.org/lp_and_r_
reports/
Breisinger, Clemens and others. 2018. “Impact Evaluation
Study for Egypt’s Takaful and Karama Cash Transfer Pro-
gram: Part 1: Quantitative Report.”
Brodmann, Stefanie, Irene Jillson and Nahla Hassan. 2014.
Social Insurance Reform in Jordan: Awareness and Percep-
tions of Employment Opportunities for Women. Washing-
ton, D.C.: World Bank.
Budig, M. J. and N. Folbre. 2004. “Activity, Proximity, or Respon-
sibility? Measuring Parental Childcare Time.” In Family
Time: The Social Organization of Care. M. Budig and N.
Folbre (Eds.). London: Routledge, pp. 51–68.
Bursztyn, Leonardo, Alessandra L. González and David Yan-
agizawa–Drott. 2018. “Misperceived Social Norms: Female
Labor Force Participation in Saudi Arabia.” NBER Working
Paper. Cambridge, MA: National Bureau of Economic Re-
search. https://www.nber.org/papers/w24736.pdf
CBJ (Central Bank of Jordan). 2018. “The Jordanian Economy in Num-
bers 2013–2017 [in Arabic].” Amman: CBJ. https://www.cbj.gov.jo/
EchoBusv3.0/SystemAssets/PDFs/2018%20%D8%A7%D9%84%D8%
A7%D9%82%D8%AA%D8%B5%D8%A7%D8%AF%20%D8%A7%D9%84
%D8%A7%D8%B1%D8%AF%D9%86%D9%8A%20%D9%81%D9%8A%20
%D8%A7%D8%B1%D9%82%D8%A7%D9%85.pdf
———. 2020. Annual Statistical Bulletin 2020 [in Arabic]. http://
www.cbj.gov.jo/Pages/viewpage.aspx?pageID=67.
Charmes, Jacques. 2000. “African Women in Food Processing:
A Major, but Still Underestimated Sector of Their Contribu-
tion to the National Economy.” International Development
Research Centre. https://www.wiego.org/sites/default/
files/migrated/publications/files/Charmes_African_
Women_Food_Processing_2000.pdf.
———. 2006. “A Review of Empirical Evidence on Time Use in
Africa from UN Sponsored Surveys.” Gender, Time Use and
Poverty in Sub–Saharan Africa. Washington, DC.: World
Bank.
———. 2015. “Time Use across the World: Findings of a World
Compilation of Time–Use Surveys.” Background paper for
the Human Development Report. New York: UNDP.
———. 2019. The Unpaid Care Work and the Labour Market. An
Analysis of Time Use Data Based on the Latest World Com-
pilation of Time–Use Surveys. Geneva: ILO.
Civil Service Bureau of Jordan. 2018. “Indicators from the
‘Situation of Supply and Demand for Educational Spe-
cializations in the Civil Service’ (2017–2018)” [in Arabic].
http://www.csb.gov.jo/web/index.php?option=com_
k2&view=item&id=649:2017–2018&Itemid=219&lang=ar.
Clark, Shelley and others. 2019. “The Impact of Childcare on
Poor Urban Women’s Economic Empowerment in Africa.”
Demography. 56 (4), pp. 1247–1272.
Committee on Financing Early Care and Education with a
Highly Qualified Workforce, Board on Children, Youth, and
Families, Division of Behavioral and Social Sciences and
Education, Health and Medicine Division, and National
Academies of Sciences, Engineering, and Medicine. 2018.
Transforming the Financing of Early Care and Education.
La Rue, Allen and Emily P. Backes (Eds.). Washington, D.C.:
National Academies Press. https://doi.org/10.17226/24984.
Comparative Constitutions Project. 2019. “Egypt’s Constitution
2014 (Rev. 2019).” https://www.constituteproject.org/con-
stitution/Egypt_2019?lang=en.

CARE ECONOMY AND PROMOTING GENDER EQUALITY
251
Constant, Louay and others. 2020. Barriers to Employment
That Women Face in Egypt: Policy Challenges and
Considerations. Rand. RAND Corporation. https://doi.
org/10.7249/RR2868.
Council for Economic Policy. 2018. “Jordan Economic Growth
Stimulus Plan.” Amman: Council for Economic Policy.
http://egp.jo/uploaded/calendar/1528124641.pdf.
Daeis, Maen, Shahda. 2018. The Elderly between the Rights
Umbrella and the Neglect Hammer. 96. Palestine: Third
Dimension.
De Henau, Jérôme and others. 2019. Investing in Free Universal
Childcare in South Africa, Turkey and Uruguay: A Compar-
ative Analysis of Costs, Short–Term Employment Effects
and Fiscal Revenue. New York: UN Women.
Department of Statistics. 2018a. “Distribution of Those Who Left
Their Work by Reason and Gender 2018 [in Arabic].” http://
www.dos.gov.jo/owa–user/owa/jobs_yearly.show_ta-
bles1_jobs_yearly?lang=A&year1=2018&t_no=24.
———. 2018b. “Percentage Distribution of Jordanian Females
Aged 15 Years and above by Economic Activity Status and
Urban / Rural, 2018.” [التوزيع النســبي لإلناث األردنيات اللوايت أعامرهن 15 ســنة -Jordan: Depart [ فاكرث حســب حاله النشــاط اإلقتصادي الحايل والحرض والريف
ment of Statistics. http://www.dos.gov.jo/dos_home_e/
main/population/woman/2018/status8/king.pd-
f?newurl=status8&newurl0=0&newur11=%2Fking.pdf.
———. 2018c. “ECES (2018) Results of Employment and Com-
pensations of Employees Survey of 2016 Report [in Ara-
bic].” http://dosweb.dos.gov.jo/DataBank/Employment/
Employment2016.pdf
———. 2018d. Statistical Yearbook of Jordan 2018 [in Arabic].
Jordan. http://dosweb.dos.gov.jo/databank/yearbook/
YearBook_2018.pdf.
———. 2019. “ECES (2019) Results of Employment and Com-
pensations of Employees Survey of 2017 Report [in Arabic].
http://dosweb.dos.gov.jo/DataBank/Employment/Em-
ployment2017.pdf
———. N.D. “Job Creation Survey Database 2018 [in Arabic]”
http://www.dos.gov.jo/dos_home_a/main/linked–html/
Job_opp.htm.
DoS and ICF International. 2012. Jordan Population and Family
Health Survey 2012. Calverton: DoS and ICF International.
———. 2019. Population and Family Health Survey 2017–18: Jor-
dan. Amman and Rockville: DoS and ICF International.
Diwan, Ishac and Irina Vartanova. 2017. “The Effect of Patri-
archal Culture on Women’s Labor Force Participation.”
Economic Research Forum Working Paper. Cairo: Econom-
ic Research Forum.
Dotti Sani, Giulia M. and Judith Treas. 2016. “Educational
Gradients in Parents’ Child–Care Time Across Countries,
1965–2012: Educational Gradients in Parents’ Child–Care
Time.” Journal of Marriage and Family. 78 (4), pp. 1083–96.
https://doi.org/10.1111/jomf.12305.
Dougherty, C. 2014. The Labour Market for Youth in Egypt:
Evidence from the 2012 School to Work Transition Survey.
Silatech Working Paper. 14 (2).
Draoui, Mahfoudh and others. 2011. “Enquête Budget–Temps
Des Femmes et Des Hommes En Tunisie.” [Time Budget
Survey of Women and Men in Tunisia] Tunis: Ministry of
Women, Family, Childhood and Seniors.
Duffy, Mignon and Amy Armenia. 2019. “Paid Care Work
around the Globe: A Comparative Analysis of 47 Countries
Prepared for UN Women.” LIS Working Paper Series. No.
758. http://www.lisdatacenter.org/wps/liswps/758.pdf
Duflo, Esther. 2012. “Women Empowerment and Economic
Development.” Journal of Economic Literature. 50 (4), pp.
1051–79.
EBRD and ICRW. 2019. Policy Report: Making the Case for
Care.
Economic Research Forum and National Institute of Statistics
(Tunisia). 2005. Tunisia: National Survey on Household
Budget, Consumption and Standard of Living, EBCNV
2005. http://www.erfdataportal.com/index.php/cata-
log/46/study–description.
Egypt Independent. 2019. “Education minister announces
public school fees, exempted groups.” Egypt Independent.
12 September. https://egyptindependent.com/minister–
of–education–issues–public–schools–fess–names–of–ex-
empted–groups/
Elder, Glen. 1977. “Family History and the Life Course.” Journal
of Family History. 2 (4), pp. 279–304.
El Hbal, Ayat. 2020. “The nursery sector sees losses during the
period of closure due to ‘corona’ [in Arabic].” Al Masry Al
Youm. 21 April. https://www.almasryalyoum.com/news/
details/1970387.
El–Kogali, Safaa and Caroline Krafft. 2015. Expanding Oppor-
tunities for the Next Generation: Early Childhood Devel-
opment in the Middle East and North Africa. Washington,

REFERENCES
252
DC: World Bank. https://openknowledge.worldbank.org/
bitstream/handle/10986/21287/9781464803239.pdf?se-
quence=1&isAllo.
Elson, Diane. 2017. “Recognize, Reduce, and Redistrib-
ute Unpaid Care Work: How to Close the Gender
Gap.” New Labor Forum. 26 (2), pp. 52–61. https://doi.
org/10.1177/1095796017700135.
El Thatha, Hatem. 2019. “Ministry of Social Development:
Electronic services enhance performance and ac-
countability [in Arabic].” Jordan News Agency. 9 Sep-
tember. https://www.petra.gov.jo/Include/InnerPage.
jsp?ID=39492&lang=ar&name=local_news
European Training Foundation. 2016. Increasing Female
Participation in Employment through Vocational Edu-
cation and Training in Jordan. Turin: European Training
Foundation. https://www.etf.europa.eu/sites/default/
files/m/13B3612BD2694D28C125802000327DE9_
PRIME%20Issues%20Paper%20Jordan.pdf.
ETF (European Training Foundation). 2013. Labour Market and
Employment Policies In Palestine. Palestine: ETF. https://
www.etf.europa.eu/sites/default/files/m/49583C88B-
3C1AD0DC1257CD1003DA5FC_Employment%20policies_
Palestine.pdf.
Fallah, Belal. 2014. “Evaluation of Employers’ Compliance to
Minimum Regulation in the West Bank.” The extent of Min-
imum Wage Compliance in West Bank. Palestine Economic
Policy Research Institute.
———. 2016. “Labor Market Efficiency in Palestine”. Palestine
Economic Policy Research Institute.
Fallah, Belal and others. 2019. “The Effect of Labor–Demand
Shocks on Women’s Participation in the Labor Force:
Evidence from Palestine.” Partnership for Economic Policy
Working Paper No. 2019–08. http://dx.doi.org/10.2139/
ssrn.3410521.
Ferrant, Gaëlle, Luca Maria Pesando and Keiko Nowacka.
2014. “Unpaid Care Work: The Missing Link in the Analysis
of Gender Gaps in Labour Outcomes.” OECD Development
Centre.
Gallup and ILO. 2017. Towards a Better Future for Women and
Work: Voices of Women and Men. Geneva: ILO and Gallup.
Galor, O. and D. N. Weil. 1996. “The Gender Gap, Fertility, and
Growth”. American Economic Review. 86, pp. 374–387.
Gauri, Varun, Tasmia Rahman and Iman Sen. 2019. “Measuring
Social Norms About Female Labor Force Participation in
Jordan.” Policy Research Working Paper. Washington, D.C.:
The World Bank.
Ghawi, Ghalia and others. 2017. “Nurseries in Jordan: Find-
ings from The Queen Rania Foundation National Early
Childhood Development Survey 2015.” Jordan: Queen
Rania Foundation. https://www.qrf.org/sites/default/
files/2019–07/qrf_nurseries_report_en.pdf.
Ghazal, Mohammad. 2018. “38 Workplace Nurseries to Be Built
by End of Year.” The Jordan Times. 10 April. Accessed 15
November 2019. http://www.jordantimes.com/news/lo-
cal/38–workplace–nurseries–be–built–end–year.
Gimenez–Nadal, Jose Ignacio and Almudena Sevilla. 2012.
“Trends in Time Allocation: A Cross–Country Analysis.” Eu-
ropean Economic Review. 56 (6), pp. 1338–59. https://doi.
org/10.1016/j.euroecorev.2012.02.011.
Guryan, Jonathan, Erik Hurst and Melissa Kearney. 2008. “Pa-
rental Education and Parental Time with Children.” Journal
of Economic Perspectives. 22 (3), pp. 23–46. https://doi.
org/10.1257/jep.22.3.23.
Hendy, Rana. 2010. “Rethinking Time allocation of Egyptian
Women: A Matching Analysis.” Cairo: Economic Research
Forum Working Paper Series. No. 526.
———. 2015. “Women’s Participation in the Egyptian Labor Mar-
ket.” In The Egyptian Labor Market in an Era of Revolution.
Ragui Assaad and Caroline Krafft (Eds.) Oxford: Oxford
University Press, pp. 147–61.
Heymann, Jody, and others. 2017. “Paid Parental Leave and
Family Wellbeing in the Sustainable Development Era.”
Public Health Reviews. 38 (1).
Hirway, Indira. 2010. “Understanding Poverty: Insights Emerg-
ing from Time Use of the Poor.” In Unpaid Work and the
Economy: Gender, Time Use and Poverty in Developing
Countries. Rania Antonopoulos and Indira Hirway (Eds.).
London: Palgrave Macmillan UK, pp. 22–57. https://doi.
org/10.1057/9780230250550_2.
Hochschild, Arlie, and Anne Machung. 1989. The Second Shift:
Working Parents and the Revolution at Home. New York:
Viking.
Ibáñez Prieto, Ana V. 2018a. “Instructions for Licensing, Reg-
ulation of Home Daycares Being Drafted — Ministry.” The
Jordan Times. 23 July. http://jordantimes.com/news/local/
instructions–licensing–regulation–home–daycares–be-
ing–drafted–%E2%80%94–ministry.

CARE ECONOMY AND PROMOTING GENDER EQUALITY
253
———. 2018b. “Provisions for Better Integration of Children with
Disabilities Included in New Nursery System.” The Jordan
Times. 22 June. http://www.jordantimes.com/news/local/
provisions–better–integration–children–disabilities–in-
cluded–new–nursery–system.
ILO (International Labour Organization). 2010. World Social
Security Report 2010/11: Providing Coverage in Times of
Crisis and Beyond. Geneva: ILO.
———. 2011a. “ILO Working Conditions Laws Database.” Gene-
va: ILO. Accessed 15 November 2019. http://www.ilo.org/
dyn/travail.
———. 2011b. “National Labour Law Profile: Jordan.” http://www.
ilo.org/ifpdial/information–resources/national–labour–
law–profiles/WCMS_158905/lang––en/index.htm.
———. 2012. “International Standard Classification of Occupa-
tions 2008 (ISCO–08): Structure, Group Definitions and
Correspondence Tables.” Geneva: ILO.
———. 2012. “R202: Social Protection Floors Recommenda-
tion, 2012 (No. 202).” https://www.ilo.org/dyn/normlex/
en/f?p=NORMLEXPUB:12100:0::NO::P12100_ILO_
CODE:R202.
———. 2014a. “Labour Inspection in Arab States: Progress and
Challenges.” Working Paper. Beirut: ILO Regional Office
for the Arab States. https://www.ilo.org/wcmsp5/groups/
public/–––arabstates/–––ro–beirut/documents/publica-
tion/wcms_325618.pdf; MoL
———. 2014b. Maternity and Paternity at Work: Law and Prac-
tice across the World. Geneva: ILO.
———. 2015. Global Estimates on Migrant Workers: Results and
Methodology. Special Focus on Migrant Domestic Workers.
Geneva: ILO.
———. 2016a. “Maternity Cash Benefits for Workers in the
Informal Economy.” Social Protection for All Issue Brief.
Geneva: ILO. https://www.ilo.org/wcmsp5/groups/pub-
lic/–––asia/–––ro–bangkok/–––ilo–beijing/documents/
publication/wcms_537934.pdf.
———. 2016b. Women at Work: Trends 2016. Geneva: ILO.
https://www.ilo.org/wcmsp5/groups/public/–––dgre-
ports/–––dcomm/–––publ/documents/publication/
wcms_457317.pdf.
———. 2017a. Domestic Workers and Employers in the Arab
States: Promising Practices and Innovative Models for
a Productive Working Relationship. Beirut: ILO Regional
Office for the Arab States.
———. 2017b. Launching the SPF in Egypt: The Egyptian Social
Protection Floor Assessment. Cairo: ILO.
———. 2018. Care Work and Care Jobs for the Future of Decent
Work. Geneva: ILO.
———. N.D. “Convention C103 – Maternity Protection Con-
vention (Revised), 1952 (No. 103).” Accessed 4 May 2020.
https://www.ilo.org/dyn/normlex/en/f?p=NORMLEX-
PUB:12100:0::NO::P12100_INSTRUMENT_ID:312248.
———. N.D. “Convention C183 – Maternity Protection Conven-
tion, 2000 (No. 183).” Accessed 4 May 2020. https://www.
ilo.org/dyn/normlex/en/f?p=1000:12100:0::NO::P12100_
ILO_CODE:C183.
———. N.D. “Egypt – Law No. 18 of 2015 Concerning the Civil
Service.” NATLEX Database of national labour, social secu-
rity and related human rights legislation. Accessed 11 June
2020. https://www.ilo.org/dyn/natlex/natlex4.detail?p_
isn=102504&p_lang=en.
ILO and OECD. 2019. Gender Equality in the G20 – Additional
Analysis from the Time Dimension. ILO. http://www.ilo.org/
global/about–the–ilo/how–the–ilo–works/multilateral–
system/g20/reports/WCMS_713376/lang––en/index.htm.
ILO Regional Office for the Arab States. 2018a. The Occupied
Palestinian Territory: An Employment Diagnostic Study.
Beirut: ILO Regional Office for Arab States. https://www.
un.org/unispal/wp–content/uploads/2018/04/ILOS-
TUDY_040418.pdf.
ILO Regional Office for the Arab States. 2018b. The Palestinian
Decent Work Programme 2018–2022. ILO. https://www.ilo.
org/wcmsp5/groups/public/–––ed_mas/–––program/
documents/genericdocument/wcms_629011.pdf.
Inglehart, R., and others. 2014a. “World Values Survey: Round
Five.” Madrid: JD Systems Institute. Accessed 22 May 2020.
http://www.worldvaluessurvey.org/WVSDocumentation-
WV5.jsp.
Inglehart, R., and others. 2014b. “World Values Survey: Round
Six.” Madrid: JD Systems Institute. Accessed 22 May 2020.
http://www.worldvaluessurvey.org/WVSDocumentation-
WV6.jsp.
INS (National Institute of Statistics). 2020. “Unemployment Rate
in Tunisia.” National Institute of Statistics. http://www.ins.
tn/fr/themes/emploi.
INS and UNICEF. 2018. “Enquête par grappes à indicateurs
multiples (MICS).” Tunisia: Ministère du Développement
de l’Investissement et de la Coopération Internationale

REFERENCES
254
(MDICI). https://mics–surveys–prod.s3.amazonaws.com/
MICS6/Middle%20East%20and%20North%20Africa/Tuni-
sia/2018/Survey%20findings/MICS%20Tunisia%202018–
SFR_French.pdf.
Institute of Law at Birzeit University. 2011. “Cabinet Resolution
No. (11) of 2011: The Regulation of Nurseries [in Arabic]”.
http://muqtafi.birzeit.edu/pg/getleg.asp?id=16311.
Kabeer, Naila. 1994. Reversed Realities: Gender Hierarchies in
Development Thought. London: Verso Publications.
Kabeer, Naila, Ashwini Deshpande and Ragui Assaad. 2019.
Women’s Access to Market Opportunities in South Asia and
the Middle East & North Africa: Barriers, Opportunities and
Policy Challenges. London: London School of Economics
and Political Science, Department of International Devel-
opment. http://eprints.lse.ac.uk/102946/.
Klasen, S. and Pieters, J. 2012. “Push or Pull? Drivers of Female
Labor–force participation During India’s Economic Boom”.
IZA Discussion Papers. No. 6395. Institute for the Study of
Labor (IZA).
Krafft, Caroline. 2020. “Why Is Fertility on the Rise in Egypt?
The Role of Women’s Employment Opportunities.” Journal
of Population Economics. https://doi.org/10.1007/s00148–
020–00770–w.
Krafft, Caroline and Ragui Assaad. 2015. “Promoting Successful
Transitions to Employment for Egyptian Youth.” Cairo: Eco-
nomic Research Forum Policy Perspective. No. 15. Cairo:
Economic Research Forum.
———. 2017. “Employment’s Role in Enabling and Constraining
Marriage in the Middle East and North Africa.” Economic
Research Forum Working Paper. No. 1080. Cairo: Economic
Research Forum. https://erf.org.eg/publications/employ-
ments–role–in–enabling–and–constraining–marriage–in–
the–middle–east–and–north–africa/
———. 2018. “Introducing the Jordan Labor Market Panel Sur-
vey 2016.” Economic Research Forum Working Paper.
Krafft, Caroline, Ragui Assaad and Caitlyn Keo. 2019. “Evo-
lution of Labor Supply in Egypt from 1998–2018: A Gen-
dered Analysis.” Economic Research Forum Working Paper
Series. Cairo: ERF.
Krafft, Caroline, Ragui Assaad and Khandker Wahedur Rah-
man. 2019. “Introducing the Egypt Labor Market Panel
Survey 2018.” Economic Research Forum Working Paper.
Cairo: ERF.
Krafft, Caroline and Safaa El–Kogali. 2014. “Inequalities in Ear-
ly Childhood Development in the Middle East and North
Africa.” Economic Research Forum Working Paper, No. 856.
Cairo: Economic Research Forum.
Krafft, Caroline and Moundir Lassassi. Forthcoming. “Public
Preschool and Maternal Labour Supply in Algeri: Evidence
from a Natural Experiment.” Economic Research Forum
Working Paper. Cairo: ERF.
Kurdi, Sikandra and others. 2018. “Targeting Social Safety Nets
Using Proxy Means Tests: Evidence from Egypt’s Takaful
and Karama Program.” In ReSAKSS Annual Trends and
Outlook Report, pp. 135–53. Washington, D.C: International
Food Policy Research Institute.
Lokshin, M., E. Glinskaya, and M. Garcia. 2000. “The Effect
of Early Childhood Development Programs on Women’s
Labor–force participation and Older Children’s Schooling
in Kenya”. Policy Research Working Paper No. 2376. World
Bank, Washington, DC.
Mansuy, Michèle and Patrick Werquin. 2015. “Labour Market
Entry in Tunisia: The Gender Gap.” Work4Youth Publication
Series. ILO. https://www.ilo.org/wcmsp5/groups/pub-
lic/–––ed_emp/documents/publication/wcms_440855.
Marphatia, Akanksha A., and Rachel Moussié. 2013. “A Ques-
tion of Gender Justice: Exploring the Linkages between
Women’s Unpaid Care Work, Education, and Gender
Equality.” International Journal of Educational Devel-
opment. 33 (6), pp. 585–594. https://doi.org/10.1016/j.
ijedudev.2013.05.005.
Mleahat, Sulieman. 2017. “Ensuring Access to Quality Pre-
schools in Palestine.” Country Liaison Report. Childhood
Education International. https://acei.org/article/ensuring–
access–to–quality–preschools–in–palestine/.
———. 2015. “Statistical Report 2014–2015 [in Arabic].” Jordan.
http://www.moe.gov.jo/ar/node/18929.
———. 2018. Education Strategic Plan: 2018–2022. Jordan.
http://www.unesco.org/new/fileadmin/MULTIMEDIA/
FIELD/Amman/pdf/ESP_English.pdf.
———. 2019. “Statistical Report 2018–2019 [in Arabic].” Jordan.
http://www.moe.gov.jo/sites/default/files/ltqryr_lhsyy_
llm_ldrsy_2018–2019.pdf.
MoE (Ministry of Education, Palestine). 2017. Education Law
2017. Palestine: Council of Ministers. https://www.wattan.
net/data/uploads/bafce6842e81cbbeac9fd6a7f5a5dfdd.
pdf .

CARE ECONOMY AND PROMOTING GENDER EQUALITY
255
MOEHE, MOH and MOSD. 2017. The National Strategy for
Early Childhood Development and Intervention: Palestine.
Palestine: UNICEF.
MoF (Ministry of Finance, Egypt). 2020. “The State General
Budget.” Accessed 16 August 2020. http://www.mof.gov.eg/
English/Papers_and_Studies/Pages/The–State–Budget.
aspx
MoH (Ministry of Health, Jordan). 2008. “Health Law 47 for
the Year 2008 and its Ammendments [in Arabic].” Jor-
dan. https://www.moh.gov.jo/Echobusv3.0/SystemAs-
sets/3be712f0–5ccd–4a7a–879c–2bf50fa6b231.pdf.
———. 2018. Ministry of Health in Numbers 2018 [in Arabic].
Jordan. https://www.moh.gov.jo/Echobusv3.0/SystemAs-
sets/435a78d7–40c2–46fe–937f–8694b5a5a8d1.pdf.
MoH (Ministry of Health, Tunisia). 2015. Comptes Nationaux de
la Sante. Tunisia. http://www.sante.gov.ma/Publications/
Etudes_enquete/Documents/Comptes%20Nationaux%20
de%20la%20Sant%C3%A9%20Rapport%202015.pdf
———. 2016. “La Santé des Tunisiens : Résultats de l’enquête «
Tunisian Health Examination Survey–2016 »”. Tunisia: MoH.
http://www.santetunisie.rns.tn/images/rapport–final–en-
quete2020.pdf.
Ministry of Human Resources and Social Development, King-
dom of Saudi Arabia. N.D. “Elderly Care [رعاية املســنني].” Ac-
cessed 10 June 2020. https://mlsd.gov.sa/ar/services/619.
MoL (Ministry of Labour, Jordan). 2018. Annual Report. Amman,
Jordan. http://www.mol.gov.jo/ebv4.0/root_storage/ar/
eb_list_page/%D8%A7%D9%84%D8%AA%D9%82%D8%B1%D
9%8A%D8%B1_%D8%A7%D9%84%D8%B3%D9%86%D9%88%D
9%8A_2018.pdf
———. 2019. “Labor law No. 8 of 1996 and its amendments.” Jor-
dan. [قانون العمل لســنة1996 وتعديالته]. http://www.mol.gov.jo/ebv4.0/
root_storage/ar/eb_list_page/%D9%82%D8%A7%D9%86%
D9%88%D9%86_%D8%A7%D9%84%D8%B9%D9%85%D9%84
_%D9%86%D8%B3%D8%AE%D8%A9_2019.pdf
MoL (Ministry of Labour, Palestine). 2000. Labour Law No.
(7) of 2000. Palestine. http://legal.pipa.ps/files/server/
ENG%20Labour%20Law%20No_%20(7)%20of%202000.pdf .
MoPIC (Ministry of Planning and International Cooperation)
and UNDP. 2011. Jordan Human Development Report 2011.
Amman: MoPIC & UNDP. http://hdr.undp.org/sites/de-
fault/files/jordan_nhdr_2011.pdf.
MoSD (Ministry of Social Development, Jordan). 2014. “Instructions
for licensing residential care for the elderly for the year 2014.”
.Jordan. http://www.mosd ”[تعليامت ترخيص دور الرعاية اإليوائية للمسنني لسنة 2014]
gov.jo/UI/Arabic/ShowContent.aspx?ContentId=119.
———. 2018a. “Nurseries law number 77 for 2018” “نظــام دور الحضانــات
/Jordan. http://www.mosd.gov.jo/UI/Arabic ”.رقم 77 لســنة 2018
Templete/hadaneh.pdf
———. 2018b. “Nurseries regulations 2018 [in Arabic].” Jordan.
تعليامت ترخيص دور الحضانة وتعديالتها لســنة 2019 صادر مبوجب املادة 95“ .2019 .———.Jordan ”.من نظام دور الحضانة رقم 77 لســنة 2018
MoSD (Ministry of Social Development, Palestine). 2015. Anal-
ysis of the Situation of Rights of Older People in Palestine.
.Palestine. http://www.mosa ”.[ اقع املســنني يف االرايض الفلســطينية 2015]
pna.ps/en/node/569.
———. 2016. National Strategy for the Elderly in Palestine
.http://www . ”,[الخطة االســرتاتيجية لقطاع ]كبار الســن يف فلسطني] 2020–2017
mosa.pna.ps/ar/content/%D8%B1%D8%B9%D8%A7%D9%8A
%D8%A9–%D8%A7%D9%84%D9%85%D8%B3%D9%86%D9%8
A%D9%86.
———. 2017. First Annual Statistical Report 2017 [التقرير االحصايئ الســنوي /Palestine. http://www.mosa.pna.ps .[األول لــوزارة التنمية االجتامعية
en/studies_research_list?title=&field_study_research_
date_value%5Bvalue%5D%5Byear%5D=2018.
Ministry of Social Development, Sultanate of Oman. N.D. “The
Elderly’s Affairs.” Accessed 10 June 2020. https://mosd.gov.
om/index.php/en/social–care–3/the–elderly–s–affairs.
Ministry of Social Solidarity. 2020a. “The Ministry of Social
Solidarity–Official Website.” Egypt. https://www.moss.gov.
eg/ar–eg/Pages/default.aspx.
———. 2020b. Internal Database. Egypt.
Moghadam, Valentine M. 2015. “Women, Work and Family in
the Arab Region: Toward Economic Citizenship.” DIFI Fam-
ily Research and Proceedings, Protecting the Arab Family
from Poverty: Employment, Social Integration and Inter-
generational Solidarity (7).
National Committee for Human Resource Development. 2015.
Education for Prosperity: Delivering Results – A National
Strategy for Human Resource Development 2016–2025.
http://www.mohe.gov.jo/en/Documents/National–HRD–
Strategy.pdf.
NCFA (National Council for Family Affairs). 2017. Situation Anal-
ysis of the Elderly in Jordan. Amman: NCFA.
———. 2018a. National Strategy Senior Citizens 2018–2022:
‘Towards a Society for All Ages.’ Jordan: NCFA. http://ncfa.
org.jo:85/NCFA/sites/default/files/Publications/National–
Strategy–Senior–Citizens–English–final.pdf.

REFERENCES
256
———. 2018b. NCFA Annual Report 2018. Jordan: NCFA. http://
ncfa.org.jo:85/NCFA/sites/default/files/Publications/En-
glish–2019–Report–compressed.pdf.
———. 2018c. Status of the Jordanian Family. Jordan: NCFA.
http://ncfa.org.jo:85/NCFA/en/Publications/14.
National Council for Family Affairs and others. 2008. The
National Jordanian Strategy for Senior Citizens. Jordan.
https://www.mindbank.info/item/4966.
National Organization for Social Insurance and MoSS. 2020.
New Social Insurance and Pension Act (Law No. 148 for
2019). https://www.nosi.gov.eg/ar/Pages/NOSIlibrary/
NOSIlibrary.aspx?ncat=7
Nazier, Hanan and Racha Ramadan. 2018. “What Empowers
Egyptian Women: Resources versus Social Constraints?”
Review of Economics and Political Science.
OAMDI (Open Access Micro Data Initiative). 2019a. “Harmo-
nized Labor Force Surveys (HLFS).” Version 1.0 of Licensed
Data Files; LFS 2009–2017; Central Agency for Public
Mobilization and Statistics (CAPMAS). Egypt: Economic
Research Forum. http://erf.org.eg/data–portal/.
———. 2019b. “Labor Market Panel Surveys (LMPS).” Version
2.0 of Licensed Data Files; TLMPS 2014. Egypt: Economic
Research Forum, 2019. http://erf.org.eg/data–portal/.
OECD. 2016. “Parental Leave: Where Are the Fathers?” OECD
Policy Brief. Paris: OECD.
———. 2017. “Caring for Quality in Health: Lessons Learnt
from 15 Reviews of Health Care Quality.” In OECD Re-
views of Health Care Quality. Paris: OECD Publishing.
https://www.oecd.org/health/caring–for–quality–in–
health–9789264267787–en.htm.
OECD/CAWTAR. 2014. Women in Public Life Gender, Law and
Policy in the Middle East and North Africa: Gender, Law
and Policy in the Middle East and North Africa. OECD
Publishing.
OECD Development Centre. 2018. Youth Well–Being Policy Re-
view of Jordan. Paris: EU–OECD Youth Inclusion Project.
Olivetti, Claudia and Barbara Petrongolo. 2017. “The Economic
Consequences of Family Policies: Lessons from a Century
of Legislation in High–Income Countries.” Journal of Eco-
nomic Perspectives. 31 (1), pp. 205–30.
Osman, Magued. 2019. “Egyptians’ Perception Regarding
Women’s Economic Participation in Egypt.” Cairo.
Oxfam. 2020. Time to Care: Unpaid and Underpaid Care Work
and the Global Inequality Crisis. Oxford: Oxfam Interna-
tional.
PCBS (Palestine Central Bureau of Statistics). 2000. “Time
Use Survey 1999/2000: Key Results [in Arabic].” Ramallah:
PCBS.
———. 2007. “Population, Housing and Establishments Census
2007 [in Arabic].” Palestine, 2007. http://www.pcbs.gov.ps/
Downloads/book1313.pdf.
———. 2012. “On the Eve of World Elderly Day.” PCBS. http://
pcbs.gov.ps/post.aspx?lang=en&ItemID=599#.
———. 2014. “Time Use Survey 2012/2013: Final Results [in Ara-
bic].” Ramallah: PCBS.
———. 2018a. “Labour Force Survey 2018 [in Arabic]” Palestine:
PCBS. http://www.pcbs.gov.ps/Downloads/book2433.pdf.
———. 2018b. Population, Housing and Establishments Census
2017 [in Arabic]. Ramallah: PCBS. http://www.pcbs.gov.ps/
pcbs_2012/Publications.aspx.
———. 2018c. “Poverty Profile in Palestine 2017.” Ramallah:
PCBS. http://www.pcbs.gov.ps/Document/pdf/txte_pov-
erty2017.pdf?date=16_4_2018_2.
———. 2019a. “The International Day of Older Per-
sons 2019.” http://www.pcbs.gov.ps/post.aspx-
?lang=en&ItemID=3563#.
———. 2019b. “Selected Indicators for Education in Palestine
by Level of Education and Region for Scholastic Years
1994/1995 – 2018/2019.” http://www.pcbs.gov.ps/Portals/_
Rainbow/Documents/Education–1994–2018–E.html.
Palestine Economic Policy Research Institute. 2018. Economic
Monitor. Ramallah: Palestine Economic Policy Research
Institute. http://www.mas.ps/files/server/Monitor/moni-
tor%2053%20arabic.pdf.
Prime Minister’s Office of the Hashemite Kingdom of Jordan.
2020. “Defense Order 1 of 2020 [٢٠٢ أمر دفاع رقم ١ لســنة].” Official
Bulletin of the Hashemite Kingdom of Jordan. Amman:
Prime Minister’s Office of the Hashemite Kingdom of
Jordan, 19 March. http://www.pm.gov.jo/upload/files/Or-
der–Defense–1.pdf.
Promundo and UN Women. 2017. Understanding Masculinities:
Results from the International Men and Gender Equality

CARE ECONOMY AND PROMOTING GENDER EQUALITY
257
Survey (IMAGES) – Middle East and North Africa. New
York: UN Women. https://www.unwomen.org/en/digital–
library/publications/2017/5/understanding–masculini-
ties–results–from–the–images–in–the–middle–east–and–
north–africa.
Qi, Liangshu and Xiao–Yuan Dong. 2017. “Gender, Low–Paid
Status, and Time Poverty in Urban China.” Feminist Eco-
nomics. 24 (2), pp. 171–93.
Queen Rania Foundation. 2017. “Early Childhood Care and
Education in Jordan – Fact Sheet.” Jordan: Queen Rania
Foundation. https://www.qrf.org/en/what–we–do/re-
search–and–publications/early–childhood–care–and–ed-
ucation–jordan–fact–sheet.
Razzaz, Susan. 2017. A Challenging Market Becomes Even
More Challenging: Jordanian Workers, Migrant Workers
and Refugees in the Jordanian Labour Market. Beirut: ILO.
Rehel, Erin M. 2014. “When Dad Stays Home Too: Paternity
Leave, Gender, and Parenting.” Gender & Society. 28 (1),
pp. 110–132.
Salehi–Isfahani, Djavad and Sara Taghvatalab. 2019. “Educa-
tion and the Allocation of Time of Married Women in Iran.”
Review of Economics of the Household. 17 (3), pp. 889–921.
Selwaness, Irene and Maye Ehab. 2019. “Social Protection and
Vulnerability in Egypt: A Gendered Analysis.” ERF Working
Paper Series. No. 1363. Cairo: ERF.
Selwaness, Irene and Caroline Krafft. 2018. “The Dynamics of
Family Formation and Women’s Work: What Facilitates and
Hinders Female Employment in the Middle East and North
Africa?” Economic Research Forum Working Paper Series.
Cairo: ERF.
Sieverding, Maia and Rasha Hassan. 2016. ‘Her Future Is Mar-
riage’: Young People’s Attitudes towards Gender Roles and
the Gender Gap in Egypt. Cairo: Population Council, 2016.
———. 2019. “Associations between Economic Vulnerability and
Health and Wellbeing in Egypt.” Economic Research Forum
Working Paper. No. 1364. Cairo: ERF.
Spierings, Niels, Jeroen Smits and Mieke Verloo. 2010. “Micro–
and Macrolevel Determinants of Women’s Employment in
Six Arab Countries.” Journal of Marriage and Family. 72 (5),
pp. 1391–1407.
Sultana, N., Gammage, S., Kes, A. 2019. Policy Report: Making
the Case for Care. International Center for Research on
Women.
The Democracy and Workers’ Rights Center. 2017. “Basic Infor-
mation on The Palestinian Law by Decree No 19 of the Year
2016 Regarding Social Security.” Palestine. https://www.
dwrc.org/en/1/30/344/The–Palestinian–Law–by–Decree–
no–19–of–the–Year–2016–regarding–Social–Security.htm.
The Higher Health Council and WHO. 2015. The National Strat-
egy of Health Sector in Jordan 2015–2019. Jordan. http://
www.nationalplanningcycles.org/sites/default/files/plan-
ning_cycle_repository/jordan/jordan_national_health_
sector_strategy_2015–2019_.pdf.
The Jordan Times. 2017. “PM, Deputies Discuss Mechanism for
Health Insurance for Elderly.” The Jordan Times. 9 January.
Accessed 20 November 2019. http://www.jordantimes.
com/news/local/pm–deputies–discuss–mechanism–
health–insurance–elderly.
United Nations. 2020. “Policy Brief: The Impact of COVID–19 on
Women.” New York: United Nations.
UN Women. 2018a. Promoting Women’s Economic Empow-
erment: Recognizing and Investing in the Care Economy.
New York: UN Women.
———. 2018b. Turning Promises Into Action: Gender Equality in
the 2030 Agenda for Sustainable Development. New York:
UN Women.
———. 2019. Progress of the World’s Women 2019–2020: Fami-
lies in a Changing World. New York: UN Women.
———. 2020. “COVID–19 and the Care Economy: Immediate
Action and Structural Transformation for a Gender–Re-
sponsive Recovery.” New York: UN Women.
UN Women Jordan. 2020a. “COVID–19 and Women’s Economic
Empowerment: Policy Recommendations for Strength-
ening Jordan’s Recovery.” Amman: UN Women Jordan
Country Office. https://www2.unwomen.org/–/media/
field%20office%20jordan/images/publications/2020/may/
covid–19%20and%20womens%20economic%20empower-
ment–%20policy%20recommendations%20for%20strength-
ening%20jordans%20recovery.pdf?la=en&vs=4619
———. 2020b. Fiscal Policy, Taxation and Gender Equality in
Jordan. Amman: UN Women Jordan. https://jordan.un-
women.org/en/digital–library/publications/fiscal–policy–
taxation–and–gender–equality–in–jordan
UN–DESA (United Nations Department of Economic and Social
Affairs), Population Division. 2019. World Population Pros-
pects 2019. Online Edition. Rev. 1. New York: DESA, Popula-
REFERENCES
258
tion Division. https://population.un.org/wpp/
UNESCO (United Nations Educational, Scientific and Cultural
Organization). 2015. Education for All 2000–2015: Achieve-
ments and Challenges. Paris: UNESCO.
UNESCO Institute of Statistics. 2018. “Education Statistics: West
Bank and Gaza.” https://datatopics.worldbank.org/educa-
tion/country/west–bank–and–gaza.
———. 2020. “UNESCO Institute for Statistics.” http://data.uis.
unesco.org/.
UN–ESCWA (United Nations Economic and Social Commis-
sion for Western Asia). 2013. “A Review of Literature on
the Changing Role of the Family Care Provision in Arab
Countries.” Beirut: UN–ESCWA. https://www.unescwa.org/
publications/review–literature–changing–role–family–
care–provision–arab–countries.
———. 2014. Disability in the Arab Region: An Overview. Beirut:
UN–ECSWA.
———. 2018. Population and Development Report Issue No. 8:
Prospects of Ageing with Dignity in the Arab Region. Beirut:
UN–ESCWA.
UNICEF (United Nations Children’s Fund). 2017. UNICEF Annual
Report 2017: Egypt.
UNICEF and the National Council for Family Affairs. 2000. Early
Childhood Development Strategy in Jordan. http://ncfa.
org.jo:85/ncfa/sites/default/files/publications/early–
childhood–development–strategy–jordan.pdf.
United Arab Emirates Government Portal. N.D.
UNSD (United Nations Statistics Division). 2008. “International
Standard Industrial Classification of All Economic Activities
(ISIC) Rev. 4.” New York: United Nations Department of
Economic and Social Affairs.
———. 2017. “International Classification of Activities for Time
Use Statistics 2016 (ICATUS 2016).” New York: UNSD.
———. N.D. “Gender Statistics Manual: Integrating a Gender
Perspective into Statistics.” UNSD. Accessed 1 May 2020.
https://unstats.un.org/unsd/genderstatmanual/.
US Social Security Administration and ISSA (International So-
cial Security Association). 2016. Social Security Programs
Throughout the World: Asia, 2016. Geneva: ISSA.
———. 2018. Social Security Programs Throughout the World:
Asia, 2018. Geneva: ISSA.
———. 2019. Social Security Programs Throughout the World:
Africa, 2019. Geneva: ISSA.
World Bank. 2013. Jobs for Shared Prosperity: Time for Action
in the Middle East and North Africa. Washington: D.C:
World Bank. http://documents.worldbank.org/curated/
en/408041468339620122/pdf/Jobs–for–shared–prosper-
ity–time–for–action–in–the–Middle–East–and–North–Af-
rica.pdf.
———. 2014a. “Tunisie – Surmonter les obstacles a l’inclusion
des jeunes [Tunisia – Breaking the barriers to youth in-
clusion].” Washington, D.C: World Bank. http://documents.
worldbank.org/curated/en/120511468305646014/Tunisie–
Surmonter–les–obstacles–a–linclusion–des–jeunes.
———. 2014b. “World Bank Report: Young People in Tunisia Still
Frustrated by Social and Economic Obstacles.” https://
www.worldbank.org/en/news/press–release/2014/10/02/
world–bank–report–young–people–tunisia–frustrated–so-
cial–economic–obstacles.
———.2015. “Développement de la Petite Enfance– Tunisie
[Early Childhood Development–Tunisia].” Washington, D.C:
World Bank Group. http://documents.worldbank.org/cu-
rated/en/986461492508159495/pdf/114297–WP–PUBLIC–
FRENCH–SABER–ECD–Tunisia.pdf.
———. 2018a. “Project Appraisal Document on A Proposed Loan
for Supporting Egypt Education Reform Project.”
———. 2018b. The Story of Takaful and Karama Cash Transfer
Program.
———. 2018c. Women Economic Empowerment Study. Washing-
ton, D.C.: World Bank Group. https://doi.org/10.1596/31351
———. 2019. “World Development Indicators.” Washington, D.C.:
World Bank Group.
———. 2020a. “Labor Force, Female (% of Total Labor Force) –
Tunisia.” World Bank Data. https://data.worldbank.org/
indicator/SL.TLF.TOTL.FE.ZS?locations=TN.
———. 2020b. State of the Mashreq Women Flagship 1: Wom-
en’s Economic Participation in Iraq, Jordan and Lebanon
(Executive Summary). Washington D.C.: World Bank Group.
———. 2020c. “West Bank and Gaza | Data.” https://data.world-
bank.org/country/PS.
World Economic Forum. 2018. Global Competitiveness
Index. http://reports.weforum.org/global–compet-
itiveness–index–2017–2018/competitiveness–rank-
ings/#series=EOSQ129

CARE ECONOMY AND PROMOTING GENDER EQUALITY
259
———. 2019. Global Gender Gap Report 2020: Insight Report.
https://doi.org/10.1002/9781119085621.wbefs350.
World Policy Center. 2020. “Family.” World Policy Analysis
Center. https://www.worldpolicycenter.org/topics/family/
policies.
Wray, Dana. 2020. “Paternity Leave and Fathers’ Responsibili-
ty: Evidence From a Natural Experiment in Canada.” Jour-
nal of Marriage and Family. 82 (2), pp. 534–49. https://doi.
org/10.1111/jomf.12661.

About the research
This policy brief is based on the report Progress of Women in the Arab States 2020: the role of the care economy in promoting
gender equality, which has been produced under the UN Women-ILO Joint programme “Promoting productive employment and
decent work for women in Egypt, Jordan and Palestine”, with funding from the Swedish International Development Cooperation
Agency (Sida). The report is equally the result of the “Production of a regional companion report to UN Women’s Progress of the
World’s Women report on Families in a changing world: public action for women’s rights,” programme, which was funded by the
Swiss Development Cooperation. This research was conducted by UN Women in partnership with the Economic Research Forum.”