The Role of Small and Mediu towns in Rural-Urban contin ...
183
Univers UFR Le Ecole docto The Role of Small towns in Rural-Ur Karatina in A thesis submitte Public Thèse en v Pré Th Pr. CALAS Bernard, Univer Pr. CHARLERY de la M committee member Dr IRAVO A. Mike, Jomo external committee membe Pr. EDOUARD Jean-Charle Dr MAINET Hélène, Univer sité Blaise-Pascal – Clermont-Ferrand ettres, Langues et Sciences Humaines orale Lettres, Sciences humaines et So CERAMAC l and Medium Enterprises (SM rban continuum: The Case of n Mt. Kenya Region, Central K Ephantus KIHONGE ed for the award of the degree of PhD in G c defence on the 15th of February 2014 vue de l’obtention du Doctorat de Géogra ésentée et soutenue le 15 février 2014 hesis Committee /Membres du jury rsity of Bordeaux 3, external committee m MASSELIERE Bernard, University of To Kenyatta University of Agriculture and er es, University of Clermont 2, thesis co-su rsity of Clermont 2, thesis co-supervisor II s ociales MEs) in small f Sagana and Kenya Geography aphie member oulouse 2, external Technology, Kenya, upervisor
-
Upload
khangminh22 -
Category
Documents
-
view
0 -
download
0
Transcript of The Role of Small and Mediu towns in Rural-Urban contin ...
Université BlaiseUFR Lettres, Langues et Sciences Humaines
Ecole doctorale Lettres, Sciences humaines et Socia les
The Role of Small and Medium Enterprises (SMEs) in small
towns in Rural- Urban continuum: The
Karatina in Mt. Kenya Region, Central Kenya
A thesis submitted for the award of the degree o
Public defenc
Thèse en vue de l’obtention du Doctorat de Géographie
Présentée et soutenue le 15 février 2014
Thesis Committee /Membres du jury
Pr. CALAS Bernard, University of Bordeaux 3,
Pr. CHARLERY de la MASSELIERE Bernard, University of Toulouse 2,
committee member
Dr IRAVO A. Mike, Jomo Kenyatta University of
external committee member
Pr. EDOUARD Jean-Charles, University of Clermont 2,
Dr MAINET Hélène, University of Clermont 2,
Université Blaise -Pascal – Clermont- Ferrand IIUFR Lettres, Langues et Sciences Humaines
Ecole doctorale Lettres, Sciences humaines et Socia les
CERAMAC
The Role of Small and Medium Enterprises (SMEs) in small
Urban continuum: The Case of Sagana and
Karatina in Mt. Kenya Region, Central Kenya
Ephantus KIHONGE
A thesis submitted for the award of the degree of PhD in G
Public defence on the 15th of February 2014
en vue de l’obtention du Doctorat de Géographie
Présentée et soutenue le 15 février 2014
Thesis Committee /Membres du jury
Pr. CALAS Bernard, University of Bordeaux 3, external committee member
Pr. CHARLERY de la MASSELIERE Bernard, University of Toulouse 2,
Mike, Jomo Kenyatta University of Agriculture and Technology
external committee member
Charles, University of Clermont 2, thesis co-supervisor
Dr MAINET Hélène, University of Clermont 2, thesis co-supervisor
Ferrand II UFR Lettres, Langues et Sciences Humaines
Ecole doctorale Lettres, Sciences humaines et Socia les
The Role of Small and Medium Enterprises (SMEs) in small
Case of Sagana and
Karatina in Mt. Kenya Region, Central Kenya
PhD in Geography
en vue de l’obtention du Doctorat de Géographie
external committee member
Pr. CHARLERY de la MASSELIERE Bernard, University of Toulouse 2, external
Agriculture and Technology, Kenya,
supervisor
1
Ephantus KIHONGE
The Role of Small and Medium Enterprises (SMEs) in small
towns in Rural-Urban continuum: The Case of Sagana and
Karatina in Mt. Kenya Region, Central Kenya
Université Blaise-Pascal – Clermont-Ferrand II
UFR Lettres, Langues et Sciences Humaines
Ecole doctorale Lettres, Sciences humaines et Socia les
CERAMAC
February 2014

2
3
Declaration
I Ephantus Kihonge Wanjiru, hereby declare that this thesis is a product of my own four years
research and where it is beholden to others, acknowledgement has been made.
Ephantus Kihonge
November, 2013

4

5
Acknowledgements
This thesis marks an end of a blessed, educative, interactive, adventurous and successful 4 years
learning period. This could not have been possible without the everlasting love and care of His
Almighty God. He didn’t only bless me with good health, personal will and journey masses, but
also importantly, surrounded me with good and supportive friends for the entire time. These God
sent friends contributed to this thesis but none so more, than my supervisors Prof. Jean-Charles
Edouard and Dr. Hélène Mainet. As my supervisors, your enabling guidance, support and
positive critique has taught me a lot in multidisciplinary scientific research. Your dedicated and
committed efforts were instrumental from the genesis of this study in Mbale, Uganda, to field
exposure and build up in Mbeya, Tanzania and in Nyeri, Kenya. You later followed with much
support in shaping and organization of contents in Clermont-Ferrand, France.
To you Jean-Charles and Hélène I say, ASANTE SANA! The best way I can acknowledge you,
is by guiding upcoming students the way you guided me. Apart from academics, Hélène, you
took care of me while in France like a big sister or a mum. Always being there for me whenever
a need arose, thanks and God bless. To Jean-Charles, your wife and children, thank you so much
for welcoming and hosting me on several weekends in Vichy. I will ever miss the adventurous
and happy moments we shared. Not forgetting the fun full “Marché de Noël”.
Many thanks also goes to the France Government through the French Embassy in Kenya,
without your Scholarship my study would have been impossible. Apart from paying for my
tuition, accommodations and keep up and for many flights to and from Europe, you also made
sure I socialized with old and continuing students in France through the many parties and
celebrations in Nairobi. To you I say MERCI BEAUCOUP!
In connection to this, I am indebted to Prof. Bernard Calas, former director IFRA- Kenya for
recommending me to Jean-Charles and Helen and also for introducing me to the French
embassy. I am also equally thankful to CREATING and CORUS organizing committees among
them Prof. Bernard Charlery de la Masselière and Prof. François Bart for facilitating the initial
contact with my supervisors and B. Calas through the wonderful programs which transformed
my life. Many thanks also go to Dr. Mbataru for your encouragement and mentorship in French
academic and social circles.
A gentleman by the name, Dr. Mike Iravo, always made sure I afforded my house rent while in
Kenya by allocating me part time jobs in JKUAT, which were later to become a permanent job.

6
To you Mike I say buya muno! And my God bless you and your generations abundantly. To Dr.
Kabare Karanja, I cannot forget your inputs to my winning concept which was among the
twenty five (25) successful applicants in East Africa and Central Europe to qualify for
CREATING program in 2009. And to Professor Elegwa Mukulu, your research guidance under
the CREATING research program cannot go unnoticed. To you all I say thanks a lot.
I appreciate all my colleagues and friends at CERAMAC for much support during my study.
Special thanks go to Dr. Eric Langlois, Dr. Jean-Baptiste and Matthieu for your input in map
work. To you Frederique thanks a lot for your endless effort in the final organization of this
thesis. My family has been a Good Samaritan to me over the years. The list is hardly exhaustive,
but special note of thanks goes to my mother (Nancy Wanjiru), my late cucu (Hannah Kihonge)
and my aunt (Agness Muhia) for your prayers and moral support. As a general note, I would like
to thank everyone who, one way or another contributed to the completion of this thesis.
Ephantus Kihonge
November, 2013
7
Abstract
Urban growth has ever been emphasized at the expense of equally important rural regions in
many developing countries. This has resulted to over exploitation of the rural and an erosion of
the much needed energetic and skilled labour force in the productive rural areas, as many youth
migrate to the already overburdened cities in such for quality life. This has not only seen an
escalation of urban poor due to hyper-urbanization, but also unbalanced and unsustainable
economic growth. Rural-urban continuum is a new perspective for propagating sustainable
economic development. The perspective calls for an integrated approach in analyzing the
development of both rural and urban areas as opposed to taking the two as distinct. On the hand,
devolvement of power and funds to local administrative units is known to enhance the rural-
urban linkages.
Small and Micro-Enterprises (SMEs), are known to form significant nodes in rural-urban
linkages. SMEs have transformed agricultural-led economies to industrial giants and their
activities are always enhanced by a devolved political structure. This has been made possible by
improving SME activities at the local administrative towns. Consequently, these SMEs serve as
strong nodes which link the surrounding rural areas to Local, National and Regional Markets
through forward and backward linkages. By strengthening and opening up opportunities for
SMEs in these towns ‘virtuous’ circles of rural-urban economic linkages are created and ignited.
These are important linkages in any industrialization process.
The study of the rural-urban linkages activities is still in development. This thesis therefore seeks
to add to the literature by generating and documenting information on the role of SMEs in small
towns in rural-urban linkages. With the dawn of a new constitution in Kenya, which calls for
among other things a more devolved government structure, this is a timely body of knowledge to
add. Kenya is an agricultural-led economy, hence the need to focus on small mountainous towns.
The towns are surrounded by rich agricultural areas and are highly populated, making them busy
hubs of mobility and exchange. Therefore, Mt Kenya region is the chosen area of study with
SMEs in Sagana and Karatina towns chosen as centres representing small towns.
This study seeks to add to the body of knowledge by addressing the following four research
questions: Due to their rural-urban linkage function, do SMEs in small town exhibits different
characteristics to those of small enterprises elsewhere in the country lacking the linkage
8
function? What is the role played by SME in small towns in forward linkages, rural and regional
development? What is the role of ‘rural functions’ in growth of SMEs in small towns? What the
role of SME in small towns in backward linkages, rural and regional development?
Guided by previous experience in CREATING and CORUS programs, available resources
(financial, human and time) and going by the fact that a number of small businesses remain
unregistered in Kenya, we decided on a workable sample of 200 SMEs. This comprised of 130
SMEs from Karatina and 70 from Sagana. The study employed questionnaires, and data were
analyzed using descriptive statistics.In depth insights into traders’ perceptions and flow of
resources was studied using case studies among the entrepreneurs in different SME sectors.
Informant interviews were used to collect more data.
From the results, SMEs in small towns which are assumed to have a linking function did not
show significance discrepancies from average characteristics surveyed at National level and also
from comparison made from specific regions in Kenya. The few noted differences are more
likely to be associated with the geo-social factors and the economical and political dynamics in
the country. The lack of the special linking characteristics could be attributed to the findings in
objective two.
Based on the study results, SMEs were found to play a relatively small role in forward linkages.
Only 12% of goods and services coming to the small towns from the rural areas were forwarded
by the SMEs, and only 25% of these goods found their way to other markets. The study
established that some factors such as to the marketing chain created by the Famers Sacco’s, the
use of Information and Communication Technologies, and contracting farming could be
contributing to the poor show of SMEs in forward linkages. Other factors included; the poor road
network to the rural areas and the history of agglomerated subsided space (market stalls and
incubation stands). However, some factors such as the market and the highway were found to be
important nodes through which SMEs linked the rural and national markets.
The rural functions in urban SMEs were found to be real and instrumental in entrepreneurship
development. They were not only vital in business survival in low seasons but were also found
have positive correlations with large capital base, high monthly turnover, increased access to
loan facilities, and large size of the enterprise. Though this concurred with earlier theories that
the rural agricultural activities could trigger the viscous circles of rural-urban linkages, the
9
current study established that such circles emerged strongly when there is direct link in
ownership structure of the urban and rural activities.
Previous studies have shown that the rural-urban trade to be more than urban-rural trade.
However, the current study shows the latter is almost three times more. The results could be said
to differ in case where the point of focus is the small trader in the small town as opposed to a
general urban-rural trade approach. Also the of nature the farmers markets could determine the
flow pattern between urban and rural supplies. Karatina and Sagana markets behaved more of
international markets, where most of the traded goods and supplies were not from the local
catchments. This meant rural populace depended on the towns not only for manufactured goods
and professional services but also for agricultural produce. A factor emphasized by the fact most
of the agricultural activities in the rural hinterlands were small scale cash crop farming.
10
Thesis set-up
The thesis comprises of two main parts (1&2), subdivided into several chapters. Part one
comprises the first four chapters. Chapter 1A presents and discusses the background to the thesis
and presents the research problem and objectives and also the study set-up. Chapter 1B gives an
over view of the Kenyan context in relation to political and economic developments. The chapter
also discusses the SME sector and the status of the independence and link between urban and
rural development in Kenya. Chapter 1C presents the dissertation literature review, taking us
through the historical development and functions of rural-urban linkages. Also discussed is the
entry of SMEs activities into cyclic cycles of rural-urban linkages. Chapter 1D discusses into
details the methodology of the employed in the study.
Part two consists of four empirical chapters as guided by the four research objectives, with each
chapter written in a standardized journal article format. Chapter 2A discusses the diverse and
dynamic SMEs in a small town set-up as per research findings of Karatina and Sagana towns.
Chapter 2B details the diminishing role of the SMEs in small towns in forward linkages and
economic development. Chapter 2C discusses the rural functions in urban areas, detailing the
importance of second income in rural areas in growth and development of SMEs in urban areas.
Lastly, Chapter 2D details the significant role played by the SMEs in small towns in backward
linkages and economic development, as show cased by the SMEs in Karatina and Sagana. The
general conclusions are also contained in this section.

11
PART ONE
12
CHAPTER 1A
INTRODUCTION
Background
Rural-urban linkages have become a manifest of the process of urbanization presenting to us a
new dimension of looking at poverty and analyzing development. It is now widely recognized
that there exists an economic, social and environmental interdependence between urban and rural
areas and a need for balanced and mutually supportive approach to the development of the two
areas. The discrete consideration of rural development as completely different of the two areas is
no longer valid. Anew Perspective, referred to as rural-urban linkages development approach, is
increasing becoming the acceptable approach. Rural-urban linkage generally refers to the
growing flow of public and private capital, people (migration and commuting) and goods (trade)
between urban and rural areas. It is important to add to these the flow of ideas, the flow of
information and flow of diffusion of innovation (Okpala, 2003).
As Cecilia Tacoli, of Institute of International Development, points out, rural-urban linkages
include flows of agricultural and other commodities from rural based producers to urban
markets, both for local consumers and for forwarding to regional, national and international
markets; and in the opposite direction, flows of manufactured and imported goods from urban to
rural settlements. They also refer to the flows of people moving between rural and urban
settlements, either commuting on a regular basis for occasional visits to urban-based services and
administrative centers, or migrating temporarily or permanently. In addition, they also include
the flows of information between rural and urban areas, which includes information on market
mechanisms- from price fluctuations to consumer preferences-and information on employment
opportunities for potential migrants. Financial flows are due, primarily, to remittances from
migrants to relatives and communities in sending areas, and transfers such as pensions to
migrants returning to their rural homes, and also investments and credit from urban based
institutions (Tacoli, 1998).
In general, Linkages can be understood as spatial and sectoral. Spatial resource flow includes
movement of people (rural to urban, urban to rural, rural to rural), goods (producer-market),
13
waste and finance. Sectoral linkages refer to the relationship between similar activities located in
both rural and urban areas (Rondinelli, 1985).
Small towns have a considerable potential role in rural-urban linkages. The towns act as markets
for farm produce from the surrounding rural region, either for local consumption or forwarding
to the national and/or regional markets. They also act as ‘nodes’ for the production and
distribution of goods and services to their neighboring rural region.
In Eastern Africa, the small towns, especially those located in highly populated mountainous
areas play a big role in rural-urban linkages. The towns, which are surrounded by rich
agricultural areas, are highly populated, making them busy hubs of mobility and exchange. They
act as ‘nodes’, where services and connections to the wider world are provided. This plays a
specific role as hubs of mostly non-farm activities where resources are exchanged and social
changes take place (Creating7.net).
Therefore, the non-farm activities in these towns forms a way of entering the ‘virtuous’ circles of
rural-urban linkages, which involves forward and backward linkages. These activities are
provided by both large industries and the Small and Micro Enterprises sector (SMEs), with the
latter dominating both in big urban centres and in a small town set-up in most developing
nations. In Kenya, according to 1999 National SME Survey, there were a total 13Millions SMEs
accounting for 76% of all the enterprises with a contribution of 25% to the Gross Domestic
Product. More than two-thirds (66%) of these small enterprises were found in non-urban strata
(small towns and rural areas). The employment within SME sector increased from 4.2 million
persons in 2000 to 5.1 million persons in 2002, accounting for 74.2% of the total persons
engaged in employment (GoK, 2003 Economic Survey).
Despite this general importance, there is little information available on the specific role played
by SMEs in rural-urban linkages. Many earlier researchers either focused their attentions on the
big urban centers or investigated SMEs from a general National perspective. This study
therefore, seeks to add to the body of knowledge on the role played by SMEs in rural-urban
linkages. This role is investigated using the case of Sagana and Karatina in Mt Kenya region in
Central Kenya.
SMEs are seen as inefficient and vulnerable to being out-competed by larger industries that will
access both urban and rural markets as trade liberalization and globalization proceeds. However,
since there are certain productive activities that are not profitable for large-scale industries,
14
empowering and organizing the SMEs to increase their bargaining power vis-à-vis forming
economically stronger groups, will see them take advantage of this niche markets.
As noted by John-Mary Kauzya (2009), a sustained economic development is an ingredient of
having a more decentralized political structure in terms of power, funds devolvement and
people’s participation AND sustained rural-urban linkages. This is further emphasized by Tacoli,
who notes that, Local governments and other local actors are best placed to identify local needs
and priorities and provide an adequate response to them. Local decision-making can help avoid
the neglect of forward and backward linkages between agriculture (rural) and services and
manufacturing (urban).
Understanding the role of the SMEs in rural–urban continuum will be a step in forward towards
filling the ‘missing middle’ lead to a better understanding of the operations and dynamics
involving small entrepreneurs in small towns and the impact of their spatial orientation and
economic environment on their activities. Such information will be of significant importance in
forming a framework for policy interventions in growth and development of economic activities
at the local town level, which is an important aspect in sustained National development.
Main Objective of the study
The main objective of the study is to generate information and document the contribution of
SMEs in small towns in rural-urban linkages, rural and regional development.
Specific objectives
1. To investigate the general and specific characteristics of SMEs sub-sectors in a small
town
2. To determine the role of SME in small towns in forward linkages, ruraland regional
development
3. To investigate the role of rural functions in growth of SMEs in small towns
4. To determine the role of SME in small towns in backward linkages, ruraland regional
development
Theoretical Concept
The study on rural–urban linkages has explicitly depended on a virtuous circle of growth model
(Mellor, 1976; Friedmann and Douglass, 1978; Evans, 1992 and Douglass, 1998). The virtuous
15
circle model takes note of inter-sectoral (farm–nonfarm) and inter-settlement (spatial)
dependencies. There are two (2) theories have been proposed on how to enter and propagate the
virtuous circles of rural-urban linkages.
The first one is through the agricultural activities in the rural areas. The proponents of this theory
(Friedmann and Douglass, 1978) maintain that agricultural development is the key to overall
development. According to the theory rising agricultural incomes spur demand for food and
other consumer goods, which leads to the creation of non-farm jobs and the diversification of
urban activities, especially in small towns close to areas of agricultural production. This in turn
absorbs surplus rural labour, raises demand for rural produce, and once again boosts agricultural
productivity and incomes.
Evans (1992) and Mellor (1976), the proponents of the second theory, point out that agricultural
growth cannot result in rural–urban development. This is because of the poor’s access to
farmland and the fluctuations of output prices.
Proponents of this theory hold on evidences which suggest that agricultural areas have, and even
specialize in small non-farm activities which are commonly in nearby small towns. From the
theory, though large industries in big urban centres are better positioned to take over rural
markets, there are certain productive activities that are not profitable for large-scale industries.
Hence small entrepreneurs in the small towns and neighbouring the rural agricultural areas can
take advantage of these niche markets. The theory establishes main questions relating to the
small enterprises in these small towns are: 1) How to link them to larger, growth-oriented
enterprises in semi-urban/urban areas? 2) How to assist in these enterprise developments in the
context of macro-policy changes, including trade liberalization?
The theory concludes in overall, the small enterprises in the small centres neighbouring the rural
areas can provide an option as an entry point to the cyclic circles of rural-urban linkages.
However, it continues to state that the specific entry points will be dictated by local conditions,
but whatever entry points are identified for a particular region, a few conditions need to be met in
order for the region to have a set of efficient economic linkages. One of the main conditions is to
analyse their spatial dimension. This is so because different villages and towns develop mini-
specializations such as pottery, dairy products etc. Such activities have the potential for
production and marketing linkages, the spatial span of which can cover multiple villages and
towns.
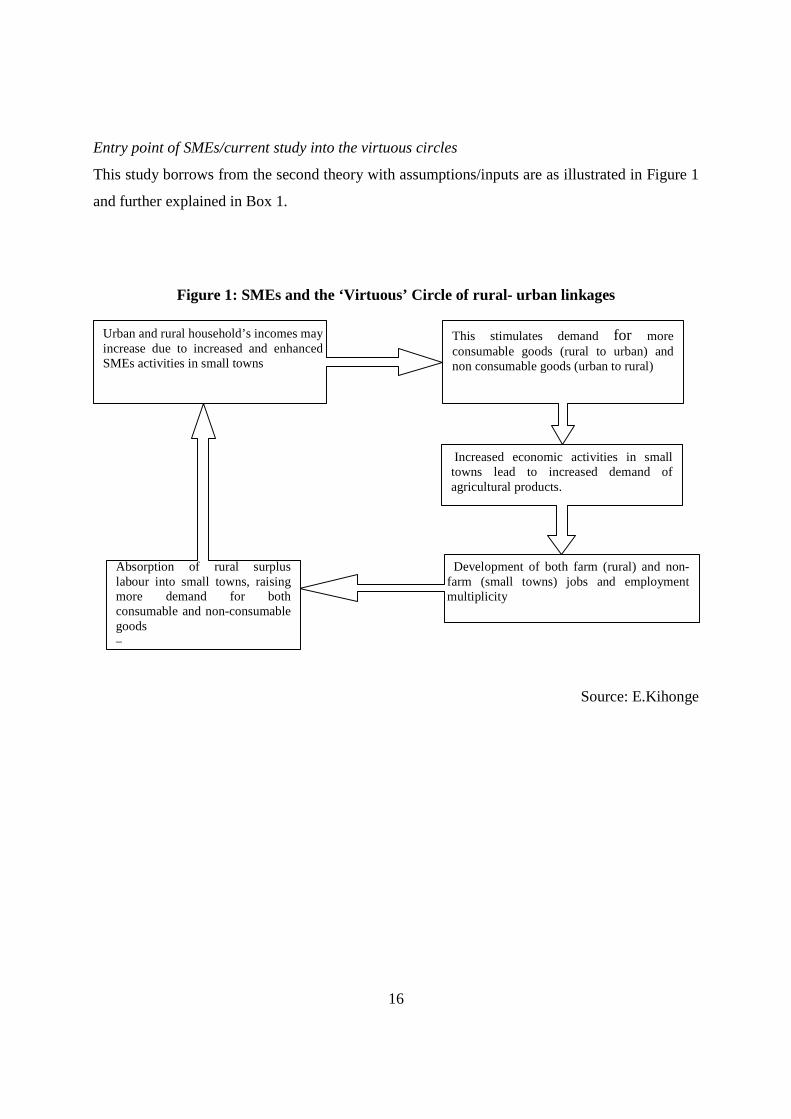
16
Entry point of SMEs/current study into the virtuous circles
This study borrows from the second theory with assumptions/inputs are as illustrated in Figure 1
and further explained in Box 1.
Figure 1: SMEs and the ‘Virtuous’ Circle of rural- urban linkages
Source: E.Kihonge
Development of both farm (rural) and non-farm (small towns) jobs and employment multiplicity
Urban and rural household’s incomes may increase due to increased and enhanced SMEs activities in small towns
This stimulates demand for more consumable goods (rural to urban) and non consumable goods (urban to rural)
Increased economic activities in small towns lead to increased demand of agricultural products.
Absorption of rural surplus labour into small towns, raising more demand for both consumable and non-consumable goods –
17
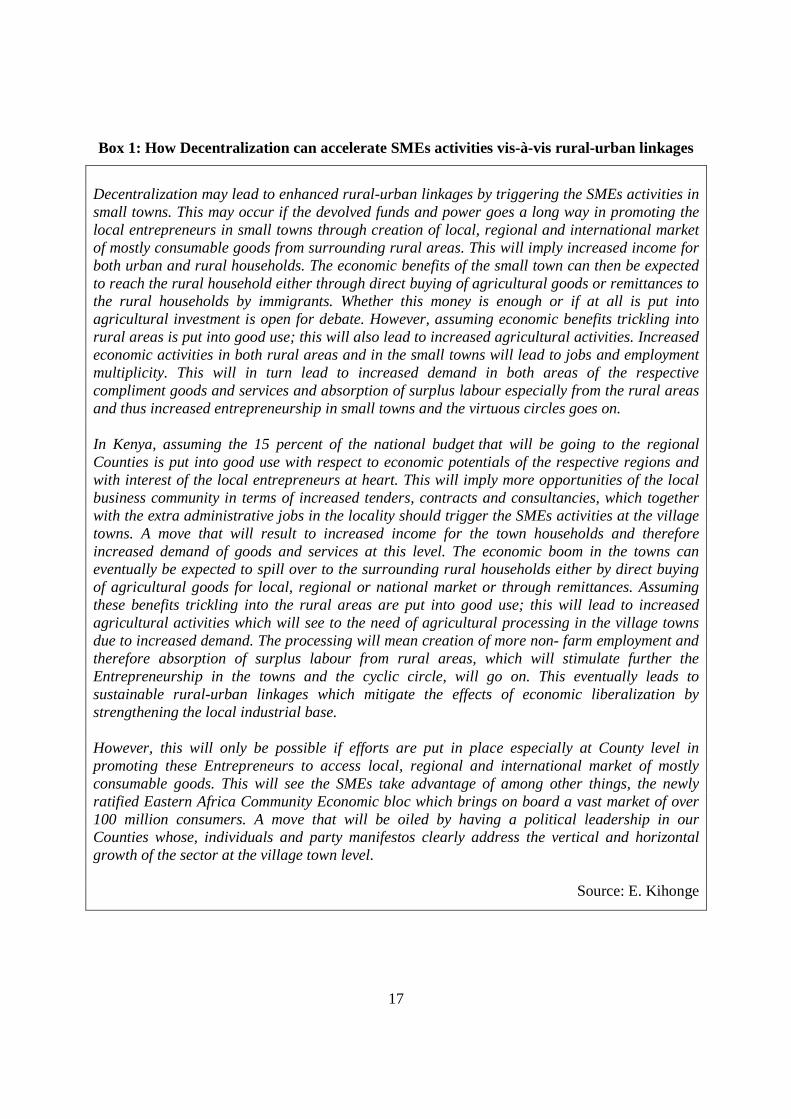
Box 1: How Decentralization can accelerate SMEs activities vis-à-vis rural-urban linkages
Decentralization may lead to enhanced rural-urban linkages by triggering the SMEs activities in small towns. This may occur if the devolved funds and power goes a long way in promoting the local entrepreneurs in small towns through creation of local, regional and international market of mostly consumable goods from surrounding rural areas. This will imply increased income for both urban and rural households. The economic benefits of the small town can then be expected to reach the rural household either through direct buying of agricultural goods or remittances to the rural households by immigrants. Whether this money is enough or if at all is put into agricultural investment is open for debate. However, assuming economic benefits trickling into rural areas is put into good use; this will also lead to increased agricultural activities. Increased economic activities in both rural areas and in the small towns will lead to jobs and employment multiplicity. This will in turn lead to increased demand in both areas of the respective compliment goods and services and absorption of surplus labour especially from the rural areas and thus increased entrepreneurship in small towns and the virtuous circles goes on. In Kenya, assuming the 15 percent of the national budget that will be going to the regional Counties is put into good use with respect to economic potentials of the respective regions and with interest of the local entrepreneurs at heart. This will imply more opportunities of the local business community in terms of increased tenders, contracts and consultancies, which together with the extra administrative jobs in the locality should trigger the SMEs activities at the village towns. A move that will result to increased income for the town households and therefore increased demand of goods and services at this level. The economic boom in the towns can eventually be expected to spill over to the surrounding rural households either by direct buying of agricultural goods for local, regional or national market or through remittances. Assuming these benefits trickling into the rural areas are put into good use; this will lead to increased agricultural activities which will see to the need of agricultural processing in the village towns due to increased demand. The processing will mean creation of more non- farm employment and therefore absorption of surplus labour from rural areas, which will stimulate further the Entrepreneurship in the towns and the cyclic circle, will go on. This eventually leads to sustainable rural-urban linkages which mitigate the effects of economic liberalization by strengthening the local industrial base. However, this will only be possible if efforts are put in place especially at County level in promoting these Entrepreneurs to access local, regional and international market of mostly consumable goods. This will see the SMEs take advantage of among other things, the newly ratified Eastern Africa Community Economic bloc which brings on board a vast market of over 100 million consumers. A move that will be oiled by having a political leadership in our Counties whose, individuals and party manifestos clearly address the vertical and horizontal growth of the sector at the village town level.
Source: E. Kihonge
18
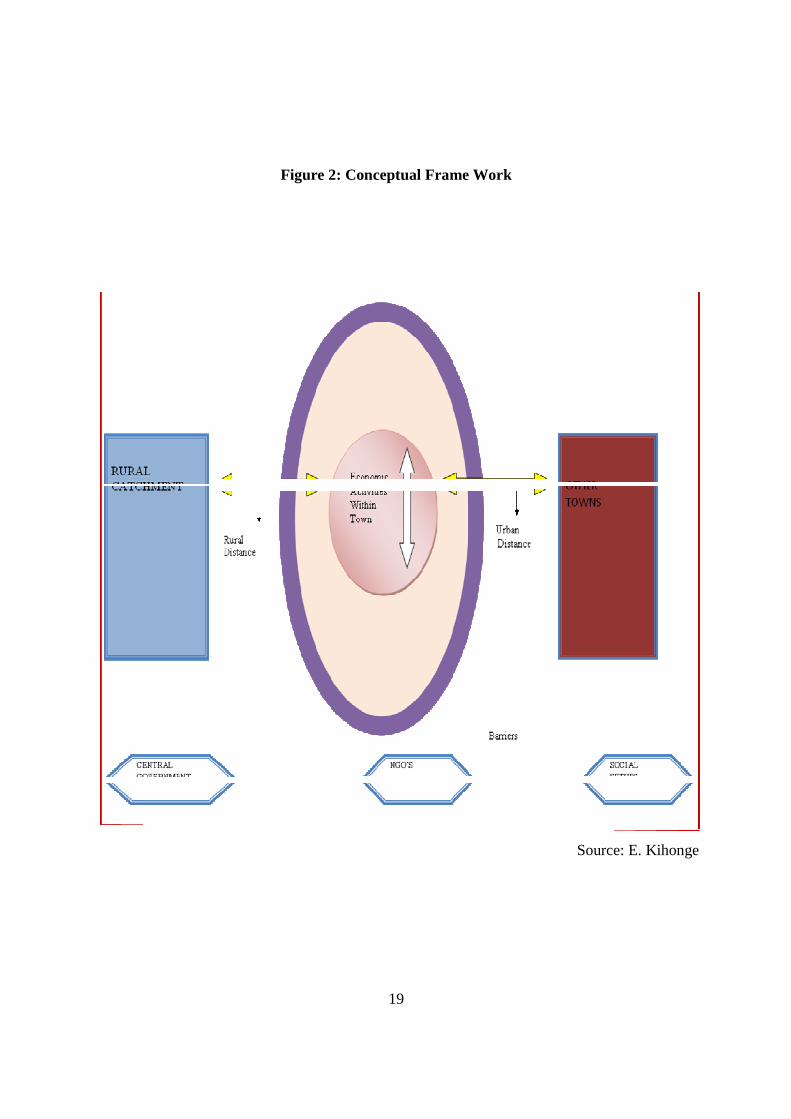
Conceptual framework
This section presents the conceptual framework (Figure 2) that seeks to capture the main
components of the theory of SMEs and rural-urban linkages. The conceptual model cannot claim
to be exhaustive. Inevitably, any framework is an oversimplification of a complex reality and
should be treated merely as a guide or a lens through which to view the world (Owuor, citing
Rakodi, 2006). The study is concerned with the role of SMEs in small towns in rural-urban
linkages with a focus cum comparison of Karatina and Sagana. To unravel the concept, the study
analyses the following: 1) Inter town trade- represented by double ended arrow inside the center
section. The SMEs in the towns are expected to trade among them and also provide goods and
services to the town dwellers. 2) Town-rural trade and town to regional and national markets; the
towns are not expected to be self sufficient in terms of customers and supply, they must
therefore rely on their surrounding rural areas and other towns.
The double ended arrows to the left of the centre section, represents the rural interactions with
the small town, in terms of: how large and far is the rural catchment, which are the commodities
in the either side of trade, main transport means and comparison of volume of trade to and from
rural sources. The right arrows compare the same things with respect to regional and National
markets i.e. which are these towns that the town in question rely on, how far are they, which
commodities are traded, transport interconnectivity and a comparison of total volume of trade
with these towns. 3) In running their daily activities the small business owners encounters a
number of challenges (barriers) and interacts differently with other stakeholders. The barriers are
reflected by the big oval which cuts across all the types of trades (inter town, rural and trade with
other towns) and both towns. 4).
Stake holders which may influence the business/owner in one way or the other includes: Central
and local governments, Non-governmental organizations, Public sector and family social settings
.All these stakeholders are placed at the far bottom of the main frame. 5) Trade activities which
over loops the small town and connect the big urban centers and the rural towns directly. 6)
Lastly, how a trader goes along the business activities (either in rural trade, town to town trade or
inter town trade),the barriers faced, or the kind of interaction with the identified stakeholders,
may be influenced by some overall factors. The overall factors identified in this study are;
demographic character such as gender, age, marital status and education level. Categories of
SMEs: Manufacturing, Service or Trade. The factors are placed at the far top of the main frame.
19
Figure 2: Conceptual Frame Work
Source: E. Kihonge
20
The study set-up
The research problem originated from the researcher’s earlier involvement with a collaborative
project “Co-operative research on East African territorial integration within globalization”
(CREATING). This project aimed at creating, developing and strengthening a social sciences
and humanities research network bringing together scholars and institutions from the European
research area with colleagues and partner institutions from a number of eastern African
countries. The project addressed four major themes: 1) Resource management and livelihood
sustainability; 2) Human dimensions of environmental (including climatic) change; 3) Mobility
and identities;4) Urban-rural linkages and development. The last theme, which involved human
dynamics in mountainous regions in E .Africa, formed basis of the current study. While the
studies under this theme mainly focused on town services offered to the farmers by various
public, private, government and non government organizations. This study deals with specific
group in urban areas under the ‘private’ organization i.e. the SMEs and does not restricts itself
to the farmers but takes into account all the groups and individuals in both rural and urban areas.
The researcher also gained to a large extends from CORUS (Coopération pour la recherche
universitaire et scientifique) program. With field exposure in Mt. Rungwe in Tanzania, Mt.
Elgon in Uganda and Mt. Kenya region, this is the current study area. It follows therefore that the
scope of the study and choice of the study area are within the CREATING and CORUS aims and
objectives.
Methodology
The study not only focuses on the SME as the unit of analysis, but also addressed the complexity
of rural-urban linkages and economic development using an analytical framework, which
combined spatial and sectoral dimensions of rural-urban linkages. A combination of quantitative
and qualitative research methodologies was used to gather both primary and secondary data.
Qualitative data were collected on variables like actor’s characteristics, key SME sectors and
flow of people and resources. This was done using a structured questionnaire.
In depth insights into traders perceptions and flow of resources was studied using case studies
among the entrepreneurs in different SME sectors. Documentation and informant interviews
were used to collect more data. Triangulation methods like combing observation with interviews
were used to improve accuracy of the data collected.

21
CHAPTER 1 B
OVERVIEW OF THE KENYAN CONTEXT
AND PRESENTATION OF THE STUDY AREA
The purpose of this chapter is to present an overview of the Kenyan context. Highlighted are the
political, social and economic developments since independence which have shaped the current
National Development. Also discussed are the economic reforms that were initiated by both
International community (World Bank and IMF) and the government of Kenya with the aim of
increasing the rate of economic growth in the country. Also discussed is the SME sector in
Kenya with a focus on the growth and constrains of the sector in the Kenyan economy and its
underlying issues. These includes: the pivotal role of the sector in the Kenyan economy with a
comparison of other countries, the challenges facing the sector and current Government
interventions. Lastly, the chapter points out the status of the interdependence and the link
between urban and rural development in Kenya.
The political environment
Kenya has an area of: 580,367 sq. km. (224,080 sq mi.) and is located in the Eastern part of
Africa. According to the Kenya National population and Housing Census, 2009, the country had
a population of 39 million people. Kenya was colonized by the British from early 20th century
until 1963 when it gained independence. The country was a de facto one-party state from 1969
under the founding president, Mzee Jomo Kenyatta. The system was reinforced by his successor,
Toroitich Arap Moi, until 1991 when Multi party democracy was introduced. In 2002, Mwai
Kibaki became the third president of Kenya and went ahead to contest for a second term in office
in 2007 general elections. The elections were marred with violence which resulted in over 1,300
deaths and at least 600,000 Kenyans being internally displaced from their homes. International
mediation saw the two warring camps agree to power sharing resulting in the formation of a
Grand Coalition government1. However, an inquiry to the violence was set up in 2008 and after
1President Kibaki agreed to share power with the main opponent, Raila Odinga on 50:50 basis, with Raila being the prime minister.
22
six (6) months of investigations, names of suspects who were believed to have the taken the
greatest responsibilities in the violence were taken to International Criminal Court (ICC) at The
Hague, Netherlands. This was after the Kenyan Parliament voted down a bill which was to see
the suspects tried locally. In 2011 the ICC confirmed charges of four (4) out six (6) suspects.
Among the four were Uhuru Kenyatta, the son of the first Kenyan President and William Ruto (a
die heart supporter of Raila in the 2007 elections which were marred by violence). In the General
elections of 2013, only months before the start of their cases at The Hague, the duo united under
the Jubilee Coalition2, and defeated the CORD coalition lead by the former Prime Minister Raila
Odinga, thereby making history of forming the first government in Kenya under the new
constitution and being the first democratically elected leaders facing charges at the International
Criminal Court. At the time of writing this thesis, everyone was curious all over the world how
the International Community and the ICC will handle the convicted two whose hearings were
meant to start in week’s time.
The economic environment
Kenya is the largest economy in the larger Eastern Africa (which entails; Uganda, Rwanda,
Burundi and Tanzania) and acts as a major trade, financial and transportation hub in the region.
In the first 10 years of independence (1963 to 1973), Kenya registered rapid economic growth
with Gross domestic product (GDP) growing at an annual average of 6.6% (Government of
Kenya, 1999).This was largely attributed to the increase in public investment, encouragement of
smallholder agricultural production, and incentives for Foreign Direct Investment. Agricultural
production grew by 4.7% annually during the same period, stimulated by redistributing estates,
diffusing new crop strains, and opening new areas to cultivation (Government of Kenya, 1999).
A darling of the west at Independence and at par with the so called tiger economies like Hong
Kong and the rest, Kenya under Mzee Jomo Kenyatta was particularly in good books for
choosing the mixed economy model as opposed to Tanzania’s Vijiji vya Ujamaa3 under Julius
Kambarage Nyerere (John Nyaosi, 2008)
2Jubilee Coalition-this is a political movement formed by Uhuru Kenyatta and William Ruto who were facing charges at the ICC, with Kenyatta being the presidential candidate and Ruto the Deputy President. The coalition was mainly supported by the two warring communities in the 2007 violence (Kikuyu and Kalenjin) and was viewed by many as an escape option to the ICC indictment of Uhuru and Ruto who had gained massive sympathetic support from their populous communities. 3 Vijiji vya Ujamaa-socialist communes in Tanzania introduced by Julius Nyerere
23
Subsequent to the reasonably high growth rates during the 1960s and 1970s, the country’s
economy began to decline drastically in mid-1980s with economic growth registering -0.3% in
2000 (Thaker and Cowan, 2001). The poor economic performance was largely due to
inappropriate agricultural, land, and industrial policies compounded by poor international terms
of trade and governance weaknesses. Increased government intrusion into the private sector and
import substitution policies made the manufacturing sector uncompetitive. The policy
environment, along with tight import controls and foreign exchange controls, made the domestic
environment for investment unattractive for both foreign and domestic investors. The Kenyan
Government's failure to meet commitments related to governance led to a stop-start relationship
With the International Monetary Fund (IMF) and World Bank, both of which suspended support
in 1997 and again in 2001 (www.state.gov).
During President Kibaki's first term in office, the economy recovered from a low growth of 0.5
per cent in 2003 to 7 per cent in 2007. As a result of the strong growth performance, real per-
capita income increased at an annual average rate of 3 per cent while poverty declined from 56.8
per cent in 2000 to 46 per cent in 2006 (GOK,2008). This was after the Government began an
ambitious economic reform program known as Economic Recovery Strategy for Wealth and
Employment Creation, 2003.The government also managed to resume cooperation with the
World Bank and the IMF. However, the economic effects of the violence that broke out after the
December 27, 2007 general election, compounded by drought and the global financial crisis,
brought growth down to less than 2% in 2008. In 2009 there was modest improvement with 2.6%
growth, with somehow a great recovery in 2010 when economy grew by 4.5%.
In 2008, the country adopted Vision 2030, a new development blue print covering the year 2008-
2030. The reform aims to transform the country into a newly industrializing “middle income”
country providing a high quality life to all its citizens by year 2030. The adoption of blue print
came after a successful implementation of the ERS in 2003 which saw the country’s economy
back to its path. Accelerating growth to achieve Kenya's potential and reduce the poverty that
afflicts about 46% of its population will require continued deregulation of business, improved
delivery of government services, addressing structural reforms, massive investment in new
infrastructure (especially roads), reduction of chronic insecurity caused by crime, and improved
economic governance generally (www.state.gov). The government's Vision 2030 plan calls for
24
these reforms, but realization of the goals calls for more concerted efforts from all stake holders
and more so increased accountability and transparency in the government.
In 2010, Kenya promulgated a new constitution which called for among other things
devolvement of funds and power to the grass roots. According to the constitution, 15 percent of
the national budget will be devolved to the 47 identified regional Counties. This is a considerable
amount of moneys considering the national budget allocations have been increasing considerably
since 2003, with a historic Ksh 1 trillion mark in 2011. This is a giant step forward which should
go hand in hand with emphasis on rural-urban linkages to achieve a sustained national
development. With the new constitution dispensation in Kenya, this is a timely body of
knowledge to add.
Structural Adjustment Programs (SAPs)
Since the increase in oil prices in 1973 the living conditions of the Kenyan people as those of
most African countries have been on the decline. This was made worse by Global economic
crisis of 1970s, presenting more economic challenges and hardship to Kenyans. In order to cope
with these challenges, government adopted the Structural Adjustment Programs (SAPs) inspired
by the World Bank and the International Monetary Fund (IMF).The adoption of SAPs was to
restore efficiency in all sectors of economy and consequently raising rate of economic growth.
Specifically, the reforms involved economic liberalization, privatization and a general
restructuring of the government’s role in the economy.
Economic liberalization brought about: price decontrols, foreign trade liberalization, decontrol of
domestic marketing of agricultural commodities and decontrol of interest rates and foreign
exchange rates. Several studies on the effects and consequences of SAPS reveal negative effects
on the economy such as inflationary pressures, marginalization and increased unemployment.
These effects have been felt to date.
According to World bank UNDP 1993 report, there is now almost unanimous agreement among
intellectuals and policy makers in and outside Africa continent that orthodox adjustment
programs, as advised by the IMF and World Bank are not working. This has seen most of
African governments, Kenya included, trade accusation with the two Bretton Wood institutions
(IMF and World Bank).
25
The Kenyan government has always urged that, SAPs are based on economic models that do not
fit Kenya social structure. Also there has been a controversy on piling condition and objectives
on the programs from the World Bank and IMF has resulted to economic liberalization of the
Kenyan economy.
Small and Medium Enterprises Sector in Kenya
The Kenyan informal sector usually operates on small-scale, locally and at a subsistence level.
They have fewer employees (especially home-based enterprises), they operate for a shorter
period, and have poor access to water and electricity and few sell outside the establishments
where the entrepreneurs live (World Bank, 2006).
In Kenya, the informal sector is referred to as jua kali, which literally means fierce sun in
Swahili. The name stems from the fact that the workers in the informal sector work under the hot
sun beating on their heads and backs, while working on metal, wood or selling wares on the
streets. The work involved is harsh and hard usually done under harsh conditions unsuitable for
labour-neither regulated nor safe (Nabuteya, 2007).
These enterprises cut across all sectors of the Kenyan economy and provide one of the most
prolific sources of employment creation, income generation and poverty reduction. Therefore
SMEs serve as hot-bed for entrepreneurship and they are seen as vehicles for development
(Bwisa, 2002). Majority of SMEs are micro enterprises with fewer than 10 employees, while 70
per cent of them are one person, own account workers. This infers that majority of SME
entrepreneurs are operating at the bottom of the economy, with a significant percentage falling
among the 53 per cent of Kenyans living below the poverty line of US$ 1 per day. The latter are
largely for subsistence and engage in economically uncompetitive activities both in the urban
and rural areas.
Income from the SME sector is ranked lowest among other sectors of the Kenyan economy, but
they are vital to the livelihoods of many urban and rural poor. Micro trade activities are
sometimes referred to as ‘survivalist’ enterprises-they allow entrepreneurs to survive with hardly
any savings (Mitula, 2003). One of the study objectives is to compare the SMEs characteristics
at the general National level with characteristics exhibited by SME in small town set-up which
have the rural-link function.
26
Challenges facing SME sector in Kenya
There are various challenges that have continued to have negative impact on the growth of SMEs
in Kenya. These challenges include but may not be limited to poor infrastructure, insecurity and
high cost of energy. There has also been unfavorable investment climate occasioned by poor
governance, institutional failures, macroeconomic policy imperfections and inadequate
infrastructure, as well as rampant corruption, bureaucratic red tape, weak legal systems and a
lack of transparency in government departments (APRM, 2007).
On financing, there are several sources of credit access in Kenya ranging from commercial banks
to micro finance organizations and informal savings groups. However, SMEs have continued to
face challenges related to accessing credit. Commercial banks are still bargaining with the issue
of collateral. Due to limited land ownership status in Kenya (Property Rights in Kenya),
entrepreneurs are unable to provide the necessary collateral needed for loan requests. On the
other hand, the informal savings group which includes Savings and Co-operative Societies
(SACCOs) and chama4 are financially ill equipped and though they provides loans at friendlier
interest rates, the members are far much limited to the amount they can borrow. According to a
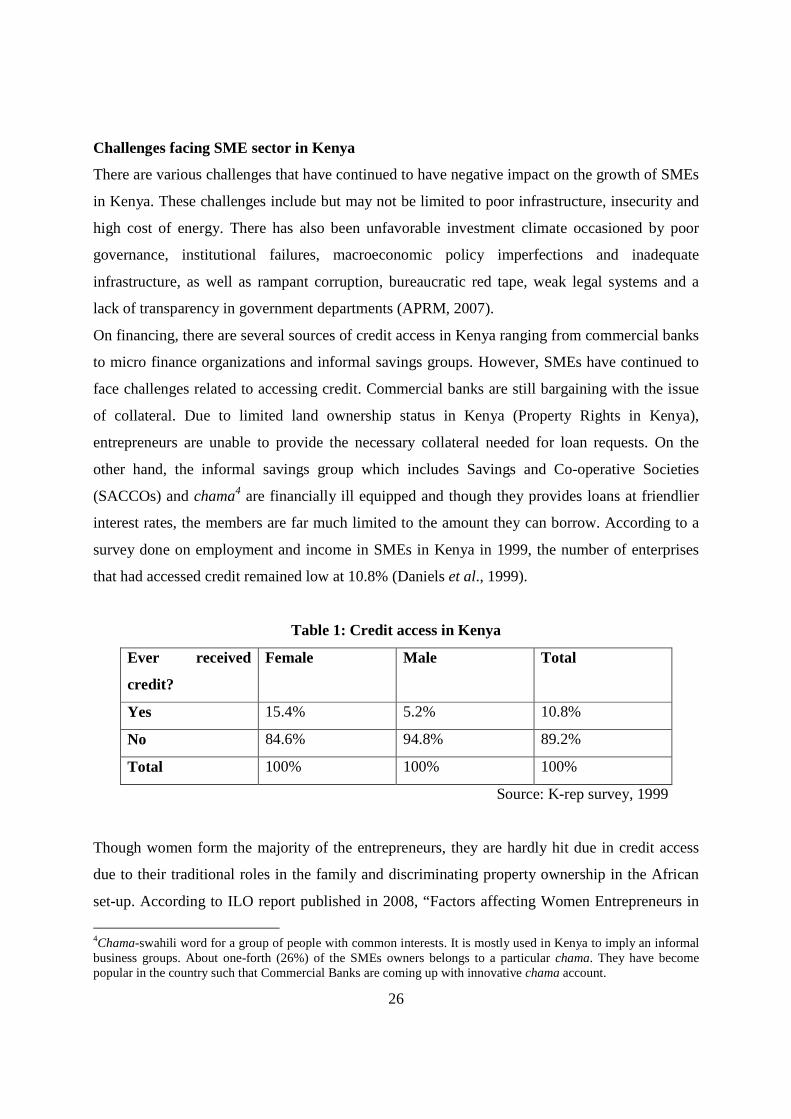
survey done on employment and income in SMEs in Kenya in 1999, the number of enterprises
that had accessed credit remained low at 10.8% (Daniels et al., 1999).
Table 1: Credit access in Kenya
Ever received
credit?
Female Male Total
Yes 15.4% 5.2% 10.8%
No 84.6% 94.8% 89.2%
Total 100% 100% 100%
Source: K-rep survey, 1999
Though women form the majority of the entrepreneurs, they are hardly hit due in credit access
due to their traditional roles in the family and discriminating property ownership in the African
set-up. According to ILO report published in 2008, “Factors affecting Women Entrepreneurs in
4Chama-swahili word for a group of people with common interests. It is mostly used in Kenya to imply an informal business groups. About one-forth (26%) of the SMEs owners belongs to a particular chama. They have become popular in the country such that Commercial Banks are coming up with innovative chama account.
27
Micro and Small Enterprises in Kenya”, women make up nearly half of all Small and Medium
Enterprises owners and 40% of smallholder farm managers, yet they have less than 10 percent of
the available credit and less than 1 percent of agricultural credit. Despite the fact that some
provisions have been made towards gender mainstreaming, there is much more that could be put
in place.
On Policy issues, the journey towards SME policy formulation by the Kenyan government has
been long. The government’s commitment to foster the growth of Micro and Small Enterprises
(MSEs) emerged as one of the key strategies in the 1986 report: Economic Management for
Renewed Growth. It was reinforced as a priority in the 1989 report, The Strategy for Small
Enterprise Development in Kenya: Towards the Year 2000. This report set out the mechanisms
for removing constraints to growth of the MSE sector.
In 1992, the government published the MSE policy report, Sessional Paper n°2 Small Enterprises
and Jua Kali Development in Kenya. The report was reviewed in 2002, leading to a new policy
framework that provides a balanced focus to SME development in line with the national goals of
fostering growth, employment creation, income generation, poverty reduction and
industrialization. However, though these efforts are commendable, these are but perhaps baby
steps compared to the task that lies ahead, namely unlocking the full potential of the SME sector
to spur and sustain economic growth. For there to be long lasting changes, it is imperative for
there to be concerted efforts starting at the policy level especially when it comes to issue
identification and solution architecture.
This is because, like in many developing countries, there have been considerable mountains of
policy publications, data and research yet the problems still remain. Realizing that the present
grinding poverty does not give would be entrepreneurs the capacity to focus and upscale their
enterprises since they are concerned with meeting their very basic needs - food, shelter and
sustenance, reducing the divergence of policy proposals and the reality on the ground then, is
perhaps the remaining policy challenge that stands in the way of Kenya reaping the full benefits
other countries such as India and Brazil are currently enjoying as a result of a robust SME sector.
As later discussed in this chapter, Kenya is ill equipped with Entrepreneurship policy which
would otherwise address business start-up and incubation for ‘shooting’ and later vertical and
horizontal growth of SMEs.

28
On the other hand, there has been complains regarding tedious registration and
certification processes in Kenya. Various bodies have their requirements and require money and
time. One option left to an entrepreneur is to evade the process but this proves more expensive at
the end because of penalty given. For instance, for an entrepreneur running chemical related
business, a certificate is needed from the Ministry of Health or similar authority to show that the
products or services offered have been analyzed and found to be safe. The authorities may also
require the product to conform to legal standards regarding composition.
In the SME sector, practical skills are being developed at low cost and with financial support;
various types of small scale technology could be developed for labour-intensive enterprises that
could absorb hundreds of young job seekers. However, those who run the businesses in this
sector lack adequate business skills mainly attributed to low levels of education. It is not
sufficient to know how to produce a high quality product. The producer must also know how to
sell it effectively and how to control the financial side of the business and in doing that the
entrepreneur must be skilled in business.
The acquisition of relevant vocational, technical and business skills is generally regarded in
Kenya as one of the critical factors necessary for growth and development of micro and small
enterprises (Namusonge, 2005). During the last fifteen years a multiplicity of capacity building
and training programs to develop Small and Medium Enterprises (SMEs) sector have been
unveiled by governments, non-governmental organizations and Micro-Finance institutions in
developing countries. However these measures place a high priority on developing indigenous
private sector to participate and lead in future economic growth. A related and equally pressing
issue is raising the ability of the rural poor to sustain economic sustainability activities for their
survival (World Bank Report, 2004).
Entrepreneurship training with its attendant features like innovation and efficiency can be
harnessed to mitigate the harsh impact of inequality, through unraveling and promoting the kinds
and levels of interconnectivity between urban and rural lifestyle, and their contribution to social
well being and local development. This can only work where economically active groups
especially the youth, are given entrepreneurship exposure and basic business training mainly in
post secondary education aimed at promoting rural entrepreneurship. Therefore, policy option for
rural entrepreneurship program that is founded on rural enterprise conscious education system
should be formulated and implemented. The system will create a favorable environment for the
29
learner to respond more effectively to technology and economic change and equip them with key
aspects in rural enterprise development (Kihonge, 2011).
Since the year 2000, a number of suggestions have been raised with the most appropriate being
to revise the secondary curriculum to incorporate skills into business studies syllabus and
introducing profiles of successful entrepreneurs and enterprises in English literature.
However, this can only be a long-term solution as it involves a lot of time, money and does not
expressly address the currently nagging situation. An effective, more spontaneous and affordable
strategy would be to introduce entrepreneurship mentoring/motivation and training for youth
groups in the community and entrepreneurship clubs in schools. This strategy would enable
youth individuals and groups to visualize income opportunities in their communities and outside,
and seek to tap into them. The schools clubs on the other hand will nurture entrepreneurship
spirit among students at an early age and therefore promote budding of nascent entrepreneurs
(Kihonge, 2011).
AIDS also threatens the survival of small and medium enterprises (SMEs). Recognizing that
HIV/AIDS is as much a business issue as a development and humanitarian concern, the
International Finance Corporation (IFC), the private sector arm of the World Bank group, aims to
promote the involvement of the private sector in the fight against the disease through its IFC
Against AIDS program.
Since 2000, the program has worked with more than 30 client companies in Africa, and South
Asia to develop, implement, and manage effective HIV/AIDS programs within their workplaces
and surrounding communities. In Africa, where SMEs account for the majority of the private
sector, IFC against AIDS has developed a training program to build the capacity of these
businesses to mitigate the impact of HIV/AIDS on their operations. The program is working
currently with 30 SMEs across Kenya, South Africa, and Mozambique (Conner, 2000).
Efforts in Progress
Government Policies
The Government has made tangible efforts in creating a positive economic environment, and
there is need to ensure this is sustainable by strengthening institutions of governance and
improving the fight against corruption. To effectively achieve economic growth, and actualize
the efforts aimed at poverty alleviation; the micro and small enterprises should be financially
30
assisted and proper policies put into place. The recent Government of Kenya (GoK) move to
simplify business licenses, the ongoing efforts to amend the Companies Act, the enactment of the
Investment Promotion ACT (2004) introduces new opportunities for indigenous Kenyan
entrepreneurs. On the same line, the Government’s Sessional Paper n°2 of 2005 on
“Development of Micro and Small Enterprises for Poverty Reduction” (GoK, 2005) has been
aimed at improving role of SMEs in matters of policy formulation on issues that affect their
growth.
However, access to and awareness of such legislations as well as other legal business
requirements and information has remained largely confined to elitist business leaders. Rural
entrepreneurs in provinces, districts and other towns may not have access to such investment
information, which they could take advantage of. This is particularly true for small-scale
entrepreneurs, who, not being well informed of the necessary legal business requirements they
should adhere to with respect to their enterprises, may often feel that they are harassed by local
authorities. Many local entrepreneurs prefer to run their businesses in an informal state, which
hampers their potential for growth, expansion and innovation. This also prevents them from
taking advantages of the incentives provided by the government for formal investment
businesses (GoK, 2005).
The Economic Recovery Strategy Paper for Wealth and Employment Creation (ERS) 2003-2007
identifies SMEs and in particular Juakali expansion as one of those activities that will assist in
economic recovery and growth. The publication of Sessional Paper n°2 of 2005 on
“Development of Micro and Small Enterprises for Wealth and Employment Creation for Poverty
Reduction” is one of the most important current government efforts to develop the MSEs sector.
The Act sets policies for developing the MSEs. Some of these policies include, among others:
Continued legal and regulatory reforms in the sector; Harmonization of trade licensing and
regulatory services; Decentralization of business registration to the provincial levels and
eventually to district levels; Quickening the process of business registration; Reforming and
enforcing the local authority Act to limit and maintain its essential regulatory powers;
Formulating and implementing a MSEs Act to provide a framework for implementing the MSEs
policies; Improving market and marketing opportunities for MSEs both locally and
internationally, through improved business linkages, increased participation of MSEs in public
procurement and increased subcontracting, among other initiatives; Increasing financial services

31
to MSEs; Promoting gender equity by increasing equal access to financial services for women
and men, empowering women, improving gender access to education, technology development
and entrepreneurship; Reforming the tax regime to improve its transparency and efficiency,
strengthening tax collection and harmonizing the tax system (GoK, 2004).
Kenya is also pursuing regional economic integration, which could enhance long-term growth
prospects. The government is pursuing a strategy to reduce unemployment by expanding its
manufacturing base to export more value-added goods to the region while enabling Kenya to
develop its services hub. In March 1996, the Presidents of Kenya, Tanzania, and Uganda re-
established the EAC. The EAC's objectives include harmonizing tariffs and customs regimes,
free movement of people, and improving regional infrastructures. In March 2004, the three East
African countries signed a Customs Union Agreement paving the way for a common market.
The Customs Union and a Common External Tariff were established on January 1, 2005, but the
EAC countries are still working out exceptions to the tariff. Rwanda and Burundi joined the
community in July 2007. In May 2007, during a COMESA summit, 13 heads of state endorsed a
move to adopt a COMESA customs union and set December 8, 2008 as the target date for its
adoption. On July 1, 2010, the EAC Common Market Protocol, which allows for the free
movement of goods and services across the five-member states, took effect. In October 2008, the
heads of state of EAC, COMESA, and SADC agreed to work toward a free trade area among all
three economic groups with the eventual goal of establishing a customs union. If realized, the
Tripartite Free Trade area would cover 26 countries (www.state.gov).
Other stakeholders’ efforts
The World Bank is ready to support Kenya's broad-based vision for the year 2030, unveiled by
President Mwai Kibaki on 3rd November, 2007. The work plan underway is to build a broad-
based vision for the year 2030, which aims to transform the economy and achieve sustainable
growth. The vision for Kenya's future is encouraging and many regional banks share the
country's objective of reducing poverty by creating opportunities for the poor by making
institutions stronger. The World Bank is ready to continue supporting the Government of Kenya
to make Vision 2030 a reality. However, the bank is also keen to see Kenya intensify reforms on
governance and on the fight against corruption.
32
In the journey towards revitalizing a well oiled SME sector, the Kenya Local Government
Reform Program (KLGRP) has been particularly relevant. This was spurred 1999 with a
deliberate policy priority focusing on reducing poverty and unemployment going hand in hand
with accelerating economic growth.
The KLGRP reforms had three components: improving local service delivery; enhancing
economic governance; and alleviating poverty. These objectives were to be achieved through
increasing efficiency, accountability, transparency and citizen ownership and on the practical
side, removal of unnecessary regulatory barriers and the reduction in costs of doing business. In
particular, the government initiated two nation-wide reform efforts, namely: the Single Business
Permit (SBP) and The Local Authority Transfer Fund (LATF). The SBP was a response to
business licensing problems faced by SMEs in the start up phase as they had to get multiple
licenses before opening shop draining the initial business inertia.
Alongside Government led efforts of change, there has also been international support towards
the SME sub-sector. For instance the International Finance Corporation (IFC) along with the
Central Bank and the ministry of Finance has been working hand in hand to establish a credit
reference bureau that should benefit SME entrepreneurs (mostly women). This reform could
enable Non-land Assets to be acceptable as collateral.
According to a 2007 Kenya Women Finance Trust (KWFT) report ‘Improving Access to Finance
for SME: International Good Experiences,’ removing the obstacles to financial access for SMEs
requires that commercial banks, micro-credit institutions, community groups and Business
Development Service (BDS) institutions work closely together. Pushing for agreements between
financial bodies and BDS suppliers can help make up for lack of capacity and reduce costs by
more efficient division of labour.
The BDS supplier makes the initial choice of projects on a purely technical basis and the credit
institution looks at financial viability. Making loans to intermediaries (NGOs and federations of
SMEs) with the job of allotting funds to members can also help cut administration costs.
Solidarity between banks, especially setting up inter-bank financing to pool money to be invested
in SMEs should also be considered as a viable option in reducing the extra risk of lending to
SMEs. This will address simultaneously the twin issues of accelerating access to finance and
reaching the unbanked.
33
An interesting case study in the banking sector has been Equity Bank. There is no doubt that the
bank is one that has stood the test of time in aiding the sub-sector. The recent announcement by
the bank to support SMEs in the country following a shilling 4 billion loan from China serves to
solidify its commitment revolutionizing the SME sector. This loan facility will be available to
SME clients at interest rates of between 7 and 9 percent for periods of 3 to 7 years, making it the
cheapest source of funding for the sector in the country. Perhaps this is a wakeup call to other
financial institutions to develop the courage beyond the shores and launch out in to the sea too.
Government efforts have also been unwavering. The proposal by the government to set up a
revolving fund to provide low interest loans to small and medium enterprises is another red
signal to commercial banks to lend on easier terms. Looking at the 2010/2011 budget that hit
Ksh 1 trillion reveals some of the intended projects. Under the theme ‘‘towards inclusive and
Sustainability Rapid Economic Development’’ the 2010 Budget set an ambitious target of
spurring growth in every part of the country. The move by the government to support growth in
SMEs sector is a new re-awaking based on what can be viewed as a gradual realization of the
inherent potentials in the sector in spurring economic growth. The budget incorporated SME
factor as a move towards revitalizing the sector - having been allotted a Sh3.8 billion credit line.
By all means, this amount is small to cater for the needs of all players in the massive SME sub-
sector. As if to fill the much-felt SME gaps, the government has also initiated other programs to
support the sub-sector. For instance, through Jitihada5 Business Plan Competition, the
government undertook a training program for entrepreneurs under the Micro, Small and Medium
Enterprises competitive project in the Ministry of Industrialization.
Implemented by the Kenya Institute of Management, Jomo Kenyatta University of Agriculture
and Technology and TechnoServe, the plan seeks to identify growth oriented and innovative
business ideas that can be nurtured into vibrant and sustainable business enterprises. It is also
meant to provide participants with innovative ideas, expert coaching and individual mentorship
to help them develop and refine their business plans.
Therefore, more policy initiatives definitions towards revitalizing the SME sub-sector should not
only be government engineered, but also enjoy the input of all stakeholders in all sectors of
development. The effort from both private and public sector towards reinforcing the existent
5Jitihada: swahili word for “put effort”.
34
SME policy provisions is highly recommended based on the fact that all appear to recognize the
SMEs’ critical role in spurring not only self sustenance but also the country’s economic boom.
Rural-urban linkages in Kenya
In Kenya like many developing countries, the interdependence and the link between urban and
rural development is rarely appreciated by development practitioners and policy makers. One of
the major reasons that hamper the achievement of sustainable development in the country is the
absence of a well-functioning system in small intermediate towns that would otherwise
contribute to rural transformation. It is also important to note that rapid changes in population
growth in the country, particularly within the rural-urban fringes are changing community
dynamics and seriously challenging the development policies and systems of governance. Many
of the past government development polices, strategies and systems of governance in Kenya
treated rural and urban development as independent, unconnected sectors with planning
separating the two into urban and rural administrative units (G.O.K, Urban Development
Policies, 2008).
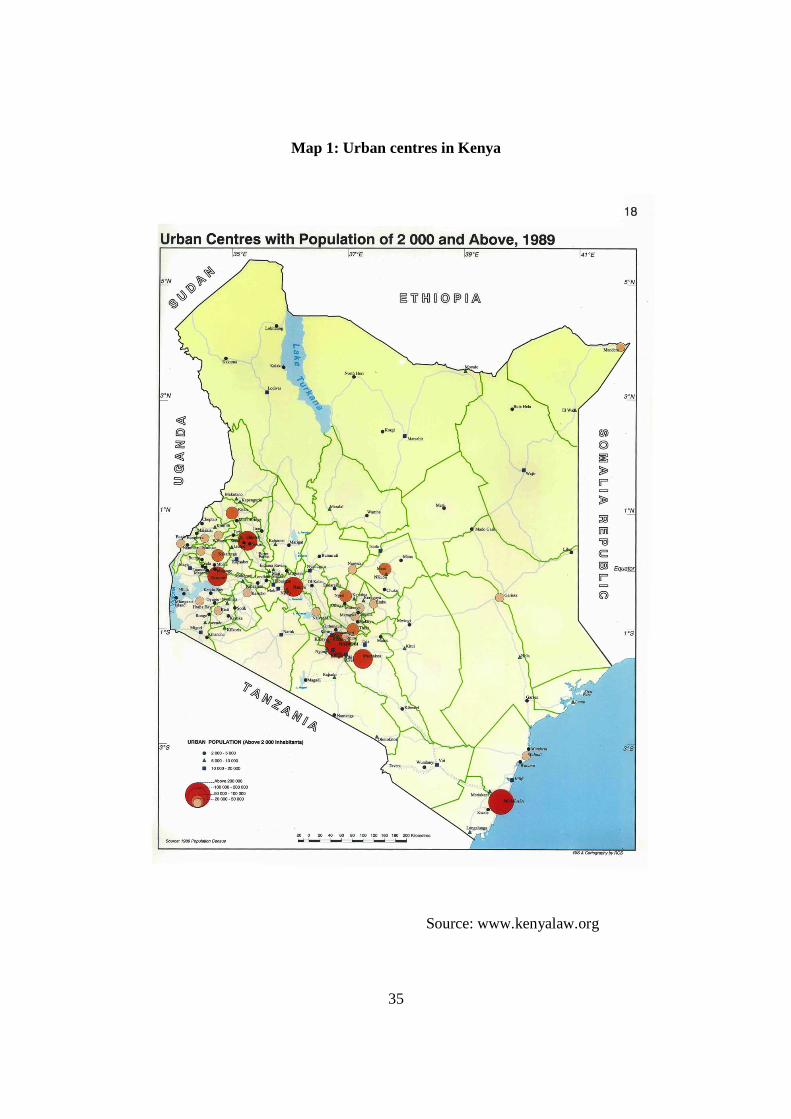
A simple glance at the size-class distribution of Kenyan urban centers suggests a lopsided urban
development, which is dominated by the primate city. There are also wide discrepancies in terms
of the level of urbanization and the size-class distribution of urban centers across regions and
between zones and even within a given region. Moreover, urban centers in the various size-
classes are not functionally integrated and, as a result, the complementary relationships that exist
among them are far from being satisfactory. There is evidence of hyper-urbanization whereby the
largest urban centre (Nairobi) is about 4 times bigger than the next largest urban centre
(Mombasa), with the former alone accounting for 47.5 per cent of total national GDP (GoK,
2006 & 2008-Kenya Country Reports to 3rd & 4th World Urban Fora). This dismal picture is also
replicated in the regions and their respective administrations, whereby provincial and district
headquarters are emerging as dominant urban centers within their respective regions.
The functional specialization of the country’s urban centers is at an infant stage and only few of
them can be categorized as intermediate towns that can offer a possibility to support the
development of manufacturing and related activities. As a matter of fact, the economic base of
most urban is dominated by public administration and a variety of service related activities.
35
Map 1: Urban centres in Kenya
Source: www.kenyalaw.org
36
Thus, they serve in the main as vehicles for almost one way flow of resources from rural to urban
areas. Both rapid urbanization process and the spectacular physical growth of towns have
emerged as major development planning issues in Kenya. The country’s urbanization has
proceeded at a tremendous pace over the past four decades and projections indicate that it is set
to grow even further in the next few years.
In 1962 in was estimated that only one Kenyan out of every 12 lived in urban centers. By the
year 1999, the proportion of the urban population had increased to 34.5 per cent which is close to
10 million people. This implies that one out of every three Kenyans lived in urban areas. By the
year 2015, the level of urbanization will have reached 44.5% with an estimated 16.5 million
people living in urban areas and eventually percentage is set to reach 54% by 2030 with about
23.6 million people living in urban areas (Vision 2030).
The country also lacks adequate number of urban centers that can generate meaningful
development impulses to their hinterlands. Many rural areas, particularly the arid and semi-arid
areas that are predominantly inhabited by pastoral communities, are out of the purview of urban
influence due to the near absence of urban centers. On the other hand, the resource potential of
many regions could not be exploited due to the absence of the requisite urban-based socio-
economic infrastructure and services (G.O.K, Urban Development Policies, 2008).
In Kenya, poorly developed horizontal linkages have weakened the effectiveness of transmission
in the rural areas as the efforts of various agencies have suffered from lack of co-ordination. This
is due to the fact that the spatial systems were those built by the colonial governments which
were not always conductive to the development to the development of the country as they
tendered to gear towards extraction from rural areas (Muendo, 2004).
According to Government of Kenya Report on national urban development, the function of the
county’s urban center is at an infant stage and only a few of the towns and be categorized as
medium sized that can offer a possibility to support the development of manufacturing and
related activities. The classifications of the towns with respect to population and functions in
Kenya are shown in Table 2 below.
The economic transformation process in Kenya has resulted in the unequal distribution of
wealth; hence the social stratification as demonstrated in Kenya. There is inter-sectoral
dynamism in the Kenyan economy. There is accumulation of wealth in a small part of the

37
modern sector which is supported by the politicians on one hand; while on the other hand, there
is a development of an impoverished and economically deprived modern subsector.
The slums are a modern phenomenon in Kenya, such as in Nairobi, Mombasa and the other
urban centers and are as a result of the increased wealth disparity and income differences
between the different economic sectors. The urban areas attract the rural migration as they are
seen to offer jobs. However, there is a slow growth of high-wage employment while the
migration of job-seekers continues to rise, leading to emergence of a low income periphery. This
low-income periphery is established just outside the wealthy urban zone where it provides goods
and services to the wealthy population and also the low-income population (Nabuteya, 2007).
Table 2: Functions and definition of towns in Kenya
Broad Classification Government Functions Private Sector Functions
“Functional
Class”
Pop.
Range
(1000)
Loc. Gov. status Admin.
Function
Education
institutions
.
Manu-
facturing
Agro-
processing
Agro-
marketing
National
Cities (2) >500 City Provincial HQ University
Principal
Towns (6) 70-200
Munipality
College
Intermediate
Towns (6) 30-70 Town Council
District
HQ
Technical
or
Vocational
school
Small
Towns (27) 10-30 Urban Council Division HQ
Rural
Centres (97) <10 --
Second.
School
Source: Based on the basic classification parameters considered in a policy study for the
development of small and intermediate towns in Kenya (2003)
Study area
Mt Kenya region in Central Kenya is the chosen area of study with Sagana and Karatina
representing small towns. Selection of the site (Sagana and Karatina towns) and their

surroundings is based on accessibility of the area, the level of urbanization and the level of
interface between the rural and urban settings.
Kenya (to the North) and Aberdares ranges (to the South) and forms
highlands’. The highlands were most preferred by the British colonizers due to their high land
fertility and good climate. The British mainly practiced large scale farming, however, today, the
land has a hereditary landownership
passes ownership from one generation to the other. This has resulted to small scale farming of
mainly tea, coffee, dairy and horticultural farming in the rural areas.
On the left is the former Central Province, on the left is a sub section of the province which
details the study area (Sagana and Karatina) with reference to big urban centers (Nairobi,
and Nyeri) and the proximity of the small towns
Aberdare Ranges.
Karatina is a town in Nyeri County, Central
kilometres south of Mt. Kenya. According to Kenya National population and Housing Census
38
surroundings is based on accessibility of the area, the level of urbanization and the level of
interface between the rural and urban settings. Sagana and Karatina are sandwiched between Mt.
Kenya (to the North) and Aberdares ranges (to the South) and forms part of the former ‘white
highlands’. The highlands were most preferred by the British colonizers due to their high land
fertility and good climate. The British mainly practiced large scale farming, however, today, the
land has a hereditary landownership structure and is subdivided into very small fragments as it
passes ownership from one generation to the other. This has resulted to small scale farming of
mainly tea, coffee, dairy and horticultural farming in the rural areas.
Map 2: The study Area
Source: Google maps-slightly adopted to fit to the current study
On the left is the former Central Province, on the left is a sub section of the province which
details the study area (Sagana and Karatina) with reference to big urban centers (Nairobi,
nd Nyeri) and the proximity of the small towns (Sagana and Karatina) to both Mt. Kenya and
Karatina is a town in Nyeri County, Central Kenya. It is located on Nairobi
kilometres south of Mt. Kenya. According to Kenya National population and Housing Census
surroundings is based on accessibility of the area, the level of urbanization and the level of
Sagana and Karatina are sandwiched between Mt.
part of the former ‘white
highlands’. The highlands were most preferred by the British colonizers due to their high land
fertility and good climate. The British mainly practiced large scale farming, however, today, the
structure and is subdivided into very small fragments as it
passes ownership from one generation to the other. This has resulted to small scale farming of
slightly adopted to fit to the current study
On the left is the former Central Province, on the left is a sub section of the province which
details the study area (Sagana and Karatina) with reference to big urban centers (Nairobi, Thika
to both Mt. Kenya and
Kenya. It is located on Nairobi–Nyeri highway, 20
kilometres south of Mt. Kenya. According to Kenya National population and Housing Census
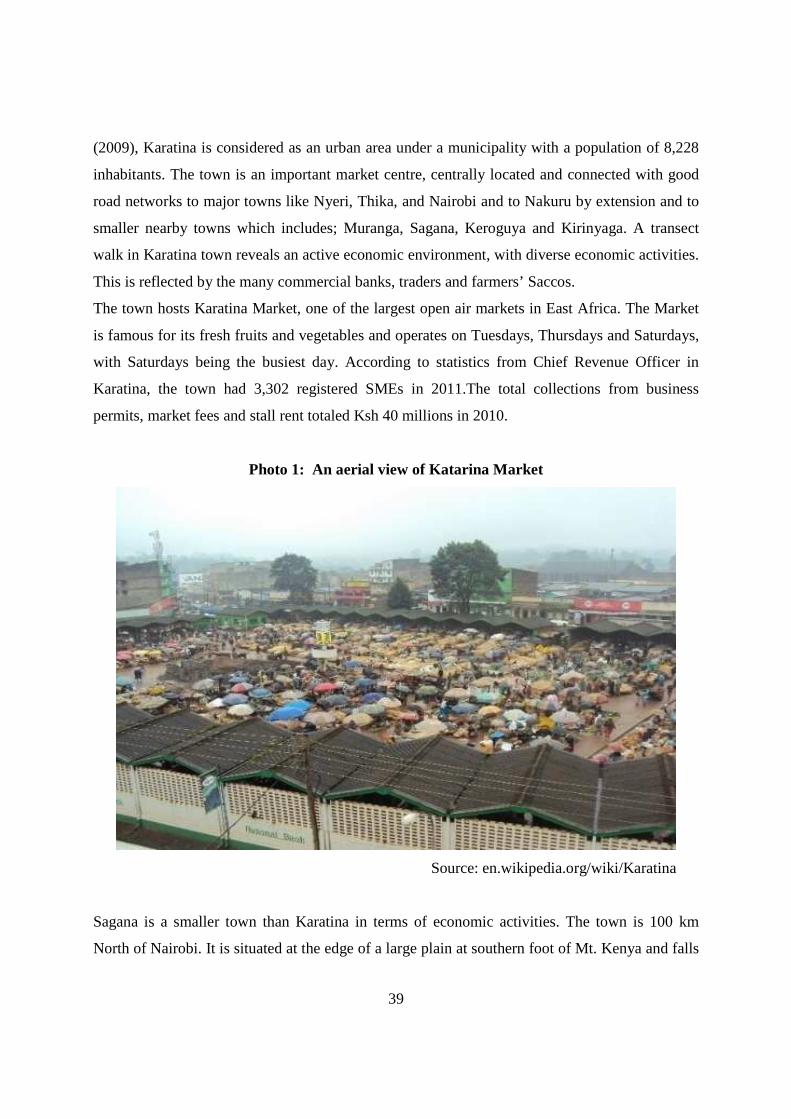
39
(2009), Karatina is considered as an urban area under a municipality with a population of 8,228
inhabitants. The town is an important market centre, centrally located and connected with good
road networks to major towns like Nyeri, Thika, and Nairobi and to Nakuru by extension and to
smaller nearby towns which includes; Muranga, Sagana, Keroguya and Kirinyaga. A transect
walk in Karatina town reveals an active economic environment, with diverse economic activities.
This is reflected by the many commercial banks, traders and farmers’ Saccos.
The town hosts Karatina Market, one of the largest open air markets in East Africa. The Market
is famous for its fresh fruits and vegetables and operates on Tuesdays, Thursdays and Saturdays,
with Saturdays being the busiest day. According to statistics from Chief Revenue Officer in
Karatina, the town had 3,302 registered SMEs in 2011.The total collections from business
permits, market fees and stall rent totaled Ksh 40 millions in 2010.
Photo 1: An aerial view of Katarina Market
Source: en.wikipedia.org/wiki/Karatina
Sagana is a smaller town than Karatina in terms of economic activities. The town is 100 km
North of Nairobi. It is situated at the edge of a large plain at southern foot of Mt. Kenya and falls

40
under Kirinyaga County. According to Kenya National population and Housing Census (2009),
Sagana is considered as an urban area under a Town council with a population of 9,889
inhabitants. Sagana is a relatively smaller town in terms of trade activities and had 400 registered
SMEs. Transect walk around the town reveals fewer and dispersed businesses activities as
compared to Karatina, The town is surrounded by rich agricultural hinterlands, where small scale
farming of high value crops, cash crops and dairy farming. The town hosts Sagana market which
is also a smaller market compared to Karatina.
Due to its strategic position, Sagana serves as a ‘gateway’ to the larger Mount Kenya region
(Kirinyaga, Nyeri, Muranga and Embu). The town is home to several storage and Distribution
Depots of economic products that serve Mount Kenya region. Among them is Kenya Breweries
depot, Kenol-Kobil fuel depot, Kenya Planters Cooperative Union depot and National Cereals
Board depot.According to a report obtained from the Town Council’s office the total revenue
collected from SMEs in 2010 totaled Ksh 14.5 millions.
Karatina Town
Karatina6 town is situated at the heart of Mt. Kenya region in Central Province, Nyeri District.
Karatina lies approximately 125km north of the capital City of Nairobi and around 22km from
Nyeri town. The town has some of the best view points of Mount Kenya and the Aberdare
Ranges.
Location and Size
The town is strategically placed at the hub of efficient road network linking it to Sagana,
Murang'a, Thika and Nairobi in the South, Kerugoya, Embu, and Meru in the East, Nyeri to the
West and Nanyuki to the North. The Nairobi-Nanyuki railway passes through the town. It has a
potential for future economic development. The Ragati River also flows through the town and
provides the town's urban water supply. Commuters use car, bicycle, and motorbikes and foot
6Karatina is a diminutive term for Muratina (Squash/Corjet) tree. The town was founded before the British Colonization of Kenya by Gikuyu women who used to trade their crafts and food under a corjet (muratina) tree. Women would direct each other on where to sell or buy merchandise under the Karatina, which is the smaller term for Muratina (The history is an integration form from Karatina Municipal Website and Wikipedia free online Dictionary, all downloaded on 2nd March, 2011).
41
even though there is a rail service from the City and Nanyuki Town. Languages spoken are
predominantly Kikuyu, Swahili and English. The town hosts Karatina Market in sub-Saharan
Africa. The Market is famous for its fresh fruits and vegetables and operates on Tuesdays,
Thursdays and Saturdays, with Saturdays being the busiest day. In the rural catchment, people
practice small scale tea, coffee, dairy and horticultural farming.
Topography and Geology
The town lies on a plateau directly below the southern side of Mount Kenya. It is fed by radially
flowing hills and streams running from Mount Kenya towards the lower slopes of the mountain
that are marked by the river Tana, the longest river in Kenya. Despite that Karatina is near Mt.
Kenya there are no large hills or mountains nearby as the town is on a plateau. The general
terrain surrounding Karatina are small rolling ridges and valleys, which assures proper drainage.
There are no known swamps in the area. The present landscape in Karatina originates from the
repeated faulting and lava outpouring. The town\s area and environ is covered mainly with
volcanic soil, which are fairly rich in organic matter and quite fertile. This soil is also suitable for
all types of buildings.
Climate and Weather
Karatina is located primarily on the upper midland and lower highland zones of Nyeri District.
Although situated near the Equator, due to its mountainous environ, Karatina enjoys a very
moderate climate throughout the year. It has annual temperatures of between 17 to 21 degrees
Celsius. The annual rainfall pattern is typically for the highland equatorial zone of Kenya and
varies from 750mm to 1,750mm. There are two rainfall seasons i.e. long rains from March to
May and short rains from October to December. The altitude above sea-level is around 1,761m.
This makes the area ideal for all types of agricultural production.
Sagana town
The most vivid history of Sagana town can be traced back to 1922 when the national railway was
constructed by the British East Africa Company. There after the town began as it functioned as a
pathway for local merchants and agriculturalists accessing the rail yard from vast areas of Mount
Kenya. Sagana town function was intended to be a trading zone for Kirinyaga, Nyeri, Muranga,
42
Embu and Nairobi because it is at the crossroads of the districts. Sagana can be termed as the
gateway to Mount Kenya. International truck road A2 connecting Nairobi to Addis Ababa,
Ethiopia passes through Sagana. Sagana railway station provides the closest accessibility link
point to Embu, parts of Nyeri, parts of Muranga, parts of Meru and the whole of Kirinyaga
district.
The major marketing facilities for cereals cultivated in central province are concentrated around
Sagana. The National Cereals Produces Board (NCBP) offer storage facilitates for surplus
cereals in Mount Kenya region. Kenya Planters Cooperative Union stores and milling facilities
cater for coffee producers in Kirinyaga, Embu, Nyeri and Meru.
Sagana tanneries process hides and skins for export and for local markets. The factory was
started in 1976.Extensive Rivers, streams and canals running across Sagana support intensive
agricultural activities. Sagana fish culture farm which is the second largest in Africa produces
fingerlings which are sold in the whole country.
Conclusions on the chapter
Rural-urban linkages have not been fully accepted in Kenya, this may be one of the ill doings
that have resulted to unsustainable development in the country. This has resulted from rapid
increase in urban population caused by amplified rural-urban migration which has lead to hyper-
urbanization and increased urban poor. For a sustained development, there is need to enhance the
rural-urban links in the Country, this will build a well-functioning system that will strengthen the
small intermediate towns that would otherwise contribute to rural transformation. This would
call for understanding the dynamics and operations of the SMEs especially with the aim of
strengthening this important sector especially in the small and intermediary towns.
The sector has been affected by regulatory requirements ranging from colonial period, which the
government assumed till the dawn of SAPs in 1990s. Though the government has put a number
of measures to revive the sector since 2003, there still remain some apparent obstacles in the path
of growth of small and medium enterprises in Kenya. These include political instability, financial
constraints, energy crisis, taxation problems, labour issues and HIV/AIDS epidemic.
43
CHAPTER 1 C
DISSERTATION LITERATURE REVIEW
Introduction
The literature review presented in this chapter takes us through the evolution of rural-urban
linkages in the context of political and administrative government structures in the world, and
more so in Africa. It gives the factors that have necessitated the metamorphosis from traditional
government systems to Decentralization system over the years. The literature further reveals the
loop hole in decentralization and the need to bring on board rural-urban relations to mitigate the
effects of globalization in the developing world.
Since rural-urban relations mostly takes place between small towns and their rural hinterlands,
the chapter discusses the SMEs as the important but neglected node of forward and backward
linkages in a small town. The chapter discusses the entry point of SMEs activity into the cyclic
circles of rural-urban linkages and brings on board the different types of linkages and how SMEs
plays part.
Historical evolvement of the ‘rural-urban linkages’ concept
In all countries, the historical economic and political geography over long periods of time
corresponded to traditional forms of distributed authority, limited to small territories and regions,
and supported by mutual-aid arrangements at the village level. Much of this historical social and
territorial structure was abolished at a later stage in history when the importance and power of
the national government was consolidated. In Europe, the emergence of the modern nation state
in the 19th century took place as the culmination of a long process of political and economic
changes over several centuries (Manor, 1999: viii).
Although vestiges of older traditions (feudal roots, monarchic patterns, and early free city states
for example) can still be traced, the modern state in Europe has been consolidated for so much
longer than in most of the so-called developing countries. So in any Asian or African country
today, the super-imposition of “old” and “new” economic and political patterns is usually much
more visible. Colonial powers had demonstrated the strength of centralistic government and
planning, which then became a model for the newly independent nation states after the end of the
44
colonial era. Centralization later became the model for development of the emerging nations in
Africa, Latin America and Asia, and was reinforced by donor agencies, including the World
Bank” (Manor, 1999: viii). After ten or more years of experience with this model, governments
began to be worried about growing inequalities and their effect on political stability. So they
realized the importance of regional and more comprehensive approaches which gave birth to
decentralization. This has brought a change from ‘‘top-down’’ to more localized, participatory,
and generally “bottom-up” administration and planning (UN Habitat, 2002)
Decentralizing ensures good governance by means of a long- term learning process with an
emphasis on capacity building of local governments and full participation of the local society.
Political and administrative decentralization can lead to paradigm shift from an “unbalanced
urbanization” to “balanced urbanization” where the surplus of the agriculture labour can be
absorbed by the growing urban employment market resulting mostly from rural-urban migration.
Empirical studies show that the concentration of urban development on the capital city is
correlated with the concentration of political power in a central government. As a European
comparison, France (with Paris as a primate city region) has a much more skewed urban
development than Germany and Italy -more dispersed pattern of city sizes due to late
consolidation of the nation state and decentralized form of government (UNDP report, 2002)
Since 1990s, African countries have been undergoing political and administrative reforms sought
to break with the past colonial and centralized structures through decentralization of power to the
local government. Decentralization is being favoured as the most suitable mode of governance
through which poverty reduction interventions can be conceived, planned, implemented,
monitored and evaluated.
According to World Bank, stock taking report, 2002, Kenya, the country on focus in this study,
was ranked 3rd most decentralized country in Africa after South Africa and Uganda. Increased
decentralization is expected in the country with the promulgation of the new constitution in the
year the 20107. The question is whether decentralization alone, will facilitate greater
participation of the communities in problem analysis, project identification, planning,
implementation, as well as oversight which will increase ownership and the likelihood of
sustainability of such initiatives.
7 Decentralization enhances rural-urban linkages which are in turn enhanced by empowering and organizing the poor to increase their bargaining power vis-à-vis forming economically stronger groups.
45
The shift from decentralization
The mere fact of opting to for decentralization shall not by itself ensure that the population
effectively participates in its development which is the ultimate goal of a good of
decentralization and governance. It is important to set up mechanism reassuring the participation
of the population. A good development paradigm paradoxically combines localism (democratic
decentralization, participation, non-government forces) and globalization (foreign direct
investment, market liberalization, information/communication technology) into a peculiar
“glocal” amalgam. Both put emphasis on local sustainable development and the revival of the
rural-urban linkages (Kauzya, 2009).
Globalization as cause and effect of an increasingly ‘borderless world’ has added direct global
linkages to the scenario of regional and international relations between North and South, urban
and rural, rich and poor. Within the 1990s, foreign direct investments (FDI) have grown
enormously to become one of the most important factors in national development, including
urban-rural relations (Friedman and Douglas, 2003).
An overview of rural urban linkages
According to David Satterthwaite (1986), many poor households have livelihoods that draw on
rural and urban resources or opportunities. Urban and rural areas are closely linked, each
contributing to the other, which needs to be considered in development planning. Many fast
growing cities are within areas with the most rapid increase in the value of agricultural
production. For instance, the urban centers serving areas producing: high value fruit or
vegetables, coffee or tea and other high value crops such as silk cocoons. Factors relating to
agriculture influencing the prosperity of most such urban centers includes: the value per hectare
of the crops (the higher the value, the more local urban development), the potential for local
value added and the scale of forward and backward multiplier linkages AND lastly the land
owning structure with the perfect stimulus to local urban development being lots of prosperous
relatively small farms growing high value crops.
Urban areas are very important to rural households. They are not only as sources of demand for
rural produce but also important for rural households as: Funding flows for rural development as
many migrants to urban areas help support development in the rural settlements from which they
moved; Accommodation and access to jobs or schools for rural family/kin/fellow villagers;
46
Refuges for some of the poorest rural dwellers; More diverse labour markets and employment
opportunities for those in nearby rural areas; Access to many different branches of government
(including access to justice) and many public services(Satterthwaite,1986).
On the other hand, rural areas are very important for many urban households. A proportion of the
urban poor derive some/all of their livelihoods from meeting rural demand, many poor urban
dwellers rely on seasonal employment in agriculture, many poor urban dwellers move back to
rural areas when times are particularly hard, many urban dwellers have relations with rural
dwellers to guarantee their food supply. Many urban dwellers also retain key assets in rural areas
and rely on rural dwellers to protect their land, crops or livestock or to provide their children
with homes or even access to schools when urban schools are bad or expensive.
Mugambi (2004) ascertains that, to tap the positives of both rural and urban areas for
development there is need to have a synergetic relationship between the two. Both rural and
urban areas, looked at separately, have their positives and limitations. Hence both the pro-rural
and arcadian view and the Pro-urbanization view are self-limiting. The rural-urban continuum
view brings in synergy in rural-urban relationships. The justification of the rural-urban
continuum views list in the visible and invisible flows and interconnections, or linkages, between
rural and urban areas. Exchanges of goods between urban and rural areas are an essential element
of rural-urban linkages (Tacoli, 2004).
Households increasingly rely on rural and urban- based resources for their livelihoods. For low-
income groups, this is often a survival strategy to make ends meet by engaging in a variety of
activities. For higher income groups, investment across sectors of activities and between rural
and urban areas, for example by acquiring farmland with income from trade or urban-based
employment, as is an accumulation strategy to increase assets and income (IIED, 2001).Rural-
urban linkages are can be explained in terms of economic linkages; social-cultural linkages;
political linkages; and administrative linkages (Owuor, 1995 and Obudho, 1999, as cited by
Mugambi, 2004).
Types of rural-urban linkages
Rural-urban linkages mostly lead to rural-urban migration. Whether this migration is beneficial
to rural areas again is a point of debate, but what are evident are the social-cultural linkages as
the immigrants still maintains ties with their rural homes and rely on village mates to settle in the
47
towns and therefore creating cultural networks. The increased economic activities in urban areas,
implies an environment concern both in the immediate environment and now inseparable rural.
These linkages are discussed below.
According to Rondinelli (1985), there are seven types of rural-urban linkages with a large
number of ‘elements’ (see Table3). Some of these types and elements are straightforward, such
as physical and economic linkages as well as service delivery linkages. However, it should be
noted that the relatively simple, ideally ‘symbiotic’ relationship of small rural towns and their
agricultural hinterlands, shown in the table, does not hold when regional networks and their
linkage patterns develop and become more complex.
Regionally, there would be considerable differences in such patterns, due to added backward and
forward linkages. Several types of rural- urban linkages can be identified in Kenya; economic
linkages physical linkages, population movement linkages, social linkages, technology linkages,
social delivery linkages and political and administrative linkages. In economic terms three types
of rural-urban linkages are usually distinguished: consumption linkage (demand for final
products), production linkages ‘backward’ or ‘forward’ supply of inputs among business, and
financial linkages e.g. rents extracted by urban landlords, remittance by migrants and rural
savings channeled through urban institution (Muendo, 2004).
Economic Linkage
Rural-urban linkages create an avenue for stimulation of rural economies to growth, spread the
benefits or urban development and transform a “rural to urban center” migration pattern to the
reverse. The linkages enhance a wide variety of consumer goods, commercial and personal
services to be offered.
Urban centers provide a central location for retail, commercial, administrative and transport
service both for agricultural producers within their rural hinterlands and for their own internal
population. According to Mugambi (2004), rural and urban areas are linked by the exchange of
processed and unprocessed products, with both areas acting as markets for each other. In this two
way relationship, urban markets provide a powerful increased rural production, while expanding
rural markets provide a powerful incentive for increased production of urban manufactured
goods. Another important aspect of economic linkage is the provision of employment
48
opportunities in non-agricultural occupations – mainly in the ‘jua kali’ sector for small and
intermediate size urban dwellers send part of their income back home, to the rural areas as
remittance. SMEs actors exist in six out of seven types of linkages (see Table 3) and interact
directly or indirectly with the 7th element (political administrative and organizational linkages)
forming a significant base in the current study.
Short term and permanent migration of people from rural to urban areas or from urban to rural
areas is an important form of urban rural linkages. The lifting of restrictions of population
movement of Africans to towns by the colonial government in the early 1960s and the opening of
the formerly closed Europeans farming areas in the Kenya highlands to Africans were the two
most important factors that opened from the rural areas to the urban areas and from one rural
area to other areas. The wide disparities in living standards and income opportunities between
backward rural areas and more progressive urban centres largely accounted for the widespread
rural to urban migration in Indonesia and the high growth rates of city populations (Muendo,
2004).
As population migrates from rural areas, the latter have to rely more heavily on hired labour for
family farm activities. Such reliance rationalizes urban-rural remittances, but where they are not
made the effects on rural households could be devastating. Also where the remittances take
advantage of investment in agriculture, they may enhance the commercialization of agriculture
activity which in turn would improve commodity terms of trade and extension of markets
(Oberai and Singh, 1983:39).
Urban-rural remittances are likely to raise rural incomes through facilitating the purchase of
productive land, hybrid seeds and the use of fertilizers- indeed, may inject scientific and
technological innovations in agriculture (Oucho, 1996). The main problem is income
contribution which, depending on who remits and who receives and for what purpose, may lead
to income inequality and uneven rural development (Chilivumbo, 1985). Most studies have
shown that remittances go to different groups depending on relationship ties. The parents receive
the highest proportion, a fact attributed to the tendency for immigrants to support old folks,
besides their families. It is probably because of the repayment of the so-called social debts
incurred in education provided by parents (Essang and Mabawonku, 1974 as cited by Oucho,
1996).
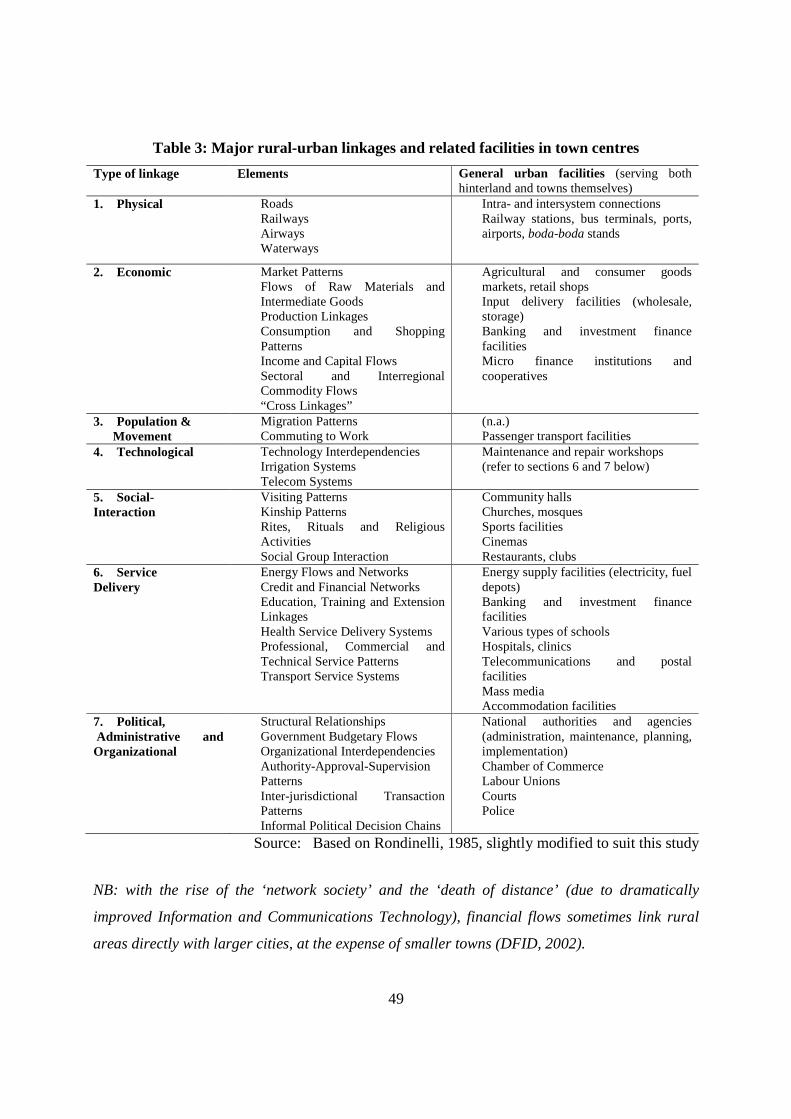
49
Table 3: Major rural-urban linkages and related facilities in town centres
Type of linkage Elements General urban facilities (serving both hinterland and towns themselves)
1. Physical
� Roads � Railways � Airways � Waterways
� Intra- and intersystem connections � Railway stations, bus terminals, ports,
airports, boda-boda stands
2. Economic
� Market Patterns � Flows of Raw Materials and
Intermediate Goods � Production Linkages � Consumption and Shopping
Patterns � Income and Capital Flows � Sectoral and Interregional
Commodity Flows � “Cross Linkages”
� Agricultural and consumer goods markets, retail shops
� Input delivery facilities (wholesale, storage)
� Banking and investment finance facilities
� Micro finance institutions and cooperatives
3. Population & Movement
� Migration Patterns � Commuting to Work
� (n.a.) � Passenger transport facilities
4. Technological
� Technology Interdependencies � Irrigation Systems � Telecom Systems
� Maintenance and repair workshops � (refer to sections 6 and 7 below)
5. Social- Interaction
� Visiting Patterns � Kinship Patterns � Rites, Rituals and Religious
Activities � Social Group Interaction
� Community halls � Churches, mosques � Sports facilities � Cinemas � Restaurants, clubs
6. Service Delivery
� Energy Flows and Networks � Credit and Financial Networks � Education, Training and Extension
Linkages � Health Service Delivery Systems � Professional, Commercial and
Technical Service Patterns � Transport Service Systems
� Energy supply facilities (electricity, fuel depots)
� Banking and investment finance facilities
� Various types of schools � Hospitals, clinics � Telecommunications and postal
facilities � Mass media � Accommodation facilities
7. Political, Administrative and Organizational
� Structural Relationships � Government Budgetary Flows � Organizational Interdependencies � Authority-Approval-Supervision
Patterns � Inter-jurisdictional Transaction
Patterns � Informal Political Decision Chains
� National authorities and agencies (administration, maintenance, planning, implementation)
� Chamber of Commerce � Labour Unions � Courts � Police
Source: Based on Rondinelli, 1985, slightly modified to suit this study
NB: with the rise of the ‘network society’ and the ‘death of distance’ (due to dramatically
improved Information and Communications Technology), financial flows sometimes link rural
areas directly with larger cities, at the expense of smaller towns (DFID, 2002).
50
Urban-rural remittances enhances the purchasing power and permit the acquisition of modern
farm implements, adoption of modern farming methods and predisposes rural farmers to
investment in cash crops (Oucho, 1996).
In Kenya, some studies contend that the contribution does not enhance rural development
(Johnson and Whitelaw, 1974). Yet what proponents of this view forget is that labour reservoirs
in Kenya from which urban migrants originates tend to thrive on subsistence economy, which
suggests why remittances end up in consumption rather than investment (Oucho, 1996).
Social – Cultural Linkages
Social and cultural linkages occur through; religious services, cultural services educational
services, health services recreational services, meal and hotel facilities etc. it is noteworthy that
the magnitude of social-cultural linkages varies with the availability and need for social-cultural
functions (Magambi,2004). Towns are the focal points for a wide variety of social linkages
among those centers and their rural hinterlands.
There is a relationship between the migration of labour and the informal sector. The decision to
migrate to the urban areas is directly influenced by family needs for a better economic stability.
The family members who migrate to the urban centers send remittances to their families back in
the rural areas. This involves the family locating their labour assets in different geographical
regions to ensure financial stability. The family in this way pulls together its resource to help it
cover risks and ensure financial stability (Meier & Rauch, 2006)
Earlier research has shown that the immigrants to the urban areas first put up with relatives or
friends as they look for jobs in the formal sector. They on the other hand help in preparing meals
and other household chores. With time, they find a job such as messengers, clerks, and move out
to start their own lives and rent a house where they can accommodate other new-comers.
However, sometimes they don’t find a job in the formal sector and they end up joining the
informal sector, where they sell second-hand clothes peas, shoes and other activities all found in
the informal sector. The informal sector work may also include helping selling in the family
kiosk, selling of newspapers, curios, shoe shining on the street corner. This pattern is found in
Kenya. There is increased rural-urban migration especially of the school leavers who still believe
that the cities offer a kind of income and it’s much far better than in the rural areas. This has
however, changed in the past years with increased unemployment and retrenchment of the formal
51
workers who in turn have got into the informal sector to fend for themselves and their families.
Long gone are the so called “white-collar” jobs which acted as a magnet to the big cities in
Kenya (Nabuteya, 2007).
According to Oucho, the link between migrants and their close relatives and friends enable their
activities in both urban and rural areas to be complementary. Although migrants participate in
the urban economy, they remain loyal to a rural economy thereby operating in geographically
separate but culturally and economically integrated systems. The links are expressed in many
ways: a migrant visit his home periodically, welcomes visitors from the village, helps new
arrivals to get started in the city, returns home to find a bride, messages flow to and from, and so
on (Gugler and Glanagan, 1978:64 as cited by Oucho, 1996). This reciprocity is intended to
sustain socio-cultural links.
In Kenya, Moock (1978:30) noted that urban-rural ties are reinforced not only by “ traditional
values” but also by a series of rural-based dependencies, namely, insecurity of urban
employment for which return to a rural area might constitute a temporary alternative, lack of
social welfare benefits in town, the need to maintain dual family enterprise and household affairs
from afar. This dependency of urban migrants on their areas of provenance has received little
emphasis in previous research.
At the same time, a majority of Kenyan heads of households living in urban centers in Kenya
grew up in the rural areas. One major aspect of rural urban linkages is the degrees of
commitment urban residents have to their urban life and lifestyles and how they maintain strong
rural ties. Such rural links include a rural house, family ties and rural-urban and urban-rural
economic transfers and the ultimate proof of weak urban lifestyle at some point in the future.
Strong dependency of rural families on off farm wage income links them to urban areas in form
of male heads living in urban areas or commuting daily (Kimani and Talor, 1973).
Environmental Linkages
According to World Bank Report (2006), the city’s ecological footprint constitutes a significant
rural-urban linkage with many management implications. The global economic forces have
contributed to increasing the ecological ‘footprint’ of ‘world cities’ deep into the countryside
(forests, water resources, agricultural products and small economies). This raises serious
52
questions of sustainability of natural, economic and social systems in developing countries where
the effects of global linkages are increasingly felt.
Heavy subsidies to agriculture in all industrialized countries are detrimental to the development
of agriculture in developing economies, with serious consequences for their competitiveness and
growth potential ‘Development’ implies change and transition processes, including the overall
rural-urban transition that is likely to be completed within the next fifty years. Therefore, the
nature of rural-urban linkages is generally changing, but even within the same country, they can
be regionally very different, depending on socio-economic-political development factors.
Therefore, what is needed are carefully ‘tailored’ policies and ‘packages’, rather than
standardized solutions (for analysis and policies) because they would never fit all regions.
Small towns and rural-urban linkages
Most of past studies have neglected small towns in favours of metropolitan towns (Linn, 1979;
Renaud, 1979). It is probably true to state that most urban researchers, and almost all policy
makers, have been so fascinated and preoccupied with the challenges of metropolitan cities, that
the lower ranges of urban settlements have been neglected and often misunderstood. On the other
hand, rural planners and researchers have traditionally focused on village-level studies and
agricultural regions, but within those, the role of small and medium-sized towns has then become
a somewhat neglected subject.
In Ghana for example, while various studies have been done on Ghana’s urbanization, they have
mainly focused on the large towns, particularly regarding migration to these centers and its
consequences. Not much has been done on the process of urbanization and urban growth
regarding small towns (Owusu, 2005). This situation, however John notes, is not limited only to
Ghana. However, in most countries, even with a skewed primate city population distribution, the
majority, or close to 50 percent at least, of urban people live in non-metropolitan areas, smaller
cities and rural towns. In most of these towns, the connections with the surrounding land, as well
as the linkages into the metropolitan areas, are un- reflected components of everyday life
experience (Freidman, 1992).
As noted by Cecilia Tacoli (1998), small towns have a considerable potential role in rural-urban
linkages. A large proportion of urban population in most nations lives in small towns. Through
53
the development of SMEs, the towns act as markets for farm produce from the surrounding rural
region, either for local consumption or forwarding to the national and/or regional markets. The
centres also act as nodes for the production and distribution of goods and services to their
neighbouring rural region. Unfortunately, there are no broad comparative investigations of the
growth of small towns in developing countries.
The difficulties of studying small towns are partly that statistics are scarce and partly that the
statistical definitions of small towns have tended to vary both from country to country and from
census to census. Statistically, small towns in many cases are not treated as towns at all, while in
other cases, data for the registered towns often include large rural areas around the town. In
general, this has probably led to an underestimation of the small town population (Hardoy and
Satterthwaite, 1986).
Population thresholds are commonly used for the definition of urban centers, but while many
Latin America and European countries use a low threshold of 2,000-2,500 inhabitants, other
nations use much higher thresholds. A large proportion of the rural population Asia lives in
settlement that, under other nation’s urban definition would be classified as urban. There is also
no universal definition of small and intermediate urban centers, since this largely depends on
national urban structure. In large countries such as India, a ‘small’ town can have a population as
many as 500,000 inhabitant ants. In smaller size nations, the population of the largest cities can
be less than 500,000 inhabitants (Tacoli, 1998).
In Kenya, according to policy study for the development of small and intermediate towns, 2003,
the two largest cities (Nairobi and Mombasa) has a population of over 500,000 with small towns
having a population of between 10,000 and 30,000. Towns with less than 10,000 inhabitants are
considered as rural centers.
Small town functions as a link between the rural areas and the large towns, and as noted by
Hazell and Brown (1987), small towns with efficient services are likely to increase the
productivity of agriculture. The towns also absorb some of the rural population surplus which
otherwise will crowd into the large cities thus mitigating rural-urban migration to the big urban
centers, which mostly results to non- sustainable urbanization.
Urbanization in Africa has created a dichotomy in social, economic, cultural and spatial aspects
of development. Socially and culturally, the cities have become embodiments of the interaction
of two civilizations, the modern, and deriving from the culture and values of countries from the
54
developed world, and the local, which has elements of traditional beliefs and practices.
Economically, modern forces of production have been concentrated in the cities where two
parallel economic sub-systems, the formal and the non-formal sectors, have evolved (Muendo,
2004). Urban growth may be beneficial for economic growth. Empirical studies that found a
positive relationship between urbanization rate and GDP growth support this argument:
Exception: Africa with high urbanization rate and no or minimal economic growth. Nevertheless,
in the Kenyan situation close to eighty per cent of the country’s GDP is made in Nairobi Ouma,
2004). Economically, modern forces of production have been concentrated in the cities where
two parallel economic sub-systems, the formal and the non-formal sectors, have evolved
(Muendo, 2004).
It is probably more useful to consider small towns within the wider national or regional system
of urban space centers. Such functions may include the provision of services, facilities and
infrastructure to their own population and to that of the surrounding region (Tacoli, 2000).
Through integrated symbiotic relationship between the urban centers and its rural inland,
national, regional and local development can be achieved. There is need to have sustainable
rural-urban linkages through the small towns. These would ensure continuous two-way flow of
benefits from cities to rural areas on a sustainable basis. Improved synergies between local
governments, NGO’s local civil society and private sector actors can play a key role in
supporting the positive aspects of rural-urban interactions while reducing their negative impacts
(Mugambi, 2004).
The urban place in the rural areas is a vital interface and an effective rural development strategy.
It is through the different levels of local governments that local needs and resources can be
assessed and many government policies most effectively implemented. In addition to taking
responsibilities related to the provision of infrastructure and services, local authorities
themselves play a role in stimulating regional economic development to improve growth and
reduce inequalities by utilizing the full potential of both rural and urban areas (Muendo, 2004).
Just as small towns and their services may have a positive influence on rural development and
agricultural productivity, the development of the small towns depends on the growth of rural
incomes. One of the objectives of the current study is to analyze how rural incomes influence the
growth of SMEs in small towns. However it is also a prerequisite that the incomes generated are
55
spread fairly evenly. Where land ownership is very concentrated, incomes tend to leak out of the
local area to non-local landowners. Thus, the small towns seem to grow especially where
agricultural reforms have taken place, because only here will growing incomes lead to growing
local demand (Hardoy and Satterthwaite, 1986).
In the 1950s and 1960s, small towns were generally seen as playing a positive role in
development as the centers from which innovation and modernization would trickle down to the
rural populations. A more recent and highly influential contribution to this positive view was the
development of the concept of “urban functions in rural development” (Renkow et al, 2004); for
which the most effective and rational spatial strategy for promoting rural development was to
develop a well articulated, integrated and balanced urban hierarchy. This network of small,
medium sized and large urban centers was described as “...locationally efficient” - it allowed
clusters of services, facilities and infrastructure that cannot be economically located in small
villages and hamlets to serve a widely dispersed population from an accessible central place”
(Rondinelli, 1985). The location of more service supply points supplying a variety of services,
agricultural inputs and consumer goods to the rural areas was seen as playing a crucial role in
rural development.
While this approach has been widely used by large international donors such as USAID, and still
influences more recent regional planning models, Hardoy and Satterthwaite, (1986), and Morris,
(1997), however, criticized the strategy on the grounds that low rural consumption was caused by
social inequality and low incomes rather than by difficult access to supply. The main argument,
echoing the “urban bias” debate, was that small towns contributed to rural impoverishment as
they were “vanguards of exploitation” of the rural poor by external forces which, according to
the case, may be colonial powers, multinational enterprises, central national government, local
administrators and elites and, in some cases, international donors. Southall (1988:5) argues that,
when there is relative egalitarian class structure and free access to land, and “...where the
stimulus to urban growth results in activity primarily by the people and for themselves, small
scale urbanization could be beneficial locally”. However, Hardoy and Satterthwaite (1986)
contest that universal generalizations and prescriptions, which formed the basis of most spatial
planning models, were not valid.
Therefore, centralized policies may not be efficient since they cannot take into account the
peculiarities and specifics of small towns and their regions. What is needed instead is real
56
decentralization of decision-making, with investment and resource-raising at the local level
which will allow the articulation of local needs and priorities and which will stimulate both rural
and urban development. Moreover, wider socio-economic issues are also likely to affect small
towns and, by extension, migration to larger cities.
Rural-urban relations and the potentially important role of small towns gained considerable
prominence in international development research and policy experimentation in the 1970s. The
theoretical discussions, as well as national policy changes, were influenced by a succession of
national and regional development theories and policies on the most appropriate urbanization
strategies as part of the transformation of agricultural into industrial-based economies. One of the
most important concepts is the Economic rationale for focusing on small and intermediate-sized
towns.
Small town functions
Rural areas’ linkage with economic and social sectors in rural towns, towns and cities can lead to
strong rural development and vice versa. This rural-urban linkage manifests itself in many ways.
Labour movement, input, output and information flows are among the major linkage elements
(Braun, 2008).
Forward linkages exhibited by the flow of farm and non-farm outputs for consumption and
production purposes in rural towns and towns are useful for creating marketing outlets (demand)
for rural households. One of the objectives of this study is to investigate the role of SMEs in small
towns in forward linkages. On the other hand, backward linkages enable the flow of inputs,
management skills, technologies an information and credit towards the agricultural and rural
non-farm sector (Tadesse, 2012). One of the objectives of this study is to investigate the role of
SMEs in small towns in backward linkages.
In this regard, rural areas’ economy is often closely interwoven with economic activities in small
towns and cities. The linkages with small towns are so pervasive that the structure of the rural
economy can vary in response to the economic and social functions in towns. This is because the
economic structure of small towns reflects the capacity of local regions to capture forward and
backward linkages and their multiplier effects (Douglass, 1998).
57
The combined effect of strong forward and backward linkages can therefore be instrumental in
increasing agricultural production and productivity, which eventually helps foster rural
development. Moreover, it can help create farm and non-farm employment opportunities and
income, which contribute to poverty reduction and development in rural areas.
The contribution of rural-urban linkage (through forward and backward linkages) to poverty
reduction and rural development rests on several factors. Land tenure systems, technology of
production and management capabilities are some of the factors that determine agricultural
production and rural development (Perkins et al., 2001). Markets, credit (and finance) and
infrastructure are among the other vital elements that harness forward and backward linkages and
contribute to rural welfare improvement (Isgut, 2004 and Todaro and Smith, 2009 as quoted by
Tadesse, 2012).
Many rural areas however have few or none of the most important functions that contribute to
strengthening forward and backward linkages. Missing functions in rural areas can affect
economic activities and rural development in many ways. However, small towns situated near to
rural areas can contribute to bridging part of that gap and play a significant role in facilitating
rural development (Fan et al., 2005).
One major contribution that small towns make is that they act as bridges to higher-order towns
and cities. In addition, they provide infrastructures and institutions that are physically connected
to the rural areas. All These services can be termed a small town functions (Tadesse, 2012).
Linkages that exist between rural and urban areas are best understood by examining the functions
of urban center (Mugambi, 2004). The functions of urban centers can broadly be classified as
economic, social, administrative, cultural and political it is also important to note that urban
centers are centers of public and social services; commercial and personal services; regional
marketing and trade; agro-processing and supply; large and small scale industry; regional
transport and communication; attraction for rural migrants and sources of income remittance; and
centers of social transformation. It is through these functions of urban centers that rural-urban
linkages occur (UNCHS- Habitat, 1995).
Freidman, 1992, observes that small towns typically have certain elements that are not found
everywhere in the surrounding rural areas, and they are the traditional signs of such ‘natural’
rural-urban relations;these have also been the subject of serious geographic, economic and social
research for many years: a market (permanent, and periodic, such as once a week); specialized
58
shops; an institution of the state (such as the court, or a district hospital); a school above the
elementary level; places of entertainment (such as a cinema); and workshops that assemble and
repair tools and machines used by farmers.
The important point to be made here is that such highly generalized indicators of ‘centrality’ of a
town need to be specified in such a way that they truly reflect the regional conditions at the time
of the analysis. Conditions change over time, and comparisons across regions or countries are not
easy. Therefore, some functions that would be rare, and thus, ‘central’ at an early stage may not
be rated as central fifteen or twenty years later. Some of the most significant small town
functions are markets and transport infrastructure as discussed below.
Market centers
Market centers perform many social roles in rural areas. In many African countries, economic
exchange grew out of traditional social gatherings and rituals. The types and frequency of
economic activities were closely linked to social events because traditional African markets
provided an important locus of social interaction (Muendo, 2004).
On his study on town functions in 2012, Tadesse found that market is an important small town
function that has a significant influence on income of both rural and small towns’ economic
activities, the further the market, the lower the probability in participation in trade activities. In
addition to being a source of consumption goods, accessible markets can be a vital outlet for both
consumables and consumables goods. Kimani and Talor (1973) discovered that period marker
centers in the Central Province of Kenya were important meeting places for rural communities
and social satisfaction were major functions of urban centers.
The transport infrastructure
Roads and transport facilities are among the vital establishments that facilitate interactions
among economic agents and can lead to higher income (Tadesse, 2012). Lanjouw et al. (2001)
stress that roads and transport are core infrastructural facilities that significantly contribute to
income from both formal and informal sectors. The role they play in improving consumption and
welfare is particularly emphasized. Furthermore, road type and quality is found to play
significant role in enabling increased market participation and intensity of marketing (Tadesse,
2012).
59
Interaction of small towns and big urban centers (cities).
New urban policies should not only focus on links between the small town and the rural areas but
also focus on the link between the small and large towns/cities (Muendo, 2004). The current
study, analyzes how the SMEs in small towns interact with other small, medium and big cities.
Cities are engines of economic growth and social development, drawing in human resources and
raw materials, which, coupled with superior urban infrastructure, have spurred industrial and
commercial development almost everywhere. Cities are not only places where capital is
accumulated and reinvested in new sectors, but also the nodal points of specialized services. As
service jobs have become increasingly important in national economies the importance of cities
in economic performance is strengthened. Both industrial and traditional service activities, along
with new services related to banking, finance and communication, constitute the new economic
base of cities.
These activities generate the major sources of government revenue, through various categories of
taxes, rents and fees (Ouma, 2004). Cities serve a primary economic function as the locations
where new forms of economic activity and economic organization evolve and gain higher value.
They are not merely places where commodities are traded and new markets explored, but they
are also centres of changes in the social division of labour. But with globalization, competition
between cities has intensified, and increasingly they battle with each other to attract international
investment (Ouma, 2004).
Cities provide economies of scalar and agglomeration, as well as the economic and social
infrastructure within which many businesses and entrepreneurships are incubated and nurtured.
They provide infrastructure for investments that support not only urban development, but which
also stimulate wider development through urban- rural trading. Urban markets provide powerful
incentives for rural production and income enhancement. Expanding rural markets, in turn,
provide powerful incentives for increased production of manufactured goods and services in the
cities.
Large cities typically produce a significant share of the gross domestic product (GDP) of their
countries (Ouma, 2004).The urban economy is the hub and nerve centers of the national
economy and, as the global society expands, a nation’s welfare will be determined increasingly
by the roles its cities play in the global economy. Cities serve a primary economic function as the
locations where new forms of economic activity and economic organization evolve and gain
60
higher value. They are not merely places where commodities are traded and new markets
explored, but they are also centers of changes in the social division of labour. But with
globalization, competition between cities has intensified, and increasingly they battle with each
other to attract international investment (Ouma, 2004).
Employment and Income in small towns
Urban economies generate significant employments in both formal and informal sectors.
Although the formal sector generally pays higher salaries, it employs a relatively small
proportion of the urban labour force in most developing countries. The informal sectors known
locally as “Jua Kali”, and known elsewhere as the home craft industry, with its lower wages,
frequently employs a greater share – if not the bulk – of the urban labour force in Kenya, a
common phenomenon in developing countries. Informal sector employment is known to grow
even at times when employment in the formal sector is stagnant. This phenomenon is one of the
principal ways in which labour markets in African countries have adjusted to economic crises. It
is worth noting that informal employment contributes to as high as 55 per cent of the total labour
force in Kenya. Considerable variations in the importance of the informal sector exist between
countries in any region. Cities support the informal sector through the provision and maintenance
of infrastructure, including adequate supply of electric power, water, transport and
telecommunications networks. They also provide well-located work sites for informal sector
entrepreneurs. By relaxing rules and regulations, the informal sector can be expected to
contribute further to the creation of new jobs (Ouma, 2004).
While poverty is increasingly becoming an urban phenomenon – particularly in developing
countries and disproportionately among women, urban populations on the whole are still
relatively better-off than most rural inhabitants in terms of cash income and access to basic social
services. However, poverty in urban areas produces particular problems of its own, in that urban
dwellers often lack the life support mechanisms available in rural areas. However, through
community Based Organizations (CBOs), church based organization, self-help groups and
Microfinance institutions (like K-Rep and Faulu Kenya, among others) some significant form of
poverty alleviation and improved lifestyles have been witnessed (Ouma, 2004).
As countries move through the development process, agriculture declines as a share of gross
domestic product (GDP), and manufacturing and services begin to dominate the economy. Goods

61
and services are often produced most efficiently in densely populated areas that provide access to
a poor of skilled labour, a network of commentary firms that act as suppliers, and a critical mass
of customers. For this reason sustained economic growth is always accompanied by urbanization.
Globalization and localization have not diminished the importance or the pace of the
urbanization process. Why does urbanization remain such an important trend? Although
globalization opens up new possibilities for linkages around the world, it also reinforces certain
advantages of proximity. This is particularly true in Kenya, where access to the opportunities
offered by globalization is much greater in cities. The growth of urban populations in both large
capitals cities and smaller municipalities feeds demand for increased localization of political
power. It puts pressure on national institutions of governance and encourages them to take the
steps towards decentralization. It makes the success of decentralization perhaps even more
important. When urban governments have the power and ability to enact a development agenda,
they can help the citizens of their cities hook up with the global economy. These cities then
become reliable links in the global production chain and attractive destinations for foreign
investment. Urbanization is integral to development, but it also presents difficult challenges. The
growth sectors of the economy- manufacturing and services are usually concentrated in cities,
where they benefit from agglomeration economies and ample markets for inputs, outputs, and
labour, and where ideas and knowledge are rapidly diffused (Ouma, 2004).
The way cities manage development, including the arrival of industries, goes far in determining
the rate of economic growth. Urban governments can foster economic development or they can
slow it down. Examining the urban process – the agglomerative forces and location inducements
that shape cities – is a useful way of identifying what role governments should play (Muendo,
2006).
The small enterprises and rural-urban linkages
According to Mulligan (1984:32), “the small town can be seen as a way of organizing economic
activities or enterprises in space. Thus, the theoretical view of the small town depends to a large
extent on the view of the enterprise and the way it interacts with its environment. Classical
location theories however, assumed enterprises to be independent entities operating in a
homogeneous free market. To explain the spatial concentration of enterprises in towns they
invented the concept of agglomeration economies. Where small and large industries are linked
62
and networked and the small enterprises are seen as complementary to the large rather than
alternative to them”.
Johanson and Mattson (1986: 9) point out that the “small enterprises will often be dependent on
one or more of the large enterprises. But at the same time, the productivity of the large enterprise
will often depend on the existence, not of a specific small enterprise, but of a network of small
service, trade and production enterprises. The small/informal enterprise is viewed as operating in
interaction with other small and large enterprises and public authorities, in an interplay which in
some situations may lead to dependency, but in others may lead to considerable autonomy”.
They therefore concludes that “the dependency between enterprises is seen as determined not
only by ownership and size, but also by many other often qualitative factors such as technology,
market and financial relations”.
This new conception of the enterprise changes the understanding of the small enterprise in
relation to macro environment, for example, the small town. According to Pedersen (1990), “the
paradox of location theory is that the cheaper transport and communication becomes, and
therefore the more footloose production becomes, the more important local production costs will
be for the location of industry. And these production costs are increasingly determined not only
by labor costs, but also by easy access to services which can secure a high productivity and
capacity utilization of production”. It is this paradox, as Pedersen suggests that must be resolved
in order to understand the development process of the developing countries in terms of both
individual enterprise and role of small towns. The current study looks at the transport and
communication network of the small towns in question.
The small enterprises are well known to operate within their local footprints in terms of supply
and customer base. According to Johanson and Mattson (1986: 26) “the enterprises usually cater
primarily to the local market in the town and its hinterland, and are better able to adapt to local
market conditions. They are often also more dependent on the local supply of inputs and services
than the large enterprises and their local branches which often obtain such services from their
own hierarchy”.
63
However, the fact that the small enterprises cater primarily for the local market does not mean
that they only operate with local contacts. This argument is extended by Freeman and Norcliffe
(1985:11) who point out that the “small enterprises function often as mediators between the local
market and outside sources of consumer goods, production inputs and information. These outside
connections may be provided by a series of middlemen or wholesalers up through the urban
hierarchy, or they may be provided by one of the large organizations”. The current study aims at
extending this argument by quantifying the trade volume in both forward and backward linkages
in small towns in question.
Though as pointed out by Freeman and Norcliffe that outside connections may be provided by a
series of middlemen or wholesalers up through the urban hierarchy, or they may be provided by
one of the large organizations ,there are numerous more occasions where some activities may not
be economically viable for them and so small enterprises takes up the advantage. Also, as
Pedersen (1990: 11) suggests, “the large organizations may cheaply provide a limited range of
standardized services and though the small enterprises are often more expensive, but on the other
hand may offer a wider range of different services. But this might not be the case in developing
countries who mostly subsidized the large organizations to attract FDI and where there is limited
supply of resources”.
However, as Pedersen concludes “if the market for the small enterprises expands, it may become
attractive for the large organizations to go in direct competition and attempt to take over the
market, for example, by establishing local branches. The large-scale sector may also, especially
where it is governmental or parastatal, attempt to monopolize the market through legislation. In
other cases, the small enterprises may be directly linked to the large enterprises or organizations,
either as subcontractors or by processing inputs or distributing products produced by them. The
contact between the peripheral rural region and the outside world, and the development or
exploitation it results in, thus follows either the "open" urban network and the infrastructure and
agglomeration economies it offers, or the internal and often closed networks of the large
organizations. Of course, these organizational networks follow in many cases the structure of the
urban system; but in other cases, the large formal organizations may be large and powerful
enough to create their own networks, often short-cutting the lower levels of the urban hierarchy”.
64
Thus, although the urban network and the large organizational networks are linked together, they
are not identical, and both are decisive for the development of the peripheral region.
Rural Functions in Urban SMEs
The GOK (2008) policy paper “Growth and poverty reduction: the role of agriculture” sees a
major role for agriculture in development through the linkages of the agricultural with the non-
agricultural sector. Agricultural growth can lead to strong multiplier effects in the non-farm
economy.
Baulch and Hoddinott (2000) calculated the economic growth multiplier associated with
additional agricultural income in Kenya and found it to be nearly three times the magnitude of
the growth multiplier for non-agriculture. A dollar of agricultural income generates an additional
$0.63 of income outside the agricultural sector, while a dollar of non-agricultural income
generates only $0.23 of income in the wider economy.
Some village economies, especially crop and livestock production have been known to have a
high multiplier effect in urban economic growth. However, the ability of urban SMEs to respond
to demand depends on both macro and micro factors and more particularly on marketing
conditions, transport and communication networks, transaction costs and internal and external
competition. The following presents, some rural functions in urban growth.
Land use and land ownership
How rural functions impacts on the urban economic growth are affected by the land use and
ownership structure. In developing Countries, the continued expansion of urban boundaries has
seen a decrease of agricultural activities in areas close to towns. Where peri-urban agriculture
still exists, the proximity to the large and able urban market coupled with decreased transport
cost ensures a high return. Such activities always have a comparative advantage over far off rural
activities as they also ensure a constant supply of fresh perishable produce to the urban market.
However, as the value of land goes up, farming takes second option as the farmer opts to sell the
land or even risks eviction. On the other hand, land loses its economic viability as it exchanges
ownership from one generation to the other despite the proximity to urban market. The
65
subdivisions into smaller and smaller plots only leave room for subsistence farming and
therefore no meaningful economic interaction with urban economy.
Non-farm employment
In the recent past, there has been a substantive evidence that small scale commercial and
subsistence farmers do engage in a second source of income inform of non- farm activities to
make ends meet. This is contrary to the long time assumption that opportunities outside the
agricultural sector were limited and therefore the labor market was incomplete. It is estimated
that rural non-farm income presents on average 42% of rural income in Africa, 32% in Asia and
40% in Latin America. Apart from eking the farmers income, the non -farm activities reduces the
amount of “surplus labour” in rural areas and allows rural households to earn other sources of
income. Non-farm income is increasingly an important source of revenue in rural areas, even in
traditional subsistence areas such as many regions in Sub-Sahara Africa.
Taddesse, (2002:95) suggests “when opting for non-farm labor, farm households can be
motivated by “pull” or “push” factors. Pull factors include better returns in the non-farm sector
relative to the farm sector. Pull factors include an inadequate farm output (either because of short
term reasons, e.g. drought, or long term reasons, e.g. land constraints), an absence of or
incomplete crop insurance and consumption credit market, risks of farming, inducing households
to diversify, an absence or failure of farm input markets or input credit markets which means
households need to pay for inputs with their own cash resources. The fact that farm households
engage in non-farm employment therefore can be a positive sign when pull factors are involved,
which means possibilities exist for economic development outside the farm sector”. Therefore
where impetus arises from push factors, it is rather an indication of the poor economic condition
of the rural sector, rather than offering a real possibility of improving the economic situation of
the farm household.
But even when push factors are involved, (Reardon 1998: 19) argues that “it will be the non-poor
households rather than the poor ones who will diversify their income sources more, because they
are in a better position to self-finance this diversification. When labour markets are increasingly
linked, induced by better infrastructure and commuting, subcontracting, and location of agro-
66
industrial enterprises in rural or peri-urban regions, forces outside the rural economy will
influence the labor use and overall sectoral composition of the rural non-farm economy”.
When there is an increase in labour demand due to a boom in a certain industry local wages can
be raised in rural economies. Good examples are as in the case of oil industry in Nigeria in 1980s
and the textile industry in China. The boom can either induce investments in labour-saving
technologies or labour extensive activities. China is a case in point (as explained by Tadesse,) its
rapidly developing industrial sector has attracted large numbers of cheap labour, mainly from the
rural countryside. Here labour is often a constraint, and farmers switch to crops that are less
labour intensive, such as rice. Households whose members have migrated (temporarily) to cities
often shift to one-season rice, which induces a stronger shift to two-season rice by households
lacking access to this type of off-farm employment. An increasing flow of migrants to the city
will thus magnify the shift away from rice and towards capital intensive but labour extensive
livestock production.
Capital
Raising funds for investment in the rural areas of mostly developing countries is an uphill task.
Apart from lack of interest from their small home savings, the farmers lack collateral or they
may be in need of little money to borrow from investors. According to Tadesse, “non-farm cash
income can bridge this gap. In times of crop failure, non-farm income can fill the food deficit.
Other mechanisms are contract farming whereby the buyer of produce will pre-finance inputs
such as fertilizer” (2002).
Of late there has been renewed interest in rural micro credit. This noble idea was started by
Prof. Mohammed Yunus, the initiator of the Grahmin Bank, which is credited with improving
the lives of poor rural people in Bangladesh. Such initiatives can also uplift the rural poor by
bridging the financial gap as they may not have access to the formal banks as the amounts they
want to borrow are too small or they cannot provide any collateral.
Inclusion and exclusion: the role of small farms
Taddesse (2002: 95) suggests that “small farms can be drivers of change and play an important
role in the rural economy, but at the same time may be left behind in the current rapid economic
developments characterized by globalization, vertical change integration etc. The position of
67
poor rural households is also influenced by the fact that agricultural markets are characterized by
large distortions, both domestically and internationally”.
Dow and Norton (2003:12) argue that the “new economy (characterized by globalization of
trade, financial flows and institutions) can both provide opportunities and threats to poor farmers
in developing countries. One of the threats is that poor smallholder households get locked out of
markets due to slow progress in participation of their country in the global economy. Another
reason is the physical and institutional isolation of poor households in rural areas. Furthermore,
Dow and Norton adds, ‘the fact that poor households have access to local, national and
international markets does not always mean that they can benefit from this access, since a
number of institutional deficiencies limit smallholder areas from taking advantage of market
opportunities: inadequate access to information, contractual enforcement and finance”.
One major question is how agriculture as a driver of change will impact on rural livelihoods
more so the rural poor. The small farm factor will to some extend determine if the rural
households benefit from economic development or are they left behind, widening the gap
between rich and poor.
The debate is also live about who mainly constitutes the rural poor between the small farmers
and the rural landless who involve in non-farm activities. According to Taddese “there has been
an assumption that the rural poor are also small farmers and that the emphasis has been on
supporting small scale-farming”. However, Barrett (2008:7) points out that “this view has been
criticized because it is the rural landless that often constitute the poor and these derive their
income from the non-agricultural sector”.
Majority of the small-scale farmers have been engaging in non-farm activities to diversify their
revenues. Though a noble idea, the problem is that they are not and at the same time investing in
agriculture at this time when the demands on agricultural production in terms of technology and
product quality are increasing. They therefore find do not maximize the returns from farming as
agriculture is no longer their main focus.
68
Taddese however indicates that “the only part of agriculture in developing countries that will
continue to grow significantly faster than population in the next twenty years is the high value
sector. The implications for the vast mass of smallholder farmers are sobering: to significantly
improve their incomes per capita over the next twenty years, they must either be part of the shift
to high-value agricultural production or increase the share of income they get from non-
agricultural sources”. Furthermore, he adds, the analysis in the preceding section suggests that
unless smallholders become vertically integrated with processors and retailers, they will
increasingly have difficulties in participating in increasingly more demanding high-value
markets (Taddese 2002: 96).
Korpi (1997) found preliminary evidence that this also means they do not invest non-farm
income into agriculture (e.g. by buying fertilizer). Another implication is that they are more
likely to invest in food crops (for their own consumption) and not in high value cash crops.
Pretty and Hine (2003) suggest that the case for the efficiency of smallholder farming may be
“breaking down, where globalization intrudes, non-traditional crops are promoted, and
agricultural modernization involved increasing use of capital”.
There is also a debate that small farms cannot live up to the current challenges in agriculture.
Meijerink and Roza (2007: 15) argue that “new technology is often capital-based and requires
certain skills that are beyond the scope of many small farmers. In general small farmers pay
more for inputs and receive less for outputs than large farms, thus decreasing their rates of return.
The high value chains impose quality and timeliness requirements that are difficult to comply
with for small farmers. Vertical coordination has been identified as an important development for
agricultural development. Evidence suggests that private vertical coordination (VC) efforts can
yield important positive effects. Farmers that are involved in such VC schemes have experienced
beneficial effects on output, productivity and product quality, and ultimately also on incomes
through improved access to inputs, timely payments, and investments. But not all farmers can
participate in these schemes”. Meijerink and Roza identify two potential equity issues with VC
schemes. The first concerns the inclusion or exclusion of small farms in contract farming. The
second concerns the distribution of rents within vertically coordinated food supply chains
69
In the first one they argue that VC can bring several benefits to farm households, including
higher welfare, more stable incomes and shorter lean periods. But there are several reasons why
contracting firms might prefer to contract wealthier farmers, thus leaving out small farms.
Contracting larger farms in supply chains reduces transaction costs (firms have to deal with a
few large forms instead of many small ones). When some amount of investment is needed in
order to be able to supply the firm, small farms may not be able to do so, being more constrained
in their financial means. These reasons would work against small farms. In some cases firms do
contract small farms. Sometimes, these firms have no choice – small farmers represent the vast
majority of the potential supply base. Some firms may choose to prefer a mix of suppliers in
order not to become too dependent on a few large suppliers. Even when firms contract small
farms, these will still constitute a minority in the total population of small farms. Many others are
still excluded.
Their (Meijerink & Roza) second development in VC is the shift from contract farming (of large
or small farms) to fully integrating production and agro-industrial holdings. This shift is often in
response to increasingly stringent food standards. Small farms lose out in this shift, but
employment opportunities are increased, which may benefit poor households or the landless.
Thus (Self and Grabowski (2007) as quoted by Meijerink and Roza) conclude that in
combination, contract-farming and agro-industrial employment are significantly positive,
reaching different groups of poor.
Meijerink and Roza conclude that “the options for small farms to participate in profitable
markets but do not participate in beneficial VC schemes are limited. In the section on non-farm
income, we have seen that this constitutes an important livelihood strategy of small and poor
farms. The rural as well as urban non-farm employment often does not represent substantially
more profitable income opportunities, although they can help diversify incomes. In many cases,
push factors drive farmers to seek alternative income generating activities. A move out of
agriculture is therefore not an option for many of these small-scale farmers. In the mid 20th
century in Europe, many farmers left the agricultural sector to work in upcoming industries (e.g.
textile). The land they left was taken up by farmers who could increase their farm and become
more competitive. In many developing countries however, this movement cannot be perceived.
70
Because the non-farm employment sector is either not sufficiently profitable or uncertain, rural
households maintain their plots of land as a security, often extensively managed”.
According to Satterthwaite (2000:31), “many poor households have livelihoods that draw on
rural and urban resources or opportunities. Urban and rural areas are closely linked, each
contributing to the other, which needs to be considered in development planning. Many fast
growing cities are within areas with the most rapid increase in the value of agricultural
production. For instance, the urban centers serving areas producing: high value fruit or
vegetables, coffee or tea and other high value crops such as silk cocoons. Factors relating to
agriculture influencing the prosperity of most such urban centers includes: the value per hectare
of the crops (the higher the value, the more local urban development), the potential for local
value added and the scale of forward and backward multiplier linkages and lastly the land
owning structure with the perfect stimulus to local urban development being lots of prosperous
relatively small farms growing high value crops”.
On the other hand, Satterthwaite (2000: 36) concludes that “rural areas are very important for
many urban households. A proportion of the urban poor derive some/all of their livelihoods from
meeting rural demand, many poor urban dwellers rely on seasonal employment in agriculture,
many poor urban dwellers move back to rural areas when times are particularly hard, many urban
dwellers have relations with rural dwellers to guarantee their food supply. Many urban dwellers
also retain key assets in rural areas and rely on rural dwellers to protect their land, crops or
livestock or to provide their children with homes (or even access to schools when urban schools
are bad or expensive”.
71
Conclusions on the Chapter
Governments all over the world have undergone metamorphosis from older traditional ones such
as federalism, monarchy and chiefdoms to more democratic and all inclusive structures such as
centralization (where most of the power and national funds are centralized), and decentralization
(where power and national funds are devolved to smaller administrative units). The
metamorphosis have been necessitated by among other things the need to achieve economic
development. However, to achieve such a milestone especially in the less developed and
developing countries, more is called for in terms of equitable distribution of resources and
power.
Decentralization which is contrary to Centralization, takes a paradigm approach towards a
sustained economic development. Through decentralization, the local economies are empowered
and the locals have the power to determine their most urgent and important community needs by
financing by either the Local or Central governments. In Africa, Kenya lies number three as the
most decentralized country after South Africa and Uganda. The impact of decentralization is
expected to be highly felt with the promulgation of the new constitution which devolves some
powers and National funds to the 47 counties administrative regions.
However, there is need to marry up decentralization with the new approach to the economic
development- rural-urban linkages. Though a number of developing countries are in the process
of devolvement few have accepted the spirit of integrated urban and rural development and still
consider the development of rural areas different from the urban ones, with the latter getting
emphasis at the expense of the former. This has led to economic inequalities in the two areas
with far less developed and neglected rural areas. Rural urban linkages concept calls for
transformation of rural areas through exploitation of the rural resources (both farm and non-
farm). This can be achieved through enhancing the economic activities in the nearby small towns
which link directly to their rural hinterlands.
The Small and Medium Enterprises in these towns forms important nodes as they usually cater
primarily to the local market in the town and its hinterland, and are better able to adapt to local
market conditions. They are often also more dependent on the local supply of inputs and services

72
than the large enterprises and their local branches. The SMEs in the said towns also forward and
back link the rural areas with Regional, National and International markets. Therefore, enhanced
SME activities in small towns could form an integrated symbiotic relationship which ensures
continuous two-way flow of benefits from cities to rural areas on a sustainable basis.
73
CHAPTER 1D
THESIS METHODOLOGY
Introduction
This chapter comprehensively covers the research methods used in this study. It endeavors to
answer the obvious but fundamental question: “how was the research conducted?” To achieve
this, the chapter elaborates on the research set-up, units of research and analysis, sampling
procedures and the methods of data collection. In addition, the chapter provides insight into the
researcher’s field experiences and data analysis considerations. It then concludes by high-
lighting some selected characteristics of the sampled households.
Research Design
Research design is the plan and structure of investigation that enables the researcher to obtain
answers to the research question (Kerlinger, 1986). The choice of a research design is guided by
the purpose of the study, the type of investigation, the extent of researcher involvement, the stage
of knowledge in the field, the time period over which the data is to be collected and the type of
analysis to be carried out, that is, whether quantitative or qualitative (Sekaran, 2003). In social
sciences research, there are five main research strategies commonly used, namely experiments,
surveys, archival analysis, histories, and case study. According to Yin (1994), each strategy has
peculiar advantages and disadvantages depending on: the type of research questions; the control
a researcher has over behavioural events; and the level of focus on contemporary events versus
the focus on historical events.
Based upon the nature of the research problem and the research questions, descriptive survey
design was considered appropriate for this study. Survey design collects data on various
variables as found in the systems and deals with coincidences and relationships (Verma and
Verma, 2004). According to Kothari (2005), descriptive design describes the present status of a
phenomenon, determining the nature of the prevailing conditions, practices, attitudes and seeking
accurate descriptions. The design was therefore, effective for the study as it explores on the role
74
played by actors in small business in rural-urban linkages and seeks to identify any links between
the actors and relevant stakeholders.
A mixed method approach (quantitative and qualitative) was used to gather both primary and
secondary data. The method offers enormous potential for exploring new dimensions of
experience in social life, and intersections between them (Amazon, 2006). Quantitative research
methods deal with the measurement of concepts with scales that either directly or indirectly
provides numeric values (Zikmund et al., 2010). These numeric values are then used for
statistical computation and hypothesis testing. Further, through hypothesis testing,
Quantitative research methods determine the generalisability of the data from the sample to the
population. This type of research generates statistical data through the use of fairly large scale
survey research collected through questionnaires or structured interviews. In order to gather
standard information, from the much distributed SMEs in both towns, structured questioners
were administered.
Qualitative research, on the other hand, involves the interpretation of phenomena without
depending on numerical measurements or statistical methods. It is mainly concerned with
observing, listening and interpreting phenomena (Zikmund et al., 2010). The main data
collection method is through in-depth interviews, observations or focus groups. Whilst
qualitative researchers review transcripts, interview recordings, notes of focus groups or
participant research, those who favor quantitative methods rely on statistical techniques aided by
software packages. In the current study, six in-depth interviews were held, three in each town. In
order to improve accuracy of the data collected, Triangulation of methods was also used where
observation were combined with interviews.
General approach and sampling procedures
The fieldwork for this study was carried out in two phases between 2010 and 2011. The first
phase was a general survey of 200 SMEs using a standardized pre-coded questionnaire. Before
that, literature research was done on the topic to gain a clearer perspective and deeper
understanding of the research problem presented in Chapter 1A. The second phase consisted of
in-depth inter-views or case studies with Market Masters, Town Revenue Officers and one trader
from each town.
75
Selection of SMEs for the general survey
Based on a representative sample and using the SMEs as the unit of research, the general survey
aimed at generating quantitative data to obtain overall information on: (a) demographic
characteristics, (b) nature and status of the business e.g. source of supply, clientele base and
chain of trade, (c) job creation (d) entrepreneur parse e.g. push or pull factors to business, source
of capital, relevant training in business, interest in mentoring and tax advice, number of
dependants and where they lived, visitation of family members, entrepreneur’s visits to other
family members and interaction with other stakeholders vis a vis municipal council public and
private organizations and NGOs.
Bearing in mind that, SMEs in both towns are scattered in buildings, streets and in the market
and that they fall into service, trade and manufacturing categories, an all inclusive and
representative sampling process was required. To achieve this, a multi stage cluster proportionate
random and simple random sampling procedures were used. The steps in this process involved
systematically answering the following questions related to the sampling design.
(1) How were clusters defined?
For Karatina, the town was sub divided into 14 clusters for the purpose of this study. This
excluded the shoe’s market; potatoes and main market. The clusters were assumed to have
similar characteristics in terms of location of the businesses (both building and street businesses)
and inclusive of all the three categories of SMEs. In the first stage, 4 clusters were selected from
the 14 clusters using simple random sampling. All the businesses in the selected clusters were
eligible to be interviewed. However, due non-cooperation and non availability of some
respondents, a multi stage cluster random process was conducted without replacement till the
desired respondents were achieved. In the three markets, Simple random sampling was used to
choose the respondents.
Due to its small size in terms of the economic activities, Sagana town was divided into 10
clusters. In the first stage, 3 clusters were randomly chosen, and this was followed by multi stage
cluster random process till the desired respondents were interviewed. In the market (Sagana has
only one market), traders were randomly selected to participate in the interview.
76
(2) How many SMEs were interviewed?
Even with a mathematical formula, there are no universal laws about the sample size (Mugenda
and Mugenda, 1999). However, guiding principles do exist. Guided by previous experience in
CREATING and CORUS programs, available resources (financial, human and time) and going
by the fact that a number of small businesses remain unregistered in Kenya, we decided on a
workable sample of 200 SMEs. In Karatina, 130 questioners were administered, with 100 being
in the clusters while the rest was done from main food market (20) and five (5) each from the
shoes and potatoes markets. In Sagana, a total of 70 respondents were interviewed, 50 coming
from the clusters and 20 from the only market in the town. In our view, the combined figure of
200 was an optimum sample that fulfilled the requirements of efficiency, representativeness,
reliability and flexibility and also manageable given the available resources and time.
3) Selection of respondents for in-depth interviews
Purposive sampling was used in the selection of respondents for the in-depth interviews.
Purposive sampling is a sampling technique that allows a researcher to use cases that have
required information with respect to the objectives of the study (Mugenda and Mugenda, 1999).
Eight (8) respondents (4 from each town) were selected. These included Revenue Officers from
the local authorities, Market Masters, one trader and a client from each town. Though Karatina
has 3 markets as earlier mentioned, they are all served by one Market Master. For the traders and
the customers, the researcher established a rapport with them during a formalization tour in the
study area and kept in touch with them in the whole research process.
Methods of data collection
The traders’ general survey
Data collection for the general survey was carried out from April to June 2010 and June to July
2011. A standardized pre-coded questionnaire was used for the survey. The survey was preceded
by an intensive period of re-familiarization with Sagana and Karatina town, developing the
sampling design, pre-testing the questioner and training the four field assistants. Having been
involved in CREATING and CORUS programs, the researcher had research experience in SMEs
in mountainous areas in East Africa. The programs dealt on research in mountainous regions in
Mt. Elgon (Uganda), Rungwe Mountains (Tanzania) and Mt. Kenya (Kenya). Using locals as
77
field assistants, it was easy to established rapport with respondents after a brief introduction.
Expect for very few cases, the respondents were willing to collaborate with the research team
and offer the information required as they understood the importance of the research. Further, the
research permit obtained from the Provincial local authority Officer at Nyeri (Appendix 2) had
directed the town clerks in Sagana and Karatina to offer the researcher any possible assistance.
This worked well in the markets and Municipal Council’s offices where the Town clerks
introduced us to the respective Staff Officers and Market Masters. The respondents to the
questioner were only the owners of the business.
The general survey questionnaire
The general survey questionnaire was developed from review of the relevant literature,
discussion with my supervisors and from earlier fieldwork experiences. The questioner which is
presented in Appendix 3 was organized in four main sections. The first part consisted of
questions regarding the trader’s demographic characteristics; sex, age, marital status and level of
education. The second part was on the nature of the business. This was the largest part of the
questionnaire and consisted of questions dealing with characteristics of the business; location,
category, registration, source of supply, clients, chain of trade and monthly turnover. The third
section was on job creation. This section sought information on the number of employees, where
they came from, and how much they earned per month. The fourth part was on the entrepreneur
(the business owner).The section targeted information on push or pull factors to business, source
of capital, relevant training in business, interest in mentoring and tax advice, number of
dependants and where they lived, visitation of family members, entrepreneurs visits to other
family members and interaction with other stakeholders vis a vis municipal council public and
private organizations and NGOs.
Piloting
Following the development of the questionnaire, a pilot study was carried out to ensure that the
items in the questionnaire were stated clearly, had the same meaning to all the respondents, and
also to give the researcher an idea of approximately how long it would take to complete the
questionnaire. According to Mugenda and Mugenda (1999), pre-testing of the instruments
ensures that items in the instrument are stated clearly and have the same meaning to all

78
respondents. A total of 30 questioners were administered and the respondents were informed that
the questionnaire was a pilot for a larger study. The data obtained was analyzed and the results
formed part of the final results of this study.
Validity of the questionnaire
The study instrument was content-validated. According to Donald and Pamela (2001), content
validity is determined by an expert judgment. The university supervisors scrutinized the
instruments to find out whether they addressed all the five specific objectives of the study that
they intend to measure and ensure its appropriateness, completeness and accuracy. They were
relied upon to determine whether items in the instrument were adequate representation of all the
areas that are under investigation.
Reliability of questionnaire
Reliability is a measure of the degree to which a research instrument yields consistent results or
data after repeated trials. Kothari (2009), reliability refers to consistency of measurement; the
more reliable an instrument is, the more consistent the measure. The researcher used split-half
procedure to test the reliability of the questionnaire through piloting. The split-half reliability
technique involves splitting items in a scale into two halves and correlating the results of each
half with each other. If the correlations are high, then both parts of the scale are deemed to be
measuring the same construct. A test was administered to a group of 10 respondents at random.
The test was split into halves (each half is an alternative form), finally the results from one half
were correlated with the results from the other one half to determine the reliability.
In-depth interview schedule
To generate wealthy information on the problem under study, the second phase of the data
collection involved face-to-face interviews with some selected respondents as discussed earlier.
The interviews were carried out between June and July 2011 after a preliminary analysis of the
general survey results. The purpose of these interviews was to clarify issues from the
questionnaires and quotations from these interviews are used to support the quantitative data.
These interviews were carried out among eight respondents (as earlier discussed) and were
selected through purposive sampling. Each interview was conducted in the respondent’s work

79
place and lasted between 1 and 2 hours. Interviewees’ were assured of anonymity and
confidentiality during the interviews and in the reporting of the interviews. The interview items
were mainly derived from the questionnaires and are presented in Appendices 3. The interviews
were transcribed and where relevant, quotations from the interview transcripts were used to
support the results from the statistical analysis.
Data Analysis
The Data was cleaned and entered for analysis using Le Sphinx statistical Package. Analysis used
both descriptive and inferential statistics. Descriptive statistics were computed to obtain a
general understanding of SMEs’ characteristics (the business and the entrepreneur), nature of
business and interaction with other stakeholders. Inferential statistics were computed in the
second stage of the analysis. The purpose here was to test a number of hypothesized relationships
so as to make generalizations of the findings from the sample to a larger population. Unlike the
general survey data which was representative of target population, the in-depth interviews were
not meant to be statistically representative, but to complement the general survey results.

80
PART TWO
81
CHAPTER 2A
Diverse and dynamic SMEs in small towns
The first objective is to investigate the general and specific characteristics of SMEs sub-sectors
in a small town. This objective is guided by the assumption that due to their rural-urban linkage
function, the SMEs in Karatina and Sagana exhibits different characteristics to those of Small
enterprises elsewhere in the country lacking the linkage function. Information is therefore sought
on actors, enterprise and sub-sector characteristics in the towns in question. The findings are
further compared (mostly) to those obtained from National survey of 1999 and other earlier
studies carried in 1991, 1995 and 1996 in different parts of the country. To gain more insight to
these characteristics, the chapter first introduces the general outlay from the economic
perspective of the two towns.
The general economic outlook of the towns
Karatina town
A transect walk in Karatina town reveals an active economic environment, with diverse
economic activities. This is reflected by the many commercial banks, traders and farmers’
Saccos. The town hosts Karatina Market, so called ‘one of the largest markets in sub-Saharan
Africa’. The Market is famous for its fresh fruits and vegetables and operates on Tuesdays,
Thursdays and Saturdays, with Saturdays being the busiest day. In the rural catchment, people
practice small scale tea, coffee, dairy and horticultural farming (see Photo 2). According to
statistics from Chief Revenue Officer in Karatina, the town had 3,302 registered SMEs in 2011.
The total collections from business permits, market fees and stall rent totaled Ksh 40 millions in
2010.

82
Photo 2: Small scale tea farming in rural catchments of Karatina town
Source: H. Mainet (2009)
The patterns of Land ownership and land use can clearly be seen. The two are important
determinants of the economic links with SMEs in Karatina town.
Sagana town
Sagana is a relatively smaller town in terms of trade activities and had 400 registered SMEs.
Transect walk around the town reveals fewer and dispersed businesses activities as compared to
Karatina (see Photo 3 and Map 3). The town is surrounded by rich agricultural hinterlands,
where small scale farming of high value crops, cash crops and dairy farming. The town hosts
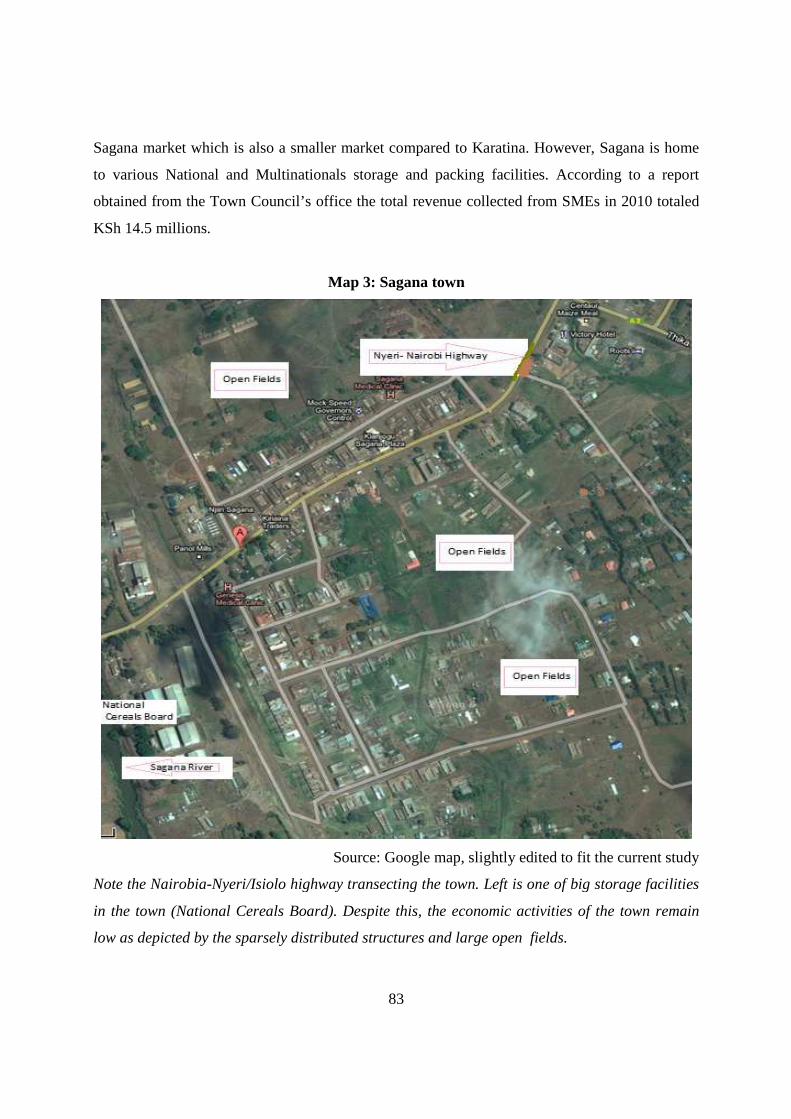
Sagana market which is also a smaller market compared to Karatina. However, Sagana is home
to various National and Multinationals storage and packing facilities. According to a report
obtained from the Town Council’s office the tot
KSh 14.5 millions.
Note the Nairobia-Nyeri/Isiolo highway transecting the town. Left is one of big storage facilities
in the town (National Cereals Board). Despite this, the economic activities of the town remain
low as depicted by the sparsely distributed stru
83
Sagana market which is also a smaller market compared to Karatina. However, Sagana is home
to various National and Multinationals storage and packing facilities. According to a report
obtained from the Town Council’s office the total revenue collected from SMEs in 2010 totaled
Map 3: Sagana town
Source: Google map, slightly edited to fit the current study
Nyeri/Isiolo highway transecting the town. Left is one of big storage facilities
town (National Cereals Board). Despite this, the economic activities of the town remain
low as depicted by the sparsely distributed structures and large open fields
Sagana market which is also a smaller market compared to Karatina. However, Sagana is home
to various National and Multinationals storage and packing facilities. According to a report
al revenue collected from SMEs in 2010 totaled
slightly edited to fit the current study
Nyeri/Isiolo highway transecting the town. Left is one of big storage facilities
town (National Cereals Board). Despite this, the economic activities of the town remain
ctures and large open fields.
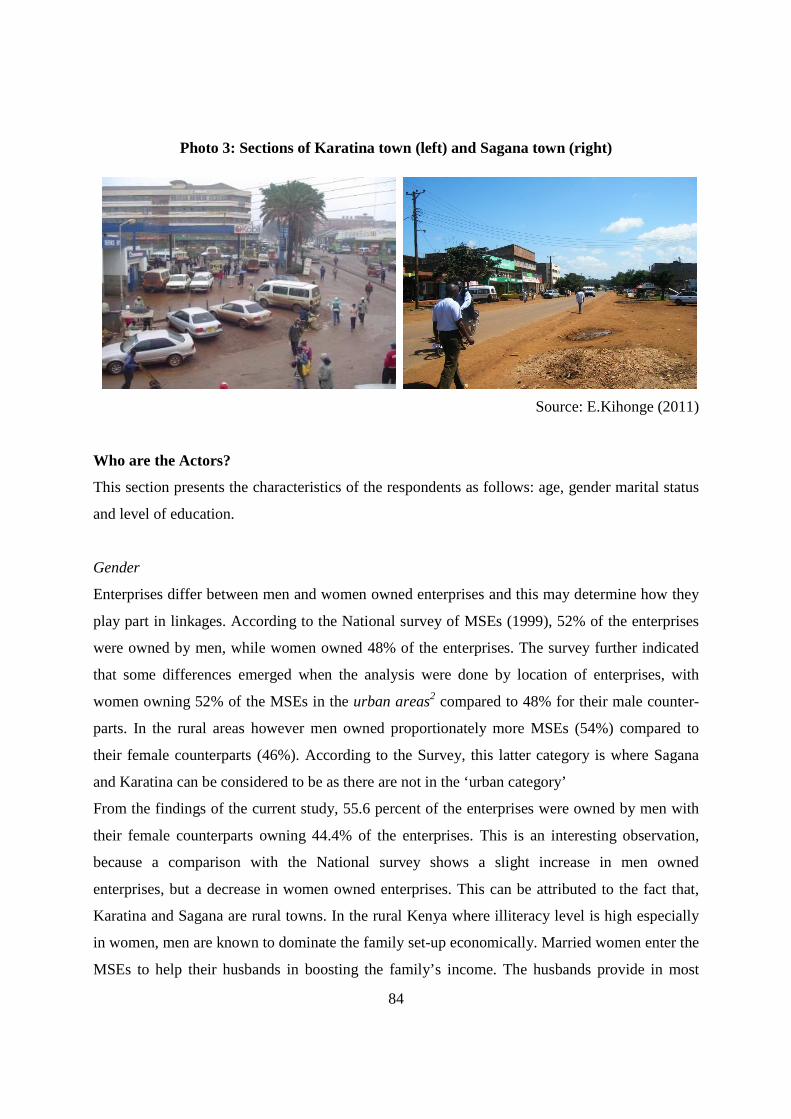
84
Photo 3: Sections of Karatina town (left) and Sagana town (right)
Source: E.Kihonge (2011)
Who are the Actors?
This section presents the characteristics of the respondents as follows: age, gender marital status
and level of education.
Gender
Enterprises differ between men and women owned enterprises and this may determine how they
play part in linkages. According to the National survey of MSEs (1999), 52% of the enterprises
were owned by men, while women owned 48% of the enterprises. The survey further indicated
that some differences emerged when the analysis were done by location of enterprises, with
women owning 52% of the MSEs in the urban areas2 compared to 48% for their male counter-
parts. In the rural areas however men owned proportionately more MSEs (54%) compared to
their female counterparts (46%). According to the Survey, this latter category is where Sagana
and Karatina can be considered to be as there are not in the ‘urban category’
From the findings of the current study, 55.6 percent of the enterprises were owned by men with
their female counterparts owning 44.4% of the enterprises. This is an interesting observation,
because a comparison with the National survey shows a slight increase in men owned
enterprises, but a decrease in women owned enterprises. This can be attributed to the fact that,
Karatina and Sagana are rural towns. In the rural Kenya where illiteracy level is high especially
in women, men are known to dominate the family set-up economically. Married women enter the
MSEs to help their husbands in boosting the family’s income. The husbands provide in most
85
cases the capital for starting the business. However, sometimes the husbands feel threatened by
the success of such businesses and withdraw the financial support or bar the women from
operating the business. This factor is well portrayed in the case study on Karatina market (“the
woman trader and the falling snow”) in Box 5.
Education
Education is the foundation for socio-economic growth and development of economies
worldwide. It is crucial to analyze the educational attainment of entrepreneurs in both Karatina
and Sagana to ascertain their level of understanding of issues and management of SMEs. This
was done to examine the extent to which people who run SMEs have the capacity to manage
their activities and as well contribute to the growth and development of the small towns and their
rural catchment. To gain further insight to this variable, analysis is sought on relationship
between education levels and monthly turnovers as well as membership in business associations.
The results were further compared to the National Survey of 1999.
From the study findings, the education level of those who started the enterprises ranged from
those who had only primary education to those had attained university education. Most however
had secondary level of education. Looking at the level of education by gender, the finding also
indicates most of the women entrepreneurs had their education concentrated at the level of
secondary. Sagana is found to have more educated SMEs as most had attained primary education
(Table 4). This is an important finding since women have been tending to lag behind in
education in developing countries.
According to the National SME survey (1999), majority at 75% had primary education, followed
by those who had secondary education who stood at 33.1%. Only a mere 1.8% had post
secondary education.
Table 4 gives a comparison between the current study and 1999 and shows that the SME
entrepreneur is today more literate and educated than the SME entrepreneur of 1999. According
to 1999 survey report, this could be attributed to the rising levels of unemployment among
secondary school and university graduates who eventually end up in the sector as an action of
last resort. This is further supported by a survey carried of urban SMEs by Shimooka (1996),
which gave a high concentration at the primary school level with 62% followed by secondary
with 36% primary and 2% with post secondary education.
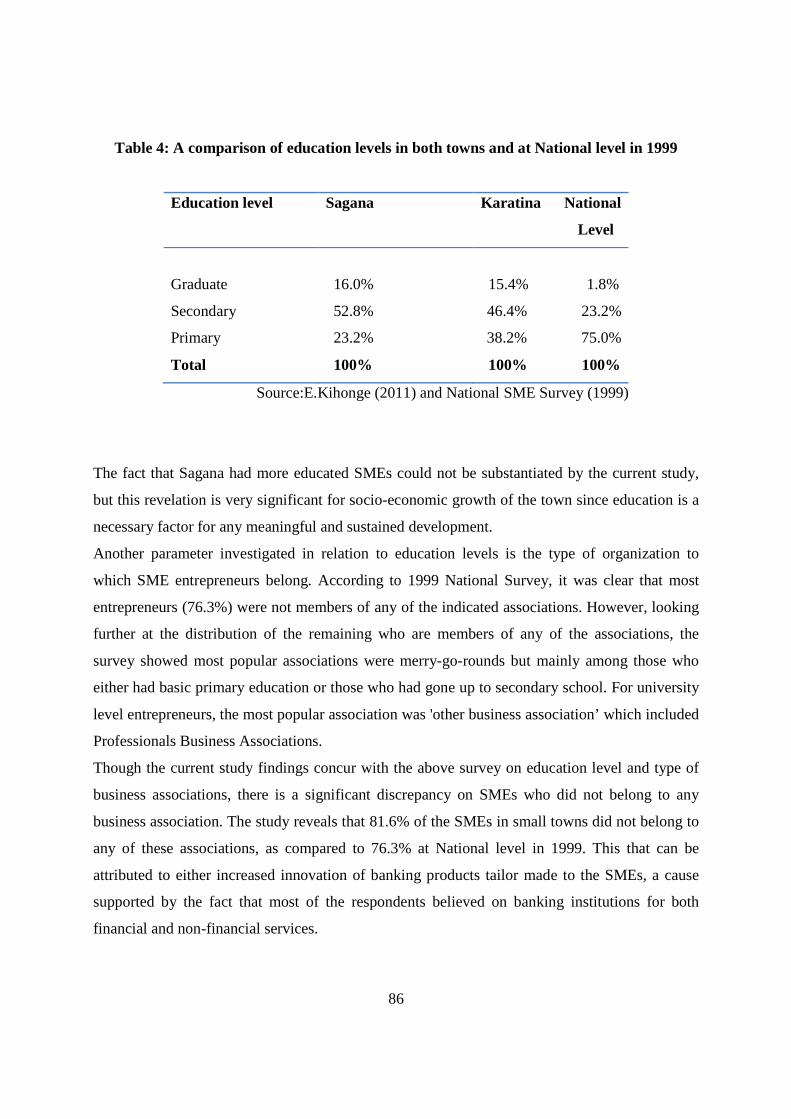
86
Table 4: A comparison of education levels in both towns and at National level in 1999
Education level Sagana Karatina National
Level
Graduate 16.0% 15.4% 1.8%
Secondary 52.8% 46.4% 23.2%
Primary
Total
23.2%
100%
38.2% 75.0%
100% 100%
Source:E.Kihonge (2011) and National SME Survey (1999)
The fact that Sagana had more educated SMEs could not be substantiated by the current study,
but this revelation is very significant for socio-economic growth of the town since education is a
necessary factor for any meaningful and sustained development.
Another parameter investigated in relation to education levels is the type of organization to
which SME entrepreneurs belong. According to 1999 National Survey, it was clear that most
entrepreneurs (76.3%) were not members of any of the indicated associations. However, looking
further at the distribution of the remaining who are members of any of the associations, the
survey showed most popular associations were merry-go-rounds but mainly among those who
either had basic primary education or those who had gone up to secondary school. For university
level entrepreneurs, the most popular association was 'other business association’ which included
Professionals Business Associations.
Though the current study findings concur with the above survey on education level and type of
business associations, there is a significant discrepancy on SMEs who did not belong to any
business association. The study reveals that 81.6% of the SMEs in small towns did not belong to
any of these associations, as compared to 76.3% at National level in 1999. This that can be
attributed to either increased innovation of banking products tailor made to the SMEs, a cause
supported by the fact that most of the respondents believed on banking institutions for both
financial and non-financial services.
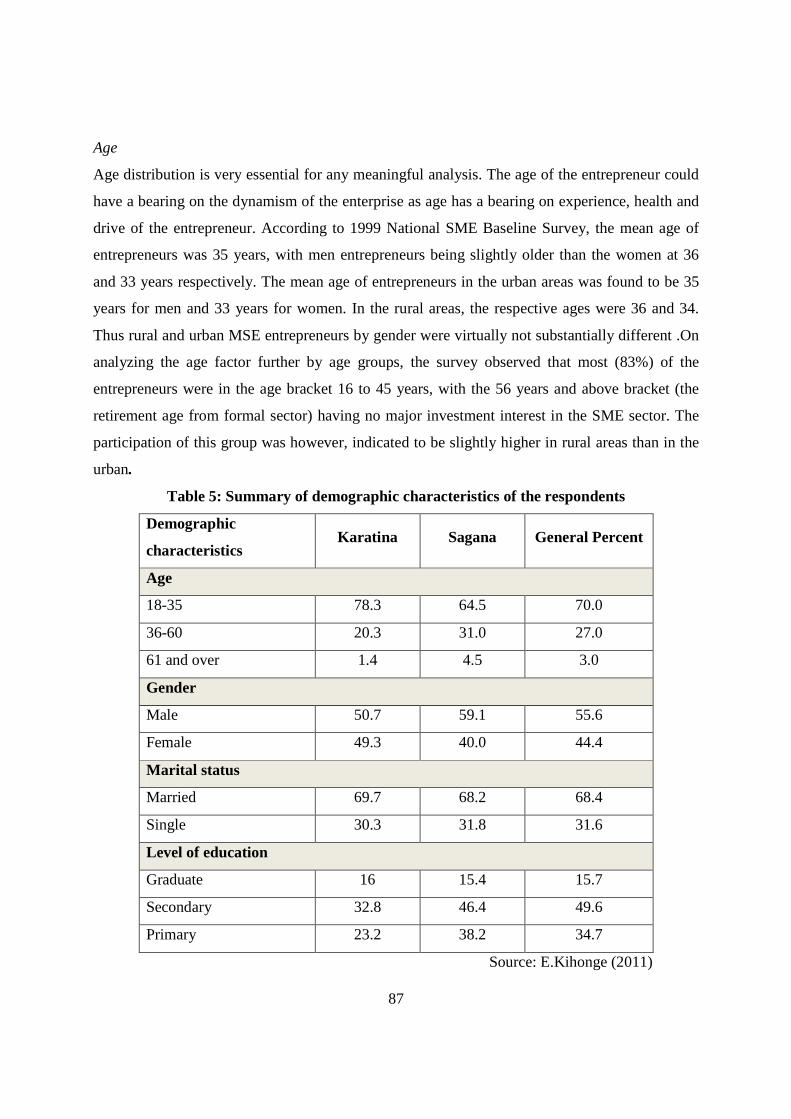
87
Age
Age distribution is very essential for any meaningful analysis. The age of the entrepreneur could
have a bearing on the dynamism of the enterprise as age has a bearing on experience, health and
drive of the entrepreneur. According to 1999 National SME Baseline Survey, the mean age of
entrepreneurs was 35 years, with men entrepreneurs being slightly older than the women at 36
and 33 years respectively. The mean age of entrepreneurs in the urban areas was found to be 35
years for men and 33 years for women. In the rural areas, the respective ages were 36 and 34.
Thus rural and urban MSE entrepreneurs by gender were virtually not substantially different .On
analyzing the age factor further by age groups, the survey observed that most (83%) of the
entrepreneurs were in the age bracket 16 to 45 years, with the 56 years and above bracket (the
retirement age from formal sector) having no major investment interest in the SME sector. The
participation of this group was however, indicated to be slightly higher in rural areas than in the
urban.
Table 5: Summary of demographic characteristics of the respondents
Demographic
characteristics Karatina Sagana General Percent
Age
18-35 78.3 64.5 70.0
36-60 20.3 31.0 27.0
61 and over 1.4 4.5 3.0
Gender
Male 50.7 59.1 55.6
Female 49.3 40.0 44.4
Marital status
Married 69.7 68.2 68.4
Single 30.3 31.8 31.6
Level of education
Graduate 16 15.4 15.7
Secondary 32.8 46.4 49.6
Primary 23.2 38.2 34.7
Source: E.Kihonge (2011)
88
In the current study the average age of the SME entrepreneurs in the small towns is 34.5 years
which has no significant difference with the National Survey of 1999 which also gave almost the
same value for both urban and rural SMEs. Also on analyzing the age factor further by age
groups, the currently study findings can be said to tally with those of the National level in 1999
as majority of the SME owners were found to be in the age bracket of (18-35 years), which stood
at 70%, followed by 36-60 age bracket at 27%, those above 61 years were only 3%. Two thirds
of those above 61 were found to be women. However Sagana town was noted to have more
youthful entrepreneurs while Karatina had a significantly higher number of those who were 61.
Distinctiveness of the enterprises
This section presents the study results on business characteristics, which includes: start-up, size
and business training. These characteristics are important in determining rural-urban linkages
and their contribution to enterprise performance. The nature of linkages and their benefits by
firms for example are likely to differ by firm size. Studies have shown that large firms are more
likely to receive more loans, have higher indebtedness, rely less on informal loans, and have
more access to credit compared to the small firms, the majority of which get their loans from
informal sources of finance. The success of the small entrepreneur depends also on the presence
of ‘related and supporting’ services for example entrepreneurship/business training.
Age of the enterprises
The age of enterprise is very essential in this study because it highlights the presence of young
and old enterprises that operate in Sagana and Karatina. The enterprises varied in their age from
less than one year to those over 10 years, with average age being 2.11 years. The data further
showed that about 70.8% of the enterprises in the sample were started in the last 5 years with
only 13.3% being over 10 years. This is an important outcome, which conformed to the
observation that the informal sector in Kenya has been very dynamic since 1990s.
Due to major decline in the formal sector, resulting from the implementation of economic
reforms as well as economic stagnation, many businesses have been created on a weak stand
which has seen frequent closer and birth of new SMEs.
The national survey shows that 50 percent of the SME closures had occurred within three years
of startup, with closures peaking before the end of the first year. This is because SMEs are
89
particularly vulnerable during the fragile initial years when they are learning how to operate the
business.
Sources and size of the seed capital
According to the National Survey (1999), there has been an upward trend in the minimal
amounts of start-up capital since 1993. In 1993, the percentage of MSEs starting with Ksh
10,000 or less was 89%, in 1995 this was 88. 4%, in 1999 this was 81. 2%. In the current study,
those in this category are 46.8% as per 2010. However, the big difference in a range of the 11
years cannot be taken as the general National outlook since the study focuses on small towns in
productive agricultural areas. Also the value of the shilling has been on declined over the years
and this has a great impact on the observed trend. On the other hand, though the current study
concurs with the National Survey, that for all the years, the amount of start-up capital is quite
small for most SMEs with the main source of start-up capital being overwhelmingly family or
personal fund, the percentage of those who use this source of funding seems to less in the towns
in question.
From the study, who started businesses with personal savings were the majority (74.5%), as
compared to 90.4 percent in same category in 1999. Notably 21.7 percent started with bank
loans. Though this can be attributed to the reformed banking sector in Kenya with lending
policies which are more friendly to SMEs, a lot has to be done to increase access to credit for
starters who mostly lack security collaterals and supportive business documents like cash flow
statements. This concurred with the results from other studies which show that SMEs used less
credit capital compared to large firms, most of which obtain credit capital. This finding is similar
to that observed in 1993 and 1995 as well as in other studies (Oketch et al, 1991). Thus there is
much need for financial support to SMEs.
Looking at the source of finance by gender, we find that most (71.4%) of women entrepreneurs
started with personal savings, while only 10.4% used loans and another 5.2% used social grants
such as pension. Majority of these businesses (32.6%) were started with a capital base in the
range of Ksh.10,000 to 50,000, with 20.6% of the businesses having being started with over
Ksh.50,000 (see Table 6). These aggregate results were also reflected in individual towns with
little or no difference when a comparison was done.
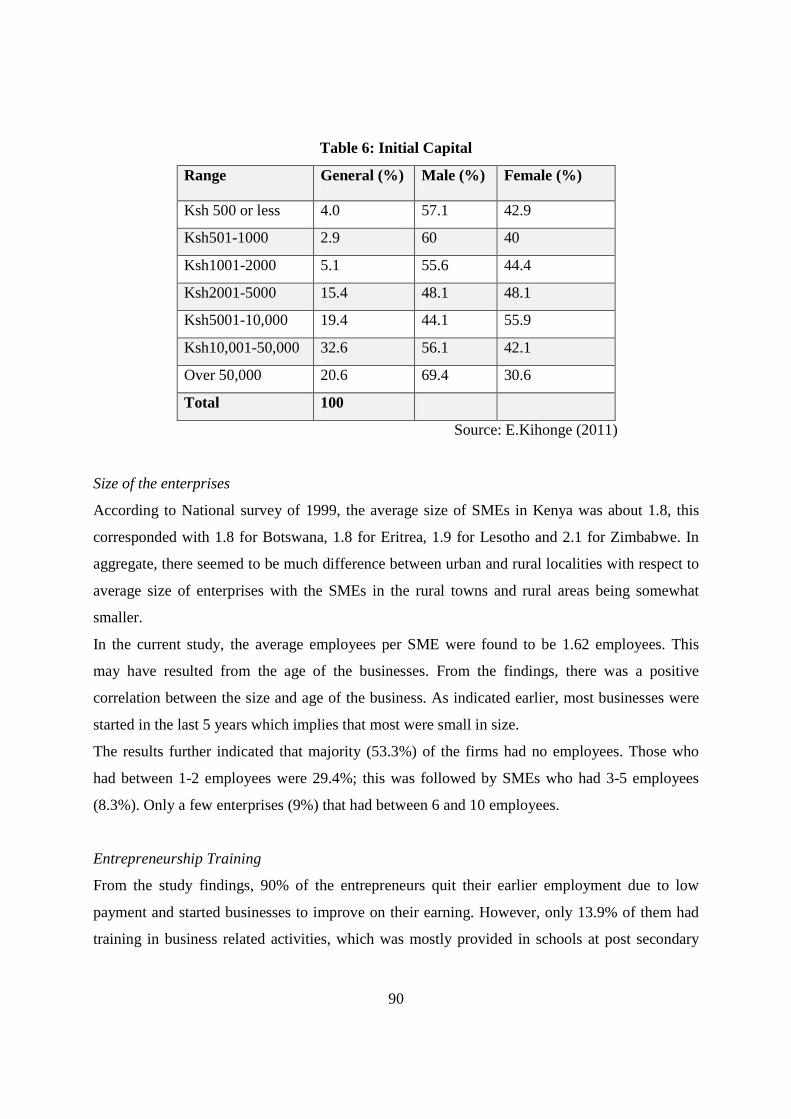
90
Table 6: Initial Capital
Range General (%) Male (%) Female (%)
Ksh 500 or less 4.0 57.1 42.9
Ksh501-1000 2.9 60 40
Ksh1001-2000 5.1 55.6 44.4
Ksh2001-5000 15.4 48.1 48.1
Ksh5001-10,000 19.4 44.1 55.9
Ksh10,001-50,000 32.6 56.1 42.1
Over 50,000 20.6 69.4 30.6
Total 100
Source: E.Kihonge (2011)
Size of the enterprises
According to National survey of 1999, the average size of SMEs in Kenya was about 1.8, this
corresponded with 1.8 for Botswana, 1.8 for Eritrea, 1.9 for Lesotho and 2.1 for Zimbabwe. In
aggregate, there seemed to be much difference between urban and rural localities with respect to
average size of enterprises with the SMEs in the rural towns and rural areas being somewhat
smaller.
In the current study, the average employees per SME were found to be 1.62 employees. This
may have resulted from the age of the businesses. From the findings, there was a positive
correlation between the size and age of the business. As indicated earlier, most businesses were
started in the last 5 years which implies that most were small in size.
The results further indicated that majority (53.3%) of the firms had no employees. Those who
had between 1-2 employees were 29.4%; this was followed by SMEs who had 3-5 employees
(8.3%). Only a few enterprises (9%) that had between 6 and 10 employees.
Entrepreneurship Training
From the study findings, 90% of the entrepreneurs quit their earlier employment due to low
payment and started businesses to improve on their earning. However, only 13.9% of them had
training in business related activities, which was mostly provided in schools at post secondary
91
level. The results concurred with the National Survey of 1991, which found out that 85% of the
entrepreneurs have not received any entrepreneurship training.
Most of these entrepreneurs were found to be more in Sagana than Karatina. On being ask if they
would be interested in receiving business mentoring, 57.3% of those who were found to have no
business training answered on affirmative.
The SMEs Sub-sectors
The SME sector has been largely analyzed from a general perspective. However, though SMEs
exhibit some similar business evolvement and development characteristics, the sector can be
broadly categorized into three (3) categories: Service, Trade and Manufacturing. With Kenya
being an agriculture-led economy and a net importer, there may exists a great discrepancy in
terms of how the players, especially in manufacturing and trade, fair in a liberalized market. This
is further emphasized by the fact that the study focused on small towns which are mostly
disadvantaged in terms of connectivity to the wider world, energy and low local customer base,
factors which might impact differently on individual sub-sectors.
The study therefore, sought to gain more insight into operations and dynamics of each category.
This was achieved through a comparative analysis of each sub-sector in terms of gender
representation, education levels of actors, wealth generation and employment creation. The study
further analyzed SMEs’ views in each category on general performance of the National
economy. This was done to gain insight into the SMEs micro economic performance in context
of national/global market.
The Trade sub-sector
In Kenya, trade sub-sector mainly refers to retailers and middlemen of agricultural products, but
for purpose of this study, the sub-sector was considered to comprise of both retailers of
agricultural and non-agricultural products. From the study findings, majority (63.1%) of SMEs
were found in this category, with most of them dealing with agricultural products. These
findings were in agreement with the National survey which found that close to two-thirds (nearly
66%) of the SME entrepreneurs were in trade. As noted in the national Survey report, the
dominance of trade over the other sectors is not uncommon in many developing countries though
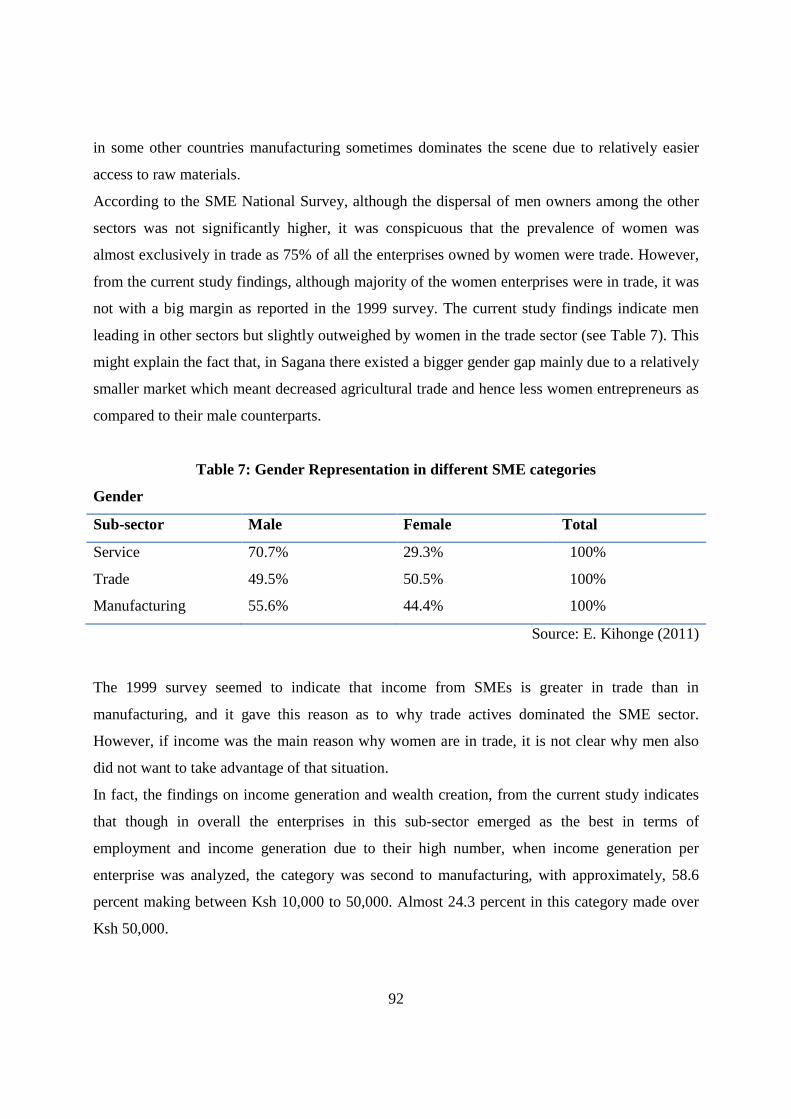
92
in some other countries manufacturing sometimes dominates the scene due to relatively easier
access to raw materials.
According to the SME National Survey, although the dispersal of men owners among the other
sectors was not significantly higher, it was conspicuous that the prevalence of women was
almost exclusively in trade as 75% of all the enterprises owned by women were trade. However,
from the current study findings, although majority of the women enterprises were in trade, it was
not with a big margin as reported in the 1999 survey. The current study findings indicate men
leading in other sectors but slightly outweighed by women in the trade sector (see Table 7). This
might explain the fact that, in Sagana there existed a bigger gender gap mainly due to a relatively
smaller market which meant decreased agricultural trade and hence less women entrepreneurs as
compared to their male counterparts.
Table 7: Gender Representation in different SME categories
Gender
Sub-sector Male Female Total
Service 70.7% 29.3% 100%
Trade 49.5% 50.5% 100%
Manufacturing 55.6% 44.4% 100%
Source: E. Kihonge (2011)
The 1999 survey seemed to indicate that income from SMEs is greater in trade than in
manufacturing, and it gave this reason as to why trade actives dominated the SME sector.
However, if income was the main reason why women are in trade, it is not clear why men also
did not want to take advantage of that situation.
In fact, the findings on income generation and wealth creation, from the current study indicates
that though in overall the enterprises in this sub-sector emerged as the best in terms of
employment and income generation due to their high number, when income generation per
enterprise was analyzed, the category was second to manufacturing, with approximately, 58.6
percent making between Ksh 10,000 to 50,000. Almost 24.3 percent in this category made over
Ksh 50,000.
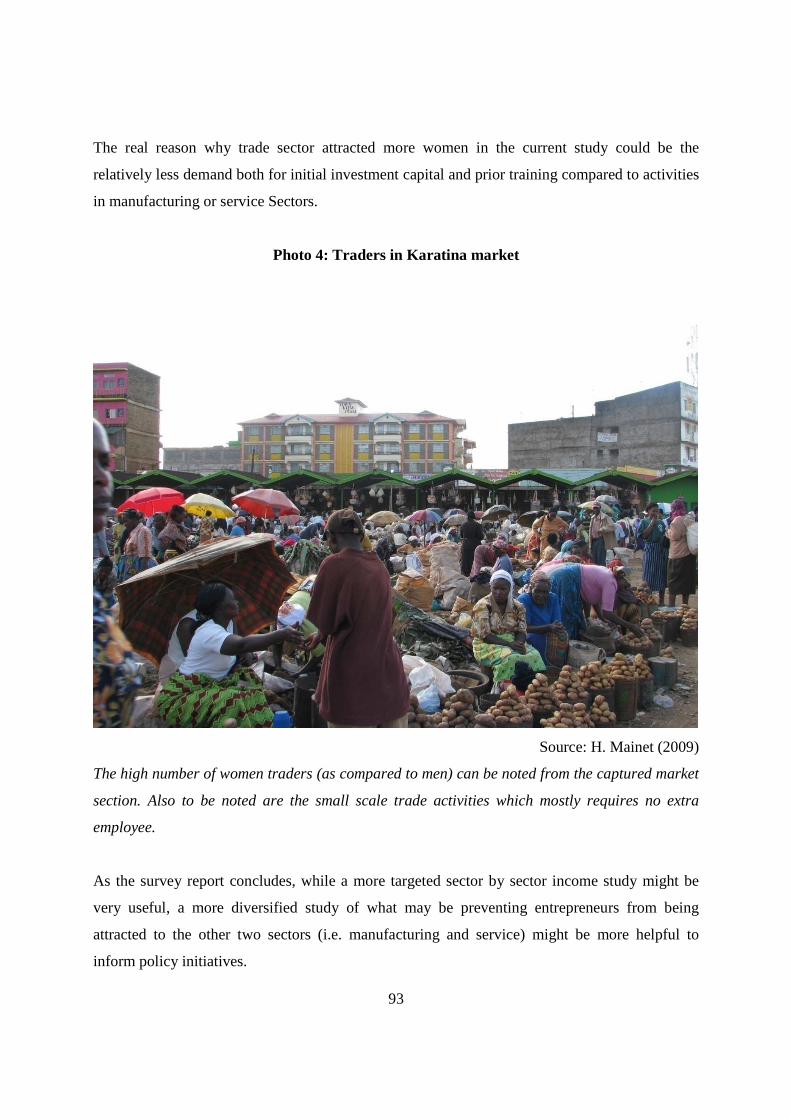
93
The real reason why trade sector attracted more women in the current study could be the
relatively less demand both for initial investment capital and prior training compared to activities
in manufacturing or service Sectors.
Photo 4: Traders in Karatina market
Source: H. Mainet (2009)
The high number of women traders (as compared to men) can be noted from the captured market
section. Also to be noted are the small scale trade activities which mostly requires no extra
employee.
As the survey report concludes, while a more targeted sector by sector income study might be
very useful, a more diversified study of what may be preventing entrepreneurs from being
attracted to the other two sectors (i.e. manufacturing and service) might be more helpful to
inform policy initiatives.
94
The findings of the current study further concurred with the 1999 survey on the negative
correlation between the size of the enterprise and the trading activities. The survey findings
consistently showed that as the size of enterprise increases the dominance of trade decreased.
From the findings, trade category emerged to be mostly a ‘one man show’, with 56.8 percent
having no extra employee apart from the owner. Those enterprises which had more than one
employee were mostly in the service and manufacturing sub-sectors. A finding that can be
attributed to the fact that most of trade activities involve retailing which mainly is not labour
intensive. This may be supportive evidence of the investment constraints which steers women
(and some men) to petty trade activities.
The trade sub- sector was expected to have gained a lot from trade liberalization. The liberalized
economy resulted to privatization of Government marketing bodies which were politically
controlled and corruption invested, this resulted to farmers gaining less from their sweats.
The findings of the study indicated that 47.7 percent of these entrepreneurs believed there was
improvement in the National economy performance in the last five years. Their rating on this
aspect was second to service category where 60.3 percent believed there was an improvement
over the same period.
Service sub-sector
Service sub-sector was the second largest with approximately 31.8 percent of total enterprises.
Just like other sectors, there was no significant difference on percentage representation of this
category when a comparison was done between the two towns. Compared to manufacturing
sector which had 44.2 percent of the SMEs who were 5 years old or less in operation, service
sector had 75.9% of businesses having operated within the same period. This can be explained
by the fact that more modern businesses were observed in context of Information and
Communication. Such included: retail banking, phone repairs, cyber cafes and electronic money
transfer.
If what was reflected in the findings is to true for other towns, then modern businesses will
remain to be a male culture in Kenya. Unlike other sub-sectors, men highly dominated the
service industry, with almost 70.7% of total enterprises in this category being men owned.
Though there was no significance difference in overall education qualifications between men and
women, factors such as training, skills and high capital may have locked the woman gender out
95
of service industry. This sector was noted to have more youthful and educated entrepreneurs than
trade and manufacturing. From the findings, almost 69% respondent had at least attained
secondary education, with 25.9% of them being graduates of either university or middle level
colleges, which again boils down to skills and training needed to run these ventures.
Compared to trade which had 64% of the respondents below 35 years of age, 81 percent of
entrepreneurs in this category were below 35 years. The industry came second to manufacturing
in employment density with almost 51.7 percent of the businesses having at least one employee,
with 8.6 percent employing between six and 10 employees. On income generation per entity, the
sector scored poorly than the other two, with almost 48.3 percent of the SMEs making between
Ksh10, 000 to 50,000, those who attained a monthly turnover of over Ksh 50,000 were 27.6
percent. Manufacturing which lead in this aspect had almost 77.8 percent of SMEs which made
between Ksh10, 000 to 50,000 and those who made over Ksh 50,000 were 11.1 percent.
Photo 5: A private school in Karatina town
Source: E. Kihonge (2011)
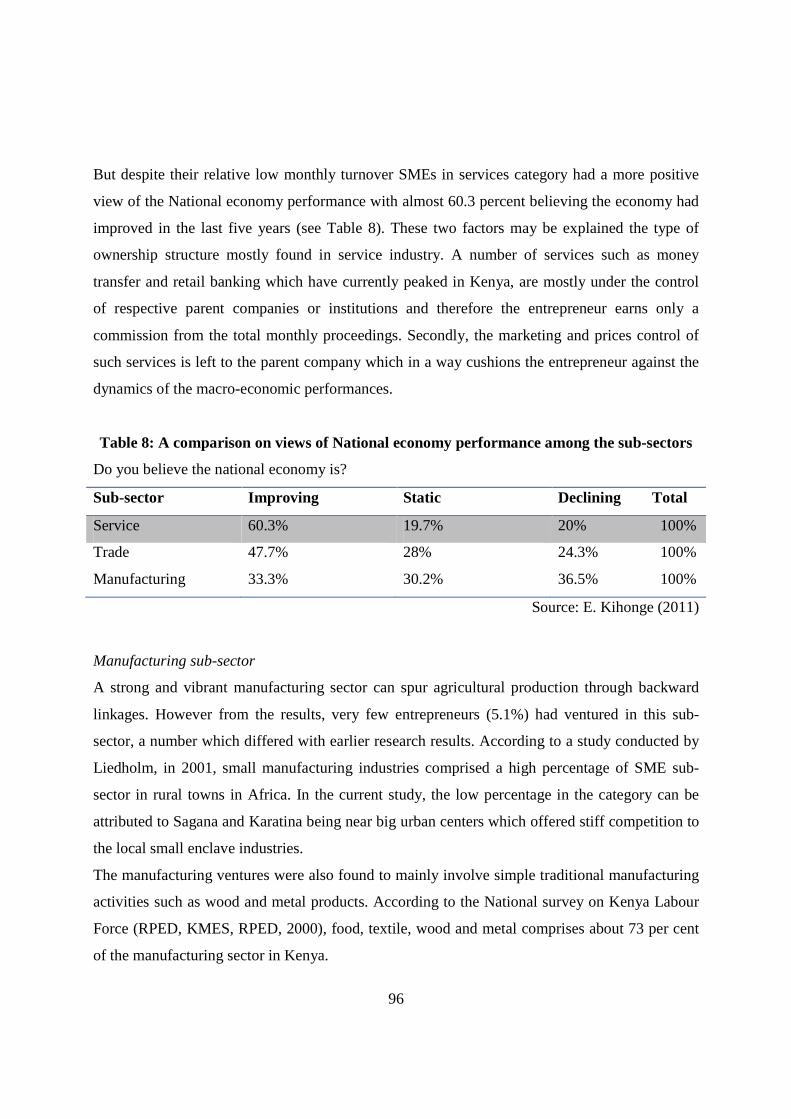
96
But despite their relative low monthly turnover SMEs in services category had a more positive
view of the National economy performance with almost 60.3 percent believing the economy had
improved in the last five years (see Table 8). These two factors may be explained the type of
ownership structure mostly found in service industry. A number of services such as money
transfer and retail banking which have currently peaked in Kenya, are mostly under the control
of respective parent companies or institutions and therefore the entrepreneur earns only a
commission from the total monthly proceedings. Secondly, the marketing and prices control of
such services is left to the parent company which in a way cushions the entrepreneur against the
dynamics of the macro-economic performances.
Table 8: A comparison on views of National economy performance among the sub-sectors
Do you believe the national economy is?
Sub-sector Improving Static Declining Total
Service 60.3% 19.7% 20% 100%
Trade 47.7% 28% 24.3% 100%
Manufacturing 33.3% 30.2% 36.5% 100%
Source: E. Kihonge (2011)
Manufacturing sub-sector
A strong and vibrant manufacturing sector can spur agricultural production through backward
linkages. However from the results, very few entrepreneurs (5.1%) had ventured in this sub-
sector, a number which differed with earlier research results. According to a study conducted by
Liedholm, in 2001, small manufacturing industries comprised a high percentage of SME sub-
sector in rural towns in Africa. In the current study, the low percentage in the category can be
attributed to Sagana and Karatina being near big urban centers which offered stiff competition to
the local small enclave industries.
The manufacturing ventures were also found to mainly involve simple traditional manufacturing
activities such as wood and metal products. According to the National survey on Kenya Labour
Force (RPED, KMES, RPED, 2000), food, textile, wood and metal comprises about 73 per cent
of the manufacturing sector in Kenya.
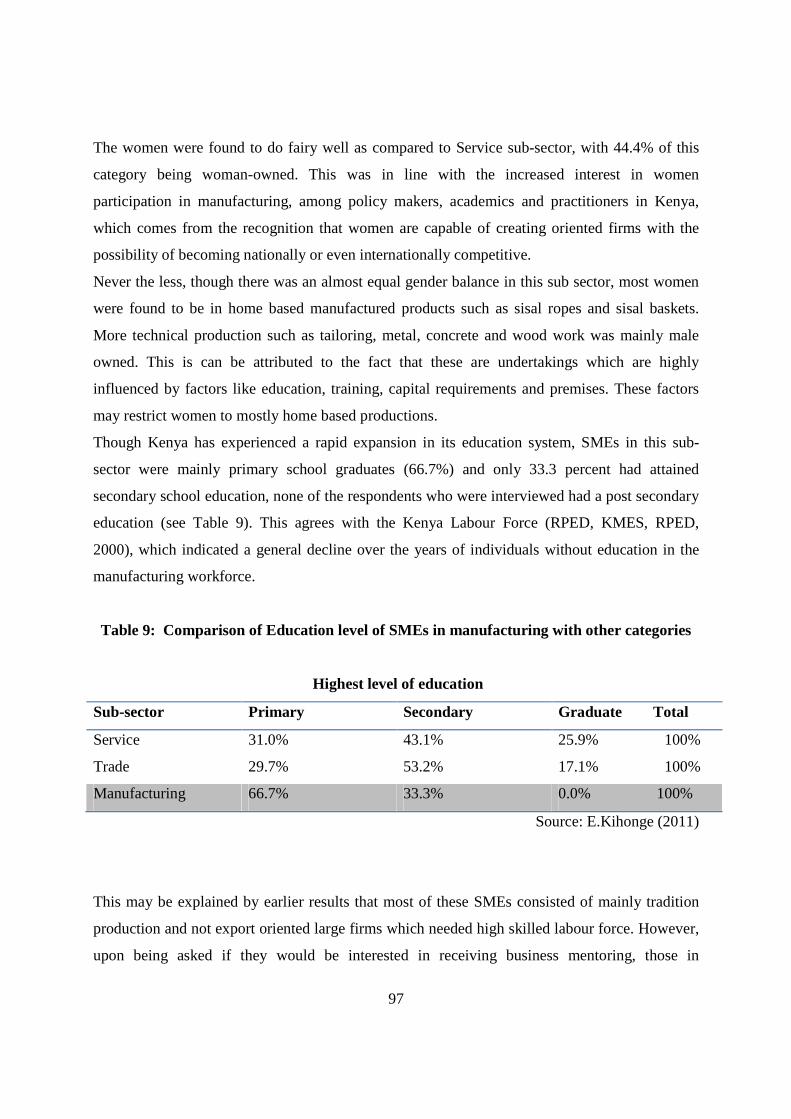
97
The women were found to do fairy well as compared to Service sub-sector, with 44.4% of this
category being woman-owned. This was in line with the increased interest in women
participation in manufacturing, among policy makers, academics and practitioners in Kenya,
which comes from the recognition that women are capable of creating oriented firms with the
possibility of becoming nationally or even internationally competitive.
Never the less, though there was an almost equal gender balance in this sub sector, most women
were found to be in home based manufactured products such as sisal ropes and sisal baskets.
More technical production such as tailoring, metal, concrete and wood work was mainly male
owned. This is can be attributed to the fact that these are undertakings which are highly
influenced by factors like education, training, capital requirements and premises. These factors
may restrict women to mostly home based productions.
Though Kenya has experienced a rapid expansion in its education system, SMEs in this sub-
sector were mainly primary school graduates (66.7%) and only 33.3 percent had attained
secondary school education, none of the respondents who were interviewed had a post secondary
education (see Table 9). This agrees with the Kenya Labour Force (RPED, KMES, RPED,
2000), which indicated a general decline over the years of individuals without education in the
manufacturing workforce.
Table 9: Comparison of Education level of SMEs in manufacturing with other categories
Highest level of education
Sub-sector Primary Secondary Graduate Total
Service 31.0% 43.1% 25.9% 100%
Trade 29.7% 53.2% 17.1% 100%
Manufacturing 66.7% 33.3% 0.0% 100%
Source: E.Kihonge (2011)
This may be explained by earlier results that most of these SMEs consisted of mainly tradition
production and not export oriented large firms which needed high skilled labour force. However,
upon being asked if they would be interested in receiving business mentoring, those in
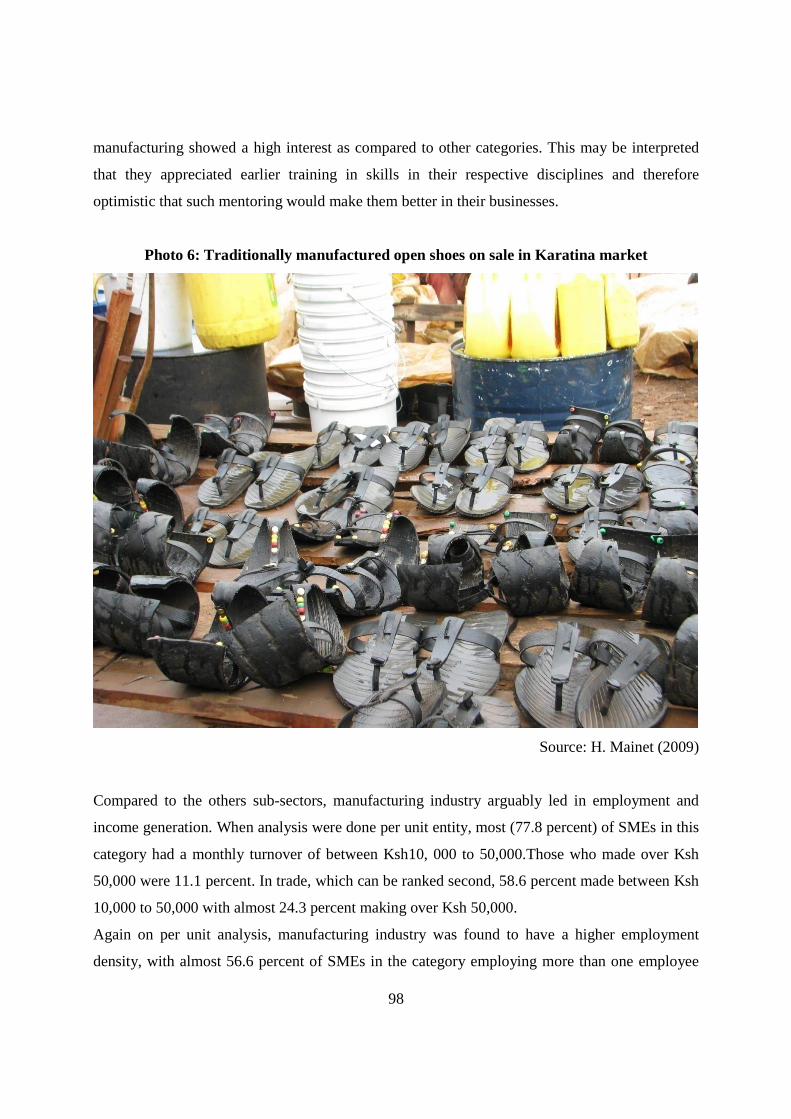
98
manufacturing showed a high interest as compared to other categories. This may be interpreted
that they appreciated earlier training in skills in their respective disciplines and therefore
optimistic that such mentoring would make them better in their businesses.
Photo 6: Traditionally manufactured open shoes on sale in Karatina market
Source: H. Mainet (2009)
Compared to the others sub-sectors, manufacturing industry arguably led in employment and
income generation. When analysis were done per unit entity, most (77.8 percent) of SMEs in this
category had a monthly turnover of between Ksh10, 000 to 50,000.Those who made over Ksh
50,000 were 11.1 percent. In trade, which can be ranked second, 58.6 percent made between Ksh
10,000 to 50,000 with almost 24.3 percent making over Ksh 50,000.
Again on per unit analysis, manufacturing industry was found to have a higher employment
density, with almost 56.6 percent of SMEs in the category employing more than one employee
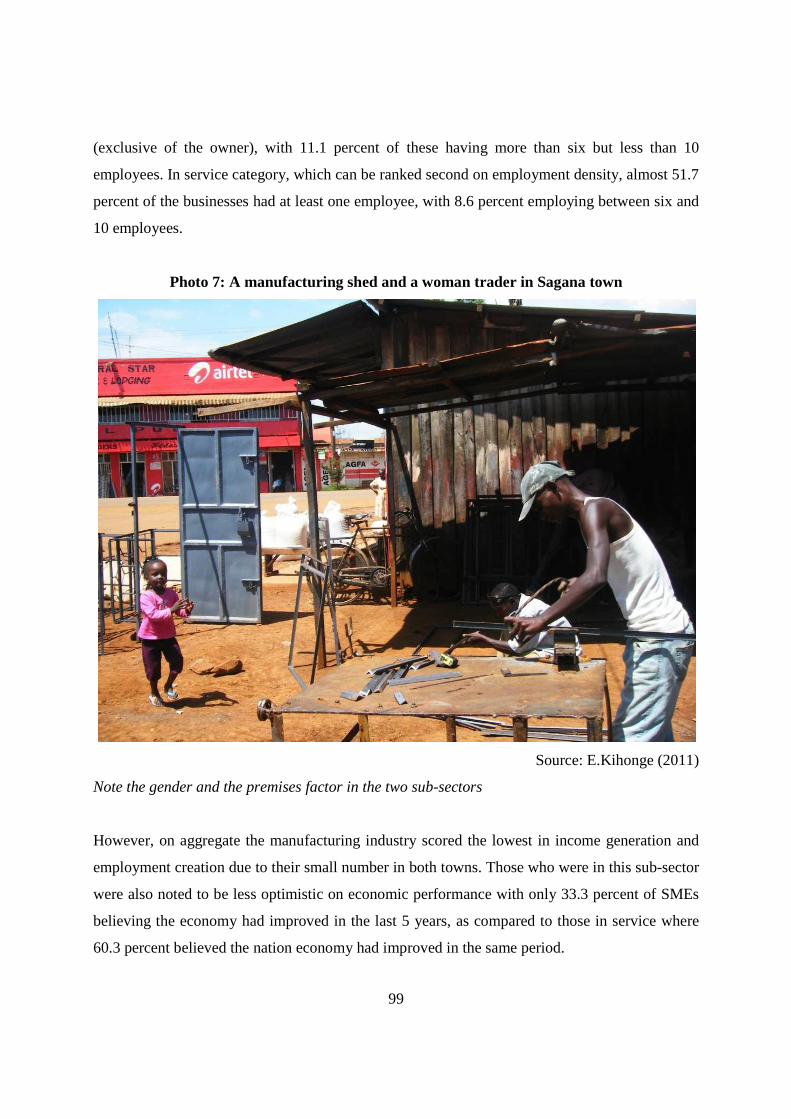
99
(exclusive of the owner), with 11.1 percent of these having more than six but less than 10
employees. In service category, which can be ranked second on employment density, almost 51.7
percent of the businesses had at least one employee, with 8.6 percent employing between six and
10 employees.
Photo 7: A manufacturing shed and a woman trader in Sagana town
Source: E.Kihonge (2011)
Note the gender and the premises factor in the two sub-sectors
However, on aggregate the manufacturing industry scored the lowest in income generation and
employment creation due to their small number in both towns. Those who were in this sub-sector
were also noted to be less optimistic on economic performance with only 33.3 percent of SMEs
believing the economy had improved in the last 5 years, as compared to those in service where
60.3 percent believed the nation economy had improved in the same period.

100
This sub-sector was expected to be hardly hit by market liberalization due to cheap imports. Also
the industry mostly depends on imported raw materials which included timber, metal, leather,
cement and cloth material. The prices of these materials have hiked over the years due to
increased inflation. Also the industry uses mainly electric energy in its production. Electricity
charges have continued to hike due to high global prices of petroleum.
Conclusions on the Chapter
The following section gives the conclusions of the chapter as comparisons and contrasts of the
characteristics of SMEs in a small town set-up versus characteristics of the same at National
level vis a vis other rural and urban areas.
Actors’ characteristics
On Age and gender, though the number of male owned enterprises was more than their women
counterparts as reported in other studies at National/different urban & rural areas (men at 52%),
the gender gap was more pronounced in the small town set up in favor of men (55.6%). This
factor can be attributed to the fact that the small towns are more in touch with rural settings,
where the African tradition of male dominance in social and economic cycles still exists.
Looking at gender by the sub-sectors, the female owned enterprises were expected to far much
outweigh the men as reported in the 1991, 1996 and 1999 reports by Oketch et al, Shimooka and
GOK respectively (approximately 75%).
However in the current study, the men came out strongly (49.5%) and stood almost at par with
the women. Never the less, most SMEs owned by women were in trade sub-sector. The woman
factor in trade was even less pronounced in Sagana as compared to Karatina, mostly because of
the fewer trade activities in the town due to the smaller market. On the age of the entrepreneur,
the current study was in agreement with previous mentioned studies which found the mean age
to be 35 years, with the current study average being 34.5years.
On education, the findings from the current study concurs with the earlier findings that
educational level of SMEs has been on the increase (if analyzed from the general perspective to
the specific town set-up). In 1996, the SME entrepreneurs who had only primary education stood
at 75% in 1999 at 62% and in the current study (2010), the same category stood at 30.75%.
Though the increasing trend may stand for other small towns in the country, the percentages of
101
those having only primary education are likely to differ as Central province is known to be well
establishes with education facilities and awareness as compared to other provinces.
On comparing the education levels per town, Sagana was noted to have more educated and
youthful entrepreneurs than Karatina. However, if this translates to better management of the
SMEs and thus boosting the economic development of the town, hangs on balance as most SME
entrepreneur said there were in business to look for greener pastures, which means there were
pushed into business by circumstances and lack of other alternatives.
Still on education, though the current study and the past studies established a relationship
between education level and the type of business association with the less learned SME
entrepreneurs opting to join ‘merry-go rounds’ and their learned more professional associations.
The interest in both associations seems to be on the decline as more SME entrepreneurs in the
current study (81.6%) did not belong to any business association, as compared to 76.3% in 1999
who did not belong to any business association. A move that can be attributed to more improved
banking networks with more friendly terms to the SMEs, as most members join the associations
to benefit from credit facilities.
Enterprise characteristics
On start-up capital, an increasing trend was noted on the amount of seed capital in comparison
with earlier studies. Since 1993, the percentages of those starting with Ksh 10,000 and below
have been on the decline. In 1993, the percentage of MSEs starting with Ksh 10,000 or less was
89%, in 1995 this was 88. 4%, in 1999 this was 81. 2%. In the current study, those in this
category are 46.8% as per 2010. However, though the current study concurs with the National
Survey, that for all the years, the amount of start-up capital is quite small for most SMEs with the
main source of start-up capital being overwhelmingly family or personal fund, the percentage of
those who use this source of funding seems to less in the towns in question. From the study, who
started businesses with personal savings were the majority (74.5%), as compared to 90.4% in
same category in 1999. Notably 21.7 percent started with bank loans.
On age and size of the enterprises, despite both towns having a rich history most of the
businesses were started in the last five years. This was in agreement with the national Survey
which established a positive correlation between the age of the businesses and their size. Due to
many businesses being young, the average size of the businesses was also smaller with an
102
average of 1.62 employees per enterprise. This was below the average size in 1999 National
survey of 1.8 employees per enterprise. Only 13.9 percent of the entrepreneurs had
business/entrepreneurship training which was mostly provide in schools at post secondary level.
SMEs Sub-sector
As in many developing countries, the trade sector emerged the most preferred sub-sector.
However, in the current study, the sector emerged to be of the aged and less educated. A negative
correlation between the sub-sector category and the size of the business was also established.
Just like in the 1999 survey, the trade activities seem to disappear as the enterprise increased in
size. On the other hand, the expected female over dominance in the trade category was missing,
with almost an equal gender representation.
Though the trade category was the overall best, in income generation and employment creation
due to the large number of enterprises, manufacturing industry had the highest income and
employment density, when analysis when done per entity. This was in contrast with 1999
National survey which had indicated the trade sub-sector to be the best in terms of income
generation. Never the less, the manufacturing sub-sector was found to be less developed with
most of the enterprises being traditional and homemade.
The Service category which proved to be bigger and modern was mostly a man show affair and
was a favorite of the young and better educated. Entrepreneurs in this category were found to be
more optimistic in national economy performance.
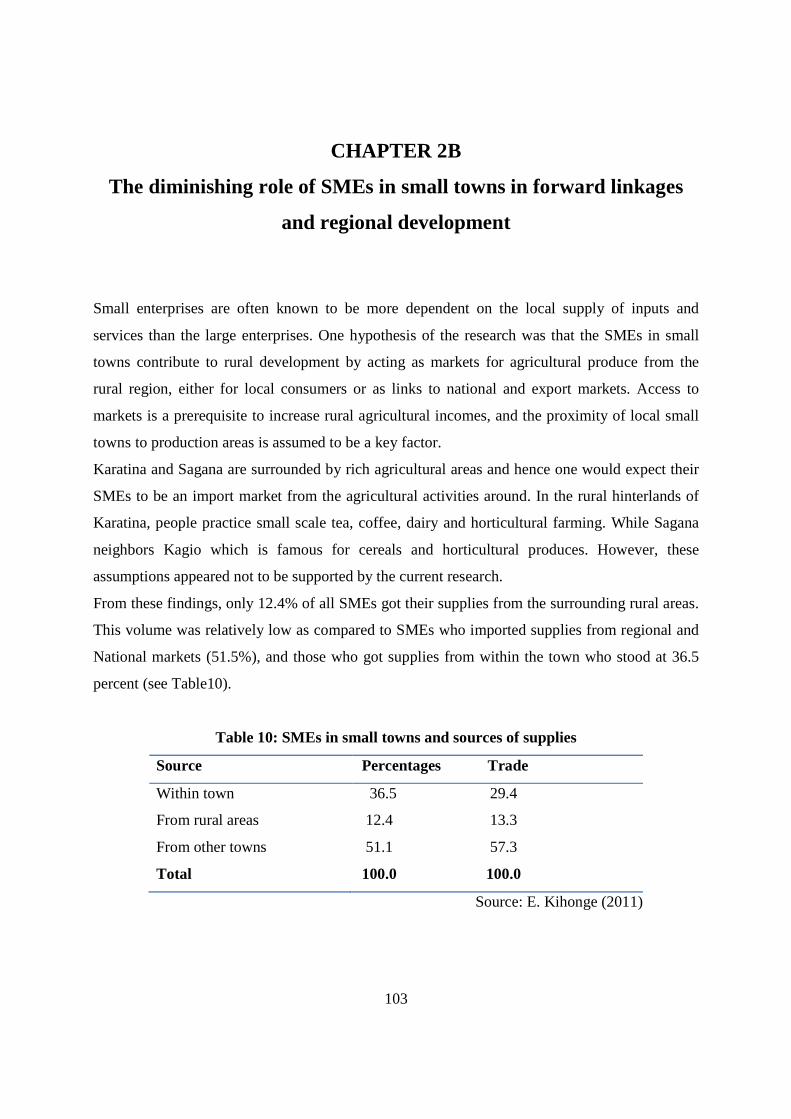
103
CHAPTER 2B
The diminishing role of SMEs in small towns in forward linkages
and regional development
Small enterprises are often known to be more dependent on the local supply of inputs and
services than the large enterprises. One hypothesis of the research was that the SMEs in small
towns contribute to rural development by acting as markets for agricultural produce from the
rural region, either for local consumers or as links to national and export markets. Access to
markets is a prerequisite to increase rural agricultural incomes, and the proximity of local small
towns to production areas is assumed to be a key factor.
Karatina and Sagana are surrounded by rich agricultural areas and hence one would expect their
SMEs to be an import market from the agricultural activities around. In the rural hinterlands of
Karatina, people practice small scale tea, coffee, dairy and horticultural farming. While Sagana
neighbors Kagio which is famous for cereals and horticultural produces. However, these
assumptions appeared not to be supported by the current research.
From these findings, only 12.4% of all SMEs got their supplies from the surrounding rural areas.
This volume was relatively low as compared to SMEs who imported supplies from regional and
National markets (51.5%), and those who got supplies from within the town who stood at 36.5
percent (see Table10).
Table 10: SMEs in small towns and sources of supplies
Source Percentages Trade
Within town 36.5 29.4
From rural areas 12.4 13.3
From other towns
Total
51.1 57.3
100.0 100.0
Source: E. Kihonge (2011)
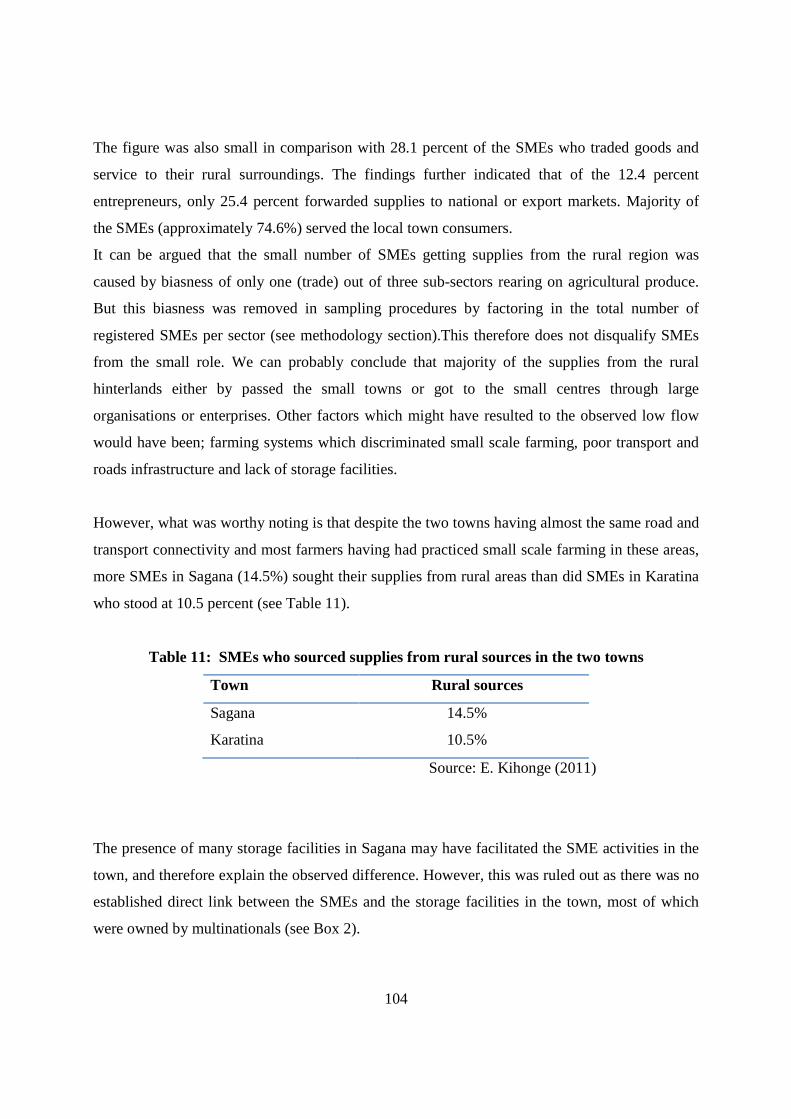
104
The figure was also small in comparison with 28.1 percent of the SMEs who traded goods and
service to their rural surroundings. The findings further indicated that of the 12.4 percent
entrepreneurs, only 25.4 percent forwarded supplies to national or export markets. Majority of
the SMEs (approximately 74.6%) served the local town consumers.
It can be argued that the small number of SMEs getting supplies from the rural region was
caused by biasness of only one (trade) out of three sub-sectors rearing on agricultural produce.
But this biasness was removed in sampling procedures by factoring in the total number of
registered SMEs per sector (see methodology section).This therefore does not disqualify SMEs
from the small role. We can probably conclude that majority of the supplies from the rural
hinterlands either by passed the small towns or got to the small centres through large
organisations or enterprises. Other factors which might have resulted to the observed low flow
would have been; farming systems which discriminated small scale farming, poor transport and
roads infrastructure and lack of storage facilities.
However, what was worthy noting is that despite the two towns having almost the same road and
transport connectivity and most farmers having had practiced small scale farming in these areas,
more SMEs in Sagana (14.5%) sought their supplies from rural areas than did SMEs in Karatina
who stood at 10.5 percent (see Table 11).
Table 11: SMEs who sourced supplies from rural sources in the two towns
Town Rural sources
Sagana 14.5%
Karatina 10.5%
Source: E. Kihonge (2011)
The presence of many storage facilities in Sagana may have facilitated the SME activities in the
town, and therefore explain the observed difference. However, this was ruled out as there was no
established direct link between the SMEs and the storage facilities in the town, most of which
were owned by multinationals (see Box 2).
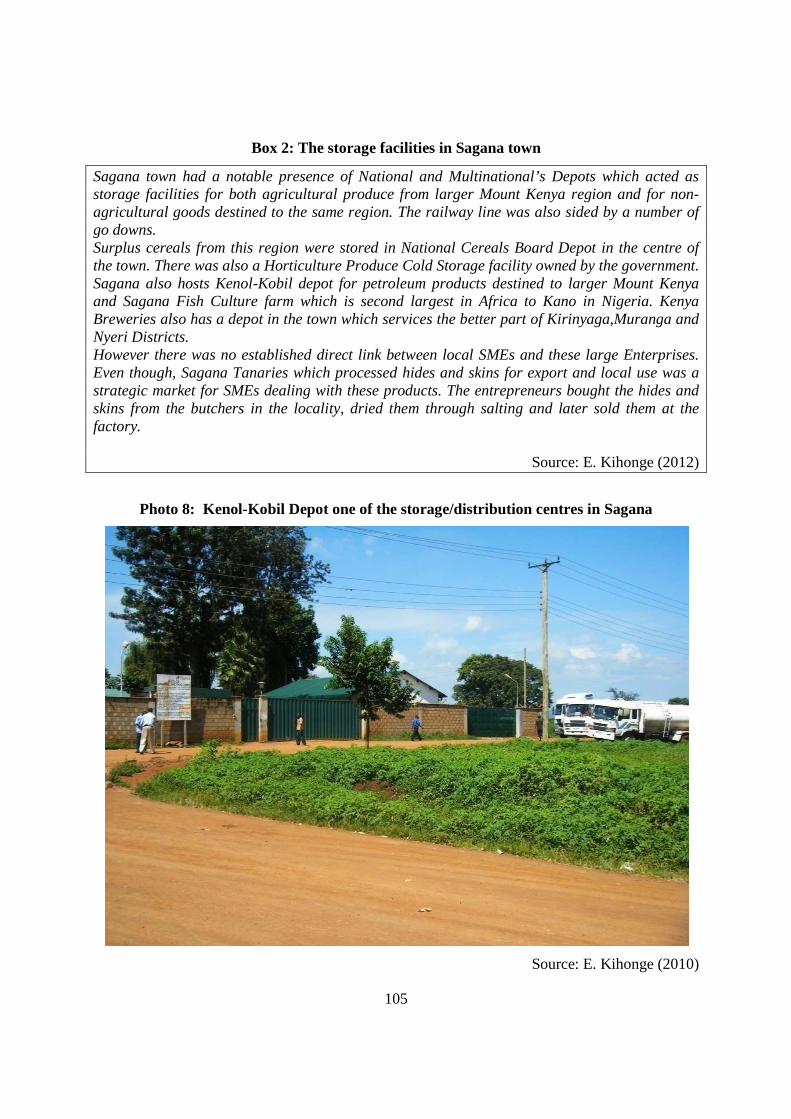
105
Box 2: The storage facilities in Sagana town
Sagana town had a notable presence of National and Multinational’s Depots which acted as storage facilities for both agricultural produce from larger Mount Kenya region and for non-agricultural goods destined to the same region. The railway line was also sided by a number of go downs. Surplus cereals from this region were stored in National Cereals Board Depot in the centre of the town. There was also a Horticulture Produce Cold Storage facility owned by the government. Sagana also hosts Kenol-Kobil depot for petroleum products destined to larger Mount Kenya and Sagana Fish Culture farm which is second largest in Africa to Kano in Nigeria. Kenya Breweries also has a depot in the town which services the better part of Kirinyaga,Muranga and Nyeri Districts. However there was no established direct link between local SMEs and these large Enterprises. Even though, Sagana Tanaries which processed hides and skins for export and local use was a strategic market for SMEs dealing with these products. The entrepreneurs bought the hides and skins from the butchers in the locality, dried them through salting and later sold them at the factory.
Source: E. Kihonge (2012)
Photo 8: Kenol-Kobil Depot one of the storage/distribution centres in Sagana
Source: E. Kihonge (2010)
106
Subsequently, Karatina was observed to have a larger rural catchment area, with 28.4 percent of
its rural supply coming over 30Kilometres as compared to Sagana which had 20 percent supply
within the same region. This might have resulted from increased economic activities brought by
the competition from large organizations/enterprises within or around the town. A fact
emphasized by the observation that SMEs in Karatina relied less on regional and national
markets in supply, with approximately 40.8 percent of its SMEs sourcing supplies from these
markets, as compared to Sagana which had 60.8% of SMEs getting supplies from these sources
(see Table 12). This can be explained by the small intensity of SME activities among others in
Sagana and significant presence of the same in Karatina.
Table 12: SMEs who sourced supplies from national and regional sources
Town Regional/national sources
Sagana 63.8%
Karatina 41.8%
Source: E. Kihonge (2011)
From the findings, the marketing chain created by the Farmers Saccos/companies, the use of
Information and Communication Technologies and contracting farming may have eliminated the
SMEs in the small towns in linking the farmers and the outside world. Other factors may have
included the poor road network to the rural areas and some rules and regulations from both
central and local government which may have negatively affected the SMEs. Business operations
such as hawking activities in raw milk, trade in timber and charcoal were also restricted. Others
such as coffee and tea hawking were illegal.
Farmers Companies/Sacco’s
Coffee, tea, rice, mangoes, French beans, passion fruits and dairy products were marketed
through Farmers Saccos and companies. The Saccos, which were mainly found to have their
main collection and storage points situated outside the towns, had collections centers all over the
rural areas. The Sacco’s were not only marketing centers, despite providing both financial and
non financial services they also ensured better prices by control of quality and bulk selling and
therefore emerging as strong competitors to the SMEs. A good example is the case discussed

107
below of Wakulima Dairies located in Rural Karatina. The case was part of our fieldwork study
with CORUS team in June 2011.
Located in the rural hinterland of Karatina, Wakulima Dairy was started in November 1990 as a
Self Help Group which was collecting milk from local dairy farmers and bulking it to for
processing in Nairobi. The company had a humble beginning with the first milk delivery of
32litres from 35 members.
In December 2006, having outgrown a self help group structure the dairy was elevated to a
public company. Though it could have qualified to become cooperative movement, the members
opted for a public company. This was after many of the members had lost their investments in
the cooperative movements in late 1970s and early 1980s due to political interferences with the
management of the co-operatives. Also the members banked on the fact that, with a limited
company, they would eventually graduate from being members and into shareholders.
Photo 9: Wakulima Dairy Company in Rural Karatina
Source www.wakulimasacco.com

108
A reflection on how the situation is on the ground concerning the membership and future of such
Companies/Saccos. Apart from collecting their supplies direct from the farmers and forwarding
them to big urban centers for processing, the companies also buy some human and animal feeds
directly from the manufactures and loan them to their members. Such a market value chain
excludes the SMEs entrepreneurs in the small towns in both forward (from) and backward (to)
linkages.
Today the company collects up to 30,000 liters per day from over 16,000 farmers. It has two
cooling tanks which have a 25,000 liters holding capacity at any given time. Besides this, it has
10 trucks that collect its shareholders’ raw milk from various points in the area. Amongst other
investments include an animal feeds manufacturing factory, and, a Sacco that offers farmers
Front Office Service Activities (Fosa) and a veterinary department that offer veterinary services.
Use of ICTs
The use of Information and Communication Technologies in linking the farmers with potential
consumers could also have had an impact on the lesser role played by SMEs in forward linkages.
Traders have been associated with exploiting the farmers by taking advantage of lack of price
information on the farmers’ side. Since mostly the farmer does not have a direct connection with
the buyers in other areas, the traders are arguably assumed to buy from them at a throw away
price and later make a ‘kill’ on sale of the same to customers in urban market.
Non government organizations are spearheading these ICT programs in Kenya which isolate the
traders from the supply value chain. A good example is ‘Drumnet ‘a non-governmental
organization which has set its activities in Karatina. Their reason for wanting to exclude the
traders in the forward linkage is well captured in the below article taken from their website
(www. drumbeat.org)
…..At dawn, while Kenya turns in its sleep, Peter Kimani is awake and on his way to Karatina
Central Farmers Market, the largest produce market in Eastern Africa, to dispose of his
produce. The onions, tomatoes, cabbages, and avocadoes will later be transported to Wakulima
Market in Nairobi, the largest wholesale farmers market in East Africa, with about
10 000 traders.
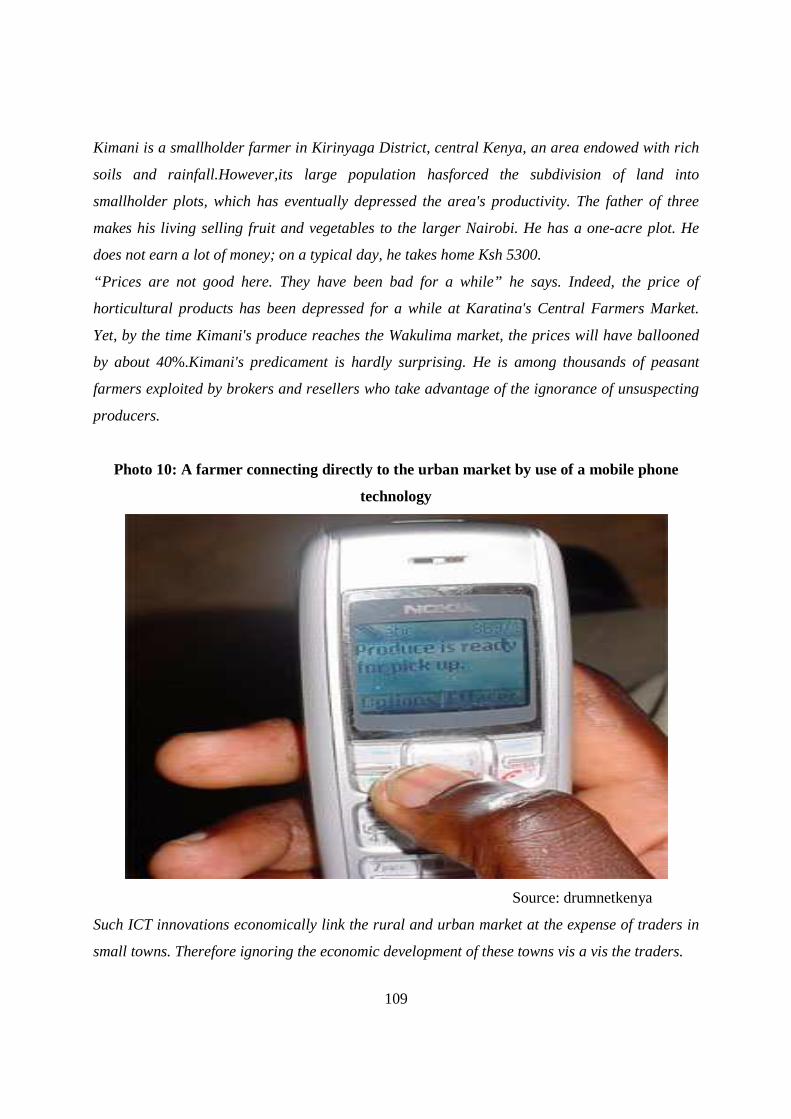
109
Kimani is a smallholder farmer in Kirinyaga District, central Kenya, an area endowed with rich
soils and rainfall.However,its large population hasforced the subdivision of land into
smallholder plots, which has eventually depressed the area's productivity. The father of three
makes his living selling fruit and vegetables to the larger Nairobi. He has a one-acre plot. He
does not earn a lot of money; on a typical day, he takes home Ksh 5300.
“Prices are not good here. They have been bad for a while” he says. Indeed, the price of
horticultural products has been depressed for a while at Karatina's Central Farmers Market.
Yet, by the time Kimani's produce reaches the Wakulima market, the prices will have ballooned
by about 40%.Kimani's predicament is hardly surprising. He is among thousands of peasant
farmers exploited by brokers and resellers who take advantage of the ignorance of unsuspecting
producers.
Photo 10: A farmer connecting directly to the urban market by use of a mobile phone
technology
Source: drumnetkenya
Such ICT innovations economically link the rural and urban market at the expense of traders in
small towns. Therefore ignoring the economic development of these towns vis a vis the traders.
110
DrumNet has established what they are calling rural “Information Kiosks” (makeshift shops) to
provide free information to local smallholder farmers about the current prices of commodities on
a daily basis. These information kiosks are equipped with computers that track retail, wholesale,
and export prices and make them available to a representative group of farmers involved in the
research. With the Internet linking producers to consumers, organization hopes the farmers are
likely to get better value for their produce.
Yet this objective will only be achieved at the expense of the traders in the small towns. Such an
initiative should be well analyzed, as it will end up removing the traders from the supply chain.
More often than not we assume their role far too much. Most of these traders are based in small
rural towns and isolating them from the value chain means isolating the development of these
towns where most farmers’ markets are based. However, the use of ICTs has proved to be
important in the development of enclave industries in the small towns as discussed in next
chapter.
Contracting farming
Another possible factor that could have negatively impacted on the role of SMEs in these towns
is the presence of contracting farming in the rural-hinterlands. According to Eaton and Shepherd,
(2001), contracting farming is one form of vertical co-operation along value chains where a
farmer or producer organization co-operates with a marketing partner (wholesaler or agro-
processor) by stipulating regulations and mutual liabilities within a contract on the production,
supply and acceptance of the agricultural produce.
This kind of cooperation ensures the farmer sells his/her produce to the contracting partner only.
Most of these systems were found in the rural Sagana and it involves crops such as mangoes,
avocadoes, passion fruits, French beans and potatoes. Among the contracting firms found
operating in this region included; Kenya Horticultural Exporters, Horticulture Crop Development
Authority (HCDA), Greenland agro-processors, Kenya agricultural exporters and Meru green
horticulture, all which had headquarters in Nairobi. These firms comes with a lot of ‘goodies’ to
the farmers and it is very difficult for traders to buy their produce, unless when the farmer wants
some quick cash, of which the buying price is also high in this case. Some of the appetizing
offers to the farmers include; security for sale of agricultural production for certain quantities,
minimization and distribution of risks, increase of income through favorable prices for inputs as
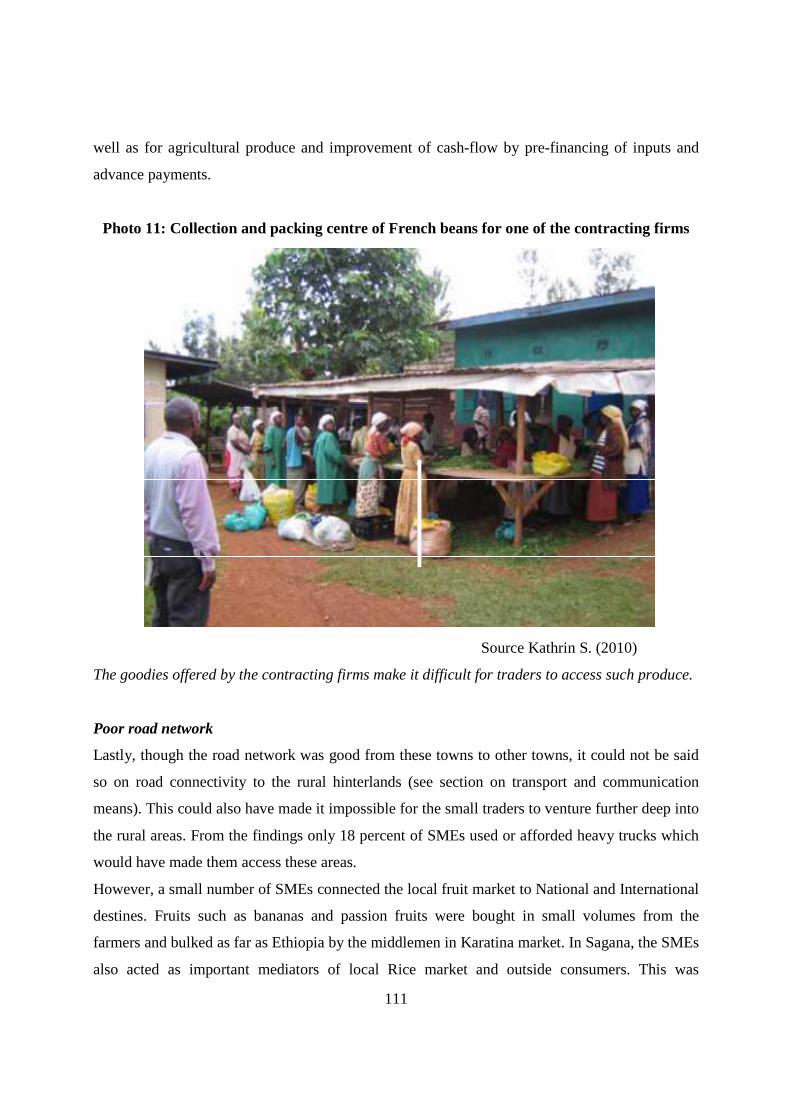
111
well as for agricultural produce and improvement of cash-flow by pre-financing of inputs and
advance payments.
Photo 11: Collection and packing centre of French beans for one of the contracting firms
Source Kathrin S. (2010)
The goodies offered by the contracting firms make it difficult for traders to access such produce.
Poor road network
Lastly, though the road network was good from these towns to other towns, it could not be said
so on road connectivity to the rural hinterlands (see section on transport and communication
means). This could also have made it impossible for the small traders to venture further deep into
the rural areas. From the findings only 18 percent of SMEs used or afforded heavy trucks which
would have made them access these areas.
However, a small number of SMEs connected the local fruit market to National and International
destines. Fruits such as bananas and passion fruits were bought in small volumes from the
farmers and bulked as far as Ethiopia by the middlemen in Karatina market. In Sagana, the SMEs
also acted as important mediators of local Rice market and outside consumers. This was
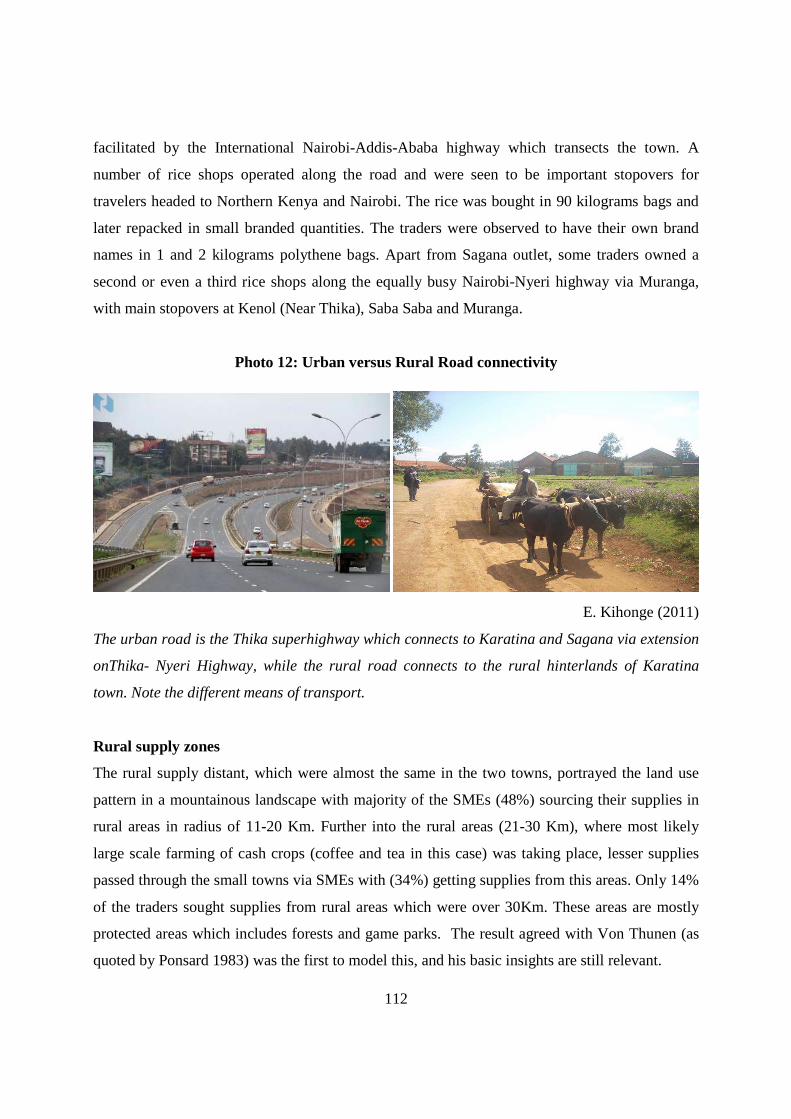
112
facilitated by the International Nairobi-Addis-Ababa highway which transects the town. A
number of rice shops operated along the road and were seen to be important stopovers for
travelers headed to Northern Kenya and Nairobi. The rice was bought in 90 kilograms bags and
later repacked in small branded quantities. The traders were observed to have their own brand
names in 1 and 2 kilograms polythene bags. Apart from Sagana outlet, some traders owned a
second or even a third rice shops along the equally busy Nairobi-Nyeri highway via Muranga,
with main stopovers at Kenol (Near Thika), Saba Saba and Muranga.
Photo 12: Urban versus Rural Road connectivity
E. Kihonge (2011)
The urban road is the Thika superhighway which connects to Karatina and Sagana via extension
onThika- Nyeri Highway, while the rural road connects to the rural hinterlands of Karatina
town. Note the different means of transport.
Rural supply zones
The rural supply distant, which were almost the same in the two towns, portrayed the land use
pattern in a mountainous landscape with majority of the SMEs (48%) sourcing their supplies in
rural areas in radius of 11-20 Km. Further into the rural areas (21-30 Km), where most likely
large scale farming of cash crops (coffee and tea in this case) was taking place, lesser supplies
passed through the small towns via SMEs with (34%) getting supplies from this areas. Only 14%
of the traders sought supplies from rural areas which were over 30Km. These areas are mostly
protected areas which includes forests and game parks. The result agreed with Von Thunen (as
quoted by Ponsard 1983) was the first to model this, and his basic insights are still relevant.
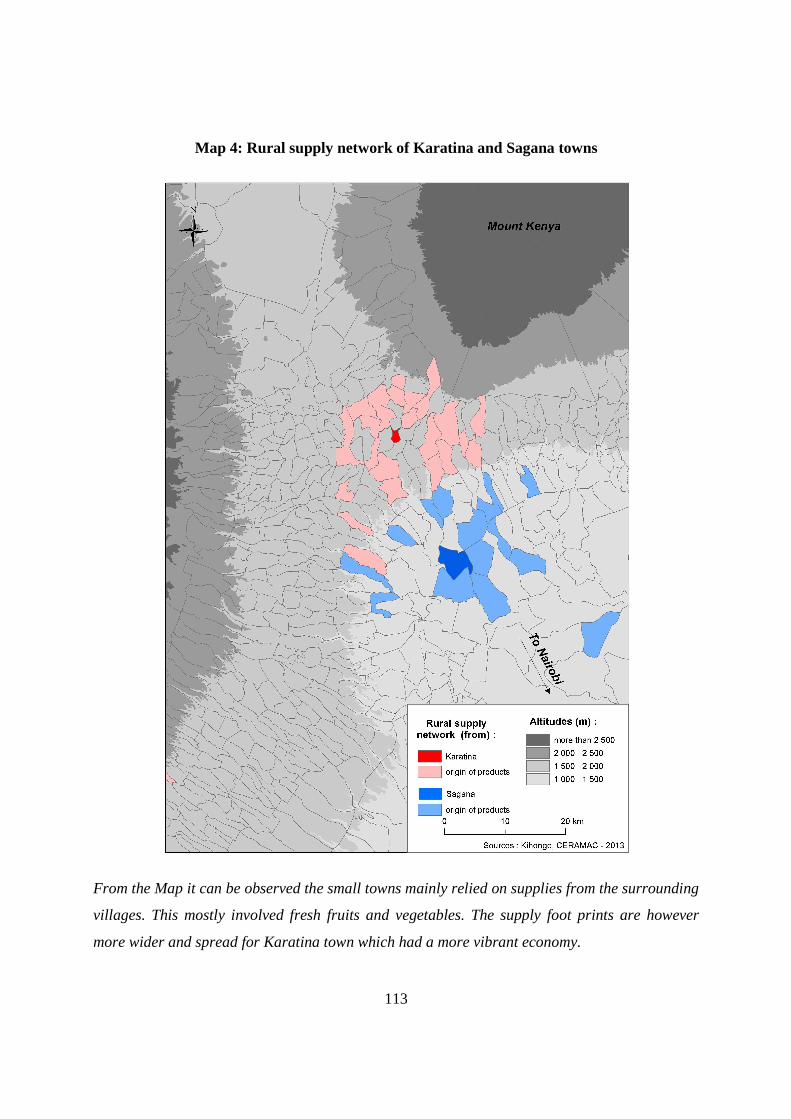
113
Map 4: Rural supply network of Karatina and Sagana towns
From the Map it can be observed the small towns mainly relied on supplies from the surrounding
villages. This mostly involved fresh fruits and vegetables. The supply foot prints are however
more wider and spread for Karatina town which had a more vibrant economy.
114
Basically he outlined that proximity to urban centers will determine cropping patterns. Perishable
crops (such as vegetables) will be grown near the centre, while non-perishable crops (such as
cereals) will be grown further away. In very remote areas, agriculture is no longer profitable and
here land is left in its natural state (e.g. nature reserves).
Transport and Communication means
Approximately 77 percent of the SMEs were found to travel to the rural areas to get the supplies
while almost 23 percent of the supplies were delivered by the farmer. The study further revealed
that almost 50 percent of these traders replenished their supplies on a daily basis, followed by
those who restocked on weekly basis at 13.6 percent. This again supports the fact that most of
the SMEs mostly acted as demand centers of mainly perishable produce from the rural regions,
which included fruits, vegetables and other high value crops such as carrots.
Transport connectivity from the rural areas to the small centers was found to be poor if not worse
in the two towns. Almost all the roads to the rural hinterlands were not asphalted. The transport
means varied from one entrepreneur to the other mostly depending on distant and quantity of
goods. Matatus (a 14 sitter cabin, which is the most common mode of travel in Kenya) were
found to be the most common means of transport in both towns with approximately 32.7 percent
of entrepreneurs using them to transport their supplies. It was further observed that although the
matatus are mostly meant for passengers, at times they combined both passengers and loads on
almost 50:50 bases, and in other cases an entrepreneur would hire the curb for his load only.
Motor cycles boda bodas (taxis) was the second most preferred means of transport of with 22
percent using this means. However, though motorcycle boda bodas were quickly picking up as
the second most preferred transport mean, their ownership structure may be doing more harm
than good (see Box 3). Hired trucks, bicycles boda bodas and traditional means such as donkey
cart were each used by approximately 15 percent of the entrepreneurs. It was further observed
that a significant percentage of the SMEs (7.5%) carried their loads on foot or walked their
animals to their selling points. This means of transport was most common in Sagana than
Karatina which was earlier found to have a large foot print into the rural areas.
Though the towns were served with a railway network, no respondent used the train neither from
rural areas through which the line transverses nor to other towns served by the train. The railway
transport is almost stalled in Kenya and the few trips made to areas outside Nairobi are unreliable
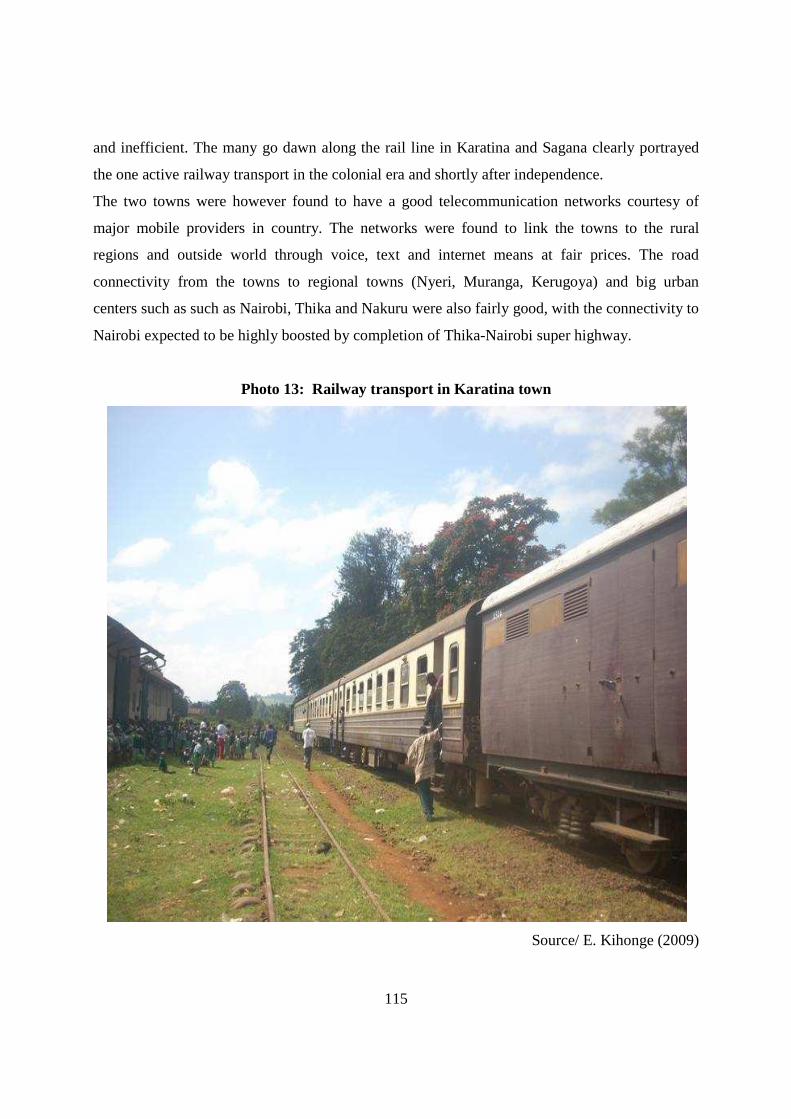
115
and inefficient. The many go dawn along the rail line in Karatina and Sagana clearly portrayed
the one active railway transport in the colonial era and shortly after independence.
The two towns were however found to have a good telecommunication networks courtesy of
major mobile providers in country. The networks were found to link the towns to the rural
regions and outside world through voice, text and internet means at fair prices. The road
connectivity from the towns to regional towns (Nyeri, Muranga, Kerugoya) and big urban
centers such as such as Nairobi, Thika and Nakuru were also fairly good, with the connectivity to
Nairobi expected to be highly boosted by completion of Thika-Nairobi super highway.
Photo 13: Railway transport in Karatina town
Source/ E. Kihonge (2009)
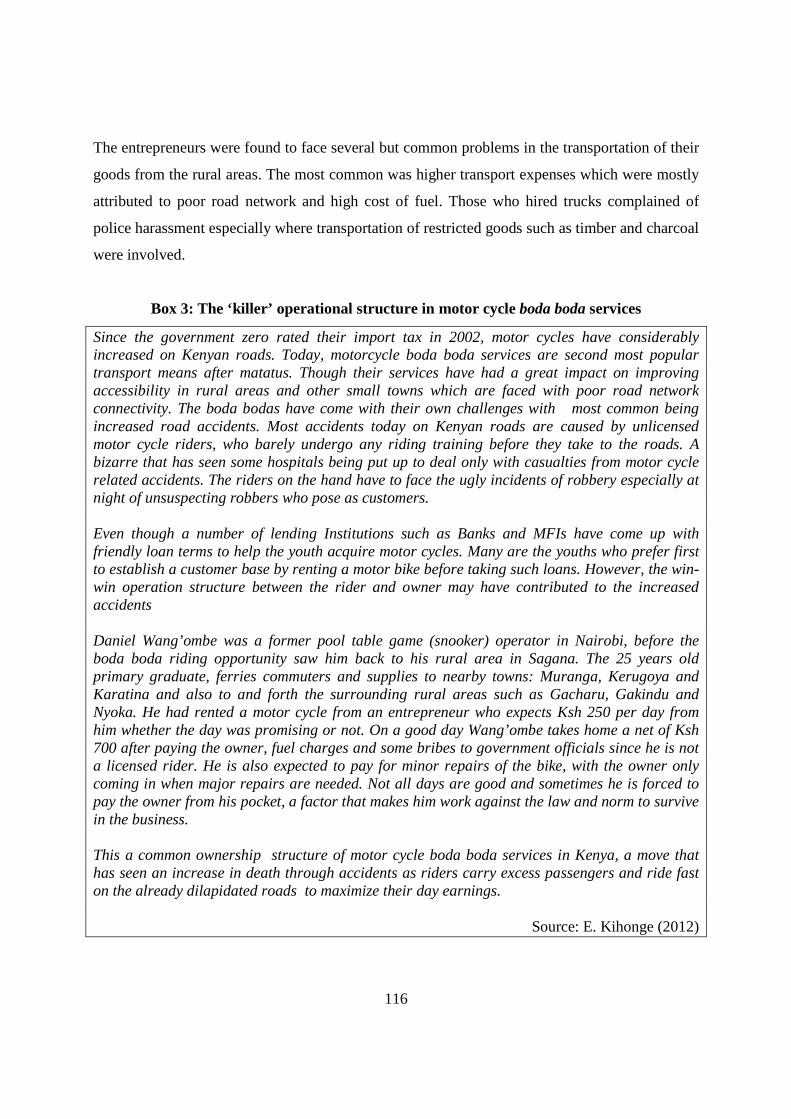
116
The entrepreneurs were found to face several but common problems in the transportation of their
goods from the rural areas. The most common was higher transport expenses which were mostly
attributed to poor road network and high cost of fuel. Those who hired trucks complained of
police harassment especially where transportation of restricted goods such as timber and charcoal
were involved.
Box 3: The ‘killer’ operational structure in motor cycle boda boda services
Since the government zero rated their import tax in 2002, motor cycles have considerably increased on Kenyan roads. Today, motorcycle boda boda services are second most popular transport means after matatus. Though their services have had a great impact on improving accessibility in rural areas and other small towns which are faced with poor road network connectivity. The boda bodas have come with their own challenges with most common being increased road accidents. Most accidents today on Kenyan roads are caused by unlicensed motor cycle riders, who barely undergo any riding training before they take to the roads. A bizarre that has seen some hospitals being put up to deal only with casualties from motor cycle related accidents. The riders on the hand have to face the ugly incidents of robbery especially at night of unsuspecting robbers who pose as customers. Even though a number of lending Institutions such as Banks and MFIs have come up with friendly loan terms to help the youth acquire motor cycles. Many are the youths who prefer first to establish a customer base by renting a motor bike before taking such loans. However, the win-win operation structure between the rider and owner may have contributed to the increased accidents Daniel Wang’ombe was a former pool table game (snooker) operator in Nairobi, before the boda boda riding opportunity saw him back to his rural area in Sagana. The 25 years old primary graduate, ferries commuters and supplies to nearby towns: Muranga, Kerugoya and Karatina and also to and forth the surrounding rural areas such as Gacharu, Gakindu and Nyoka. He had rented a motor cycle from an entrepreneur who expects Ksh 250 per day from him whether the day was promising or not. On a good day Wang’ombe takes home a net of Ksh 700 after paying the owner, fuel charges and some bribes to government officials since he is not a licensed rider. He is also expected to pay for minor repairs of the bike, with the owner only coming in when major repairs are needed. Not all days are good and sometimes he is forced to pay the owner from his pocket, a factor that makes him work against the law and norm to survive in the business. This a common ownership structure of motor cycle boda boda services in Kenya, a move that has seen an increase in death through accidents as riders carry excess passengers and ride fast on the already dilapidated roads to maximize their day earnings.
Source: E. Kihonge (2012)

117
Photo 14: Motor cycle ‘boda bodas’ in Karatina
Source: H. Mainet (2010)
Rural-urban flow patterns
SMEs in Karatina lead in forwarding of supplies with 20 percent of those who bought supplies
from rural region selling them to regional and national markets as compared to Sagana where
only 8.1 percent of the SMEs forwarded to these markets. In Karatina, approximately 45 percent
of the SMEs exported to towns which were between 21-30 Kilometers, with Nyeri, Muranga and
Kerugoya towns topping the list. Those sold to towns which were between 31-50 Kilometers
were 32 percent and mainly to Thika and Nanyuki towns.
Approximately 18 percent of the SMEs were found to sell their produce in towns which were
over 50 Kilometers, with Nairobi and Nakuru topping this list. Only 15 percent of the SMEs sold
to towns which were less than 10 Kilometers away with Kibingoti and Chaka towns leading.
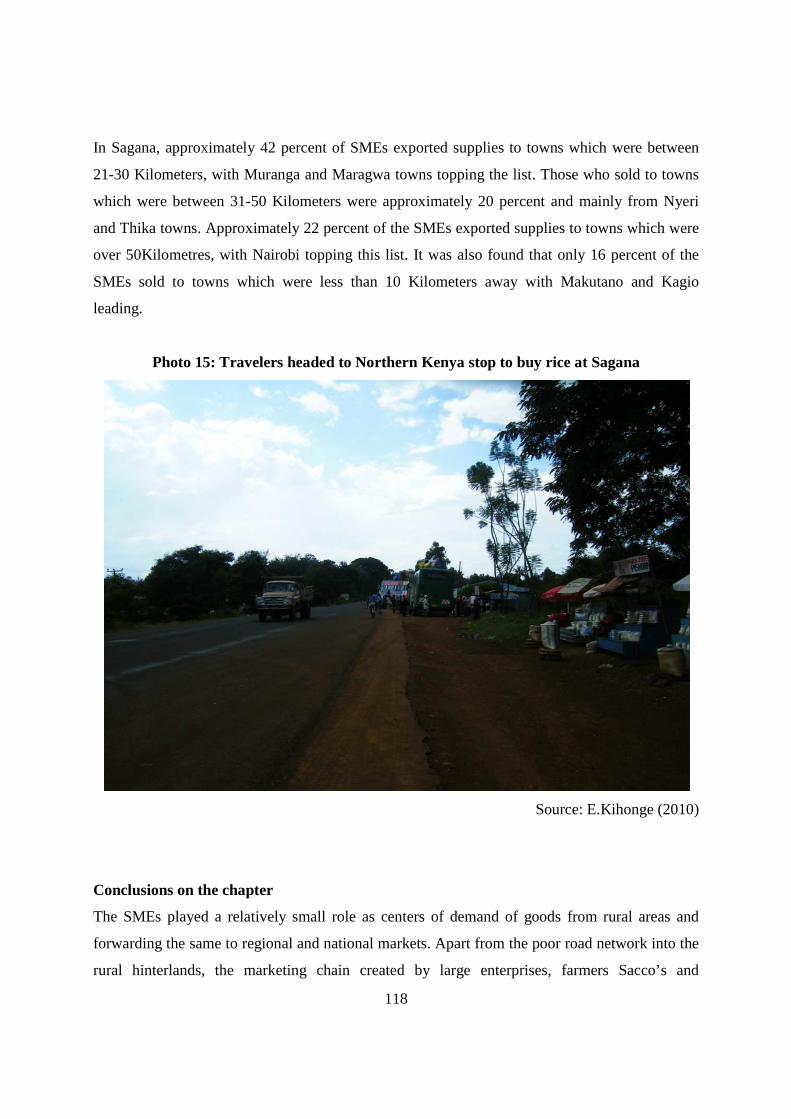
118
In Sagana, approximately 42 percent of SMEs exported supplies to towns which were between
21-30 Kilometers, with Muranga and Maragwa towns topping the list. Those who sold to towns
which were between 31-50 Kilometers were approximately 20 percent and mainly from Nyeri
and Thika towns. Approximately 22 percent of the SMEs exported supplies to towns which were
over 50Kilometres, with Nairobi topping this list. It was also found that only 16 percent of the
SMEs sold to towns which were less than 10 Kilometers away with Makutano and Kagio
leading.
Photo 15: Travelers headed to Northern Kenya stop to buy rice at Sagana
Source: E.Kihonge (2010)
Conclusions on the chapter
The SMEs played a relatively small role as centers of demand of goods from rural areas and
forwarding the same to regional and national markets. Apart from the poor road network into the
rural hinterlands, the marketing chain created by large enterprises, farmers Sacco’s and

119
middlemen from larger urban centers may have a big stake in outdoing the SMEs in forward
linkages. Most of the supplies that the SMEs brought to the small towns also ended up in local
market with only a small percentage exported to outside markets. However, some factors such as
the market in Karatina town and the highway in Sagana were found to be important nodes
through which SMEs linked the rural and national markets.
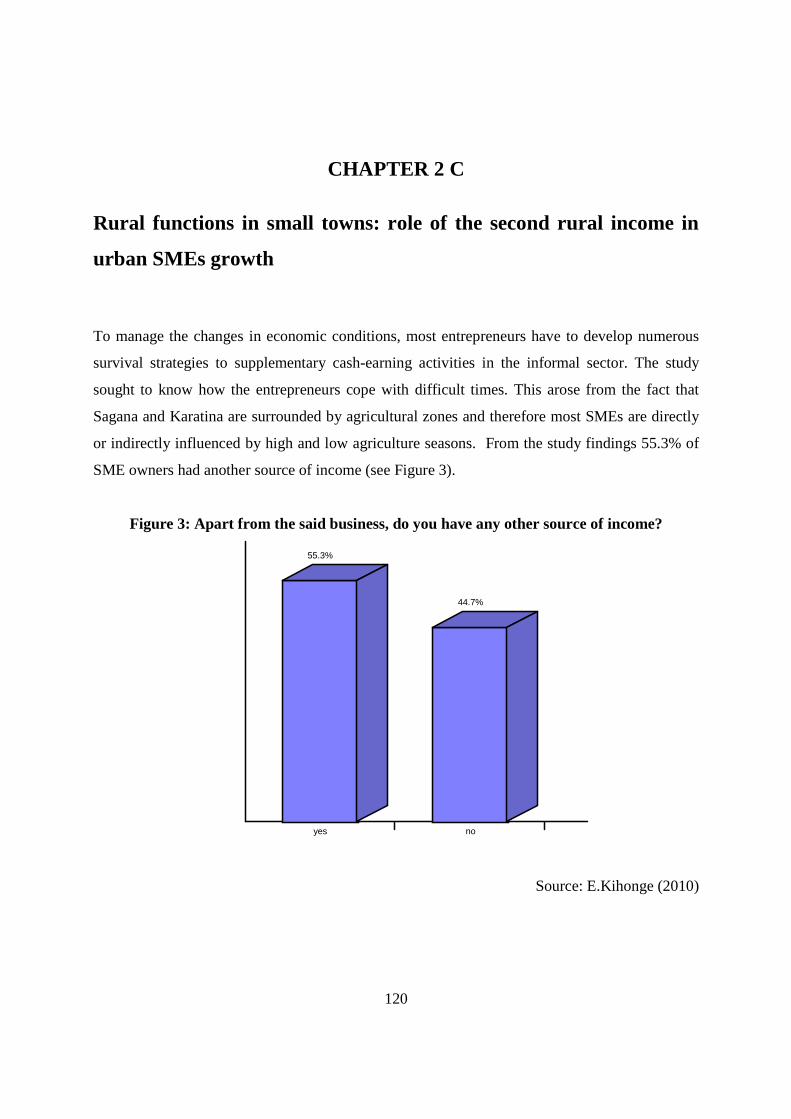
120
CHAPTER 2 C
Rural functions in small towns: role of the second rural income in
urban SMEs growth
To manage the changes in economic conditions, most entrepreneurs have to develop numerous
survival strategies to supplementary cash-earning activities in the informal sector. The study
sought to know how the entrepreneurs cope with difficult times. This arose from the fact that
Sagana and Karatina are surrounded by agricultural zones and therefore most SMEs are directly
or indirectly influenced by high and low agriculture seasons. From the study findings 55.3% of
SME owners had another source of income (see Figure 3).
Figure 3: Apart from the said business, do you have any other source of income?
Source: E.Kihonge (2010)
yes
55.3%
no
44.7%

121
A high percentage, approximately 65 percent of these second sources of income were found to be
in rural areas which and mostly involved small scale agricultural farming and animal keeping
such as cow, sheep and goat rearing. The total number of SMEs who had rural activities as the
second source of income was found to be approximately 32.5 percent. Box 4 below gives a case
of one entrepreneur in Sagana whose business depended on the rural activities.
Box 4: Rural functions in urban SMEs- the case of Murimi Karume
Murimi Karume owned a well known small manufacturing venture in the heart of Sagana. His business was famous for welding and metal fabrication works, both in the town and in the surrounding rural region, which included his rural home Mucagara and neighboring Gakindu, Thanju and Kamuthanga villages. The 32 years old entrepreneur was married and lived with his wife and two children in Sagana town. However the first born in a family of five visited his rural home which about 5 kilometers away almost on daily basis. …I visit Mucagara every other day…. A response that aroused my suspicion on why the daily visits and yet he lived with his family in the town. His name “Murimi” and his business “Favorite Metal works and Fabrications Enterprises” shared the same root and link. Murimi is a Kikuyu name for a farmer and through farming he was able to save Ksh 40,000 seed money to venture into manufacturing business in 2001 after his technical training course from nearby Muranga Technical College. He juggled between the two careers to standardize the ‘crescents’ and ‘troughs’ created by ups and downs of the business operation wave. The earnings from his small manufacturing business which also served clients from near (Nyeri Muranga, Kerugoya) and far (Nairobi, Thika, Kiambu,) towns, peaked in two seasons per year. From March to June and from October to mid December with a break of low season from July to September. In the good times which corresponded to the rainy and green seasons in Kenya, he made between Ksh 35,000 to 58,000 per month in turnovers. It was during this period that he was able to put aside some ‘savings’ by restocking his heard of cattle and goats in his rural home. The income from the sale of the animals supplemented his business earnings in the low seasons which hit low of Ksh 18,000 to 30,000 per month. This strategy did not only enable him survive for the whole year by meeting his many business and family expenses which included wages of two workers and rent of his manufacturing shed, but he had also made other investments. Today besides his business being worthy Ksh585, 000 to 700,000, which includes a mini truck which he uses to transport raw materials from Muranga town which is 25 Kilometers away, Murimi is also a proud owner of a plot of land in the heart of Sagana. ….You should take a business loan and put up butchery…I suggested as he showed me his newly acquired plot of land in Sagana town….. I don’t believe in loans and am OK with how I operate my businesses. (…) I want to use my own savings to put up a church said Murimi. ‘Sheep’ are also important… I added as I concluded the interview.
Source: E.Kihonge (2012)
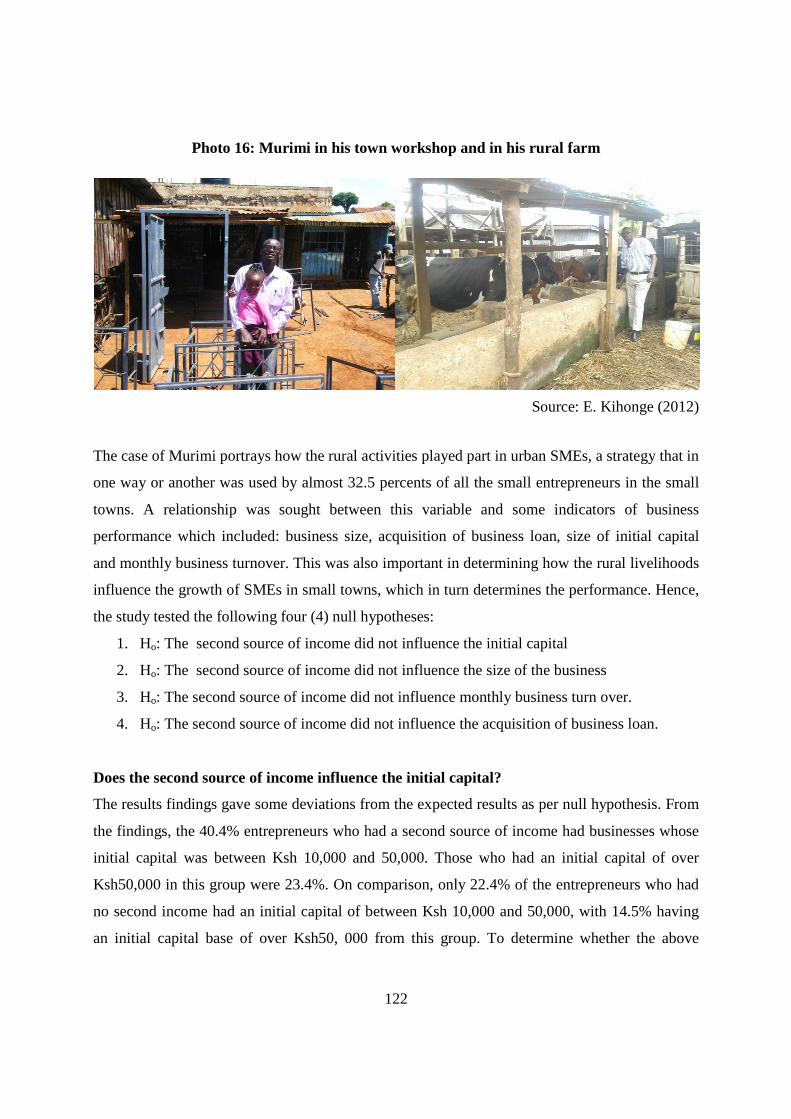
122
Photo 16: Murimi in his town workshop and in his rural farm
Source: E. Kihonge (2012)
The case of Murimi portrays how the rural activities played part in urban SMEs, a strategy that in
one way or another was used by almost 32.5 percents of all the small entrepreneurs in the small
towns. A relationship was sought between this variable and some indicators of business
performance which included: business size, acquisition of business loan, size of initial capital
and monthly business turnover. This was also important in determining how the rural livelihoods
influence the growth of SMEs in small towns, which in turn determines the performance. Hence,
the study tested the following four (4) null hypotheses:
1. Ho: The second source of income did not influence the initial capital
2. Ho: The second source of income did not influence the size of the business
3. Ho: The second source of income did not influence monthly business turn over.
4. Ho: The second source of income did not influence the acquisition of business loan.
Does the second source of income influence the initial capital?
The results findings gave some deviations from the expected results as per null hypothesis. From
the findings, the 40.4% entrepreneurs who had a second source of income had businesses whose
initial capital was between Ksh 10,000 and 50,000. Those who had an initial capital of over
Ksh50,000 in this group were 23.4%. On comparison, only 22.4% of the entrepreneurs who had
no second income had an initial capital of between Ksh 10,000 and 50,000, with 14.5% having
an initial capital base of over Ksh50, 000 from this group. To determine whether the above
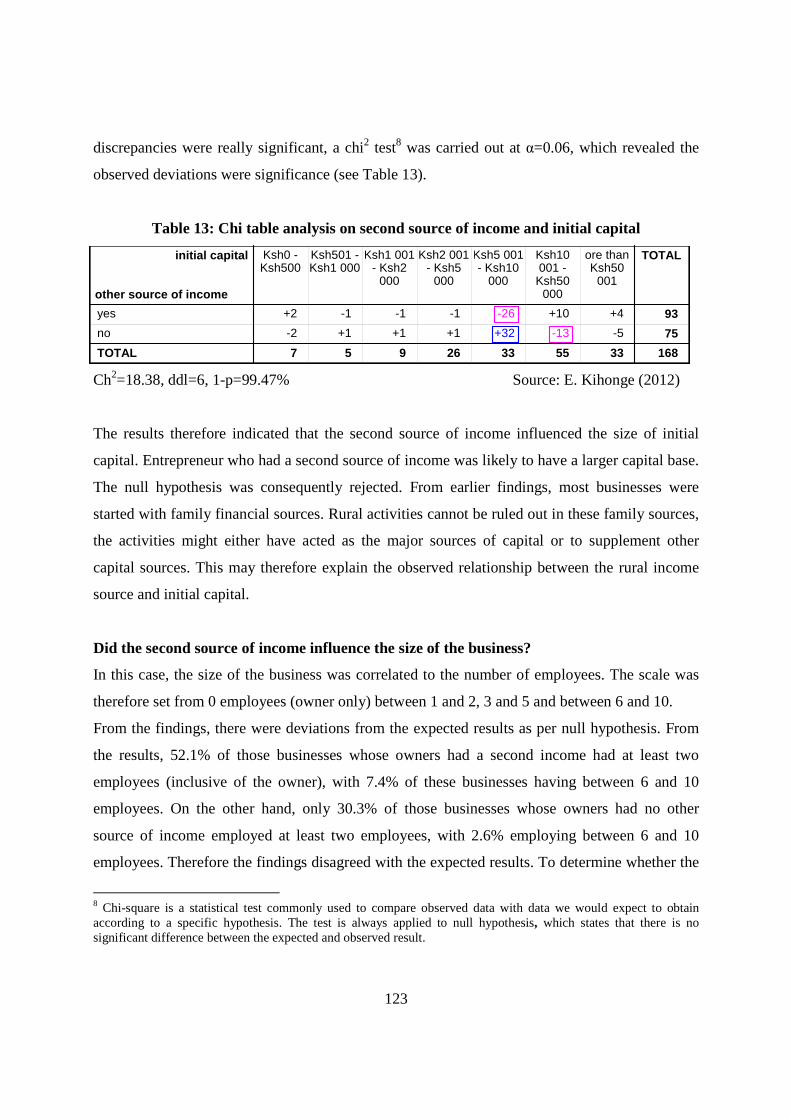
123
initial capital
other source of income
yes
no
TOTAL
Ksh0 -Ksh500
Ksh501 -Ksh1 000
Ksh1 001- Ksh2
000
Ksh2 001- Ksh5
000
Ksh5 001- Ksh10
000
Ksh10001 -
Ksh50000
ore thanKsh50
001
TOTAL
+2 -1 -1 -1 -26 +10 +4 93
-2 +1 +1 +1 +32 -13 -5 75
7 5 9 26 33 55 33 168
discrepancies were really significant, a chi2 test8 was carried out at α=0.06, which revealed the
observed deviations were significance (see Table 13).
Table 13: Chi table analysis on second source of income and initial capital
Ch2=18.38, ddl=6, 1-p=99.47% Source: E. Kihonge (2012)
The results therefore indicated that the second source of income influenced the size of initial
capital. Entrepreneur who had a second source of income was likely to have a larger capital base.
The null hypothesis was consequently rejected. From earlier findings, most businesses were
started with family financial sources. Rural activities cannot be ruled out in these family sources,
the activities might either have acted as the major sources of capital or to supplement other
capital sources. This may therefore explain the observed relationship between the rural income
source and initial capital.
Did the second source of income influence the size of the business?
In this case, the size of the business was correlated to the number of employees. The scale was
therefore set from 0 employees (owner only) between 1 and 2, 3 and 5 and between 6 and 10.
From the findings, there were deviations from the expected results as per null hypothesis. From
the results, 52.1% of those businesses whose owners had a second income had at least two
employees (inclusive of the owner), with 7.4% of these businesses having between 6 and 10
employees. On the other hand, only 30.3% of those businesses whose owners had no other
source of income employed at least two employees, with 2.6% employing between 6 and 10
employees. Therefore the findings disagreed with the expected results. To determine whether the
8 Chi-square is a statistical test commonly used to compare observed data with data we would expect to obtain according to a specific hypothesis. The test is always applied to null hypothesis, which states that there is no significant difference between the expected and observed result.
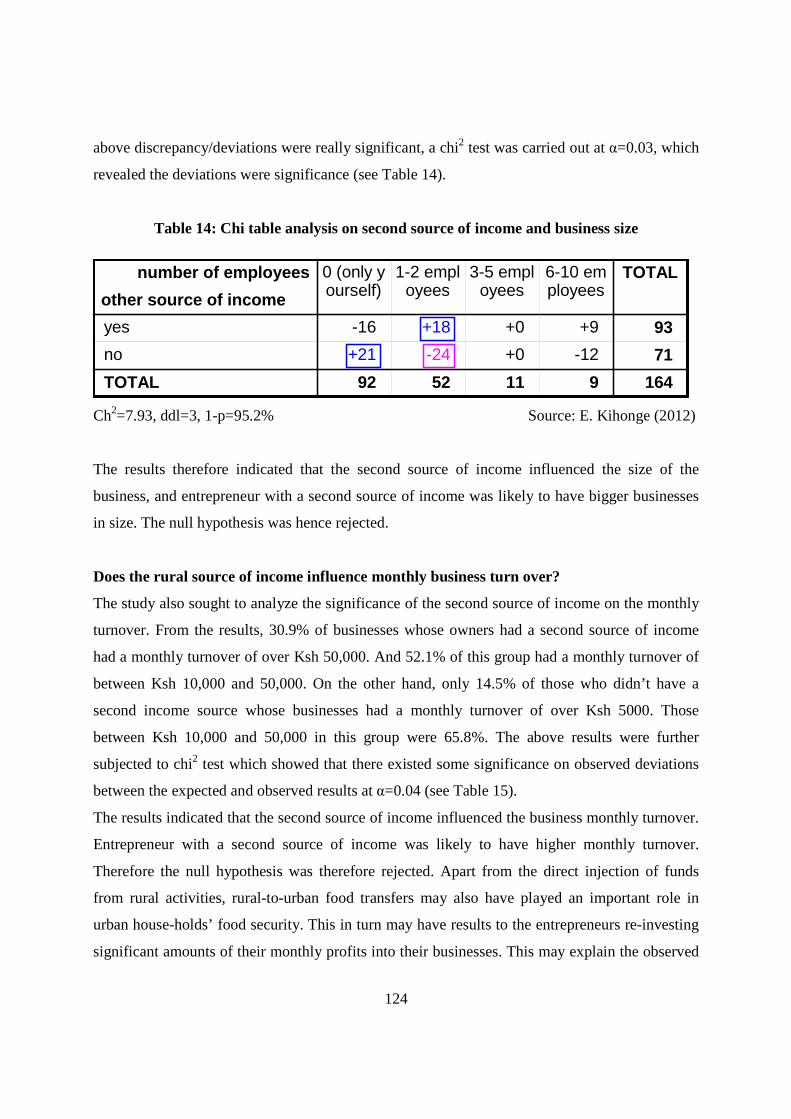
124
number of employees
other source of income
yes
no
TOTAL
0 (only yourself)
1-2 employees
3-5 employees
6-10 employees
TOTAL
-16 +18 +0 +9 93
+21 -24 +0 -12 71
92 52 11 9 164
above discrepancy/deviations were really significant, a chi2 test was carried out at α=0.03, which
revealed the deviations were significance (see Table 14).
Table 14: Chi table analysis on second source of income and business size
Ch2=7.93, ddl=3, 1-p=95.2% Source: E. Kihonge (2012)
The results therefore indicated that the second source of income influenced the size of the
business, and entrepreneur with a second source of income was likely to have bigger businesses
in size. The null hypothesis was hence rejected.
Does the rural source of income influence monthly business turn over?
The study also sought to analyze the significance of the second source of income on the monthly
turnover. From the results, 30.9% of businesses whose owners had a second source of income
had a monthly turnover of over Ksh 50,000. And 52.1% of this group had a monthly turnover of
between Ksh 10,000 and 50,000. On the other hand, only 14.5% of those who didn’t have a
second income source whose businesses had a monthly turnover of over Ksh 5000. Those
between Ksh 10,000 and 50,000 in this group were 65.8%. The above results were further
subjected to chi2 test which showed that there existed some significance on observed deviations
between the expected and observed results at α=0.04 (see Table 15).
The results indicated that the second source of income influenced the business monthly turnover.
Entrepreneur with a second source of income was likely to have higher monthly turnover.
Therefore the null hypothesis was therefore rejected. Apart from the direct injection of funds
from rural activities, rural-to-urban food transfers may also have played an important role in
urban house-holds’ food security. This in turn may have results to the entrepreneurs re-investing
significant amounts of their monthly profits into their businesses. This may explain the observed
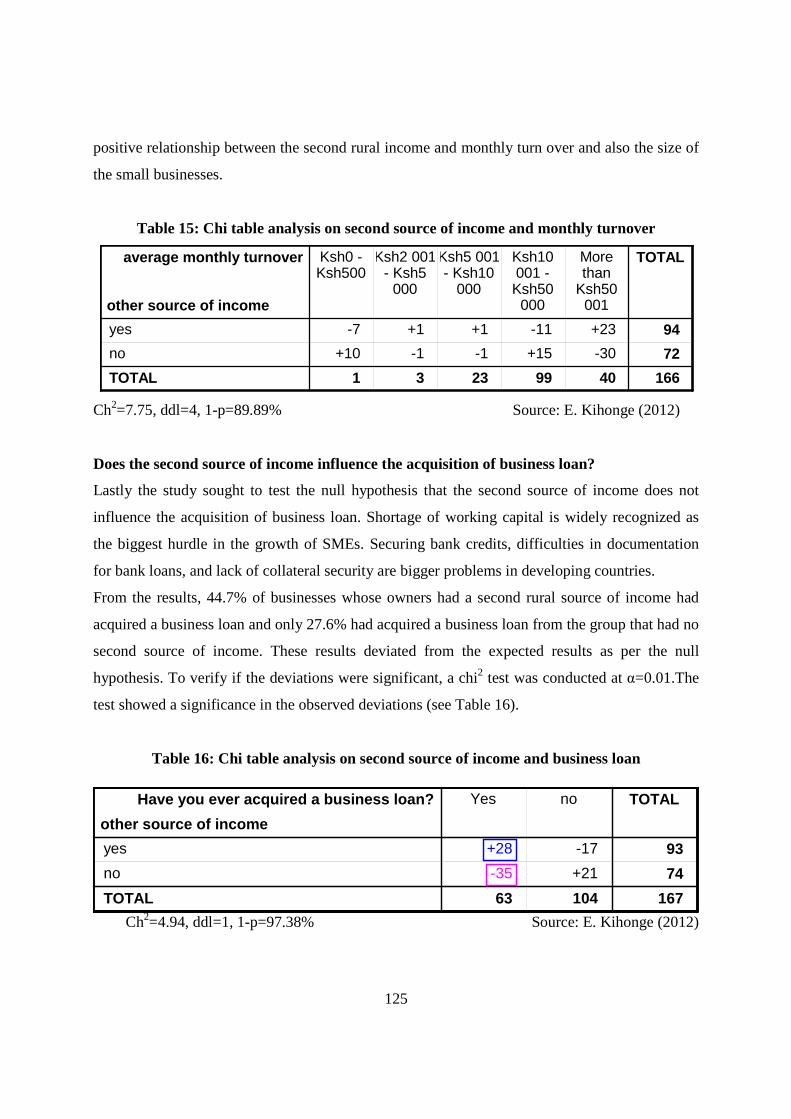
125
positive relationship between the second rural income and monthly turn over and also the size of
the small businesses.
Table 15: Chi table analysis on second source of income and monthly turnover
Ch2=7.75, ddl=4, 1-p=89.89% Source: E. Kihonge (2012)
Does the second source of income influence the acquisition of business loan?
Lastly the study sought to test the null hypothesis that the second source of income does not
influence the acquisition of business loan. Shortage of working capital is widely recognized as
the biggest hurdle in the growth of SMEs. Securing bank credits, difficulties in documentation
for bank loans, and lack of collateral security are bigger problems in developing countries.
From the results, 44.7% of businesses whose owners had a second rural source of income had
acquired a business loan and only 27.6% had acquired a business loan from the group that had no
second source of income. These results deviated from the expected results as per the null
hypothesis. To verify if the deviations were significant, a chi2 test was conducted at α=0.01.The
test showed a significance in the observed deviations (see Table 16).
Table 16: Chi table analysis on second source of income and business loan
Ch2=4.94, ddl=1, 1-p=97.38% Source: E. Kihonge (2012)
average monthly turnover
other source of income
yes
no
TOTAL
Ksh0 -Ksh500
Ksh2 001- Ksh5
000
Ksh5 001- Ksh10
000
Ksh10001 -Ksh50
000
Morethan
Ksh50001
TOTAL
-7 +1 +1 -11 +23 94
+10 -1 -1 +15 -30 72
1 3 23 99 40 166
Have you ever acquired a business loan?
other source of income
yes
no
TOTAL
Yes no TOTAL
+28 -17 93
-35 +21 74
63 104 167
126
The results hence indicated that the second source of income influenced the acquisition of a
business loan. An entrepreneur who had a second source of income was more likely to acquire a
business loan. Therefore the null hypothesis that the rural second source of income did not
influence the acquisition of business loan was rejected.
Approximately 52 percent of those who did not go for business loans cited lack of collaterals and
securities, with 22.2 percent fearing defaults. These factors can be substantiated by the fact that,
those who had a rural second source of income had other means of survival and therefore
reduced fear of default. Similarly, the second rural income came with extra securities to the
entrepreneur.
Conclusions on the chapter
In general, though there was no relationship between the second source of income and
forwarding of supplies to national and regional markets, the second source of income was
observed to be an important factor in urban SME development. In Kenya the gap between real
rural incomes and real urban incomes has narrowed considerably in the last years, due to
increased rural entrepreneurship, this has increased the necessity for some urban investors to fall
back on rural assets to supplement their business income. Rural farming activities are equally
important for urban households’ food supplies. People either cultivate a rural plot themselves
(usually the wife) or benefit from the farming activities of family members at the rural home.
Apart from supplementing the entrepreneur’s income in low business seasons, the rural sources
played also significant role in entrepreneurship development. Large capital base, high monthly
turnover, business size and access to loan facilities have always been associated with increased
business performance and survival.
127
CHAPTER 2D
SMEs in small towns and their role in backward linkages, rural and
regional development
The fourth research objective was to determine how the SMEs in these towns contribute to rural
and regional economic growth through backward linkages. The chapter discusses how the
hypothesis guiding the objective was tested, the decision made and possible explanation to the
results, with case studies to supplement the quantitative data. Also highlighted are the outside
(regional and national) markets and small local enclave industries as sources of flows to the rural
region. The chapter further discusses the urban-rural flows patterns arising from backward
linkages.
SMEs in small towns act as major nodes for distribution of goods and services to their rural
region. Small towns have been known to act as centers for production and distribution of
goods and services to their rural populace. Such concentrations reduce the costs and improve
access to a variety of services for both rural households and enterprises. Such services include
agricultural extension, health and education, as well as professional’s services and lower order
services such as bars and restaurants, and wholesale and retail sales of manufactured goods from
within and outside the regions.
The study assumed that SMEs in small towns acted as major nodes for distribution of goods and
services to their rural region. This hypothesis was substantiated by the current research. From the
study findings, approximately 28.1 percent of the SMEs traded goods and service to their rural
surroundings, with a small difference when a comparison was done based on individual towns.
This was a relatively significant figure compared to 14 and 57.8 percent of SMEs who mainly
served other towns and local town markets respectively (see Table17). The figure was also
significant compared to the number of SMEs who got supplies from rural region which stood at
12 percent, which can be taken to mean the town-rural trade (28.1%) was approximately over
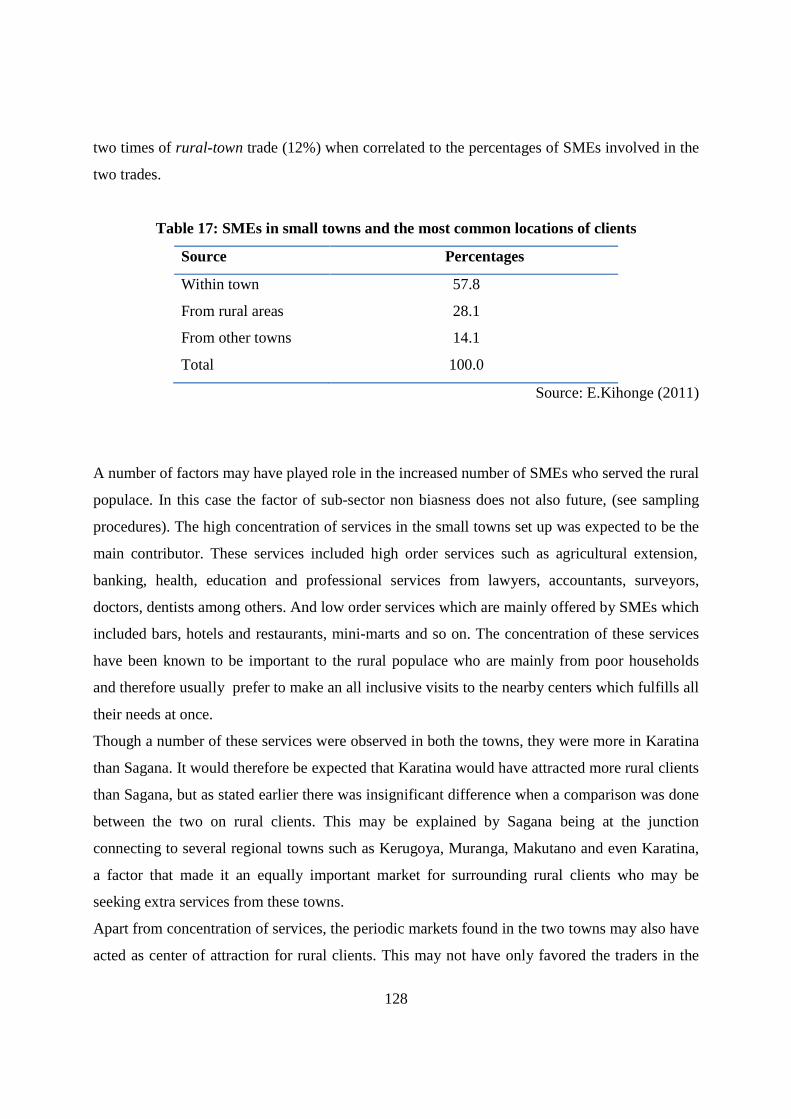
128
two times of rural-town trade (12%) when correlated to the percentages of SMEs involved in the
two trades.
Table 17: SMEs in small towns and the most common locations of clients
Source Percentages
Within town 57.8
From rural areas 28.1
From other towns
Total
14.1
100.0
Source: E.Kihonge (2011)
A number of factors may have played role in the increased number of SMEs who served the rural
populace. In this case the factor of sub-sector non biasness does not also future, (see sampling
procedures). The high concentration of services in the small towns set up was expected to be the
main contributor. These services included high order services such as agricultural extension,
banking, health, education and professional services from lawyers, accountants, surveyors,
doctors, dentists among others. And low order services which are mainly offered by SMEs which
included bars, hotels and restaurants, mini-marts and so on. The concentration of these services
have been known to be important to the rural populace who are mainly from poor households
and therefore usually prefer to make an all inclusive visits to the nearby centers which fulfills all
their needs at once.
Though a number of these services were observed in both the towns, they were more in Karatina
than Sagana. It would therefore be expected that Karatina would have attracted more rural clients
than Sagana, but as stated earlier there was insignificant difference when a comparison was done
between the two on rural clients. This may be explained by Sagana being at the junction
connecting to several regional towns such as Kerugoya, Muranga, Makutano and even Karatina,
a factor that made it an equally important market for surrounding rural clients who may be
seeking extra services from these towns.
Apart from concentration of services, the periodic markets found in the two towns may also have
acted as center of attraction for rural clients. This may not have only favored the traders in the
129
markets but also SMEs in service and manufacturing sub-sectors. The market days in Karatina
were on Tuesdays, Thursdays and Saturdays, with Saturday being the busiest day. In Sagana the
markets days were Mondays, Wednesday and Fridays with Friday being the busiest day.
Provision of quality goods and services is also known to make the small towns an alternative to
big urban centers due to their proximity, which normally results from competition created by
large enterprises in big urban centers. This was no option to SMEs in Karatina and Sagana, who
had to match the competition from big urban centers (Nairobi, Nyeri and Thika) to remain
relevant, a factor which was accelerated by immediacy and good road connectivity to these
centers.
Increased rural income from hinterlands of Sagana and Karatina from small scale farming mostly
in high value crop farming, which fetched good prices, could also have been significant. The
rural income is known to influence the buying power of the rural households. This is in turn
influenced by the nature of agricultural activities and land ownership structure. Low rural
incomes are associated with reduced buying power and are caused by skewed ownership of land
which mostly occurs at the expense of small scale farming. In cases where few individuals or
organizations own land most of the rural households end up laborers in the big farms with poor
pays. Additionally, other activities in big farms such as ranching provide few employment
opportunities. Also, decreased rural income may be caused by farming of low value crops which
fetch low market prices.
Sources of Goods and Services
Regional, national and international markets
The links between the small town and large towns was found to be more pronounced with
approximately 50.6 percent of the SMEs sourcing both consumables and non-consumables from
outside markets. Approximately 54.6 percent of these mostly served the local town market, with
27 percent mainly selling their supplies to the rural areas. The SMEs were also found to link
national and international markets to regional towns with approximately 18.4 percent of those
who bought goods from these markets selling to other closer towns.
SMEs in manufacturing lead in sourcing their suppliers from other towns (however due to their
small number at 5%, it can’t be argued the same in terms of total volumes flow). Approximately
60.4 percent of SMEs in trade sourced their supplies from other towns (see Table 18). But it

130
should be noted that some SMEs sourced supplies from more than one location as noted by high
total percentages.
Table 18: SME sub-sector and regional/national sources of supply
Sub-sector regional/national sourcing
Service 31.1%
Trade 60.4%
Manufacturing 66.7%
Source: E. Kihonge (2011)
It was further observed that SMEs in service sub sector sourced fewer supplies from other towns
and also had less clients coming from rural areas. An observation that can be attributed to
dramatically improved Information and Communications Technology, which had seen some
flows such as information and finance being linked to rural areas directly from larger cities, at
the expense of smaller towns (see Table 19).
Table 19: SME sub-sector and rural clients
Sub-sector Rural client base
Service 37.9%
Trade 38.7%
Manufacturing 44.4%
Source: E. Kihonge (2011)
The spatial aspects of the rural-urban linkages are visible though the mapping of connected
places via Sagana and Karatina (maps 5 and 6). From the map it can be seen that most of the
rural supply zones mostly came from surrounding rural villages (less than 20 Km) these regions
were however less in numbers in Sagana than Karatina which had more vibrant economic
activities (See Map 6). However the regional market had large foot sprints almost FOUR times
the supply rural radius for Sagana town. It can also be seen that the high altitude regions where
we expect to find natural reverses did not form part of supply zones especially in Mt. Kenya.
However we had significant selling zones in high altitudes especially along Aberdare ranges.
131
Map 5: Urban–rural trade links in Sagana town
132
Map 6: Urban-rural trade links in Karatina town

133
In Karatina, from the map it can also be seen that most of the rural supply zones mostly came
from surrounding rural villages (less than 20 Km) but the regional market had large foot sprints
almost FIVE times the supply rural radius for Karatina town. Again the high altitude regions did
not form part of supply zones especially.
Supply flow patterns
Supplies from outside markets came from near and far with approximately 80 percent of the
SMEs getting supplies from regions which were over 50Km. Though the sources could be traced
to both international and national markets, most non consumables mainly came from Nairobi.
Tanzania, Uganda and Ethiopia were found to be important sources of grains, with fruits being
sourced as far as Rwanda (Bujumbura). Most cereals (green grams, rice, jahi) and potatoes came
from markets in nearby towns.
Sagana town relied more on outside markets in supply, with approximately 60.8 percent of its
SMEs sourcing supplies from other towns, as compared to Karatina which had 40.8% of SMEs
getting supplies from these sources. This can be explained by the small number of large
enterprises such as wholesalers, supermarkets, hard wares, and banks which resulted to SMEs
sourcing their services in the neighboring towns such as Muranga, Makutano, Karatina and
Kerugoya.
The consumables were found to come from within and without. Vegetables and fruits were
sourced from surrounding rural areas. The town relied on other towns too such as Kutus
(tomatoes), Muranga (bananas), Thika (cereals) and Mwea (rice). Non consumables mainly came
from Nairobi, Thika and Nyeri. However, the relocation of the market in 2009 from the center to
the far edge of the town had seen the trade volumes of some goods go down considerably.
The market was initially situated on a private plot, which leaves a lot to be desired on the urban
planning of small towns in Kenya. A move that resulted to the minority traders in non
consumables being adversely affected and were lobbying for separation of consumables and non-
consumables goods, hoping they would relocate to the original site where they made better
business. A good example is Julius Muchai, a migrant from Muranga who sold clothes in the
market for 12 years. His three trips to Nairobi to get new supplies in one week had reduced to
only one trip. A factor he attributed to the new location.
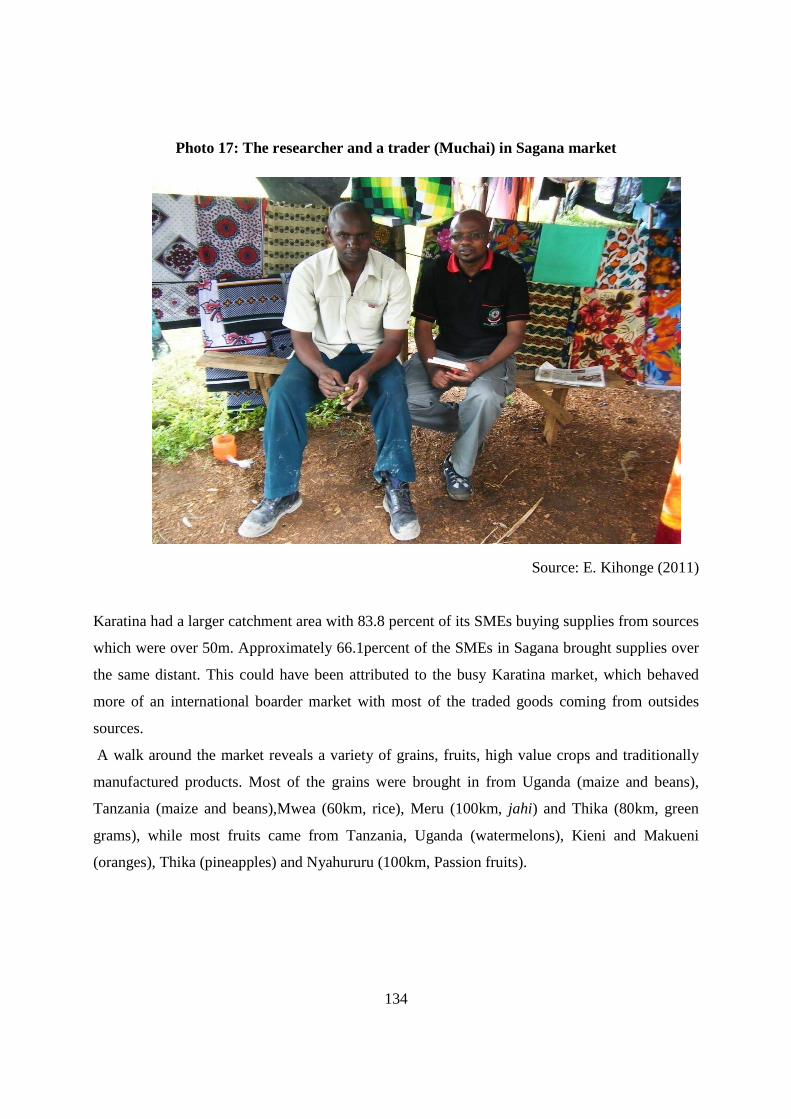
134
Photo 17: The researcher and a trader (Muchai) in Sagana market
Source: E. Kihonge (2011)
Karatina had a larger catchment area with 83.8 percent of its SMEs buying supplies from sources
which were over 50m. Approximately 66.1percent of the SMEs in Sagana brought supplies over
the same distant. This could have been attributed to the busy Karatina market, which behaved
more of an international boarder market with most of the traded goods coming from outsides
sources.
A walk around the market reveals a variety of grains, fruits, high value crops and traditionally
manufactured products. Most of the grains were brought in from Uganda (maize and beans),
Tanzania (maize and beans),Mwea (60km, rice), Meru (100km, jahi) and Thika (80km, green
grams), while most fruits came from Tanzania, Uganda (watermelons), Kieni and Makueni
(oranges), Thika (pineapples) and Nyahururu (100km, Passion fruits).
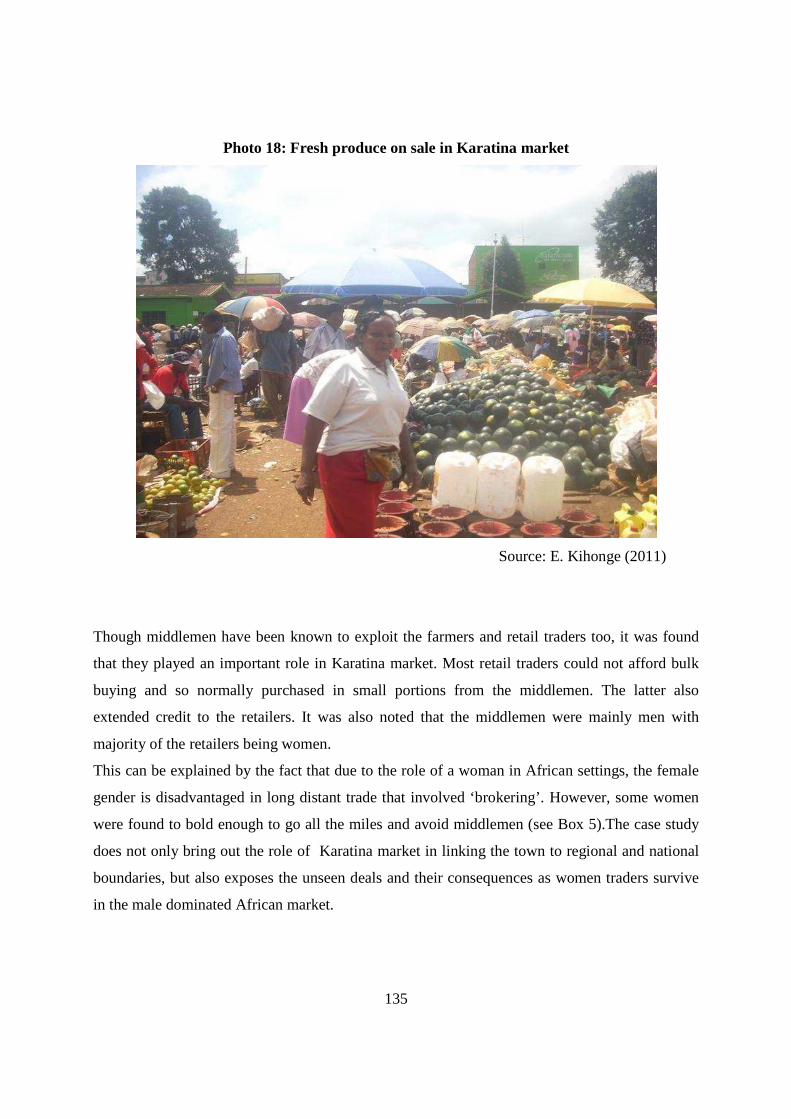
135
Photo 18: Fresh produce on sale in Karatina market
Source: E. Kihonge (2011)
Though middlemen have been known to exploit the farmers and retail traders too, it was found
that they played an important role in Karatina market. Most retail traders could not afford bulk
buying and so normally purchased in small portions from the middlemen. The latter also
extended credit to the retailers. It was also noted that the middlemen were mainly men with
majority of the retailers being women.
This can be explained by the fact that due to the role of a woman in African settings, the female
gender is disadvantaged in long distant trade that involved ‘brokering’. However, some women
were found to bold enough to go all the miles and avoid middlemen (see Box 5).The case study
does not only bring out the role of Karatina market in linking the town to regional and national
boundaries, but also exposes the unseen deals and their consequences as women traders survive
in the male dominated African market.
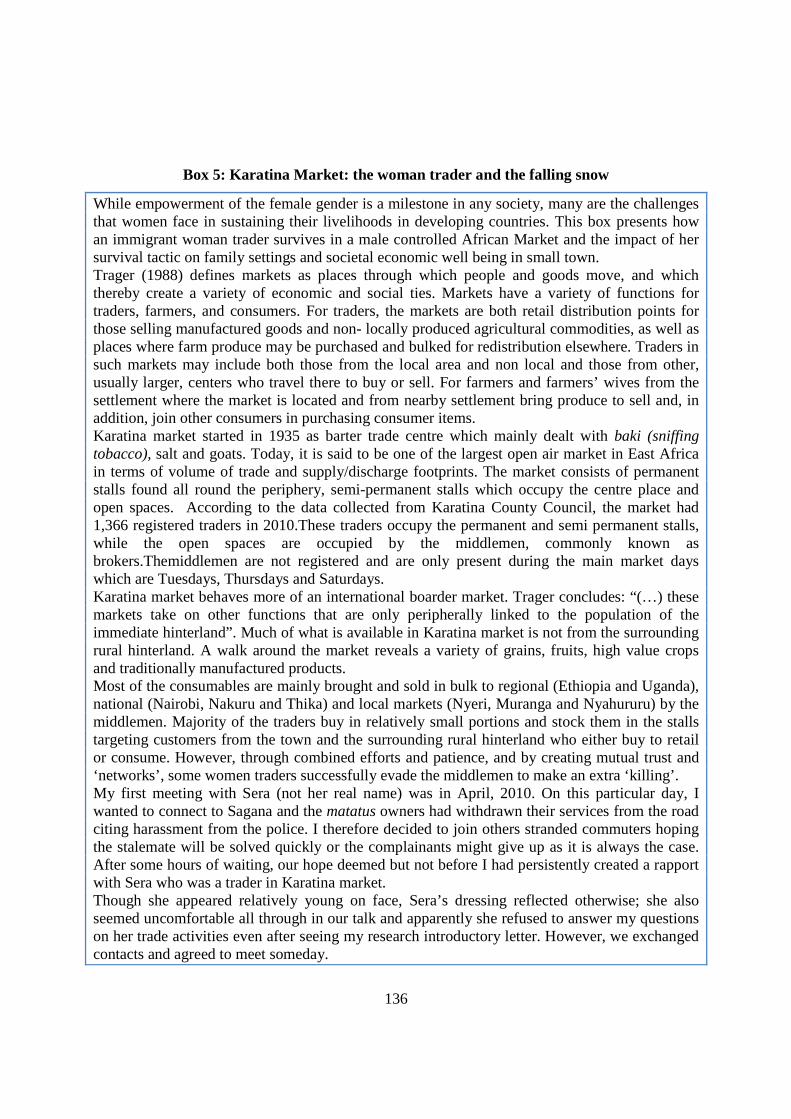
136
Box 5: Karatina Market: the woman trader and the falling snow
While empowerment of the female gender is a milestone in any society, many are the challenges that women face in sustaining their livelihoods in developing countries. This box presents how an immigrant woman trader survives in a male controlled African Market and the impact of her survival tactic on family settings and societal economic well being in small town. Trager (1988) defines markets as places through which people and goods move, and which thereby create a variety of economic and social ties. Markets have a variety of functions for traders, farmers, and consumers. For traders, the markets are both retail distribution points for those selling manufactured goods and non- locally produced agricultural commodities, as well as places where farm produce may be purchased and bulked for redistribution elsewhere. Traders in such markets may include both those from the local area and non local and those from other, usually larger, centers who travel there to buy or sell. For farmers and farmers’ wives from the settlement where the market is located and from nearby settlement bring produce to sell and, in addition, join other consumers in purchasing consumer items. Karatina market started in 1935 as barter trade centre which mainly dealt with baki (sniffing tobacco), salt and goats. Today, it is said to be one of the largest open air market in East Africa in terms of volume of trade and supply/discharge footprints. The market consists of permanent stalls found all round the periphery, semi-permanent stalls which occupy the centre place and open spaces. According to the data collected from Karatina County Council, the market had 1,366 registered traders in 2010.These traders occupy the permanent and semi permanent stalls, while the open spaces are occupied by the middlemen, commonly known as brokers.Themiddlemen are not registered and are only present during the main market days which are Tuesdays, Thursdays and Saturdays. Karatina market behaves more of an international boarder market. Trager concludes: “(…) these markets take on other functions that are only peripherally linked to the population of the immediate hinterland”. Much of what is available in Karatina market is not from the surrounding rural hinterland. A walk around the market reveals a variety of grains, fruits, high value crops and traditionally manufactured products. Most of the consumables are mainly brought and sold in bulk to regional (Ethiopia and Uganda), national (Nairobi, Nakuru and Thika) and local markets (Nyeri, Muranga and Nyahururu) by the middlemen. Majority of the traders buy in relatively small portions and stock them in the stalls targeting customers from the town and the surrounding rural hinterland who either buy to retail or consume. However, through combined efforts and patience, and by creating mutual trust and ‘networks’, some women traders successfully evade the middlemen to make an extra ‘killing’. My first meeting with Sera (not her real name) was in April, 2010. On this particular day, I wanted to connect to Sagana and the matatus owners had withdrawn their services from the road citing harassment from the police. I therefore decided to join others stranded commuters hoping the stalemate will be solved quickly or the complainants might give up as it is always the case. After some hours of waiting, our hope deemed but not before I had persistently created a rapport with Sera who was a trader in Karatina market. Though she appeared relatively young on face, Sera’s dressing reflected otherwise; she also seemed uncomfortable all through in our talk and apparently she refused to answer my questions on her trade activities even after seeing my research introductory letter. However, we exchanged contacts and agreed to meet someday.
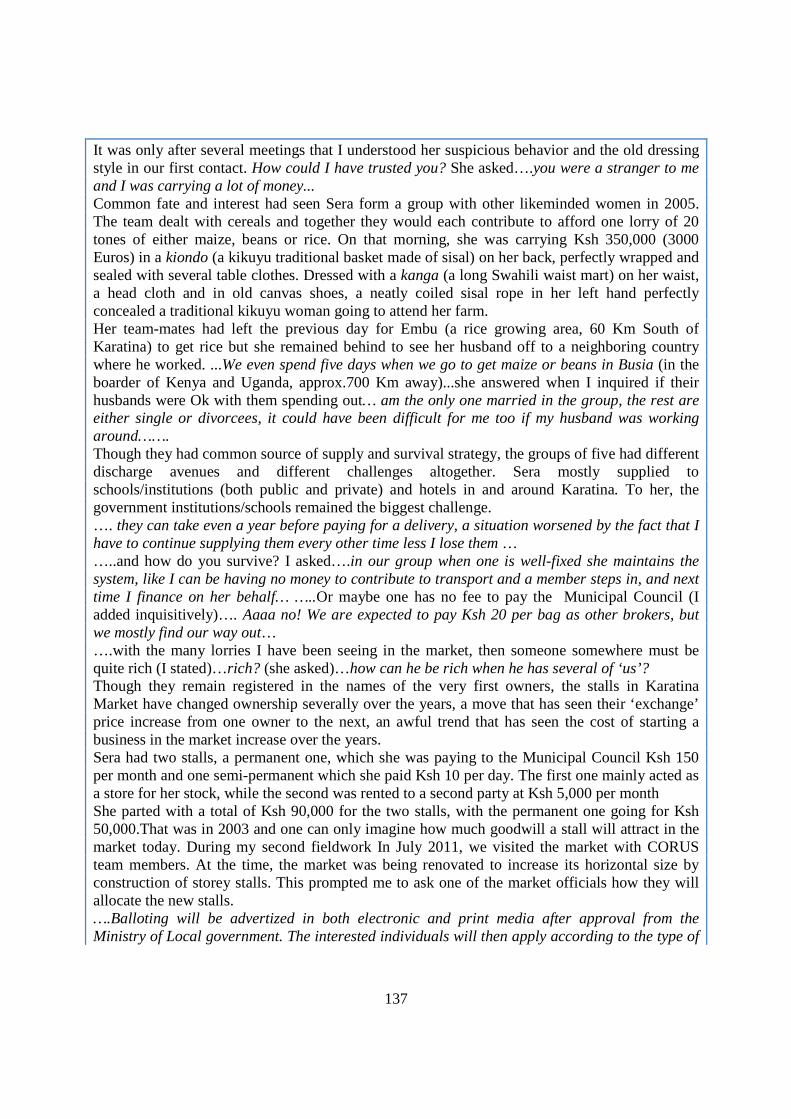
137
It was only after several meetings that I understood her suspicious behavior and the old dressing style in our first contact. How could I have trusted you? She asked….you were a stranger to me and I was carrying a lot of money... Common fate and interest had seen Sera form a group with other likeminded women in 2005. The team dealt with cereals and together they would each contribute to afford one lorry of 20 tones of either maize, beans or rice. On that morning, she was carrying Ksh 350,000 (3000 Euros) in a kiondo (a kikuyu traditional basket made of sisal) on her back, perfectly wrapped and sealed with several table clothes. Dressed with a kanga (a long Swahili waist mart) on her waist, a head cloth and in old canvas shoes, a neatly coiled sisal rope in her left hand perfectly concealed a traditional kikuyu woman going to attend her farm. Her team-mates had left the previous day for Embu (a rice growing area, 60 Km South of Karatina) to get rice but she remained behind to see her husband off to a neighboring country where he worked. ...We even spend five days when we go to get maize or beans in Busia (in the boarder of Kenya and Uganda, approx.700 Km away)...she answered when I inquired if their husbands were Ok with them spending out… am the only one married in the group, the rest are either single or divorcees, it could have been difficult for me too if my husband was working around……. Though they had common source of supply and survival strategy, the groups of five had different discharge avenues and different challenges altogether. Sera mostly supplied to schools/institutions (both public and private) and hotels in and around Karatina. To her, the government institutions/schools remained the biggest challenge. …. they can take even a year before paying for a delivery, a situation worsened by the fact that I have to continue supplying them every other time less I lose them … …..and how do you survive? I asked….in our group when one is well-fixed she maintains the system, like I can be having no money to contribute to transport and a member steps in, and next time I finance on her behalf… …..Or maybe one has no fee to pay the Municipal Council (I added inquisitively)…. Aaaa no! We are expected to pay Ksh 20 per bag as other brokers, but we mostly find our way out… ….with the many lorries I have been seeing in the market, then someone somewhere must be quite rich (I stated)…rich? (she asked)…how can he be rich when he has several of ‘us’? Though they remain registered in the names of the very first owners, the stalls in Karatina Market have changed ownership severally over the years, a move that has seen their ‘exchange’ price increase from one owner to the next, an awful trend that has seen the cost of starting a business in the market increase over the years. Sera had two stalls, a permanent one, which she was paying to the Municipal Council Ksh 150 per month and one semi-permanent which she paid Ksh 10 per day. The first one mainly acted as a store for her stock, while the second was rented to a second party at Ksh 5,000 per month She parted with a total of Ksh 90,000 for the two stalls, with the permanent one going for Ksh 50,000.That was in 2003 and one can only imagine how much goodwill a stall will attract in the market today. During my second fieldwork In July 2011, we visited the market with CORUS team members. At the time, the market was being renovated to increase its horizontal size by construction of storey stalls. This prompted me to ask one of the market officials how they will allocate the new stalls. ….Balloting will be advertized in both electronic and print media after approval from the Ministry of Local government. The interested individuals will then apply according to the type of
138
produce/product one wish to trade in. However, under-traded or new produce/products will be given first priority... I insisted to know the under traded products/produce at the moment, to which he quickly added... That is the work of the market officials to decide, who includes two representatives from each produce/product sold in the market… Due to our tight field work program, I was not lucky to meet Serah over the one week we stayed in Nyeri. But I was to return to Sagana after some weeks as part of my fieldwork and I took the chance in one of the evenings to hook up with her in Karatina. I was mostly interested in knowing how their group had managed to maintain their mutual trust in the last six years. Such business groups exhibits complex group dynamics especially where members lend money to each other on mutual trust. According to Sera, they owe their respect to one elderly member who had introduced all the others to the business. Apart from this member who was in her late forties, the others were in their earlier thirties. They also came from the same home village, but stayed in different suburbs around Karatina. …Are you applying for balloting for the new stalls? (I asked as were finishing our nyama choma)… ….Every member in our group is applying (she replied)…and which new produce will you be introducing? (I asked). ….That is what they ask, but I intend to rent it out, what I know is whether new or old, a stall must attract ‘goodwill’… it’s all networks (answered Sera). I opened the curtains of my room and admired the falling snow which had created white ‘networks’ over the house roof tops in Clermont-Ferrand… It brought back memories of how mud covered Karatina market the last time I saw it.
Source: E. Kihonge (2012)
Sources from small enclave industries
Enclave industries in small towns have been known to be important sources of mostly
manufactured products to the rural region and other nearby towns too. In Karatina and Sagana
these activities involved metal and furniture workshops, shoemaking, flour milling, bakeries,
sawmills and tailoring.
Though manufacturing industry was found to have more rural clients who stood at approximately
44.4%, collectively they played a small role in production and distribution of products and
services to both outside and rural region. While they normally form the majority sub-sector in
small towns and rural areas in developing countries, they only comprised approximately 5% of
total enterprises in the towns under study, with Sagana having less than 2%. And by having the
most rural clients’ density implied their services were mostly sort, however, they were
disadvantaged by their small numbers.
139
This could have been attributed to competition from larger and better equipped manufacturing
units found in bigger urban centers (Nairobi, Thika and Nyeri) which as stated earlier had the
advantage of proximity and were connected by good roads. The survival of small industries in
Sagana and Karatina therefore called for continuous innovation to improve competitiveness.
Apart from large capital required for innovation in product or production process, skills are of
paramount importance too. The results indicated that the majority of entrepreneurs/owners in this
sub-sector were least educated with majority having only primary education. This means unless
intervention measures are put in place, the success of enclave industries remains in question in
terms of acquired skills and knowledge.
Kenya Industrial Estate (KIE) which is entrusted with the mandate of supporting indigenous
small industries through financing and business development through incubation was found to
have a regional branch in Karatina. Through funds from the Central Government the
organization offered both long and short term loans to the small entrepreneurs, however, though
the interests’ rates were friendly, only a handful could have afforded the collaterals required to
secure such loans. The collaterals included land, which ought to have been valued at 140 percent
of the loan applied for. Others included motor vehicles and heavy machineries which were
worthy a loan amount of 50 and 80 percent of their values respectively. Apart from paying the
valuation fees, the entrepreneurs were also expected to pay for a three days business training
before they qualify for the loan.
The business incubation which is supposed to assist the small investors in their initiation stages
by offering among other things, working sheds at subsidized rent rates, experience and
networking has never materialized. According to by then Chairperson of the KIE Karatina
branch, while they are meant to change ownership and give room to new incoming small
investors, the 30 sheds in Karatina still remained occupied by same investors since their
inception in 1980s with a good number having been permanently sold to these occupants by
previous government regimes.
By the time of research, several new sheds were under construction in Karatina (see Photo 19),
Sagana, Kerugoya and Mwea town through Economic Stimulus Program initiated by the
government to boost the national economy which was greatly affected by the Post Election
violence in 2007. Some moneys had also been received by the KIE Karatina branch to put up a
12 storey building for commercial sheds in the town.
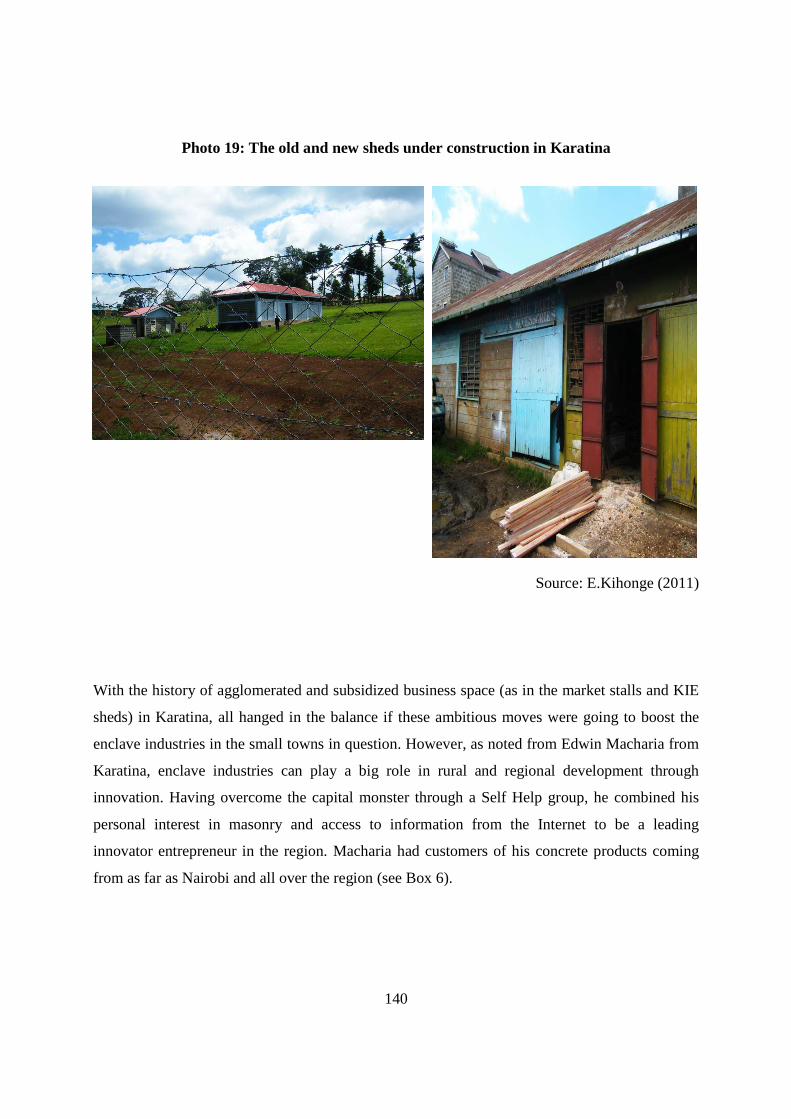
140
Photo 19: The old and new sheds under construction in Karatina
Source: E.Kihonge (2011)
With the history of agglomerated and subsidized business space (as in the market stalls and KIE
sheds) in Karatina, all hanged in the balance if these ambitious moves were going to boost the
enclave industries in the small towns in question. However, as noted from Edwin Macharia from
Karatina, enclave industries can play a big role in rural and regional development through
innovation. Having overcome the capital monster through a Self Help group, he combined his
personal interest in masonry and access to information from the Internet to be a leading
innovator entrepreneur in the region. Macharia had customers of his concrete products coming
from as far as Nairobi and all over the region (see Box 6).
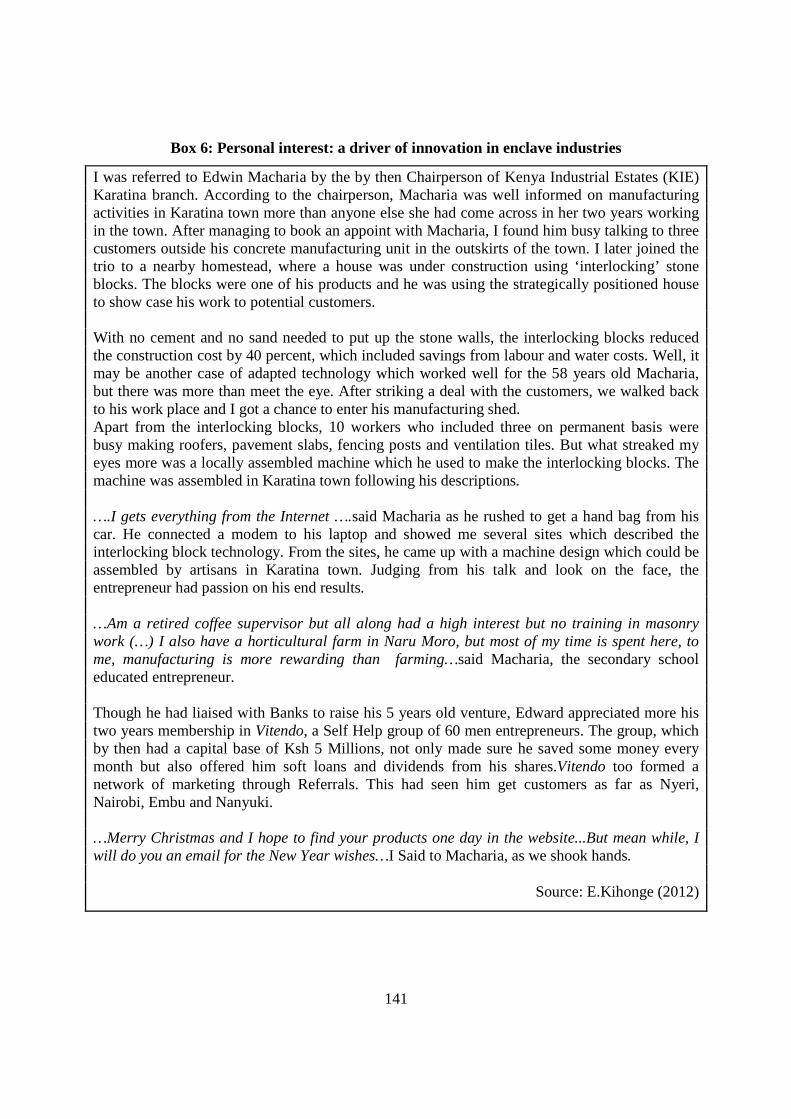
141
Box 6: Personal interest: a driver of innovation in enclave industries
I was referred to Edwin Macharia by the by then Chairperson of Kenya Industrial Estates (KIE) Karatina branch. According to the chairperson, Macharia was well informed on manufacturing activities in Karatina town more than anyone else she had come across in her two years working in the town. After managing to book an appoint with Macharia, I found him busy talking to three customers outside his concrete manufacturing unit in the outskirts of the town. I later joined the trio to a nearby homestead, where a house was under construction using ‘interlocking’ stone blocks. The blocks were one of his products and he was using the strategically positioned house to show case his work to potential customers. With no cement and no sand needed to put up the stone walls, the interlocking blocks reduced the construction cost by 40 percent, which included savings from labour and water costs. Well, it may be another case of adapted technology which worked well for the 58 years old Macharia, but there was more than meet the eye. After striking a deal with the customers, we walked back to his work place and I got a chance to enter his manufacturing shed. Apart from the interlocking blocks, 10 workers who included three on permanent basis were busy making roofers, pavement slabs, fencing posts and ventilation tiles. But what streaked my eyes more was a locally assembled machine which he used to make the interlocking blocks. The machine was assembled in Karatina town following his descriptions. ….I gets everything from the Internet ….said Macharia as he rushed to get a hand bag from his car. He connected a modem to his laptop and showed me several sites which described the interlocking block technology. From the sites, he came up with a machine design which could be assembled by artisans in Karatina town. Judging from his talk and look on the face, the entrepreneur had passion on his end results. …Am a retired coffee supervisor but all along had a high interest but no training in masonry work (…) I also have a horticultural farm in Naru Moro, but most of my time is spent here, to me, manufacturing is more rewarding than farming…said Macharia, the secondary school educated entrepreneur. Though he had liaised with Banks to raise his 5 years old venture, Edward appreciated more his two years membership in Vitendo, a Self Help group of 60 men entrepreneurs. The group, which by then had a capital base of Ksh 5 Millions, not only made sure he saved some money every month but also offered him soft loans and dividends from his shares.Vitendo too formed a network of marketing through Referrals. This had seen him get customers as far as Nyeri, Nairobi, Embu and Nanyuki. …Merry Christmas and I hope to find your products one day in the website...But mean while, I will do you an email for the New Year wishes…I Said to Macharia, as we shook hands.
Source: E.Kihonge (2012)
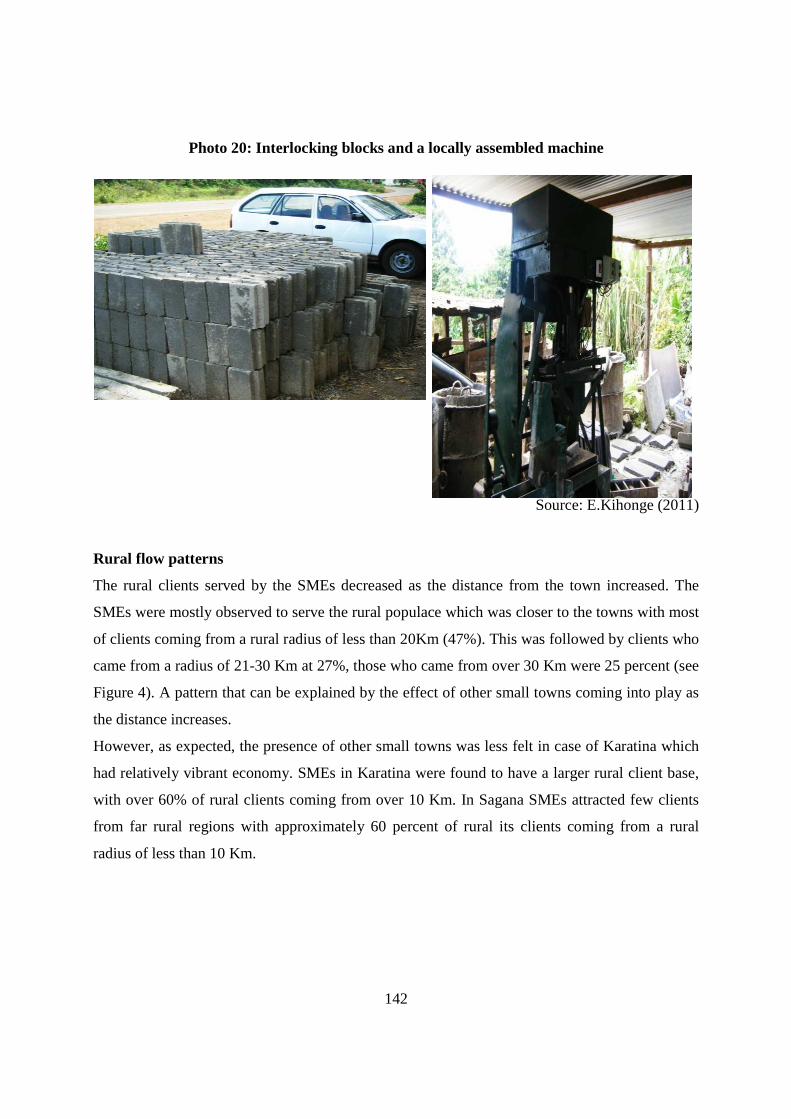
142
Photo 20: Interlocking blocks and a locally assembled machine
Source: E.Kihonge (2011)
Rural flow patterns
The rural clients served by the SMEs decreased as the distance from the town increased. The
SMEs were mostly observed to serve the rural populace which was closer to the towns with most
of clients coming from a rural radius of less than 20Km (47%). This was followed by clients who
came from a radius of 21-30 Km at 27%, those who came from over 30 Km were 25 percent (see
Figure 4). A pattern that can be explained by the effect of other small towns coming into play as
the distance increases.
However, as expected, the presence of other small towns was less felt in case of Karatina which
had relatively vibrant economy. SMEs in Karatina were found to have a larger rural client base,
with over 60% of rural clients coming from over 10 Km. In Sagana SMEs attracted few clients
from far rural regions with approximately 60 percent of rural its clients coming from a rural
radius of less than 10 Km.
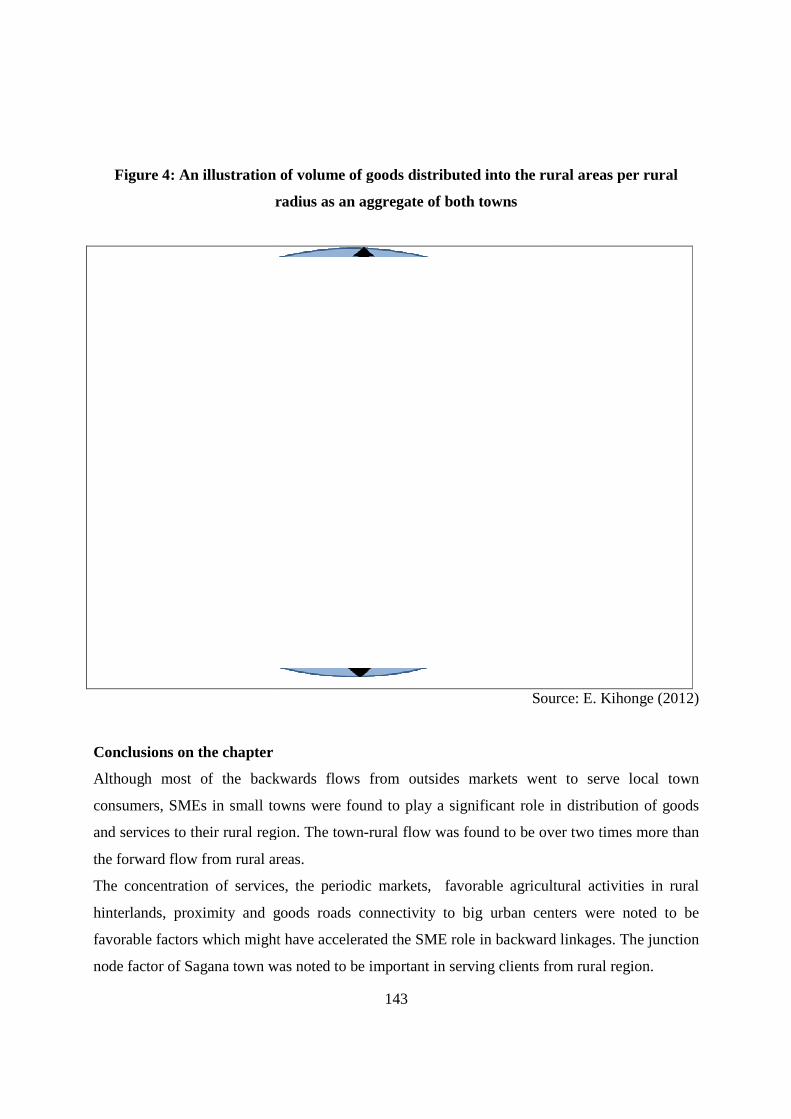
Figure 4: An illustration of volume of goods distributed into the rural areas per rural
radius
Conclusions on the chapter
Although most of the backwards flows from outsides markets went to serve local town
consumers, SMEs in small towns were found to play a significant role in distribution of goods
and services to their rural region. The town
the forward flow from rural areas.
The concentration of services, the periodic markets, favorable agricultural activities in rural
hinterlands, proximity and goods roads connectivity to big urban centers were noted to be
favorable factors which might have accelerated the SME role in backward linkages. The junction
node factor of Sagana town was noted to be important in serving clients from rural region.
143
: An illustration of volume of goods distributed into the rural areas per rural
radius as an aggregate of both towns
Source: E.
Although most of the backwards flows from outsides markets went to serve local town
consumers, SMEs in small towns were found to play a significant role in distribution of goods
and services to their rural region. The town-rural flow was found to be over t
the forward flow from rural areas.
The concentration of services, the periodic markets, favorable agricultural activities in rural
hinterlands, proximity and goods roads connectivity to big urban centers were noted to be
tors which might have accelerated the SME role in backward linkages. The junction
node factor of Sagana town was noted to be important in serving clients from rural region.
: An illustration of volume of goods distributed into the rural areas per rural
Source: E. Kihonge (2012)
Although most of the backwards flows from outsides markets went to serve local town
consumers, SMEs in small towns were found to play a significant role in distribution of goods
rural flow was found to be over two times more than
The concentration of services, the periodic markets, favorable agricultural activities in rural
hinterlands, proximity and goods roads connectivity to big urban centers were noted to be
tors which might have accelerated the SME role in backward linkages. The junction
node factor of Sagana town was noted to be important in serving clients from rural region.
144
The SMEs were also found to link national and international markets to regional towns with
approximately 18.4 percent of those who bought goods from these markets selling to other
nearby towns.
The traders, especially in the markets were observed to play a key role in connecting the small
towns with both regional and international agricultural production zones with consumables
coming from far and wide. However, improved information and communication technology may
have resulted to low sourcing of supplies of the service sub-sector from national and regional
markets and subsequently fewer rural clients due to some services being offered direct from big
urban centers to rural areas and vice versa at the expense of small towns.
Though the enclave industries had most clients’ density, their small numbers weaken their role in
production and distribution of goods and services. This was mostly attributed to lack of
innovation in products and/or production processes and therefore they may not have matched the
competition from their counterparts in nearby large urban centers.

145
GENERAL CONCLUSIONS
Objective ONE: to investigate the general and specific characteristics of SMEs sub-sectors
in a small town
The first objective was guided by the assumption that due to their rural-urban linkage function,
the SMEs in small towns exhibits different characteristics as compared to the general outlook of
the sector at national level and also to some specific regions where data was available. From the
results, SMEs in small towns which are assumed to have a linking function did not show
significance discrepancies from average characteristics surveyed at national level and also from
comparison made from specific regions in Kenya. The few noted differences are more likely to
be associated with the geo-social factors and the economical and political dynamics in the
country. The lack of the special linking characteristics could be attributed to the findings in
objective two.
Objective TWO: to determine the role of SME in small towns in forward linkages, rural
and regional development
The second objective was guided by the hypothesis that the SMEs in small towns play significant
role as markets links for agricultural produce from the rural region, either for local consumers or
as links to national and export markets. This hypothesis did not stand, as SMEs in these towns
played a lesser role in forwarding of goods and services for local, regional and international
market. This could have been the reason the SMEs lacked the special linking characteristics as
sought in objective ONE.
So, from earlier research work, though small enterprises are often known to be more dependent
on the local supply of inputs and services than the large enterprises, this, according to the current
study findings did not result to forward linking. Most of the rural inputs supplied by the SMEs
were used or consumed at the local town centre. The study established that some factors which
could have attributed to the poor show in forward linkages included; the marketing chain created
by the Farmers Sacco’s/companies, the use of Information and Communication Technologies,
middlemen from larger urban centers and contracting farming. Other factors are; the poor road
network to the rural areas, the history of agglomerated subsided space (market stalls and
146
incubation stands) and some rules and regulations from both central and local government which
may have negatively affected the SMEs. Business operations such as hawking activities in raw
milk, trade in timber and charcoal were also restricted. Others such as coffee and tea hawking
were illegal. However, some factors such as the market and the highway were found to be
important nodes through which SMEs linked the rural and national markets.
Objective THREE: to investigate the role of rural functions in growth of SMEs in small
towns
The third objective was guided by the assumption that Sagana and Karatina are surrounded by
agricultural zones and therefore the growth of most SMEs is influenced by farming activities in
the rural areas. This assumption was upheld to be true as over a third of the SMEs were found to
juggle between the SMEs activities in the small towns and farming activates in the rural areas.
The growths of the urban and rural activities were therefore found to a have a strong symbiotic
relationship. The rural functions in urban SMEs were found to be real and instrumental in
entrepreneurship development. They were not only vital in business survival in low seasons but
were also found to improve business performance in terms of large capital base, high monthly
turnover, increased access to loan facilities, and large size of the enterprise.
Though this concurred with earlier theories that the rural agricultural activities could trigger the
viscous circles of rural-urban linkages, the current study established that such circles emerged
strongly when there is direct link in ownership structure of the urban and rural activities.
Objective FOUR: to determine the role of SME in small towns in backward linkages, rural
and regional development
The fourth objective was guided by the hypothesis that SMEs in small towns act as major nodes
for distribution of goods and services from both local and regions to their rural region. This
hypothesis was upheld by the current study. Previous studies have shown that the rural-urban
trade to be more than urban-rural trade. However, the current study shows the later is almost three
times more. The results could be said to differ in case where the point of focus is the small trader
in the small town as opposed to a general urban-rural trade approach. Several factors were
identified in earlier objectives on the diminished role of the small traders in rural-urban trade.
Also the nature the farmers markets could determine the flow pattern between urban and rural
147
supplies. As noted in earlier chapters, Karatina and Sagana markets behaved more of international
markets, where most of the traded goods and supplies were not from the local catchments. This
meant rural populace depended on the towns not only for manufactured goods and professional
services but also for agricultural produce. A factor emphasized by the fact that most of the
agricultural activities in the rural hinterlands were small scale cash crop farming.
Areas of further research
The empirical analyses in this thesis identified some gaps in the role of Small and Medium
Enterprises in small towns in rural-urban continuum. The insights from the empirical findings
can be further strengthened through future research. Though the current study findings concur
with the National Survey of 1999, survey on education level and type of business associations,
there is a significant discrepancy on SMEs who did not belong to any business association. The
study reveals that 81.6% of the SMEs in small towns did not belong to any of these associations,
as compared to 76.3% at National level in 1999. The study also revealed that most SMEs
believed on banking institutions for both financial and non-financial services. Since there has
been increased innovation of banking products tailor made to the SMEs, one area of further
research can be to investigate the impact of the tailored made banking products on formal and
informal business associations.
From the study findings women were found to do fairy well in manufacturing sub-sector with
44.4% of this category being woman-owned. However, majority were found to be in home based
manufactured products such as sisal ropes and sisal baskets. Since the current study did not detail
the dynamics, operations and contribution of home based manufacturing in rural –urban linkages
a research on the same could also be interesting.
The current study also focused Sagana and Karatina towns. The two are sandwiched between Mt.
Kenya (to the North) and Aberdares ranges (to the South) and therefore have high land fertility
and good climate. This makes the towns attractive to big investors in agriculture, a factor
leveraged by their proximity to big towns Nairobi, Nyeri and Thika. This might have contributed
to the diminishing role of SMEs in small towns in rural-urban linkages. It would be therefore
interested to conduct a similar research in other small towns in the country with different
characteristics for comparison purposes.
148
Though there was no relationship between the second source of income and forwarding of
supplies to national and regional markets, the second source of income was observed to be an
important factor in urban SME development. However, the current study did not quantify the
contribution of the rural second incomes to growth of urban SMEs in small towns. A further
research on the same area to quantify this contribution could open more insights on rural
functions in urban SMEs development.
Lastly, though the currently study focused on the role of SMEs in small towns in rural-urban
linkages, the study results indicated that the SMEs in these towns were also significant in linking
the small towns to other small towns with approximately 18.4 percent of those who bought goods
from the markets selling to other nearby towns. Therefore it would be interesting to further
investigate the social-economic networks and linkages that involve one small town to the other.
149
APPENDIX 1
Acronyms
COMESA: Common Market for Eastern and Southern Africa
CORUS: Coopération pour la recherche universitaire et scientifique
CREATING: Co-operative research on East African territorial integration within Globalization’
EAC: East African Community
ERS: Economic Recovery Strategy
EU: European Union
FDI: Foreign Direct Investments
IFC: International Finance Corporation
IIED: International Institute for environment and Development
ILO: International Labour Organization
IMF: International Monetary Fund
IFC: International Finance Corporation
IRD: Integrated Rural Development
KLGRP: Kenya Local Government Reform Program
KPSDS: Kenya Private Sector Development Strategy
KWFT: Kenya Women Finance Trust
LATF: The Local Authority Transfer Fund
LDCs: Least Developed Countries
MFI: Micro Finance Institutions
MRTT: Ministry of Research, Technical and Technology
MSEs: Micro and Small Enterprises
MSETTP: Micro and Small Enterprise Training and Technology Project
MSMEs: Medium Small and Micro Enterprises
MVA: Manufacturing Added Value
NEPAD- New Partnership for Africa Development
NJEMA: National Juakali Exhibitions and Marketing Association
NGO: Non Governmental Organization
PSDS: Private Sector Development Strategy
150
ROSCAs: Rotating- savings and credit Associations
RNFEs: rural non-farm enterprises
SACCO: Savings and credit co-operative societies
SADC: Southern African Development Community
SHG: Self Help Group
SBP: Single Business Permit
SITE: Strengthening Informal Sector Training and Technology
SMEs: Small and Medium enterprises
SSEs: Small Scale Enterprises
SAPs- Structural Adjustments Programs
UFRD: Urban Functions in Rural Development
UMP: Urban Management Program
UNIDO: United Nations Industrial Development Organization
UK: United Kingdom
UN: United Nations
UNIDO: United Nations Industrial Development Organization
USAID: United State Agency for International Development
USD: United States Dollar
VAT: Value- Added Tax

151
APPENDIX 2A
Research Permit

152
APPENDIX 2B
153
APPENDIX 3
Trader’s questionnaire
Personal details
1.1 Name: ………………………………………………………………..
1.2 Tel No: ………………………………………………….
1.3 Age: Circle one: (a) 18-35 (b) 36-60 (c) 61 and over
1.4 Circle one: (a) Male (b) Female
1.5 Marital status: circle one: (a) married (b) single (c) divorced (d) window(er)
1.6 current resident ………………………….
1.7 Highest formal level of education …………………………………
2. Nature of business
2.1 Location of the business …………………………………
2.2 What is the nature of your business? (a) Service (b) trade (c) manufacturing
2.2(a) Type of service/product/commodity……………………………
2.3Do you have a business permit? (a) Yes (b) no
2.4 Do you own your stall or area of business? Circle one. (a) Yes (b) no
2.5.0 Do you or your business have a bank account? (a) Yes (b) no
2.5.1 Have you ever acquired a business loan? (a) Yes (b) no
(If the answer is NO, go to question 2.5.4)
2.5.2 If yes, from which institution
(a) Bank
(b) Micro-Finance Institution
(c) ROSCAS
(d) NGO
(e) Govt Dev programs e.g. youth/women fund
(f) Informal money lenders
(g) Other (specify)…

154
2.5.3 Was the loan enough for the intended purpose? (a)Yes (b) no
2.5.4 What are the reasons for not taking a loan?
(a) Lack of awareness
(b) Attitude of bank staff
(c) Needs for bribes.
(d) Procedures and formalities
(e) Absence of collateral
(f) Problems with defaults.
2.6.0 Where do you buy your business supplies from?
(a) Within the town
(b) In the rural areas, specify which ones……………………….
i) What is the approximate distance of the above area from your business?
(a) 0-10Km (b) 11-20Km(c) 21- 30Km (d) 31-50km (e) above 50km
(c) In other towns, specify which ones……………………..
ii) What is the approximate distance of the above area from your business?
(a) 0-10Km (b) 11-20Km(c) 21- 30Km (d) 31-50km (e) above 50km
(d) If it is from both rural and other towns fill both part (b) and (c)
2.6.1How often do you get new supplies or law materials? (a) Daily (b) twice in a week (c)
weekly (d) twice in a month (e) monthly (f) other -specify……
2.6.2 Which of the below fits you
(a) I buy direct from the producer/farmer/wholesaler
(b) I buy from middle men/women
2.6.5 Which of the below fits you
(a) I go to collect my supplies
(b) The supplies are delivered by the seller
(c) Other, specify…………………………………………………………….
2.6.6Which is your common mode of transport for your supplies
(a) Own car

155
(b) Taxi, specify………………..
(c) Public means
(d) Tradition means
(e) Boda boda –bicycle
(f) Boda boda –motorbike
(g) Other, specify……………………………
2.6.7 What are your transport expenses per delivery
(a) Ksh0 – Ksh50
(b) Ksh51 – Ksh100
(c) Ksh101 – Ksh500
(d) Ksh501 – Ksh1 000
(e) Ksh1 001 – Ksh2 000
(f) Ksh2001-Ksh10, 000
(f) Over Ksh 10,000
2.6.8 What major transportation problems do you encounter?
2.7.0 Who are mainly your clients? (a) Male (d) female
2.7.1 Where do your clients mainly come from?
(a) Within the town
(b) In the rural areas, specify which ones……………………….
What is the approximate distance of the above area from your business?
(a) 0-10Km (b) 11-20Km(c) 21- 30Km (d) 31-50km (e) above 50km
(c) In other towns, specify which ones……………………..
What is the approximate distance of the above area from your business?
(a) 0-10Km (b) 11-20Km(c) 21- 30Km (d) 31-50km (e) above 50km
(d) If it is from both rural and other towns fill both part (b) and (c)
2.8 Has the number of your clients changed in the last three years? Circle one:
(a)Increased (b) decreased (c) stayed the same.
2.9 What is the size of your average monthly turnover: Circle one: (this is NOT profit!)

156
(DON’T READ THE LIST)
(a) Ksh0 – Ksh500
(b) Ksh501 – Ksh1 000
(c) Ksh1 001 – Ksh2 000
(d) Ksh2 001 – Ksh5 000
(e) Ksh5 001 – Ksh10 000
(f) Ksh10 001 – Ksh50 000
(g) More than Ksh50 001
2.11 Do you offer credit to your customers? Circle one: (a) Yes (b) no
2.12What are your daily expenses related to doing business (give a list, but not the amount)
a)……………………………………….
b)……………………………………….
c)………………………………………….
d)…………………………………………
e)……………………………………………
f)……………………………………………
g)……………………………………………….
2.12(a) in your own opinion, are the expenses (a) too high (b) just OK.
2.13 Does your family have any other source of income? Circle one (a) Yes (b) no
2.13(a) If no, how do you cope in low business seasons. ……………
3. Job creation
4.1 How many employees do you have? Circle one:
(a) 0 (only yourself) (b) 1-2 employees (c) 3-5 employees
(d) 6-10 employees
4.2 Where do your employee(s) come from? ..............................................
4.3 How much do your employees get on average per month……………………….
(a) Ksh0 – Ksh500
(b) Ksh501 – Ksh1 000
(c) Ksh1 001 – Ksh2 000
(d) Ksh2 001 – Ksh5 000
157
(e) Ksh5 001 – Ksh10 000
(f) Over Ksh 10,000
5. Questions for the business owner
5.1Have you ever been engaged in formal employment? (a)Yes (b) No.
5.1(a) Why did you leave formal employment……………………………………………………
5.2 How long have you owned this business? ………………………………….
5.3 How did you access start-up capital? Circle one or more: DON’T READ LIST
(a) Family savings OR
(b) Loan from family OR
(c) Loan from financial institution OR
(d) Loan from Small Cash Loans OR
(e) Social grants (e.g. pension) OR
(f) Other: Specify: ………………………………………
5.4 How much was your initial capital
(a) Ksh0 – Ksh500
(b) Ksh501 – Ksh1 000
(c) Ksh1 001 – Ksh2 000
(d) Ksh2 001 – Ksh5 000
(e) Ksh5 001 – Ksh10 000
(f) Ksh10 001 – Ksh50 000
(g) More than Ksh50 001
5.5 Have you had training on your business? (a) Yes (b) No
5.5(a) If yes, who provided the training………………………………………………………
5.6 Do you believe that the local economy is (a) Improving (b) Static (c) Declining?
5.7 Would you like to expand the size of your business? (a)Yes (b) no
5.7 (a) Give reasons ……………………………………………………………
5.8 What are the major problem preventing you from increasing the number of your clients?
Specify: …………………………………………………………….
5.9 Would you like to diversify your business? Circle one: (a) Yes (b) no
5.9 (a) If yes, in what direction? …………………………………………….

158
5.10 Would you be interested in receiving business mentoring (e.g. financial management,
marketing, and accounting)? Circle one (a) Yes (b) no (b) maybe
5.11 Would you be interested in receiving tax advice? Circle one: (a) Yes (b) no
Give reasons …………………………………………
5.12 Do you think the local Council’s business licensing policy is: Circle one.
a) Too strict /
b) Not strict enough /
c) Just right
5.13 Do you belong to a trade or business organisation, including Revolving and Savings Credit
Association (ROSCA)? Circle one (a) Yes (b) no
5.13(a) If yes, specify which one(s): ……………………………………………………
5.14 In your experience, has any organisation helped you in setting up and running your
business?
Specify: ………………………………………………………………
5.15 In your opinion, which organisation could help you grow/expand your business?
………………………………………………………………
5.16 In your opinion, should the local Municipality assist businesses such as yours? Circle one:
(a) Yes (b) no
5.17(a) Give a reason for your answer: ………………………………………………….
6.0 Number of dependants………………………………………
6.1 Do you live with the dependants: (a) yes (b) no
(if yes to qn.7.0)
6.2 If no, where do they live?……………………
6.3 How often do you visit them?
(a) Twice in a week
(b) Weekly
(c) Twice in a month
(d) Monthly
(e) Twice in a year
(f) Yearly
(g) Other, specify…………………………..

159
6.4 Who mostly visits you from your family?
(a) A relative
(b) A member from your nuclear family, specify which one……………………
6.5 How often do they visit you?
(a) Twice in a week
(b) Weekly
(c) Twice in a month
(d) Monthly
(e) Twice in a year
(f) Yearly
(g) Other, specify…………………………..
7.0 Would you like to be contacted by us in the future? Yes / no
THANK YOU FOR YOUR COOPERATION
160
BIBLIOGRAPHY
Scientific References and Books
Andreoni, J., Erard B. and Feinstein, J. (1999). ”Tax Compliance”, Journal of Economic
Literature, Vol. 36. N°2, pp. 21
Aryeestey, E. and Gockel, F. (1991). ”Mobilizing domestic resources for capital formation in
Ghana. The role of informal financial sector”. Africa Economic Research. Consortium Research
paper N°3
Atieno, R. (2006). “Linkages between MSEs and Financial Institutions: Implications for the
Development of Small Scale Clothing Enterprises in Kenya”, Final Report Submitted to the
Africa Clothing and Footwear Research Network, Nairobi
Barr, M.A. (1998). “Enterprise Performance and the Functional Diversity of Social Capital”.
Centre for the Study of African Economies, WPS/98-1
Barrett, C. B. (2008). “Smallholder market participation: Concepts and evidence from eastern
and southern Africa”. Food Policy, 33(4), pp. 299-317
Baulch, B. and Hoddinott, J. (2000). “Economic mobility and poverty dynamics in developing
countries”. Journal of Development Studies, 36(6),pp. 1-24
Bennett, J.R. (1998). “Business Associations and their Potential Contribution to the
Competitiveness of SMEs”, Entrepreneurship and Regional Development, 10, pp. 243-260
Bigsten, A., P. Collier, S., Dercon, M. Fafchamps, B., Guthier, J. W., Gunning, M., Soderbom,
A., Oduro, R., Oostendorp, C., Patillo, F. Teal and A. Zeufack (2000). “Credit Constraints in
Manufacturing enterprises in Africa”, Centre for the Study of African Economies, WPS/2000.24
Bolnick, B.R. (1992). Moneylenders and financial markets in Malawi. Harvard Institute of
International Development, Cambridge and North Eastern University, Boston. World
Development Vol.20, N°1
Braun, J. (2008). “Rural-urban linkages for growth, employment, and poverty reduction”.in: G.
Alemu and E. Wale (Eds.) Proceedings of the Fifth International Conference o the Ethiopian
Economy. Ethiopian Economic Association, Addis Ababa, Ethiopia
Bulunywa, W. (1999). “Entrepreneurship and small business enterprise growth in Uganda”.
Makerere University, Uganda
Bureau of African Affairs (2010). USA State Department, (www.state.gov)
161
Burke, A.E., FitzRoy, F.R. and Nolan, M.A. (2000). “When Less is More: Distinguishing
Between Entrepreneurial Choice and Performance”, Oxford Bulletin of Economics and Statistics,
Vol. 62. N°5, pp 34
Bwisa, H., (2002). Sunday Nation, August 4th 2002. Retrieved on 15th July, 2010.
http://www.nation.com/news/DailyNation/04082002/Business8.html
Calgari, M. (1998). “Flat Taxes and Effective Tax Planning”, National Tax Journal, Vol.
51.N°3, pp. 31
Carroll, R., Holtz-Eakin, D., Rider, M. and Rosen, H.S. (2000). “Personal Income Taxes and the
Growth of Small Firms”. NBER Working Paper N°7980
CBS, K-REP and ICEG (1999). A National Survey of Small and Micro Enterprises in Kenya,
Nairobi
Chilivumbo M. (1985). “Feeding the people: An examination urban agriculture in East Africa”.
International Development research centre Ottawa.
Conner, W. (2000). “The rural-urban linkages of households in Durban, South Afric”a: In
Environment and Urbanisation Vol. 10. N°1, pp. 77-87.
Daniels, et al. (2000). Rural-urban interactions and Livelihood strategies: The case of Lindi
region, Southern Tanzania. IIED
de Janvry, A and Sadoulet, E. (2006). “Peasant household behaviour with missing markets:
Some paradoxes explained”. Economic Journal, 101(409), pp. 1400-1417
Dondo, A. (1994). “Credit to the informal sector. Approches and models experienced in Kenya”.
K-REP occasional paper N°27, Nairobi. Kenya Rural Enterprises Program
Donald, R. P. (2007). Business research methods (10th ed.) Boston: McGraw-Hill
Douglass, M. (1998). “A regional network strategy for reciprocal rural-urban linkages: An
agenda for policy research with reference to Indonesia”. Third World Planning Review, 20(1),
pp. 1-33
Dow, W. H. and Norton, E. C. (2003). “Choosing between and interpreting the Heckit and Two-
Part models for corner solutions”. Health Services & Outcomes Research Methodology, 4(1), pp.
5-18.
Ellis, A., Cutura, J., Dione, N., Gillson, I., Nanuel, C. & Thongori J. (2007). Gender and
Economic Growth in Kenya: Unleashing the power of women. Washington, DC: The World
Bank
162
Erard, B. and Feinstein, J.S. (1994). “Honesty and Evasion in the Tax Compliance Game”,
RAND Journal of Economics. Vol. 25 N°4, 16p.
Evans, H.E. (1992). “Rural-urban relations, household income diversification and agricultural
productivity”, Development and Change Vol.22, pp. 519-545
Fan, S., Chan-Kang, C. and Mukherjee, A. (2005). “Rural and urban dynamics and poverty:
Evidence from China and India”. FCND Discussion Paper 196 (DSG Discussion Paper 23),
International Food Policy Research Institute (IFPRI), Washington, D.C., US
Freeman, D. B. and Glen B. Norcliffe, (1985). Rural enterprise in Kenya. Development and
spatial organization of the non-farm sector. Research Paper N°214. Chicago: University of
Chicago, Dept. of Geography
Friedmann, J., (1992). “Modular Cities: Beyond the Rural-urban Divide”, in Environment and
Urbanisation, Vol. 8, N°1
Friedmann, J. and Douglass M., (1975). Agropolitan development: Towards a New Strategy for
Regional Planning in Asia, University of California, Los Angeles
Friedmann, J., and Douglass, M.(1978). “Agropolitan Development: Towards a New Startegy
forRegional Planning in Asia“, in Lo, Fu-Chen and Kamal Salih (eds.), pp. 163-192
Gentry, W.M. and Hubbard, R.G. (2000). “Tax policy and Entrepreneurial Entry”. The American
Economic Review. Vol. 90. N°2, pp. 35
Owusu, G.(2005). “Small Towns in Ghana: Justification for their promotion under Ghana’s
Decentralization Programme”. African studies Quarterly 8, N°2
Gichira, R. (1995). Entrepreneurship development model for developing countries. University of
Illinois, Urbana Champaign
Hall, R.E. and Rabushka, A. (1983). Low Tax, Simple Tax. Flat Tax. McGraw Hill New York
Hall, R.E. and Rabushka, A. (1995). The Flat Tax.Hoover Institution Press, Stanford
Hardoy, J. E. and D. Satterthwaite (1986).Government policies and small and intermediate
urban centres, Hodder and Stoughton, London and Westview (USA),pp. 335-395
Hazel and Brown (1987). “The disappearing rural-urban boundary: Rural social economic
transformation in the Shongyang Dalian Region of China”. In Third World Planning Review,
pp.229-232
Henry, S. (2001). Good practices in business Development Service: How Do We Enhance
Entrepreneurial skills in MFLs Clients? Alternate Savings Ltd, Canada
163
Holtz-Eakin, D. (1995). “Should Small Businesses be Tax Favoured?”National Tax Journal,
Vol. 48. N° 3, 43 p.
IIED (2001). Rural urban Interactions and Livelihood Strategies Series: International Institute
for environment and Development, Working paper 1; October 2001, http://www.iied.org/
IIED (2001).Land Tenure and Resource Access in West Africa: Issues and Opportunities for the
Next Twenty Five Years, International Institute for Environmentand Development, London
Inziani, V.R. (2006). Informal sector as a source of funds for Small and Micro Enterprises-
evidence from Dandora Slums in Nairobi. Unpublished MBA thesis,University of Nairobi
Isaksson, A. and C. Wiglborg (2002). “Financial constraints on Kenyan Manufacturing”, in:
Bigsten, A. and P. Kimuyu (eds.), Structure and Performance of Manufacturing in Kenya,
Centre for the Study of African Economies, Oxford.
Isgut, A. E. (2004). “Non-farm income and employment in rural Honduras: Assessing the roleof
locational factors”. Journal of Development Studies, 40(3): 59-86
Johanson, J. and Mattson, L.-G. (1986). “Interorganizational Relations in IndustrialSystems-A
Network Approach Compared with the Transaction Cost Approach”, Intemational Studies of
Management and Organization, 40, 2
Johnson, G.E and W.E. (1974).Urban-rural transfer in Kenya: An estimated remittance
functions: Economic Development and Cultural Change, vol.22 N°.3, pp.473-479
Kerlinger (1986). Foundations of Behavioral Research
Kihonge, E. (2011).The role of SMEs In Housing Entreprises in Sustaining Urbanizatio: A case
study of Residential And Business Premises In Juja town In Central Kenya. Jomo Kenyatta
University of Agriculture and Technology, School of Human Resources and Development.Vol.3
Number 2
Kihonge, E. (2012). Unpublished work on ‘my jua kali focused politician’
Kihonge, E., Iravo, M. and Karanja, K. (2013). “Secondary towns and rural interactions in
Eastern Africa: SMEs in small mountainous towns and rural economic growth”, paper presented
at the Conference “The Attractiveness of Small and medium Towns. Criteria, Issues and
Strategies”, Krakow (Poland), 5-7 December.
Kihonge, E. (2014). “The role of small and medium enterprises (SMEs) in rural-urban inkages
and economic development: the case of Mt. Kenya Region in Central Kenya”, in F. Bart (ed.),
Rural and urban dynamics in the east-African mountains (to be published).
164
Kimani, S. and D.R.F. Taylor, (1973). Growth Centres and Development in Kenya. Thika,
Kenya: Maxim Printers
Kongolo, M. (2007). Women and Informal credit: Lessons from Moretele, South Africa
Kothari, C.-R. (2009). Research Methodology Methods and Statistics (3rd ed.). New Delhi: New
Age International
Korpi, T. (1997). “Is utility related to employment status? Employment, unemployment, labour
market policies and subjective well-being among Swedish youth”. Labour Economics, 4(2), pp.
125-147
K-Rep. (2001). Final report on BDS in Kenya. K – REP Advisory Services Ltd, Nairobi
Lanjouw, J. and Lanjouw, P. (2001). “The rural non-farm sector: Issues and evidence
fromdeveloping countries”. Agricultural Economics, 26(1), pp. 1-23
Liedholm, C. and Mead. D. C. (1987). “Small Scale Industries in Developing Countries:
Empirical Evidence and Policy Implications.” International Development Paper N°9. Michigan
State University Department of Agricultural Economics, East Lansing
Linn, J. F. (1979). Policies for Efficient and Equitable Growth of Cities in Developing Countries,
World Bank Staff Working Paper N°342. Washington: World Bank
Manolova T. S., Brush C. G. and Edelman L. F. (2008). “What do women entrepreneurs
want?”Strategic Change.17, pp. 69-82
McPherson, A.M. (1991). Micro and Small Enterprises in Zimbabwe. Results of a country wide
survey. Gemini Technical Report 25
Mead, D.C., and Liedholm, C. (1998). The Dynamics of Micro and Small Enterprises in
Developing Countries.Published by Elsevier Science Ltd
Meier, G. and Rauch, J. (2006).Leading issues in Economic development, Oxford University
Press, 7th Ed.
Meijerink, G. and Roza. P. (2007). “The role of agriculture in development. Markets, Chains and
Sustainable Development Strategy and Policy”. Paper, no 5. Stichting DLO: Wageningen.
Mellor, J. (1976). The new economics of growth. Ithaca, New York, Cornell University Press
Mitullah, W.V. (2003). “Street Trade in Kenya: The Contribution of Research in Policy Dialogue
and Response”, in Nabeel Hamdi (ed) Urban Futures: Economic Growth and Poverty
Reduction.Rugby: ITDG
165
Moock, J. L. (1978). “The content and maintenance of social ties between urban migrants and
their home-based support groups: The Maragoli case”. Africa Urban Studies, 3, pp. 15-31
Morris, A. (1997). “Market behaviour and market systems in the state of Mexico” Small Towns
and Beyond: Rural Transformation and Small Urban Centres in Latin America, Thela
Publishers, Amsterdam, pp. 123-132
Morris, M. H., Miyasaki, N. N., Watters, C. E., & Coombes, S. M. (2006). “The dilemma of
growth: understanding venture size choices of women entrepreneurs”. Journal of Small Business
Management 44(2),pp. 221–244
Mosenene, O. (2002). “Informal credit demand in Botswana. Micro lending industry in
Gaborone”. In Mugenda, O.M.and Mugenda A.G.,Research Methods: Quatitative and
Qualitative approaches. Nairobi: African Center for Technology Studies Press
Unpublished dissertation for Master of Arts Economics, University of Botswana
Muenda, P. (2004). “The orbits of urbanisation in Afric”a, In Building and Land Development:
pp. 48-56
Mullei, A. and Bokea, C. (1999). Micro and small enterprises in Kenya: Agenda for improving
the policy environment. International Centre for Economic Growth, Nairobi
Mulligan, G. F.(1984). “Agglomeration and Central Place Theory: A Review of the Literature”,
International Regional Science Review 9,1
Mwang’ombola, H.M. (2005). “Extension services to small-scale industries: The Tanzania
experience”. Forestry Department, Tanzania
Nabuteya, A. (2007). “Presentation at Youth Micro Finance Forum” held at University of
Nairobi: 12-10
Namusonge, G.S. (2005). “The role of Financial Institutions in Acquisition of Technological
Capabilities by Small and Medium Enterprises in Kenya”. Proposal Submitted to African
Technology Policy Studies (ATPS) Network
Ndegwa,N. (2002). “Decentralization in Africa;A stock taking Survey”. Africa working papers
Series 40World bank, Washington D.C.
Nyaosi, J. (2008). Why quest for a new constitution may yet prove exercise in futility. Free online
Articles Directory
166
Oberai, A.S and Singh, H.K.M.(1983). “Migration remittances and rural development: Findings
of a case study in the Indian Punjab”. International Labour law review, Vol.119, N°.2, pp. 229-
245
Oucho, J.O. (1996). Urban Migrants and Rural Development in Kenya. Nairobi: Nairobi
University Press
Ouma, A.P.S. (2004). Informal Financial sector in Kenya. The case of Siaya District.
Unpublished thesis for Master of Arts Economics Degree, Kenyatta University
Owuor, S.O. (2006). Rural livelihood sources for urban households. A study of Nakuru town,
Kenya. Leiden: African Studies Centre, ASC Working Paper 51
Pedersen, P. (1990). The Role of Small Rural Towns in Development.Bohuslaningens
Boktryckeri AB, Uddevalla Sweden
Perkins, D. H., Radelet, S., Snodgrass, D. R., Gillis, M. and Roemer, M. (2001). Economics of
Development, 5th edition. W.W. Norton & Company, New York, US
Ponsard, C. (1983). History of Spatial Economic Theory, Chapter 2: "Johann Heinrich von
Thünen", pp.13-18
Pretty, J. N and Hine, R. E. (2003). Reducing food poverty by increasing agricultural
sustainability in developing countries. Agriculture, Ecosystems and Environment, 95(1), pp. 217-
234
Reardon, T and Berdegue, J. (2002). “Rural non-farm employment and incomes in Latin
America: Overview and policy implications”. World Development, 29(3), pp. 395-409
Renaud, B. (1979). National Urbanization Policies in Developing Countries, World Bank Staff
Working Paper N°347, Washington: World Bank
Renkow, M., Hallstrom, D. G. and Karanja, D. D. (2004). “Rural infrastructure, transactioncosts
and market participation in Kenya”. Journal of Development Economics, 73(1), pp.349-367
Richardson, H.W. (1982). “Policies for Strengthening Small Cities in Developing Countries”,
Mathur (ed.), pp. 327-354
Rondinelli, D. (1983). Secondary Cities in Developing Countries: Policies for Diffusing
Urbanization, Beverly Hills: Sage Publications
Rondinelli, D. (1985). Applied Methods of Regional Analysis: The Spatial Dimensions of
Development Policy, Boulder, Colorado; Westview Press
167
Rondinelli, D. and Ruddle, K. (1978). “Urbanization and Rural Development: A Spatial Policy
for Equitable Growth”,New York: Praeger
Satterthwaite D. (1986). “Presentation; Roundtable on Urban Upgrading”, October 1-5.
Johannesburg, South Africa
Self, S. and Grabowski, R. (2007). “Economic development and the role of
agriculturaltechnology”. Agricultural Economics, 36(3), pp. 395-404
Sekaran, U. (2003). Research method for business: A skill building approach, 4th edition, John
Wiley & Sons
Shimooka, A. (1996). Measuring needs for training,1stedition
Sonfield, M., Lussier, R., Corman, J. and McKinney, M (2001). “Gender comparisons in
strategic decision making: An empirical analysis of the entrepreneurial strategy matrix”. Journal
of Small Business Management, 39(2), pp.165-173
Sonia, B. (2002). “The impact of economic liberalization on employment and wages in
India”International Policy Group: Geneva workshop: January 2002
Southall, A. (1988). “Small towns in Africa revisited”, African Studies Review Vol.31
St-Onge, S. (2005). “Support for growth oriented Women Entrepreneurs in Kenya program on
boosting Employment through Small Enterprise Development job creation and Enterprise
Development”. International Labour Office, Geneva and private Sector Department and Africa
Development Bank, Tunis
Tacoli, C. (1998). “Rural-urban interactions: A guide to the literature“, Environment and
Urbanization, Vol. 10 N°1 (April), pp. 147-166
Tacoli, C. (2004). “Rural-Urban Linkages and Pro-Poor Agricultural Growth: An Overview.
Helsinki Workshop, 17-18 June
Tacoli, C. (2000). Changing rural-urban interactions in Sub-Saharan Africa and their impact on
livelihoods: A summary. Working Paper Series on “Rural-Urban Interactions and Livelihood
Strategies”, Working Paper N°7, International Institute for Environment and Development
(IIED).
Tadesse, T. (2002). Contributions of town functions to the development of rural areas, empirical
of Ethiopia. Unpublished thesis
Taylor, M. (1996). “Earnings, Independence or Unemployment: Why Become Self-Employed?”
Oxford Bulletin of Economics and Statistics, Vol. 58.
168
Thaker, P. and Cowan, D. (2001). Economic Performance in Kenya. The Economist Intelligence
Unit
Theocharides, S. and Tolentino, A. (1991). “Integrated strategies for small enterprise
Development”. International Labour Organization, Geneva
Trager, L. (1988). “Rural-Urban Linkages: The Role of Small Urban Centres In Nigeria”.African
Studies Review. Vol.31.N°3 1988, pp.29-38.
Tucker, S. (2007). The four stages of start up business. Eyeplot Ltd, West Yorkshiren
Vincent, G. (2004). Sustainable Entrepreneurship. The role of Microfinance,Entrepreneurship
and Sustainability in Reducing Poverty in Developing Countries
Wooldridge, J. M. (2001). Econometric Analysis of Cross Section and Panel Data. The MIT
Press, Cambridge, Massachusetts, US Press, Cambridge, Massachusetts, US
Government of Kenya
Government of Kenya (2001). Economic Survey, Government Printer, Nairobi
Government of Kenya (2002). Economic Recovery Strategy for Wealth & Employment Creation,
2003. Government Printers, Nairobi
Government of Kenya (2003). Report of the 1998/99 Labour Force Survey, Central Bureau of
Statistics, Nairobi
Government of Kenya (2004). Value Added Tax Act, Cap 476. Government Printers, Nairobi
Government of Kenya (2004). Kibera social and economic mapping: household survey report.
Government Printers, Nairobi
Government of Kenya (2005). Sessional Paper Number 2 of 2005 on the Development of Micro
and Small Scale Enterprises for Wealth and Employment Creation for Poverty Reduction,
Government Printer, Nairobi
Government of Kenya (2005). Investment Promotion Act. Government Printers, Nairobi
Government of Kenya (2005). Investment program for the economic recovery strategyfor Wealth
& Employment Creation, 2003-2007. (Annual progress report 2003/2004) Government Printers,
Nairobi: 2005
Government of Kenya (2006). Private sector development strategy paper 2006 –
2010.Government printers, Nairobi
169
Government of Kenya (2007). Vision 2030, first medium plan, (2008-2012). Government
Printers, Nairobi
United Nations
UNDP and UNCHS (1995). Rural-Urban Linkages: Operational implication forsustained
Development, unpublished, New York
UNDP (2000). Rural-Urban Relations: An Emerging Policy Priority, New York: Institutional
Development Group, Bureau for Development Policy, UNDP (Interim Report, December 2000)
UNDP (Interim Report, December, 2000). Development Group, Bureau for Development Policy
UNHCS (Habitat) Habitat II – Dialogue # 6: Land and Rural/Urban Linkages in the Twenty-
First Century, Proceedings of the Conference held in Istanbul, June 6 2002,UNCHS, Nairobi
World Bank
World Bank (1998). Business development service for SMEs, Preliminary Guideline for donor
funded interventions. World Bank, Washington
World Bank (2000). Kenya: Inside Informality: poverty, jobs, housing and services in Nairobi’s
slums, May 31, 2006, report N°36347-KE
World Bank. (2000). Business development services for small enterprises: Guideline for donor
intervention (2nd ed.). World Bank, Washington.
World Bank (2000). Increasing the demand for labour: Deregulation to increase export growth,
agricultural growth and labour market flexibility. Chapter 6 in India: Reducing Poverty,
Accelerating Development (Washington D.C).
World Bank (2001). World Development Report 2000/2001: Attacking Poverty, New York:
Oxford University Press
World Bank (2002). Globalization, Growth, and Poverty: Building an Inclusive World, World
Bank Policy Research Report, New York: Oxford University Press.
World Bank (2002). World Development Report 2003: Sustainable Development in a Dynamic
World, New York: Oxford University Press.
World Bank (2006). Kenya inside Informality: poverty, jobs, housing and services in Nairobi’s
slums, May 31, report N°36347-KE

170
Websites
www.theodora.com/wfbcurrent/kenya/kenya_economy.html
www.africaneconomicoutlook.org
www.creating7.net
www.kuntaportaali.org
www.sciencedirect.com/science
www.state.govt
http://www.sciencedirect.com/science
www.googlemaps
171
LIST OF FIGURES
Figure 1: SMEs and the ‘Virtuous’ Circle of rural-urban linkages 16
Figure 2: Conceptual Framework 19
Figure 3: Apart from the said business, do you have any other source of income? 120
Figure 4: An illustration of volume of goods distributed into the rural areas per
rural radius as an aggregate of both towns
143
172
LIST OF TABLES
Table 1: Credit access in Kenya 26
Table 2: Functions and definition of towns in Kenya 37
Table 3: Major rural-urban linkages and related facilities in town centres 49
Table 4: A comparison of education levels in both towns and at National level 86
Table 5: Summary of demographic characteristics of the respondents 87
Table 6: Initial Capital 90
Table 7: Gender Representation in different SME categories 92
Table 8: A comparison on views of National economy performance among the
sub-sectors
96
Table 9: Comparison of Education level of SMEs in manufacturing with other
categories
97
Table 10: SMEs in small towns and sources of supplies 103
Table 11: SMEs who sourced supplies from rural sources in the two towns 104
Table 12: SMEs who sourced supplies from national and regional sources 106
Table 13: Chi table Analysis on second source of income and initial capital 123
Table 14: Chi table Analysis on second source of income and business size 124
Table 15: Chi table Analysis on second source of income and monthly turnover 125
Table 16: Chi table Analysis on second source of income and business loan 125
Table 17: SMEs in small towns and the most common locations of clients 128

173
Table 18: SME sub-sector and regional/national sources of supply 130
Table 19: SME sub-sector and rural clients 130
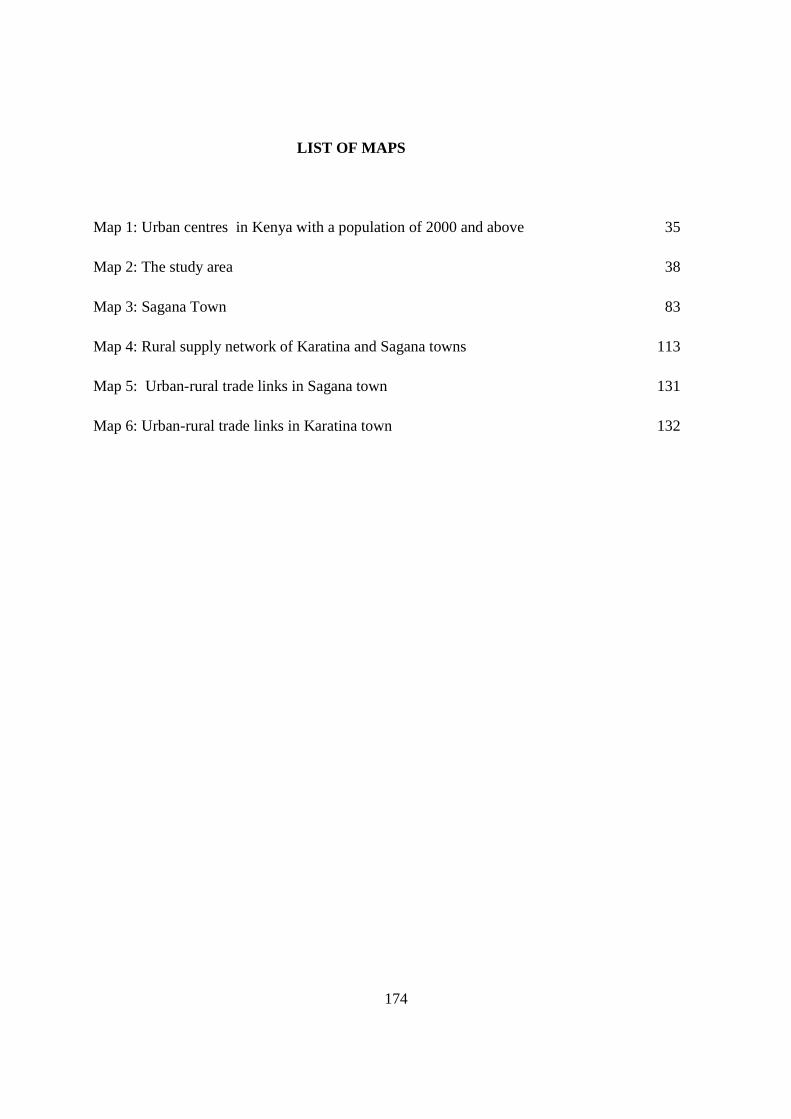
174
LIST OF MAPS
Map 1: Urban centres in Kenya with a population of 2000 and above 35
Map 2: The study area 38
Map 3: Sagana Town 83
Map 4: Rural supply network of Karatina and Sagana towns 113
Map 5: Urban-rural trade links in Sagana town 131
Map 6: Urban-rural trade links in Karatina town 132
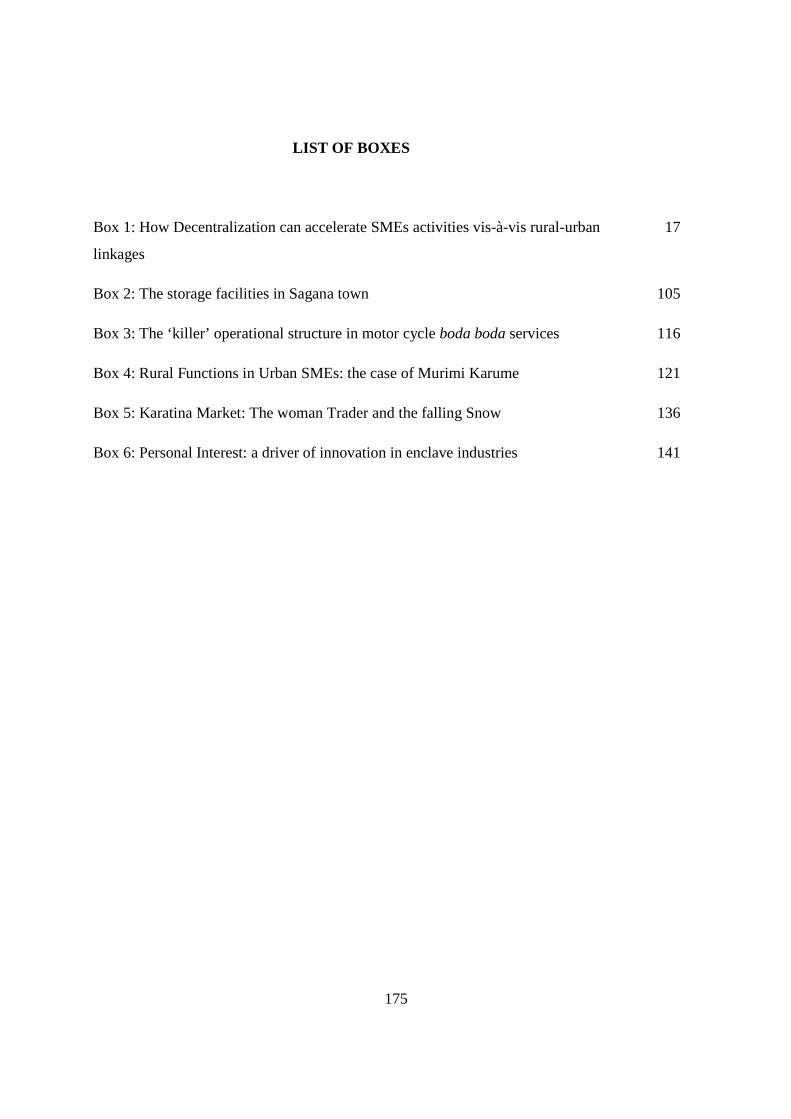
175
LIST OF BOXES
Box 1: How Decentralization can accelerate SMEs activities vis-à-vis rural-urban
linkages
17
Box 2: The storage facilities in Sagana town 105
Box 3: The ‘killer’ operational structure in motor cycle boda boda services 116
Box 4: Rural Functions in Urban SMEs: the case of Murimi Karume 121
Box 5: Karatina Market: The woman Trader and the falling Snow 136
Box 6: Personal Interest: a driver of innovation in enclave industries 141
176
LIST OF PHOTOS
Photo 1: An aerial view of Katarina Market 39
Photo 2: Small scale Tea farming in rural catchments of Karatina town 82
Photo 3: Sections of Karatina town and Sagana town 84
Photo 4: Traders in Karatina market 93
Photo 5: A private school in Karatina town 95
Photo 6: Traditionally manufactured open shoes on sale in Karatina market 98
Photo 7: A manufacturing shed and a woman trader in Sagana town 99
Photo 8: Kenol-Kobil Depot one of the storage/distribution centres in Sagana 105
Photo 9: Wakulima Dairy Company in Rural Karatina 107
Photo 10: Farmer connecting directly to urban market by use of mobile phone
technology
109
Photo 11: Collection and packing centre of French beans for one of the
Contracting firms
111
Photo 12: Urban versus Rural Road connectivity 112
Photo 13: Railway transport Karatina town 115
Photo 14: Motor cycle ‘boda bodas’ in Karatina 117
Photo 15: Travelers headed to Northern Kenya stop to buy rice at Sagana 118
Photo16: Murimi in his town workshop and in his rural farm 122
Photo 17: The researcher and a trader (Muchai) in Sagana market 134
Photo 18: Fresh produce on sale in Karatina market 135

177
Photo 19: The old and, new sheds under construction in Karatina 140
Photo 20: Interlocking blocks and a locally assembled machine 142
178
TABLE OF CONTENTS
Declaration 3
Acknowledgements 4
Abstract 7
Thesis set-up 10
PART ONE 11
CHAPTER 1A : INTRODUCTION 12
Background 12
Main Objective of the study 14
Theoretical Concept 14
Conceptual framework 18
The study set-up 20
Methodology 20
CHAPTER 1B: OVERVIEW OF THE KENYAN CONTEXT AND
PRESENTATION OF THE STUDY AREA
21
The political environment 21
The economic environment 22
Structural Adjustment Programs (SAPs) 24
Small and Medium Enterprises Sector in KenyaErreur ! Signet non défini. 25
Challenges facing SME sector in Kenya 26
179
Efforts in Progress 29
Rural-urban linkages in Kenya 34
Study area 37
Conclusions on the chapter 42
CHAPTER 1C: DISSERTATION LITERATURE REVIEW 43
Introduction 43
Historical evolvement of the ‘rural-urban linkages’ concept 43
The shift from decentralization 45
An overview of rural urban linkages 45
Types of rural-urban linkages 46
Small towns and rural-urban linkages 52
The small enterprises and rural-urban linkages 61
Rural Functions in Urban SMEs 64
Conclusions on the chapter 71
CHAPTER 1D: THESIS METHODOLOGY 73
Introduction 73
Research Design 73
General approach and sampling procedures 74
Selection of SMEs for the general survey 75
Methods of data collection 76
Data Analysis 79
180
PART TWO 80
CHAPTER 2A: Diverse and Dynamic SMEs in small towns 81
The general economic outlook of the towns 81
Who are the Actors? 84
Distinctiveness of the enterprises 88
The SMEs Sub-sectors 91
Conclusions on the chapter 100
CHAPTER 2B: The diminishing role of SMEs in small Towns in forward
linkages and Regional Development
103
Rural supply zones 112
Transport and Communication means 114
Rural-urban flow patterns 117
Conclusions on the chapter 118
CHAPTER 2C: Rural functions in small towns: Role of the second rural
income in urban SMEs growth
120
Does the second source of income influence the initial capital? 122
Did the second source of income influence the size of the business? 123
Does the rural source of income influence monthly business turn over? 124
Does the second source of income influence the acquisition of business loan? 125
Conclusions on the chapter 126
CHAPTER 2D: SMEs in small Towns and their role in Backward linkages,
Rural and Regional Development
127
181
Sources of Goods and Services 129
Sources from small enclave industries 138
Rural flow patterns 142
Conclusions on the chapter 143
GENERAL CONCLUSIONS 145
Table of Acronyms 149
Appendix 2a-Research PermitErreur ! Signet non défini. 151
Appendix 2b-Research Permit 152
Appendix 3-Traders Questionnaire 153
BIBLIOGRAPHY 160
LIST OF FIGURES 171
LIST OF TABLES 172
LIST OF MAPS 174
LIST OF BOXES 175
LIST OF PHOTOS 176
TABLE OF CONTENTS 178
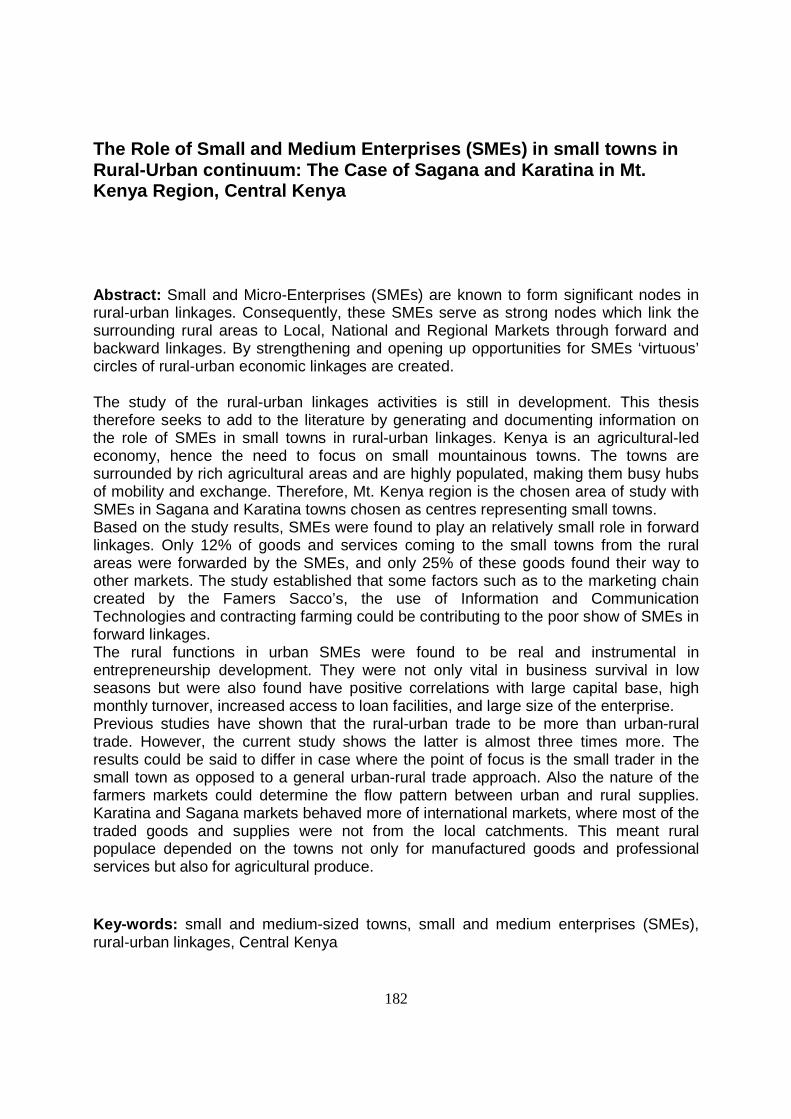
182
The Role of Small and Medium Enterprises (SMEs) in small towns in Rural-Urban continuum: The Case of Sagana and Karat ina in Mt. Kenya Region, Central Kenya
Abstract: Small and Micro-Enterprises (SMEs) are known to form significant nodes in rural-urban linkages. Consequently, these SMEs serve as strong nodes which link the surrounding rural areas to Local, National and Regional Markets through forward and backward linkages. By strengthening and opening up opportunities for SMEs ‘virtuous’ circles of rural-urban economic linkages are created.
The study of the rural-urban linkages activities is still in development. This thesis therefore seeks to add to the literature by generating and documenting information on the role of SMEs in small towns in rural-urban linkages. Kenya is an agricultural-led economy, hence the need to focus on small mountainous towns. The towns are surrounded by rich agricultural areas and are highly populated, making them busy hubs of mobility and exchange. Therefore, Mt. Kenya region is the chosen area of study with SMEs in Sagana and Karatina towns chosen as centres representing small towns. Based on the study results, SMEs were found to play an relatively small role in forward linkages. Only 12% of goods and services coming to the small towns from the rural areas were forwarded by the SMEs, and only 25% of these goods found their way to other markets. The study established that some factors such as to the marketing chain created by the Famers Sacco’s, the use of Information and Communication Technologies and contracting farming could be contributing to the poor show of SMEs in forward linkages. The rural functions in urban SMEs were found to be real and instrumental in entrepreneurship development. They were not only vital in business survival in low seasons but were also found have positive correlations with large capital base, high monthly turnover, increased access to loan facilities, and large size of the enterprise. Previous studies have shown that the rural-urban trade to be more than urban-rural trade. However, the current study shows the latter is almost three times more. The results could be said to differ in case where the point of focus is the small trader in the small town as opposed to a general urban-rural trade approach. Also the nature of the farmers markets could determine the flow pattern between urban and rural supplies. Karatina and Sagana markets behaved more of international markets, where most of the traded goods and supplies were not from the local catchments. This meant rural populace depended on the towns not only for manufactured goods and professional services but also for agricultural produce.
Key-words: small and medium-sized towns, small and medium enterprises (SMEs), rural-urban linkages, Central Kenya