
THE ROLE OF OCCUPANT BEHAVIOUR IN GAS CONSUMPTION FOR SPACE-HEATING: A comparative case-study of 3...
165
Graduate School of the Environment Centre for Alternative Technology, Machynlleth, Powys, SY20 9AZ, UK tel: 01654 705981 School of Computing and Technology University of East London Docklands Campus 4-6 University Way London E16 2RD tel: 020 8223 3000
Transcript of THE ROLE OF OCCUPANT BEHAVIOUR IN GAS CONSUMPTION FOR SPACE-HEATING: A comparative case-study of 3...

Graduate School of the EnvironmentCentre for Alternative Technology,Machynlleth,Powys, SY20 9AZ,UK
tel: 01654 705981
School of Computing and TechnologyUniversity of East LondonDocklands Campus4-6 University WayLondonE16 2RD
tel: 020 8223 3000

THE ROLE OF OCCUPANT BEHAVIOUR
IN GAS CONSUMPTION FOR SPACE-HEATING:
A comparative case-study of 3 identical flats
Angela Maria Lafferty
MSc Architecture: Advanced Environmental and Energy StudiesCentre for Alternative Technology, Machynlleth
January 2014

MSc AEES January 2014 Angela Lafferty
ABSTRACT
In the context of the UK's binding CO2 emissions reduction target of 80% by 2050, this thesisinvestigates the little-understood effect of occupant behaviour on household energyconsumption, particularly for space-heating, and its role in the observed 'performance gap.'
It takes the form of a comparative case-study of 3 identical flats in Edinburgh: the flats werecontinuously monitored for 3 months between September and November 2013, to obtain hourlygas and electricity consumption data, and temperature and relative humidity measurements at5/10 minute intervals. Sensors were placed in the main living space, hallway and 3 bedroomsof each flat. The quantitative data is complemented by in-depth interviews with the occupants.
Both electricity and gas consumption were found to vary considerably over the 3 months aswell as on an annual basis. Only one of the flats was found to have a primary energyconsumption of lighting, heating, HW and ventilation within the SAP estimate, but this wasneither a good indicator of overall energy use or of total household CO2 emissions. Dailysnapshots were analysed in greater detail to shed light on differences of behaviour on the sameday in the same conditions.
The significant differences between flats were found to be largely explained by habits whichhad formed around seeking thermal comfort, which were also affected by the design of the flat.Behaviour was generally not influenced by the threat of climate change, and lack of action bythe government is argued to be the principal reason for 'missing' CO2 reductions.
Some proposals to induce large-scale behavioural change are put forward, based oneducation, feedback loops and the polluter-pays principle, with the conclusion that only aradical change in government strategy will bring about the magnitude of change required.
Keywords:
domestic energy; space-heating; energy-monitoring; performance gap; occupant behaviour;thermal comfort; household CO2; window-opening; post-occupancy evaluation; buildingperformance evaluation.
3

MSc AEES January 2014 Angela Lafferty
ACKNOWLEDGEMENTS:
I would like to thank all those people without whom this thesis research could not have happened:
My lovely neighbours, who allowed me to invade their homes – I can't use your real names butyou know who you are; Ian Clark of Ewgeco, for lending the energy monitoring equipment (andtelling me how to use it!); Charlie Brown of Strathclyde University Architecture Department forlending the Tinytag data loggers and his time spent on uploading the data; Adrian Leaman forkind permission to use the BUS methodology survey and providing me with the benchmarkingresults and graphics; Brian Hardie and Chatriona Hossack of City of Edinburgh Council forproviding copies of the extensive building warrant drawings and documentation; and JohnGilbert, Sandy Halliday and Branka Dimitrijevic for helpful advice in the initial stages.
Huge thanks also go to all the staff and students at the Centre for Alternative Technology, forproviding me with the inspiration and expert knowledge to undertake this research - inparticular, my thesis tutor Jason Hawkes, for all his help, constructive criticism and calmingwords.
Thanks to my parents and sisters for feeding me and looking after the kids when needed.Above all, thanks to my partner Ian and our children Max and Carmen, for putting up with meover the last few months – the old Mummy will be back as of next week!
Beyond any aspirations of contributing knowledge to the field, or having implications for policy-makers, by far the most important aspect of this research is the learning journey I have beenon.
Conflict of interest:
The author is also an occupant in one of the case-study flats. Although it may be argued thatthis influenced results, the author believes that heating behaviour was consistent with previousyears (reflected in average annual consumption figures) and far from detracting from the study,being an active participant brought the advantages of knowledge and experience of thecuriosities of the flats, which would have been missed by an outside researcher.
4

MSc AEES January 2014 Angela Lafferty
Table of Contents
ABSTRACT..................................................................................................... 3
ACKNOWLEDGEMENTS:...............................................................................4
ABBREVIATIONS and ACRONYMS............................................................10
CHAPTER 1 - INTRODUCTION....................................................................11
1.1 Environmental context...................................................................................111.2 CO2e reduction targets..................................................................................111.3 Energy security................................................................................................121.4 The 'energy performance gap'.....................................................................121.5 Research focus and objectives....................................................................12
CHAPTER 2 – LITERATURE REVIEW..............................................................13
2.1 Introduction.....................................................................................................13
2.2 The performance gap....................................................................................132.2.1 How is building performance measured?.............................................132.2.2 What is the 'performance gap'?.............................................................142.2.3 Extent of the gap......................................................................................142.2.4 Contributing factors – what causes the gap?......................................15
2.2.4.1 Building-related factors ..................................................................152.2.4.2 Prediction-related factors...............................................................17
2.3 Focus on the 'occupant effect' ...................................................................18
2.4 Background to thermal comfort ..................................................................20
2.5 Summary: a knowledge gap........................................................................21
CHAPTER 3 – METHODS..............................................................................22
3.1 Introduction & site context.............................................................................22
3.2 Quantitative data collection.........................................................................253.2.1 Gas and electricity...................................................................................253.2.2 Temperature and relative humidity........................................................263.2.3 Weather data............................................................................................273.2.4 Data analysis.............................................................................................27
3.3 Qualitative data collection...........................................................................283.3.1 Occupant diaries......................................................................................283.3.2 Interviews...................................................................................................28
CHAPTER 4 – METHODOLOGY...................................................................29
4.1 Mixed-method approach .............................................................................29
4.2 Main methodology types..............................................................................294.2.1 'Diagnostic' POE........................................................................................29
5

MSc AEES January 2014 Angela Lafferty
4.2.2 Large data-set analyses...........................................................................304.2.3 Mid-sized information-rich studies...........................................................30
4.3 Discussion of methods used..........................................................................314.3.1 The case-study approach.......................................................................314.3.2 The 'controlled' experiment - limitations.................................................314.3.3 Length of study..........................................................................................334.3.4 Survey and interview................................................................................33
4.4 Relevance of findings in a nationwide context..........................................34
CHAPTER 5 – RESULTS and ANALYSIS........................................................35
5.1 Introduction.....................................................................................................35
5.2 Interview results – portraits.............................................................................355.2.1 Flat A portrait - 'Amanda and Tim'..........................................................355.2.2 Flat B portrait – 'Rachel and Gordon'.....................................................365.2.3 Flat C portrait -'Becky and Michael'.......................................................36
5.3 Overall energy consumption........................................................................37
5.4 Gas: variation of consumption over time....................................................385.4.1 Cumulative consumption........................................................................385.4.2 Average daily consumption....................................................................385.4.3 Isolating heating from cooking and hot water use..............................39
5.5 Comparison with SAP.....................................................................................41
5.6 Temperature monitoring results and analysis..............................................445.6.1 Global temperature data summary.......................................................445.6.2 Focus on living room temperatures........................................................475.6.3 Living room temperatures differentiation by period of the day ........485.6.4 Living room temperature variation over duration of study .................49
5.7 Three daily comparisons................................................................................505.7.1 Tuesday 5th November – Dull cold day (Figure 26)..............................515.7.2 Thursday 7th November – Sunny cold day (Figure 27).........................555.7.3 Friday 22nd November – Coldest day (also sunny)..............................56
5.8 Relative humidity (RH) ...................................................................................59
5.9 BUS survey results – occupant satisfaction..................................................59
5.10 Energy and CO2 benchmarking.................................................................61
CHAPTER 6 – DISCUSSION.........................................................................65
6.1 Introduction ....................................................................................................65
6.2 What influences and motivates behaviour?................................................656.2.1 Thermal comfort .......................................................................................656.2.2 Habits..........................................................................................................696.2.3 Feedback for occupants: energy saving advice.................................70
6.3 The action-performance gap.......................................................................716.3.1 Lack of awareness individual role...........................................................71
6

MSc AEES January 2014 Angela Lafferty
6.3.2 Lack of awareness: amount of energy being consumed...................726.3.3 Lack of awareness...a 'disconnect' or 'head in the sand'?.................726.3.4 Government & media..............................................................................74
6.4 How to change – potential solutions............................................................756.4.1 Existing action and proposals..................................................................756.4.3 TV campaign: “We're in this together!”.................................................766.4.4 Simple Home User manuals.....................................................................776.4.5 Personal Carbon Allowances and Increasing Block Tariffs..................79
6.5 Note from a Scottish perspective.................................................................80
CHAPTER 7 - CONCLUSIONS.....................................................................82
7.1 Summary .........................................................................................................82
7.2 Key recommendations..................................................................................83
7.3 Implications.....................................................................................................84
7.4 Limitations........................................................................................................85
7.5 Further research .............................................................................................86
POST-SCRIPT...................................................................................................................87
APPENDIX A - Data loggers: Specifications and 'calibration'.................................88
APPENDIX B - 'Variables' of experiment ....................................................................91
APPENDIX C - Interview transcript Flat A....................................................................92
APPENDIX D - Interview transcript Flat B..................................................................105
APPENDIX E - Interview transcript Flat C..................................................................121
APPENDIX F - Product specifications........................................................................133
APPENDIX G - Electricity consumption ....................................................................134
APPENDIX H - Meter and Ewgeco data comparison ...........................................135
APPENDIX J - Calculation methods..........................................................................137
APPENDIX K - SAP regulated energy estimates......................................................138
APPENDIX L - SAP Calculations (SAP 2005)..............................................................139
APPENDIX M - BUS Methodology Questionnaire & Selected Results....................145
APPENDIX N - Heat loss calculations........................................................................152
APPENDIX P - Flat B: Relative humidity.....................................................................154
REFERENCES.............................................................................................155
BIBLIOGRAPHY.........................................................................................161
7

MSc AEES January 2014 Angela Lafferty
Index of Tables
Table 1: Key case-study details 22
Table 2: List of logger types and locations 26
Table 3: Summary of daily gas consumption data for all 3 flats 39
Table 4: Collation of all SAP information gathered 43
Table 5: SAP predictions versus actual energy use ('regulated' and total) 43
Table 6: Table of metrics: measuring energy use and CO2 emissions 64
Index of Figures
Figure 1: Graph showing the variations in atmospheric CO2 concentration 11
Figure 2: Residential sector GHG emissions (based on end-source) 1990-2011 14
Figure 3: Plot of neutral temperatures against outdoor temperatures 21
Figure 4: Map of Edinburgh showing site's coastal location 23
Figure 5: Edinburgh's location in the UK context 23
Figure 6: Aerial site view, showing case-study flats in context 23
Figure 7: Photo of main south-facing elevation 24
Figure 8: Plan diagram of the flat layout 24
Figure 9: Numbered diagram of Ewgeco monitoring system setup 25
Figure 10: Effect on sunrise times - Flats A and C 33
Figure 11: Stacked column graph of total energy consumption for all 3 flats 37
Figure 12: Total gas consumption of all 3 flats 38
Figure 13: Line graph showing daily gas consumption for all 3 flats 39
Figure 14: Line graph (as Fig. 13) adjusted to exclude cooking and HW gas use 40
Figure 15: Stacked bar graph of gas breakdown per flat 41
Figure 16: 'Extrapolation' of monitored gas consumption to annual profiles 41
Figure 17: Stacked bar graph of annual average gas consumption per flat 42
Figure 18: Column graph comparing SAP Primary Energy Indicator with actual'regulated' and total energy use per flat 44
Figure 19: Plan diagram showing mean temperatures per room, per flat 45
Figure 20: Flat A: Range, IQ range and median temperatures for each room 45
Figure 21: Flat B: Range, IQ range and median temperatures for each room 46
Figure 22: Flat C: Range, IQ range and median temperatures for each room 46
Figure 23: Histogram of temperature distribution in living rooms 47
Figure 24: Box & whisker plot of mean living room temps, by period of day 49
Figure 25: Living room temperature variation over the 12 weeks 50
8

MSc AEES January 2014 Angela Lafferty
Figure 26: Comparison: dull cold day – Tuesday 5th November 52
Figure 27: Comparison: sunny cold day – Thursday 7th November 54
Figure 28: Comparison: the coldest day (also sunny) – Friday 22nd November 58
Figure 29: Summary of overall BUS methodology survey results 60
Figure 30: Key results - temperature and heating 60
Figure 31: Case-study flats' annual energy consumption, with benchmarks 61
Figure 32: Annual CO2 emissions for each flat, with benchmarks 62
Figure 33: Annual energy costs per flat (assuming same unit costs 63
Figure 34: Comparison of flats against Passivhaus and Zero Carbon Homes 64
Figure 35: External wall detail (adapted from warrant drawing) 67
Figure 36: Ewgeco real-time display of electricity and gas use 75
Figure 37: Electricity savings as part of a nationwide campaign in New Zealand 76
Figure 38: Example of the 'Overview' page of a Home User Manual 78
Figure 39: Increasing block tariffs for electricity and gas 80
Figure 40: UK map showing mean maximum summer temperatures 81
9

MSc AEES January 2014 Angela Lafferty
ABBREVIATIONS and ACRONYMS
ASV Annual Service Visit (boiler service)
BPE Building Performance Evaluation
BRE Building Research Establishment
CO2 Carbon dioxide
EPC Energy Performance Certificate
EST Energy Saving Trust
DECC Department for Energy and Climate Change
GHA Good Homes Alliance
GHG Greenhouse Gas
HW Hot water
IBT Increasing Block Tariff
IES Integrated Environmental Solutions
IPCC Intergovernmental Panel on Climate Change
MRT Mean Radiant Temperature
MVHR Mechanical Ventilation with Heat Recovery
NHBC National House-Building Council
Ofgem Office of Gas and Electricity Markets
PCA Personal Carbon Allowance
PEI Primary Energy Indicator
PHPP PassivHaus Planning Package
POE Post-Occupancy Evaluation
RdSAP Reduced data SAP
RH Relative humidity
SAP Standard Assessment Procedure
SEDBUK Seasonal Efficiency of Domestic Boilers in the UK
SPSS (A statistical software package from IBM)
TRV Thermostatic radiator valve
ZCB Zero Carbon Britain
ZCH Zero Carbon Homes
10

MSc AEES January 2014 Angela Lafferty
CHAPTER 1 - INTRODUCTION
1.1 Environmental context
It is now widely accepted that the earth's climate is changing as the result of rising levels ofgreenhouse gases (GHGs) in the atmosphere, the main one of which is carbon dioxide or CO2
(DECC, 2013b). It is acknowledged that significant natural fluctuations in CO2 levels occur overtime, however Fig 1 below shows that current levels are unprecedented and the rate ofincrease is far higher than any over the last 800,000 years, leading to the conclusion that theprincipal cause is man's fossil fuel consumption since the mid 19th Century industrial revolution. Global temperatures have been shown to be rising, along with rates of ice-melt and sea-levelrise (IPCC, 2013). The 'tipping point' in CO2 concentration which should not be exceeded toavoid irreversible climate change is generally given as 400 parts per million (ppm): observeddaily, and weekly average CO2 concentration at the Mauna Loa Observatory first exceeded400ppm in May 2013 (Scripps Institution of Oceanography, 2014), with the monthly averagefigure forecast to do so in April 2014 (Monroe, 2013).
1.2 CO2e reduction targets
Many industrialised countries have now committed themselves to legally binding greenhousegas emission reductions, often referred to as CO2e reduction targets (the 5 other GHGs areweighted and converted to CO2 equivalent for normalisation purposes (DECC, 2013c)), underthe Kyoto Protocol: this includes the UK which in the Climate Change Act 2008 set a target ofan 80% reduction, based on 1990 levels, by 2050 (HM Government, 2011).
The UK residential sector is a major contributor to national CO2 emissions, accounting foraround 25%1 (HM Government, 2011), and therefore cuts in this sector will need to match oreven exceed the overall target of 80%. Households consume around a third of UK final energy(DECC, 2012) and the intended de-carbonisation of the electricity grid through renewables willhelp to lower residential emissions, however there is also a strong focus on reducingconsumption by improving the energy efficiency of buildings and appliances.
Space-heating accounts for the largest proportion of household energy use, around two-thirds
1 Varying slightly on an annual basis dependent on weather.
11
Figure 1: Graph showing the variations in atmospheric CO2 concentration over the last 800,000 years (Scripps Institution of Oceanography, 2014)
Highest level in at least 800,000 years
MSc AEES January 2014 Angela Lafferty
of the total2 (Palmer et al., 2013), and with the vast majority of homes (93% in 2010) using gasfor heating, savings in this area have the potential to make a large impact on the overallreduction target.
1.3 Energy security
In addition to helping meet CO2 reduction targets, reduced energy use would ease predictedpressures on UK energy security in the middle of this decade. Electricity generation capacity,and therefore spare capacity, will be reduced to historically low levels in 2015-16, largely due tothe closure of ageing coal-fired power stations (Ofgem, 2013), but is forecast to rise again after2017 due to the combination of increased capacity and reduced demand. The 'squeeze' onelectricity will also have an impact on gas due to its increased use as a replacement for coal-fired generation, up from 40% in 2012 to 60% mid-decade (Ofgem, 2012). Coupled with thedecrease in North Sea gas provision, which only meets around 40% of current UK demandscompared to almost 100% in 2000 (Ofgem, 2012), maintaining the security of national gassupply will become increasingly dependent on overseas imports.
1.4 The 'energy performance gap'
There is some evidence, that despite an overall downward trend in national CO2 emissions,household emissions are not falling in line with predictions (Boardman, 2007; Druckman et al,2011), with figures showing that CO2 emissions from residential gas use are actually a thirdhigher today than in 1990 (Palmer et al., 2013). Although this is in part due to the higher uptakeof gas heating, and increasing numbers of households, it could also be a sign of increasingcomfort expectations.
The energy performance gap has also been noted at the individual building scale (Monahan &Gemmell, 2011; Thompson & Bootland, 2011; Cutland Consulting, 2012), and research to datehas identified numerous causes including poor construction, simplistic and inaccurateprediction tools and overly complex design. However, the effect of building occupants isincreasingly acknowledged to be a significant factor (Gill et al, 2010; Janda, 2011; Gupta &Darby, 2011).
1.5 Research focus and objectives
This study aims to examine the effect of occupant behaviour on household energyconsumption, with a particular focus on gas for space-heating.
The thesis research involved detailed monitoring of energy use and temperatures in three 'lowcarbon' identical flats in Edinburgh, alongside in-depth interviews of the adult occupants, toaddress the following research objectives:
1. To quantify the effect of occupant behaviour on gas consumption in these 3 flats.2. To compare the flats' annual primary energy use with SAP predictions (to highlight any
'performance gap').3. To identify key differences in occupant use of the systems in the flat, which may explain
differences in space-heating consumption.4. To use the data to suggest changes in behaviour that would reduce consumption in
each flat.
The insights gained in the case study will then be discussed in a broader context, to determine:
5. The implications for residential design, particularly in new build situations.6. Potential strategies for reducing household energy demand (other than building
efficiency measures) crucial to meeting CO2 emissions.
2 Again, this value fluctuates from year to year, and so an average figure for the last 10-15 years is given.
12

MSc AEES January 2014 Angela Lafferty
CHAPTER 2 – LITERATURE REVIEW
2.1 Introduction
This literature review aims to bring together and critique the existing research on the residentialenergy sector, drawing on government and industry reports, published case-studies andacademic papers from both the UK and abroad. By reviewing the existing body of knowledge, itwill be possible to both establish the current situation in the UK and set the basis for this pieceof research by identifying gaps in the current knowledge.
It is structured in two main sections: the first describes the idea of building performance andexamines the 'performance gap', looking at evidence of its existence and identifying thepossible contributing factors; the second focuses on one of these: the 'occupant effect', andlooks mainly at research on the relationship between occupants and heating energyconsumption, which is the subject of this thesis investigation.
Knowledge in the field of thermal comfort is also reviewed, as a major influence on the humanrelationship with energy consumption in the home.
2.2 The performance gap
2.2.1 How is building performance measured?
As early as 1993, the UK Government introduced its Standard Assessment Procedure (SAP),an energy-efficiency rating scheme for domestic buildings (Kelly et al., 2012). It has undergonemany revisions since then, and in 2006, the use of SAP 2005 became mandatory in buildingregulations for all new homes.
Buildings are rated on a scale of 1-100, and because SAP is independent of the number ofoccupants and the dwelling size, ratings can be compared across the country. SAP ratings arealso used in Energy Performance Certificates (EPC), the issuing of which became mandatory in2007 upon the sale or rental of a property, and in the case of existing properties a simplifiedversion known as RdSAP (reduced data) is used.
Criticisms of SAP are that as the energy rating is based on costs, rather than the amount used,this can favour the use of dirty but cheaper fuels such as coal (Kelly et al., 2012). Costs alsofluctuate over time, which can affect the SAP rating. SAP also only estimates 'regulated'energy, which is that used for heating (space and water), lighting and ventilation, and thereforeexcludes the majority of electricity use by appliances and cooking, meaning it is not a goodpredictor of total energy use. SAP is essentially a compliance tool, rather than a prediction tool.
Total building energy performance can be more accurately predicted by more sophisticatedsoftware packages, such as IES (a suite including lighting and thermal simulation tools), andPHPP (the Passivhaus design tool), as these take account of location and anticipated use-pattern. However, total energy use is always dependent on how occupants actually use theirhome (Stevenson & Leaman, 2010; Janda, 2011).
The assessment of actual building energy performance comes under the domain of Post-Occupancy evaluation (POE), or Building Performance Evaluation (BPE) as it is increasinglyknown. POE is a broad discipline which developed in the 1960's, covering all aspects of abuilding's performance, however it is not yet standard practice due to disputes over which partyshould bear the financial costs, and fears of liability for defects. The results of this is that non-domestic buildings have been the focus of most published POE studies, and in the domesticsector it is more often used in social housing rather than private homes (Stevenson & Leaman,2010).
13
MSc AEES January 2014 Angela Lafferty
2.2.2 What is the 'performance gap'?
A 'performance gap' in the UK domestic sector has been widely reported (Boardman, 2007;Spring, 2011; Blight & Coley, 2013; Cutland Consulting, 2012; Carbon Trust, 2012; CarbonBuzz, 2013; Zero Carbon Hub, 2013; Kelly et al. 2012, Monahan & Gemmell, 2011; Thompson& Bootland, 2011; Druckman et al., 2011); however, there is significant ambiguity as to themeaning of the term itself.
In some of the literature the gap refers to the apparent rising trend in CO2 emissions of thedomestic sector as a whole, in spite of various government policies intended to decrease them(Boardman, 2007); however, it is also used to mean the difference between estimated andactual CO2 emissions of individual dwellings (Cutland Consulting, 2012).
Similarly, the term is used to describe both the collective and individual gap in energyperformance, which although related to CO2 emissions, has subtly different implications due tothe differing carbon intensity of energy sources (Boardman, 2007). Indeed, the terms energyand CO2 are often used interchangeably (eg. in Carbon Trust, 2012; and Cutland Consulting,2012) which clouds the issue somewhat, and creates misunderstanding over effectivestrategies; for instance, converting to renewable energy reduces CO2 emissions, but thenational renewable targets can only be reached if demand is also reduced.
An energy performance gap in a building becomes apparent when the actual measured energyconsumption exceeds that estimated by SAP, or any other prediction tool used at the designstage, and problems can be diagnosed by a variety of methods including thermal imaging,airtightness testing and co-heating tests. While the former two identify areas of heat lossthrough the fabric and infiltration, the latter is a method of calculating the heat loss coefficient,independently of occupant behaviour, by electrically heating a building to a specific constanttemperature over 2-3 weeks (Cutland Consulting, 2012; Sanders, 2010).
2.2.3 Extent of the gap
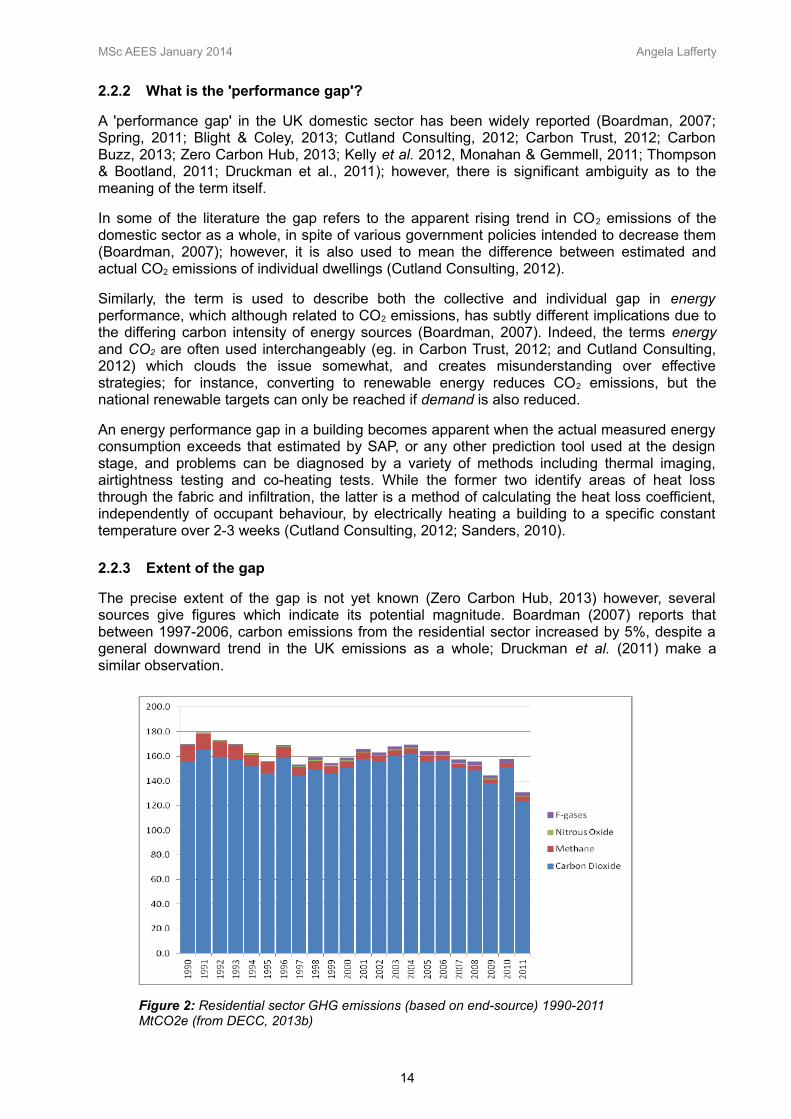
The precise extent of the gap is not yet known (Zero Carbon Hub, 2013) however, severalsources give figures which indicate its potential magnitude. Boardman (2007) reports thatbetween 1997-2006, carbon emissions from the residential sector increased by 5%, despite ageneral downward trend in the UK emissions as a whole; Druckman et al. (2011) make asimilar observation.
14
Figure 2: Residential sector GHG emissions (based on end-source) 1990-2011 MtCO2e (from DECC, 2013b)

MSc AEES January 2014 Angela Lafferty
However, the most recent figures available (see Fig 2 above) seem to suggest an overalldownward trend in household CO2e emissions from 2004 onwards3, leading to an overall 23%reduction in 2011 over 1990 levels. The national reduction over the same period was higher, at29%, highlighting under-performance in the residential sector. In addition, annual percentagesfor housing are highly volatile due to their strong weather dependency: when calculated on theprevious year's figures – 2010, a particularly cold year - the percentage reduction on 1990levels was just 7%, even though the total national figure was 23%.
This serves to illustrate the point that analysis of any trends really depend on the time-scalebeing looked at, as variability in weather and electricity carbon-content can have a large impacton year-on-year CO2 trends. The effect of the financial recession, coupled with rising energycosts, is also thought to have markedly reduced emissions since 2008 (Kelly et al, 2012), andcould quickly rise with economic recovery. Therefore, real consistent trends can only beobserved in the long-term, and it is too early to predict whether or not the recent downwardtrend will continue.
To reinforce the above point, residential energy consumption in 2012 was 11% higher than in2011, caused largely by colder weather and was therefore 6% higher than 1990 levels (DECC,2013d).
So in spite of significant improvements in the energy-efficiency of the housing stock, with theaverage SAP rating increasing from 45 to 57 from 1996-2011 (DCLG, 2013a), the sector as awhole is still consuming more energy than it did 22 years ago. Figures show that energy perhousehold has fallen, by about 30% since 1970, but that this is largely due to smallerhouseholds, and is offset by the steadily increasing number of homes (Palmer et al, 2013).
The indication is that cuts per household will have to be more dramatic to achieve thenecessary CO2 cuts by 2050.
2.2.4 Contributing factors – what causes the gap?
Much research has attempted to identify the underlying causes of the gap in energy and CO2
performance expectations (Cutland Consulting, 2012; Boardman et al, 2007).
As well as the increasing number of households, Palmer et al. (2013) attribute rising residentialenergy use to increased electrical appliance use, greater prevalence of central heating andpossibly higher expectations of thermal comfort. Others blame building defects and inadequacyof estimation software. All factors identified can be grouped under three broad headings:building-related, prediction-related or occupant-related, and are considered in turn below.
2.2.4.1 Building-related factors
Building regulations are demanding ever-increasing standards of construction, includingairtightness and insulation, requiring CO2 emission calculations which demonstrate 25%improvements on the same design to previous building regulations (HM Government, 2010).
The resulting levels of fabric and system improvements across the national housing stock,between 1996 and 2011, are apparent from the English Housing Survey4 (DCLG, 2013b). Forexample, since the introduction of efficient condensing boilers their use has increased rapidly,particularly since mandatory status in 2005, accounting for 38% of all boilers in 2011. Thepercentage of fully double-glazed homes increased from 30 to 76%, those with cavity wallinsulation from 14 to 38%, and those with a high level of loft insulation has increased tenfoldfrom 3 to 30% (though over 80% have at least some loft insulation); it is not reported how manydwellings have all 3 measures. These figures give an indication of the quantity of improvements
3 Falling in every year except 2010 (which was an exceptionally cold year).
4 As of 2008, the English Housing Condition Survey and the Survey of English Housing were amalgamated to form the EHS. Thefigures are for England only, but can be broadly interpreted as representative of the UK as a whole (due to England's population being around 80% of UK)
15

MSc AEES January 2014 Angela Lafferty
undertaken, and therefore the effectiveness of the government's policies, however they do notindicate the quality of the improvements, nor the effect on household energy consumption.
Design, construction and systems installation
Cuts from fabric improvements are being undermined by other factors – including thecombination of poor construction and poor design of details and heating/ventilation systems.The Zero Carbon Hub presents a body of evidence of the performance gap, from a variety ofdifferent studies; one co-heating test study on 16 homes showed that they all required moreenergy than predicted, 11 of them significantly more, and more than double in one case(Wingfield et al., 2010, cited in Bell et al, 2010). For this reason, a report by the Good HomesAlliance (Thompson & Bootland, 2011) recommends post-construction testing, as a method ofevaluating the construction quality in isolation ie. without occupant effects.
An example of poor performance due to construction details is the party wall thermal bypassphenomenon, whereby cold air enters and circulates within the cavity, bringing u-values up to0.6W/m2K (Cutland Consulting, 2012). This problem was only highlighted in the UK in 2007,and dealt with in regulations in 2010, despite having been well-known in the USA for thirtyyears (Bell et al., 2010).
A performance evaluation of a retrofitted tenement block (MEARU & Assist Architects, 2012)also brought up design issues as a factor in increased energy consumption, where glazed sun-spaces were considered to be within the building envelope rather than an enclosed externalbuffer space, meaning they were heated despite the substantial heat loss through the glazing,as well as having insufficient thermal store to store any solar heat gains. A similar problem witha sun-space/conservatory design was highlighted in an NHBC Foundation report (CutlandConsulting, 2012), and in a series of case studies by Stevenson (2008).
The MEARU BPE also found several problems relating to the design and/or installation of theMVHR system, whereby some flats had no external air supply despite being built to highairtightness standards, and units being inaccessible to change filters. The MVHR design wasalso an issue in the study by Gill et al. (2010), where the controls were in the cooker hood andwere thus rarely used. These both highlight the lack of understanding, in the industry as awhole, of the principles of low-energy design, and are contributing directly to the energyperformance gap.
The NHBC Foundation report highlights un-communicated design changes as another cause ofpoor performance, citing a case where structural timber was increased during construction,resulting in higher u-values than assumed in the energy model. Where poor workmanship isidentified, such as poor cavity insulation, it is suggested this is caused by overly complexdesign and detailing. While it may be argued that NHBC may be biased towards findingreasons other than poor construction for poor fabric performance (indeed they are defensive ofthe fact that blame is often put on house-builders), with this report seeming to underplay therole of poor quality construction, these points are nevertheless valid.
A Zero Carbon Hub report (Bell et al, 2013) perhaps offers a more objective view, citing a lackof skills, awareness and training in the construction industry as additional factors, in a detailedlist of issues which includes the lack of product ID once packaging is removed.
Although the presence of construction defects is relatively easily detectable through thermalimaging, airtightness/smoke tests, and co-heating tests, in practice there are difficulties inaccurately quantifying their effect on energy consumption. This is due to a lack ofmethodologies for doing so, and the fluctuation of real in-situ u-values as opposed to notional'steady-state' values normally used (Sanders, 2010, Cutland Consulting, 2012).
16

MSc AEES January 2014 Angela Lafferty
Quantification of building-related factors
There is therefore limited empirical data on the extent of fabric under-performance. However,the Good Homes Alliance estimates that around 30% of a home's heat loss can be caused bythermal bridging, and up to 50% by unintended air infiltration (Thompson & Bootland, 2011):these figures underline the importance of careful design and construction. Nevertheless, Fell &King (2012) found that in any case, less than a third of variation in gas use could be explainedby physical characteristics, using a somewhat crude calculation method based on EPC ratings.
A more sophisticated statistical analysis study (Guerra Santin et al., 2009) found that 42% ofvariation in energy demand for space heating was due to building characteristics, whichincluded a variety of factors such as insulation level, number of heated rooms, building age,layout, and the presence of a thermostat. The study also suggests that design factors such asinternal layout can have an impact on energy consumption, for example open kitchensproviding warmth to living spaces, which offsets heating demand.
Firth et al (2010) found, through complex computer modelling, a large cumulative effect of aseries of under-performing energy-efficiency measures, and therefore that ensuring high qualityworkmanship to achieve design targets is essential. Further research is to follow on quantifyingthis effect using data from case studies.
Taking a different approach, East (2013) examined the effect of fabric upgrade to an existingVictorian house, with the same occupants before and after retrofit. This method theoreticallyallows the effect of occupant behaviour to be discounted in order to assess directly thereduction in energy consumption due to retrofit, however some behavioural change may haveoccurred in reality due to greater energy awareness and the 'rebound' effect (discussed later).The study found that the retrofit resulted in an actual 69% reduction in measured energy usecompared to the SAP prediction of 83%: further evidence of the performance gap.
Branco et al. (2004) found that failures in the technical systems including the solar waterheating system, ventilation (MVHR), buried pipes, were the main contributors to the 50%higher-than-expected gas consumption.
2.2.4.2 Prediction-related factors
Here we will focus on issues with SAP, as the least accurate and most widely-used predictiontool. It is also the basis of many government policies to improve energy efficiency in thenational building stock, such as EPCs and the Green Deal (Kelly et al, 2012).
The fundamental criticisms of SAP have already been outlined in section 2.2.1, and are largelydue to the fact that it is a compliance tool, rather than a predictive tool. The distinction betweenregulated and non-regulated energy means a discrepancy is inevitable: with gas use this isnegligible, but it is highly relevant to electricity consumption. For example, lighting was shownto make up just 15.4% of household electricity use in a study by the Energy Saving Trust(Owen, 2012), no figure was given for ventilation or boiler pumps but the Unknown categoryaccounted for 9.7%, leaving at least 75% of domestic electricity use unaccounted for in SAP.This is problematic, particularly in the light of rapidly increasing consumption fromcommunication and entertainment appliances (Coleman et al., 2012)
Many further flaws are identified with SAP: it is claimed to be too sensitive to variation in data-input for well-insulated homes (Cutland Consulting, 2012), the human error in data-input isfrequent due to poor and variable understanding of key concepts (Bell et al., 2010), it does notaccount for climatic differences, nor has it been adequately validated (Kelly et al, 2012) andthat it makes erroneous default assumptions on internal temperatures and heating patterns(Shipworth et al., 2010; Huebner et al., 2013).
17

MSc AEES January 2014 Angela Lafferty
Several sources suggest that there are differences in SAP accuracy depending on the age ofthe dwelling: Kelly et al (2012) propose that SAP significantly over-estimates energyconsumption of older buildings, and underestimates that of new-builds meaning that savings inretrofitted homes are not as large as anticipated. This was also the conclusion of East (2013),Huebner et al. (2013) and Sunnika Blank & Galvin (2012), illustrating the growing body ofevidence to support this theory, which if true could mean that the national CO2 reductiontrajectory (HM Government, 2011) has been vastly overestimated.
Perhaps the most scathing criticism of all is that it "confounds cost-effectiveness, energyefficiency and environmental performance giving an inadequate estimate of all three policyobjectives" (Kelly et al. 2012).
A further weakness in SAP and therefore the EPC, is that energy use is reported in kWh/m2.While the intention is to allow comparison of all dwellings regardless of size, ie. generalbenchmarking, the result is that unduly large (luxurious) dwellings appear less energy intensive,as is evident in a study of domestic energy consumption in the Middle East (Aldossary et al.,2014) and the comparison is not a fair one. The authors do point out that a key use of thekWh/m2 metric is as a scale to compare future consumption of the same household ie. in anenergy reduction exercise or retrofit scenario.
A more useful metric might be kWh/person or kWh/m2/person to account for changes inhousehold size. This might also be applied to reporting CO2 emissions, but is less tangible tothe occupant than energy consumption, which is within their control.
Some criticisms have been addressed in the latest SAP version 2012, in that regional climaticdata and height above sea level are now taken into account, as well as further refinements ofCO2 emissions factors, fuel price and primary energy factors (DECC and BRE, 2013). As SAPcontinues to become more accurate at predicting standardised energy use for a building, thediscrepancies caused by user behaviour will become even more pronounced.
2.3 Focus on the 'occupant effect'
Many have identified the role of the occupant as a significant one, increasingly so in the light ofcontinuing fabric improvements and the associated reductions in energy demand (Monahan &Gemmell, 2012; Guerra Santin et al, 2009, Haas et al, 1998) and many have sought a deeperunderstanding of the complexities at play.
Fell & King (2012) conducted a study of 70 households, all owner-occupied, three bedroomed,semi-detached properties, which found evidence of a correlation between high gasconsumption and high internal temperature preference, as well as longer more frequentshowers, and interestingly, higher usage if the home had been lived in longer (thought to bebecause any upgrades were done at the time of moving in, so now out of date). In depthinterviews, surveys and user diaries revealed that there is no consistent set of behavioursdisplayed by high consumers, and that rather it is a combination of behaviours that happens toresult in high overall consumption.
This study also uncovered a range of interesting attitudes and behaviours, such as retireesfeeling they have earned the right to consume as much energy as they wish, and women'feeling cold' more than men. Their efforts to isolate occupant behaviour are, however,undermined by factors such as the varying age of homes, shape of and modifications to thehomes, such as conservatories.
In a much-cited study on a development of 26 low-carbon homes, Gill et al. (2010) found afactor of 3 difference in heat consumption.5 Quantitative analysis of survey responses onbehaviour against measured consumption determined that occupant behaviour accounted for51% of this variation – the remainder presumably caused by differences in size, layout,technical problems and micro-climate though it was not explicitly stated. Although interesting, it
5 On a kWh/m2 basis, to allow comparison of different sized homes.
18

MSc AEES January 2014 Angela Lafferty
could be argued that this approach is not wholly scientific due to the self-reported nature of thedata (Bryman, 2008), the fact that the survey was retrospective and dealt with generalbehaviours and opinions. For instance, Fell & King (2012) noted that professing energy efficientbehaviour did not correlate with actual lower consumption in their study.
Gram Hanssen (2010) also made this observation, in a Danish study of 5 'identical' owner-occupied 1960/70's terraced dwellings, because of highly differing comfort needs. She found afactor of 3.65 difference in annual heat consumption, between the specifically selected high andlow users. This is ostensibly wholly due to occupant behaviour, as the homes are the same ageand design, but again micro-climatic differences may play a part, particularly as the homeswere chosen from a large neighbourhood. In-depth open-ended interviews identified contrastingbehaviour and, like Fell & King, reveals a host of fascinating behavioural traits and attitudes,such as habits of window-opening learned in childhood, and varying perceptions of the cost ofenergy.
Blight & Coley (2013) sought to determine the sensitivity of a Passivhaus design to occupantbehaviour, using an IES model with 100 varying user profiles and statistical analysistechniques, in response to widespread concern over high-sensitivity of passive houses: theextremely low heating/cooling energy limit of 15kWh/m2 means that any deviation represents ahigh percentage difference which is often attributed to construction defects rather thanoccupant behaviour. However, even large differences in passive houses represent far lessenergy use than the same factor difference in a standard house. The paper concludes thatpassive houses are actually far less sensitive to occupant behaviour than often thought, thoughsevere limitations on modelling of ventilation behaviour mean this result should be treated withcaution.
A statistical analysis of the Dutch housing stock (Guerra Santin et al., 2009) found that overall,occupant behaviour accounts for only 4.2% of variation in energy consumption for space-heating; it is questionable how useful it is to consider this at a nationwide scale, because highindividual variation is masked by averaging out over the population, due to the many othercontributing factors; however it does suggest that targeting occupant behaviour is not asimportant for policy-makers as other areas of improving domestic energy-efficiency.Disaggregating data by house type or age might yield a higher percentage of influence,however the limitations of statistically analysing qualitative data should be borne in mind(Bryman, 2008). This is discussed further in the next chapter.
Frequent window opening, including while the heating was on, was reported in several POEcase studies as a key factor in poor energy-performance (Stevenson, 2008; MEARU and AssistArchitects, 2012) It was also reported as a strategy to cool rooms that were too hot (Fell & King,2012) and even reported as a trend in well-insulated houses (John Gilbert Architects, 2010).Sanders (2010) states that differing window-opening behaviours can increase ventilation ratestenfold, along with the associated energy load. The evidence indicates that the savingsanticipated by increasingly well-insulated homes may be offset by this heat dumping strategy.
Shipworth (2011) also proposes increased winter window-opening as a potential reason forincreased household energy consumption, to counter the suggestion by Utley & Shorrock(2008) that higher thermostat settings are to blame: they reported that average internaltemperatures have risen from 12°C in 1970 to 18°C in 2005, and attribute this to the spread ofcentral heating and associated higher comfort expectations. However, Shipworth's statisticalanalysis study finds no evidence of higher thermostat settings. The distinction between demandand actual temperatures is subtle, but Shipworth's point is that while average temperaturesmay have risen, this is due to a host of factors more complex than simple demand temperature,including increased heating duration, increased heated area and under-performance of fabricimprovements, all of which have policy implications.
This distinction is often not made in other studies, for example Haas et al. (1998), found astrong and highly correlated linear relationship between energy consumption and 'chosenindoor temperature' reported by occupants, but it is not clear whether the authors assume that
19

MSc AEES January 2014 Angela Lafferty
chosen and actual temperatures are the same and what the implications would be for theirfindings.
The number of heated bedrooms was the most significant occupant factor in Guerra Santin etal. (2009), supporting Shipworth's theory of increased heated area, but also that temperaturesettings, particularly at evening and night time are a significant occupant factor. Again these areoccupant reported, presumably thermostat settings. Shipworth's distinction may go some wayto explaining Guerra Santin et al.'s finding that there is low correlation between thermalenvelope quality and internal temperature.
The variability of occupant behaviour gives rise to anomalies such as continuously occupiedhomes which use less energy than daily unoccupied ones (John Gilbert Architects, 2010), eventhough on a wider scale the reverse has been shown to be true (Guerra Santin et al., 2009).Similarly, Gram Hanssen's (2010) study of 5 dwellings found that contrary to expectation, oneof the lowest consumers also had the highest average and maximum temperatures.
2.4 Background to thermal comfort
The seeking of thermal comfort is known to be an important influence on household energyconsumption. It is defined as “the state of mind that expresses thermal satisfaction with thesurrounding environment” by ASHRAE (2010), and is a product of many factors, divided intothose related to the physical environment: air temperature, mean radiant temperature, airmovement and relative humidity, and those which are occupant-related: clothing level (clo),and activity level or metabolic rate (McMullan, 2007). Karjalainen (2013) asserts that there isalso a psychological element to thermal comfort, inferred in the ASHRAE definition, which is todo with the occupants perception of control of their own environment.
Fanger's (1970) theory and research in the field of thermal comfort provides a model whichpredicts a comfort temperature for any given set of physical variables, that is, the temperatureat which the mean vote of occupants would be neutral ie. comfortable. The problems with thismodel are that it assumes a constant clothing and metabolic rate for all occupants, which israrely or never the case in reality, as well as disregarding age, gender, season, country andtherefore external temperatures, climate and actual weather - known as ‘recent thermalexperience’. It also does not consider whether a building is naturally or artificially ventilatedheated or cooled.
These are all aspects which have been researched and documented in the Adaptive Comforttheory, which proposes that building occupants make adaptations to themselves and theirenvironment which allow them to feel comfortable within a temperature range, rather than at aspecific temperature, and furthermore that the value of the temperature range is dependent onthe type of building (natural or mechanically ventilated, heated, cooled), and the externaltemperatures (more precisely, the running mean of the external temperature). The adaptivecomfort model is constantly being evolved and refined, to include more data (Humphreys et al.,2013): the most recent model is shown in Figure 3, which plots the relationship between neutraltemperature and external temperatures in HC mode buildings (ie measurements taken whilebuildings are being heated or cooled). The relationship is shown to be non-linear: the neutraltemperature falls until a certain outdoor temperature, below which the internal neutraltemperature begins to rise again.
In this latest paper, Humphreys et al. also make the important point that seasonal adjustment ofindoor clothing has reduced in some cultures (possibly referring to the UK), which would impacton the comfort temperature range shown in the model.
20

MSc AEES January 2014 Angela Lafferty
2.5 SUMMARY: A KNOWLEDGE GAP
Based on the points raised in this literature review, there is a clear need for further research inthe area of occupant behaviour to understand the performance gap, particularly as Boardman(2007) suggests a third of CO2 savings required in households must come from behaviouralchange.
The energy-efficiency of the UK housing stock is increasing, but despite the apparentdownward trend in household CO2 emissions since 2004, the strong effects of weather andeconomic factors on annual figures mean it is yet too early to assume that this trend willcontinue.
It has been suggested that UK householders are enjoying higher comfort levels than in thepast, which may be part of the reason that residential energy consumption is still higher todaythan it was in 1990. The gap in knowledge of space-heating practices has been identified bymany (Guerra Santin et al., 2009; Monahan & Gemmell, 2011), with a particular lack ofresearch on understanding demand temperatures and heating patterns (Huebner et al. 2013a;Fell & King, 2012).
Huebner et al. (2013b) highlight the need to 'control' building characteristics when attempting tounderstand the effect of occupants on heating use, and Morley & Hazas (2011) suggest thatthere are too many inter-related variables in large heterogeneous housing stock data-sets toget a clear picture of occupant behaviour through statistical analysis.
21
Figure 3: Plot of neutral temperatures against outdoor temperatures, from Humphreys etal. (2013)
MSc AEES January 2014 Angela Lafferty
CHAPTER 3 – METHODS
3.1 INTRODUCTION & SITE CONTEXT
This study takes the form of a comparative case-study of three 'identical' 3-bedroomapartments in Edinburgh, using a mixed-methods approach of both quantitative and qualitativeresearch elements, to study the relationship between occupants and space-heating. Theproperties were simultaneously monitored for gas and electricity consumption for a period of 12weeks in Autumn 2013, during which time the temperature and relative humidity was alsomonitored in several locations in each property. Care was taken to ensure the equipment set-upwas near identical in each flat. Although the focus is on gas use, electricity data was alsocollected to gain a 'whole-house' picture of energy consumption, as well as enabling 'regulatedenergy' comparisons which include elements of electricity use.
The participating households were chosen using the convenience sampling method (Bryman,2008), and written consent was obtained. Participants were informed of the nature of the study,however it was not made explicit that the focus was the effect of the occupant on energyconsumption, due to the possibility that natural behaviour might be altered6 (Bryman, 2008).
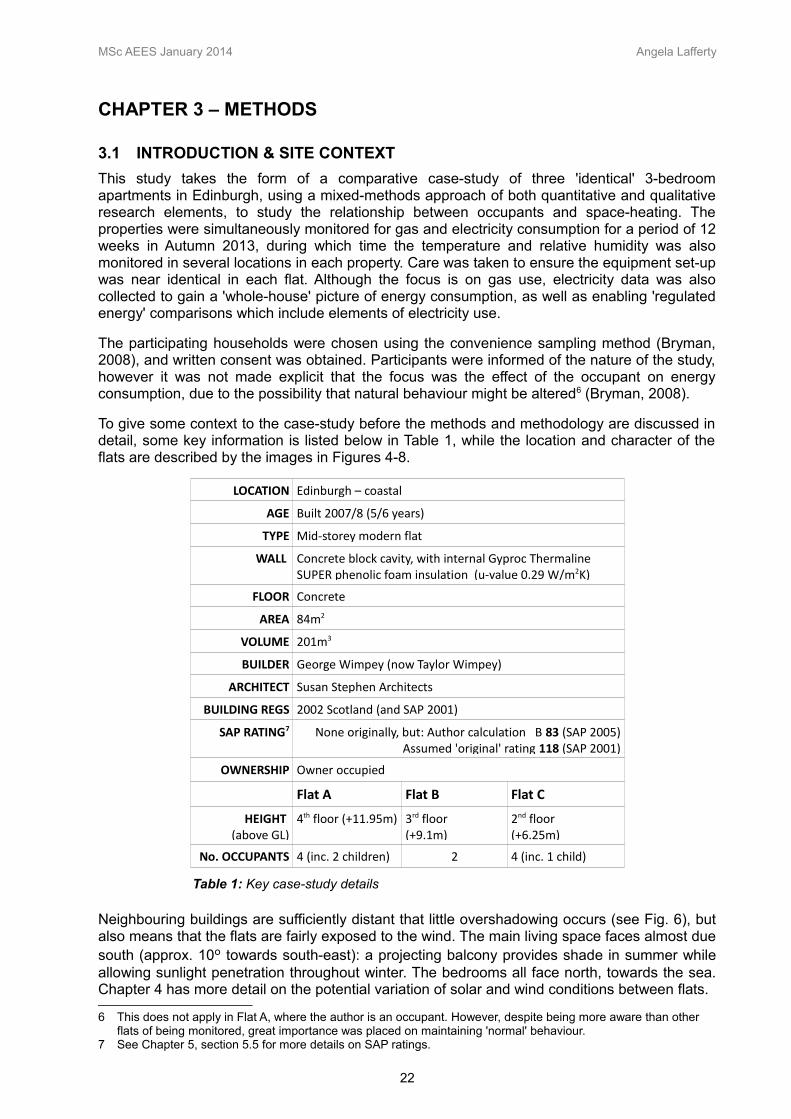
To give some context to the case-study before the methods and methodology are discussed indetail, some key information is listed below in Table 1, while the location and character of theflats are described by the images in Figures 4-8.
LOCATION Edinburgh – coastal
AGE Built 2007/8 (5/6 years)
TYPE Mid-storey modern flat
WALL Concrete block cavity, with internal Gyproc Thermaline SUPER phenolic foam insulation (u-value 0.29 W/m2K)
FLOOR Concrete
AREA 84m2
VOLUME 201m3
BUILDER George Wimpey (now Taylor Wimpey)
ARCHITECT Susan Stephen Architects
BUILDING REGS 2002 Scotland (and SAP 2001)
SAP RATING7 None originally, but: Author calculation B 83 (SAP 2005) Assumed 'original' rating 118 (SAP 2001)
OWNERSHIP Owner occupied
Flat A Flat B Flat C
HEIGHT (above GL)
4th floor (+11.95m) 3rd floor (+9.1m)
2nd floor (+6.25m)
No. OCCUPANTS 4 (inc. 2 children) 2 4 (inc. 1 child)
Table 1: Key case-study details
Neighbouring buildings are sufficiently distant that little overshadowing occurs (see Fig. 6), butalso means that the flats are fairly exposed to the wind. The main living space faces almost duesouth (approx. 10º towards south-east): a projecting balcony provides shade in summer whileallowing sunlight penetration throughout winter. The bedrooms all face north, towards the sea.Chapter 4 has more detail on the potential variation of solar and wind conditions between flats.
6 This does not apply in Flat A, where the author is an occupant. However, despite being more aware than other flats of being monitored, great importance was placed on maintaining 'normal' behaviour.
7 See Chapter 5, section 5.5 for more details on SAP ratings.
22

MSc AEES January 2014 Angela Lafferty
23
Figure 6: Aerial site view, showing case-study flats in context (image adaptedfrom GoogleMaps, 2013)
Figure 5: Map of Edinburgh. showing site's coastal location distancefrom weather stations (image adapted from GoogleMaps, 2013)
Figure 4: Edinburgh's locationin the UK context.

Figure 7: Photo of main south-facing elevation: case-study flats are identified and outlined in red.(image adapted from GoogleMaps, 2013)
MSc AEES January 2014 Angela Lafferty
24
Figure 8: Plan diagram of the flat layout. Radiators are indicated in red, and data-logger positions are in green. Locations of thermostat (TH), boiler and gasand electricity meters are also shown.
N
S

MSc AEES January 2014 Angela Lafferty
3.2 QUANTITATIVE DATA COLLECTION
3.2.1 Gas and electricity
Gas and electricity consumption were measured by a Ewgeco monitoring system, see Figure 9below, from 9 September to 28 November 2013. Data is displayed in 'real-time' on the monitorand updated every 2 seconds, however, it is only stored in hourly totals. The display screenwas left switched off and stored in an inaccessible location throughout the study in order toavoid exacerbating the 'reactive effect' (Bryman, 2008) whereby participants may alter theirnormal behaviour not only as a result of being observed, but also of being able to view theirown energy consumption. Several studies have shown that use of energy monitors cansignificantly lower domestic energy consumption, including one using the same Ewgeco system(Currie et al, 2011), which showed a reduction of 20% in gas consumption and 7% forelectricity, though it is often claimed that reductions are short-term only.
1 Electricity meter
2 CT current clip Clamps around live cable from meter
3 Sensus Cubix U6 Gas meter
4 METUR005 Pulse block Reads pulse counter
5 Ewgeco transmitter Collects data from both meters through wires and transmits wirelessly to display. Must be kept plugged in.
6 Ewgeco display Displays and holds all data. Should be kept in cradle (plugged in).
Figure 9: Numbered diagram of Ewgeco monitoring system setup (with legend).
Several 'calibration' exercises were carried out on the 3 Ewgeco systems, to check theaccuracy of the temperature readings: they were all observed to be recording the sametemperature over a length of time in the same location, however when compared with both theLascar and Gemini data-loggers (see below), the temperatures recorded were found to be onaverage 2.5°C higher – see Appendix A for more detail.
It was not possible to simultaneously connect all 3 systems in the same flat to perform a similarcheck for accuracy of electricity and gas consumption measurement, however meter readings
25

MSc AEES January 2014 Angela Lafferty
were taken in all flats at the beginning, interim and end of the monitoring period (with morefrequent meter readings being taken in Flat A) as a cross-check for the Ewgeco data: thismethod allows 'calibration' of measurements over a longer period of time for more accuracy.
Measured gas consumption over the 3 months by both methods is plotted in Figure 12 inChapter 5 (see also Appendix H). The results show a small fluctuating error in Flat A of between4-12%, and an overall total gas consumption measurement 5.6% higher than the meterreadings. This amounts to a difference of 94 kWh – over 1 kWh for each day of the monitoringperiod, which is significant. The error in the other flats was much smaller, and the Ewgeco veryslightly underestimated rather than overestimated consumption in Flats B and C. It is difficult tosay for Flat C as the monitor was broken before the final meter readings were taken, howeverin Flat B the overall difference was 20kWh – which nevertheless equated to around 4.5% ofconsumption, as gas use was lowest in this flat.
As gas meter readings give usage in m3, the following standard conversion has been applied togive consumption in kWh in the Results chapter: m³ x 1.02264 (CF) x 39.16 (CV) / 3.60 (CF) =kWh, where CF is the conversion factor and CV is the calorific value.
3.2.2 Temperature and relative humidity
Temperature and relative humidity were monitored in several locations in each flat, over thesame period as the gas and electricity: the living room, all 3 bedrooms and in the hall, directlyadjacent to the central heating thermostat (see Figure 8 for positions of data-loggers). Theloggers were placed in line with standard guidelines, which are: away from windows, doors,heat sources (including sunlight), and between knee and head height where possible(Shipworth et al., 2010; Huebner et al., 2013; Kane et al., 2011). Furniture layout was almostidentical in each flat, although slight variations meant it was not always possible to placeloggers in exactly the same location in each flat: the differences, however, are not deemedsignificant.
Two different types of data logger were used, however the same type was used in the sameroom: details are listed in Table 2 below. Full specifications of both types are given in AppendixA. It was not possible to set up both types of loggers to record at the same time interval, and itwas initially intended to discard every second reading for the Lascar loggers to allowsimultaneous comparison with the Tinytag loggers; however the smallest timescale analysedwas a 24 hour period, when hourly averaged figures were used rather than pointmeasurements.
Location Logger type Recording interval
Notes
Living Lascar EL-USB2 5 mins
Hall Lascar EL-USB2 5 mins
Master bedroom Tinytag 10 mins
Bedroom 2 Tinytag 10 mins
Bedroom 3 Ewgeco display 1 hour (averaged) Temperature only
Balcony - external
Tinytag (7) 10 mins From 25th Sept Flat A only
Table 2: List of logger types and locations
26

MSc AEES January 2014 Angela Lafferty
3.2.3 Weather data
Weather data for the monitoring period was sourced in CSV (comma separated value) formatfor the nearest weather station, just under 2 miles away in Leith (Wunderground, 2013). Valuesfor most parameters were given at 1 minute intervals. To allow comparison with othertemperature data, 4 out of every 5 readings or 9 out of every ten readings were discardedwhere appropriate, to give 5 or 10 minute readings.
A Tinytag logger was placed on the balcony of Flat A (protected from rain and direct sunlight) asa cross-check for external temperature and humidity data provided by the weather station.Although a useful comparison, it became apparent during analysis that the minimumtemperatures were generally higher than those from the weather station, probably due to theproximity to the building.
3.2.4 Data analysis
All quantitative data was analysed and compared using a combination of SPSS (statisticalsoftware package), and Microsoft Excel. Graphs were produced in both, depending on thefunction. A considerable amount of time was spent 'cleaning' and preparing data for analysis:this included adjusting the times of all data to reflect the change from BST to GMT at 2am on27th October, in order that energy use and temperatures could be related to to the real time ofday. In addition, it was found that the time had been set incorrectly on the Tinytag loggers,requiring a further adjustment of 35 minutes.
There was minimal data loss associated with the temperature loggers, with the exception ofBedroom 2 in Flat C, where there were no recordings after 15 th October (44 days missing).Temperature and RH data was uploaded once during the study from the Lascar Easyloggers,as they were nearing full storage capacity – this resulted in one missing reading per logger,which was manually infilled with the averaged value of readings on either side. A very smallnumber of readings were identified as 'outliers' and discarded for Flat A and C living rooms, asit was apparent that despite careful placement, the loggers did receive direct sunlight foraround an hour on several afternoons in October and November - easily identifiable by rapidtemperature spikes reaching 29.5°C. Readings that were higher than the maximumtemperature recorded on any other day were discarded, along with the corresponding RHvalue. SPSS also identified outliers at the lower end of the temperature scale, notably in FlatC, but these were considered to be as true instances of low temperatures due to window-opening in cold weather and were thus kept in the dataset.
There were frequent short periods of data loss associated with the Ewgeco monitors, whereone, two or more consecutive hourly readings were missing, for no known reason. It was notpossible to estimate these missing values, due to the highly variable nature of energy useobserved in the flats. Although this had little effect on the overall consumption data, it meantthat there were a reduced number of days available on which to compare simultaneousconsumption in all 3 flats. This intermittent data loss was a particular problem in Flat A, andhappened on 18 out of the total 81 days monitored, whereas in Flat B it occurred on 8 days andin Flat C on just 1 day. However, Flat C had the highest amount of missing data overall due tothe equipment being broken, with no electricity data from 31 October onwards (28 daysmissing), and no gas data from 16 November onwards (12 days missing). Daily meter readingswere taken in the last week of the study when the breakage was noticed.
Although some data was uploaded during the period, no analysis was made until the datacollection was complete at the end of November: this was mostly to avoid any influence on thebehaviour of the author (an occupant of Flat A) due to knowledge of others' energyconsumption.
27

MSc AEES January 2014 Angela Lafferty
3.3 QUALITATIVE DATA COLLECTION
3.3.1 Occupant diaries
Occupants were asked to fill out a diary for the duration of the monitoring period, however, tominimise the reactive effect, they were asked only to record unusual events, such as additionalvisitors, periods of absence or boiler breakdown (Sanders, 2010). More detailed informationwas recorded in Flat A to allow cross-checking and illumination of the quantitative data(Bryman, 2008), in particular the external weather conditions, and use of the heating system.8
Information on occupant activity and rooms being used was also noted on some days, whichwas useful in the analyses of 3 particular days (See chapter 5, section 5.7).
3.3.2 Interviews
Face-to-face interviews were carried out with each adult occupant in their own homes,comprising two distinct elements: firstly, a structured closed questionnaire using the BUSmethodology (Leaman, 2013), was self-completed by the occupants (with minimal input fromthe interviewer), to assess general comfort and building satisfaction levels; secondly, a semi-structured interview took place, which closely followed a set list of key questions, to collectinformation more specifically relating to occupant behaviour, such as window-opening habits,heating habits and attitudes to energy costs.
These were carried out at the end of the monitoring period, to ensure that normal behaviourswere not altered as a result. In the case of Flat A, the interview was slightly different, due to theinterviewer/author also being an occupant and active participant in the discussion. It didhowever follow the same structure, and address the same questions. Transcripts of allinterviews can be found in Appendices C-E, and extracts are used in the main text to illustratediscussion points.
Some additional information was gathered through observation (on visits to each flat forequipment installation, interim data download, and dismantling), such as whether windowswere open, position of internal doors, and curtains/blinds position, again to help illuminate themeasured data as well as triangulate with the interview responses.
3.3.3 Specifications
Photocopies of all building warrant drawings relating to the flats were obtained from the City ofEdinburgh Council, along with SAP calculations for selected properties in the development –unfortunately there were no SAP calculations carried out on these 3 particular flats. Thedrawings, show important information such as wall and floor build-ups, u-values, typicalconstruction details and storey heights – though it is possible that there were deviations fromthe original design during construction, as was seen in the Literature Review chapter.
Information relating to the heating system (boiler, programmable thermostat, radiators andTRVs), as well as trickle vents and mechanical ventilation system are in Appendix F withinternet links to the actual product manuals or data sheets.
8 Timing, and temperature reading on hall thermostat at the time of switching on.
28

MSc AEES January 2014 Angela Lafferty
CHAPTER 4 – METHODOLOGYThis chapter contains a discussion of why the methods described in the previous chapter werechosen. Firstly, the mixed-method is laid out as a premise for any meaningful buildingperformance methodology, of which three distinct categories are then discussed. The researchis then placed in the context of these methodologies, with a justification of each of the keystrategies employed.
4.1 Mixed-method approach
Although the quantitative and qualitative strategies of mixed-methods approaches aresometimes regarded as epistemologically incompatible (Bryman, 2008), and have historicallybeen used only separately in building performance studies (Stevenson & Leaman, 2010), it isbecoming increasingly common that they are used together due to their complementary andintegrated nature (Gupta & Darby, 2011), This is considered essential to discovering why abuilding is performing in a certain way, as quantitative measurements alone can only show thatit is.
Furthermore, a solely quantitative approach is fundamentally unable to answer questionsrelating to behaviour, as no meaning can be taken from observed differences (Morley & Hazas,2011), due to the subjectivity and large number of variables involved in achieving comfort in thehome (Karjalainen, 2013).
Similarly, qualitative data alone is not sufficient – partly because self-reported information suchas consumption habits, temperature preferences, environmental attitudes may not accuratelyreflect reality (Bryman, 2008) and because an assessment of comfort cannot be made withoutobjective data. There is also a need to observe and measure many variables in actionconcurrently, as the effect of one on the other, cannot be gained from interviews alone.
In the context of POE and BPE, quantitative data collection can consist of in-situ energy andenvironmental monitoring, meter readings and external weather data which is qualitativelyinformed by occupant surveys, questionnaires and diaries; these strategies are employed indifferent combinations depending on the objective of the exercise, as there is no single definedapproach to POE (Riley et al., 2009).
4.2 Main methodology types
The methodologies used in recent studies relating to energy in housing, appear to generally fallinto three distinct categories, all of which combine varying amounts of quantitative andqualitative data collection methods.
4.2.1 'Diagnostic' POE
The first is the 'diagnostic' or 'check-up' type POE with the immediate practical purpose ofimproving energy efficiency. These are usually used in the context of small-scale new-build orretrofitted social housing, and often where new and relatively untested technologies have beeninstalled, such as ground-source heat pumps (MEARU & Assist Architects, 2010) or solar hotwater systems (John Gilbert Architects, 2010). They typically propose collecting data over shortperiods of 2-4 weeks, to minimise intrusion to occupants and costs involved.
Sanders (2010) proposes a 3-level methodology, to direct time and equipment use mosteffectively: for example, if measured energy consumption taken from meter readings, is withinaround 20% of the SAP prediction, then there would be no problem to diagnose with the morecostly environmental monitoring, thermal imaging and airtightness tests. This methodology alsoadvises that meter readings are sufficient for most types of study, but it is important to note thespeed with with technology is moving in this regard (EST, 2008), with monitoring of gas
29

MSc AEES January 2014 Angela Lafferty
consumption only becoming possible in recent years.
A major advantage of this type of study is that that a feedback loop is created, whereby findingsare then taken on board in the design of the next project, as is certainly the case with JohnGilbert Architects (2010).
4.2.2 Large data-set analyses
Secondly, at the opposite end of the scale are studies using complex statistical analysistechniques such as ANOVA (analyses of variance) on large-datasets. For example, GuerraSantin et al. (2009), carry out analysis in SPSS on a random sample of 15,000 Dutch homes todetermine the effect of building characteristics on gas consumption for space-heating, andHaas et al (1998) use a cross-section sample of 400 homes in Austria to produce statisticallysignificant evidence of the rebound effect. Druckman and Jackson (2008) examine data from7000 UK households to determine the effect of geographical and socio-economic factors onenergy consumption, and Shipworth et al. (2010) draw on interview data from a stratifiedrandom sample of 427 UK households in a study of central heating settings, as part of thelarger CaRB project. An issue with these large studies is characterised by the Guerra Santin etal. study: the authors explain that the behavioural data was transformed from categorical valuesinto dichotomous variables, which for something as complex as window-opening behaviourmeans that a large amount of granularity of information is lost. Ventilation behaviour wasconsequently found to be insignificant, in stark contrast to many other research findings.
4.2.3 Mid-sized information-rich studies
The third distinct type draws on aspects of the smaller POE studies and the larger data-setstudies, to both identify problems in the dwellings and/or seek to draw conclusions that areapplicable to the wider population, and often intended for policy-makers. This type of study isarguably the most illuminating, because the size of sample is often small enough thatmeaningful insight can be gained from householder interviews, but large enough to allow theextrapolation of findings not possible in the smaller (but very useful) POE studies.
One example is Fell & King's study for DECC (2012), which looked in detail at the gasconsumption of 53 'comparable' UK households over 8 weeks: all owner-occupied, threebedroomed, semi-detached properties. They were selected from a larger sample and thenclassified as HIGH or LOW (top or bottom decile) gas consumers. A qualitative strategy of in-depth interviews and participant diaries was used to illuminate weekly meter reading data,supplemented in 20 households by hourly temperature monitoring in 3 rooms. This strategy notonly measures differences in consumption, it matches those differences with the behaviour ofthe actual occupants, and allows patterns to emerge from the data, such as that on average,the temperatures were higher in the HIGH using homes. When it was clear that there was nopattern between specific behaviours and overall consumption, the granularity of informationprovided by the interviews and diaries allowed the researchers to understand that any randomcombination of behaviours could result in high gas use, which is a key finding in itself.
Gill et al. (2010) conducted a similar study, with findings aimed at designers of low-carbonhomes. In contrast to Fell & King, the 26 homes were all part of the same new-build, housingassociation development. They monitored gas, electricity and water use, and conductedinterviews to investigate occupant behaviour, but only after sizeable differences in consumptionwere observed. Correlation analysis of survey results and measured consumption suggestedthat 51% of variation in gas use was due to occupant behaviour, but also highlighting thatdespite identical age and construction of the homes, other non-occupant differences were stillsignificant.
A study which does not easily fit into any of the categories described, is Gram Hanssen's(2010) exploration of energy-using habits in 5 identical terraced houses. These homes wereselected from a much larger study of the 1960/70's planned neighbourhood they are situated in,
30

MSc AEES January 2014 Angela Lafferty
in a similar way to both Fell & King's and Gill et al's studies – based on their high or low energyuse. This study is heavily focused on the information gained in the occupant interviews, as ameans of understanding behaviour in the more conceptual terms of the practice-theoryapproach, and in terms of granularity it offers perhaps the clearest picture of all the researchreviewed.
4.3 Discussion of methods used
This study is closest in methodology and objectives to the third type of housing energy studyidentified above, however due to its small sample size it also shares attributes with the smallerPOE type. There are disadvantages to both approaches, which this research has tried toovercome by combining the benefits of each, within the practical limitations of time, money andresources. The defining aspects of the research design are discussed below.
4.3.1 The case-study approach
The small sample size of a case-study means that findings are not able to be generalised,however this approach was chosen as it allows a more in-depth analysis and ability to give thewhole picture of household behaviour, with use of complementary quantitative and qualitativestrategies.
The main objective of this research was to isolate occupant behaviour as the sole variable, bycontrolling the physical and location characteristics – this is almost impossible with largersamples as it is difficult to find enough identical homes which are all in the same location. In ahousing estate, 'identical' homes may be spread out over an area with subtly different micro-climates and shading obstacles, and a high-rise building with stacked flats would be subject tohigher wind loading on upper levels.
Difficulties of recruiting participants and arranging access are also contributing factors; forthese reasons, the three participating households were chosen by convenience sampling(Bryman, 2008). The author lives in one of the flats and has existing relationships withoccupants of the two other identical flats. Together with the fact that the flats were fairly newand had been fitted out with exactly the same heating system and large appliances, as well ashaving a very similar demographic (home-owners all aged between 32-42 years, professionals)and electronic appliance ownership (DVD players, laptops, iPads, broadband hub, LCD TV's), itwas therefore considered a rare and fortunate opportunity to carry out some unique research,in as close to lab-like conditions as is possible in the real-world.
Detailed knowledge and experience of the flat gained by living in it are considered advantages,serving to enrich the research further by, for example, tailoring the interview questions toaddress the specific conditions in the flat. This 'action research' approach is advocated byGupta & Darby (2011), where researchers become active participants rather than passiveobservers.
While a slightly larger sample size may have been preferable, there were no more flats of thesame type in the development, and monitoring additional properties would have been difficultdue to budgetary, logistical and data-handling constraints.
4.3.2 The 'controlled' experiment - limitations
As nearly all physical and location variables in the study were controlled, such as dwelling size,age, construction type, boiler efficiency and heating system (see Appendix G for more details)we can attribute almost all of the variation in energy use to occupant behaviour. However,occupant-related variables could have been controlled still further, by ensuring all boiler settingswere the same, all TRV settings the same, and all trickle vents open at all times, to allow easierquantification of such parameters as the effect of thermostat setting - however, this would nothave given a true reflection of variations found in reality, and could be considered unethical by
31

MSc AEES January 2014 Angela Lafferty
causing occupants to perhaps consume more energy, and be less comfortable, than wouldotherwise have been the case (Bryman, 2008).
In spite of the flats being in of exactly the same type and location, there are nevertheless 3variables which can not be deemed 'fully controlled' in this experiment: airtightness (buildquality), wind effect, and solar access.
Sonderegger (1978, cited in Morley & Hazas, 2011) found that 29% of variation in heat-consumption, in a study of 31 seemingly identical town-houses, was due to non-occupantrelated factors. These include defects and missing insulation, leading to higher infiltration andfabric heat losses. However, it is also possible that micro-climatic differences had an effect inthis case, where the geographic spread of 31 houses is much larger than the 3 stacked flats inthis study, and the houses had gardens with differing amounts of trees and bush cover.Together with the fact that flats have less external envelope than town-houses, and thatstandards have improved significantly since this 1970's study, the variation in consumption dueto non-occupant factors in this study is likely to be significantly less.
Thermal imaging and airtightness testing could have quantified build-quality differences tosome extent, but for financial and logistical reasons were not carried out as part of this study.As all occupants independently reported draughts in the same areas, this can be taken as anindication of a relatively similar air leakage rate.
It is widely known that wind speeds increase with height, in the absence of any obstructions,and that wind effects on buildings generally increase over a height of about the 4 th storey(Mawditt, 2013).9 As this site is relatively exposed, within a few hundred metres of the coast,and is surrounded predominantly by open land and one-storey industrial buildings (see Chapter3, figure 3) the lower storeys of the building may not be as sheltered from wind effects as wouldbe assumed in a more built-up area. The wind effect is likely to be most significant in Flat A, butit would be impossible to quantify without the use of sophisticated CFD modelling to account forturbulence and 'wind-tunnel' effects.
The storey-height of the flat also has an effect on the amount of solar radiation it receives,because of obstruction by neighbouring buildings. However, the street width is approximately30m (including pavements) and there are no buildings immediately opposite. Opposite and tothe south-west there is a derelict 2 story building, and opposite to the south-east there are twobuildings which have some impact on early morning autumn/winter sun; one of them is a new7-storey flat development (see Chapter 3, figure 3).
Figure 10 (below) illustrates that there is an approximate delay of almost half an hour oneffective 'sunrise' times between Flats A and C, on a day in January, which can be assumed tooccur every day throughout late autumn, winter and early spring to a greater or lesser degree.The effect, however, is deemed to be minimal, because of the lower solar radiation levels at thissun angle compared to peak levels in the middle of the day. There is deemed little effect on'sunset' times for the same reason, and to the absence of building obstructions to the west.
In summer there is no direct solar gain in any of the south-facing living rooms due to thebalcony overhang. Future development of vacant land opposite the flats will significantlyincrease the impact of winter overshadowing on solar heat gain, particularly in Flat C.
9 The average annual wind speed for this site given by the NOABL wind map (2012) is 5.4 m/s (19.4 km/h) at a 10m height. NOABL does not account for the effects of building or trees, meaning that the true figures in built-up areas are usually far lower, however it could be more accurate here due to the exposed conditions. In addition, NOABL does not include thermally-driven sea breezes, which are also a factor at this site so the average wind speed may even be higher.
32

MSc AEES January 2014 Angela Lafferty
4.3.3 Length of study
It was felt that the 2-4 week monitoring period generally used in the POE methodologies is tooshort to give an accurate picture, due to the high variability of lifestyle and weather factors. Forexample, the 2 weeks could fall in a particularly warm or cold spell, or when the occupants areon holiday, off sick or have guests staying. In addition, extrapolation of annual data from 2weeks of measurements can introduce a high level of error.
Furthermore, having experienced 5 years of changing seasons in the flat, the authorhypothesised that the relationship of temperatures in different rooms may change over time,either through choice or through changes in heat loss in colder months (ie. that the living roomis the warmest room in summer, but the coldest room in winter). Sanders (2010) also stressesthe importance of measuring as many rooms as possible. Ideally, the study would have takenplace over a whole year, or at least the entire heating season, however time constraints meantthat only 3 months was possible. Although the period does not cover the coldest part of theyear, it does capture the transition from early autumn to early winter and the start of the heatingseason. A further advantage of this longer period is to provide a larger sample on which to baseaverage figures – over 23,000 readings in the living rooms and hall.
4.3.4 Survey and interview
It was decided to use the BUS methodology survey (Leaman, 2013) to ascertain occupantsatisfaction levels, for several reasons: it is already an established and respected method; thisdata can contribute to a wider database of dwelling BPE surveys; and that these surveyresponses can be benchmarked against responses from other similar buildings.
The interview question selection was influenced by many of the studies reviewed, including:Huebner et al. (2013) questions on adaptive behaviour for thermal comfort, and attitudestowards energy and the environment; Yohanis (2012) questions on energy-saving behaviourand appliance use; and Sanders (2010) questions on ventilation habits and draughts. Askingoccupants on awareness of energy costs was in part prompted by Gill et al's behaviour survey,although it was decided not to create Likert response scales, as no statistical analysis was tobe carried out on qualitative data (Groat and Wang, 2002).
33
Figure10: Photograph from Flat A living room, with corresponding view from Flat C view overlaid, showing effect on 'sunrise' times.
Flat C: 9:29am
Flat A: 9:02am
Sunrise: Thu 09 Jan 2014

MSc AEES January 2014 Angela Lafferty
Care was taken to restrict the number of questions and therefore length of interview, as thiscould invoke negative or short responses due to boredom (Bryman, 2008; Leaman, 2013). Forthis reason, the subject of frequency and duration of electrical appliance use was not coveredin any detail despite its importance in understanding differences in annual electricityconsumption, as it was considered to be secondary to the main focus area of gas and space-heating. It was decided to interview both adult residents together, to increase the likelihood thatanswers reflected reality, being agreed upon by consensus, as well as highlighting anydisagreements or contrasting behaviour within each couple.
The question list can be seen in Appendices C-E, in the transcripts of the interviews. Thewording was loosely followed, usually leaving questions fairly open-ended, with further'prompts' noted underneath as an aid to the interviewer (the author) in facilitating occupant'sresponses, as recommended by Stevenson (2008).
Interviewees have been given pseudonyms to preserve anonymity. This approach was chosenrather than naming them as Occupant 1, 2 etc. to give a more human picture rather than adescription of a scientific experiment, as people and their behaviours are, after all, at the centreof this research. This approach is better for the reader, as numbers can be easily confused withone another, but also for the author, as it facilitates writing critically and objectively aboutherself and her own behaviour.
4.4 Relevance of findings in a nationwide context
As already stated, this study is not intended to be statistically representative; nonetheless itsfindings may have some relevance in a nationwide context, underlined by the followingsummary statistics (DCLG, 2013) :
• Detached houses are the most prevalent dwelling type in the UK, but flats neverthelessconstitute around 20% of all dwellings, and purpose-built flats around 16%.
• In 2011-2012, 65% of households were owner-occupied.
• The average total usable floor area of dwellings in 2011 was 91m2, and over half of allowner-occupied dwellings had a floor area less than 90m2 (mostly in the 70-89m2
bracket). The area of the study flats is 84m2.
• 90% of the housing stock has central heating, and around half of boilers arecombination boilers (inc. condensing combis).
• The flats have a likely band B energy-efficiency rating, and are therefore representativeof the nation's limited 'low-carbon' stock. In 2011, only 0.2% of dwellings were in bandsA-B.
It is useful to bear all of these figures in mind when considering the research results, which arepresented in the following chapter.
34

MSc AEES January 2014 Angela Lafferty
CHAPTER 5 – RESULTS and ANALYSIS
5.1 INTRODUCTION
This chapter sets out the key findings to emerge from the large amount of both quantitative andqualitative data collected throughout the study. It is not possible to fully analyse and present allof this data due to the amount generated, however the gas consumption and temperature dataare analysed at a range of scales to gain as much insight into occupant heating practices aspossible. As stated in the Methods chapter, electricity data was collected to gain a 'whole-house' picture of energy consumption, as well as providing data to derive electrically heated hotwater, lighting and mechanical ventilation estimates for 'regulated energy' comparisons: assuch, no detailed analysis of electricity consumption is given. Several appendices accompanythis chapter, with cross-references given when appropriate.
Firstly, a 'portrait' of each household is presented to provide some background to aidunderstanding of the monitoring data, presented in subsequent sections. This description ofeach household is a summary of the information gained from the occupant interviews, of whichtranscripts are to be found in Appendices C-E.
The quantitative data is then presented, in the following order: firstly, the overall results of theenergy monitoring of all three flats, including a comparison with SAP figures. This is followed bypresentation of the temperature data, and subsequent detailed analysis of three individual dayswith temperatures and gas use overlaid. A brief summary of the relative humidity data is thenprovided, followed by some key results from the BUS methodology occupant satisfactionsurvey, and finally a section on household energy and CO2 benchmarking.
5.2 INTERVIEW RESULTS – PORTRAITS.
All names used below are pseudonyms to protect identity of the occupants.
5.2.1 Flat A portrait - 'Amanda and Tim'
This flat is occupied by Amanda and Tim, a couple in their early-mid thirties, and their 2 pre-school aged children. The flat is occupied a large proportion of the time by Amanda and thechildren, while Tim works standard hours Mon-Fri. They describe themselves as energyconscious, but do have some 'bad' habits such as enjoying long showers, and keeping the flatquite warm. Amanda in particular is a 'cold person', normally wearing many layers, and all theTRVs are up at maximum.
The heating was first switched on on the evening of 19th September. This couple like the houseto be warm, usually setting the thermostat to 22°C. However, they operate the heatingmanually, so that it is only used when they feel cold. They usually switch the thermostat down(so that it is effectively 'off') once the flat has heated up, to avoid the boiler coming on and off allevening which they think is unnecessary. The daily average gas consumption for the study was22 kWh, however this increased from just over 8 kWh/day in the first week of the study, to over50 kWh/day in the last week. The windows are generally shut all winter (and late autumn) butare occasionally opened after excessive showering or cooking. The trickle vents are usuallyopen, only shut during periods of strong wind.
The bath is used every evening for the 2 children, and the adults use the gas shower in thebathroom rather than the electric shower in their ensuite as it is broken. They consume theleast electricity: this is partly explained by the non-use of the electric shower, and strictswitching-off behaviour. This occupants of this flat only rarely use the tumble dryer, a hair-dryer,or hair straighteners. This flat has a significantly different lighting layout to the other two, withnumerous 50W halogen downlights fitted throughout, rather than low-energy pendant fittings; it
35

MSc AEES January 2014 Angela Lafferty
is therefore estimated that lighting takes up a large portion of this flat's electrical consumption10.
5.2.2 Flat B portrait – 'Rachel and Gordon'
This flat is occupied by Rachel and Gordon, a couple in their mid-thirties/early forties. It isgenerally unoccupied during the week in daytime (8am-6pm) when the couple are at work,however it was occupied most of the time during the last month of the study by one of theoccupants. The couple are conscious of energy costs, (both working in the energy sector) andonly switched their heating on in the 11th week of the study. Gordon does not 'feel the cold', andsaid he could live without heating, whereas Rachel does tend to feel cold, but uses othermeans for as long as possible (layers, hot water bottle, blankets) to delay switching on theheating. Their thermostat is set to 21.5°C, and is programmed to come on for an hour in themorning, and for around 3 hours in the evening (though it is not firing all this time as it reachestarget temp quickly). The TRVs are at maximum in the living room, but turned down to 3 in thebedrooms.
The windows are kept shut throughout the late autumn/winter period, as are the trickle ventsmost of the time, however the mechanical extract runs continuously on the trickle setting. Theirelectricity use is relatively high, partly explained by both occupants using the electric showerevery morning, and relatively frequent use of the oven for cooking and baking. The TV etc. isleft on standby overnight but most other sockets are switched off at the wall. The occupantsfeel that electricity use is a necessary part of daily life, whereas gas is easier to cut back on.
5.2.3 Flat C portrait -'Becky and Michael'
This flat is occupied by Becky and Michael, a couple in their late thirties/early forties, along withtheir adult daughter and their pre-school aged son. The flat is occupied a large proportion of thetime by Becky and her son, while Michael works standard hours Mon-Fri, and their daughter'spresence at home is more variable. Their energy consumption was the highest of the study, forboth gas and electricity. This is partly explained by the higher number of adult occupants. Boththe gas and electric shower are used, as well as the bath.
The heating is used manually, and set to 20°C, the lowest setting of the three flats. The TRVsare also set low except in living and bedroom 3 which are at maximum. However, the heatingconsumption is characterised by the couples strikingly different comfort preferences, asdescribed in the interview. Becky prefers cooler temperatures, opening the windows all dayevery day year round, and would very rarely switch on the heating - using a blanket instead asshe doesn't like to 'breathe warm air'. By contrast, Michael likes the house to be warm, and theheating is on when he is at home. The master bedroom window remains open continuously(except in extreme weather). The couple both find the energy costs of this flat to be high,compared to previous properties they have occupied (separately). It seems that thecombination of the two contrasting comfort conditions is causing the relatively high gasconsumption.
It is not immediately obvious why the electricity consumption is so high, even with use of theelectric shower accounted for, but it may be due to increased use of hair-dryers, straighteners,more frequent use of oven and appliances being left on standby. Despite finding costs high,they would continue to pay the bill ahead of altering habits, unless costs increased dramatically.
10 Example: living rooms in the other flats have 2 pendant fittings of 10W each, whereas Flat A has 11x50W= 550W,If lights are assumed to be on for around 6 hours in the evening, this amounts to 3.3 kWh instead of 0.06kWh.
36
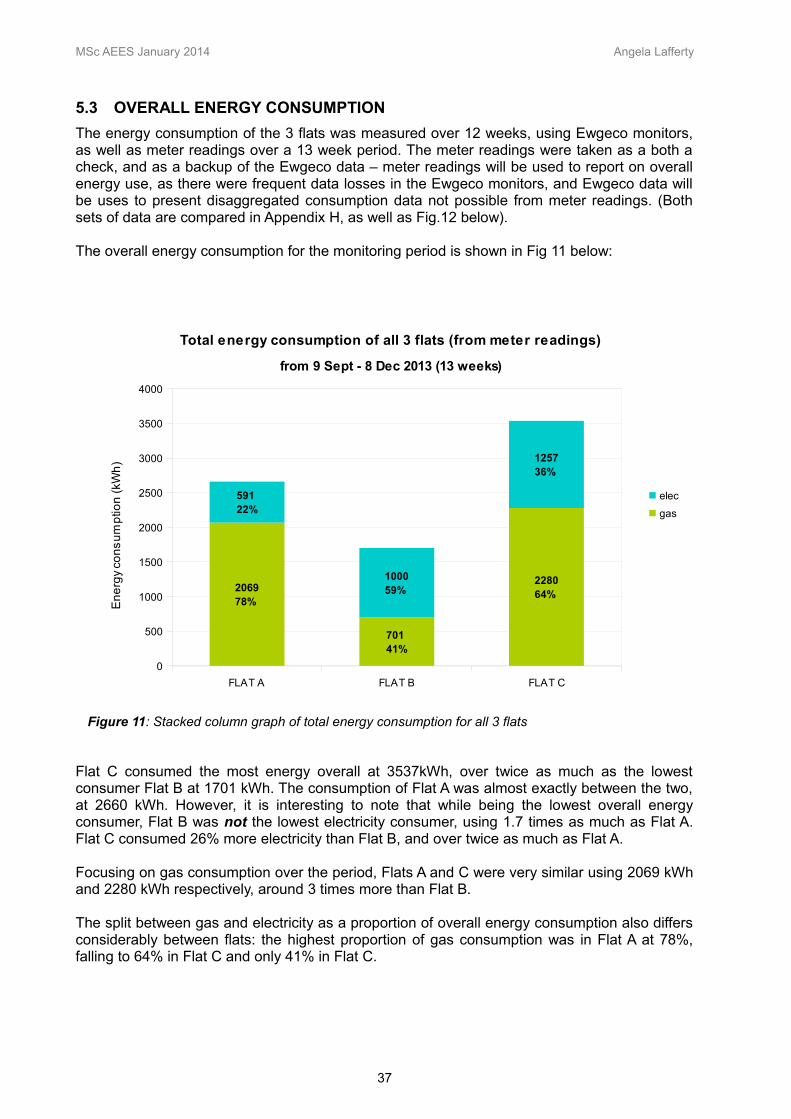
MSc AEES January 2014 Angela Lafferty
5.3 OVERALL ENERGY CONSUMPTION
The energy consumption of the 3 flats was measured over 12 weeks, using Ewgeco monitors,as well as meter readings over a 13 week period. The meter readings were taken as a both acheck, and as a backup of the Ewgeco data – meter readings will be used to report on overallenergy use, as there were frequent data losses in the Ewgeco monitors, and Ewgeco data willbe uses to present disaggregated consumption data not possible from meter readings. (Bothsets of data are compared in Appendix H, as well as Fig.12 below).
The overall energy consumption for the monitoring period is shown in Fig 11 below:
Flat C consumed the most energy overall at 3537kWh, over twice as much as the lowestconsumer Flat B at 1701 kWh. The consumption of Flat A was almost exactly between the two,at 2660 kWh. However, it is interesting to note that while being the lowest overall energyconsumer, Flat B was not the lowest electricity consumer, using 1.7 times as much as Flat A.Flat C consumed 26% more electricity than Flat B, and over twice as much as Flat A.
Focusing on gas consumption over the period, Flats A and C were very similar using 2069 kWhand 2280 kWh respectively, around 3 times more than Flat B.
The split between gas and electricity as a proportion of overall energy consumption also differsconsiderably between flats: the highest proportion of gas consumption was in Flat A at 78%,falling to 64% in Flat C and only 41% in Flat C.
37
Figure 11: Stacked column graph of total energy consumption for all 3 flats
FLAT A FLAT B FLAT C
0
500
1000
1500
2000
2500
3000
3500
4000
206978%
70141%
228064%
59122%
100059%
125736%
Total energy consumption of all 3 flats (from meter readings)
from 9 Sept - 8 Dec 2013 (13 weeks)
elec
gas
En
erg
y co
ns
um
ptio
n (
kWh
)

MSc AEES January 2014 Angela Lafferty
5.4 GAS: VARIATION OF CONSUMPTION OVER TIME
5.4.1 Cumulative consumption
Figure 12 (below) illustrates how cumulative gas consumption in all 3 flats varies with time,(plotting both Ewgeco and meter reading data). It is clear that the rate of gas consumptionincreased in all 3 flats over the length of the study, in line with expectation as it draws closer tomidwinter, however the graph reveals vital differences not evident from overall data: Flats A andC display an exponential-type curve, suggesting a gradually increasing gas consumptionthroughout the study. It is not possible to accurately predict the continuation of these curves,however it is likely that they would follow the path of a typical S-curve, with consumptionbeginning to decrease again from winter into spring, and perhaps becoming linear over thesummer when there is no heating influence.
Flat B however, maintained a linear growth until 19th November when a marked increase inconsumption took place, marking the beginning of this flat's heating season. The heating periodon the graph is too short to predict whether the path will be linear or curved over winter, butseasonal influence means it is likely to follow a slight curve, before tapering off to linear growthagain over summer.
Although Flat C had higher consumption overall by 8th December, the apparently more rapidlyincreasing curve of Flat A suggests that its consumption may overtake that of Flat C beforemidwinter, which may or may not result in a higher consumption over the whole year.
5.4.2 Average daily consumption
Figure 13 (below) shows both the actual daily gas consumption for the three flats over the 12week period, as well as average daily consumption (averaged with the preceding andsucceeding 3 days) to give a clearer picture.
38
Figure 12: Total gas consumption of all 3 flats
09/0
9/2
01
3
16/0
9/2
01
3
23/0
9/2
01
3
30/0
9/2
01
3
07/1
0/2
01
3
14/1
0/2
01
3
21/1
0/2
01
3
28/1
0/2
01
3
04/1
1/2
01
3
11/1
1/2
01
3
18/1
1/2
01
3
25/1
1/2
01
3
02/1
2/2
01
3
09/1
2/2
01
3
0
500
1000
1500
2000
2500
Total gas consumption of all 3 flats(Using Ewgeco monitor and meter readings)
A Meter A Ew geco B Meter B Ew geco C Meter C Ew geco
Date
To
tal g
as
co
ns
um
ptio
n (
kWh
)

MSc AEES January 2014 Angela Lafferty
It can be seen that Flat B had a relatively constant average daily consumption with little dailyfluctuation until the 18th November when the heating was switched on, marking a sharpincrease. Flat A had a higher amount of daily fluctuation, with the daily average increasingslowly until around the end of October where it began to increase more rapidly. Flat C has thehighest level of daily fluctuation, with several high peaks of over 80 kWh/day, but an overallincreasing trend is nevertheless apparent. This rate of growth appears to be slower than that ofFlat A, as was noted from Fig. 12, suggesting that Flat A may go on to consume more gas thanFlat C over a whole year, depending on when the curve levels off and begins its descent intospring. A summary of the data is also given in tabular form in Table 3.
Min(kWh)
Max (kWh) Range Date(s) of highestconsumption
Flat A 0.65 73.97 73.32 21, 20, 26 Nov
Flat B 0.54 34.87 34.33 20, 21, 23 Nov
Flat C* 4.55 88.81 84.26 14 Nov, 11 Oct
Table 3: Summary of daily gas consumption data for all 3 flats.
*Flat C: monitor was broken on 16th November so data missing after this date. The highest daily consumption for other flats occurred after this date as the weather became colder, therefore it is possible that the maximum for Flat C could be higher than the figure shown.
5.4.3 Isolating heating from cooking and hot water use
All the gas consumption results presented so far also include gas used for cooking and hotwater, and do not therefore represent gas consumption purely for heating purposes. In thissection, an attempt is made to adjust the figures to exclude non-heating use.
39
Figure 13: Line graph showing daily gas consumption (actual and average) for all 3 flats
09/0
9/2
01
3
16/0
9/2
01
3
23/0
9/2
01
3
30/0
9/2
01
3
07/1
0/2
01
3
14/1
0/2
01
3
21/1
0/2
01
3
28/1
0/2
01
3
04/1
1/2
01
3
11/1
1/2
01
3
18/1
1/2
01
3
25/1
1/2
01
3
02/1
2/2
01
3
09/1
2/2
01
3
0
10
20
30
40
50
60
70
80
90
100
Daily gas consumption (actual and average) for all 3 flats
A B C A Avg B AvgC Avg
Date
Da
ily g
as
co
ns
um
ptio
n (
kWh
)

MSc AEES January 2014 Angela Lafferty
In the case of Flat B, the average daily use prior to the heating being switched on was 2.75kWh, and as there was so little daily fluctuation can be taken as a constant for the duration ofthe study. This figure is almost wholly for cooking, as both occupants only used the electricshower. Other hot water use is likely to be minimal as the flats all have dishwashers.
It is more problematic to estimate for the other 2 flats for several reasons: Flat C was alreadyusing the central heating from the outset of the study, so there are no data for non-heating days– for Flat A, the heating was not used for the first 10 days of the study, allowing a roughestimate to be made; the hourly Ewgeco data showed significant fluctuation from day to day, inamounts as well as timing, making it very difficult to allocate gas usage according to activity.However, a rough estimate was able to be made using occupancy information from theinterviews – for more detail on the calculation methodology see Appendix J.
As Figure 14 illustrates, adjusting gas consumption to exclude non-heating use does not have asignificant effect on each flats' consumption relative to one another, as the amount is only asmall proportion of average daily consumption, particularly in the later weeks.
The disaggregated figures do have an effect on relative overall consumption for the period, asshown in Figure 15 (below): the relationship between Flat C and B changes from 3.25 timesmore to 3.44 time more, and Flat C uses around 25% more gas for heating than Flat A,compared to only 10% more in terms of overall gas consumption.
40
Figure 14: Line graph as Fig. 13 above - adjusted to exclude cooking and HW gas use
09/0
9/2
01
3
16/0
9/2
01
3
23/0
9/2
01
3
30/0
9/2
01
3
07/1
0/2
01
3
14/1
0/2
01
3
21/1
0/2
01
3
28/1
0/2
01
3
04/1
1/2
01
3
11/1
1/2
01
3
18/1
1/2
01
3
25/1
1/2
01
3
02/1
2/2
01
3
09/1
2/2
01
3
0
5
10
15
20
25
30
35
40
45
50
Average daily gas consumption for HEATING (estimated) for all 3 flats
A daily av HEAT B daily av HEAT C daily av HEAT
Date
Da
ily g
as
co
ns
um
ptio
n H
EA
TIN
G (
kWh
)

MSc AEES January 2014 Angela Lafferty
However, it must be borne in mind that these disaggregated figures are rough estimates only,and also that they represent only a quarter of an annual cycle: it is not simple or clear-cut toextrapolate annual consumption from these figures, due to differing rates of increasingconsumption over time.(ie Flat A consumption increasing more steeply than Flat C, which couldlead to higher over a year, despite being lower at end of study). A hypothesis of annualconsumption patterns is shown below in Figure 16, based on an extrapolation of monitoreddata (shown in Fig. 13) into sine-wave patterns of different amplitudes for Flats A and C, and ashorter pulse type pattern for Flat B. This extrapolation is at best a guess, and simply illustratesthe point that it is difficult to predict annual consumption based on a 3 month snapshot.
5.5 COMPARISON WITH SAP
Estimating annual consumption from the data is problematic and inaccurate, as discussed, andthe additional step of normalising the consumption data to a standard year, using degree days,would add a further layer of inaccuracy. Instead, it is proposed to use meter readings to derivean average annual consumption. All of the occupants were the first occupants of the newly builtflats, therefore the current gas meter reading gives the gas consumption for each flat over theduration of occupancy. The meter reading of Flat A on moving in was 00027, accounting for the
41
Figure 15: Stacked bar graph of gas breakdown per flat.
Flat A Flat B Flat C
0
500
1000
1500
2000
2500
125060%
45164%
155268%
81940%
25036%
72832%
Estimated breakdown of gas consumption of all 3 flats from 9 Sept - 8 Dec 2013 (13 weeks)
cooking+HW
Heating
Ga
s c
on
su
mp
tion
(kW
h)
Figure 16: 'Extrapolation' of monitored gas consumption to annual profiles. Hatched area denotes the actual data in Fig. 13 on which this projection is based.
J

MSc AEES January 2014 Angela Lafferty
gas use due to plumbing installation and boiler commissioning etc. Move-in meter readingswere not available for the other 2 flats, but were assumed to be the same as Flat A. Anydifference would be a minute proportion of 5 years of subsequent gas consumption andtherefore this method is considered to be fairly accurate. (Further detail of calculations are inAppendix J).
Figure 17 below illustrates the annual gas consumption averaged over the 5 years ofoccupancy of all flats, as well as an estimated breakdown into heating and non-heating uses.The allocation for Flat C is almost the same on an annual basis as it is for the 3 month studyperiod. Flat B's breakdown is dramatically different, a result of the short heating season beingalmost entirely missed by the study. Heating makes up 64% of all gas use on an annual basis,relatively high despite the short heating season, because of the negligible hot water use,leaving cooking as the only other use. The situation in Flat A is slightly more complex due tosignificant annual variation in hot water demand from gas (the electric shower was used byboth adults when not broken); the heating demand can be taken as constant over the 5 years at4703 kWh, but forms between 59%-76% of gas use depending on HW demand. (Highlightingthe major influence of electric/gas showering). The SAP comparison will be made on the basisof higher HW demand, as this is the current situation in Flat A.
As SAP considers energy related only to heating, HW, lighting and ventilation, estimates ofthese were made, using manufacturer's data, power-ratings, Ewgeco data analysis andinterview information. The SAP 2005 primary energy factors for mains gas and electricity werethen applied to convert delivered (consumed) energy into primary energy, to allow comparisonwith the SAP prediction. (Further detail of calculations are in Appendix K).
There were no SAP worksheets submitted for this particular flat-type at the the time of thebuilding warrant application/granting in 2005 as this was not a requirement, however SAPcalculations were carried out for a number of other flat-types in the development, using SAP2001 version. At that time the SAP scale was from 1-120: the SAP ratings for the assessed flatsranged from 100-112 for ground and top floor flats, while the 2 mid-floor flats assessedachieved 118, indicating that the mid-floor flats were at the very top end of the spectrum. TheSAP 2001 rating for Flats A, B and C would also likely have been near the top of the scale,though notably, the boilers installed are only Band D compared to the more efficient Band Aboilers used in the SAP calculation.
42
Figure 17: Stacked bar graph of annual average gas consumption per flat (breakdown estimated).
Flat A Flat B Flat C
0
1000
2000
3000
4000
5000
6000
7000
8000
9000
10000
4703283274%
597867%
237334%
100426%
292033%
Annual gas consumption (averaged over 5 years) for all flats NB: Breakdown estimated
Cooking + HW
Heating
An
nu
al g
as
co
ns
um
ptio
n (
kWh
)
59-76%
24%
34%
41%
Ave
rag
e A
nnua
l Gas

MSc AEES January 2014 Angela Lafferty
Energy Performance Certificates have been obtained for two recently sold mid-floor flats in thedevelopment, and a SAP calculation was carried out by the author for Flat A. Details of all SAPinformation gathered is presented in Table 4 below (The full SAP worksheets are in AppendixL).
Source Floorarea Version
SAP/EErating
EIrating Band
Prim. EnergyIndicator
Space-heating
Original mid-storey SAP
SAP 2001 118 - A - -
Mid-storey saleEPC
74m2 RdSAP 2009 81 84 B 105 kWh/m2 2408
Mid-storey saleEPC
88m2 RdSAP 2009 83 86 B 91 kWh/m2 3177
Calc. based on actual study flat
84m2 SAP 2005 83 84 B 114 kWh/m2 2482*
Table 4: Collation of all SAP information gathered.
*The author is not an experienced SAP assessor, therefore figures given can only be taken as rough guides.Differences in orientation and layout could account for the differences space-heating requirement and Primary Energy Indicators.
The correlation between sources is high, leading to the almost certain conclusion that Flats A, Band C would be classed as Band B 'low-carbon' dwellings, with a SAP rating of 81-83, and anEnvironmental Impact rating of 84-86. Table 5 and Figure 18 below, compares the author's SAP2005 assessment of the flat-type with the actual consumption of the 3 flats in the study.
Primary Energy Indicator (kWh/m2/year)
Space-heatingrequirement (kWh/year)
SAP 2005 114 2482*
ActualRegulatedannualenergy use
Flat A 130 4703
Flat B 77 2832
Flat C 145 5978
Actual Totalannual energy use
Flat A 176
Flat B 186
Flat C 290
Table 5: SAP predictions versus actual energy use ('regulated' and total)
The figures show that Flat A's regulated primary energy consumption is 14% higher than theSAP prediction, while Flat C's is 27% higher. Flat B however has a significantly lower primaryenergy use than predicted at only 68% of SAP.
However, when considering total primary energy Flats A and B are fairly similar, due to Flat B'shigh proportion of electricity, at 54% and 63% higher than SAP regulated energy prediction. FlatC's total primary energy consumption is over 2.5 times the SAP regulated energy prediction. IfSAP 2009 revised primary energy factors are used to compare against the SAP 2005
43

MSc AEES January 2014 Angela Lafferty
prediction, the picture worsens further, to 2.7 times higher.
Due to the potential inaccuracy of the authors SAP calculation, it is thought that SAP PEIprediction may have been overestimated (based on comparison with other figures in Table 4),in which case the results would be worse still.
It is clear that actual primary energy consumption far outweighs SAP predictions for all flats,which is largely due to the high proportion of unregulated energy use in Flat B, significantlyhigher space heating demand in Flat A, and both in Flat C.
5.6 TEMPERATURE MONITORING RESULTS AND ANALYSIS
5.6.1 Global temperature data summary
This section presents the key temperature data from the 12 week monitoring period from 9September to 28 November. As the temperatures were monitored at 5 (and 10) minute intervalsin 4 rooms in each flat, a huge amount of data was generated, which cannot all be fullyanalysed here, in both temporal and spatial terms. Therefore, a summary of the data will begiven, followed by a more in-depth focus on the living room temperatures as the room wheremost time is spent. Analysis will be focussed on the evening period (6pm – 12 midnight) as theperiod where all 3 flats were occupied at the same time, to allow comparisons.
The mean temperatures for each room in each flat over the period are illustrated in Figure 19below. Note that bedroom 3 data is included for illustrative purposes only due to the accuracy ofthe data being in question.11
The temperatures in every room were on average highest in Flat A, and lowest in Flat C. Thereis a large difference of 2°C between the warmest and coolest living rooms, while the differencebetween warmest and coolest halls is less, at 1.2°C. Bedroom 2 had the highest averagetemperature in all the flats, which was matched by the living room temperature in Flat A. Afterbedroom 3, the master bedroom had the lowest average temperature in all 3 flats, which wasmatched by the living room temperature in Flat B.
11 The temperatures measured by the Ewgeco monitor are thought to be around 2.5°C below actual temperatures, and have been adjusted accordingly - however the certainty of this adjustment is low.
44
Figure 18: Column graph comparing SAP Primary Energy Indicator with actual 'regulated' and total energy use per flat
Flat A Flat B Flat C SAP 05
0
50
100
150
200
250
300
350
Comparison of Primary Energy Indicator
for all flats vs SAP 2005
Regulated energy
Total energy
Pri
ma
ry E
ne
rgy
Co
ns
um
ptio
n
(kW
h/m
2/y
ea
r)

MSc AEES January 2014 Angela Lafferty
45
Figure 20: Flat A: Range, interquartile range and median temperaturesfor each room (bedroom 3 data is unreliable).
Figure 19: Plan diagram showing mean temperatures per room, per flat, over the 12 weeks.

MSc AEES January 2014 Angela Lafferty
46
Figure 22: Flat C: Range, interquartile range and median temperatures for each room (bedroom 2 (missing) and 3 data is unreliable).
Figure 21: Flat B: Range, interquartile range and median temperatures for each room (bedroom 3 data is unreliable).

MSc AEES January 2014 Angela Lafferty
However, these average temperatures may be masking more subtle variations, particularlysince the temperatures were monitored over the transition from late summer, through autumn tothe onset of winter, where changes in central heating use were taking place in each flat, asseen in the previous section. The box and whisker plots in Figures 20-22 above give moredetailed information on the temperatures experienced in each monitored room of the flats,illustrating the overall range of temperatures experienced, as well as the inter-quartile rangesand the median, describing more accurately the nature of air temperature in each space.
For instance, the living room in Flat C experiences the largest range of all rooms in the study,as well as reaching the lowest temperatures. It is also clear that the greatest level of uniformityacross rooms is in Flat B, where both the overall and interquartile ranges for each room are notdramatically different. A common feature in all 3 flats is the narrow temperature rangeexperienced in the hall, probably due to its internal nature, which is related to the earlierobservation that the hall temperatures were the most closely related space across the 3 flats.The hall temperatures are of interest because this is where the room thermostat for the centralheating is located, and the temperature logger was placed in the same location.
It would also have been interesting to compare the relationship between the living room and thebedrooms over time. For example, the author's experience is that the living room is generallythe warmest room of the flat in summer, but that it feels significantly cooler than the bedroomsin late autumn and winter, excluding during periods of high solar gain. It might be the case thatthe 'average temperature' is again concealing a more complex thermal relationship betweenrooms that changes over time.
5.6.2 Focus on living room temperatures
A histogram showing the distribution of the living room temperature data in all 3 flats is shownin Figure 23 below.
47
Figure 23: Histogram of temperature distribution in living rooms

MSc AEES January 2014 Angela Lafferty
Over 23,000 separate readings were taken at 5 minute intervals, giving validity to the findings(a small number of readings were discarded for flats A and C due to direct sun exposure –further detail is in section 3.2.4 of the Methods chapter).
The living room in Flat A experienced the highest temperatures for a larger proportion of thetime. The most frequent temperature is 21°C, however it is clear from the histogram that almostthe same amount of time is spent at 22°C – almost a fifth of the readings. Almost two thirds ofthe time the living room is between 21-22°C,and almost 70% of the time is spent at 21°C orabove. The temperature stayed within a range of 6.5°C and never dropped below 18°C. Theaverage temperature was 21.1°C.
Temperatures in the living room of Flat B were also fairly stable, with an even smallertemperature range of 5°C. The shape of the distribution curve is fairly similar to Flat A, but it isslightly flatter and centred around temperatures a degree or so lower, with a modes of 20-20.5°C and an average of 19.7°C. In contrast to Flat A, only 15.5% of the time was spent attemperatures of 21°C or above. This profile suggests little influence from either heating orventilation, which corresponds with information given in the interview, that the heating was onlyswitched on for the first time in the penultimate week of the study, and windows (and oftentrickle vents) remain closed throughout autumn and winter.
The distribution of temperatures in Flat C is quite different: although the bell-curve shape issimilar to the other 2 flats, it is significantly flatter and more skewed to the left, illustrating thewider range of temperatures particularly towards the lower end of the scale. The range isdouble that of Flat B at 10.5 degrees, and reaches temperatures as low as 12°C, albeit for avery small proportion of time. The extent of lower temperatures compared to the other 2 flatssuggests more frequent and prolonged window opening, as such low temperatures would notbe reached by fabric heat loss alone, especially since the heating was used almost every dayduring the study. Daily opening of windows from morning till evening was confirmed in theinterview. The distribution of higher temperatures is similar to Flat B, following almost the sameprofile on the right with only 12% of the time being spent at temperatures of 21°C and above.
In summary, the dominant picture to emerge from the histogram comparison is that Flat Aoccupants have a preference for warmer than average12 temperatures for most of the time, thatFlat B occupants live in slightly cooler but nevertheless comfortable temperatures for the vastmajority of the time – without the use of heating, and that Flat C experiences a high degree ofvariation in temperature, thought to be due to the combination of daily window-opening andheating use.
5.6.3 Living room temperatures differentiation by period of the day
The living room data was also analysed by time of day to gain more insight on daily patterns,with all readings being categorised into 'morning', 'afternoon', 'evening' and 'night'. The resultsare again presented in box and whisker format in Figure 24 below.
The split by period of day reveals that Flat A has the highest living room temperature regardlessof the time of day, whereas Flat C is only cooler than Flat B in the mornings and afternoons,with evening and night temperatures almost matching for the majority of the time (ie. theinterquartile range denoted by the coloured box). The overall range of temperatures in Flat Cremains the widest at all periods of the day, although in the morning period the difference inrange is reduced (except the very small number of readings at very low temperatures in Flat C).The afternoon period most closely represents the overall picture for all flats.
12 The desired living room temperature is assumed to be 21°C in SAP (DECC and BRE, 2013)
48

MSc AEES January 2014 Angela Lafferty
The evening temperatures in Flat A are high and restricted to the narrowest range, indicating ahigh level of control by the occupants to meet a higher temperature preference. The afternoonshave a fairly wide range and also reach the highest temperatures, perhaps indicative of thesolar influence in the south-facing room. By contrast however, the afternoons in Flat C aregenerally the coolest time of day, perhaps indicating that the window is more frequently open atthis time of day than any other.
Temperatures in Flat B's living room are fairly uniform throughout all periods of the day,indicative perhaps of a high degree of environmental control, considering that there was littlegas used for heating throughout the period. The afternoons however, appear to be the warmestperiod of the day with the highest maximum, mode and minimum temperatures of any timeperiod: unfortunately this is also a time of day when the occupants are out at work, andtherefore unable to enjoy it. This is indicative of this flat's strong relationship to outdoortemperatures, as well as the 'lightweight' nature of the construction being unable to retain anyheat until evening.
5.6.4 Living room temperature variation over duration of study
Finally, the average living room temperature data was analysed to chart its variation week byweek; the average evening living room temperatures were also plotted on the same graph tohighlight already suspected differences from earlier analyses. The average externaltemperature is also plotted – note that the scale for this is on the secondary Y-axis. The resultsare shown in Figure 25 below, and offer several interesting insights.
First, it can be seen that in all flats, the average evening temperatures are consistently higherthan the average daily temperatures over the 12 weeks, but to varying degrees: in Flat A theevening temperature deviates from the daily average as the study progressed, whereas in FlatB the two are very close until they begin to deviate only in the last week or so; in Flat C thedifference is highly variable and does not seem dependent on the timescale. Theseobservations seem to confirm previously noted hypotheses, namely the high effect of thecentral heating in the evening in Flat A, the non-use of heating until the last week of the study in
49
Figure 24: Box and whisker plot of average living room temperatures, split by period of the day.
NIGHT MORNING AFTERNOON EVENING OVERALL midnight – 6am 6am – noon noon – 6pm 6pm – midnight
25
24
23
22
21
20
19
18
17
16
15
14
13
12
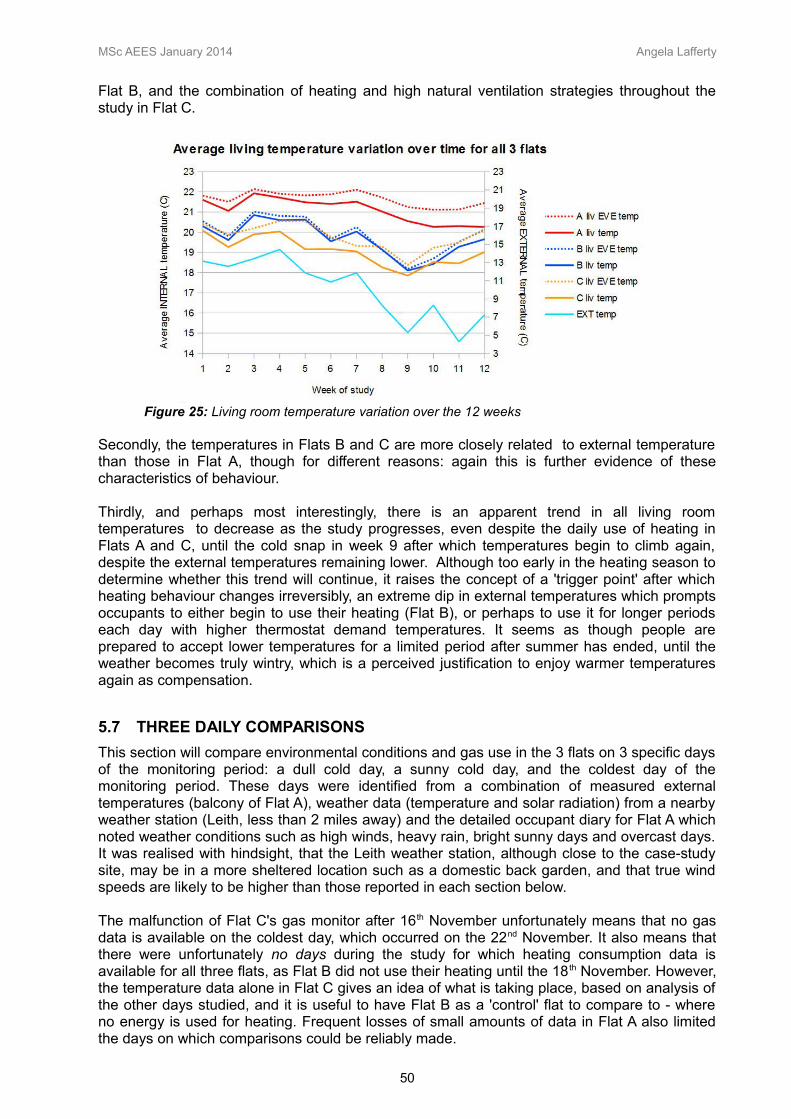
MSc AEES January 2014 Angela Lafferty
Flat B, and the combination of heating and high natural ventilation strategies throughout thestudy in Flat C.
Secondly, the temperatures in Flats B and C are more closely related to external temperaturethan those in Flat A, though for different reasons: again this is further evidence of thesecharacteristics of behaviour.
Thirdly, and perhaps most interestingly, there is an apparent trend in all living roomtemperatures to decrease as the study progresses, even despite the daily use of heating inFlats A and C, until the cold snap in week 9 after which temperatures begin to climb again,despite the external temperatures remaining lower. Although too early in the heating season todetermine whether this trend will continue, it raises the concept of a 'trigger point' after whichheating behaviour changes irreversibly, an extreme dip in external temperatures which promptsoccupants to either begin to use their heating (Flat B), or perhaps to use it for longer periodseach day with higher thermostat demand temperatures. It seems as though people areprepared to accept lower temperatures for a limited period after summer has ended, until theweather becomes truly wintry, which is a perceived justification to enjoy warmer temperaturesagain as compensation.
5.7 THREE DAILY COMPARISONS
This section will compare environmental conditions and gas use in the 3 flats on 3 specific daysof the monitoring period: a dull cold day, a sunny cold day, and the coldest day of themonitoring period. These days were identified from a combination of measured externaltemperatures (balcony of Flat A), weather data (temperature and solar radiation) from a nearbyweather station (Leith, less than 2 miles away) and the detailed occupant diary for Flat A whichnoted weather conditions such as high winds, heavy rain, bright sunny days and overcast days.It was realised with hindsight, that the Leith weather station, although close to the case-studysite, may be in a more sheltered location such as a domestic back garden, and that true windspeeds are likely to be higher than those reported in each section below.
The malfunction of Flat C's gas monitor after 16th November unfortunately means that no gasdata is available on the coldest day, which occurred on the 22nd November. It also means thatthere were unfortunately no days during the study for which heating consumption data isavailable for all three flats, as Flat B did not use their heating until the 18 th November. However,the temperature data alone in Flat C gives an idea of what is taking place, based on analysis ofthe other days studied, and it is useful to have Flat B as a 'control' flat to compare to - whereno energy is used for heating. Frequent losses of small amounts of data in Flat A also limitedthe days on which comparisons could be reliably made.
50
Figure 25: Living room temperature variation over the 12 weeks

MSc AEES January 2014 Angela Lafferty
The days selected for comparison are:
Tuesday 5th November: Dull cold day Thursday 7th November: Sunny cold dayFriday 22nd November: The coldest day
It should be understood throughout, that the living room and hall loggers only read to asensitivity of 0.5°C, and are therefore less accurate than the bedroom loggers with 0.1°Csensitivity. The discrepancy however is within ± 0.5 degree and is not deemed to be of anysignificance to the overall results (See Appendix A). The readings were at 5 and 10 minuteintervals (depending on logger type) but were averaged to give hourly figures, which alsomakes the curve smoother. No temperature data is available for Flat C's bedroom 2 after 15 th
October, and is therefore absent from the graphs below. Where no additional information isgiven in the diary assumptions are made based on interview answers (see Appendices C-E) forthermostat and TRV settings, door positions, and windows being open or closed. Thisinformation is used to help interpret and give a level of detail to the data interpretation.
All three flats were occupied on all three days, as we can tell from periodic gas (and electricity)use, as well as occupant diaries and interviews.
5.7.1 Tuesday 5th November – Dull cold day (Figure 26)
WeatherThe weather conditions for that day were described in the diary entry for Flat A as “Thick har(coastal fog) for much of day.” Data from the Leith weather station gives an averagetemperature of 3.9°C (ranging from 1.3 - 6.6°C), an average humidity of 99% (91-100%), anaverage wind speed of 1.4 km/h (0 – 12.9km/h), with gusts up to 22.5 km/h. The wind directionwas predominantly northerly throughout the morning (though it was generally very still)changing to a predominantly SW/WSW wind from around 4pm onwards. Figure 26 shows theexternal temperatures from Leith weather station as well as those logged from the balcony ofFlat A, which were slightly higher, probably due to the sheltered location and proximity to thebuilding. However, the overall profile is similar.
Flat A profile (see first graph, Figure 26):From diary: “Windows open v. briefly AM (condensation in bedrooms). Heating on at 9.10am.”Bedroom 2 was in use as a study room during the day by Amanda, with the door closed. Timand the youngest child were in the living room during the day (Tim off work due to back injury).
The temperatures in all rooms fell steadily throughout the night, the bedrooms slightly moreslowly: possibly due to sleeping occupant heat gains. There was some gas used for showeringin the early morning, then at 9:10am the heating was switched on, and the temperatures in allrooms began to rise until around 10am. The living room temperature rose by less than 1 degreewhereas the others all rose by around 1.5°C, due to their lower starting temperatures. All roomsreached 21°C except bedroom 2,which reached a higher temperature of 22°C: this is probablydue to the door being shut. Bedroom 2 also had a higher starting temperature, possibly due tobedroom door usually being almost fully closed overnight.
After 10am the temperatures began to drop, although the living room dropped least due tocasual heat gains including people, TV and cooking (or possibly less logger sensitivity). Theheating was then switched on again at around 1pm, taking all the rooms up back up to 21.5°C,except again, bedroom 2, reaching over 23°C. Casual heat gains then took the temperature tonearly 24°C. The room was then vacated around 5pm and the temperature dropped sharplyindicating the door being opened, and the slight rise in temperature of the hall and living roomshows that that they benefited from some of that heat. (in contrast to the master bedroom,which is not in the path of this heat flow). The temperatures dropped off again as eveningprogressed, but the heating was not used again. The living room temperature was fairly stableat around 20.5°C during the evening period.
51

MSc AEES January 2014 Angela Lafferty
52
Figure 26: Comparison of internal temperatures and gas usage in all 3 flats on a dull cold day – Tuesday 5th November.
Gas consum
p tion
Living
Hall
Mast.B
ed
Bed 2
Ext.tem
p LOG
GE
R
Ext. tem
p LEITH 0 2 4 6 8 10 12 14 16 18 20 22 24
Fla
t C: T
ue
s 5
th N
ov
em
be
rD
ull cold day
Time of day
12 13 14 15 16 17 18 19 20 21 22 23 24
Fla
t B: T
ue
s 5
th N
ov
em
be
rD
ull cold day
Time of day
12 13 14 15 16 17 18 19 20 21 22 23 24
Fla
t A: T
ue
s 5
th N
ov
em
be
rD
ull cold day
Time of day
Internal temperature (degrees C)
21 kWh
Tot 33
kW
h0 kW
hTo
t 3 k
Wh
28 kWh
Tot 38
kW
h

MSc AEES January 2014 Angela Lafferty
Flat B profile: (see second graph, Figure 26):From diary/interview: Both occupants at home: holiday from work. The heating had not yetbeen switched on for the season and therefore all gas used was for cooking or HW only.
The living room was the coolest room throughout the whole day. The bedroom temperaturesrose as outside temperatures began to rise, but by less than 1 degree, while the living roomonly rose by half a degree by peak outside temperature, at around 2pm. Again however, thiscould be partly an issue of lack of logger sensitivity. The living room temperature rose again inthe evening, due to cooking and presence of both occupants, as well as other casual heatgains such as the TV; the rises in the hall and bedroom 2 temperatures are not immediatelyexplainable, but could be due to heat migrating from the open living room door (always proppedopen), with the heat flow possibly induced by trickle ventilation, whereby bedroom 2 iseffectively 'pulling' warm air from the living room. The temperatures may also have increaseddue to lighting heat gains, particularly in the hall where there are 4 spotlight bulbs.
It is interesting that the master bedroom is the warmest room for much of the day, given that itwas the coolest room on average for the whole study period, perhaps suggesting that this roomis being occupied throughout the day. As Flat B is effectively a 'control' flat showing how thebuilding works without heating, it seems there is little time lag between outdoor and indoortemperatures, further evidence of low thermal mass in the structure.
Flat C profile: (see third graph, Figure 26):From diary/interview: Occupied during the day by Becky and her son, and possibly her grown-up daughter too (unknown).
Similarly to Flat B, it is the master bedroom which is the warmest room, which is at odds withthe window being open continuously, as described in the interview. Bedroom 2, however couldhave been the warmest room (but data is missing). The living temperature is the lowest formost of the day.
The heating is used early in the morning, when Michael is getting ready for work, and raises allroom temperatures by between 1-1.6°C, however the rooms do not all reach the sametemperature (as in Flat A). The temperatures begin to drop, due to the heating being turned offand probably the windows being opened. There is some gas use at around 11am which resultsin temperature rises, indicating that the heating may have come on accidentally, perhaps due toMichael having not turned it down far enough when he left for work - we know from theinterview that the heating is switched 'on' and 'off' by manually turning up and down thethermostat, and that Becky very rarely switches the heating on.
At around 5.30-6.00pm the temperatures begin to rise steeply again, indicating that the heatingis being used (when Michael returned from work). The living room and hall temperatures thencontinue to rise until around 10.30pm, (with around 13 kWh gas use) whereas the masterbedroom reaches a peak of 19.6°C much earlier, at around 7pm. This indicates that the lowTRV setting of 1 has stopped the hot water flow to the radiator, or that it is continuing to heatbut the open window is lowering the temperature overall. The living room temperature climbs by3.5°C, partly contributed to by cooking and casual gains, finally reaching the set-point of 20°Cat around 9pm.
ComparisonIt is clear that Flats A and C used the central heating at various points in the day, but that theliving room in Flat C has significantly lower temperatures and higher variation than Flat Athroughout the day. However both flats experience similar temperature of 20.5°C in the lateevening. Flat A's habit of closing the living room door could be having the effect of keeping thetemperatures in that room higher than they would have been, perhaps by 'blocking' the tricklevent cross ventilation path and therefore reducing ventilation heat loss, as well as naturalconvection currents.
53

MSc AEES January 2014 Angela Lafferty
54
Figure 27: Comparison of internal temperatures and gas usage in all 3 flats on a sunny cold day – Thursday 7th November.
Hourly G
as (kWh)
Ext. tem
p LEIT H
Ext.tem
p LOG
GE
R
Living temp.
Hall tem
p.
Mast.B
ed temp.
Bed 2 tem
p.
0 2 4 6 8 10
12
14
16 18 20
22
24
Fla
t C: T
hu
rs 7
th N
ov
em
be
rS
unny cold
da
y
Time
of d
ay
12
13
14 15 16
17
18
19
20 21 22
23
24
Fla
t B: T
hu
rs 7
th N
ov
em
be
rS
unny cold
da
y
Time
of d
ay
12 13 14 15 16 17 18 19 20 21 22 23 24
Fla
t A: T
hu
rs 7
th N
ov
em
be
rS
unny cold
da
y
Time
of d
ay
Internal temperature (degrees C)
18 kW
h(To
t. 33 kW
h)
0 kWh
Tot 3
kW
h
? kW
h
30 kWh

MSc AEES January 2014 Angela Lafferty
It is interesting to note that the temperature in Flat B never falls below 18°C, despite using noheating. This indicates that internal heat gains are equal to losses at this internal-externaltemperature difference of 12-14°C, or rather, at an average external temperature of 4-6°C.Overnight (between midnight and 6 am), the heat losses are much greater in the two flats usingheating, partly because the temperature difference to outside is greater – certainly in Flat A, butalso due to a much higher ventilation rate – certainly the case in Flat C.
5.7.2 Thursday 7th November – Sunny cold day (Figure 27)
Again, all 3 flats were occupied for most of the day.
WeatherThe weather conditions for that day were described in the diary entry for flat A as “Bright andsunny; freezing wind.” Data from Leith weather station gives an average temp of 7°C (rangefrom 4.3-9.2°C), average humidity of 87% (range 65-100%), average wind speed of 7.1km/h(range from 0-20.9km/h,and gusts up to 46.7km/h. The wind direction was predominantlynortherly throughout the day (a third of the time), though very mixed and a significant portion ofSW (WSW-SSW) winds too. The temperatures logged from the balcony of Flat A were againslightly higher than Leith, though the profile was a closer match than on the 5th.
Flat A profile: (see first graph, Figure 27):The temperatures in all rooms fall steadily overnight; bedroom 2 is a degree warmer than themaster bedroom, which is over a degree warmer again than the living room. At around 8am, theliving room and hall temperatures begin to rise along with outside temperatures, and solargains, whereas the bedrooms continue to fall until much later, when the heating is switched onat around 3pm. The living room door may have been closed at around lunchtime, as the halltemperature stops rising when the living room continues to rise to over 21°C by 3pm. However,bedroom 2 was being used as a study room by Amanda again that day, so despite a verycomfortable temperature in the living room (occupied by Tim and his daughter), the heating wasswitched on to raise the temperature in Bedroom 2, which was 20.5°C. The living room thenreached a peak (of 22.5°C) before the other rooms, possibly due to the TRVs switching offbefore the hall thermostat reached the set temperature, or the living room door being opened toget rid of excess heat to the hall. The heating was used again in the evening around 7pm(although some of the gas use at this time was for the children’s' bath), however the living roomdid not heat up as quickly as other rooms, barely rising at all. This is perhaps indicative of thehigher fabric and infiltration heat losses in this room compared to the others.
Flat B profile: (see second graph, Figure 27): One occupant at home during the day. The heating was not used at all over the whole day, andhad not yet been switched on for the season. The living room temperature is, again, the lowestof the flat. As in Flat A, the living room and hall temperatures begin to rise at around 8am as thesun rises, as does that of bedroom 2, indicating that both doors are open. However the masterbedroom temperature remains fairly static, untouched by solar heat gains. Temperatures fellagain between 2-5pm, as the sun got lower in the sky and then set, however the temperaturesrose again slightly in the evening, to reflect cooking. The master bedroom temperature onlybegan to climb at around 8-9 pm, when it is assumed that either one or both occupants were inthe room, with the lights and TV on. The living room temperature peaks at 19°C during the day,and falls from 18.5°C to 17.5°C over the evening period. The hall has the highest temperature,perhaps due to the combination of benefiting from solar heat gains and losing least heatthrough fabric losses.
Flat C profile: (see third graph, Figure 27): Again, the living room is the coldest room overnight, and the heating appears to have been lefton (ie. the thermostat not turned down low enough to avoid it coming on by itself). The heatingcomes on again in the morning when Michael gets ready for work, and again the masterbedroom reaches the highest temperature, despite the bedroom window being open. It is
55

MSc AEES January 2014 Angela Lafferty
possible that some of this heat gain could be a result of Michael showering in the ensuiteand/or possibly the use of a hair-dryer.
It is not very clear what happens during the middle part of the day: the temperatures in allrooms seem to hover around the 18.5°C mark, the hall and master bedroom most stable whilethe living room peaks and troughs between 18°C and 19°C from roughly 9-5pm. This patternseems to suggest that the heating thermostat was not turned down low enough to avoidswitching on when the open windows lowered the temperature sufficiently, and was not noticedat any point during the day. The constant gas use throughout to day seems to support thistheory, however there could be another explanation.
The living room temperature does continue to rise in the morning after the others have stopped,suggesting there is some solar heat gain effect, despite the window being open and the blindsclosed, or this could simple reflect occupancy-related gains. Again, the heating is put on whenMichael returns home form work, and all temperatures begin to rise again. As on the 5th
November, the master bedroom temperature stops rising much earlier than the others, andbegins to fall again, indicating the window remaining open while the others are all closed for theevening. The living room temperature climbs from 17.5°C to 20.5°C over the evening period.
ComparisonThe flats showed little difference in amounts of gas used for heating between the dull day andthe sunny day, however it is difficult to compare because the sunny day was also significantlymore windy, which could have caused both fabric and ventilation heat losses to outweigh thesolar gain. In addition, the heating figures (in red) are only estimated, and such broadconclusions cannot be drawn by comparing 2 single days.
The effect of solar gain is noticeable on the daily graphs, however it is difficult to quantify.Looking at Flat B again as a control flat (without heating or significant ventilation) it is clear thatthe sun was able to raise the living room temperature by 2°C - particularly clear whencompared with the previous graph for the dull day. In Flat A the rise is about 2.5°C, possibly dueto the living room door being closed, and the peak temperature is higher because of the higherstarting temperature. If bedroom 2 had not been occupied that day, and occupancy restrictedmainly to the living room (as it often is) it is likely that the occupants would not have switchedthe heating on. However, they did decide to switch it on in the evening, despite temperatures of20.7°C or above in all the rooms, thereby negating much of the beneficial effect
In Flat C, however, it seems that the flat does not benefit from the sun's heat, because of theshading by the blinds, and being lost through the open windows.
5.7.3 Friday 22nd November – Coldest day (also sunny)
WeatherThe weather conditions for that day were described in the diary entry for Flat A as “Very sunny.”Data from Leith weather station gives an average temp of 2°C (range from -0.4 to 4.2°C),average humidity of 88% (range 66-92%), average wind speed of 0.5 km/h (range from 0-4.8km/h,and gusts up to 11.3 km/h. The wind direction was evenly split between N and SW fortwo third of the day. The temperatures logged from the balcony of Flat A were significantlyhigher than those from Leith, though the profile still matched - it may have been slightly sunnierat the case-study site however the radiant heat from the building proximity was probably havingan effect.
Flat A profile: (see first graph, Figure 28):The temperatures in all rooms fell steadily overnight, by 2 degrees for the bedrooms and hall,and 3 degrees for the living room: further evidence of higher heat loss in this room. At sunrise,the living room temperature began to rise rapidly, from 18°C to 22°C over the course of the
56

MSc AEES January 2014 Angela Lafferty
daylight hours. Almost all of the solar gains were kept in the living room by closing the door, andthe other room temperatures continued to fall throughout the day, until the heating wasswitched on at 5pm for the first time that day. Despite the occupants usual thermostat set-pointof 22C, it is clear form the graph that none of the spaces reach this temperature, except for theliving room very briefly. It is thought this may have to do with the occupants often manuallyturning down the thermostat after the space is felt to have heated up, instead of leaving theheating on for the whole evening to maintain a more steady temperature.
By making use of solar gain in the living space, the occupants avoided using any heating untilthe evening. No heating was used in the morning before sunrise, most likely because Amandaand the children were not awake before this time, and Tim simply 'put up' with the lowertemperatures while getting ready for work. It is not clear, however, that making use of the solargain in this way actually saved any evening heating, because of the higher drop intemperatures in the other rooms, which then had a higher-than-normal climb of around 4°Cback up to 'comfortable' temperatures.
Flat B profile: (see second graph, Figure 28):The occupants of Flat B had by this point begun using their central heating system, due to thecolder weather. The heating is used early in the morning, while Rachel is getting ready for work.It is immediately clear that the TRV in bedroom 2 is set too high, particularly as it is unoccupied,as it heats up the most quickly, to the highest temperature, peaking at over 22°C. The livingroom heats up the least, indicating inadequacy of the radiators to cope with the much higherheat losses in this room.
The living room temperature continues to rise, however,once the heating has gone off, althoughmuch less dramatically than in Flat A, indicating that the door is open. The bedroomtemperatures both fall throughout the day, while the hall temperature rises slightly after an initialdrop, indicating that is is receiving some of the solar heat gain. The living room temperaturefalls the most quickly once the sun has gone, again evidence of higher heat losses, and heatsup by only half a degree when the heating is switched on compared to 2 degrees in bedroom 2,despite cooking and casual gains.
This flat used an estimated 27% less gas than Flat A on this day, despite a thermostat setting ofonly 0.5°C lower, and using the heating in the morning as well as in the evening. The eveningtemperatures of all the rooms are in fact slightly higher in Flat B, with the exception of the livingroom, which is about 1.5-2°C lower in Flat B. A key factor in the overall higher temperaturesdespite lower gas use maybe lower ventilation (closed trickle vents) but also the much smallertemperature differences, which cause the heating system to work much harder in Flat A.
Flat C profile: (see third graph, Figure 28):No gas data is available for Flat C on this day, however the temperatures themselves tell a afascinating story. Heat loss overnight is dramatic, particularly in the living room where it dropsalmost 5.5°C between midnight and about 6am when the heating comes on. It is fairly clearfrom the graph that the heating does not accidentally come on throughout the day, as is thoughtto be the case on Thursday 7th.. Again though, there does not appear to be much benefit fromthe solar gain, with the living room temperature fairly stable at 18.5C indicating that the gainsare matched by the ventilation losses. At the time of the heating being switched on in theevening, the temperatures in all rooms are between 17°C and 18°C, compared to 19° and 20°Cin Flat B.
This is worth noting, as the thermostat setting in Flat C is only 20C, so if the occupants hadkept windows closed during the day to take advantage of the free solar heat, they may not haveneeded to use the heating in the evening. One key issue though, is that without heating, theliving room temperature seems to fall more rapidly than in other rooms – in all the flats – whichis at odds with the requirement for this to be the warmest room for evening occupation.
57
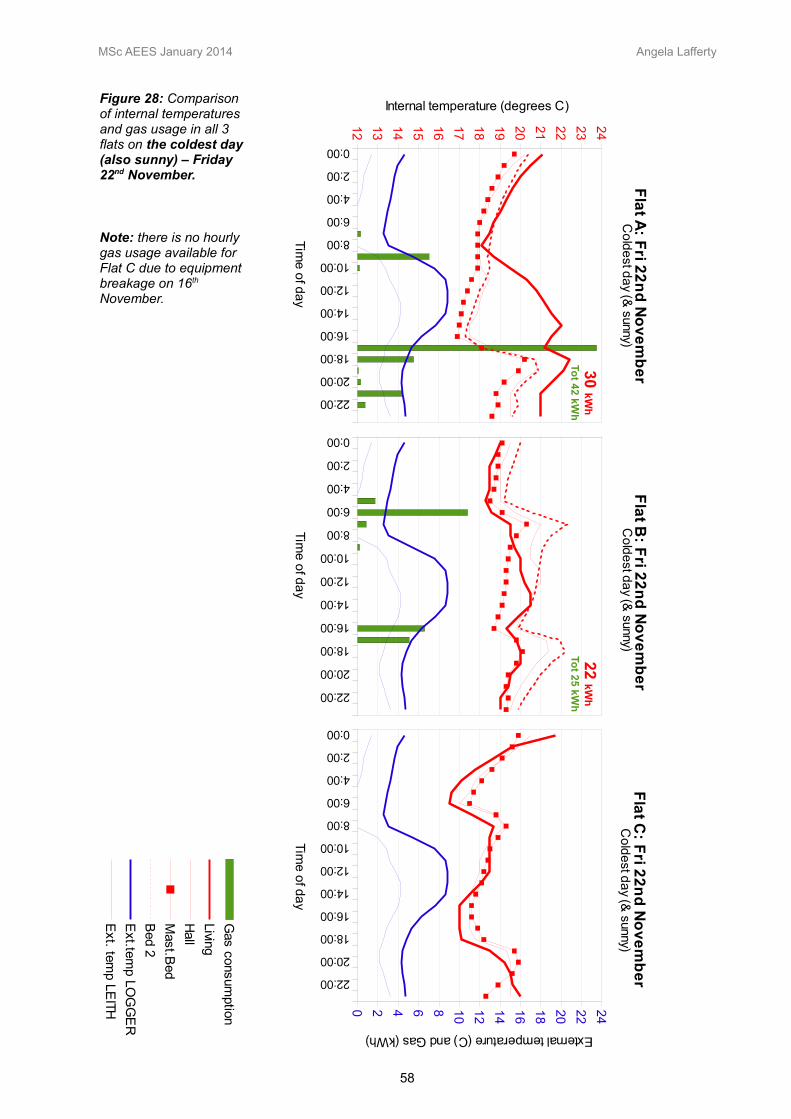
MSc AEES January 2014 Angela Lafferty
58
Figure 28: Comparison of internal temperatures and gas usage in all 3 flats on the coldest day (also sunny) – Friday 22nd November.
Note: there is no hourly gas usage available for Flat C due to equipment breakage on 16th November.
Gas consum
p tion
Living
Hall
Mast.B
ed
Bed 2
Ext.tem
p LOG
GE
R
Ext. tem
p LEITH 0 2 4 6 8 10 12 14 16 18 20 22 24
Fla
t C: F
ri 22
nd
No
ve
mb
er
Co
lde
st da
y (& sunny)
Time
of d
ay
12 13 14 15 16 17 18 19 20 21 22 23 24
Fla
t B: F
ri 22
nd
No
ve
mb
er
Co
lde
st da
y (& sunny)
Time
of d
ay
12 13 14 15 16 17 18 19 20 21 22 23 24
Fla
t A: F
ri 22
nd
No
ve
mb
er
Co
lde
st da
y (& sunny)
Time
of d
ay
Internal temperature (degrees C)
30 kW
hTo
t 42 kW
h22
kWh
Tot 2
5 kWh

MSc AEES January 2014 Angela Lafferty
5.8 RELATIVE HUMIDITY (RH)
Although RH was not analysed in detail, some general observations can be made from therecorded data, focussing again on the living room only.
In Flat A, the relative humidity averaged 58.6% over the whole monitoring period. There waslittle variation when split by period of the day, ranging from an average of 57.8% in theafternoons to 59.9% in the evenings. The RH remained within the comfort range of 40-70%(McMullan, 2007) for the vast majority of the time: the lowest recording was 43.5%, but therewere 129 readings (out of 23,027) where RH exceeded 70%, which represents less than 0.6%of the total time. These few instances occurred when the temperatures were also high, andalways in the evenings, suggesting the moisture levels were briefly increased due to cooking,and perhaps drying washing on radiators. This flat does frequently experience condensation onwindows in winter.
In Flat B, the average RH was slightly higher than Flat A, at 65.3%. Again, there was very littlevariation at different periods, averaging 64.9% in the afternoons and 65.7% in the evenings.The lowest recorded RH was 52.5%, but a significant period – almost a fifth - of the total timewas spent at RH levels above 70%, peaking at 79%. These elevated levels were found in alltime periods, and not restricted to evenings as in Flat A. The occupants also reported frequentcondensation on the windows. The implications are that the flat is not adequately ventilated,despite the mechanical extract being on continuously (see interview transcript) with the result ofpossible poor air quality (high concentration of CO2) or mould growth and perhaps interstitialcondensation. The trickle vents remain closed much of the late autumn and winter, and it maybe that the extract is not functioning correctly because of a lack of supply air from the tricklevents.
Flat C had the lowest levels of RH in general, probably due to the much higher influx of colder,drier air from outside. The average was 58%, ranging from an average 57.1% in the afternoonsto 59.1% in the evenings. The RH did dip below 40% on a handful of occasions all on the sameday (22 Nov), equal to less than 0.2% of the total monitored time. RH levels also exceeded70% for around 3.3% of the time, peaking at 76%. As in Flat B, the excessive RH levels werescattered between all time periods of the day, meaning specific causes cannot be suggestedwithout further investigation and analysis. Both adults' responses in the BUS survey indicatedthat they found the air to be quite dry in winter, and they reported in the interview that their flatdid not experience condensation on the windows.
5.9 BUS SURVEY RESULTS – OCCUPANT SATISFACTION
The adult occupants of the flats were asked to fill out an occupant satisfaction survey, using theBUS (Building Use Studies) Methodology format (Leaman, 2013). The survey covered manyaspects of occupant satisfaction in some detail, and the results are too numerous to bepresented here, however the overall summary results are shown in Figure 29, and key resultsrelating to winter temperatures and heating control in Figure 30. (Note - Some further resultsfrom the BUS survey are in Appendix M, but to view the full set of results please visit:http://www.usablebuildings.co.uk/1317/).
It can be seen that overall, occupants of these three flats are fairly satisfied with all aspects oftheir homes (the slider bars use traffic light colours to denote satisfaction scores in relation tobenchmarks). It is important to remember that occupant satisfaction is not solely based ontemperatures experienced in the home, however thermal comfort is a major factor.
Occupants feel they have fairly good control of the heating system, are in general quitecomfortable with winter temperatures overall, however one occupant rated winter temperaturesas too cold – this was Rachel in Flat B, which suggests that she would prefer her flat to bewarmer. The responses relating to variation of temperature are mixed, which initially seems to
59

MSc AEES January 2014 Angela Lafferty
60
Temperature in winter - overall Temperature in winter – too hot/cold
Control of heating system Temperature in winter – stable/varies
Figure 30: Key results - temperature and heating
Figure 29: Summary of overall BUS methodology survey results

MSc AEES January 2014 Angela Lafferty
correspond with the actual measured data, except that Flat C occupants scored 4 and 5,whereas Flat B occupants scored 2 and 7. This highlights the fact that perception oftemperatures depends highly on the activity being undertaken; while for example, thetemperature in Flat C varies significantly over a 24 hour period, activity levels are higher duringthe day when windows are open and temperatures cooler, but lower in the evening when theactivity may be watching TV with the heating on, so comfort is maintained throughout. The starkcontrast in Flat B occupants' scores is surprising; Rachel's score of 7 (high variation) couldindicate a high sensitivity to changes in temperature.
5.10 ENERGY AND CO2 BENCHMARKING
The flats in the case-study are relatively new, at around 6 years old, in comparison to themajority of the UK's housing stock. It has already been established (in section 5.5) that the flatsare almost certainly in Band B in terms of energy-efficiency rating, which makes them 'low-carbon' homes on paper at least. To determine whether or not they perform substantially betterin reality, annual consumption figures were plotted against a selection of regional and nationalfigures in a bench-marking exercise (Figure 31 below).
All the flats use less gas than the all of the benchmark figures: compared to the nationalaverage, Flat A uses less than half, Flat B uses just over a quarter and Flat C uses around 59%of the national average; and when compared against other 3-bedroomed purpose-built flats ofroughly the same age they use 33%, 64% and 15% less respectively. In terms of electricity, FlatA uses only half the UK average, Flat B uses 15% less while Flat C uses around 7% more. It isclear that the higher energy-efficiency of the flats has a substantial impact in reducing gasconsumption, there is predictably no effect on electricity consumption.
61
Figure 31: Case-study flats' annual energy consumption, in relation to national figures
NOTES : - Flats A, B and C annual gas is averaged over 5 years (2008-13). Annual electricity is crudely calculated by multiplying the 3-month monitored total by 4.- NEED (National Energy Efficiency Database) figures are for England, based on weather-adjusted 2011 figures (DECC, 2013c)- 'Local area' is Middle Layer Super Output Area (Intermediate Geography Zone/Scot) – weather-adjusted 2011 DECC figures (Rogers, 2012)
Flat A Flat B Flat C Post-1999 purpose-built 3-bed f lats (NEED)
All purpose-built 3-bed f lats (NEED)
All dw ellings (NEED)
Local area (DECC)
UK – all dw ellings (DECC)
0
2000
4000
6000
8000
10000
12000
14000
16000
70
75
38
36
88
98
10
51
4
10
34
2
15
10
0
10
09
9
14
89
8
23
64
40
00
50
28
32
86
35
09
42
00
33
59
47
09
Benchmarking: Annual gas and electricity figures
gas
elec
kWh

MSc AEES January 2014 Angela Lafferty
If we consider annual CO2 emissions for each flat (Figure 32), it becomes clear that thebreakdown between gas and electricity use has a major effect because of electricity's muchhigher carbon intensity. Even though Flat B uses the least energy overall, over half of it is in theform of electricity which means its CO2 emissions are actually higher than those of Flat A. Thealmost equal ratio of gas to electricity use in Flat B is unusual, and is a result of this couple'svery careful use of heating, rather than an above average consumption. The factor of differencebetween the highest and lowest emitting household is 1.64. However, the carbon intensity ofelectricity will be drastically reduced in the years ahead with the increase of renewablegeneration, which would mean that even if all 3 flats continued to use exactly the same amountof both fuel-types as they do now, that their annual CO2 emissions would change relative toeach other. For this reason, it is clear that the focus should be on reducing household energyconsumption rather than CO2 per se. The annual CO2 emissions are shown alongside theaverage UK household figures for 1990 and 2009/10 – Flat A's emissions are just over half thenational average for 2009/10, whereas Flats B and C emit 46% and 16% less respectively. The1990 figure is shown for illustrative purposes only, as they cannot be truly compared due to the20% fewer households in 1990 (DECC, 2013d).
It is also interesting to briefly look at the energy costs of the three flats, again because of thedifference in cost of 1 kWh of electricity compared to 1kWh of gas. The same unit costs wereused for all flats to allow comparison, however it is likely that each flat will be paying differentunit costs as well as receiving discounts such as dual-fuel or prompt payment, depending onsupplier.
Assuming a cost per unit of 4p for gas, plus 30p/day standing charge, and a unit cost of 14p forelectricity plus 18p/day standing charge, the annual energy costs for each flat are shown inFigure 33 below. They correlate reasonably well with the figures given in the occupants'interviews (see transcripts – Appendix C-E), although they are perhaps underestimated forFlats A and C and overestimated for Flat B, who do receive dual-fuel and direct-debit discounts.The rough nature of the annual electricity calculation (multiplying 3-months measured use by 4)is also perhaps skewing the costs somewhat.
62
Figure 32: Annual CO2 emissions for each flat, with 1990 and 2009/10 benchmarks
NOTE: Calculated on the basis of 0.216 kgCO2/kWh gas, and 0.519 kgCO2/kWh electricity, from SAP 2012 (DECC & BRE, 2013)
Flat A Flat B Flat C 1990 CO2/hh
2009/10 CO2/hh
0
1000
2000
3000
4000
5000
6000
7000
8000
elec
gas
kgC
O2

MSc AEES January 2014 Angela Lafferty
It can be seen that there is a relationship between financial costs and CO2 emissions, which intheory is a good incentive to favour use of less carbon-intensive gas over electricity, howeverthis does not really happen in practice, as one cannot substitute the other in an existinghousehold. It does however drive the installation of gas central heating rather then electricheating whenever practical. Again, this is a situation that may change in the future with the de-carbonisation of electricity.
Metrics of comparison
As was highlighted in the literature review, energy use and CO2 emissions cannot be comparedbetween different dwelling types and sizes if measured in absolute terms, therefore figures areoften given in a per unit area format, such as kWh/m2 in SAP. This unit of measurement is alsoflawed however, as larger properties can thus appear more energy-efficient even: for example alarge house 'under-occupied' by just 2 people will probably consume far more energy than asmall flat with 4 occupants, but may use less when normalised for floor area (Aldossary et al,2014a). It could be considered more equitable to measure consumption on a per capita basis,or by using both floor area and occupancy to normalise the absolute figures.
Table 6 below compares the variables discussed in this study, using the different metricsproposed above, to illustrate the complexity of reporting household energy and CO2 figures.The figures are compared for each of the three flats, with those highlighted in green being thelowest in that category. Where the lowest total energy, gas and space-heating consumer is FlatB when measured in either kWh or kWh/m2, it becomes Flat A when the number of occupants istaken into account.13 Attention is drawn in particular to the 'regulated energy' figures, whichbecome the same for Flats A and B when reported in terms of kWh/m2/person, and also similarto Flat C. This is could be argued to be a fairer way of reporting household figures, as it doesnot penalise those with larger families who are actually living more efficiently by using lessspace.
This form of reporting will be discussed again the context of personal carbon allowances(PCAs) and SAP/ EPCs in the next chapter.
13 It may be debated whether young children should be counted the same as adults, however it was deemed that the additional energy use associated with their bedroom lighting and heating, extra electricity used for additional clothes, sheets and towels washing, more frequent dishwasher use, the higher gas use for hot water and cookingdoes qualify them as additional occupants. Indeed SAP makes no distinction in its use of occupancy data from the English House Survey to derive its occupancy to area relationship (Henderson, 2008).
63
Figure 33: Annual energy costs per flat (assuming same unit costs andstanding charges)
Flat A Flat B Flat C
0
200
400
600
800
1000
1200
1400
£789 £889 £1
,235
Annual energy costs per flat
gas
elec
Total cost
Co
st i
n £
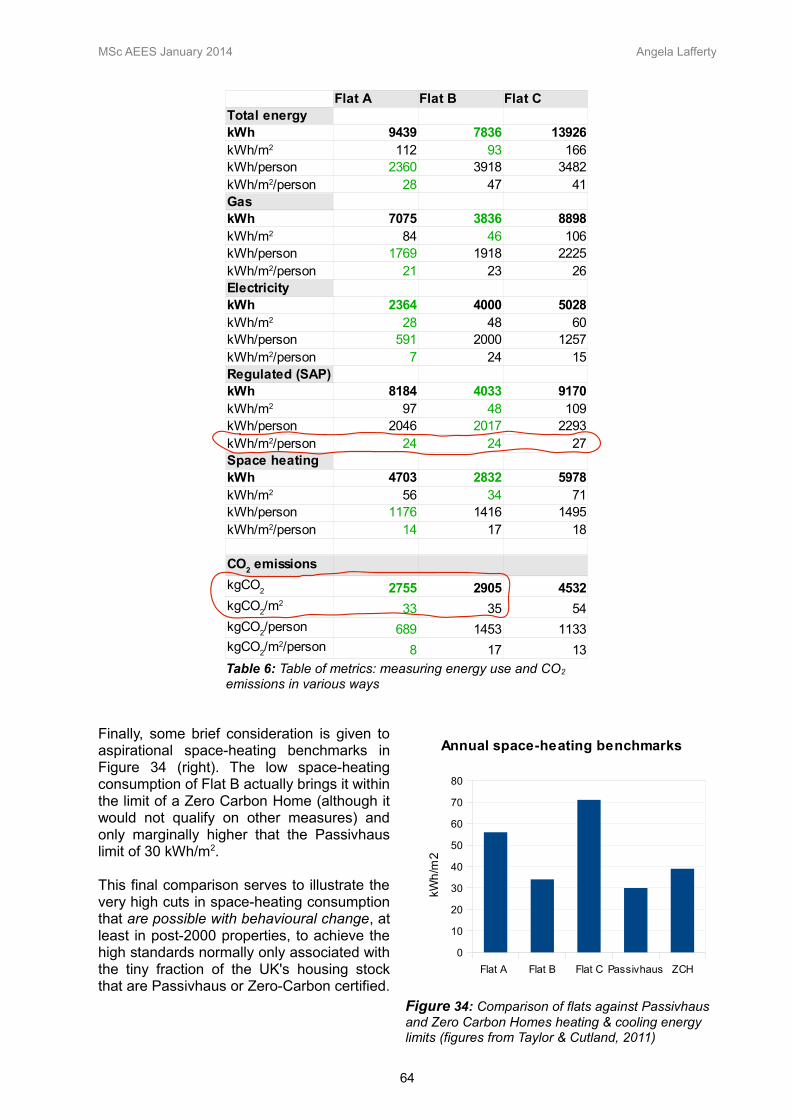
MSc AEES January 2014 Angela Lafferty
Finally, some brief consideration is given toaspirational space-heating benchmarks inFigure 34 (right). The low space-heatingconsumption of Flat B actually brings it withinthe limit of a Zero Carbon Home (although itwould not qualify on other measures) andonly marginally higher that the Passivhauslimit of 30 kWh/m2.
This final comparison serves to illustrate thevery high cuts in space-heating consumptionthat are possible with behavioural change, atleast in post-2000 properties, to achieve thehigh standards normally only associated withthe tiny fraction of the UK's housing stockthat are Passivhaus or Zero-Carbon certified.
64
Figure 34: Comparison of flats against Passivhaus and Zero Carbon Homes heating & cooling energy limits (figures from Taylor & Cutland, 2011)
Flat A Flat B Flat C Passivhaus ZCH
0
10
20
30
40
50
60
70
80
Annual space-heating benchmarks
kWh
/m2
Table 6: Table of metrics: measuring energy use and CO2 emissions in various ways
Flat A Flat B Flat CTotal energykWh 9439 7836 13926
112 93 166kWh/person 2360 3918 3482
28 47 41GaskWh 7075 3836 8898
84 46 106kWh/person 1769 1918 2225
21 23 26ElectricitykWh 2364 4000 5028
28 48 60kWh/person 591 2000 1257
7 24 15Regulated (SAP)kWh 8184 4033 9170
97 48 109kWh/person 2046 2017 2293
24 24 27Space heatingkWh 4703 2832 5978
56 34 71kWh/person 1176 1416 1495
14 17 18
2755 2905 4532
33 35 54
689 1453 1133
8 17 13
kWh/m2
kWh/m2/person
kWh/m2
kWh/m2/person
kWh/m2
kWh/m2/person
kWh/m2
kWh/m2/person
kWh/m2
kWh/m2/person
CO2 emissions
kgCO2
kgCO2/m2
kgCO2/person
kgCO2/m2/person

MSc AEES January 2014 Angela Lafferty
CHAPTER 6 – DISCUSSION
6.1 INTRODUCTION
Following the initial summary of the key findings, this chapter will be split into three distinctparts: firstly, it will look at the motivations behind occupant behaviour, namely seeking thermalcomfort and formation of habits, and will deal with each aspect of thermal comfort in turn. Asummary of feedback will be given for each flat. Secondly, the discussion will broaden to awider context, and consider some of the reasons behind the lack of behavioural change in theresidential sector. The third section will put forward solutions which are considered to have thepotential to induce the necessary shift in energy consumption behaviour, required to meet theUK CO2 reduction targets.
Summary of key results
Several key behaviours were identified with increasing space-heating energy use in this case-study: in Flat A an apparent preference for higher temperatures more of the time was thedominant factor, and in Flat C, the high frequency and duration of winter window openingresulted in much higher ventilation heat losses than the other 2 flats. Despite the fairly lowannual gas use in Flat B, the heating of unoccupied rooms means that energy is being usedunnecessarily.
In absolute terms, these differences in behaviour translated to a factor of 2.1 difference inidentical flats, with the most strictly controlled parameters of any study to date between thehighest and lowest annual space-heating consumption; however, this does not give a clearpicture in terms of overall energy use and CO2 emissions: indeed, this small study showed avery diverse range of behaviour which showed no correlation between gas and electricity use.Due to the differing carbon intensity of gas and electricity, the breakdown in household use hada high impact on that household's CO2 emissions. For example Flat B's careful use of gas didnot transfer to their use of electricity, and as a result their carbon emissions were higher thanFlat A's. Furthermore, depending on the metric used to report energy and CO2 emissions, thelabelling of 'high' and 'low' users changes dramatically. For instance, Flat B were the lowestoverall energy users, but when considered on a per person basis, they consumed the most.Indeed, the SAP occupancy assumption for this size of dwelling is about 2.5 (Henderson,2008), which highlights the point. The interest in comparing these various metrics, is related toa number of potential 'solutions' discussed further below.
A further issue is that emerges is the difference between energy and CO2. It is clear that while itis the CO2 emissions that we need to reduce, the focus should nevertheless be on reducingenergy. As we see from the study, the lowest energy user did not have the lowest CO2
emissions, however this relationship will change with the de-carbonisation of the grid. Tounderstand how to target policies and guidance to reduce household CO2 emissions, we mustfirst understand the main drivers in occupant space-heating behaviour.
The only real option to reduce space-heating energy demand of buildings of this age group, inthe short term at least, is behavioural change, as large scale fabric improvements to increaseairtightness, reduce u-values and cold bridging are not likely to be undertaken for decades.
6.2 WHAT INFLUENCES AND MOTIVATES BEHAVIOUR?
There are any number of factors which can influence our decisions in regulating our internalenvironments, but the main themes which emerge from this study, and backed up by theliterature, are the act of seeking thermal comfort, and quite simply the habits we have formed.
6.2.1 Thermal comfort
It can be seen from the BUS occupant survey results (Chapter 5, section 5.9), that alloccupants are on the whole reasonably satisfied with their homes, and have thus been
65

MSc AEES January 2014 Angela Lafferty
successful in controlling their internal environments to satisfy their own comfort needs.
We have seen clear differences in measured temperatures between the flats, as well asdifferences in stated thermostat settings; surprisingly, the flat with the highest gas use also hadthe lowest average room temperatures. However, air temperature is only one of the 6 factorsaffecting thermal comfort (as outlined in Chapter 2 – Literature Review, section 2.4), and it isclear that the other factors are affecting comfort levels and resulting energy use.
Mean radiant temperature
Mean radiant temperature (MRT) is defined as “the temperature of a black sphere at the pointin question that would exchange no net radiation with the surroundings”...“and can have adistinct directionality, such as when there is a radiant heater, a cold window or direct sunlight”(CIBSE, 2013). It is an important factor in thermal comfort, as the cooler the surface, the moreheat is lost to it from the human body through radiation. Highest comfort is felt when MRT andair temperature are similar, with an MRT of 3 degrees less than air temperature resulting in a'stuffy' sensation (McMullan, 2007). No surface temperatures were measured as part of thisstudy, and therefore the mean radiant temperatures of the rooms cannot be calculated.However, some hypotheses may be put forward based on both quantitative and qualitative datathat was gathered.
In Flats A and B, there was little window opening during the monitoring period, particularly fromthe start of October onwards. Flat A's occupant diary recorded only rare occurrences of 'brief'window-opening, for moisture removal purposes after particularly heavy showering, and FlatB's interview revealed that the windows had not been opened at all since early October. Assurface temperatures and air temperatures are often very similar in well-constructed buildings(CIBSE, 2013), it could be assumed that in these two flats the mean radiant temperature maybe only slightly below air temperatures.
By contrast, Flat C had windows open during the day, every day, with the master bedroomwindow only rarely being closed. The effect of prolonged window opening would be to not onlylower air temperatures, as can be seen from the data (See Results chapter), but also to lowerthe temperature of the building fabric itself. In the daily examples looked at, Flat C living roomair temperature was around 17°C at the point when the heating was switched on in theevenings (although it was lower than this on other days) and the surface temperatures couldtherefore also have been at around that temperature (see Figures 26-28, Chapter 5). As winterprogresses and external temperatures drop further, the late afternoon air and surfacetemperatures could reach even lower figures on a regular basis, meaning that at around5.30/6pm when the heating is switched on and the windows closed, there is the potential tocreate an uncomfortably large gap between air and mean radiant temperature in that room.
This phenomenon could be exacerbating the discomfort felt by both occupants at the other'scomfort temperature, as described in the following 3 short extracts from the interview:
Michael: It's always cold in here.Becky: See I always think it's warm in here. - - - - - - - - - - Int: Oh right! So Michael...you wouldn't say then, that you were a 'cold' person, or feel the cold more than other people?Michael: I wouldn't say that, but I normally...always walk in here and say it's cold. And I put the heating on.Becky: Ah...see....he'll come in, and I'll have a vest top on, and he's got a hoodie and all that on, and I'll be like...it's roasting, and he'll say it's freezing.Michael: I like a warm house.
- - - - - - - - - - Int: (To Becky) So you do sometimes feel cold?Becky: Yeah! But I'll get a blanket, and cuddle into a blanket, rather than...(put the heating on) 'Cause I don't like... breathing hot air.(Laughs)
66

MSc AEES January 2014 Angela Lafferty
In particular, Becky's feeling of breathing 'hot air' when the heating is on, could be due to therelatively high difference in temperature between the air and the living room surfaces, ratherthan the absolute temperature of the air itself, which averaged between 19°C and 20°C in theevenings.
There is evidence, however, that low mean radiant temperatures may also be an issue in FlatA, as Amanda complained that the living room felt colder than other rooms in the evenings,despite having an average evening air temperature of 21.5°C (see Appendix C for interviewtranscript). This could be a result of the large proportion of external envelope in this roomcompared to the bedrooms. In addition to the south elevation external wall, this room is alsobounded by cavity party walls on either side (see layout plan in Chapter 3, Figure 5): althoughthought to have a u-value of 0 at the time of design (zero heat loss), it is now known that thistype of wall can have u-values of up to 0.6 W/m2K (see Chapter 2 – Literature Review).
This is much higher than the 0.29W/m2K u-value of the external walls, and could be causingsurface temperatures to be substantially lower than the air temperatures. In addition, thewarrant drawings show areas of cold bridging at the wall and floor slab junctions because thewall insulation is internal (see fig. 35 below).
This 'cold-bridge' condition applies to three of the living room's four perimeter walls, causingcooler temperatures to a large portion of the floors and to lesser extent the ceilings in each flat.
Interestingly, the occupants in Flat B did not feel that the living room was cooler thanelsewhere, even when specifically asked on the subject (see interview transcript, Appendix D),despite the measured data showing it to be cooler more of the time. One explanation of thisoffered by the occupants, was the frequency of cooking and baking in the adjoining kitchen.
Air movement
Again, the air movement in the flats was not measured as part of this study, but would havebeen extremely useful to know in terms of assessing the extent to which the air temperatures(and ideally, the the operative temperature including the effect of MRT (McMullan, 2007) wereaffected by varying levels of air movement, and whether this was markedly different betweenflats, particularly in the living rooms in the evenings. This would also have helped give anindication of the effect of closing trickle vents and internal doors.
67
Figure 35: External wall detail (adapted from warrant drawing by Susan Stephen Architects)
MSc AEES January 2014 Angela Lafferty
All occupants complained of an uncomfortable draught coming from the balcony door in theliving room, and trickle vents were closed in all flats in periods of windy weather.
It is known that if the speed of air movement exceeds 0.1m/s, a higher air temperature isneeded to provide the the same comfort level (McMullan, 2007). So, for example, despitetemperatures in Flat A being higher than those in Flat B, the air may be moving at higher speedbecause of all the trickle vents being open when they are more often closed in Flat B, andtherefore could be causing it to feel colder than it is. Flat A though, frequently has the livingroom door closed, so may in fact have lower air movement speeds than Flat B. It is impossibleto quantify without the necessary data; suffice to say that it is highly likely that air movementsspeeds are not the same in the 3 flats, with varying degrees of effect on the experience oftemperature.
Some rudimentary heat loss calculations are given in Appendix N, however these exclude theeffects of the party-walls, the cold bridging at the slab perimeter and open trickle vents andwindows.
Relative Humidity (RH)
The effect of RH on thermal sensation depends on the corresponding temperature at the time:high RH at warmer temperatures means the skin is less able to lose heat through evaporation(sweat), and high RH at cooler temperatures can cause a 'chilly' sensation (McMullan, 2007).
Using the average RH figures from each flat's living room (see Results, section 5.8, it wouldseem that there are no real issues – Flat B has the highest average RH at 65.3%, andcombined with an average temperature of about 20°C sits within accepted comfort levels. Thesignificant period of time where RH levels exceeded 70% may pose more cause for concern,although this would have more to do with potential interstitial condensation and mould growththan thermal comfort.
A scatter plot of RH and temperatures (Appendix P) shows that more of the time at higher RH isalso spent at higher temperatures, and as there were no reports of ever feeling too hot oroppressive, there is deemed to be no negative effect on thermal sensation due to high RH inFlat B. The RH was very rarely high at cooler temperatures, so there is deemed to have beenno 'chill' effect' occurring either.
It should be remembered that for the majority of the monitoring period, Flat B did not use thecentral heating; it is expected, based on measured data, that the average internal wintertemperature would be higher than those experienced in October and November before theheating was switched on (see Chapter 5, Figure 25), and that therefore any problems with highRH would be confined to those few months (and the 'mirrored' months on the other side of thisflat's short heating season, in spring).
Clothing and activity levels
Clothing insulation levels (clo) play an important role in regulating the body's heat loss rates.However, it is extremely difficult to attribute accurate clo ratings in reality, particularly asvariation does occur throughout the day and from day to day, often depending on outsideweather. From the interview responses, it is possible to determine that there were noticeabledifferences between occupants of the same household, as well as from flat to flat. For instance,Becky in Flat B would normally wear thin cotton trousers and a T-shirt in the evenings, even inwinter, whereas Michael would normally wear both a T-shirt and jumper as he feels cold, evenwhen the heating is on. A similar difference was apparent between the occupants of Flat B.
In further contrast, Amanda in Flat A would always have long sleeves at home, even in the
68

MSc AEES January 2014 Angela Lafferty
summer, and usually 2 thinner cotton layers plus one or two heavier cardigans inautumn/winter, despite living in average air temperatures around 2 degrees higher than Becky.This indicates that even at 22°C air temperature, Amanda's comfort level is not being met asshe wears substantially more clothing than the other occupants (as well as sometimes usinghot water bottles and blankets to supplement this) and therefore would find it difficult to turndown the thermostat without making other changes to the internal environment, for exampledecreasing the ventilation rate by closing trickle vents. Raising activity levels would be likely tohave a profound effect here, as Amanda's prolonged periods of working on the computer meanthat the body's heat production through metabolic rate has decreased to the extent where heatloss is being minimised by reducing blood circulation to the extremities, hence her constantfeeling of being cold.
It is interesting then, that Becky feels comfortable at indoor temperatures of around 18.5°C(deemed 'comfortable' as it was the average afternoon living room temperature, when Beckywas in sole control of the indoor environment) with a very low clo rating of around 0.5. Crucially,it points towards the idea of acclimatisation and/or physiological differences, both of which aredebated in the academic field of thermal comfort. Fanger & Oleson (1971) concluded from theirexperiments that there was little physiological difference between human beings, and thatfurthermore humans do not acclimatise to different climates, in contrast to findings inHumphreys et al. (2013) and CIBSE (2013) which show that people in different parts of theworld do differ in their neutral comfort temperatures, and their preferred temperature canchange over time in a new environment.
6.2.2 Habits
There was evidence in the interviews to back up theories of Gram-Hanssen (2010) andHuebner et al. (2013b) that habit plays an important role in energy consumption.
Examples include the habit of leaving doors open or closed, never changing TRV settings (asthis habit had not been acquired) – only 27% of people varied them 'sometimes' (Huebner etal., 2013b) – this habit seemed to be prefigured by the flats layout and the building physicsaspects discussed above – ie. Flat A felt the living room to be cooler than other rooms, andstruggled to heat it adequately. All occupants were in the habit of wearing a certain level ofclothing, although they added extra layers if necessary. For instance, Tim in Flat A talks ofsometimes feeling cold, then realising he's wearing a T-shirt (see transcript in Appendix C). Thedaily habit of rigorously switching off appliances and lights had been acquired in Flat A, but notso much in the other 2 flats where switching off was less consistent.
In the cases of Flats A and C, their habit of switching on the heating whenever it was feltnecessary, instead of using the programmer, may actually lead to higher gas use due toaccidentally leaving it on (observed in the daily comparisons for Flat C) or simply just using itmore: for example, Flat B have their heating programmed to the same times of day, regardlessof whether it is a weekday or weekend. They stated that even if they were at home and felt coldduring a 'heating off' period, they would not override the thermostat.
Gram Hanssen (2010) discusses the notion that many habits are unconsciously learned inchildhood, and reproduced later. The interviews provide some evidence of this: Amanda in FlatA alludes to always being cold, except in her parents' house, suggesting that the reason shelikes high temperatures is that this is how she has grown up. Rachel in Flat B associates her'feeling the cold' more than her partner to the fact that she is from a warm country – Australia.However, instead of using heating in the shoulder parts of the year (when the other flats do)she is in the habit of using a blanket, hot water bottle and hot drinks. These adaptive habits areshared by the other females, and to a lesser extent the males.
Although it was not discussed in the interview, it is possible that Becky's habitual windowopening behaviour may have been learned in childhood from her parents. Indeed, the 2 yearold daughter in Flat A had already begin copying her parents' habit of keeping the living roomdoor closed (See Appendix C – interview transcript).
69

MSc AEES January 2014 Angela Lafferty
It is clear then that thermal comfort and habits are often intertwined; this suggests that comfortpreferences can be changed over time, just like all habits. Habits can be hard to break, andhard to make, but it can be done. Although Amanda 'prefers' to turn the thermostat to 22°C, it islikely that over time, she could adapt to lower temperatures. As Humphreys et al. (2013)pointed out, the vanishing custom of varying clothing levels with the seasons 'could presumablybe reinstated were there sufficient reason to do so.' The common goal of achieving 80% cuts inCO2 emissions is certainly sufficient reason to try to change our habits, however comfortablethey may be.
6.2.3 Feedback for occupants: energy saving advice
After all the detailed analysis and discussion of the gas consumption and associatedbehaviours of all the participants, it is useful to briefly sum up the various ways in which eachflat could potentially reduce their space-heating consumption.
Flat A: As Flat A complained of the living room not getting as warm as the other rooms, also backed upby the measured data (due to larger proportion of external envelope and glazed area, andpossibly under-sized radiators), the TRVs should be turned down in the bedrooms. It issuggested they are turned down to 1 initially, and turned up incrementally until a comfortablebalance is reached. A problem with this is that the room thermostat is in the hall, and thus theradiator does not have its own TRV, so once the hall heats up to the required temperature it willstill shut off the boiler before the living room heats up adequately. A possible solution is to leavethe either the living room door or the bedroom doors open, to prevent the hall from heating uptoo quickly. However, it is not clear from the data that reduced bedroom TRV settings in Flats Band C had much effect on either temperature or gas consumption.
Having either the living room or bedroom doors closed would also help to reduce pressure-driven ventilation through the window trickle vents and therefore reduce heat lost in this way aswell as uncomfortably high air movement.
An obvious energy saving would come from lowering the thermostat setting, and furtherincreasing clothing levels (though these are already high in the case of Amanda) and activitylevels to ensure comfort is retained. This would reduce energy consumption on a daily basis, aswell as potentially reducing the length of the heating season overall. Some thought might begiven to using the timer to control the heating instead of using it manually, or perhaps acombination of the two. For example, the heating is more consistently used in the evening thanduring the day, so this element could be programmed, with the option to manually overrideduring the day as and when needed, possibly to a lower temperature than in the evening.
Flat B: The length of the heating season in Flat B is considerably shorter than in the other two flats,and it could be said that space-heating consumption is already at its minimum. However, two ofthe bedrooms in this flat are not generally occupied: instead of having the radiator TRVs set to3, they could be turned down to the frost setting, with bedroom doors closed instead of open.This would have the effect of reducing natural light in the hall, which may be unacceptable tothe occupants, although the flat is generally unoccupied during daylight hours in winter so itmay be less of an issue. Although patterns and nature of electricity consumption were notstudied in any detail, the magnitude of the difference between this flat and Flat A suggests thatsignificant savings could potentially be made, though it is not immediately apparent how.
Flat C: A clear method of reducing gas consumption in this flat would be to significantly reduce thelength of time and frequency of opening windows. This would significantly reduce the length ofthe heating season, as indoor temperatures would not dip low enough to require heating untilseveral weeks later in the year, with a similar effect in curtailing use of heating in spring. Evenduring the heating season, the reduced daily temperature drops in both air temperature and
70

MSc AEES January 2014 Angela Lafferty
fabric temperature would mean less work for the boiler to restore evening temperatures to acomfortable level for Michael, particularly as this flat has the lowest thermostat setting. Thereduced difference in MRT and air temperatures is likely to also reduce the opposites ofdiscomfort felt by by both adults. However, it is also clear from the occupant interviews that thepsychological effect of opening windows is important to Becky, and may have health benefitsthat have not been measured, therefore this may not be considered an option.
A method of mitigating the heat loss through open windows may be to close all internal doorsthroughout the day, to reduce airflow between the north and south walls of the flat.
Alternative advice of ensuring that the heating is not on while windows are open should stillyield savings. As the master bedroom window is open almost continuously, the radiator TRV inthis room should be turned down to the frost setting, and the bedroom door should be closedonce the other windows are closed for the evening, to reduce heat loss and therefore gasconsumption. Increasing clothing levels or using blankets and hot water bottles while watchingTV may mean heating could be used for shorter periods or at an even lower setting.
Similarly to Flat B, the data suggests that significant savings may be possible in electricity consumption, however further investigation would be required to determine how.
6.3 THE ACTION-PERFORMANCE GAP
The concepts of global warming and climate change are now widely known to the generalpublic, but there is little evidence that the necessary changes in behaviour to reduce householdcarbon emissions are taking place.
6.3.1 Lack of awareness individual role
Firstly, there is strong evidence to suggest that there is a lack of awareness of the roleindividuals have to play in combatting climate change, and of how they are supposed to do it.One of the interview questions asked about global warming. The answers are below:
Int: Ok...and in your daily lives, when you're in your home, using your gas and electricity, do you ever think about...global warming and climate change, or anything like that? (Pause) Int: I mean...does it affect anything you do, or...? (Pause) Rachel: Not...not..in terms of... Gordon: No, not for me anyway.
- - - - - - - - - - Int: Do you think...in your daily lives, do you think about climate change, or anything like that, or feel you have a role to play in it?Becky: Not in my daily life, no.Michael: Uhhhm...(long pause)...Well...I don't know, not really, no. I could probably think of things, but...no.
Rachel, Gordon and Becky are quite clear that thoughts of climate change do not affect any oftheir daily behaviour. Michael seemed to have mixed feelings but in the end answered no: hishesitation indicates that he either thought he should answer 'yes', or that he does think about itbut gave a short answer to bring the interview to an end.
The occupants in Flat A indicated that climate change did influence their actions, but this was tobe expected as the author/interviewer/ “Amanda” is currently a student in that field (seeAppendix C interview transcript Flat A).
When households did display energy-conserving behaviour, such as in Flat B with their low gas
71

MSc AEES January 2014 Angela Lafferty
use, this was seen to be financially motivated rather than out of concern for carbon emissions.
Rachel: So yeah, we've tried to hold off as long as possible, and 'cause Gordon's not working as well, we're just a bit, sort of...arghhh (intake ofbreath), yeah it's going to be so expensive to...put the heating on these days, so...
This financial rather than environmental motivation is not unique to this study: Fell & King(2012) and Currie et al (2011) found this to be widespread in their household studies.
6.3.2 Lack of awareness: amount of energy being consumed
Fell & King (2012) found that most participants in their study did not know how much gas andelectricity they were using, or how much it cost, despite saying that prices had gone up. In thisstudy, the occupants did all have rough idea of what they were paying, when pushed to thinkabout it, and in contrast to Fell & King's study, the two flats paying by monthly direct debit had aclearer idea than the flat paying quarterly. Flats B and C paying by direct debit also thought thatenergy was expensive, whereas the occupants in Flat A considered energy to be cheap, whichis perhaps the reason they were less aware.
Another question asked occupants whether they thought they used more or less energy thanthe average household: the occupants of Flat C thought that their consumption of both gas andelectricity was roughly average: consumption of both was higher than the other flats in thestudy, but gas consumption was lower than the national average – mostly due to the higherfabric-efficiency - and electricity consumption was slightly higher than average. The occupantsof Flat B guessed that their gas consumption was lower than average, but that their electricityuse maybe higher: in fact both were lower than the UK average, but electricity use was indeedhigher when compared to similar age and size of flat.
Flat A's occupants also had a fair idea that their consumption of both fuels would be lower thannational averages, despite having less awareness of the cost of their bills, because of theirhabitual switching off and energy-efficient building fabric. They were slightly surprised at howmuch less electricity they used compared to the other study flats, because of the high numberof halogen spotlights particularly in the living room. The evidence suggests that householdersactually do have some awareness of their levels of energy consumption, as was also found byGill et al. (2010).
6.3.3 Lack of awareness...a 'disconnect' or 'head in the sand'?
Part of the problem in reducing household energy consumption, argue Fell & King (2012), isthat occupants do not associate their attempts at seeking comfort directly with their energy use,and as such are not 'consuming' energy itself, rather the services it provides. This could be saidto be part of a wider phenomenon in modern life, where everything is 'on tap' and we do nothave to think about where it comes from. As such, there is a disconnect between the need toreduce energy demand and the need to change lifestyle.
It is also argued that people are too busy 'getting on with life' (Fell & King, 2012) and jugglingtoo many things already to take on yet another task of monitoring their carbon footprint (Sapiroet al, 2012).
Zero Carbon Britain (CAT, 2013) suggests that in fact it is not a lack of awareness that preventsus from changing our behaviour, but a denial that things have to change at all: a symptom ofaddiction to fossil-fuelled lifestyles. Sapiro et al (2012) found that participants in their researchwere keen to receive advice but in reality were reluctant to restrict any aspects of their ownlifestyles. Examples of this attitude were shown by all occupants in this study, even those inFlat A who claim to be environmentally-conscious. A few examples are given below:
Int: ...would you say you had, sort of...long showers, short showers, or do you know roughly how long they last? Gordon: I'm about 15 minutes, 'cause I'm, I'm..
72

MSc AEES January 2014 Angela Lafferty
Rachel: You're a thinker in the shower...Gordon: I'm a thinker in the shower. I do all my best thinking in the shower! (Laughs)
- - - - - - - - - - Rachel: ....see, electricity's one of those things though, isn't it, it's just so much part of your daily life now, you know...you flip a switch and you're not even really conscious of the fact that it's.... - - - - - - - - - - Rachel: Electricity, you can't really get around it, you've got to use electricity one way or the other...
- - - - - - - - - - Int/Amanda: Would say your showers were long or short,or...?Tim: Not as short as I'd like, I mean...they're not long, but I do daydream in them, and I use it to wake myself up.Int/Amanda: I'd say mine were probably quite long, like 10-15 minutes. I know they should be shorter, but I'm the same, I daydream, and like it 'cause it's warm...- - - - - - - - - - Int: Ok. If energy costs...well, they already have...but if energy costs were to increase substantially, what would you do? Would you: just pay the bill whatever it costs, would you only heat some rooms and not others...would you just put up with the cold in order to save money, reduce the length of time that you've got the heating on for, or...something else?Becky: (Pause)...To be honest, we'd probably just pay it.Michael: We'd pay it, I mean, if it was going to double then it would be a bit silly, but if it was going up £10, £15, £20 then we'd just pay it, to be honest.
These examples all show that essentially, the occupants like how they live, and want to keep ongoing as they are. There is nothing surprising about this, or inherently wrong, but it is telling of asort of complacency in the face of climate change, borne of not having to change. It is theworld's poorest countries who will be hardest hit by climate change (World Bank, 2012), andalthough its effects are beginning to be felt in the UK, with more frequent extreme weather, ourrelative wealth and comfort mean that we have a greater ability to adapt and mitigate. Inaddition, the threat of climate change is often perceived as intangible, as something that willhappen in the future (Sapiro et al, 2012).
The above examples though, are not necessarily representative of a general behaviour:Gordon likes long showers, but uses very little heating, and could live without it; Rachel toolives with less heating than she would ideally like to use, even though she does not do thesame with electricity; Tim and Amanda like long showers and high room temperatures, that arein contrast to their conservative electricity use; Becky and Michael would pay more to avoidchanging their habits, but have the lowest thermostat setting of the study – which on its ownwould likely have resulted in the lowest gas of the study instead of the highest. It is thecombination of this with the winter window opening that is a principal cause of their higher gasuse. Fell & King's (2012) study uncovered the same conflicting and combined 'high' and 'low'behaviours, and that there was no correlation between valuing the environment and using lessgas, precisely because of these inconsistencies in behaviour.
They also found attitudes of occupants feeling 'entitled' to live life as they wish, and feelings of'sacrifice' in relation to any proposed reductions in comfort, with people simply “not prepared tosit in their homes and get cold” (Fell & King, 2012).
There is evidence then, in this study and in the wider research, that people do not want tochange their habits, or that they do not think it is actually possible to use less than they alreadydo. A lack of education on why and how to achieve change is a key problem here.
73

MSc AEES January 2014 Angela Lafferty
6.3.4 Government & media
It is argued here, that indeed the problem is a lack of awareness, not of climate change, not ofour own energy consumption levels, but of how much less we need to be consuming, theurgency with which we need to change, and the basic knowledge of how to do it.
If we are collectively and individually in denial about our addiction to energy, as Zero CarbonBritain (CAT, 2013) argues, then it is perhaps due to the message not being communicatedwidely or loudly enough.
Despite plans to vastly improve the housing stock energy-efficiency and increase renewablegeneration, meeting the CO2 reduction target is nevertheless reliant on households' significantdemand reduction through behavioural change (Boardman, 2007), and yet, the government'sown Carbon Plan report (HM Government, 2011) proposes few strategies to achieve it,focussing instead reducing household CO2 emissions through building energy-efficiencymeasures and de-carbonisation of energy supply.
Asking people to change their behaviour is a politically 'touchy subject', as illustrated by thecontroversy last year when the energy secretary Ed Davey suggested that people wearjumpers at home to cope with sharply rising energy costs (Saul, 2013). Indeed, a governmentspokesman later clarified, that: "...it is entirely false to suggest the prime minister would advisepeople they should wear jumpers to stay warm” (Wintour, 2013). This example reinforces thenotion of our addiction to energy, and the idea that we can not achieve comfort without it, letalone reduce consumption in any way. It also confirms the idea of recent abandonment oftraditional clothing customs (Humphreys et al, 2013), given wearing warm clothes would havebeen standard practice as little as 40 years ago when average internal temperatures were only12°C (Palmer et al, 2013). The interviews from this study however, portray a more complexrelationship with clothing: that in each household one of the occupants already does wearsubstantially more clothing than their partner, in an effort to live within mutually comfortabletemperatures.
Government advice in the face of rising energy costs is instead, to shop around for a cheaperdeal, with the implication that energy company profits are to blame. Energy companies in turnblame government 'green' levies (Saul, 2013).
Consumers are bombarded with 'pressure and encouragement from society and advertisers toconsume' their products (Sapiro et al. 2012) and are left feeling 'paralysed' and 'apathetic' (CAT,2013). Mixed messages from government and the press only compound this inertia, such asthe apparent support for 'fracking' (hydraulic fracturing to extract shale gas and oil). An onlinenewspaper article (Faulkner, 2013) not only denies the environmental costs of fracking, butclaims it is actually better for the environment, in that it replaces coal. The article also alertsreaders to the little-known fact that UK energy reserves are at a historical low (see Introduction,section 1.3), and uses the fear of 'running out' to make the case for exploiting untappedreserves of fossil fuels, even implying that failing to do so might 'jeopardise health and safety' inour nation's homes in winter.
The message reaching consumers therefore, is not that we need to reduce our energyconsumption in the face of potential shortages, and that we need to find cleaner ways ofproducing the energy we demand, but that our ever-increasing demands must, and will be metby increasing the supply, regardless of environmental costs.
In summary, the overriding reason that widespread behavioural change is not taking placecould be that householders are not being made aware of the scale or urgency of the need to doso, in order to meet the binding CO2 reduction targets in 2050, for fear of political unpopularity.In other words. Individuals may not want to curtail their lifestyles, but they might be prepared todo so if given the direction, motivation and knowledge of how to do it.
74

MSc AEES January 2014 Angela Lafferty
6.4 HOW TO CHANGE – POTENTIAL SOLUTIONS
6.4.1 Existing action and proposals
The Carbon Plan (HM Government, 2011) outlines policies and strategies for reducing energydemand in the housing sector: these are focussed on improving the energy-efficiency of thefabric and systems (Warm Front, Green Deal), and encouraging domestic renewable energyproduction (RHI and FITS) to contribute to de-carbonisation of national energy supply. Policiessuch as Zero Carbon Homes aim to do both. The only substantial strategy aimed at changingbehaviour is the roll-out of smart-meters by 2019.
While smart-meter trials have reported reductions in household energy consumption of 5-15%(DECC, 2012), gas consumption by 7-23% and electricity consumption by 7% (Currie et al,2011), there are concerns that savings may only be short-term(Stevenson and Leaman, 2010).
Change can only be achieved and sustained where there issome form of effective feed-back loop, such as a well-designedreal-time display, with habitual checking by the occupants. TheEwgeco monitor14 used in Currie et al's (2012) trial was deemedby 79% of participants to be easy-to-use, in particular because ofthe coloured traffic light display (See figure 36). The trialfeedback indicated that the behaviours that householders alteredthe most, were also those which resulted in the highest savings,such as closing windows or adding layers before using theheating, and turning down thermostats and TRVs.
Feedback is also being called for by construction professionals,in the form of routine post-occupancy evaluation (Stevenson &Leaman, 2010; Way & Bordass, 2005) but this is yet to be takenon board by the government. As already highlighted, barriers to voluntary POE and BPE uptakeinclude costs and fears of liability among designers if under-performance is discovered. As hasbeen seen in this study, the design of a home has a profound impact on user behaviour; forexample, a lesson to be learnt here is the profound impact of the high external envelopeproportion in the living room on occupant heating patterns, as this room is generally preferredto be the warmest in a home. Not only are fabric and infiltration heat losses thought to behigher in this room than elsewhere in the flat (the temperature data shows this room is often thecoolest, in all 3 flats, despite only 1 occupant complaining of it), but the cold-bridging is likely tobe causing uncomfortably low mean radiant temperatures as well.
Another design lesson to be learnt, is the apparent ineffectiveness of orienting the living spaceto the south, which goes against widely accepted passive solar design advice. Although thisstudy did not investigate this in detail, reasons are thought to be the lack of sunny days(particularly in Scotland), the unwanted shading from useful gains in the shoulder seasons bythe balcony, and that the sunniest winter days tend to also be the coldest, so that any solarheat gains are quickly lost through the large windows. An IES study of the flat (Lafferty, 2013)also found that there was insufficient thermal mass in the room (due to to the insulation beinginternal) to retain warmth until the evening, and thus did not reduce the need for centralheating. The wider implication of these observations is the unsuitability of large south-facingwindows in a Scottish climate, unless combined with thermal mass, or unless on the externalenvelope of an unheated sun-space, separated from the interior by an external wall.
However, without government intervention to break the 'funding deadlock' (Stevenson &Leaman, 2010) the opportunity to learn invaluable lessons such as these is being missed as amatter of course.
14 The Ewgeco monitor was also used in this study, with the display concealed.
75
Figure 36: Ewgeco real-time display of electricity and gas use

MSc AEES January 2014 Angela Lafferty
A number of proposals aimed specifically at inducing household behavioural change througheduction, feedback and motivation are discussed below.
6.4.3 TV campaign: “We're in this together!”
A study by the Energy Saving Trust (Owen, 2012) has revealed that we are a nation of TVwatchers, with average viewing likely to exceed 6 hours a day. The occupants in this study alsoconfirmed that the TV is often on in the background, even when they are doing other things. Anuntapped opportunity therefore exists, to communicate the urgent behaviour change messageto large numbers of people. A precedent for this type of TV campaign exists in New Zealand,where an estimated 96% of the adult population is reached over the course of a year(Brownlee, 2009).
Over half of New Zealand's electricity supply comes from hydro generation (Martin, 2012),leaving it vulnerable to shortages during relatively frequent periods of drought when lake levelsare low (Cook, 2012). In an effort to deal with impending shortages of supply, the New ZealandGovernment has a history of reaching out to the population through sustained nationwide TVcampaigns informing them of lake levels and the necessary reduction in demand to avoidblackouts (Sadd, 2014): in one such campaign in 2001, five different adverts were screenedover 6 weeks calling for 10% cuts in electricity demand over 10 weeks, and giving useful tips tohouseholders in how to achieve them (Hodgson, 2001a). Daily feedback was also given to thepublic, both verbally on the news, and in the form of graphs (see figure 37 below) available onthe internet the next day (Scoop Independent News, 2001).
Figure 37 shows that the savings on one day in one region were nearly 20%, however bothregional and daily totals varied significantly on a daily basis. Overall, the campaign did not quiteachieve the 10% target (Hodgson, 2001b) but the crisis was successfully avoided, with nopower cuts occurring.
76
Figure 37: Graphs illustrating achieved electricity savings as part of a nationwide campaign in New Zealand (images from Scoop Independent News, 2001)

MSc AEES January 2014 Angela Lafferty
The New Zealand approach encompasses many of the key points already raised in thisdiscussion: the message of demand reduction is being clearly and widely communicated to thepublic; the government is using the 'threat' of shortage as a motivation to change behaviour,rather than a reason to increase supply (as in the UK fracking example); householders wereeducated on how to achieve cuts in the series of adverts; there were several means of 'feeding-back' the success of daily efforts; and the communal aspect of the impending shortage and thegovernment's campaign seem to engender an almost 'war-time' spirit among the population,which rallied to (almost) achieve the necessary cuts.
In an effort to achieve cuts in household energy use on a longer-term basis, the countrylaunched a new television campaign in 2009 (EECA Energywise, 2014), a series of 60-secondslots which aired simultaneously on 4 channels, three nights a week, during prime-time eveningviewing, with further repeats throughout the week (Brownlee, 2009). The campaign cost around$4 million (NZ) for a year, a figure which pales in comparison to the multi-billion pound cost ofthe UK's smart-meter roll-out for example (HM Government, 2011).
While the smart-metering campaign (combined with an in-house display) addresses the needto provide consumers with feedback on their energy consumption, it does not communicateeither the scale or the urgency of measures required in the way that a TV 'awareness andeducation' campaign can. We too will be faced with the possibility of interruptions to our energysupply over the next few years (see Introduction), and instead of keeping this information quietfor fear of political unpopularity, the government should seize the opportunity to give immediacyto the issue of climate change, and harness public co-operation in meeting national targets.
Only by giving the public a real motivation to change their behaviour, as is the case with theNew Zealand droughts, is any real change likely to occur. Smart-meters would then be a vitaltool to the householder to help meet the specified energy reduction targets requested of themby the government. It is argued here that householders currently have no idea that they are, asa collective entity, expected to achieve an 80% reduction in CO2 emissions by 2050, nor themagnitude of the interim targets, and furthermore how those CO2 reductions relate to theirenergy use. Householders need a framework within which to measure their efforts (Boardman,2007).
While there are many sources of energy-saving advice and carbon-calculation tools in the UK,such as the Energy Saving Trust, none could ever hope to reach as wide an audience as a TVcampaign, or be as successful in inducing widespread behavioural change. Only those who arelooking for this information will find it on the internet, whereas a prime-time TV campaign wouldreach almost everyone, based on the New Zealand figures.
A televised experiment in communal energy-conservation using Ewgeco energy monitors wasbroadcast in Scotland in late 2013 (The Great Big Energy Saving Challenge, 2013), in whichresidents of a street in a small town near Aberdeen were challenged to reduce their energyconsumption by 30% over 3 weeks: in fact they achieved a 49.8% reduction. This level of cutsis unlikely to be maintained in the long term, having been induced by the public challengeaspect of the trial, however it is nevertheless indicative of the magnitude of savings that can beachieved when necessary. An increasing number of this type of TV programme could in itselfraise the profile of the householder's role in meeting climate change targets.
The impending energy crunch is the ideal opportunity for the government to capitalise on the'fear' of shortages to invoke consumer savings in the communal spirit, following the NewZealand precedent, rather than forever increasing capacity to match and avoid the 'need' forfracking, for example.
6.4.4 Simple Home User manuals
There is increasing call for householders to be issued with simple user manuals, outlining thekey design features of their home and how to use them for maximum energy efficiency(Monahan & Gemmell, 2011). With the ever-increasing complexity of modern housing,
77

MSc AEES January 2014 Angela Lafferty
communicating design intent to the occupants is key to ensuring that homes perform moreclosely in-line with predictions. Much research has already been done on the most effectivecontent and format of such a document (MEARU and 55 North Architecture, 2011), with aspecific recommendation that it must be specific to each house. An example of the type ofsimple but explanatory graphic recommended is shown in Figure 38 below.
The manual would include basic information on the heating and ventilation systems, but alsoguidance on how to actively use the physical features of the home. In the example above,specific instructions are given on use of the sun-space, which varies depending on externalconditions. Sun-spaces, often in the form of conservatories, are a key source of energywastage in UK homes, as their purpose is often misunderstood by home-owners and are oftenheated despite being intended as being outwith the building envelope (Palmer et al, 2013).
Retrospectively produced user-manuals for existing homes could be instrumental in helping toachieve large-scale reductions in energy demand, alongside other measures outlined in thischapter, as most householders are likely to have only a rudimentary knowledge of buildingphysics. In addition, failings in the original design would be picked up and advice given on howto best manage them; for example, in the case of the flats in this study, a manual could explainhow best to achieve warmer temperatures in the living room than elsewhere during winter, asall 3 flats were observed to have cooler living rooms.
Advice on the optimum ventilation technique too, is vital. We have seen evidence of heat lossand lower gas use in Flat B which are potentially due to lower ventilation rates from the tricklevents being closed. According to Galvin (2013) heat losses from trickle ventilation are vastlyunderestimated, and advises that they should never be left open in winter, as is the governmentadvice in Germany. Instead, a tactic known as 'shock' or purge ventilation is recommended:several short bursts per day of 2-5 minutes, to freshen the air quickly without cooling thebuilding fabric. Galvin asserts that trickle ventilation can use up to 20 times as much energythan purge ventilation – therefore advice of this kind would be invaluable to all the flats in thisstudy.
Manuals are needed to encourage a dynamic relationship between homes and their owners.Janda (2011) makes the case for teaching building-literacy skills – even to schoolchildren – toreinstate a more instinctive knowledge of how to use buildings. The occupants in this studywere all seen to take deliberate and active measures to control their environments, even whensome of these were habitual: the key is to educate people, who can then form new habitsbased on sound scientific knowledge.
78
Figure 38: Example of the 'Overview' page of a Home User Manual (MEARU and 55 North Architecture, 2011)

MSc AEES January 2014 Angela Lafferty
It is argued here, that a challenge to the uptake of user manuals on a wide scale may be thelack of building physics understanding of designers and architects themselves, as detailedthermal modelling and energy-efficiency calculations are usually carried out by otherconstruction professionals, creating a disconnect.
6.4.5 Personal Carbon Allowances and Increasing Block Tariffs
Personal carbon allowances have been suggested by many, including Boardman (2007);however they face opposition for a number of reasons, not least the 'denial' of necessarylifestyle change discussed above, although practicality aspects are also debated (Sapiro et al.,2012).
The question of PCAs is an extremely broad one, as they cover carbon emissions from allareas of daily life including food, drink and transport. The discussion on PCAs is limited here tothe context of household energy consumption only, and would perhaps take the form of anenergy rather than carbon allowance, for reasons discussed previously in section 6.1. Theseare namely that energy consumption is more tangible than CO2 having a constant value,whereas the CO2 content of fuels changes over time, possibly leading to establishing behaviourpatterns that could be difficult to reverse in the future.
Following on from the discussion on metrics used in reporting energy and CO2, it is proposedthat any energy allowance be allocated on a kWh/m2/person basis, to avoid furtherexacerbating fuel poverty and ensure equitable distribution of resources. In addition, it isproposed that a coefficient be applied to the allowance to take account of the building's EPCenergy-efficiency rating (using an improved SAP methodology), again to avoid unfairlypenalising those living in older inefficient properties. Occupancy could be established by linkingto data already held by government, such as the electoral roll, or council tax register.Information regarding the number of children at an address is also held by governmentdepartments, such as the Child Benefit Office. Further refinements to the energy allowancecalculation would need to be made using computer modelling, particularly to calculateprogressive reductions in the allowance over time, but it is thought the suggestion offered hereis a feasible strategy to raise the energy-awareness of householders and induce behaviouralchange. Of course, education would need to form the keystone to this proposal.
For those who exceed their allowance, some form of carbon trading could allow them topurchase unused credits from others, or in the event that the PCA covers the entire carbonfootprint of an individual's life, carbon saved from other sectors such as flights or food could beused to buy energy. This issue of what to do with unused carbon credits needs careful thoughthowever, to avoid encouraging the rebound effect.
A similar proposal to the PCA is the Increasing Block Tariff (IBT) for both gas and electricity, atype of charging structure where costs increase with the number or timing of units used. Astrong case is made in a WWF report (Thumim et al., 2007), which outlines the numerous waysthat such tariffs can be structured to alter behaviour in different ways, such as shifting peakloading or reducing demand overall. These tariffs can work well in conjunction with smart-meters, as the meters can display real-time tariff information to the customer who can thenchoose to delay use of an appliance until a cheaper time, or with smart-grids where use ofcertain appliances can be automatically set by tariff. Figure 39 below shows the proposedDemand Reduction tariff structures, which are described as the most aggressive of theproposals in the report, but with the highest potential to reduce consumption: 7.4% forelectricity and 7.9% for gas.
Again, exacerbating fuel poverty is listed as a barrier, however Thumim et al. (2007) proposethat the windfalls generated, by most consumers paying more, could be used to mitigate this. Ifthe tariff structures were linked to the EPC energy-efficiency rating, property size andoccupancy, as proposed above, the basic allowance at the cheapest rate would vary dependingon the specific circumstances of the household, easing the problem of fuel poverty further.However, it is not known what effect this would have on the demand reduction figures – again
79

MSc AEES January 2014 Angela Lafferty
an iterative computer modelling approach would be needed to find the optimum solution.
Using the increasing block ranges of the tariffs proposed in Figure 39 (ignoring the pence perunit cost as these have changed dramatically since 2004), the electricity consumption of Flat Awould fall within the cheapest block, whereas Flats B and C's consumption would also crossinto the 2nd block, providing an incentive to reduce consumption to below 3000kWh/year. Forgas, all 3 flats would fall into the first block only, due to their energy-efficient fabric in relation tothe majority of the housing stock. With the average UK household consuming around 15,000kWh annually, there would be a significant cost increase associated with crossing into the 2nd
price block. It is crucial therefore that the EPC rating is linked to the tariff. This could beimplemented in a similar way to the current method of setting water costs for households basedon their Council Tax property bands (Scottish Water, 2014).
The occupant interviews, however, seem to indicate that while occupants are aware of risingcosts of energy, costs alone are not enough of a motivator to change behaviour, with both FlatsA and C stating that they would carry on paying higher costs without necessarily making anychanges to their heating habits. It is key therefore, that this strategy be employed in conjunctionwith the others mentioned above to ensure householders are made aware of their role inreducing carbon emissions, are educated on how to do it with specific advice tailored to theirhome, and that they receive feedback – both individual (smart-meter) and collective (TVcampaign) on the effectiveness of their efforts. Financial motivation certainly has a role, butonly when underpinned by a multi-pronged approach to education.
6.5 NOTE FROM A SCOTTISH PERSPECTIVE
In the light of the forthcoming referendum on Scottish Independence (18 September 2014), it isworth considering what the implications would be on household energy use in an independentScotland. The guide to independence produced by the YES campaign (The ScottishGovernment, 2013) paints a picture of an energy-rich future, with frequent mention of increasedenergy security and lower energy prices, due to being in full control of its own substantial
80
Figure 39: Increasing block tariffs for electricity and gas, designed for maximum demand reduction (from Thumim et al., 2007)

MSc AEES January 2014 Angela Lafferty
natural resources. These resources include the North Sea oil and gas reserves, as well as onand offshore wind capacity. The document talks of the UK's 'dependence on critical Scottishassets (particularly energy)' and hints of hard-times ahead which will not affect an independentScotland due to its energy safety-net.
The implication of enhanced energy security however, is that the threat of shortages will nolonger be present, thereby reducing the incentive for any wide-scale behavioural changes. Incontrast, energy security would be even more precarious in the rest of the UK than at present,with even heavier reliance on imports. This may be the sort of trigger-point required to kick-startthe rest of the UK's energy-reduction campaign, as in the example of New Zealand discussedabove. Although Scotland would continue its drive for renewable energy and energy efficiencyin buildings, its potential failure to achieve CO2 reductions through behavioural change couldjeopardise its efforts to meet the overall national target.
Location
With a majority population of the UK living in the South East, general design advice may have abias towards these areas. However, there is significant climatic difference between Edinburghand SE England, and indeed between Edinburgh and other parts of Scotland.
With ever-increasing standards of thermal performance in the UK's dwellings, attention isturning to the problem of summer over-heating. It is clear from Figure 40 (below) that meanmaximum summer temperatures in Edinburgh are at least 2-4°C lower than SE England insummer: this has very different implications for the risk of overheating, and related adviceregarding solar shading. For example, the balcony shading in this case-study prevents solarheat gain in the shoulder seasons: this might be desirable further south, but useful solar gainwould could have the potential to delay the onset of the heating season in the north. The cleardistinction in climates across the UK indicates a need for less centralised design advice, andimportantly, the need to use local weather files in design stage energy-performance predictions.
81
Figure 40: UK map showing mean maximum summer temperatures (Met Office, 2014)

MSc AEES January 2014 Angela Lafferty
CHAPTER 7 - CONCLUSIONS
7.1 SUMMARY
Quantifying differences
This study conducted a 'controlled' real world experiment to study the effect of occupantbehaviour on gas use for space-heating, in isolation from other variables, with the aim of betterunderstanding the residential 'performance gap'.
The study found a factor of difference of 3.25 for gas use over the 3-month study period, whichreduced to 2.3 when using average annual gas consumption figures. The equivalent factors forspace-heating only gas consumption were 3.44 and 2.11 respectively. There was high variationin the energy consuming behaviour of the three households in this sample, with the gasconsumption level of a flat having no relation to its electricity use, overall energy use or CO 2
emissions. For example, the flat with the lowest gas consumption and the lowest overall energyconsumption did not have the lowest electricity consumption nor the lowest CO2 emissions.
Only one flat had a Primary Energy Indicator which fell within the SAP estimate: this was theflat with only 2 occupants. Furthermore, this flat had the highest percentage of 'unregulated'energy use at 59% of its total primary energy consumption, compared to only 26% unregulatedin another. This clearly highlights the problems of dealing only in regulated energy. It was alsoclear from the study that SAP significantly underestimated the space-heating requirement of theflats, with even the lowest-consuming flat exceeding the estimate, despite its short heatingseason of about half that assumed by SAP. This is an indicator of seriously flawed assumptionsin SAP (and RdSAP) regarding heat losses, perhaps due to exclusion of the party wall effectand the cold-bridging issue around the floor slab perimeter, as well as underestimation of trickleventilation heat losses.
This situation uncovered in this study is unlikely to be unique, and therefore adds weight toconcerns already raised by others about SAP's underestimation of heating requirements innew-build and retrofitted housing.
The study also found that the highest consuming household depended on the metric beingused to report energy use. Reporting on a per person basis made consumption between theflats much more comparable, and strengthens the case for measuring building performance inthis way rather than by using comparisons to SAP ratings, which are independent ofoccupancy.
Reasons for differences
There were several reasons identified for the large variation in space-heating energy use of thethree flats, including the ventilation strategy, the significant variation in the length of heatingseason, and differences in internal temperatures, which were due to a complex combination ofhabit and different comfort requirements. For instance, the flat with the lowest thermostatsetting, and lowest measured temperatures, also had the highest space-heating consumptionbecause of the frequent window opening; this meant more gas was used daily over a longerpart of the year.
Comfort was found to depend on a far more complex set of factors than air temperature alone,with evidence that Mean Radiant Temperature in particular is playing a significant role, inseveral of the occupants' comfort. It may be that some people are more sensitive to MRT thanothers. All occupants displayed adaptive behaviour such as adding clothing layers, particularlythe 3 females in the study.
It was observed that the living room was not the warmest room in the flat, particularly as theautumn progressed and outside temperatures dropped, which is in contrast to the SAP
82

MSc AEES January 2014 Angela Lafferty
assumption (and general acceptance) that living rooms are around 3 degrees warmer thanbedrooms. This was thought to be due to high proportion of external envelope in this room,resulting in higher fabric and ventilation losses, but also a lower MRT because of extensive coldbridging of the floor slab around ¾ of the perimeter of the room.
Case-study: changes to behaviour
The study makes several recommendations to each household to save energy:
• Flat A could reduce hall thermostat setting, reduce TRVs in bedrooms, and use the timer.
• Flat B could switch off radiators in 2 unused rooms, close doors and reduce electricaluse.
• Flat C could reduce window-opening by employing shock ventilation, and close internaldoors. They could also use the timer, which can always be overridden if necessary. Alsoreduce electrical use.
However, it is possible that the occupants may prefer not to carry out these recommendations,as evidence from this study and from wider literature suggests an inertia in householdbehavioural change. It is clear that despite energy being regarded as expensive, higher pricesalone are not a motivator for change.
It is therefore concluded that the urgency and scale of the cuts required by the housing sectorhave not been communicated by government, as despite being aware of climate change,householders do not associate their comfort-seeking habits with CO2 emissions. Thegovernment has so far failed to provide a framework within which to assess levels of energyconsumption, against others or against a notional target. Government have also thus far failedto put in place adequate strategies to feedback, educate, and motivate householders to reducetheir consumption, largely due to the political unpopularity of advocating 'sacrifice' of personalcomfort levels.
The government should use the impending energy 'crunch' in 2015/16 as a motivator forchange, rather than seeking to continually increase energy supplies to meet demand, throughfracking for example. The threat of impending shortages has been shown to motivatereductions in electricity consumption in New Zealand, and the opportunity should be seized inthe UK.
7.2 KEY RECOMMENDATIONS
A multi-pronged approach of education, awareness, feedback and motivation is put forward tocomplement the government's impending smart-meter roll-out scheme, which alone may fail tosustain any initial reductions over the long term.
• TV awareness campaign – it is considered vital to communicate to householders that aminimum 80% reduction in household CO2 emissions must be made by 2050, and that asubstantial chunk (estimated at 30%) must come through actual behavioural changerather than fabric-efficiency measures. A TV campaign would: communicate thatmessage; use the potential energy shortages in 2015/16 as a motivation to reducedemand; set incremental targets; give general advice on how to achieve cuts; and feedback national progress to reward and encourage sustained efforts.
• Home user-manuals – to educate householders on the design intentions, as homesoften use more energy than expected due to lack of understanding of how they wereintended to work: sun-spaces and ventilation regimes are prime examples. Usermanuals could also be produced retrospectively to mitigate original design mistakes.
• Increasing block tariffs (or personal energy allowance) – will give householders thevital framework within which to place their own energy use, as well as a financial
83

MSc AEES January 2014 Angela Lafferty
incentive to use less. Crucially, these must be linked to the number of occupants as wellas the SAP energy-efficiency rating of the home, to ensure fair distribution of resourcesand financial burden. This will also encourage reduction in those homes which alreadyhave low use due to a thermally efficient fabric.
Reductions in household energy demand must be made easier for consumers to achieve,through far better, tailored advice, and feedback at an individual and a national level. Togetherwith personalised targets and a financial disincentive to consume, based on the polluter paysprinciple, it is possible to achieve the level of cuts necessary to achieve our CO2 emissionsreduction target.
7.3 IMPLICATIONS
The finding of this study that variations in household energy diminish when compared on a perperson basis has important implications for how residential building energy performance ismeasured in the future. SAP specifically disregards occupancy, and it is therefore unfair toportray larger households as high consumers when they consume less per person than smallerones using the same floor area. The implication is that it is necessary to bring together theenergy-efficiency rating of a building, and the number of occupants in assessing itsperformance: an increasing block tariff based on these 2 factors is a logical means for ahousehold's consumption to be fairly assessed against a baseline.
The implications of this research for design have already been mentioned, and include thenecessity to minimise external envelope in living rooms as much as possible; this has thepotential to substantially reduce space-heating consumption, because living rooms are wheremost waking time is spent. There are several implications for passive solar design, includingthat large expanses of south-facing glazing may only be suitable as part of a double walledsun-space, at least in Scotland.
Although the necessary heat loss calculations were not carried out to verify the extent of heatloss through trickle ventilation, there are implications arising from this study to suggest thattrickle ventilation is not appropriate in taller buildings, particularly in exposed locations, wherepressure differences are far greater than in sheltered 2 storey houses. It may be, as Galvin(2013) asserts, that trickle vents should simply be closed throughout the colder months, infavour of purge ventilation – but it would be essential to educate householders on this.
A key implication of this research is, that if nothing is done by government to encouragereductions in household energy demand, other than the roll-out of smart-meters by 2019, it isunlikely that the CO2 reduction target will be met. The modest reductions so far have come fromfabric improvements, increased appliance efficiency and de-carbonisation of the grid.
If however a campaign such as that suggested were to be implemented and prove successful,it would increase carbon-awareness in general, and could kickstart a new attitude ofconservation and reduced consumption in all aspects of life. The UK would be able to lead theway for developing nations, who will also need to curb their emissions in the future.
7.4 LIMITATIONS
The key limitations of this study are outlined below:
It was not possible to fully analyse and discuss all of the data gathered in a thesis of this limitedsize and scope. Ideally, more thorough analysis of all 81 days of the monitoring period wouldhave been carried out, instead of the three single days. Together with more sophisticatedanalysis techniques, such as multiple regression analysis, this would have enabled betterquantification of the effects of particular behaviours, such as closing internal doors. It wouldhave been interesting to delve more deeply into aspects of the occupant interviews, such as thevarying attitudes and perceptions of energy costs.
84

MSc AEES January 2014 Angela Lafferty
In hindsight, it would probably have been sufficient to record room temperatures at half-hourlyor even hourly intervals, which would have reduced the quantity of data without much loss ofgranularity. It had been originally intended to overlay temperature and gas consumption data forscrutiny of even smaller time-scales, of perhaps an hour, to analyse the effects of boiler-cyclingto maintain a set temperature, and to see how quickly rooms heat up once the heating isswitched on. However, the energy consumption data was not available at a resolution of lessthan an hour, despite displaying on the monitor in real time, therefore this was not possible. Thedata-processing was complicated by using 2 different logger types: this was done throughnecessity because of difficulties in sourcing enough of the same type, however the fact thatthey could not be set to monitor at the same intervals caused problems, as did the clock-change in October which was handled differently by both loggers as well as the Ewgecosystem, and was time-consuming to correct.
It is arguable whether or not the continuous monitoring using the Ewgeco system was anecessary component of this research: weekly meter readings would possibly have sufficed forthe majority of analysis carried out and the equipment could simply have been installed for afew days to get some detailed 'snapshots'. However the intrusive nature of requesting frequentmeter readings from the occupants, as well as the possibility of data loss due to them not beingprovided, or behavioural change due to the constant reminder of being monitored,meant thatthe Ewgeco system offered the better solution. In addition, the three days analysed werechosen as days with no data loss, as well as being interesting for a particular reason (ie. thecoldest day, a particularly sunny day)– these could not have been chosen in advance, onlyafterwards based on weather conditions. Also, weekly data would not have allowed us to seethe high daily variability of gas use occurring in two of the flats.
In addition to the three days analysed, it would have been intriguing to look at the days ofhighest consumption in each flat, to identify any particular triggers on that day which wereabsent in the other flats. Those days were
Flat A: 73.97 kWh 21 NovemberFlat B: 34.87 kWh 20 NovemberFlat C: 88.81 kWh 14 November (although equipment was broken on 16 Nov, and
likely that the highest gas use took place at a later date)
An important limitation of this study was the approximate nature of several of the calculations,for example the annual electricity derived from the 3-month data, and the attempt to estimatethe SAP regulated energy component of each household's consumption. These estimates havepotentially significant margins of error, and could have skewed the results. A better methodwould have been to provides estimates within a range, to highlight this margin of error.
An obvious limitation is the length of the study: ideally the flats would have been monitored overa whole year, or at least have included a complete heating season (though this study showedthat they vary significantly in length). However, the length of time available was limited by thethesis time-scales, as the hand-in is in January: monitoring for a full year or heating seasonwould have meant putting the equipment in place the previous year, which was not foreseen, ordelaying the thesis hand-in by 6 months, which was not desirable.
This study highlighted the false results that can be given by 'snapshot' monitoring regimestypical of the 2-4 week POE studies discussed in the Literature Review. For instance, theaverage living room temperature in Flat A showed it to be the warmest room (along withbedroom 2) although the 3 daily detail studies show the living room to be the coolest room formost of the time on each day in all flats, suggesting a changing relationship between roomsover the changing seasons. The issue is similar with gas consumption data (less withelectricity) although this is often 'normalised' using degree-day data: again, given more time,degree-day data would have been used to normalise the data from the 3 month study.
85

MSc AEES January 2014 Angela Lafferty
Measurements of internal surface temperatures and air speeds, as well as airtightness testingand thermal imaging, would have contributed to the overall picture and allowed some moredefinitive conclusions to be drawn about the factors affecting heat loss in each flat and whetherthey differed. Even without this information, more detailed heat loss calculations than thoseshown in Appendix N could have been carried out for a range of scenarios to enablecomparison, given more time.
The scope of thesis grew, from the initial intention of simply reporting the magnitude of anyconsumption differences, to investigating the reasons behind the differences, and to proposingstrategies to induce behavioural change. While this is felt to be a necessary extension of theoriginal topic, it has perhaps meant that the thesis attempts to cover more ground than waspossible in the time given. Given the focus on attitudes in the discussion, it would have beenuseful to devote more of the interview questions to this area; however, it was felt important tokeep the interview to a reasonable length.
7.5 FURTHER RESEARCH
Several avenues for further research exist using data already collected in the study:
• Detailed analysis of the hourly electricity consumption data would be interestingalongside the study of gas use, particularly as the study indicates the lack of correlationbetween electricity and gas use in each flat. The large differences in electricity userecorded between flats merits more investigation to determine the cause, as it is not atall apparent. Initially it was thought that the electric shower was largely to blame,however from calculations carried out as part of the SAP analysis it was clear thatelectric showering only accounts for around a quarter of the difference between flats Aand C.
• As previously mentioned, it would also have been interesting to compare therelationship between the living room and the bedroom temperatures over time. Forexample, the author's experience is that the living room is generally the warmest roomof the flat in summer, but that it feels significantly cooler than the bedrooms in lateautumn and winter, excluding periods of high solar gain. This could be carried out on theexisting data or on a new study over a whole year.
A next step to follow on from and complement the existing piece of research would be to set upthe experiment again, this time allowing occupants to use the real-time display to measure theeffect, if any, on their consumption behaviour. In this case, the data would have to benormalised using degree-day data to allow comparison with the previous monitoring period.
Another avenue to extend the current research would be to give in-depth feedback tooccupants detailing the costs of their habits, along with tailored advice and then assess theimpacts of implementing that advice on fuel bills. Monthly meter readings would be adequate toquantify the effect, along with a final interview to gain insight into the occupants experiencesand perceptions of impact on their lifestyles.
Undoubtedly, further research is required into what would motivate people to reduce theirenergy use: the example of New Zealand could provide valuable insight, particularly indetermining whether the successful short-term energy-reduction campaigns have any effect inthe longer term. The situation in New Zealand is very different to the UK, with much lowerhousehold energy use, internal temperatures and levels of insulation (New Zealand HomeEnergy Web, 2008; Humphreys et al, 2013; CIBSE, 2013), and while the current drive there toincrease temperatures to improve health may lead to a rise in household energy use (NewZealand Home Energy Web, 2008), New Zealand nevertheless provides the UK with anexample of a westernised culture living a less energy-reliant lifestyle.
An aspect touched upon in the interviews but not explored in this study was that noise was a
86

MSc AEES January 2014 Angela Lafferty
major factor in occupants not using the mechanical ventilation systems in the flat. Clearly, withgrowing airtightness standards and the resulting move towards MVHR, careful design isessential to minimise noise impact and the potential for occupants to switch off ventilation unitsbecause of it. More research could be carried out to establish acceptable backgroundventilation noise levels, and how to optimise duct routes.
POST-SCRIPTSince the end of the monitoring period, the author has made several small changes to theheating regime in her own flat (Flat A) as a result of the findings of the study, the main purposeof which was to reduce energy consumption and improve the thermal comfort in the living room.
The hall thermostat is now usually set to 21°C instead of 22°C, and the TRVs in bedrooms 2and 3 are turned down to the frost setting, with no noticeable difference in comfort in theserooms. The theory is that the hall radiator has to work for longer to heat these rooms too, thusavoiding switching off the heating before the living room has had a chance to heat upadequately. The living room trickle vents have also been closed to reduce draughts, asventilation is thought to be adequate from the bedroom trickle vents alone. Purge ventilation isused if required, when cooking, but only for short bursts of 30 seconds or so. It is hoped thatthese minor changes will have an effect on heating bills, while perhaps even having a beneficialeffect on comfort.
At the time of writing, one of the flats is about to be put on the market for sale: an EPC hasbeen issued which gives figures very close to those estimated by the author. The energy-efficiency rating is 83, the environmental impact rating is 86, the PEI is 91 kWh/m2/year and thespace heating demand is even lower than estimated at 2013 kWh/year. The only recommendedmeasure is the replacement of the Band D boiler with a condensing boiler, which wouldincrease the SAP rating by 1 point.
87

MSc AEES January 2014 Angela Lafferty
APPENDIX A – Data loggers: Specifications and 'calibration'Two different types of data logger were used in this study due to logistical difficulties in sourcing enough of the dame type. Specifications of both types are given below. Neither set of loggers had been recently calibrated, therefore it was felt necessary to carry out a 'calibration' exercise to check the accuracy of their measurements in relation to one other. The results are shown and described below.
Specifications: Lascar EL-USB data-loggers
LOCATION
'EL 1' Flat A Living room'EL 2' Flat A Hall'EL 3' Flat B Living room'EL 4' Flat B Hall'EL 5' Flat C Living room'EL 6' Flat C Hall
Specifications: Gemini 'Tinytag' Ultra data-loggers
LOCATION'TT 1' Flat A Master bedroom'TT 2' Flat A Bedroom 2'TT 3' Flat B Master bedroom'TT 4' Flat B Bedroom 2'TT 5' Flat C Master bedroom'TT 6' Flat C Bedroom 2'TT 7' Balcony (Flat A)
88
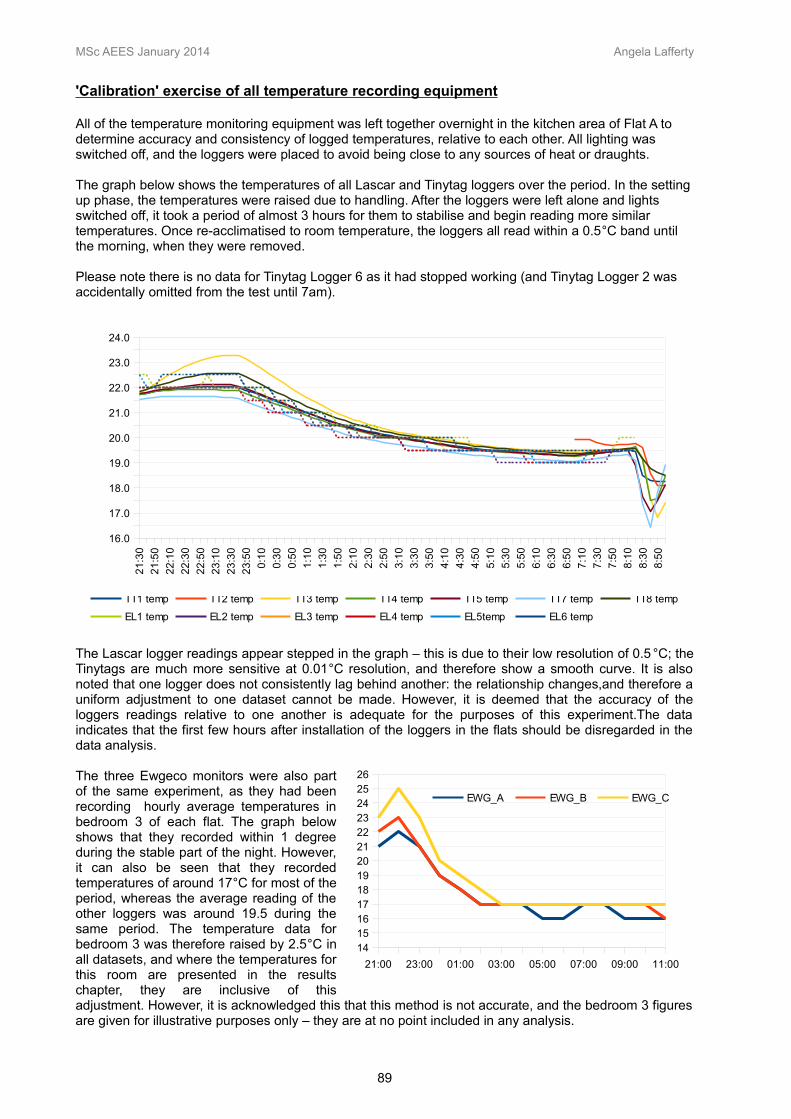
MSc AEES January 2014 Angela Lafferty
'Calibration' exercise of all temperature recording equipment
All of the temperature monitoring equipment was left together overnight in the kitchen area of Flat A to determine accuracy and consistency of logged temperatures, relative to each other. All lighting was switched off, and the loggers were placed to avoid being close to any sources of heat or draughts.
The graph below shows the temperatures of all Lascar and Tinytag loggers over the period. In the settingup phase, the temperatures were raised due to handling. After the loggers were left alone and lights switched off, it took a period of almost 3 hours for them to stabilise and begin reading more similar temperatures. Once re-acclimatised to room temperature, the loggers all read within a 0.5°C band until the morning, when they were removed.
Please note there is no data for Tinytag Logger 6 as it had stopped working (and Tinytag Logger 2 was accidentally omitted from the test until 7am).
The Lascar logger readings appear stepped in the graph – this is due to their low resolution of 0.5 °C; theTinytags are much more sensitive at 0.01°C resolution, and therefore show a smooth curve. It is alsonoted that one logger does not consistently lag behind another: the relationship changes,and therefore auniform adjustment to one dataset cannot be made. However, it is deemed that the accuracy of theloggers readings relative to one another is adequate for the purposes of this experiment.The dataindicates that the first few hours after installation of the loggers in the flats should be disregarded in thedata analysis.
The three Ewgeco monitors were also partof the same experiment, as they had beenrecording hourly average temperatures inbedroom 3 of each flat. The graph belowshows that they recorded within 1 degreeduring the stable part of the night. However,it can also be seen that they recordedtemperatures of around 17°C for most of theperiod, whereas the average reading of theother loggers was around 19.5 during thesame period. The temperature data forbedroom 3 was therefore raised by 2.5°C inall datasets, and where the temperatures forthis room are presented in the resultschapter, they are inclusive of thisadjustment. However, it is acknowledged this that this method is not accurate, and the bedroom 3 figuresare given for illustrative purposes only – they are at no point included in any analysis.
89
21:00 23:00 01:00 03:00 05:00 07:00 09:00 11:00
14151617181920212223242526
EWG_A EWG_B EWG_C
Both types of loggers all reading within a 0.5°C band
Loggers re-acclimatising after handling
Setting up
TT1 temp TT2 temp TT3 temp TT4 temp TT5 temp TT7 temp TT8 temp
EL1 temp EL2 temp EL3 temp EL4 temp EL5temp EL6 temp
21
:30
21
:50
22
:10
22
:30
22
:50
23
:10
23
:30
23
:50
0:1
0
0:3
0
0:5
0
1:1
0
1:3
0
1:5
0
2:1
0
2:3
0
2:5
0
3:1
0
3:3
0
3:5
0
4:1
0
4:3
0
4:5
0
5:1
0
5:3
0
5:5
0
6:1
0
6:3
0
6:5
0
7:1
0
7:3
0
7:5
0
8:1
0
8:3
0
8:5
0
16.0
17.0
18.0
19.0
20.0
21.0
22.0
23.0
24.0

MSc AEES January 2014 Angela Lafferty
Accuracy of Lascar logger to room thermostat (Flat A):
Temperature displayed on the room thermostat in the hall of Flat A was noted periodically, to comparewith the actual temperature recorded by the Lascar logger in the same location. The thermostat wasgenerally within ±0.5°C, and therefore within an accepted level of accuracy.
Date/time Thermostattemperature (°C)
Logger temp reading (°C)
10 Sep 12.45pm 20 20.5
19 Sep 10am 19.5 19.5
19 Sep 11am 22 22
2 Oct 8pm 21 22
9 Oct 7.55pm 23 22.5
10 Oct morn 19.5 20
10 Oct 12.20pm 20 20
13 Oct 2.40pm 19 20
14 Oct 12.55pm 20.5 20.5
11.25pm 21.5 21
16 Oct 12pm 19.5 20
16 Oct 2.55pm 23 23
17 Oct 3pm 19.5 20
17 Oct 3.45pm 22 21.5
18 Oct 10.15am 19.5 19.5
11.30am 19 19.5
12.45pm 21.5 21.5
8.30pm 20.5 20
11.30pm 22 22
19 Oct 1.55pm 20 20
24 Oct 9.45am 20 20.5
27 Oct 2.25pm 20.5 21
11.30pm 22 22
30 Oct 4.25pm 20 20
6.30pm 22.5 22.5
31 Oct 8.30pm 20.5 21
31 Oct 10pm 22.5 23
3 Nov 7pm 20 19.5
3 Nov 8pm 22 21.5
9 Nov 7.30am 18.5 19
9.45 am 18.5 19
4.45pm 19 19.5
10 Nov 10am 21 21.5
17 Nov 1pm 18.5 18.5
20 Nov 7.55am 17.5 18
22 Nov am 17.5 18
90

MSc AEES January 2014 Angela Lafferty
APPENDIX B – 'Variables' of experiment
PHYSICAL VARIABLES
Construction type CONTROLLED
Layout CONTROLLED
Orientation CONTROLLED
Thermal condition CONTROLLED (ie. all mid-storey flats)
Heating system CONTROLLED
Airtightness CONTROLLED*(assumes same, but could be different)
Construction quality CONTROLLED*(assumes same, but could be different)
External weather CONTROLLED*(same weather, but may be slight differences in wind speeds and solar access)
Main household appliances CONTROLLED
Lighting UNCONTROLLED - varies between flats
USER VARIABLES
Temperature Dependent
RH Dependent
Gas consumption Dependent
Elec consumption Dependent
Ventilation levels UNCONTROLLED - measured
No. occupants UNCONTROLLED - measured
Homeowner age CONTROLLED – all between 32-42 years old
Activity levels UNCONTROLLED*(Though main evening activity (all flats) is watching TV on sofa – similar activity level)
Clothing UNCONTROLLED - measured
Window opening pattern UNCONTROLLED - measured
Boiler settings UNCONTROLLED - measured
Radiator thermostats UNCONTROLLED - measured
Cooking pattern UNCONTROLLED – measured
Hot water use pattern UNCONTROLLED – measured
91

MSc AEES January 2014 Angela Lafferty
APPENDIX C - Interview transcript Flat A
NOTE – In this interview, the interviewer is also one of the occupants, with the pseudonym Amanda. For this reason, the format is more of a dialogue between the two occupants than an 'interview',with Amanda leading with the questions, and waiting until Tim has responded before offering her own opinion. A small number of omissions have been made from the transcript, when the conversation strayed from the topic to personal matters or subjects which were not relevant.
TRV = Thermostatic radiator valveInt: = Interviewer (author)
1 - HOUSEHOLD DETAILS: FLAT A
No Occupants - 4
Age bands 20-25, 26-30, 31-35 (x2), 36-40, 41-45
Child aged 2 and 4
Occupancy: Generally occupied most days.
2 - OCCUPANCY PATTERN
2.1 - When is your flat occupied?(PROMPTS: Same every day? Evenings & weekends? Different every week? Seasonal variation)
Int/Amanda: So, when... what would you say your pattern is?Tim: Here at evenings and weekends. Evenings from 6pm and out again in the morning...I tendto have left by twenty past 7 usually. And weekends, although I'm often out with the kids.Int/Amanda: Yeah, while I'm studying. And I'm in most days with the kids now, since I stopped work in June, but we do go out to nursery and back on Tuesdays, Wednesdays and Thursdays – sometimes stay out all day or just come back home in between.
2.2 - Has this been case for last 5 years? How has lifestyle varied?
Int/Amanda: And over the last 5 years, your lifestyle's more or less stayed the same hasn't it?Tim: Yeah, I mean I've changed jobs, and been a student for a year too, but generally, yeah, I'm out all day during the week.Int/Amanda: Yeah, but mine has changed a lot. I was working full time too when we first moved here, then I was off on maternity for 9 months, went back to work 3 days a week for another...nearly 2 years, then off on maternity again for a year, then back to work 3 days again for 8 months, up until June this year. And am now at home again after they closed the office. down.
2.3 - Describe a typical evening in your home (PROMPTS: ie which rooms are occupied, which activities are taking place, dinner time...ie “wewatch TV in living room most evenings”)
Int/Amanda: Ok, so a typical evening in our home?
92

MSc AEES January 2014 Angela Lafferty
Tim: We're both on our laptops, kids go to bed by 8. Between 6 and 7 we have the TV or musicon while we have dinner.Int/Amanda: Yeah, and when we're working at the table we have all the main lights on (in the living room).
2.4 - Describe showering/bathing patterns.(PROMPTS: How many showers per week using electric shower?Length?Time?
None – as it has been broken for around a year (though was previously used daily by both adults).
2.5 - How many showers using gas shower? Length?Time?
Int/Amanda: Right, so...showering. Well we both use the gas shower as the other one's broken...There was a while when you were having showers at work, when you were cycling, but generally you shower here...Tim: Yeah. In the morning before work.Int/Amanda: And I'm usually mid-morning. Would say your showers were long or short,or...?Tim: Not as short as I'd like, I mean...they're not long, but I do daydream in them, and I use it to wake myself up.Int/Amanda: I'd say mine were probably quite long, like 10-15 minutes. I know they should be shorter, but I'm the same, I daydream, and like it 'cause it's warm...Also I have long hair, that takes ages to shampoo and condition!
2.6 - How many baths per week? Time? How full?
Int/Amanda: And we run a bath every night for the kids.
2.7 - Describe cooking pattern.(PROMPTS – Mostly hob/oven/microwave? Frequency? Lunchtime cooking? During week?)
Int/Amanda: Ok – cooking pattern. Generally...Tim: Well, you do all the cooking at the moment.Int/Amanda: Yeah. We generally use the gas hob, sometimes the (electric) oven...Tim: Sometimes the microwave...Int/Amanda: Yeah but only very occasionally, we don't use it to cook meals though, really. And I'd say I generally cook at lunchtime and in the evening...at lunch it's normally something quick,like pasta, or just reheating last night's leftovers.
3 - HEATING CONTROL
3.1 - How do you operate and control your central heating?(PROMPTS - manually, timer, constant thermostat...Why? Do you think it uses less energy or tosuit lifestyle...?)
Int/Amanda: Right, this section's all about our heating – how do we use our heating? Well, we use it manually, yeah?Tim: Yeah, never use the timer.Int/Amanda: And how would you describe how and when we use it, and what temperature we set it to?Tim: Well, I'm not here during the day. In the morning, sometimes I do feel cold, but generally speaking I don't put the heating on. Although I might have done a couple of times this week. I get up while everyone else is still in bed, and eat my breakfast. And then in the evenings I sometimes put it on, at 21 degrees. But usually it's you who puts it on.Int/Amanda: And what prompts us to put it on?
93

MSc AEES January 2014 Angela Lafferty
Tim: Just if we feel cold. I have noticed lately that I feel cold when I go to bed – I'm fine all evening but when I go in our bedroom it feels pretty cold. Int/Amanda: I feel though, that when the heating's on, the bedrooms heat up much faster than the living room. I know what you mean about the bedroom feeling cold, but that's because the heating's not on anymore when we go to bed. We -Tim: Yeah, I feel like we only have the heating on for a very short period of time, but it heats upvery quickly. Int/Amanda: I mean, we could leave it on so that when it reaches the set temperature it'll switch off automatically then keep coming back on when it drops to keep it warm, but we don't do that do we? We just switch it off manually when it reaches the set temperature. Tim: Yeah. We generally have one... boost in the evening, kids go to bed and they're fine. And we're ok in here (living room).Int/Amanda: And so, you set it to 21 then?Tim: I think so, yeah.Int/Amanda: I find that it doesn't actually reach the temperature it's set to. I always set it to 22.Tim: But we sometimes turn it down before it gets there.Int/Amanda: No, but even if you leave it, the thermostat says 21.5 even when it's set to 22.
3.2 - What are the programmed (or usual manual) settings? Is it the same every day? (PROMPTS - Do you ever override it? If so how often? Why? Who? When? Does it just dependon whether you are home, how cold it is etc?) Do you ever forget to switch off?
3.3 - Do you have a usual target temperature? (PROMPT: or does it vary within a range ie. 20-22°C?
Int/Amanda: Do you feel that you're comfortable in a range of temperatures then?Tim: Yep. I think I'm very comfortable, very easy-going.Int/Amanda: Well, I'd say I don't really feel comfortable if it goes below 20 ish on the thermostat. Often that's when I'll decide to switch it on. I try not to use it during the day, but as the weather gets colder I think I do use it more and more, even just for a short blast.
3.4 - Have you ever adjusted the thermostat settings (from default) since you moved in? (PROMPTS - Do you ever look at instructions? Did you when you first programmed it? Proportional band width (default 1.5C) or boiler cycle rate? Do you use optimised setting? Did you know it had one?)
Int/Amanda: Have we ever adjusted the thermostat settings from the default?Tim: No.Int/Amanda: Did you know it had an optimised setting?Tim: No, how does that work?Int/Amanda: I'll give you the instructions (laughs). It learns your pattern, and works out what time to come on at to heat the house to the right temperature by the time you get up, or come home from work, because the outside temperature is different every day.
3.5 - How did you learn to use the thermostat programmer? Do you find it easy to operate?(PROMPTS: did you use instructions, were you shown by seller, or just figure it out?)
Int/Amanda: Ok. How did you learn to use the programmer?Tim: I think, the day we moved in, a manager form Wimpey showed us round the flat, a site manager or something.Int/Amanda: Yeah, I think that's right. And do you find it easy to operate?Tim: Very easy.
94

MSc AEES January 2014 Angela Lafferty
3.6 - Do you ever adjust the settings on the boiler?PROMPTS – hot water temperature and/or central heating temperature? Do you know what they do?
Int/Amanda: Do you ever adjust the settings on the boiler?Tim: No, I've never done that. You have though, trying to fix it.Int/Amanda: Yeah, I did, when it broke back in August, and I looked at the instruction manual to try and work out what was wrong, and I realised you could change the water temperature for the heating and for the hot water. It's not very easy to work out what temperature you've set it to though 'cause it's not marked on the dial. And it also doesn't tell you what's the best setting. But I think I put the heating UP, because I always feel that the living room's cold,and I put the hot water DOWN, so we don't need to mix so much cold in for the kids' bath.
3.7 - How do you control your TRVs?(PROMPTS – what are they set on, all same, do you vary them? Do you understand what they do?
Int/Amanda: How would you say we control the thermostats on the radiators, the valves?Tim: Well, I know how to do that!Int/Amanda: But do you do it? We don't adjust them on a daily basis do we?Tim: No. Int/Amanda: Do you know what they're set at?Tim: Five. I think they're all at maximum.Int/Amanda: Yeah, they are. I've checked. And we generally don't adjust them, maybe only if some of us were away. Like when you took the kids to your parents for a few days, I turned their bedroom ones down. And shut their doors, otherwise there's no point.
4 - VENTILATION
4.1- Describe window opening in winter? (PROMPTS – every day all day/ every day couple of hours/ after showers/during cooking/ occasionally/ never....while heating on? Depends on weather/wind. Who does it?)
Int/Amanda: Ok, ventilation. Can you describe our window opening, in autumn/winter?Tim: Well, I think a couple of mornings in winter, I have had a shower...or autumn, I mean it's not officially winter till the 21st December, but...I've opened the (bedroom 3) window after a shower to try and ventilate the flat and get rid of steam, but you've gone and closed it, saying it's too cold. So we put the fan..the extractor fan on.Int/Amanda: Yeah, I mean, I really don't like the windows open in winter, it's just too cold and unpleasant. And then I just need to put the heating on to warm up again.Tim: Yeah, but even in winter, I do sometimes think we should open the window in the morning,just to freshen it up a bit, I think it feels a bit stale in the mornings.Int/Amanda: But you don't do it that often, because you know I won't like it?Tim: Yeah, exactly (laughs). I mean...I wouldn't leave it open for long, I agree, it is too cold now. But in the summer I think we should do that.Int/Amanda: We do do that in the summer, I think the windows are open every day in summer, maybe not all day. And not all of them, because of the wind... Tim: Yeah, yeah...that's true.
4.2 - Is it different in summer? What about September?(ie. is it a gradual change?)
Answered above.
95

MSc AEES January 2014 Angela Lafferty
4.3 - How are window trickle vents set? Do you alter these much/ever?
Int/Amanda: And what about the trickle vents? Tim: Generally speaking, I leave them trickle vents open...In recent days, with the very windy weather, you have closed them.Int/Amanda: But would you never close them?Tim: No I would close them too, I certainly...I used to, when we first moved into this flat, I used to open and close them as a first step before putting on the heating, but now I've just sort of reached a sort of general... pattern, where I just leave them open. But in really wild windy conditions I would shut them, although...I don't like them to be shut when there's washing drying in the flat. I think sometimes you do that. Int/Amanda: I think sometimes, if I do that, I'll have the fan on, just on the trickle setting. It's just when the weather's too bad outside.
4.4 - Do you use the mechanical ventilation system? If so, describe use pattern?(PROMPTS – ie always on trickle/only during showering/cooking/ as and when needed? If not why not? Noise/energy consumption? Do you think it works?
Int/Amanda: So...well,the next question is whether we use the mechanical ventilation, so-Tim: Yeah, well sometimes, maybe not as much as we should, because when we have showers we generally leave the bathroom door open for the kids...so it's still on but probably not as effective.Int/Amanda: I agree, I'd say we put it on 2 during and after showers, but otherwise it's switch off at the wall. And occasionally on the trickle setting if window vents are shut.
4.5 - Same question for cooker hood extract.
Tim: And I think we under-use the kitchen cooker hood, we generally forget to put it on. Sometimes...I'll maybe open the balcony door...but the windows don't steam up like I've seen other people's. Not often anyway.Int/Amanda: Well, for me...I can't stand the noise. And that's actually the same for the bathroom extracts, it really puts me off using them. For the bathrooms, I don't like it being used early in the morning because the noise wakes everyone else up, especially in bedroom 2, and Ijust hate having such a loud noise in the kitchen when I'm cooking, it stresses me out, especially with the kids and the TV on, the noise just drives me crazy.Tim: Yeah, the fan is really noisy, but I've never been woken up by it because no one else ever gets up before me! (Laughs).
4.6 - Are your internal doors normally open/closed? (PROMPTS - Variable? Which rooms? Any reason)
Int/Amanda: Ok, so internal doors...Tim: They're normally open.Int/Amanda: Well, I'd say that the living room door and Ralph's door (4 year old son - bedroom 2) are always shut in the evenings...Tim: Well, yeah, they are. The others are always open though.Int/Amanda: Yeah. I would say...I suppose, you're not here that much during the day, but I generally keep that door (pointing to living room door) closed a lot of the time, in the day.Tim: Oh, ok yeah...Int/Amanda: And so does Alicia (2 year old daughter), she loves shutting it...Tim: Oh yeah, she just slams it shut all the time, doesn't she?Int/Amanda: She can't stand it being open – she just goes over and slams it. I guess she's used to it being shut.
96

MSc AEES January 2014 Angela Lafferty
4.7 - When do you close your blinds/curtains?
Int/Amanda: And what about the blinds and the curtains? Tim: I've got into the habit, I don't know if you've noticed, of closing the blinds (living room, floor- length), in the evening.Int/Amanda: Yeah. I suppose...we don't shut them in summer do we, so it takes a while to get back into the habit of doing it again every year, when it starts being dark in the evenings. I thinkyou started doing it at the beginning of October, I noted it in the diary.Tim: I mean, there's a few reasons why I like them shut...I feel, like it feels a bit more private when they're shut, even though we're on the fourth floor and there's no one opposite, although now there is that new block diagonally across from us...But also I think it does stop some heat from going out.Int/Amanda: Yeah, it just feels nicer too, more cosy...when it's cold and dark outside. It probably does stop the draught from the trickle vents a bit... And we always shut the bedroom curtains at night, all year round.Tim: Yeah.
5 - COMFORT ACTIONS
5.1 - Describe yourself + comfort requirements (if not already been covered)(PROMPTS – like it warm, like it cool, neither, varies...)
Int/Amanda: Ok. So...describe yourself and your comfort requirements...like, do you often feel hot, do you often feel cold, are you a warm person or are you a cold-Tim: I think I'm a warm person...I think this flat is warm.Int/Amanda: Ok...Tim: Actually, thinking about it now, I'd say I'm slightly on the cold side...right now, I mean, but itdoesn't really bother me. But I don't ever mind you turning the heating on though...Int/Amanda: So, do you think you'd put it on less, if it wasn't for me? Like, if you were living here by yourself?Tim: No, not really...well I don't really know. Possibly, yeah, 'cause I'm quite stingey as well. I don't mind the amount we use just now though. Although, I think if you and the kids weren't all here, if it was just me, it would be colder, so I might have the heating on the same amount anyway.Int/Amanda: Well, that's really interesting, because...say...at the moment we're both studying and working on our laptops every night, sitting separately at the table, but say we were both snuggled up together on the couch at night...watching a film, like we used to before ...we got sobusy...then, we'd keep each other warm. Possibly have the blanket too, but we wouldn't feel as cold as we do when we're sitting still at the table.Tim: Well, since I've hurt my back and I've been using the laptop lying on the floor instead of atthe table...I've been getting really cold, though I don't always notice until I'm finished...and I get up and...realise, I'm really cold.
Int/Amanda: Well, as for me, I would definitely describe myself as a cold person. I'm nearly always cold. Everywhere I go, like in restaurants, at work, other people's houses...except Mum and Dad's...in the evenings. And your Mum and Dad's, in the evenings too. Tim: Yeah...they're warm.Int/Amanda: I'm quite often cold at both of them during the day though. And I would never have just one layer on, even here... at home... when I have bare skin I just feel cold. Usually I have a top, with a dress over it, jeans and one or two cardigans...in the winter.Tim: I know, you're a lizard (laughs).Int/Amanda: ...and I think even in summer, I would only have bare arms if I went outside...if it'sa hot sunny day I mean – it doesn't ever get that warm in here, like maximum 21 ish I think...from the thermostat...?Tim: Yeah, I think it's about that, maybe 20 to 21 over the summer Int/Amanda: I've just always been like that though...Well, since I can remember...maybe not
97

MSc AEES January 2014 Angela Lafferty
when I was little, but…since I was a teenager anyway. Tim: You should go to the doctor... Int/Amanda: Yeah...actually I think I did...when I was pregnant, the first time...I remember going to the doctor about it 'cause it was really bad, but...they said it was nothing. Just poor circulation.
5.2 - Do any rooms feel particularly comfortable/uncomfortable, cold/warm in general (winter)?(PROMPTS – Explain further. Or does whole flat feel same temp?)
Int/Amanda: Anyway...do you think all the rooms feel the same, or do you notice a difference...in any of them?Tim: I think Alicia's room (bedroom 3) is the coldest...Int/Amanda: Yeah, that is a cold room...but it does heat up fast with the radiator on. I really stillthink the living room is the coldest – in winter- not in summer. Then I think it's probably the warmest. Especially in the evening. And it's the evening too, in winter, when it feels the coldest..mainly, I think...in the daytime it's not so bad. Maybe because we all spend most time in there...I mean with the kids...and if I cook...and especially if it's sunny, then it's lovely and warm.
5.3 - If you are cold one eve watching TV, what do you do?(PROMPTS - Would you ever, put on a cardigan/jumper/slippers/blanket/HWC/hot drink etc/shut vents/put up heating.....)
Int/Amanda: So, for example, if you were sitting watching TV one night, or working, and you felt a bit cold...what would you do?Tim: Ehmmm...I don't think I really have a standard answer to that I'm afraid...Int/Amanda: Well, I'll give you some prompts and you can say if you think any apply to you. Would you put on a cardigan or jumper-Tim: Yes I would.Int/Amanda: ...slippers, blanket, hot water bottle...?Tim: I'd just put an extra layer on...my top half. And maybe a blanket, on the couch.Int/Amanda: But not a hot water bottle, and you don't like hot drinks...Tim: No.Int/Amanda: Would you shut the vents?Tim: Well, I have done in the past...(pause)...but I think since we put the blinds up they don't need to be shut anymore.Int/Amanda: Well, yeah, unless it's really windy I would say. And...would you put up the heating, if you were cold?Tim: Yes.Int/Amanda: But would you do that after putting on an extra layer...or, would you just put it up if you felt like it?Tim: Well...I probably...well,it's been so much in the media now, about conserving energy, so...yes, I think I'd always put another layer on first, before turning up the heating.Int/Amanda: Ok, so -Tim: But it also depends on time...I think, earlier in the evening I'd probably just put up the heating, but as the evening goes on, I'd think,well it feels a bit silly now to switch it on,so I'd justput on an extra layer.Int/Amanda: Ok.Tim: But ...maybe I am a bit inconsistent though...Int/Amanda: But it's true though, what you said about timing though, because we do...it's not just us it's for the kids too...so,I agree, I think we're more likely to put it on early in the evening, but not so much later on. We just switch it off and deal with it if it gets a bit colder...Not always though...And sometimes we forget.Tim: Yeah, that's true...and it comes on and off all night...but not often though. It's happened a few times.
98

MSc AEES January 2014 Angela Lafferty
Int/Amanda: So, if I'm cold watching TV...I will have hot drinks, and use the blanket, even if theheating's on...and if it's really cold I'll sit with the hot water bottle the whole evening. And probably take one to bed too. For my feet really, they get like blocks of ice.Tim: I know, I hate it.Int/Amanda: I'd probably not turn the heating up any higher, like...I'd leave it at 22. I think maybe very very occasionally I've put it to 23, but hardly ever. I'd leave the heating on for the evening though...instead of switching it off straight away. So it doesn't get cold again so quickly.
5.4 - Do you ever use any additional heating?ie kitchen heater, electric heater, elec. blanket etc
Int/Amanda: And do we ever use any additional heating ...like that plinth heater in the kitchen?Tim: No.Int/Amanda: No, never.Tim: You use hot water bottles. Int/Amanda: Yeah, well I already mentioned that, and it's not heating...as such. Well...I suppose it does use energy to boil the kettle. I'd normally boil it for tea anyway, but just put more in for a hot water bottle. You could use one too, if you were cold...we've got 3?Tim: I know! But...I don't need it.
5.5 - What is your normal evening attire in evening (watching TV for example?) PROMPTS – Do you dress the same as daytime (at home) or do you add layers?
Int/Amanda: Right...what is your normal evening attire, in the living room?Tim: Tracksuit bottoms and a T-shirt. Actually, recently I've been still been wearing my work clothes...a jumper and a shirt.Int/Amanda: Well, how many layers?Tim: One or two, at the most. Though I think this winter...maybe it's because of my back...I've been wearing more layers to work than I've ever done previously. Except when dressed by my Mum...(Laughs).Int/Amanda: And in a typical day, at home...so, the weekend, would you change the number oflayers from daytime to evening?Tim: Would I....no, it'd probably stay the same...Int/Amanda: Ok...Some of these questions are inspired by me, because I know that I quite often put on extra layers in the evening. I guess when I'm not so busy with the kids..'cause I know that I'm going to be sitting still.Tim: Yeah, actually now I remember that if I ever mention to you...on the odd occasion that I'm cold, you say 'But you've got a T-shirt on Tim!'Int/Amanda: Yeah, I'd say that happens...yeah, you often do that! 5.6 - Are there any draughts? Any other problems?
Int/Amanda: So, would you say there are any draughts or other problems in the flat?Tim: There are draughts in the flat, but I think they're deliberate...I'm happy to have draughts. I mean, they serve a function, in that they freshen up-Int/Amanda: So, you're talking about the trickle vents?Tim: Yeah, and I deem that a draught.Int/Amanda: Ok, yeah...I agree you can feel draughts from the vents. But I think the balcony door is the main one.Tim: Well yeah, there is a draught from that...people always comment on it if they're sitting nextto it. Yeah, it never got properly fixed did it...the new door was just as warped as the old one.Int/Amanda: Yeah. Any other draughts?Tim: There's a draught from the front door...that's why I got that draught excluder.
99
MSc AEES January 2014 Angela Lafferty
6 - ENERGY COSTS
6.1 - Who is your Gas supplier?
Int/Amanda: So, gas supplier...Scottish Power.
6.2 - Who is your Electricity supplier?
Int/Amanda: Electricity...is Good Energy.
6.3 - How do you pay your gas & electric bills? (PROMPTS – Quarterly, monthly Direct Debit...)
Int/Amanda: We pay quarterly, don't we?Tim: I don't know, yeah...Int/Amanda: Yeah we do!Tim: Do we?Int/Amanda: Well it's not monthly!Tim: Yeah quarterly then, yeah...whenever the bills come through.Int/Amanda: Yes it's quarterly, using actual meter readings.
6.4 - How do your fuel bills compare to those at your previous home?
Int/Amanda: How do you think the bills compare to those at our previous home?Tim: I think proportionately, they're cheaper...because this is a newly designed flat, and the last one had single-glazing and lost heat really quickly, whereas this...I think...maintains its heatreally well...although it's a much bigger flat. That one was also in a basement, so that made it colder.Int/Amanda: Yes, it was about 200 years old, with solid stone walls...definitely had higher heating bills than here...
6.5 - How would you describe the cost of heating your home to a comfortable level?
Int/Amanda: And how would you describe the cost of heating this flat to a comfortable level?Tim: Fine. (Pause) It's much talked about in the media, the expense... but I think we're quite conservative in our use, and we've got a new-build flat...I think people lack perspective on the price of energy, although maybe...when there are reports of huge profits, prices do then...seem unreasonable. But I just think people are more prepared to buy the latest gizmos, and beer...and cigarettes and just crap in general, than they are to pay to heat their homes. But that's probably not a popular view...Int/Amanda: Well I agree. I don't think energy costs that much...somehow people don't mind paying a fortune for mobile phone contracts, or putting petrol in their car...I mean, say a full tank is about...£70? And you fill it up once a week...if you commute, or drive around a lot...that's nearly £300 a month! Even every 2 weeks, that's still £150 a month. I suppose people still do complain about petrol prices too though...But mobile phone contracts, and Sky subscriptions...people choose to have those.
6.6 - What is the average cost of your gas / electricity bills per year?
Int/Amanda: So...do you know..what is the average cost of our gas and electricity per year?
100

MSc AEES January 2014 Angela Lafferty
Tim: (Long pause...) £400...? No actually, I think it's gone up...our last one was about £130, butin the summer it was £83 I think...so yeah, about £450 ish. To Good Energy that is...Int/Amanda: Ok, so that's electricity. And for gas?Tim: Mmmm...about the same...I think? Yeah, between four and five hundred anyway.Int/Amanda: I don't know actually. They're in your name, so you always pay them, I don't reallyeven see them...Tim: Yeah that's true, it's always me that pays them. But I can't...Int/Amanda: I just remember, when we had to pay the whole two first years of gas at once..remember? When they couldn't find us on their system, and it was £666, I always remember that, so £333 a year. But that was four, five years ago now...so it will have gone up by now. So £450 is probably about right...I guess.
6.7 - How do you think you compare to average population? Why?
Int/Amanda: Do you think we use more or less energy than the average population?Tim: I think we use less.Int/Amanda: Both gas and electricity?Tim: Ummmm (long pause)...I'd still say less...'cause we turn everything off.Int/Amanda: Yeah. I think less for electricity, because of that, and less gas too, but only because we live in a new house...I mean, I think we have it warmer than most people, so...it would be really expensive in an older house, but here it's ok.
6.8 - ...to other flats? ie. roughly same, more less? Why do think that is? Do you care?
Int/Amanda: And how about, compared to other flats in this development?Tim: No idea...At a push I'd say maybe less, because we do try to be careful...but I don't know.Int/Amanda: I can't guess, because I have the meter readings...so I know. We use quite a bit less electricity, though I'm quite surprised...because I feel like we have our lights on all the time,and we've got so many of them...I suppose we don't use the electric shower just now though...uhmmm, and for gas we come between the other two flats.
6.9 - Would you like to use less (or more) or are you happy with the way things are?
Int/Amanda: Would you like to use more, or less energy, or are you happy with the way with what we use?Tim: Well...I think I'd always like to try and use less...if I could. While it's not renewable. Even though we do use Good Energy for electricity...which is meant to be 100% but...Who would want to use more, when you pay for it?Int/Amanda: Well, people who feel their house is too cold, but they can't afford to use more...Tim: Oh right. Well, that's not why we don't use it more.
6.10 - If energy costs increased substantially, what would you do?(PROMPTS - Pay the bill whatever the cost /Only heat certain rooms/Put up with the cold in order to save money/ Reduce heating duration/Other/)
Int/Amanda: If energy costs increased substantially, what would you do? ie. Would you...pay the bill whatever the cost , or only heat certain rooms, or just put up with the cold to save money, or have it on for shorter periods...or lower the thermostat...or..?Tim: I'd probably just pay it. But...I'd consider various measures in future...I would consider not heating certain rooms if they weren't being used, but they all are at the moment, so...and I would be open to having the thermostat on lower...but my main answer would be...I'd just pay it.Int/Amanda: Yeah, I have to say me too...even though I know I shouldn't. It's just that...we probably wouldn't even notice it going up anyway, because we...obviously don't pay that much attention to our bills (laughs). And we don't think it's that expensive, but I suppose if things were... to get tight, then maybe we'd look at it properly. Obviously, as well though, I'd be keen
101

MSc AEES January 2014 Angela Lafferty
to reduce how much we use for environmental reasons, I mean...that's the reason I'm doing all this in the first place...the whole MSc I mean...so, I would definitely think about changing the way we operate our heating, after this is all over and I understand it all better...how the flat works.
7 - GENERAL
7.1 - Has there been any instance of asthma or other similar health problem that could be associated with the living environment?
Int/Amanda: So...you have asthma, but you had that before you moved here. Do you think Ralph's (potential) asthma's got to do with living here?Tim: No.Int/Amanda: D'you think it's just genetic, passed on by us?Tim: Yeah.
7.2 - Is there any condensation or mould growth in the home? PROMPTS - Windows, shower/cooking moisture... Why do you think that is?
Int/Amanda: Do we have any condensation or mould growth?Tim: Yes.Int/Amanda: Describe...Tim: Well...I think there's a tiny bit of mould on the window sills, in the bedrooms...where they meet the plastic seal.Int/Amanda: No...I'd say it was where the glass pane meets the plastic frame, there's sometimes a tiny wee bit there, in the corner...but I wipe it off quite frequently. Is that what you mean?Tim: Maybe yeah. You get the odd bit of condensation there...Int/Amanda: I'd say we get it every day...in winter I mean, not in summer. Maybe you don't seeit so much as you leave before the curtains are open in the mornings...Tim: Yeah, that could be...Int/Amanda: Might be to do with the shower, and not having the windows open.
7.3 - Any eco/ energy saving habits? ie switching off lights, 30 degree wash, hanging not tumble dry?
Int/Amanda: Ok, and...would you say you had any eco or energy saving habits?Tim: yes...plenty. Do you want me to go through them?Int/Amanda: Yes, briefly...Tim: We turn all the power off at night, except the fridge. We switch lights off in rooms we're not in...we've discussed some already...like closing doors to keep the heat in here (living room),wearing extra layers. I mean...the kids never say they're cold, do they?Int/Amanda: No...but they've got different metabolisms, haven't they? Occasionally, Ralph will say he's cold...quite often in the morning, when he gets up. Things like not using the tumble-dryer, we only use that once in a blue moon because the washing machine repair guy told us to...Tim: Yeah, I forgot about that.
7.4 - Standby/switching off appliances?
Already covered.
102

MSc AEES January 2014 Angela Lafferty
7.5 - TV on in background while doing other things?
Int/Amanda: Would you say the TV was often on in the background?Tim: Sometime do, yeah. I often put it on the digital radio...I find the TV too distracting.Int/Amanda: I would say...I very often have it on when I'm doing other things. It's on quite bit for the kids, but I have it on when I'm making dinner...even if I'm just listening to it and I can't see it.
7.6 - Do you ever try to save energy? Do you think about it? Do you think about global warming/climate change, and think you have a role in it?
Int/Amanda: Do you think, when you're going about your daily life...do you think about global warming and climate change...those kinds of things?Tim: Yes.Int/Amanda: You do? What about it?Tim: I find it quite...burdensome to be honest. Not burdensome, that's the wrong word...I just think...everything I do, things like that just go through my head.Int/Amanda: And so you think you have a role in it?Tim: Yeah, I think if everybody plays their part, it would help. I think ultimately...big businesses make a bigger difference, but...I still don't think that's any reason to just then give up...we should still take responsibility for our own actions.
Int/Amanda: And I think it's obvious that I think about it, or I wouldn't be doing the course. I do strongly believe too...that we all have to play our parts in it, but it will take a big change in the way we live...everyone I mean.
7.7 - How, when, where are clothes dried?
Already covered.
7.8 - Do you use low energy light bulbs? When are lights on?ie when and which rooms. Evening all on? (heat gains)
Int/Amanda: Only 1 low energy bulb, in the lamp in the livingroom. There are a ridiculous number of halogen spotlights in the livingroom (which we did not choose), but we haven't been replacing the ones that die...so there are only 5 out of the 11 actually on at the moment. But wedo have the living room lights on for hours every night, as we're both working on our screens...probably from 3pm till about midnight... most nights in winter. Tim: Yeah.Int/Amanda: Ok, thanks, we're finished now.
THINGS TO NOTE -
Other differences – lighting (lamps)LIVING: 50W halogen (x11) KITCHEN : 50W halogen (x3) HALL: 50W hal. (x3)
BED 1: 50W halogen (x4) ENSUITE: 50W halogen (x2) BED 2: 50W hal. (x4)
BED 3: 50W halogen (x4) BATHROOM: 50W halogen (x2)
Radiator settingsLIVING 1: 5 LIVING 2(balcony): 5 BED 1: 5ENSUITE: 5 BED 2: 5 BED 3: 5
103

MSc AEES January 2014 Angela Lafferty
Trickle vent positions – usually all open
LIVING windows LIVING DoorBED 1 BED 2 BED3
OTHER NOTES -
Elec £400-450/year (≈ £35/month)Gas £400-450/year (≈ £35/month)
104

MSc AEES January 2014 Angela Lafferty
APPENDIX D – Interview transcript Flat B
NOTE – A small number of omissions have been made from the transcript, when the conversation strayed from the topic to personal matters, due to the interviewer and occupants being neighbours.
ASV= Annual Service VisitTRV = Thermostatic radiator valveInt: = Interviewer (author)
1 - HOUSEHOLD DETAILS: FLAT B
No Occupants - 2
Age bands 26-30, 31-35, 36-40, 41-45
Occupancy: Generally occupied evenings and weekends only.
2 - OCCUPANCY PATTERNInterviewer: Before we start, I just want to say, please don't feel that there's a right or wrong answer to any of the questions, just answer as truthfully as you can. There's no particular answer that I want to hear, and we all have good and bad habits, me included. I'm just interested to hear about how you use your house, not to judge anything that you do.
2.1 - When is your flat occupied?(PROMPTS: Same every day? Evenings & weekends? Different every week? Seasonal variation)
Int: So, your flat is pretty much empty during the week isn't it... you guys are at work? So it's just evenings and weekends you're here, or...? Gordon: I've not been at work for the last...month, I finished work up about a month ago Int: Oh right.Gordon: So for the last month I've been here. Int: OK, but in general...?Gordon: In general, yeah, we're in only evenings and weekends. Int: Ok.
2.2 - Has this been case for last 5 years? How has lifestyle varied?
Int: And... since you've moved in – did you move here about 5 years ago as well? Gordon: Yeah.Int: Do you remember what date it was? Gordon: Yeah, it was 20th of May.Int: 20th May...2008? Both: Yep, yeah.Int: And, has it more or less been the same in the last 5 years, like, just evenings and weekends that you've been here...because you were working full time. Both: (Nodding) Yeah.Int: Just that our house has varied so much, since, you know I've been on maternity leave, I've been back at work, I've been part-time, full-time...it's just different all the time so... Rachel: Oh yeah, of course...
105

MSc AEES January 2014 Angela Lafferty
2.3 - Describe a typical evening in your home (PROMPTS: ie which rooms are occupied, which activities are taking place, dinner time...ie “wewatch TV in living room most evenings”)
Int: Typically in the evenings....in your home...do you generally sort of ...stay in this room, or doyou...work in different rooms, or...? Gordon: Generally stay in this roomRachel: Generally........uh..mmm...it kind of depends, doesn't it? Like if the football's on and stuff like that, and I'm adamant that I'm not watching... (Interviewer laughs, Rachel laughs)...then I'll go through to the bedroom...Int: Yeah...that sounds familiar! (Laughs)Rachel: (Laughs) Yeah!...and um...weekends, I spend a lot of time in the kitchen, so...yeah.Int: Oh right, ok. And so, the TV would be on, and...generally...? Rachel: Yep, so Gordon would be here, like he is now, like, he'd be watching the TV but his laptop would be on and...yeah.
2.4 - Describe showering/bathing patterns.(PROMPTS: How many showers per week using electric shower?Length?Time?
Int: Oh right. Well, that's pretty much like ours I think...that's what people do. Cool, um...so basically, what I've been studying is..the... the gas consumption. I ...I know I've done electricity too, but that's sort of just a general background thing – it's gas that I'm really interested in. So I need to kind of ...'take out' ...cooking and showering...so that I can see what the heating -Rachel: Ok.Int: ...you know, because obviously the meter just takes them all together, so...do you use...have you got a shower in the other bathroom, or...? (Interviewer points to main bathroom while speaking).Rachel: Yeah, but we don't use it. Int: But you don't use it...so you use that one (Points to ensuite)...the electric one. Rachel: Yeah, we only use that one (main bathroom) when the one in the ensuite breaks down, so....Int: Ok. But it hasn't broken down while I've been monitoring...? Rachel: No. (pause) And we only switched the heating on, last...oh...was it Monday?Int: Really! The first time?Gordon: Monday or Tuesday, yep.Int: Ok. Rachel: Might have even been Wednesday you know...it was one day last week! Int: Ok, I'll probably be able to tell that from the data then, but that's good to know. I can't believe that! Wow, that's amazing. Rachel: Yeah, well, we...we try and hold off, especially 'cause now... the price hike in energy and everything, and Scottish Gas have now done away with the Employee Incentive as well, so... Int: Oh right, that's nice of them!Rachel: Yeah, well Ofgem made themInt: Oh right...Rachel: So yeah, we've tried to hold off as long as possible, and 'cause Gordon's not working as well, we're just a bit, sort of...arghhh (intake of breath), yeah it's going to be so expensive to...put the heating on these days, so... Electricity, you can't really get around it, you've got to use electricity one way or the other, but the heating....So we tried to not switch it on for as long as possible. We've got a blanket on the end of our bed, and like, if it's really really col- Gordon doesn't tend to feel the cold anyway, it's only me, so if I'm really cold I'll just bring the blanket through (to the living room) and...
106

MSc AEES January 2014 Angela Lafferty
Int: Ok, yeah, so back to showers...would you say you had, sort of...long showers, short showers, or do you know roughly how long they last? Gordon: I'm about 15 minutes, 'cause I'm, I'm..Rachel: You're a thinker in the shower...Gordon: I'm a thinker in the shower. I do all my best thinking in the shower! (Laughs) You're about half a minute (to Rachel)(Laughs) Rachel: D'you reckon?! I'd say, I mean I would say …Gordon: I'm only joking about that one! Rachel: I would say I have pretty long showers, unless it's....well, through the week, when I'm going to work …..they're quite quick, cause you haven't got time to stand there and...yeah, but the last 2 weeks when I've been off I've definitely had longer showers. Int: Oh right. ok. But both generally in the morning is it?Both: yeah.
2.5 - How many showers using gas shower? Length?Time?
Int: And so, you don't use the gas one at all. Gordon: No.
2.6 - How many baths per week? Time? How full?
Int: Do you ever have baths? Rachel: Occasionally, yeah. Gordon: Once in a blue moon. Rachel: I had one whilst the study was on, I might have had 2 actually...Gordon: Have you? Rachel: How long...when did you put the equipment in? Int: It was the start of September, maybe the 2nd week in September? Yeah. Rachel: Oh no, then I only had one. (jokes) it's a luxury...Do you find, when you have a bath, that you've just got to run the hot tap? Int: Well...to be honest I never have one, it's the kids have one every night, and we...I suppose we make it cooler for them because...so I do put a bit of cold in at the end. Rachel: Oh ok, yeah, no if we run a bath, literally it's just the hot tap, cause otherwise it's freezing. Int: Well, you know, I was just looking at your boiler settings, 'cause you can change them... mind you you've got yours up quite high...Rachel: Well, the last time they came and did the service, the ASV, he put it up quite high, because the boiler had developed a squeak, hadn't it? Like, every time it came on in the ...especially in the mornings, did it do it in the evenings? I cant remember...Gordon: It did it sometimes in the evenings, yeah...Rachel: ...it had this squeak...(laughs) so the guy came, and he couldn't see where it was coming from or anything, so he turned it up, the boiler, like the temperature gauge on it, he turned it up full bore I think, and that got rid of the squeak. But when I book the next ASV I'm going to ask them to look at that, because ...I'm not entirely sure that's the way to solve the problem. Int: Well, you hot water gauge is not right at the maximum setting, it's quite high, but the centralheating one is lower.Rachel: Oh is it? Ok...I wonder then if he turned the hot water one up, I was under the impression he turned the heating one up...Gordon: he did play about with the hot water quite a bit. Int: When was that – when you had that done? Rachel: I think that would have been last...December? January? About this time of the year I'd say. Int: Otherwise you've never altered the settings? Rachel: No, never touched the boiler, no. Boilers scare me! (Laughs)
107

MSc AEES January 2014 Angela Lafferty
2.7 - Describe cooking pattern.(PROMPTS – Mostly hob/oven/microwave? Frequency? Lunchtime cooking? During week?)
Int: And cooking, so... you don't cook here during the week at lunchtimes? Both: No. Int: Just the evenings?Both: Yeah. Int: And do you generally use the gas hob, or the (electric) oven, or both...?Rachel: It can be both, can't it? (to Gordon). Gordon: I would have said the oven more...Rachel: Not through the week, no, through the week I would say it's the hob more, and occasionally the oven, but at the weekend it's both.
3 - HEATING CONTROL
3.1 - How do you operate and control your central heating?(PROMPTS - manually, timer, constant thermostat...Why? Do you think it uses less energy or tosuit lifestyle...?)
Int: Ok, I mean, quite a lot of these questions, it's just so that, when I'm looking at the data, I can try and figure out what's going on, cause it' just going to be a lot of peaks and troughs, and I need to have a stab at what's going on... (laughs). Right, so now this bit we're going to talk about heating. So, how do you operate ...well, you only put it on the other day, but... Gordon: Just an hour in the morning and an hour at night. Rachel: I think its longer than that actually... Gordon: Is it? Rachel: Yeah...it comes on at.... Int: Sorry - so it's on a timer is it? Both: Yeah it's on a timer yeah. Gordon: It came on at 7 and finished at... Rachel: No it comes on at half 6 and I think it finishes at half 7 or 8, so an hour or hour and a half in the morning, and then it comes on at half past 4 in the afternoon...(long pause)... it....I don't know cause I just leave it the same every year, I just switch it on and then....Gordon: It's only on for an hour or so. Rachel: No, because its still on now (time) It definitely comes on at half 4, I'd say it stays on till 8 maybe? Gordon: You're kidding! Rachel: No but that's on timer, so it's only when it drops below...Int: Yeah if it meets your set temperature it will switch itself off...Rachel: Yeah, so it only goes on for a short blast to bring it back up again. Gordon: Oh right.
3.2 - What are the programmed (or usual manual) settings? Is it the same every day? (PROMPTS - Do you ever override it? If so how often? Why? Who? When? Does it just dependon whether you are home, how cold it is etc?) Do you ever forget to switch off?
3.3 - Do you have a usual target temperature? (PROMPT: or does it vary within a range ie. 20-22°C?
Int: So, what temperature do you set it to? Gordon: 21.Rachel: 22 I think it is..is it 21? Gordon: Maybe 21.5...
108

MSc AEES January 2014 Angela Lafferty
Rachel: Hang on I'll check....(pause). Yes, it's 21.5. Int: Thank you. And...are the times the same every day? Rachel: Yes, even at weekends, yes. Int: Would you, do you ever override the timer? Rachel: We haven't done since it's been switched on, although when I think I first switched it on I did put it on the wrong setting, so I put it on, I think automatic instead of manual or the other way around, so it was on for a bit longer in the evening than it was meant to be. Int: Do you mean last week when you first switched it on? Rachel: Yeah yeah. And generally speaking we don't (override) but there were a couple of times last year when we had washing hanging in the hallway, so we sort of switched it on for a couple of hours...just to try and get the washing dry so we could get rid of it, but...Int: But that's...kind of occasional? Rachel: Yeah. Gordon: Yes, very very occasionally. Int: So if you were here (at home) say, on a Saturday lunchtime, and you were feeling cold... Gordon: Probably not. Rachel: I'd just bring the blanket through (Gordon agrees).Int: OK. Rachel: Or I'd make Gordon make me a cuppa...(laughs) Gordon: Or both! Rachel: Or both, yeah! Or a hot water bottle, we've been using that a lot lately too...Gordon: You have. Rachel: Yes, I've been using it.
3.4 - Have you ever adjusted the thermostat settings (from default) since you moved in? (PROMPTS - Do you ever look at instructions? Did you when you first programmed it? Proportional band width (default 1.5C) or boiler cycle rate? Do you use optimised setting? Did you know it had one?)
3.5 - How did you learn to use the thermostat programmer? Do you find it easy to operate?(PROMPTS: did you use instructions, were you shown by seller, or just figure it out?)
Int: So when you first moved in, how did you programme the timer/thermostat?....(pause) Did you just sort of, figure it out or.... Rachel: The guy did show us when we first moved in, but that was obviously May, and we didn't switch it on until the December or January...I think that year it was actually the January. So I just played about..I guess the lucky thing is that with work, I'd had to do my City & Guilds on timers and stuff anyway, so I knew a lot of it already. Int: Ok, and do you know about or have you used the optimised setting? Both: No.Int: Did you know about it, or... Both: No...Int: I only found out about it from reading the instructions last week, I haven't used it either, but I can let you know more if you're interested? Rachel: Yeah ok. Int: Ok, so you haven't changed any of the default settings, you've just set the times? Rach: Yeah that's right.
3.6 - Do you ever adjust the settings on the boiler? PROMPTS – hot water temperature and/or central heating temperature? Do you know what they do?
Already covered in earlier section 2.6 about baths.
3.7 - How do you control your TRVs?
109

MSc AEES January 2014 Angela Lafferty
(PROMPTS – what are they set on, all same, do you vary them? Do you understand what they do?
Int: And, how would you say you operate the individual thermostatic radiator valves (TRVs)? Rachel: Generally speaking we leave them as they are....I think there are a few that are up to full bore, and again that was actually a Scottish Gas man that came round and did that because I complained about how little warmth there was coming out of.... that wasn't the last ASV, that was the one before. And especially this one here (living room) and the one in the dining room didn't feel as though they were warming up as much, so the guy just came in and turned them up full bore and said, yeah that's your problem. Again though, I'm not really sure that's actually the answer to the problem. Int: We have the same problem with the dining room one, even up at maximum, it seems to need to be bled regularly, like it seems to get air trapped in it and you need to bleed it. Just thatone though. Rachel: Ah, we've never had to do that. Gordon: We don't use the heating that often anyway...Rachel: Yeah, and actually, to be fair, we've probably got the heating on, more because we're worried about the pipes...Gordon: ...rather than the cold outside, it's not that cold, so...we probably wouldn't have had the heating on. Rachel: Well it's not cold for you! (Laughs) But those of us who are from Australia.....Int: So you were saying then, you don't sort of alter them on a daily basis then, the TRVs, they're just set as they are? Both: Yep, yeah. Int: Ok. And do you understand how they work? Rachel: Yes, well they make it hotter or colder...pause....it's something to do with the water flow that goes through it, and depending on how much water goes through affects the temperature of it. Taking me back to the City & Guilds! (Laughs)
4 - VENTILATION
4.1 - Describe window opening in winter? (PROMPTS – every day all day/ every day couple of hours/ after showers/during cooking/ occasionally/ never....while heating on? Depends on weather/wind. Who does it?)
Int: Ok, so now, we'll move on to ventilation...could you describe your window-opening patterns...probably focussing on winter first of all...Rachel: Ok, winter...generally...generally speaking we wouldn't open the windows. Until, I think it was last week, we had the vents in the bedroom windows open but then we had that cold snap they got closed, and I haven't opened them back up again yet. Umm... to be fair, through the winter, either one of us will sometimes go and open the vents and close the vents...it just depends... Int: Not the vents, sorry, the actual windows. Rachel: Oh the actual windows...no, generally not. Gordon: Only the balcony door gets opened. Int: Ok, and in summer...? Rachel: Yeah they're open a lot, and they stay open for …Gordon: I mean you open that window (living) and the door quite a lot I suppose...Rachel: Yeah and the one in the bedroom, our bedroom, but you can't have the ones in here and the ones in the second bedroom open at the same time, because that creates a vacuum.Int: Yeah ours is the same...Rachel: You've got to learn which ones...and sometimes I'll open the ones in the third bedroomand just leave that as well, but yeah...
110

MSc AEES January 2014 Angela Lafferty
4.2 - Is it different in summer? What about September?(ie. is it a gradual change?)
Int: And do you remember roughly, what time of year you stopped opening the windows, and kept them closed? Rachel: It was quite late this year actually...Gordon: I think you had that one open in the early part of last month (Oct) …Rachel: Yeah I think I did too... Gordon: So October, and as she said for the trickle vents in the bedrooms she only just closedthem last week.
4.3 - How are window trickle vents set? Do you alter these much/ever?
Int: So the trickle vents are normally open then, are they? (Referring to answer given earlier in response to window-opening question).Rachel: Well, no, well, the ones in the bedroom, our bedroom, yes, and throughout summer they're always open, and the window will always be open as well. Umm...but the trickle vents inwinter in the bedroom..........(long pause)....it's probably a bit hit and miss, I couldn't really say...occasionally yeah....Int: That's fine, that's ok, that's an answer! So, just as when you feel....?Rachel: Yeah, it's more if you remember it as well, 'cause sometimes I'll open it up, and then you climb into bed and think, gosh this bed's cold, and it's because the vents are still open. Int: So would you say you alter them on a daily basis, or...? Rachel: Not in winter no, it'd probably be...I'd say weekly is maybe even pushing it, it's probably every second week..eh...can I be really honest, it's only if I wake up and the bedroom's stuffy, that I'll open the vents up in winter. Int: So, on default they're closed, and you'd open them if you felt like you needed more fresh air, rather than the other way round? Rachel: Yeah. Int: Right, ok. And in here (living room)? They're closed. But that's because we do go out on the balcony, because we put like, bottles of water and stuff out there at this time of year, so we're forever in and out, so it's not like......Gordon: Watering the plants as well... Rachel: Exactly, and Gordon has a nasty habit if he goes out on the balcony, he just leaves thedoor wide open...(missed out a section) So I think this part of the flat gets plenty of fresh air.(Big blurb about not being right or wrong, its feedback for designer etc)
4.4 - Do you use the mechanical ventilation system? If so, describe use pattern?(PROMPTS – ie always on trickle/only during showering/cooking/ as and when needed? If not why not? Noise/energy consumption? Do you think it works?
Int: How about the mechanical ventilation/fan, do you ever use that?Rach: That does-...Gordon: Very very rarely.Rachel: Well, no I've had it on twice this week already. I use it, Gordon doesn't. Int: So could you describe how, when, why you use it? Rach: When we first moved in, we used it all the time, and that was because when the guy firstshowed us around the flat he said that was...the circulation for when you're in the bathroom,to take the moisture out, so you wouldn't get problems with the bathroom. Umm, but when we started getting problems with the bathroom, we got them back in ...to check the vents. They changed it and said no, it's actually just a fresh air vent, it's not anything to do with taking moisture out, so.... Gordon: And it wasn't connected properly. Rachel: Yeah the one in the bathroom wasn't connected to the vents bits, so they had to put a big hole in the ceiling and fix it, and then putty it back over again.
111

MSc AEES January 2014 Angela Lafferty
Int: So when you said-sorry...that you were having problems with the bathroom, that was to do with your walls was it, or...? Rach: Yeah, yes, the moisture and stuff from the bathroom, just from the showers...umm, and Ihave a real issue with not having windows in bathrooms..I like to have.....At this time of year in a bathroom, I would have the window open now...So we got them back through, they said it was just a fresh air vent, so..I probably use it, it's on most weekends, you know like after we've had showers and stuff, 'cause at the weekend I do tend to take a longer shower, and the room's a bit....so..Int: What setting do you put it on when you do that? Rachel: 2. It's always on 2. I don't think 1 does anything. I don't think 2 does anything either, I think it's psychological...Int: Have you got a middle setting as well? Rachel: No just 1 and 2...Gordon: No. Int: Oh have you not? Rachel: Middle means its off...Int: Can I just go and have a look at it? Both: Yeah Int: Just that I thought it was the same as ours...(pause) Yes, I think it is the same as ours, themiddle setting is 'trickle'...ours certainly is, and it looks the same as ours...Rach: Oh really? They said... Int: When we first moved in, the guy told us. If the house is really quiet you can hear it, well ...we can certainly hear ours, even on the middle setting. Rachel: I can always hear, in the 2nd bedroom, and Gordon's sister's fiancé doesn't like sleeping here because it's noisy, and I just thought it was because...there's a pipe that comes out...in the middle of that wall? Int: Well, the boiler flue goes that way...and the extract duct...Rach: Yes that's it, so I just assumed it was like, all of that kind of stuff...I didn't realise the fan was on all the time...? Int: Yeah, I've been quite conscious of that in our flat, same thing, when people come to stay (in bedroom 2) and you switch the fan on 2 after a shower it's so noisy and wakes them up...Both: Yeah it's so noisy.Gordon: So how do you switch it off then? Int: There's an isolator switch on the wall there. Rach: Yeah, next to the lightswitch...But he actually told us just leave that switch on? Int: Yeah, they told us that too...but-Rach: Oh ok, I didn't realise, I had no idea...You've taught me something! Int: It's interesting that you didn't know it was still on though, I mean, they told us to leave it on too, but the first night we were here it was so noisy, we actually thought it was coming from outside and didn't realise it was the extract....Rachel: You get used to it, don't you? You (talking to Gordon) don't hear it, you're quite lucky, but I do tend to hear it, and like...if I've switched it on and I've forgotten that it's switched on, I can always hear it when I go to bed and I get up and turn it off again. Int: Yeah, me too. But...so, you always have it on the middle setting then... Rach: Yeah, I just didn't realise that. Int: Well, it doesn't use much energy, but it is on, just to let you know...but it's good, I mean it's giving you a low, constant level of ventilation.
4.5- Same question for cooker hood extract.
Int: Oh yes, and your cooker hood, do you use that? Rachel: I...eh...occasionally. I don't think it's a brilliant cooker hood, so...I don't see much effectfrom it when I do use it. I can't actually tell you the last time I used it. Gordon: We'd just open the door (balcony door). Rach: Yeah and it's really noisy, and so, like if I'm in there cooking, and Gordon's in there watching TV...you can't hear anything, so, yeah, we tend to open the door.
112

MSc AEES January 2014 Angela Lafferty
Int: All really interesting to feedback to the designers....Rachel: Yeah, and I also put in my survey (BUS) that with the layout, it's the fact that you've got your kitchen just there, with the washing machine and dishwasher,so even if I'm not in therebaking, if you're trying to watch the TV and one of those is on...you're snookered, you can't hear anything.
4.6 - Are your internal doors normally open/closed? (PROMPTS - Variable? Which rooms? Any reason)
Int: And ….the doors inside your flat...is that the way they are generally? I mean, all propped open? Rachel: Yeah, we know that's naughty, but.... (because they all have self-closing mechanisms as they are fire-doors) Int: No, I'm not asking from a fire point of view...we've actually taken all our closers off the doors so they don't slam shut, because of the kids...we were worried about their fingers. Rachel: Oh have you? I do find...I think in Britain it's gone a step too far....(bit about Wimpey guy and fire insurance etc) Int: But, yeah, I was just interested to know how you have your doors....You mentioned about not being able to have living room and bedroom 2 windows open at the same time in summer, but if you closed this door that would stop the suction....Rachel: Yeah, but no we don't do that.
4.7- When do you close your blinds/curtains?
Int: Ok, that's fine. Em....and you've not got blinds or curtains in here (living room) Both: No. But I noticed you do have blinds in the bedrooms...Rach: Yeah. We just couldn't decide what to do in here...and we've lived here like this for so long now that I'm just used to it. Gordon: We'll wait until they build across there (referring to proposed flat development directly across the road)....We're high enough up....... (cut out blurb about our own blinds) Rachel: I quite like having nothing there, it just makes it feel a bit more...spacious. Int: And in the bedrooms, do you close the blinds, or...? Rachel: Our bedroom, we do at night time...Gordon: The others ones, they just stay as they are at the moment...Rachel: Unless we've got somebody staying in the 2nd bedroom, but ...that's few and far-between these days...
5 - COMFORT ACTIONS
5.1 - Describe yourself + comfort requirements (if not already been covered)(PROMPTS – like it warm, like it cool, neither, varies...)
Int: Ok. So, now we'll talk about your (comfort) preferences, you've already told me you don't feel the cold (to Gordon) but you do (to Rachel)....and that's a general thing, would you say, every day?Both: Yep.
5.2 - Do any rooms feel particularly comfortable/uncomfortable, cold/warm in general (winter)?(PROMPTS – Explain further. Or does whole flat feel same temp?)
Int: And throughout the flat, do you notice that any rooms are particularly warmer or colder thanother rooms, or.....do they all sort of feel the same....or....?
113

MSc AEES January 2014 Angela Lafferty
Rachel: ...I would say...that....the living room and the dining/kitchen area are warmer than the bedrooms. Int: And is that...in winter, in summer, or throughout the year the same? Rach: Yeah. (ie same all year). Because when one of us gets kicked through to the bedroom towatch... football or not football as the case may be..the other one is on tea duty because it's colder through in the bedroom, so...Int: Ok. That's interesting, because I feel the same in the summer...I would say that this room's definitely warmer. But in winter, when the heating's on...I think you said before, because the radiators in here, they're quite small... Both: Yeah Int: (cont) ...and the room doesn't really seem to heat up as much as the others, when the heating's on, that's what I find... Rachel: No, I don't know whether it's because I do a lot of baking though....so the oven's... Int: Yeah, so the kitchen's adding heat to the room... Rachel: Yeah...
5.3 - If you are cold one evening watching TV, what do you do?(PROMPTS - Would you ever, put on a cardigan/jumper/slippers/blanket/HWC/hot drink etc/shut vents/put up heating.....)
Int: And....I think we've covered this already, but if you were sitting watching TV here one evening, and you're feeling a bit cold, what would you do?Gordon: Get the blanket.Rachel: (simultaneously) Generally bring the blanket through. Int: Cup of tea, you said as well? Rach: Yeah, or hot water bottle...
5.4 - Do you ever use any additional heating?ie kitchen heater, electric heater, elec. blanket etc
Int: Ok. Do you ever use any additional heating? Like.... Both: No. Int: And do you have, under your cooker, a little fan heater thing...Both: Yeah.Int: Do you ever use that? Gordon: No. Rachel:...Except if Gordon's doing the hoovering and... Gordon: ...and I can't hear it switching on if I've accidentally banged into it.
5.5 - What is your normal evening attire in evening (watching TV for example?) PROMPTS – Do you dress the same as daytime (at home) or do you add layers? Int: Ok, and now I'm going to ask you about what you normally wear at home... (laughs) I knowit may seem like a strange question, but I just mean how many layers really. Rachel: Oh ok, I wear more layers than you (to Gordon) Gordon: Yeah I normally just wear the one layer. Int: Long sleeves, like you are now, or...? Gordon: I very rarely wear a T-shirt, so like a long-sleeved shirt or something like that. Int: And this is really autumn/winter I'm talking about... Gordon: Yeah. Int: Does it vary during the year? Rachel: I will wear multiple layers, minimum of 2. Int: Mmm-hmm...and is that like...so, you're wearing thin cotton...
114

MSc AEES January 2014 Angela Lafferty
Rachel: Yeah so I'm feeling a bit warmer today so I've only got the one layer on today, but yeah normally it'd be like...jeans, or track pants, and a T-shirt and a jumper, or...a long sleeved top like this....yeah. Int: And, would you say, cause you've only just switched your heating on last week...would what you wear change from when the heating's not on to when it is on? Rachel: No. (long pause). Just the frequency of the blanket. (Laughs)
5.6 - Are there any draughts? Any other problems?
Int: Ok. And are there any draughts, do you ever feel any draughts in the flat? Rachel: Yeah. That door has actually got a bow in the top left hand corner, which I've asked them to come and fix numerous times, and they've never been able to. And they refused to put a new door on it. So yeah... Int: We all have the same problem then! We had ours replaced actually but it's still the same...Rachel: Yeah, I mean in the middle of winter when its blowing a gale, and you're sitting at the table, you can hold your hand up and feel the breeze, and it's not like right next to the door, it's a fair way away. I find it appalling to be honest with you, in a new-build, that you should have a draught like that, and that they can't fix it. And I think it's even worse that 3 flats are like that. Int: Yeah, and in ours it's not just that the door is warped, it's also that the seal all the way round where the door meets the wall is coming away, and there are big gaps...Gordon: We did have that too, but we got it looked at when we moved in. Int: Right ok, any other draughts. Rachel: That's the one I'm aware of the most. Gordon: Don't think there are any others. We don't really use the other 2 bedrooms...
6 - ENERGY COSTS
6.1 - Who is your Gas supplier?
Int: Ok. So...who is your gas supplier? Rachel: Scottish Gas.
6.2 - Who is your Electricity supplier?
Int: And electricity? Rachel: Scottish Gas.
6.3 - How do you pay your gas & electric bills? (PROMPTS – Quarterly, monthly Direct Debit...)
Int: And how do you pay your bills...monthly, quarterly or...? Rachel: Monthly Direct Debit yeah. Int: So that's the same amount every month? Both: Yeah. Int: And do you...is that based on estimates, or...? Rachel:...Well... Gordon:...Well you (Rachel) normally send them the …Rachel: Yeah I send them the meter readings every month, but it doesn't actually change...So at the beginning of the year, they will take your average of the year before and tell you what your monthly payments are, but then they obviously take in their price hikes as well....Oh, we'repaying more money now - 23rd of November it kicked in...!
6.4 - How do your fuel bills compare to those at your previous home?
115

MSc AEES January 2014 Angela Lafferty
Int: And how do you think your fuel bills compare to your previous home? Rach: That was electric though wasn't it? Gordon: Yeah. Int: Ok, so you can't really make a comparison.
Int: Ok, was that an old flat, or...? Gordon: It was a renovated old flat, with new central heating but it was all electric.
6.5 - How would you describe the cost of heating your home to a comfortable level?
Int: Ok. And how would you describe the cost of heating your home, this home...to a comfortable level? Rachel: I'd say it's expensive. Gordon: For what we use. Rachel: Yeah,and I think the reason we hold off, and don't use as much as other people would normally use, is because.... we just can't afford it.
6.6 - What is the average cost of your gas / electricity bills per year?
Int: Do you know roughly, what your annual gas and electricity bills are? (Pause). Int: Don't worry if the answer's no....Rachel: ...Not off the top of my head, no... Int: That's fine. Gordon: (to Rachel) What is it roughly per month? And we'll just times it by 12? Rachel: Ummmmm....Gordon: Do you want me to look it up? Int: No, no, I just wanted to know if you know that's all. Rachel: Well, I'm thinking we pay in the region of £90 per month, but that would include, gas and electric, and it also includes …..appliance cover. Gordon: I thought it was about £60-odd but... I don't know,I might be wrong. Rachel: Yeah that's what I'm saying though, it includes that...appliance cover thing, so... Gordon: And that's twenty pounds, twenty-odd pounds, 'cause it's the top one we get. Rachel: Yeah it's the top one, so it's more than that. It's more like thirty, thirty-five pounds... Int: Ok, right. That's fine. Rachel: See the difficulty I'm having, is because we used to get a staff discount and we don't get that now, so...not 100% sure sorry. Int: No don't worry, it's just that some people know exactly what they spend, and some people don't really care, so... Rachel: I know how much it is a month, roughly, for each, and I know that we're in credit, but yeah.... Int: No, that's fine, you've got a rough idea, that's fine....really!
6.7 - How do you think you compare to average population? Why?
Int: Umm, do you think you use more or less gas and electricity than the average population? Rachel: Less. Int: Both gas and elec? Rachel: I'd say we use less gas, but I wouldn't be surprised if we use more electricity. Int: And why do you think that would be? Rachel: Umm, well, Gordon pretty much has his laptop on 24/7...I've got mine on a fair bit as well cause of school at the moment...Gordon: I don't sleep much so I'm up through ...I do only sleep for a couple of hours so I'm up most of the night...
116

MSc AEES January 2014 Angela Lafferty
Int: Oh my goodness... Gordon: I'll sit and watch TV and that kind of thing...but I'll sit in the dark, when Rachel's not here I'd probably sit in the dark, so I don't have lights on...I don't have anything on, eh, going onin the house. And I don't cook, so....the kettle's about the only thing, and the telly... Rachel: Oh yeah, that's the only thing as well, is that I do do a lot of cooking, so there will be....and when there's sport on and stuff one of us will be in the other bedroom so ...there's often 2 TV's going...Gordon: Then again we don't have kids, so there aren't kids running about playing computers in all the bedrooms and all that...Rachel: I'd still say we were probably more than the average on electricity. Gordon: I'd say we were probably average with electricity. Rachel: Do you think so? Gordon: That's just my opinion.
6.8 - ...to other flats? ie. roughly same, more less? Why do think that is? Do you care?
Int: Ok. And...compared to other flats in this development...how would you rate yourselves? Gordon: I would say we were, probably the same answers. Rachel: Yeah. Gordon: It's just, I think, purely because at the moment I'm around here more often than not, and because I'm up at ridiculous hours in the morning anyway, so...I'll have my stuff on, from then on...
6.9 - Would you like to use less (or more) or are you happy with the way things are?
Int: Ok. And ideally would you like to use more or less energy, or are you happy with the way things are? Rach: I'm alright with the gas, I'd probably ….(pause)....see, electricity's one of those things though, isn't it, it's just so much part of your daily life now, you know...you flip a switch and you're not even really conscious of the fact that it's.... Gordon: See I'm into my soft lighting at the moment...I've got fairy lights on everywhere. Rachel: Yeah, but a lot of them are battery-powered though, and the ones out there (balcony) are solar-powered,so... Int: So ...do you mean you'd like to use less electricity ? Rachel: Less electricity, yeah. Int: Do you feel the same? (To Gordon) Gordon: Yeah,definitely with the gas,I think, I'm quite happy to not have the heating on more often than not to be honest with you, but with the electricity, I can't stop myself from not sleeping, so...I have to have the telly on... Int: Yeah, no, no I'm not passing any judgement or anything! (Laughs) Sorry, I just meant, would you rather use less or more than you do, or are you happy with what you use? Gordon: I'd probably like to use less, but...em...when it comes to switching things off, like the internet and all that, at night, I'm not the best...Rachel: Yeah...we're not good at switching things off at the main, are we?
6.10 - If energy costs increased substantially, what would you do?(PROMPTS - Pay the bill whatever the cost /Only heat certain rooms/Put up with the cold in order to save money/ Reduce heating duration/Other/)
Int: Ok. If energy costs were to increase substantially, what ...what would you do, how would that affect you? i.e. would you pay the bill whatever the cost, would you only heat certain rooms, would you put up with the cold in order to save money, would you reduce the length of time that you have the heating on, or reduce the thermostat setting, or...or what would you do? Gordon: For me I'm a tight...I'm a true Scotsman (laughs), I would have the heating off. But that's just me, 'cause I can cope without the heating on.
117

MSc AEES January 2014 Angela Lafferty
Int: you mean off altogether, for the whole year? Gordon: Yeah, I could go... I mean really, it's very very rarely that I'll go and use the cover with Rachel...you know. I'm normally boiling, all the time. Rachel: Yeah... you see for me, not having the heating on's not really an option..So...I ...I wouldn't really consider not heating the whole of the flat either, 'cause to me that just seems like...if you've got a cold room and a warm room, you're going to lose all your warmth in your warm room to the cold room, as soon as you open the door anyway. I think I would probably look at reducing the length of time that it's on for...but I don't think I could ever go without it entirely.
7 - GENERAL
7.1 - Has there been any instance of asthma or other similar health problem that could be associated with the living environment?
Int: Ok. Do either of you have any health problems that have started since you've lived here...something like asthma, or skin problems, or...? Both: No, nope.
7.2 - Is there any condensation or mould growth in the home? PROMPTS - Windows, shower/cooking moisture... Why do you think that is?
Int: Ok. Do you have condensation on your windows, in the mornings? Gordon: Yeah, in our bedroom definitely. Rachel: A little bit yeah. In the winter....Int: Is that everyday, or? Gordon: Every day. Rachel: But if we had the vents open....? Int: I don't know, we have it as well I've noticed, we've had it every day.
Int: And..why do you think ...that happens? Rach: Cause its cold outside and warm inside. Gordon: I don't know if its to do with the structure of the walls and all that kind of thing, I don't know enough about it. Rach: It's only in the bedroom isn't it? Int: Oh is it? Gordon: Well, its in the second bedroom too but it's not as bad. Rach: Oh is it? Gordon: I don't know if it makes any difference that we're sleeping in there, cause that one's not as bad. But it still has the same problems, just at the bottom corners.
7.3 - Any eco/ energy saving habits? ie switching off lights, 30 degree wash, hanging not tumble dry?
Int: Ok. So....just,would you say you have any 'eco' or energy-saving habits at all? You've already mentioned that you quite often switch off the lights...Gordon: Yeah I would sit here in the dark, when I'm here, especially on my own. Int: Anything else? Rachel: When we use the dishwasher we use the eco-mode more often than not. We never use the dryer on the washing machine, we never do that. Gordon: I think we did it once...Rachel: And the washing machine broke...Gordon: So we would never do it again.
118

MSc AEES January 2014 Angela Lafferty
Int: So how do you dry your washing then? Gordon: We just hang it up and just let it dry,we put it in the hallway or one of the bedrooms at the moment, and in the summer time it would be out on the balcony.
7.4 - Standby/switching off appliances?
Int: Ok. And....putting things on standby, switching them off at the wall, you said you don't really(do that)...? Gordon: More standby...Rachel: We're not very good at that. Gordon: I do...that's more for the equipment under the telly, and the internet. Well...the TV in our bedroom, and everything here ...and the (internet) hub, but all the light switches, and these switches here, I'll often go round them all and switch them off at the wall at night. Like the kettleand all that kind of thing, more often than not these days.
7.5 - TV on in background while doing other things?
Int: Do you...when you're not watching TV,would you have it on in the background,...when you're doing other things, cooking, or eating or...? Rachel: I have to admit, I very rarely sit down to just watch the TV, but it's always on... If Gordon's not in, I will quite happily sit without the TV on, and I would put my music on the laptop or something like that. Gordon: It's a comfort thing I think...I'm maybe not even watching it, and I'm doing stuff on my computer, but it's just...a bit background noise.
7.6 - Do you ever try to save energy? Do you think about it? Do you think about global warming/climate change, and think you have a role in it?
Int: Ok...and in your daily lives, when you're in your home, using your gas and electricity, do you ever think about...global warming and climate change, or anything like that? (Pause) Int: I mean...does it affect anything you do, or...? (Pause) Rachel: Not...not..in terms of... Gordon: No, not for me anyway.
7.7 - How, when, where are clothes dried?
Already answered in section 7.3 about eco/energy-saving habits above.
7.8 - Do you use low energy light bulbs? When are lights on?ie. when and which rooms. Evening all on? (heat gains)
Int: Ok. Have you got low-energy light bulbs? Both: Yes. Gordon: Not many but we have got some. Rachel: This one's low energy… (pointing to a lamp).Gordon: The one in our bedroom is...that one used to be (pointing to ceiling pendant). Rachel: The one in the third bedroom is. Int: What, are they... just normal tungsten ones? Gordon: I think they're normal ones, yeah. Int: I thought you couldn't...can you still buy them? I thought you couldn't anymore? Gordon: I...ehmm...I've... (laughs) Rachel: They came with the flat!
119

MSc AEES January 2014 Angela Lafferty
Gordon: I very rarely...that's how often the big lights are on, they're very very rarely on, it's normally just low lighting. Int: No, it's just...I just wasn't sure if you could still buy...we don't have...we just have halogens so we don't have these kind of lights... Gordon: No (laughs)....IKEA used to sell loads and loads of them and...em...I'm the kind of person that when I buy something I buy bulk, so I've got ...stockpiles of them...Rachel: Very rarely do we have these lights on (the main lights). If we have one on it'll be this one (points to lamp). Int: Ok, so lamps rather than main lights. Gordon: And our bedroom's an eco one. Rachel: Not sure about the second one though.
Int: Well, I think we've finally come to end, thanks very much for that! Both: No problem. Rachel: That's alright!
THINGS TO NOTE -
Other differences – lighting (lamps)LIVING – tungsten x 2 KITCHEN : 3 downlights HALL: 2x2 direct. spots
BED 1: LE bulb + fairy ENSUITE – 1 light BED 2 -1 tungsten
BED 3: LE bulb + fairy BATHROOM - ?
Radiator settingsLIVING 1: 5 LIVING 2(balcony): 5 BED 1: 3ENSUITE: 3 BED 2: 3 BED 3: 3
Trickle vent positions – all shut. All bedroom blinds open except Master bedroom.
OTHER NOTES -
Elec £43/monthGas £12/month
120

MSc AEES January 2014 Angela Lafferty
APPENDIX E - Interview transcript Flat C
NOTE – A small number of omissions have been made from the transcript, when the conversation strayed from the topic to personal matters, due to the interviewer and occupants being neighbours.
TRV = Thermostatic radiator valveInt: = Interviewer (author)
1 - HOUSEHOLD DETAILS: FLAT C
No Occupants - 4
Age bands 20-25, 26-30, 31-35, 36-40 (x2), 41-45
Child aged 4
Occupancy: Generally occupied most days.
2 - OCCUPANCY PATTERNInterviewer: Before we start, I just want to say, please don't feel that there's a right or wrong answer to any of the questions, just answer as truthfully as you can. There's no particular answer that I want to hear, and we all have good and bad habits, me included. I'm just interested to hear about how you use your house, not to judge anything that you do.
2.1 - When is your flat occupied?(PROMPTS: Same every day? Evenings & weekends? Different every week? Seasonal variation)
Int: So, first of all...well, I already roughly know your typical week...so, you're at work Monday to Friday? (to Michael)Michael: Mmm-hmmm.Int: And you guys are generally out ...Mondays, Wednesdays and Fridays to nursery? (to Becky and her son)Becky: Uh-huh, yeah. But I often come back between dropping him off and picking him up again.Int: And what about Lauren? (grown-up daughter)Becky: Well, it's changed since.... she used to be in between 8pm... every night until about 8 inthe morning if she was at college, but it's changed so much, so...it's really random now.Int: That's fine...but is she here...every day, or...?Becky: Now she's not, 'cause she's got a job in the mornings, so she'll just be coming home fora couple of hours.Int: But...she does stay here...every night?Becky: Oh yeah sorry! Yeah, yeah...she does ...she is here at some point every day.Int: I just wasn't sure if she spent some of the time at her gran's...?Becky: Oh right...
2.2 - Has this been case for last 5 years? How has lifestyle varied?
Int: Now...over the last 5 years since you've lived here..well, when did you move in exactly, do you remember?Michael: 2008. In May.
121

MSc AEES January 2014 Angela Lafferty
Int: In May...right ok. And has your lifestyle changed much over that time?Becky: No, not really, no. Not since Jack was born.
2.3 - Describe a typical evening in your home (PROMPTS: ie which rooms are occupied, which activities are taking place, dinner time...ie “wewatch TV in living room most evenings”)
Int: Ok, so what would be a typical evening in your home then? Do you generally use this room, or...?Both: Mm-hmm, yeah.Int: And would you have the TV on...or...?Becky: Telly's always on.Int: Ok. And would you have laptops, iPads on?Becky: Yeah, probably.Michael: Yeah, iPads probably...Int: And most nights you would stay in this room, would you...or?Both: Yeah.
2.4 - Describe showering/bathing patterns.(PROMPTS: How many showers per week using electric shower?Length?Time?
Int: Ok. Showering and baths. Do you use both showers?Becky: Yeah. Michael's the only one that uses that shower (pointing to ensuite)Int: Ok, so Michael...electric shower...
2.5 - How many showers using gas shower? Length?Time?
Becky: And everyone else uses that bathroom (points to main bathroom).Int: Right. And is it generally mornings..or?Becky: Yeah, yeah...definitely mornings for Michael, and probably most mornings for me, yeah, or after the gym or whatever...Int: And then Jack (4 year old), does he...?Becky: I would say...I only bath Jack about every second day or something...soInt: Right...Becky: ...and that would be the mornings that we're off (nursery) as well...Int: Oh does he have it in the morning?Becky: Yeah. Int: And...how would you describe the length of your showers?Becky: Mine are under... 5 minutes...Int: Under 5 minutes...and...?Becky: Yeah, and Michael's about an hour and a half! (Laughs)Michael: Ten minutes....Ten to fifteen minutes...Becky: Yeah right....no way.Int: Ok....so...why do you have short ones? (to Becky)Becky: 'Cause...Jack...'cause I've got Jack and I don't get peace to stay in the shower any longer!(Laughs)Int: I just ignore my two! (More laughs...)Becky: Even Lauren though, she's still at that age where she wants my attention and...Int: And does she have long or short showers?Becky: She has long showers.
2.6 - How many baths per week? Time? How full?
122

MSc AEES January 2014 Angela Lafferty
Answered above.
2.7 - Describe cooking pattern.(PROMPTS – Mostly hob/oven/microwave? Frequency? Lunchtime cooking? During week?)
Int: Ok. (Pause) And cooking...do you use mostly the hob, or the oven, or a mixture of both....orthe microwave?Becky: Well,we've not got a microwave anymore...Michael: (Jokes:) We're eco-warriors...(Laughs)Becky: I would probably say, more likely...equal oven and hob.Int: Ok...and do you do any daytime...is it just evenings, or do you cook during the day as well?Becky: It's more just like sandwiches and stuff during the day, so...not as much during the day, no.Int: And are weekdays and weekends the same, or...?Becky: The same. Just the same, yeah. Probably cook properly once a day I would say...
3 - HEATING CONTROL
3.1 - How do you operate and control your central heating?(PROMPTS - manually, timer, constant thermostat...Why? Do you think it uses less energy or tosuit lifestyle...?)
Int: Ok, your central heating now. Is it on a timer or do you...use it manually...?Becky: No, we just put it on when we feel like it.Int: Ok. And who...does it?Becky: Well, I..I would...I never turn it on unless it's freezing...so I'd say Michael's more...more likely to be the one that uses it.
3.2 - What are the programmed (or usual manual) settings? Is it the same every day? (PROMPTS - Do you ever override it? If so how often? Why? Who? When? Does it just dependon whether you are home, how cold it is etc?) Do you ever forget to switch off?
Int: Ok, so it's whenever you feel like it, so it's not on the same amount of time every day?Becky: No...no...just....
3.3 - Do you have a usual target temperature? (PROMPT: or does it vary within a range ie. 20-22°C?
Int: Ok. And do you know what he sets to, what temperature he sets it to? (Michael has stepped out of the room for a minute).Becky: Mmm...not sure..think it's like ..20 or something maybe even...(Michael returns)Int: Michael...when you put the heating on, do you generally set it always to the same temperature...or...what do you do?Michael: Ummm...20 degrees.Int: Ok.Michael: 21 if it's really cold.Int: And then, when it reaches that temperature, do you...switch it off,or...leave it on, or...?Michael: No, we just leave it on. Until we go to bed. Becky: Or until I freak out and turn it off...Michael: Yeah, whatever's first...
123

MSc AEES January 2014 Angela Lafferty
3.4 - Have you ever adjusted the thermostat settings (from default) since you moved in? (PROMPTS - Do you ever look at instructions? Did you when you first programmed it? Proportional band width (default 1.5C) or boiler cycle rate? Do you use optimised setting? Did you know it had one?)
Int: And is the programmer just on the original settings...have you put it on the optimised setting...or?Becky: No, no...don't think we've ever changed it.Michael: No it just stays on manual, we always do it manually.Int: I just wondered if you know about the optimised setting...Becky: No.Michael: Yeah, it's where...if you set your heating to come on at 6, it'll have the house warm foryou at 6 rather than coming on at 6...it'll be ready for you waking up. Int: Yeah. Ok.
3.5 - How did you learn to use the thermostat programmer? Do you find it easy to operate?(PROMPTS: did you use instructions, were you shown by seller, or just figure it out?)
Int: And...do you remember how you...when you first used the programmer...did someone show you how to do it,or...?Michael: Yeah,the Taylor Wimpey guy showed us. But it's not really that hard to work out.
3.6 - Do you ever adjust the settings on the boiler?PROMPTS – hot water temperature and/or central heating temperature? Do you know what they do?
Int: Ok...do you ever adjust the settings on the boiler?Becky: No....I've never touched the boiler.Michael: Not really.
3.7 - How do you control your TRVs?(PROMPTS – what are they set on, all same, do you vary them? Do you understand what they do?
Int: Ok....And, the radiator valves...do you change them at all, or do you know what they're set at?Becky: To be honest, I think...all the bedroom ones are off, it would only be the ones in here (living room) that are on, isn't it...and the bathrooms? (To Michael)Michael: These two are at 5 (living and dining area)...Jack's room's at 5 (bedroom 3) ...Becky: Is it?Michael: ...and ours is at one and a half, but...just to give it a wee heat. And the bathroom onesare just 'on'. I don't know what Lauren's (bedroom 2) is at?Becky: I think hers is off.Int: Ok...and...you don't alter them at all, you just leave them...the same all the time?Both: Yeah.
4 - VENTILATION
4.1- Describe window opening in winter? (PROMPTS – every day all day/ every day couple of hours/ after showers/during cooking/ occasionally/ never....while heating on? Depends on weather/wind. Who does it?)
Int: Ok. So...ventilation. How would you describe your window....when you open your windows?
124
MSc AEES January 2014 Angela Lafferty
Michael: All day every day.Becky: I open them all the time...I open them in the morning as soon as I get up.Int: All of them?Michael: What d'you mean? They're normally open at night..Becky: Well, our bedroom one is open all night...Int: So that's...always, 24/7?Becky: Yeah, always. And, when I get up in the morning I normally open Jack and Lauren's room windows.Int: And then..they don't stay open all night? When do they get closed? Becky: I close them at night, at bed-time.
4.2 - Is it different in summer? What about September?(ie. is it a gradual change?)
Int: And is that the same...summer or winter?Becky: Oh in the summer I'd have everything open, all the time...mmm-hmmm.Int: Ok. (long pause) Would you ever have, in extreme weather or something like that, like the other night when it was really wild, would you shut them then?Michael: Uh-huh, if it's mega windy.Becky: Yeah! (Laughs)
4.3 - How are window trickle vents set? Do you alter these much/ever?
Int: And what about the vents, are they always shut? (Pointing at the vents as they are currently shut).Michael: They're normally open, I don't know why they're shut?Becky: I never touch them 'cause I can't reach them, but...you normally...Michael: Yeah I normally leave them open, there must have been one day when I closed them...to stop the wind coming in.Int: And is that the same in all the rooms?(Pause)Michael: Mmmm...pretty much, yeah.Becky: Think so, yeah.
4.4 - Do you use the mechanical ventilation system? If so, describe use pattern?(PROMPTS – ie always on trickle/only during showering/cooking/ as and when needed? If not why not? Noise/energy consumption? Do you think it works?
Int: And do you use the fan (pointing to it in the hall)Becky: The what?Int:...you know, the extract fan?Becky: Yeah, I always use them, I'm just not convinced they work.Int: When do you use it?Becky: I use it every time I go in the shower.Int: Ok, and what setting do you put it on?Becky: At the highest one.Int: Ok. And do you ever have it on...just on the middle setting?Both: No.Int: So you just switch it off?Becky: Just switch it on and off, yeah.Int: So...off at the wall?Michael: At the wall, the power, yeah.Int: Because the other flat didn't realise that it was still on, on the middle setting, if you don't switch it off at the wall, so it's been on since they moved in...
125

MSc AEES January 2014 Angela Lafferty
Becky: Oh, well, I probably didn't realise that either then.Michael: Yeah, it stays on...if you don't switch it off at the wall. Becky: Oh, I've never had it like that...
Int: Ok.
4.5 - Same question for cooker hood extract.
4.6 - Are your internal doors normally open/closed? (PROMPTS - Variable? Which rooms? Any reason)
Int: And ….and the doors inside your flat...are they generally...?Michael: Yeah, they're always open.Becky: Yeah...always open, apart from Lauren's is the only room with the door closed at night.Int: Alright...so they're open day and night, except Lauren's..Becky: Mmm-hmm.
4.7 - When do you close your blinds/curtains?
Int: Ok, and when do you close your blinds? (They are currently closed).Becky: Emmm...I probably hardly open them, to be honest! Well, in the mornings....all the bedroom ones are opened in the morningsInt: Ok.Becky: And closed at night.Int: Ok. But those ones stay shut (pointing at living room blinds).Becky: I mostly keep them shut, yeah.Int: And is that...because...?Becky: It's just that when they're open it's just really glary, you can't see the telly...yeah...
5 - COMFORT ACTIONS
5.1 - Describe yourself + comfort requirements (if not already been covered)(PROMPTS – like it warm, like it cool, neither, varies...)
Int: Ok. And now, this bit's about...how you make yourself comfortable...So, would you describe yourself as, for example, a hot or cold person, or...?Becky: Well...we're complete opposites, aren't we? (To Michael).Michael: Yeah.Becky: Like...earlier on when you said-Michael: It's always cold in here.Becky: See I always think it's warm in here.Int: So you always think it's warm, and you always think it's cold...So would you say-Becky: Or vice versa. When I'm cold he's hot!Int: Oh right! So Michael...you wouldn't say then, that you were a 'cold' person, or feel the cold more than other people?Michael: I wouldn't say that, but I normally...always walk in here and say it's cold. And I put the heating on.Becky: Ah...see....he'll come in, and I'll have a vest top on, and he's got a hoodie and all that on, and I'll be like...it's roasting, and he'll say it's freezing.Michael: I like a warm house.
126

MSc AEES January 2014 Angela Lafferty
5.2 - Do any rooms feel particularly comfortable/uncomfortable, cold/warm in general (winter)?(PROMPTS – Explain further. Or does whole flat feel same temp?)
Int: Ok. And do you feel, within the flat...that any rooms are – do they all...feel the same, temperature-wise, or are any colder or warmer...?Both: Jack's room (bedroom 3) is freezing.Michael: Because it has 2 exterior walls I think.Int: Yeah.
5.3 - If you are cold one eve watching TV, what do you do?(PROMPTS - Would you ever, put on a cardigan/jumper/slippers/blanket/HWC/hot drink etc/shut vents/put up heating.....)
Int: If you were...sitting here watching TV one night and...you felt cold, what would you do?Michael: Ehm, probably put the heating up a wee bit, and just close the door.Becky: I wouldn't do that though.Michael: Why, what would you do?Becky: I'd get a blanket.Michael: Oh right.Int: (To Becky) So you do sometimes feel cold?Becky: Yeah! But I'll get a blanket, and cuddle into a blanket, rather than... 'Cause I don't like...breathing hot air.(Laughs)Int: Ok.
5.4 - Do you ever use any additional heating?ie kitchen heater, electric heater, elec. blanket etc
Int: Do you ever use ...any additional heating...like a portable heater, or...?Becky: No.Int: Have you got one of those plinth heaters, under your cooker?Becky: Oh yeah. But only if we've accidentally kicked it or something...Michael: Or hit it with the vacuum cleaner...that's the only time it goes on.
5.5 - What is your normal evening attire in evening (watching TV for example?) PROMPTS – Do you dress the same as daytime (at home) or do you add layers? Int: Ok, and what would you normally wear, sitting in the evening at home?Becky: Just like pyjama bottoms and a T-shirt...Michael: Not pyjama bottoms...lounge pants. (Laughs)Int: Oh right. So, would you normally have long sleeves? (To Michael)Michael: Mmm-hmm. Int: And is that one...or two layers you've got on there? Sorry...hope I'm not being too personal!(Laughs)Michael: Eh, a T-shirt and a jumper.Int: If you don't want to answer any questions that's ok...Michael: No, no it's fine.Becky: Eh...pants, and socks and......(laughs)
5.6 - Are there any draughts? Any other problems?
127

MSc AEES January 2014 Angela Lafferty
Int: Ok. Nearly finished now...Are there any draughts...in your flat?Michael: Eh, yeah, well, there's a draught....Becky: Maybe sometimes from there actually...(pointing to balcony door)...'cause the door's...like that (signalling that it is warped).Michael: Yeah. There's a draught from our bedroom as well...at the top of the window, air comes in that...And the door, the front door. Becky's going to make a draught excluder.Int: And...are there any other problems? Build quality...or?Michael: Nope.Becky: No...I'm quite happy with it to be honest.
6 - ENERGY COSTS
6.1 - Who is your Gas supplier?
Int: Ok. So...now just a wee bit about your gas supplier and things. So who...supplies your gas and electricity? Michael: Scottish Power.Int: Both the same?Michael: Yeah.
6.2 - Who is your Electricity supplier?
Answered above.
6.3 - How do you pay your gas & electric bills? (PROMPTS – Quarterly, monthly Direct Debit...)
Int: And how do you pay...do you pay by Direct Debit...or...?Michael: Direct Debit.Int: Is that every month? So it's the same amount every month?Michael: Mm-hmm, yeah.Int: And do you ever give them actual meter readings, like at the end of the year...?Michael: Yeah we give them readings...every now and then I get a text message..Becky: ...I always have someone come to the door for the readings.Michael: Yeah, randomly...but I normally get a text message, and you've got to give them a text message reading.Int: And does that then adjust your payments?Michael: Yeah, and then you get a new bill sent out, after that.
6.4 - How do your fuel bills compare to those at your previous home?
Int: And how do you feel your bills compare to your previous home?Becky: Ehmm...(long pause)....I don't know, obviously - they're higher because it's a bigger house than I've had previously...is that what you mean?Int: Well, so your previous house was smaller, but what kind of house was it though? Was it old, or...?Becky: It was a flat, but it had an upstairs and downstairs, so it was on two levels.Int: So a duplex...but was it old or new or...?Becky: A new flat.Int: So you think that was cheaper for gas and electricity?Becky: Yeah, definitely.Int: And...do you know roughly when your old place would have been built?Becky: Yeah, probably be about mid....well now, it would be about 25 years old I think,'cause I'm sure, I was there 8 years and it was 10 years old.
128

MSc AEES January 2014 Angela Lafferty
Int: So, does that make it about 1990 or so, that it was built?Becky: Yeah, that sounds about right.
6.5 - How would you describe the cost of heating your home to a comfortable level?
Int: Ok. And How would you describe the cost of heating your home to a comfortable level?Michael: Eh, about 120 quid a month.Int: And...do you think that's cheap, or expensive?Michael: Ehmm.... I think it's pretty expensive, but then again...well it's more expensive than anywhere I've lived before.Int: Oh right, so did you...you didn't live together in the previous place then?Becky: Only briefly.Int: Ok, and you think this is more expensive too?Michael: Yeah, but then again, heating prices have gone up.
6.6 - What is the average cost of your gas / electricity bills per year?
Int: So I was going to ask what's the average cost of your gas and electricity per year, but you've just said £120 a month...is that just for gas? Michael: I'd say it was about £1400 per year, for both.Int: For both, ok. Is that a dual fuel thing?Michael: No, we haven't got round to doing that...one's in Becky's name and one's in my name-Becky: I know we should, you get a discount aswell, if it was together....Michael: One's about £55, and the other one's about £65 or some thing like that...or 70 and 50.
6.7 - How do you think you compare to average population? Why?
Int: And do you think, that you, as a household, use more or less gas and electricity than the average population?Becky: No...I wouldn't have thought so.Int: So you think you're about average then?Becky: Oh yeah, sorry, average.Michael: Yeah, I mean we don't use it for anything...extra, I would say.
6.8 - ...to other flats? ie. roughly same, more less? Why do think that is? Do you care?
This question was not asked, as it was deemed covered by the previous answer.
6.9 - Would you like to use less (or more) or are you happy with the way things are?
Int: Ok. And would you like to you more or less, or are you happy with the way it is, like, for example would you like to be able to use more gas but you find it too expensive, or...?Becky: No, I think we're just happy with the way it is.
6.10 - If energy costs increased substantially, what would you do?(PROMPTS - Pay the bill whatever the cost /Only heat certain rooms/Put up with the cold in order to save money/ Reduce heating duration/Other/)
129

MSc AEES January 2014 Angela Lafferty
Int: Ok. If energy costs...well, they already have...but if energy costs were to increase substantially, what would you do? Would you: just pay the bill whatever it costs, would you onlyheat some rooms and not others – well you kind of already do that a bit with your TRVs – would you just put up with the cold in order to save money, reduce the length of time that you've got the heating on for, or...something else?Becky: (Pause)...To be honest, we'd probably just pay it.Michael: We'd pay it, I mean, if it was going to double then it would be a bit silly, but if it was going up £10, £15, £20 then we'd just pay it, to be honest.Int: Ok.
7 - GENERAL
7.1 - Has there been any instance of asthma or other similar health problem that could be associated with the living environment?
Int: Are there any health issues you associate with living in this flat, like asthma or anything?Becky: No. Nothing at all.
7.2 - Is there any condensation or mould growth in the home? PROMPTS - Windows, shower/cooking moisture... Why do you think that is?
Int: Do you get condensation ...on your windows?Becky: No.Michael: Don't think we do, no.Int: Actually we get it nearly every day.Michael: Do you? That's because your house is too warm.Int: It might be something to do with not opening windows I think, and that's why you don't get it.
7.3 - Any eco/ energy saving habits? ie switching off lights, 30 degree wash, hanging not tumble dry?
Int: Ok...in your general lifestyle, have you got...would you say you had any eco or energy-saving habits? (Pause)Int: Like, switching off lights, lower temperature wash, not using tumble dryer...anything like that?Becky: No, probably not (Laughs).Michael: No, Lauren loves leaving lights on, that's what she does best, isn't it? Becky: Yeah,we're not very good.Michael: I guess, the only thing I'd do...is I'd normally put things on at night, like the dishwasher and stuff like that, instead of during the day.Becky: I wouldn't do that, 'cause I just need to get things done, I couldn't wait till night time.Michael: I'd probably be waiting for the tumble-dryer to finish anyway. It's only recently that we've started using that a lot.Becky: I know it weird,we never touched it for years, and then just started using it recently.
7.4 - Standby/switching off appliances?
Int: Ok. So...do you leave things on standby or switch them off at the wall, in general?Michael: Standby.
130

MSc AEES January 2014 Angela Lafferty
7.5 - TV on in background while doing other things?
Int: And, would you say that the TV's on, quite often on in the background when you're doing other things?Becky: Yeah, I suppose. If I'm in on my own then it's not on, but everybody else has it on all the time.
7.6 - Do you ever try to save energy? Do you think about it? Do you think about global warming/climate change, and think you have a role in it?
Int: Do you think...in your daily lives, do you think about climate change, or anything like that, or feel you have a role to play in it?Becky: Not in my daily life, no.Michael: Uhhhm...(long pause)...Well...I don't know, not really, no. I could probably think of things, but...no.
7.7 - How, when, where are clothes dried?
Int: So, the dryer...do you use it for every wash, or...?Becky: I put things on the radiators and on the clothes horse, but I have recently started tumble drying socks and pants, and small things.
7.8 - Do you use low energy light bulbs? When are lights on?ie when and which rooms. Evening all on? (heat gains)
Int: Ok. And you have low-energy light bulbs haven't you? (Interviewer can see them).Becky: Yeah, most of them are. A pendant in each room.Int: And is it halogen spotlights in the kitchen though?Becky: No, that's just a pendant too.Michael: Spotlights over the units though.Int: And the bathrooms?Becky: They've got a pendant and spotlights.Int: And the pendants are all low-energy?Becky: Yeah I think they are.Int: Ok.
Int: Well, that's us finished – thank you very much! Both: That's alright. No problem.
THINGS TO NOTE -
Other differences – lighting (lamps)LIVING: LE pendant x 2 KITCHEN : LE pendant HALL: LE pendant
BED 1: LE pendant ENSUITE: LE pendant+ halogens BED 2: LE pendant
BED 3: LE pendant BATHROOM: LE pendant+ halogens
Radiator settings
131

MSc AEES January 2014 Angela Lafferty
LIVING 1: 5 LIVING 2(balcony): 5 BED 1: 1ENSUITE: on BED 2: off BED 3: 5
Trickle vent positions – Usually open, but currently shut.
LIVING windows LIVING DoorBED 1 BED 2 BED3
OTHER NOTES -
Elec £ 70/month est.Gas £ 50/month est.
132

MSc AEES January 2014 Angela Lafferty
APPENDIX F – Product specifications
PRODUCT DATA SHEET/MANUAL
BOILER IDEAL Mini C24 Combi http://www.idealheating.com/downloads/manuals/mini_uhuj.pdf
RADIATORS STELRAD Compact type K1 and K2(assumed)
Http://www.stelrad.com/uk/resources/files/5fa8d29482d6708f9087861187243c29/compact.pdf
TRVs Terrier thermostatic radiator valve http://pegleryorkshire.co.uk/MEDIA/Downloads/10542145_Terrier_Brochure_Oct_09.pdf
ROOMTHERMOSTAT
HONEYWELL CM907 Digital Programmable Thermostat
http://www.honeywelluk.com/Documents/Full-Specification/pdf/793.pdf
TRICKLE VENTS TITON Trimvent Select S13 2700 http://www.titon.co.uk/media/product/ventilator/download/trimvent-select-s13/catalogue-page.pdf
MECHANICALVENTILATION
GREENWOOD CMEV.4Central continuousmechanical extract system
http://www.greenwood.co.uk/media/pdfs/CMEV4_Data_Sheet.pdf
Boiler settings:
Flat HW (35-55) Approxtemp
CH (38-85) Approxtemp
A 2/3rd last notch 50C 2nd last notch 77C
B Last notch 55C 3rd last notch 69C
C Last notch 55C Last notch 85C
Ventilation rates:
Vent type/EAmm2
No Total EA Total air leakage m3/hr 50Pa(when closed)
Living/kitchen 2700 3 8100 7.83
Master bed 2700 2 5400 5.22
Bed 2 3400 2 6800 6.5 est - unknown
Bed 3 2700 2 5400 5.22
Natural subtotal 25700 25
Plus infiltration 9 est (m3/h/m2)=288 thoughenvelope area debatable?)
Natural total 313 (eq. 1.6 ach -see above)
OR 2167 (eq 10.8 ach)
Greenvac 60 l/sec 216 m3/hr normal pressure
133
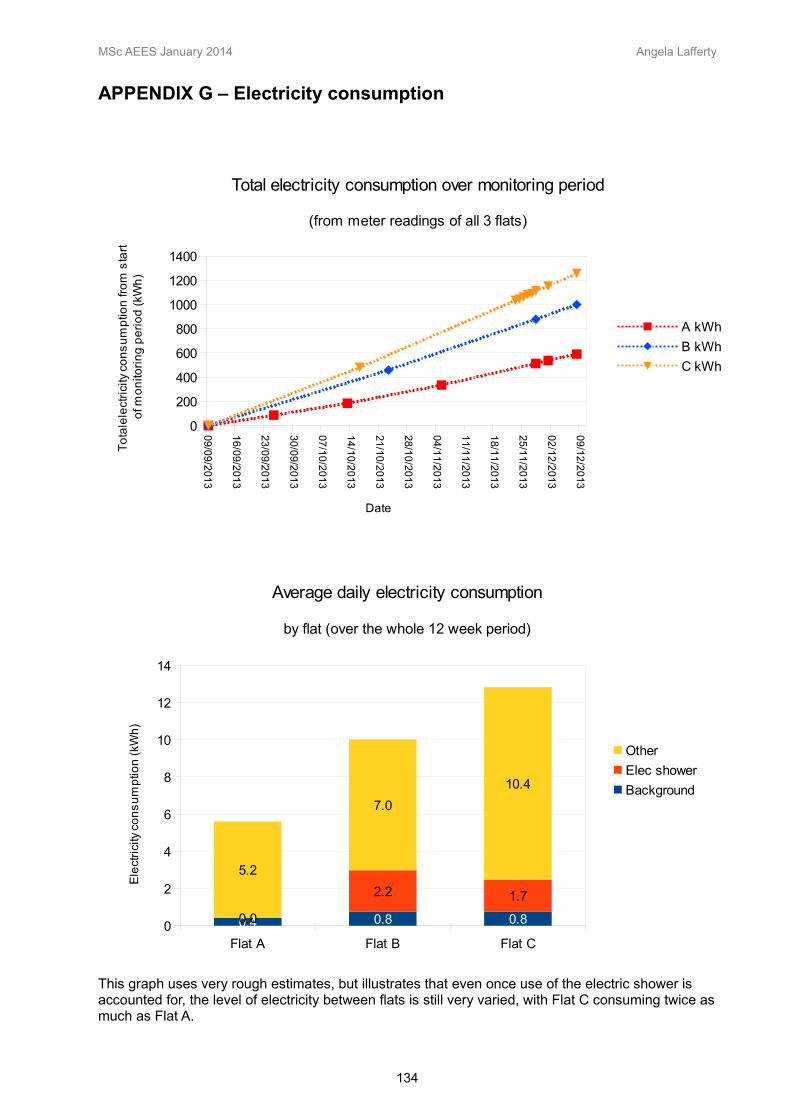
MSc AEES January 2014 Angela Lafferty
APPENDIX G – Electricity consumption
This graph uses very rough estimates, but illustrates that even once use of the electric shower is accounted for, the level of electricity between flats is still very varied, with Flat C consuming twice asmuch as Flat A.
134
09/0
9/2
01
3
16/0
9/2
01
3
23/0
9/2
01
3
30/0
9/2
01
3
07/1
0/2
01
3
14/1
0/2
01
3
21/1
0/2
01
3
28/1
0/2
01
3
04/1
1/2
01
3
11/1
1/2
01
3
18/1
1/2
01
3
25/1
1/2
01
3
02/1
2/2
01
3
09/1
2/2
01
3
0
200
400
600
800
1000
1200
1400
Total electricity consumption over monitoring period
(from meter readings of all 3 flats)
A kWh
B kWh
C kWh
Date
To
tale
lect
rici
ty c
on
su
mp
tion
fro
m s
tart
o
f mo
nito
rin
g p
eri
od
(kW
h)
Flat A Flat B Flat C0
2
4
6
8
10
12
14
0.4 0.8 0.80.0
2.2 1.7
5.2
7.0
10.4
Average daily electricity consumption
by flat (over the whole 12 week period)
Other
Elec shower
Background
Ele
ctri
city
co
ns
um
ptio
n (
kWh
)

MSc AEES January 2014 Angela Lafferty
APPENDIX H – Meter and Ewgeco data comparison
135
09/09/2013
16/09/2013
23/09/2013
30/09/2013
07/10/2013
14/10/2013
21/10/2013
28/10/2013
04/11/2013
11/11/2013
18/11/2013
25/11/2013
02/12/2013
0
200
400
600
800
1000
1200
1400
1600
1800
2000
2200
Flat A: Comparison of gas consumption Meter vs Ewgeco monitor
A Meter
A Ewgeco
Date
Ga
s c
on
su
mp
tion
(kW
h)
09/0
9/2
01
3
16/0
9/2
01
3
23/0
9/2
01
3
30/0
9/2
01
3
07/1
0/2
01
3
14/1
0/2
01
3
21/1
0/2
01
3
28/1
0/2
01
3
04/1
1/2
01
3
11/1
1/2
01
3
18/1
1/2
01
3
25/1
1/2
01
3
02/1
2/2
01
3
09/1
2/2
01
3
0
200
400
600
800
1000
1200
1400
1600
1800
2000
2200
Flat B: Comparison of gas consumption Meter vs Ewgeco monitor
B Meter
B Ewgeco
Date
Ga
s c
on
su
mp
tion
(kW
h)

MSc AEES January 2014 Angela Lafferty
136
09/0
9/2
01
3
16/0
9/2
01
3
23/0
9/2
01
3
30/0
9/2
01
3
07/1
0/2
01
3
14/1
0/2
01
3
21/1
0/2
01
3
28/1
0/2
01
3
04/1
1/2
01
3
11/1
1/2
01
3
18/1
1/2
01
3
25/1
1/2
01
3
02/1
2/2
01
3
09/1
2/2
01
3
0
200
400
600
800
1000
1200
1400
1600
1800
2000
2200
Flat C: Comparison of gas consumption Meter vs Ewgeco monitor
C Meter
C Ewgeco
Date
Ga
s c
on
su
mp
tion
(kW
h)

MSc AEES January 2014 Angela Lafferty
APPENDIX J – Calculation methods
Estimating non-heating uses of gas Both adults use the gas shower, generally in the morning though not necessarily every day, dueto hectic mornings getting to nursery with kids, and also as Tim frequently cycled to work andshowered there – this changed mid-study when Tim hurt his back and stopped cycling. Bothchildren share a bath every evening usually around 7pm. Cooking is generally somewherebetween 4-6pm, and frequently at lunchtime though very small amounts to reheat leftovers ormake pasta. All of these become very difficult to distinguish once into the heating periodthough when temperature is overlaid (Bedroom 3) it becomes slightly easier, as a temperaturerise indicates the heating is on, however the lack of granularity – 1 hour sections too big –means that activities happen simultaneously and cannot be distinguished, ie showering whileheating on. The heating can be on at any time of day, whenever the occupants feel cold. Avisual analysis of the hourly Ewgeco data was carried out, identifying around 8-10 easilydiscernible instances of showers, baths and cooking (also backed up by diary info), producing adaily average of 11kWh of non-heating gas use - this was considered to be an overestimationdue to the selective nature (and the fact that not all activities happened everyday), and wasaveraged down to 9kWh overall, when taken in conjunction with the daily average over the 10days prior to the heating being used, which was 8.5 kWh. This figure was applied until midOctober, and 9.5kWh was applied after that date.
For Flat C, the same Ewgeco data visual analysis process was carried out on 20 separatedays, made somewhat easier by the general assumption that the heating was never on duringweekdays when Michael was not at home, as Becky stated she would prefer to never use theheating. This made it easier to identify morning/daytime showers of Becky and her daughter,and the baths every second day of their preschool son which were also in the mornings. Anaverage of 8kWh a day non-heating use was calculated. Michael uses only the electric shower.
These estimates, although very rough, seem reasonable. Flat A's very slightly higher daily HWuse would correlate with the daily evening baths for the children as opposed to the everysecond day bath in Flat C, and both flats have 2 adults using the gas shower.
Calculating average annual GAS (over last 5+ years) for each flat:
Flat A: 7075 kWh (3170.494-0027)*11.12405/1804 *365Flat B: 3836 kWh (1907.241-0027)*11.12405/1990 *365Flat C: 8898 kWh (4388.389-0027)*11.12405/1990 *365
The above calculation is made by taking the meter reading at the start of the study andsubtracting the initial meter reading at the move-in date (assumed to be 00027 as in Flat A),then apply m3 to kWh conversion, then divide by number of days lived in property (Flat A movedin later), then multiply by 365 to get annual figure.
Calculating gas use for heating only:Constants will be applied, despite some changes in lifestyle over time of Flat C, however Flat Aused to use the electric shower until it became broken around a year ago, for the second time.We will assume that for half of the 5 years there was no electric shower use, so 9 will beapplied for half the time, and 4 will be applied for the other half (daily average of 5kW for gasshower deducted from HW use). So we can use average of 6.5. Heating should be relativelyconstant throughout 5 years, but HW varies significantly, affecting overall gas use.
Flat A: 7075 - (6.5*365) = 4702.5 kWhFlat B: 3836 – (2.75*365)= 2832.25 kWhFlat C: 8898- (8*365) = 5978 kWh
137

MSc AEES January 2014 Angela Lafferty
APPENDIX K – SAP regulated energy estimates
To calculate primary energy use from these figures, the SAP 2005 Primary Energy Factorswere used:
Gas – 1.15 Elec - 2.8
And a comparison was also made using SAP 2012 Primary Energy Factors:Gas - 1.22 Elec – 3.07
The electric shower was broken in Flat A hence no allowance for electric HW.
Ventilation figures were calculated using manufacturer's information on the continuousmechanical ventilation system. This was only switched on in Flats A and C after showering, onthe maximum setting, whereas it was also on continuously on the trickle setting in Flat B.
Flats B and C have low-energy lighting in much of the flat,whereas Flat A had numerous 50Whalogen spotlights throughout. Lighting has been estimated on this basis, as well as being usedfor less of the time in Flat B due to being unoccupied more of the time (ie until 6pm weekdays).
Gas and electric HW use was estimated from the Ewgeco data, based on showering timesgiven by the occupants in interviews. For example, it was known that the electric shower in FlatC was used by only 1 occupant, early in the morning before going to work: this was very easyto identify on the graphs. Gas HW use was more difficult to distinguish from heating, but couldbe compared against temperature rises to determine what the gas was used for, as well asusing times given by occupants. It is accepted that there is a large margin of error in thesecalculations.
138
A B C SAP05Gas Heating 4703 2832 5978 2482Gas HW 2555 73 2190
0 813.95 624.15Ventilation 13 150 13Lighting 912.5 164.25 365
8183.5 4033.2 9170.15
Elec HW

MSc AEES January 2014 Angela Lafferty
APPENDIX L – SAP CALCULATIONS (SAP 2005)
139

MSc AEES January 2014 Angela Lafferty
140

MSc AEES January 2014 Angela Lafferty
141

MSc AEES January 2014 Angela Lafferty
142

MSc AEES January 2014 Angela Lafferty
143

MSc AEES January 2014 Angela Lafferty
144

MSc AEES January 2014 Angela Lafferty
APPENDIX M – BUS Methodology Questionnaire & Selected Results
145

MSc AEES January 2014 Angela Lafferty
146

MSc AEES January 2014 Angela Lafferty
147

MSc AEES January 2014 Angela Lafferty
148

MSc AEES January 2014 Angela Lafferty
149
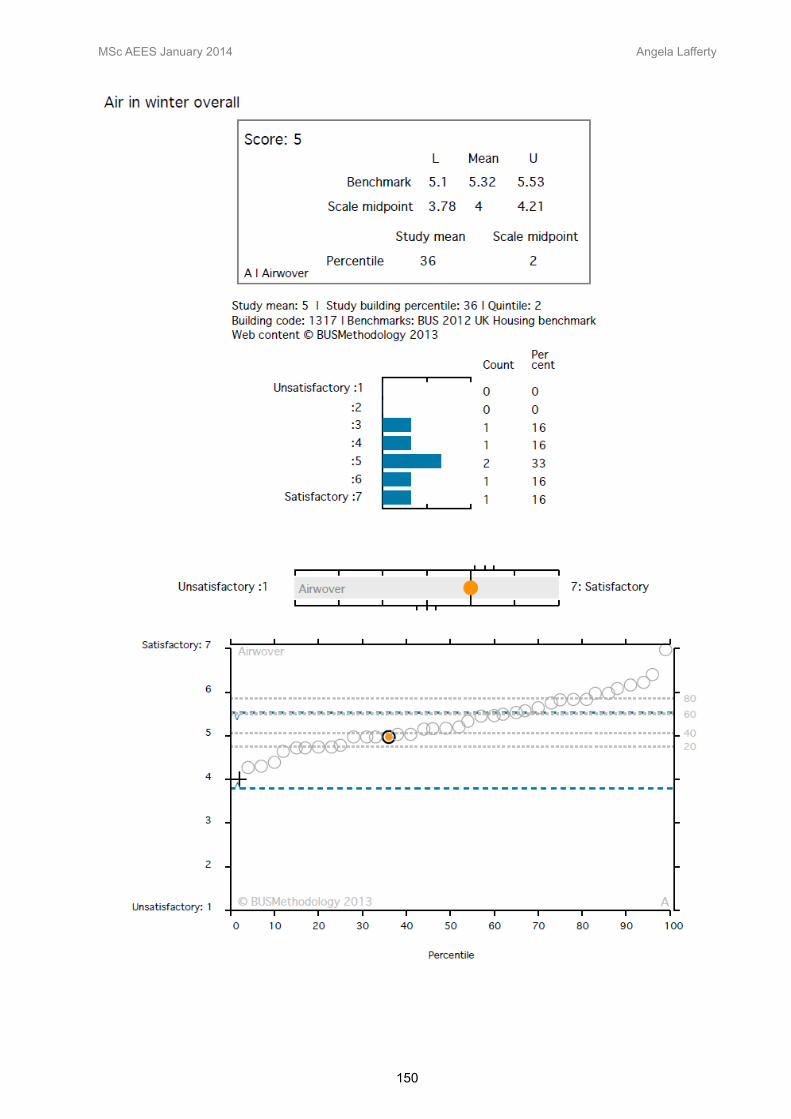
MSc AEES January 2014 Angela Lafferty
150

MSc AEES January 2014 Angela Lafferty
151

MSc AEES January 2014 Angela Lafferty
APPENDIX N – Heat loss calculations
Comparison of living room heat losses in the 3 flats
Ventilation heat loss is calculated using the following formula:
Q = ⅓ × N × V × ΔT
Fabric heat loss is calculated using the following formula:
Q = u x A x ΔT
Where:• N is the number of airchanges per hour (calculated as 1.4 ach15)
• V is the volume of the room (which is 75.6m3 )
• ΔT is the temperature difference between incoming and outgoing air (assuming outside temp of 5°C, and using average living room temp of study 21.1°C, 19.7°C, 19.1°C for A, B and C respectively)
• u is the u-value (0.29W/m2K for the wall,and 1.8 W/m2K for the windows)
• A is the area of the external surface (which is 9.78m2 for the wall and 5.1m2 for the glazing )
The total heat losses for the living rooms are set out below. These assume that no heat lossesoccur through either the party walls or the floors and ceilings.
FLAT A:Fabric heat loss: 45.7 W (south-facing external wall)
147.8 W (glazing)Ventilation heat loss: 4.22 WInfiltration heat loss: 568 WTOTAL 766 W
FLAT B:Fabric heat loss: 41.7 W (south-facing external wall)
135 W (glazing)Ventilation heat loss: 3.7 WInfiltration heat loss: 518 WTOTAL 698.4 W
FLAT C:Fabric heat loss: 40 W (south-facing external wall)
129.4 W (glazing)Ventilation heat loss: 3.55 WInfiltration heat loss: 497.4 WTOTAL 670.4 W
15 The actual air change rate was derived from the ach@50Pa, calculated from the assumed air leakage rate of 9m3/hr/m2. A typical rule of thumb for average annual rates is to divide the test figure by 20 (Kronvall–Persily model, Jokisalo et al, 2009), however this is thought to under-predict in exposed locations and best applied to single storey homes with normal wind loading. In this case the flats are in a windy coastal area, at height above ground level: It was suggested that dividing ach@50Pa by 10 would give a better rough estimate (Mawditt, 2014).
152

MSc AEES January 2014 Angela Lafferty
Therefore, the heat loss on a 5°C day is almost 15% higher in Flat A than in Flat C, when allwindows and trickle vents are closed. In reality, the fabric heat losses would be far higher in allflats once the party wall effect is taken into account, and the cold bridging around the perimeterof the slab. Also, the trickle vents are usually open in Flat A which would lead to higher heatlosses, and of course the windows being open in Flat C would lead to even higher ventilationheat losses, however none of these have been calculated here.
General air leakage discussionAir infiltration of 9 m3/h/m2 (of envelope area) is assumed as the flat was built to 2002 regs andwas not airtightness tested. However, the definition of 'envelope area' for a flat in a multi-storeybuilding is debatable:
“The envelope area of a flat in a multiple storey building includes the floors, walls and ceilingswhich are shared with adjacent flats.” from Part L (HM Government, 2010).
The amount of air infiltration for the flat varies enormously if only external surface area isincluded. The area of external wall is approx 32m2, yielding an air leakage rate of 288m3/h.Added to the trickle vent (closed) air leakage, this gives total ventilation rate of 313m3/h, arounda 1.6 ac/h @50Pa (volume is 201m3).
However, if the Part L definition is used, then the total air leakage becomes 2167 m3/hr or 10.8ac/hour @50Pa – a factor of almost 7 difference! The issue is that while it may be correct to saythat the barrier between flats is not airtight, and indeed may be around the same rate as to theexternal air, the key difference is the temperature difference. Ie from inside to outside may beas much as 20°C in winter, however as this research illustrates, the difference between flatsmay only be around 2-3°C. Added to this the effect of wind speed and direction on actual airinfiltration rates (which do not affect internal spaces) this method of calculation produces highlyinaccurate results when attempting to calculate actual air infiltration and air change rates, andtherefore ventilation/infiltration heat loss calculations. (Some in-between value should be used,as there may be infiltration loss from downlight recesses etc, but to treat floor and ceiling thesame as external walls seems flawed.
External walls only = 32m2
Walls 32 (external)38
Floor 84Ceiling 84TOTAL 238m2
153

MSc AEES January 2014 Angela Lafferty
APPENDIX P – Flat B: Relative humidity
Scatter plot of RH and temperature in the living room of Flat B.
154

MSc AEES January 2014 Angela Lafferty
REFERENCES
Aldossary, N.A., Rezgui, Y., Kwan, A. (2014a) ‘Domestic energy consumption patterns in a hot and arid climate: A multiple-case study analysis’, Renewable Energy, 62, 369–378. Available at: http://linkinghub.elsevier.com/retrieve/pii/S0960148113003972 [accessed 27 Oct 2013].
ASHRAE (2010) ANSI/ASHRAE Standard 55-2010: Thermal Environmental Conditions for Human Occupancy. Atlanta, Georgia: American Society of Heating, Refrigerating and Air-Conditioning Engineers.
Bell, M., Ross, D., Black, M., Davies, H., Partington, R., Adams, D., Pannell, R. (2010) Carbon Compliance for Tomorrow’s New Homes: A Review of the Modelling Tool and Assumptions. Topic 4: Closing the Gap between Designed and Built Performance, Zero Carbon Hub. Available at: http://www.zerocarbonhub.org/resourcefiles/TOPIC4_PINK_5August.pdf [accessed 18 Nov 2013].
Blight, T.S., Coley, D.A. (2013) ‘Sensitivity analysis of the effect of occupant behaviour on the energy consumption of passive house dwellings’, Energy and Buildings, 66, 183–192. Available at: http://linkinghub.elsevier.com/retrieve/pii/S0378778813003794 [accessed 27 Oct 2013].
Boardman, B., Friends of the Earth, Co-operative Bank (Great Britain), University of Oxford. Environmental Change Institute (2007) Home Truths: A Low-Carbon Strategy to ReduceUK Housing Emissions by 80% by 2050, Environmental Change Institute, University of Oxford, Oxford. Available at: http://www.foe.co.uk/sites/default/files/downloads/home_truths.pdf [accessed 15 Aug 2013].
Branco, G., Lachal, B., Gallinelli, P., Weber, W. (2004) ‘Predicted versus observed heat consumption of a low energy multifamily complex in Switzerland based on long-term experimental data’, Energy and Buildings, 36(6), 543–555. Available at: http://linkinghub.elsevier.com/retrieve/pii/S0378778804000696 [accessed 29 Oct 2013].
Brownlee, G. (2009) 'Launch of Energy Spot Campaign', Official website of the New Zealand Government [online]. Available at: http://beehive.govt.nz/speech/launch-energy-spot-campaign [accessed 23 Jan 2014].
Bryman, A. (2008) Social Research Methods, Third edition. Oxford University Press.
Carbon Trust (2012) Closing the Gap: Lessons Learned on Realising the Potential of Low Carbon Building Design, CTG047. Available at: http://www.carbontrust.com/media/81361/ctg047-closing-the-gap-low-carbon-building-design.pdf [accessed 10 Nov 2013].
Centre for Alternative Technology (2013) Zero Carbon Britain: Rethinking the Future [online], Available at: http://zerocarbonbritain.com/images/pdfs/ZCBrtflo-res.pdf [accessed 12 Dec 2013].
Coleman, M., Brown, N., Wright, A., Firth, S.K. (2012) ‘Information, communication and entertainment appliance use—Insights from a UK household study’, Energy and Buildings, 54, 61–72. Available at: http://www.sciencedirect.com/science/article/pii/S0378778812002952 [accessed 30 Mar 2013].
Cook, M., (2012) 'Energy supply and use - Electricity after the Second World War', Te Ara - the Encyclopedia of New Zealand. Available at: http://www.TeAra.govt.nz/en/energy-supply-and-use/page-6 [accessed 22 Jan 2014].
155

MSc AEES January 2014 Angela Lafferty
Currie, J., Stinson, J., Willis, R., Smith, S. (2011) Ewgeco - Home Energy Display Trials. Available at: http://www.napier.ac.uk/instituteforsustainableconstruction/lcbtgateway/Documents/TSB%20Ewgeco%20Smart%20Homes%20Report%2020%20June%202011.pdf [accessed 18 Oct 2013].
Cutland Consulting (2012) Low and Zero Carbon Homes: Understanding the Performance Challenge, NHBC Foundation NF41. Available at: http://www.nhbcfoundation.org/Researchpublications/tabid/339/Default.aspx [accessed 26 Mar 2013].
DCLG (2013a) Code for Sustainable Homes and Energy Performance of Buildings: Cumulativeand Quarterly Data for England, Wales and Northern Ireland up to End of December 2012, Statistical Release. Available at: https://www.gov.uk/government/uploads/system/uploads/attachment_data/file/120631/130226_CSH_Statistics_-_Q4_-_to_end_Dec_2012.pdf [accessed 7 Apr 2013].
DCLG (2013b) English Housing Survey: Headline Report 2011-12. Available at: https://www.gov.uk/government/uploads/system/uploads/attachment_data/file/211288/EHS_Headline_Report_2011-2012.pdf [accessed 17 Nov 2013].
DECC (2012) Quantitative Research into Public Awareness, Attitudes, and Experience of Smart Meters (Wave 1 of3), 1. Available at: https://www.gov.uk/government/uploads/system/uploads/attachment_data/file/86421/smart-meters-tracking-report-wave-1.pdf [accessed 30 Mar 2013].
DECC (2013b) Statistical Release: 2012 UK Greenhouse Gas Emissions, Provisional Figures and 2011 UK Greenhouse Gas Emissions, Final Figures by Fuel Type and End-User. Available at: https://www.gov.uk/government/uploads/system/uploads/attachment_data/file/193414/280313_ghg_national_statistics_release_2012_provisional.pdf [accessed 12Nov 2013].
DECC (2013c) National Energy Efficiency Data Framework June 2013. Available at: https://www.gov.uk/government/uploads/system/uploads/attachment_data/file/209089/National_Energy_Efficiency_Data-framework_June_2013_Part_I.pdf [accessed 5 Nov 2013].
DECC (2013d) ‘Energy Consumption in the UK (2013) Chapter 3: Domestic energy consumption in the UK between 1970 and 2012’. Available at: https://www.gov.uk/government/publications/energy-consumption-in-the-uk [accessed 3 Nov 2013].
DECC, BRE (2013) ‘SAP 2012 The Government’s Standard Assessment Procedure for Energy Rating of Dwellings’. Available at: http://www.bre.co.uk/filelibrary/SAP/2012/SAP-2012_9-92.pdf [accessed 2 Nov 2013].
Druckman, A., Jackson, T. (2008) ‘Household energy consumption in the UK: A highly geographically and socio-economically disaggregated model’, Energy Policy, 36(8), 3177–3192. Available at: http://www.sciencedirect.com/science/article/pii/S0301421508001559 [accessed 30 Mar 2013].
Druckman, A., Chitnis, M., Sorrell, S., Jackson, T. (2011) ‘Missing carbon reductions? Exploring rebound and backfire effects in UK households’, Energy Policy, 39(6), 3572–3581. Available at: http://www.sciencedirect.com/science/article/pii/S0301421511002473 [accessed 30 Mar 2013].
East, B. (2013) Are Retrofits Performing as Designed and What Are the Implications for the Retrofitting of Pre-1945 Solid Wall Housing? A Case Study of a Brighton Retrofit. Unpublished MSc thesis, University of East London.
EECA Energywise (2014) The Energy Spot: Episodes 1-33 [Online]. Available at: http://www.energywise.govt.nz/energyspot/episode-1/introduction [accessed 23 Jan 2014].
156

MSc AEES January 2014 Angela Lafferty
Energy Saving Trust (2008) Monitoring Energy and Carbon Performance in New Homes, CE298. Available at: http://www.goodhomes.org.uk/downloads/members/est-ce298-monitoring-energy-and-carbon-performance-in-new-homes.pdf [accessed 10 Apr 2013].
Fanger, P. O. (1970) Thermal comfort. Copenhagen: Danish Technical Press; 1970.
Faulkner, C. (2013) Why the UK Should Embrace Fracking [Online]. Available at: http://www.theguardian.com/environment/2013/dec/19/uk-fracking-shale-gas [accessed 23 Jan 2014].
Fell, D., King, G. (2012) Domestic Energy Use Study: To Understand Why Comparable Households Use Different Amounts of Energy. A Report to the Department for Energy and Climate Change. Brook Lyndhurst.. Available at: http://www.brooklyndhurst.co.uk/domestic-energy-use-study-_222?path=,222 [accessed 14 Oct 2013].
Firth, S.K., Lomas, K.J., Wright, A.J. (2010) ‘Targeting household energy-efficiency measures using sensitivity analysis’, Building Research & Information, 38(1), 25–41. Available at: http://www.tandfonline.com/doi/abs/10.1080/09613210903236706 [accessed 17 Nov 2013].
Galvin, R. (2013) ‘Impediments to energy-efficient ventilation of German dwellings: A case study in Aachen’, Energy and Buildings, 56, 32–40. Available at: http://linkinghub.elsevier.com/retrieve/pii/S0378778812005294 [accessed 10 Nov 2013].
Gill, Z.M., Tierney, M.J., Pegg, I.M., Allan, N. (2010) ‘Low-energy dwellings: the contribution of behaviours to actual performance’, Building Research & Information, 38(5), 491–508. Available at: http://www.tandfonline.com/doi/abs/10.1080/09613218.2010.505371 [accessed 13 Apr 2013].
Gram-Hanssen, K. (2010) ‘Residential heat comfort practices: understanding users’, Building Research & Information, 38(2), 175–186. Available at: http://www.tandfonline.com/doi/abs/10.1080/09613210903541527 [accessed 5 Nov 2013].
Guerra Santin, O., Itard, L., Visscher, H. (2009) ‘The effect of occupancy and building characteristics on energy use for space and water heating in Dutch residential stock’, Energy and Buildings, 41(11), 1223–1232. Available at: http://linkinghub.elsevier.com/retrieve/pii/S0378778809001388 [accessed 29 Oct 2013].
Gupta, R., Darby, D.S. (2011a) Action Research Approach for Gaining and Providing Feedbackon Domestic Energy Use to Understand Occupant Behaviour, Perceptions and Expectations [online]. Available at: http://www.ukerc.ac.uk/support/tiki-download_file.php?fileId=1906&display [accessed 15 Apr 2013].
Haas, R., Auer, H., Biermayr, P. (1998) ‘The impact of consumer behavior on residential energy demand for space heating’, Energy and buildings, 27(2), 195–205. Available at: http://www.sciencedirect.com/science/article/pii/S0378778897000340 [accessed 29 Oct 2013].
Henderson, J. (2008) A Review of the Relationship between Floor Area and Occupancy in SAP,BRE STP 09/ NOFA01. Available at: http://www.bre.co.uk/filelibrary/SAP/2012/STP09-NOFA01_Occupancy_and_floor_area.pdf [accessed 25 Jan 2014].
HM Government (2010) ‘Approved Document L1A Conservation of fuel and power in new dwellings’. Available at: http://www.planningportal.gov.uk/uploads/br/BR_PDF_AD_L1A_2010_V2.pdf [accessed 7 Apr 2013].
HM Government (2011) The Carbon Plan: Delivering Our Low Carbon Future. Available at: https://www.gov.uk/government/uploads/system/uploads/attachment_data/file/47613/
157

MSc AEES January 2014 Angela Lafferty
3702-the-carbon-plan-delivering-our-low-carbon-future.pdf [accessed 12 Nov 2013].
Hodgson, P. (2001a) 'Govt Launches Power Saving Publicity Campaign', Official website of the New Zealand Government [online]. Available at: http://beehive.govt.nz/release/govt-launches-power-saving-publicity-campaign [accessed 23 Jan 2014].
Hodgson, P. (2001b) 'Successful power saving campaign to wind down', Official website of the New Zealand Government [online]. Available at: http://beehive.govt.nz/release/successful-power-saving-campaign-wind-down [accessed 23 Jan 2014].
Huebner, G.M., Cooper, J., Jones, K. (2013) ‘Domestic energy consumption—What role do comfort, habit, and knowledge about the heating system play?’, Energy and Buildings, 66, 626–636. Available at: http://linkinghub.elsevier.com/retrieve/pii/S0378778813004349 [accessed 27 Oct 2013].
Huebner, G.M., McMichael, M., Shipworth, D., Shipworth, M., Durand-Daubin, M., Summerfield,A. (2013) ‘The reality of English living rooms – A comparison of internal temperatures against common model assumptions’, Energy and Buildings, 66, 688–696. Available at: http://linkinghub.elsevier.com/retrieve/pii/S0378778813004131 [accessed 29 Oct 2013].
Humphreys, M.A., Rijal, H.B., Nicol, J.F. (2013) ‘Updating the adaptive relation between climateand comfort indoors; new insights and an extended database’, Building and Environment, 63, 40–55. Available at: http://linkinghub.elsevier.com/retrieve/pii/S0360132313000474 [accessed 11 Jan 2014].
IPCC (2013) Summary for Policymakers. Climate Change 2013: The Physical Science Basis. Contribution of Working Group I to the Fifth Assessment Report of the Intergovernmental Panel on Climate Change. Available at: http://www.climatechange2013.org/images/uploads/WGI_AR5_SPM_brochure.pdf [accessed 16 Nov 2013].
Janda, K.B. (2011) ‘Buildings don’t use energy: people do’, Architectural Science Review, 54(1),15–22. Available at: http://www.tandfonline.com/doi/abs/10.3763/asre.2009.0050 [accessed 3 Apr 2013].
John Gilbert Architects (2010) Glasgow School of Art POE Methodology Study (Draft). Available at: http://www.cicstart.org/userfiles/file/FS-3-REPORT.PDF [accessed 6 Apr 2013].
Kane, T., Firth, S.K., Allinson, D., Irvine, K., Lomas, K.J. (2011) ‘Understanding occupant heating practices in UK dwellings’, Presented at the World Renewable Energy Congress2011, Linköping, Sweden. Available at: https://dspace.lboro.ac.uk/dspace-jspui/handle/2134/12399 [accessed 26 Oct 2013].
Karjalainen, S. (2013) ‘Should it be automatic or manual—The occupant’s perspective on the design of domestic control systems’, Energy and Buildings, 65, 119–126. Available at: http://linkinghub.elsevier.com/retrieve/pii/S0378778813003319 [accessed 27 Oct 2013].
Kelly, S., Crawford-Brown, D., Pollitt, M.G. (2012) ‘Building performance evaluation and certification in the UK: Is SAP fit for purpose?’, Renewable and Sustainable Energy Reviews, 16(9), 6861–6878. Available at: http://www.sciencedirect.com/science/article/pii/S1364032112004595 [accessed 13 Oct 2013].
Lafferty, A. (2013) 'Assessing the Effect of Solar Gain on Annual Energy Consumption for Heating in a Modern Flat Using IES-VE Simulation Software', CEM 163, Centre for Alternative Technology/ University of East London. Unpublished essay.
Leaman, A. (2013) BUS Methodology [online]. Available at: http://www.busmethodology.org [accessed 10 October 2013].
Martin, J.E. (2012) 'Hydroelectricity', Te Ara - the Encyclopedia of New Zealand. Available at:
158

MSc AEES January 2014 Angela Lafferty
http://www.TeAra.govt.nz/en/hydroelectricity [accessed 22 Jan 2014].
Mawditt, I. (2014) Telephone conversation with Angela Lafferty, 08 January.
McMullan, R. (2007) Environmental Science in Building, Sixth edition. Palgrave Macmillan.
MEARU, Assist Architects (2012) 7-11 Gilmour’s Close - Performance Evaluation. Available at: http://www.cicstart.org/userfiles/file/AC-6-REPORT.PDF [accessed 27 Oct 2013].
MEARU, 55 North Architecture (2011) Guidance For Living in a Low Carbon Home, The Scottish Government. Available at: http://www.scotland.gov.uk/Resource/Doc/217736/0116377.pdf [accessed 7 Apr 2013].
Monahan, S., Gemmell, A. (2012) The Impact of Occupant Behaviour and Use of Controls on Domestic Energy Use, NHBC Foundation NF38. Available at: http://www.nhbcfoundation.org/Researchpublications/tabid/339/Default.aspx [accessed 26 Mar 2013].
Monroe, R. (2013) The Annual Rise in CO2 Levels Has Begun - The Keeling Curve [online], Scripps Institution of Oceanography. Available at: http://keelingcurve.ucsd.edu/the-annual-rise-in-co2-levels-has-begun/ [accessed 16 Jan 2014].
Morley, J., Hazas, M. (2011) ‘The significance of difference: Understanding variation in household energy consumption’, ECEEE Proceedings of the 2011 Summer Study. Available at: http://citeseerx.ist.psu.edu/viewdoc/download?doi=10.1.1.225.7551&rep=rep1&type=pdf [accessed 14 Oct 2013].
New Zealand Home Energy Web (2008) Energy at Home [online]. Available at: http://www.physics.otago.ac.nz/eman/hew/ehome/energyuse.html [accessed 18 Jan 2014].
NOABL Wind Map (2012) NOABL Wind Map 1.01 [online]. Available at: http://www.rensmart.com/Weather/BERR [accessed: 15 Jan 2014].
Ofgem (2012) Gas Security of Supply Report. Available at: https://www.ofgem.gov.uk/ofgem-publications/40204/gas-sos-report.pdf [accessed 16 Jan 2014].
Ofgem (2013) Electricity Capacity Assessment Report 2013, Report to the Secretary of State. Available at: https://www.ofgem.gov.uk/ofgem-publications/75232/electricity-capacity-assessment-report-2013.pdf [accessed 16 Jan 2014].
Olesen, S., & Fanger, P. O. (1971). 'Can man be adapted to prefer a lower ambient temperature?' In Proceedings of Fifth International Congress for Heating, Ventilating and Air-Conditioning (Vol. 1, pp. 27-40).
Owen, P. (2012) Powering the Nation: Household Electricity-Using Habits Revealed, Energy Saving Trust. Available at: http://www.energysavingtrust.org.uk/content/download/77884/934627/version/1/file/Powering+the+nation+report+CO332.pdf [accessed 13 Apr 2013].
Palmer, J., Cooper, I., Tillson, A., Hughes, M., CAR, V.C., Summerton, P., CE, R.M., Allinson, D., Oreszczyn, T., AEA, E.R. (2013) ‘United Kingdom housing energy fact file 2012’, London: Department of Energy and Climate Change (DECC). Available at: https://www.gov.uk/government/uploads/system/uploads/attachment_data/file/201167/uk_housing_fact_file_2012.pdf [accessed 16 Nov 2013].
Riley, M., Moody, C., Pitt, M. (2009) ‘A Review of the Evolution of Post-Occupancy Evaluation as a Viable Performance Measurement Tool.’, Presented at the 4th Annual Conference Liverpool BEAN. Available at: http://www.ljmu.ac.uk/BLT/BEST/BEAN/99792.htm [accessed 16 Apr 2013].
Rogers, S., (2012) The domestic energy use map of Britain [Online]. Available at: http://www.
159

MSc AEES January 2014 Angela Lafferty
theguardian.com/news/datablog/interactive/2012/apr/02/energy-use-map-electricity-gas?commentpage=1 [accessed 04 Sept 2013]Sanders, C. (2010) Development of an Affordable Methodology for the Evaluation & Reporting of the Energy Performance of Occupied Dwellings, Final Report, Glasgow Caledonian University. Available at: http://www.scotland.gov.uk/Resource/Doc/217736/0109993.pdf [accessed 27 Mar 2013].
Sadd, L (2014) Email exchange with Angela Lafferty, 14 January.
Sapiro, U., Franses, J., Barrow, M., Cumberlege, T. (2012) Personal CarbonAllowances White Paper: How to Help Consumers Make Informed Choices, A joint report between Carbon Trust Advisory and The Coca-Cola Company. Available at: http://www.carbontrust.com/media/68490/personal__carbon_allowances_white_paper.pdf [accessed 18 Jan 2014].
Sanders, C. (2010) Development of an Affordable Methodology for the Evaluation & Reporting of the Energy Performance of Occupied Dwellings, Final Report, Glasgow Caledonian University, available: http://www.scotland.gov.uk/Resource/Doc/217736/0109993.pdf [accessed 27 Mar 2013].
Saul, H. (2013) 'Ed Davey: I Wear a Jumper at Home to Keep Energy Bills Down, Says Ministeras British Gas Raises Prices by 10%', The Independent [online]. Available at: http://www.independent.co.uk/news/uk/home-news/ed-davey-i-wear-a-jumper-at-home-to-keep-energy-bills-down-says-minister-as-british-gas-raises-prices-by-10-8889452.html [accessed 24 Jan 2014].
Scoop Independent News (2001) Electricity Information for Tuesday 21 August 2001 [online]. Available at: http://www.scoop.co.nz/stories/BU0108/S00218/electricity-information-for-tuesday-21-august-2001.htm [accessed 23 Jan 2014].
Scottish Water (2014) Unmetered Charges 2012-2013 [online]. Available at: http://www.scottishwater.co.uk/you-and-your-home/your-charges/2012-2013-charges/unmetered-charges [accessed: 28 Jan 2014].
Scripps Institution of Oceanography (2013) The Keeling Curve [online]. Available at: http://keelingcurve.ucsd.edu/ [accessed 18 Nov 2013].
Shipworth, M. (2011) ‘Thermostat settings in English houses: No evidence of change between 1984 and 2007’, Building and Environment, 46(3), 635–642. Available at: http://linkinghub.elsevier.com/retrieve/pii/S0360132310002799 [accessed 29 Oct 2013].
Shipworth, M., Firth, S.K., Gentry, M.I., Wright, A.J., Shipworth, D.T., Lomas, K.J. (2010) ‘Central heating thermostat settings and timing: building demographics’, Building Research & Information, 38(1), 50–69. Available at: http://www.tandfonline.com/doi/abs/10.1080/09613210903263007 [accessed 26 Oct 2013].
Stevenson, F. (2008) ‘Post-occupancy evaluation of housing’, Power Point presentation Available at: www. usablebuildings. co. uk/Pages/UBEvents. html. Available at: http://oisd.brookes.ac.uk/conferences/changetosurvive/resources/fionnstevenson_workshop2.pdf [accessed 10 Apr 2013].
Stevenson, F., Leaman, A. (2010) ‘Evaluating housing performance in relation to human behaviour: new challenges’, Building Research & Information, 38(5), 437–441, Available: http://www.tandfonline.com/doi/abs/10.1080/09613218.2010.497282 [accessed 7 Apr 2013].
Sunikka-Blank, M., Galvin, R. (2012) ‘Introducing the prebound effect: the gap between performance and actual energy consumption’, Building Research & Information, 40(3), 260–273. Available at: http://www.tandfonline.com/doi/abs/10.1080/09613218.2012.
160

MSc AEES January 2014 Angela Lafferty
690952 [accessed 9 Nov 2013].
Taylor, M., Cutland, N. (2011) Passivhaus and Zero Carbon: Technical Briefing Document, Passivhaus Trust. Available at: http://www.passivhaustrust.org.uk/UserFiles/File/Technical%20Papers/110705%20Final%20PH%20ZC%20Brief.pdf [accessed 24 Jan 2014].
The Great Big Energy Saving Challenge (2013), BBC Two Scotland Television, 31 October.
The Scottish Government (2013) Scotland’s Future: Your Guide to an Independent Scotland. Available at: http://www.scotland.gov.uk/Publications/2013/11/9348/downloads [accessed 26 Nov 2013].
Thompson, P., Bootland, J. (2011) GHA Monitoring Programme 2009-11: Technical Report. Results from Phase 1: Post-Construction Testing of a Sample of Highly Sustainable New Homes, Good Homes Alliance. Available at: http://www.goodhomes.org.uk/downloads/members/gha-monitoring-report-approved.pdf [accessed 10 Apr 2013].
Thumim, J., White, V., Redgrove, Z., Roberts, S. (2007) Waste Not, Want Not: Energy Tariffs for Sustainability, A report by the Centre for Sustainable Energy for WWF-UK. Available at: http://assets.wwf.org.uk/downloads/energy_tariffs_report.pdf [accessed 23 Jan 2014].
TVNZ One News (2001) 'Nation-wide energy saving underway', 28 July [Online]. Available at: http://tvnz.co.nz/content/50988 [accessed 04 Jan 2014].
Way, M., Bordass, B. (2005) ‘Making feedback and post-occupancy evaluation routine 2: Soft landings – involving design and building teams in improving performance’, Building Research & Information, 33(4), 353–360. Available at: http://www.tandfonline.com/doi/abs/10.1080/09613210500162008 [accessed 10 Apr 2013].
Wintour, P. (2013) 'No. 10 Says People Should Consider Wearing Jumpers to Keep Fuel Bills down', The Guardian [online]. Available at: http://www.theguardian.com/money/2013/oct/18/no-10-jumpers-fuel-bills [accessed 24 Jan 2014].
World Bank (2012) Turn Down the Heat: Why a 4°C Warmer World Must Be Avoided. Available at: http://climatechange.worldbank.org/sites/default/files/Turn_Down_the_heat_Why_a_4_degree_centrigrade_warmer_world_must_be_avoided.pdf [accessed 25 Jan 2014].
Wunderground (2013) Weather History for IMIDLOTH12 [online]. Available at: http://www.wunderground.com/weatherstation/WXDailyHistory.asp?ID=IMIDLOTH12 [accessed: 03Dec 2013]
Zero Carbon Hub (2013) Closing the Gap between Design and as-Built Performance - New Homes, Interim progress report. Available at: http://www.zerocarbonhub.org/resourcefiles/ZCH_DvAB_Full%20Report.pdf [accessed 27 Oct 2013].
BIBLIOGRAPHYAldossary, N.A., Rezgui, Y., Kwan, A. (2014b) ‘Domestic energy consumption patterns in a hot
and humid climate: A multiple-case study analysis’, Applied Energy, 114, 353–365. Available at: http://linkinghub.elsevier.com/retrieve/pii/S0306261913008088 [accessed 27 Oct 2013].
Boait, P.J., Rylatt, R.M. (2010) ‘A method for fully automatic operation of domestic heating’,
161

MSc AEES January 2014 Angela Lafferty
Energy and Buildings, 42(1), 11–16. Available at: http://linkinghub.elsevier.com/retrieve/pii/S0378778809001558 [accessed 7 Nov 2013].
BRE (2011) ‘SAP 2012: Background and Consultation Questions’. Available at: http://www.bre.co.uk/sap2012/page.jsp?id=2759 [accessed 15 Apr 2013].
BRE (2001) The Government’s Standard Assessment Procedure for Energy Rating of Dwellings 2001 EDITION, Task. Available at: http://projects.bre.co.uk/sap2001/SAP2001_web.pdf [accessed 18 Oct 2013].
Butcher, K., Chartered Institution of Building Services Engineers (2005) Heating, Ventilating, AirConditioning and Refrigeration: CIBSE Guide B, Chartered Institution of Building Services Engineers: London.
Chartered Institution of Building Services Engineers (2006) Environmental Design: CIBSE Guide A., CIBSE: London.
CIBSE (1998) Building Energy and Environmental Modelling: Applications Manual AM11, CIBSE, London.
CIBSE (2006) Environmental Design: CIBSE Guide A, CIBSE, London.
CIBSE (2008) CIBSE Concise Handbook., Chartered Inst. of Building Services Engineers: London.
CIBSE (2013) The Limits of Thermal Comfort: Avoiding Overheating in European Buildings., TM52.
Combe, N., Harrison, D., Craig, S. (n.d.) ‘An investigation into usability and exclusivity issues ofdigital programmable thermostats’. Available at: http://dspace.brunel.ac.uk/bitstream/2438/6060/2/Fulltext.pdf [accessed 13 Oct 2013].
Committee on Climate Change (2010) ‘Chapter 6: Power sector decarbonisation to 2030’, in The Fourth Carbon Budget – Reducing Emissions through the 2020s. Available at: http://downloads.theccc.org.uk.s3.amazonaws.com/4th%20Budget/4th-Budget_Chapter6.pdf [accessed 8 Sep 2013].
Das, P., Chalabi, Z., Jones, B., Milner, J., Shrubsole, C., Davies, M., Hamilton, I., Ridley, I., Wilkinson, P. (2013) ‘Multi-objective methods for determining optimal ventilation rates in dwellings’, Building and Environment, 66, 72–81. Available at: http://linkinghub.elsevier.com/retrieve/pii/S0360132313001030 [accessed 11 Jan 2014]
DECC (2013b) Quantitative Research into Public Awareness, Attitudes, and Experience of Smart Meters (Wave 2), 2. Available at: https://www.gov.uk/government/uploads/system/uploads/attachment_data/file/86686/1201137301_-_DECC_SM_Tracking_Report_WAVE_2_-_FINAL_-_1_Feb_2013_-_INTERNAL_USE.pdf [accessed 30 Mar 2013].
DECC, BRE (2011) ‘The Government’s Standard Assessment Procedure for Energy Rating of Dwellings DRAFT 2012 edition’. Available at: http://www.bre.co.uk/filelibrary/SAP/2012/Draft_SAP_2012_December_2011.pdf [accessed 15 Apr 2013].
Evins, R., Pointer, P., Vaidyanathan, R., Burgess, S. (2012) ‘A case study exploring regulated energy use in domestic buildings using design-of-experiments and multi-objective optimisation’, Building and Environment, 54, 126–136. Available at: http://linkinghub.elsevier.com/retrieve/pii/S0360132312000510 [accessed 27 Oct 2013].
Foucquier, A., Robert, S., Suard, F., Stéphan, L., Jay, A. (2013) ‘State of the art in building modelling and energy performances prediction: A review’, Renewable and Sustainable Energy Reviews, 23, 272–288. Available at: http://www.sciencedirect.com/science/
162

MSc AEES January 2014 Angela Lafferty
article/pii/S1364032113001536 [accessed 30 Mar 2013].
Gleeds (2011) Feasibility of Further Reductions in CO2 Arising from Regulated Energy Use in New Homes. Available at: http://www.scotland.gov.uk/Resource/0041/00414404.pdf [accessed 7 Apr 2013].
Henretty, N. (2013) Household Energy Consumption in England and Wales, 2005–11, Office forNational Statistics. Available at: http://www.ons.gov.uk/ons/dcp171766_321960.pdf [accessed 14 Oct 2013].
HM Government (2013) ‘Amendments to the Approved Documents’. Available at: http://www.planningportal.gov.uk/uploads/br/approved-documents-amends-list_2013.pdf [accessed 7 Apr 2013].
Jokisalo, J., Kurnitski, J., Korpi, M., Kalamees, T., Vinha, J. (2009) ‘Building leakage, infiltration,and energy performance analyses for Finnish detached houses’, Building and Environment, 44(2), 377–387. Available at: http://linkinghub.elsevier.com/retrieve/pii/S0360132308000516 [accessed 31 Dec 2013].
Kansara, T., Ridley, I. (2012) ‘Post Occupancy Evaluation of buildings in a Zero Carbon City’, Sustainable Cities and Society, 5, 23–25. Available at: http://linkinghub.elsevier.com/retrieve/pii/S2210670712000364 [accessed 27 Oct 2013].
Kempton, W. (1986) ‘Two theories of home heat control’, Cognitive Science, 10(1), 75–90. Available at: http://csjarchive.cogsci.rpi.edu/1986v10/i01/p0075p0090/MAIN.PDF [accessed 14 Jan 2014].
Kershaw, H., Lelyveld, T., Burton, S., Orr, G., Charlick, H., Dennish, T., Crowther, M. (2010) In-Situ Monitoring of Efficiencies of Condensing Boilers – TPI Control Project Extension, Final Report for Energy Saving Trust. Available at: http://www.energysavingtrust.org.uk/content/download/31412/376568/version/1/file/In-situ+monitoring+of+efficiencies+of+condensing+boilers+%E2%80%93+TPI+control+project+extension.pdf [accessed 7Nov 2013].
Lomas, K.J. (2010) ‘Carbon reduction in existing buildings: a transdisciplinary approach’, Building Research & Information, 38(1), 1–11. Available at: http://www.tandfonline.com/doi/abs/10.1080/09613210903350937 [accessed 26 Oct 2013].
McMichael, M., Shipworth, D. (2013) ‘The value of social networks in the diffusion of energy-efficiency innovations in UK households’, Energy Policy, 53, 159–168. Available at: http://www.sciencedirect.com/science/article/pii/S0301421512009202 [accessed 30 Mar2013].
Menezes, A.C., Cripps, A., Bouchlaghem, D., Buswell, R. (2012) ‘Predicted vs. actual energy performance of non-domestic buildings: Using post-occupancy evaluation data to reduce the performance gap’, Applied Energy, 97, 355–364. Available at: http://linkinghub.elsevier.com/retrieve/pii/S0306261911007811 [accessed 30 Mar 2013].
Monahan, S., Gemmell, A. (2011) How Occupants Behave and Interact with Their Homes, NHBC Foundation NF35. Available at: http://www.nhbcfoundation.org/Researchpublications/tabid/339/Default.aspx [accessed 26 Mar 2013].
Nowak, T. (2009a) Energy Efficiency, BRE 3, Energy Use in Homes 2007. Available at: http://www.bre.co.uk/filelibrary/pdf/rpts/Energy_Efficiency_2007.pdf [accessed 1 Apr 2013].
Nowak, T. (2009b) Space and Water Heating, BRE 1, Energy Use in Homes 2007. Available at: http://www.bre.co.uk/filelibrary/pdf/rpts/Space_and_Water_Heating_2007.pdf [accessed 1 Apr 2013].
163
MSc AEES January 2014 Angela Lafferty
Nowak, T. (2009c) Thermal Insulation, BRE 2, Energy Use in Homes 2007. Available at: http://www.bre.co.uk/filelibrary/pdf/rpts/Thermal_Insulation_2007.pdf [accessed 1 Apr 2013].
Pan, W. (2010) ‘Relationships between air-tightness and its influencing factors of post-2006 new-build dwellings in the UK’, Building and Environment, 45(11), 2387–2399. Available at: http://linkinghub.elsevier.com/retrieve/pii/S0360132310001186 [accessed 11 Jan 2014].
Preiser, W.F., Nasar, J.L. (2008) ‘Assessing building performance: Its evolution from post-occupancy evaluation’, International Journal of Architectural Research, 2(1), 84–99. Available at: https://archnet.org/gws/IJAR/8821/files_8181/2.1.06%20-w.preiser%20&%20j.%20nasar-pp84-99.pdf [accessed 26 Oct 2013].
Royal Academy of Engineers (2010) Global Water Security – an Engineering Perspective [Online]. Available at: http://www.raeng.org.uk/gws [accessed 06 December 2010].
Scottish Building Standards Agency (2007) A Low Carbon Building Standards Strategy for Scotland., Scottish Building Standards Agency, Livingston.
Scottish Government (2011) ‘Energy Report Example’. Available at: http://www.scotland.gov.uk/Resource/Doc/1125/0116244.pdf [accessed 1 Apr 2013].
Sheridan, L. (no date) Developing a Standardised Methodology for Post-Occupancy Evaluationof Recently Built Housing [online]. Available at: www.ads.org.uk/download/4735-linda-sheridan [accessed 26 Mar 2013].
Socolow, R.H. (1978) ‘The Twin Rivers program on energy conservation in housing: Highlights and conclusions’, Energy and Buildings, 1(3), 207–242. Available at: http://www.sciencedirect.com/science/article/pii/0378778878900038 [accessed 11 Jan 2014].
Spataru, C., Gillott, M., Hall, M.R. (2010) ‘Domestic energy and occupancy: a novel post-occupancy evaluation study’, International Journal of Low-Carbon Technologies, 5(3), 148–157. Available at: http://ijlct.oxfordjournals.org/cgi/doi/10.1093/ijlct/ctq020 [accessed 22 Oct 2013].
Spring, M. (2011) ‘Bridging the gap: Post-occupancy evaluation’, Architects’ Journal. Available at: http://www.architectsjournal.co.uk/home/footprint/bridging-the-gap-post-occupancy-evaluation/8611760.article [accessed 10 Nov 2013].
Stevenson, F., Carmona-Andreu, I., Hancock, M. (2013) ‘The usability of control interfaces in low-carbon housing’, Architectural Science Review, 1–13. Available at: http://www.tandfonline.com/doi/abs/10.1080/00038628.2012.746934 [accessed 7 Apr 2013].
Taylor Wimpey (2012) ‘Climate Policy’. Available at: http://about.taylorwimpey.co.uk/NR/rdonlyres/6D4D07FB-509D-424F-88AE-733E5D89A003/0/2012_ClimatePolicy.pdf [accessed 26 Mar 2013].
The Scottish Government (2009) Modelling Greenhouse Gas Emissions from Scottish Housing:Final Report. Available at: http://www.scotland.gov.uk/Resource/Doc/287852/0087812.pdf [accessed 20 Dec 2013].
University of Exeter (n.d.) ‘Post Occupancy Evaluation’, in The Design and Delivery of Low Carbon Buildings. Available at: http://www.exeter.ac.uk/media/universityofexeter/research/newsandevents/Post_Occupancy_Evaluation.pdf [accessed 10 Apr 2013].
Utley, J.I., Shorrock, L.D. (2008) Domestic Energy Fact File 2008. Available at: http://www.bre.co.uk/filelibrary/pdf/rpts/Fact_File_2008.pdf [accessed 7 Apr 2013].
164

MSc AEES January 2014 Angela Lafferty
Yohanis, Y.G. (2012) ‘Domestic energy use and householders’ energy behaviour’, Energy Policy, 41, 654–665. Available at: http://linkinghub.elsevier.com/retrieve/pii/S0301421511009050 [accessed 22 Oct 2013].
Yohanis, Y.G., Mondol, J.D. (2010) ‘Annual variations of temperature in a sample of UK dwellings’, Applied Energy, 87(2), 681–690. Available at: http://linkinghub.elsevier.com/retrieve/pii/S0306261909003146 [accessed 2 Nov 2013].
Yohanis, Y.G., Norton, B. (2000) ‘A comparison of the analysis of the useful net solar gain for space heating, zone-by-zone and for a whole-building’, Renewable energy, 19(3), 435–442. Available at: http://www.sciencedirect.com/science/article/pii/S0960148199000099 [accessed 2 Nov 2013].
Zero Carbon Hub (2010) Carbon Compliance for Tomorrow’s New Homes: A Review of the Modelling Tool and Assumptions. Overview of Findings and Recommendations, Available: http://www.zerocarbonhub.org/resourcefiles/CARBON_COMPLIANCE_GREEN_OVERVIEW_18Aug.pdf [accessed 18 Nov 2013].
Zimmerman, J.-P., Evans, M., Griggs, J., King, N., Harding, L., Roberts, P., Evans, C. (2012) Final Report Issue 4 Household Electricity Survey A Study of Domestic Electrical Product Usage, R66141. Available at: http://randd.defra.gov.uk/Document.aspx?Document=10043_R66141HouseholdElectricitySurveyFinalReportissue4.pdf [accessed 13 Apr 2013].
165