
the role of housing and building - ECA Repository
225
the role of housing and building EC AC 332.S21 H91S5 c.2 united nations
-
Upload
khangminh22 -
Category
Documents
-
view
1 -
download
0
Transcript of the role of housing and building - ECA Repository

the role of housing and building
EC AC 332.S21 H91S5
c.2
united nations

m^wm «mm
MÜoei

HUMAN SETTLEMENTS IN AFRICA THE ROLE OF HOUSING AND BUILDING
UNITED NATIONS ECONOMIC COMMISSION FOR AFRICA
ADDIS ABABA APRIL 1976

FOREWORD BY THE EXECUTIVE SECRETARY OF THE ECONOMIC COMMISSION FOR AFRICA
This publication has been prepared by the Economic Commission for Africa in collaboration with the Government of the Netherlands which has provided valuable assistance. This collaboration is one of many which the Commission has had with the Government of the Netherlands since 1967 in different fields. Because of many such fruitful collaborations and having regard to the interest of the Government in the problems of human settlements in developing countries, the Commission sought and readily obtained assistance in the preparation of this volume because of the vast amount of information and data which had been accumulated jointly from 1967 onwards.
The publication should be a valuable tool which can be used by African administrators and technologists, including economic and financial planners, in the preparation of national development plans and for the implementation of chosen policies and programmes in human settlements. The publication should also be of use to international institutions and bilateral donors in understanding the conditions and needs of African countries. Among other things, it will enable them to appreciate fully areas where emphasis might be placed and impact achieved. At national level it is our considered view that the publication will help to make a continuing impact on the development of human settlements in Africa through full consideration of the establishment and building up of national and local institutions.
Let me hasten to add that the publication of this volume is not an end in itself. There is indeed an urgent need to take account of the possibilities of follow-up action. Such possibilities might include more regular publication of information and data affecting particular problems, a study of the time span needed for human settlements development based on the approaches we have offered, the development of standards including minimum standards for different types of housing related to income, and demonstration projects in co-operative and aided self-help housing, together with analysis of such conditions and evaluation of results. It would need to be decided at the appropriate time whether these actions would be on a continental, sub-regional or national scale but there can be no one - dimensional approach to the tackling of these problems of human settlements.
I commend the reading of the approaches offered in this publication to all concerned in the development and improvement of living conditions in this continent.
A special acknowledgement has to be made to the Governments of Cöte-d'Ivoire, Sudan, Tunisia and Zambia for all the aid received in the elaboration of the case studies.
In conclusion, I would like to express special thanks to Mr. F.H.J. Nierstrasz, Mr. H. van den Born, Mr. C. Dijkgraaf, and Mr. W. Rip all of Bouwcentrum, Rotterdam, who worked in close collaboration with the ECA staff members.
Addis Ababa, February 1976 Adebayo Adedeji Executive Secretary


Contents
Foreword 1
Introduction 4
Part 1 A Factual Analysis
Chapter 1 Scope for Reflection 5 Chapter 2 Population 8 Chapter 3 Urbanisation 15 Chapter 4 Housing Needs 19 Chapter 5 Income 24 Chapter 6 Education and Training 30
Part 2 A Framework for Decision Making
Chapter 7 Economic Restraints and Social Benefits 33 Chapter 8 Basic Decisions 40 Chapter 9 Staging a policy 45
Part 3 Aspects of Implementation
Chapter 10 Priorities in Standards and Design 51 Chapter 11 Construction and Building Materials 66 Chapter 12 Housing Finance 76 Chapter 13 Settlement Planning, Land Use and Local Government 94
Part 4 Case Studies
Chapter 14 The Resettlement in Port Sudan Town 103 Chapter 15 The Programme for the Upgrading of Squatter Settlements 112
in Lusaka Chapter 16 Housing in Tunisia 121 Chapter 17 Resettlement and Modernisation of Rural Housing in Ivory Coast 134
Part 5 Conclusions and Recommendations 142
Annexes 145
3

INTRODUCTION
The right of everybody to decent housing has already been recognized in 1948 in the Universal Declaration of Human Rights. However, all over the world experience has shown time and again that the realization of this right is difficult and needs the continuous efforts of central, regional and local governments, of the building and the building materials industries, of the financial world and, not least, of all the people who need shelter, shelter fit for human living and in an environment that really offers economic, social, cultural and recreational opportunities. Moreover, it must be an environment in balance with the natural resources of this planet.
As so far experienced both in and outside Africa, easy, ready-made and generally applicable solution^ of this many-sided problem are not available.
The conclusion drawn in World Housing Survey1 that housing conditions deteriorate at an alarming rate is certainly still true in most if not all urbanizing parts of Africa. However in many African countries important work is done, leading to improvements in the conceptual and — albeit it on a still modest scale — in the practical sense. More and more it is recognized that people's participation and self-reliance are of major importance in the satisfying of housing needs. Africa has potentials to develop its housing in a truly modern approach, that means corresponding with its specific needs and in its own way affecting design and use of materials as well as organizational, financial and land-use aspects. It becomes recognized that a. African society has a long and valuable tradition of communal action; b. traditional building materials can be used for building conforming to adequate quality
standards; c. improvement of such materials is possible; d. local production of building materials is possible, but not yet organized on a large scale; e. human potential is available, but not yet organized; f. architecture is not new in Africa, but ignored in many countries.
However, tremendous efforts and, even more, a lot of ingenuity are needed to achieve positive solutions. The longer the process of deterioration continues the more difficult it will be to catch up with the resulting arrears, economically, technically and socially. Therefore it is urgent to pool every piece of available knowledge. Whereas solutions will always at least have to be attuned to conditions that can differ from country to country and from place to place, information concerning approaches and experience elsewhere can surely be valuable.
This survey has been prepared on behalf of the United Nations Economic Commission for Africa to help governments and other parties concerned with the conceptualization and analysis of the problems involved, to supply them with the most up-to-date information about solutions and experiences in other African countries, and thus to help them to solve their housing problem. The set-up of this volume differs in many aspects from the E.C.A.'s 1965 publication, Housing in Africa.2 Less emphasis is put on statistical data, insofar as these data can be found in other accessible sources such as statistical and demographic year books. On the other hand, more attention is given to subjects that can be of more instrumental value to decision makers and practicians. Within this framework also a small number of projects realized or in the stage of realization have been presented in the form of case studies described and discussed in depth.
Although it is recognized that housing problems can only be solved in the context of a comprehensive human settlements policy, this survey focusses on the role of housing and building. The technical, economic and administrative aspects of housing and building are such that the need for a specialist's approach certainly continues to exist.
The ECA and the authors to whom it entrusted this study are fully aware of the fact that many problems are still waiting for a solution and that on the subject of housing in developing countries neither final statements nor easy recipes can be given. African countries have started, or are starting, with a more comprehensive approach towards housing. Essentially this book has to be, and cannot be more than, a trend report which condenses and reflects in an analytical way the thinking and practical work that are under way. It is hoped that this survey will be of help to all especially concerned in efforts to further development.
United Nations Economic and Social Council, Report of the Secretary General: World Housing Survey E/C.6/129, Geneva, 5 September 1973. United Nations Economic and Social Council, Economic Commission for Africa, Housing in Africa, Addis Ababa, 1965.

PART 1 A FACTUAL ANALYSIS


CHAPTER 1. SCOPE FOR REFLECTION
The Urban Scene
Although several ancient civilisations in Africa have known the phenomenon of urbanconcentrations, only the northern part of the continent has a lasting and continuous traditionconcerning urban settlements. Similarly, the administration, management and planning of urbanareas, are often in a developing stage. Those responsible have no doubt to deal with enormousproblems, out of which the rapid growth of the urban population is most alarming. fncomparison with traditional settlements in rural areas, present-day urbanization implies a sharpand sudden interference with the originally existing ecological system.
The concentration of large numbers of people in limited areas can only be maintainedsuccessfully with the aid of more or less sophisticated solutions of problems that either do notexist at all in rural areas or that exist there only to a much smaller extent. Water supply, wastedisposal, the lack of availability of (traditional) building materials and fire hazards ean all bequoted in connection with the interference with the eco-system.
Out of this area arises the need for building codes. However, the existence of building codesand the lack of suitable building materials make it considerably more difficult for people tobuild their own houses. Other factors also working against self-help include the scarcity andhigh prices of land and the loosening or loss of communal ties.
Foreign examples, coming mostly from industrialized countries in other climatic zones, proveat the best only of limited value. Standards and building codes as developed in those countriesare in many respects not suitable in African conditions. Climatological differences constitute ofone reason. Building codes as inherited from the colonial period were also heavily basedtowards the use of the building materials known in the "mother"land. but that often are notand cannot be made available in sufficient quantities at acceptable prices in the African countryitself. Examples of very expensive civil servants housing as inherited from the colonial period,together with the flood of rising expectations, may have been handicaps for a realisticassessment of the problems at stake.
Whereas traditional building approaches as developed during the centuries in villages couldnot be applied in fastly urbanizing areas, modern education for the building industry has beenespecially for the higher grades, and more oriented towards the economic, technical and socialcircumstances prevailing in industrialized countries than towards the needs of urbanizing Africa.
Although in the Northern African region cities have been a well-known phenomenon sinceancient times - long before the rise of [slam and Christianity - rapid urbanization there isproducing for the peoples and their governments enormous problems concerning housing.Increases in population and mass migration to towns are also difficult to deal with in thisregion, notwithstanding the age-long experience in the building of towns. Sheer numbers, lowincomes, limited investment funds, rising expectations and the adaptation of old towns tomodern economic development are important factors.
[n urbanizing areas in most developing countries the provision of housing does not as a matterof course mean the learning of techniques and the copying of solutions from economically andtechnically more advanced countries. In situations with an abundant supply of labour, lowwages, ouvert and hidden unemployment, lack of foreign currency the introduction of sophisticated capital-intensive production methods for building will make houses unnecessarily expensive, will not lead to economical production on the required scale. will be of little value for thecreation of more employment, will result in an outflow of money from the country (interestand repayments for the machinery), and may well increase the balance of payments problem. Itwould not be wise to adapt more or less automatically to the production methods whichprevailed in the now industrialized countries long ago, when also in those countries labour wascheap and investment capital extremely scarce. It may well be that with present-day technological knowledge, and taking fully into account the economic and other conditions prevailingin the country, better production methods can be developed than were formerly used in thenow developed countries. Because the development of such methods is primarily in the interestof the developing countries, such methods will have to be developed mostly by these countries.
The best solutions may differ from country to country, but not only because of differences inthe availability of certain types of building materials. Differences in income and in theavailability of investment funds can be of decisive influence. The economically optimaltechnical combinations of labour and capital goods in the form of building equipment, willdepend upon the possible rate of increase in incomes, wage level, the availability of labour ofdifferent skills, the availability of capital, and the balance of trade. In all these respects thereare differences in the countries on the African continent. Most countries have only slowly
5

increasing per capita incomes out of which the necessary investments have to be made, and have a lack of investment capital. Some countries, however, are in a better position because of oil revenues. This is particularly true for Libya. Because of its relative abundance of investment means coming out of oil revenues, this country can afford, both economically and technologically, to make some big steps forward. The phase of more labour-intensive production methods which are necessarily applied for the time being, and perhaps for some decades to come in mcst African countries, can rather easily be omitted in a case like this.
For any country the choice and development of building methods best suited to its social and economic condition is of tremendous importance. The fact is that the vast majority of Africans have to live in very poor circumstances and that they cannot afford to buy or rent houses erected with the aid of so called modern technology. "How can people be so poor that they cannot even afford to buy ready-baked bread, but have to make their own to save the baker's profit, even dream of a factory-made house? To talk of prefab rication to people living in such poverty is worse than stupid; it is a cruel mockery of their condition."1
That original and very rewarding combinations of traditional materials, labour-intensive methods and recently-developed intermediate technologies can be made has been proved in a number of cases, some of which are mentioned in the "case-study" chapters of this book.
The urgent need for such approaches will become more clear when consideration is given to the dimensions of the problem. Because an understanding of the process of urbanization has lagged considerably behind the process as such in many African cities, housing especially for low-income groups has developed haphazardly, leading to very unsatisfactory conditions in terms of health, opportunities and well-being. In a situation where, for instance, 40 per cent of the population is in urgent need of houses of rather modest minimum standards, the corresponding total investment need will be at least in the order of 60-80 per cent of the annual income of the whole population of the region. Because of other urgent needs it may well be that only five per cent or less of regional income could be spent on investment in housing, and even that will entail considerable effort. If there is an annual increase in population (natural + migration) of five per cent, this would mean an additional annual need of 7.5-10 per cent of the regional income.
Furthermore, it should be realized that there are urban areas where some 70 per cent of the population is badly housed. If standards as used in Western Europe today would be applied, the investment needs for housing only would perhaps have to be multiplied by 4 to 8 or even more. It should be realized that the present housing stock in the so-called rich countries is the result of 100 years'or more of building activity. If in such countries a large part of the housing stock would have to be renewed in a short time that would also mean total investment needs equal to 70 to 150 per cent of the national income.
•
Thus the housing job to be done in urban areas in Africa has tremendous dimensions and this constitutes an enormous challenge to any political system.
The dimensions of this challenge and the differences in social setting in African countries make it necessary to evaluate very critically the financial and administrative systems originating from countries longer on the road of economic development where such systems have been transplanted to Africa.
The Rural Scene
Many if not most of the housing problems in urban areas as discussed in the foregoing paragraph are caused by a dense population on limited areas. Traditional solutions as developed and practiced over the years in indigenous villages are, as already pointed out, for many reasons not applicable in urban areas. This does, however, not imply that rural housing nowadays poses no problems, should continue as before and should receive no attention from governments. This is, in fact, more and more being recognized in Africa. Nevertheless, in rural areas the problems are of very different and smaller dimensions than in urban and urbanizing areas.
Just as urban housing is closely connected with urban development, so are the problems of rural housing tied to rural development. Rural housing needs growing attention for a number of reasons, some of which are:
Fathy, H,: Architecture for the poor, The University of Chicago Press, Chicago, 1973. 6

1. Population is also increasing in rural areas which leads to the growth of existing settlements and the need for new settlements. Besides that, the preponderance of the rural sector is still overwhelming: about 80 per cent of the population live in the rural areas, while in terms of employment the preponderance is even more marked.
2. Traditional housing and building themselves are admittedly real achievements in man's long struggle to adapt the environment to his needs. Today, however, the villagers themselves are questioning whether improvements can be made in terms of health, security, comfort and the efforts needed to provide such housing.
3. In some countries — such as Uganda, Rwanda and Swaziland — the traditionally scattered distribution of homesteads presents special problems which make the development of villages necessary in order to realize rural development.
4. With changes in the methods of agricultural production and in the nature of agricultural products, with the transformation from a closed self-sufficient economy to a market-oriented system, new ideas are coming in. For example, with the rise of regional centres, modern building materials and modern housing facilities are coming within the people's horizon.
5. Such examples are also introduced by village people who are working in towns but who build modern houses in their home village with the intention of returning there after retirement.
6. The idea of achieving better housing in rural regions fits well into the regional development approach.
Special cases for attention to rural housing can arise out of the creation of artificial lakes in connection with the installation of hydro-electric plants, making it necessary to transplant whole villages. Famous examples in Africa in this respect are the Volta River, the resettlement Scheme in Ghana, the Bandama Valley-project in Ivory Coast, and similar projects in Nigeria, Mozambique, etc.
Not the least important argument for giving attention to rural housing is the necessity of preventing ever-growing disparities between urban and rural regions. In all cases where it is considered necessary to reduce the flow of migrants to urban areas the supply of better housing can be a positive factor within the framework of a more comprehensive regional development policy.2 Policies in such a direction are chosen in situations where an increase in agricultural production is given a high priority and in those cases where it is felt that the capacity of the urban regions to absorb migrants is limited.
Thus, the problems of urban and rural housing differ in many respects. The dimensioning of the urbanization problem attracts most attention and this is leading to a relative neglect of the rural sector both by government action and private initiative. Although direct action in urban areas is necessary and governments will be compelled to develop new approaches to housing and building, there can be little doubt that regional socio-economic development is the most critical problem, and that efforts have to be concentrated on this item.
United Nations Economic Commission for Africa, Factors in regional planning affecting human settlements in Africa, Doc. E/CN.14/HUS/I, Addis Ababa, 23 March 1975, p. 38-42.
7

CHAPTER 2. POPULATION
Size and Rate of Growth
Factual knowledge of the African population and its characteristics is still imperfect. However, in an increasing number of countries the collection of basic data has improved, mainly due to their taking part in the 1970 round of the UN population programme. According to recent estimates, (see Table 2-1) the total number of inhabitants in independent developing Africa is about 350 million. The annual rate of growth during the 1960's was 2.5, while for the early 1970's this figure was 2.8. A further increase can be expected, which is shown in Table 2-11. The population will double in approximately 25 years.
Fertility and Mortality
This projection is based on the fact that fertility will probably show only a slow decline, and that mortality, due to increasing control of diseases and improvement of basic health conditions, will drop considerably. The birth rate in Africa is at present 47 per thousand of the population, and the death rate about 21 per thousand. These rates are higher than those of any other area in the world, but the natural growth rate still remains below that of Latin America, which in the late 1960's was facing a growth rate of 2.9.1
It is important to note, however, that there are wide differences from country to country regarding birth and death rates. Death rates in North Africa are (except Sudan) lower than 15 per thousand and expected to be about 10-11 per thousand within the next 10 years.2 For West and Central African countries this figure is at present between 20 and 26 per thousand, except Ghana (16). Projections show a decline to between 17 and 22 per thousand for 1985 (Ghana 13). During the next decade birth rates for most countries will remain on a level over 45 per thousand except in Egypt (39), Mauritius (30) and Gabon (33).
Age Structure
These changes in the incidence of birth and death will have a strong impact on the age structure of the African population. The fact that high fertility affects population structure more significantly than mortality is causing a high increase of the percentage of the number of persons under 15 years old; this phenomenon is accelerated by improving health conditions, which also strongly affects the rise of the age group over 64. Table 2-III shows the development of age groups for some African countries. All have faced such a rapid increase of the dependency ratio that this figure will go over 1,000 for most of them within a few years. This means that for every person in the working age group (15-64) there is about one other present in the dependent age groups. For developed countries the dependency ratio lies between 500 and 700.
Sex Distribution
The implications of a high ratio of one sex to the other in planning a country's development with regard to human settlements are important in considering marriage and marital problems. Data on sex distribution are not available for all African countries, but Table 2-1V shows a predominance of males over females in 14 countries, while in 16 there are more females than males. Considerable disparities can be regarded as exceptions and mainly arise from temporary events, such as migration of males to industrial centres abroad. (Lesotho's male-female ratio was 76 in 1969). However, there is at present insufficient knowledge about determinants of the total sex ratio, such as sex ratio at birth, infant and childhood mortality and sex pattern of deaths to explain differences up to 5 per cent.
Household Size
African households tend to be larger than in European countries. This is not only caused by higher birth rates, but also due to the fact that related or unrelated non-family members are found in African households. Per country a wide variability in household size can be seen. Also there is quite a difference between urban and rural household size, which can be explained by the high growth rates of the major cities, attracting young people, often not accompanied by relatives (see Tables 2-V and 2-VI). The information given in Table 2-V shows that country averages range from 3.9 (Gabon) to 6.6 (Burundi). An increase in household size may be expected for many countries, because of declining infant mortality.
United Nations Economic and Social Council, Economic Commission for Africa, Survey of Economic Conditions in Africa 1971, Part I, UN Sales no. E72. IL K.7, New York, 1972. United Nations, Population Division, World Population Prospects 1965-2000 as assessed in 1968, UN Sales no. E/F.72. XIII.4, New York, 1974.
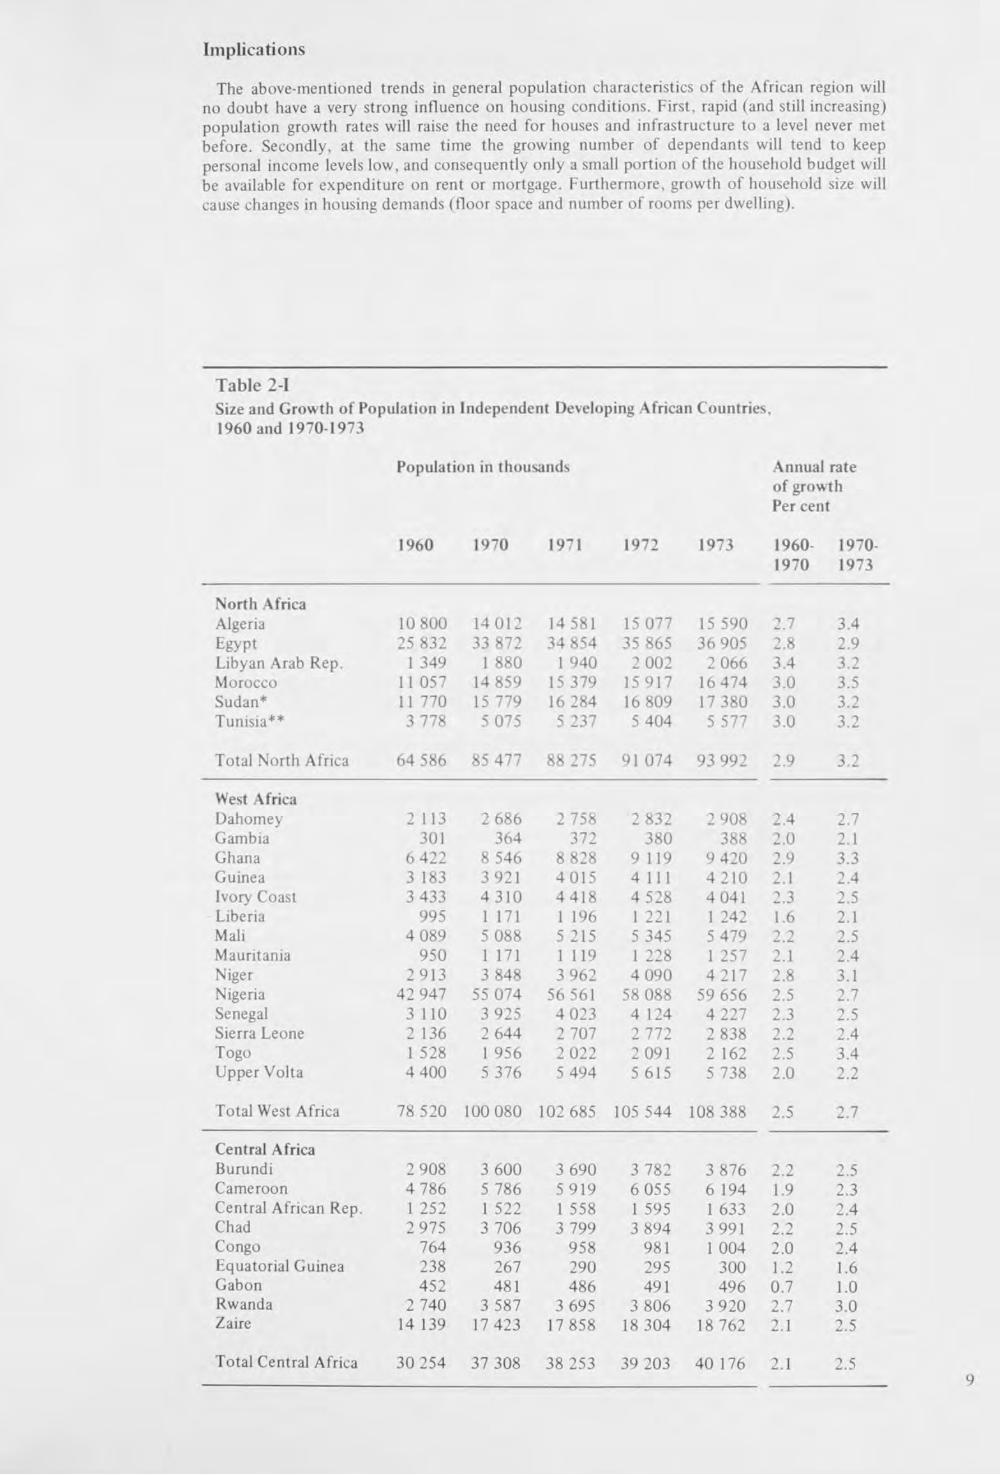
Implications
The above-mentioned trends in general population characteristics of the African region will no doubt have a very strong influence on housing conditions. First, rapid (and still increasing) population growth rates will raise the need for houses and infrastructure to a level never met before. Secondly, at the same time the growing number of dependants will tend to keep personal income levels low, and consequently only a small portion of the household budget will be available for expenditure on rent or mortgage. Furthermore, growth of household size will cause changes in housing demands (floor space and number of rooms per dwelling).
Table 2-1 Size and Growth of Population in Independent Developing African Countries, 1960 and 1970-1973
Population in thousands Annual rate of growth Per cent
1960 1970 1971 1972 1973 1960- 1970-1970 1973
North Africa Algeria 10 800 14 012 14 581 15 077 15 590 2.7 3.4 Egypt 25 832 33 872 34 854 35 865 36 905 2.8 2.9 Libyan Arab Rep. 1 349 1 880 1 940 2 002 2 066 3.4 3.2 Morocco 11 057 14 859 15 379 15 917 16 474 3.0 3.5 Sudan* 1 1 770 15 779 16 284 16 809 17 380 3.0 3.2 Tunisia** 3 778 5 075 5 237 5 404 5 577 3.0 3.2
Total North Africa 64 586 85 477 88 275 91 074 93 992 2.9 3.2
West Africa Dahomey 2 113 2 686 2 758 2 832 2 908 2.4 2.7 Gambia 301 364 372 380 388 2.0 2.1 Ghana 6 422 8 546 8 828 9 119 9 420 2.9 3.3 Guinea 3 183 3 921 4 015 4 111 4 210 2.1 2.4 Ivory Coast 3 433 4 310 4 418 4 528 4 041 2.3 2.5 Liberia 995 1 171 1 196 1 221 1 242 1.6 2.1 Mali 4 089 5 088 5 215 5 345 5 479 2.2 2.5 Mauritania 950 1 171 1 119 1 228 1 257 2.1 2.4 Niger 2 913 3 848 3 962 4 090 4 217 2.8 3.1 Nigeria 42 947 55 074 56 561 58 088 59 656 2.5 2.7 Senegal 3 110 3 925 4 023 4 124 4 227 2.3 2.5 Sierra Leone 2 136 2 644 2 707 2 772 2 838 2.2 2.4 Togo 1 528 1 956 2 022 2 091 2 162 2.5 3.4 Upper Volta 4 400 5 376 5 494 5 615 5 738 2.0 2.2
Total West Africa 78 520 100 080 102 685 105 544 108 388 2.5 2.7
Central Africa Burundi 2 908 3 600 3 690 3 782 3 876 2.2 2.5 Cameroon 4 786 5 786 5 919 6 055 6 194 1.9 2.3 Central African Rep. 1 252 1 522 1 558 1 595 1 633 2.0 2.4 Chad 2 975 3 706 3 799 3 894 3 991 2.2 2.5 Congo 764 936 958 981 1 004 2.0 2.4 Equatorial Guinea 238 267 290 295 300 1.2 1.6 Gabon 452 481 486 491 496 0.7 1.0 Rwanda 2 740 3 587 3 695 3 806 3 920 2.7 3.0 Zaire 14 139 17 423 17 858 18 304 18 762 2.1 2.5
Total Central Africa 30 254 37 308 38 253 39 203 40 176 2.1 2.5 9

Table 2-1 (continued) Size and Growth of Population in Independent Developing African Countries, 1960 and 1970-1973
Population in thousands Annual rate of growth Per cent
1960 1970 1971 1972 1973 1960- 1970-1970 1973
Eastern Africa Botswana 506 623 637 652 667 2.1 2.3 Ethiopia 20 700 25 046 25 597 26 160 26 735 1.9 2.2 Kenya 8 115 10 898 11 247 11 607 11 978 3.0 3.2 Lesotho 885 1 043 1 064 1 085 1 107 1.6 2.0 Madagascar 5 370 6 932 7 126 7 326 7 531 2.6 2.8 Malawi 3 447 4 443 4 558 4 676 4 798 2.6 2.6 Mauritius 662 861 882 904 927 2.7 2.5 Somalia 2 226 2 789 2 862 2 936 3 012 2.3 2.6 Swaziland 320 421 434 447 460 2.8 3.0 Tanzania 10 328 13 236 13 593 13 960 14 337 2.5 2.7 Uganda 7 489 9 774 10 106 10 450 10 805 2.7 3.4 Zambia 3 219 4 295 4 428 4 565 4 706 2.9 3.1
Total Eastern Africa 63 267 80 361 82 534 84 768 87 063 2.4 2.7
Total independent developing African countries 236 627 303 551 311 747 320 589 329 619 2.5 2.8
* See chapter 16 (case study Port Sudan) for results of the 1973 population census. ** See chapter 17 (case study Tunisia) for results of the 1975 population census.
Source: United Nations World Population Prospects as Assessed in 1968, Population Studies, No. 53, New York, 1973.
Table 2-II Projected Population in Independent Developing Africa at 5-year Intervals, 1965-2000
Year Population in millions Annual rate of growth in per cent
High Medium Low Period High Medium Low variant variant variant variant variant variant
1965 266.5 266.5 266.5 1970 303.3 303.3 301.5 1965-1970 2.6 2.6 2.5 1975 349.9 348.6 342.8 1970-1975 2.9 2.8 2.6 1980 407.6 403.5 391.7 1975-1980 3.1 3.0 2.7 1985 479.5 469.1 447.4 1980-1985 3.3 3.1 2.7 1990 564.0 546.1 508.7 1985-1990 3.3 3.1 2.6 1995 666.7 633.9 573.0 1990-1995 3.4 3.0 2.4 2000 784.3 730.0 639.0 1995-2000 3.3 2.9 2.2
Source: Survey of economic conditions in Africa 1973, UN Sales no. E.75.11.K.1. New York, 1974.

Table 2-III Growth of Age Groups in Index Figures in Selected African Countries
Country Year Age Group as % of Total Population Dependency Ratio
0- 14 15 - 39 40 -64 65 and over
% index % index % index % index
Algeria 1956 42.6 100.0 37.0 100.0 17.4 100.0 3.0 100.0 838 Algeria 1966 47.2 110.0 33.6 90.6 14.8 85.2 4.4 146.3 1 066
Ghana 1960 44.6 100.0 38.4 100.0 13.9 100.0 3.1 100.0 912 1970 46.9 105.2 36.1 94.0 13.4 96.1 3.6 117.2 1 020
Morocco 1960 44.4 100.0 35.1 100.0 16.5 100.0 4.0 100.0 938 1971 46.2 104.0 33.6 95.6 15.6 94.5 5.6 143.0 1 074
Tunisia 1956 40.9 100.0 36.9 100.0 17.7 100.0 4.5 100.0 976 1966 46.3 113.2 33.5 90.9 16.6 94.0 3.6 78.9 996
Libya 1954 38.0 100.0 37.1 100.0 18.7 100.0 6.2 100.0 792 Libya 1964 43.7 115.1 35.9 96.7 15.3 81.7 5.1 82.5 953
Uganda 1959 41.4 100.0 39.5 100.0 17.0 100.0 2.1 100.0 770 Uganda 1969 46.2 111.5 36.1 91.3 13.9 81.8 3.8 182.5 1 000
Kenya 1962 46.3 100.0 37.0 100.0 12.9 100.0 3.8 100.0 1 004 Kenya 1969 48.3 104.4 35.1 94.8 12.2 94.9 4.4 114.2 1 114
Tanzania 1957 42.5 100.0 40.6 100.0 15.0 100.0 1.9 100.0 798 1967 44.4 104.5 38.7 95.3 14.3 95.4 2.6 137.0 887
Zambia 1963 44.7 100.0 41.6 100.0 12.0 100.0 1.7 100.0 866 1969 46.0 103.0 35.9 86.2 14.9 124.2 3.2 188.0 968
Nigeria 1963 43.0 100.0 44.1 100.0 10.9 100.0 2.0 100.0 818 19. . .
Source: Compiled from population figures of ECA demographic section.

Table 2-IV Population Sex Ratio in Selected African Countries — Males per 100 Females
Sub-region and Country Year Ratio
North Africa Algeria 1966 100.9 Egypt 1966 104.3 Libya 1964 108.3 Morocco 1966 100.2 Sudan 1965 101.9 Tunisia 1965 104.5
West Africa Ghana 1960 102.2 Guinea 1965 98.6 Nigeria 1963 102.0 Senegal 1965 98.2 Sierra Leone 1963 98.4 Togo 1965 94.1 Upper Volta 1965 99.6
Central Africa Burundi 1965 97.5 Rwanda 1965 97.4
East Africa Botswana 1968 95.0 Kenya 1969 100.1 Lesotho 1969 76.0 Madagascar 1966 96.9 Mauritius 1966 100.8 Swaziland 1966 91.4 Tanzania 1967 95.3 Uganda 1965 100.4 Zambia 1969 96.0
Source: United Nations Economic Commission for Ahica, Demographic Handbook for Africa, Addis Ababa, 1971.
Table 2-V Average Size of Household in Selected African Countries and their National Capitals
Country and Major Cities Year Average Size of Household
Egypt 1960 5.0 Cairo 1960 4.8
Upper Volta 1961/62 5.2 a) Ouagadougou 1961/62 4.5
Mali 1960 5.1 Bamako 1960 4.9
Niger 1960 4.1 b) Niamey 1959/60 3.0
Gabon 1964 3.9 Libreville 1960/61 3.3

Country and Major Cities Year Average Size of Household
Congo 1961 4.4 Brazzaville 1960/61 4.6
Chad 1964 4.2 Ford Lamy 1962 2.8
Burundi 1965 6.6 Bujumbura 1965 3.7 C)
Central African Republic 1959 3.9 D) Bangui 1955/56 2.4
Tanzania 1967 4.4 Dar-es-Salaam 1967 3.3
Madagascar 1966 5.3 Tananarive 1960 5.0
Kenya 1969 5.6 Nairobi 1969 4.3
a) Excludes Ouagadougou, Bobo Dioulasso, Gouray and Yako.
b) Excludes Nomadic Zones and Niamey. c) And Brousse. d) Excludes Bangui, the East Zone and the Nomadic Zone.
Source; National Publications.
Fable 2-VI 'ercentage of Households by Number of Persons per Household
'ountry and Census Year Total Number of Persons per Household Households
1 2 3 4 5 6 7 and un-over known
Ugeria 1954 272 662 12.1 21.3 20.5 19.6 12.9 7.0 6.7 European population Cameroon 1957 7 047 45.8 18.2 16.3 12.7 4.8 1.7 0.8 non-indegenous pop. onl :AR 1960 260 650 15.2 23.9 16.6 12.5 9.6 7.4 14.8 longo 1961 134 000 15.4 17.5 13.9 12.6 10.7 8.7 21.3 )ahomey 1961 465 730 14.2 14.7 <-30.'/ r —> <-20.] 1 —> 20.3 African pop. only ^GYPT 1960 5 176 706 7.8 11.6 13.6 14.6 14.4 12.5 25.6 Ethiopia 1961 123 755 19.9 23.1 18.2 13.3 9.2 6.1 10.3 Addis Ababa only iabon 1961 115 034 9.6 28.0 19.8 13.3 9.4 6.4 13.4 Lenya 1962 136 893 17.5 15.9 13.2 12.9 10.7 8.3 21.5 .esotho 1956 159 232 10.5 15.9 17.0 15.4 11.8 8.7 15.1 5.7 Fam. households .iberia 1962 232 522 12.8 18.1 23.1 10.5 11.5 8.1 15.9 Fam. households Jb. Arab. R. 1964 331 990 6.0 14.6 15.9 16.0 14.4 11.8 21.2 Fam. households lali 1961 688 400 0.1 15.8 18.6 16.6 13.7 10.6 24.5 0.2 Morocco 1960 2 426 884 7.9 14.5 14.8 14.9 13.3 11.4 23.2 Mozambique 1950 23 319 17.6 17.6 18.5 16.5 11.3 9.2 9.4 öliger 1960 611 070 • • • 27.8 20.2 15.4 11.3 8.0 15.4 2.0 »ierra Leone 1963 545 189 22.7 23.4 14.4 9.9 7.1 5.3 17.2 louth Africa 1960 228 642 3.7 8.4 10.3 12.0 12.5 12.0 41.1 Fam. households ludan 1956 2 065 809 5.3 13.3 14.7 15.8 14.9 12.0 23.8 coloured pop. only Tunisia 1966 873 949 5.7 11.6 13.4 14.3 14.2 13.0 27.8
jource; United Nations Compem/zum of Housing Statistics 7977, New York, 1974.

Figure 3-1 Growth of 10 major African cities
2000 000
1 000 000
500 000
400 000
300 000
200000
100000
50000
40000
30000
20000
100C0
5000 4000
3000 c o 2000 *-• -2 3 D-O &H 1000
1890 1910 1930 1950 1970
Greater Lagos with Lagos City •c*o®o» Kinshasa
Accra
Ibadan
Dakar
1890 1910 1930
—— Abidjan **c*cm Nairobi
•o*d»o» Mombasa
Addis Ababa
Dar es Salaam
1950 1970
Greater Lagos 1950 = 250 000 1967 = 1 500 000
Lagos City 1901 = 41 000 1969 = 842 000
Kinshasa 1908 = 4 700 1970 = 1 200 000
Accra 1901 = 26 622 1966 = 521 900
Ibadan 1890 = 200 000 1967 = 720 000
Dakar 1904 = 18 400 1969 = 677 000
Abidjan 1910 = 1000 1968 = 400 000
Nairobi 1906 = 11 500 1970 = 507 373
Mombasa 1906 = 30 000 1962 = 179 600
Addis Ababa 1908 = 35 000 1967 = 637 800
Dar es Salaam 1900 = 20 000 1970 = 353 000

CHAPTER 3. URBANISATION
Urban Growth Rates
In addition to the rapid population increases, a second important demographic factor to be considered is the extraordinarily rapid urban growth. Although one of the least densely populated regions of the world, urban growth is the fastest. Table 3-1 shows urban growth rates at an average of about 5 per cent a year,1 or doubling in about 15 years. The rate of growth was highest in Central Africa (5.7 per cent), followed by East Africa (5.4 per cent). West Africa (5.2 per cent) and North Africa (4.5 per cent) in 1970. Other more recent sources (see Survey of Economic Conditions in Africa 1972, page 269) assume a rate of growth of urban population of 6.1 per cent for the African region (Table 3-II). In that year there were 7 cities with more than 1 million inhabitants and 44 with populations between 100,000 and 500,000. Growth rates of more than 10 per cent can be noticed.1,2
As can be seen from Table 3-1, Africa has a wide range of urbanization varying from 4.7 per cent in 1970 for some East African countries up to 43.5 per cent for Tunisia and 48.3 per cent for Mauritius. Apart from the urban population growth as a whole, the great proportion of urban dwellers tend to concentrate in major cities, often the capital. The UN study The world's million-cities (ESA/P/WP/45) has calculated that the world's fastest growth of million-cities takes place in Africa, i.e. 9.3 per cent with a low estimated overall population growth of 2.6 per cent which is in fact already 2.8 per cent (Table 3-I1I). So there is some evidence for the conclusion that a doubling of the population of major cities on the African continent within 10 y e a r s w i l l n o l o n g e r b e a n e x c e p t i o n . ( F i g u r e 3 - 1 )
Rural-Urban Migration
In examining the data of the previous paragraph, it appears that migration plays a much more important role in urban growth than natural increase. From the figures given in Tables 2-1 and 3-1 the conclusion can easily be drawn that the annual increase of urban population due to migration is between 3 and 4 per cent, assuming equal birth and death rates for both urban and rural population. A further assumption that the total population of the region is mounting to about 350 million while 20 per cent of them is urban, brings us to the conclusion that about 2.5 million persons arrive every year in urban regions looking for shelter, in many cases a considerably higer rate of urban immigration than 3.4 per cent can be assumed. To give some examples: Lusaka's immigration is estimated at 6.5-7.0 per cent per year and that of Nairobi at 5 per cent per year.3
Slums and Uncontrolled Settlements
The proportion and growth of slums and squatter settlements in many African towns is phenomenal. Statistical information is available as to the problem of the growth of slums, but when the number of regular dwellings annually constructed is taken into account, the only conclusion can be that the output remains far behind the needs. This continuing gap must be filled up by uncontrolled settlements, and consequently the extent of it is increasing.
The data compiled in table 3-IV give an impression as to the importance of the problem. This information may lead to the conclusion that housing conditions in the major urban areas on the African continent are really very bad. No doubt serious overcrowding and lack of elementary services are widespread drawbacks in slums and uncontrolled settlements. One should bear in mind however, that standards desirable on human grounds and more or less easily applicable in developed societies result in needs going far beyond the resources of a developing country. Furthermore, in certain cultures combined with climate conditions a large number of persons per room seems quite acceptable, because the dwelling is often used only at night by all the household members. Therefore it is not intended to say, by means of the data given in table 3-IV that an important part of the housing stock is without any value for the inhabitants and should be replaced, preferably at once.
i World Housing Survey, op. cit. Kingsley Davis; World Urbanisation 1950-1970, Vol. I, Berkeley, 1969. United Nations, Economic and Social Council, Economic Commission for Africa, Volume and Implications of Migration to Lusaka, E/CN.14/CAD 2/10, 3 May 1974.
15

Table 3-1 Urbanization in Africa 1950 to 1980
Country Annual percentage Urban population as a percentage Growth of Urban of Total Population
1950- 1960- 1970- 1960 1970 1980 1960 1970 1980
Africa 4.7 4.7 5.0 17.9 22.2 27.3 (4.8) (5.3) (5.1) (15.5) (20.8) (25.7)
North Africa 4.5 4.5 4.8 29.9 35.2 40.9 West Africa 5.2 5.2 5.4 15.3 20.0 25.7 East Africa 5.3 5.4 5.6 7.3 9.7 12.7 Central Africa 7.1 5.7 5.9 11.5 16.5 23.0
North Africa 1965- 1970- 1975- 1965 1970 1975 1980 1970 1975 1980
Algeria 6.0 5.9 5.9 37.7 42.9 48.3 53.7 Egypt 4.1 4.2 4.2 40.5 43.2 45.9 48.6 Libyan Arab Rep. 4.6 4.7 4.9 24.7 26.6 28.6 30.8 Morocco 5.3 5.4 5.2 32.3 35.4 38.7 42.0 Sudan 4.6 4.8 4.9 9.3 10.0 10.7 11.5 Tunisia 4.5 4.7 4.7 40.5 43.5 46.4 49.5
West Africa Ghana 6.1 6.1 6.0 27.1 31.2 35.7 40.5 Ivory Coast 6.0 6.0 5.9 17.9 21.3 25.1 29.4 Mali 4.4 4.6 4.7 10.8 12.0 13.2 14.6 Nigeria 5.0 5.1 5.2 20.2 22.7 25.5 28.5 Senegal 4.0 4.0 4.2 24.1 26.0 28.1 30.1 Sierra Leone 4.0 4.1 4.3 12.8 13.9 15.1 16.3 Other countries 6.4 6.5 6.6 7.8 9.5 11.5 13.8
Central Africa Cameroon 5.8 5.9 5.9 16.4 19.6 23.3 27.4 Cairo 6.1 6.2 6.1 13.5 16.2 19.3 23.0 Other countries 5.6 5.7 5.7 13.9 16.4 19.2 22.5
East Africa 1965- 1970- 1975- 1965 1970 1975 1980 1970 1975 1980
Ethiopia 4.1 4.3 4.5 6.8 7.5 8.3 9.1 Kenya 6.2 6.4 6.5 8.5 9.8 11.4 13.2 Madagascar 5.0 5.0 5.1 12.1 13.4 14.8 16.4 Mauritius 3.3 3.3 3.2 46.5 48.3 50.2 52.0 Somalia 3.4 3.8 4.0 19.1 20.2 21.4 22.7 Tanzania 5.7 5.9 6.0 5.8 6.8 7.8 9.1 Uganda 6.8 6.9 6.9 6.4 7.8 9.5 11.5 Zambia 6.6 6.6 6.5 18.7 22.2 26.2 30.6 Other countries 4.8 5.5 6.4 4.1 4.7 5.5 6.4
Note: The figures in brackets refer to independent developing Africa.
Source; United Nations Secretariat, Population Division — Urban and Rural Population: Individual Countries 1950-1980 and Region and Major Areas 1950-2000, Department ESA/P/WP.33/Rev. 1,22 September, 1970.

Table 3-II The Relative Size and Growth of Urban Population in Independent Developing Africa
Urban Population as Rate of Growth of a percentage of Total Urban Population in Population in 1970 per cent per annum
during 1965-1970
North Africa 29.7 6.9 Algeria 29.5 6.6 Egypt 41.0 3.3 Libyan Arab. Rep. 23.7 2.1 Morocco 35.2 7.0 Sudan 7.5 3.9 Tunisia 25.7 4.5
West Africa 14.0 5.0 Dahomey 11.9 6.2 Gambia 9.6 1.6 Ghana 17.4 6.2 Guinea 10.7 7.0 Ivory Coast 19.0 8.6 Liberia 18.4 9.0 Mali 7.1 7.4 Mauritania 1.7 Niger 4.3 9.0 Nigeria 15.3 3.6 Senegal 27.3 4.6 Sierra Leone 13.2 9.8 Togo 10.5 8.5 Upper Volta 4.2 7.1
Central Africa 16.2 5.8 Burundi 2.2 8.7 Cameroon 41.0 3.3 CAR 16.4 6.0 Chad 7.6 8.4 Congo, P.R. 31.0 4.8 Gabon 11.4 7.5 Rwanda 3.2 Zaire 15.0 7.4
East Africa 8.7 5.9 Botswana 8.6 Ethiopia 4.9 4.2 Kenya 7.9 9.0 Lesotho 2.4 Madagascar 10.5 2.9 Malawi 8.2* Mauritius 47.0 4.8 Somalia 11.5 7.8 Swaziland 2.4 Tanzania 5.7 6.2 Uganda 7.8 7.6 Zambia 25.3 6.7
Independent developing Africa 17.4 6.1
* In 1966.
Source: United Nations Economic Commission for Mx'xcz Survey of Economic Conditions in Africa, 1972, Addis Ababa, 1974.

Table 3-III The Growth of Total, Urban and Million-city Population, 1950-1985, by Regions
Area Average Annual Rate of Growth, 1950-1985 in per cent
Total Urban Population of population population
Million cities Old and new Towns and existing in million cities smaller 1950 cities than a million
comb, a) at any given time b)
(1) (2) (3) (4) (5)
World total 2.0 3.3 2.6 4.5 2.8 More dev. regions 1.1 2.2 1.8 2.9 1.8 Less dev. regions 2.4 4.6 4.1 6.7 3.8 East Asia 1.7 4.7 3.6 5.4 4.3 South Asia 2.6 4.0 4.1 7.1 3.0 Europe 0.8 1.6 1.2 1.8 1.5 Soviet Union 1.3 2.9 1.5 5.4 2.4 Africa 2.6 4.9 4.2 9.3 4.2 North America 1.5 2.2 1.7 3.0 1.6 Latin America 2.9 4.3 4.2 6.1 3.5 Oceania 2.2 2.6 2.7 3.5 1.8
Source: The World's Million-cities, 1950-1985, prepared by the Population Division, Department of Economic and Social Affairs of the United Nations Secretariat (ESA/P/WP.45).
a) i.e., the combination of million-cities existing at any given date. b) i.e., the urban population excluding million-cities existing at any given date.
Table 3-IV Slums and uncontrolled settlements
Country Year City Percentage of city population living in slums and uncontrolled settlements
Ghana 1968 Accra 53 Ivory Coast 1964 Abidjan 60 Liberia 1970 Monrovia 50 Nigeria 1971 Ibadan 75 Senegal 1971 Dakar 60 Togo 1970 Lome 75 Upper Volta 1966 Ouagadougou 52 Kenya 1970 Nairobi 48
Mombasa 66 Madagascar 1969 Tananarive 33 Malawi 1966 Blantyre 56 Somalia 1967 Mogadiscio 77 Tanzania 1970 Dar-es-Salaam 50 Zambia 1969 Lusaka 48 Libya 1968 Benghazi 20 Morocco 1971 Casablanca 70
Rabat 60 Sudan 1971 Port Sudan 55 Cameroun 1970 Donala 80
Yaounde 90 Zaire 1969 Kinshasa 60
Source: World Housing Survey, op.cit.

CHAPTER 4. HOUSING NEEDS
General
It is a widespread assumption that housing conditions in the majority of the developing countries are deteriorating despite attempts at improvement by private or governmental action. For this fact the following arguments are usually put forward: — rapid growth of population; — massive migration or rural households to the cities; and — preference for improvement and investment in other sectors than housing.
To meet the thus increasing needs, 8 to 10 dwellings per 1,000 population are said to be required in many countries1 while production is estimated at only 2 to 4 dwellings.2 The situation in the African region seems to be even worse; production was estimated to be about 3 units per 1,000 while the need was estimated at approximately 10 to 13 units per 1,000 population.3 This gap is so enormous that it is sometimes felt that it is overstated4 and in that case could prove to be counterproductive. Cautious research of available statistical data is, therefore, of the utmost importance.
Housing Conditions
An evaluation of current housing conditions asks for a clear definition on minimum requirements, for which a useful description could be:5 "Permanent materials which do not permit the transmission of sickness, enough sanitary equipment and area and facilities adequate to family size". Tables 4-1 to 4-III present the most recent data encountered, which give an impression of the standard of both urban and rural housing. Table 4-1 shows the average number of persons per room; Table 4-II is a report on the average number of rooms per dwelling. Note that the information available is almost only concerning urban areas. This applies also to Table 4-III, which indicates the number of dwellings supplied with piped water, electricity, toilets, bathing facilities and kitchen.
Clearly most housing units consist of only one or two rooms. Taking into account that the average household size is approximately five persons, the result must be overcrowding. In fact, in most countries more than 70 per cent of the families are reported to have one or two-room dwellings. Table 4-III shows the problems of sanitation dramatically. The information given is, however, in most cases derived from censuses carried out during the early 1960's. Only a few African countries decided to include in their 1970 round census a questionnaire regarding housing conditions, and only three countries have so far been able to publish the results. Recent surveys of housing conditions are available for Tanzania (1969), Togo (1971) and Morocco (1971).
It is not possible to reach a conclusion about any improvement of housing conditions with respect to earlier data, because population growth together with continuing poverty have undoubtedly created new substandard housing despite newly-built houses or improvement of existing buildings. Scarcity of available data makes it impossible to estimate realistically the minimum number of dwellings per 1,000 inhabitants to be constructed to meet replacement housing needs. There is some evidence that people feel their housing conditions less unsatisfactory than could be expected regarding the situation from an overall point of view.
In Togo, to give an example, a wide variety of appreciation of living circumstances is observed,6 while conditions in terms of UN-standards are invariably bad. Because of this, it would be better to consider housing needs for replacement as a priority of less importance than the needs evolving from population growth and to try to bring residential building output on a level with the housing needs resulting from population growth which can be met initially.
World Housing Survey, op. cit. Housing, Building, Planning: Problems and Priorities in Human Settlements, UN doc. A/8037. United Nations Economic Commission for Africa, Survey of Economic conditions in Africa 1972, UN sales no. E.74. M.K. 1, New York, 1973, p. 138.
4 Proceedings of the 7th session of the UN committee on Housing, Building and Planning, Geneva, 15-26 October 1973. Koth, M.N., Silva, J.G., Dietz, A.G.H.: Housing in Latin America, Cambridge (Mass.), M.I.T. Press, 1965, p. 29. See Republique Togolaise, Ministere du Plan: Enquete de l'Habitat 1971, Lome 1974.

To what degree should replacement needs already be included in a housing programme in the present stage, or should they be incorporated more gradually? Another very important question is the period during which arrears should be recovered. Estimates of housing needs have been based on two assumptions:7
\. The existing housing stock will be replaced at the rate of 2 per cent annually. 2. Houses needed because of increase in population have been calculated for the period
1960-1970 on the assumption of an occupancy of two families per house, and for the period 1970-1980 of 1,5 family per house.
Foi the period 1970-1980 production targets for annual production in the order of 8 to 9 houses per 1,000 of population have been calculated.
A more gradual, and most probably more realistic, approach concerning replacement is made in the method as developed by the Housing Section of the Economic Commission for Africa.8
The basic relationship between population and housing is given by the formula:
D = 0.1 x P25/29
D = dwellings to be built annually
^25/29 ~ population age group 25-29
This formula is based on the assumption that the interval between successive generations is 27 years, and that 27 years is the average settling age. The number of settling couples will thus be half the population age 27, or one-tenth of the population aged between 25 and 30. Further assuming that the average lifetime of a dwelling is about the same as the average lifetime expectancy of a 27-years-old person, it is clear that the need for new dwellings to be produced each year will be approximately equal to one-tenth of the population in age-group 25-29. For the African region, this age-group accounts for 6-9 per cent of the total population, while the average is about 7.5 per cent of the total.9 Data for this item are collected for selected African countries in Table 4-IV. Production targets on the basis of this approach range from 6 to 10 units per 1,000 of population.
Replacement of existing dwellings and the recovering of quantitative arrears could be arranged for with such an approach during a period of 30 years. Whereas such an approach seems quite practical for the next decades, adaptation will be necessary in the more distant future because it may be expected that the average life expectancy both of people and of houses will increase.
World Housing Survey, op. cit. p. 91. Giertz, L.M.: Population Development is the base for Housing Needs, UNECA Doc. E/CN. 14/HOU/78, 5 August 1970. World Population Prospects, op. cit. p. 91.

Table 4-1 Average Number of Persons per Room
Country Year T = total Persons Remarks U = urban
Algeria 1966 T 2.8 CAR 1960 T 3.4 Afr. pop. only Congo 1961 T 2.7 Egypt 1960 U 1.6 Ethiopia 1961 U 2.7 Addis Ababa only Ivory Coast 1957 U 2.5 Kenya 1962 U 2.5 Liberia 1956 U 1.7 Monrovia only Malawi 1967 u 1.9 for towns Mauritius 1962 T 1.9 Morocco 1960 T 2.2 Nigeria 1961 U 3.0 Lagos only Senegal 1955 T 1.5 Dakar only South Africa 1960 T 1.3 excluding Bantu pop. Sudan 1966 U 2.5 Tunisia 1966 T 2.8 Tanzania 1958 U 1.8 Former Zanzibar only Zambia 1969 T 2.4 Data refer to living quarters
Source: Compendium of Housing Statistics 1971, UN publication Sales No. E/F 73 XVII.4.
fable 4-11 )ccupied Conventional Dwellings — Percentage of Dwellings by Number of Rooms
Country and Census Year Number of Number of Rooms per Dwelling Dwellings
1 2 3 4 5 6 7 and un-over known
Algeria 1966 1 791 570 34.3 34.0 18.0 8.4 2.5 1.1 0.8 0.9 <
r N 1960 260 650 89.5 8.1 1.6 0.4 0.1 0.0 0.1 0.1 Excluding Bangui
'ongo 1961 134 000 62.8 23.1 8.7 3.3 1.1 0.5 0.4 igypt 1960 1 572 488 7.7 16.3 25.0 26.3 14.6 5.7 4.4 vory Coast 1958 12 538 55.4 24.3 11.0 4.7 2.0 1.1 1.5 Urban only Cenya 1962 136 879 52.9 17.3 8.9 6.1 2.7 1.5 1.2 9.3 Malawi 1967 39 365 46.6 29.3 14.8 5.2 2.8 0.9 0.4 0.0 Urban Mauritius 1962 134 700 33.8 27.9 18.5 9.0 4.6 3.5 2.7 0.1 Morocco 1960 527 000 19.5 36.1 20.6 10.7 4.1 •4-4.7 —• 4.3 Nigeria 1961 92 900 76.9 16.0 3.9 3.2 • Urban only Senegal 1955 11 495 30.3 29.8 27.5 8.8 < 3.6 — -> Dakar only Jouth Africa 1960 1 022 850 11.4 14.2 18.6 21.0 20.2 8.5 6.0 Excl. Bantu pop. Tunisia 1966 836 130 59.7 24.9 9.4 3.5 1.0 0.4 0.3 0.9
Excl. Bantu pop.
fanzania 1958 20 349 36.5 29.1 20.6 8.0 2.1 1.0 0.8 2.0 Urban only Gambia 1969 879 134 51.3 25.5 13.3 5.9 2.5 0.9 0.6
Urban only
Source: Compendium of Housing Statistics, 7977, op.cit.

Table 4-III Percentage occupied conventional dwellings with water supply system and toilet
Country and Census Year Total Number Piped water of Dwellings
With Without
Inside Outside within 100 m
Algeria 1966 1 794 904 22.7 15.2 62.1 Egypt 1960 758 504 39.5 60.5 Ethiopia 1961 123 755 74.3 25.7 Malawi 1967 39 365 21.6 22.1 56.0 Mauritius 1962 134 700 14.9 47.1 37.9 Morocco 1960 546 514 51.9 48.1 Nigeria 1961 92 900 . • • • • •
Senegal 1955 12 740 87.7 6.5 5.8 Sudan 1966 253 060 63.9 36.1 Tunisia 1966 873 949 14.8 85.2 Tanzania 1968 96 483 • • •
Zambia 1969 879 134 12.4 14.5 73.1
Source: Compendium of Housing Statistics 1971.
Table 4-1V Estimates of Housing Needs
Country Year Population Estimated Total Annual age 25-29 in 1970 population production as percentage in 1970 targets of total (millions) per 1 000 of population population
Algeria 1956 6.8 6.2 14.33 89 000 1966 6.4
Ghana 1960 8.7 7.3 8.64 63 000 1970 7.3
Morocco 1960 8.2 6.0 14.90 89 000 1971 6.0
Tunisia 1956 7.4 6.2 5.14 32 000 1966 6.5
Libya 1954 8.5 7.8 1.94 15 000 1964 8.2
Sierra Leone 1963 9.5 9.0 2.55 23 000 19 . . .
Nigeria 1953 9.0 55.07 496 000 1963 10.0
Kenya 1962 7.8 6.5 11.23 73 000 1969 6.9
Tanzania 1957 8.2 7.5 13.27 100 000 1967
Zambia 1963 8.1 6.6 4.18 28 000 1969 7.0
Source: See table 7-1.

Toilet Electr. Light. Kitchen Bath/shower
With Without With Without With Without With Without
Flush Other
49.1 50.9 33.7 37.8 58.2
66.1 66.2 41.3
80.2 19.2 12.3 87.4
33.0 34.7 32.3 15.7 83.7 53.9 46.0 20.1 79.8 22.4 64.4 13.2 60.7 39.1 86.2 13.7 47.6 52.2
88.7 11.3 76.1 20.4 69.2 24.3 19.7 55.5 7.0 88.0 5.0 81.3
95.9 18.7 4.1
2.6 67.7 29.7 26.4 23.9 75.9
2.4 28.3 69.3 • • • • • • • • • . . . . . • . . •
15.4 34.5 50.4 27.5 72.5 • • • • • • • • • • • •
Egypt : residential buildings Ethiopia : Addis Ababa only Malawi : urban centre Nigeria : Lagos only Senegal : Dakar only (European type dwelling) Tanzania : Zanzibar only
23

CHAPTER 5. INCOME
Income Levels
Statistical information about the net disposable income per capita is very scarce. Even more unreliable and lacking is the information about income distribution. The only more or less reliable data are GDP figures per capita and net national income per capita which can be calculated by taking into account income from or to abroad, indirect taxes, subsidies and consumption of fixed capital. Table 5-1 shows that GDP per capita for 41 countries amounted in total to US$ 133.3 in 1960, US$ 169.9 in 1970, US$ 171.4 in 1971 and US$ 175.8 in 1972. This gives an annual average increase of approximately 2.5 per cent (constant 1970 prices). On the contrary, there are 8 countries having a lower GDP per capita in 1972 than in 1960. In 25 countries the GDP per capita was less than US$ 200 and out of them were 11 with less than US$ 100. Average per capita income levels might generally be 10 per cent lower. Further assuming an average household size of 5 persons, the average yearly family income is in fact for most countries not exceeding US$ 1,000. This picture has not fundamentally changed over the years since the early 1960's. Only in a few countries is a significant rise in average income levels shown (Libya, Tunisia, Ivory Coast, Gabon, Botswana and Swaziland).
Income Distribution
The existing data show great inequality in the distribution of income. In the first place, there is a considerable disparity between rural and urban areas. In the least developed countries approximately 85 per cent of the labour force is working in the agricultural sector but accounting for only 50 per cent of total GDP (see Table 5-II). In the more developed countries the active agricultural population is only 65 per cent of the labour force, but providing 30 per cent of the total GDP.
Figure 5-1 Wages in Agriculture as Percentage of Wages in Manufacturing
^ ICG
o
80 -
00 O 00 cd ^ 60 -o
1> l_( 3 — 3 o •c QO 03
Oß OJ
40
20 -
100 200 300 400
per capita GDP US$ constant 1970 prices
(a) Cameroun 1970;(b) Ghana 1972; (c) Kenya 1972;(d) Malawi 1972;(e) Morocco 1972; (f) Mauritius 1972;(g) Tanzania 1971; (h) Uganda 1971 ;(i) Zambia 1972.
Sources: (b) (d) (e) (f) (i) Yearbook of Labour Statistics 1973 ILO. Geneva, 1974, pp. 574-575,671-672. (a) (c) (g) (h) Survey of economic conditions in Africa 1973, op.cit

Table 5-1 Amount and Rate of Growth of per capita GDP in 41 Independent African Countries at Constant 1970 Market Prices, 1970-1972
Country Per capita GDP US S (a) Rate of Growth of per capita GDP - per cent
1960 1970 1971 1972 1960 1970- 1971-1970 1971 1972
Algeria 329.4 331.2 323.0 349.1 0.1 2.5 8.1 Egypt 169.1 213.0 209.0 209.7 2.3 1.9 0.3 Libyan Arab Rep. 359.2 1 980.1 1 763.2 1 816.5 18.6 11.0 3.0 Morocco 203.5 225.6 229.2 231.7 1.0 1.6 1.1 Sudan 116.9 1 16.0 118.9 116.7 0.1 2.5 1.9 Tunisia 222.4 274.0 290.1 330.2 2.1 6.3 13.8
Total North Africa 199.4 259.1 253.7 261.9 2.7 2.1 3.2
Dahomey 77.5 92.7 93.0 91.1 1.8 0.4 2.1 Gambia 101.0 126.6 132.2 137.1 2.3 4.4 3.7 Ghana 298.2 259.4 266.5 267.5 1.3 2.7 0.4 Guinea 87.1 81.6 79.3 77.3 0.6 2.8 2.6 Ivory Coast 185.4 345.9 347.1 363.0 6.4 0.4 4.6 Liberia 290.7 356.5 373.7 380.3 2.1 4.8 1.8 Mali 61.9 52.6 53.2 45.6 1.6 5.7 14.1 Mauritania 96.2 163.6 179.1 166.3 5.4 9.5 7.1 Niger 78.9 94.4 89.1 85.2 1.8 5.6 4.4 Nigeria 102.5 136.9 150.4 156.6 2.9 9.9 4.1 Senegal 249.2 217.0 194.5 222 2 1.4 10.0 14.2 Sierra Leone 107.0 170.3 174.5 175.2 4.8 2.4 0.4 Togo 79.5 135.2 136.4 125.2 5.5 0.9 8.3 Upper Volta 52.5 64.7 64.7 64.7 2.1 0.1 0.4
Total West Africa 122.8 150.0 157.6 162.0 2.0 5.1 ro
bo
Burundi 91.3 63.8 68.2 69.0 3.6 6.9 1.2 Cameroon 135.3 188.5 189.3 188.4 3.4 0.4 0.5 Central African Rep. 135.8 134.8 132.0 132.7 0.1 2.1 0.5 Chad 36.3 72.8 71.2 62.3 1.7 2.1 12.5 Congo 189.0 302.6 297.8 291.1 4.8 1.6 2.2 Equatorial Guinea 230.7 284.6 245.2 211.9 2.1 13.9 13.6 Gabon 398.2 696.9 730.7 807.9 5.8 4.8 10.6 Rwanda 53.0 60.1 60.9 59.7 1.3 1.4 2.0 Zaire 126.1 117.8 123.9 127.0 0.7 5.2 2.5
Total Central Africa 120.6 127.5 130.6 131.5 5.8 2.4 0.6
Botswana 92.9 133.2 206.9 237.3 3.7 55.3 14.7 Ethiopia 58.4 75.6 73.6 76.2 2.6 2.6 3.5 Kenya 94.1 147.8 154.9 158.0 4.9 4.8 2.0 Lesotho 52.8 65.9 67.5 69.4 2.2 2.4 2.8 Madagascar 117.1 129.7 128.8 119.5 1.0 0.8 7.2 Malawi 47.1 73.9 82.7 86.9 4.6 12.0 5.0 Mauritius 209.2 219.0 236.2 263.5 4.7 7.8 11.6 Somalia 90.2 89.4 91.1 95.4 0.1 2.0 4.7 Swaziland 151.6 266.3 282.3 291.1 5.8 6.0 3.1 Tanzania 64.9 97.0 97.5 99.9 4.1 0.4 2.6 Uganda 79.9 135.3 126.0 127.4 5.4 6.9 1.1 Zambia 266.4 372.5 349.7 336.1 3.4 6.1 3.9
Total East Africa 84.9 120.0 119.5 120.9 3.5 0.4 1.2
Total 41 independent developing African countries 133.3 169.9 171.4 175.8 2.7 0.9 2.6
(a) Population figures for all countries except Nigeria are derived from the United Nations publication World Population Prospect as assessed in 1968, op.cit.
Source: Survey of Economic Conditions in Africa 1973, op.cit.

Table 5-11 Elements of Economic Structure of the Least Developed African Countries in 1971 or nearest year
Country Population 1971 GDP * Agriculture Manufac- Exports as Exports per Density per capita as a percen- turing as a a percentage capita US $ per km2 US $ tage of percentage of GDP 1971
GDP 1971 of GDP 1971 1971
Sudan 6 120 40.6 9.0 21.1 25.4 Dahomey 25 94 40.5 5.8 34.9 33.8 Guinea 16 71 34.0 8.2 22.4 15.8 Mali 38 54 44.5 11.4 19.4 10.5 Niger 3 84 63.3 6.9 16.0 13.4 Upper Volta 20 57 42.7 10.5 6.3 3.6 Burundi 130 59 67.6 3.9 10.4 6.1 Chad 3 77 48.0 9.1 12.5 9.7 Rwanda 145 60 53.4 13.9 10.5 6.3 Botswana 1 146 47.4 8.9 27.4 40.0 Ethiopia 21 74 57.6 6.2 10.0 7.5 Lesotho 31 85 65.5 0.7 19.3 10.4 Malawi 38 78 52.3 12.5 21.0 16.4 Somalia 4 88 37.6 4.5 14.4 12.7 Tanzania 14 98 37.6 10.1 21.9 21.5 Uganda 43 131 55.1 7.2 19.2 25.1
Total least developed African countries 9.9 90 50 8.1 14 13.1
Total other developing African countries 13.5 207 30 13.6 25 51
Source: Survey of Economic Conditions in Africa, 1972.
Table 5-III Wage rates in Selected African Countries (latest year)
Country Year Unit Average African Expatriate Public
Ghana 1970 N/Month 55.6 48.5
Gambia 1971 D/Month 96.0 85.80 833.2 89.0
Cameroon 1970 Thousand CFA/Year
Central Africa 1967 Thousand CFA/Year
197 103 (b) 1 834 (b)
Congo 1966 Thousand CFA/Year
156 100 (b) 1 853 (b)
Chad 1967 Thousand CFA/Year
221 112 (b) 1 731 (b)
Kenya 1972 K/Year 286.9 349.0
Malawi 1972 Kw/Month 28.9 31.6
Tanzania 1971 Sh/Year 4 132.3 4 196.5
Uganda 1971 1969
Sh/Year Sh/Year
4 556.4 3 953.1 3 390 20 574
4 074.5 4 096
Source; Survey of Economic Conditions in Africa, 1973, op.cit.

Active Agri Enrolment Electricity Roads in cultural Ratio at Consump km per Population as a First and tion in Kwh 1,000 km2
percentage of Second level per capita 1969 Labour Force of Education 1970
80 18 27 4 52 21 11 55 83 20 55 115 91 15 8 10 91 8 10 6 89 • • • 5 61 86 18 6 184 91 15 11 9 91 • • • 23 278 91 52 19 14 85 11 17 19 98 64 • • • 129 87 27 28 88 82 7 7 20 86 24 30 37 86 32 55 103
85 23
65 107
* At 1970 market prices.
Private Agriculture Non-agricultural
73.57 31.0 59.2
117.7 ..."
283 129 (a) 377 (a)
247.5
27.6
4 087.6
3 920.5 3 913
83.1
1 574.3
2 495.9
355.5
5 114.5
5 043.1
(a) Private sector (b) Modern private sector
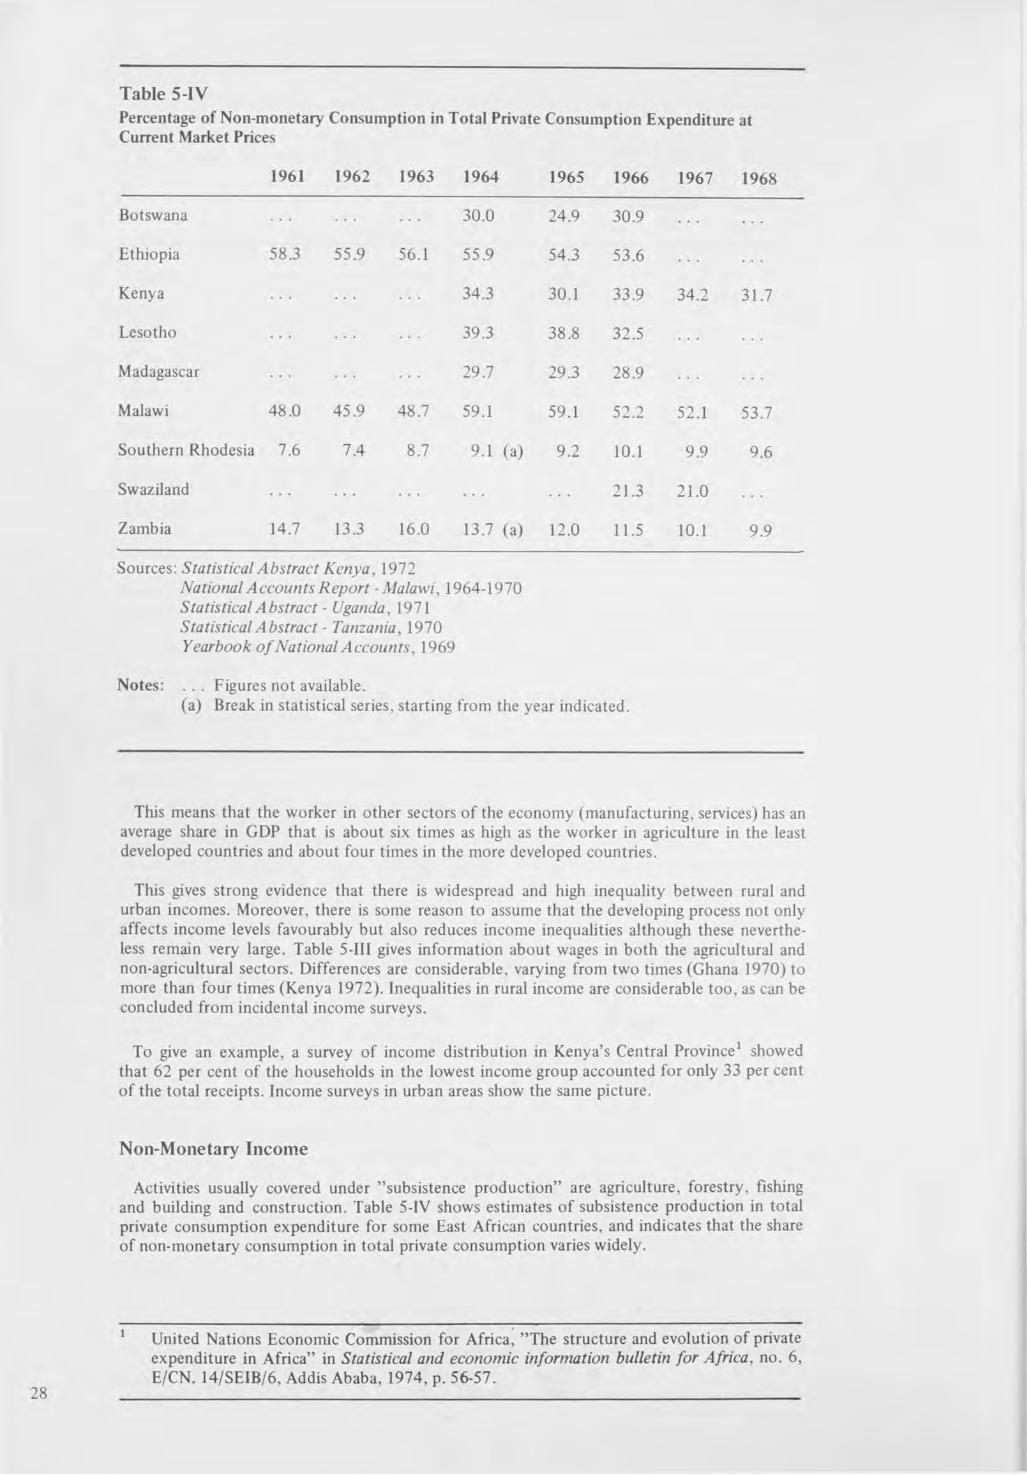
Table 5-IV Percentage of Non-monetary Consumption in Total Private Consumption Expenditure at Current Market Prices
1961 1962 1963 1964 1965 1966 1967 1968
Botswana 30.0 24.9 30.9 . . . . . .
Ethiopia 58.3 55.9 56.1 55.9 54.3 53.6 . . .
Kenya 34.3 30.1 33.9 34.2 31.7
Lesotho 39.3 38.8 32.5 . . . . . .
Madagascar 29.7 29.3 28.9
Malawi 48.0 45.9 48.7 59.1 59.1 52.2 52.1 53.7
Southern Rhodesia 7.6 7.4 8.7 9.1 (a) 9.2 10.1 9.9 9.6
Swaziland 21.3 21.0 . . .
Zambia 14.7 13.3 16.0 13.7 (a) 12.0 11.5 10.1 9.9
Sources: Statistical Abstract Kenya, 1972 National Accounts Report - Malawi, 1964-1970 Statistical Abstract - Uganda, 1971 Statistical Abstract - Tanzania, 1970 Yearbook of National Accounts, 1969
Notes; . . . Figures not available. (a) Break in statistical series, starting from the year indicated.
This means that the worker in other sectors of the economy (manufacturing, services) has an average share in GDP that is about six times as high as the worker in agriculture in the least developed countries and about four times in the more developed countries.
This gives strong evidence that there is widespread and high inequality between rural and urban incomes. Moreover, there is some reason to assume that the developing process not only affects income levels favourably but also reduces income inequalities although these nevertheless remain very large. Table 5-III gives information about wages in both the agricultural and non-agricultural sectors. Differences are considerable, varying from two times (Ghana 1970) to more than four times (Kenya 1972). Inequalities in rural income are considerable too, as can be concluded from incidental income surveys.
To give an example, a survey of income distribution in Kenya's Central Province1 showed that 62 per cent of the households in the lowest income group accounted for only 33 per cent of the total receipts. Income surveys in urban areas show the same picture.
Non-Monetary Income
Activities usually covered under "subsistence production" are agriculture, forestry, fishing and building and construction. Table 5-IV shows estimates of subsistence production in total private consumption expenditure for some East African countries, and indicates that the share of non-monetary consumption in total private consumption varies widely.
United Nations Economic Commission for Africa, "The structure and evolution of private expenditure in Africa" in Statistical and economic information bulletin for Africa, no. 6, E/CN. 14/SEIB/6, Addis Ababa, 1974, p. 56-57.

A vague relationship between the level of non-monetary consumption and the GDP per capita can be observed: the lower the degree of monetization the lower is the GDP per capita. However, care must be taken in interpreting the information of Table 5-IV, because the lower figures may result from an underestimation of subsistence production which is very important in private consumption patterns in rural areas. From the available data in Table 5-IV it is not possible to conclude an increasing monetization trend. Thus the considerable share of nonmonetary income in total GDP remains a serious constraint for setting up housing finance facilities, especially in rural areas.
Expenditure on Rent
The economic commission for Africa has so far conducted three studies2 on household consumption patterns in Africa. Analysis of the household expenditure surveys published in these studies shows that it is rather difficult to assess the effect of income level on rent. This is partly caused by differences in definitions used as a starting point in organising the several surveys, and partly by the wide variations in results. In spite of this, it can be concluded that rent generally increases with income. In rural areas expenditure on rent seems to be considerably lower (2-5 per cent of total cash expenditure) than in urban areas in lower income groups (5-15 per cent).
2 Statistical and Economic Information Bulletin for Africa, nos. 2, 4 and 6.

CHAPTER 6. EDUCATION AND TRAINING
Educational Budget
Practically all African countries have long recognized that education is an important instrument to achieve social change and economic development and for this reason most of them devote a high proportion of their budget - ranging from 15-24%1 during the late sixties, early seventies — to education.
Enrolments
As a result, enrolments during the period 70-73 increased considerably. The average annual rate of growth in primary education during that period exceeded 10% in 5 countries and was between 5 and 10% in 14 countries, between 2 and 5% in 4 countries and between 0 and 2% or negative in 7 countries.2 In most countries the number of people in the relevant age group for primary education will increase with approximately 3% per year. To keep the enrolment ratio constant a growth of at least 3% is necessary. Especially for the least developed countries reaching this goal meant solving nearly insurmountable problems because the population is mainly rural or nomadic and sparse.
Generally speaking, school-attendance in rural areas is much lower than in urban concentrations. Is the school-attendance ratio in the first year often low by sheer lack of educational facilities in the neighbourhood, what cares even more is the drop out phenomenon and the high rate of repetition. The costs of education per pupil completing his course or attaining a certain level are sometimes tripled3 in Africa compared with costs per pupil when a repetition and drop out problem should not exist. Certainly the poorest countries, not at all in a position to afford such an educational wastage, have to face the severest problems in this prospect. Table 6-1 gives some information.
Drop Outs
The report aforementioned stated that in a number of African countries 80% of the children entering school repeat at least one school year or drop out before completing the primary level. Causes of educational wastage are many and complex. There is a lack of school-attendance control, inadequate schoolbuildings, inappropriate location, insufficient teacher training, overcrowding and lack of equipment. Often school-attendance means a lowering of the household income by loss of the child's earnings.
All these problems cannot easily be solved because the enrolment problem primarily is a quantitative one. The number of children asking for education in one year (age six) is about 600 per 10,000 active population (age 15-64) in developing countries, while in a developed society this figure is only averaging 200.4
Unsuitable Curricula
Many African countries still put an educational system inherited from colonial times into practice, which means that they in fact tend to educate their children in the same way and to the same extent as in fully developed societies. No doubt the educational budget would then have to rise to at least twice the amount spent in a fully developed society with the same active population. This is economically impossible, even if there would be improvement in birth control in the future. On the other hand the educational system applied in many developing countries is more and more subject to a critical attitude. The 1970 report on the world social situation mentions "lack of relevance to economic and social requirements, unsuitable curricula ill-related to the surroundings".
The survey of economic and social conditions in Africa 1974 states that "the rate of expansion of secondary, and even more of post-secondary education has been larger than that of
"Public finance statistics 1969-1973" in Statistical and Economic Information bulletin for Africa, nr. 6, E/CN.14/SEIB/6, Addis Ababa, 1974. United Nations Economic and Social Council, Economic Commission for \ix\cdi, Survey of economic and social conditions in Africa I, E/CN 14/632 31/12/74, p. 112-114. United Nations Department of Economic and Social Affairs, 1970 Report on the world social situation, UN Sales no. E.71.IV. 13, New York, 1971. Giertz, L.M., Dijkgraaf, C.: Schoolbuilding in early development, Rotterdam, 1975.

primary schools and because large sums have been spent in this way the goals of universal literacy have been pushed further in the future. One result is that children outside the school system are rejects or drop outs from an educational process which is biased towards producing an elite minority".
As a result of the impact laid on general education at primary and secondary level in the past, there is an acute shortage of skilled workers, especially in the construction industry, which is nowhere satisfactorily met.5 Although the construction industry is by its character a larger employer of unskilled labour, it can only play this economically very important role when it can have a wide range of skills varying from lower technical to higher managerial at its disposal. Education in this respect will have to focus on the extension of vocational training for the modern sector.
Unfortunately the vast majority of families will not be able to use the services of the construction industry in solving their housing problems. For acquiring a decent house they are committed to various stages of self-participation and organisation. Unless a special educational approach to fulfill the needs of this kind of activity, lack of elementary and managerial skills will no doubt continue to cause a considerable number of failures in self-help arid site and services projects. Such an approach will be discussed in chapter 10.
Table 6-1 Education efficiency in selected African countries
Country Year Age group Enrolment ratio
Period Age group Drop out rate
Remarks
Malawi 1968 1970
6-14 6-14
36 34
65-70 6-12 72 repetition not included
Botswana 1971 6-12 64 65-70 6-12 49 repetition not included
Burundi 1968 1970
6-12 6-12
37 34
65-70 6-12 70 repetition not included
Dahomey 1972 6-12 36 65-70 6-12 40 provisional data repetition not included
Guinea 1969 7-12 38
Lesotho 1973 6-13 62 63-68 68-73
6-12 6-12
68 60
repetition not included
Mali 1970 6-12 19.5 65-70 6-12 37 repetition not included
Niger 1972 6-12 11.6 68-73 6-12 36 repetition not included
Rwanda 1966
1971
6-12
6-12
57
49
64-69
66-71
6-12 70 boys 84 girls 65 boys 76 girls
repetition not included
Somalia 1971 6-12 9 66-71 6-12 25 repetition not included
Sudan 1973 6-12 40 66-71 6-12 32 repetition not included
Chad 1965 1971
6-14 6-14
22 22.5
66-71 6-12 70 repetition not included
Uganda 1969 6-13 41 62-68 6-13 30 repetition included
Upper Volta 1970 6-12 12 67-70 6-10 42 repetition not included
Source: Based on data supplied by UNESCO (unpublished).
Survey of economic conditions in Africa 1973, op. cit.


1. Traditiona I housing in the lagune area in Benin.

2. Traditional housing in Niger of sun-dried mud blocks plastered and sometimes painted.

3. Rockhewn monolithic church in Ethiopia, 11th century. A wonderful example of the use of locally-available building materials, as the tukul-houses in the same village of Lalibela.

4. Modern houses and traditional Swahili houses in Tanzania have the same floor plan. Upgrading of traditionally-built houses is possible with the same building materials as the contractor built the adjoining house.

A FRAMEWORK FOR DECISION MAKING

CHAPTER 7. ECONOMIC RESTRAINTS AND SOCIAL BENEFITS
The problems of housing in developing countries are such that governments cannot expect satisfactory conditions to be realized on the necessary scale without an active and strategically well-chosen role. In order to develop a feasible approach it is necessary to make a thorough analysis of the problem with all its ramifications. Present needs and the development of future needs must be known quantitatively as well as qualitatively. National statistics are only of limited value for practical policy because houses are needed in definite places. So data concerning needs must be available at least per region. Insight must be gained into the costs involved at different levels of quality, both in terms of investments and of annually returning expenses. Furthermore, investments and annual expenses must be matched with paying potentials, not only at the micro-level (household incomes, savings and loan-potential) but also at the macro-level (national income, national savings, and loan potential).
Equations have to be solved both in financial and also in real terms, for instance, concerning the availability of materials and manpower. Breakdowns have to be made and equilibriums reached at the regional and perhaps at the local levels. Average figures will not suffice, because of variations in income and other household characteristics. The size of the problem and the limited means that can be made available may well make the emanating system of equations appear to be insoluble, even with standards that are considered as definitely low. Difficult and harsh decisions have to be made: for instance, concerning the amount of scarce capital that should be invested in housing, where housing has to compete with other urgent investment needs such as for agriculture, infrastructure, industry, health and education. Standards have to be scrutinized and priorities set, which implicitly means the formulation of an answer to the question of who shall be sacrificed for whom, to what extent and for what period.
Ideally, the major decisions concerning the size, cost and regional breakdown of housing production should be taken within the context of an integrated economic and physical planning system.1 However, nowhere has a real integration between economic and physical planning been realized so far. In this respect major problems still have to be solved. Up to now, economic planning has been mainly oriented on a medium-term, with a planning period of 4 to 6 years, whereas the orientation of physical planning has been towards periods of 10 years and even much longer.2
At least equally serious is the lack of theoretical models for an integrated economic and physical planning. Although important recommendations have been made at an experts' conference at United Nations Headquarters in 1974,3 it will take time, for many reasons, before practical results can be expected both in developed and in developing countries. The peoples in need of housing cannot wait as long. But even within the realm of economic planning no operational methods exist leading to clear-cut decisions concerning the amounts of money to be invested in housing and in other directions. Nobody can state what is, even from the economic point of view, the optimal investment in housing given the human, the natural and the other resources of a country. Far too little is known about the trade-offs between, for instance, less investment in housing and more in education, or more in agriculture.
Furthermore, the integration of housing programming into economic development planning appears to be not ideal in African countries. Many complaints have been recorded from African administrators being responsible for housing at the national level that they had not been or not sufficiently, consulted during the preparation of economic development plans.4 The United Nations Centre for Housing, Building and Planning has made some interesting contributions.5'6
In the past some rather one-sided economists have argued against investment in housing because the pay-back period on other investments such as agriculture was much shorter, and
United Nations Economic and Social Council, Economic Commission for Africa, Report of the North African Sub-Regional Working Group of Experts of Specific Aspects of Housing Finance, (Addis Ababa, 20-25 November 1972), E/CN.14/587; E/CN.14/HOU/IOO, Addis Ababa, 1973, par. 95-2. "Integration of Physical and Economic Planning" in Human Settlements, Vol. IV, no. 2, April 1974, the Centre for Housing, Building and Planning, Department of Economic and Social Affairs, United Nations, New York, 1974. "Integration of Physical and Economic Planning", op. cit. Economic Commission for Africa, Secretariat sources. United Nations, Department of Economic and Social Affairs, Methods for Establishing Targets and Standards for Housing and Environmental Development, ST/SOA/76, New York, 1968. United Nations Department of Economic and Social A f f a i r s , A n E c o n o m i c F r a m e w o r k f o r Investment Planning in Housing and Urban Infrastructure, ST/ECA/186, New York, 1973.

thus supplied opportunities for a much faster increase in income than investment in housing. This type of argument has been strongly criticised in the famous book by the UN consultant Charles Abrams,m the Modem World.1 Abrams argued that: — Economic development cannot go on without social development including housing, and
that housing, like health and education, is indispensable to the proper balance of development and to the economic activities that require it.
— The building of homes is "economic" because houses in the less developed areas are often the small production centres for the tailor, dressmaker or storekeeper.
— Housing plays a major role in stimulating employment, direct and indirect. In this respect it can enable the absorption of unemployment, particularly in cities, where there has been an influx of migrants. By doing so, the inflation of rents can be curbed. In many places, particularly in rural areas and small towns, the production of considerable housing may be homespun without affecting the labour market or other productive apparatus.
— A housing programme can also play an important part in developing savings and in releasing productive capital into the economy. People will save for housing, even when they might not save for anything else.
— Industrial production will be hampered or stopped unless workers are sheltered. — An environment developed by squatting proves less economic in the long run than a
planned one: the descent of masses of people upon a city and their makeshift construction of dwellings may raise the cost of installing utilities thereafter to excessive levels. Provision of the housing and utilities from the start may, therefore, prove a wise economy in the long run, particularly when the transportation routes are planned simultaneously.
Still another argument is given in the 1965-1974 Development Plan of the Republic of Niger.8 When a family starts to improve its house, according to this plan, it means that in sociological perspective the family has taken its first steps on the road of development. Such a family has accepted that the future will be different from the past, and after such a change of mind the family can transform its attitudes in many other respects.
On the other hand, it is known that the investment in housing in all developing countries is relatively low. Clearly an increase in such percentages would open possibilities for improvement in the housing sector. However, it is obvious that such an increase in most cases should not be accompanied by a reduction of investment in other vital sectors such as infrastructural works, agriculture and industry. It should be noted that the arguments put forward by Charles Abrams in the beginning of the 1960^ do not necessarily imply a real reduction of investment in other directions. When, for instance by means of aided self-help, productive capacities not presently used are mobilized, there will be no need for reduction of other investments. Houses being built by people in their spare time that otherwise would not have been made productive, or the employment of jobless workers in construction, may well result in an increase in investment in housing without a corresponding decrease in other investments. (In such a case the investment in housing as a percentage of GNP will, however, increase).9
Because of the incompleteness of our experience concerning the optimal percentage of National Income to be invested in housing, a decision in this respect, starting at the macro-level of National Income and to be translated from there to the micro-level, is for the time being not practical. Basically the approach should start at the other end of the decision-making chain. The investment cost of a house is closely related to the income of the household to be housed. The relationship between the investment cost of a house and the annual income of the household can be expressed in a factor in the order of 2 to 3. Experience shows that the investment for a house should not be more than 2 to 3 times the annual income of the household in need of shelter. The actual value of this multiplicator depends on:
a) The amount of income: the lower the income, the less people can spend on housing; b) the rate of interest on loan capital for housing: the lower this rate of interest, the more
expensive the investment for a house can be in comparison with the income of the inhabitants; and
c) the period of repayment for loans: the longer this period is set, the more acceptable investment costs will be in relation to income. (For more details in this respect, see Chapter 12 Housing Finance).
Abrams, Charles,: Housing in the Modern World, Man's Struggle for Shelter in an Urbanizing World, Faber and Faber, London, 1966.
8 Perspectives decenales de developpement 1965-1974, Presidence de la Republique, Commissariat general au plan, Niamey, 1965. United Nations, Economic and Social Council, Some Aspects of the Housing Mortgage Market in African Countries, E/CN.14/HOU/89, Addis Ababa, 1971, par. 56.

Formally the relationship between the part of national income annually invested in housing, the number of houses constructed, and the household incomes can be expressed in the 1PI formula (investment-production-income formula).10,11
_ h a x 0 c x f
Pih 1,000
where
pih = percentage of National Income invested in housing
ha = number of houses constructed annually per 1,000 of population
oc = average occupancy of new houses
f = average building and land development cost of a house divided by the average annual income of the household.
The deduction of the IP1 formula is given in Annexe I. With the aid of this formula, it can be seen that, for instance, with an annual housing production of 3 houses per 1,000 of population, an occupancy of 5 persons per house, and the building and land development cost being 2 times the annual income of the household, the annual investment in housing will be equal to
3 x 5 x 2 1,000
or 3 per cent of National Income.
On the basis of calculations as elaborated in Annexe I it can be concluded that with an annual investment in housing equal to 3 per cent of National Income, generally respectively 3, 4 or 5 dwellings per 1,000 of population can be constructed when the average cost of a house (construction and development of land) is 2, 1.5 or 1.2 times the income of the households to be housed. In many places, the building of a house with construction and land development costs being no more than twice the income of low income households is seen as a nearly impossible challenge.
In Togo,1 2 for instance, with a per capita GDP of US$ 135 (CFA 37,800) corresponding with per capita National Income in the order of US$ 120, the price of a low-cost house in Lome is about US$ 3,750. With an average occupancy of 4 persons per house this would mean an investment cost — average income ratio (f-factor) of 7.4 and a house cost — per capita income ratio of 29.7. In the urban areas in Niger1 J a minimum annual income for a four-person household would be in the order of 158,000 CFA. The cost of a serviced site (provided with wash basin, lavatory and electricity) will be about 150,000 CFA. In this case, the value of the f-factor is 1.
Only when building activities for middle and higher incomes can be set at a lower level than the average house-building activity it will be possible to build somewhat more houses for a given investment percentage out of National Income. The degree in which this might be possible has to be studied separately for each country or region. In UNECA's Report of the Seminar on Housing Administration in Africa,1* held in Copenhagen in 1971, it has been recommended by participants that allocation to Housing from the Gross National Product should not be less than 5 per cent instead of the prevailing 2 per cent in African countries. Depending on the value of the factor f (quotient of building and land development, cost of house, and household income) and the average occupancy rate, the number of houses built for such an outlay will vary from 5.2 to 10 per thousand. The figure of 5.2 houses per 1,000 of population reflects the situation where housing production is evenly distributed over the various income groups, while
10 Nierstrasz, F.H.J., Why Housing Policy, lecture delivered for Bouwcentrum International Education, Rotterdam, 1971.
11 United Nations Economic and Social Council, Economic Commission for Africa, Report of the Uneca Task Force on Financing of Housing, Building and Physical Planning (Addis Ababa, 27-30 November 1972), Annexe, from F.H.J. Nierstrasz, E/CN.14/HOU/99, Addis Ababa, 1973.
12 Plan de developpement economique et social 1971-1975, Direction des Etudes et du Plan, Lome, 1971.
13 Perspectives decenales de developpement 1965-1974, Presidence de la Republique Commissariat general du plan, Niamey, 1965.
14 United Nations Economic and Social Council, Economic Commission for Africa, Report of the Seminar on Housing Administration in Africa (English-speaking countries), Copenhagen, Denmark, 19 September - 12 October 1971, E/CN.14/539, 12 October 1971.

the figure of 10 houses built annually per 1,000 of population reflects a situation where house-building is focussed mainly on low-income groups. When comparing quantitative needs with a percentage of GNP that might be devoted to investment in housing, and with household incomes, no other conclusion appears possible than that the costs of houses should be set very low.
Whereas the average investment for a house (construction cost and land development cost) should not be more than 6 to 10 times the per capita National Income, for large groups - with incomes below the average ones — the costs should be distinctly lower.
The graphs (Figure 7-1/2) indicate how many houses per 1,000 of population can be built annually (along the vertical axis) in relation to percentages of National Income invested in housing (along the horizontal axis). The outcome depends further on the relationship investment cost of a house/annual income, indicated by the factor f and the occupancy rate. The first graph contains data for an average occupancy rate (oc) of 4 persons per house, and the second refers to situations with an occupancy rate of 5 persons per house. For instance, in the first
Figure 7-1 Percentage of National Income to be invested in Housing, Average Occupancy Rate — 4
Investment Cost of House1 1 excluding the value of the unserviced land. Annual Income of Household

graph it can be seen that with oc = 4 and f = 1.5, 5 houses per 1,000 of population can be realized annually, and that this will need an investment equal to 3 per cent of the National Income. Similar graphs can be constructed for situations with other values for oc and f by using the 1P1 formula.
In Table 7.1 figures are given for a number of countries based on the assumption that housing production would be arranged according to the formula by which each man between 25 and 29 years of age needs a house (see Chapter 4). However, it might still be that in some countries production of housing needs as derived from this ECA method (see Table 7.1), even when based at the lowest cost estimates, would prove to be above the economic capacity. In such cases adaptations will have to be made to achieve a more gradual development of house-production figures over a period of time. In such situations most probably periods longer than 30 years would be needed to arrive at satisfactory minimum conditions. Further study in this respect is urgently necessary.
Figure 7-2 Idem Average Occupancy Rate = 5
Investment Cost of House1 1 excluding the value of the unserviced land. Annual Income of Household
37

The interpretation of available statistical data may still pose a number of problems. It is therefore necessary to ascertain: 1. Whether the figures also cover traditional housing realized in the non-monetary sector, and 2. to what extent site development costs (roads and utilities) are included in the investment
figures for houses. Last'y, it should be noted that besides investment in houses, roads and utilities also capital is needed for community facilities like, for instance, schools. According to a UN source, there are indications that utilities and community facilities cost from about one-quarter of the cost of housing to a figure approximately equal to it.15
Table 7-1 Estimate of Housing Needs and Needed Capital Formation for Housing
Country Year Population age 25-29 as percentage of Total population
Estimated in 1970
Total population in 1970 (millions)
Annual Housing Needs 1970
Total Per 1,000 population
1 2 3 4 4a
Algeria 1956 1966
6.8 6.4
6.2 14.33 89 000 6.2
Ghana 1960 1970
8.7 7.3
7.3 8.64 63 000 7.3
Morocco 1960 1971
8.2 6.0
6.0 14.90 89 000 6.0
Tunisia 1956 1966
7.4 6.5
6.2 5.14 32 000 6.2
Libya 1954 1964
8.5 8.2
7.8 1.94 15 000 7.8
Sierra Leone 1963 9.5 9.0 2.55 23 000 9.0
Nigeria 1953 1963 10.0
9.0 55.07 496 000 9.0
Kenya 1962 1969
7.8 6.9
6.5 11.23 73 000 6.5
Tanzania 1957 1967
8.2 7.5 13.27 100 000 7.5
Zambia 1963 1969
8.1 7.0
6.6 4.18 28 000 6.6
Source: Columns 1, 3, 5, 6,9 various UN publications.
Columns 7a and 8a: Apply when investment for a house (value of unserviced land excluded) is 1.5 times the annual income of the households (f = 1.5).
Columns 7b and 8b: Apply when investment for a house is 2.0 times the annual income of the households (f = 2) (value of unserviced land excluded).
15 United Nations, Department of Economic and Social Affairs, Methods for Establishing Targets and Standards for Housing and Environmental Development, op. cit., page 6.
38

Income per capita US $ in 1970
Average Household Size
Fixed Capital Formation needed (million US $) 1970
Share of (7) in 1970
in real GDP
5 6 7a 7b 8a 8b
290 5.2 201.3 268.4 4.4 5.8
230 4.9 106.5 142.0 4.8 6.4
200 5.2 138.8 185.1 4.1 5.5
240 5.2 59.9 79.9 4.3 5.7
1 705 5.2 198.9 265.2 5.3 7.1
160 4.9 27.1 36.1 6.0 8.0
125 4.9 455.7 607.6 6.1 8.1
130 5.6 79.7 106.3 4.9 6.6
90 4.4 59.4 79.2 4.6 6.2
345 4.9 71.0 94.7 4.4 5.9

CHAPTER 8. BASIC DECISIONS
The housing problem will never be solved as long as no clear decisions are made concerning a number of basic questions. Choices in one direction or in another will have a decisive impact on the elaboration of policies. In this chapter these basic decisions are listed and the attitudes of different Governments are recorded.
A. Desirability of Increase in Population
Housing policy must be seen as part of a general development philosophy. As such, it has to do with the answers to a number of basic questions. The first question in this context concerns the desirability or acceptance of a continuation of an increase of population at the present rate. It is perhaps not as much the absolute capacity of the African soils to accommodate still many more people than today as the rate of population growth at which real improvement of living circumstances will remain possible. This question, the answer to which is related to the other fundamental problems of religion and morale, is not dealt with in this survey. However, it must be stressed that the- solution of many housing problems would be facilitated by a decrease of population growth.
In the Uganda Development Plan1 it is stated that the balance of evidence clearly suggests that the present very high rate of population growth in that country will, in the long run, severely reduce the growth of GDP per capita, and consequently adversely affect the welfare of Ugandans. As unfavourable elements of a fast population growth are mentioned the growing proportion on non-productive age groups, the pressure on employment, the pressure on the land, and the pressure on educational and social services. In view of the economic, social and health problems the Government considers it necessary to institute a programme of advice to women on family planning and child spacing.
In the 1971-1976 development plan of Cameroun,2 also acknowledgement is made of the economic disadvantages of rapid demographic growth, in terms of a growing disparity between regions and in terms of increasing costs for schools and for the creation of employment. At the same time, however, a series of more favourable aspects is identified such as:
Increase of demand and supply; improvement of productivity; possibility to bring new lands under exploitation; stimulation of a more dynamic mentality; and the need to feed more people will accelerate the adaptation of rural society, if sufficient measures are taken to integrate the young in the economic system of the country.
B. Brake on or alternative to migration?
The second question that has to be studied is whether migration from the countryside to the urban areas should continue in the same degree as during the past decades. In many countries rural development and the development of rural centres and smaller towns are considered necessary, also in connection with damming or at least reducing the exodus to the big cities. Such tendencies are included, for instance, in the development plans of Cameroun2 (1971-1976), Kenya2 (1974-1978), Lesotho* (1970/71-1974/75), Tanzania5 (1969-1974), and Zambia6 (1972-1976).
The second National Development of Zambia, for instance, . . aims at the decentralisation of industries, despite the additional costs involved. In the absence of decentralisation, there will be an accentuation of the problem of housing shortages, water shortages and a host of other social problems which will cost the country much more than the cost of decentralisation".
1 Third Five Year Development Plan, 197111972-1975/1976, Entebbe, 1972. Troisieme plan quinquennal de developpement economique et social 1971-1976, Ministere du plan et de l'amenagement du territoire, Yaounde, 1973.
3 Development Plan 1974-1978, Nairobi, 1974. First Five Year Development Plan 1970/71-1974/75, Central Planning and Development Office, Maseru, 1970. a. The People's Plan for Progress b. Second Five Year Plan for Economic and Social Development, Ministry of Economic Affairs and Development Planning, Dar es Salaam, 1965.
6 Second National Development Plan 1972-1976 Ministry of Development Planning and National Guidance, Lusaka, 1971.

In the Tanzania plan (1969-1974) it is said that since the aim is set at improving the standard of the rural population, relatively less will be available for improving the standard of the urban population. The government's policy is directed at reducing the comparatively high growth rate of Dar es Salaam. To support the development of rural areas, it is necessary to have dynamic townships as centres for a geographical area. Such townships supply markets for the farmer and provide him with services from trade and transportation. Industrial development must be the backbone for these dynamic townships.
Also in the development plan for Cameroun the growth of secondary centres is considered as a screen against the rural exodus.
In the Zambia development plan (1972-1976) it is stated that the need for new housing to provide accommodation for workers in new industries can be reduced by the careful selection of sites for such industrial establishments. A policy of taking new employment to small undeveloped population centres will help to speed up rural development, while at the same time reducing urban migration and the need for more urban housing.
One objective of the National Development Plan of Zaire is the reduction of migration to the urban areas. To this end urban and rural growth poles are created. The two initial rural growth poles are in the Shaba region in the south, based on mining and metallurgy, and in the region in the north-east between Kasangani and Bukavu, based on agriculture, plantation, farming and tourism.7
C. Few high-cost or many low-cost houses?
With building costs and the state of the art being what they are, this can only lead to the recognition that self-reliance, aided self-help and expendable houses will be the main directions in which solutions can be found compatible with the hard facts of life. One principal choice is that between the building of a limited number of relatively high-cost houses for a small group of population, or the effort to build many more houses against much lower costs in order to accommodate all the people.8
The upper limit for investment in housing depends on the size of the effort (in real or monetary terms) that can be made for investment in housing, given the other urgent needs to produce food, clothing and to make investments in infrastructure, agriculture, education, industry and so forth. Because the total production capacity is still low in African countries, the efforts that can be made for housing are limited. Even in the case that 5 per cent of GNP as recommended by United Nations conferences — could be spent on housing investment (instead of only 2-3% as actually prevailing in African countries), an annual housing production of about 8 houses per 1,000 of population can only be achieved at an average cost level of 6.0 to 7.5 times the annual per capita income (see graphs at the end of Chapter 7). In such a context practically no room is left for subsidizing more expensive housing.
How interesting GNP figures may be for economists as far as housing is concerned such figures are of more interest in connection with the macro-economic effects of housing efforts than concerning the planning of the efforts to be made. This planning should be primarily based on the incomes and the paying capacities of the people to be housed.9 If the houses can be built corresponding to the paying capacities of the dwellers, the economic effect will be usable also in macro-economic terms. If, on the other hand, we would want to start with the determination of the exact percemage of National Income or Gross National Product to be invested in the housing sector, a priori we would not be sure whether the corresponding decisions could be taken at the micro-economic level of the household in its environment.
D. Decisions for urban housing with far-reaching consequences
Major decisions to be made concern the way the housing problem in urban areas will be met in terms of cost levels, standards, the amount of self-help, the attitude towards squatting areas, building materials, lands, financing and management. Given the relationship between household incomes, costs of houses and investments in housing in terms of National Income or GDP,
United Nations Department of Economic and Social Affairs, Financing Rural Housing: Selected Policies and Techniques for Developing Countries, New York, 1974. United Nations Economic and Social Council, Economic Commission for Africa and German Foundation for Developing Countries, The Finance of Housing in the Public and Private Sectors, E/CN.14/HOU/31, Addis Ababa, 1968, par. 50. In this connection see also Chapter 12, page 114-115 and Tables 12-1 and 12-11.

efforts are being made everywhere to find solutions that can be borne economically. The efforts undertaken or so far announced cover a wide range, which includes: — Demolition of slums (Kenya); — Improvement of squatters' settlements (Upper Volta, Uganda, Zambia); — Site and service and self-help schemes (Tanzania); — Expendable houses; — Cheap contractor-built houses; — Development of private sector in housing (Uganda); — Important role assigned to national housing or home-building corporations (Malawi); — Development of mass production methods; — Substitution of imported building materials by materials produced within the country; and — Reviewing building codes in connection with local needs.
Attitudes differ from country to country, but gradually "unorthodox" solutions as site and service schemes appear to get more emphasis.
The situation as described in the Uganda Development Plan10 is typical for many African countries. . . Only a very small proportion of the urban population can afford to rent or own what may be termed as a "standard" housing unit. This situation reflects not only the preponderance of very low income earners but also the relatively high cost of house-building. It is totally unrealistic to imagine that, in the foreseeable future, such changes in these two variables would occur as to significantly increase the capability of the low-income earners (80 per cent or so of total urban households) to own or rent standard housing. The really relevant housing for this group must be conceived in terms of single rooms and improved traditional units with much less than standard facilities, that is, in terms of shelter programmes."
In Malawi the main emphasis for the coming decade is set on site and service schemes for the great majority of the town dwellers who cannot afford housing of permanent materials. Roads, water and pit latrines are provided, and tenants are left to build their own houses: "The importance of this extension to site and service, which has proved extremely successful so far, is that it is the only feasible and inexpensive (relative to permanent construction) way of deflating the problem of the growing and unplanned squatter areas, which poses a serious health hazard (besides fostering a good deal of socially undesirable behaviour)."11
No urban housing programme can bypass the problem of squatting. ". . . If construction of these units is forbidden", as stated in the Kenya development plan (1974-1978)1 2 "many migrants to towns will be left with no houses at all, and — since studies show that few return to the countryside — they will crowd in with friends and relatives. On the other hand, the existence of these units constitutes an urban blight, and creates problems of disease and crime. For this reason, the Kenyan Government has decided that such houses will be discouraged within city limits. Instead, during the plan period the Kenyan Government will provide 60,000 self-help sites with basic services (water and sewage) and will assist people in putting up their own houses". According to the development plan, slums will be removed when satisfactory alternative housing has been found.
In Zambia12, it is recognized that although squatters' areas are unplanned, they nevertheless represent assets both in social and financial terms. The areas require planning and services, and the wholesale demolition of good and bad houses is not a practical solution. As stated in the Zambia development plan: "First priority must be given to the acquisition of land when any unauthorised settlement on it is to be upgraded. Strict control of any further development must be enforced both inside and outside the designated area. The following services must then be provided in any upgrading exercise: piped water supplies, sewers and sewage disposals, roads and surface water drainage, street lighting and other communal services".
Clearly "supporting policies" are more and more replacing restrictive policies such as the demolition of slums and exclusion from urban services. The so-called "informal" economic activity which takes place in many slum and squatter areas absorbs much of the "formal" sector's labour surplus, provides goods and services which the urban poor can afford, and constitutes a growing portion of the urban economy.14 Even with the large-scale improvement
10 Third Five Year Development Plan, 7977/72-7975/76, op. cit. 11 Statement of Development Policies 1971-1980, Office of the President and Cabinet
Economic Planning Division, Zomba, Government Press, 1971. 12 Development Plan, 1974-1978, op. cit. 1 3 Second National Development Plan, 1972-1976, op. cit. 14 United Nations, Habitat: United Nations Conference on Human Settlements, 1976, Urban
Slums and Squatter Settlements in the Third World, Note by the Secretary General, A/CDNF.70/RPC/9, 15 May 1975.

of existing squatter areas and with large-scale development of new site and service schemes, situations may continue to exist where at least during a number of years it would have to be accepted that new uncontrolled old-style squatter settlements would develop. Even when more site and services schemes are developed, it will take time before a production level can be reached that will balance the influx of new migrants.
Some housing plans - such as, for instance, those developed hx Kenya, Uganda and Tanzania — contain a mixture of approaches, including contractor-built housing, site and services, and the stimulation of the population to solve their housing problems themselves. Whereas in Malawi the main emphasis is set on site and services schemes, for a minority of the urban population investments are made through the Malawi Housing Corporation in small-to-medium-sized permanent houses. The demand for such housing is expected to rise rapidly as a consequence of general economic development. In Zambia government funds will be channelled primarily into the provision of serviced plots and the requisite communal services. In Botswana the Government's low-cost housing policy centres on the provision of serviced sites. In a number of other countries — Algeria, Cameroun, Cote d'lvoire, Gabon, Senegal and Togo — the development plans still concentrate on contractor-built houses for urban areas.
Given the prospects for most African countries in terms of urban growth and development of incomes in urban areas, it can be expected that nearly everywhere more and more emphasis will have to be put on site and services and aided self-help schemes. Unless dramatic, and so far totally unexpected, changes would occur in building techniques, contractor-built houses will remain too expensive to provide for the low-income majorities in the urban population to any impact-making degree. This situation cannot but have a tremendous impact in many directions.
Educational systems in a society where most of the people will have to construct or have to take part in the construction of their own houses, should be such that children will be prepared to do so and supply them with the necessary learning and training. (See chapter 10). Since the results that can be obtained through site and services schemes and through self-help, as well as the efforts to be made for such operations, can be positively influenced by organized cooperation, the co-operative movement and community workers will find here extremely important and rewarding tasks. Specific training needs will have to be met.
The planning and the layout of towns cannot but deeply be influenced by such developments. Traditional town planning as developed in Europe and the United States cannot cope with the problems which have to be dealt with in urban Africa. New design and planning systems will have to be developed in order to cope with the site and services city with built-in facilities for later improvement. Planning and building legislation will have to be brought into line with such developments. Site and services and self-reliance implies land or at least home-ownership for big groups of the population. Rental schemes do not seem possible in such a context.
Housing standards have to be brought in line. It is not accidental that in the Kenyan development plan mention is made of research into building standards. In the Uganda development plan15 it has been stated that "the existing building codes are, by and large, obsolete and irrelevant".
Housing finance systems will also need to be geared to the specific conditions in the urban regions on the African continent. The need to rely heavily — at least for the next decades — on site and services and self-help will also influence the development of the building materials industry and the construction industry. Special emphasis will have to be laid on the development and production of elements that can be easily handled by people with limited skills in the field of building. This may well influence the development of specific building technologies.
The construction industry will, on the one hand, be directed mainly at the more complicated types of buildings such as hospitals and factories and the — limited — needs for more expensive houses, and on the other hand at the supply of some skills needed for low-cost housing that might be difficult to learn. It can be expected that small contracting firms can be'developed over the years out of the many people who built — and extended — their own houses.
All these aspects make it clear that there is a distinct need for specific research and development efforts in order to cope with the many problems of building based on self-reliance in Urban Africa. These research and development efforts not only concern building technology but also building organisation and planning systems as well as sociological, legal, financial and administration aspects. This type of research and development work will have to be in close relation with actual planning and building efforts. Application of results should receive specific
15 Third Five Year Development Plan, op. cit.

attention. As already stated in Chapter 1, such work will have to be done predominantly in African countries.
F. Decisions concerning rural housing
Rural housing needs attention on its own merits, and not only in connection with efforts to lessen the rural exodus. In this respect different attitudes can be observed. "The housing problem in rural areas, where the majority of the people are living in traditional houses without any modern improvement, is not very acute. Nor is it a serious threat to health." (Tanzania Development Plan 1969-1974).1 6 The improvement of rural housing is part of the national development policy which emphasizes the creation of Ujamaa villages which often replace the very scattered settlements existing before. The concentration into villages makes it easier for the Government to provide basic services such as education, health, water, roads and electricity, and also enable production, distribution and consumption to be shared equally. The development of these villages is based upon self-reliance.1 7
Policies appear to be aimed at gradual improvements through the supply of information and model projects. Mobile Construction Units — one for each district — have been formed and charged with the duties of organizing technical advice to people in villages. It is envisaged that by 1980 there will be 65 rural construction units manned by 325 rural construction technicians. In the Kenyan development plan (1974-1978)18 it is stated that the impetus for the construction of housing in the rural areas must continue to come from the people themselves. The Government will, however, provide funds for research, education and technical advice and assistance. "The conventional structures in the rural areas present an ever-present hazard to life and property." {Somalia Development Plan 1974-1978).19
'4.
Practically everywhere it is accepted to continue the traditional self-help system in rural areas. In a number of countries model dwelling and advisory and demonstration services are supplied by the Government, for instance, in Cameroun and Uganda. According to the Somalia Development Plan2 0 some attention will be given to rural housing, focussed on self-help and co-operative action. In Niger a modest start has been announced aimed at self-help, the supply of basic equipment for building, and the supply for groups of villages of a skilled building worker and of a skilled furniture worker. Furthermore, loans will be made available to people who have started to improve their houses and who want to continue doing so. Small loans to give more scope for improvements already undertaken by the people can be made available by Credit Niger.
In Swaziland2 1 one of the countries where rural housing is widely dispersed, rural services centres, the so-called "Tinkundla" centres, are being developed throughout the country. The service centre in each Regional Development Area will provide the location for offices and housing for officials of various Ministries involved in rural developments. It will also be the location of such services as agricultural supply, storage and marketing depots, a small pool of mechanical equipment for hire, portable water supply, a clinic, and possibly private stores and handicraft workshops. If the communities wish, such centres may form focal points for residential resettlement.
In Rwanda, a country with a thousand hills but without villages, a study is being undertaken concerning the improvement of traditional rural housing, including construction, equipment and use. Emphasis is to be put on local materials, minimizing of investment, labour saving, and gradual implementation.
1 6 The People's Plan for Progress, op. cit. 1 7 Habitat: United Nations Conference on Human Settlements, National Report on Human
Settlement in Tanzania, A/Conf.70/NR.4/15 April 1975. 1 8 Development Plan 1974-1978, op. cit. 19 Development Programme 1971-1973, Ministry of Planning and Coordination, Mogadishu,
1971. 20 op. cit. 21 Second National Development Plan 1973-1977, Mbabane, Government of Swaziland,
1972.

CHAPTER 9. STAGING A POLICY
All over the world it can be observed that an integral approach to housing emerges only gradually, starting with ad hoc measures, passing from trial and error to a systematic analysis, and tending from there to a more or less comprehensive policy. Housing policy begins with an increasing awareness of the existence of housing problems and the consciousness that without countervailing measures the situation will steadily worsen. This stage has been reached everywhere in Africa. Starting with the final — more or less ideal — phase and proceeding in reverse from that ideal future to the present, the following stages can be distinguished: 7. All people are properly housed, so the main tasks in housing concern the replacement of
houses becoming obsolete and of catering for new needs arising out of changes in population structure.
6. Such a situation has not yet been reached, but activities concerning housing, building and planning have developed in such a way that it can be shown that the arrears are diminishing each year and that it can be reasonably expected that adequate housing for all the people can be reached within one or two decades.
5. A situation of adequate housing for all the people is far from being reached and will most probably not be attainable within one or two decades. But it can still be shown that the situation is improving each year.
4. Adequate housing for all has nowhere near been reached, and no factual improvement can be observed at present. Still it can be expected that as a result of a well-defined policy already under execution, an upturn will be realized within the foreseeable future.
3. A situation where conditions are still worsening, and although a policy to come to terms with the problems is not yet in operation, it is already under preparation.
2. A situation where housing conditions are worsening, each year, and where a strategic policy is not yet being prepared. Yet there is an awareness of the problem and some ad hoc measures are being taken.
1. A situation where things go from worse to worse and nobody appears to care.
In reality many more in-between situations may be noticed. Also it might be claimed that because after a lapse of time people more or less accept what is considered an acceptable situation, the seventh stage may appear as a fata morgana. Nevertheless, a scheme like this can be helpful to produce an awareness of the actual position of various countries. Apparently all over the world only very few countries may be classified under Category 7. Sweden anyway will be considered as a serious candidate in this respect, although because of the ongoing process of levelling up of requirements, many people in Sweden may not agree. Perhaps, with the exception of Lybia, that because of its oil richness may already have reached Stage 6, African countries today have to try to find their way through the phases ranging from two to five. It is doubtful how many countries have reached Stage 5, the stage where, although adequate housing for all the people will not be attainable within one or two decades, the situation is improving each year. For even when production of adequate housing is increasing annually, it may be that because of the still faster growing needs created by increase in urban population, the total situation is still deteriorating.
Most countries still linger in Stages 4, 3 or 2. This is understandable given colonial inheritances, other historical backgrounds and the apparent difficulties for governments to handle the housing problem as evidenced everywhere in the world. This, however, does not mean that the situation is hopeless. On the contrary, as pointed out in Chapter 8, many countries are coming to realistic approaches, and with further continuous efforts, at least in some and perhaps in most countries, a manageable housing situation fulfilling basic standards for all the people can be realised within 30 to 50 years. In some countries such a goal might even be reached in about 20 years. Such targets are attainable only if adequate efforts are made now, and will not be postponed.
To realise such targets, a wide range of tasks has to be performed, including items as: 1. Collection of data concerning needs and paying capacities. 2. The formulation of targets in connection with national and regional planning. 3. The formulation and evaluation of alternative time-plans and alternative methods by which
to reach those targets, leading to the adoption of a basic strategy. 4. Identification of problems to be solved, with an indication of priorities. 5. The creation of suitable conditions for the fulfilment of those targets, — legally (town-planning, land ownership, building codes and so forth); — financially; — budgetary; — fiscally;
as well as in terms of — lands; — building materials, included production, transportation and trade; — manpower; and — education and training.

6. Arrangements for the execution and management of site and services and self-help projects. 7. Special attention to all problems of the development of intermediate technology and of the
relationship between self-help, intermediate technology, the intermediate sector and the construction industry.
8. Development and execution of demonstration projects. 9. Perhaps, most important, the realization of increasing numbers of housing units built
annually. 10. Information to all people concerned leading to overall participation. 11. Division of responsibilities and tasks between governmental agencies, private enterprise,
voluntary agencies and the people to be housed, about who shall do what and what can various parties expect from others.
12. Assignment and division of responsibilities and tasks within the Government at various levels; arrangement of adequate co-operation between various branches of Government.1,2
13. Where needed, creation or expansion of specialized institutes, for instance, for research and the development of building materials to be locally produced.
14. Arranging for the regular evaluation of results obtained and, where necessary, additional measures of changes in policy.
All these items are connected with housing policy which has already been laid down as "the formulation by a government of goals and targets for the housing of the population on the one hand, and of the development of machinery for the realization of those goals and targets on the other hand".3 It would be by no means difficult to elaborate this rather cryptic list into a very much longer one. However, the major problem is perhaps not so much that the job appears so overwhelming, but how to set priorities in such a way that a more or less balanced process of development can be set afoot and can be kept moving. Administrative and technical procedures have to be developed not by putting a brake on actual performance but in conjunction with growing numbers of houses achieved. 4
The ideal to be obtained in the long run should not be accepted at the price of fewer houses built today. Whereas the houses as scheduled for today have to be built, the people, the tools, the materials and the methods for the houses to be built tomorrow have to be made ready, while at the same time studies and other activities have to be set in motion to ensure that better tools, materials and methods can be handled by better-prepared people who will have to build far more houses in a more distant future. Certainly during the earlier phases in which there will at most times be a lack of skilled manpower and experts at all levels, preparatory activities have to be planned according to urgency.
Although the lack of houses in urban areas is overwhelming, and the means to meet this need are strictly limited, it will not be of the highest urgency to determine the exact dimensions of the needs. A global estimate indicating the order in terms of even hundreds of thousands may be sufficient. It will not be necessary to wait with increasing building activities on the results of elaborate and time and money consuming sophisticated analyses of demographic developments. Such analyses, of course, have to be made, but the process of refinement can be spread over 10, 20 or even more years. It is more important to have from the beginning a sound estimate of the paying potential of the majority of the people.
In the same way, town planning for the year 2000 or later should not be forgotten, although on the condition that the most urgent tasks in planning urban development for the next 2 to 20 years should get all the attention needed for site and services schemes and self-help in the near future. Ideal solutions that can only be obtained over 30 years or more should not be detrimental to far-from-ideal but badly-needed solutions to provide people with housing now. Some method of network planning can certainly be useful in order to distribute activities over time and to make the best use of the actually available manpower in the present.
Short-term, Medium-Term and Long-term Policies
The distinction between short-term, medium-term and long-term policies is most important. Short-term policy concerns the next 2 to 4 years; medium-term policy covers the period from 4 to about 10 years from now; while long-term policy is based on the period covering some 20 to 30 years from the present.
Nierstrasz, F.H.J., a.o. Report on Housing Policy to the Government of Ghana, Accra, 1967, p. 5. United Nations Economic and Social Council, Economic Commission for Africa, Report of the Seminar on Housing Administration in Africa (English Speaking Countries), Copenhagen, Denmark, 19 September to 2 October 1971), Addis Ababa, 1971.
3 Nierstrasz, F.H.J., op. c/Y.

During the short-term attention is directed at the execution of current plans as already set up and at the preparation of new plans for the medium-term period. Principally, short, medium and long-term policies should be regarded as different aspects of one all-embracing endeavour. The long-term policy is mainly determined by the goals to be ultimately reached, whereas short and medium-term policies will be determined more by the economic and other possibilities to reach those goals in successive steps. Short-term policy should not consist of a number of ad hoc arrangements, but of decisions and measures for things to be done now as part of an integral long-term scheme. As time proceeds, the medium-term policy of yesterday will be realised as the short-term policy of today.
During the early phase of housing development short-term policy will be mainly concerned with an inventory of problems, the execution of some ad hoc measures in connection with the most urgent bottlenecks, the assignment of tasks for all kinds of preparatory work, and perhaps the setting up of institutes. A more systematic medium and long-term policy can then be developed gradually.
Some countries, such as Rwanda and Somalia, are still in an early phase of housing policy. The existence of the problems has been identified and specific attention is being given to activities which have first to be undertaken in order to tackle the problems more effectively on a larger scale later. For instance, in the development plan of Somalia* it is stated that "the provision of adequate housing programmes is . . .preconditioned by the availability of such factors as sufficient production of building materials, qualified manpower, allocation of resources, provision of credit facilities, proper town and physical planning, and adequate and unified building codes and regulations. All these prerequisites have to be adequately developed and strengthened in Somalia". One of the measures taken is the establishment of a technical unit responsible for research and development concerning building materials. In a number of other countries short-term policy already bears the stamp of longer-term activities already undertaken, thus being angled on the one hand on the execution of previous plans and on the other on laying the foundations of considerable expansion of production in the following planning periods. Such a situation, for instance, can be observed \x\ Algeria, Tunisia and Kenya.
In Algeria the 1970-1973 development plan5 included an increase in housing production of 200 per cent compared with the previous period. However, during the years from 1970 to 1973 the most important goal was to set up the institutional arrangements needed for a far greater expansion during the 1974-1977 plan. In Kenya the development plan for the period 1970-19756 was aimed at the production of four times as many housing units as had been realised during the previous five years.
However, the existence of an established policy covering the short, medium and long-term does not necessarily signify that the problems left exist only in the realm of execution. Almost everywhere the evaluation of experiences will lead to correctional steering processes and perhaps also to changes in steering techniques. Moreover, revision of goals and targets may be inevitable. It can be expected that countries which in their official policy have so far relied mainly on contractor-built housing will put more emphasis on site and services and aided self-help schemes. Last but not least, governments will be apt, as a consequence of experience or of a change in political philosophy, to change their role in housing, building and planning.
Role of the Government
It will be useful to have from the start clear ideas on the role to be performed by the Government. Concerning housing, two extremes can be identified. At one extreme, a situation can be conceived where the only interference of Government with housing is restricted to the enforcement of technical minimum standards. At the other extreme the situation can be imagined where financing and construction as well as the ownership and the management of all housing are in the hands of the State. These extreme situations, however, appear to be practically non-existent.
In Western Europe considerable interference by the Government is common practice, with such items as capital provided by the Governments, tax reductions, subsidies, mortgage insurance, public housing settlements, and in some cases building through direct labour departments. Public housing provision exists even in the United States of America, albeit on a rather small scale. In African countries Governments so far have not chosen either of the two
Development Programme 1971-1973, Ministry of Planning and Co-ordination, Mogadishu, 1971. Plan Quadriennal 1970-1973, Secretariat d'Etat au Plan, Alger, 1970.
6 Development Plan 1974-1978, Nairobi, 1974.

extremes but have preferred some kind of in-between position. State or national housing corporations exist in many countries (e.g. Ghana, Uganda, Kenya, Tanzania).
In most African countries Governments play an active role in the fostering of better housing in many other ways, such as regional development aimed also at the improvement of housing, urban planning, stimulation of local production of building materials, facilitating housing finance, participating in self-help, site and services schemes and so forth. Land policy is considered as an important item everywhere. The building of a house affects many sectors of society. Lands administration, economic planning, urban planning, public works, supply of potable water, electricity provision, supply of building materials, manpower, building codes and regulations, finance and probably an increasing degree of action through co-operatives and community development.
The responsibility for these aspects falls under different authorities. The targets for housing production may be set by a central planning agency. The production of building materials may fall under the Ministry of Industries and the import of such materials under the Ministry of Foreign Trade. Building codes may be in the hands of a Ministry of Public Works, while the Ministry of Finance will have a say concerning housing finance. Most problems of lands may be handled by a Ministry of Lands and Mineral Resources. When co-operative action is needed, there is a Ministry of Co-operatives. Rural housing may be connected with a Ministry or an agency for Rural Development. Building research and development may be conducted by institutes from universities and may or may not be carried out in relation with actual needs as experienced in building practice.
All over the world, in rich countries as well as in poor ones, the co-ordination of different authorities connected with housing poses problems at the national as well as at lower levels. A number of approaches can be noted for the achievement of satisfactory cj-ordination at the national level. One tendency is to set up a separate Ministry of Housing and bringing most or all responsibilities and tasks related to housing into the hands of that Ministry. Such a solution has the advantage that the political and executive responsibility for housing is clearly placed in one office and that different activities related to housing can be harmonized. However, problems of co-ordination will continue to exist, although perhaps to a lesser degree. Given the considerable investment needs for the execution of housing programmes, that anyway have to be balanced against other outlays, the co-operation of planning agencies, finance ministers and other authorities will still be needed.
Another solution sometimes adopted is to set up a separate agency to be responsible for the execution of a nation's housing programme. The difference between that and a separate Ministry may not be great, but there will still be the critical question of to whom finally belongs the control of such an agency: one Minister, two or more Ministers, or the President? The set-up of a specific housing board constitutes another approach towards better co-ordin-ation. Various constructions have been, or anyway can be, conceived, ranging from a voluntary co-operation between different Ministries which have representatives in such a board to a body of independent experts who make recommendations directly to the highest executive power, which then has to decide whether the recommendations will be put into practice or not. Lastly, such a board might have executive power itself. The feasibility of different organisational arrangements depends on the constitutional and administrative set-up of Government; for instance, whether there is a federal or unitary governmental structure, or whether the political authority lies in the hands of a Council of Ministers, or of a Head of State.
Co-operative housing has proved to be an important element in the improvement of housing, specifically in connection with low-income groups. "Co-operative housing is any form of organization and action in which small or large groups of people undertake co-operatively to obtain housing to be owned by those who occupy it."7 According to the quoted UN report, co-operative housing requires strong encouragement and collaboration on the part of the State. According to this report, a housing co-operative inevitably becomes a living and wholesome neighbourhood built on concepts of interdependence and sharing. A plea is given for partnership between Government and "co-operative organizations,. . . the former exercising the power of public authority, especially in the two critical areas of land and financing, and the latter contributing the complementary power that derives from voluntary action and the unique qualities that attach to the co-operative system.8 Also it is recommended that all measures by developing countries to build up non-profit housing organization should be based on the idea of the future integration of such organizations into one system of non-profit housing organization.
United Nations Department of Economic and Social Non-Profit Housing Organizations, ESA/OTC/SEM/75/2, New York, 1975, p. 69. United Nations Department of Economic and Social Affairs, Non-Profit Housing Associations, op. cit., p. 75.

including the formation of a technical service organization, of regional development centres, and the organization of long-term training programmes for the staff of such organizations.9
Good co-ordination at the national level will lighten effective co-ordination and execution at lower levels. The typical problems of African countries, specifically the aspects of self-help and intermediate building technology, will probably lead to different organisational set-ups from those developed elsewhere.
United Nations Department of Economic and Social Affairs, Housing Organizations, op. cit., p. 127.


5. Slum areas are growing rapidly outside urban centres.

6. Slum areas are demolished and built up again a few kilometers outside the town.
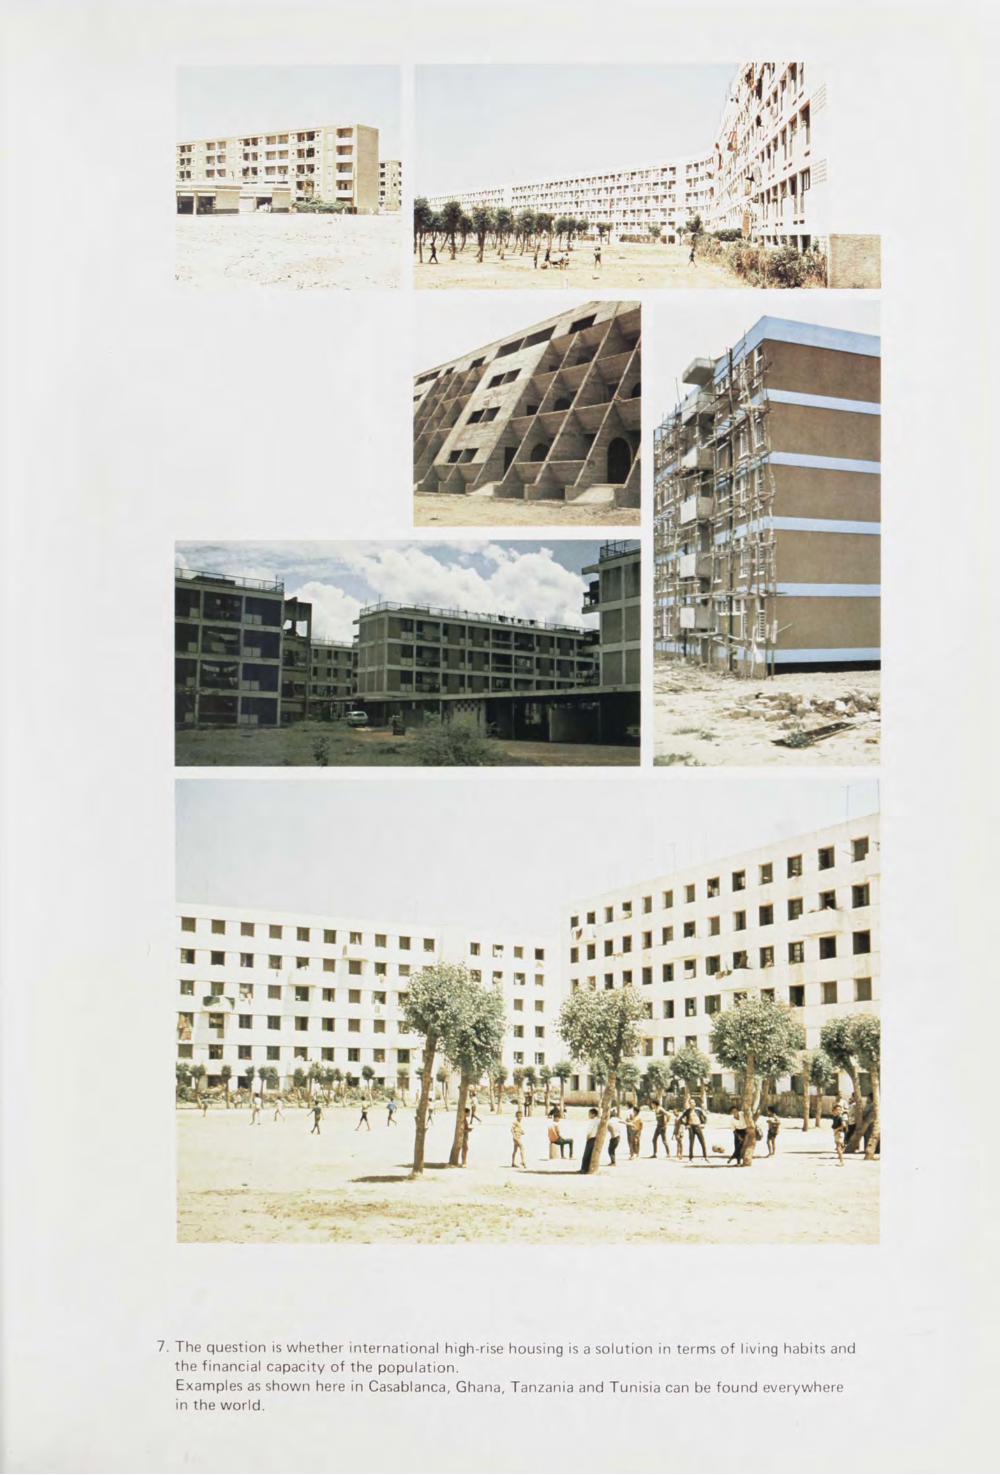
• •h r r n ^ fi- f*w "P-^'--r̂ S: ^^ir^ririr yZ ̂ 7 |̂l
ldlMltfidk^5t2.'̂ r.,!r,iP'Ti?irirrT2j 1 ,̂ 111 ,̂ || II I
« 1 1 • p ' 6 i * r « • B • •
1 1
"
s^. • ' .«fc, • - - — • k- • j. ̂ •f' 'i -• ? •* "- • _^ • • -y .1 • •• - • ' -
7. The question is whether international high-rise housing is a solution in terms of living habits and the financial capacity of the population. Examples as shown here in Casablanca, Ghana, Tanzania and Tunisia can be found everywhere in the world.

8. People always need a shelter, and if there is no house available, people will construct one themselves. Some of the houses in slum areas have a very good construction: brick walls, concrete floors, etc, but they are often in the wrong places.

PART 3 ASPECTS OF IMPLEMENTATION

CHAPTER 10. PRIORITIES IN STANDARDS AND DESIGN
Basic Considerations
Preparation for living in a complex society requires planning. This is generally taken for granted, but the planning process itself has often fallen into a routine pattern that obscures the need for new input. One of the biggest blind spots is the failure to recognize that planning ultimately is the users' business. This is not suggesting that untrained people should design buildings, but rather that they should provide information for the brief by which the trained professionals transform the natural into the built-up environment. If they like the built-up environment in which they live, then they are paying for use-value; if they do not and would like to move out at the first opportunity, then the plan has no use-value. The close involvement of users would emphasize functional quality and remove those weaknesses which tend to render expensive projects useless. Planning may be someone's particular responsibility, but it is everyone's business.
All too often the European types of houses form the basis for housing in Africa, while similarly the craftmanship and the human dimensions of African traditional building forms are much too frequently neglected. Too often also the users themselves neglect their own priorities of requirements as related to their own financial capacities. Because the social and religious life of people takes place for an important part in the open, or at least away from "home", housing is in fact only a temporary shelter against weather. For the architects the task is to design for these two contradictory requirements and to realise simultaneously a housing community along with a private isolated territory for the household and its members.
The problems connected with these two contradictory claims can be illustrated by two examples:
(1) Traditional housing in Upper Volta,1 and (2) Traditional housing in Northern Togo.2
Similar studies have been made for other African countries,3,4,5 and further examples can be found in the book "Economic Housing in Africa".6 These illustrations of which some are architecture without architects present houses adapted to the social life, the economic possibilities and the climate.
In former days excellent examples could also be found, for instance, in the nineteenth century Kingdom of Buganda:7 "(Their houses) were large and beautifully made conical structures of tightly woven canes and reeds that often soared fifty feet into the air. These dwellings were dry and comfortable in the rainy seasons and cool in the hot seasons, and they were infinitely more attractive than any building that has been erected in Uganda in the twentieth century."
It is not by any means intended to say that this is the solution for present-day urban and rural settlements. However, to solve the housing problem an answer has to be found for the fast-increasing prices of the traditional Western building materials, the shortage of skilled labour that can use Western techniques, and the discrepancy between the Western town planning and housing design and the existing social and economic structure of an African country.
The housing problem can only be solved if the solution is in harmony with the financial capacity and the needs and desires of the family (Figure 10-1). Cost and quality must be studied simultaneously. This is at the micro-level (project level). At the macro-level (country) quantity also comes into the picture. The choice is between too few too expensive houses or more low-cost ones (see Chapter 7).
Silva Julio, A.: L'Habitat Traditionnel en Houte Volta Ouagadougou, 1970. 2 Silva Julio, A.: L'Habitat Traditionnel au Nord Togo Cacavelli (Togo), 1974.
Bjeshagen, Torbjörn and Särfors, Ingemar: L 'Habitat traditionnel dans la republique populate du Congo, Uppsala, 1972. Evardson, K.I. and Hegdal, B.: Rural Housing in Tanzania; Report on a pre-study. Ministry of Lands and Housing and Urban Development, Dar-es-Salaam, 1972. Oliver, Paul: Shelter in Africa, London, 1971. Jährling, R.: Economic Housing in Africa, Addis Ababa, United Nations Economic Commission for Africa, 1976. Moorehead, A.: The White Nile, Hamish Hamilton, London, 1960.
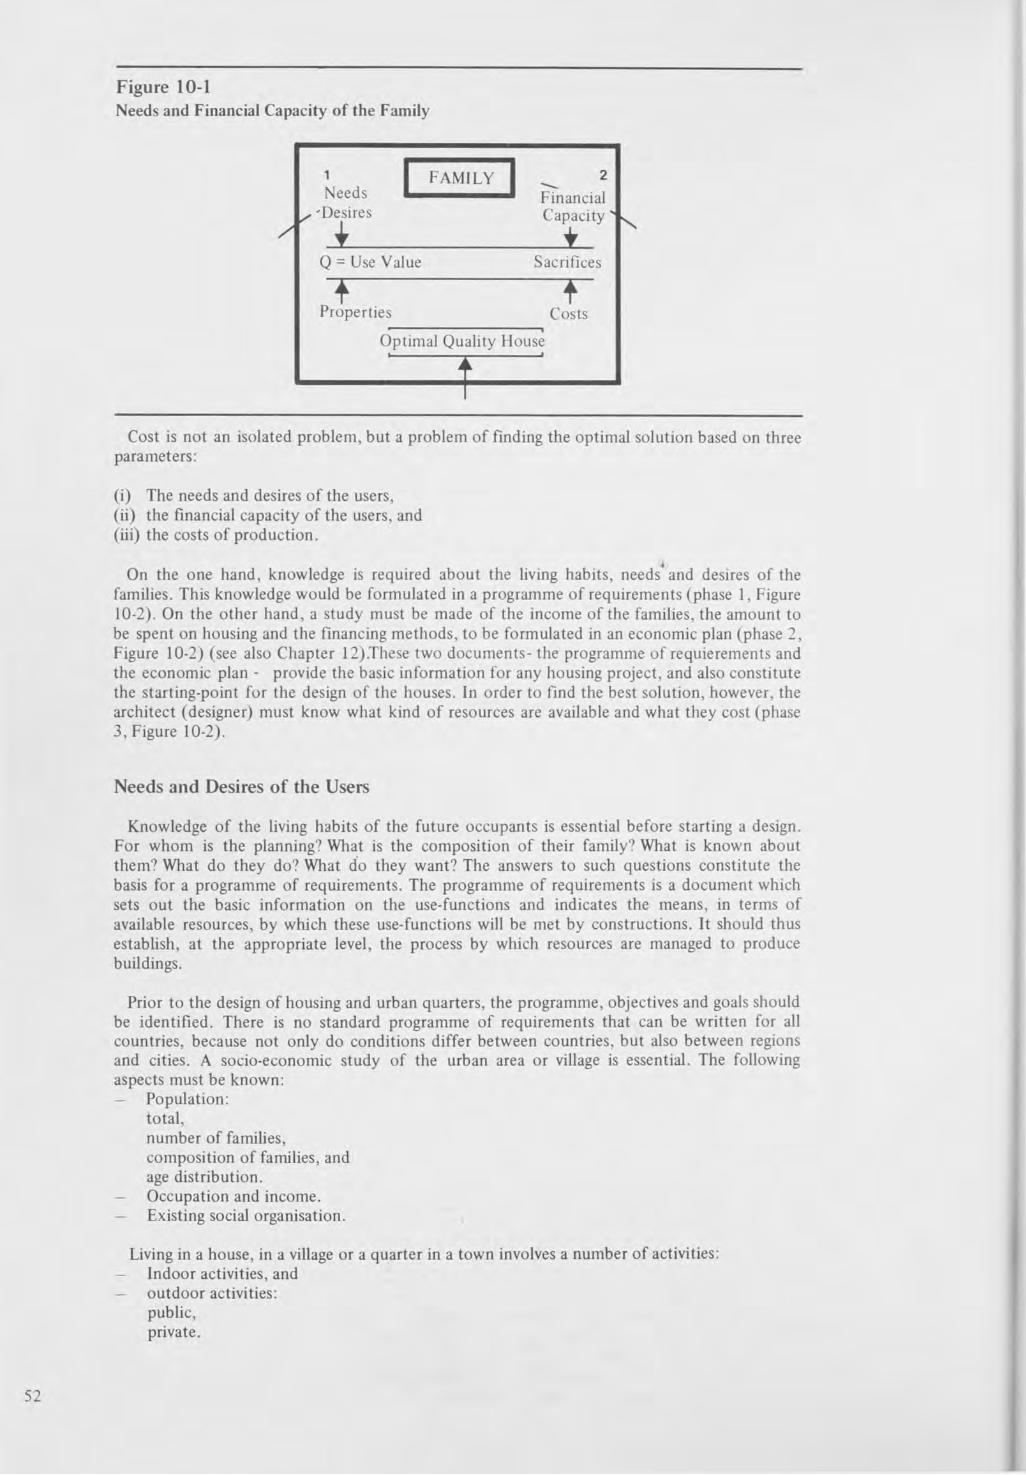
Figure 10-1 Needs and Financial Capacity of the Family
1 Needs
^ 'Desires
FAMILY 2
^ A Q = Use Value Sacrifices
* J Properties Costs
Optimal Quality House
Cost is not an isolated problem, but a problem of finding the optimal solution based on three parameters:
(i) The needs and desires of the users, (ii) the financial capacity of the users, and (iii) the costs of production.
On the one hand, knowledge is required about the living habits, needs^ and desires of the families. This knowledge would be formulated in a programme of requirements (phase 1, Figure 10-2). On the other hand, a study must be made of the income of the families, the amount to be spent on housing and the financing methods, to be formulated in an economic plan (phase 2, Figure 10-2) (see also Chapter 12).These two documents- the programme of requierements and the economic plan - provide the basic information for any housing project, and also constitute the starting-point for the design of the houses. In order to find the best solution, however, the architect (designer) must know what kind of resources are available and what they cost (phase 3, Figure 10-2).
Needs and Desires of the Users
Knowledge of the living habits of the future occupants is essential before starting a design. For whom is the planning? What is the composition of their family? What is known about them? What do they do? What do they want? The answers to such questions constitute the basis for a programme of requirements. The programme of requirements is a document which sets out the basic information on the use-functions and indicates the means, in terms of available resources, by which these use-functions will be met by constructions. It should thus establish, at the appropriate level, the process by which resources are managed to produce buildings.
Prior to the design of housing and urban quarters, the programme, objectives and goals should be identified. There is no standard programme of requirements that can be written for all countries, because not only do conditions differ between countries, but also between regions and cities. A socio-economic study of the urban area or village is essential. The following aspects must be known; — Population:
total, number of families, composition of families, and age distribution.
— Occupation and income. — Existing social organisation.
Living in a house, in a village or a quarter in a town involves a number of activities: — Indoor activities, and — outdoor activities:
public, private.

Figure 10-2 Relation between Needs, Financial Capacity and Resources

No matter how well a house is designed, it may possibly never give real satisfaction to its users if other amenities have not been provided. This leads to the question about where to start: with the public utilities such as schools, hospitals, market, water, sewerage and roads, or with the dwelling? Surveys among the future occupants will reveal whether high or even medium, if not low technical standards of the dwelling as such are the first priority. Some amenities are at least of equal importance, such as potable water, sewerage, opportunity for work and, to a lesser degree, opportunities for education, health care and so forth. Where to start with the programme of requirements and where to put the priority is dependent on the available budget.
The Financial Capacity of the Users
From the graphs it can be read that the actual building cost for contractor-built "low-cost" housing far exceeds the amount to be spent on housing for a large group of the population. Absolutely necessary cost reductions of 50% or more can only be reached where, instead of the paternalistic provision of ready-made housing projects, shelter will be realized in a process of self-help and community development by the people themselves. By straining their own personal savings capacity, people involved in such a process will not only improve their own living conditions, morale and productivity, but may also contribute to the development of the smallest building industry. This means that the programme of requirements should not be a sophisticated document for architects but a simple handbook for the man (or the family) who has to build his own house.
Standards should be developed in connection with three distinct income groups, as indicated in Figure 10-3:
1. The large group (about two-thirds of the population) that cannot Afford the cost of a contractor-built urban core house. For this group, site and services, improved squatter areas, self-help and aided self-help can be the only solutions.
2. A mostly much smaller group with somewhat higher and more regular incomes for which contractor-built core housing might be a proposition, also because of the possibility of later extensions.
3. A small group that can afford contractor-built houses.
Figure 10-3 Annual Income and Investment Possibility in Housing per Household
14.
12.
10.
8.
Average Household Income
I I I I I I I I I I I
50 100
>• Population in %

For Category 1 emphasis should be put only or mainly on zoning standards, affording an acceptable layout of the neighbourhood and safeguarding future extension concerning houses and public facilities. The main condition should be that later upgrading will be possible and that the Category 1 type of housing can in time develop - by upgrading and extending - into a Category 2 type. Ideally it should also be possible to let Category 2 type develop into the level of Category 3 type of housing. (Figures 104,5,6).
In fact, the developing nations are in this way beginning to plan for urban renewability. However, because Category 3 type of house is designed and constructed in one step, perhaps a somewhat more economic land use might be possible than with Categories 1 and 2. This in any case will hold true for apartment buildings that most times can only be realised for the Category 3 income group. Implicit in this approach is the recognition that building codes inherited from colonial times, or anyway heavily influenced by building codes from Europe, will not be valid instruments for the development of housing in Africa for many decades to come. For houses in Categories 2 and 3 more permanent structures are possible and therefore more detailed building standards.
Figure 10-4 Different Approaches required for Different Categories
organisation training, communal facilities
QC c
• " •T3 W k* 00 D-3
i planning + design standards
transitional structures
00 c -O k* 00 D, 3
i permanent structures

Figure 10-5 Government and Family Input in Housing
FAMILY input in building
GOVERNMENT input in organisation materials supply, training
FAMILY input in building
GOVERNMENT input in organisation materials supply, training
00 <D
O P UH
00
c: o C/2 c cd
\z
+ housing
+ core housing
00
O —
c <D
(Ü OH
T zoningand site + service + squatter
Type 1A - 1B Type 2 Type 3
GOVERNMENT input in building and standards
Building activities have a function in an interrelated process of changes between population, employment, attractiveness and land use. The housing problem is related to: a. access to employment; b. access to urban facilities, such as social services, health and transport; c. access to education; d. land use; and e. housing quality and quantity.
If the amount a family can afford to pay for their house is not enough and if the gap between this amount and the cost of a contractor-built house cannot be met through subsidies, some form of self-help is the only solution. The task of the Government is to provide a master-plan which can be filled in by the population with the aid and services of governmental bodies. This master-plan should focus on the factors a-d (see Chapter 13). However, attention should not only be given to the development of new schemes, because the upgrading of existing squatter settlements is of equal urgency (Figure 10-7).
Upgrading of Slums and Squatter Settlements
Although housing in squatter areas8 may be built from traditional materials or be illegal, the percentages given in Chapter 3 tend to overstate the problem. Many of these houses provide adequate shelter and offer good access to employment. Since the public sector does not provide
Urban slums and squatter settlements in the Third World, UN Doc. A/CONF 70/RPC/9 (prepared for Habitat), 15 May 1975, describes the phrase slums and uncontrolled settlements as "areas of relatively permanent housing which in appearance at least are poor, underserviced, overcrowded and dilapidated;" and the various types of urban squatter settlements which have been referred to in other publications as transitional, marginal, uncontrolled, subintegrated, spontaneous, etc.

a solution that this group of the population can afford, these slum houses are the cheapest being produced by the private sector. Upgrading not only relates to a better physical environment but also to the mobilisation and the stimulation of the population. The Port Sudan resettlement project (described in Chapter 14) demonstrates that also under the most unfavourable circumstances large-scale improvements are attainable. Other examples are in Rabat9, Dakar, Dar-es-Salaam and Lusaka.
The main features of such upgrading programmes are:
— Improvement of sanitary equipment; — improvement of infrastructure; — improvement of social services and education; and — giving the people security of tenure.
Most existing structures will be retained and gradually improved by the families. Participation of the people is indispensable for any large-scale programme so that organization and training is the most important task of the Government.
Site and Services Schemes
In most African countries, site and services projects have not really been very popular. The fear of creating new slums and the political consequences of this decision have stopped many initiatives. Housing ministries may have many of the necessary skills to initiate and control such projects. "But the historic concentration on conventional housing solutions generally constitutes a dangerous bias which is not easily remedied."1 0 But site and service projects are under construction today, for example, in Botswana, Kenya, Senegal, Tanzania and Zambia. In site and service projects, plots are allocated, levelled and connected with water, sewerage and electricity; social and public services and schools are provided and the school can be used as a community centre for training on how to build or improve houses (see "the role of education"), However, the allocation of the project to marked areas and employment is particularly important.
Aided Self-Help
A specific approach to the problem of cost reduction is "aided self-help". It contains two basic elements: 1. Self-help means that part of the labour is supplied by the future tenants themselves. The
advantages of this working method are: (a) Saving on building costs: — saving on professional labour; — saving on profits, overheads and profits of intermediaries; and — saving on costs by quantity reduction, serial production, etc.
In many countries there is no mass production of building materials or elements and dwellings are still being built as single products.
(b) Social advantages: Taking part in an aided self-help programme means for the participant that he gradually gets used to the new situation and makes social contacts with the community.
2. Aid concerning design, site development, financing, execution and mutual arrangements between participants in the scheme. Through this social, technical and managerial aid, much better houses are realized than in situations where people are left completely to their own intitiative and knowledge. The necessary aid by a self-help specialist can be arranged through international organizations, governmental agencies, regional or local institutes etc. and can take the following forms or combinations of forms:
— The infrastructure; — sanitary core and/or roof + supporting structure;
standard designs and specifications, demonstrations prototypes, instruction, supervision; — financing (e.g., roof-loan schemes, foundation schemes); and
supply of certain materials (e.g., cement, doors, windows, roofing material) and/or plant and tools (e.g., blockpress).
Jacoub el Mansour: Donnees et programme d'intervention dans un bidonviUe de Rabat, Royaume du Maroc, Ministere de ITnterieur, Direction de l'Urbanisme et de l'Habitat, Rabat, 1970.
1 0 World Bank: Sites and services projects, Doc. A/CONF. 70/RPC/8/Add. 1, prepared for the regional Habitat Conferences, 27 May 1975.

Figure 10-6 Zoning concerning Housing, Public Facilities and Employment
00 <U O >
OO U 4>
Oß OO GO C c O 't/5 C/5 3 3 o o 3 X X OH
Employment
Public Services
Housing
Housing
There are certain requirements, however, for the success of an aided self-help programme, which may be listed as follows:11
a. Sound town-planning and provision of a suitable infrastructure; b. an acceptable dwelling design; c. possibilities of extension or improvements in the future; d. availability and applicability of local materials; e. simplicity in construction for execution by unskilled participants; f. selection and number of participants; and g. careful organization and social preparation.
Examples in Africa are Ethiopia,12 Senegal,12 Sudan1 2 and Upper Volta.13
11 United Nations Economic and Social Council, Economic Commission for Africa, Cooperative, non-profit and self-help housing in Africa, E/CN. 14/HOU/105, 25 June 1973.
12 United Nations, Self-help practices in Housing: Selected case studies, UN sales no. E 73. IV. 15, New York, 1973.
1 3 Silva, Julio A.: 20 maisons en banco ameliore, Ouagadougou, 1972.

Figure 10-7 Upgrading and Extendability; the Same Master-plan for Each Stage
Type 1A. Guided Squatter Settlements
Type IB. Site and Service
Type 3. Contractor Built 59
Type 2. Core Housing

The Importance of Cost Control
It will be clear that for the implementation of housing schemes, as described so far in this Chapter, the question of whether or not the costs of labour and materials can be kept within the paying capacity of the tenants is of vital importance. Any building market is highly sensitive to especially unfavourable developments, and African building markets form no exception to this general rule. To give an example, in several African countries the costs per square metre of houses, including "low-cost" contractor-built housing, recently reached a level even higher than in Western Europe. The factors influencing this enormous increase of the building costs are many, and especially include: — Increase of transport cost especially affecting the imported building materials; — imbalance between the demand side and the supply side; — lack or skilled labour; — lack of trained middle-level staff to control the preparation and implementation of the
building project; and — inflation.
No doubt government initiatives in order to control such developments could be carried out more easily and reasonably if a proper cost control system would be available. House-building costs expressed in monetary units per square meter gross or net area are usually the only figures available. However, they provide a first indication and the breakdown of building costs is much more important than only to identify the factors affecting high cost level.
Scarcity of Data
The view that "data on the present level of house-building costs in Africa are scarce and difficult to compare"14 was written more than 10 years ago, but still holds true, although in some countries attempts have been made to collect' them on a statistically significant basis. In 1968, 1969 and 197015 series of sub-regional meetings were organized by the United Nations Economic Commission for Africa, aiming at a more efficient cost control in housing.
The SfB System
Recommendations to set up a National Housing Centre in each country, to constitute a permanent Working Group of Experts on House Building Costs, and to adapt the SfB16 system for further detailed study have not been carried out so far. The SfB system is a coding method used for rationalization and co-ordination in building by:
a) Using it, either manually or by computer, for management (planning, control and cost checking) of building construction work including cost control of the design stage and the collection of experience in well arranged data banks.
b) Using it, either manually or by computer, for the arrangement of specifications and bills of quantities for building projects and of related codes of practice (including "National Building Specification" and standards) as well as drawings of specific elements for re-use in following projects.
c) Using it for the arrangement of trade catalogues — on shelves or in drawers — and for national compilation, either manually or by computer, of any related information to be used for building construction, as well as information on how to apply the materials and the components, their prices, supply conditions, addresses of suppliers, etc.
Normally, comparing the cost between different projects within a country or between countries leads to problems of an administrative nature. Every contractor, each country has its own system, with the traditional breakdown in trades and operations being used as well as the breakdown in elements. Instead of this, there must be a coordination of all efforts within the full range of activities. A tool like SfB developed in industrialized countries can be easily applied and suitably adapted to African conditions.
14 Housing in Africa, op. cit. 15 Report of meeting of experts on house-building costs, Addis Ababa, 1968 (E/CN.14/416),
Tangiers, 1969 (E/CN. 14/460), Kumasi, 1970 (E/CN. 14/496). 1 6 SfB was the name of the Swedish National Committee originally inventing this system in
1942-1949.

The co-ordinating effect of the SfB-system is achieved by the combined use of three sets of concepts, grouped and coded separately with easy-to-learn symbols (Figure 10-8). The introduction of such a system will ensure the availability of reliable information in the right quantity, of the right quality, in the right format and at the right time. This is a prerequisite to economic building.17 With a system like SfB in operation it will be much easier to get an insight into factors influencing building costs, and, if necessary, to take measures based on such information. To achieve this, generally speaking two ways are open: the macro pattern and the micro pattern.
Figure 10-8 SfB-principle: 3 different types of symbols
building elements
design
construction
control
SfB co-ordination by coding e.g.:
(21) walls F
blockwork e
stone
construction materials (and other resources
Table 1 Table 2 Table 3
Bracketed numbers for building elements Capital letters for constructions Lower-case letters for resources
The Macro-pattern
Supply for house-building on the macro-level may be illustrated by Figures 10-9/10-10. We can speak of a closed and an open system of supply. One is where we only have the domestic resources at our disposal and the other where imported resources can also be used.
In the closed system the nation regards its own population as users of the houses, its own labour force as producers of the houses and its own natural resources as the suppliers of power and materials needed for the production. The constraints imposed by the limitations of natural resources may be an important feature of this closed system.
1 7 Finbarr Shanley: "The Application of the SfB-system for building Economies" in: SfB Review, Kokkedo, 1975.

Figure 10-9 Closed (Domestic) System
CLOSED (DOMESTIC) SYSTEM
POPULATION
4 products
labour
open syteem
• EXPORTS < IMPORTS
NATURAL RESOURCES
Figure 10-10 The Domestic Market
id
ic + it
ib + it
la + it
IMPpRTS
FOREIGN MARKET
In the open system all the resources of the world are available by imports. The imports, however, have ultimately to be paid for by exports of equal value. "Equal value" is measured in foreign currency. This may be a restriction, because most countries have to plan carefully for optimal use of the foreign currencies available for import. The problem facing us at the macro-level of house production is thus the optimalisation of the total supply based on domestic natural resources and imports. Looking at the house-building supply (cost)* pattern from this point of view, it may be illustrated as shown in Figure 10-10. Each functional element of the house is a piece of construction. The materials for the construction may come from domestic natural resources or they may have to be imported. The costs involved in house-building are the values added to the dormant constructions which make up the functional elements of the building.
The transformation of the raw materials into building elements may be a single operation or a complicated network of activities. In Figure 10-10 the possibilities are schematically illustrated, showing three major transformation steps (a, b and c) in modern building. Above them there are the design and administration activities (d). The three main steps of "value added" are:

a. Extracting and refining of materials; b. shaping of materials into building component; c. construction (the work on site to bring materials and components into constructions
making up the functional elements of the building). In each one of these steps the value added represents the cost of labour, plant and management for the operations in question. And between each one of the steps the costs for trade and transportation involved have also to be paid. The optimal solution to the house-building problem, then, will be found when the best use is made of domestic natural resources with an optimal import content in the total process of house production.
Figure 10-11 Cost Comparison between Types 1-3 Projects
£ « -o e
design, owners adm. constr. management 12%
o o
C -C <D <D B « ^ E ^ + «50 ̂C •- 3 •a o ~ JO 3 al aa o
(7) fixtures 5 7, (6) electr. inst. 5 7. (5) sanitary inst. ^7.
(4) finishes 10%
(3) sec. elements 10%
(2) primary elements ss'/.
c c 2 5 'B E .2 cx 3 -S 0-13 >
"O 'T-3 5 73 -j S
(1) ground elements ^o7.
sewage, water, electr. 30'/,
road works 10 ^
acq., survey/layout 10%
Type
• contractor built
own supply of materials
| j own supply of labour, management
The Micro-pattern
The micro-decisions in building concerning one project are recognized to follow a certain pattern as advised by the E.C.A.:
a. Basic decisions (if, where and when? financial restrictions etc.). In this stage the decision has to be taken whether to build contractor-built houses (Category 3), core houses (Category 2), aided self-help (Category 1A) or site and services schemes (Category IB). In Figure 10-11 a comparative estimation of building costs for the same house, but built following the practices of Category 3, 2, 1A and IB respectively has been carried out, this estimate being based on data from various projects in selected African countries.18 The
18 Working Group on House-Building Costs, Tangier, 1-12 September 1969: A review of country monographs, Uneca Doc. E/Cn. 14/HOU/48 Rev. 1,9 January 1970.

building cost subdivided into the main elements is 100%,to which can be added design and owner's administration (3%), construction management, profit and overheads (12%) and the costs of land acquisition and development (50%). The total cost of a contractor-built house will then be 165% of the building costs. Land acquisition and development will make no big differences in cost whether type 1, 2 or 3 is chosen, the Government providing the same facilities for the middle and lower income groups. Little can be done here through self-help. But by changing the contractor-built part into own supply of labour and materials a house with a 50 m2 floor area can be completed after some years for half the cost of the same Government-sponsored contractor-built house. It is assumed that materials bought individually are more expensive than those bought in large quantities by contractors.
b. Functional decisions (programme of requirements). c. Design decisions (spare allocation and architecture choice of constructions and materials).
The functional and design decisions should not only deal with building projects in a traditional (Euro-American) way but also with the requirements for building materials and the design of such standard components which may be cheaply produced and assembled. The principle of quality optimalisation should be brought from the level of "construction" to the level of "building materials and components" (Chapter 11).
Figure 10-11 shows very clearly that the development and organization of self-help practices ask for more skills in the community than the role of the contractor, i.e. the provision of materials and skills from outside the community becomes less important.
The Role of Education
For this reason, the existing formal educational system in most African countries should be developed also in such a way and on such a scale that a housing programme for the masses has more than a slight opportunity to be implemented. Only a special approach to ensure the necessary educational and ideological basis can give a solution. Such an approach, if successful, will have a major impact, because the poorly-educated are concentrated in the poorest parts of society. However, such an approach should be supplementary to and not a rival of, the formal educational system. Moreover, it should not reach only school children but adult people as well. A recent study1 9 defines such an approach as "Basic Education".
The objectives of basic education have to be defined in terms of "functional minimum learning needs". "Functional" means that education and training programmes should serve well-identified target groups, which will be able to use in daily life the education received. Such an identification is not difficult concerning housing the poor, because of a serious lack of skills in every household to execute self-help practices, especially in urban areas. Without skills there can be no production. Therefore, may it be squatting, core housing, site and services, or aided self-help, educational facilities are of vital importance in settlement planning.
Preferably before the first inhabitants of a new ward settle down, educational facilities should already be made available. For this purpose a modest school community centre would have to be built in advance, where educational as well as managerial activities for the starting up of the building process could be concentrated.
Courses on various aspects of self-help building activities may be organised there, such as:
— How to transform local raw materials into building components; — how to read drawings; and — how to assemble various building components on site.
As part of the training for these schools, reading and arithmetic already introduced on a country-wide scale to produce functional literacy will prove of great help.
For the implementation of basic education in "self-reliant" building a local organization of community workers is needed. A community worker should have specific skills not only in teaching but also in construction techniques. In addition, he should have managerial capacities and be able to maintain easy communication with the local populations. A national organization, responsible for the training and guidance of community workers, will be required for this purpose. Such an organization should have strong links with educational and financial authorities and with organizations promoting local industrialization and community development. Furthermore, it should be responsible for the promotion on a country-wide scale of locally-
1 9 World Bank, Education, sector working paper, Washington, 1974, p. 28^30.

generated practices which have proved successful, and thus for the proper briefing and assistance of local action groups.
Self-reliance offers most valuable education effects and this is an investment of great development potential in people. In this aspect the Community Development and Popular Participation in Tanzania is of interest, especially in relation to its planning and construction facilities, because community development in that country has a special identity; Ujamaa Vijijin is the name of Tanzania's community Development Programme, Self-Reliance is its guide for popular participation, and Learning while Doing is its commitment to education.20
Conscious of the limited resources at its disposal, Tanzania has committed itself to popular participation through self-reliance. The two main targets of a developing society, namely education and shelter, are thus pursued in a direct and problem-solving way.
* Cost-pattern and supply-pattern are synonyms in this context.
20 National Report on Human Settlements in Tanzania, prepared for Habitat, Doc. A/CONF. 70/nr. 4, 15 April, 1975.

CHAPTER 11. CONSTRUCTION AND BUILDING MATERIALS
Traditional and Modern Construction
Many African countries offer beautiful examples of public and traditional construction. Some of ancient origin, some more recent, but all constructed with local materials and skills. Rock-hewn monolithic churches of the 11th century in Ethiopia, the beautiful mosques in the mud cities of the Hausa States with the exterior enrichments of the houses; the bamboo houses in the lagunes of the West coast; all are adapted to locally available materials. Coral stone along the East coast, mud walls in the Sahel countries, stones for the Axumite and Tigre houses in Ethiopia, all these materials have proved to last a hundred years or more. The history of the Colonial period in Africa cannot be ignored, so the influence of "modern" building industry and technology on Africa is inevitable. "But African society and structure is not the mirror of Europe and should not be."1 The illustrations in this book show existing structures of great value, offering a wide variety of options that depend on the varied systems of African culture and their interaction with houses, villages and towns. These cannot be replaced by prefabricated multi-storey flats such as have been erected in places like Casablanca, Tema, Abidjan and Nairobi.
The UNIDO Monograph "Construction Industry"2 characterises modern and traditional constructions as follows: a. Modern construction employs the technologies developed in the industrialized countries,
requiring a relatively large amount of equipment, managerial skills and skilled labour from various trades. It uses modern materials either locally produced or imported meeting international standards. It handles major infrastructural works and modern prestigious buildings by mainly expatriate firms, and less sophisticated public and private buildings and minor infrastructural works by national contractors.
b. Traditional construction is largely a matter of self-help outside or on the brink of the monetary sector, and it predominates in the rural areas. It is increasingly influenced by the modern sector when inputs like cement, roof sheets and modern finishes are used.
From this interaction an "intermediate technology" is emerging, sometimes referred to as the conventional construction sector, where artisans and small indigenous contractors are handling a good deal of urban housing in squatter settlements and self-help schemes.
In many African countries nowadays, development efforts often focus on the modern construction sector so as to deal with growing investment programmes and to meet pressing needs for urban shelter. However, it should be realized that the traditional self-help construction still produces the built environment of the vast majority of the African people in rural as well as in urban areas, and that it is likely to continue having this predominant role for many years to come. Demands now in the traditional sector do not necessarily respond to resources released for construction at large. This becomes clear from the often occurring situations where idle capacity in the modern sector co-exists with excessive demands in the traditional sector. Low responses to official low-cost housing schemes or official financing facilities simultaneously with rapidly-growing squatter areas are striking examples. Yet this does not alter the fact that modern technology has the potential to provide major impulses for raising the quality level of traditional or conventional construction.
Progress in housing then will depend on the interaction between the traditional and the modern sectors. It can be foreseen that intermediate sectors will develop, or perhaps will have to be developed, in connection with self-help construction. On the one hand, this intermediate sector will — as an offspring of the modern sector — supply components and render services for which skills are needed that are difficult for self-help people to acquire. On the other hand, out of self-help construction skilled or semi-skilled labour and small enterprises will gradually start to enter the professional building sector. The beginnings of such developments can already be observed, and some aspects will be explained in the last section of this Chapter.
But, modern construction industry has also to play a role in housing in African countries, not only as a supplier of half-products to the traditional and the intermediate sectors but as a producer of houses for the relatively small group of people who rely on contractor-built houses. Also for this modern sector the fusion of new technologies and labour-intensive production methods offers important potentials for development, which simultaneously constitutes a tremendous challenge. For this reason a description of the modern sector in Africa is given below, and one of the aspects of the fusion mentioned above, i.e., the application of the principles of rationalization, will be discussed in some depth.
1 Shelter in Africa, London 1971. Construction Industry, UNIDO Monograph on Industrial Development No. 2, United Nations, New York 1969.

The Structure of the Construction Industry
The importance of the construction industry in national economies is indicated by its contribution to the Gross Domestic Product (GDP) and Gross Fixed Capital Formation (GFCF). Aggregate data from national accounts are shown in Annexe 2. For various reasons, care must be exercised when attempting to draw general conclusions from the figures. Firstly, it is difficult to define the boundary between the construction industry and other economic sectors, in particular the building materials industry. Secondly, a considerable amount of construction, particularly maintenance and modernization, is carried out by other industries as ancillary activities. Finally, much construction is done in the non-monetary sector of which at best only crude estimates are included in the statistics.3 (Table A2-I)
Figure 11-1 Share of Construction in G.D.P. of African Subregions 1965-1972
7%
'65 '70 *72
All Africa
'65 '70 '72
North-Africa
'65 ' 7 0 ' 7 2
West-Africa
*65 '70 '72
Central Africa
'65 ' 7 0 ' 7 2
East-Africa
As shown below, the construction sector in 1972 contributed on average 5-7% to the GDP and this proportion tended to increase with increasing per capita GDP 4 However, this general pattern is disturbed particularly by the amount of construction in countries at an early stage of economic development, where the occasional occurrence of one or a few big projects results in a temporary increase of construction activities. Many African countries are in this situation, which can also be seen from the graph below, showing the relationship between the value added by construction per capita and the GDP per capita in 1972. For countries with a per capita GDP of more than US$ 200-300, a representative average of the share of construction would appear to be more than 7 per cent.
But also in this situation considerable fluctuations appear when a few big investment projects are undertaken, or emphasis is temporarily placed on investments in plant and machinery. The large fluctuations in construction are also reflected in the countries' investment ratios that are the shares of the expenses on fixed capital formation in the GDP's. The output of the construction industry is a major component of these expenses. Average investment ratios for the African sub-regions are shown below. Again the gradually increasing investment ratios correspond with the growth of the per capita GDP, and it would appear that, allowing for considerable fluctuations due to the temporary changes in the nature of investments, investment ratios in countries with lower per capita GDP's (say, up to US$ 200 annually) are on average roughly 15 per cent, whereas in countries with higher per capita GDP's investment ratios they are well above 20 per cent.
The major components of the GFCF are investments in construction (including land improvement) and machinery. From available data it appears that the output of the construction industry contributes between 50 and 75 per cent of the GFCF in the majority of the African countries. There is no clear association between this ratio and the per capita GDP. Indeed, "over a short period a country may concentrate on plant and machinery or on infrastructure with a high construction component; over long periods a relative balance is maintained in capital formation between these two sectors".5
World Housing Survey, op.cit., p. 204. 4 Ibid (2), p. 7-8. 5 I b i d ( 2 ) , P a g e 9 .

Figure 11-2 Relationship between Value added by Construction per Capita and per Capita G.D.P. for 34 African Countries in 1972.
1000 900 800 700 600
500
400
300
200
150
100 90 80
^ 70 cri 60
B 50 cd a 40 cd
U 5 30 cx
CLi
o 20
10
• • • # • #
* ••
# • • •
• •
• jgf V *
• •
• w * f *
• 4
•
2 3 4 5 6 7 8 9 10 15 20 30 40 50 60 708090100
-• Value added by Constr. per capita (U.S. $)
Figure 11-3 Investment Ratios in African Subregions
30%
25
20
15
10
5
0 '65 '70 '72
All Africa
•65 '70 '72
North-Africa
'65 '70 '72
West-Africa
'65 '70 '72 '65 '70 '72
Central Africa East-Africa
Regarding the proportion of residential buildings and other buildings in construction some data are shown in Figure 11-4. This patchy information, however, does not permit a true insight into the situation. For a few countries the proportion of residential building seems somewhat more than 50% or roughly 30-35% of the output of construction. This may be confirmed by an ECA estimate of the division of the output of the construction industry in

Figure 11 -4
Fixed Capital Formation, Total Building and Residential Building as Percentage of G.D.P.
(latest year).
ZAIRE
BOTSWANA
• V.V
1969
ETHIOPIA
KENYA
1972
1973
LESOTHO 1967
M A D A G A S C A R 1571
V. >•"//.r-7^T
• •
v v—r-r
. . . . . ZZZ2
mmmm
MALAWI
MAURITIUS -
"SWAZILAND
TANZANIA -
UGANDA
1969
1972
1971
ZZZJi
zzzzzzzzzzz: / '• ' / / .V / A
xzzzzzzzzzz / r/r s rs TT-rrr
1973
1971
.•.W.':.".'/TTTV . . . . . . . . . . . ZZ21
s?-rr azgggz]
ZAMBIA 1970 zzzzzzzzzzzz ZZ2ZZ2Z2ZZ2Z zzzzzzztza
QTH ER AFRJC./ H RHODESIA SOUTH RHODESIA 1972
SOUTH AFRCA 1972
ZZ2Z2ZZZZZZZ
ZZZZ2ZZZZtzZZ:
Fixed Capital Formation
Residential Building
Total Building
Information not available
Source: See Table A2-I1.

Africa in 1970,6 given in Table A2-III, where expenditure on dwellings is shown to absorb 35 per cent of the expenditure on construction. Assuming that the latter estimate provides a representative average, it follows that expenditure on dwellings absorbs roughly 20 per cent of the GFCF, or some 3 per cent of the GDP in most African countries. As shown in Chapter 7, with an expenditure on housing of 2 to 3 per cent of the GDP, not more than 2 to 5 units per 1,000 people can be built annually at a cost of six to ten times the per capita GDP.
With regard to the quantitative aspect reference can be made to Chapter 4, where it is estimated that only to accommodate newly-formed households on average 7.5 housing units per 1,000 people are needed. This is roughly three times as much as the present output of the construction industry. Furthermore, to realise the indicated cost level is an almost impossible challenge, certainly in the countries with a relatively low per capita GDP. To give just one example: the cost of a core house in Kenya, including water supply, sewage disposal, and one finished room, totally about 28 m2, was estimated in 1970 at about US$ 1,520, which was slightly more than 10 times the per capita GDP in Kenya at that time. Considering also the unequal income distribution between the rural and the urban populations and within the urban population, and the tendency to concentrate on the less problematic and more profitable high and medium class houses in the cities, again the basic fact is underlined that the professional construction industry has met and can meet only a fraction of the total housing demands by producing complete contractor-built houses. Almost all rural housing and a large proportion of urban housing is, and will continue to be, provided through traditional or some form of self-help construction.
Building Materials
Building materials and components are the major inputs in the construction sector, contributing between 50 and 60 per cent of the total value of construction output7 and expenditure on building materials can be calculated at some 4-6% of the GDP or roughly between US$ 5-20 per capita per annum for most of the African countries. The potentials for developing the domestic building materials industry, therefore, would seem large, more so as — the industry is the supplier of the construction industry which belongs to the faster
growing sectors at the early stages of economic development; — there is much scope for import substitution in these early stages thus adding to the demand
over and above the growing demands for locally produced materials at present; and — additional demands for modern materials may come from the traditional construction
sector as it develops.
However, in many African countries these potential developments are difficult to realize because of the relatively small size and the large fluctuations of present demands not only at the local level, but also in the national context. A good deal of modern building materials including such key materials as cement and steel sections, can only be produced economically through large-scale manufacturing. Not only large demands are therefore required, but those demands should also be concentrated considering the often low value/weight ratio, which prohibits transport over long distances, certainly in the African setting, where transport facilities in general are poor. Next to the small sizes of local demands, relatively large fluctuations in their demands prevent a rapid development of building materials industries in most African countries.
The problems of such fluctuating demands can clearly be demonstrated by referring to the local production of concrete in Kenya. The cement industry in Kenya is well established. Production of cement has been increasing steadily although local consumption of cement has been fluctuating considerably. This was possible as cement has been exported to Uganda and Tanzania and to the Persian Gulf countries. Furthermore, as the industry has adequate liquidity, it was able to carry large stocks. Therefore also at times when local demands were depressed, the cement production could be maintained at economic levels of output, which was reflected in the prices of cement.
When after the slump of 1963-64 construction activities started booming, the price index of cement rose only a few per cent. This was not the case with the aggregates that are mixed with cement to make concrete. This aggregate is produced by local firms which reduced investments and output during the slump due to lack of capital and possibly lack of confidence. Production of aggregate could not be resumed after the slump with adequate speed, resulting in rising price
United Nations Economic Commission for Africa, The status and problems of housing and construction industry in Africa,EICN. 14/HOU/104, June 1973.
7 Ibid (2), Page 205. "

indices for stone, sand and ballast of some 60 per cent during 1966-67.8 It can be seen that fluctuations in demands often result in high price levels of locally produced building materials unless these fluctuations can be accommodated by stock changes, exports or imports. Stocking, however, requires the availability of additional capital, which is very scarce in most African countries, whereas reliance on exports presupposes established channels and markets. It is, therefore, not surprising that the imports of building materials are considerable, the value of them representing as much as 5-8% of the total value of imports.9
In terms of expenditure on GDP, these imports represent a value of roughly two billion US$, or 3.6% of the GDP of all African countries in 1972 as shown below:10
Values in million US $
1965 197211
GDP 22 980 54 000
Investment in construction 1 980 (8.6% of GDP) 5 310 (9.8% of GDP)
Expenditure on building materials 1 100 (4.8% of GDP) 2 950 (5.5% of GDP)
Imported building materials 600 (2.6% of GDP) 1 936 (3.6% of GDP)
It can be seen that in 1972 as much as 65 per cent of the consumption of modern materials was imported, and, more importantly, that to supply the increase of construction between 1965 and 1972 the value of additional imports was about twice the value of additional locally produced materials. Increased demands for modern building materials, therefore, are not simply followed by a proportionate increase of local production and certainly not by additional increases because of import substitution. Also, this is in spite of the fact that various raw materials such as clay, limestone, sand and concrete aggregates are widely distributed. In this connection it is interesting to note that, as shown in Table A2-V, such key materials as cement, cement products, clay products and worked wood are locally produced in most African countries.
The insufficiency of locally produced building materials is not simply a matter of the availability of raw materials resources and of the introduction of new production technologies. Rather can this insufficiency be attributed to the limited and fluctuating demands in combination with scarce capital, poor transport facilities and scarce energy. Planning for the development of local building materials production, badly required to reduce the foreign exchange bill, needs to be based on a thorough understanding of these factors at the local level. In this connection, reference is made to a useful guide provided in the UNIDO Monograph No. 3,12
where the degree to which a number of selected criteria affects the production of certain common building materials is indicated. Although this monograph is well-known, a summary of these criteria is given in Table A2-VI for the sake of completeness. From this it can be seen that the economic production of such key materials as cement and steel sections provides problems. On the other hand local production of materials such as concrete blocks, clay products, sawn wood, chip-board units and ceramic ware would appear relatively easy.
In conclusion, it would appear that considering the opportunities and problems of developing local building materials production in Africa, Government policies should focus on;
The promotion of steadily-growing continuous demands at the local level. The importance of this can hardly be overstressed, as both sudden increases and fluctuations of demands simply result in a higher price level. Continuous demands could come from Government-sponsored housing and building programmes, including sites and services schemes and rehabilitation programmes of squatter areas both in urban and smaller rural centres. The development of small-scale industries and workshops, in both the larger and smaller urban centres as well as in the villages. Possible measures include providing financing facilities, setting up training programmes in the fields of management and technologies, and promoting the use of local materials through demonstration projects and information centres.
Republic o f K e n y a , D e v e l o p m e n t P l a n 1 9 7 0 - 7 4 . 9 Ibid (2), Page 207. 10 Ibid (5). 1 1 A breakdown of different materials is shown in Table A2-IV. 12 Building Materials Industry, UNIDO Monograph on Industrial Development, No. 3 UN
New York, Page 37-42.

— The adaption of standards that fully recognize the improving capability of local manufacturers and artisans, as well as the needs and the resources of the African people living in both the urban and the rural areas.
Rationalization in the Case of Labour Intensive Production
As indicated in the introductory section, most housebuilding in the non-traditional sector is undertaken by a number of medium-sized national contracting firms and numerous small indigenous contractors and individual artisans. Attempts to introduce international construction practices, which were mainly based on a large amount of prefabrication requiring relatively heavy equipment, have not been very successful. Prefabrication, however, is just one aspect of rationalization, a concept which refers to the total set of opportunities to improve the performance of the construction industry. Rationalization can be applied to construction processes at all levels of technology on the basis of the following principles: a. Standardization of building materials and components, as well as of design and construc
tion procedures. b. Specialization in construction operations essential for training of unskilled or semi-skilled
labour by assigning repetitive tasks, resulting in increased labour productivity and improved quality.
c. Co-ordination or organization, the necessary complement of standardization and specialization calling for planning and control of the construction process.
Figure 11-5 Rationalisation of the Construction Process
'4/
Time •
Time •

The application of these principles to construction processes may best be illustrated on the basis of the diagram below (Figure 11-5). The diagrams show how rationalized construction processes on the site with standardized inputs and specialized operations are arranged according to production lines.
The sum of the building operations in a vertical sense results in the completion of one unit, and the continuous execution of the different operations in a horizontal sense results in the successive completion of all units within a project. The output of a line is expressed as the number of completed units per unit of time. The size of a production line is limited, mainly because of the limited numbers of labourers that can efficiently operate on one site, and its output then depends on such factors as: — The labour productivity: within a well-organized construction process labour productivity
tends to increase. — The complexity of the final product: simple core-houses can be produced at a higher rate
than complete dwellings. — The level of mechanisation which relates directly to the labour productivity.
A house-building programme now, showing the number of dwellings to be completed within a certain space of time, in say, an urban area, can be realized by setting up several parallel production lines. As management considerations do not restrict the number of simultaneously operating production lines, it follows that also in situations where labour-intensive production methods are applied, the required total output can be produced if the number of parallel lines is sufficient.
At this point the advantages and disadvantages of prefabrication can be understood. Referring once again to the above illustrations, production line A may represent a labour-intensive process and production line B a mechanized process in which also prefabricated elements are used. Two major differences are noted:
The number of operations within line A is larger than in line B, where a number of operations is removed from the site to a building element plant; and
— the output of line B is larger than that of line A.
Prefabrication now is widely regarded as a way of reducing costs and raising quality levels, as well as of increasing output and using unskilled labour. In this connection it should be noticed that:
Increasing total production can also be realized by increasing the number of parallel production lines, in which labour-intensive production methods are applied.
— To a large extent unskilled labour can be used also in labour-intensive production processes by dividing such processes into repetitive operations.
— To reduce labour costs by introducing a high level of mechanisation and prefabrication, a large continuous demand is required at the local level, which, as explained in the foregoing section is a rare phenomenon in Africa at present.
It follows that prefabrication, particularly of heavy structural elements is an illogical approach in most African countries. Prefabrication of non-structural parts as window frames, doors, stairs, kitchen fittings and the like, and to a lesser extent of light structural parts, though not spectacular, may be much more beneficial. In this connection reference is made to "Prefabrication in Africa: Status and Problems",13 from which is quoted that the first step towards prefabrication in Africa would have the following characteristics:
The basic prefabricated elements should either be craft-fabricated or fabricated with the help of simple machines. These elements should be light enough to be handled by preferably two but no more than four workers. The assembly of the elements should be done with the help of simple machinery such as pulleys or non-mechanized cranes. The first designs for all prefabricated houses should be such as to acquaint householders with the new method. These characteristics show the importance of introducing new
techniques on the basis of existing techniques, resources and attitudes.
In conclusion it would appear that the primary condition for successful application of the principles of rationalization in construction is the continuity in the construction process and its constituent parts. Continuity, however, is foreign to the African construction industry, which by and large is just the sum of inputs of finances, professional contractors and building materials suppliers, provided on an ad hoc basis for individual projects. But in many African countries, where the public sector is predominant in house-building investments, governments
13 United Nations Economic and Social Council, "Prefabrication in Africa: Status and Problems", E/CN. 14/HOU/lOl, 15 January 1975.

can make a major contribution to the promotion of rationalization by planning and implementing continuous construction programmes. These programmes include both the construction of housing projects and the provision of serviced plots, and certainly in the larger population centres the present effective demands are sufficiently large to set up several parallel production lines. The "professional" construction industry can then enlarge its present modern role in shaping the built environment by gradually improving its performance through rationalization. However, this role will be limited to the larger population centres. In the smaller centres and in the rural areas, where demands are small and scattered, rationalization of the construction process as described is an irrelevant concept.
Intermediate Technology
Rationalization of a building process mainly relying on unskilled labour, constitutes one example of so-called intermediate technology. Basically intermediate technology is directed at developing and fostering productive techniques which, while making unprejudiced use of today's technological knowledge, are matched to the conditions in developing countries, such as supply and the cost of labour, the scarcity of investment funds, and the availability and cost of materials and non-human energy.
Some examples which can be quoted are: — The improvement of the water resistance of traditional mud blocks with waste products
from oil refineries. — The use of building blocks with a low percentage of cement (e.g., sandcrete). — Interlocking blocks of which walls can be constructed without mortar. — Improvement of constructions with stabilized earth. 4
— Modern calculation devices for construction in traditional materials. — Combination of traditional and modern building components (e.g., factory-made window
frames in houses constructed with "chica", and the use of cement-asbestos roofs). — Tools and devices for unskilled self-helpers. — Use of second-hand industrial equipment no longer used in Europe because of labour costs
there.
Intermediate technology can be used at different levels; At that of the rural and urban self-helpers; at that of the intermediate sector; at that of the small construction firm; and at that of the large firm, as well as that of the production of building materials and components. In all these sectors, there is ample scope for matching today's economical knowledge with the needs and circumstances now prevailing in African countries. Major efforts should be made for the development of intermediate technology.
Interaction between Traditional and Modern Construction
As explained in the preceding Sections the vast majority of the African people will continue to rely on traditional construction with a gradual increase of modern inputs of a varied nature. The different directions of such a development may be seen from the case-studies which are included in this publication.
For instance, in the description of the present settlements policy in Tunisia, it is shown how improved traditional building methods and materials can be successfully applied in a large-scale housing project. The traditional inputs resulted in a cost reduction of some 30 per cent as compared with the initial costs involved in the application of non-traditional techniques.
Also in the Lusaka squatters improvement programme, a form of interaction between traditional and modern construction is found. The programme builds on the traditional principles of self-help to be applied in a modern urban setting. Thus modern materials like cement, prefabricated steel doors and window frames and asbestos roof sheets are made available, and the individual participants in the scheme may choose to hire professional labour.
A noteworthy mixing of traditional and modern approach is also found in the squatter resettlement programme in Port Sudan. The original settlements have been developed by the people themselves who used the materials that they could find in the immediate surroundings, in this case waste wood from the docks. People's aspirations and resources have been fully recognized in the Government-guided resettlement programme. In this well-organized self-help effort the same materials have been used to rebuild the individual shelters, bu^ situated in a potentially modern urban environment.
74

These and many other examples apply to urban settlements; the description of the Bendama Valley in the Ivory Coast project refers to similar interaction in a rural setting, though in the context of the construction of a modern, large-scale, infrastructural work. But also village improvement as such is increasingly undertaken.
Interesting references in this respect can be made to the rural development programme in Tanzania, a country that has identified the development of its rural economy as its first priority: "It is therefore the villages which must be made into places where people live a good life; it is in the rural areas that people must be able to find their material well-being and their satisfaction. This improvement in village life will not, however, come automatically. It will come only if we pursue a deliberate policy of using the resources we have — our manpower and our land - to the best advantage. This means people working hard, intelligently, and together; in other words, in co-operation."14
The cornerstone of this development is the transformation of rural Tanzania, with its scattered peasant population living in temporary shelters, into permanent settlements, the Ujamaa villages, where on the basis of self-reliance people participate in building up their community. Government guidance is channelled through strong and closely co-operating political and administrative systems reaching into the villages. In a country relying so much on decentralized development in spite of its very limited resources in terms of communication facilities and trained manpower, the importance of such systems cannot be overestimated. Through these systems knowledge about the principles of village layout and construction can reach the villagers. Their experience in traditional construction of a non-permanent nature is but of limited value, and major innovations are called for regarding such aspects as: — The selection of appropriate sites, taking into consideration the existing physical environ
ment. — The layout of shelters on the basis of household activities. — The proper preparation of sites with particular emphasis on drainage problems. — The function and the proper construction of foundations and ground-floor slabs.
The manufacture of durable walling materials, including improved structure of bush poles plastered on both sides, sun-dried mud blocks, stabilized soil blocks, cement blocks and burnt bricks, the actual selection depending on the locally available raw materials. The proper use of roofing materials, mainly corrugated iron sheets, though burnt clay tiles may be developed on the basis of the widely-spread skill of pottery. The development of simple household devices and equipment, including chimneys, sanitary ware, cooking equipment, wash-basins, clean water storage, furniture and the like.
These and other aspects of improving settlements and shelters are explained in booklets, pamphlets and data sheets made available to the villagers by the Ministry of Lands, Housing and Urban Development. In addition, Government-assistance is being provided, or is under construction, through: — the organisation of seminars;
the operation of field construction units, composed of three or four technicians; and the construction of model shelters, finally some 50 units in each of the about 70 districts.
It is through measures of this nature and through the establishment of a local building materials industry — which should play an important supporting role — that the physical improvement of the rural environment is aimed at.
14 J.K.Nyerere, "Education for self-reliance" , D a i T-es-Sa\aam 1967.

CHAPTER 12. HOUSING FINANCE
Nearly everywhere and at all times the cost involved in the development of a site and the building of a house are such that they cannot be met by young people at the beginning of marital life.1'2 This holds true not only in modern urban situations but also in many traditional non-monetary societies. In the latter, members of the extended family, friends and other village people may have an active hand in the construction. Economically such a social obligation to supply mutual aid can be understood as a form of credit to the benefitting party: sooner or later he will be under obligation to render comparable services to others. Paid services, however, also exist in non-monetary societies. In some places specialists also exist there, who are paid in kind for some building jobs too difficult for the others to do. In a monetary economy the social right to be aided by others in house building, the social obligation to aidothers,is replaced by a system expressed in financial and legal terms of loans, debts and rents. A young couple or other people in need of a house can either rent a house, buy one, or have one built. If they want to be home-owners, in most cases their savings will not be sufficient for the whole investment and they will need a loan, for which they will have to accept obligations concerning repayment and the payment of interest. If they want to become tenants, they will get the use of a dwelling owned by another and have to pay rent which will help to cover amortization and interest. The possibility to become a tenant or to attract loans depends in the last resort on social conditions: the people concerned must be considered acceptable and credit worthy.
In a non-monetary society the cost of a house (in real terms, seizing the aforementioned opportunities by using labour and material in the building process instead of using these always scarce factors of production for other purposes) has to be in balance with the total means and the other needs of such a society. Certainly there normally exists a limit to the amount of material and labour to be supplied by society for housing its members.
In a monetary society, within the existing framework of productive capacity, ownership of lands, equipment, and the distribution of income, wealth and power, there is a limit to the amount of financial means that can be used for housing. This limit exists in terms of savings, income and the loan capacity of the person who wants to buy or have a house built. Within a — technically — sound financial system such a brake on personal investments keeps total investment (including that in housing) on a level that is compatible with the means of society as a whole. The existence of a large second-hand market of houses, of whatever age and at relatively low prices, facilitates the problems at least from the quantitative point of view in industrial countries.
In Africa today both approaches, the traditional and the monetary one, exist: the monetary one for the higher income groups in urban areas, and the 100 per cent traditional one still in more or less isolated other regions. Very large groups of the population are somewhere on the road progressing from the 100 per cent traditional approach to a 100 per cent monetary situation. In financial terms, the acute housing problems of the majority of the urban population are reflected in the almost general absence of facilities to obtain credit for housing partly because the people concerned have stepped out of the traditional system whereas modern monetary institutions so far served only the higher and middle income levels of the urban population.
Interest
A major distinction between the traditional and the monetary sectors concerns the calculation and charging of interest.3 In a monetary economy interest is charged because the investment of capital enables producers to get higher incomes. The rate of interest normally directs scarce capital funds into what are economically the most profitable investments. Whether such an automatism works satisfactorily in terms of comprehensive development in poor countries is often questioned. Additionally, in inflationary situations it is doubtful whether the rate of interest really acts as an optimalizing factor even in purely economic terms. The concept of the interest rate as the price of money seems to be rather new to African
Donnison, The Government of Housing, Hammondsworth, Middlesex, England, Penguin Books Ltd., 1967. United Nations Economic and Social Council, Economic Commission for Africa and German Foundations for Developing Countries, Some Major Issues in Financing of Housing in Kenya, (prepared by N.O. Jörgenson), E/CN.14/HOU/25, Addis Ababa, 1968. However, interest may also occur in a non-monetary economy as far as goods (e.g., foodstuffs) got from another in the present have to be paid back later with a greater quantity of the same goods.

conditions.4 The knowledge that the nominal5 rate of interest is a far from ideal instrument for steering purposes in general, and perhaps for housing in particular, may be a stimulus to develop economically feasible and socially acceptable systems of housing finance.
The impact on housing of the level of the rate of interest and of other loan conditions can be tremendous. The total amount of money that can be invested in a house for a certain family depends on:
(a) The income (level, regularity and other prospects); (b) the amount that can be saved out of this income during a certain period, and the disposable
savings; (c) the part of income that can be spent on annual expenses for housing (debt repayment,
maintenance, taxes in the case of home owners and rent in the case of tenants); (d) the level of the rate of interest; (e) the period of amortization of loans in the case of home owners and the period of
depreciation in the case of rental housing; and (f) the system of amortization or depreciation applied: instalment system or annuity system.
The higher the rate of interest and the shorter the amortization or depreciation period, the lower is the acceptable investment level for a house in terms of family income. The part of income that a family can spend on housing also exerts, of course, a decisive influence. In Table 12-1 it can be seen that a family with an annual income of 1,000 monetary units that can afford to spend annually 10 per cent of this income on housing, can buy a house costing 534 MU when the rate of interest is 12 per cent and the amortization period 10 years. With a rate of interest of 2 per cent and an amortization period of 20 years, the same household with the same income and also spending 10 per cent annually on housing could afford to have a house costing more than three times as much (1,648 MU).
Evidence suggests that renters are generally prepared to spend something in the region of 10-20 per cent of current income on rents when the market taken is a private, uncontrolled one.6 Owner-occupiers might then be — according to this source — expected to pay 5-10 per cent out of current income over and above this. It has to be questioned whether these figures hold true for the lowest income groups.
Table 12-1 has been calculated on the assumption that the household would be able to get a loan of 100 per cent of the value of the house. It applies also for rental housing. (The tables have been calculated on the assumption that repayment or rent is calculated with an annuity or flat rate system. The annual costs of maintenance, taxation and so forth are set at 1 per cent of the total investment for the house. With the aid of the formula, as given, figures for other situations can be calculated).
Amortization is the repayment of loans with interest. The repayment period, certainly in African countries, is considerably shorter than the lifetime of the house. Because of this, home owners have to meet considerable financial burdens during the first 10 to 15 years of the use of the house, after which the house may have become free of debt. Depreciation, diminution of value, is caused among other things by the wear and tear of the house. It is an element in the calculation of rent and should correspond with the lifetime of the house. There often is a tendency of housing managers to adapt rents to the shorter amortization period, thus bringing rents above the necessary economic minimum level.
United Nations Economic and Social Council, Economic Commission for Africa, Savings Mobilization in Developing African Countries, Paolo Mottura, E/CN.14/HOU/107, Addis Ababa, 1973. The nominal rate charged will differ from the real rate if the purchasing value of money changes in course of time. United Nations Economic and Social Council, Economic Commission for Africa, Review of Sources and Methods of Financing for Housing and Urban Development in Africa, E/CN. 14/HOU/64, Addis Ababa, 1970, p. 7.

Table 12-1 Maximum cost to be invested in a house, as a function of part of annual income used for housing and rate of interest
Annual income 1 000 (MU) monetary units Loan up to 100% of the cost of the houses
% of Loan; 100.00 Maintenance: 1.00 Amortization per.: 10.00
IH 2% 4% 6% 8% 10% 12% 5 412.11 375.11 342.77 314.40 289.44 267.40
10 824.22 750.23 685.55 628.81 578.88 534.80 15 1 236.33 1 125.35 1 028.32 943.22 868.32 802.20 20 1 648.44 1 500.47 1 371.10 1 257.62 1 157.77 1 069.60 25 2 060.55 1 875.59 1 713.87 1 572.03 1 447.21 1 337.01 30 2 472.66 2 250.71 2 056.65 1 886.44 1 736.65 1 604.41
IH = % of Revenue spent for Housing.
% of Loan: 100.00 Maintenance: 1.00 Amortization per.: 15.00
4; IH 2% 4% 6% 8% 10% 12%
5 569.31 500.29 442.62 394.22 353.42 318.82 10 1 138.62 1 000.58 885.24 788.45 706.84 637.65 15 1 707.93 1 500.88 1 327.87 1 182.68 1 060.26 956.48 20 2 277.24 2 001.17 1 770.49 1 576.91 1 413.68 1 275.31 25 2 846.55 2 501.47 2 213.11 1.971.14 1 767.11 1 594.14 30 3 415.86 3 001.76 2 665.74 2 365.37 2 120.53 1 912.96
IH = % of Revenue spent for Housing
% of Loan: 100.00 Maintenance: 1.00 Amortization per.: 20.00
IH 2% 4% 6% 8% 10% 12% 5 702.67 598.21 514.48 447.01 392.28 347.51
10 1 405.34 1 196.43 1 028.97 894.03 784.56 695.02 15 2 108.02 1 794.65 1 543.45 1 341.05 1 176.84 1 042.54 20 2 810.69 2 392.86 2 057.94 1 788.07 1 569.12 1 390.05 25 3 513.37 2 991.08 2 572.42 2 235.09 1 961.40 1 737.57 30 4 216.04 3 589.29 3 086.91 2 682.11 2 353.68 2 085.08
IH = % of Revenue spent for Housing
% of Loan: 100.00 Maintenance: 1.00 Amortization per.: 25.0C
IH 2% 4% 6% 8% 1-% 12% 5 816.72 675.56 566.72 482.25 416.08 363.63
10 1 633.44 1 351.13 1 133.44 964.51 832.16 727.27 15 2 450.16 2 026.69 1 700.16 1 446.77 1 248.25 1 080.90 20 3 266.88 2 702.26 2 266.88 1 929.03 1 664.33 1 454.54 25 4 083.60 3 377.73 2 833.60 2 411.29 2 080.41 1 818.18 30 4 900.32 4 053.39 3 400.33 2 893.55 2 496.50 2 181.81
IH = % of Revenue spent for Housing

% of Loan; Maintenance: Amortization per.
100.00 1.00
30.00
IH 2% 4% 6% 8% 10% 12% 5 914.91 737.13 604.96 505.93 430.74 372.73
10 1 829.82 1 474.27 1 209.93 1 011.86 861.48 745.46 15 2 744.74 2 211.40 1 814.90 1 517.79 1 292.22 1 118.20 20 3 659.65 2 948.54 2 419.87 2 023.72 1 722.96 1 490.93 25 4 574.57 3 685.67 3 024.84 2 529.66 2 153.70 1 863.67 30 5 489.48 4 422.81 3 629.81 3 035.59 2 584.44 2 236.40
IH = % of Revenue spent for Housing
% of Loan; 100.00 Maintenance 1.00 Amortization per.; 35.00
IH 2% 4% 6% 8% 10% 12% 5 999.95 786.44 633.12 521.90 439.79 377.88
10 1 999.91 1 572.88 1 266.24 1 043.80 879.58 755.76 15 2 999.86 2 359.33 1 899.36 1 565.70 1 319.38 1 133.64 20 3 999.82 3 145.77 2 532.48 2 087.61 1 759.17 1 511.52 25 4 999.77 3 932.21 3 165.60 2 609.51 2 198.96 1 889.40 30 5 999.73 4 718.66 3 798.72 3 131.41 2 638.76 2 267.28
IH = % of Revenue spent for Housing
% of Loan; 100.00 Maintenance: 1.00 Amortization per.: 40.00
IH 2% 4% 6% 8% 10% 12% 5 1 073.98 826.12 653.92 532.70 445.39 380.79
10 2 147.96 1 652.25 1 307.84 1 065.41 890.79 761.59 15 3 221.94 2 478.37 1 961.77 1 598.12 1 336.19 1 142.39 20 4 295.92 3 304.50 2 615.69 2 130.82 1 761.58 1 523.18 25 5 369.90 4 130.62 3 269.61 2 663.53 2 226.98 1 903.98 30 6 443.88 4 956.75 3 923.54 3 196.24 2 672.38 2 284.78
IH = % of Revenue spent for Housing
% of Loan: 100.00 Maintenance: 1.00 Amortization per.: 45.00
IH 2% 4% 6% 8% 10% 12% 5 1 138.70 858.18 669.33 540.03 448.86 382.44
10 2 277.40 1 716.37 1 338.67 1 080.06 897.73 764.89 15 3 416.10 2 574.55 2 008.01 1 620.09 1 346.60 1 147.34 20 4 554.81 3 432.74 2 677.35 2 160.12 1 795.47 1 529.79 25 5 693.51 4 290.92 3 346.69 2 700.15 2 244.34 1 912.24 30 6 832.21 5 149.11 4 016.03 3 240.18 2 693.21 2 294.69
IH = % of Revenue spent for Housing

% of Loan; 100.00 Maintenance: 1.00 Amortization per.: 50.00
IH 2% 4% 6% 8% 10% 12% 5 1 195.50 884.17 680.78 545.00 451.02 383.38
10 2 391.01 1 768.34 1 361.57 1 090.00 902.04 766.77 15 3 586.52 2 652.51 2 042.36 1 635.00 1 353.06 1 150.15 20 4 782.03 3 536.68 2 723.15 2 180.00 1 804.09 1 533.54 25 5 977.54 4 420.85 3 403.94 2 725.00 2 255.1 1 1 916.93 30 7 173.05 5 305.02 4 084.72 3 270.00 2 706.00 2 300.31
IH = % of Revenue spent for Housing
Formula applied Ij c = — x annt)r +^-
I l c i n v e s t m e n t i n l a n d a n d c o n s t r u c t i o n L part of investment covered by loan Rh part of annual income (revenue) spent on housing annt)r annuity dependent on period of amortization and rate of interest m annual cost of maintenance and taxes, as % of 1^ c
(L = 1 and m = 0.01)
Table 12-11 Maximum cost to be invested in a house, as a function of part of annual income use for housing and rate of interest
Annual income 1 000 (MU) monetary units Loan up to 70% of the cost of the house
% of Loan: 70.00 Maintenance: 1.00 Amortization per.: 10.00
IH 2% 4% 6% 8% 10% 12% 5 568.64 519.19 475.70 437.36 403.48 373.44
10 1 137.28 1 038.38 951.40 874.73 806.96 746.88 15 1 705.93 1 557.57 1 427.10 1 312.09 1 210.44 1 120.33 20 2 274.57 2 076.76 1 902.81 1 749.46 1 613.92 1 493.77 25 2 843.21 2 595.95 2 378.51 2 186.83 2 017.40 1 867.21 30 3 411.86 3 115.14 2 854.21 2 624.19 2 420.88 2 240.66
IH = % of Revenue spent for Housing
% of Loan: 70.00 Maintenance: 1.00 Amortization per.: 15.00
IH 2% 4% 6% 8% 10% 12% 5 775.46 685.31 609.20 544.77 490.04 443.35
10 1 550.92 1 370.63 1 218.41 1 089.55 980.08 886.70 15 2 326.38 2 055.95 I 827.62 1 634.33 1 470.13 1 330.05 20 3 101.84 2 741.27 2 436.82 2 179.10 1 960.17 1 773.41 25 3 877.30 3 426.59 3 046.03 2 723.88 2 450.22 2 216.76 30 4 652.76 4 111.91 3 655.24 3 268.66 2 940.26 2 660.11
IH = % of Revenue spent for Housing

% of Loan: Maintenance: Amortization per.
70.00 1.00
20.00
IH 2% 4% 6% 8% 10% 12% 5 946.79 812.91 703.93 615.03 542.17 482.08
10 1 893.59 1 625.82 1 407.87 1 230.06 1 084.34 964.17 15 2 840.38 2 438.73 2 111.80 1.845.09 1 626.51 1 446.26 20 3 787.18 3 251.65 2 815.74 2 460.12 2 168.68 1 928.35 25 4 733.97 4 064.56 3 519.67 3 075.16 2 710.85 2 410.44 30 5 680.77 4 877.47 4 223.61 3 690.19 3 253.02 2 892.53
IH = % of Revenue spent for Housing
% of Loan: 70.00 Maintenance: 1.00 Amortization per.: 25.00
IH 2% 4% 6% 8% 10% 12% 5 1 090.41 912.26 772.09 661.59 573.93 503.77
10 2 180.82 1 824.53 1 544.19 1 323.18 1 147.87 1 007.55 15 3 271.22 2 736.80 2 316.29 1 984.77 1 721.80 1 511.33 20 4 361.63 3 649.07 3 088.38 2 646.37 2 295.74 2 015.11 25 5 452.04 4 561.34 3 860.48 3 307.96 2 869.68 2 518.89 30 6 542.45 5 473.61 4 632.58 3 969.55 3 443.61 3 022.67
IH = % of Revenue spent for Housing
% of Loan: 70.00 Maintenance: 1.00 Amortization per.: 30.00
IH 2% 4% 6% 8% 10% 12% 5 1 211.97 990.47 821.63 692.72 593.43 515.99
10 2 423.95 1 980.94 1 643.27 1 385.44 1 186.86 1 031.98 15 3 635.92 2 971.41 2 464.90 2 078.16 1 780.29 1 547.97 20 4 847.90 3 961.88 3 286.54 2 770.88 2 373.73 2 063.97 25 6 059.87 4 952.35 4 108.17 3 463.60 2 967.16 2 579.96 30 7 271.85 5 942.81 4 929.81 4 156.32 3 560.59 3 095.93
IH = % of Revenue spent for Housing
% of Loan: 70.00 Maintenance: 1.00 Amortization per.: 35.00
IH 2% 4% 6% 8% 10% 12% 5 1 315.73 1 052.54 857.90 713.65 605.43 522.89
10 2 631.47 2 105.78 1 716.80 1 427.30 1 210.90 1 045.73 15 3 947.20 3 157.62 2 573.70 2 140.95 1 816.35 1 666.68 20 3 262.94 4 210.16 3 431.60 2 854.60 2 421.81 2 091.67 25 6 578.67 5 262.70 4 289.51 3 568.25 3 027.26 2 614.47 30 7 894.41 6 313.24 5 147.41 4 281.90 3 632.71 3 137.36
IH = % of Revenue spent for Housing

% of Loan: Maintenance: Amortization per.
70.00 1.00
40.00
IH 2% 4% 6% 8% 10% 12% 5 1 404.92 1 102.13 884.59 727.77 612.86 526.80
10 2 809.85 2 204.27 1 769.18 1 455.55 1 225.76 1 053.60 15 4 214.78 3 306.40 2 653.78 2 183.33 1 838.65 1 530.40 20 5 619.70 4 408.54 3 538.37 2 911.11 2 451.53 2 107.20 25 7 024.63 5 510.68 4 422.97 3 638.89 3 064.41 2 634.00 30 8 429.56 6 612.81 5 307.56 4 366.67 3 677.30 3 160.80
IH = % of Revenue spent for Housing
% of Loan: 70.00 Maintenance: 1.00 Amortization per.: 45.00
IH 2% 4% 6% 8% 10% 12% 5 1 482.06 1 141.97 904.31 737.34 617.48 529.01
10 2 964.12 2 283.95 1 808.63 1 474.68 1 234.96 1 058.02 15 4 446.19 3 425.93 2 712.95 2 212.02 1 852.45 1 557.04 20 5 928.25 4 567.90 3 617.26 2 949.36 2 496.93 2 116.05 25 7 410.32 5 709.88 4 521.58 3 686.71 3 087.42 2 645.07 30 8 892.38 6 851.86 5 425.90 4 424.05 3 734.90 3 174.08
IH = % of Revenue spent for Housing
% of Loan: 70.00 Maintenance: 1.00 Amortization per.: 50.00
IH 2% 4% 6% 8% 10% 12% 5 1 549.12 1 174.11 918.93 743.82 620.33 530.20
10 3 098.25 2 348.23 1 837.86 1 487.65 1 240.67 1 060.53 15 4 647.38 3 522.35 2 756.79 2 231.47 1 861.00 1 590.80 20 6 196.50 4 696.47 3 675.72 2 975.30 2 481.34 2 121.07 25 7 745.63 5 870.59 4 594.65 3 719.13 3 101.68 2 661.34 30 9 294.76 7 044.71 5 513.59 4 462.95 3 722.01 3 181.61
IH = % of Revenue spent for Housing
Formula applied Ii)C = * — annUl +^-
I1)C investment in land and construction L part of investment covered by loan Rh part of annual income (revenue) spent on housing annt)r annuity dependent on period of amortization and rate of interest m annual cost of maintenance and taxes, as % of 1^ c
(L = 0.7 and m = 0.01)
Table 12-11 has been composed at the assumption that the household would get a loan only for 70 per cent of the value of the house.

Main problems
The problems met in Africa in the field of housing finance are; 1. Loans for housing are mostly only available to middle and higher income groups, but there
are efforts to change this situation.7
2. Repayment periods are short in connection with the technical life-span of the house (see Tables 12-1, 12-11). These periods, indeed, are considerably shorter than in many Western European countries.
3. In situations with communal land-ownership, the supply of mortgage loans is difficult because of lack of collateral for the lender.
4. The existing financial institutes which have been set up on lines corresponding to these of institutes in Western countries, both in their role of receiver of savings and as a lending body, have so far not been directed, or only to a very small extent, to the low-income majority.
5. Schemes set up with a starting capital meant to be used as revolving funds have often lost momentum completely as a consequence of inflation.
6. Savings and loan systems serving people needing site and service schemes, aided self-help schemes, and similar ideas by and large still have to be developed.
7. With the considerable increase in building activities which must occur to meet housing needs it will be necessary to establish or refine methods and procedures for the financing of the infrastructure (roads, schools, community building and so forth).
This situation cannot be improved with pious recommendations. But over the years a number of interesting approaches can be noticed. For example, a beginning has been made on a deeper analysis of savings and loan problems on the African Continent in general8
It is not unwillingness of the side of the lending institutes that has induced them to concentrate on higher income groups and on relatively short repayment periods. This attitude reflects the risks connected with the supply of long-term loans for housing. The number of people in Africa, with, in bankers' terms, stable incomes is still limited. The economic prospects of countries depending considerably on developments on the world markets for raw materials and agricultural products are known to alternate sharply. Moreover, life expectancy is shorter and the risks of revolutionary changes are greater than in older and more settled countries. Also in the latter countries housing loans to owner-occupiers are seldom supplied to people with low incomes. Since banks and financial institutes in Africa, including those specialized in housing finance, are mostly modelled on examples from the older industrial nations, these institutes are not equipped to deal with the urgent problems of housing finance in countries where 80 per cent of the population falls in income categories below the so-called low income groups in richer countries.
It may be recognized that short repayment periods as prevailing in Africa may stimulate savings, will make money invested in housing circulate faster, and thus will mobilize more capital for housing.
Role of Financial Institutions
For various purposes it is useful to distinguish between the capital needed for the construction of the house and that required for the servicing of the land and community facilities. The home owner has to arrange more or less directly for the first-mentioned category and part of the second: in some way he has to pay for the servicing of his plot.
However, estate development agencies and governments generally have to supply the capital for community facilities and often for a part of the servicing of the plots. Both of these sectors can tap the capital market through other channels than the (future) owner-occupiers. Part of this invested capital will be returned directly by the owner-occupiers, and a part may be paid back over a long period in various ways. In this connection attention will now be given first to the financing of the construction and the serviced land as will have to be arranged by the owner-occupier.
United Nations Economic and Social Council, Economic Commission for Africa, Some Aspects of the Housing Mortgage Market in African Countries, E/CN.14/HOU/89, Addis Ababa, 1971. United Nations Economic and Social Council, Economic Commission for Africa, Savings Mobilization in Developing African Countries, op. cit.

Housing finance9 has two main aspects: On the one hand, the collection of new savings and the attraction of capital from other sources, and on the other hand, the transformation of these means into funds to be put at the disposal, on reasonable conditions, of people and agencies who want to rent or build houses.
Central banks as well as commercial banks10 in Africa have so far concentrated their operations on large-scale governmental and private transactions. Such institutions have paid specific attention neither to housing finance nor to the collection of savings in small amounts as generated by people in the low-income brackets. While commercial banks in high-income countries today also attract clients amongst the numerous groups of salary and wage earners, such a development cannot for many decades be expected in African low-income countries. With the present organization and staffing of commercial banks, the cost of handling operations for people with very low incomes would be far too expensive. Therefore it will be necessary to rely on other types of institutions like savings banks, credit unions, and specialised agencies for low-income housing. The network needed to collect savings from low-income people and to serve this group with other financial transactions still needs considerable development in various ways.
Post Office Savings Banks, as installed in many countries during Colonial rule, have the advantage that they administer a very wide branch system, also in the rural areas where no other banking facilities are readily available. This type of bank, moreover, collects financial resources that otherwise would probably have been spent on consumption goods or hoarded. A major drawback of Post Office Savings Banks is that they tap money from local, low-income sources, and then invest it mostly in Government bonds. Until now these banks have not provided credit facilities at the local level. However, two countries,Algeria and Swaziland, have already changed their postal banks into institutions that also lend at the iocal level. Comparable changes are under preparation in Benin, Ghana, Mali, Nigeria and Zambia.
Credit Unions, growing rapidly in Africa, attract as well as supply money at the local level. However, this type of institute lacks the central co-ordination, financial know-how and investment opportunities for excess savings as available in the organization of post office banks and other types of savings banks. The members of the National Association of Credit Unions existing in many countries are not acting as financial intermediaries (as "bankers bank") to their local members.1 oaThe success of the credit union movement in Africa is ascribed to the traditional co-operative spirit which is common to many African populations.11'12 Credit Unions can be considered as a sort of formalization of this tradition which had already for a long time led to numerous indigenous savings and mutual aid associations, such as the "ekub" in Ethiopia, "sanduk" in Sudan, "esusu" in Nigeria, and "tontine" in French-speaking West Africa: "These associations convene on fixed dates and all the members then pay a specified sum. The whole amount collected is given to one of the members, who is either drawn by lot, chosen according to a list of priority, or selected during the meeting itself after a study of his needs and requests. This person will then reimburse the sum received by paying his regular contribution to the associations for the time needed to cancel the debt. Normally no interest is charged on these loans or paid on the savings contributed by each member." The fact that this latter type of organization has not been swept away, or even weakened, by such strong disruptive phenomena as industrialization, migration and urbanization, led Mottura to the conclusion that other financial intermediaries have not followed the right approach towards African savings behaviour and that the task of integrating indigenous associations into the "organized" financial sector should be undertaken.
Many data concerning financial institutions in Africa as given in this Chapter are from United Nations Economic Commission and Social Council, Economic Commission for Africa, Savings Mobilization in Developing African Countries, op. cit.
I 0 United Nations Economic and Social Council, Economic Commission for Africa, Review of Sources and Methods of Financing for Housing and Urban Development in Africa, E/CN. 14/HOU/64, 1970.
1 0 d T h e r o l e o f c r e d i t u n i o n s i n t h e f i e l d o f h o u s i n g i n C a n a d a a n d t h e U S A i s d e s c r i b e d i n United Nations Economic and Social Council, Economic Commission for Africa and German Foundation for Developing Countries, Credit Unions: A Basis for Obtaining Funds for Housing, E/CN.14/HOU/23, Addis Ababa, 1968.
II United Nations Economic and Social Council, Economic Commission for Africa, Savings Mobilization in Developing African Countries, op. cit., p. 45.
1 2 United Nations Economic Commission for Africa, Indigenous Savings Associations in Eastern Africa and the Mobilization of Domestic Savings, (M.R. Jellieve), E/CN. 14/ HOU/21, 1968.

The drawbacks connected with the institutions just described, both the "modern organized" and the "traditional" ones in their present form, do not occur with still another category of institutions, The Savings and Credits Banks. In addition to Algeria and Swaziland where such banks have developed out of the old savings banks, such banks have been established in Burundi, Egypt, Rwanda, and Zaire, while new savings banks are reported to be established in the Central African Republic, Ethiopia, Lesotho and Sudan. Such banks promote household savings, collect deposits, and grant credits to small-scale business in all sectors of the economy. Savings Banks are national in scope13 and non-specialized; their eventual specialization depending upon the local economic and social environment and consisting more in the choice of potential customers than in the selection of specific banking operations. Their essential function should be that of promoting social and economic welfare in the social strata where such need is most felt. Although this type of bank is a recent phenomenon in Africa, their growth rate has been good. The potentials of such a system have also been characterized in another UNECA report:14 "Since in all savings matters safety and availability are of the utmost importance, a nation-wide Savings Bank System working under Government guarantee could play a very important part in the financial system. For optimal results such a Savings Bank system should have an adequate branch network in rural as well as urban districts. Moreover, it should be able in due time, and subject to adequate supervision, to provide agricultural, home-ownership, and personal loans, as well as credits to small and medium-sized business enterprises."
However, in the end it is not the name that matters but the way of functioning. There is clearly a need for savings and loan institutions attracting savings and supplying credits locally in a more or less personal context. But which local member banks, or local offices, can fall back on expert knowledge, where needed, for investments, or additional credit facilities at a central organization? Furthermore, contractual savings schemes should be made possible within the context of such banks. The ideal system would be to incorporate the forceful traditional indigenous savings and loan associations. The question of what interest should be charged will be dealt with later. The fundamental question not dealt with in the comprehensive study of Mottura15 concerning housing finance is whether, in addition to such a type of savings and loan bank, there should be other institutions rendering savings and loan services locally for people to finance their houses.
Building Societies already operate in a number of African countries. (Botswana, Ghana, Kenya,16 Liberia, Mali, Nigeria, Swaziland and Zambia). Principally such institutions attract savings and enable their depositors not only to withdraw their savings but also to receive an additional mortgage loan with which to buy a house or have one built. Where saving for home-ownership is a strong incentive building societies could act as a driving force for saving mobilization although so far they have served only middle and higher-income groups. These institutions are, in fact, modelled on examples from such countries as England and Germany. In order to be able to supply mortgage loans, building societies certainly use their deposits, but rely heavily on the issue of bonds bought on the market solely for investment purposes. In their present set-up this type of institution is not equipped to deal with housing finance for the mass of people with low and very low incomes.17
Most of the institutions discussed so far (Post Office Savings Banks, Credit Unions, Indigenous Savings and Mutual Aid Associations, Savings and Credit Banks) attract their capital from the savings of their participants. Building Societies do the same but also attract loan capital from other sources. Attention has to be given also to a number of other sources. Pensioners' funds, social security funds, providence funds, and insurance companies all collect savings also from people with moderate and low incomes. Such savings constitute a considerable and for many decades increasing potential source for investment capital for housing. Especially pensioners' funds and life insurance companies dispose of capital for long-term investment such as
13 See also United Nations Economic and Social Council, Economic Commission for Africa, Mobilization of Domestic Savings in West Africa, E/CN.14/HOU/84, Addis Ababa, 1971.
14 United Nations Economic and Social Council, Economic Commission for Africa and German Foundation for Developing Countries, Mobilization of Domestic Savings, op. cit.
15 United Nations Economic and Social Council, Economic Commission for Africa, Savings Mobilization in Developing African Countries, op. cit.
1 6 United Nations Economic and Social Council, Economic Commission for Africa, The East African Building Society — A Case History on Establishment and Progress, E/CN.14/ HOU/65, Addis Ababa, 1970.
17 For technical information concerning building societies see United Nations Economic and Social Council, Economic Commission for Africa and German Foundation for Developing Countries, The Role of Savings and Loan Associations (Building Societies) in Mobilizing Savings for Housing, E/CN.14/HOU/26, Addis Ababa, 1968.

housing. So far, the governing bodies of such institutions in Africa have been reluctant to devote a considerable part of such resources to housing, which is quite contrary to policies pursued elsewhere by such agencies. On various occasions recommendations have been made to use such funds also in Africa for housing.1 8.19.20.21 But a positive change in this attitude has been occurring recently.22
In Senegal the French system of obligatory savings by employers in the form of a percentage of the wage sum is applied, such a system being considered better than workers' housing directly provided by employers.2 3
In the field of rural housing a considerable source of finance, in number of advances if not the aggregate amount of capital involved, is that of suppliers' credit locally. Thus it is frequently the case that the purchase price of corrugated iron roofing, for example, includes an element of interest because payment will be made over a period of several months. In a small survey in Uganda it was found that about half of a group of owner-occupiers working in a town had obtained some kind of credit or instalment payment on building materials. This is, of course, likely to be more important where the builder has regular paid employment as well as cash income from crops, since there is more likelihood of full repayment in this case. The major items of expenditure on a house built in rural or peri-urban areas, other than the labour element, lend themselves to this type of credit system when the type of construction is a modification of traditional methods. The types of materials involved are corrugated rion (asbestos) sheeting, roof and wall poles, doors and windows, cement etc.24
Need for Specialized Institutions for Housing Finance besides a Saving and Credit Banking System?
Various considerations have to be taken into account in connection with the basic question of whether, given the development of a Savings and Credit Bank System as just discussed, special institutions should also be created with branches at the local level for the financing of low-income housing. In this connection, there are seven important points to be considered: 1. For this type of housing finance specific approaches and know-how are required. Actually,
neither institutions like Savings and Credit Banks nor building societies possess such knowledge.
2. Because of the limited savings capacity on the one hand and the cost of operation on the other, the inclusion in a Savings and Credit Banks System of saving and loaning for housing appears an attractive solution. By reason of its local roots — also in distant places — Savings and Credit Banks will be in the position to judge the economic capacities of people wanting housing finance.
3. The question has to be answered whether the supply of housing loans would not exhaust the lending capacity of the Savings and Credit Banks. In this connection, it should be stressed that because of the low income, the need for self-help and the scarcity of funds, the size of individual loans will in any case have to be kept limited: perhaps to something in the order of 40 per cent of the cost of a modest house, which means that 20 per cent will have to be saved beforehand and 40 per cent may be in the form of self-help labour.
18 United Nations Economic and Social Council, Economic Commission for Africa and German Foundation for Developing Countries, Report of the Regional Meeting on Technical and Social Problems of Urbanization with Emphasis on Financing of Housing, E/CN.14/4501, E/CN.14/HOU/40, Addis Ababa, 1969, par. 221-23.
1 9 United Nations Economic and Social Council, Economic Commission for Africa, Review of Sources and Methods of Financing for Housing and Urban Development in Africa, E/CN. 14/HOU/64, Addis Ababa, 1970, par. 109-12.
20 United Nations Economic and Social Council, Economic Commission for Africa, Report of the East African Sub-Regional Meeting on Specific Aspects of Housing Finance, E/CN. 14/ 485, E/CN.14/HOU/75, Addis Ababa, 1970, par. 94.
2 1 United Nations Economic and Social Council, Economic Commission for Africa, Report of the West African Sub-Regional Meeting on Specific Aspects of Housing Finance, E/CN. 14/ 530, E/CN.14/HOU/90, Addis Ababa, 1971, par. 79-2.
22 Economic Commission for Africa, Secretariat Sources. 23 United Nations Economic and Social Council, Economic Commission for Africa, Review of
Sources and Methods of Financing for Housing and Urban Development in Africa, op. cit. par. 46.
24 United Nations Economic and Social Council, Economic Commission for Africa, Review of Sources and Methods of Financing for Housing and Urban Development, op. cit., par. 47.
86

4. As far as additional national or international seed capital might become available, such capital could be channeled to the local branches through the National Savings and Credit Bank Organization or through a specialized State Housing Bank. (This type of institution will be discussed later). Such a State Housing Bank should co-operate closely with a National Savings and Credit Bank Organization.
5. Other potential suppliers of loans for housing like social security funds, pensioners' funds and life insurance companies might also make use of the local know-how of Savings and Credit Banks.
6. Savings and Credit Banks could very well include contractual savings for housing schemes in their range of services.
7. As far as know-how about building techniques and operations are concerned, the regional or local Savings and Credit Banks should arrange for close co-operation with self-help specialists, people like community workers in charge of site and services schemes, housing co-operatives and regional or local housing authorities.
Altogether it can be concluded that Savings and Credit Banks could very well have a major role in the financing of low-income housing. Certainly at this moment easy ready-made solutions for such functioning are not available, and much creative work will have to be done and experiments be made concerning the co-operation with specialists in charge of self-help, site and service schemes, and similar activities. The amount of the loan, the moment at which the loan or part of it should be made disposable and whether the loan should be supplied in money or in building materials are just some of the questions needing further consideration.
In this respect lessons can still be learned from the Ghanaian roof loan scheme, a type of scheme that could be very well included in the housing loan facilities to be supplied by a co-ordinated system of Savings and Credit Banks. This type of loan is an excellent example of how the amount of individual loans can be kept within operational limits, from the viewpoint of both the borrower and the lending institutions. Of course, the need to keep the amount of individual loans limited can be met in other ways: for instance, by first only supplying loans for small houses, and then providing loans later for extensions.
National Housing Banks
National Housing Banks fulfil important functions in Norway and Brazil. In Africa, a National Housing and Building Bank has been established in Liberia as a Special Fund Project. Also with UN assistance, a National Housing Bank has been set up in Tanzania in co-operation with the Norwegian International Development Agency ; and a proposal to establish such a bank has been accepted in principle in Sierre Leone. In Tunisia a housing bank started functioning in 1974. Also in Kenya such an institution is under implementation. Other countries where the establishment of housing banks and funds has taken place are Botswana, Egypt, Ethiopia, Gabon, Ghana, Ivory Coast, Libya, Nigeria, Senegal, Somalia, Togo and Zambia.2 5 Although some of these institutions in the different countries do not always carry the title of "Housing Bank", their operations are of the same character.
According to a report from the Economic Commission for Africa,26 the objective of a National Infrastructural and Housing Bank "... would be to act as the focal point for the initial receipt, co-ordination and use of capital to be channelled into mortgage operations by a distribution of capital to the mortgage institutions ... It would also have the duty of dealing on behalf of Government with international institutions already engaged or which will become engaged in mortgage work, e.g., the African Development Bank and the proposed International Housing Finance Corporation."
The feasibility and the role to be performed by such an institution have to be considered in connection with the overall organization of the financial network in a country. The most important part of the capital for housing will have to be provided by the people to be housed. Saving systems could be arranged for by a network of Savings and Credit Banks. A second network only for housing finance beside that emerging already from Savings and Credit Banks would not be the most economical solution. Thus a National Housing Bank would have to work at the local level through local institutions like Savings and Credit Banks. Whether it should deal directly with the latter ones, or indirectly through a National Savings and Credit Banks
Economic Commission for Africa, Secretariat Sources. 26 United Naiions Economic and Social Council, Economic Commission for täncdi, Establish
ment and Development of Housing Banks and their Role in African Countries, E/CN.14/ HOU/85, Addis Ababa, 1972. See also: United Nations Economic and Social Council, Economic Commission for Africa, Principles and Draft Model Law Towards Establishment of Housing Banks in Africa, E/CN.14/HOU/106, Addis Ababa, 1973.

Organization, needs careful consideration in connection with the existing or emerging financial framework of a country. It might also be considered to incorporate the services to be given to future home owners by a National Housing Bank directly in a National Savings and Credit Banks organization. National Housing Banks, or functionally comparable national institutes, may serve also in connection with the provision of capital for rental housing projects, for technical infrastructure, and for community facilities. Also they might play a role concerning the direction of capital from pensioners' funds, social security institutions and insurance companies into housing and related facilities. Furthermore, such an organization could have a role in connection with mortgage insurance and the creation and safeguarding of a secondary mortgage market. Moreover, such an organization could — in co-operation with other financial authorities — handle the attraction and distribution of capital from international sources.
Where and when loans are needed on a larger scale than for individual owner-occupiers, such as for rental housing projects and for roads and community facilities for estate development and local governments, other funds will have to be tapped besides those of individual savers. A National or State Housing Bank could act here as an intermediary or catalyst to the capital market and to social security funds, insurance companies and similar activities. A State Housing Bank might act as an intermediary in this respect because of its specialist knowledge of the housing sector.
Insurance
An insurance system to creditors guaranteeing them the amortization and payment of interest when a debtor was unable to meet his obligations can reduce the rate of interest somewhat. Such systems exist, e.g., in the United States and in the Netherlands. IA the United States the system is self-supporting, because a certain fee is charged to all debtors covered by the scheme. In the Netherlands the system works with the aid of the Central and Local Governments. Practically no losses have been suffered so far. The feasibility of such systems in African conditions should be studied thoroughly. A well arranged secondary mortgage market exists in Denmark, facilitating the selling and buying of existing mortgage loans which in that way become more liquid assets. Here again the feasibility of such an approach for Africa could well be studied.
International Sources
The attraction of capital from international sources has already been discussed many times in UN papers on housing finance. This item can only be handled by paying full respect to all the aspects connected with encouraging foreign investment capital for various purposes, not only for housing. The amount of foreign capital that can be absorbed by a country depends on many factors, such as the rate of interest, the timing of repayments, the effects on earning, and the paying capacity of the country. The lack of capital for housing certainly does not mean automatically that a country should increase its foreign debt. Everything depends on the country's condition on the one hand and future economic prospects on the other; but discussion of these more general economic aspects falls outside the scope of this survey. So far the use of foreign capital for housing has been discussed in terms of seed capital to be employed as revolving funds and as catalysts for the development of African housing finance institutes, and in such a limited context the attraction of foreign capital for housing can certainly be defended.27
The difficult question whether, and on what conditions, supply of international capital for housing on a considerably larger scale would be feasible, or perhaps necessary has not so far received attention, and so remains open for adventurous research workers and policy makers. According to a UN seminar (1973) on non-profit housing organizations,28 sources of credit including government, governmental financial institutions and overseas financial assistance are limited and a country must not rely too much on them. The source of money that can make a substantial contribution to the solution of the housing problem lies in the savings of the masses.
27 United Nations Economic and Social Council, Economic Commission for Africa and German Foundation for Developing Countries, Use of External Aid in Housing, E/CN.14/ HOU/28, Addis Ababa, 1968, par. 24.
28 United Nations, Department of Economic and Social Xüzixs, Non-Profit Housing Associations, ESA/OTC/SEM/75/2, New York, 1975.

"Intermediate technology" also needed in the realm of housing finance
Because of the widely differing conditions, also for the development of housing finance, the copying of methods developed in high-income countries will be far from sufficient for African countries,29 because the overall scarcity of capital demands that much greater emphasis must be put on the savings of people for housing. The need for low-cost housing means that the amount of loan per house will be limited. All this shows that the cost of the organization of financial institutes in connection with total turnover cries for unorthodox solutions. Other important aspects are the size of credits in relation to the total cost of the house, the form in which loans are supplied whether in money or in material, and the collateral in connection with African forms of land ownership.
Whereas in some Western countries loans for home ownership are, or at times have been, supplied covering 100 per cent of the value of the site and the house, such solutions certainly will not prove feasible in Africa today. Since capital is scarce and people should be made to understand that in order to be housed they will have to make considerable personal efforts, loans should only be made to people who can themselves provide an important part of the capital needed, in the form either of savings or of labour in the case of self-help. Based on the size of the needs, it will be better to supply many small loans enabling people to build the first part of their houses, or to expand an existing house, than to give fewer large loans to a limited number of households.
Current examples of housing finance are quite in accordance with this principle. In a large-scale village reconstruction project in Egypt, with a maximum cost set for the house at £E 350, the maximum amount of loan is set at 60 per cent. A down payment of 10 per cent has to be contributed by participants before and during construction, self-help efforts are provided by the participants covering 20 per cent of the total cost, and 10 per cent is covered by a direct subsidy from Government. The period of repayment is set at 25 years and the rate of interest on the loan at 1.5 per cent.
Interesting developments are also reported from Ivory Coast30 where "a formula was arrived at that could be of great value in any national programme". A credit society for the improvement of rural housing (Societe de Credit ä l'amelioration de l'habitat rural) started a programme in 1966 on a limited scale. A substantial amount of the necessary funds has to be provided by the prospective builder, and only money for materials is provided. The terms are short, as in theory, the loan should be repaid within three years, and sometimes even in 12 months. For a dwelling costing 100,000 CPA francs, the conditions are;
(1) Personal participation 25,000 CPA francs (2) Amount of loan 75,000 CPA francs (3) Annual repayment over a period of three years 25,000 CPA francs (4) Portion of annual net income to be used for repayment 25 per cent (5) Annual net minimum income 100,000 CPA francs*
Detailed information on this scheme is given in a UN report from the Department of Economic and Social Affairs, Financing Rural Housing: Selected Policies and Techniques for Developing Countries.
Preferably savings and loan schemes should be such that after a period of not more than five years everyone who has saved according to the contract will get the additional loan needed to build his house. Experience has shown that the period of contractual saving should not be very long, otherwise participants lose their trust in the scheme. To very low income groups, badly in need of some form of improved shelter, a period of 5 years must already be considered too long: a period of 2 to 3 years might well be the upper limit.
Another very important point is that loans should mostly not be provided as liquid money. The opening of a credit account to be used only for the purchase of building materials or for the payment of a contractor could be a feasible solution. Also the supply of credit directly in the form of building materials could be a practical solution, especially in connection with site
29 United Nations Economic and Social Council, Economic Commission for Africa and German Poundation for Developing Countries, Housing Finance from Public and Private Sources, E/CN.14/HOU/22, Addis Ababa, 1968, par. 27. United States Government Division of International Affairs, Department of Housing and Urban Development, Housing in the Ivory Coast, Washington DC, 1967.
31 United Nations, Department of Economic and Social Affairs, Financing Rural Housing: Selected Policies and Techniques for Developing Countries, New York, 1974, p. 45.
* Note that the f-factor (see Chapter 7 and Annexe I) is 1.

and services and self-help schemes. Credit in the form of building materials might also be given to small building contractors who only get new credits after they have used all materials supplied according to their contract. The relationship between suppliers of capital on the one hand and self-help agencies and other estate development authorities on the other hand needs specific attention.
Land, in addition to the house on it, has in many countries always served as collateral for mortgage loans. In several African countries land is communally owned, has a specific status, and cannot be bought or sold, and thus cannot serve as collateral. Ingenious solutions have been developed in order to bypass this problem. One of the elements in the Ghanaian roof loans scheme2,2 is that the loan is given to cover the expenses only for an advanced stage of the building process, for the roofing. The construction without the roof, not the land, then serves as collateral.
In Cameroun the Government has introduced a personal credit for construction of housing in rural areas. A recent UN study33 mentions the introduction of "character loans", "co-signer loans" and "collective responsibility loans", as solutions in situations where land cannot serve as collateral. According to this Report, the criterion of a "character loan" can be applied to those individuals or households who have a reasonably clean record of loans and repayments in kind in their community. "Co-signer loans" can be provided for those individuals who are able to bring solvent co-signers (institutions or individuals) as a security for loan. Since the late 1950's, the "collective security" criterion has been successfully applied in rural areas, the loan being given to the beneficiary in a tribal area under the security of the village or tribal chief.
In the same Report mention is made of the concept of "supervised credit", a scheme under which the prospective home-owner is helped by a technician or community worker to prepare a financially practicable home plan. According to this source, the risks are to a great extent minimized because of the supervisory element present. At a UNECA conference34 it was recommended that in' the case of land owned on a communal basis, governments should establish a scheme and an agency to provide a certificate of land-holding to enable individuals to take advantage of credit facilities for housing by using this certificate as security for loans.
High or low rate of interest?
The level of the rate of interest remains an intriguing problem. As already stated, the concept of interest is not popular in many African societies. Since interest payments constitute a considerable percentage of annual housing costs and have a decisive impact on the acceptable investment costs (see Tables 12-1 and 12-11) all over the world, efforts have time and again been made to provide capital for housing at a low rate of interest. As the level of the rate of interest fulfils important functions in the national and international economic clockwork, and because the capital needed for new housing consumes an important part of total savings, it proves difficult to concentrate housing finance in a separate sector closed off from the rest of the economy and with artificially low rates. Concerning housing, and perhaps also concerning other investments by low-income groups, the advantage of a lower debt-service might well outweigh the incentive to saving attributed to a high rate of interest. In such a view, the goal for which savings are made — the house — might serve as a stronger incentive than the level of the rate of interest. Since efforts in kind (the home-owners' labour) constitutes a considerable part of the total investment effort to be made for a house, and as this effort in low-income conditions will not be influenced by the rate of interest, the negative effect of a high rate of interest in the form of high annual payments for interest on loans will weigh more heavily than the positive one in the form of larger savings. Because of the necessarily large self-help component in any housing effort on an appreciable scale, housing will still have to be realized for at least a number of decades in an intermediate sector between the 100 per cent monetary and the 100 per cent traditional economy. A more or less special low-rate circuit for housing finance, probably connected with the supply of capital for other activities to be undertaken by low-income groups, might well fit into these conditions. Especially for this sector could a Savings and Credit Banks system as already discussed function adequately.
32 United Nations Economic and Social Council, Economic Commission for Africa, The Roof Loans Scheme in Ghana, E/CN.14/HOU/32, Addis Ababa, 1969.
33 United Nations, Department of Economic and Social Affairs, Financing Rural Housing: Selected Policies and Techniques for Developing Countries, New York, 1974.
34 United Nations Economic and Social Council, Economic Commission for Africa and German Foundation for Developing Countries, Report of the Regional Meeting on Technical and Social Problems of Urbanization with Emphasis on Financing for Housing, E/CN.450, E/CN.14/HOU/40, Addis Ababa, 1969.

t Table 12-111 Details of Terms for House Mortgage Loans
Country Organization Period of repayment of loans
Rate of interest per annum
Botswana Commercial Banks Not known, but probably not in excess of 5 years
Not known, but probably those prevailing in the Republic of South Africa 8^-10 per cent
Botswana Building Company
Not known Not known
Central African Republic
National Development Bank
5-10 years 8-10 percent
Ethiopia Savings and Mortgage Corporation of Ethiopia
5 years 8^ per cent plus 1 per cent additional on approval of loan
Imperial Savings and Home Ownership Public Association
16 years up to 7 per cent
Ghana First Ghana Building Society
5 to 15 years 9 per cent
State Insurance Corporation
5 to 15 years 9 per cent
Kenya Housing Finance Company Kenya Ltd.
15 to 25 years 8% per cent
East African Building Society (Housing Bank suggested)
5 to 15 years 9-10 per cent
Liberia Commercial Banks 1 to 5 years 9-10 per cent discounted initially
National Housing and Building Bank
Not known Not known
Madagascar A social welfare body not named
Up to 20 years 3 per cent
Madagascar National Bank
10 years 5-7 per cent
•
Madagascar National Bank
5 years 8 per cent(50 per cent loans for sums in excess of 2.5 million Madagascar francs)
Malawi New Building Society
Up to 20 years IVi per cent Freehold 8^ per cent Leasehold

Table 12-111 (continued) Details of Terms for House Mortgage Loans
Country Organization Period of repayment Rate of interest per of loans annum
Mauritius Commonwealth Development Corporation
Government
Local Money Market
Up to 20 years Approx. S]6. per cent
Morocco Caisse Immobiliere et Hoteliere
15 years
15 years
4 per cent (on low-cost housing)
4-8^ per cent on ordinary loans
Nigeria Western State Housing Corporation
10-15 years IVi per cent
' X :
Nigeria Building Society, Lagos
Up to 20 years 816. per cent
Sierra Leone Anticipated formulation of Housing Finance Company of Sierra Leone Ltd.
Not known Not known
Somalia Credito Somale (Government Commercial Bank)
5 to 25 years 5 per cent
Sudan Sudan Estates Bank
5 5
5 5
18 years
18 years
Not stated
3 per cent for low-income groups. Loans up to £S.2000
3 per cent for middle-income groups. Loans up to £S.7000
6-9 per cent for high incomes over £S.450 per annum. Loans up to £S.25000
Swaziland Swaziland Credit and Savings Bank
Up to 15 years SVi per cent
Swaziland Building Society
Up to 15 years 9 per cent
Tanzania Housing Finance Company of Tanzania Ltd.
15 to 25 years 8^ per cent
National Housing Bank in process of Establishment
Not known Not known
Arab Republic of Egypt
Not named Up to 15 years 5-6 per cent

Country Organization Period of repayment Rate of interest per of loans annum
Uganda Housing Finance 15 to 25 years Company of Uganda Ltd.
S1̂ per cent
Zambia National Building Up to 20 years Society (amalgamation of three societies)
816. per cent
Source: United Nations Economic and Social Council , Economic Commission for Africa, Establishments and Developments of Housing Banks and their Role in African Countries. E/CN.14/HOU/85/Rev. 1, Addis Ababa, 1972.
Furthermore, i t should be realized that high rates of interest not only reflect a relative scarcity of loan capital on nominal conditions, but also are often a consequence of inflation. In such a si tuation creditors suffer losses on outstanding loans which lose in real purchasing power as prices continue to increase. The high nominal rate of interest can be understood as a compensation for this continuous loss in real value on the outstanding debt. Factually a high nominal rate of interest consists for the major part of an addit ional amortization of the loan in real terms. The real rate of interest may be below 1 per cent with a nominal rate abovr 10 per cent, the difference being the compensation for loss on the main sum. Such a si tuation causes specific problems for housing finance, because financial burdens for new houses will be extremely high during the first years of use.
Solutions have been sought in the development of more or less complicated loan systems with deferred payments or with index clauses. Discussions concerning the feasibil i ty of such schemes in developed countries are far from finished, and it certainly has to be questioned whether the sophisticated systems sti l l under discussion in Western Countries today could already be introduced as workable solutions for Africa. All in all , i t should be concluded that in developing countries there is ample scope for research and experiment into the relation between housing and the rate of interest . Weighing all the factors discussed in this section, solutions with low rates of interest st i l l appear the most attractive for housing.

S KJ \J L-l O O I O1 ^ «^ / \ v/l -* Vy O ü V/ C* O ^ vj » \~* «_»»-«^.kJV J-'*-/ V» V-» V *-J -y - — w ->^1 ^ -w «-|. »• -w _ _
i{DE9 jo qjdsp aqx 'ssuoz Suiuiofpc ui ^JOM OJ puE aAi| oj JDAOOB OI^M ajdoad asoqj ioj psjtiuii
jda>| 9q UBD 5(J0M PUB 9lU0q U99A\J9q 9DUB)Sip 9qj snqx '(RCI aJnSlj 99S) p9DBld 9JB S9IlIAipB
JBpJ9UlUJOO pUB (Bujsnpui jgSjBJ 9m ipiqM SuOJB 9U0 PU0D9S B SI 9J9m qDiqM 0) pUBJBd uoqqu 9UO ui pgjBrnis si Suisnoq 9J9qM Xjp-uoqqu B OJ spB9| judiudop^dp pjjruvd 9qx
•uJ9jjBd SunBUJ9;iB 9qj puB uj9jjBd puBJBd 9qi :p9qsinSuiisip
9q UBD jnoXBj jo s9dXj oisBq omj 'Sui^ds XjpBOjq 'puB '9SUB suj9UBd jnoÄB] Dijp9ds
9Uios p99U oiSBq siqj jo jnQ "(Suisnoq qjiM jgq^Soj p9uuBid si ÄJjsnpui 'unopjBq^ uqi qjnqns
A\9U 9qj UT '9J9qM '91 J9jdBq3 'Bisiunx Xpnjs 9SBD 9qj os|B 995) ^ouBjsip 9pX3iq JB JO SUI^|BM JB 'S9UI0q 9qj UIOJJ JBJ /Ü9A JOU p9;BDOJ 9q Pjnoqs S9U0PBJ pUB sd0qS>|J0A\ 9§JB1 OSJB 'J9A9MOH
•p9UJ90UOD 9JB sdoqs S9JBS l|BUIS pUB sdoqS^JOM UBSIJJB HBUIS SB JBJ SB JSB9I IB SB9JB |BpU9pTS9J
ui p9jd900B 9q pjnoqs puB 9iqissod si doqs>[JOA\ puB sSuqpMp jo uoijBuiquioo UIBVI90 V
•SB9JB UBqjn UBOIJJV jo jnoÄB| 9qj uo pBduii
9jqBJ9pisuoD B 9ABq jsnui ;u9ui9Jinb9J srqx 'uoijB^JodsuBJj uo 9UJ03UI jpqj jo JU90 J9d OT7
OJ dn pu9ds o; 9ABq S9UIODUI A\0( ÄJ9A qjIM 9ld09d 9J9qM 'SUMOJ 9SJB| UI JSIX9 X|qBU9J§9J U9JJO
qoiqM suoijBnjis 9qj iU9A9jd oj 9pBui 9q 9JOj9J9qj pjnoqs JJOJJ9 ÄJ9Ag 'Suo] 9q jou pjnoqs >JJOM JO 90Bjd pUB 9UJOq U99MJ9q pUB 'jOOqOS XjBUIIjd puB 9UJOq U99MJ9q 'J9>JJBUI puB 9UIOq U99MJ9q
S90UBISIQ •S9SU9dX9 JJOdsUBJJ UO OSJB jnq S9SU9dX9 Suisnoq UO 9ZIUI0U039 OJ 9ABq Ajuo JOU
S9UIOOUI MOJ qjIM 9jd09d 'J9A9MOH "UOlJBJJOdsUBJJ JO SJSOD qSiq 'SpjOM J9qjO UI 'JO 'P9JJ9ABJI
9q OJ S9DUBJSip Suoj OJ pB9J AllSB9 XbUI SUA\OJ Siq UI S9IJISU9P MOT "luiod Siqj JB UOIJU9JJB 9JOUI
p99U 'SUMOJ JO 9ZIS pUB jnoXBJ 9qj §UIUJ90UOO 'XBS OJ SI JBqi 'J9A9J-OJ3BUI 9qi JB SUI9jqOjd 9qi
•(j9jdBq3 siqj ui J9iBj p9ssn3sip 9JB suJ9jq0Jd jBpos 9QX) ^9^ jo juiod jBDiuq39i 9qi UIOJJ sui9jqojd ou XjjBDipBJd s9Sod suJ9jsXs qons jo 9sn 9qj puB 's9pBD9p jsBd 9qj Suunp p9jBJoqBj9
U99q XpB9JJB 9ABq SUI9JSXS pUB Su3lS9p JO S9dXj qDUS 'J9A9MOH ^SBJS J9JBJ B JB XjqBJ9piSUOD
p9AOjduii 9q JJIM suigjsXs qons XjqBqojj •SJBIJU9SS9 XjiunuuuoD J9qjo puB sui9jsXs J9JBAV
3ui5(uijp PUB 93BJ9M9S 'SUJ91SXS pBOJ qjm SJU9UI9AOJduiI JO UOISUBdxg J9JBJ JOJ UOIJBAJ9S9J
9utqiuoD oj J9pjo ui poqpui u9is9p t49nssiitt JO ^puSt4 jo puijj 9uios jo 9sn gqj 9JBJISS9D9U JJIM siqj (pooqjnoqqSpu puB p9Jis) j9A9j-ojoiui 9qj jy "Suisnoq dj9q-jj9S jo S3ijsiJ9pBJBq3 9qj oj
'psjno 9qj UIOJJ X|qBJ9j9Jd 'p9jdBpB 9q oj 9ABq JJIM SUMOJ puB spooqjnoqqSpu jo JUOXBJ 9qi
•XBM XjOJBJOjdX9 UB UI XjUO p9SSnDSip 9q UB3 P9AJOAUI
sui9jqojd gqj j9jdBq3 siqj ui puB ju9Ujdoj9A9p XJJB9 JO 9SBJS B UI JJIJS is9q 9qj JB 9JB
P9dS9J Siqi UI S9qDBOjddB 9AlSU9q9jduiOD JO JU9Uldoj9A9p 9qj pUB Sui^juiqj piJOS 'S9ipn)S
QSNOJOQX gjqBpiOABun s9ijisu9p MOJ J9qiBJ 9>{BUI 'UOISU9JX9 JOJ uopBAJ9S9J puB Suipjmq
9SIJ-MOJ 'S)U9UI9J9 QJOQ •JU9UI9J9 JBIJU9SS9 UB 9JB SJU9UI9AOjdlUI pUB SUOJSUdJXd dunjnj JOJ SUOIJBAJ9S9^ ^JH JO S98BIS lU9J9JJip 3uunp 9SB9JDUI JJIM 9UJOOUI pUB 9ZIS XJIUIBJ 9qi 'p
•9jqiSB9J 9q JJIM S91JOJS OMJ JO 9UO JO UiniUIXBlU B qjIM UOipnJJSUOO 9SIJ-MOJ XjUO
9JOJ9J9qi •p9JIUjq 9JB S9UI9qDS dj9q-jj9s UI S;UBdlDIlJBd JSOUI JO SJJI^JS 9qi •p9jd90DB 9q OJ
9ABq JJIM S9IJISU9p MOJ XJ9AIJBJ9J 'dj9q-JJ9S qjIM p9jdnOD 'S9UI9qDS S931AJ9S pUB 9JIS UI pUUOJ 9q UBD 3uisnoq uinunuiiu 9iBnb9pB JOJ 9DUBqD tS9jdo9d gqj 9J9qM 'BDUJV UI 'J9A9MOH •sSutpunojjns snopBds 9JOUI ui 9Aq 01 pJojjB UBD op-oj-jj9M 9qi Xjuo sB9J9qM 'SB9JB UBqjn
p9pMOJD-Xj9SU9p UI 9Aq S9UJODUI MOJ qjIM 9jd09d 9J9qM9SJ9 iXjOpipBJJUOD DJinb JB9ddB
XBIU siqj '^qSis JSJIJ \\ saijp tQisudp-MOj J9qjBj SB p9doj9A9p gq oj 9ABq JJIM S9ijp UBDUJV 'D
•SDUJUHOD pDZqBUJSnpUl J9qJB9 UI S9UIODUI qjIM p9JBduiOD U9qM MOJ
SS9J9qjJ9A9U 9JB S9IJP UI U9A9 S9U10DUI 93BJ9AB 'SB9JB JBJUJ UI UBq) J9qSiq XJJBJ9U9§ — Supq
9uiij 9QJ JOJ PB9J JB — 9q XBIU S9iip ui SDUIODUI qSnoqqv sdyp diuoDW-MO] XjjUBUiuiopgjd
9q XjlJBSS9D9U JJIM MOJJOUIOJ JO pUB XBpOJ JO S9ljp UBDUJV SUOIjd9DX9 M9J XJ9A qjlyW q •jU9UJdoj9A9p Ji9qi gpinS
oj ̂ugpyjnsui gjBspoqpuiSuiuuBjd JBUOIJU9AUOD 9qj jBqj JSBJ OS SUIMOJ3 9JB SUMOJ UBDUJV :9snBD9q si siqx 'MOU ji^un
9J9qM9SJ9 UMOU5J SB - UJ9pOUI SB JJ9M SB JBUOlJipBJJ — SUMOJ UIOJJ lU9J9JJip Xj9A 9q OJ 9ABq
XjqBqojd poiu JJIM MOJJOUIOJ JO SUMOJ UBDUJV jUDjgjjip XjjBDiSBq ui uoijBniis 9qj BDUJV UJ
•SUOlJBjgdo 9JBDS-9§JBJ '§
puB is9snoq qmq-JopBJjuoD JOJ SUIMOJJB J9A9J puB uoijnqujsip 9UiODUi 'J !P9AJOAUI s9ijuoqjnB 9qj JJB puB XjiunuiuiOD 9qj qnsuoD oj puB UBjd oj DUIIJ qSnou9 '9
!93UBqD JBpos MOJS B JO UOIJBUUIJUOD 'P !9SuBqD UBqjn JO DJBJ MOJS B JO uoijBnuijuoD 'D
'.UI9JSXS SUOlJBDlUniUlUOD puB pBOJ §UIJSIX9 9qj JO UOI}BAJ9S9Jd 'q
!SJB9X p9jpunq 9UO UBqj 9JOUI JOJ p9}StX9 XpB9JJB 9ABq qDiqM SUMO) JO UOIIBAJ9S9JJ 'B :SB qDns 'Sß gqj puB 9dojng ui pgpunoj SB
S9jdpuud UO p9SBq SBM §UIUUBjd-J9pBlU JO B9pi 9qj 9SnBD9q jnq 'UOiqSBJ 9J9DUIS pUB JUDpdlUOD
B UI 9UOp JOU 9J9M X9qj 9SnBD9q JOU SUMOJ UBDUJV XUBUI UI p9JIBJ 9ABq SUBjd J9JSB^
jnoXcq jo sui9j}Bj usqjQ

•BDUjv ui S3JJU90 uBqjn ijb XpBau ui pBOJssojo b ;b si se9jb uBqjn jo ajnjnj aip joj Suiuu^id pus 'auo pa^Bjosi ub jou si bAus^j jo siduiBxa sajx •gjnpnjjsBjjui 9i[j oj uoijippB ui sasnoq 9joo jo uoiprujsuoo 3i{j asudiuoD Xbui }i jo suojb ajnpnjjsBjjui UBqjn jo unoj sqj ui aq Abui siqx j'JUQuiuoJiAua UBqjn sq; jo sjuauiap oisBq jsoui 9qj jo uoisuojd aqj uo Suijbjjusouoo Xq XJBSS909U 9q JJIM qDBOjddB J9qjOUB SUI9iqOjd 9S9qj q^IM 9d00 O} J9pJO Ul JBq) p9ZIU§009J si
•JI9M SB sgiJjunoo jgqjo JOJ p9Dnpojd 9q ubd S9jn§y JBpuiis •9ido9d uoqjiui 6 P9jbujiis9 ub 9)BpouiuiooDB oj jnq uopBpidod IBinj J9JB9J§ qonui B 9AJ9S OJ AjUO JOU p9dO|9A9p 9q OJ p99U IJIM SUMO} 'J9A9MOq 'SJB9X $1 }X9U 9m SuunQ 'S^UBJiqBqUl UBqjn uoqjiui \ ÄpjBUIIXOjddB JOJ S91JI|PBJ 9piAOJd pUB 9)BpOllI -uioDDB oj p9do|9A9p sBq bXu9^ jnoqSnojqj gjnprujsBJjui UBqjn 'sjb9A QL ;sBd 9qj SuunQ
•SZ.6I '9/dei/3Ja/0Z. • JN03/V wmm 10} pa^dsid jgdBj 'vtudyjo doududdxg :SUVJJ }Duoi3d}J puv jvuoiivtf DIVUDQIPQ Jo uoijvnjDd J uo vudjuj MSjpuy '9{Bgn :33-irios
•p9ziuBqjn pX jou jnq s9UBpunoq {Bdioiunui ui pgpnpui uoijBjndod jBin^j
9TI Z ^81 Z£6 T LQ)6 3S9 zsz I^ox
08 89 Zl S e z nj9p\[ 61 S VI t7 s I nqiug ie P\ L\ 9 P s Bg9lUB5{B^ It-ST 9Z 01 8 e lJ9Xj\[ S3 Z zz Zl 6 9 ZS 01 zv 81 03 8 pjopiH OS —
OS 81 H P VMI 06! 99 PZL ee PZ II nuinsi^i e8 t7 6L LP 8e 8T njn>{B{si LTV — LPP LPZ 081 SZ. BSBquiopv 860 I 860 I 60S LPI 611 iqojiB^
uBqjQ moi 0861 6961 1961 8^61
"(OOOJ uoijBindoj 0861 sumoj iBdiDuud j j jo uoijeindod papafojj
i-n m*!
Tei UI p9JBJ}Sn|p 9q UBD S9JJU9D UBqjn §UlUIOD9q S98BJJIA PUB S9JJU90 UBqjn JO qiAVOJ§ pidBJ 9qx
9|duiBXg SB bXu9}J UI qjMOJ9 UBqjQ
•piJOA\ 9qj JO S^Bd J9qjO Ul JU9lBA9Jd SB SUOm'JSUBJJ pUB dtqSJ9UA\0 JO Sjd9DUOD qjlA\ 9iqiJBdui03 XpSB9 JOU 9JB }Bqj PIX9 SUI9JSXS 9JnU9J pUBJ p9JOOJ Xld99p SUOI§9J UBDUJV XuBUI UJ '1 •sj9sn 9qj joj ps 9q oj S9inj 9qi uo sb jpAv sb 'spooqjnoqq§pu puB sumoj jo juoXbj 9qi uo pBduii punojojd b 9ABq {jim siqj[ ^ouBipj-jps qSnojq^ 9§jbi puB Xq pgpnjpuoo 9q o; 9ABq puB sdnojS 9Ujooui-a\o| 9q; jo 9(do9d joj 9q |pM s9snoq 9qj jo poiu ;Bqi ju9uj9jmb9j 9qx ' I
:j9;dBq3 siqj jo 9doDS 9q} uiqjiAV p9jB9Jj 9JB sp9dsB joCbui oavx
•p9Jinb9J 9JB S9qDBOjddB [buiSuo 'pJJOM 9qj jo siJBd J9qjo ui SB9JB p9ziuBqjn J9pio ui pqi uiojj ju9J9jjip 9jinb 9q oj 9nuijuoo IITA\ S9U^UnOO UBOIJJY XUBUI UI UOipnjlS 9qj 9SnBD9a 'SpjBpUBJS OISBq UTBJJ90 OJ §uipuods9J ;U9UldopA9p pJBn§9JBS o; p9p99U 9JB SUOlSlAOjd JB§9J pUB p9JBd9jd 9q OJ 9ABq SUJ9UBd 9|qB5iJoyw ^sn puBi jo sui9iqojd Xubui oj 9Sij s9ai§ bdijjv ui Suujrmo sb uoijBziuBqjn pidB>i
1NHHNH3AOO 1V301 QNIV '3Sa aiMVl OMIMNVld £1 H31dVH3

CHAPTER 13. SETTLEMENT PLANNING, LAND USE, AND LOCAL GOVERNMENT
Rapid urbanization as occurring in Africa gives rise to many problems of land use. Workable patterns have to be prepared and legal provisions are needed to safeguard development responding to certain basic standards. Because the situation in many African countries will continue to be quite different from that in older urbanized areas in other parts of the world, original approaches are required.
Two major aspects are treated within the scope of this Chapter: 1. The requirement that most of the houses will be for people of the low-income groups and
have to be constructed by and large through self-reliance. This will have a profound impact on the layout of towns and neighbourhoods, as well as on the rules to be set for the users.
2. In many African regions deeply rooted land tenure systems exist that are not easily compatible with concepts of ownership and transactions as prevalent in other parts of the world.
Urban Growth in Kenya as Example
The rapid growth of urban centres and villages becoming urban centres can be illustrated in table 13-1.
Table 13-1 Projected population of 11 principal towns 1980 Population ('000).
Town 1948 1962 1969 1980 Total Urban Rural*
Nairobi 119 347 509 1 098 1 098 Mombasa 75 180 247 447 — 447 Nakuru 18 38 47 79 4 83 Kisumu 11 24 33 124 66 190 Thika 4 14 18 50 — 50 Eldoret 8 20 18 42 10 52 Kitale 6 9 12 23 2 25 Nyeri 3 8 10 26 15 41 Kakamega 5 4 6 17 14 31 Embu 1 5 4 14 5 19 Mem 2 3 5 12 68 80
Total 252 652 907 1 932 184 2 116
* Rural population included in municipal boundaries but not yet urbanized.
Source; Ligale, Andrew N., Criteria on Evaluation of Deliberate National and Regional Plans: Experience of ATewya, Paper prepared for Habitat A/CONF. 70/RPC/13P/6, 1975.
During the past 70 years, urban infrastructure throughout Kenya has developed to accommodate and provide facilities for approximately 1 million urban inhabitants. During the next 25 years, however, towns will need to be developed not only to serve a much greater rural population but to accommodate an estimated 9 million people. Similar figures can be produced for other countries as well.
It is recognized that in order to cope with these problems another approach will be necessary by concentrating on the provision of the most basic elements of the urban environment.1 This may be in the form of urban infrastructure alone or it may comprise the construction of core houses in addition to the infrastructure. This example of Kenya is not an isolated one, and planning for the future of urban areas is at a crossroad in nearly all urban centres in Africa.
Legale, Andrew, N., Criteria of Deliberate National and Regional Plans: Experience of Kenya, paper prepared for HABITAT, A/CONF. 70/RPC/13 P26, 1975.

Urban Patterns of Layout
Master plans have failed in many African towns not because they were not done in a competent and sincere fashion, but because the idea of master-planning was based on principles as founded in Europe and the US, such as: a. Preservation of towns which have already existed for more than one hundred years; b. preservation of the existing road and communications system; c. continuation of a slow rate or urban change; d. continuation of a slow social change; e. enough time to plan and to consult the community and all the authorities involved; f. income distribution and level allowing for contractor-built houses; and g. large-scale operations.
In Africa the situation in basically different. African towns of tomorrow will most probably have to be very different from towns — traditional as well as modern — as known elsewhere until now. This is because: a. African towns are growing so fast that the conventional planning methods are insufficient to
guide their development. b. With very few exceptions African cities of today and of tomorrow will necessarily be
predominantly low-income cities. Although incomes in cities may be — at least for the time being — generally higher than in rural areas, average incomes even in cities are nevertheless low when compared with incomes in earlier industrialized countries.
c. African cities will have to be developed as rather low-density cities. At first sight, this may appear quite contradictory: elsewhere people with low incomes live in densely-crowded urban areas, whereas only the well-to-do can afford to live in more spacious surroundings. However, in Africa, where the peoples' chance for adequate minimum housing can be found in site and services schemes, coupled with self-help, relatively low densities will have to be accepted. The skills of most participants in self-help schemes are limited. Therefore only low-rise construction with a maximum of one or two stories will be feasible.
d. The family size and income will increase during different stages of life. Reservations for future extensions and improvements are an essential element. Both elements, low-rise building and reservation for extension, make rather low densities unavoidable. Thorough studies, solid thinking and the development of comprehensive approaches in this respect are at the best still in a stage of early development and in this Chapter the problems involved can be discussed only in an exploratory way.
The layout of neighbourhoods and towns will have to be adapted, preferably from the outset, to the characteristics of self-help housing. At the micro-level (street and neighbourhood) this will necessitate the use of some kind of "grid" or "tissue" design method in order to combine reservation for later expansion or improvements with road systems, sewerage and drinking water systems and other community essentials. Probably such systems will be improved considerably at a later stage. However, such types of designs and systems have already been elaborated during the past decades, and the use of such systems poses practically no problems from the technical point of view. (The social problems are discussed later in this Chapter).
The problems at the macro-level, that is to say, concerning the layout and size of towns, need more attention at this point. Low densities in big towns may easily lead to long distances to be travelled, or, in other words, high costs of transportation. However, people with low incomes not only have to economize on housing expenses but also on transport expenses. Distances between home and market, between home and primary school, and between home and place of work should not be long. Every effort should therefore be made to prevent the situations which often regrettably exist in large towns, where people with very low incomes have to spend up to 40 per cent of their income on transportation. This requirement must have a considerable impact on the layout of African urban areas.
A certain combination of dwellings and workshop is possible and should be accepted in residential areas at least as far as small artisan workshops and small sales shops are concerned. However, also large workshops and factories should be located not very far from the homes, at walking or at bicycle distance. (See also the case study Tunisia, Chapter 16, where, in the new suburb Ibn Khaldoun, industry is planned together with housing). Out of this basic need some specific layout patterns arise, and, broadly speaking, two basic types of layout can be distinguished: the parallel pattern and the alternating pattern.
The parallel development leads to a ribbon-city where housing is situated in one ribbon parallel to which there is a second one along which the larger industrial and commercial activities are placed (see Figure 13-1). Thus the distance between home and work can be kept limited for those people who accept to live and to work in adjoining zones. The depth of each zone depends on whether it has to be based on pedestrian distances or on bicycle distances. When walking distances have to be adhered to, the combined depth of both zones should

preferably be not more than 6 km (3.53 miles): for instance, 4 km for the residential zone and 2 km for the commercial and industrial one. This latter zone should be subdivided in such a way that the most disturbing activities should be situated as far away as possible from the residential zone. Zoning should also take into consideration the direction of the prevailing wind. Both zones will be intersected by the main road or a main road system. In order to keep distances short, there should be a sufficient number of road connections from the residential area to tne working area.
Figure 13-1 Principle of Parallel Development
Recreation/Agriculture
Commerce
Housing
Residential
Clean Industry Less Clean Industry
Centre
Industry and Commerce
A very attractive aspect of such a scheme is that all residential places will be situated at a short distance from the open country which could be used for agricultural and recreational purposes. People living in the town could also have a plot of land from which they could get some income in the form of crops. Where the layout can be based on travel by bicycle instead of on walking to work the total depth of residential and industrial zone together could be put at approximately 10 km, for instance, 6.5 km for the residential zone and 3.5 km for the industrial and commercial area. It should be noted that such a scheme makes it possible to start at the pedestrian level, so that later when more money becomes available for bicycles, both zones can be deepened. In a residential zone of 10 to 4 km with a gross density of 10-15 houses per ha, 160,000 to 240,000 people can be housed with an average of 4 persons per house. With a residential zone based on bicycle distance (15-0 km) the population to be housed could number somewhere between 360,000 and 700,000 people.
Of course, longer ribbons might be conceived, but these have the major drawback of increasing the average distances to the town centre and between excentrically situated residential zones. To a certain extent this can be overcome by curving the ribbons. (See Figure 13-2). If transportation systems could be based on motor transport, the possibilities would, of course, be quite different. However, it is doubtful whether low-income groups can rely greatly on even public motorized transport because of its cost. Well-known examples of systematically planned ribbon developments can be found in the USSR, for instance, Wolgagrad.
Figure 13-2 Curved Ribbons in Parallel Development

Concerning the alternating pattern, there are several possibilities which can be adapted to local circumstances, although the main patterns are: concentric, radial and rectangular.
The concentric pattern consists of alternating rings with housing and industry around a centre.
Figure 13-3 Concentric Type of Lay-out
In the radial pattern, housing and industrial zones are alternated in more or less trapezoidal zones perpendicular to the centre.
Figure 13^ Radial Type of Lay-out
With a radius of 5 km, between 220,000 and 340,000 people (with a radius of 7.5 km, between 325,000 and 470,000 people) could be housed in a town with a radial or concentric type of layout. The average distances to the centre would be shorter than in a city with the same amount of people distributed according to a parallel layout scheme.
Figure 13-5 Partly Radial Pattern

The concentric, as well as the radial type, however, has two disadvantages: 1. Interconnecting roads between commercial and industrial zones have to pass residential
ones: ring roads in radial developments and radial reads in concentric patterns. 2. Some of the residential zones will be situated unfavourably from the viewpoint of
disturbing features such as pollution from adjoining industrial zones.
Partial solutions showing fewer of these disadvantages could be used in situations with fewer inhabitants than those mentioned above. Moreover, the concentric pattern appears less attractive than the radial one because with the latter access is possible from all residential zones to open land outside without having to go through one or more industrial zones.
Figure 13-6 Checker Pattern
Another rectangular example of the alternating development is the checker-pattern (Figure 13-6): Up to a population of from 200,000 to 300,000 this appears to be a workable solution. The greater the number of inhabitants, the longer will be (also in this case) the distance to the centre. Moreover, with a repetition of the checker pattern, the residential quarters will become more or less completely enclosed by large commercial and industrial zones. Even where roads for industrial and other traffic could be separated, problems of noise and pollution would be difficult to prevent.
Reviewing the advantages and disadvantages, the parallel (ribbon) development, the radial variant enclosing less than half a circle, or the checker pattern if kept limited at least to approximately 250,000 inhabitants, could all be acceptable, but not ideal. However, an ideal city cannot be realized when several hundred thousand — if not more than a million — people with low incomes have to be accommodated.
For cities and towns of up to 200,000 inhabitants better solutions can be reached, in terms of distances and quality of residential zones, than for larger ones. Considering the larger ones, the parallel development affords acceptable distances between home and work and, in principle, a qualitatively good situation of residential zones. However, the distance from residential zones to the centre and between different residential zones will then become rather long. If many hundreds of thousands of people have to be accommodated in towns with radial or checker patterns, this will lead to longer distances and to disturbances in the residential quarters from the adjoining industrial ones.
It has to be questioned how wise it would be to have a million or more people in one urban area, if distances to the centre and between peripheral residential quarters become so great that the majority of the population would not be able to travel over those distances regularly because of the cost of transportation, but only very occasionally.
The schematic patterns as analyzed and presented here can rarely be applied in pure form. In most places geographical conditions will demand adaptations. In existing towns the situation as developed in the past will limit actual choice; for the implementation of very capital-intensive and often dangerous and polluting installations like refineries and certain industrial processes, location at a distance from towns will be necessary and economically acceptable. The investment on the equipment is so high and the relative cost of labour so low that it will prove economically feasible to let workers travel by motor-coach over longer distances.

Regional Ribbon Planning Star Towns
This example of adaption of the pure ribbon forms for a rural region has been proposed in Rural Buildings in Africa.2 In order to avoid uncontrolled semi-urbanization, star-like combinations of ribbons have been proposed, of a more or less equilateral triangular pattern. The ribbons will meet in the centre of gravity of the region stretching urban arms in three directions towards the border lines of the regions. The analysis so far has demonstrated the wisdom of all those African Governments which are stimulating the development of smaller towns in order to avoid a continuous increase in population and the extension of the capital and other major cities.
R U R A L V I L L A G E S
E X I S T I N G M A J O R V I L L A G E
T O R E M A I N R U R A L
E X I S T I N G T O W N
SECONDARY ROAD
i>0 sx A.S\ /\
Figure 13-7 Star Towns
Regional Planning Physical Planning should protect the Countryside
• Main one-way Road - Urban-rural Border
l l l t l i i l i n i i t i i i t l l H i l l To be urbanized
Impact of Increasing Incomes
When average incomes steadily increase through the years there may come a point when more and more people will be able to rely on contractor-built housing. Such a situation might arise, for example, when households reach an annual income level of about 2,500-3,000 US$ (at present value, although if inflation continues the nominal amount would have to be much more). How long it will take in different regions to arrive at such a situation cannot be predicted. Most probably it will be a process taking many decades. During that period a gradual transformation from cheap site and services to higher standard housing will take place, partly by self-help and gradually also by contractors.
After such a period more densely-built residential areas may become feasible, although whether such areas will be realized will also depend on a choice between lower-cost and lower-density housing with relatively high cost of transportation, and higher-cost higher-density housing with lower cost of transportation. The choice may well be between a self-help house and private means of transportation and a more expensive contractor-built house that would
United Nations Economic and Social Council, Economic Commission for Africa, Rural Buildings in Africa and the World, Addis Ababa, 1970.

leave no financial scope for (private) motorized transportation. Therefore a precise prediction of planning and housing needs in a future when incomes might be between two and five times higher than today cannot be given.
Land Tenure and Land Control
The conditions to be met in most African countries — predominantly site and services development, coupled with careful layout in order to limit walking distances and to safeguard possibilities for future improvement — are a challenge to (urban) government. A system of controlled land use has to be developed adapted to such circumstances. Moreover, due consideration must be given to specific aspects of land use and land property now existing in Africa.
Systems of land tenure differ considerably. In a recent United Nations study3 a major distinction is made between: a. Sub-Sahara Africa and b. predominantly Moslem countries. Concerning a greater part of Sub-Saharan Africa, it is stated in this Report that land-holding practices can be classified neither as communal land-holding nor as private ownership. A better classification would be that they form a kind of "corporate" system "... which ensures that the rights of individual members co-exist with those of the group at large . . . individuals are permitted to possess parcels of land for farming, building etc., but they do not have the absolute right of ownership. Furthermore, customary practices permit direct descendants of a land-holder to inherit his rights without losing those rights to the lajger group". According to this UN Report, "the permissive individualistic aspect" of the customary land tenure practice is contrary to the misconception that African chiefs and community leaders have absolute control over community lands. Most customary land codes . . . dictate that the chiefs, as traditional heads, serve in administrative capacities to ensure that various clans and kinship groups, families and individuals receive their due share". The Report says that in African jurisprudence there is no clear-cut division between property and possession as is the case in English jurisprudence. But proprietorship per se is not really alien to some sub-Saharan countries. In this connection mention is made, among others, of Western Nigeria and Zambia.
As for the predominantly Moslem countries, the same source4 points out that tenure systems should be understood within the context of Moslem land law, which, however, often "has had to adjust itself to local customs". Although, according to Moslem philosophy, land is the property of Allah, the principle of land ownership and alienation is widespread.
The major elements of Moslem land law are: a. "Land may be resold prior to seizure or possession by the first purchaser, including all trees,
but excluding grains and crops unless specified. b. Leasing of land (ijara) is regarded by the Moslem land law as analagous to contract of sale
and as, after leasing the land, buildings and crops are not regarded as part of the land, the lessor can trespass on the land.
c. When land is lent, the borrower may build on it (for this was not uncommon in tropical Africa in the early part of the century), but when the lender receives back his land, he can compel the borrower to remove his house and trees.
d. When land is used as a pledge for money-lending, the pledgee has the right to use the land, according to one school of Moslem law (Hanafi and Shafii), so that in essence second mortgages are not permissible under Moslem law, but according to another school (Maliki), a pledgor can continue using the land pledged by arrangement with the pledgee.
e. Land used as a mortgage is considered as a conditional sale and the property is automatically transferred to the mortgagee in case of default. The mortgage may lease back to the mortgager and obtain rent, or what amounts to interest on his loan."
It cannot be denied that the emergence in sub-Sahara countries of proprietary ownership vis-ä-vis "corporate" ownership is the result of the high economic value currently attached to land and to population pressure on land, as stated in the UN Report quoted. However, this does not need to imply that further development should be directed towards a system of urban private land ownership, as is customary in Western countries. It is doubtful whether a system modelled on this example would be functionally compatible with major needs as evolving in the actual urbanization process in Africa. It should be stressed that the African challenge appears
Department of Economic and Social Affairs, Urban Land Policies and Land Use Control Measures, Volume I, Africa, New York, United Nations, 1973. Department of Economic and Social Affairs, Urban Land Policies and Land Use Control Measures, Vol. I, Africa, op. cit.
100
I

quite unique: low density, site and services urbanization, with built-in safeguards for orderly development and for later improvement. Concerning the last aspect, it should be noted that in many European and American cities new legislation is needed in order to satisfy the urgent needs for slum clearance, improvement and urban renewal.
Al this clearly means that in order to overcome urban chaos, any system of land legislation should be attuned to: 1. The provision of land at low cost for site and services schemes. 2. The weak financial resources of (local) governments, making it difficult to finance the
acquisition of large areas of land long before actual development. 3. The control of development directed at safeguarding minimum standards and the reserva
tion of "built-in scope for renewal".
In order to achieve effective control, a system of leasehold appears preferable over a system with site and services schemes leading to complete individual property rights. In this respect, an adaptation of age-long attitudes towards land in sub-Saharan countries might be an interesting solution.
The riddle of how to combine weak municipal resources with a system of leasehold (or freehold) instead of a proprietary system is surely a difficult one. A number of solutions are, however, conceivable; 1. Government-controlled lease contracts between owners and users, perhaps with a tripartite
arrangement under which local governments lease from owners and sub-lease to users. Some type of indexation should be considered. Other possibilities might be found in a strict planning legislation coupled with heavy taxation on land not brought under development as prescribed by the Government.
2. Acquisition of property, or long-term lease of lands to be used for residential purposes, by financial institutions working on behalf of the public interest, such as Savings and Credit Banks, pensioners' funds and social security. The right to use the lands might then be transferred to households on a lease basis.
3. Guarantee of the rights of users to continue the lease under reasonable conditions after the expiration of the first contract.
4. A lease system could be applied also in situations where the land is Government-owned, even when no compensation had to be paid. Concerning land for industrial purposes, Governments must be able to ensure that lands are used according to plans: transfer of ownership to the (local) government does not appear necessary in this respect.
5. Lastly, the cost and benefits of urban development (road building, sewerage, public open spaces and so forth) should be fairly distributed. In those cases where improvement in infrastructure is realized through self-help, the participants in such a scheme should reap the benefits.
Under any system, however, a clear registration of titles and other rights is necessary. It appears far from accidental that in many developed plans, also in countries in an early stage of housing policy, considerable attention is given to the development of a cadastral registration system, for instance, in Cameroun and Senegal.
Local Government
African countries have to discover how to meet the challenge of developing public (urban) planning legislation on the one hand and of laying down rights of land use in order to achieve adequate urban living and housing on the other. Without the creation of popular understanding of the issues described here, this task might well prove to be too exciting for any authority. It is also doubtful whether with the centralization of urban responsibilities in the hands of national governments sufficient results could be expected. Not only does the development of strong and popular-supported urban governments appear necessary. The great reliance that will have to be put on co-operative efforts in connective with site and services schemes seems to point out the creation of neighbourhood or district councils with a considerable amount of effective power and responsibility.
101

I mmmmm
i r\^
'
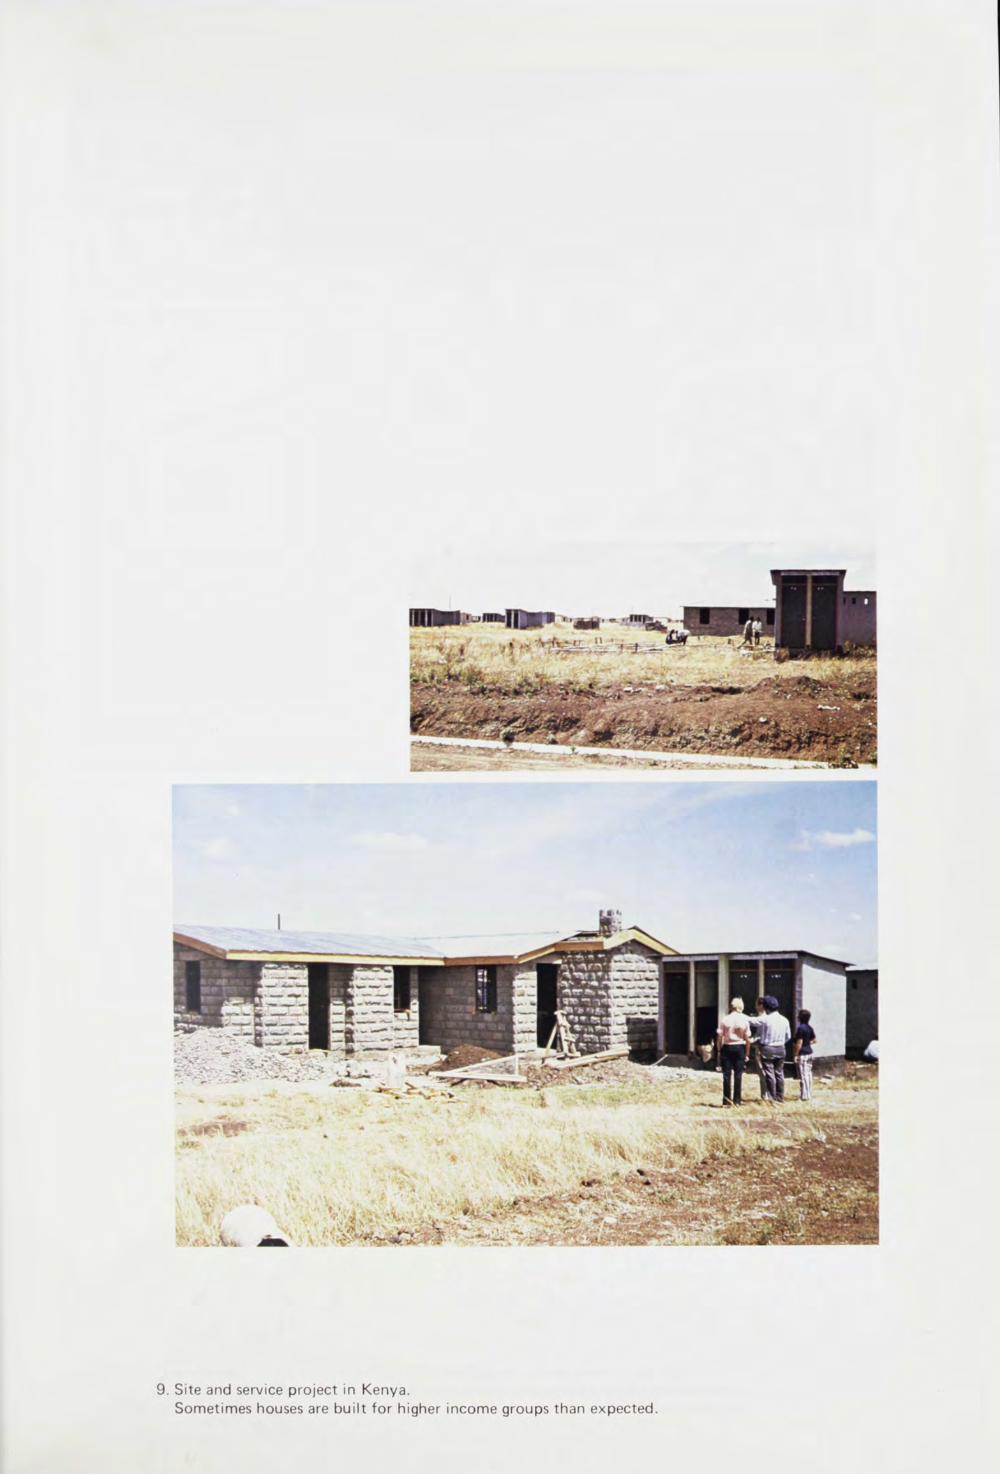
9. Site and service project in Kenya. Sometimes houses are built for higher income groups than expected.

10. Si te and service projects in Zambia in the di f ferent stages. The si tes are provided wi th to i let and water connect ions. Gradual ly the house is growing f rom a one-room uni t to an at t ract ive home.

11. Social and religious life and the work of the people take place in the open. The architect's task is to design for a community along with a private isolated territory for the household and its members.

12. New building materials have to be developed in order to meet the tremendous need for houses. In many countries houses are being designed with cheap and locally produced building materials as seen in this example of a timber house in Ghana and geobeton in Togo (pressed clay blocks with 5% cement).

PART 4 CASE STUDIES

CHAPTER 14. THE RESETTLEMENT IN PORT SUDAN TOWN
The Importance of the Resettlement Programme
Like many large and intermediate cities in Africa, Port Sudan, the seaport of Sudan, has experienced a large influx of immigrants from the rural areas. The population of the town has more than trebled during the past two decades thus showing an average annual growth rate of more than 6 per cent. Conventional procedures to absorb the immigrants have proved to be inadequate and in 1970 it was found that more than 60,000 people — that is, more than half of the population of Port Sudan at that time — were living in squatter areas. The environment in these areas was extremely unhealthy from both the physical and social points of view. Densities varied between 50 and 100 families per hectare, open spaces were used as rubbish dumps, and connections with the town's water supply system were missing. The shacks that the people had built themselves were made of waste-wood, cardboard, tins and rags. Employment opportunities were few and people could only afford the most basic foods and clothing.
In 1969 a resettlement programme was initiated that, in spite of a severe shortage of public and private funds, aimed at improving the living conditions of the entire squatter population. The implementation of this programme has been most successful and by 1975 as many as 40,000 squatters had been provided with the following basic services: — Security tenure of a plot of 200-250 m2 situated in official town extensions in which
sufficient open spaces are left for future construction of community centres, schools, mosques, shops, markets and other amenities.
— Public utilities and services, including connections with the city's water supply system (one tap per 150-250 families), surface drainage, garbage disposal and public transport.
— Assistance in re-erecting the original shelters on the designated plots; the original materials such as waste wood and tins have been used as much as possible, but rags, cardboard, etc. have been replaced.
This massive resettlement scheme demonstrates that even under the most unfavourable circumstances large-scale improvements of the living conditions of desperately poor people are attainable. The value of the programme relates not only to the better physical environment that has been created, but particularly to the mobilization and the stimulation of people who so far were hardly involved in any development. In the new settlements continuous improvements can be observed: Dwellings are extended; durable materials are used to replace waste wood and tins; and schools, markets and other facilities are gradually filling the open spaces. Subsequent social surveys point at the development of further activities by the local population.
These very positive achievements can particularly be attributed to: — Participation of the people, which is indispensable for any large-scale programme of this
nature. Participation was secured primarily because the rights, needs and resources of the people were fully recognized. Security of tenure and efficient assistance of concerned Government staff stimulated the people to seize the opportunity so that concrete results could be achieved at short notice. This in turn had a stimulating effect on subsequent schemes.
— The realistic assessment of the limits set by the extremely scarce available resources. Only the most basic services and amenities were provided and people were allowed to construct their shelter of whatever material they could afford. It was accepted that further improvements in order to meet prevailing standards would be gradually realized. This prevented the project coming to an early standstill and contributed much to the credibility of the Government efforts.
— The recognition that normal Government procedures are not suitable for dealing with a programme of this nature. For this reason an ad hoc Government team was appointed and the implementation of the programme was organised in such a way that formal procedures did not delay the actual rehabilitation process.
The implementation of the programme just described must be considered as only the successful beginning of a development process relating not merely to the squatter areas but also to Port Sudan town as a whole. However, it shows how the continuous participation of the people, a basic condition for sustained development of the region and its population, can be relied upon.
The National and Regional Setting
Sudan, situated in North-east Africa, is the largest country on the African continent with an area of more than 2.5 million square kilometers. Except for some highlands in the western and southern regions and along the Red Sea, most of the country lies below 500 m above sea level. The northern part of the country is desert or semi-desert with vegetation on narrow stretches

along the Nile and some wadis. In the central part vegetation consists of short grass and low-wood savanna merging into swamps, high wood savanna and tropical forests in the southern regions.
Population and Economy
According to the preliminary estimates from the last population census the total population was over 14 million in 1973. Compared with the figures of the 1955/56 census, showing a population of more than 10 million, this would mean an average annual increase of about 2 per cent. Considerable differences occur between the various provinces. The fastest growth has taken place in the Khartoum province (almost 5 per cent per year) and the Blue Nile province (almost 4 per cent per year). A more than average growth is also found in the Kassala-Red Sea province (more than 2.5 per cent per year), whereas the remaining northern and central provinces show annual growth rates of less than 2 per cent. The population in the southern provinces was stagnant or decreased. As in all African countries the urban population grew at considerably higher rates. For instance the population of Khartoum, the capital city of Sudan, increased to an estimated 850,000 in 1973; at a growth rate of 7-8 per cent annually. Growth rates of more than 6 per cent occurred in Port Sudan, the second city of Sudan, where the population in 1973 was estimated at more than 130,000. It is interesting to note that the vast majority of the urban population in Sudan was born in the province of residence and that apart from the most urbanized provinces Khartoum and Kassala/Red Sea urban immigration was limited mainly to movements within the provinces. For some further details about population and migration, reference should be made to Annexe 3.
Notwithstanding the continued urbanization process, agriculture is still by far the predominant occupation of the people of Sudan. In 1968 it was found that more than 70 per cent of the economically active population was working in the agricultural sector, about 15 per cent was employed in the public and private services sector, and less than 15 per cent in industry and handicrafts, construction, communication and commerce. The agriculture sector is much less dominating when measured in terms of contribution to the Gross Domestic Product. In 1972 the sector contributed less than 40 per cent to the GDP, and the public and private services sector roughly 45 per cent. The per capita GDP in 1972 can be calculated at roughly US$ 135. Some further particulars of the occupation of the people and of the relative importance of the different economic sectors are shown in Tables A3-I-4/5.
Port Sudan and the Red Sea Region
The conditions in the Red Sea region are typical in many respects for those prevailing in the vast areas of Northern and Central Sudan. The main sources of living of the population are agriculture and animal grazing, but both occupations are not very productive because of the infertility of the land and the unfavourable and uncertain climatic conditions. With a density of less than 5 persons per km2, the area is very thinly populated. Not much has been done so far to improve the physical conditions, so that the people, dependant as they are on the whims of Nature, have to struggle hard merely to survive. Only a few irrigation schemes have been developed where people grow cash crops next to subsistance crops. The traditional tribal and religious ties have not stimulated the people much to improve their difficult situation.
Response to education where provided is poor and health conditions are bad; in short, the picture is that of a backward rural society with very few economic and social resources at its disposal. Under such conditions it is not surprising that people tend to give up their tough and uncertain living in the countryside and move to the towns where they have been informed far better opportunities and unknown amenities and services are available. These movements are mainly directed towards Port Sudan, the capital city of the Red Sea province and the second city of Sudan.
Port Sudan Town, founded in the beginning of this century, is the only seaport of Sudan and is therefore of national importance. The ship movements expressed in terms of both the number and the tonnage of ships calling in decreased considerably after the closure of the Suez Canal in 1967, but it can be expected that the re-opening of the Canal in June 1975 will result in increased activities in the port.
The transport connections of Port Sudan with its hinterland, mainly Khartoum and Gezira, the major agricultural area in Sudan, are characterized by long distances and poor performance of the carriers. The majority of the import and export goods is carried by the Sudan Railways which frequently fail to deliver the required transport performance for various reasons. Measures to improve the efficiency of Sudan Railways are under consideration. Road connec-
104 tions with Port Sudan are dry-weather roads, but a bituminized road linking Port Sudan with

Gezira is now under construction. The envisaged improvements of the transport facilities will undoubtedly contribute to the further development of the port, and it can be expected that Port Sudan will become a more attractive location for industries. The port, the basic industries and the provincial government administration provide employment opportunities, and such a centre, surrounded by a stagnant rural area, cannot but attract many immigrants. Considering the gloomy prospects of the Red Sea region at short notice and the potentials for development in Port Sudan itself, an early decrease of this immigration cannot be expected.
The Squatter Areas of Port Sudan Town
Usually the tribesmen from the surrounding areas get acquainted with the amenities of town life in Port Sudan by visiting Deim el Arab, a native market that already existed before the port itself was built. Here they find an urban way of life in which they recognize many of their rural traditions, and here they meet their fellow tribesmen who have settled in the town. Here also they find temporary accommodation if they wish to settle down themselves, and from here they get assistance in finding their way to the docks and the other places of employment. As long as this migration was limited, Deim el Arab could continue its function as a reception area for new arrivals. But after 1950 the influx of immigrants grew steadily, and new arrivals who could not find accommodation in Deim el Arab or in the town itself squatted in nearby areas. The local authorities were unable to keep pace with these developments by providing legalized plots, water, sewerage and garbage disposal and other services, and in 1969/70 it was found that out of an estimated total population of 112,000 people, more than 60,000 people were living in various uncontrolled settlements, as shown in Annexe 3-II.
These uncontrolled settlements, called deims, provide an unhealthy environment not only from the physical but also from the social and cultural points of view. The density within the deims varies from 50 to 100 families per hectare, open spaces within and around the deims are mainly used as rubbish dumps, access paths are narrow and winding, and fire hazards are considerable, particularly since many of the shacks the people have built themselves are made of waste wood that can be cheaply obtained from the docks. People have to share their yards where many outdoor activities take place, such as cooking and sleeping, with cattle and poultry. The shacks themselves mostly have only one room which makes it impossible for the people to continue their traditional living habits characterized amongst other things by spatial separation of the sexes and hospitality to visitors.
Such a picture is known in many cities of all sizes all over the world and conventional approaches to improve the conditions in the deims here proved to be inadequate because: — public budgets were insufficient to provide urban services and public housing at what are
considered minimum standards, and in quantities that keep up with the amount of urban immigration;
— private financing resources were not available for low-income families who can only afford the most modest form of shelter; and
— public administration was unable to respond to rapid urban growth through inflexible procedures and sheer lack of manpower.
Adjustments of the existing financing and administrative procedures are not likely to be effective at short notice, nor are measures to curb the rural emigration and the stimulating of the urban economy, and consequently the economic resources of the deim population. Recognition of the fact that from such points of view as public health and social justice improvement of the environment in the uncontrolled deims was needed as quickly as possible has, however, led to the implementation of a rehabilitation programme that: — involves the population of all the deims, or more than half of the population of Port
Sudan; — recognizes the intimate relationship between environmental standards and available re
sources; and is organized with the maximum participation of the deim population in co-operation with small efficiently-operating teams of Government staff.
Scale and Standards of the Rehabilitation Programme
A very impressive aspect of the rehabilitation programme is that it involved within a few years the resettlement of as much as two-thirds of the population of the uncontrolled deims as surveyed in 1969/70. Between 1970 and 1974 some 40,000 people were provided with a plot, some basic services and assistance in building a one-room shelter. The materials used for these shelters were by and large the same as those of which the original shacks had been made, which implies a recognition of the economic value of these shacks, no matter how primitive. As can be seen from Figure 14-1 showing the changes of the map of Port Sudan during subsequent biennial

Figure 14-1 Lay-out Port Sudan 69-70, 70-71, 72-73, 74-75 and 75-
t "'4. N
'//y/'/s N
k'^ ////A.«—1
t
n

Old Town
Industrial Area
Squatter Settlements
M Organisation Deims
Site of Improved Deims/.
| | Sites and Services^,
% \ M r » *
m w\ \ 1̂ %

periods, the scale of the operations in the context of the city is considerable. It is noted that the resettlement of the remaining 20,000 people, to which by 1975 some 10,000 more people have to be added, is envisaged as from 1975. However, the selection of suitable sites has been delayed pending decisions on the extension of the city's water supply system. When such a massive programme is to be implemented in a city like Port Sudan, where national and local resources are scarce, the improved environment can only be of the most modest standard.
The major improvements that have been realized are the following: — Security of Tenure
In Sudan major pieces of land within townships and municipalities are government building land that can be used in various ways on a leasehold basis. Disposal of government building land is covered by the Towns Land Scheme of 1947 and the Village Lands Scheme of 1948 (as revised in 1950). Distinction is made between 1st class, 2nd class and 3rd class building land, mainly depending on location, and differing in rent and period of tenure. Areas which "have been duly constituted native lodging areas" are known as 4th class areas. The squatters who have been found living in the uncontrolled deims, be they owner or renter of a shack, are given the legal right to occupy on leasehold basis this government building land (one plot per family) located in an area planned for housing. The leases that are free of charge, have to be extended every year, but it is envisaged that at a later stage the resettlement areas will be upgraded to a 3rd class area. The importance of recognizing a squatter as a citizen by giving him the legal right to occupy a place can hardly be overestimated.
— Plots and Public Open Spaces Each family qualifying for the resettlement programme gets the right to occupy a plot of 200-250 m2. The plots are arranged in blocks up to 20 units separated by access roads with a width up to 10-12 m. Such a width allows the use of the roads as playing grounds and gathering places. The roads furthermore protect the mostly timber shelters against the spread of fire. Further open spaces are distributed all over the new settlements, with other spaces being reserved for the future construction of such buildings as primary and secondary schools, health centres, markets and shops, mosques, police stations and community buildings. The building of public latrines, dressing rooms and dispensaries through self-help is part of the resettlement programme, the staff and the equipment of the health facilities being provided by the Ministry of Health. The construction of primary schools, again through self-help, has a high priority, but it is not included in the actual programme. The keeping of cattle is concentrated in large stables, where better control of the production of milk and meat is possible. The gross density of the new settlements is such that future upgrading of the area is possible. An overall plan of a new settlement and a more detailed neighbourhood plan is shown in Figure 14-2.
Figure 14-2 Typical Lay-out of a Resettlement Area

- Public Utilities and Services The connection of the new settlements with the city's central water supply system is included in the resettlement programme. The cost of mains, house connections and taps is prohibitive for the supply of water to each individual plot at this time, so communal standpipes are provided, each serving as many as 150-250 families. But the system permits a future increase of tapping points. Further public services provided within the framework of the resettlement programme include surface drainage (open ditches along the roads), garbage disposal, police protection and bus services. Like the water supply, these services are of minimum standards.
- Improved Shelters The original shacks are mostly made of waste wood that can be cheaply obtained from the docks. Also cardboard and tins tied together to form some sort of building element are used. Only very primitive provisions for sewage disposal are available. Within the framework of the resettlement programme, assistance is provided in removing the original shacks and erecting at the designated site a shelter with a dimension of 4 x 4 m2. The original materials, insofar as they are timber and tins, are used as much as possible, and at a small charge additional materials are provided as required. The location of the new shelter allows an easy extension in the future. Sketches showing some typical layouts of future extensions are given in Figure 14-3. The people are also instructed how to make provisions for the disposal of waste water and sewage.
Figure 14-3
3 - R O O M E X A M P L E 4 - R O O M E X A M P L E

As can be concluded the shelters in the new settlements are still primitive and only slightly improved shacks, set in a still rather poor environment. However, sticking to standards that are beyond the means of the people prohibits any rehabilitation on a massive scale. The few improvements that have been realized within the framework of the resettlement programme in Port Sudan of which the provision of secure tenure seems of outstanding importance, will encourage the people to continue the upgrading of their property and their community.
The Organization of the Programme
The rehabilitation of human settlements like the uncontrolled deims in Port Sudan cannot be achieved without the full participation of the people involved. From an economic point of view the importance of participation can be conceived in terms of utilization of the only abundantly available resource, that is, the under-employed manpower. But participation is much more than that. It provides, as in the case of Port Sudan, deprived and desperately poor people the opportunity to get their definite share in the fruits of development by making their own shelter and improving their immediate environment. When basing programmes on the participation of people great care has to be exercised. There are numerous examples of disappointing experiences in spite of the good intentions and concerted efforts of public and private agencies.
Two major reasons appear to underlie the successful mobilization of the deim population of Port Sudan. Firstly it was fully appreciated that at any time the resources of the people determine the standard of their shelter and environment. The deim population felt that the new settlements to be created were within their immediate reach. Secondly, equally important, it was recognized that fast results were required so as to maintain initial enthusiasm and momentum. Usual Government procedures designed to deal with matters quite different from massive rehabilitation of settlements are generally speaking inadequate, so that such procedures have often resulted in lengthy preparation but few achievements. For this reason the preparation and the implementation of the resettlement schemes in Port Sudan have been kept out of normal Government routine. A small team of Government staff, including social surveyors, planners and architects, appointed on an ad hoc basis, closely co-operated with the representatives of the deim population. Formal procedures required for such actions as legalization of leases have had no impact on the time schedule of the actual programme.
The whole organization may best be explained by summarizing the schedule of operations for the rehabilitation of a deim as follows: — Carrying out a socio-economic survey and assessment of the existing building structures, so
as to obtain the required data for the design of the new settlement and to enlist the households eligible for a plot. Owners and renters of existing shacks were accepted, but absentee owners and new squatters who squeezed into the deim during the preparation process were excluded. The survey was carried out by a Government team composed of a social surveyor, a planner and an architect who could survey up to 1000 families per month. The experience of being in the deims and discussing with the people their circumstances and expectations was found most valuable by this team.
— Designing of a new settlement on the basis of the findings of the socio-economic survey. Draft plans were discussed with the population of the deim and amendments agreed upon by the people were included in the final plan which was then sent to the Central Planning Authority in Khartoum for formal approval. Simultaneously, lists of prospective plot-owners were prepared and their contribution to the programme in terms of money and man-hours was discussed. This stage, in which the Government team played a central role covered some two to three months in total.
— Preparation of sites, including the pegging out of plots, the digging of trenches for surface drainage, the laying of water mains and installing standpipes, and the building of temporary public latrines. The general work was carried out by the prospective plot-owners, guided by the Government team, while water mains and standpipes were installed by hired plumbers. Simultaneously, the financial contribution from the prospective plot-owners was collected, amounting to some 2 per cent of their annual income. This money was used to cover some out-of-pocket expenses such as the hiring of equipment and the purchase of building materials on behalf of the poorest people, all in addition to similar facilities provided by the local government.
— Transfer of existing shacks to the new settlements. Per day 50-80 shacks were disassembled, the usable materials (waste wood and tins) transferred on lorries and carts, and the new units, consisting of one room only, rebuilt on the designated plots. Additional materials were provided to replace cardboard and rags. The work was carried out by 150-200 men at a time, organized in small groups and assisted by skilled carpenters as required. Each household, therefore, was required to supply about two man-days. The whole operation was directed by the Government team. During the day of transfer, accommodation was provided for the families involved. After the operation, the families
110 were given a lease certificate and a model plan of a complete house.

— Finalizing administrative procedures, such as the formal registration of leases and the inclusion of the new settlements in the official town plan.
The whole operation as summarized covered 8-10 months depending on the size of the deim. The organization of the process was least complicated when the new site did not overlap the existing site, but in the case of overlapping organizational problems could be solved by firstly preparing overspill areas. Government subsidies were limited to the supply of land free of charge, of water mains and standpipes and of some municipal labour and equipment.
Probably the most important Government contribution was provided by the staff in charge of the organization of the whole process, spending much effort and inventivity to carry on the programme in spite of difficult circumstances and scarce resources.

CHAPTER 15. THE PROGRAMME FOR THE UPGRADING OF SQUATTER SETTLEMENTS IN LUSAKA
Housing Policies in Zambia
Present housing policies in Zambia stress self-help and self-reliance and so conform with the traditional way of life of the Zambian people. Families are accustomed to providing their own shelter and government housing programmes aim at supporting people's efforts so as to contribute to their continuing development. Above all, these programmes recognize that man only can and will respond to new impulses if these are related to his aspirations and his resources. The provision of urban shelter clearly demonstrates the potentials of government-assisted self-help. It also shows how public attitudes are in a process of continuous change under the pressure of developments that are beyond government control, and how such changes are incorporated in successive housing programmes.
Demographic and economic structure
From its colonial past Zambia inherited an uneven population distribution and an unbalanced economic structure, in which copper mining predominated. The population concentrated in the so-called line of rail, a stretch of land along the railway from Livingstone on the southern border with Rhodesia through the capital city of Lusaka, to the Copperbelt cities in the north. Already in 1964 when the country became independent the level of urbanization was as high as 20 per cent. After independence, this tendency continued at an accelerated rate of change. Rural-urban migration was greatly encouraged by the removal of the restrictions on migration imposed by the Colonial Government, the increasing job opportunities in urban areas resulting from expending public and private activities, and the widening gap between urban and rural incomes. The importance of this process can be seen from the considerable differences in the population growth within various regions.
Between 1963 and 1969 the total population of Zambia grew at an average annual rate of about 2.5 per cent from slightly less than 3.5 million to somewhat over 4 million. Annual growth rates, however, in the Copperbelt and the Central Province were 7 per cent and almost 6 per cent respectively. This growth was largely directed towards Lusaka that has experienced an average annual growth rate of more than 13 per cent and to the Copperbelt cities that have grown at a rate of more than 7 per cent. All other provinces show annual growth rates of less than 2 per cent, whereas in two instances even a decline of the population was found. For some further particulars, reference should be made to Annexe 4-1, Table 1-1.
Notwithstanding the rapid urbanization in Zambia — in 1969 the urbanization was almost 30 per cent — agriculture is still the predominant, though little rewarding occupation of the Zambian people. As shown in Annexe 4-1, Table 1-2, in 1969 about 45 per cent of the people who had paid employment was engaged in agriculture, but the contribution of the agricultural sector to the Gross Domestic Product was less than 10 per cent. Moreover, the rate of unemployment, or rather underemployment, in the rural areas appeared to be high as compared with the urban areas where unemployment varies between 10 and 15 per cent.
There is a growing imbalance between the incomes of the urban and the rural population, in spite of the very low population densities and the favourable climatic and soil conditions for agricultural potential. In this connection mention is made of present attempts to stimulate the rural development by focussing efforts on so-called intensive development zones. It is hoped that by simultaneously improving agricultural productivity and providing better services in such zones the still massive rural-urban migration can be curbed.
As indicated above, copper mining is the predominant sector in economic terms. In 1969 mining contributed roughly 40 per cent to the Gross Domestic Product and about 95 per cent to Zambia's export. However, sharp fluctuations in both the output of the mines and the world copper prices seriously hamper the continuity of Zambia's development efforts. The problems are aggravated by the difficult transport position of the land-locked country that previously had closed its border with Rhodesia and presently experiences the blockade of its transport lines through Angola. (Annexe 4-1, Table 1-3).
Implications for urban housing
At an early stage the Zambian Government recognized that, due to its limited resources, the growing needs for urban shelter could not sufficiently be met by government built and owned low-cost housing schemes. In the First Official Housing Programme adopted in 1965, funds
112 were set apart to enable the local authorities to subsidize not only complete low-cost houses.

but also serviced plots on which the houses were to be self-built. This tendency continued in successive development plans and housing programmes. A continuously increasing proportion of the funds were allocated to the provision of serviced plots, different sets of standards were introduced with communal next to individual services, and loans for self-help were made available. Such policies developed under the mounting pressure of the tremendous urban immigration, and they resulted in a large increase of the urban low-cost housing stock.
In Lusaka, for instance, the Government, mainly through the Lusaka City Council, succeeded in more than doubling the low-cost housing stock during the first decade after independence. As shown in Table A4-II-1 between 1964 and 1973 about 12,000 units were provided, about half of them as complete houses and the other half as serviced plots. For some particulars of different schemes see Tables A4-II-2/4.
Notwithstanding these commendable achievements the provision of housing could not keep pace with the exceptionally fast growth of the population of Lusaka. Between 1964 and 1973 almost 20,000 households were not able or willing to move into official housing areas and squatted in uncontrolled settlements. Although such massive unplanned developments create problems from the point of view of efficient town lay-out and public health, the opinion gained ground that they represent assets both in social and financial terms. At various levels of public thinking it was recognized that, in line with the concepts of self-help and self-reliance, the best future approach would lie in improving squatter settlements rather than forced resettlement and demolition of good and bad houses alike.
This is reflected in the present policies laid down in the Second National Development Plan (1972-1976) that, amongst other things, aims at: — Improving the standards of rural housing and regrouping of villages so as to facilitate the
provision of services; — responding to the increasing needs of urban low-income housing by almost exclusively
providing serviced plots of varied standards; — encouraging private home ownership and assisting public and private employers in con
structing staff housing; and — upgrading uncontrolled settlements and controlling further unauthorized developments.
In line with this policy is a large scale upgrading sites and services programme consisting of the servicing of as many as 17,000 dwellings in existing squatter settlements and of preparing and servicing 12,000 new residential plots. This programme is presently being undertaken by the Lusaka City Council with the assistance of the International Bank for Reconstruction and Development.
The Opportunities for Upgrading the Lusaka Squatter Settlements
More than any other housing programme the upgrading of existing settlements interferes with developments that already have been set in motion by the people themselves. Participation of these people, then, can only be expected if the components of the programme will provide new

impulses to their continuing development. In this light, full awareness of the resources and the aspirations of the people and their social and cultural conditions are of utmost importance, next to considerations of general town lay-out.
General town planning aspects
The city of Lusaka sprawls over about 360 km2 of municipal area. Around the central commercial area major low-cost housing areas are situated in the north-western sector and middle-class housing areas in the south-western sector. Here also the major squatter settlements are located. The south-western sector consists of high-income housing areas and government officer and the north-eastern sector of the high-class townships of Chelston and Roma, the National Assembly, the university and the airport. Also in the eastern sectors smaller squatter settlements are found.
Figure 15-1 Lay-out of Lusaka, Types of Settlement
As indicated on the map of Lusaka, shown in Figure 15-1 two types of squatter settlements can be distinguished; — Urban settlements situated in relation to areas of employment and main services. These
mostly high density settlements offer a wide range of opportunities for individual development at various levels of investment.
— Rural settlements, mostly isolated small communities of low-density development, usually surrounded by extensive areas of cultivation. They offer the opportunity for subsistence living with minimum investment.
It is of major importance to consider such basic social and economic characteristics of squatter settlements when conceiving an upgrading programme, because any fundamental change in the nature of the settlements may only result in people simply moving to another place where they can continue their preferred way of life.
Upgrading of the major unauthorized urban settlements is presently undertaken with the assistance of the International Bank for Reconstruction and Development as mentioned before.

Principal selection criteria were: — Proximity to existing employment, public facilities and available services; — suitability of sub-soil condition for eventual sewer installation; and — conformity with the Lusaka Development Plan.
The large settlements near the industrial area in the north-eastern part of Lusaka viz. George, Chaisa, Nguluwe, Cipita, meet these criteria. Rocky soil conditions in Chawama, south of Lusaka, make the area unsuitable for housing development, but the complex is included in the programme because it is one of the most established settlements where people have a keen interest in their future development. Two other major squatter settlements, viz., Old Kanyama and Kalingalinga, are not included as the areas are reserved for industrial development and cultural use respectively under the Lusaka Development Plan.
Two rural settlements are under consideration for upgrading and further development at a later time, i.e. Bauleni and Chainda. Both are located in areas reserved for agricultural purposes, and they appear of a permanent nature in conformity with the Lusaka Development Plan. Water can be supplied through boreholes with high potential yield. Initial upgrading could be restricted to providing two of these boreholes operated by hand pumps and to surfacing of access roads. Future upgrading could include the replacement of hand pumps with mechanical pumps and water reticulation from storage tanks to communal standpipes. Faecal disposal could be continued through pit latrines provided that the density will be left below say 20 houses per hectare. Both settlements show how unofficial efforts can anticipate officially desired developments.
Population and housing in the squatter settlements
From the many surveys on the squatting phenomenon in Lusaka, some of which are summarized in Tables A4-III can be seen that the inhabitants of the squatter settlements by and large represent a cross-section of all residents of Lusaka. For instance, the rate of unemployment among householders in squatter areas is generally well below 10 per cent. About 75 per cent of the householders are employees and some 15 per cent of them are self-employed which is almost twice as high as for Lusaka as a whole. Incidentally, one quarter or mpre of the employment is found in the construction industry, this relatively high proportion reflecting the origin of most of the squatter settlements as temporary settlements for construction workers. The proportion of production and related workers in the squatter settlements is high when compared with Lusaka as a whole in contrast to the low proportion of professional and administrative workers.
The income distribution in the squatter settlements corresponds closely to that in all low-cost housing areas, with modal monthly incomes mainly between ^40-50.' Additional household incomes include housing allowances, earnings by household members other than the household heads and earnings from sub-letting. Outdoor domestic and social activities, ceremonies, and traditional dancing held with the co-operation of tavern owners show the vivid spirit of the squatter communities and also indicate an extension of traditional Zambian values in the urban situation.
1 K (wacha) =100 Ngwee » 1.5 US$.

The majority of the houses in the squatter areas are lived in by the owner who built the house himself. But as the housing market develops with the age of the different settlements, considerable numbers of houses are bought and sold. The amount of the rental housing, let either by residents of the settlements or a growing number of absentee landlords, is increasing. The houses themselves usually are small, the majority having only one or two rooms. Overcrowding, that is to say, the sharing of one habitable room by more than 2 persons is experienced by about two-thirds of the population.
In 1969 a high proportion of the houses were found to be constructed of permanent (burnt brick or concrete blocks) and semi-permanent (sun-dried bricks) materials. Since then this proportion is expected to have increased considerably. Continuous improvements include the replacement of grass roofs and the building of concrete block shells around existing structures. These changes are also reflected in the costs of the structures. Surveys carried out in 1964 showed that the majority of the houses were in the cost range of K20 to K50. At present the cost ranges are much wider, pointing to the increased use of more durable materials and at the confidence of the residents in their future security.
The major problem in the squatter settlements is the poor quality of services or the incomplete absence in some cases. With the exception of one settlement, none has piped water; water is obtained from shallow wells shared on the basis of about 10 houses per well, and in limited quantities from Government tankers. Faecal disposal is through pit latrines, each of them normally shared by two households. Due to the close proximity of these pit latrines to the wells, the water is heavily contaminated so that there is a continuous danger of a serious epidemic.
Educational facilities are particularly scarce, with nearly two-thirds of the children unable to secure a place in school.
In order to complete the picture of the environment in the Lusaka squatter settlements a small group of houses in the George settlement is shown in Figure 15-2 while in Table A-IV-1 more details are given about the different squatter settlements.
Local leadership
An important role in the squatter settlements is played by UNIP,2 the political party of Zambia. Locally-elected UNIP officials provide leadership and exercise control on the course of events in the settlements, thus performing part of the duties normally assigned to the local government. For instance, a newcomer to a settlement is introduced to the local leadership without delay, and if he is accepted he will be granted permission to occupy a plot and construct a shelter according to certain instructions. Such instructions cover the location of the shelter (with a view on the easy provision of possible future services) and the use of building materials. It has been found that a large majority of those who had built their houses themselves and a considerable minority of those who had bought their houses had done so after they had obtained permission from the local UNIP leaders.
Another noteworthy activity of the UNIP leadership in the squatter settlements is the provision of primary education. Relatively few children from the squatter settlements have access to the Government-run schools, as all these schools except one are located outside the squatter areas. The UNIP-run schools are fee-paying, unlike government schools, with fees ranging from 20-45 NgvVee per month to provide the salaries of the teachers.
Under the leadership of UNIP, self-help has become a part of the way of life in the squatter settlements. Not only are houses continuously improved and schools managed, but clinics are built, roads and drainage are maintained, and support is provided in emergencies. All this contributes to a strong sense of cohesion, stability and pride within the communities, and people appreciate the convenient housing and the proximity to places of employment. The most urgently felt need is piped water, followed by improved roads and sanitation.
The components of the upgrading programme
The existing and continuously developing social, economic and organisational resources of the squatters should constitute the basis for Government assistance in providing them with basic services and facilities. This assistance is seen as maintaining the self-reliance of the families and contributing to the full integration of the settlements in the whole of the city. Therefore
United National Independence Party. 116

Figure 15-2 A House Group in George
T-TTT
VVft̂ f \ -T
-f
**IW* i f r-i... /
mü
rT^r^V • .0.
.^-ff Ü 'r-^T^-TT-
1 1 7

services and community facilities should be introduced into the squatter settlements, so that the residents will eventually be able to obtain the same standard of provision as in other, fully serviced, residential neighbourhoods.3
But it is recognized that, because of financial and organizational constraints, a phased approach is necessary, to achieve these standards. In the first phase, with which the present upgrading programme is concerned, one water standpipe will be provided for every 25 families, but the pipes are sized so that every house will eventually have its own water supply. Sewage will be disposed of through pit latrines to be provided by the individual families. Main bus routes of 6 m width will be bitumenized and internal roads of 4 m width will be gravelled; surface water drainage will be through open ditches; security lighting consists of 2 single lamp standards per ha; and periodic collection of garbage will be provided.
In addition, new primary schools will bring school places on a level with the other neighbourhoods of Lusaka. Existing markets will be improved and new ones added up to a standard of 1 market per 10,000 people. Multi-purpose community centres will be provided up to the same standard. A health centre will be built in each of the major complexes to be upgraded. Further small industrial sites to accommodate tradesmen such as carpenters, repairmen and metal workers will be provided both within the existing complexes and on the periphery. Of primary importance to the individual families is the security of tenure provided under the Housing Act (Improvement Areas and Statutory Housing Areas) that was recently adopted. This legislation enables tenure to be established for at least 25 years in upgraded areas and the length of leases for serviced plots increased to 30 years. It further simplifies the registration of land title and regulates the transfer and inheritance of plots. It also enables the Ministry of Local Government and Housing to administer by regulation specific terms of tenure, building standards and the use of plots. The above servicing is applied to some 17,000 shelters in four existing complexes and to about 7,600 new plots in three overspill areas. The latter are provided to accommodate those families who must move from the settlement because of the input of services and facilities and because of de-densification.
Besides upgrading and servicing as just described, the programme also includes the preparation and servicing of some 4,400 plots in six sites designated for sites and services. Initial standards here are higher than those applied in upgraded and overspill areas. The programme further provides for the supply of building materials. For this purpose loans will be made available at a level of K 100 to families in upgraded areas, K 250 in overspill areas, and K 525 in other sites and services areas. These amounts are equal to the cost of building materials for at least a two-room expandable dwelling of the various minimum standards required.
Finally, the programme includes the extension of primary infrastructure amongst which are a new water distribution grid and related works, a local distribution main from the Lusaka Water Works, sewer and stabilization ponds, road extensions and garbage removal equipment.
The total cost of the programme is estimated at about K 26.5 million, including technical assistance and price contingencies. The cost of on-site servicing is about 20 per cent of this amount, one-third of this for upgrading and servicing of overspill areas, and two-thirds for servicing of the other sites and services areas. Community facilities require some 20 per cent of the total amount and the supply of building materials somewhat over 20 per cent. The remaining 40 per cent will be spent for primary infrastructure — over 10 per cent —, technical
3 Lusaka Sites and Services Project. Request to the IBRD prepared by the National Housing Authority, July 1973, Volume 2, p. 5-67.

assistance — somewhat less than 15 per cent and physical and price contingencies - between 20 and 25 per cent.
The development cost per plot — including on-site servicing, engineering fees and contingencies have been calculated at K 130 in upgraded and overspill areas and at K 467 - K 1325 in the other sites and services areas, depending on the standards applied. Monthly charges, on the basis of 7.5 per cent interest and a repayment period of 30 years, amount to K 0.90 and K 3.25 - K 9.25 respectively. Monthly charges for the repayment of building materials loans, on the basis of 7.5 per cent interest and a repayment period of 15 years, amount to K 0.94 in upgraded areas, K 2.35 in overspill areas and K 4.90 in the other sites and services areas.
Some Aspects of Implementation
In planning the implementation of the upgrading programme, it has been recognized that such a programme can only be undertaken successfully if the full participation of both the people in the settlements and the relevant public and private agencies is secured. In this context the organizational framework with its implications for on-site operations is of major importance. Equally important are the effects of the components of the programme on the individual households and on the social and economic patterns.
The Project Unit
The implementation of the major components of the programme is taken care of by a Project Unit established especially for this purpose. This Project Unit has the status of a department within the organization of the City Council, and its Director reports directly to the Lusaka City Council Finance and General Purpose Committee that deals with all matters relating to the programme at the city level. A newly-established Interagency Steering Committee facilitates the co-ordination at the national level.
Two major reasons have led to the establishment of the Project Unit: — The nature of the programme is different from any other Council programme. Efficient
implementation requires direct communication lines with many public and private agencies at the national and the local levels, particularly with the appropriate units within the UNIP structure.
— The implementation of the programme requires efforts over and above existing efforts of the civil service. Additional staff is needed which may partly be appointed on a contract basis for the limited period of implementation.
The Project Unit itself is divided into three divisions: the finance and procurement division, the engineering division and the community development division. This last division has established close co-operation with the Local Ward Development Committees, part of the UNIP structure. These committees are composed of representatives of the communities and are chaired by the local city councillor. Through this set-up close co-operation between the Project Unit Staff and the people in the settlements, who are all organized in small units within the UNIP structure, is made possible.
On-site operations
On-site operations are initiated by personnel of the community development division of the Project Unit. They first hold briefing meetings where information about the upgrading programme is given, and where the residents may make suggestions of personal and common interest. The results of the briefing are reported back to the Project Unit. Next the engineering division prepares a plan and the proposed roads are pegged out in the field. In consultation with the leaders and the rest of the community possible amendments are discussed till an agreement is reached. The plans are then worked out in detail. Those families that are affected by the proposed roads and the other inputs are consulted about their forthcoming move to the overspill areas. Exchanges with unaffected families can be arranged as required.
Experience so far has shown an increasing interest in occupying a plot in the overspill area and in applying for a building materials loan. It is intended that the construction of dwellings is done by self-help under the guidance of expert personnel of the Project Unit. But since most of the householders are fully employed, they only have time for building during the weekend. There is a strong tendency therefore to use hired labour for which, however, no financing facilities are provided. Thus for not a small number of families it is difficult to find the required time or finances for construction.

Some other problems may arise from the tight timetable of the engineering operations which is necessary to curb cost increases. Tuning of the residents' participation in the programme to this timetable is, then, difficult, and can be a great strain on the community development workers and the local leaders. At this stage, when the implementation of the programme has just started, possible problem areas can only be roughly indicated, but it can be expected that the further experiences will be of much value for the planning and the implementation of similar programmes at other places.
The evaluation of the upgrading programme will be equally valuable. Evaluation is seen as measuring the degree to which the goals of the programme are fulfilled by analyzing both its anticipated and unexpected effects. These goals are to improve the standard of living in the squatter settlements, to involve the residents in decision-making processes, to provide security to the squatters, and to integrate the settlements into the city as a whole. In brief, the programme aims at contributing to the sustained development of the squatters, which is a tremendous challenge to all concerned.
120

CHAPTER 16. HOUSING IN TUNISIA
Principal Characteristics of the Country
Tunisia is situated at the crossroads of the Mediterranean and is bordered by Algeria and Libya. The area is 164,150 km2.
Demography
The population is 5,600,000 (1975), with a natural increase of 2.3 per cent, and an actual increase of 2 per cent. The average Tunisian family is 5.07 people. The distribution of the population by age in per cent is:
Table 16-1
0 - 14 43
15 -24 21
2 4 - 6 4 32
65+ 4
This shows that 64 per cent of the population is less than 25 years of age.
Geographical distribution
More than 40 per cent of the population are town dwellers. Especially is the conurbation of Tunis causing extremely difficult housing problems. During the period 1966-1971 the exodus from rural areas to the towns rose rapidly. In Southern Tunisia and in the east (Southern Steppes and Haut Tell) the movement towards the towns was particularly high. In 1975 20 per cent of the population was concentrated in the two provinces of Tunis. The rate of increase in population in Tunis is 4 per cent per year.
Economic aspects
GNP (Gross National Product) in 1974 was US$ 550 per capita (in current market prices).1
Housing Policies
Situation in 1974
In the ten year period 1962-1971, 104,000 homes were built at an investment of 187 million dinars. The State participated in the programme by building 38,000 low-cost houses. The census of 1966 taking place during this ten year period made it possible to gain a better insight into the housing stock, the main characteristics of which are as follows:
1 "Le Monde", 4-2-1976.

Table 16-11 Housing Characteristics according to 1966 Census
Type of Housing Numbers % Average number State of occupation of persons per dwelling Owners Rented Parents Patrons Others
Private houses 355 000 40.6 5.45 70.3 17.2 5.1 3.1 4.3
Flats 34 000 3.9 4.43 14.0 78.7 1.8 2.7 2.6
Collective housing 100 000 11.4 4.77 57.0 57.0 12.1 1.3 2.6
Huts 347 000 39.8 4.93 80.7 4.1 5.6 4.2 5.1
Tents 17 000 1.9
Others 21 000 2.4
Total 874 000 100 4.89
For points of the census of 1966 and 1975 see Figure 16-1. During the past ten years, a little more than 10,000 units per year have been built but the marriages in the same period were around 30,000 a year.2 Thus the results in this field of housing are important, but far from being enough.
In the 4-year plan, 1973-1976, the following reasons were given to account for the slowing-down of the housing sector during the ten-year period: — Land problems which had curbed the realization of the programme. — The imprecise role of each participant, particularly in the communal schemes. — The shortage of building materials. — Technical problems and problems relating to normalization and standardization. — The lack of facilities for study and finance for the infrastructure. — The lack of financial programming.
With the intention of easing these difficulties the Plan has recommended the setting up of specialist organizations (land, finance and construction). It foresees the building of 71,000 housing units of which 44,500 will be State assisted (representing 42,500 or 95 per cent of economic housing of which 20,000 are rural dwellings; 10,000 suburban dwellings and 12,500 economic housing units).
During the years 1972, 1973 and 1974, 28,000 houses were built. Figure 16-2 shows the number of houses annually constructed since independence in both the private and public sector. It is hoped to build 37,000 dwellings per year in order to stabilize the housing deficit by 1981.
Organizations created during the planning period 1973-76
a. Land policy The speculation which exists regarding land is strangling the realization of the housing
programme as it leads to hold-ups and an increase in the cost of developing urban areas. The Land Agency for Housing, Industry and Tourism was created to acquire, divide and distribute land situated in defined zones, that is to say, for housing, industry or tourism. The Public Bodies of an industrial and commercial nature are: 1) Agency for housing land (AFH). 2) Agency for industrial land (AFI). 3) Agency for tourist development (AFT). The tasks of each agency are laid down in a special enactment.
Commission Nationale Sectorielle de l'Habitat et de l'Urbanisme, The 4-year plan, 1973-1976, Tunis, 1973.

Figure 16-1 Housing Census 1966 and 1975, as published in "La Presse" (newspaper)
to Press* pvy • g »At 1975
' ^ y y . y j , siilaidil TO TO®?? yv9&9MS i | RECCSSWENT SDßiÄt D£ LA
PSMiLST^ETKS LOGtMENTS
41 111 m J k l Z £ U 3
I B T S
ouFsriCNR "Ostes
P8EÜSEZ LZ TYPE DE LOC,E"EflT Reponsßs possiiXfsn
-- Vmr. taafeo* be-1
v- Kvbii&tkjr.# ifoxicrv
itmimZ LES MATERIAVX ST.: 3 POM LA CONSTRUCTION DES MUMS ET DES WITS
possfeies
— ?V' -•
r'; •;•-•;,;• •••
--• T ««>•;• — C f v t i *
-• afaff1. sy®i
• 5 - • SK» ~ 7«tt4 '4-— Awlr^s
mD'C'TZ SI LE LOCEMENT EST POURVV:
— cfüfte — ri «n W C — d one soMc bcin «nsroijee •— d'une ciu^rns — d'ur« pasts
INDlOm LB NOMBM BE PIECES DMBITAWN QUE COMPORTE
LE LOCEMEMT
RECENSEMENT GENERAL DE LA POPULATION ET DES LOGEMENTS 8-29 MAI 1975
L®s lecteufs trouveront '.«s ooest.o«s qui sero^t oosees ou* cttoven* peodnnt tourrt^s cJu roc«nsemen( afm quSls »oient owerl.s de Ja ^ at urn des ren*^^nf!m#«n?s Jf? marshes et rossure» qu» ces rertsejQnefneftH ne se rappori<jr>t nuOero«nt o do* socrnts dont i's cr<siQ»eRt }o cfivu'gotlon
L«s Isctewrs trouveront egaJemenl des precision?, sur «es touts recherche* por Je n censement
Pour <Huslrer '.'•^oortonce de c«s questions --»us puta'Jcns por o»?i«urr. ies reeuttots recueili'S o portsr des reponses de» c«tOYens»ors des precedent» recen- ome^ts
1975
tvmtttäM WMiMt*
. mmnm täMWm
mmnm*
mwmitH*
mmmm*
'VP»Wj^iw> Oil
LE LOGEMENT BUTS Des OUfcSTlONS
Oeou»s 1^53. 'e mw^frmrr de '»a OT...1-; Hon q et#- coinp-f' por v- f&&e^e!ven' des '5ccjen>er»5.;. d#- section df? donrier ane re?»'^ d©$ tfucture' iM »'hobltot ®» vue fie vonnoitre y-- f «-•• • xkjns de ?ogement do <0 rv>i v. <3fir»n d: ! 1
different^*? r^tlon^ n* d'-TT^^er i<s pc-"que dü povs en ce cJcjr?o»r-?
Ces r«r;^lfjm«T>en*P onr^A^^ r • d'-ioor^-cier ?e d^r:' de v:
do compter ?e<, -' »gnemen'.i (ionnos sur le type de 'oger ont
Cette question pefme^'O de iu^or de rim-portance dos oommcdites don I sor,t pour-vus !es knjemeots.
O fWW»?<7r>«.?Twrt permettre de comrottre ki smtcttJte des logements oo Ttidiaie et de «nesyrer dtygr^ tfertcQrvbr&mnt vn norr.&o rvjfKR B& per^^orsne« per piece be-b»tot>te.
RFSULTATS OES RECfcNSIfMCNTS
messen mdMdueM« apoofloment rr!0i'i'>0 cotleclhre
outre? non rt?stinen a ' hebitcrtion
Ensembio 873 949
Ces inJoniuilions n^ettiicnt pas disponibles en 1966
<65-i«fr:t if* sulvo^tes : onetmont !•» cor -xx; • dorn c-ut oourvus • ; v
Commodites»
Soejemonts povrvw« d'efnctrlcit^ 5oqeme«ts ootirvus du qo/ Joqements pourvu« d© cuisine »oqemeels pourvus de WC
Nombro
, lav
8r»7 7& 286
353 011 354 ?31
24 % 9
40 % 41 %
&r! I960, fa r4o«jrt Hon des? teoe^nnts Jo nofftbre de ? o o ^te k» •• >5'y<jnte
Nomtare do ufftce< Nemb*^ de {ocemont<.
1 piece 529 937 61 2 picces 212 194 jf4 3 pfcces 79 534 9 4 piece« et ptos 52 2S4 &
Snsembfo 87:; 949 100 %
Ce nv-rnbre rnoven dp personnel >*ar piece okü? o ;
Poor «©8 maisotrs in&vHiu&iim idor. viiic .. a iPdrtemeeiS! et ?os rr^K-r;« co^oct-vo-. : ?a report;•fan •vt.frcit lp «ffvante •
Nombre d« pf'eces Nombfe de % «elements
1 pteoe 22" m " - 48 " 2 pieens 148 312 3C 3 pie€«s && 6^9 14 4 pidcesi 26 379 s 5 pieces- 7 9SS 1 6 piece« e( 9 978 2
Bmemble 499 025 100 % Pomi cm prtm de 50 %' ne <soo>pdfto^t sjeo?» i> -s; fo • pe^sonnes per ntdc^ hpb-?obfe eto-H d'eny-rpe *3 • orscrsoef

Figure 16-2 Number of Houses annually constructed since 1956
o o 30--I •
2 8 -
26. -
24.-
"S 22. CJ P 20. 00 c 8 18.
* 16.4 3 c c cd 14.
1 2 . -
10.
by the State
private
6 2 - 6 4 65 - 68 Average Numbers 6 9 - 7 0
56 57 58 59 60 61 62 63 64 65 66 67 68 69 70 71 72 73 74
• Year
Source: Information provided by the "Ministere de l'Equipement, Direction de THabitat".
b. Financing The "Caisse National d'Epargne Logement" (CNEL, National Bank for Housing) was created
by a law of May 7 1973, with the aim of; — Collecting Savings Deposits. Each saver enters into a contract for four years, fixing the
total investment and the loan needed. The saver has the opportunity of buying a new house from a housing agent or to build for himself.
— Issuing short-term loans (during the construction period of the housing programmes) to housing agents.
— The Caisse National d'Epargne (National Savings Bank for Housing) will therefore become an organization specializing in the realm of housing finance and will develop into a Bank for Housing and Land Loans.
c. Housing promotion To stimulate housing promotion the State passed a law in 1974 to encourage the housing
promoters. Until that date there was only the Societe Nationale Immobiliers de Tunisie (SNIT). In Tunisia now there are about 20 building promoters. The SNIT is the only national society. Created by law in September 1957, it is governed by the Companies Act and by its own constitution. Its nominal capital was provided by an initial contribution from the State of 100,000 dinars. Formed in the beginning to superintend the State-owned real estate and to undertake construction programmes with or without its participation, it started operating in September 1969, as the only entrepreneur, the national housing programme which had mainly a social character. It is thus that the yearly programmes have grown and increased from 5,000 houses in 1969 to 13,500 houses in 1974. Investments have increased from 7,000,000 dinars for the 1969 programme to 27,500,000 dinars for that of 1974. The financing is granted for a 30 per cent deposit in advance by the prospective buyers, and 70 per cent by credit of the SNIT.

Organization of the building sector
a. Work force Emigration of qualified building workers is adversely affecting the domestic labour market
which, on the other hand, is suffering from serious imbalances between the coastal zones and the hinterland. Special action with regard to intensifying vocational training and developing of rural areas has been undertaken. As for public buildings (schools, hospitals, etc.) a start has been made on a systematical inventory of qualitative and quantitative drawbacks.
b. Construction materials The lack of material is frequently referred to by those concerned with the supply of building
materials. The lack of cement, bricks and other materials is the greatest danger to the stabilization of employment in this sector. Also it is doubtful whether sufficient material is imported and whether there is a good enough distribution of material to prevent the slowing-down of investment. In 1972 the building material industry produced 8 per cent of the total manufacturing output and covered 6 per cent wage employment. Cement:
The production of cement is of the first importance. It exceeded 600,000 t in 1975 (103,000 in 1972), As a result of the construction of the cement works of Gabes, which will start production in 1977, the supply will be more than 1,200,000 t per year. Other cement works are under construction at Bizerta and Tala, so that the domestic consumption for the next planning period 77-81 will thus be covered. The capacity of this branch of the industry has been extended considerably during the fourth planning period. Red bricks:
The production of red clay will reach 700,000 t in 1976 with new brickworks under construction. Further new works and the extensions planned by companies will raise the production capacity from 1,570,000 m2 in 1972 to 2,090,000 m2 in 1976. Clay tiles:
The recent extension in capacity of the existing factories to 1,150,000 m2 will lead to a fuller use of production potential which would otherwise be wasted.
c. Other initiatives In order to strengthen the basis of production, the State is encouraging the setting up of local
enterprises (in all provinces) with the participation of national organizations involved in housing and building. Consequently decentralization has been effected for all these organizations: State departments and the building societies. (SNIT, for example, has set up three regional agencies in the north, central and south of the country; the CNEL and the AFH have established agencies in the more remote areas of the country).
d. Repair and maintenance of existing property The more the housing programme proceeds, the more it becomes necessary to carry out an
important piece of work in the field of the maintenance and repair of the existing housing stock. Therefore a policy of protection and conservation is established. To control repair work and the modernization of existing homes with the aim of preserving the existing value, a fund has been established known as Fonds Nationale d'Ameliorisation d'Habitat (National Fund for Housing Improvement). This fund gives loans and subsidies exclusively for repair work and improvements of property.
Building Research
As one of the efforts in the housing field the Ministry of Works and Public Facilities has created a research centre for Low-cost Housing. The first aim of this centre is to study the rationalization and promote the utilization of local building materials in order to reduce house-building costs, to limit the use of expensive current materials, and to help the low-income group to build their own houses (aided self-help) without specialist labour. Started in May 1973, the centre has achieved promising results since.
Reduction of building costs: results obtained by the housing research centre
The first prototype constructed by the centre consists of nine houses in La Mornaghia. Site plan:
The design has been divided into two groups of houses. Gl and G2. The plan Gl comprises four types (Rl, R2, R3 and R4), and Group G2 comprises five types of cheaper houses (Dl, D2, D3, D4 and El) (see plans). Extensions to these houses will be possible in the courtyard (Figure 16-3/4).

Figure 16-3 Floor-plan and Section of Groups Gl and G2
Legend
1. room 2. kitchen 3. patio, garden 4. toilet
4 units per group

Materials used: Foundations. In place of standard foundations (a mixture of gravel, sand and cement) a filling
is used made of excavated earth and Torba3 and Tafezza.4 These local products are nearly half the price of normal concrete. Masonry in foundations and elevations:
Masonry work in foundations is done with blocks of Tafezza fixed with mortar made with Torba. The interior jointing is filled with mortar containing 350 kg standard of cement. The cost saving on m3 of masonry in rough stone is about 30 per cent. Frames for doors and windows:
Lintels for doors and windows have been replaced, as an economic method, by prefabricated beams of stone and plaster (see pictorial details).
Figure 16-4 Floor-plan and Section of House R3
600
20 20 140, ICQ 140 no .eqeq59 no.ioo, 120^
1030
Roofs and roofing: The traditional system of curved roofs has been employed for the Gl type (four homes).
Materials used are six-hole bricks and plaster. It has been observed that this procedure is less expensive than roofing with stone blocks, in spite of the need for specialist workmen and the cost of their employment. A saving of D 1.5/m2 was effected on this project. Two masons chosen to assist the specialist worker on the roofs have now learned the system and have become trained workmen themselves. They decorate the roof with a cement cover, coated with whitewash.
Torba: A sort of clay. Tafezza: Chalk stones dug up when ground clearing.

Conclusion
From this study it would appear that the results obtained have been most encouraging, seeing that the economy attained per m2 was Dil, which, along with the current construction work would be about 32 per cent. As this reasonable economy was worked out on a limited number (9) of buildings, it is certain that this percentage will be improved when carried out on a larger scale. It is offset, on the other hand, by the increase in the workers' wages which now account for 40 per cent of the total costs; but if carried out in self-help the cost per m2 will be 40 per cent less expensive, especially with local materials (Tafezza, Torchis and Torba) replacing to a large extent the usual materials such as cement, limestone, steel etc. As the scarcity of these materials, which has made building so difficult in Tunisia for so many years, is now less pressing, the realization of a social housing programme can be stimulated, in particular for the people who live in rural areas.
Ibn Khaldoun Tunis
The experiment in the town of Ibn Khaldoun is a new attempt in town planning in Tunisia. It is, in effect, the first time that a complete community of this size has been planned; integrating from the start employment zones (light industries), equipment and public services. The settlement has been designed with an attempt to integrate the living habits and town planning principles for a large suburb. The density is of a normal standard urban average (40 to 50 houses per hectare), but the houses have a large privacy — being detached or horizontally grouped — in a traditional urban arrangement (Medina type). The problem of re-housing the people of Djebel Lohmar, the starting point of the whole operation, has now been partially resolved. It is not only the creation of an important new town because of its size, but more important is its reference to the traditional cities of the Maghreb countries.
Figure 16-5 Situation Ibn Khaldoun
128

Figure 16-6 Type A-Dwelling
Figure 16-7 Type B-Dwelling
1. Living Room 2. Kitchen 3. Toilet 4. Extension 5. Patio 6. Staircase

1. Sleeping Room 2. Kitchen 3. Toilet 4. Extension 5. Patio
Design
Architectural studies are being extended by the SCET5 Tunisia, the site management and co-ordination are carried out by a team from the SNIT/SCET Tunisia.
Design studies
Before starting the design process, studies were made of the Tunisian way of planning and building, recent and traditional. This cleared the way for a prospective guideline, conscious of past mistakes and respecting living habits, with due regard to accelerated evolution. The result of this concept is a human settlement characterized by the Mediterranean habit of living around a patio, extendable dwellings, a continuity of built-up areas, control of open spaces and a great variety of buildings. The realization of the project has been divided into five series of 1,500, 600 and three of 1,000 units, for each of which the most prominent contractors in Tunisia were invited to tender, with as little delay as possible. They had to give assurance, moreover, of the highest quality of workmanship. (Figures 16-5/8). On the perimeter of the town of Tunis there was an enclosure of 50 hectares with archaic housing and huts; Melassine, Saida, Manoubia and above all, Djebel Lahmar. Those responsible for housing in the Ministry for the Environment, the SNIT, the SCEF and the municipality of Tunis decided on a pilot operation of 5,000 houses — the town of Ibn Khaldoun.
5 Societe Centrale pour l'Equipement du Territoire. (Organization for Land Development).

Table 16-111 Financial terms per type in Ibn Khaldoun
Type Price For families with monthly
(30%) payable in advance
income
Interest charged to purchaser 6
Duration of loan
B
4000 dinars
2600 dinars
60 D and more
30 to 60 D
± 1300D
± 850 D
5%
5%
15 years
15 years
less than 30 D ± 600 D 0% 15 years C 1800 dinars
6 The State will underwrite the difference between the selling price and the price paid by the purchaser.
Options
The socio-economic survey undertaken by the Municipality of Tunis made it possible to define the financial capacity of the households and the rate of repayment acceptable. The method of financing was formed within the framework of State aid given to low-cost housing for sale. The State decides the selling price, monthly repayments and the duration of the loan. In order to achieve these objectives, the results of the studies are translated by means of a technological approach into practical and typically Tunisian solutions. The following tablß shows how this was done:
Table 16-IV Number of houses per phase and type of Ibn Khaldoun
Type of A B C Total housing
phase
1 226 702 560 1 488 already constructed
2 351 134 120 605 under construction
3 467 284 188 939 under construction
4 30 103 881 1 014 planned for 1976
5 126 579 353 1 058 planned for 1976
Total 5 104 housing units
Urbanization study
The suburb of Ibn Khaldoun, situated to the north-west of the centre of Tunis on a piece of land of 150 hectares is part of Greater Tunis, in which urban growth is planned around a small number of sub-centres. The urban plan of Ibn Khaldoun was based on a number of criteria, which have guided the steps taken by the designers and of which the most important were:
Spatial organization in order to bring together harmoniously, for both the individual and the community, the different functions of housing, employment and recreation. Concentrations of facilities in a limited number of places, thus fostering the attractiveness for the inhabitants of the neighbourhood.
— Thorough analysis of the site in order to overcome its difficulties and to take advantage of its possibilities.
— Planning of a living area with a charm of its own, without concessions to imported solutions, and leading to a characteristic urban pattern.

From these principles arose successively: — A road system, the design of which takes into account both the difficulties of the site and
the aspect of optimal communications between the urban centres. — A recreation area integrated in the centre of the suburb, designed to be a place to meet and
to play, a forum and at the same time an amphitheatre. — An urban grid fostering the intimacy of the village without, however, scattering too much
the communal facilities, rejecting the foreign and anonymous iron grid town planning and seeking, on the contrary, to give every creature its own identity.
La Mornaghia prototypes under construction

133
S f - f . » S't- • ' ' *•''•£> V--- , '«
>»V£S«f i
i---,; v'-./
'a^f> ' y - ' / • -
f; "/5 -r/^,;. - >|* '• * -v.
^ •- -••'4 ^ ^ ;. x , •* .-
i - -4 -
" r ^ ̂ - ' i V v - ' ? • . i » '• •' "V 'ij-'"
/•. -> ^ - -v.
;• ^ . ,'"*
• * • • ^ % • ' :
> .\.. . -; S,i - ,!
- •' " • • • - . ' V •/'• "v». . "

CHAPTER 17. RESETTLEMENT AND MODERNIZATION OF RURAL HOUSING IN IVORY COAST
Regional Development
Many cjuntries in the world are experimenting with regional insti tutions. Examples are: Tennessee Valley Authority (USA), Rijnmond (Netherlands), Volta River Authority (Ghana), Office de Mise en Valeur de la Medjerda (Tunisia) and Authorite pour l 'Amenagement de la Vallee du Bandama (AVB) (ivory Coast) .
In Ivory Coast the construction of the Kossou Dam was the start of a specific regional approach. However, the hydro-electric Kossou complex has a country-wide economic value. The power station, si tuated in the middle of the country, will produce 500 mill ions of KWh per year (equal to today's energy consumption of Ivory Coast) . The construction of the dam caused the following problems:
a) Financial. Costs 22.4 bil l ion FCFA1 = about 17 per cent of the total investment 1966-1970 of 131 bil l ion FCFA. Additional investments are necessary for fist ing irr igation and electrif ication of the region.
b) Socio-economic. The lake is si tuated in one of the regions with the highest population density of Ivory Coast . About 20 vil lages and 75,000 people have been resett led. About 90 per cent of the population preferred to sett le in the direct neighbourhood of the lake, instead of migrating to the ARSO2 area. This was against expectations and led to economic problems. Not only efficient economic alternatives had to be offered, but the future development of the existing population in the lake area had to be protected. As in 3imilar resett lement programmes the danger existed that not only would the migrants be left to face the music but also their new neighbours. In the first stage work was concentrated on the problems of the migrants; in the second stage, 1973-1976, priori ty has been given to the total regional development.
The AVB (Authorite pour TAmenagement de la Vallee du Bandama), created in 19693 as an autonomous organization as co-ordinator and responsible for the operations, has gradually changed into i ts present form, i .e. , a regional insti tute focussing on: — Energy; — narrowing the differences between the various parts of the region; — general improvement of l iving conditions; — supporting migrants; and — supporting the original exist ing population.
In the National Development Plan 1971-1975 a systematic approach to regional development was announced. However a l i t t le outside the scope of this case study, the Ivorian approach to regional planning is worth mentioning. The new central organization for Regional Planning is the DATAR (Direction de l 'Amenagement du Terri toire de l 'Action Regional) with a priori ty programme to narrow the differences between regions. The DATAR is subdivided into the following sections: — Section d 'Urbanisme; — section geographique; — section cartographique; — section sociologique; — FRAR.
Regional Funds for Rural Planning (FRAR)
If the collective planning activit ies of national or regional importance are to be realized in rural areas then these activit ies must continue to be financed by the State while the collective facil i t ies of local importance must depend of private f inancing methods. Owing to their local character and their establishment, construction and maintenance must be the direct responsibil i ty of the local populations. As the central authorit ies are too far away from these areas to undertake these responsibil i t ies, i t has been felt advisable to let the regional authorit ies themselves decide who shall carry out the programmes in the regions.
Financial aid from the Government remains indispensable. If the collective local facil i t ies were to remain virtually dependent on the local populations, as they are now, the poorer
1 I US$ = 250 FCFA. I 'Autorite pour l 'Amenagement de la Region de Sud-Ouest.
3 July 18, 1969, directly under the President of the Republic.

regions would never catch up. For this reason, the creation of Regional Funds for Rural Planning was decreed by Act No. 71-384 of July 31, 1971, including an Economic, Social and Cultural Development Plan for the years 1971-1975 - Article 12. One regional fund is being created for each region, and every fund will concern i tself only with facil i t ies for the country people. I t is a multi-purpose fund capable of financing every collective facil i ty of local importance and interest that may serve several vil lages.
The Managing Board is presided over by the President of the Regional Development Committee and will count among its members, beside the Prefects of the departments in question, also representatives of the Ministries of the National Plan and of Finance and also of the technical Ministries concerned. The General Secretariat of the Fund is in the hands of the Regional Delegate of the National Plan.
Every fund receives: — A contribution from the Central Government; — help from outside the private regions; — participation from the populations of the region, which will be a smaller or larger part of
the investment (depending on the region and the kind of facil i ty). The sharing of the populations in the investment will give rise, jointly or not, to contributions in cash, in working days, and in bringing materials. The State is given each Fund annually a lump sum, which will be higher in proportion as the financial income of the rural area is lower. The programmes must conform to the directions established by the Central Administrations of the Ministries concerned and be approved by the Ministries of the National Plan, of Economy and of Finance.
At the grass roots level, the central vil lage as far as possible consti tutes the level at which the programme will be elaborated. Once the financing has been decided upon by the Managing Board of the Fund the project forms completed on that occasion form contracts between the population concerned and the Administration, laying down their respective duties. One of the most important points of this regionalization is to guarantee the workmen the establishment of small Ivory Coast enterprises at the level of the chief towns within the region concerned, and to ensure greater openings for young people who have come from regional technical centres.
This case study of the resett lement of vil lages has to be placed in the wider context of regional planning in the total country and in the l ight of the new climate of opinion which stresses the importance of a close correlation between society and sett lement.
The traditional settlement
More than 80 per cent of the population of Ivory Coast l ives in the rural areas in vil lages with a population of less than 4,000 inhabitants. The tradit ional house and vil lage differs from region to region in architectural form and uti l ization of materials. The land ownership is of the community. Sites are allocated according to needs and have no relation to the social status of the temporary user. Materials are available in the direct neighbourhood at no cost . Everybody can build his own house. The construction of the single-storey earth-walled house is typical , with the roof framed in t imber, bamboo or palm-frond and covered with thatch. Extended roofing shades the walls.
He wever satisfactory in tradit ional socio-economic si tuations, with regular upkeep, there are several disadvantages with this form of shelter. The thatched roof is an excellent thermal insulator, but has to be repaired every 3 years. Secondly, the thatch is a convenient breeding ground for vermin. Thirdly, thatch roofs create a serious fire hazard. The infrastructure of the vil lage is at tuned only to pedestrian traffic. As community facil i t ies there are a market, danceplace and hallowed spots (Figure 17-1).
The modern village
The grid plans of European-American origin with plots of 20 x 20, 20 x 25 or 20 x 30 m have nothing to do with the exist ing social structures and stimulate a str ict ly individual way of l iving (investment and maintenance). The cost of the infrastructure is high (roads, water and sewerage).
The modern home
The modern house consists of l iving room, bedrooms, shower, toilet and terrace. The kitchen in most cases is buil t later in the tradit ional way. Materials used are concrete blocks and

Figure 17-1 The Traditional versus the Modern Village
xX'. \ C^r.
»O
<H>
13 a • a Q a a
o a a a a a a a
a a a a a o o a
a a a a a a a a
p n Lj ü . u ,
or
r~—^
corrugated iron or aluminium roof sheets. French louvers form doors and windows (the ventilation openings are in most cases stopped up by the owners). Most of the building materials are not available on the spot. Building materials and labour are brought from outside the village.
The question is: Is it necessary to destroy the traditional village pattern, or are there other possibilities to find a compromise between traditional settlements and modern settlements? On judging the two extremes, there must be taken into account the fact that the modern town is attractive and in many cases an example rural people like to copy. The houses in towns have become models for village houses. Concrete blocks and corrugated iron sheets have become status symbols, and are related to the social status of its owner.
The Ad Hoc Group of Experts on Social Indicators for Housing on Urban Development4
proposed that the social indicators be ordered in terms of three levels or concentric zones: Level 1 the household and its dwelling; Level 11 the immediate housing environment community; and Level HI the larger societal context. (See also Chapter 10). More adequate data series will be needed. In Ivory Coast a first step has been made to collect this data leading towards an environment responding more adequately to human needs. This work has been done by the AVB, UNDP+projects and the CRAU (Centre de Recherches Architecturales et Urbanisme) for the Bandama Valley project.
United Nations, Department of Economic and Social Affairs, .Socz'fl/ Indicators for Housing and Urban Development, Sales no. E.73.IV.13. New York, 1973.

The UNDP Programmes
For the execution of i ts housing programme the AVB has been assisted by the project UNDP /ONU/IVC/71/527, s tar ted in 1971 and finished in 1974. This programme resulted in the reset t lement of 75,000 persons in 75 vil lages (average of 1000 inhabitants per vi l lage) of which 7 per cent was reset t led in the south-west region (ARSO). In total about 13,000 houses were buil t . The short history of this project represents an evolution of the concepts of planning design and materials .
Chronological summary
1971 First intervention in the vil lage of Taki Salekro, in the reset t lement area; 1972 rat ionalizat ion of AVB-houses, price reduction 20 per cent . Proposals for changes in
lay-out of the vil lage. First school in Taki Salekro in geo-beton (pressed clay blocks with 5 per cent cement) ( landcrete);
1973 second pilot vi l lage Boureba. Instead of rectangular grids, houses are grouped around squares. All public buildings are constructed in geo-beton, as well as some houses, and the outdoor ki tchens and toi lets;
1974 new pilot project , the vil lage of Kossou, on a hexagonal grid, a new type of dwell ing with covered l iving room, part ly constructed in landcrete.
But adding houses and public ut i l i t ies together is not by any means a vi l lage. The environment in human set t lements is dependent on a variety of indicators: functional , spat ial , social and economical . The economic aspect is not the only indicator of the success of a project , but more diff icult to specify are object ive measures such as heal th, happiness, t radit ion, etc . i f modernizat ion of the rural set t lements is considered as one. of the weapons against the rural exodus, social and environmental constraints must be accepted. The i l lustrat ions of the development in planning and design are clear . An at tempt is being made towards a reflect ion of the African habitat in an African environment by Africans. African society has a long and valuable t radit ion of communal act ion to which fresh impetus is being given by the str iving for self-rel iance which can be observed today throughout the continent .
The new A VB/UNDP project5
I t has been specif ied that the re-establishment of the people affected by the ris ing water has been real ized on land along the River Bandama and that the vil lages known as "receiving" vi l lages now think of themselves as " the only real vict ims" of the Kossou operat ion and expect State aid, and now look to the AVB as the agency which has to improve the condit ions of the original inhabitants . The Kossou operat ion has created a certain motivat ion and consciousness among the rural populat ion that must be used to meet the needs and the policy of the Government as regards s t imulat ion, promotion of rural crafts , and improvement of l iving condit ions and therefore of dwell ing environment.
The AVB is now considering the costs of improving the original set t lements. From the enquiries conducted for project IVC/71/527, concerning almost 40 riverside vi l lages — that is , 40,000 inhabitants of the Central Bandama region — i t appeard that 86 per cent of the populat ion involved was in favour of the formula "Aided Self-Help" (ACA), including the mobil izat ion of local f inancial resources on individual and collect ive bases. I t should be noted that the small AVB area (Autori te pour l 'Amenagement de la Vallee du Bandama) encompassing the r iverside vi l lages and thus the "receiving vil lages", includes about 300,000 persons, and that the larger AVB area represents almost one mil l ion inhabitants (even more if the possible revision of the borders of this larger area is taken into considerat ion).
In contrast to the f irs t punctual operat ion of the AVB that was performed entirely at the expense of the State, the new operat ion would consist of helping the r iverside populat ions to take a direct part in their own progress and hence in the development of their region.
The First Self-Help Village
Aka N'Guessankro, a t radit ional rural vi l lage, was selected as the f irs t prototype self-help project . The populat ion is about 1800. Coffee and cocoa are the principal sources of income. Enquiries and socio-economic surveys showed that the at t i tude of the vil lagers towards aided self-help was posi t ive. A new road to the lake is under construct ion and a new si te for the
UNDP-lvory Coast sources (unpublished).

village was chosen by the vil lagers. Studies of the neighbourhood and the family structures formed the basis for the planning. The vil lage consists of 19 aoulos (extended families) and 3 aoulobos (group of extended families, clan). The 3 aoulobos are grouped around the community facil i t ies in the centre of the vil lage.
Figure 17.2 Extendable A.V .B. Houses (first villages)
320 I 240 I 240 , 240 . 320 320 , 240 . 240 240
240 I 240 | 2 40 j 320 j , 240 | 320 ; 320 I 240 1 I 320 1 240 ! 240 ! 240 | 320
Finance
In the beginning of 1975 a co-operative (groupement a vocation cooperative) was created in Aka N'Guessankro. Because of the different formulas an important participation of the vil lagers has been registered. The shares of the 230 members totals 10,200,000 FCFA. The different formulas are: A Turnkey (21.8%) B Structure finished (roof + walls)6 (14.4%) C Foundation and floor finished (11.1%) D Tenure of the plot (18.5%) E Option on the plot (33.7%)
Those who will occupy a habitable house: A + B = 34.7% Those building in any case: A + B + C = 46.7% Sites without construction: D + E = 53.3%
It can be seen that about half the number of the families joined in the building activit ies. Almost all have become members of the co-operation and have reserved si tes for future construction (minimum contribution FCFA 2000).
A look at the cost price calculation for a standard vil lage (125 dwellings distr ibuted over 6-20 blocks) shows the following figures: 1 Financed by the vil lagers a) Participation in the construction of the houses: — first instalment: about 20% of 125 x 300,000 FCFA •= 7,500,000 — mortgage from the bank, repayable in about 5 years, 80% of
125 x 300,000 FCFA = 30,000,000 — 15,000 working days = held over b) participation in construction of collective facil i t ies and infrastructure: — 125 x 40,000 FCFA, with repayment of 1/3 in the first year, the
rest spread over 5 years = 5,000,000 — 5000 working days = held over
total 42,500,000 FCFA 2. Government participation — access roads, platforms and pits = 7,500,000 — collective facil i t ies within the framework of the FRAR-centre
programme = 3,000,000 — compensation for mortgage interest at 4.5% a year = 3,500,000
total 14,000,000
GENERAL TOTAL 56,500,000 FCFA
138 No windows, doors or finishes.

Figure 17-3 Development in Village Planning
• • O
tu
nu
EU a
o
o
o
> /Öl o
I C O a
V o \\0 s*/ 0s
o
o
k0
o o
The corresponding repayment scheme then looks as follows, for formulas A, B and C:
1st repayment contribution towards infrastructure
5-year term of repayment infrastructure
Formula A 60,000 13,000 73,000
48,000 5,200
53,200
Formula B 39,000 13,000 52,000
31,800 5,200
37,600
Formula C 12,000 13,000 25,000
9,600 5,200
14,800
The prices quoted are those for 1974-1975, and the income figures for 1969-1970. Since 1970 the commercialized area has extended; and the production prices of the speculative cultivations have increased.

The design
The design is based on the following principles: — Extendible housing according to the size of the family in different stages. — Kitchen with covered verandah forms the basis of each house (A). — The rooms are grouped around a courtyard. — 9 variations in size are possible. — The use of locally-produced building materials.
The first prototype was finished early in 1975. (Figure 17-2/4). The house consists of different design units: A. Kitchen and shower 9 m2
covered area 18 m2
B. Living rooms 9-18 m2
C. Additional rooms D. Additional rooms
The house can be realized in 3 stages. 1. Units A + B, 2. Unit C, 3. Unit D.
Construction
Because of the systematic construction the Units can be built in different stages. It is possible to realize successively: 1. Foundation and floor. 2. Windows and door frames and roof. 3. Elevations in block work. The window and door frames form at the same time the support and anchor of the roof, allowing construction of the walls protected against sun and rain.
Materials
Foundations and floors: concrete 150 and 200 kg. Walls: pressed clay blocks with 10 per cent cement. Roofs: self-supporting aluminium sheets. Window and door frames: hardwood.
Figure 17-4 The Extendable Design for Aided Self-help Housing in Aka N'Guyassankro

13. A simple ki ln produces br icks and t i les for the house constructed at the same place as where the bui lding mater ia ls were found in Upper Volta . Wood-wool-cement s labs are the construct ion mater ia ls for wal ls and roofs of this low-cost house in Ghana.

14. New intermediate technology materials are being developed in research centres. The C.C.L. in Lome (Togo) developed light-weight blocks with rice and peanut shells, and this low-cost house with walls and roof of plastered bamboo.

15. The suburb 1BN Khaldoun of Tunisia is an example of new town-planning in Africa. Modern building materials, extendable houses and traditional (Medina) town-structure. See case study of Tunisia, Chapter 16.

16. Aided self-help housing in Ivory Coast. See case study Ivory Coast, Chapter 17.

CONCLUSIONS AND RECOMMENDATIONS

CONCLUSIONS AND RECOMMENDATIONS
in the foregoing pages the probiems and developments in housing on the African continent related to human sett lements have been described and analyzed. Because of differences in climate, resources, social set-up and poli t ical choices no standard recipes can be given; some fairly general l ines have been identified. Yet i t is not without hesitat ion that the following conclusions and recommendations have been writ ten — at the specific suggestion of the Executive Secretary of the United Nations Economic Commission for Africa. "The best pilots stand ashore", runs a Dutch proverb. From a distance the actual problems may seem more simple than when they have to be dealt with on the spot. I t is often easier to state what has to be done than to have to do the job directly. Moreover, some recommendations may seem dated because in many countries an awareness of the problems already exists (Chapters 8 and 9), and certain policies to be l isted below have already been put into practice, albeit often in an early phase of implementation.
Development as occurring in Africa today remains a unique process and a specific challenge, a challenge forcing men more to develop new methods, or at least to modify exist ing ones considerably, than just al lowing them to copy and repeat well-known and time-and-agaiu tested standard solutions. The best that this volume and its conclusions can hope to offer is to l ighten the task of those responsible for human sett lements in different countries by supplying them with the elements needed for a systematic approach to housing. One of the most outstanding features of the housing problem in Africa, and elsewhere, is i ts size, as demonstrated by the figures on needs in Chapter 4 and the analysis in terms of income in Chapters 5 and 7. With problems of l imited dimensions, societies may be able to afford the relative luxury of less economical solutions: if total expenses for a certain i tem are very low, even a method costing twice as much as the best one may, in relation to outlays on all other i tems, not be felt as doing much damage. But in connection with housing the si tuation is different. Even the most economical solutions mean quite a drain on the available resources, while failures, including temporary ones, will be very costly for society.
Recommendation. The dimensions of needs and means, the growth of population, and the process of urbanization all make it unavoidable that housing has to be dealt with as a long-term process. This does not imply, however, that governments might postpone efforts to improve the situation. The longer an effective approach will be postponed, the bigger the arrears will grow, the more difficult the needed solutions will be, and the more t ime it will take to deal with the problems. The problems of an uncontrolled slum area with 2 mill ion people — economically, socially and poli t ically — might well prove to be any more than 10 t imes as difficult as those in such an area with 200,000 people.
in order to deal in a realist ic way with housing, governments have to know what will have to be expected in terms of population, income and urbanization if no specific measures are taken.
Recommendation. Governments have to decide whether or not they want to influence the rate of population growth. Therefore they need an insight concerning the effects of uncontrolled growth and, eventually what can be expected of certain counter measures. (Chapter 8).
Recommendation. Here again governments need to decide whether they will let urbanization go unchecked, whether they want to try to change it quantitatively (that is, by measures directed at diminishing migration to urban areas in absolute numbers), or whether they want to direct the migration stream, for instance to other places than already overcrowded urban areas. Rural development, the development of rural centres, and the development of new towns and cities have to be studied and be decided upon in this relation. (Chapter 8).
Recommendation. Continuous efforts should be made to come to a more systematic and better attunement of general development planning, physical planning and housing. (Chapter 7).
Recommendation. The choice between building only a limited number of relatively costly houses for a few people, or building many houses to serve many people is clear. Satisfactory housing standards for all people can only be reached by choosing the second solution.
Recommendation. Given the average money-income levels that can be attained in the majority of countries, most Africans will have to build their houses with their own hands, or at least have to participate in an active way in the building process. (Chapters 7 and 8). An exception may only be made for countries which, because of specific si tuations, have reached or can soon reach average per capita incomes of at least 800 dollars ( in 1975 purchasing power). Self-reliance includes self-help, the development of an appropriate "intermediate" technology, the use of local materials, and an emphasis on the households ' incomes and savings as the main source for housing investment (Chapters 10, 11 and 12). Self-reliance will have an enormous

impact on design and lay-out both for the house (Chapter 10) and for the urban settlement (Chapter 13). It means also the adaptation of settlements and housing to African needs, in climatic and economic as well as social terms. Self-reliance will, furthermore, have a thorough impact on primary and secondary education and, in the building field, also on professional education and training (Chapters 6 and 10).
Recommendation. It has to be considered whether, besides the building of houses, part of the necessary infrastructure (e.g., roads, sewers and the supply of drinking water) has to be included in self-help schemes.
The recognition of self-reliance as being the basic key to the realization of human settlements does not imply that it is a magic formula.
Recommendation. Adequate conditions can only be created and maintained in a well-steered process which takes into consideration at least a number of decades. To this end governments must develop long-term, medium-term and short-term policies. (Chapter 9). Such policies should be reviewed and adapted regularly with the aid of a systematic review of needs, achievements, failures and fresh data concerning technical and economical solutions.
Recommendation. In many countries a first goal should still be the attainment of a situation where further deterioration of housing conditions in fast-growing urban areas should be stopped.
Recommendation. The demolition of squatter or slum settlements is only defendable in situations where the population of such areas can be offered better accommodation and better opportunities to gain a living than in the slum areas. In all other situations the gradual improvement of such settlements should be fostered in terms of sanitation, safety, social facilities, roads and so forth. (Chapters 8 and 10). In 'this respect also the use of self-help schemes should be encouraged and promoted.
The income situation as prevailing in most countries, — making necessary on a large scale self-help housing, as well as expendable and improvable housing — makes careful but original approaches to town planning necessary.
Recommendation. Distances between home and work and home and facilities have to be kept short in order to avoid high expenses on transportation. Town plans should make this possible, whereas, on the other hand, mixtures of housing with industrial settlements that would lead to health-impairing situations, should be avoided. The planning of towns and residential areas should allow for all this and, furthermore, eventually to pass from pedestrian to more mechanical traffic and transport systems. All this will lead to original and specific forms of town lay-out (Chapter 13).
Recommendation. As African cultural heritages and tendencies will have to influence town planning, these aspects as well as the implications of legal and administrative systems should be studied carefully. Systematic approaches including guided experiments, should be fostered, and for this multi-lateral co-operation and active support by the UN family are needed.
Self-reliance implies the use and development of construction materials, construction methods and tools which match the specific conditions in African countries. Although the employment of capital-intensive production methods (including the pre-fab and industrial systems as developed in high income countries) are definitely unsuitable to conditions in most African countries, this does not mean that no use should be made of technological knowledge which in principle is available in the whole world today. So far this knowledge has been mainly used to develop production techniques attuned to the economic conditions of high income countries.
Recommendation. In order to come to optimal solutions for Africa, all available knowledge should be mobilized for the creation of production techniques that economically fit into African conditions. This means the combination of labour at reasonable wage rates and the most appropriate techniques for each type of production. This so-called intermediate technology will have to be developed primarily by the countries from the Third World. (Chapters 1 and 11). Examples include the improvement of the water resistance of mud blocks (e.g., with waste products from oil refineries), the improvement of traditional materials with the aid of laboratory research, interlocking blocks of which walls can be made without mortar, the use of modern instruction and organization methods for self-help housing, and so forth (Chapter 11). Specific attention should be given to all of these things by members of the UN family, and multi-national and bi-lateral co-operation projects. African universities and research institutes should devote much time and resources to intermediate technology in building. The construction industry and the building materials industry will also have to be developed in such a

perspective.
Between the huge mass of self-help builders and the professional building industry an intermediate sector may well develop, which will include people who perform specific skilled or semi-skilled tasks in self-help schemes and firms rendering specific services or selling materials and components to self-helpers (Chapter 11),
Intermediate technology can be applied at nearly all levels: at that of the rural and urban self-helpers, at that of the small construction firm and at that of the large concern, as well as at that of the production of building materials and components (Chapter 11).
Recommendation. Standards should be adapted to the needs of self-reliance, with an emphasis on safeguarding the scope for future improvement. (Chapter 10).
Recommendation. The impact of self-reliance on education includes: Primary education, including direction over the roles to be performed by most people in house construction and co-operative schemes. Direction of professional training and education for building at all levels to the specific needs concerning self-help, including the use and development of traditional materials, the organization of self-help schemes, the resulting administrative approaches, and the development of residential and urban designs meeting African operations.
Recommendation. Systems of land tenure should be further developed, taking fully into account the needs for low to very low land charges for sites and services and self-help schemes on the one hand, and the safeguargding of possibilities for future upgrading and adaptation on the other hand. (Chapter 13).
Recommendation. Each country should develop a saving and loan system which will bring the services of qualified financial institutions in those fields to the level of all families Such a system should include facilities for housing finance, and the local banks or branches of such an organization must be able to fall back, financially and professionally, on a central institute. Housing banks fulfil important functions at the national level in this respect. Whether specific circuits - besides that of general savings and loans institutes - should be erected with affiliation of the local level must also be investigated.
Recommendation. Research and development work should be directed to the needs of self-reliance in housing and building in all respects.
Recommendation. The responsibilities and roles of authorities at different levels, as well as the division of work with other parties such as co-operatives and private enterprises, have to be adapted to the necessities of self-reliance. (Chapter 9). The development of strong local government authorities is recommended. (Chapter 12).
Far from being only a technical or economic problem, the provision of housing in Africa is a problem of social development in its widest sense, encompassing legal, educational and community-building aspects and directed at real human and social improvement. Housing in Africa is a challenge. Some of the tools are already available, but many others have still to be made, or even invented. But with the effort of all, it can be more than a challenge: Housing in Africa can be made a promise, and, better still, the realization of an African "Habitat".
143


ANNEXES


Annexe 1 Formal relationship between percentage of national income invested in new housing, the costs of the houses, and the incomes of the households: the investment-production-income formula (IPI).
Number of Houses Built Annually
or in symbols
H A
Average Building and Land Develop
ment per House
Part of National Income Invested in
New Housing
Yh
Let ha be the number of houses built annually per 1,000 of population and P the total number of population,
H A then ha - x 1,000
11
111
and H A = ha x P 1,000
Y Let National Income be Y, then the average income per head of population will be-p-.
Let the average number of persons to be housed in new housing be oc, then the average Y
income of the family to be housed will be-p- oc.
Let f be the factor indicating the relationship between the income of a family to be housed and the cost involved in construction and development of land (Ca) or
f =
or
Ca Y P Oc
IV
V
VI
VII
Ca — f x p oc
Substituting IV and VIII in II gives
P Y x f "p" oc = Yh
VIII
1,000 IX
Now let pih be the percentage of the National Income invested in housing, then
Yh = Pih Y
Substituting X in IX results in
X
ha X a A 1,000 Y
X f-p- Oc =:p ih Y XIa
This formula can be reduced to
ha 1,000
h
x fYoc =pih Y
or f O P = 1 1,000 ^ "c ~Pih
or Pih ha x oc x f
1,000
Xlb
XIc
Xld
145

National income can where necessary be expressed in Gross National Product (GNP) or in Gross Domestic Product (GDP).
Y = q GNP XII
and Y = r GDP, XIII
then PihY = pjh q GNP XIV
and PihY = pjh r GDP. XV
So p^ q indicates the percentage of Gross National Product invested in housing and Pih r the percentage of Gross Domestic Product invested in housing.
In more and more countries, the number of houses built annually per 1,000 of population (ha) is being included in the set of statistical data collected.
For accurate measurements the factor ha needs additional interpretation. It should not be understood to represent the number of houses completed during the year under observation but the number of new houses on which there have been construction activities. At the beginning of each year already a number of houses are under construction, which still have to be finished. During the year construction of other houses starts, while in the course of the year most of the houses that were already under construction at the beginning of the year will be completed, and also part of the houses for which construction started during the year will be completed during the same year. And, of course, at the end of the year there will be a number of houses not yet completed. In countries with advanced housing statistics the figures concerning dwellings completed, dwellings started and dwellings under construction are available. For correct measurements in terms of investments a weighted average should be made of the three categories (completed, started and under construction) and recording also the extent of investment efforts made for each category during the year under construction. In situations where building sites are developed long before the construction of the house starts (for instance, one or more years) still further refinements have to be made in order to reach reliable conclusions on the basis of statistical data. Otherwise erroneous conclusions might easily be drawn, especially in situations with heavy and irregular fluctuations in site development and irregular periods between site development and the start of house construction.
In situations where no big changes occur in the number and the cost of houses constructed annually, and where a regular sequence exists between site development and the start of house construction, a calculation on the basis of the number of houses completed will give an acceptable approximation for the use of the formula which has been given here. The factor oc
(occupancy) indicates the number of persons per new house, and this may well be below the average occupancy of the total housing stock. Advanced housing statistics also include the changes in the number of houses per 1,000 of population, which is the reciprocal of the number of persons per house. As an approximation, this last figure of the average occupancy of the total housing stock may be used instead of the average occupancy of the houses built in one year. As previously stated, the factor f indicates that for the construction and the development of the land of a house an investment has to be made equal to f times the annual income of the household. So the value of the undeveloped land is not included in this calculation. Undeveloped land as such is an asset. Assets can be transferred from one person to another, but this type of transaction as such has nothing to do with the production and the corresponding creation of income and new investment as part of this income. Because, however, the household to be housed has to pay in one form or another for the right to use undeveloped land, the total investment to be met by this household will be somewhat more than that included in this macro-economic income-investment formula.
Since f is defined as the factor indicating the relationship between the income of a family to be housed and the costs involved in construction and development of the land (CA), ^ rnay be defined as the factor indicating the relationship between the income of a family to be housed and the total capital outlay needed for the house, value of undeveloped land, cost of land development and cost of construction. Only in some rare circumstances does f = f, for instance, in a situation where land is a free good, where land as such has no value for buying and selling, or in a society where all households in need of a house already own a piece of undeveloped land. Normally such occasions do not occur and therefore f' > f.1
Let the annual income of a household be 150 MU (MU = monetary unit), the undeveloped land cost be 30 MU, and the costs of development and construction be 3Q0 MU. Total investment for the household will then amount to 330 MU and the f' will be 2.2 and f will be 2.0.
146

This IPI formula can be used not only in the national context, but also at other levels, such as the regional one. Corresponding types of calculation can also be made for certain groups of the population, such as farmers, civil servants, industrial workers and so forth.
Other possible separate uses of the IPI formula might be the modern and the traditional sector, or the monetary and the non-monetary sector.
It is obvious that the study of ex-post data and of ex-ante alternatives can only be fruitful if the underlying statistical data are sufficiently reliable. Many African countries still have no data concerning. GDP and GNP data can be used if a satisfactory estimate can be made of their relationship with National Income. In cases where National Account statistics do not reflect the part of the traditional sector, misconceptions may easily arise. Sectorization (modern versus traditional sector) of the data and the use of the formula is then recommended.
As stressed in many sources, the calculation of the value of the part of GNP realized in the non-monetary sector is rather hazardous. Also regretfully no precise data are known concerning the dimensions of the economic efforts in terms of annual income needed to produce shelter or a house in the non-monetary sector. Whereas the efforts needed for a very primitive shelter with low technical lifetime — may be evaluated in the order of 0.5 the effort needed to attain the - real - annual income of the household, for the most primitive forms of shelter the value of f may even be lower than 0.5. This does not necessarily mean that in such situations the total effort spent on housing is relatively low: because of the short technical lifetime of the most primitive types of shelter, building has to be undertaken more frequently than in situations where more permanent buildings are made. In the case of the more sophisticated construction also in the non-monetary sector, the effort for the construction of a dwelling may well be higher than the "annual income" of the household. In such situations the mutual help given amongst villagers has the same function as financial credit in a monetary society; the tapping of additional resources needed by young people to realize a dwelling with investment needs that cannot be met out of personal income or personal savings.
The investment-production-income formula describes the extremely important relationship between investment in housing, the number of houses produced, and the household and national income in terms of averages. Because of inequalities in income distribution, the houses that can be afforded by huge sectors of the population will be considerably below the average cost of a house, as implicitly dealt with the IPI formula (construction and site development), costs being f times the average income of the average family. Just as the average size of the household to be housed may differ from the average size of all households, so may the income of the average family to be housed differ from the average income of all families. Perhaps the major problem of housing in developing countries is the very low capacity of the people to pay for housing, especially for housing derived from foreign examples. In view of all the statistical restrictions just formulated, the usefulness of the IPI formula might well be questioned.
However, with the aid of the IPI formula an insight can be gained into the nature of the relationship between the percentage of national income invested in housing, the number of houses completed, the costs of the houses, and household incomes. This insight may help, on the one hand, to understand once again how difficult the problem is but, on the other hand, to steer towards realistic solutions.
Given a definite occupancy rate and a definite percentage of national income to be invested in housing it can be graphically shown how many houses can be built with various combinations of the number of houses to be constructed and the cost of these houses in terms of the incomes of the households to be housed, and it is obvious that with high costs fewer houses can be built for a given percentual investment out of national income than with low costs. The higher the occupancy rate of the houses, the higher will be the percentual investment for housing out of national income given a fixed production of dwellings per 1,000 of population (ha) and given a fixed relationship between investment for a house and the income of the household (f). In practice the number of houses produced (H^) and the number of persons per house (oc) are interrelated. A relative by high number of dwellings constructed per 1,000 of population may well go together with a relatively low occupancy (oc), whereas a low number of houses constructed per 1,000 of population will most times be matched with a high occupancy. These type of relationships are illustrated by graphs (Figures A1-1/7).
In Chapter 7 graphs (Figure 7-1/2) - based on the IPI formula — are given showing the relationship between % of National Income invested in housing (y-axis) and number of houses built annually (x-axis) with occupancy rates of 4 and 5 persons and with different values for f.
From the graphs in this annexe it can be read that with a high average occupancy of 5 and f = 2 an investment of 1 per cent of national income in housing corresponds with an annual production of 1 house per 1,000 population, where the cost of a house (excluding the 147

undeveloped site) is twice the average annual household's income.
This situation is typical for many developing countries; a situation where a relatively high number of houses can be built against a relatively lower percentage of National Income invested in housing can (when f is in the order of 2) only be achieved with a relatively low occupancy rate. This situation is typical for high income countries such as Sweden, Switzerland, the Netherlands and the Federal Republic of Germany.
In Uneca's Report of the Seminar on Housing Administration in Africa,2 held in Copenhagen in 1971, it was recommended at the request of the participants that allocation to housing from the Gross National Product should not be less than 5 per cent instead of the prevailing 2 per cent in African countries. National Income can be estimated to be in the order of 96 per cent of GNP3 corresponding with
0^ = 5.2 per cent of National Income.
The number of houses per 1,000 of population (ha) that can be constructed for an outlay of 5.2 per cent of National Income is given in Table Al-I for different values of f and oc.
Table A1-I Number of Houses to be built when 5.2 per cent of National Income is invested in Housing
f ha
with oc — 5 with oc = 4
2 5.2 6.5 1.0 5.5 6.8 1.8 5.8 7.2 1.7 6.1 7.6 1.6 6.5 8.1 1.5 6.9 8.7 1.4 7.4 9.3 1.3 8.0 10.0 1.2 8.7 10.8 1.1 9.5 11.8 1.4 10.0 12.5 1.0 10.4 13.0
In various other U.N. reports a target of 10 houses per 1,000 of population has been recommended. Such a production figure could with an outlay of 5.2 per cent of National Income, only be reached with extreme — if not unrealistic — low costs per house: with an occupancy rate of 5 persons per house it would imply that the factor f would be equal to 1.04. In the case of an average occupancy of 4 persons per house, f should be set at 1.3, which means that the cost of construction and development of the site should not be more than 1.04 to 1.3 times the annual income of the household to be housed. However, the graphs and calculations have been prepared so far on the assumption that house production is equally proportioned over all income groups. For long-term policy planning purposes this is not an unrealistic assumption. However, as such the IPI formula can be interpreted differently. If, for example, it is assumed that f has a value of 3, oc of 4 and ha of 3, most probably the houses built will be distributed among the higher income groups. On the other hand, if policy is heavily focussed on building houses for the lowest income groups, factor f will be rather low because the low income households have incomes well below the national average.
United Nations Economic and Social Council, Economic Commission for Africa, Äeporr of the Seminar on Housing Administration in Africa (English speaking countries), Copenhagen, Denmark, 19 September - 2 October 1971, E/CN.14/539, 12 October 1971. Consumption of fixed capital being estimated at 4 per cent of GNP.

Figure Al-1 Relationship between annual production of houses per 1,000 of population and average number of persons per house, when 1, 2, 3, 5 or 8 per cent of National Income is invested in new housing and
^ cost of house ^ ^ = income of household —
Average number of persons per house

Figure A1-2 Relationship between annual production of houses per 1,000 of population and average number of persons per house, when 1, 2, 3, 5 or 8 per cent of National Income is invested in new housing and
^ cost of house income of household —
Average number of persons per house

Figure A1-3 Relationship between annual production of houses per 1,000 of population and average number of persons per house, when 1, 2, 3, 5 or 8 per cent of National Income is invested in new housing and
cost of house ^ ^ income of household —
Average number of persons per house

Figure Al^t Relationship between annual production of houses per 1,000 of population and average number of persons per house, when 1, 2, 3, 5 or 8 per cent of National Income is invested in new housing and
^ cost of house — income of household —
Average number of persons per house

Figure A1-5 Relationship between annual production of houses per 1,000 of population and average number of persons per house, when 1, 2, 3, 5 or 8 per cent of National Income is invested in new housing and
cost of house ^ ^ income of household
2 3 4 5 Average number of persons per house
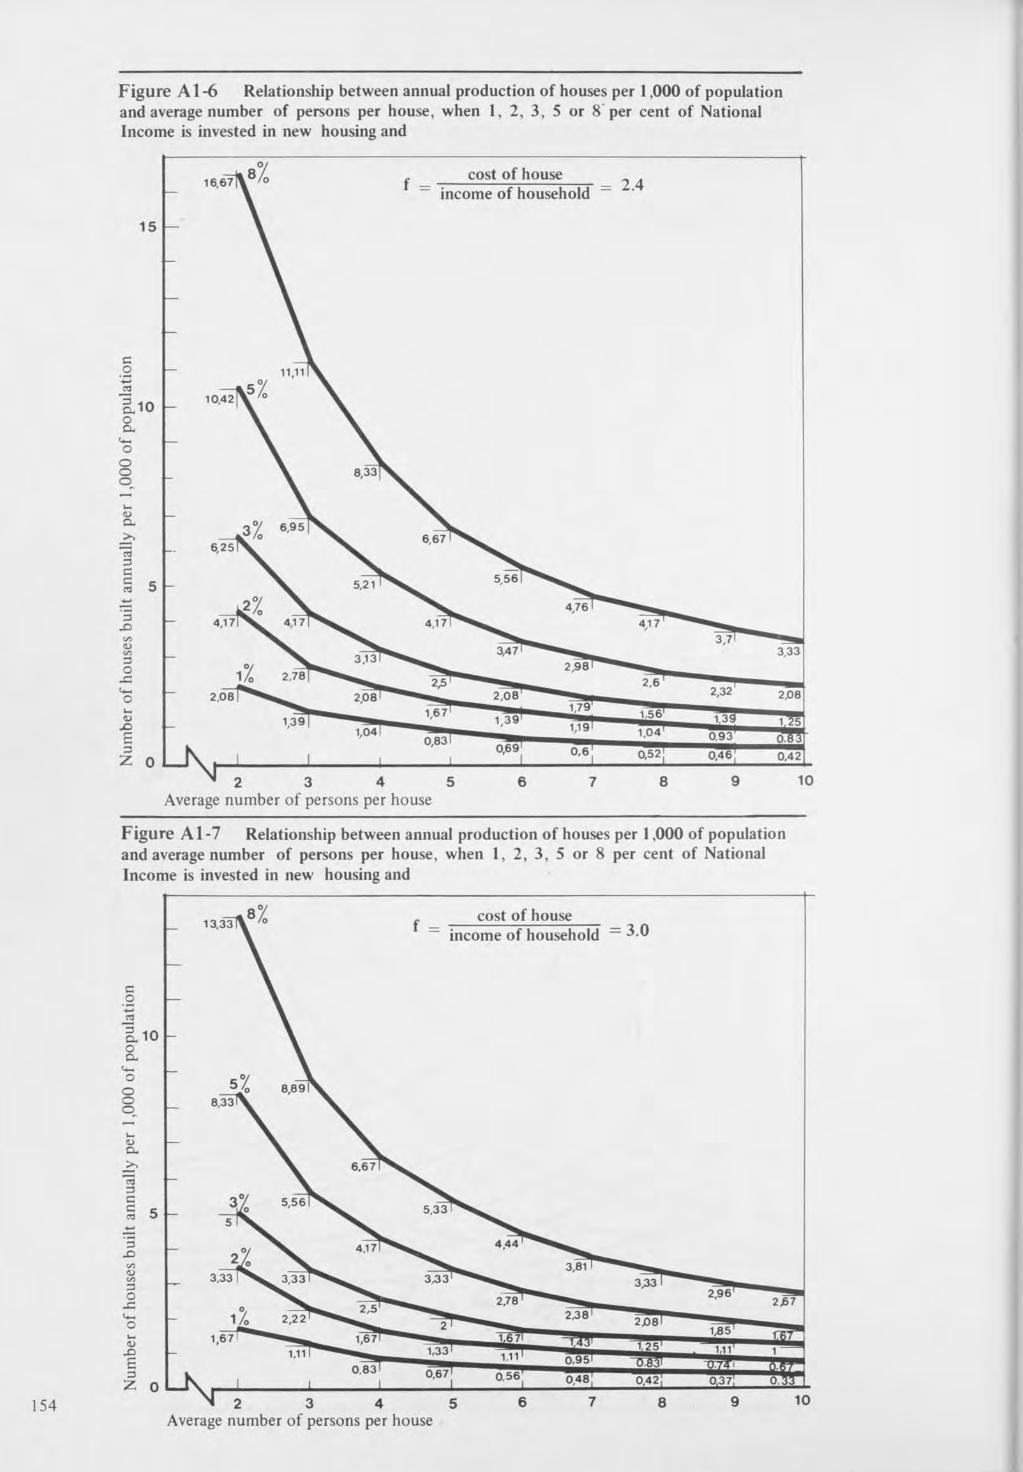
Figure A1-6 Relationship between annual production of houses per 1,000 of population and average number of persons per house, when 1, 2, 3, 5 or 8 per cent of National Income is invested in new housing and
Figure Al -7 Relationship between annual production of houses per 1,000 of population and average number of persons per house, when 1, 2, 3, 5 or 8 per cent of National Income is invested in new housing and

Annexe 2 Additional Statistical Data concerning Building Materials and the Construction Industry.
155

Table A2-I Structure of the Construction Industry 1965-1972 in 35 African Countries
Subregion/country GDP at constant Construction Share of GDP at 1970 Gross fixed 1970 factorcost constr. market price capital million US S1 in GDP % million US $ formation
1 2 3 4 5
North Africa
Algeria 1965 2 846.0 205.5 7.2 3 310.8 523.5 Algeria 1970 3 950.5 414.6 10.5 4 640.2 1 539.3 1972 4 484.3 473.6 10.6 5 263.0 1 820.3
Egypt 1965 5 297.1 236.6 4.5 5 992.5 941.2 Egypt 1970 6 191.1 278.2 4.5 7 214.8 804.9 1972 6 539.1 321.2 4.9 7 520.3 852.8
Libya 1965 1 699.7 137.8 8.1 1 786.5 507.6 Libya 1970 3 582.1 229.0 6.4 3 722.3 670.6 1972 3 583.0 285.7 8.0 3 636.7 823.6
Morocco 1965 2 462.4 107.6 7.2 2 673.9 292.6 1970 3 013.7 156.1 10.5 3 351.7 515.8 1972 3 333.2 162.9 10.6 3 688.4 488.7
Sudan 1965 1 481.0 75.5 5.1 1 667.9 175.2 1970 1 526.7 64.0 4.2 1 830.6 210.2 1972 1 734.3 67.6 3.9 1 961.9 240.8
Tunisia 1965 937.0 87.5 9.3 1 085.7 289.7 1970 1 198.5 88.0 7.3 1 390.1 312.9 1972 1 154.3 113.0 7.3 1 784.0 386.1
West Africa
Dahomey 1965 173.3 8.8 5.1 190.9 24.1 1970 226.4 16.9 7.5 248.8 41.4 1972 246.8 20.8 8.4 257.9 48.9
Gambia 1965 34.5 0.1 0.3 38.4 4.8 1970 40.7 0.1 0.2 45.9 6.4 1972 45.8 0.2 0.4 52.0 8.8
Ghana 1965 1 770.9 121.9 6.9 2 227.6 375.4 1970 1 932.3 92.1 4.8 2 216.6 213.6 1972 2 1 1 1 9 85.7 4.1 2 440.4 225.3
Ivory Coast 1965 821.7 47.5 5.8 980.1 180.6 Ivory Coast 1970 1 180.5 89.6 7.6 1 490.6 302.1 1972 1 371.8 100.5 7.3 1 643.3 336.4
Liberia 1965 367.6 13.1 3.6 391.7 61.5 1970 396.2 17.9 4.5 417.5 80.5 1972 432.2 20.2 4.7 463.8 115.6
Mali 1965 217.9 15.3 7.0 238.5 27.7 1970 240.7 11.7 4.9 267.1 36.1 1972 218.5 12.3 5.6 243.8 42.2

Investment GDP per Added value Index ratio capita2 by constr. (1965 = 100)
per capita U S s 1 2
6 7 8 9
15.8 33.2 34.6
239 276 294
17.2 29.0 31.2
100 169 181
15.7 11.2 11.3
180 186 188
8.1 8.4 9.2
100 104 114
28.4 18.3 22.6
1 049 1 846 1 723
85.0 118.1 110.3
100 139 130
16.9 15.4 13.2
185 194 210
13.3 20.4 22.3
100 153 168
10.5 11.5 12.3
108 97
105
5.5 4.1 4.1
100 75 75
26.7 22.5 21.6
215 233 286
20.0 17.0 20.9
100 85
105
12.6 16.6 19.0
12.5 13.9 16.9
16.9 9.6 9.2
18.4 20.3 20.5
15.7 19.3 24.9
11.6 13.5 17.3
73 84 86
105 110 121
228 224 232
214 274 303
344 338 354
48 48 41
3.7 6.3 7.2
3.2 2.2 4.8
15.7 10.8
9.5
12.4 20.8 22.1
12.4 15.2 16.6
3.4 2.4 2.3
•100 170 195
100 69
150
100 69 60
100 168 178
100 123 134
100 71 68
157
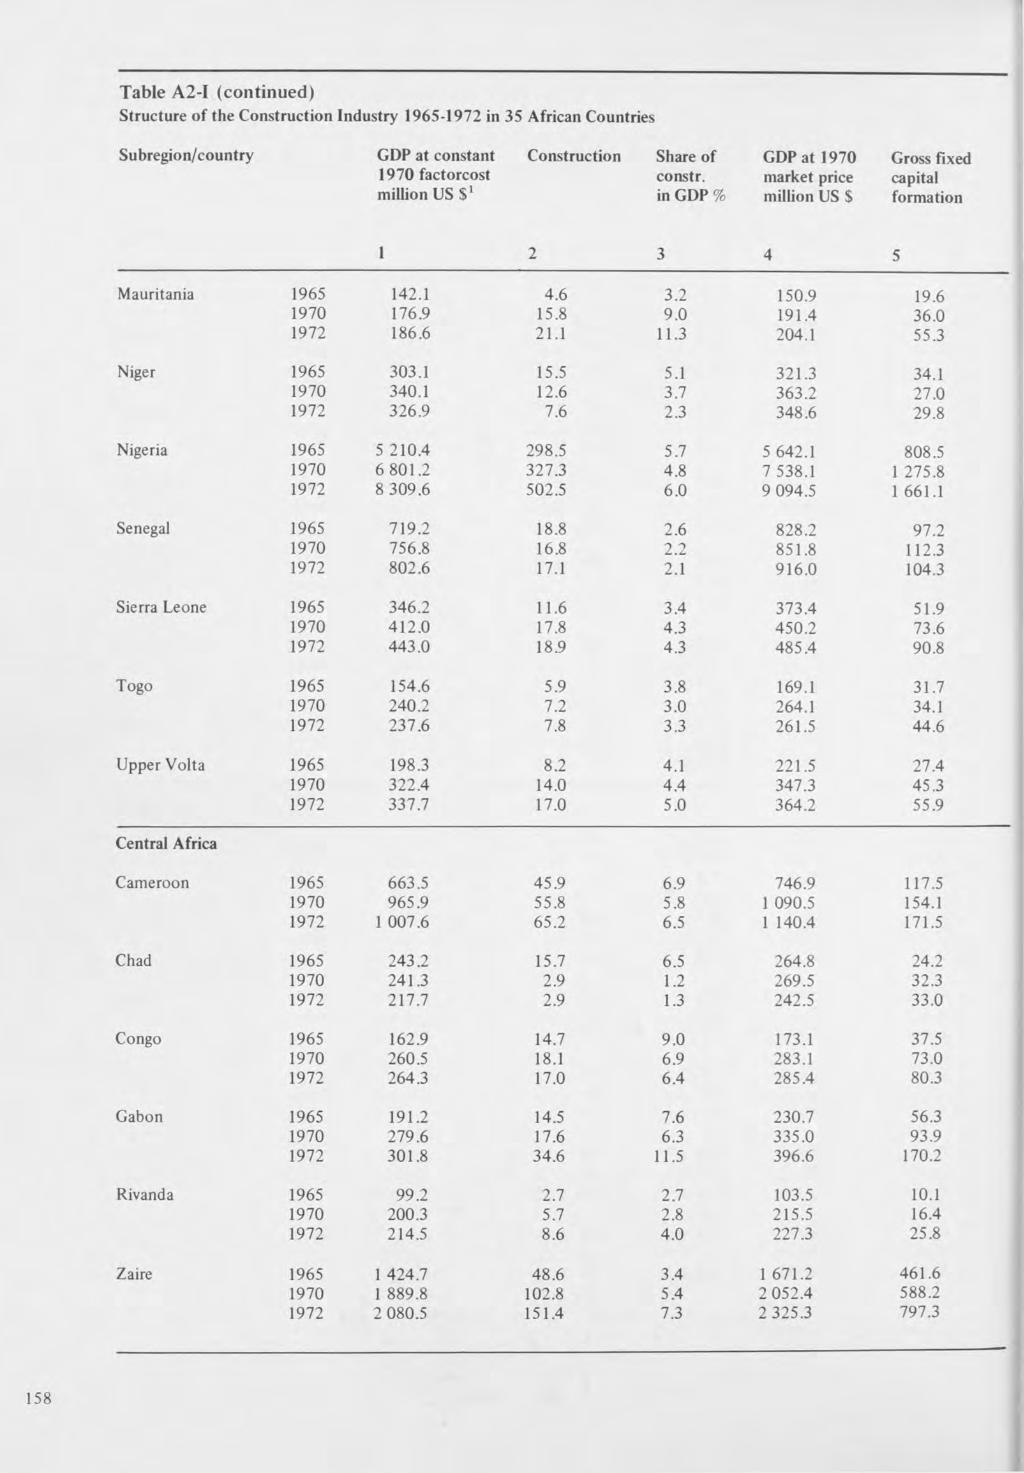
Table A2-I (continued) Structure of the Construction Industry 1965-1972 in 35 African Countries
Subregion/country GDP at constant Construction Share of GDP at 1970 Gross fixed 1970 factorcost constr. market price capital million US S1 in GDP % million US $ formation
1 2 3 4 5
Mauritania 1965 142.1 4.6 3.2 150.9 19.6 1970 176.9 15.8 9.0 191.4 36.0 1972 186.6 21.1 11.3 204.1 55.3
Niger 1965 303.1 15.5 5.1 321.3 34.1 1970 340.1 12.6 3.7 363.2 27.0 1972 326.9 7.6 2.3 348.6 29.8
Nigeria 1965 5 210.4 298.5 5.7 5 642.1 808.5 1970 6 801.2 327.3 4.8 7 538.1 1 275.8 1972 8 309.6 502.5 6.0 9 094.5 1 661.1
Senegal 1965 719.2 18.8 2.6 828.2 97.2 1970 756.8 16.8 2.2 851.8 112.3 1972 802.6 17.1 2.1 916.0 104.3
Sierra Leone 1965 346.2 11.6 3.4 373.4 51.9 1970 412.0 17.8 4.3 450.2 73.6 1972 443.0 18.9 4.3 485.4 90.8
Togo 1965 154.6 5.9 3.8 169.1 31.7 1970 240.2 7.2 3.0 264.1 34.1 1972 237.6 7.8 3.3 261.5 44.6
Upper Volta 1965 198.3 8.2 4.1 221.5 27.4 1970 322.4 14.0 4.4 347.3 45.3 1972 337.7 17.0 5.0 364.2 55.9
Central Africa
Cameroon 1965 663.5 45.9 6.9 746.9 117.5 1970 965.9 55.8 5.8 1 090.5 154.1 1972 1 007.6 65.2 6.5 1 140.4 171.5
Chad 1965 243.2 15.7 6.5 264.8 24.2 1970 241.3 2.9 1.2 269.5 32.3 1972 217.7 2.9 1.3 242.5 33.0
Congo 1965 162.9 14.7 9.0 173.1 37.5 1970 260.5 18.1 6.9 283.1 73.0 1972 264.3 17.0 6.4 285.4 80.3
Gabon 1965 191.2 14.5 7.6 230.7 56.3 1970 279.6 17.6 6.3 335.0 93.9 1972 301.8 34.6 11.5 396.6 170.2
Rivanda 1965 99.2 2.7 2.7 103.5 10.1 1970 200.3 5.7 2.8 215.5 16.4 1972 214.5 8.6 4.0 227.3 25.8
Zaire 1965 1 424.7 48.6 3.4 1 671.2 461.6 1970 1 889.8 102.8 5.4 2 052.4 588.2 1972 2 080.5 151.4 7.3 2 325.3 797.3

Investment GDP per Added value Index ratio capita2 by constr. (1965 = ICQ)
per capita US s1 2
6 7 8 9
13.0 138 4.4 100 18.8 151 13.6 309 27.1 152 17.2 391
10.6 206 10.5 100 7.4 193 7.1 68 8.5 195 4.5 43
14.3 107 6.1 100 16.9 124 6.0 98 18.3 143 8.6 141
11.7 206 5.4 100 13.2 193 4.2 78 11.4 195 4.1 76
13.9 146 5.0 100 16.3 162 7.0 140 18.7 169 7.3 146
18.7 94 3.6 100 12.9 122 3.7 103 17.1 114 3.8 106
12.4 41 1.7 100 13.0 60 2.6 153 15.3 60 3.0 176
15.7 125 8.6 100 14.1 165 9.6 112 15.0 167 10.9 127
9.1 73 4.7 100 12.0 66 0.8 17 13.6 57 0.7 15
21.7 194 17.5 100 25.8 277 19.1 109 28.1 270 17.3 99
24.4 416 31.6 100 28.0 559 35.2 111 42.9 592 68.1 216
9.8 32 0.9 100 7.6 54 1.5 167
11.4 55 2.2 244
27.6 81 2.8 100 28.7 87 4.7 168 34.3 91 6.6 235

Table A2-I (continued) Structure of the Construction Industry 1965-1972 in 35 African Countries
Subregion/country GDP at constant 1970 factorcost million US S1
1
Construction
2
Share of constr. in GDP %
3
GDP at 1970 market price million US $
4
Gross fixed capital formation
5
East Africa
Ethiopia 1965 1 448.9 85.6 5.9 1 547.4 204.8 1970 1 762.4 83.6 4.7 1 892.2 245.6 1972 1 868.8 90.7 4.9 1 992.5 235.2
Kenya 1965 993.2 40.2 4.0 1 072.9 139.7 1970 1 461.3 73.9 5.1 1 610.7 315.5 1972 1 668.1 83.5 5.0 1 833.9 412.3
Madagascar 1965 590.4 26.8 4.5 669.8 64.5 1970 778.0 30.5 3.9 899.1 131.2 1972 788.7 30.7 3.9 875.4 117.0
Malawi 1965 248.3 9.4 3.8 258.4 27.6 1970 309.0 16.5 5.3 328.1 60.2 1972 379.6 16.4 4.3 406.0 75.4
Mauritius 1965 168.3 11.4 6.8 192.3 32.3 1970 160.5 8.6 5.4 188.5 26.0 1972 204.3 11.9 5.8 238.1 39.1
Tanzania 1965 852.6 27.0 3.2 932.4 118.8 1970 1 150.5 54.1 4.7 1 284.3 254.0 1972 1 257.7 63.9 5.4 1 395.1 293.5
Uganda 1965 724.9 14.9 2.1 774.7 104.8 1970 1 193.6 20.5 1.7 1 322.8 162.5 1972 1 199.6 11.9 1.0 1 331.3 145.2
Zambia 1965 1 011.5 72.6 7.2 1 198.4 222.0 1970 1 451.6 112.1 7.7 1 599.8 436.9 1972 1 499.7 131.3 8.8 1 534.1 467.2
Botswana 1965 59.7 3.5 5.9 63.4 12.1 1970 73.8 4.0 5.4 82.8 15.2 1972 119.3 25.0 21.0 154.6 80.6
Lesotho 1965 61.7 1.1 1.8 65.7 7.3 1970 58.1 1.5 2.6 68.3 7.0 1972 66.3 3.2 4.8 75.1 17.6
1 at 1970 rate of exchange. 2 at constant 1970 factorcost.
Source: 1. Statistical Yearbook 1973 Parts 1,2,3,4 (population tables). 2. GDP estimates for African countries in constant 1970 prices in Statistical and economic
information Bulletin for Africa nr. 5. p. 211-224.

Investment GDP per Added value Index ratio capita2 by constr. (1965 =100)
per capita u s s 1 2
6 7 8 9
13.2 64 3.8 100 13.0 72 3.4 89 11.8 72 3.5 92
13.0 106 4.2 100 19.6 130 6.6 157 22.5 138 6.9 164
9.6 97 4.4 100 14.6 115 4.5 102 13.4 112 4.4 100
10.7 63 2.4 100 18.3 70 3.7 154 18.6 81 3.5 146
16.8 227 15.4 100 13.8 198 10.7 69 16.4 246 14.3 93
12.9 73 2.3 100 19.8 87 4.1 178 21.0 90 4.9 213
13.5 85 1.8 100 12.3 122 2.1 117 10.9 115 1.2 67
18.5 273 19.6 100 27.3 347 26.7 136 30.5 339 29.8 152
19.1 107 0.3 100 18.4 114 6.2 98 52.1 173 36.3 576
11.1 73 1.3 100 10.2 62 1.6 123 23.4 68 3.3 254

Table A2-II Share of Building in GDP 1960-1973
Subregion, country, currency unit Source GDP in GFCF Share of and period purch. val. GFCF in
current GDP prices per cent
North Africa
Algeria, 1 000 million dinars 1963 (1) 13.13 2.71 20.6 1969 (1) 20.52 5.75 28.0 1970 (1) 22.91 7.60 33.2 1971 (1) 23.52 8.60 36.6
Egypt, million Egyptian pounds 1960 (1) 1 455.5 225.6 15.5 1965 (1) 2 403.8 377.4 15.7 1969 (3) 2 971.3 350.3 11.8 1970 (3) 3 145.5 355.0 11.3 1971 (3) 3 336.7 370.4 11.1
Libya, million Libyan pounds 1962 (1,2) 169.7 64.5 38.2 1965 (1,2) 517.3 146.9 28.4 1969 (1,2) 1 267.2 316.6 24.9 1970 (3) 1 329.3 242.7 18.3 1971 (3) 1 508.8 269.5 17.9 1972 (3) 1 599.2 355.0 22.2
Morocco, 1 000 million dirhams 1960 (1,2) 9.09 0.92 10.1 1965 (1,2) 13.16 1.44 10.9 1970 (1) 16.96 2.61 15.4 1971 (3) 18.53 2.62 14.1 1972 (3) 20.15 2.67 13.3
Sudan, million Sud. pounds 1966 (1,2) 497.6 71.8 14.4 1969 (1) 602.6 96.0 15.9 1970 (3) 637.6 73.2 11.5
Tunisia, million dinars 1960 (1) 334.2 59.5 17.8 1965 (1) 495.9 132.3 26.7 1970 (3) 746.9 149.5 25.2 1971 (3) 861.7 172.2 20.0 1972 (3) 1 043.7 196.8 18.6 1973 (3) 1 117.3 237.4 21.2
West Africa
Dahomey, 1 000 million CFAF 1965 (1) 46.5 5.9 12.7 1966 (1) 48.1 6.3 13.1 1967 (3) 48.7 8.6 17.7 1970 (3) 61.3 10.2 16.6
Gambia, million dalasi 1965 (1) 72.0 9.0 12.5 1970 (1) 96.0 13.5 14.1
Ghana, million newcedi 1960 (1) 956 194 20.3 1965 (1) 1 608 271 16.9 1970 (1) 2 262 218 9.6 1971 (3) 2 500 311 12.4 1972 (3) 2 827 244 8.6
Ivory Coast, 1 000 million CFAF 1960 (1) 140.7 19.1 13.6 1965 (1) 236.8 43.6 18.4 1969 (1) 364.0 61.8 17.0 1970 (1) 414.0 83.9 20.3 1971 (1) 445.1 92.3 20.8 1972 (3) 478.8 . . . . . .

Share of construction in GFCF per cent
total res. bu. non res. infra str. land bu. impr.
Share of Share of "resident- "total ial building" building in GDP in GDP per cent per cent
28.4 28.0
42.2 46.9 50.0 45.7 42.8
55.8 69.7 63.6 76.4 74.8
27.0 42.3 47.2 60.4 61.2
+ 4-• 4 • + > i > 4
28.8 29.4 16.4 16.0 13.6
11.8 1 1 . 1 11.0
55.5 53.8 53.6 59.9 69.3
2 2 . 2 ' 19.2 19.5 25.6 28.1
> i > i-> 4-> f-
33.3 34.6 34.1 34.3 32.2
2.2 2.1 3.0 3.6 3.7
10.9 15.0 39.0
24.2 16.3 22.3
11.3 3.2
12.0 13.6 11.0
4.7 3.8 2.5
2.6 2.6
3.5 4.4 2.9
65.2 60.7 62.9 59.5 59.4 57.6
15.0 13.0 13.2 13.0
> 4 > 4-> f-
47.9 46.5 46.2 44.6
3.8 2.6 2.5 2.8
52.7 54.1 44.2
68.9 45.9
62.8 64.2 64.2 63.2 63.7
63.9 38.8 54.5
64.1
29.2 46.7 37.2
43.3 28.1
45.3 40.6 52.3 47.3 43.4
-> 4 > 4 > 4
-• 4-> 4-
> 4 > 4--• 4 > 4 > 4-
63.9 38.8 54.5
64.1
23.5 7.4 7.0
25.6 17.8
17.5 23.6 11.9 15.9 20.3
4.9 5.8 6.6
5.4 4.0
9.2 6.9 5.0 5.9 3.7
163

Table A2-II (continued) Share of Building in GDP 1960-1973
Subregion, country, currency unit and period
Source GDP in purch. val. current prices
GFCF Share of GFCF in GDP per cent
Mali, 1 000 million Mali francs 1965 (1) 94.9 11.0 11.6 1969 (1) 135.5 18.1 13.4
Mauritania, 100 million CFAF 1968 (1,2) 47.1 11.3 24.0
Niger, 1 000 million CFA francs 1961 (2) 5.1 1965 (1) 74.0 7.9 10.7 1966 (1) 96.0 8.8 9.2
Nigeria, million Nig. pounds. 1960 (1) 1 206.7 159.4 13.2 1965 (1) 1 683.7 241.3 14.3
million naira 1970 (3) 52 81 1 8 449 16.0 1971 (3) 66 509 12 349 18.6 1972 (3) 71 815 14 800 20.6 1973 (3) 84 527 17 459 20.7
Sierra Leone, million Leone 1963 (2) 205* 24.6 12.0 1965 (1,2) 279.9 38.9 13.9 1969 (1,2) 369.0 56.3 15.3 1970 (3) 375.3 61.4 16.4
Togo, 1 000 million CFAF 1967 (1,2) 57.03 10.16 17.8 1969 (1) 69.64 8.72 12.5 1970 (1) 73.42 9.49 12.9
Upper Volta, 1 000 million CFAF 1965 (1) 56.5 7.0 12.4 1966 (1) 58.2 7.0 12.0 1968 (1) 79.0 6.7 8.5
Central Africa
Cameroon, 1 000 million CFAF 1965 (1,2) 176.0 27.9 15.9 1967 (1,2) 219.4 34.6 15.8 1969 (3) 280.0 35.3 12.6 1970 (3) 302.9 42.8 14.1
C A.R., 1 000 million CFAF 1970 (1) 57.0 8.2 14.4
Chad, 1 000 million CFAF 1970 (1) 74.9 9.0 12.0
Congo, 1 000 million CFAF 1970 (1) 78.6 20.0 25.4
Gabon, 1 000 million CFAF 1969 (1) 80.8 28.3 35.0 1970 (1) 89.5 30.5 34.1 1971 (1) 105.1 32.2 30.6
* estimates 1972* (1) 108 5 51.5 47.5
Zaire, million Zaires 1970 (3) 1 419.1 226.5 16.0

Share of construction in GFCF per cent Share of Share of "resident- "total ial building" building"
total res. bu. non res. infra str. land in GDP in GDP bu. impr. per cent per cent
56.4 4 - 56.4 •
54.1 4- - 54.1 -•
50.4 4- - 15.0 -• 4- -35.4 -> 3.6
70.6 4- -60.8 -• 4— - 9.8 > 59.5 4- -51.9 > 4— - 7.6 -• . . . 5.5 56.1 4- -49.4 -• i - 6.7 > 4.5
65.4 4- -35.2 • 21.7 8.5 4.6 61.4 4 -26.5 > 19.7 15.2 • • • 3.8 56.5 4 -23.0 -• 30.0 3.5 . . . 3.7 60.9 4- •26.6 -> 31.5 2.8 • • • 4.4 65.3 4- •25.9 36.7 2.7 • . • 5.3 70.4 4- 30.5 > 36.4 3.5 6.3
55.7 23.2 3.7 28.0 0.8 2.8 3.2 47.0 18.8 3.3 21.6 3.3 2.6 3.1 46.3 21.0 3.4 21.7 0.2 3.2 3.7 45.6 4- - 45.6 -•
60.8 4- -25.5 > 4— 35.3 • 4.5 49.2 - 49.2 > • . • • • •
52.6 4 -31.1 > 4- -21.5 4.0
60.0 4- -38.6 -> 4- 21.4 4.8 61.4 4- -35.7 -• 4- 25.7 -• • • • 4.3 72.7 4- -63.7 -• 4- 9.0 > 5.4
67.8 4- -45.9 -• 4 21.9 -• 7.3 63.1 4 - 45 4 -• i 17.7 -• • • a 7.2 62.3 21.2 19.0 i 22.1 -• 2.7 5.1 58.9 17.1 18.7 4 23.1 -• 2.4 5.0
19.5 4- - 19.5 ->
4- > . . . 4- . -•
. . . 4- , ,
56.5 4 - 56.5 >
45.0 12.5 14.5 14.2 3.8 2.0 4.3

Table A2-II (continued) Share of Building in GDP 1960-1973
Subregion, country, currency unit Source GDP in GFCF Share of and period purch. val. GFCF in
current GDP prices per cent
East Africa
Botswana, million Rands 1968 (1.2) 47.9 9.9 20.7
Ethiopia, million Eth. dollars 1969 (3) 4 056 544 13.4 1970 (3) 4 442 512 11.5 1971 (3) 4 701 554 11.8 1972 (3) 4 717 603 12.8
Kenya, million Ken. pounds 1965 (1) 351.5 45.7 13.0 1970 (1) 575.5 112.7 19.6 1971 (1) 643.0 144.2 22.4 1972 (1) 711.2 159.9 22.5 1973 (3) 805.7 181.5 22.5
Lesotho, million Rands 1965 0,2) 39.2 4.4 11.2 1967 (1,2) 42.3 5.2 12.3
Madagascar, 1 000 million Mg. fr. 1966 (1) 181.6 22.4 12.3 1969 (1) 224.3 33.6 15.0 1970 (1) 249.8 36.4 14.6 1971 (1) 268.5 41.7 15.5
Malawi, million Kwachas 1960 (1) 94.6 14.0 14.8 1965 (1) 180.4 19.3 10.7 1969 (1) 246.4 49.0 19.9 1970 (3) 272.0 50.2 18.5 1971 (3) 335.9 53.2 15.8
Mauritius, million rupees 1960 (1) 649 194 29.9 1965 (1) 923 155 16.8 1970 (1,4) 1 048 145 13.8 1971 (1,3) 1 161 184 15.8 1972 (3) 1 432 229 16.0
Swaziland, million Rands 1967 (1,2) 53.4 11.2 21.0 1968 (1,2) 57.2 10.7 18.7 1969 (3) 75.3 9.5 12.6 1970 (3) 80.1 16.1 20.1 1971 (3) 100.1 20.0 20.0
Tanzania, million shillings 1960 (1,4) 3 966 464 11.7 1965 (1,4) 6 140 789 12.9 1970 (3) 9 175 1 815 19.8 1971 (3) 9 803 2 359 24.1 1972 (3) 10 922 2 298 21.0 1973 (3) 12 470 2 828 22.7
Uganda, million shillings 1965 (1,2) 5 9001 776 13.2 1970 (2,3) 9 449 1 261 13.3
1 estimates 1971 (3) 10 367 1 632 15.7
Zambia, million Kwacha 1966 (1,2) 782.3 175.8 22.5 1969 (3) 1 240.1 253.6 20.4 1970 (2,3) 1 185.3 327.6 27.6

Share of construction in GFCF per cent
total res. bu. non res. infra str. land bu. impr.
Share of Share of "resident- "total ial building" building' in GDP in GDP per cent per cent
53.5 30.3 11.1 12.1 6.3 8.6
65.3 67.2 67.3
65.3 67.2 67.3
48.3 16.8 11.2 17.7 2.6 2.2 3.6 49.3 16.6 12.5 18.1 2.1 3.3 5.7 50.7 16.4 11.8 20.8 1.7 3.7 6.3 53.3 15.6 12.9 23.2 1.6 3.5 6.4 53.2 12.6 10.9 28.3 1.4 2.8 5.3
68.1 86.5
58.7
68.5 55.4 56.1 42.6 37.8
66.4 61.3 66.3 61.4 47.9
63.6 82.7
67.1 51.8 53.7
51.5 40.0
22.8 20.7 14.8
15.9 16.3 14.8
-• 4 • 4
58.7
> 4 + 4 42.6 37.8
-• 4-> 4
24.8 22.8 16.6
4.5 3.8
1.4 3.6 2.4
14.9 21.3
2.8 1.6 1.7
3.1 3.3 2.4
7.1 10.2
9.9 5.5
10.7
15.4 6.7 5.3 5.8 4.8
53.5 21.4 14.3 9.8 8.0 4.5 7.5 43.0 13.1 14.0 11.2 4.7 2.5 5.1 52.5 10.5 21.0 21.0 • • • 1.3 4.0 35.5 5.0 17.4 13.1 • • • 1.0 4.5 35.0 7.5 12.5 15.0 1.5 4.0
59.1 4- -37.5 > 4— - 21.6 4.4 50.9 20.3 17.0 13.1 0.5 2.6 4.8 54.4 14.4 12.0 26.4 1.6 2.9 5.2 58.1 12.0 9.2 34.3 2.6 2.9 5.1 64.7 12.9 9.7 39.8 2.3 2.7 4.7 63.7 11.5 10.6 39.9 1.7 2.6 5.0
45.5 52.3 43.3
52.4 65.7 58.7
15.2
13.3
13.5 33.0
12.0
45.5 52.3 43.3
23.2
28.1
0.5 32.7
5.3
-•
-•
•>
3.4
3.7
6.5 6.7 7.0

Table A2-II (continued) Share of Building in GDP 1960-1973
Subregion, country, currency unit Source GDP in GFCF Share of and period purch. val. GFCF in
current GDP prices per cent
Other Africa
South Rhodesia, million R. dollars 1965 1970 1971 1972
South Africa, million Rands 1960 1965 1970 1971 1972
(1,2) 751.9 100.0 13.3 (2) 1 079.5 171.7 15.9 (3) 1 227.0 221.5 18.1 (3) 1 369.9 253.9 18.5
(2,4) 5 473 1 100 20.1 (2,4) 7 968 2 000 25.1 (3) 12 393 3 102 25.0 (3) 13 740 3 682 26.8 (3) 15 404 4 101 26.6
Sources: 1. Statistical Yearbook Africa 1973, National accounts tables part 1-4, Addis Ababa 1974. 2. "The Structure and Changes in Capital Formation in African Countries between 1960 and
1970", in Stat, and Ec. Inf. bulletin Africa no. 4, p. 45-86, Addis Ababa 1973. 3. Completed United Nations Questionnaires on National Accounts for the years 1970, 1971,
1972,1973. 4. Survey of Economic Conditions in Africa 1972, p. 140-142, Addis Ababa 1974.
Table A2-III Average Structure of the Construction Industry in Africa
Sectors All New work Repair & maintenance Maintenance work as percentage of
Total Public Private Total Public Private new work
Agriculture, forestry, fishing, mining, quarrying
11 10.2 2.2 8.0 8.8 0.1 0.7 8
Manufacturing,» including construction
12 11.4 2.4 9.0 0.6 0.1 0.5 5
Gas, electricity, water 7 6.6 6.6 — 0.4 0.4 — 6
Transport, communications, roads and other public services
24 16.0 16.0 — 8.0 8.0 — 50
Trade, commerce and other private services
5 4.5 0.5 4.0 0.5 — 0.5 10
Dwellings 35 31.8 0.3 31.5 3.2 — 3.2 10
Education 3 2.8 2.1 0.7 0.2 0.2 — 7
Health and welfare 3 2.8 2.3 0.5 0.2 0.2 — 7
Totals 100 86.1 32.4 53.7 13.9 9.0 4.9 16
EGA rough estimates pending availability of accurate figures.
Source: United Nations Economic and Social Council, The Status and Problems of Housing and Construction Industry in Africa, E/CN. 14/HOU/104.

Share of construction in GFCF per cent Share of Share of "resident "total ial building" building"
total res. bu. non res. infra str. land in GDP in GDP bu. impr. per cent per cent
59.3 i -29.7 > 16.9 12.7 4.0 60.8 19.0 19.6 15.4 6.8 3.0 6.1 58.7 16.7 22.4 13.9 5.7 3.0 7.1 61.4 17.1 27.1 11.9 5.3 3.2 7.2
63.7 18.2 18.2 50.0 15.0 15.0 56.7 17.0 16.4 57.9 16.5 17.2 58.3 15.2 15.7
27.3 20.0 23.3 24.2 27.4
3.7 3.8 4.2 4.4 4.0
7.3 7.6 8.3 9.0 8.2
purch. val. = purchasers values res. bu. = residential building non res. bu. = non-residential building infra str. = infrastructure land impr. = land improvement
Table A2-IV Imports of Some Key Materials in Relation to Total Consumption
(Value in million US $)
Building Materials Consumption Imports Total Imports as Locally Domestic a % of Total Produced Consumption Domestic
Consumption
1. Cement and Cement Products — 25%
390.90 346.60 737.50 47
2. Iron and Steel Products — 34%
120.40 882.64 1 003.00 88
3. Ceramic Products including Glass and Other Non-metallic Products — 10%
118.00 117.00 295.00 60
4. Wood Products — 17% 325.97 175.53 501.50 35
5. Paints and Varnishes -4%
59.00 59.00 118.00 50
6. Electrical Fittings and Fixtures — 10%
— 295.00 295.00 100
Total 1 014.23 1 935.77 2 950.00 65
Source; United Nations Economic and Social Council, The Status and Problems of Housing and Construction Industry in Africa, United Nations, June 1973.

Table A2-V Domestic Production of Building Materials and Related Industries in Africa
Number of countries by region and total
Country Cement Cement Asbestos Clay Iron and products cement products steel
products works (integrated plants)
Iron and steel
Non-ferrous
Worked wood
products metals
8 10
14
North Africa Algeria X Libya Morocco X Sudan X Tunisia X United Arab
Republic X
Subtotals 5
West Africa Dahomey Gambia Ghana Guinea Ivory Coast Liberia Mali Mauritania Niger Nigeria X Senegal X Sierra Leone Togo Upper Volta
Subtotals 2
Central Africa Angola X Cameroon Central African
Republic Chad Congo (Braz.) Congo
(Kinshasa) X Gabon
X X X X X
X
X X X X X X
X X X
X X
X
X
X
X
X
X
4
X X X X X
X
X X X X X X X
X X X X X X
13
X X
X
X
X X
X
X
2
0
X
X
X
X
4
X
X
X X
X X
X
X
X
X
X
X
4
X X
X X
X
X
X X X
X
5
X X X X X X
X X X X
10
X X
X
X X
Subtotals 0 0

Plywood Paints and varnishes (mixing and production)
Sheet Electrical Sanitary Sanitary glass fittings, ware fittings
fixtures
1 1 12 13 14 15 16
X
X
X
X
3
X
X
X
3
X
X
X
3
X
X
X
X
X
X X
X
X X
X
X
0 0 0
4 2 0 0 0 0

Table A2-V (continued) Domestic Production of Building Materials and Related Industries in Africa
Number of countries by region and total
Country Cement Cement products
Asbestos cement products
Clay products
Iron and steel works (integrated plants)
Iron and steel
Non-ferrous
Worked wood
products metals
East Africa Burundi X — X —
Ethiopia X X — X — X — X Kenya X X X X — X X X Madagascar X X . . . X — . . . • • . X Mauritius — X — X — — — —
Mozambique X X . . . X — • • • • • • X Nyasaland X X . . . X — • . • • • • X Northern
Rhodesia X X X X — X X X Rwanda — X — X —
Somalia X — • • • — — — X Southern
Rhodesia X X X X X X X X Tanganyika riilpia X — X — X X Uganda X X X X — X — X
Subtotals 8 13 4 12 1 5 4 10
Grand totals 17 32 9 37 3 17 14 30
Source: "The African building materials industries", (E/CN. 14/HOU/34).
Note: Presence of building material X Absence of building material — No information available . . .

Plywood Paints and varnishes (mixing and production)
Sheet Electrical Sanitary Sanitary glass fittings, ware fittings
fixtures
X X
X X
X
X X
4
12
X X
3
1 1
0
3
4
8
X
2
4
0
1

Table A2-VI Definition of Production Criteria and Grades
Production criterion Grade
A B C
1. Raw materials source The optimum distance from source to factory less than more than
8 km 8-160 km 160 km 2. Water requirement
The volume of water consumed to manufacture $2 400 of product more than 4 500 - less than
13 500 litres 13 500 litres 4 500 litres 3. Fuel costs
The total fuel costs as a percentage of production costs more than less than
10 5-10 5 4. Electricity requirement
Electricity cost as a percentage of fuel costs more than less than
90 50-90 50 5. Minimum size of market
The minimum value of annual output that would justify capital costs (thousands of $) more than less than
1 200 240-1 200 240 6. Capital for storage
Outlay on storage facilities at all stages of manufacture expressed as a percentage of capital costs more than less than
15 5-15 5 7. Reliability of process
The length of time the basic process has been used commercially less than more than
10 years 10-30 years 30 years 8. Adjustability of process
How easily the process can be adjusted to market demand continuous intermittent adjustable
process but regular to demand 9. Plant maintenance
The percentage of production time lost through maintenance 10 5 nil
10. Supervision/quality control The ratio of supervisors to total labour force and proportion of their time spent only on supervisory duties 10% 5% intermittent
continuous continuous supervision 11. Skilled labour
The ratio of fully skilled operatives to the total labour force more than less than
50% 10%-50% 10% 12. Production per man-hour
The value of product per man-hour worked less than more than
$4 $4-$ 10 $10 13. Packaging
The percentage of costs added for packaging 10 5 nil

Production criterion Grade
A B C
14. Value/weight ratio The sale value per ton of product
15. Handling for delivery The equipment required for loading and unloading transport vehicles
less than $30
cranes
$30-$ 150
hoists, lifts etc.
more than $150
no equipment
16. Cost of delivery The addition to works costs for delivery cost more than
10% in 50 mile radius
5%-10% any distance
less than 5% any distance
Source: Building Materials Industry, Unido Monograph, No. 3, UN, New York, 1971.

Table A2-VII Classified Building Materials graded according to selected production criteria
Materials Production criteria
Raw Water Fuel materials require- costs source ment
Electricity requirement
Minimum Capital market for size storage
1. Building stone (sedimentary)3 A C B BC C C 2. Building stone (igneous & metamorphic)b C B B B B C 3. Natural aggregates A A B BC C B 4. Synthetic aggregates A A A B B B 5. Portland cements0 A AB A C AB B 6. Limesc A C A C C C 7. Gypsum plasters0 B B B C AB C 8. Plasterboard B A B C A B 9. Glass sheet B A A C A A
10. Concrete blocks B AB C C BC AB 11. Concrete tiles B B C C B B 12. Concrete pipesd B A C B BC A 13. Sand-lime bricks AB C B C C BC 14. Asbestos-cement products C A C B B B 15. Pre-cast concrete units B B B C BC A 16. Pre-stressed concrete units6 B B C B B B 17. Woodwol slabsf C A C BC BC C 18. Clay bricks/blocksg A A AB C BC C 19. Clay tiles C B B C B C 20. Ceramic and stoneware pipes B B B C B C 21. Ceramic sanitary ware C C B C C A 22. Sawnwood BC C C C C C 23. Plywood panels C C C B B B 24. Chipboard units B C A C B C 25. Timber window frames C C C A C A 26. Timber flush doors C C C B B B 27. Plastic panels11 C C B B B A 28. Plastics fabrication1 C B B B B C 29. Roofing felts C C C C C C 30. Paints and varnishes C C B B C B 31. Joint sealants and mastics C C C B B B 32. Reinforcing barsJ B C C A C A 33. Rolled steel sectionsk AB A A C A A 34. Structural steel fabrication C B C A C A 35. Steel pipes B * B C A B 36. Cast-iron pipes B A B C A B 37. Steel window frames B C C B B B 38. Stainless steel sheet1 C A B C A C 39. Aluminium sheet/extrusionsm C C C c C C 40. Aluminium window frames C B C A B B 41. Copper/brass pipes C * B C A B
a Including quarrying and processing. b Excluding quarrying. c Excluding extraction of raw materials. d Including production of ancillary items such as man-holes, inspection chambers etc. e Production in highly mechanized plants. 1 Production on an industrialized scale. § Production by modern plant. h Production of purpose-made products.
Source; Building Materials Industry, UNIDO Monograph No. 3, UN, New York, 1971.

Age of Continu Plant Super Skilled Produc Packaging Value/ Handling Cost of process ity of mainte vision labour tion per weight for delivery process
process nance and man-hour ratio delivery process quality control
C C C C AB A C AB BC A C C C C B B C B BC B C C B C C BC C A BC A A AB A A C B C A BC A B A A A B AB AB A C A C AB B C C A B A C B C C B B AB B B A C A C C B B AB B C B C B BC A B B B A B B BC B C C B B C AB C A BC A B C C B C B C A C A B B A B C C C B AB A C BC C C C A C A C A C A A B BC AB C B C B B B AB AB BC AB C A AB A A A B B B BC C A A A C C C B C B C B C B C A C B C A BC A BC A C C C B B A B BC BC P C C C C B A B B BC B C B B B B A B C C C C C C B BC AB C BC C B C C C B AB AB C B B C B AB C B C B C B B B C C C B B BC C C C C B C B B B B C C C C B C C A A A C C C C A B B A B B C C C C C A B B B * C B C C B C C A B B A A C C B C C A C B A A C C B B A B B C C C BC C B A B B A B C B A B B C C B B A C C A B B C B B B * C B AB B C B B * B B C B AB B B B C B B * C B C C B A B B B C C C B C B B C A A * C C BC C A C C B B c C C C B B A B B B * C C AB B
1 Including a variety of processes, of which the most important are injection moulding and extrusion.
J Excluding rolling bars, but including cutting, bending etc. k Including smelting iron and steel and the rolling processes. 1 Including production of sheet from steel slab. m Production from ingot. * Not available.

mmgrni emmäaBtoMM

Annexe 3 Additional Statistical Data concerning the Resettlement Project in Port Sudan Town.
179

Table A3-I-1 Area, Population and Density by Province in 1955/56 and 1973
Province Area Population Population Density Density sq.km (000s) (000s) 1955/56 1973
1955/56 1973 (1) (2) (3) (4) (5)
BaKral Ghazal 213 751 999.0 1 366.6 5 6
Blue Nile 142 138 2 069.4 3 914.0 15 28
Darfur 496 369 1 328.8 1 838.7 3 4
Equateria 198 131 903.5 724.5 5 4
Kassala and Red Sea 340 655 941.0 1 472.3 3 5
Kordofan 380 546 1 762.0 2 010.3 5 5
Northern 477 074 873.0 901.8 2 2
Upper Nile 236 180 888.6 798.8 4 3
Khartoum 20 971 504.9 1 113.3 24 53
Total 2 505 805 10 270.2 14 140.3 4 6
Source: Statistical Yearbook 1973, Department of Statistics
Table A3-1-2 Urban Population by Province of Birth
Province of All six By Province of Residence Birth Provinces
Blue Nile Darfur Kassala Khartoum Kordofan Northern
Both sexes 1 454.5 312.0 111.0 270.7 459.0 180.4 121.4
Blue Nile 282.6 248.5 1.3 6.1 21.0 4.6 0.9
Darfur 130.8 9.5 101.9 3.9 10.9 4.3 0.3
Kassala 208.1 2.0 0.3 200.3 4.0 0.5 0.8
Khartoum 339.2 7.6 1.3 5.3 318.8 3.5 2.7
Kordofan 199.3 12.1 2.2 5.7 21.2 156.3 1.7
Northern 243.5 19.9 2.2 42.3 60.8 5.7 112.6
Southern 13.3 2.4 0.6 0.9 6.6 2.1 0.6
Outside Sudan 37.8 10.0 1.2 6,2 15.5 3.2 1.6
Source; Statistical Yearbook 1973, Department of Statistics

Table A3-I-3 Immigrants by Province of Latest Residence
Sex Province of latest immigration
All six Provinces
By Province of Residence
Blue Nile Darfur Kassala Khartoum Kordofan Northern
Both sexes 452.710 96.380 24.210 90.200 155.220 51.150 35.550
Blue Nile 68.110 33.510 1.020 6.600 21.090 4.620 1.270
Darfur 43.990 9.410 15.320 3.610 10.900 4.360 0.390
Kassala 30.210 2.150 0.380 21.250 4.070 0.610 1.750
Khartoum 38.220 7.900 1.520 6.110 15.020 3.650 4.020
Kordofan 69.760 12.060 2.328 5.470 21.240 27.040 1.570
Northern 151.490 19.250 1.940 40.330 60.800 5.370 23.800
Southern 14.210 2.420 0.690 1.160 6.550 2.390 1.000
Outside Sudan 36.720 9.680 0.960 5.670 15.550 3.110 1.750
Source; Statistical Yearbook 1973, Department of Statistics

Table A3-I-4 Economically Active Population by Sector and Sex in 1967/68
Area/Sex Total Animal Agriculture Husbandry Forestry
Finishing
Industry Handicrafts Building «& Construction
A. Males
(i) Urban
(ii) Semi-Urban
(Iii) Rural
(iv) All areas
B. Females
(i) Urban
(ii) Semi-Urban
(iii) Rural
(iv) All areas
C. Both sexes
(i) Urban
(ii) Semi-Urban
(iii) Rural
(iv) All areas
100.00
100.00
100.00
100.00
100.00
100.00
100.00
100.00
100.00
100.00
100.00
100.00
0.43
1.10
4.26
3.53
7.14
6.02
0.38
0.97
4.77
3.96
6.33
30.21
79.87
66.68
3.78
30.38
18.02
72.20
6.03
30.19
79.74
67.45
4.35
2.20
0.41
1.03
1.27
3.89
2.09
0.33
0.89
5.08
5.64
1.91
2.63
18.56
12.66
7.52
8.71
6.60
6.46
2.93
3.62
3.61
3.39
1.06
1.56
0.34
2.85
1.32
1.24
3.28
3.33
1.10
1.54
Source; Statistical Yearbook 1973, Department of Statistics
Table A3-I-5 Gross Domestic Product at Constant 1970 Factor Cost
Sudan GDP at Agriculture Mining Industry Construe- Other factor cost tion Services
1960 1 224.7 715.9 1.0 112.0 78.2 337.6 1965 1 481.0 707.3 1.0 144.0 75.5 553.2 1968 1 692.5 641.9 7.3 186.9 78.0 778.4 1969 1 537.9 618.1 5.0 200.3 69.3* 645.2 1970 1 526.7 624.0 5.1 190.6 64.0* 643.0 1971 1 684.3* 654.3* 12.1* 202.9* 65.2* 749.8* 1972 1 734.3* 663.3* 12.4* 212.4* 67.6* 778.6*
* figures marked with an asterisk indicate that they are either estimates by the ECA secretariat or represent adjustments to original country data by the ECA secretariat.
Source; Statistical and Economic Information Bulletin for Africa, No. 5 op.cit.

Transport Commerce Other Other Seeking & Com- & Trade Government private work for munication Services Services 1st time
7.70
4.92
0.89
2.09
0.34
0.19
0.21
6.91
4.33
0.80
1.78
12.48
12.67
1.91
4.10
6.87
10.13
0.38
1.45
11.83
12.41
1.63
3.66
30.85
20.04
2.39
7.35
17.87
13.92
0.19
2.49
29.39
19.32
2.03
6.56
24.31
14.79
6.13
9.07
23.03
16.77
1.32
3.94
24.12
15.02
5.30
2.24
4.86
5.04
1.18
1.97
29.21
12.03
0.95
3.73
7.56
5.87
1.17
2.29
Table A3-1I-1 Summary of the Deims of Port Sudan Town
Name of Deim Number of Number of Settling began in Families People
Omna/Adrot Dibba + 3 000 + 13 000 + 1950 Gilude + 1 000 + 4 500 + 1950 El Sharef + 600 + 2 500 + 1959 El Salalah + 2 300 + 11 500 + 1959 Dar-es-Salam + 2 400 ± 12 000 ± 1964 Dar-el-Naiem ± 600 + 2 500 + 1965 El Nur + 1 900 + 9 000 ± 1966 Hanah Kamut ± 1 000 ± 4 500 ± 1966 Olei + 1 500 + 2 000 + 1968
+ 14 300 + 61 500
183


Annexe 4 Additional Data concerning the Programme for the Upgrading of Squatter Settlements in Lusaka.
NOTE;
All tables in Annexe 4-II1 are taken from Lusaka Sites and Services Project, op. cit. Request to the IBRD prepared for the Government of the Republic of Zambia by the National Housing Authority, July 1973, Volumes 1 and 4 as indicated:
Tables are based on the following surveys:
DCO Nguluwe: The Research Unit of Department of Community Development "Ground-floor to Development: A Survey of Nguluwe Coumpound", 1967.
DCD Kalingalinga: The Research Unit of Department "A Socio-economic survey of Kalinga-linga", 1967.
Department of Town and Country Planning "Mwazione: A study of an unofficial housing area", 1973 — draft.
University of Wisconsin, Department of Sociology; Zambia Housing Study: Survey of low-cost residential areas in Lusaka, Kitwa and Ndola, 1973, preliminary data.
University of Zambia, School of Humanities and Social Sciences, Subject of Sociology, F/eW work Project 1971. Report by Tony Seymour.
Lundgren, Schlyter and Schlyter, "Zambia, Kapwapwe Compound. A study of an unauthorized settlement". University of Land, Dept. of Architecture, 1969.
Dr. Patrick Ohedite; Demographic data from Lusaka, 1970. Preliminary tabulation.
DTCP George:
UW Chipata, Chaisa, Nguluwe:
UNZA Roma:
LSS:
OH:
185

Table A4-I-1 Population of Districts, compared with 1963
District Population Annual Area Density rate of (hectares) (population
1963 1969 increase COOOs) per 1000 (%) hectares)
Centra! Total 505 164 712 630 5.9 11 629 61 Copperbelt Total 543 465 816 309 7.0 3 133 261 Eastern Total 479 866 509 515 1.0 6910 74 Luapula Total 357 018 335 584 -1.0 5 056 66 Northern Total 563 995 545 096 -0.6 14 781 37 North-Western Total 211 189 231 733 1.6 12 583 18 Southern Total 466 327 496 041 1.0 8 528 58 Western Total 362 480 410 087 2.1 12 640 32
Zambia Grand Total 3 490 170 4 056 995 2.5 75 260 54
Populations of Major Cities
1963 1969
Lusaka 109 300 262 425 Kitwe 123 027 199 798 Ndola 92 691 159 786 Mufulira 80 609 107 802 Chingola 59 517 103 292 Luanshya 75 332 96 282 Kabwe — 65 974 Livingstone — 45 243 Chililabombwe 34 165 44 862 Kalulushi 21 203 32 272
Source: Census of Population and Housing 1969. Final Report, Vol. 1 - Total Zambia.
Table A4-I-2 Working Population 15 Years of Age and Over classified by Broad Industry Groups: Total Zambia
Total African Non-African
Agriculture, forestry and fisheries 330 400 329 200 1 200 Mining and quarrying 57 300 52 900 4 600 Electricity, gas and water supply 8 100 7 600 500 Manufacturing 35 300 33 000 2 300 Construction 58 700 53 700 5 000 Commerce 41 400 39 100 2 300 Transport and communications 35 600 33 000 2 600 Services 189 500 181 400 8 100
Total 756 300 729 900 26 600
Source: Census of Population and Housing 1969, Final Report. Volume 1 - Total Zambia.

Table A4-I-3 Gross National Product at the Factor Cost (millions of dollars)
Zambia GNP total Agriculture, Mines Indust. Construc Other of costs forest, etc. and career Manuf. & tion services of factors Electr,
1960 818.9 92.9 439.5 50.7 41.7 194.1* 1965 1 011.5 101.0 385.2 83.5 72.6 369.2 1968 1 211.1 100.0 383.4 134.7 96.0 497.0* 1969 1 442.9 108.6 586.1 141.6 98.6 508.0 1970 1 451.6 109.6* 547.5* 152.1* 112.1* 530.3* 1971 1 402.0* 112.6* 351.8* 181.5* 115.3* 640.8* 1972 1 449.7* 122.4* 395.3* 189.9* 131.3* 660.8*
* Figures marked with an asterisk indicate that they are either estimates by the ECA Secretariat or represent adjustments to original country data by the ECA Secretariat.
Source: Statistical and Economic Information Bulletin for Africa, No. 5. Op.cit.
Table A4-II-1 Ownership of the Housing Stock 1964 and 1973
19641 % 19732 %
High and medium cost Privately-owned Other owners Government Lusaka City Co. Others
949 64
260
942 1 273
2 215 10.4 4.4 6.0
2 3524
452 N.A.
20 864 2 804
23 272 31.8 29.0
3.8
Low cost (official) Privately-owned Government Lusaka City Co. Others (publicly Owned)
385 679
9 088 195
10 347 48.5 1.8 3.2
42.6 0.9
N.A. 2 3524
14 586 N.A.
16 938 23.1
3.2 19.9
Self-help plots 1 265 5.9 1 265 1.7
Site and service plots — — 5 400 7.4
Low cost (unauthorised) 7 5003 35.2 26 322s 36.0
Total 21 327 100.0 73 197 100.0
N.A. = Not Available.
1 Ministry of Housing and Social Development, Proceedings of the Conference on Urban Housing, Lusaka, March 1964.
2 Lusaka City Council and appropriate Ministries. 3 Estimate based on 1957/58 and 1967 figures. 4 Split between high/medium and low-cost not available, so total divided equally between
the categories. 5 National Housing Authority, counts from 1972 aerial photographs.
Source: Lusaka Sites and Services Project. Request to the IBRD prepared for the Government of the Republic of Zambia by the National Housing Authority, July 1973; Volume 1, page 2.35.

Table A4-II-2 Housing Programmes; Construction of Conventional Low-Cost Houses
Tender Project Type Number Building (Cost per Services Total cost Rent date cost sq.ft) costs
1965 Libala III 3R/478 316 K 1 270 K 2.66 K 478 K 1 748 K 16.80 4R/581 233 K 1 446 K 2.48 K 478 K 1 924 K 18.25 Bachelor Units 52x4 208 K 812 K 3.47 K 200 K 1 012 K 10.00
1966 Libala IV 3R/478 277 K 1 296 K 2.72 K 500 K 1 796 K 16.80 4R/581 152 K 1 474 K 2.54 K 500 K 1 974 K 18.25 5R/769 80 K 1 092 K 2.35 K 500 K 2 402 K 22.40 Bachelor Units 32x4 128 K 788 K 3.37 K 208 K 996 K 10.00
1967 Chilenje S. 2B/536 728 K 1 856 K 3.47 K 630 K 2 486 K 18.20 I and II 3B/646 229 K 2 102 K 3.29 K 630 K 2 732 K 20.10
4B/746 39 K 2 322 K 3.12 K 630 K 2 952 K 22.35 Bachelor Units 60x4 240 K 1 026 K 4.56 K 260 K 1 286 K 12.00
1969 Chilenje S. 2B 456 K 1 791 K 3.34 K 844 K 2 635 K 18.20 Ill and IV 3B 269 K 2 020 K 3.13 K 844 K 2 864 K 21.30
4B 40 K 2 245 K 3.00 K 844 K 3 089 K 25.20
Note: 1 1.5 US $
Specifications;
Libala III and IV: Separate shower, separate W.C. Bedroom 90 sq.ft. min. Electric light and power points, purpose-made 2-plate electric cooker and hot water heater for shower. Walls not plastered and no apron slabs. Plots 45 x 70'.
Chilenje South I and II: Separate W.C. and shower off internal passage. Bedrooms 90 sq.ft. min. Electric light and power points in all rooms. 2-Plate electric cooker and hot water heater. Precast concrete walls and smooth finish both sides, apron slabs and plastic topped timber kitchen work top unit. Plots 45 x 70'.
Chilenje South III andIV: Separate W.C. and shower off internal passage. Bedrooms 90 sq.ft. min. Electric light and power points, electricity for cooking, electric hot water heater. Plots 45 x 70'.
Source: Lusaka Sites and Services Project. Request to the IBRD prepared for the government of the Republic of Zambia by the National Housing Authority, July 1973: Volume 4, page 2.A1.16.

Table A4-1I-3 Planning and Design Standards of Selected Site and Service Schemes in Lusaka
Name of scheme No. of plots Type of scheme Plot size Density Water supply
Net Gross plots/ha plots/ha
Kaunda Square I 1 977 Normal 30' x 60' 43 9 x 18.3 m
32 To each plot
Kaunda Square II 637 & 200 very low cost houses
Normal 45' x 90' 20 12 x 27 m
14.5 To each plot
Chunga 1084 & 276 core houses
Normal 40' x 90' 20 12 x 27 m
14.5 To each plot
Name of scheme Sewage disposal Road access Open space standard Social & Commercial facilities
Kaunda Square I Waterbome from ablution block
18m & 12m gravel roads to 15% of the plots, with communal parking areas & 3.5 m footpaths to remainder of plots
0.74 ha per 1000 40% playing fields 60% incidental O.S. with footpaths plus 0.4 ha per 1 000 for agriculture
1 school per 494 households, 4 sites (0.8-0.9 ha) and one existing. 0.5 ha per 1 000 commercial and social facilities
Kaunda Square II Waterbome from ablution block
30 m, 18m & 12 m gravel roads to each plot
0.36 ha per 1 000 incidental open space
1 school per 435 households (sites 2 and 2.1 ha), 1 church, 1 tavern, 1 clinic per 4 300. Shops 0.06 ha per 1 000
Chunga Waterbome from ablution block
18.5 & 12m gravel roads to 55% of plots, 6 m footpaths to remainder
1.43 ha per 1000 17% incidental O.S. 21% playgrounds 62% recration
1 school per 496 households (sites 3.2, 3.6 & 5.6 ha, one existing) 1 tavem per 2 500. Shops, market & workshops 3.3 ha per 1 000. 0.24 ha per 1 000 community facilities.
Source: Lusaka Sites and Service Project. Request to the IBRD prepared for the Government of the Republic of Zambia by the National Housing Authority, July 1973; Volume 4, page 2.A2.3/4.

Table A4-II-4 Unit Costs of Selected Site and Service Schemes
Lusaka
Kaunda Kaunda Chunga Square I Square II
No. plots 1 977 8682 1 0843
Date 1970 1971 1969
Site clearance and levelling 4.60 — —
Survey — — —
Water Supply 37.30 69.00 91.22 Sewerage 159.70 112.46 167.42 Roadworks 13.80 ) 74.69 Storm water drainage 47.20 > 95.01 15.42 Other )
—
Subtotal 263.00 276.47 348.70 Ablution unit 78.20 196.38 353.00
Total 341.001 472.85 701.70
Service charges 2.50 — 4.50 Service charges with materials loan repayment ViNi — —
Note: 1 1.5 US $
1 It was considered necessary for roads & storm water drainage to be upgraded, & flush cisterns & rodding eyes to be added. Cost K 46.90 + K 40.47 respectively, total K 87.37, therefore total cost per unit K 428.37.
2 Of the 868 plots, 200 are occupied by very low cost houses K 1 550 each, total cost per unit K 1 826.47, rent K 18.90.
3 Of the 1 084 plots, 283 are occupied by core houses K 1 495.50, total cost K 1 844.20 per unit, rent K 14.50.
Source; Lusaka Sites and Services Project. Request to the IBRD prepared for the Government of the Republic of Zambia by the National Housing Authority, July 1973; Volume 4, page 2.A2.5.

Table A4-III-1 Employment in Lusaka Squatter Areas
Employment of Householders
Settlement Date of Survey % of householders in employment Survey
Kalingalinga 1967 94 DCD Nguluwe 1967 93 DCD George 1969 93 OH Roma 1971 96 UNZA George 1972 91 DTCP Chipata 1973 95 UW Chaisa 1973 92 UW Nguluwe 1973 90 UW
Source: Volume 1, page 2.47.
Employment of Males
Settlement Date of Survey % of adult males in employment Survey
Kalingalinga 1969 74 census Old Kanyama 1969 59 census Mtengo 1969 73 census Quarries 1969 72 census George 1969 76 census
Source: Volume 1, page 2.47.
Employment Status of Householders
Employment status George % of householders Nguluwe
Chipata Chaisa
Employee 75.2 78.3 78.8 73.5 Self-employed 14.9 16.9 13.1 16.4 Employer 0.8 Unemployed 9.1 4.8 8.1 9.1
Survey DTCP UW UW UW Date 1972 1973 1973 1973
Source: Volume 1, page 2.48.
Employment by Industry
Major Industrial Group George 1972 Lusaka 1969
Agriculture, hunting, forestry and fishing 0.2% 2.7% Mining and quarrying 0.2% 0.5% Manufacturing 21.2% 9.2% Electricity, gas and water 2.0% 1.1% Constjuction 25.7% 11.6% Wholesale, retail trade, restaurants and hotels 23.0% 7.3% Transport and communications 10.7% 9.4% Financial institutions, insurance, real estate and
business services 1.2% 2.2% Community, personal and social services 12.8% 36.4% Not stated 3.0% 19.6%
Survey DTCP census
Source: Volume 1, page 2.48.

Table A4-III-2 Lusaka Squatter Areas: Occupational Groups
George Squatter Lusaka (DCTP) Areas Built-up 1972 % of % o f
total total
Professional, technical and related workers 1% 8.6 14.7 Administrative and managerial workers — 0.4 2.2 Clerical workers 5% 3.0 5.1 Sales workers 15% 9.4 7.8 Service workers 11% 15.7 22.1 Agriculture and allied sector workers 3% 6.2 4.3 Production and related workers 62% 54.0 36.5 Not stated 3% — —
Source; Volume 1, page 2.49. Volume 4, page 2.A1.16.
Table A4-III-3 Lusaka Squatter Areas; Income
Income Groups
Kwacha George Chipata Chaisa Nguluwe Roma
None 8.7 6.0 8.1 5.5 1 - 9 1.0 1.3 1.0 1 - 8 I « 3.5
10 - 19 1.1 1.3 — 5.5 20 - 29 5.0 8.4 4.0 3.6 35.1 3 0 - 39 16.0 18.0 11.1 16.3 17.6 40 - 49 21.1 25.3 12.1 20.0 ] i OQ Ö 50 - 59 9.9 18.0 17.3 20.0 j r Z y . o
60 - 69 13.2 6.0 13.1 9 1
70 - 79 4.1 4.8 9.1 3.6 8 0 - 89 6.5 4.8 6.1 5.5 90 - 99 1.7 4.0 5.5
100 - 109 1.8 1.3 2.0 1.8 > 7 n 110 - 119 0.2 — 1.0 —
/ / .U
120 - 129 1.9 — 2.0 1.8 130 - 139 0.5 2.4 1.0 —
140 - 149 0.3 — — —
150+ 2.1 — 8.1 N.S. 6.2 2.4 — 7.0
Survey DTCP UW UW UW UNZA Date 1972 1973 1973 1973 1971
Source; Volume l,page 2.50.

Lusaka Squatter Areas: Income
Additional Incomes
% of household heads receiving housing allowance
% of wives earning additional income
Average amount of wives' earning
% of households with members other than the head & his wife earning
% of households receiving income from letting rooms
Average amount received from letting rooms
Source: Volume 1, page 2.51.
Lusaka Low-Cost Housing Areas: Income Groups
Monthly Income Lusaka, All Low-cost Housing Lusaka, all Low-cost Housing Areas; (Kwacha) Areas 1973 Total number of Households
0- 9 12.1 6 788 10- 19 4.1 2 295 20- 29 4.1 2 296 30- 39 12.3 6 899 40- 49 16.1 9 088 50- 59 8.5 4 788 60- 69 10.5 5 889 70- 79 4.5 2 567 80- 89 6.0 3 383 90- 99 3.3 1 842
100- 109 2.7 1 521 110- 119 1.1 623 120- 129 2.3 1 313 130- 139 1.1 630 140- 149 1.1 604 150- 159 1.0 542 160+ 9.2 5 192
Total 100.0 56 250
Source: Volume l,page 2.8.
Chipata Chaisa Nguluwe
47.0% 46.5% 49.1%
2.4% 8.1% 7.2%
K 9.00 K 15.63 K 8.38
2.4% 28.3% 3.6%
1.2% 3.0% 3.6%
K 4.75 K 11.71 K 4.50

Table A4-III-4 Estimated Minimum Monthly Household Expenditure; 1970
Minimum monthly % of Total Expenditure Expenditure
Rent K 5 50 n 9.8 Light 45 0.8 Heat 2 00 4.4 Food 38 41 68.0 Transport 2 60 4.6 Clothes 5 00 8.9 Household equipment 2 00 3.5
K 56 46 100.0
Note: An estimate of the poverty datum line in Lusaka carried out in 1970 by the National Food and Nutrition Commission showed that the minimum monthly expenditure on food necessary to give a family of six a satisfactory diet using local foods was K 38.41. The total expenditure per month would have been K 56.46, not including money for entertainment or recreation. The Consumer Price Index has risen 31% since 1970 and so the equivalent amounts in 1973 might be K 43.40 and K 63.80.
Source: Volume 4, page 2.A1.8.
Table A4-III-5 Lusaka Squatter Areas: Type of House Occupancy
Self-built 56.9 Bought 23.6 Rented house 13.8 Rented room 4.6 Borrowed 1.2 Given —
Date 1967 Survey DCD
George George Nguluwe Nguluwe Chipata
68.4 40.8 77.6 56.4 63.9 17.5 32.1 9.0 25.5 19.3 7.0 9.2 13.4\ 10.9 10.8
13.8 - J 10.9
7.0 0.8 — 1.8 —
— 2.8 — 3.6 2.4
1967 1972 1967 1973 1973 LSS DTCP DCD UW UW
Source: Volume l,page 2.59.

Table A4-in-6 Lusaka Squatter Areas: Housing Characteristics
Cost of house % of Self-built & Bought Houses
George Chipata Chaisa Nguluwe
Less than K 39 11.7 32.9 15.4 37.8 K 40- 79 22.9 44.3 14.2 28.9 K 80-119 21.6 11.5 27.3 15.5 K 120- 199 20.3 4.2 16.8 8.8 K 200 - 299 11.3 — 13.1 4.4 K300 + 10.4 7.2 10.8 2.2
Average K 140.00 K 86.75 K 222.79 K 69.00
Survey DTCP UW UW UW
Source: Volume l,page 2.59.
Rented Dwellings
Rent paid George Chaisa
Less than K 4.00 4.0% 8.3% K 4.01 - 5.00 34.4% 16.6% K 5.01 - 6.00 31.1% 25.0% K 6.01 - 7.00 7.1% 83% K 7.01 - 8.00 7.1% —
K 8.01 - 9.00 1.3% —
K 9.01 - 10.00 7.1% 25.0% K 10.01 - 15.00 2.0% —
K 15+ 3.9% 16.8%
Average K 6.43 K 9.36
Survey DTCP UW
Source; Volume 1, page 2.60.
House Sizes
George House sizes
1968 1972
1 room 27% 24% 2 rooms 27% 31% 3 rooms 30% 22% 4 rooms 11% 14% 5 rooms 3% 4% 6 rooms + 2% 3%
Survey LSS DTCP
Source; Volume l,page 2.61.
Material of House Construction (Census) 1969
Settlement Total no. of Pole and Burnt Brick Kimberley Other dwellings Dagga Cone. Block brick
Kalingalinga 1 826 2.8 36.8 40.5 19.7% Old Kanyama 1 591 9.2 33.6 48.0 9.0% Mtengo 1 655 5.2 48.3 34.8 11.7% Quarries 5 667 4.7 16.7 74.8 3.4% George 4 234 2.7 18.1 78.8 0.2%

Table A4-IV-1 Lusaka Squatter Settlements: Demographic Information
Demographic Information George Chaisa Nguluwe Chipata Old Kanyama
Est. no. of houses 7 094 3 900 1 465 2 337 2 841 Est. no. of people per house 5.83 5.8 5.8 5.5 5.5 Est. population 41 358 22 620 8 497 12 855 15 625 Area 209 Ha 69 Ha 46 Ha 84.0 Ha 144 Ha Density 29.9 h/Ha 61.0 h/Ha 31.4 h/Ha 26.8 h/Ha 20.4 h/Ha Average household income K 40 -K 44 K 66.46 K 44.68 K 47.53 not known Average cost of house/rent K 140.00/K6.43 K 22.79/K 9.36 K 69.00/K 6.08 K 86.57/K 5.56 not known Land ownership freehold freehold mainly freehold, native reserve mainly State/part
part State land land freehold
Demographic Information Chawama (incl. Quarries Kalingalinga Kalikiliki Bauleni Nyerere)
Est. no. of houses 3 100 1 459 I 620 340 518 Est. no. of people per house 5.8 5.8 5.5 5.5 5.0 Est. population 17 980 8 462 8 910 1 870 2 590 Area 95 Ha 71.5 Ha 54.0 Ha 11.5 Ha 40.0 Ha Density 32.8 h/Ha 20.4 h/Ha 30.0 h/Ha 29.0 h/Ha 13.0 h/Ha Average household income not known not known not known K 45.33 not known Average cost of house/rent not known not known not known K41.66/K4.50 not known Land ownership mainly State State and free mainly State/ State land mainly State/part
land hold part leasehold freehold
Demographic Information Roma Chelston Chainda Chilanga
Est. no. of houses 261 280 660 510 Est. no. of people per house 5.0 5.0 5.0 5.5 Est. population 1 513 1 410 3 300 2 805 Area 17 Ha 12 Ha 32.50 Ha 25.0 Ha Density 15.3 h/Ha 23.5 h/Ha 20.3 h/Ha 20.4 h/Ha Average household income not known not known K 46.70 not known Average cost of house/rent not known not known K 37.35/K 5.00 not known Land ownership freehold freehold freehold part leasehold/
part freehold
Source: Lusaka Sites and Services Project. Request to the IBRD prepared for the Government of the Republic of Zambia by the National Housing Authority, July 1973; Volume 2.