Pass Microsoft 70-680 Exam with 100% Guarantee - Pass4itsure
Upload
khangminh22Category
view
1download
0
THE ROLE OF A CREDIT GUARANTEE IN ALLEVIATING CREDIT
CONSTRAINTS AMONG COFFEE FARMERS’ COOPERATIVES IN
ETHIOPIA
by
NEGUSSIE EFA GURMESSA
Submitted in accordance with the requirements
for the degree of
DOCTOR OF LITERATURE AND PHILOSOPHY
in
DEVELOPMENT STUDIES
at the
UNIVERSITY OF SOUTH AFRICA
SUPERVISOR: DR CATHERINE NDINDA
November 2016

ii
DECLARATION
I hereby declare that ‘The Role of Credit Guarantee in Alleviating Credit Constraints among
Coffee Farmers’ Cooperatives in Ethiopia’ is my own work and that all the sources that I have
used or quoted have been indicated and acknowledged by means of complete references.
____________________________ 4 November, 2016
(Negussie Efa Gurmessa)

iii
ACKNOWLEDGEMENTS
Throughout this study, I received various support from many individuals and organisations. I am
thankful to all. Firstly, I would like to express my sincere gratitude to my supervisor, Dr
Catherine Ndinda, for her extraordinary commitment and patience in reviewing my work, in
identifying relevant materials, in providing critical comments and guidance. Her understanding,
encouragement and support were immensely useful in making this study possible. I also received
tremendous moral support and encouragement from my colleagues in CABI. I am very grateful
to all of them. In particular, I wish to extend special thanks to Mr Morris Akiri and Dr Charles
Agwanda who encouraged me to undertake my study on a CABI-led Credit Guarantee Scheme.
This study was made possible through a financial support provided by my employer (CAB
International) and the financers of the project - Common Fund for Commodities and Rabo Bank.
I am also grateful to the different individuals and organisations who participated in the study in
various ways. In particular, I owe special thanks to the credit managers of the selected banks and
Directors of MFIs, primary cooperatives and their management, coffee and cooperative experts
at various levels for their cooperation, time and contribution in providing necessary information.
I am particularly thankful to zone and district coffee and cooperative experts who participated in
data collection for their devotion and patience during the field data collection. Director of Coffee
and Tea Development of MoANR, Mr Fikru Amenu and his team deserve special gratitude for
their moral and logistic supports during the study. Furthermore, I would like to express my
sincere appreciation and thanks to Dr Hailemariam H/wold for his useful guidance on
econometric modelling of the quantitative data analysis. Special gratitude also goes to my
friends, Getachew, Kindie (Dr) and Shiferaw, for their encouragement and moral support.
Finally, my special thanks go to my wife, Meskerem, for her understanding and moral support
throughout this study. And of course, I owe my children special gratitude and love. The study
obviously compromised my care and attention towards them. As a responsible father, I hope that
I demonstrated to them the value of hard work, commitment, determination and endurance. It
was not that easy juggling family life, full-time job and a PhD study.

iv
ABSTRACT
This study explored the role and effectiveness of a credit guarantee scheme targeting coffee
farmers’ cooperatives in Ethiopia. The study, among other things, aims at exploring how
provision of a credit guarantee influences supply of institutional credit to coffee farmers’
cooperatives as well as examines cooperatives guaranteed loan utilisation, the resultant
changes/impacts and intervening factors. Credit guarantee schemes largely trace their roots in the
liberal and neoliberal economic and social contexts. One of the key issues the current study tried
to address is examining how a credit guarantee scheme operates in a partially liberal capitalist
context where there is pervasive state intervention in the key sectors of the economy, including
financial and coffee sectors. The study was conducted in eight zones of the two major coffee
producing regions of Ethiopia – Oromia and Southern Nations, Nationalities and Peoples’
regions. A mixed method with structured questionnaires (at two stages), key informant
interviews, focus group discussions and extensive observation were used to collect data from
primary cooperatives, financial institutions, coffee extension and cooperative experts. Qualitative
analytical methods, descriptive statistics and econometric model were used in analysing the data.
The study reveals that most primary cooperatives have weak institutional, business and financial
capacities, and limited access to institutional services including credit. The findings show that
cooperatives generally have limited role in the coffee production end, but they play an important
role in its marketing. The study suggests that coffee or multipurpose cooperatives are not ideally
suitable to serve as intermediaries for bank loans. The study reveals that the vast majority of the
study cooperatives have potential demand for loans, but revealed low actual demand. Different
sets of internal (demand side) and external factors influence cooperatives’ potential and actual
demand for loan in different ways. The assessment of the guarantee scheme under analysis
shows that though most of its design and operational features are in line with international
practices, there are some obvious limitations. Low risk coverage level, limitation in the total
volume of the guarantee fund, lack of capital enhancement mechanism for the lending banks,
short life span of the scheme, lack of flexibility and adaptation and reliance on a single lending
bank are among the notable limitations. In terms of utilisation of the guarantee fund and outreach
of the lending activity, the scheme attained limited achievements with a low leverage ratio.

v
However, substantial financial additionality was attained among the borrower cooperatives, but
the intervention had little impacts in improving the terms and conditions of loans. The positive
effects on the economic/business activities of beneficiary cooperatives include acquisition of
processing facilities, increase in member size, increased volume of coffee processed and dry
cherry traded and improvement in the income generated from such business activities. However,
the scheme had limited effects on cooperatives’ human resources and type of management. A
number of internal and external factors appear to influence effectiveness of a credit guarantee
targeting farmers’ cooperatives.
Several recommendations were made. First, there is a need to integrate attractive features into the
scheme that can be periodically revised and adapted. These may include raising the risk coverage
level especially at the initial stage, including liquidity boosting mechanism, lowering guarantee
fee level, devising longer-term arrangement, integrating strong capacity building and technical
support and other incentive packages. Second, the lending banks need to develop suitable loan
products, revisit and improve their lending terms, requirements and approaches. Third, if they are
to effectively demand for and make proper use of such guaranteed loans, cooperatives need to be
supported so as to enhance their organisational, business and technical capacities. Fourth, there is
a need for the government to further strengthen provision of a more supportive and enabling
legal and institutional environments and relax some of the regulatory frameworks so as to
facilitate the lending-borrowing activities.

vi
LIST OF ABBREVIATIONS ADLI Agriculture Development-led industrialisation AIDB Agriculture and Industrial Development Bank
AMC Agricultural Marketing Corporation
ATA Agriculture Transformation Agency
CBE Commercial Bank of Ethiopia
CBO Cooperative Bank of Oromia CFC Common Fund for Commodities CGS Credit guarantee scheme CSA Central Statistical Agency DBE Development Bank of Ethiopia
DFID Department for International Development ECX Ethiopian Commodity Exchange
EPRDF Ethiopian Peoples’ Revolutionary Democratic Front FCA Federal Cooperative Agency FGD Focus Group Discussion GDP Gross Domestic Product
HDI Human Development Index
HDR Human Development Report
ICA International Cooperative Alliance
ICO International Coffee Organisation IIRR International Institute of Rural Reconstruction
ILO International Labour Organisation
ITC International Trade Centre KII Key Informant Interview
LGS Loan Guarantee Scheme
MFI Microfinance Institution
MoA Ministry of Agriculture (Ethiopia)
MoFED Ministry of Finance and Economic Development
NBE National Bank of Ethiopia
NGOs Non-governmental Organisations
OBoFED Oromia Bureau of Finance and Economic Development
OCFCU Oromia Coffee Farmers’ Cooperative Union
OECD Organisation for Economic Cooperation and Development
PASDEP The Plan for Accelerated and Sustained Development to End Poverty
PEA Project Executing Agency
PIA Project Implementing Agency
RUSACCO Rural Saving and Credit Cooperative
SACCO Saving and Credit Cooperative
SAP Structural Adjustment Programme
SBA Small Business Administration
SME Small and Micro Enterprises
SNNPR Southern Nations and Nationalities People’s Region
TIN Tax (payers) Identification Number
UNDP United Nations Development Programme
USAID United States Agency for International Development
vii
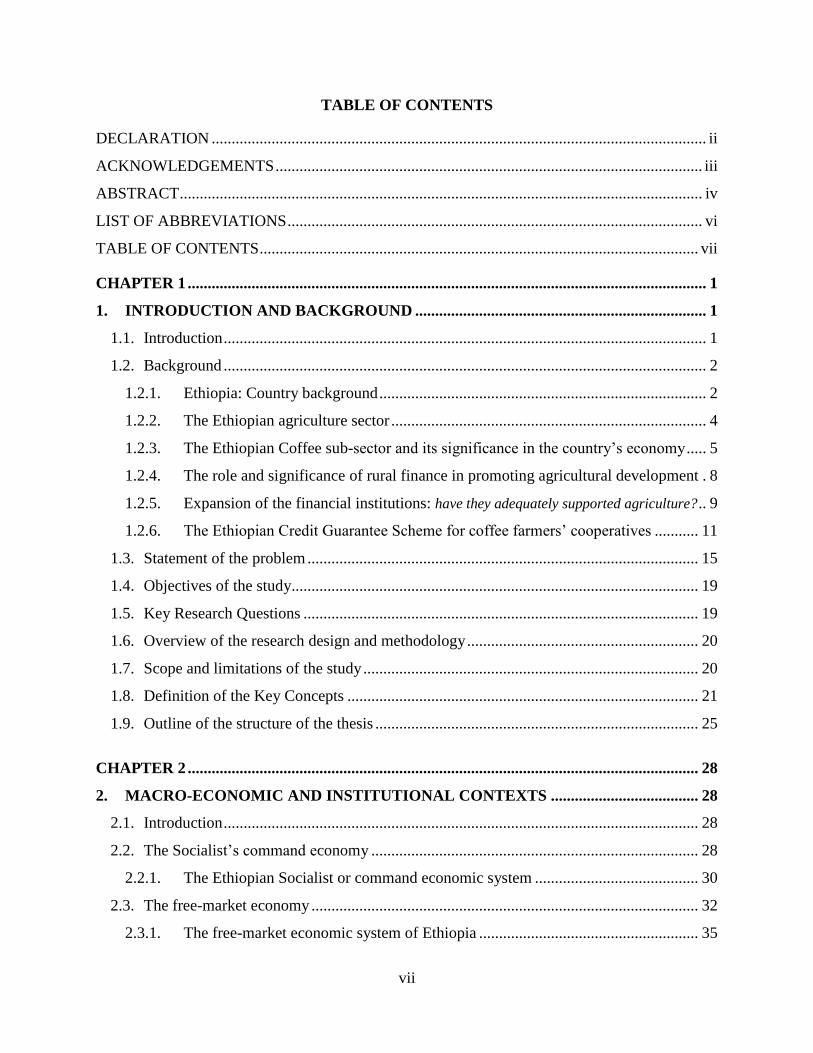
TABLE OF CONTENTS
DECLARATION ............................................................................................................................ ii
ACKNOWLEDGEMENTS ........................................................................................................... iii
ABSTRACT ................................................................................................................................... iv
LIST OF ABBREVIATIONS ........................................................................................................ vi
TABLE OF CONTENTS .............................................................................................................. vii
CHAPTER 1 .................................................................................................................................. 1
1. INTRODUCTION AND BACKGROUND ......................................................................... 1
1.1. Introduction ......................................................................................................................... 1
1.2. Background ......................................................................................................................... 2
1.2.1. Ethiopia: Country background .................................................................................. 2
1.2.2. The Ethiopian agriculture sector ............................................................................... 4
1.2.3. The Ethiopian Coffee sub-sector and its significance in the country’s economy ..... 5
1.2.4. The role and significance of rural finance in promoting agricultural development . 8
1.2.5. Expansion of the financial institutions: have they adequately supported agriculture? .. 9
1.2.6. The Ethiopian Credit Guarantee Scheme for coffee farmers’ cooperatives ........... 11
1.3. Statement of the problem .................................................................................................. 15
1.4. Objectives of the study...................................................................................................... 19
1.5. Key Research Questions ................................................................................................... 19
1.6. Overview of the research design and methodology .......................................................... 20
1.7. Scope and limitations of the study .................................................................................... 20
1.8. Definition of the Key Concepts ........................................................................................ 21
1.9. Outline of the structure of the thesis ................................................................................. 25
CHAPTER 2 ................................................................................................................................ 28
2. MACRO-ECONOMIC AND INSTITUTIONAL CONTEXTS ..................................... 28
2.1. Introduction ....................................................................................................................... 28
2.2. The Socialist’s command economy .................................................................................. 28
2.2.1. The Ethiopian Socialist or command economic system ......................................... 30
2.3. The free-market economy ................................................................................................. 32
2.3.1. The free-market economic system of Ethiopia ....................................................... 35

viii
2.3.2. Credit Guarantee Schemes under the Ethiopian context ............................................. 49
2.4. Farmers’ Cooperatives: An indispensable rural institution .............................................. 52
2.4.1. Overview of concepts, evolution and significance of farmer cooperatives ............ 52
2.4.2. Cooperatives’ role in catalysing agricultural development .................................... 54
2.4.3. Cooperatives movement in Africa: Evolution, features and prospects .................. 55
2.4.4. Cooperatives movement in Ethiopia: Evolution and current state ......................... 58
2.4.5. Coffee cooperatives and their role in coffee marketing .......................................... 67
2.4.6. Role of cooperatives in rural finance ...................................................................... 69
CHAPTER 3 ................................................................................................................................ 72
3. INTERVENING IN RURAL FINANCE ........................................................................... 72
3.1. Introduction ....................................................................................................................... 72
3.2. Rural Finance .................................................................................................................... 72
3.2.1. Role and impacts of access to rural finance ................................................................ 72
3.2.2. Rural financial markets and the rural poor: challenges and constraints ..................... 74
3.2.3. Credit demand by smallholder farmers ....................................................................... 75
3.2.4. Factors influencing demand for credit ......................................................................... 79
3.2.5 Estimating loan demand and its determinants: Conceptual & analytical framework .. 85
3.2.6 Analytical approaches employed in examining determinants of loan demand under
the current study ...................................................................................................... 88
3.3. Intervening Through a Loan Guarantee ............................................................................ 96
3.3.1. What is a loan guarantee and why it is chosen?...................................................... 96
3.3.2. Typology, design and modes of operation of Loan Guarantee Schemes ................ 98
3.3.3. Additionality and loan fund leverage .................................................................... 102
3.3.4. What do critics say about loan guarantees? .......................................................... 104
3.3.5. What do empirical studies say about the role and impacts of LGSs? ................... 106
3.3.6. Factors influencing effectiveness and success of a credit guarantee scheme ....... 107
3.3.7. Analytical Approach in Evaluating Loan Guarantee Schemes ................................. 111
CHAPTER 4 .............................................................................................................................. 122
4. DESIGN AND METHODOLOGY OF THE STUDY.................................................... 122
4.1. Introduction ..................................................................................................................... 122

ix
4.2. Description of the study areas ......................................................................................... 122
4.3. Sampling Design, Data Collection and Analysis ............................................................ 127
4.3.1. Research method and approaches employed by the current study ....................... 127
4.3.2. Sampling procedure .............................................................................................. 129
4.3.3. Data collection ...................................................................................................... 131
4.3.4. Data analysis procedure ........................................................................................ 136
4.4. Ethical measures ............................................................................................................. 142
CHAPTER 5 .............................................................................................................................. 145
5. EMPIRICAL FINDINGS ON THE ETHIOPIAN COFFEE AND COOPERATIVE
SECTORS .................................................................................................................................. 145
5.1. Introduction ..................................................................................................................... 145
5.2. The Ethiopian coffee sector ............................................................................................ 145
5.3. Are coffee/multipurpose coops suitable to act as intermediaries for bank loans? .......... 164
5.4. Challenges and constraints of coffee or multipurpose cooperatives ............................... 165
5.5. Credit for agriculture, coffee and cooperatives ............................................................... 167
5.6. Cooperatives’ institutional, socio-economic and business characteristics ..................... 177
5.7. Cooperatives’ demand for institutional credit and its determinants ............................... 187
CHAPTER 6 .............................................................................................................................. 200
6. EMPIRICAL FINDINGS ON THE PERFORMANCE AND PRELIMINARY IMPACT
OF THE CREDIT GUARANTEE SCHEME ........................................................................ 200
6.1. Introduction ..................................................................................................................... 200
6.2. Views about the role and benefits of the Ethiopian coffee credit guarantee scheme ..... 200
6.3. Scheme design and operation.......................................................................................... 201
6.4. Utilisation of the loan guarantee and coverage of the scheme ........................................ 206
6.5. Loan fund leverage ratio ................................................................................................. 210
6.6. Assessment of Additionalities attained under the current scheme.................................. 210
6.7. Improvements in the institutional capacity of beneficiary cooperatives ........................ 226
6.8. Impacts on lenders’ and borrowers’ behavior: Incidence of moral hazard .................... 235
6.9. Factors affecting effectiveness of a CGS for farmer cooperatives ................................. 237

x
CHAPTER 7 .............................................................................................................................. 242
7. DISCUSSIONS OF THE KEY FINDINGS .................................................................... 242
7.1. Introduction ..................................................................................................................... 242
7.2. The role of cooperatives in coffee processing, marketing and as intermediaries for
channeling bank credit to smallholder farmers ............................................................... 242
7.2.1 Significance of the coffee sector ........................................................................... 242
7.2.2 Coffee Production, Processing and Marketing: The role of cooperatives ............ 243
7.2.3. Cooperatives’ operations and services in relation to coffee business ....................... 250
7.2.4. Suitability of cooperatives as intermediaries for bank loans………………………252
7.3. Credit for agriculture and coffee ................................................................................... 2544
7.3.1. Are agriculture and coffee priority areas for bank lending? ............................... 2544
7.4. Cooperatives’ demand for institutional credit and factors influencing demand ............. 257
7.4.1. Institutional, business and socio-economic features of cooperatives .................. 258
7.4.2. Cooperatives’ demand for institutional credit and its determinants ..................... 265
7.5. Influence of a credit guarantee on institutional credit supply to farmers’ coops ............ 274
7.5.1. Role and contribution of a credit guarantee in stimulating bank lending ............. 274
7.5.2. Scheme design and operation: Is it attractive enough to the lending banks? .. ….275
7.5.3. Utilisation of the loan guarantee and outreach of the scheme .............................. 277
7.5.4. Loan fund leverage ratio ....................................................................................... 280
7.5.5. Salient design and operational features and drawbacks of the scheme ................ 281
7.5.6. What can be proposed for future guarantee schemes? .......................................... 284
7.6. Additionalities obtained under the current guarantee scheme ........................................ 287
7.6.1. What does the financial additionality attained tell us? .............................................. 287
7.6.3. What are the economic additionalities attained under the current scheme? .............. 291
7.6.4. Improvements in the institutional capacity of beneficiary cooperatives ................... 294
7.7. Effect of the credit guarantee scheme on lenders’ and borrowers’ behavior. ................. 298
7.8. What are the factors that affect effectiveness and performance of a CGS targeting
farmers’ cooperatives in the Ethiopian context? ............................................................. 300
CHAPTER 8 .............................................................................................................................. 302
8. CONCLUSIONS AND RECOMMENDATIONS .......................................................... 302
8.1. Introdcution ........................................................................ Error! Bookmark not defined.

xi
8.2. In relation to scheme design features and implementation strategies ............................. 302
8.3. As related to the participating (lending) bank................................................................. 307
8.4. As related to the borrower cooperatives ......................................................................... 309
8.5. In relation to national policy, regulatory framework and institutional supports ............. 312
8.6. Recommendations on areas for Further Research .......................................................... 314
REFERENCES: ........................................................................................................................ 315
APPENDICES ........................................................................................................................... 332
APPENDIX 1. Information sheet and consent forms .......................................................... 332
APPEDIX 2. Key informant interviews, focus group discussion and observation guides .. 339
APPEDIX 3. Questionnaires ............................................................................................... 345
LIST OF TABLES
Table 3.1: Factors contributing to success and failure of a credit guarantee programme .......... 109
Table 4.1: Some features of the study zones .............................................................................. 124
Table 4.2: Some features of the selected study districts ............................................................. 125
Table 4.3. Samples of stakeholders included in the study .......................................................... 131
Table 4.4: Aspects of additionality and associated benefits that were analysed ........................ 139
Table 4:5: Description of explanatory variables used in the study ……………………………142
Table 5.1: Percent of cooperatives and volume of coffee processed over years ....................... 148
Table 5.2: Number of coffee processing facilities available in the study zones and districts .... 150
Table 5.3: Relationship between regional location and preferred processing method .............. 152
Table 5.4: Coffee processing facilities cooperatives need most ................................................ 152
Table 5.5: Status of primary market centres in the study zones and districts as of 2014/15 ...... 153
Table 5.6: Where were cooperatives selling their coffee over years? ........................................ 155
Table 5.7: Time cooperatives sold their coffee over the three years (2010 – 2012) ................... 157
Table 5.8: Major challenges and problems of the coffee sector in the views of stakeholders .... 159
Table 5.9: Major problems facing the coffee sector across some of the study areas ................. 160
Table 5.10: Challenges and constraints of cooperatives as outlined by different stakeholders .. 166

xii
Table 5.11: Sectoral distribution of loans & advances of some private banks (2011/2012) ...... 169
Table 5.12: Summary of cooperatives’ loan access .................................................................... 172
Table 5.13: Relationship between regional location and loan access ......................................... 172
Table 5.14: Purpose for which previous loan was used .............................................................. 174
Table 5.15: Regional locations of the primary cooperatives included in the (baseline) study ... 177
Table 5.16: Relationship between regional location and cooperatives’ member size ............... 178
Table 5.17: Summary of some demographic characteristics of the study cooperatives ............. 179
Table 5.18: Relationship between regional location and type of cooperatives .......................... 180
Table 5.19: Relationship between cooperatives’ regional location and having manager .......... 181
Table 5.20: Summary of cooperatives’ human resources as of September 2012 ....................... 181
Table 5.21: Cooperatives’ capital ownership ............................................................................. 182
Table 5.22: Relationship between regional location and amount of total capital ...................... 183
Table 5.23: Income generated through coffee business in Birr .................................................. 184
Table 5.24: Relationship between regional location and distance to nearest bank .................... 184
Table 5.25: Relationship between regional location and union membership ............................ 186
Table 5.26: Summary of cooperatives’ previous applications for bank loans ............................ 190
Table 5.27: Relationship between regional location and decision to apply for bank loan ........ 190
Table 5.28: Relationship between regional location & amount of bank loan applied for…….191
Table 5.29: Purpose for which loan is needed ........................................................................... 191
Table 5.30: Preferred time of loan repayment ............................................................................ 192
Table 5.31: Heckman two-step selection model for amount of loan demanded and decision to
borrow (A) .................................................................................................................................. 195
Table 5.32: Heckman two-step selection model for amount of loan demanded and decision to
borrow (B) ................................................................................................................................... 197
Table 6.1: Strong/effective design and operational features and shortcomings of the Ethiopian
coffee guarantee scheme ............................................................................................................. 204
Table 6.2: Changes in decision to apply for bank loans ............................................................ 208
Table 6.3: Difference between scheme participant and non-participants in accessing loan ....... 211
Table 6.4: Difference in accessing loans before and after participating in the scheme .............. 212
Table 6.5: Difference between participants and non-participants in the amount of loan taken.. 212

xiii
Table 6.6: Difference between amount of loan obtained by scheme participants before and after
participating in the scheme ........................................................................................................ 213
Table 6.7: Changes in length of loan processing time after participating in the scheme ........... 216
Table 6.8: Difference between participants and non-participants in terms of length of loan
processing time .......................................................................................................................... 217
Table 6.9: Difference between scheme participant and non-participant cooperatives in terms of
type of coffee traded ................................................................................................................... 219
Table 6.10: Relationship between participation in the scheme and volume of coffee bought –
before and after participating in the scheme .............................................................................. 219
Table 6.11: Difference between participants and non-participants in volume of coffee bought by
coops in 2013 and 2014 (in kg)................................................................................................... 220
Table 6.12: Difference between participants and non-participants in the amount of coffee
processed between 2012 to 2014 ............................................................................................... 220
Table 6.13: Relationship between participation in the scheme and sun-drying methods used ... 222
Table 6.14: Difference between participants and non-participants in length of coffee storage 223
Table 6.15: Difference between participants and non-participants in the income obtained from
coffee (2012 – 2014) .................................................................................................................. 224
Table 6.16: Difference between participants and non-participants in the profit obtained from
coffee trade in 2013 and 2014 ..................................................................................................... 225
Table 6.17: Difference between participants and non-participants in the amount of profit
obtained from coffee trade in 2013 and 2014 ............................................................................ 225
Table 6.18: Difference between member size of participants and non-participants (2015) . ..... 227
Table 6.19: Relationship between participation in the scheme and member size of coops – before
and after participating in the scheme ......................................................................................... 227
Table 6.20: Relationship between participation in the scheme and number of permanent workers
– before and after participating in the scheme ........................................................................... 228
Table 6.21: Difference between participants and non-participants in number of employees .... 228
Table 6.22: Difference between participants and non-participants in having accountant ......... 229
Table 6.23: Relationship between participation in the scheme and having an accountant – before
and after the scheme ................................................................................................................... 230

xiv
Table 6.24: Difference between participants and non-participants in their members’ willingness
to deliver coffee without payment on spot .................................................................................. 231
Table 6.25: Changes in terms of farmers’ willingness to deliver coffee without payment on spot –
before and after the scheme ........................................................................................................ 231
Table 6.26: Difference between participants and non-participants in the value of fixed assets.. 234
Table 6.27: Constraints and challenges to the success of CGSs ................................................ 238
Table 6.28: Factors that could enhance the effectiveness of a credit guarantee scheme: ........... 240
Table 7.1: Proposed adaptations and additions to the structure, design and operational features of
a guarantee scheme targeting farmer cooperatives in Ethiopia. ................................................. 284
LIST OF FIGURES
Figure 3.1: Framework for assessing the features and performance of guarantee schemes ....... 120
Figure 3.2: Simplified logical framework for assessing credit guarantee performance ............. 120
Figure 4.1. Production share of coffee producing regions of Ethiopia ....................................... 126
Figure 4.2: Distribution of coffee growing areas and study zones by production level ............. 126
Figure 5.1: How cooperatives undertake sun-drying of coffee? ................................................. 149
Figure 5.2: How cooperatives trade majority of their coffee?………………………………….156
Figure 5.3: Source of loans taken over years .............................................................................. 173
Figure 5.4: Educational level of cooperatives chairperson/manager………………………….179
Figure 5.5: Distance (of cooperatives) from service providers ................................................... 185
Figure 6.1: Difference between scheme participants and non-participants in applying for loan 207
Figure 6.2: Mean length of loans obtained by participants and non-participants ....................... 215
Figure 6.3: Comparison of mean amount of coffee processed by coops before & after and with
and without the scheme (Kg) ...................................................................................................... 221

1
CHAPTER 1
1. INTRODUCTION AND BACKGROUND
1.1. Introduction
Access to affordable and appropriate financial services on a timely manner is a critical factor for
all development efforts in general and for the agricultural sector in particular. However,
smallholder farmers’ access to institutional credit has been restricted by a number of constraints
related both to the supply and demand sides, and other external factors such as policy and
regulatory frameworks. In particular, risks associated with agricultural production and rural-
based smallholders, costs of small-scale lending and lack of viable collateral are frequently
mentioned as the major constraints. Credit guarantee schemes have been designed and widely
used to address the problems associated with loan security and to encourage financial institutions
to lend to those who are traditionally considered credit risky groups. Such credit guarantees
largely trace their origin in the liberalism and neoliberalism economic systems of European and
North American countries. Such economic policies seek to promote deregulation, privatisation,
free market and trade. Under such economic systems it is believed that market enables efficient
and effect allocations of productive resources and thus state is expected to abstain from
intervening in the economy and market. As Harvey (2005) notes the role of the state is to create
and preserve an institutional framework appropriate to such practices.
In recent decades, credit guarantee programmes have become popular across the globe and have
been taken up by countries with different policy environments and economic systems. Ethiopia is
one of such countries, which have been trying to use this tool under different political, social and
economic contexts. The Ethiopian government has not been convinced of the relevance and
effectiveness of neoliberalism in realising the kind of development the country seeks to attain.
The government rather pursues what is known as a “developmental state” economic thinking that
is characterised by strong state intervention in the economy and extensive regulation. Such
variations in the political and economic environments would inevitably have profound effects on
the performance and effectiveness of credit guarantee programmes. Taking a credit guarantee

2
scheme for coffee farmers’ cooperatives in Ethiopia, this research explored the role,
effectiveness and impacts of a credit guarantee programme. The study has analysed demand for,
access to, supply and utilisation of bank credit and resultant changes in relation to the availed
credit guarantee, and factors influencing its performance and successes.
This chapter presents introduction and background to establish the context of the study. The
following section begins by providing background information about Ethiopia. This will be
followed by sections on the significance of the Ethiopian agriculture and the coffee sub-sector,
significance and expansion of rural finance, and the design and operational features of the
Ethiopian credit guarantee scheme for coffee farmers’ cooperatives. Finally, statement of the
research problem, research questions, objectives of the study, overview of the research design
and methodology, limitations and scope of the study, definitions of the key concepts used in the
study, structure of the thesis and chapter contents are outlined.
1.2 Background
1.2.1. Ethiopia: Country Background
Located in the Horn of Africa, Ethiopia is one of the largest countries in Africa and the second
most populous nation in the continent. According to the CSA population projection for 2014, the
total population of Ethiopia is about 88 million, while the total area of the country is 1.14 million
sq. km (HDR, 2013). In total, about 81 percent of the population resides in rural areas (CSA,
2013), largely depending on agriculture for their livelihood. The rapidly growing population has
been posing serious challenges to the government as food production and the growth of other
agricultural products could not keep pace with the high population growth rate. Despite the
recent rapid economic growth, Ethiopia is still one of the poorest countries in the world.
According to the Human Development Report (2013), Ethiopia’s Human Development Index
(HDI) for the year 2012 was 0.396, positioning the country at 173 out of the 187 countries and
territories. This is well below the average of 0.466 for countries in the low human development
group and the average of 0.475 for countries in sub-Saharan Africa. Moreover, Gross National
Income per capita for Ethiopia is US$1,017 as compared with US$2,010 for sub-Saharan Africa.
Recent studies indicate that national poverty has shown significant decline. The country’s 1.25

3
USD per day poverty rate has fallen from 71.3% in 1990 to 30.40% in 2009, while the poverty
head count ratio at national poverty line for the same period has declined from 45.50% to
29.60% (Chanyalew, 2015). UNDP’s HDR (2013) indicates that Ethiopia along with some
African countries such as Rwanda and Uganda continued to grow at a faster rate. Other evidence
also shows that Ethiopia has recorded a high annual growth since 2004 and the country has
become one of the fastest growing economies in Africa.
The economy of Ethiopia is largely based on agriculture, which contributes close to 50 percent of
the Gross Domestic Product (GDP), up to 90 percent of the export earnings, as well as provides
livelihoods to about 83% of the population of Ethiopia (Davis et al., 2010). In fact the share of
agriculture from GDP has declined from 53% to 42% between 1995/6 and 2010 (Chanyalew,
2015). This is mainly due to a shifting trend to services and industry, which have gained
significant importance in recent years. Consequently, the share of the service sector has grown
from 34.60% to 46% during the same period (Ibid). Despite the low productivity of the
agriculture sector and widespread poverty among the farming community, Ethiopia is endowed
with immense natural resources and paramount potential for agricultural production. The country
is also known for its massive agro-ecological, ethic, social and cultural diversity.
According to Davis et al. (2010), out of the total 111.2 million hectares of total land area of
Ethiopia, 74 million hectare is arable while currently only 13 million hectares is being used for
agricultural activities. Recent records show that there are about 13.5 million smallholder farmers
with an average landholding of 0.93 hectare (Chanyalew, 2015). According to the CSA (2014)
sample survey of the main (Meher) season of private peasant holdings, about 12, 407, 473;
209,880; 161,488 and 71,507 hectares of land are covered by grain crops (out of which 79.38%
is cereals), root crops, vegetables and fruit crops, respectively. In addition, 538,467 ha; 222, 079
ha; 24,727 ha and 29,104 ha, respectively, are covered by coffee, Khat, hops and sugar cane
(CSA, 2014). Moreover, the country’s livestock resources are among the top in the world, at
least in terms of number. Ethiopia also possesses high level of biodiversity of great significance
to the world. Among others, the country has provided coffee Arabica and teff genetic resources
to the rest of the world. Though the country is paradoxically hit hard by recurrent droughts,
Ethiopia is renowned for its abundant water resources. These, among others, include Lake Tana

4
(the source of Blue Nile), and other major rivers that even flow beyond the boundary of the
country. Ethiopia has 12 major river basins, 12 large lakes, 122 billion m3 of annual surface run
off and an estimated 2.6 billion m3 of usable ground water (Chanyalew, 2015). But these water
resources are yet to be developed and effectively utilised for agriculture and other purposes.
Ethiopia has developed only about 5% of its irrigation potential area, which is estimated to be 3.7
million ha (Chanyalew, 2015). Particularly the dwindling natural resources and climate change,
coupled with the rapidly growing population, have posed enormous challenges to the
government in its effort to accelerate sustainable growth in the agriculture sector and in the
overall development endeavors of the nation.
1.2.2. The Ethiopian agriculture sector
As discussed in the above section, agriculture constitutes a vital part of the Ethiopian economy.
In addition to providing food for the rapidly growing population, the sector plays a vital role in
generating raw material inputs and financial resources for the manufacturing sector. However,
despite the encouraging achievements recorded in recent years, the growth and development of
the agricultural sector has not reached a satisfactory state. Low agricultural productivity is
apparently one of the main contributory factors to Ethiopia’s large food deficit (Croppenstedt et
al, 2003). The agricultural sector in Ethiopia is largely characterised by small-scale, scattered
and subsistence-oriented production system, with limited access to and use of improved farm
inputs and technologies, credit and other support services, and weak market integration.
Moreover, agricultural activities are predominantly rain-fed which has been posing a daunting
challenge to the country in the face of climate change. Various records (e.g. MEDAC, 1999)
show that Smallholder farmers operate about 95 percent of the cultivated land and produce more
than 90 percent of the agricultural products.
In view of its vital role in influencing the performance of the other sectors and overall
development of the economy, agriculture has taken a centre stage in the development agendas of
Ethiopia. Government’s past and current plans and development programmes rendered unique
attention to the agriculture sector, as an engine for economic growth and poverty reduction. Like
their predecessors, the just ended five-year Growth and Transformation Plan, and the new five
year plan have set huge targets for the sector. At a time when many governments in Africa were

5
curtailing support for the agricultural sector, the Government of Ethiopia instituted a policy of
Agricultural Development-Led Industrialisation (ADLI) (Davis et al., 2010). The principal
objective of the Ethiopian development plan is transformation of the subsistence agriculture to
market-oriented production, and effectively linking forward and backward with the industry.
This process inevitably demands, among other things, financial and technological resources. For
instance, in India the Green Revolution of the 1960s and 1970s called for adequate supply of
credit to acquire farm inputs such as fertilizer, improved seeds, irrigation pump, and the likes
(Mohan, 2004). Nevertheless, like in many other developing countries, small-scale farmers in
Ethiopia experience shortage of saving capital and sufficient financial resources to invest in
critical farm inputs and modern technologies that would boost their productivity and income.
Despite its immense potential and critical role in the economy, the Ethiopian agriculture sector
has not enjoyed the support and attention of financial institutions. In general, lack of effective
extension services and lack of agricultural credit have been frequently mentioned among the
major factors hindering the productivity of the Ethiopian agriculture (Anbes and Gowda, 2008).
In a country like Ethiopia where agriculture plays a dominant role in the economy and engage
the vast majority of the population, there is a critical need to provide adequate credit facilities for
smooth and sustainable operation, growth of the sector and improvements in farmers’ living
conditions (Admasu and Paul, 2010; Admassie, 2004). Undoubtedly, absence of effective and
appropriate financial resources could undermine the efforts to modernise and advance the
agriculture sector. Thus accessible, affordable, adequate and sustainable financial services are
required to support the transformation process of the Ethiopian agriculture from its bare
subsistence level to commercial and market-oriented farming. The effects of the policies and
reform programmes of the different governments on the agriculture and related sectors under the
different regimes of Ethiopia are discussed in chapter two.
1.2.3. The Ethiopian Coffee Sub-sector and its significance in the country’s economy
Coffee is one of the prominent agricultural commodities with considerable social, economic and
environmental significance for Ethiopia. The country is one of the pioneer coffee producers,
consumers and exporters in the world. Ethiopia is the first and sixth largest coffee producer in
Africa and in the world, respectively (ICO, 2005). During the year 2012, Ethiopia exported 3.2

6
million bags of coffee, making the country the largest African coffee exporter and the tenth
largest ex-porter in the world (ICO, 2013). The fact that about half of Ethiopia’s coffee is
consumed locally inevitably has had adverse effects on the volume of exportable coffee.
However, now-a-days such tradition is increasingly taken as a positive culture and great
opportunity to sustain the coffee industry, especially during global coffee market falls. Being the
origin of coffee Arabica, the country possesses massive diversity in terms of coffee genetic
resources. Despite the rapid growth revealed in other exportable commodities, coffee has
continued to be the leading commodity in terms of export earnings, currently accounting for over
a quarter of the value of all exports. In fact the value share of coffee has declined from more than
65% in the1990s to about 26.50% in 2012 (Chanyalew, 2015). Coffee also provides livelihood to
a quarter of the population. According to the CSA report (2014), about 538,467 hectares of
coffee is produced by about 4.50 million smallholder farmers, with annual production of 3.92
million quintals. In terms of proportion of area coverage, at national level coffee covers 3.84% of
the area under all crops (Ibid).
Evidence suggests that the smallholder sector is responsible for about 95% of the coffee
produced in Ethiopia. The rest is produced by large private and state farms1. Esayas (2010)
indicated that some 12 years ago, there were only three large state farms under the Coffee
Plantations Development Enterprise, namely: Bebeka, Limu and Tepi with coffee plantation area
of 6,537 ha, 8,026 ha and 6,442 ha, respectively. As of 2010, the coffee plantation area under the
enterprise was 20,144 hectares. However, these parastatals have been sold out to private
investors over the past years (between 2012 and 2014). Bebeka and Teppi Coffee Plantations
were privatised in 2011/12 and 2012/13, respectively. Limu Coffee Plantation was the last to be
privatised in 2014. Currently, there are no more state coffee plantations in Ethiopia (Minten et al,
2014). On the other hand, earlier reports show that within about a decade, over 135 private
investors have entered into developing modern coffee plantations on over 32,000 hectares of land
(Esayas, 2010). Some sources indicate that large scale commercial farmers at present operate on
up to 50,000 hectares of coffee land. However, the contribution of large-scale farms to the total
coffee production of the country is still meager as compared with the share of the smallholders.
1The share of state farms has diminished in recent years due to privatisation activities and the last farm was
privatised in 2014.

7
Coffee activities across all levels of the value chain demand substantial financial resources.
Smallholder farmers, who are responsible for the production of the bulk of Ethiopia’s coffee,
experience lack of adequate financial services to acquire necessary inputs and modern
technologies. This has had serious implications for their productivity and market integration. Due
to lack of collateral of required value and quality, and because of the nature of their
activity/business and locations, most smallholder coffee producers of Ethiopia face formidable
challenges in accessing formal credit markets. In general, credit services for the coffee sector are
generally scarce in Ethiopia, particularly for the production end. A study by ITC (2011) reports
that the coffee sector development in the East African region has been jeopardised by lack of
credit facility. The same study notes that lack of finance is one of the obstacles to the
modernisation of coffee production and post-harvest activities. Similarly, farmers’ cooperatives
contribution in improving farmers’ position in the coffee value chain has been hampered
primarily by lack of finance. They have difficulties in obtaining loan to invest in modern
pulping, drying and storage facilities, as well as to finance their marketing operations (ITC,
2011). Obviously lack of credit to acquire modern processing facilities has serious consequences
for coffee quality, with profound implications for market access and economic return.
The changing policy environments at national level and in relation to the coffee sub-sector had a
number of consequences for the coffee sector development. Among these, changes in policies
related to cooperative promotion, coffee development and marketing institutions, coffee
marketing system, and financial institutions have greater direct and indirect effects on the coffee
sector. For example, Minten et al (2014: 2-4) notes the fact that there have been substantial
domestic policy reforms in the recent years that has hugely affected the structure and
performance of the coffee export sector. This is largely related to the creation of the Ethiopian
Commodity Exchange (ECX) marketing system, which has led to vital changes in the structure
of coffee value chain. Having keen interest in the coffee sector, the government of Ethiopia has
intervened in the coffee sector through various measures. As Minten et al (2014) noted, the
government directly has been intervening in the coffee market for example in an effort to reduce
hoarding by exporters. In a related issue, a policy was effected in 2011 to limit the amount of
coffee an exporter can keep in the warehouse at a given time. In addition, as highlighted by

8
Minten et al (2014: 4) there have been a number of changes regarding export taxes on coffee
over time, which include the removal of entry barriers (Proclamation No. 70/1993); the
consolidation of all taxes and duties levied on coffee export into a single tax group (Proclamation
No. 99/1998). Waiving of all export taxes on coffee exports following the early 2000s
international coffee crisis is another notable measure. The effects of the policy directions of the
different regimes of Ethiopia on the coffee sector are further discussed in depth in chapter two.
1.2.4. The role and significance of rural finance in promoting agricultural development
Improving access of resource-poor people to appropriate financial services has been increasingly
recognised as one means of breaking the vicious circle of poverty they are trapped in. Access to
adequate and timely financial services for all actors in the agricultural value chain has been
identified as a key element for success (KIT and IIRR, 2010). In particular, as Gandhimathi and
Vanitha (2009) note, credit is one of the prerequisites for farmers to increase the agricultural
output in the agricultural development endeavor of a country. Credit helps smallholders to
acquire necessary inputs, adopt new technologies and undertake new investments which they
cannot finance from their own capital. According to Barslund and Tarp (2008), households with
access to credit seem to be more willing to pursue promising but risky technologies as it
increases their risk bearing capacity. Extending this line of argument, Sial et al. (2011) note that
availability of agricultural credit increases technical efficiency, resource allocation and
profitability of farmers. Apart from its critical role in improving production and productivity,
credit can also enable smallholders access better market opportunities, generate better income
and improve their livelihoods. In general, development experience has shown that deeper and
more efficient financial markets can contribute to accelerated agricultural growth and improved
food security (World Bank, 2006b).
Some scholars note that (e.g. Mahmood et al, 2009) agriculture as a sector depends on credit
more than any other sectors due to seasonal variations in the farming returns and the shift
towards commercial farming. Transformation of the subsistence agriculture to commercial-
oriented production would inevitably escalate the demand for capital to finance expansion and/or
operations of farm activities, and for acquisition of modern technologies. That is why many
underscore that credit is a key element in the effort to modernise agriculture and

9
commercialisation of a rural economy (Mahmood et al, 2009; Olagunju and Ajiboye, 2010;
World Bank, 1994). The benefits generated through financing initiatives of rural-based farming
community are not limited only to farm households. As KIT and IIRR (2010) put it, efforts to
serve those engaged in agriculture related activities hugely increases the client-base for financial
institutions as well. Moreover, development in the agriculture sector will have considerable spill-
over effects for the non-farming communities and the nation at large.
1.2.5. Expansion of the financial institutions: have they adequately supported agriculture?
Like many other developing countries, the Ethiopian government has considered expansion of
the financial market as an important policy direction. In early 1990s, the EPRDF-led government
took a crucial step in terms of liberalising the centrally planned and communist-ruled economy.
As discussed in chapter two, liberalisation of the financial market forms an important part of
these efforts. As a result, a number of financial institutions (including private financial
institutions), have emerged in recent years. Nevertheless, though there have been enormous
expansion and developments in the financial markets of Ethiopia over the past two decades, there
are still substantial gaps in the rural and agricultural financial markets. Evidence (e.g. Admassie,
2004) shows that generally the improvements have not been vested in the agricultural and
smallholder sectors as expected. As compared to other economic sectors, financial resources
(such as credit facilities) that have been directed to the Ethiopian agricultural sector are generally
low (Admasu and Paul, 2010; Admassie, 2004). For instance, Croppenstedt et al (2003) asserted
that access to credit is a major supply-side constraint to fertilizer adoption in Ethiopia.
Earlier study (Admassie, 2004) shows that the share of agriculture in the total credit disbursed by
banks between 1991/92 and 1997/98 has only been 14.70 percent. In particular, its production
activities have been experiencing severe shortage of institutional credit. Wolday (2008b)
similarly indicated that out of the total amount of loans disbursed (2.7 billion Birr) until 2007 by
Awash International Bank, one of the pioneer private banks in Ethiopia, only 172 million Birr
was allocated for the agricultural sector. In agreement with this evidence, a World Bank study
(1994) reveals that lending by the Commercial Banks of Ethiopia to agriculture has been less
than 5% and has stagnated over years. In addition, almost all of the agricultural credit is of short-
term nature, which will have little impact on long-term investment and in transforming the

10
agricultural sector (Admassie, 2004). Moreover, Bastin and Matteucci (2007) note that existing
financial services are too costly and often not tailored to the farmers’ needs in terms of timing,
duration and volume. A study conducted by Komicha (2008) in South-eastern Ethiopia shows
that the formal credit sector had the longest loan processing time, less flexible repayment
arrangement and often offers credit in kind.
In general, the loan products of the formal financial markets often do not take account of the
nature of the crop (e.g. coffee) production cycle, and are not suitable to smallholders (ITC, 2011;
Bastin and Matteucci, 2007). Although farmers require credit for various agriculture related
purposes, the bulk of the formal agricultural credit in Ethiopia has been geared towards delivery
of inputs for major food crops. For instance, studies conducted by Wolday (2008a) and Admasu
and Paul (2010) ascertain that agricultural loans from banks’ are often channeled to farm
households indirectly in the form of fertilizer and improved seeds. As discussed in the next
chapter, though the EPRDF government had declared adoption of a free-market economic policy,
it has sustained heavy interventions and extensive regulations on the financial sector. Such state
intervention and tighter regulatory systems appear to severely discourage financial institutions
from extending loans to the less attractive and risky sectors such as rural-based smallholder
farmers. In addition, the policy banks have been given directions to channel their funds to
priority areas such as government development projects and selected private investments.
Due to their limited access to the formal credit sector, the majority of Ethiopian farmers often
heavily rely on informal credit sources2 that charge high interest rates. As a result, the informal
lending sector has continued to dominate the rural financial market. Studies conducted by
Gemtessa et al (2006) and Emana et al (2005) report that 80% and 74% of the borrowers in their
respective study areas obtained loans from informal sources. Informal lenders are often preferred
for some of their peculiar features which include: proximity, timely access, collateral-free
lending, speedy disbursement, flexibility in loan transaction, and less complicated bureaucratic
procedures (Pal, 2002; Sinha and Martin 1998). However, informal credit sources are not in a
position to serve borrowers that demand larger volume of loan such as those involved in
2Informal finance refers to all transactions, loans and deposits occurring outside of the regulations of a central
monetary or financial market authority (Aryeetey et al, 1997; Atieno, 2001).

11
activities related to coffee which require substantial amount of capital. Moreover, because of its
exorbitant interest rates, shortage of loanable funds and short-term loan products, the informal
credit market is less likely to meet farm households’ demand for credit (Komicha, 2008).
1.2.6. The Ethiopian Credit Guarantee Scheme for coffee farmers’ cooperatives
With the aim of improving smallholders’ coffee quality and income, a three year pilot project on
improving coffee quality through enhanced primary processing practices was implemented in
Ethiopia and Rwanda between July 2004 and February 2008. The pilot project demonstrated
substantial impacts in terms of improving coffee quality and producers’ income (Negussie et al,
2007). The improvement in quality was greatly translated into increased price premiums of up to
78% above the prevailing local prices offered for the coffee produced using traditional
processing methods. Despite the significant positive impacts, massive out-scaling of the results
and adoption of the experiences by non-project participant farmers and those in other areas could
not be realised as expected. Lack of financial resources to acquire necessary coffee processing
technologies by smallholder producers was identified as one of the formidable challenges. As
discussed in the preceding section, although there are a number of financial institutions in
Ethiopia, lending to smallholders and their cooperatives has not been attractive due to a number
of reasons. Farmers’ inability to provide viable collateral has been identified as one of the major
bottlenecks in accessing bank credit. Thus experiences gained and challenges faced during the
pilot phase had led to the initiation of a follow-on project, which basically focused on provision
of a credit guarantee.
Initiation of the guarantee scheme, participating institutions and focus areas
Cognisant of the aforementioned reality, Common Fund for Commodities (CFC), International
Coffee Organisation (ICO), CABI Africa, Rabo Bank and the Ministry of Agriculture (MoA) in
Ethiopia initiated a follow up project that integrated credit guarantee fund (CFC, 2011). The
scheme is a five year project (2011 - 2016) and is entitled ‘‘Sustainable Credit Guarantee
Scheme to Scale up Improved Coffee Processing in Ethiopia and Rwanda’’. It aims at promoting
enhanced access to affordable commercial credit3 to farmer cooperatives to facilitate out-scaling
of improved coffee processing technologies and practices. This in turn was expected to help the
3Both working capital for purchase of coffee cherries and long-term loan to finance investment in processing facility

12
beneficiary cooperatives to improve the quality of their coffee, to access competitive market and
raise the returns from coffee business. CFC is the main financier, while CABI Africa and MoA,
respectively, are the project executing and implementing agency for the Ethiopian component.
The initiative was a partial guarantee scheme whereby the risks of losses are equally shared
between the guarantor (CFC) and the lending bank (Cooperative Bank of Oromia). The
guarantee was provided through the Rabo Bank Rural Fund, which has acted as the fund
manager. Moreover, Rabo Bank International Advisory Services was engaged to provide
capacity building services to the lending banks and coffee cooperatives. Through the assessments
carried out during the scheme design, Cooperative Bank of Oromia (CBO) showed interest and
willingness to participate in the lending process in Ethiopia. It was stated in the project proposal
that CBO is the most suitable candidate for the Guarantee Scheme due to its strong focus on
cooperatives and its knowledge about the coffee sector. In addition, it is one of the few banks
involved in financing of coffee processing activities, while most other banks only finance the
coffee trade. Many primary cooperatives and their unions in the Oromia region are shareholders
of CBO. Though it originally started operation as a Bank for the Oromia region, CBO is now
expanding its operation to nation-wide network with 120 branches as of November 2014 (as
compared with only about 60 branches in 2011).
Strengthening and working through farmer cooperatives were considered as a key strategy in the
successful implementation of the guarantee scheme. The scheme has implemented a number of
capacity building and other complementary activities that aim at improving the ability of the
lending bank to effectively lend as well as to boost the capacity of the targeted cooperatives to
effectively make use of the guaranteed loans. Moreover, improving access to appropriate market
information by key players such as producers and traders was cited as an essential element in the
project. However, this component of the scheme did not seem to be granted adequate attention
during its implementation. In addition, coffee extension and cooperative promotion experts
working with primary cooperatives received several training of trainers’ programmes.
Structure of the partial credit guarantee scheme, risk-participation and eligibility
As indicated in the project document, two levels of credit guarantees were proposed for the
Ethiopian component. A portfolio guarantee scheme financed mainly by the CFC was proposed

13
as a financing mechanism for primary cooperatives. In addition, an agri-guarantee fund was
devised as a funding mechanism for the cooperative unions and large commercial farmers, and
was to be funded mainly through Rabo Bank. The former is the primary interest of the current
study. As Navajas (2001) notes, indirect (or portfolio) guarantee is where a third party (in this
case RABO Bank) administers the fund provided by the donor agency (such as CFC), and the
scheme guarantees loan up to a certain percentage. The project document indicated that it is not
practical to obtain approval from the guarantor for each and every loan separately. The guarantor
and lending banks rather agreed on the borrower and loan criteria beforehand. Thus all loans that
meet the agreed criteria were to be guaranteed by the scheme. In extending a qualifying loan to a
borrower, CBO shall abide by prudential lending practices, and shall use its existing lending
policies and procedures in screening, approving and disbursing the qualifying loans.
Risk sharing
As stated above, the initiative is a partial guarantee scheme with 50% risk sharing between the
lending bank and the guarantor. In June 2011, two risk-participation agreements were signed
between Rabo Bank (Rabo Rural Fund and Rabo Foundation) and the Cooperative Bank of
Oromia for the two components highlighted in the preceding section. The following issues were
highlighted in the risk participation agreements: “CBO has requested Rabo to provide security to
cover possible losses under the qualifying loans by means of a risk-participation up to a
maximum of 50% on the principal amount and up to 1 year’s accrued interest of each qualifying
loan. Rabo and CFC have agreed to provide CBO with such security always provided that the
aggregate amount payable to the CBO by CFC (through Rabo Rural Fund) and Rabo Foundation
under the total risk participation shall under no circumstance exceed 1,250,000 USD and 500,000
USD under the first and second agreements, respectively”. In other words, based on the 50% risk
sharing, the total risk agreement is 3.50 million USD.
The risk participation agreement states that the guarantee fund will be kept in Rabo’s account in
the Netherlands. With respect to a guarantee fee, it was stated that CBO should pay annual risk
fee of 1.5% to Rabo Bank in consideration of its Total Risk Participation. However, we observed
that the local bank was of the opinion that the fee was to be paid on the actual amount of loan
disbursed to the targeted cooperatives. It was stated that the agreement expires after 5 years, and

14
the maximum tenor of any qualifying loan shall be 4 years. In addition, the first year was
devoted to ground works, awareness creation and capacity building. As a result, the first round
guaranteed loans were granted to a few primary cooperatives towards the end of 2012. Thus the
effective lending duration under the scheme was generally too short.
Eligibility
As regards eligibility of the borrowers and targeted sector, it was stated in the scheme’s
agreement that coffee farmers’ cooperatives, active in coffee production, processing and
marketing, created and registered with relevant authority, or in the process of being created or
holding a license, is eligible to become a borrower. Nevertheless, in view of the small size of the
scheme’s guarantee fund, at the commencement of scheme implementation, the project
management (PIA and PEA), in consultation with the cooperative promoting agencies, selected
22 primary cooperatives from 12 districts of the two major coffee producing regions of Ethiopia
– Oromia and Southern Nations Nationalities and Peoples (SNNP) regions. Among these,
qualifying cooperatives submit loan applications directly to CBO, which undergo normal
appraisal and screening procedures of the bank. The bank provides working capital and
investment loans (for processing facilities) to eligible cooperatives. It was agreed that Rabo is
not involved in verifying whether a qualifying loan included in the credit portfolio meets the loan
eligibility criteria. The maximum amount of principal disbursed by CBO under each individual
qualifying loan shall not exceed USD 250,000. It was agreed in the document that CBO shall
notify Rabo and PEA of the inclusion of any qualifying loan, borrower and loan amount in the
credit portfolio by means of reports.
Defaults and Claims Procedure
Defaults and claims procedures are also clearly stated in the agreement. The following
statements were outlined in the agreement (CFC, 2011) with regard to credit loss and claims
under the risk participation. A loss shall be any amount of a qualifying loan that the CBO could
not collect including the principal and interest of (up to a maximum of 1 year accrued at a
maximum rate of 15% p.a.) of such qualifying loan. Loss shall be deemed to occur 180 calendar
days after default date. In the event of a default, Rabo shall share 50% of risk of loss with CBO,
provided that the maximum amount reimbursable by Rabo in respect of the cumulative losses

15
shall not exceed USD 1,250,000. Upon the occurrence of a loss, CBO shall inform Rabo of such
loss and claim for reimbursement of the corresponding risk participation, by submitting an
affidavit letter. Rabo shall transfer to CBO the amount of the corresponding risk participation
within 15 days of receipt of the loss notice and a written confirmation from the PIA.
1.3. Statement of the problem
Ethiopia is endowed with immense genetic diversity and potential, conducive ecological and
socio-economic conditions for coffee production. The country produces various coffee types that
are globally cherished for their superior cup qualities and unique flavours. Nevertheless, full
potential of the coffee sub-sector has remained hugely untapped both in terms of
production/productivity and quality. Though the country is arguably said to have more than 12
million hectares of suitable land for coffee production (Alemayehu and Esayas, 2008), according
to official statistics (CSA, 2014) to date coffee area coverage is only 538,467 hectares. Its
productivity remained low with a national average yield of 728 kg per ha (CSA, 2014), while
Vietnam with a recent history in coffee production has attained a productivity level of over 2000
kg per ha (Admasu et al, 2008). In addition, quality of the product and the income generated by
millions of smallholder coffee producers could not attain a satisfactory state. Coffee quality
problems are largely related to the poor harvesting, processing and post-harvest handling
processes employed by smallholder producers. These mainly stem from lack of adequate
awareness, knowledge/skill, and finance to acquire improved processing facilities and for related
activities, and lack of incentives such as attractive market price. As outlined in the previous
section, in Ethiopia, a credit guarantee scheme was designed with the aim of improving coffee
farmers cooperatives’ access to bank loan to enable them acquire improved coffee processing
facilities and to support their coffee trade activities. This was in turn expected to enhance the
quality and volume of coffee traded by cooperatives, to help them attract competitive market and
thereby improve their income.
In developing such a credit guarantee scheme, there is a general belief and expectation that farm-
households and their cooperatives would exhibit effective demand to obtain and utilise bank
loans if credit guarantees are provided. Because limited access to and participation by the

16
resource-poor smallholders and their association in the formal credit market is often believed to
be largely due to constraints related to supply. Several studies (e.g. Bastin and Matteucci, 2007;
Wolday, 2008a; 2009a) point to the presence of huge potential and unmet demand for rural
credit in Ethiopia. Some, however, argue that farmers and the rural poor may not depict effective
demand for availed credit facilities as expected due to various reasons. There are substantial
obstacles to the transformation of potential demand to revealed demand (Aryeetey, 1996). Some
analysts claim that weak demand for credit fund may hinder the participation of smallholder
farmers and other rural poor in the credit market. Concurring with this line of argument, Diagne
and Zeller (2001) and Komicha (2008) note that a farm household can have access but may
choose not to participate in the credit market. A study conducted in Ada’a Liben district of
Ethiopia (Admasu and Paul, 2010) shows that only 43 percent of the interviewed farmers
expressed need for credit. Berhanu (2005) similarly notes that some MFIs were facing a
challenge in getting sufficient demand for their existing loan products mainly due to the
mismatch between what the institutions offer and what the borrowers require. This thus calls for
rigorous country and context specific empirical studies that closely look at the extent of demand
and factors influencing credit demand among farmers’ cooperatives operating under diverse
natural and socio-economic settings. One focus area of this study is thus to bridge this
information gap by systematically examining farmer cooperatives’ response to the availed credit
facilities under the Ethiopian context, which is characterised by pervasive state intervention and
tight regulatory environment.
Another important anticipation in devising such an intervention is that provision of a credit
guarantee can effectively address the financial gaps by encouraging banks to improve credit
allocations to farmers’ cooperatives. Nevertheless, though credit guarantee has been widely used
by governments and other agencies in several countries, there are varying views with regard to
its actual role and impacts in effectively mitigating credit constraints. Many (e.g. Zhang and Ye,
2010; Cowling and Mitchell, 2003; Kang and Heshmati, 2008) note that comprehensive studies
have not been conducted to evaluate the contributions and impacts of CGSs particularly in
developing countries. Some (e.g. Green, 2003) maintain that evaluations of individual CGS are
often limited in scope and few schemes have been evaluated consistently. Empirical evidence is
not only scarce, but the findings of existing studies that attempted to evaluate credit guarantees

17
are also mixed and inconclusive (D’ignazio and Menon, 2013). Some past studies (e.g. Zecchini
and Ventura, 2009; Cowling and Mitchell, 2003; Mafimisebi et al., 2010) reported that it is
effective in addressing small entrepreneurs’ credit constraints, while others (e.g. Kang and
Heshmati, 2008; Zhang and Ye, 2010) came up with findings indicating partial successes or
complete failure in attaining its aims. Therefore, examining whether a CGS (whose origin is
largely traced back to a purely free-market economy) can demonstrate effectiveness and success
under a financial market with strong government intervention and tighter monetary and
regulatory environments is one of the focus areas of this study.
Moreover, most of the previous studies on credit guarantees focused on assessing the
government-supported schemes for SMEs in Asia and developed countries of Europe and North
America, where such schemes have been extensively applied. Apparently private firms (such as
SMEs) differ from farmer cooperatives in their philosophy, objectives, principles, nature and
location of their businesses. When one looks at the situation of Ethiopia, majority of the studies
conducted on rural finance tended to focus on analysing credit supply and supply side constraints
among individual farm households. Some studies (e.g. Emana et al, 2005; Komicha, 2008)
attempted to explore sources of loans for smallholder farmers, while others (e.g. Borchgrevink et
al, 2005; Wolday, 2009a; Bastin and Matteucci, 2007) tried to analyse the performance, outreach
and financial sustainability of the microfinance institutions. Other researchers (e.g. Admasu and
Paul, 2010; Anbes and Gowda, 2008) focused on assessing credit use among farmers in non-
coffee growing areas and/or government credit service for inputs targeting food crops. Thus there
is a critical need for a study that closely and deeply examines the role and impacts of a credit
guarantee in improving institutional credit allocations, access and utilisation by coffee farmers’
cooperatives and the resultant changes. As far as the current researcher knows, this is the first
empirical study that aims to systematically examine the role and effectiveness of a credit
guarantee in mitigating coffee farmer cooperatives’ credit constraints under the Ethiopian
financial market.
In terms of methodological approach, some studies (e.g. Beck et al, 2010) tried to provide
descriptions and comparisons of scheme features and operations across countries. A number of
studies focused on assessing ex-post impacts of the schemes on the firms or on the economy

18
based on cross-sectional research design and/or secondary sources of data. As some scholars
(e.g. Saldana, 2000; Green, 2003) point out, previous studies failed to continuously monitor and
analyse how credit guarantees work, their effects on the decisions of the lending banks, and how
they benefit both creditors and borrowers. Apparently, such studies have limitations in closely
monitoring and examining the processes, the relationships between the three parties (lender,
borrowers and guarantors), and intervening factors. Moreover, the effectiveness of credit
guarantee programmes varies from place to place as a result of varying political, policy, market,
and other socio-economic and institutional factors. This suggests the need for studying the
performance and impacts of each guarantee scheme in the context of its operational environment.
Such studies require a research design that allows continuous and deeper analysis that is based
on a mix of quantitative and rich qualitative data collected at various stages of the intervention.
Such an approach would also enable to closely monitor and examine the processes of the
guarantee offering, its utilisation and relationships between the parties involved in the scheme, as
well as the underlying causes for the success or failure of the guarantee programme. This new
methodological approach in assessing the effectiveness and success of a credit guarantee is one
of the contributions of the current study.
On the other hand, in theory cooperatives have the potential to contribute to the expansion of
financial service provision to the poor in rural areas (ITC, 2011). However, practical experiences
from various countries show mixed results when it comes to the role of multipurpose
cooperatives in this regard. A World Bank study (1994) reported that multipurpose cooperatives
in many countries have generally not been successful in providing savings and credit services.
Experience in the Philippines, however, shows that cooperatives can effectively serve as conduits
of credit funds to individual members, who assume joint liability (Briones, 2009). Thus another
relevant issue for the current study is assessing potential role and suitability of multipurpose
cooperatives to serve as intermediaries to channel credit funds to small scale farmers.
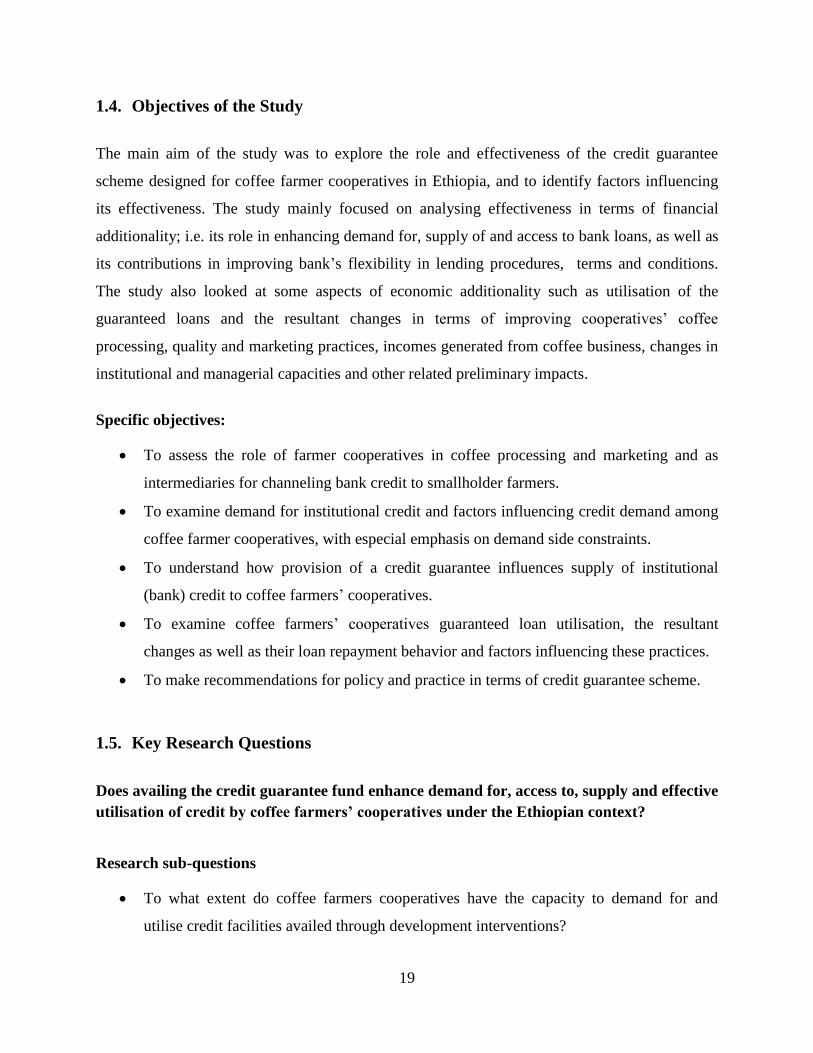
19
1.4. Objectives of the Study
The main aim of the study was to explore the role and effectiveness of the credit guarantee
scheme designed for coffee farmer cooperatives in Ethiopia, and to identify factors influencing
its effectiveness. The study mainly focused on analysing effectiveness in terms of financial
additionality; i.e. its role in enhancing demand for, supply of and access to bank loans, as well as
its contributions in improving bank’s flexibility in lending procedures, terms and conditions.
The study also looked at some aspects of economic additionality such as utilisation of the
guaranteed loans and the resultant changes in terms of improving cooperatives’ coffee
processing, quality and marketing practices, incomes generated from coffee business, changes in
institutional and managerial capacities and other related preliminary impacts.
Specific objectives:
To assess the role of farmer cooperatives in coffee processing and marketing and as
intermediaries for channeling bank credit to smallholder farmers.
To examine demand for institutional credit and factors influencing credit demand among
coffee farmer cooperatives, with especial emphasis on demand side constraints.
To understand how provision of a credit guarantee influences supply of institutional
(bank) credit to coffee farmers’ cooperatives.
To examine coffee farmers’ cooperatives guaranteed loan utilisation, the resultant
changes as well as their loan repayment behavior and factors influencing these practices.
To make recommendations for policy and practice in terms of credit guarantee scheme.
1.5. Key Research Questions
Does availing the credit guarantee fund enhance demand for, access to, supply and effective
utilisation of credit by coffee farmers’ cooperatives under the Ethiopian context?
Research sub-questions
To what extent do coffee farmers cooperatives have the capacity to demand for and
utilise credit facilities availed through development interventions?

20
What factors do influence demand for, access to and utilisation of credit by coffee
farmers’ cooperatives?
How does provision of credit guarantee enable banks to improve allocations of credit and
reach small scale coffee farmers and cooperatives?
What are the lending criteria and conditions of banks with and without the credit
guarantee programme for coffee farmers and cooperatives?
How suitable are primary co-operatives as intermediaries for channeling credit services
from financial institutions to smallholder coffee producers?
1.6. Overview of the research design and methodology
The study was conducted in 8 coffee growing zones of Oromia and Southern Nations
Nationalities and People’s (SNNP) regional states, where the current credit guarantee scheme for
coffee farmers’ cooperatives has been operating. The study areas represent Western, South-
Western, Southern and Eastern coffee growing parts of Ethiopia, with different coffee production
systems, agro-ecology, and socio-cultural set-ups. The sampling technique used in the study was
largely purposive. A mixed methods approach was used in undertaking the study; data collection
process employed both qualitative and quantitative approaches and techniques. Primary data
were collected from multiple sources using different techniques and tools. These comprised of a
structured questionnaire survey (at two stages), focus group discussions, key informant
interviews, observation and literature/documentation review. Some of the data were collected at
one point in time (cross-sectional), while data on various issues were gathered at several stages
of the scheme implementation (longitudinally) for three years to assess changes and trends. The
data were analysed both qualitatively and quantitatively. Details of the study methodology are
provided in chapter 4.
1.7. Scope and limitations of the Study
This study analysed the role and effectiveness of a credit guarantee scheme mainly focusing on
12 districts involved in the credit guarantee scheme under analysis, although data were also
gathered on some cooperatives from non-project areas for comparison purposes. Coffee growing

21
areas of Ethiopia and actors involved in the value chain are vast and numerous. Due to the
limited coverage of the guarantee scheme, and because of limitations of time and resources, the
researcher was unable to include all coffee growing areas and stakeholders which would provide
further information. The samples may not fully represent the population of farmers, cooperatives
and other stakeholders throughout the coffee growing parts of Ethiopia. The study focused on
smallholder farmers’ cooperatives and did not cover those involved in large scale coffee farming.
Furthermore, the study had limitations in examining long-term changes and impacts of the
intervention in terms of creating sustainable relationship between the lender and borrowers, and
in improving the livelihoods of the coffee farming communities as most of the data were
generated at early stages of the scheme. In addition, the study closely analysed the case of the
Cooperative Bank of Oromia (a partner bank under the scheme), which tends to be more
cooperative-friendly. Somehow this may not represent the typical experiences of other
mainstream commercial banks in the country. Moreover, the research largely used qualitative
and descriptive approaches and methods with non-random sampling, which may have some
influence on their representativeness and generalisation of the findings. In particular, limitations
in the number of cooperatives participated in the current scheme did not allow econometric
analysis of its impacts.
1.8. Definition of the Key Concepts
This section provides clarifications of the key terms that will frequently feature in the study. The
definitions have been adapted from different literature sources.
(A) Cooperatives
The International Cooperative Alliance (ICA, 1995) defines a cooperative as ‘‘an autonomous
association of persons united voluntarily to meet their common economic, social and cultural
needs and aspirations through a jointly owned and democratically controlled enterprise’’. In
outlining their peculiar nature, Schwettmann (1997) and others highlighted the fact that members
of cooperatives make equitable contributions to the capital and accept a fair share of the risks and
benefits. In addition, members’ active participation in their cooperatives’ activities and major
22
decisions is critical. These definitions imply that a cooperative is a voluntary business enterprise,
independent of state, initiated, owned and controlled by its members.
(B) Rural finance
Various authors provided definitions of the term rural finance. According to Klerk (2008) it
refers to various forms of financial services provided in rural areas for agricultural as well as
non-agricultural purposes. These include savings, lending, insurance and remittance services to
rural households and other entrepreneurs. For the purpose of this research, the term ‘‘rural
finance’’ is considered mainly in terms of savings and credit services provided to the farm
households and their cooperatives.
(C) Formal financial sector
All financial service providers regulated by the banking law of a particular country are taken as
the formal financial sector. These consist of banks, registered microfinance institutions (in
countries where this sector is regulated) and registered saving and credit associations and unions
(Klerk, 2008). Those that are not regulated by the Central (National) Banks are known as
informal financial sector. In the Ethiopian context formal financial institutions include banks,
insurance companies and microfinance institutions. However, SACCOs are registered and
regulated by the cooperative agency. Thus in the context of this research, the term rural finance
covers all these financial institutions.
(D) Agricultural credit
Agricultural credit is the chief component of rural financial services. Ozowa (2007, quoted by
Sebopetji, 2008) states that agricultural credit encompasses all loans and advances granted to
borrowers to finance production activities relating to agriculture, fisheries and forestry as well as
for processing, marketing, storage and distribution of products produced through these activities.
By temporarily transferring purchasing power from one party to another, credit facilitates
acquisition of capital/asset among the borrower. The current researcher thus used the term
‘agricultural credit’ to refer to all loans and advances granted to smallholder farmers and their
associations to finance and service agricultural (including coffee) production, processing, storage
and marketing activities.
23
(E) Credit rationing
Credit rationing refers to one of the common features of a credit market in developing countries.
The borrower household or firm is said to be credit constrained when it completely lacks access
to credit or when it cannot borrow as much it wants even if it is willing to pay the interest rate
asked for (Rahji and Adeoti, 2010; Dohcheva, 2009; Diagne and Zeller, 2001). Stiglitz and
Weiss (1981) note that, among other things, adverse selection, moral hazard and information
asymmetry result in equilibrium credit rationing. Some also claim that policy and regulatory
frameworks can directly or indirectly induce credit rationing. According to Dohcheva (2009),
perception of the agricultural sector (by the lending institutions) as a riskier sector is another
factor that exacerbates credit rationing problems. Failure of the loan applicants to provide
collateral of required value and quality would further worsen the situation. The current
researcher thus uses the term ‘credit rationing’ to refer to a situation where the borrowers are
given a loan smaller than they applied for or denied a loan at all.
(G) Loan guarantee
In the literature the expressions credit guarantee and loan guarantee are used interchangeably
(Jonson, 2009). Credit guarantee is one of the popular tools used to alleviate financial constraints
of farmers and other small enterprises by encouraging financial institutions to improve credit
allocations to these groups. Deelen and Molenaar (2004) define a credit guarantee as “a financial
product that a small entrepreneur can buy as a partial substitute for collateral. It is a promise by a
guarantor to pay to the lender all or part of the loan if the borrower defaults”. Loan guarantees
cover an agreed percentage of the loan losses, and can be financed by governments or
donor/development agencies. In the context of this study, the primary focus is the partial loan
guarantee provided by external development agencies.
(H) Additionality or incrementality
The term additionality or incrementality has been understood and defined in various ways. The
former is a term commonly used in Europe, while the latter is used in North America (Riding et
al, 2007). Additionality can be categorised into two: Financial additionality refers to additional
loans extended to targeted borrowers as a result of the guarantee provided to the lender, while

24
economic additionality refers to the economic and social benefits ultimately realised by the
beneficiaries of the guarantee fund (Levitsky, 1997; Saldana, 2000; Green, 2003). The latter may
include improvements in the income of borrowers, an increase in the amount of commercial and
economic activities in terms of employment, sales, new product development, competitiveness,
productivity and economic growth (Green, 2003). Gudger (1998) notes that additionality also
refers to a credit provided on a more favourable terms to the target beneficiaries. This research
thus adopts the meaning of additionality that encompasses different dimensions such as
additional loans obtained, changes in terms and conditions of loans and impacts on the business
and economic activities of the borrowers.
(I) Asymmetric information
This is a common phenomenon in the rural credit market and refers to a situation where there is a
lack of sufficient information between the borrowers and lenders about each other. Such situation
may favour the party with more information or knowledge. Asymmetric information exists when
the two parties to a contract (the lenders and borrowers) don’t have the same information
(Gobeze, 2008). As Yaron (2005; cited by Gobeze, 2008) notes, there always exists asymmetric
information between the lenders and borrowers which creates problems of adverse selection and
moral hazards.
(J) Moral hazard and adverse selection
Adverse selection stems from a situation where the lending institution lacks sufficient
information about the loan applicants to establish their risk levels. According to Okurut et al
(2004), adverse selection occurs when borrowers with safe (and lower default risk) projects
decide to opt out of the credit market because of the rising interest rates, while riskier projects
(with high probability of default) but with potential higher returns come forward to apply for a
loan. In order to avoid such adverse selection problem, as Stiglitz and Weiss (1981) note, banks
are often reluctant to raise the cost of borrowing and prefer to reduce the amount of loans
provided, which often results in credit-rationing. On the other hand, moral hazard arises when
the presence of a guarantee induces reckless conduct by the guaranteed lender or borrower
(Freedman, 2004: 8). In other words, because of the presence of the guarantee the lender may
show reluctance in properly screening loan applications or in following up loan recovery, while

25
borrowers may also show opportunistic behavior by going for a riskier project or by deliberately
defaulting.
1.9. Outline of the structure of the thesis
Chapter 1: Introduction and background
This chapter presents introduction and background to establish the context of the study. The key
issues presented in the chapter include background information about the country, the Ethiopian
agriculture sector, the coffee sub-sector, role and significance of rural finance, design and
operational features of the credit guarantee scheme for coffee farmer cooperatives. The chapter
finally provides statement of the research problem, research questions, objectives of the study,
overview of the research design and methodology, scope and limitations of the study, definitions
of the key concepts used in the study, outline of the thesis and contents of each chapter.
Chapter 2: Macro-economic and institutional contexts of Ethiopia
This chapter provides an understanding of the underlying theoretical conceptualisation that has
shaped the Ethiopian economy over time. The chapter highlights the two dominant economic
systems – The socialist’s command economy and the free market economic policy. The chapter
then discusses the political and macro-economic systems of Ethiopia and their impacts on
various sectors and overall performance of the country’s economy. The chapter goes on to
provide a detailed review of literature and theoretical discussion on farmers’ cooperatives as a
vital rural institution.
Chapter 3: Intervening in Rural Finance
This chapter presents literature review and theoretical discussions related to rural finance in
general and a credit guarantee intervention in particular. The chapter begins with a literature
review, theoretical and conceptual discussions on various aspects of rural finance such as rural
credit markets, credit demand by farmers, factors influencing credit demand and credit guarantee
schemes. The chapter finally presents analytical approaches and frameworks chosen for the
current study.

26
Chapter 4: Study Design and Methodology
This chapter presents design and methodology of the study, including description of the study
areas, sampling strategy, data collection and analytical methods. The chapter finally highlights
measures taken in relation to research ethics.
Chapter 5: Empirical findings on the coffee and cooperative sectors of Ethiopia
This chapter presents the findings of both qualitative and quantitative studies on Ethiopian coffee
and cooperative sectors. These include the significance of the Ethiopian coffee sector, role of
cooperatives in its production, processing and marketing, sources of finance for agriculture and
the coffee sub-sector and bank’s priority areas for lending. The chapter goes on to present the
findings on cooperatives’ institutional, business and socio-economic characteristics, their access
to institutional services, their loan demand and its determinants.
Chapter 6: Empirical findings on the performance and preliminary impacts of the credit
guarantee scheme
This chapter presents the findings of the qualitative and descriptive analyses on the performance,
contributions and effects of the credit guarantee scheme under analysis. The chapter in particular
looks at the findings on the strengths and limitations of the design and operational features of the
scheme, its utilisation by banks and outreach, and financial and preliminary economic
additionalities attained under the scheme. The chapter finally presents the findings related to its
impacts on the lenders’ and borrowers’ behavior and factors that affect its performance and
effectiveness.
Chapter 7: Discussion of the key findings
This chapter presents synthesis and discussions of the key findings of the study in relation to
existing literature or theory. Discussions of the key empirical findings are organised according to
the specific corresponding objectives set for the study.
27
Chapter 8: Conclusions and recommendations
Drawing on the theoretical and empirical findings and discussions, this chapter presents the
conclusions and recommendations made by the study.
Bibliography
Appendix

28
CHAPTER 2
2. MACRO-ECONOMIC AND INSTITUTIONAL CONTEXTS
2.1. Introduction
This chapter provides an understanding of the underlying theoretical conceptualisation that has
shaped the Ethiopian economy over time. The chapter begins by providing a brief discussion of
the two dominant economic systems – The Socialist’s command economy and the free market
economic policy. The chapter then goes on to discuss the political and macro-economic systems
of Ethiopia and their impacts on various sectors (including the agriculture, coffee and financial
sectors, local/farmers’ institutions) and overall performance of the country’s economy. This is
followed by a detailed review of literature and theoretical discussion on farmers’ cooperatives as
vital rural institutions. The chapter ends with a summary of the key points.
2.2. The Socialist’s Command Economy
The Marxist’s ideology had profound influence in many parts of the world. Several countries
especially from Central and Eastern Europe, former Soviet Union, Asia and Africa, including
Ethiopia had adopted this ideology to a varying degree. Proponents of Marxism aim at
eliminating what is believed to be an undesirable economic system (which is basically
capitalism) that results in undesirable societies. This ideology denounces a system that provides
fertile ground for accumulating excessive wealth among a small segment of the society at the
expense and misery of the majority (working class). It thus wishes to replace such undesirable
economic system with a system that abolishes private property and provides a ground for
communal ownership of key means of production. To this effect, it promotes the struggle of the
workers (the proletariat) exploited by the capitalists (bourgeoisie) and a move to socialism and
finally communism, which is believed to be an ideal economic and political system. Under such
a system, as Marxists believe, the redistribution of wealth and ensuring communal ownership of
means of production would help overcome inequalities, injustice and many of the other problems
prevailing in the capitalist system.

29
While Ethiopia, like some of the other countries that were pursuing this ideology, was often
referred to as a Marxist state, it would be more relevant to refer to it as a Socialist state, since the
focus was on redistribution of resources (that also involves some elements of the free market)
rather than the social ownership of the means of production and fundamental social change. As a
move towards communism the socialist ideology is against monopolistic and competitive
behaviors which are considered to be the basic features of the capitalist system. Unlike a free-
market economy in which production decisions are made by private sector actors through market
prices (by the laws of demand and supply), in the centrally planned socialist economic system,
economic decisions (what to produce, how resources are allocated, how to distribute, including
decisions regarding prices) are made by the central government. Under the socialist’s command
economic system state-owned (public) enterprises and collectives play a key role in the
production of goods and services.
Experiences from various socialist states show that such a move did not succeed in creating the
desired ideal economic and social system. The critics of the socialist system argue that its
principle is too idealistic. Socialism, as critics and practical experiences reveal, is a system that
makes individual citizen and even organisations (including farmers’ cooperatives) dependent on
the state for everything they need and what they are supposed to do. Another important limitation
of the socialist’s collective production system is that it undermines the role of incentives and
competitive behavior in the economic activities. Such lack of incentives and low productivity
was witnessed during the Ethiopian socialist system. According to Butabaev (2015), in centrally
planned economies, enterprises were not acting as source of innovation, but rather were treated
merely as production units. Butabaev goes on to point out that “absence of competitive
environment as selection process, lack of trial and error experimenting through market led
initiatives resulted in slow pace of product evolution”. Butabaev (2015) and others argue that
there was a high degree of inflexibility, heavy and inefficient bureaucracy in the central planning
system, which was unable to timely adjust and adapt to technological and social changes and
innovations. Some also note that the concentration of power within government creates an
environment that undermines the needs and freedom of its citizens.

30
The problems and limitations of the socialist’s centrally planned economic system were not
eliminated with merely departing from the system. The legacy and aftermath effects of this
system have continued to negatively impact on the performance of the economic and social
development of the countries coming out of socialism. For example, Butabaev (2015) notes that
“prolonged economic stagnation, which former socialist economies (including Eastern Europe
and the former Soviet Union) are facing since the crisis of 2008, suggests that fundamental
economic problems inherited from the socialist system have not been properly addressed by the
transition reforms”. Butabaev goes on to argue that after more than 20 years of market reforms,
stagnant centrally planned economies were replaced by stagnant capitalist economies. For
example, Flek and Večerník (2004, cited by Butabaev, 2015), indicated that though Czech
Republic at the beginning of the transition period appeared to be a successful example of
structural transformation generated by the transition reforms, since the middle of 1990s there has
been no further change in the structure of employment. According to Butabaev (2015), economic
stagnation was not only structural and technological, but also extended to institutional and social
aspects. The inefficiencies, sense of dependence and lack of innovativeness and entrepreneurial
mentality among farmers’ cooperatives in Ethiopia is one of the practical examples of the
legacies and problems inherited from the socialist system.
2.2.1. The Ethiopian Socialist or command economic system
Before embarking on the socialist economic policy, Ethiopia was under Emperor Haile Sellasie’s
Feudo-capitalist system. The Imperial regime that existed prior to 1974 was a kind of free-
market economy that encourages foreign investment in an attempt to industrialise the country
through import substitution industrialisation strategy. During this regime, some efforts were
made to encourage expansion of large scale farms and agribusinesses (Chanyalew, 2015). The
regime largely adopted pro-capitalist and pro-feudal policies with its typical feature of repression
and exploitation of the peasants by landlords. This had ignited mass discontent and a growing
pressure particularly from the educated elites. This eventually led to the popular revolution that
brought Haile Selassie’s regime to an end in 1974.
31
The Derg4 regime (1974 - 1991) emerged with a drastic change and adopted a centrally planned
and state controlled economic and political system that promotes socialism. Such socialist
strategy of the government, as Nega and Nuru (1999) noted, required that most productive
activities had to be put under state control. This move led to the nationalisation of all major
private undertakings. Unsurprisingly, the socialist government had accorded profound role to the
socialised sectors (including the public sector) with marked discrimination against the private
sector. The drive to run a centrally planned economy through a highly centralised and
undemocratic administrative structure depressed private initiatives and discouraged popular
participation in the planning and execution of development undertakings (Demeke, 1999).
Moreover, the policy that imposed capital ceilings on private operators had acted as a major
impediment to private investments. The 1975 land reform proclamation that declared rural land
to be a property of the state also prohibited private individuals from hiring agricultural labour.
This had serious detrimental effects on the survival and operations of the private undertakings.
The Military government also set up the Agricultural Marketing Corporation (AMC) with a
mandate to supervise the production and sale of agricultural outputs. This was mainly used by
the government to exercise direct control over the prices of major agricultural products,
particularly food grains. In addition, it had monopoly in the distribution of fertilizer and thus was
able to directly control its price (Kebret, 2000).
Understandably, owing to its anti-imperialist stands the socialist government did not favour
direct foreign investment for promoting supply of financial resources. As Nega and Nuru (1999)
point out, this had compelled the government to largely rely on internal sources of finance such
as massive domestic borrowing and printing of money, which had its own consequences. As a
result of the unfavourable police environment, coupled with the effects of the civil war, the
country’s economy had severely suffered and continued to march backwards. The Ethiopian
economy, as Nega and Nuru (1999) noted, was much worse off in 1991 when the military
government was overthrown than when it resumed power in 1974. This alarmingly declining
trend of economic performance had forced the military government to eventually adopt mixed
economy policy and strategies. However, that did not last long as the regime of the military
government came to an end in 1991. Unfortunately, the Ethiopian socialism was orchestrated by
4 It is an Amharic term that refers to the ‘committee’ of soldiers.

32
military dictators, who hijacked the philosophy and concepts of socialism and headed to a wrong
direction with a lot of malpractices. As a result, the system eventually ended with catastrophic
outcomes for the country and its citizens.
2.3. The free-market economy
Over the past decades, many countries that had adopted the free-market economic development
route were largely embarking on neoliberal economic policy, which as some (e.g. Bresser-
Pereira, 2009; Chang, 1999) noted, was a hegemonic ideology from the late 1970s to the early
2000s. According to Harvey (2005), neo-liberalism is:
‘‘a theory of political economic practices which proposes that human well-being can best be
advanced by liberating individual entrepreneurial freedoms and skills within an institutional
framework characterised by strong private property rights, free markets and free trade. The role
of the state is merely to create and preserve an institutional framework appropriate to such
practices”.
As this definition suggests, neoliberals believe that state intervention in the market is undesirable
and should be avoided or kept to a bare minimum. As many (e.g. Bresser-Pereira, 2009; Chang,
1999) comment, neoliberalism is a radical economic liberalism as it advocates minimal state,
wholesale liberalisation and self-regulated markets. In other words, neoliberals believe that
effective allocation of resources is attained only through market mechanisms; i.e. basically
through price competition. In general, the neoliberal economic theory concludes that the only
viable and desirable path to development, as Chang (1999) and others noted, is through and with
the “invisible hands” of the market forces. This theory regards the price mechanism as capable of
achieving not only optimal short-term allocative efficiency but also optimal long-term dynamic
efficiency. Consequently, neoliberals seriously undermine and negate the need for any
interventionist policies by the government and even doubt the existence of any positive role that
the state could play in the development process.
Although the neoliberal ideology traces its roots in the developed economies of the world, it was
largely adopted by developing countries through programmes and initiatives that attempted to
copy and introduce economic development models and policies of the developed world to the

33
less developed countries. Many of the elements of neoliberal policies found their ways to the less
developed economies, including sub-Saharan Africa, particularly through the Structural
Adjustment Programmes of the 1980s and 1990s. Like in many other parts of the world, the
Briton Wood Institution’s Structural Adjustment Policies were largely meant to limit the role of
the state, enhance privatisation and increase the role of the market in SSA.
Critiques point to a number of limitations of the neoliberal’s argument for complete market
liberalisation and avoidance of state intervention. As noted by Bresser-Pereira (2009), some
argue that neoliberals aspire to have a weak state that allows the national economy to become a
playing field for large (including multinational) corporations. Some critics comment that
neoliberalism is the ideology that the wealthy used in the late 20th century against the poor, the
workers and a social democratic state; which is thus a very reactionary ideology (Bresser-Pereira,
2009). As Chang (1999) and others argue, one of the problems with the neoliberal theory is its
tendency to undermine market failures – prevalence of instances when the market mechanism
ceases to properly function. Such market imperfections and inefficiency will be more
pronounced during the economic crisis, to the point of seeking government’s intervention. Many
largely attribute the failure of the structural adjustment programmes in several countries to the
neoliberal ideas heavily embedded in such policies. In particular, such programmes have had
various detrimental effects for several nations in sub-Saharan Africa (SAPRIN, 2004; cited in
Dadzie, 2012). The critics of such an economic policy, including the Ethiopian government, in
their argument generally emphasise its irrationality, its failure in attaining sustained economic
growth and development in developing countries, and its effect in concentrating income and
wealth among a tiny segment of the population. The declining growth rates, the financial and
economic crisis and instabilities encountered by the developed world in recent years have also
been increasingly cited as an evidence of the failure of this development path. In this regard, as
Bresser-Pereira (2009) noted, the crash of 2008 and the ongoing economic and financial crisis
that required government’s intervention to rescue indebted banks and companies (of the
developed world) has intensified attacks against the neoliberal development policy.
Basically neoliberal economic policies are largely in line with the neoclassical and classical
economic theories, but obviously stand against the Keynesian economics. As a concept closely

34
related to the laissez-faire economic market, classical economic theory believes that free-market
requires little or no state intervention at all. In terms of making economic decisions, including
resource allocations, it proclaims that individuals and businesses should be allowed to act
according to their own self-interest. In the views of classical economists rather than government
spending, consumer and business expenditures are the most critical component of a national
economic activities and growth. In contrary, Keynesian economists argue that private sector
decisions sometimes lead to inefficient economic outcomes which require active policy
responses by the government or public sector. Keynesian economics basically advocates a mixed
economy, whereby the private sector is allowed to play a predominant role with a room for
government intervention. According to this theory, such state intervention is especially
considered critical during recessions and sluggish economic performance. Evidence shows that
Keynesianism served as the dominant economic model in the developed nations since the Great
Depression of 1930s and 1940s. During this period Keynes advocated for increased government
spending and lower taxes to stimulate demand and to help the economy to come out of the
Depression.
As a result of the tendency to move towards a less stringent state regulation on the
economy/market, and due to the increasing tendency to focus on economic policies focusing on
stability, Keynesianism gradually gave way to neoliberalism which had dominated the
macroeconomic policy arena since 1970s. The declining importance of Keynesianism and the
rise of neoliberalism in the 1970s shifted the focus of scholarly and practical work in
development towards market (in the neoclassical sense) inspired growth (Dadzie, 2012).
However, some claim that the financial crisis of the 2008 has led to the resurgence of the
Keynesian economic thoughts. While classical economics tend to focus on seeking long-term
solutions for economic problems, the Keynesian economics often pay attention to the immediate
results with instant corrections to a national economy. In general, classical economists believe
that the economy is self-correcting and there is no need for intervention from the government,
even when a recession occurs. In contrast, Keynesians argue that it may take too long to realise
such self-correction in the economy or market place, if at all. That is why Keynes urge the
national governments and monetary policy makers to take immediate actions to help the

35
economy in the short-run. The development policies of the current Ethiopian Government
somehow appears to be in line with the Keynesian economic theory.
2.3.1. The free-market economic system of Ethiopia
Though the Imperial regime of Ethiopia appeared to follow a free market economic policy, its
political ideology was far from liberalism as it exercises a monarchical5 system of ruling with its
autocratic nature. The Emperor was the head of state, holding supreme authority in the country.
As discussed in the preceding section, after taking power from the Imperial regime in 1974, the
military government adopted socialist’s command economic policy direction. However, the
political system and economic policy of Ethiopia took entirely a new dimension after 1991,
which marks the end of the military regime and departure from the socialist system. Soon after
coming to power in 1991, the EPRDF-led government took crucial measures in terms of
liberalising the centrally planned and communist-ruled economy, and in shifting to a pro-
capitalist and market-oriented economic system.
Since its transitional period, the current government has adopted various macro-economic policy
measures as well as sector specific social, economic and financial policies and programmes. The
reforms included short-term stabilisation and structural adjustment measures that permit markets
to guide resource allocations (Nega and Nuru, 1999). Nevertheless, the current Ethiopian
Government did not want to fully embark on the prescriptions of neoliberals, which is against the
notion of state intervention. As Nega and Nuru (1999) note, while the Government seems to have
reluctantly accepted the capitalist system, it did not seem to be convinced that totally opening up
all economic sectors to the market forces and allowing pure market allocation of resources is a
viable option for a country like Ethiopia. Because the country’s economy was just coming out of
a totally controlled system as well as the domestic private sector is at its infant stage. The
Ethiopian government is of the view that neoliberalism and liberal capitalism cannot provide the
rapid, broad-based, inclusive and sustainable economic development the country aspires to
attain. Thus the government has decided to adopt a developmental state model, which allows it to
have active participation and intervention in the economy. The Government is pursuing the
principles of revolutionary democracy, which is neither pure liberal nor socialist, and combines
5 Where the power tends to be transferred by hereditary rights

36
elements of both capitalism and socialism (Chanyalew, 2015). The development policy of the
current Ethiopian government doubts the appropriateness of copying and transplanting Western
development models to such countries like Ethiopia with a different tradition, history, socio-
economic and cultural set-up. As a result, one of the central elements of its ideology is putting
much emphasis on internally crafted development and industrialisation policies and strategies,
and providing rooms for government’s active involvement in the development process.
The developmental state model adopted by the Ethiopian government is said to be motivated by
the successes and experiences of the East Asian countries such as Japan, Korea, Taiwan and
Singapore. Taking this development path (with some elements of capitalism and socialism) also
seems to be adopted by other countries that were coming out of the command economic system.
For example, Bolesta (2007) notes that the process of post-socialist transformation in countries
such as Poland involved creation of neither capitalism nor socialism, but a system that combines
some elements of both. Based on the works of other scholars, Dadzie (2012: 18) has identified
some key attributes of a state that make it developmental: (1) A developmental state is
committed to and consistent in its pursuit of developmental objectives, (2) The developmental
state is an activist state, and should not take the role of an overseer, (3) A developmental state
needs to evolve as the needs of the society or citizen change, (4) A developmental state is well-
staffed, risk-taking, socially legitimate and democratic. According to Bolesta (2007: 105):
“A developmental state is often conceptually positioned between liberal open economy
model and a centrally planned model. The theory of developmental state isn’t capitalist
or socialist, and is based on combinations of positive advantages of the private business
and the positive role of the government.
In stressing the role of the government in the economy, Dadzie (2012) note that there is a
growing recognition among key institutions that the state is not an enemy to development but
rather a potential entrepreneur of last resort and an agent of positive social change. Dadzie thus
calls for the need to re-integrate and engage the state in the developmental process in SSA. In
line with this argument, Ikpe (2008, cited by Dadzie, 2012) asserted that the developmental state
thinking continues to be a powerful tool in effecting structural changes in the economies of
developing countries even in the era of globalisation. Particularly in the early stages of

37
economic development state intervention is indispensable to induce the requisite savings or
initial accumulation of capital for the industrial development process (Bresser-Pereira, 2009).
In discussing the applicability of Developmental State concept in SSA, Mkandawire (2001, cited
in Dadzie, 2012) highlighted the fact that during the 1960s, in fact SSA had states that were
developmental in their aspirations as well as in their economic performance. Citing some
practical experiences, Dadzie indicated that in fact the fastest rates of economic growth and
development were achieved in the period soon after independence where there was relatively
more state involvement. Concurring with other scholars, Dadzie (2012) suggests that SSA need
to draw on relevant lessons from the East Asian experience, because that region has been the
fastest growing region of the world in the last five decades. This assertion somehow justifies the
relevance of the experiences and development model chosen by the current Ethiopian
government. Bolesta (2007) suggests that once a country has reached a certain level of
development, there are possibilities to consider further liberalisation. Ikpe (2008, cited in Dadzie,
2012) in particular emphasises the importance of agricultural development in helping
developmental states in SSA to effectively implement their industrial policy and achieve
structural transformation. In this regard, the Agriculture Development Led Industrialisation
Strategy of the Ethiopian government is in agreement with such views.
Johnson (1999, cited by Bolesta, 2007) in discussing the relationship between the government
and private businesses under a developmental state model indicated that they become a partner
for the government in its developmental endeavours. But private business plays a more important
part which makes a developmental state more of capitalist in nature (Bolesta, 2007). Some (e.g.
Zewde, 2000) argue that though the pro-private sector policy of the Ethiopian government has
had its own merits, the privatisation process may not achieve its desired objective of liberating
and promoting the private enterprise unless the state guarantees free and fair competition. Based
on observations and some practical evidence, we can realistically conclude that if the non-state
actors (both the private sector and civil society) are accorded more space and role, the
development of Ethiopia could be further accelerated.

38
However, despite some challenges and limitations, the favourable policy directions of the current
government have led to rapid expansion of private undertakings in recent years. The economic
performance of the country has demonstrated remarkable growth rates over the past years. Even
international institutions such as IMF and the World Bank have commended Ethiopia’s economy
as one of the fastest growing economies in the world. In this regard, the role of extensive public
investments in infrastructures and social services, and the contribution of the public enterprises
can be clearly noticed. Nevertheless, some critics question the sources of this growth and
whether it has been translated into sustainable improvements in the wellbeing of the people. One
of the obvious limitations is that despite the impressive growth rates recorded in the national
economy, such changes have not been accompanied by transformation in the structure of the
economy. Though significant shift towards the service sector has been observed in recent years,
the country’s economy is still dominated by the agricultural sector, which largely relies on
smallholder producers and rain-fed production system. The desired growth in the industrial
sector could not be attained as planned. Some scholars (such as Butabaev, 2015) argue that the
quantitative increase of aggregate outputs is only part of the economic growth. Such quantitative
increases have to be accompanied by qualitative and structural changes in order to qualify to be
called an economic growth. They go on to comment that the fundamental feature of economic
growth is that such process involves shifts in the production and employment from agriculture to
manufacturing and then to the service sector. In this regard, Butabaev (2015) notes that the role
of the state is to focus on policies which initiate, facilitate and sustain change. Parallel to efforts
that aim at promoting large scale industries, there is a need to further strengthen incentive and
support mechanisms for expansion of small-scale manufacturing industries that provide the basis
for the industrialisation process and for attaining structural transformation. In this regard, the
endevours of the current Ethiopian government is commendable though it needs to be further
strengthened and continued with sound and strategic interventions.
2.3.1.1. Policies related to the Ethiopian agricultural sector and their effects
All the different regimes of Ethiopia have recognised the vital role the agricultural sector plays in
the country’s development endeavors. The orientation of the agriculture policies of the different
regimes are directly related to the political and economic systems they pursue. The agricultural

39
policy of the Imperial regime had a feudal and semi-capitalist orientation while the agricultural
policy of the Derg regime was absolutely of a socialist nature. During the Imperial regime,
commercial agriculture was primarily in the hands of private individuals and companies of both
domestic and foreign origin, while farmers were kept in smallholder agriculture, footed on a
feudal land tenure system (Chanyalew, 2006). The Derg’s policy on agriculture, in contrary,
emphasised expansion of collective and state-owned farms. Large-scale collective production
system was promoted as a remedy to problems related to fragmented and smaller farm sizes, as
well as as a mechanism to promote the socialist production system. As part of the drive to
promote collective farming, as Demeke (1999) notes, the government granted special incentives,
including reduced fertilizer costs, higher grain prices, lower land tax and interest free loans
(from service cooperatives) to producers’ cooperatives. On the other hand, the current EPRDF
Government has a mixed type, partly pseudo-capitalist and partly socialist, which is footed on
what is known as the revolutionary democracy (Chanyalew, 2006).
Land reform policy has remained to be a contentious issue under the different regimes of
Ethiopia. Many argue that the land tenure system of the different regimes of Ethiopia have had
serious influences on the performance of the agriculture sector. Adal (2002) notes that such
disagreement and heightened debates on land policies among politicians, academia and others is
not surprising given the agrarian nature of the economy and the role of land in the country’s
social and political arena. While the land tenure system that existed during the Imperial period
was mixed and varied across different regional locations of the country, many (e.g. Adal, 2002;
Gebreselassie, 2006) concur on the fact that the land policies under the recent two regimes seem
to exhibit some similarities. As Adal (2002) notes, the land tenure system that existed during the
Imperial regime of Ethiopia was one of the most complex tenure systems in the world. It took a
variety of classifications, which among others include6, rist/kinship, private, state, church, and
6 Based on the works of others, (Adal, 2002) has described the different tenure systems as follows: “Rist/kinship
tenure – was the most prevalent tenure in the northern part of the country and had two forms of land rights – rist
and gult. Rist is the right to claim a share of land based on kinship to a historical ancestor held in common with
other rist holders. Gult right was accorded to members of the ruling elite as a reward to loyal service and to
religious institutions as endowments. The individual or institution that held land as gult had the right to collect taxes
from those who tilled it. They also had judicial and administrative authority over those who lived on it. Gult right
does not extend to ownership of land but is limited only to taxes. Private tenure - This landholding system was the
most dominant pattern affecting over 60% of Ethiopia’s peasants, and was found in the southern and southwestern
parts of Ethiopia. The private tenure was created when the crown confiscated land conquered by its armies and
granted vast blocks to a wide range of people and institutions including soldiers, northern civil servants who were

40
others (Adal, 2002). In contrary, under the recent two regimes (Derg’s socialist regime and
EPRDF-led government), land has become a public property that is administered by the
government. During the Derg’s socialist regime, the 1975 drastic land reform provided tenants
with use rights to operate their lands, but without rights to sell, mortgage or exchange. The
change of government in 1991 has not resulted in much change in terms of land policy
(Gebreselassie, 2006). Even though the new government embarked on a free market economic
policy, it has decided to retain public ownership of all rural and urban lands. The present
Constitution of Ethiopia declared that ‘Land is a common property of the nations, nationalities
and peoples of Ethiopia and shall not be subject to sale or to other means of transfer/exchange’.
Those pro-state ownership (mainly the ruling party), as Adal (2002) notes, argue that private
ownership of land will lead to concentration of the same in the hands of few individuals or
companies (who have the capacity to purchase), eviction of the poor farmers, landlessness and
rural-urban migration of peasants who are left without any alternative means of livelihood.
Continuing on this line of argument, some (e.g. Fantu,1994; cited in Adal, 2002) comment that
given the country’s infant industrial base and limited opportunities for non-agricultural
undertakings, land is the only productive asset available to the majority of the rural population
and thus needs to be dealt with utmost care. On the other hand, critics of the current land policy
raise a number of concerns related to the tenure insecurity which has implications for efficiency
of land utilisation, commercialisation of production system, long-term investment and land
improvement incentives, among others. Gebreselassie (2006) notes that though the current
government has made efforts to address the issue of tenure insecurity through the provision of
land certificate, insecurity of tenure and its consequences still remain one of the critical land-
related problems in Ethiopia. He goes on to argue that given the absence of any contractual or
lease agreement with the government and the general belief that the next round of land
redistribution will take place any time, the incentive to invest in land improvement would remain
weak. In agreement with this view Adal (2002) points out that the poor performance of the
deployed to administer the new areas, peasants moving south because of land pressure in the north, local tribes that
did not resist the conquest, local village and clan chiefs, church officials and institutions, and other elites close to
the crown. Church tenure - The Ethiopian Orthodox Church used to be an important landholding entity during the
pre-revolution period, such church land had been largely obtained through grants from the crown. However,
aristocrats and provincial gentry had also transferred land to local institutions and officials. Government tenure -
These included arid range lands in the remote lowlands of eastern and southeastern Ethiopia that were occupied by
nomads, and those unoccupied arable lands distributed all over the country”.

41
Ethiopian agricultural sector is largely related to the land tenure system. The current researcher is
of the opinion that though the social, political and economic importance of tenure security is
beyond dispute, arguments against state-ownership of land and its consequences need to be
founded on empirical evidence.
As other agriculture related policies are concerned, soon after taking power in 1991, the current
government declared collectivisation and villagisation as undesirable policy directions. As stated
in the above section, the new government initiated various economic reform programmes in line
with the SAP measures of the Bretton Wood Institutions. These among other included removal
of substantial taxation of agriculture, market liberalisation and devaluation (Demeke, 1999).
Apparently, in many countries, including SSA, most of the measures taken under the SAP
package have encountered serious failure. Such limitations and its own developmental state
thinking made the current government to focus on internally crafted social and economic
development policies and strategies. Overall, the government adopted agricultural development-
led industrialisation as its economy-wide development strategy. ADLI and the successive five-
year plans of the government consider agriculture as a decisive sector that determines the pace of
growth of the other sectors such as industry. Despite a number of challenges, the agriculture
sector indeed displayed significant growth in recent years. As many (e.g. Chanyalew, 2015)
agree, agriculture has contributed to the recent years’ registered economy-wide as well as sector-
specific growth in terms of increased revenue and foreign exchange. However, as Yu et al (2008)
notes, the service sector has been the fastest growing sector since 1960/61, and its contribution to
total GDP growth has exceeded that of the agricultural sector since 1992.
2.3.1.2. Policies related to the Ethiopian coffee sector
In respect to the coffee sub-sector, as Ayana (1999) notes, during the seventeen years of
centralised economic management of the military government, coffee production suffered from
lack of appropriate incentive mechanisms for producers. During this period, coffee producers’
were receiving too low prices in general, and even in relation to the prices of cereals. This had
apparently depressed farmers’ appetite to adopt improved coffee technologies and management
practices. Furthermore, the prevailing policy was compelling farmers to sell fresh cherries to
service cooperatives (that operate wet mills) with some advance payment. Eventually farmers

42
were not receiving final payments from their cooperatives. As a result, there were several cases
where farmers had decided to uproot their coffee trees and replace with other crops (Ibid). On the
other hand, the economic liberalisation measures taken under the current EPRDF-led government
(1991 to date) have generated a number of incentives for farmers and other actors involved in the
production, processing and marketing of coffee. Some of these measures have notable positive
impacts in promoting the development of the coffee sub-sector and particularly its export
activities. Some of the earlier measures that have direct impacts on the performance of the coffee
sub-sector, as Ayana (1999) notes, include devaluation of the Birr, introduction of floor prices
for some export commodities (which has been removed at present), liberalisation of trade
licensing and introduction of investment incentives. In addition, unlike the situation under the
military government, farmers are no longer forced to sell their coffee solely to cooperatives on
loan and at low prices.
In particular, as Minten et al (2014: 2-4) point out, there have been significant policy reforms in
the recent decade that affected the structure and performance of the coffee export sector. In
addition, there have been a number of changes regarding the export taxes on coffee, which
include removal of entry barriers; the consolidation of all taxes and duties levied on coffee
export into a single tax family; and the waiving of all export taxes on coffee exports following
the 2002 international coffee crisis. In general, the government has been exercising tight control
and regulation on exports of certain key commodities and food crops such as coffee, cotton and
teff. Having keen interest in the coffee sector, the government also directly intervened in the
coffee sector through various measures. For instance, as Minten et al (2014) noted, the
government directly intervened in the coffee market a number of times in an effort to reduce
hoarding by exporters. This includes banning traders involved in such acts from exporting
coffee, as well as ceasing their coffee stocks. Furthermore, a policy was devised in 2011 to limit
the amount of coffee a particular exporter can keep in the warehouse at a given time.
In addition, the subsequent reforms undertaken by the current government have had substantial
impacts on institutions related to the coffee sub-sector. These include frequent restructuring of
the institutions dealing with coffee development and marketing, creation of structures and
regulations that support and promote farmers’ cooperatives, formation of cooperative unions,

43
creation of new marketing systems and infrastructure (which include creation of coops marketing
channel, primary coffee market centres and ECX trading system), emergence of several private
financial institutions and policies related to credit provisions. In particular, the frequent changes
in structures of institutions that support coffee development and marketing have had detrimental
effects on the development of the Ethiopian coffee sector. Looking only at the institutional
changes in the recent eleven years will suffice to see how coffee institutions experienced severe
instability and frequent changes just in about a decade. Dissolution of the Coffee and Tea
Authority (which was affiliated to the Ministry of Trade and Industry) in 2004 marks the end of a
full-fledged and dedicated institution to coffee development and marketing in the country.
Following the cessation of CTA’s existence as an autonomous coffee institution, the
responsibility to oversee coffee development and marketing activities was transferred to the
Ministry of Agriculture and Rural Development. As a result, two departments (namely: Coffee,
Tea and Spice Development Department and Coffee Tea, Spice and Cotton Marketing
Department) were created under the MoARD. To make the matters worse, following the major
reforms adopted by the MoARD in late 2007, the coffee departments were merged with others
and put under the Directorate of Agricultural Extension. This resulted in the absence of
specialised and dedicated institutional structure and personnel on coffee development and
marketing. The ministry gradually began to realise the consequences of lack of institutions
dealing with coffee and created sub-Directorates for Coffee, Tea and Spice Development and
Marketing in the MoA. The development wing was affiliated to the Agricultural Extension
Directorate while the marketing part was put under the Agricultural marketing wing. The later
was finally moved to the Ministry of Trade, which resulted in the complete separation of
institutions dealing with coffee development and marketing. In late 2014, the government went
on and promoted Coffee, Tea and Spice Development to a full-fledged Directorate level under
the MoA, and also created new departments dealing with its marketing aspect under the MoT.
In addition to the gaps and changes observed at national level, coffee institutions experienced
similar problems at regional levels, which are responsible for the implementation of day-to-day
activities. Such institutional instability and uncertainty obviously has had serious implications for
long-term investment, and strategic and sustainable approaches to the development of the coffee
sector. Eventually, understanding the challenges and gaps, the government has recently (in

44
November 2015) decided to reinstate an autonomous and dedicated institution for Coffee and
Tea Development and Marketing under the Ministry of Agriculture and Natural Resources7. This
move has been delightedly welcomed by the coffee sector actors and hoped to take the coffee
sector one step further.
2.3.1.3. Policies related to the financial sector
Role and functions of the financial institutions have taken different forms under the different
political and economic systems of Ethiopia. Understandably, the governments of the respective
regimes intervened in the allocation of financial resources in line with their development
policies, strategies and plans. According to Admassie et al. (2005), under the Imperial regime
interventions in the financial sector took various forms, which include: allocation of credit
according to coordinated investment plans, use of differential interest rates, establishment of
public commercial and specialised banks, and giving priority to productive projects. Bank credits
were directed (both to private and public undertakings) in line with the priorities set in the five-
year Development Plans. The Plans identified agriculture as the leading economic activity, and
mining, manufacturing and power as the most propulsive sectors (Ibid; Chanyalew, 2015). In
terms of investment credit, priority was accorded to ‘directly productive’ economic activities
(which claim over 90% of the total long-term credit), while short-term credit mainly targeted
undertakings that promote exports as well as contribute to production. According to Admassie et
al (2005), there was also interest rate discrimination between borrowers by favoring businesses
or enterprises that are in conformity with the Development Plan. However, credit supply was not
discriminating borrowers by nature of ownership as the plan recognises both private and public
sectors as equally important entities. The fact that the plan allows the agriculture sector to
receive about half of the bank’s credit demonstrates the importance it attached to this sector.
Credit for farm tools and implements had been extended to farmers by the then Development
Bank of Ethiopia (DBE) through the Grain Corporation or Farmers Cooperatives. These
institutions normally receive credit, procure farm implements and supply to farmers on credit (to
be repaid in kind) or lease or sell them on credit if they are expensive (Admassie et al, 2005).
7 The new institution is called Coffee and Tea Development and Marketing Authority

45
Evidence shows that the DBE quitted extending such credit service in 1961 mainly due to
problems related to loan recovery, which was not of course unique to small farmers’ credit. Poor
results were recorded with the DBE’s credit to large scale agriculture and cooperatives (Ibid). Its
successor, the Agricultural and Industrial Development Bank (AIDB) aimed, among others, at
mobilising funds and extending medium- and long-term agricultural credit. However, evidence
suggests that it did not perform better in terms of reaching out to farmers. Its credit policy
discriminated against farmers located far away from the main road; required collateral (asset to
be insured at borrowers’ expense) and/or personal guarantor, and compelled borrowers to sell
their produce to its subsidiary agency at fixed prices as a means of enforcing repayment.
According to Admassie et al. (2005), the bulk of AIDB’s agriculture credit was channeled to
dairy development projects, large farmers, cooperatives of commercial farmers and not to
peasant farmers.
The Derg’s socialist regime was an entirely controlled system that made all economic
undertakings to be carried out based on the directives coming from the central planning body.
Under the socialist regime, like all other economic sectors, financial institutions were basically
expected to execute the economic plans outlined by the national planning organ. To this effect,
all privately-owned financial institutions (banks and insurance companies) were nationalised in
1975 and reorganised in accordance with the country’s socialist ideology and its economic policy
(Geda, 1999; 2000; Chanyalew, 2015). This resulted in the formation of one commercial bank
(the Commercial Bank of Ethiopia), one National Bank, two specialised banks (the Agricultural
and Industrial Bank, and Housing and Saving Bank) as well as one insurance company. During
this period, the NBE was directly controlling all financial institutions by fixing deposit and
lending interest rates, through foreign exchange and credit allocation (in favour of the public
sector), and by directly financing government deficit (Geda, 1999).
Credit policies of the financial institutions were used as one means of strengthening and
expanding the socialised sectors. In terms of credit and foreign exchange allocations, the
socialised sectors (mainly public enterprises, state farms and cooperatives) were accorded
priority, while the private sector was hugely marginalised. As a result, the largest share of the
banks’ resources was directed to the socialised sector, whereby for example about 68% of

46
ADB’s loan fund was allocated to state farms (Geda, 1999). In addition, state farms and
cooperatives were not required to provide collateral to access loans. Moreover, the lending
interest rate was discriminatory against the private sector, favoring cooperatives and state owned
sectors (Wale, 2000). For instance, the private sector was charged an interest rate of 7% on loan
for agricultural undertakings while cooperatives and the public sector were required to pay 5%
and 6%, respectively (Ibid). The Agricultural and Industrial Development Bank was re-
established in 1979 with the aim to avail investment funds to the agricultural and industrial
sectors. Thus the bank’s main clients were cooperatives, state farms and other state enterprises
(Wolday, 2008b). As a result, close to 90% of AIDB’s agricultural loans were extended to state
farms while the rest went to agricultural cooperatives, while the private peasant sector received a
negligible share (Admassie et al, 2005). As Demeke (1999) comments, though public investment
and institutional credit in agriculture under the Derg regime were directed towards the expansion
of collective and state farms, disappointingly their total contribution to the agricultural output
rarely exceeded six percent. This apparently had serious implications both for the performance of
the financial institutions and the private sector undertakings.
The departure from the socialist system and adoption of the new policy in 1991 (market-led
economic system) resulted in greater changes in the organisation of the financial sector and its
operations. In early 1990s, as part of the SAP packages, Ethiopia has embarked upon various
financial sector liberalisation efforts. This, among others, necessitated reorganisation of the state
financial institutions to function in a market oriented policy framework. In addition, the new
financial sector Proclamation No. 84/1994 allows the private sector to engage in the banking and
insurance businesses (Geda, 1999). In fact following issuance of this proclamation the country
has witnessed massive proliferation of private financial institutions. Moreover, they are also
allowed to serve the private sector, which was previously marginalised by the policies of the
socialist government. In line with this, the role of the country’s Central Bank (known as the
National Bank of Ethiopia) had to be reformulated. However, as many (e.g. Wolday, 2008b;
Geda, 1999) note, the government decided to assume a cautious approach towards liberalisation
and in reforming the financial sector. Geda (1999) states that the current government adopted a
strategy of gradualism (gradual opening up of private banks and insurance companies, etc.) and
strengthening domestic competitive capacity before effecting full-fledged liberalisation;

47
restricting the sector to domestic investors, strengthening the regulatory and supervisory capacity
of the National Bank. In support of such policies, some (e.g. Dadzie, 2012) are of the opinion
that a policy of gradual trade and financial sector liberalisation might be appropriate for countries
coming out of the socialist economies, rather than a sudden shift from a closed economic system
to full-fledged economic liberalisation. Despite some drawbacks, the policy directions of the
current Ethiopian government in terms of the financial sector development indeed appear to yield
substantial positive changes. The country has witnessed expansion of private undertakings
including financial markets, and notable economic growth.
Nevertheless, heavy government intervention in the financial sector and tighter regulatory
frameworks appear to have some detrimental effects on the activities and performance of the
private financial institutions. Above all, it has severely influenced the lending capacity and
appetite of private financial institutions, particularly towards rural-based smallholder farmers and
their cooperatives. In addition, the policy banks are required to focus on government priority
areas such as government development projects and selected private investment activities such as
commercial farms, manufacturing and export sectors. In general, such interventions in the
financial market are not as such intended to address market failures. They rather seem to stem
from the developmental state thoughts of the government which believes that deliberate and
direct intervention is needed to mobilise and direct financial resources to realise the desired
development of the country.
Various studies document that small-scale farmers are still facing a number of problems that
hamper the drive to transform from subsistence to market-oriented and modern production
practices. Absence of a financial service that caters for smallholders’ credit need is often cited as
one of the major constraints. As Chanyalew (2015) comments, a complete neglect of the main
engine of the agriculture-led industrialisation transformation process is prevalent in Ethiopia. He
goes on to note that most of the benefits gained from the growth of the agriculture sector have
been diverted to the service, industry, energy and telecommunications sectors. Wale (2000),
based on earlier information obtained from Birritu (1999), reports that agriculture on average
received only 3.04% of the loans disbursed by the commercial banks during the period 1991 to
1997. In contrary, the average shares for trade, construction, manufacturing and other sectors

48
during this period were 63.8%, 14.38%, 13.91% and 4.84%, respectively. Similarly, based on
CAADP study (2009), Chanyalew (2015) reported that Ethiopia’s agriculture sector receives less
than 2% of the capital goods imported as of late 2000s. Thus as Chanyalew notes, the agriculture
sector has been deprived the desired modernisation and continued to be exploited to generate
revenues from labour- and land-intensive production undertakings to make the service and
industry sectors grow. The other severe problem is that, as Wale (2000) comments, most of the
formal credit for the rural community in Ethiopia is time biased, mainly being short-term, and for
fertiliser loans, while credit for medium- and long-term investments is lacking. He further notes
that credit provision is often biased in favour of large and medium-sized enterprises, public
enterprises and urban dwellers, but against small scale farmers and other small entrepreneurs. In
this regard, Chanyalew (2015: 145) strongly comments as follows: “What have we done for the
agriculture sector to make it grow rather than exploiting it for the growth of the service and
manufacturing sector? The sector has not received adequate support in terms of access to
capital”. Chanyalew goes on to urge the government that it is high time to give due attention to
the capital requirement of agriculture if the desired modernisation and commercialisation have to
be achieved. This, according to him, requires appropriate national agricultural finance system,
which is currently lacking.
In terms of credit to the coffee sub-sector, Ayana (1999) points out that until the emergence of
private banks in recent years, the Development Bank of Ethiopia and the Commercial Bank of
Ethiopia were the only institutions engaged in the financing of coffee processing and marketing.
DBE usually financed the investment components, while the CBE concentrated on the short-term
working capital components (Ayana, 1999). However, the roles of these two financial
institutions in providing finance to the coffee development and processing activities appear to
diminish in recent years. As highlighted above, they tend to focus on some priority government
development projects and large investment projects and selected enterprises. Among the
commercial banks, Cooperative Bank of Oromia appears to be the major financier of particularly
farmer cooperatives’ activities, especially in the Oromia region. However, being a cooperative
bank, CBO does not cater for the credit needs of individual farmers. Moreover, loans of CBO
almost solely focus on the marketing component of the coffee value chain.

49
2.3.2. Credit Guarantee Schemes under the Ethiopian context
As will be discussed at length in the next chapter, the emergence of credit guarantee programmes
dates back to the 19th
century, when the first generation of guarantee schemes was established in
some countries of Europe. Such schemes were later expanded to Asia, North America and Latin
American countries. But credit guarantee programmes have short history among African
countries. In particular, as many (e.g. Saldana, 2000; Geda, 1999) noted, liberalisation of the
financial sector in the 1990s (as part of the reform packages of SAP) removed government’s
intervention through direct and targeted lending to certain sectors. As a result, Governments and
donor backed partial credit guarantees have become popular intervention mechanisms in
developing countries in recent decades. Mango and Meyer (1998; cited by Saldana, 2000),
reported that government’s intervention through a credit guarantee complements liberalisation of
the financial sector. Various studies tend to claim that unlike other financial interventions, credit
guarantees cause little distortion to the credit market as the guaranteed lending activities are
more consistent with the banks’ normal lending procedures and practices.
The early generation of credit guarantee schemes largely operated under a free-market economic
system and strived to address problems of market imperfections. They were particularly devised
to mitigate challenges related to loan security and information asymmetry that were acting as a
major barrier to small entrepreneurs in accessing formal credit. After coming out of the socialist
system and following adoption of the free market economic policy in early 1990s, such
intervention in the financial market has started to emerge in Ethiopia. Credit guarantee
programmes have become relatively popular over the past decade, especially as one of the
preferred mechanisms to back SMEs’ business and overall development. Such intervention
however tends to largely focus on urban-based SMEs and on creating employment opportunities
for the youth. Under the government-backed CGSs that are related to the SME strategy in
Ethiopia the government provides 70% guarantee, while borrowers (SMEs) are expected to
provide 20% equity. The remaining 10% risk is absorbed by the lending MFIs. Nevertheless, as
officials of some MFIs noted, implementation of such a guarantee scheme revealed limited
performance and success. Limitations in the capacity of the beneficiary SMEs in terms of
running viable business, in providing the 20% equity, and in making effective use of loan fund
and repaying the guaranteed loans seem to be among the major challenges. In addition, there

50
have been some donor-supported loan guarantee initiatives that were involving commercial
banks and MFIs in Ethiopia. According to some sources, the loan recovery rate of some of those
initiatives was disappointing. This could stem from the tendency to view such external supports
as aids to be donated to the target group. It is thus critical to carry out adequate awareness raising
and capacity building intervention before such loans are provided.
The Ethiopian context seems to be different from that of the countries where such credit
guarantee programmes had originally emerged. Because in Ethiopia such initiatives are expected
to operate under the economy and firms coming out of a strictly centrally controlled command
economic system. And of course their implementation takes place in an economic/market system
that experiences heavy government intervention. Because the EPRDF-led Government’s
developmental state ideology permits deliberate government intervention in the economy
including in the financial sector. In other words, such state intervention and tight monetary and
regulatory environment would obviously influence the operations of the credit market. Thus
under such financial system and policy/regulatory environment lack of collateral might not be
the major or sole limiting factor to farmers and other small entrepreneurs in accessing
institutional credit. As a response to such constraints and challenges, financial institutions may
tend to restrict their lending activities or decide to make selective lending whereby the borrowers
targeted by the current guarantee scheme might be of less interest to the lending banks. Such
circumstances would inevitably create challenges that may affect the effectiveness of such a tool
unless it is backed by other attractive incentive and support packages for the participating banks.
2.3.2.1. Credit Guarantee Schemes and Farmer Cooperatives in the context of Ethiopia
The economic policies and government interventions in the financial sector during the socialist
system in Ethiopia and elsewhere focused on promoting the socialised sectors (collectives, state
and public enterprises). As discussed in the preceding sections, cooperatives were among the
priority sectors for credit allocation, and were receiving targeted, subsidised and often
uncollectable credit. Even cooperatives with weak management, poor governance and technical
capacity and unbankable business activities were allowed to receive loans. Such practices
resulted in the culture of dependence, widespread defaults and resource misappropriation by self-
serving managers or committee members. This poor credit repayment culture has continued to

51
affect cooperatives’ credit worthiness and banks’ confidence in the cooperative societies even
today. Based on previous experiences, Wolday (2008a; 2009a) warn that credit to cooperatives
should not erode the repayment culture of rural households, which has been the case during the
Derg’s socialist regime.
The reform initiatives launched in the 1990s resulted in removal of subsidies, cheap and targeted
loans, and deregulation of the financial and agricultural output markets, leaving cooperatives to
operate on their own in the free market environment. In order to qualify for loans, like other
private enterprises, they are expected to meet various bank lending requirements. However,
farmers’ cooperatives have struggled in accessing credit because of their weak institutional
capacity, lack of assets of good quality and value (to provide collateral), information asymmetry,
and lack of good credit track records. Hence credit guarantee can help to address some of these
constraints and improve cooperatives’ access to institutional credit. Nevertheless, the challenge
of a credit guarantee scheme targeting farmers’ cooperatives in countries like Ethiopia is not
limited to facilitating better access to bank loans. One of the key issues that need to be critically
looked into is how to reconcile the experiences and practices of cooperatives that have their roots
in the Marxist system and credit guarantees which trace their foundations in the liberal and neo-
liberal economic thinking. It is thus essential to sufficiently address previous shortcomings, bad
credit culture, mind-set up and notion of dependence and adequately capacitate the cooperative
societies to operate with the spirit of competitiveness under the free market economy. Therefore,
credit guarantee programmes targeting cooperatives with such unpleasant experiences and credit
history need to devise strategies that would enable them address such longstanding tradition and
practices. Assefa (2005) arguably claims that progresses made in Ethiopia demonstrate that the
negative attitude towards cooperatives can be reversed and cooperatives designed under socialist
ideologies can be successfully rehabilitated and revitalised as market-oriented private business
organisation. More importantly, cooperatives need to clearly understand that credit is a
commodity that should be acquired to undertake sound and profitable businesses and is
eventually repaid as per the contractual agreement. In addition, stated in the preceding section,
government’s intervention in the financial sector and cooperatives’ affairs would inevitably
affect their access to guaranteed loans and its effective utilisation as other important constraining
factors may come into play.

52
2.4. Farmers’ Cooperatives: An indispensable rural institution
The role of vibrant grass-root peoples’ organisations in promoting inclusive and sustainable
social and economic development is beyond dispute. Farmer cooperative is one of such
fundamental local institutions. This section provides literature review and theoretical discussions
on farmer cooperatives, with special emphasis to the context of Africa and Ethiopia.
2.4.1. Overview of concepts, evolution and significance of farmer cooperatives
Today cooperatives assume a central position in the development strategies and programmes of
many countries. Their crucial role in fostering self-reliance and empowerment among the poor
and in supporting overall socio-economic development has gained prominence. The International
Cooperative Alliance (ICA, 1995) defines a cooperative as ‘‘an autonomous association of
persons united voluntarily to meet their common economic, social and cultural needs and
aspirations through a jointly owned and democratically controlled enterprise’’. This definition
emphasises that a cooperative is a voluntary business enterprise that is initiated, owned and
controlled by its members and not by the state. As Schwettmann (1997) notes, one of the features
of cooperatives is that members make equitable contributions to the capital and receive a fair
share of the risks and benefits. The larger share of the surplus income is distributed to members
in the form of dividend, while certain part of this surplus is kept as a reserve fund and/or can be
used to address some social needs of its members and the community. One of the features that
distinguish cooperatives from investor-oriented firms, as Ortmann and King (2007) note, is that
in cooperatives dividends are given out to members on the basis of their use or patronage of
cooperatives and not on the basis of their investment or ownership share.
Another peculiar feature of cooperatives is that they are based on some unique values and
encompass certain fundamental principles. Dobrohoczki (2006: 136) notes that cooperative
principles combine a community sentiment with a business venture. The seven popular principles
are: open and voluntary membership, democratic member control in the form of one member one
vote, economic participation from limited return on investment, autonomy and independence to
ensure democratic control, cooperation among cooperatives, cooperative education, and a
concern for the community. Behind these principles are values such as self-help, equity, social

53
responsibility, democracy, equality among members and solidarity (ILO, 2003; Dobrohoczki,
2006). In general, their peculiar governance structure and basic principles distinguish
cooperative societies from privately owned business firms. They differ from other shareholding
firms by their democratic nature, with voting rights being assigned by person rather than by size
of shareholding (ILO, 2003: 3). Though cooperatives are not primarily motivated by profit, they
are not purely welfare-driven non-governmental aid organisation. As Develtere and Pollet (2008:
41) noted, to qualify to be a cooperative, the organisation has to be operated as an economic or
business enterprise and realise its objectives through economic transactions, of course without
undermining economic fairness.
Cooperatives generate diverse benefits to its members and the community at large. Apart from
their economic benefits, cooperatives have greater social values. Cooperatives help in mobilising
and distributing financial resources; in identifying business opportunities for the poor; in
empowering them to defend their interests; and in providing security by changing individual
risks into collective ones (Wanyama et al, 2008). Based on a UN report, Mcloughlin (2011:4)
further outlines a number of benefits including their role in promoting entrepreneurial
development, providing employment opportunity, raising incomes and helping to reduce poverty,
enhancing social inclusion, social protection and community-building. Another critical benefit of
cooperatives, as Dobrohoczki (2006: 135) notes, is their role in democratising the market system,
thereby helping to overcome the undesirable effects of globalisation. This is due to the fact that
cooperative businesses are often undertaken in line with community concerns and social ethics,
as they are member controlled and owned organisations. Dobrohoczki goes on to comment that
“as they embed social and community concerns and re-inject the surplus back into the
community, cooperatives can serve as effective mechanism for the counter-cultural backlash
against large profit driven multinational companies”.
Based on ICA (2005) data, Dobrohoczki (2006) reported that cooperatives have over one billion
members across the globe and employ 20% more people than large multinational corporations
across a range of sectors. According to Wanyama et al (2008), cooperatives create employment
opportunities in three ways: (1) Through direct wage employment of people who work in
different levels of cooperatives and cooperative promoting institutions. (2) By providing self-

54
employment to cooperative members via their business activities. (3) Indirectly through the
spillover effects of their activities on non-members. Emana (2009) and Pollet (2009) reported
that cooperatives provide about 82,000 and 115,079 direct8 and indirect employments to people
in Ethiopia, respectively. This sector generates employment for about 0.24% of the total
population of Ethiopia while this is as high as 5.5% in Kenya (Pollet, 2009). Nevertheless, some
evidence (e.g. Pollet, 2009) indicates that in many African countries, including Ethiopia,
cooperatives performed poorly in terms of advocacy and voicing members’ interests. In general,
Barton (2000; quoted by Ortmann and King (2007a) noted that although cooperatives are
common in many parts of the world, their most extensive and successful use during the last
century has been in North America and Europe. However, as discussed below, some vibrant
cooperatives have started to emerge in some African countries in recent years.
2.4.2. Cooperatives’ role in catalysing agricultural development
Many agree that cooperatives play an important role in providing various services that enhance
agricultural productivity and production and returns from this sector. Okwoche et al. (2010: 125)
note that cooperatives are effective avenues for provision of such services as farm inputs,
agricultural credit, extension and education, marketing of members’ produce and so forth. They
go on to point out that consistent and effective performance of these roles will accelerate the
transformation of agriculture and economic development. In the fragmented smallholder
agriculture, cooperatives play a decisive role in generating economies of scale, in improving
bargaining power and in fostering their market integration. An empirical study conducted in Iran
(Motamed, 2010: 1592) found significant differences between members and non-members of
cooperatives with respect to the production rate of paddy, technical knowledge, income,
reduction of unemployment and increase in annual income. Emana (2009) observed that
cooperatives have been assuming an increasing role in agro-processing, marketing and finance in
Ethiopia. Moreover, cooperatives can serve as an important avenue for smallholders to get access
to certification programmes and other premium markets, such as fair-trade schemes.
8 The direct employment includes people employed by cooperative movement institutions such as federation,
colleges, and government institutions in charge of cooperatives, and primary cooperatives.

55
2.4.3. Cooperatives movement in Africa: Evolution, features and prospects
In general, cooperative models in Africa are largely imported ones (Develtere, 2008). Various
sources (e.g. Schwettmann, 2011) indicate that the introduction of modern cooperatives in the
majority of African countries was orchestrated by colonial powers, who tried to transfer their
own cooperative systems into their colonies and protectorates. According to Schwettmann
(1997:4), in the former British colonies, cooperatives were established in the 1930s, while the
French colonial power introduced a parastatal institution called ‘‘Societes Indigenes de
Prevoyance’’ in the early 1920s. As a result, cooperatives were often viewed among the local
communities as alien institutions imposed by external forces. In fact, many (e.g. Wanyama,
2012; Getnet and Anullo, 2012) agree that the colonial states promoted cooperatives for the sake
of achieving their own interests, rather than addressing economic and social problems of the
communities in the colonised countries. The primary essence of setting up cooperatives was to
facilitate production, marketing and exports of commodities for industries and markets in the
colonial states of Europe. For example, Ortmann and King (2007a;b) contend that though
agricultural cooperatives have played an important role in the development of the commercial
agriculture sector in South Africa, small-scale farmers in the former (less-developed) homelands
did not have access to these cooperatives and their services under the previous (apartheid)
government policies.
Unlike the other African countries, Ethiopia, Egypt, Liberia and Sierra Leone are said to have
their own home-bred cooperative development experience with local adaptations of imported
concepts (Schwettmann, 2011; Develtere, 2008). Among many of the former socialist African
countries such as Ethiopia and Tanzania, cooperative development was considered as a strategy
to promote the idea of socialism, collective ownership of production factors and to maintain
control over the production and marketing of farm produce (Schwettmann, 1997 and 2011).
Cooperatives established with such intention thus largely violated the basic principles of
cooperative societies, such as voluntary membership. Though these policies resulted in massive
expansion in the number of cooperatives, they encountered widespread failure and discredited
cooperative institutions in several African countries (Schwettmann, 2011: 2).

56
Develtere (2008: 13) notes that after independence cooperatives remained high on the political
agenda in most African countries. However, the cooperative system and approaches in promoting
cooperatives did not witness much change after the independence. Most African countries
continued with the colonial framework that allows the state to intervene in cooperatives affairs,
and dictate their development (Wanyama, 2012: 6). Unfortunately, in most Africa countries,
including Ethiopia, cooperatives were largely used as a tool to carry out various development
and political functions on behalf of the state, and were not given a chance to operate as
autonomous, member-initiated and member-controlled organisations. Develtere and Pollet (2008:
38) comment that cooperatives tended to function as semi-public and bureaucratic enterprises
rather than genuine, voluntary and private businesses. In some countries, governments even
switched from the incentive-oriented policy on cooperative development to employing coercive
measures (Wanyama, 2012: 6). In general, the colonial and post-colonial experiences left a
tainted perception of cooperatives about the way they are initiated, operated and the mode of
interaction with external actors such as governments and the donor agency (ILO, 2008). Based
on the works of several scholars, Kodama (2007) noted that evaluation of the performance of the
rural cooperatives in Africa, particularly those under the socialist system, was generally negative.
Evidence shows that the economic reforms and market liberalisation measures that were
implemented as part of the structural adjustment programme (SAP) had substantial influence on
cooperatives development in Africa. As ILO (2008) notes, liberalisation of the economy in the
early 1990s was expected to give members the chance to become the real owners of their
cooperative business and advance its performance. However, as Schwettmann (1997: 14)
observed the impact of SAP was negative in the immediate perspective, though it favored
cooperative development in the long-run. SAP induced policy reforms forced the governments to
pull out leaving the cooperatives to the forces of the market (Develtere and Pollet, 2008;
Schwettmann, 1997; Bernard et al, 2010). Government agencies that promote and support
cooperatives development were also downsised, which as Develtere and Pollet (2008) noted,
resulted in a sharp decline in the number and turnover of cooperatives. Financial and material
supports rendered to cooperatives such as subsidised and targeted cheap loans were removed in
most African countries. Schwettmann (2011: 2) notes that sudden disappearance of thousands of
inefficient, over-protected and politicised cooperatives following the SAP measures temporarily

57
created a vacuum that neither the emerging informal and self-help organisations nor the private
sector were able to fill.
Despite some initial pause particularly in the early 1990s, the cooperative movement in Africa
has gained momentum owing to the prevailing favourable conditions in recent decades.
Schwettmann (1997) observes that many African governments have embarked on economic,
political and cooperative reform programmes which somehow provided the basis for a genuine
cooperative movement. Today evidence points to the successes of rural producers’ organisations
in the region, particularly in agricultural commodity marketing, whereby a typical example
includes coffee in Ethiopia (Bernard et al, 2010: 6). Evidence (e.g. Develtere and Pollet, 2008;
Pollet, 2009) generally shows that today there is a rising trend in the number of cooperatives in
Africa due to a more proactive attitude and support by governments. In this regard, Rwanda and
Ethiopia are often cited as typical examples where government and external supports have
played notable role in promoting the development of the cooperative sector.
Research undertaken by ILO in 2006 and 2007 reports that out of 100 Africans, seven people are
members of a formal cooperative, which would mean that the continent has 70 million co-ops
members (Develtere and Pollet, 2008; Schwettmann, 2011). A study by Pollet (2009) in nine
countries in Africa, including Ethiopia, indicated that the two main types of cooperatives are
agricultural (including multipurpose and marketing cooperatives) and saving and credit
cooperatives. The former constitutes 40 - 60% of all cooperatives, while the later accounts for 30
- 50%. Some (e.g. Pollet, 2009; Mcloughlin, 2011), however, note that if the renaissance of
cooperatives in Africa and elsewhere is to be fully realised and sustained, there is a need for a
more favourable policy and institutional environment, greater visibility, a stronger voice, further
diversification, improved management and governance, access to credit, more autonomy, a
market-driven approach, strong horizontal networks and vertical structures and integration.
Though excessive government intervention and control has been seen as a main problem in the
cooperatives development in Africa, there is a consensus on the importance of government
support and some facilitative intervention. As Dobrohoczki (2006: 145) notes, cooperative
development flourishes best when government actively promotes, facilitates and provides

58
favourable conditions, but does not control or dictate their formation and operations. Muthuma
(2012) based on the experience of Kenyan cooperatives argues that paternalistic policies stunt
the development of cooperatives while laissez-faire policies tend to neglect them. But facilitative
policies and support would promote the development of cooperative sector.
2.4.4. Cooperative movement in Ethiopia: Evolution and current state
In general, the emergence of modern types of cooperative in Ethiopia happened after the
majority of African countries (Emana, 2009). The first legislation for agricultural cooperatives
(No 44/1960)9 was promulgated in 1960 (Bernard et al, 2010; Benson, 2013). Since then
different cooperative laws have been formulated and implemented in an attempt to promote and
regulate these institutions in line with the prevailing ideologies and economic systems of the
respective regimes. These legislations include: Directive No 44/1960; Proclamations No.
241/1966; 138/1978; 85/1994; 147/1998 and its amendment act No. 402/2004 (Emana, 2009).
Institutions have been part of the political and economic processes of Ethiopia and have
experienced frequent changes in the way they are promoted and used by the different
governments. For instance, as Zewde (2000) notes, during the Derg regime, all institutions
inherited from the Imperial regime were looked at critically at least or with downright hostility at
worse. The new regimes tended to focus on creating new rural institutions by getting rid of those
which had their footings in the former regime. Nevertheless, the governments of the different
regimes of Ethiopia, regardless of their ideology, motives and approaches to establish them, put
emphasis on cooperatives as important grass-roots institutions that foster the social and economic
development of the community.
2.4.4.1. Cooperative movement during the Imperial and Derg (Socialist) regimes
Evidence shows that the issuance of the first decree on cooperatives (No. 44 of 1960), which is
known as ‘‘Farm Workers Cooperatives Decree’’ marks the beginning of the formal agricultural
cooperatives in Ethiopia. In 1966, this legislation was replaced by Cooperative Society
Proclamation No. 241/1966. During the Imperial era, cooperatives were primarily created to
9 In fact records (e.g. Chanyalew, 2015) show that there was a proclamation (No. 241/58) during the Haile Selassie
regime that was used to promote and regulate SACCOs.

59
support the production of high-value export/industrial crops, such as coffee, sesame and spices
(Lemma 2008; Emana, 2009), and members of cooperatives were farmers with large
landholdings, mainly producers of these crops. Some SACCOs were also formed during the
Imperial regime by employees of some of the prominent public institutions such as the Ethiopian
Airlines and Ethiopian Roads Authority. Various sources show that in the 1960s and 1970s, a
few cooperatives were operating in the country. Evidence (e.g. Lemma, 2008; Emana, 2009)
suggests that by the end of the Imperial regime in 1974, there were only 149 cooperatives in the
country. These include 94 multipurpose, 19 SACCOs, 19 consumer and 17 handicraft
cooperatives. A number of problems obstructed the development and performance of
cooperatives during this regime. In particular, as Getnet and Anullo (2012) noted, land tenure
system of the regime; shortage of trained manpower, weak marketing infrastructure, shortage of
credit service and other institutional supports were identified as bottlenecks to the expansion of
the cooperative movement during the Imperial period.
After the 1974 revolution cooperatives became the most preferred forms of institution for rural
development in Ethiopia (Adal, 2000). The introduction of a socialist system with a central
command economic policy led to a drastic change in the way cooperatives were promoted,
regulated and used. As Adal (2000) notes, after embarking on the policy of socialist
transformation of agriculture, the military government had aggressively promoted formation of
cooperatives, hoping that collective farming is one means of achieving that. The government
enacted proclamation No 71/1975 to nationalise all lands, which paved the way for the
establishment of peasant associations, service cooperatives and agricultural producer
cooperatives. The Socialist government later on issued a new proclamation on cooperatives (No.
138/1978) with the intention of including promotion of other types of cooperatives, of course on
the basis of Marxist principles and political ideology of the regime. This proclamation imposes
compulsory membership to cooperatives, which violates one of the basic principles of
cooperatives – voluntary membership.
There were two types of cooperatives in rural Ethiopia during the Derg regime: namely, service
cooperatives and producers’ cooperatives. The former was basically purchasing and marketing
cooperative that was vested with the responsibility of farm inputs supply, provision of credit

60
services, supply of consumer goods, and marketing members’ produce. They were also given the
responsibility of promoting socialist philosophy and collective operations to enhance the political
consciousness of the peasants and to establish Agricultural Producers’ Cooperatives (Adal,
2000). These were just collective production units whose members were put together merely
because of the wishes of the socialist government. Many point out that the ultimate goal of the
Derg government was to establish collective farms, rather than genuine cooperative societies. As
Adal (2000) notes, this was expected to be achieved step by step by gradually shifting from
service cooperatives to agricultural producers cooperatives, and then to collectives. However,
producers’ cooperatives were ultimately found to be one-third less productive than individual
farms (Kodama, 2007; Bernard et al, 2010). There was obvious lack of trust, commitment,
incentives and innovativeness among the members of the producers’ cooperatives that were
critical for boosting productivity. The membership rate was also low, remained around 20% in
1988 and 1989, while that of service cooperatives was as high as about 80% (Kodama, 2007).
Some sources (e.g. Chanyalew, 2015) indicate that the number of primary cooperatives was
10,524 by the end of the military regime.
During the Derg regime, cooperatives were promoted to be used in implementing Government
policies and plans, which were not popular among the community. These among others include
collective ownership of properties, putting means of production under the control of
cooperatives, collection of grain quotas and compulsory contributions, and building up a socialist
economy (Getnet and Anullo, 201; Emana, 2009; Adal, 2000). Cooperatives and their members
were required to operate in line with the principle of socialist collectivisation where both
production and marketing of produce were conducted collectively (Lemma, 2008). To make the
matter worse, cooperatives were used as an avenue to recruit militia and to mobilise resources for
the civil war. Board members employed various coercive measures to collect grains and other
farm products from members at fixed prices to meet the quota imposed by the government
(Tesfaye, 2005; USAID, 2005). Cooperative leaders, which were appointed by the political
leaders, were closely associated with the regime, and served as mere conduits of directives from
government officials (Tesfaye, 2005). Nepotism, embezzlement and misappropriation of
resources of cooperatives were rampant (Tesfaye, 2005; USAID, 2005). The principal agent

61
problem10
in a cooperative, as Ortmann and King (2007a) note, are likely to result in member
dissatisfaction and lack of confidence. Eventually all agricultural producers’ cooperatives were
dissolved when the government switched from its socialist policy to that of a mixed economy in
1990. With the end of the military regime in 1991, most of the rural-based service cooperatives
were destroyed, looted and neglected (Adal, 2000; Emana, 2009). As Chanyalew (2015) notes,
the cooperative movement was almost vanishing towards the end of the Derg regime, and about
99% of them were dissolved when the regime was overthrown. In general, unfortunately, policies
of the military regime had far-reaching consequences for institutional development and human
capital in Ethiopia.
2.4.4.2. Cooperative development after 1991: Status, performance and prospects
The approach towards cooperative promotion in Ethiopia has been changed since early 1990s
with the adoption of the free market economic policy. During the initial transition period of the
current government, some vacuum was observed in the cooperative movement. Most of the
efforts of the new government initially focused on maintaining peace and stability and setting up
necessary institutions and administrative structures. Moreover, as Chanyalew (2015) notes the
EPRDF Government’s pause for a while was also partly in response to the bad reputation and the
dislikes the rural communities have shown towards the cooperatives initiated during the Derg
regime. However, the new government recognised the key role cooperatives could play in the
socio-economic development of the country, and gradually demonstrated positive moves towards
reviving and promoting them. In general, the emergence of new economic reforms and market
liberalisation policies created a favourable environment for the development of the cooperative
sector. In particular, as Chanyalew (2015) notes, agricultural cooperatives gained greater
attention after the issuance of the leading sector-wide policy and strategy document in 2001. It
was stated in the Rural Development Policy and Strategy and the successive five-year
development plan documents of Ethiopia that cooperatives of various types are vital instruments
in solving the problems of marketing (of inputs and outputs), provision of credit, income
generation and so forth.
10
In agency theory in relation to a cooperative structure this problem arises as employed agents or managers may not
act in the best interests of the cooperative members (Ortmann and King, 2007a).

62
In 1994 the Agricultural Cooperative Society Proclamation (No. 85/94) was promulgated,
embedding the basic cooperative principles. This created a fertile ground for reorganising,
strengthening as well as for establishing new cooperatives in line with the free market economy
(Lemma, 2008; Adal, 2000). In the new legislation, the government indicated its desire to avoid
unnecessary intervention in cooperatives’ internal affairs and to allow them to be formed on the
basis of members’ free will and to properly operate in the free market economic system.
However, when one looks at the actual practices in terms of how cooperatives are formed and
their day-to-day operation, it is hardly possible to claim that all the basic principles of
cooperatives have been fully respected. The previous proclamation was revised after four years
and Proclamation No 147 was issued in 1998. This proclamation warrants that cooperative policy
is fully consistent with the universal cooperative principles and the ILO’s Promotion of
Cooperatives Recommendation 193 (Emana, 2009: Vii). It has been commended for integrating
internationally accepted cooperative principles, values and ethics. Many (Assefa, 2005; USAID,
2005; Emana, 2009; Adal, 2000) believe that the new proclamation is fairly comprehensive and
provides a more favourable context for the formation of all types of cooperatives, including
SACCOs. The new law also permits cooperatives to be organised at various levels such as
primary, secondary (union) and tertiary (federation).
In addition, in 2002, the Cooperatives’ Commission establishment Proclamation No. 274
provided clear institutional framework for promoting and supporting the cooperative movement
in Ethiopia (Emana, 2009: 3). The Federal Cooperative Agency (FCA) was then set up with the
mandate of formulating policies and legal frameworks, overseeing proper implementation of
relevant legislations, and promoting and registering cooperatives, of course working with and
through the regional level structures. Some of the regional states of Ethiopia (SNNPR, Tigray
and Amhara) have enacted their own proclamations for the promotion of cooperatives. Further
legal reforms were introduced in 2004 to reinforce implementation of the cooperative principles
and strengthen membership incentives by improving members’ rights (Bernard et al, 2010). As a
result, currently, cooperatives are at least promoted under one authority and in line with a
relatively standard law that governs the promotional and operational activities (Gessese, 2010).

63
Facilitating creation of cooperative unions and provision of various support measures by the
government is another commendable move in the right direction. These supports include initially
seconding personnel to manage cooperative unions, especially for the first generation of unions.
This, as some comment, in fact has some influence on the unions by making them dependent on
and closely associated with the government. The launching of education and training
programmes on cooperatives at different universities and colleges further demonstrates
government’s commitment to support the cooperative sector. As a result of the current fairly
conducive policy environment and supports provided by the government, a variety of
cooperatives have emerged and their numbers have shown rapid growth. According to the FCA,
as of March 2013, there were a total of 48,124 different types of primary cooperatives with
6,635,458 members, out of which 23% are female. Likewise, as of March 2013, a total of 293
unions were formed by 8,411 primary cooperatives. According to the FCA (2012) report, just in
one year period (between March 2011 and March 2012) about 2,957 primary cooperatives and
17 unions were formed. In general, over a period of five years (between 2007 and 2012), the
number of cooperatives in Ethiopia grew by 87.4% (Bernard et al, 2013), which demonstrates
massive expansion.
Following various reform programmes and issuance of the cooperative proclamations, somehow
autonomous, democratic, and business-oriented cooperatives have started to emerge in Ethiopia.
For instance, member farmers have been given the opportunity to democratically elect the
leaders of their cooperatives, though some indicate persistence of government’s interference in
cooperatives’ internal affairs. Lemma (2008) argues that although the communities that
experienced failure during the previous regime still doubt the viability and benefits of these
institutions, the successes of some cooperatives and unions have stimulated the interest of many
farmers and other groups. Concurring with these views, Assefa (2005) notes that progresses
made in Ethiopia demonstrates that the negative attitude towards cooperatives can be reversed
and cooperatives created under the socialist system can be successfully rehabilitated and
revitalised as market-oriented private business organisation.
Nevertheless, Bernard et al (2010) comments that although the cooperative sector has
demonstrated commendable successes in export crops (such as coffee), the achievements in the

64
staple food crops is negligible. Although efforts made by the Ethiopian government have made
notable progress in revitalising the cooperative sector, the reality on the ground shows that still
substantial work is needed to convince farmers about the benefits of cooperatives. As a result of
the tainted image of the previous state-initiated and controlled cooperatives, many farmers have
continued to display distorted perception about cooperatives and still tend to view them with
suspicion. A study conducted by Kodama (2007) in Southern Ethiopia indicates that most of the
respondent farmers tended to regard the cooperatives in the same way that they viewed the
service cooperatives of the previous regime. The same study revealed that cooperatives appear to
be customers of coffee farmers, rather than their own organisations. On the other hand, a study
conducted by Bernard et al (2010) indicates that only 17% of farm households with access to a
cooperative in their Kebeles participated in it; while only 9% of all farm households participated
in cooperatives at a national level. The above two studies suggest that a long process of trust and
confidence building is required for cooperatives to overcome persisting suspicion among
potential member farmers.
2.4.4.3. Types of cooperatives in Ethiopia
In Ethiopia, cooperatives are engaged in a wide array of activities. While many of them are
engaged in the provision of multiple services, some specialise in a single activity. Emana (2009)
reports that in Ethiopia cooperatives are engaged in 36 different types of activities. These
include, among others: producers’ cooperatives, multipurpose and/or marketing cooperatives (of
various agricultural and livestock products), SACCOs, consumer cooperatives, handcrafts
cooperatives, mining cooperatives, housing cooperatives, construction cooperatives and service
cooperatives. According to earlier reports by Lemma (2008), about 80% of the primary
cooperatives operate both in rural and urban areas were engaged in the service sector.
Despite the decisive role the agriculture sector plays in the national economy, various reports
show that the number of non-agricultural cooperatives outstrips that of those engaged in
agricultural activities. According to Emana (2009) about 37% of the primary cooperatives in
Ethiopia are engaged in agricultural activities, while others (e.g. Bernard et al, 2010) report that
agricultural cooperatives account for less than one-third of the cooperatives in the country. A
recent report of FCA shows that, as of March 2013, out of the total 48,124 primary cooperatives

65
(of 20 different types), 10,124 are multipurpose/agriculture, while 11,850 are SACCOs. Housing
cooperatives, consumer cooperatives and irrigation cooperatives are 8,162; 2,496 and 1,255,
respectively. According to Emana (2009), multipurpose farmers’ cooperative unions (44%) and
grain marketing farmers’ cooperative unions (24%) are the dominant secondary cooperative
structure in Ethiopia. He, however, notes that a rapid increase has been observed in the number
of consumers’ cooperatives in recent years largely in response to the escalating costs of
consumer goods and services.
With regard to the services provided by multipurpose (agricultural) cooperatives, a study by
Bernard et al (2013) reported that supplying agricultural inputs and credit are the most important
activities of multipurpose cooperatives in Ethiopia. About 92% and 72% of cooperatives
included in their study were involved in providing agricultural inputs and credit services,
respectively. The same study indicates that the main reasons reported by farmers for joining
cooperatives is related to accessing farm inputs. Only 7% and 5% of the respondents,
respectively, indicated accessing credit and output marketing as reasons for joining cooperatives.
Thus it is critical to support and encourage primary cooperatives to aggressively participate in
output marketing as well as to undertake value adding activities to members’ produce so as to
generate attractive returns for their members.
2.4.4.4. Higher level cooperative structures in Ethiopia
Cooperation among cooperatives is one of the fundamental principles of cooperatives, implying
the critical need for fostering horizontal links/networks and vertical integration among
cooperatives. Many (Develtere and Pollet, 2008; Lemma, 2008; Emana, 2009) suggest that
creation of secondary and tertiary structures would result in a more integrated and effective
cooperative sector. These authors maintain that such horizontal links and vertical integration
allow cooperatives to pool resources, enjoy economies of scale, share experience, boost their
visibility, strengthen advocacy and lobbying capacity to effectively attain their vision and goals.
The cooperative proclamation of Ethiopia (147/1998) provides a ground for the formation of
different levels of cooperatives - primary cooperatives, unions, federations and a cooperative
league. The second level cooperative structure (union) is formed by primary cooperatives

66
engaged in similar produce or activity, regardless of their geographical locations. Until the past
couple of years, one was able to find only primary level cooperative structure in Ethiopia.
However, a number of cooperative unions and a few federations have been formed in the country
over the past years. An earlier report by Lemma (2008) indicated that by 2005, there were 104
different types of unions that encompassed only about 13% of the primary cooperatives in the
country. However, a recent report by the FCA shows that as of March 2013, there were 293
cooperative unions throughout the country.
In response to the undesirable acts and business mal-practices of private coffee traders (in
relation to cooperative societies) in late 1990s, the Ethiopian government decided to establish
coffee farmers’ cooperative unions to handle cooperatives’ coffee export activities (Kodama,
2007; Dempsey, 2006). As a result, a number of coffee farmers’ cooperative unions were
established following the issuance of Cooperative Proclamation No. 147 of 1998. The first coffee
cooperative union, the Oromia Coffee Farmers’ Cooperative Union (OCFCU), was established in
1999. This was followed by the formation of Sidama Coffee Farmers Cooperative Union,
Yirgachefe Coffee Farmers Cooperative Union, Kaffa Forest Coffee Cooperative Union, Bench
Maji Forest Coffee and Tepi Coffee Farmers’ Cooperative Unions. More recently some new
coffee, multipurpose and SACCO unions have emerged in different parts of the country though
most of them exhibit weak financial, managerial and institutional capacities. In particular, the
first three coffee cooperative unions (Oromia, Sidama and Yirgachefe) had enjoyed various types
of supports from the government and non-governmental agencies (Kodama, 2007; USAID,
2005). For instance, the government recruited staff with experience in cooperatives and coffee
business and seconded to unions by paying their salaries for the first two years (Kodama, 2007).
The latter generation of unions obviously did not get an opportunity to enjoy such targeted
support and privilege. Thus owning to their weak institutional and management capacities, the
performance of their business activities do not seem to be as effective as those of the first
generation unions.
Issuance of Proclamation No. 147/98 also provided the legal basis for the formation of
federations of unions based on their product specialisations. Though the government intends to
establish different federations at national level on different areas or sectors, formation of many
67
vibrant federations does not seem to happen as desired by the government. Recently three
agriculture-related federations have been established at regional level: an Agricultural
Cooperative Federation in SNNP, a Federation of Grain Marketing Cooperatives in Oromia, and
a Multipurpose Marketing Federation in Tigray (that largely focuses on sesame); the former was
established in 2008 and while the latter two were created in 2009 (Emana, 2009; ATA, 2012;
FCA, 2012). Some sources report emergence of other federations which include federation of
mining cooperatives in the Oromia region. However, discussions held with experts of the FCA
reveal lack of clarity and mutual understanding among the federal and regional cooperative
agencies about whether to promote federations at the regional or national level. Moreover, there
appears to be overlapping in the activities and services of unions and regional federations. The
new cooperative sector development strategy suggests that by delineating unions as secondary-
level structures that exist up to a regional level, and a national federation as a tertiary-level apex,
the confusion and problems related to overlapping duties and responsibilities of the two
structures can be overcome.
2.4.5. Coffee cooperatives and their role in coffee marketing
One of the significant recent changes in relation to cooperatives is that in 2001 the government
allowed creation of a cooperative marketing channel (Dempsey, 2006). This was intended to
address the challenges that coffee cooperatives faced in marketing their products through private
traders, such as delayed payments and other mal-practices. The new marketing system allows
coffee cooperative unions to directly export their members’ coffee without passing through the
central auction market or ECX trading system. Creation of such a marketing system has provided
a great opportunity to cooperative unions to play an important role in marketing members’
coffee. As a result, some of the unions were able to demonstrate their potential in enhancing
farmers’ integration into higher segment of the value chain and thereby generate better return for
their members. For instance, the Oromia Coffee Farmers Cooperative Union (OCFCU) was the
third largest coffee exporter in 2011, with a total sale exceeding 41 million USD (ATA, 2012).
As Minten et al (2014) reports, OCFCU in fact accounts for 57% of the export transactions made
by cooperatives between 2006/07 and 2012/13. This points to the presence of huge gaps between
the different cooperatives unions in terms of capacity and business activities. Out of the 328
market actors taking part in coffee trading at the ECX auction centre, 14 are cooperative unions

68
while 2 are regional federations (FCA, 2012). Moreover, cooperatives provide a vital avenue to
coffee farmers to participate in various certification schemes and Fair-trade markets, which
attract premium prices for member farmers.
However, the actual volume of the coffee marketed by primary cooperatives and their parent
unions is limited largely due to financial constraints. It is not uncommon for unions to advise
primary cooperatives to sell their coffee through other channels when they are short of finance.
Consequently, the majority of cooperatives have continued to largely rely on conventional
marketing channels. For instance, in 2004/05 YCFCU had purchased 1,036 tons of coffee,
constituting 13% of the coffee purchased by member primary cooperatives (7,744 tons). Bagersh
(2012) reports that cooperatives and their unions export only 8% of Ethiopia’s coffee, while
private exporters are responsible for the bulk of the export volume (87.50%). The remaining
4.5% is exported by commercial farms. However, a recent study (Minten et al, 2014) reveals that
the share of cooperatives in the coffee export was just between 3% and 6% during the period
2006/07 to 2012/13. Thus on the part of the government and other development agencies there is
a critical need to step up efforts and supports in terms of building the capacities of primary
cooperatives and their unions and in enhancing their access to financial resources.
Moreover, despite the significant achievements recorded in coffee marketing, as Dempsey
(2006) notes, coffee cooperatives were still held with bad reputation and lack of trust that had
emanated from their political use during the Derg regime. ATA (2012) notes that many
agricultural cooperative members do not market their produce through their cooperatives. In
particular, it is not uncommon for cooperative members to receive better payments in cash for
their cherries from local private washing station operators. However, although the actual volume
of coffee handled by cooperatives remained low, their presence in the coffee market plays a vital
role in stimulating competition and in enhancing market power of producers by providing
alternative market outlets. This obviously helps to counter the monopolistic power of private
traders and compels them to offer improved prices for farmers produce.

69
2.4.6. Role of cooperatives in rural finance
There is a growing consensus among many that cooperatives play an indispensable role in
enhancing poor people’s access to financial services. Experiences from the Philippines show that
cooperatives can effectively serve as conduits for credit funds to individual members, who
assume joint liability (Briones, 2009). In this regard, the development strategies and plans of the
different regimes of Ethiopia have recognised cooperatives’ crucial role in rural finance service
provision. For instance, during the Socialist regime, one of the key functions of the Service
Cooperatives was provision of loans to priority sectors at lower interest rates. Similarly, the
current Rural Development Policy and Strategy of Ethiopia explicitly states that cooperatives
could play a vital role in the delivery of financial services particularly to the poor by linking their
activities with formal banks and MFIs (Wolday, 2008a; 2009a).
In particular, saving and credit cooperatives have become popular in this regard. According to
Schwettmann (1997) SACCOs or their unions have been successful in Africa, which could be
attributed to the fact that they are a kind of formalised rotating saving and credit associations
which are widespread across the continent. As Chanyalew (2015) notes, in Ethiopia RUSACCOs
are expected to be the main sources of agricultural finance services to smallholder farmers and
multipurpose cooperatives. However, though Ethiopia has recently seen rapid expansion of
(RU)SACCOs, most of them are at an infant stage and suffer from lack of financial capacity
(have struggled to raise sufficient savings). Thus as of now they are not in a position to meet the
financial needs of member farmers and sister multipurpose cooperatives. Chanyalew (2015)
underscores that RUSACCOs’ financial products and services are currently very limited and lack
diversity.
In terms of the role of agricultural/multipurpose cooperatives in this regard, experiences from
various countries reveal mixed outcomes. Many scholars tend to conclude that involvement of
MPCs in the provision of credit service may result in additional load, complication and resource
misappropriation. According to Chanyalew (2015), multipurpose cooperatives in Ethiopia have
been involved in the service of credit provision, especially to meet emergency needs to close the
gap preceding the harvest season. He, however, noted that their involvement in the provision of

70
financial services has been carried out haphazardly and its delivery often focused on periodical
problem solving. Chanyalew goes on to point out that some MPCs have continued with such
traditional practice of credit provision although RUSACCOs have been established in many parts
of the country. In his view, this is being practiced by not strictly observing the existing
regulatory acts that leaves such credit services to RUSACCOs, as well as due to the low capital
base of RUSACCOs. This calls for the need to create necessary awareness among MPCs on
relevant policy and regulations.
Concurring with the above argument, Wolday (2008a; 2009a) warns that since sustainable
delivery of financial services requires specialised financial institutions engaged in banking
activities, commodity-based or multipurpose cooperatives may not be able to effectively render
such services. An earlier World Bank study (1994) similarly reported that MPCs in many
countries have generally not been successful in providing saving and credit services, due to their
lack of specialisation in financial services and because of their involvement in other diverse
activities. The same study noted that MPCs in sub-Saharan Africa traditionally provided short-
term crop advances to members; but such transactions were often not properly managed and
controlled, and resulted in substantial losses to many cooperatives. In view of such challenges,
(Chanyalew, 2015) suggests that engaging multipurpose cooperatives in the agriculture finance
delivery should be based on best international practices and should not also be considered as a
substitute to MFIs and RUSACCOs. In other words, credit provision should not be taken as the
main function of multipurpose cooperatives. Cognisant of this reality, the government of
Ethiopia has set a direction to support agricultural/multipurpose cooperatives to form their own
sister SACCOs in order to enable them render better financial services to their members. Such
efforts need to be accompanied by adequate supports in terms of creating favourable regulatory
framework, capacity building and other complementary services as most (RU)SACCOs currently
have weak institutional, managerial and financial capacities. Parallel to these efforts, the existing
cooperative bank needs to be provided with a more favourable policy and regulatory
environment that promotes its lending services to the cooperative sector.

71
Summary
The main focus of this chapter was to provide an overview of the macro-economic and
institutional contexts of Ethiopia, focusing on the underlying theoretical conceptualisation that
has shaped the Ethiopian economy over time. The chapter has discussed the different features of
the socialist’s command economic system, which had detrimental effects on the development of
the private sector, including the coffee sector. The system did not allow the creation of genuine,
autonomous and vibrant farmers’ organisations. The legacy and aftermath effects of such a
closed and stagnant economy have continued to persist for some time after the end of the regime.
The current Ethiopian government has embarked on a free-market economy in the context of a
developmental state paradigm. Rather than adopting the neoliberal ideology which prescribes a
wholesale liberalisation process, the Ethiopian government has decided to take a cautious and
gradual approach towards liberalization by maintaining heavy intervention and regulation on key
sectors of the economy. Unlike the post-socialist situation in most other transition countries, the
Ethiopian economy has shown impressive growth which could be largely attributed to the heavy
government spending and indigenous development policies and strategies. The policy reforms of
the current government in line with the free market economy appeared to favour expansion of the
private sector, including the financial sector.
The chapter also discussed that cooperatives are indispensable rural institutions that play a great
role in the socio-economic development of the community and country at large. However, the
development of the sector in developing countries, including Ethiopia has been constrained by a
number of factors which are largely related to the way they were promoted and formed as well as
due to the effects of the political and economic environments in which they were formed and
operating. Cooperatives play a crucial role particularly in coffee marketing in Ethiopia.
Literature suggests that multipurpose/agricultural cooperatives are not ideally suitable to be
involved in the provision of credit services to farmers. The experiences of Ethiopia generally
reveal that cooperatives strive best under a free market economic environment that allow them to
operate as an autonomous, competent and market-oriented private business organisation. Of
course without undermining the spirit of sound and fair business activities, social values and
services.

72
CHAPTER 3
3. INTERVENING IN RURAL FINANCE
3.1. Introduction
This chapter provides literature review and theoretical discussions related to rural finance in
general and a credit guarantee intervention in particular, with the aim of providing a theoretical
and conceptual framework for the study. The chapter begins with a literature review and
theoretical discussion on rural finance, rural credit markets, credit demand by farmers and factors
influencing credit demand. This is followed by theoretical and conceptual frameworks on credit
guarantee schemes. Before concluding with a summary of key points, the chapter presents
analytical frameworks for determining credit demand as well as in evaluating the performance
and impacts of a credit guarantee scheme.
3.2. Rural Finance
Intervening in rural finance has become a central issue in the development strategies and
programmes of many countries. Rural finance refers to those financial services provided in rural
areas (by various actors) for agricultural as well as non-agricultural purposes (Klerk, 2008). Such
services include: savings, lending, insurance and remittance services to rural households and
entrepreneurs. In general, improving access of resource-poor people to appropriate financial
services has been increasingly recognised as one means of breaking the vicious cycle of poverty
they are trapped in. This section provides literature review and theoretical discussions on issues
related to rural finance.
3.2.1. Role and impacts of access to rural finance
Like many other sectors, access to appropriate financial services is of profound importance for
stimulating the development of the agricultural sector. KIT and IIRR (2010) underscore that

73
access to adequate and timely financial services for all actors in the agricultural value chain is a
key factor for success. Credit in particular plays a pivotal role in the drive to transform
smallholder agriculture from subsistence level to commercial and market-oriented farming.
Agriculture generally relies heavily on credit more than any other sector because of the seasonal
variations in the farm income and a changing trend towards commercial and mechanised farming
(Mahmood et al., 2009). Drawing on experiences from different contexts, the World Bank
(2006) argues that efficient financial markets can play a decisive role in accelerating agricultural
growth and in ensuring food security. Several empirical studies reported the impacts of having
access to credit on farm households and its contribution to the national economy. In their study
in Pakistan Mahmood et al (2009) found that access to credit service increased farm family’s per
month income from livestock sector by 181%. A study conducted by Sial et al (2011) found that
availability of agricultural credit removes financial constraints and increases technical efficiency,
resource allocation and profitability of farmers. Similarly, Iqbal et al (2003) found a positively
significant relationship between institutional credit and agricultural GDP in Pakistan. In line with
these findings, a study in Vietnam (Barslund and Tarp, 2008) reported the fact that households
with access to credit were more willing to pursue promising but risky technologies as credit
access increases their risk bearing capacity. Unfortunately, farm households in developing
countries have continued experiencing severe credit constraints.
Several studies reported the adverse effects of credit constraints on the farm households and rural
community at large. For example, in Peru Fletschner et al, (2010) reported that farms which
experienced financial constraints on average attained 27% less profit than those who had
adequate access to credit. A study conducted in Africa (Mafimisebi et al, 2010) similarly
reported the fact that shortage of institutional credit is a major contributor to the persistent poor
performance of Nigeria’s agriculture sector. Muayila and Tollens (2012), in their study to
investigate the effects of credit constraints in the Democratic Republic of Congo found that
credit constrained households had lower welfare outcomes than unconstrained ones. Credit
constraints affect not only the output and efficiency of rural households, but also their capacity to
adjust to the major policy reforms of recent years and the aftermath of the exchange rate crisis
(Chaves et al, 2001:35). Cognizant of this reality, many (e.g. Mahmood et al, 2009; Olagunju

74
and Ajiboye, 2010; World Bank, 1994) underscore that credit is a key ingredient in the effort to
modernise agriculture and commercialisation of the rural economy.
3.2.2. Rural financial markets and the rural poor: challenges and constraints
Rural financial markets in developing countries are often segmented into formal, semiformal and
informal sectors. These different sectors have peculiar features and often target different
segments of the rural population. Many (e.g. Emana et al, 2005; Komicha, 2008; Chaves et al,
2001; Barslund and Trap, 2008) point out that the informal sources often dominate the credit
markets in rural areas of most developing countries, including Ethiopia. However, such informal
sources have a number of limitations among which the exorbitant interest rates charged on loans
is the chief one. In general, smallholder farmers and the rural poor often experience severe credit
rationing11
problems.
The formal financial institutions do not favour lending to rural based resource-poor farmers and
other small entrepreneurs for a number of reasons. Analysts (e.g. Olagunju and Ajiboye, 2010;
KIT and IIRR, 2010) note that most commercial banks prefer to channel credit to less risky
enterprises, and often tend to eliminate or severely restrict their loan allocation to smallholder
farmers. For instance, a World Bank study (1994) shows that rural credit from the formal
financial institutions is less than 10% in most Sub-Saharan African (SSA) countries. Credit
allocated to trade activities is much larger than the share of agricultural production, agro-
processing or other rural enterprises (World Bank, 1994; Klerk, 2008). Even among the
rural/farming community in most SSA countries, as World Bank (1994) noted, the larger share of
commercial banks’ loan portfolio is channeled to large-scale agricultural enterprises or to the
better off section of the community. As a result, the rural poor are often forced to revert to
informal sources to meet their credit requirements.
11
Credit rationing often emanates from a situation where the demand for loans exceeds its supply at the prevailing
interest rate. It mainly refers to two scenarios whereby farmers receive credit, but smaller than amount demanded or
they are completely denied a loan at all even if they are willing to pay the required interest rate (Dohcheva, 2009;
Rahji and Adeoti, 2010). Credit rationing can also be categorised as external and internal rationing. The first one
refers to a situation whereby farmers apply for a loan, but do not get it, while the later represents the case where
farmers for various reasons do not apply for a loan although they wish to obtain.

75
When one talks of the thinness of financial services that go to the smallholder agricultural sector
in most African countries, Ethiopia is no exception. Several studies (e.g. Admasu and Paul,
2010; Admassie, 2004; Chanyalew, 2015) indicate that, as compared to other economic sectors,
in Ethiopia the financial resources that flow to the smallholder agriculture is generally low.
Though there have been substantial improvements in expanding financial markets in Ethiopia in
recent years, evidence (Admassie, 2004; Bastin and Matteucci, 2007; Komicha, 2008;
Chanyalew, 2015) shows that there are substantial gaps in the rural and agricultural finance.
Earlier study by the World Bank (1994) suggests that in Ethiopia, lending by the Commercial
Banks to agriculture has been less than 5% and it has stagnated. Admassie (2004) reports that in
Ethiopia the share of agriculture in the total credit disbursed by banks between 1991 and 1998
was less than 15%. Recent literature on issues related to credit supply to the Ethiopian
agriculture sector shows persistence of similar trends. For instance, Wolday (2008b) notes that
out of the total 2.7 billion Birr loan disbursed until 2007 by Awash International Bank, one of the
pioneer private banks in Ethiopia, only 172 million Birr (15.70%) was allocated to the
agricultural sector. The last Plan for Accelerated and Sustained Development to End Poverty of
Ethiopia indicated that only 6% of smallholder farmers in Ethiopia had access to financial
services (Wolday, 2010). Moreover, almost all of the agricultural credit is of short term nature,
with little impact on long-term investment and in effecting transformation of the agriculture
sector (Admassie, 2004). In addition, existing financial services are too costly and often not
tailored to the Ethiopian farmers’ needs (Bastin and Matteucci, 2007). Problems related to
financial capacity of the lending institutions and the prevailing tighter monetary and regulatory
environments appear to largely contribute to the limited flow of loan finance to stallholder
farmers. Because under such circumstances lenders tend to channel their limited credit fund to
selected urban-based borrowers and to those who can generate other benefits for the banks (such
as foreign currency earnings and cash deposit).
3.2.3. Credit demand by smallholder farmers
As discussed in the preceding section, the popular assumption in the literature is that farm-
households’ and small scale firms’ demand for credit excessively exceeds supply and as a result
they are often credit rationed by financial institutions. This assumption implies that all or most
households and firms show positive demand for credit facilities from the formal sector, and their
76
participation in credit service is normally determined by the lending institutions. As a result,
most of the theoretical and empirical literature on rural credit and government policies have
largely focused on the supply-side constraints, with little attempt to explore household’s or
firm’s demand for the services (Mpuga, 2010; Karlan et al, 2011). Among the studies conducted
in Ethiopia, Bastin and Matteucci (2007) investigated the demand and supply of financial
services for coffee producers in two districts of Jima area in Ethiopia. The findings indicate that
there is substantial gap between demand and supply of financial services in that only 42% of the
demand was satisfied. Their study concluded that the entire sample of farmers had a potential
demand for credit services. This study however focused on services of microfinance institutions
in two districts and the findings may not reflect the situation in other areas and services of the
banking industry. A study by Pombo and Herrero (2001, cited by Green, 2003), reported that up
to 80% and 95% of investment needs of small and medium enterprises and micro-enterprises,
respectively, remains unsatisfied in some Latin American and African countries. A study carried
out in China (Rui and Xi, 2010) similarly showed that 71% of the rural households were rationed
in the credit markets. Similarly, Muayila and Tollens (2012) in their study in the Democratic
Republic of Congo (DRC) reported that 71% of the farm households experienced credit
constraints. A closer look at the findings of these studies suggests that credit rationing, limited
access to and participation in credit services is a common challenge across the different regions;
i.e. Africa, Latin America and Asia.
Contrary to these findings, some empirical evidence indicates that the demand for loan among
the farming community and rural poor might not be that strong. As Aryeetey (1996) argues, there
are various obstacles to the transformation of potential demand into actual demand. Zeller (1994)
suggests that participation in borrowing is a function of the household's or individual's demand
for credit and its access to a market. Apparently demand for credit is related to price which
involves interest rates and other costs associated with obtaining credit. Various authors (e.g.
Diagne and Zeller, 2001; Komicha, 2008; Dohcheva, 2009; Chaves et al, 2001) attest that even if
the farm households have access to a particular source of credit and at the same time lack
sufficient capital for their investment project or operations, they may decide not to participate in
borrowing from that source. A study conducted by the World Bank (1994) suggests that many
people avoid being in debt, while others might not have a worthwhile activity to be financed by

77
borrowed funds. Therefore, as Diagne et al (2000) argues, participation in a credit programme is
something households or firms choose to do, while access to a credit service is a limiting
constraint put upon them, such as eligibility criteria and lending requirements. This discussion
points to the critical importance of both supply and demand side constraints in influencing
demand for credit.
Chaves et al (2001) in a study in Rural Romania reveals that the observed scarcity of credit
transactions in rural areas was caused by factors which weakened both the supply of and demand
for rural credit. The study negates the commonly held assumption that the unwillingness of the
banking sector to lend to rural entrepreneurs (i.e. a weak supply) is the cause of insufficient
credit flows to rural areas. Weak demand for loans is an important determinant of the limited
participation of rural households and small entrepreneurs in credit markets. According to this
study, only 31% of the rural households reported having a demand for loans. This study goes on
to point out that the demand for loans was not uniform, but varied by key characteristics of the
agents such as size, economic sector, ownership, and agro-region. Some authors (e.g. Klerk,
2008) argue that due to their limited economic activity and capacity, households in marginal
areas do not need much capital. Fear of being rejected due to their perception that they do not
meet the lending criteria can also be one of the limiting factors.
The findings of some of the studies conducted in Ethiopia are consistent with the above
arguments. For instance, in their study in Ada’a Liben district of Central Ethiopia, found out that
only 43% of the respondent farmers were in need of credit, while the remaining 57% did not
express need for credit. This study however focused on input loans in food crop growing areas,
and may not depict the credit demand and supply situation in cash crop growing areas such as
coffee. Similarly, Berhanu (2005) reported that some microfinance institutions in Ethiopia were
struggling to secure sufficient demand for their existing loan products mainly due to the misfit
between what the institutions offer and what the customers require. In view of this reality,
Chaves et al (2001) and others emphasise that deepening financial markets in rural areas and
increasing their outreach requires both stronger credit supply and demand. The above discussions
thus suggest the critical need for identifying and addressing both supply and demand side

78
constraints if smallholder farmers have to effectively demand for, access and benefit from
institutional loans.
3.2.3.1. Credit demand as related to loan attributes and sectoral choices
Studies discussing credit sectoral choices by farmers suggest that farm households borrow from
different sources; but the informal source of credit appears to dominate. Komicha (2008) in
analysing sectoral choice of farm households’ and its determinants in two districts of Southern
Ethiopia reported that about 55% of the interviewed households borrowed from different
sources, whereby the informal credit sector is the dominant one. Studies report that various
household and farm characteristics, loan attributes and lending requirements influence sectoral
choice of credit. Khan and Hussain (2011) in examining the determinants of demand for formal
and informal credit by cotton growers in Pakistan found that educated farmers and big farmers
take loans from the formal sector, while the distance from the formal lending institution, number
of visits to take the loan, high transaction costs and bribery and corruption appear to push
farmers towards informal sources. According to Barslund and Trap (2008), the determinants of
credit demand from the two sources in Vietnam were distinct. They also found massive
differences across regions in terms of demand for credit.
Komicha (2007) notes that imperfect financial markets adversely affect credit sectoral choice.
Among the household characteristics, according to Komicha (2007), the choice of formal sector
was positively affected by gender (male had higher probability for demanding loan), household
labour, farm size, credit information and extension visit. This implies that women tend to rely on
informal credit sources, if at all, which has important policy implications. According to
Komicha’s study, non-farm income, dependency ratio and interest rate had negative influence on
credit demand from formal source. Credit rationing by the formal financial institutions is often
cited as one of the factors that force farmers and other small entrepreneurs to switch to the
informal credit sources to meet their credit needs. Thus formal financial institutions need to
adapt their lending policies and products in line with the credit needs of the farm households’ if
their share in formal credit market is to rise.
Exploring the loan attributes preferred by the borrowing farm households, some studies suggest
that farmers often require different kinds of loans for various purposes - both for productive and
79
non-productive purposes. A study conducted by Komicha (2007) in Southern Ethiopia reports
that farm households need credit both for production and consumption purposes, whereas the
formal credit sector targets credit for production purposes. Klerk (2008) indicates that while the
poorer groups might need micro-credit to cover production costs and emergency expenses,
farmers and their organisations involved in cash-crop production often require larger amounts of
credit to finance production, inputs, processing and marketing. Schwettmann (1997) similarly
notes that farmers’ cooperatives need loans for two purposes: to finance their own business
operations (pre-financing of crops, input purchase, export financing, purchase of assets), and to
provide short-term loans to their members. Glenk et al (2009) tried to examine farmers’
preferences for different rural credit systems in one region of Georgia, in relation to the
implementation of credit unions or cooperatives. The results of this study show that segments of
the farming population differ in their preferences for loan attributes. Farmers expressed huge
demand for small loan with individual liability, but with long-term duration. Their study
indicated that two-thirds of the respondents were interested in investing in agricultural
production. Unfortunately, as some analysts (e.g. Bastin and Matteucci, 2007; Wolday, 2008a)
comment the terms and financial products of most financial institutions are not appropriate for
agricultural activities and smallholder farmers. Financial services with diverse and flexible
products and terms are needed if the financial requirements of the different segments of the
farming community and other rural entrepreneurs are to be properly met. In particular, credit
facilities extended to the farming community need to take into account the cycle and nature of
the agricultural enterprises.
3.2.4. Factors influencing demand for credit
Evidence shows that farmers’ and other rural entrepreneurs’ borrowing behavior, participation12
in and efficient utilisation of credit facilities are influenced by an array of socio-economic,
technical, institutional and environmental factors. Nevertheless, analysts (e.g. Swain, 2007)
claim that the empirical evidence on the factors influencing rural credit demand is quite limited.
In support of this argument, Atieno (1997) pointed out that though credit programmes have been
12
An individual or a household is said to be participating if it is borrowing from a source of credit, while having access to credit
implies the possibility to borrow from that particular source, although the household may decide not to borrow due to a number
of reasons (Diagne and Zeller, 2001).

80
used as important components of rural development in many developing countries, the limited
success recorded in many of such interventions is largely attributed to the failure to properly
identify the credit needs of the target groups. Atieno goes on to comment that such programmes
have tended to allocate credit according to the perceived needs, rather than on the basis of the
amount of funds that farmers are able to manage and/or demand. Evidence (e.g. Karlan et al,
2011) also shows that farming communities generally face a complex set of risks and
uncertainties that complicate the decision to borrow. According to Swain (2002), the limited
number of households demanding loans from the formal sector appears to be a choice decision of
the household. Farmers with small-scale and fragmented holdings with poor infrastructural
facilities often have limited access to new technologies, markets and various support services and
possibly a low return on investment. This can obviously restrict their demand for loans even if
they have access to them. In general, some authors (e.g. Atieno, 2001) outline that, among other
things, weak entrepreneurship capacity, lack of viable enterprise to finance, risks associated with
agricultural production and markets for outputs, poor infrastructure and other support services,
inability to meet collateral requirement, perceived low chance of application success, loan
attributes (such as inappropriate loan duration, loan amount and terms of payment), and high
costs of borrowing can have profound influence on farm households’ and small firms’
borrowing decisions.
Various studies attempted to determine factors that have an influence on farm household’s or
firm’s demand for credit in different countries, by focusing on the key characteristics of the
borrowing households or firms. Although some argue that the main challenge confronting the
poor is lack of access rather than the interest rate, the findings of most studies, regardless of their
regional and geographical focus, reported that interest rates charged on loans negatively
influence credit demand. For instance, studies conducted in the Philippine (Briones, 2009),
Ghana (Akudugu, 2012), Ethiopia (Komicha, 2007) and Thailand (Wiboonpongse et al, 2006)
found that increasing effective lending rate had a negative influence on credit demand. Thus
demand side attributes and response need to be taken into account in determining the interest
rates of financial institutions that aim to reach out to small-scale farmers. In general, high
transaction costs were found to negatively influence formal credit demand in Ethiopia (Komicha,

81
2007) and China (Tang et al, 2010). Likewise, collateral requirement and/or value had
understandably a negative influence on credit demand in Romania (Chaves et al, 2001).
Understandably, distance to the lending financial institutions was reported by several studies to
have a negative influence on loan demand. For instance, studies conducted in Nigeria (Oni et al,
2005; Akpan et al, 2013), Ghana (Akudugu, 2012), Pakistan (Khan and Hussain, 2011) and
China (Bing et al, 2008) found a negative and significant relationship between distance to the
lending agency and loan demand. This is not surprising as distance to the lending agency is
directly related to costs of borrowing, information asymmetry and accessibility. This has
important policy implications for government and financial institutions in terms of improving
infrastructure and distribution of financial institutions’ networks so as to improve rural peoples’
access to financial services.
Though most studies tended to report presence of a positive association between educational
level and demand for loan, there are inconsistencies in the findings conducted in different
countries or regions. For instance, educational status was found to have a positive influence on
credit demand in Nigeria (Oni et al, 2005; Akpan et al, 2013), Kenya (Messah, 2011), Uganda
(Mpuga, 2010), Pakistan (Khan and Hussain, 2011), China (Rui and Xi, 2010; Tang et al, 2010),
Ethiopia (Girma and Abebaw, 2015) and Ghana (Akudugu, 2012). Surprisingly, another study
from China (Bing et al, 2008) reported that education had a negative, but significant influence on
credit demand, while a study conducted in Thailand (Wiboonpongse et al, 2006) reported
absence of a significant relationship between the two variables. Overall, studies show that
education is one of the key variables in influencing the decision to take loan by farm households
and small entrepreneurs. This calls for efforts to enhance farm households’ awareness,
knowledge and skills if they have to effectively demand for, access and utilize loan funds.
With regard to the influence of age, conflicting findings were generated by studies conducted in
different countries. For instance, contrary to the longstanding belief that as age progresses
farmers would be more conservative and reluctant in coming forward and demanding for credit,
studies conducted in Uganda (Mpuga, 2010) and Nigeria (Akpan et al, 2013) reported that age of
the household is positively related to their loan demand. In other words, older farmers were more

82
likely to demand for credit. Possibly this might be related to resource endowment as older
farmers often tend to have better access to some critical assets such as land, especially in the
African context. However, Bing et al (2008), in their study in China, found a negatively
significant relationship between age and credit demand, while studies conducted in Ethiopia
(Girma and Abebaw, 2015) and India (Swain, 2007) did not find a statistically significant
association between the two variables.
Another important factor in determining loan demand was gender of the head of household or
entrepreneur. Like many other variables, inconsistent results were reported with regard to the
influence of gender. For instance, some studies reported that women were less likely to demand
for credit from formal credit sources in Ethiopia (Komicha, 2007), Uganda (Mpuga, 2010),
Nigeria (Ajagbe et al, 2012), while a study from Ghana (Akudugu, 2012) surprisingly reported
that men were less likely to seek loan. Another study conducted in Ethiopia (Girma and Abebaw,
2015) did not find a significant association between gender and credit demand. This calls for
further context specific investigation across countries and even across various cultural groups or
communities as influences of gender is likely to be context specific. Another critical variable in
influencing credit demand was farm size. For instance, farm size was found to positively
influence demand for formal credit in Pakistan (Khan and Hussain, 2011), Ethiopia (Komicha,
2007), China (Bing et al, 2008; Tang et al, 2010), India (Swain, 2002; 2007), Vietnam (Barslund
and Trap, 2008), Kenya (Atieno, 1997) and Ghana (Akudugu, 2012). This could suggest the fact
that farmers with larger farm: (1) are in a better position to provide assets required for collateral,
(2) need external loan to finance their farm activities or expansion. The insignificance of the
effect of land in some of the studies however requires further investigation in relation to that
particular context. In this regard, Barslund and Trap (2008), in their study in Vietnam, found that
though land was a statistically significant determinant of overall credit demand, there was
substantial difference across regions in the demand for credit.
Expenditures for children education and medical care were reported by some studies (e.g.
Komicha, 2007; Bing et al, 2010; Rui and Xi, 2010) as an important factor in influencing loan
demand in different countries (such as Ethiopia, China). Likewise, production and management
expenditure was reported to positively influence loan demand in China (Bing et al, 2008). A

83
study conducted in Romania (Chaves et al, 2001), however, shows that the demand for loans at
the household level was associated with highly inelastic consumption needs rather than with
investment opportunities. Though household or family size was expected to have strong and
somehow similar effects across countries, it has shown inconsistencies in different countries. For
instance, family size was reported to have a positive effect on credit demand in India (Swain,
2007; 2002) and China (Tang et al, 2010), while it had a negative influence in Kenya (Messah,
2011), Uganda (Mpuga, 2010) and Nigeria (Akpan et al, 2013). Thus the reason behind the
positive influence of family size in the Asian context and its negative effects in the African
countries in terms of influencing loan demand could be related to variations in socio-cultural
aspects which need further investigation. Some studies did not find a significant relationship
between family size and credit demand in some countries such as Thailand (Wiboonpongse et al,
2006) and Ethiopia (Girma and Abebaw, 2015). On the other hand, dependency ratio had some
influence on credit demand. In this regard, Komicha (2007) and Messah (2011) found a negative
influence in Ethiopia and Kenya, respectively, while Swain (2007) found a positive association
between number of dependents and credit demand in India.
Sector of primary engagement was also found to influence credit demand. But the findings in
different countries were not consistent. For instance, engagement in non-farm activity positively
influenced credit demand in China (Bing et al, 2008) and India (Swain, 2007). In Uganda,
Mpuga (2010) found a negative relationship between credit demand and engagement in
agriculture as a primary activity. The same study reported a positive association between credit
demand and involvement in industry, administration and commercial activities. In contrary,
engagement in farming was found to have a positive influence in Ethiopia (Girma and Abebaw,
2015). Similarly, a study conducted in the Philippines (Nagarajan et al, 998) found that loan
demand was influenced by the ability and capacity of a borrower to specialize in farming. On the
other hand, Kudugu (2012) found a positive association between cultivation of cash crop and
credit demand in Ghana, which might be the case in coffee growing areas of Ethiopia. This is not
surprising as production, processing and marketing of cash crops require substantial capital. Use
of fertilizer was also reported in Nigeria (Oni et al, 2005) to positively influence credit demand.

84
Another variable with inconsistent effects is non-farm income. Studies conducted in Ethiopia
(Komicha, 2007) found a negative influence of non-farm income on credit demand, while Bing
et al (2008) found a positive association in China. Other studies from Ethiopia (Girma and
Abebaw, 2015) and Kenya (Atieno, 1997) did not find a significant association between non-
farm income and credit demand. Likewise, some studies found that income (total) of farm
household has a positive influence on credit demand in Nigeria (Oni et al, 2005) and Kenya
(Messah, 2011). Similarly, studies conducted in India (Swain, 2007), China (Bing et al, 2008),
Uganda (Mpuga, 2010), Nigeria (Ajagbe et al, 2012) reported that value of asset and/or net
wealth significantly and positively influence credit demand. This is in agreement with existing
literature, which argues that farmers with better capital often reveal higher demand for credit due
to two reasons: (1) they are confident and/or able to provide collaterals required by banks, (2)
they often need additional external finance to support their operations or further expansion.
Moreover, liability was reported by some studies to positively influence credit demand in China
(Rui and Xi, 2010; Bing et al, 2008). This is in line with available literature which claim that
households with higher liabilities may look for additional fresh loans to settle their outstanding
loans (that may approach maturity date) and/or for additional business undertakings. On the other
hand, membership of social group/organization had a positive influence across countries – Ghana
(Akudugu, 2012) and Nigeria (Akpan et al, 2013).
The above findings show that studies conducted in different countries and regions appear to
report inconsistent findings with regard to factors influencing credit demand. Surprisingly, even
some of the studies conducted in the same countries at times generate conflicting findings in this
regard. However, some variables were found to influence credit demand across countries.
Among these, size of farm holding, distance from lending institutions, education of the
household head, level of assets or net wealth, education and medical expenditures, age of the
head of household, gender of head of household, sector of primary activity, among others, appear
to influence loan demand across countries in different ways. In general, we were not able to
establish a clear distinction between variables that influence credit demand in different regions.
The review also points to the thinness of such studies in the African context (with the exception
of Nigeria and a few countries) as compared to countries in Asia. The inconsistencies among the
findings of the studies carried out in different countries suggest the need for conducting country

85
and context specific studies as national policies and regulatory frameworks and other socio-
economic and environmental circumstances have considerable influence on demand for credit. In
particular, empirical evidence on factors influencing farmer cooperatives’ credit demand is
scarce as existing studies tend to focus on individual farm household’s or SME’s.
3.2.5 Estimating loan demand and its determinants: Conceptual and analytical
framework
In designing a credit guarantee scheme, it is normally anticipated that both the borrowing firms
and lending banks would demonstrate strong interest and positive response. Evidence suggests
that improving credit supply through such an intervention may not necessarily generate effective
demand due to a number of reasons. Mpuga (2010) notes that there is a complex set of factors
related to the borrowers’ attributes that can greatly influence demand for credit. As outlined in
the preceding sections, empirical studies generate inconsistent results with regard to factors
influencing loan demand by farm households. In general, literature suggests that the empirical
evidence on factors influencing rural loan demand is quite limited. Thus many authors such as
Mpuga (2010) and Otieno (2007) underscore the need for carefully analysing factors influencing
the borrowing behavior of households or firms if the extent of demand for loans and underlying
causes for low demand are to be properly understood. Kanoh and Pumpaisanchai (2006: 2)
suggest that analysing credit demand and credit supply separately helps in avoiding the
simultaneous problem, which is a contentious issue in assessing changes in lending activities and
behaviors of banks. It is therefore necessary to model farmers’ and their cooperatives’ demand
for institutional credit in order to provide better explanations on underlying relationships
between borrowing decisions and factors influencing that behavior.
Literature documents that existing studies adopted different approaches in measuring loan
demand. There is a general consensus that measuring credit demand is a complicated undertaking
as demand is reflected in different ways. As Atieno (2001) points out, a number of conceptual
problems are identified in estimating credit demand, particularly in such fragmented and
imperfect rural credit markets. Nagarajan et al. (1998) argue that estimates of loan demand are
often biased and inefficient due to use of models that do not properly address selectivity bias or
use of data that do not capture loans from multiple sources. Some studies tend to base their

86
analysis on the observed loan amounts or approved loan applications, while others use the sum of
loans approved and loans rejected by banks. Several scholars (e.g. Atieno, 2001; Wiboonpongse
et al., 2006) argue that it is misleading to identify a loan demand based on information for
observed loan amount only since this reflects merely the existing supply. They note that data
truncation by omitting non-borrowers and loan size rationing have been undermined by some of
the previous studies that attempted to estimate loan demand in a number of developing countries.
Sharing similar views, Barslund and Tarp (2008: 490) state that in instances where only matched
(approved) loan applications are observable, the researcher cannot identify the factors affecting
real credit demand by households. Even with data on rejected loan applications, identification of
‘self-constrained’ households or firms is a challenging task. Thus in their analysis of credit
demand, they categorised households as demanding credit if they: (i) obtained a loan; (ii) had a
loan application rejected; or (iii) did not apply even if they wanted credit. Fletschner et al (2010)
affirm that identifying the level of constraints of non-applicants of loan is more challenging as
this group likely consists of heterogeneous individuals or households including: (a) those who do
not want a loan due to lack of profitable business requiring external finance; (b) those who want
loans but do not apply because they think that their request will be rejected; (c) those who
believe they qualify for a loan but are discouraged from applying by transaction costs, lenders
requirements and associated risks and constraints. Kanoh and Pumpaisanchai (2006) note that
survey data that include both borrowers and non-borrowers provide several benefits in analysing
loan demand as it provides qualitative information about the credit market that cannot be
obtained from the observed credit data.
The common aspects often assessed by studies that look at loan demand are examining whether
the household or firm wants to borrow (including preferred sources) and extent or volume of
loan demanded and factors influencing them. Several empirical studies (e.g. Mpuga, 2010;
Zeller, 1994; Messah and Wangai, 2011; Okurut et al, 2004; Tang et al, 2010; and Zapata, 2006)
used binary choice Probit model to examine the determinants of household’s or firm’s decisions
to apply for a loan and/or which sector (formal versus informal) to borrow from. Some studies
such as Frangos et al (2012) used logistic regression, which is obviously very much similar to
the Probit model in assessing factors affecting decision for taking institutional loans.

87
Nevertheless, the borrowing choice between the formal and informal sectors has not been
considered a relevant issue in the present study. This is due to the fact that contrary to the case of
individual households, it is not a common practice for farmer cooperatives to take loans from
informal credit sources. Thus the central focus of the current study was examining probability of
demanding for loans and volume of loans demanded by cooperatives and their determinants.
On the other hand, a number of studies (e.g. Mpuga, 2010; Nagarajan et al, 1998; Ajagbe et al,
2012) used Tobit model to estimate the determinants of the amount of loan demanded by
households or small entrepreneurs, while Wiboonpongse et al, (2006) estimated Tobit model
type II to investigate factors affecting decision to borrow and volume of loan demanded. As
Ukurut et al (2004) note, where the dependent variable measures values, ordinary OLS
regression is subject to possible sample selection bias. The common approach for dealing with
such sample selection bias is the use of the Heckit or Heckman two-step selection model13
which
accounts for sample selection problems14
(Ukurut et al, 2004; Bushway et al, 2007; Sigleman
and Zeng, 1999). Sigelman and Zeng (1999: 167) note that the Heckit model has emerged as the
de facto default alternative to the Tobit model when values cluster at zero due to selection bias
rather than censoring. Heckman (1979) argues that those who decide to participate in borrowing
constitute a self-selected sample and not a random sample. Moreover, standard Tobit model
imposes an assumption which is often too restrictive: exactly the same variables affecting the
probability of a non-zero observation determine the level of a positive observation and with the
same sign (Verbeeck, 2004: 227). However, Heckman estimation assumes that different sets of
variables govern the probability of demanding for a loan and the intensity of loan demand. Thus
Heckman two-step selection approach provides a mechanism to correct for non-randomly
selected samples by accounting for information on those who decided not to participate in
borrowing. In other words, it does not consider the demand of those who did not participate
completely as zero (Gronau, 1974; Heckman, 1976). We, therefore, employ Heckman’s two-step
selection model in the current study, where selection into the sample of those who need loan is
13
Heckman’s sample selection model is also referred to as “Tobit-2’’ model by some (e.g. Amemiya, 1994 as cited
by Toomet and Henningsen, 2008) 14
Sample selection bias may arise in practice for two reasons. First, there may be self-selection by the individuals or
data units being investigated. Second, sample selection decisions by analysts or data processors operate in much the
same fashion as self-selection (Heckman, 1979: 153).

88
first modeled and in the second step we incorporate the inverse Mills ratio (lambda) generated in
the selection equation into the equation of interest to overcome the sample selection bias.
Existing studies used a mixed set of quantitative and qualitative variables in the models used to
examine factors influencing borrowing decisions. These include among others: attributes of the
borrowing households or firms, attributes of the loan and lending institutions, and other
exogenous factors. With regard to small firms, owners or managers’ attributes and characteristics
of the firm/enterprise appear to be given greater emphasis as important factors in determining
their borrowing behavior.
3.2.6 Analytical approaches employed in examining determinants of loan demand under
the current study
The factors that may affect cooperative’s propensity to borrow and amount of loan to borrow can
be broadly grouped into:(1) Cooperative’s attributes (institutional, managerial, business and
economic), (2) loan and lending institutions characteristics (3) Proxies for other exogenous
factors. This study focuses on examining the associations between cooperatives’ loan demand
and their institutional, business and managers’ attributes. Literature affirms that
owner/manager’s attributes (such as age, level of education, etc.) are firms’ institutional and
business attributes (such as resource endowment, human resources, economic and business
activities, etc.) are important factors that greatly influence borrowing decisions, access to and
effective utilisation of loans. Thus factors related to cooperative’s institutional, business and
managers’ attributes are the explanatory variables that are used in the econometric model
presented in the next section.
In view of their expected limited influence on loan demand in the current context, some variables
(which were considered in other previous studies) have not been included in this study. For
instance, though several studies report that gender of the head of the household or
owner/manager of a firm is an important determinant of demand for and access to credit, it has
not been included in the current analysis. This is due to the fact that none of the cooperatives had
reported having female management committee chairperson or manager. Moreover, the number
of employees of a firm can logically have an influence on its loan demand. The descriptive data

89
however shows that the vast majority of the cooperatives have only one or two full-time
employed workers, who are mainly security guards. Thus this variable too was not included in
the current loan demand analysis. In addition, though participation in the current guarantee
scheme is expected to enhance cooperatives’ demand for and access to bank loan, the data on
loan demand was collected at the beginning of the intervention. Thus this variable was not
expected to have significant influence on cooperatives’ loan demand at the beginning of the
intervention.
The loan demand process basically follows two logical stages. In the first stage, the cooperative
decides to demand (apply) for institutional loan or not. In the second stage, the cooperative
decides on the amount of loan to apply for. In this study, we adopted two approaches in
measuring loan demand (i.e. both the decision to borrow and the amount to borrow). With the
first approach, cooperatives’ actual loan applications were considered, whereby we asked
cooperatives whether they had applied for a bank loan (directly or through their union) during
the year 2011. This is a dummy variable taking on two values; i.e. if a cooperative responded
“Yes”; it will take a value of 1, or 0 otherwise. We then posed a follow up question to
cooperatives that replied ‘Yes’ by asking them the volume of loan they applied for in 2011. The
dependent variable (amount of loan demanded) in this case is a quantitative variable. We
designated the credit demand identified through the first approach as Demand-A. We recognise
that this apparently does not reflect the true loan demand as most cooperatives are likely to be
self-constrained or self-credit rationed for various reasons. Given the current limited
participation of cooperatives in the credit market, neither loan applications submitted by
cooperatives nor loan requests approved by banks can provide a true picture of the loan demand
among cooperatives. Therefore, with the intention of considering the potential demand of self-
constrained cooperatives as well as to compare this potential demand with the actual demand
they revealed in 2011, we further employed a second approach. In the second approach, we
posed a question to a cooperative if they seriously and genuinely demand for a loan during the
following year (2012 coffee season). A value of 1 is assigned to cooperatives that answered
‘Yes’ to these questions and 0 otherwise. We went on and asked those who responded “Yes” to
this question the amount of loan they demand. In our analysis, the loan demand captured through
the second approach was referred to as loan Demand-B. The later approach tends to reflect their

90
desire and potential to demand for loans which may not be necessarily transformed into actual or
revealed demand without further interventions.
As indicated above, in our empirical analysis of loan demand, we employed the Heckman two-
step selection approach. In step 1, we estimated the probability of a cooperative’s demand for a
loan, which is done on the basis of the probit model. Though the probit model offers important
information about the decision to demand for credit, it does not tell us anything about the volume
of credit demanded by a cooperative in relation to its institutional, business and managerial
characteristics. Thus in the second stage, using the Heckman two-step selection model, we
investigated factors affecting volume of loan demanded by cooperatives, which in this context is
defined as the amount, in ET Birr, cooperatives reported to demand. This was carried out by
including the inverse Mill’s ratio derived from the probit estimates into the second stage
estimation. The specification of the Heckman two-step selection model is as follows.
The Heckman correction takes place in two stages. In the first stage, we formulate a model for
the probability of borrowing. The participation or selection equation can be specified with a
probit regression of the form:
0uZ1C iii (1)
Where i is the indexes of cooperatives ),...,1( Ni , Ci represents the decision to borrow (Ci = 1 if
the cooperative decides to take credit and zero otherwise), Zi is a vector of explanatory variables
assumed to explain the probability of borrowing, γ is a vector of the parameters to be estimated,
and iu is the idiosyncratic error term.
In the second stage, we correct for self-selection by incorporating a transformation of these
predicted individual probabilities as an additional explanatory variable. The demand equation
can be specified as follows:
1 if 11 iiii CxY (2)

91
xi denotes a vector of explanatory variables and iY denotes amount of loan demanded by
cooperative i. The volume of loan demanded is not observed for cooperatives that do not demand
loans.
The term ii ZZ 15
is known as the inverse Mill’s ratio or Heckman’s lambda. The first
step is to estimate the correlation term (Heckman’s lambda) by maximum likelihood probit
model. The next step is to estimate the model using ordinary least squares with the estimated bias
term as an explanatory variable using only the observations in the truncated sample with Yi > 0.
Under the assumption that the error terms are jointly normal, we have,
)();1,( ZXZCXYE ii (3)
Where ρ is the correlation between unobserved determinants of propensity to borrow and
unobserved determinants of credit demand and λ is the inverse Mills ratio.
Description of variables and working hypotheses
Review of literature and empirical findings of research on rural credit and the current
researcher’s knowledge of the study areas/issues were used in structuring working hypotheses for
this section. Description of explanatory variables related to cooperative managers, institutional
and business attributes, which are hypothesised to influence borrowing decisions of cooperatives
in the study areas, on a priori grounds, are outlined below. These variables were included in the
Heckman two-step selection model.
Cooperative’s manager/chairperson age (AGCHAI): There is a general belief that as age
progresses, individuals may become more risk averse, conservative and skeptical. Mpuga (2010)
suggests that the young may tend to save and/or borrow more for investment while the old may
be less inclined to borrow. It is hypothesised that cooperative manager’s age and probability of
borrowing and amount to borrow from formal institutions are inversely correlated.
15
is the standard normal probability density function and is the standard normal cumulative density
function

92
Educational level of cooperative manager/chairperson (EDUCATN): This represents the level of
schooling attended by the person heading the cooperative. For the purpose of the current
analysis, educational status has two categories which are expressed as a dummy variable
represented by zero for no or only informal education and 1 for attending formal schooling.
Several studies (e.g. Ajagbe et al, 2012; Mpuga, 2010; Zapata, 2006) report that education
positively affects entrepreneurs’ decision to apply for, the amount of loan applied for and the
chances of accessing loans. Higher educational level can, for example, enable the manager to
prepare sound business plans and loan applications that can convince the lender. Thus education
of the coops leader is expected to increase borrowing decision and the amount to be borrowed.
Having professional manager (PROMANG): Having full-time employed professional manager
could be a crucial factor that influences the nature, magnitude and scope of business activities,
and overall performance of the cooperatives and their demand for credit. Having full-time paid
professional manager is thus expected to increase the probability of demanding for loan and the
volume of loan demanded.
Age of the cooperative (COOPAG): Age of the cooperative refers to the number of full years
since their formal establishment up to the date of this survey. It is normal to expect that older
cooperatives have better experience and well established business activities (that may require
additional financing), better opportunity to form links with various institutions as well as to
accumulate assets that can be used as collateral to access loans. Some (e.g. Zapata, 2006) argue
that the length of the firms’ existence affects the lender’s rationing behaviors. It is therefore
anticipated that the age of the cooperative is positively correlated with its loan demand.
Cooperative’s member size (MSIZE): It can be argued that the member size of a cooperative can
reflect farmers’ interest and confidence towards cooperatives. It can also be related to the
magnitude of business activities because agricultural cooperatives mainly depend on incomes
generated by marketing members’ produce. Cooperatives with large member size are therefore
expected to depict higher demand for bank loans (both in terms of seeking loans and volume of
loan demanded).

93
Total capital (TOTCAP): Total capital (in Birr) is the proxy for the initial endowment for
cooperatives and is calculated as the sum of physical assets, equipment, share/bonds, cash in
bank and cash on stock. Several studies(e.g. Zapata, 2006; Mpuga, 2010; Aga and Reilly, 2011)
reported that firms that have better assets are more likely to seek and/or secure formal credit.
This could enhance their ability to provide viable collateral and is likely to boost lenders’
confidence to extend loans. Zapata (2006) notes that businesses with smaller asset size and lower
daily sales experience greater rationing from lenders. Though in certain cases, the effect is
ambiguous as it can be argued that businesses with higher capital can meet at least part of their
financial needs, we hypothesise that the level of total capital is generally positively associated
with higher probability of demanding loan.
Liability (LIA2012): This refers to the sum of all outstanding loans (when the survey took place)
that the cooperative has to repay to the creditor. It can be logically expected that cooperatives
with large outstanding liabilities may refrain from taking additional loans, or lending institutions
may be reluctant to provide additional credit. On the other hand, cooperatives with outstanding
liabilities may look for more loans to settle their outstanding loans and for additional business
undertakings. It was therefore hypothesised that liability would have either positive or negative
effects on demand for loan.
Total annual income (TOTINC): This refers to the total annual sales revenue generated both from
coffee and non-coffee business activities during the year (in Birr). This can reflect the level of
business activities of the cooperative. Mpuga (2010) argues that economic activities, needs and
expenditure increase with an individual’s/household’s income. Entrepreneurs with higher income
may also have a better chance to accumulate sufficient asset that can serve as collateral to
acquire more loans as well as may aim to further expand their business. It can thus be expected
that a higher value of cash income increases the probability of demanding for additional finance.
On the other hand, earning higher income may also enable cooperatives to self-finance at least
part of their financial requirements.
Total expenditure (TOTEXP): This represents the sum of all kinds of expenditures incurred by
the cooperative during the year 2012 both for productive business activities and social and other
purposes. The level of expenditure can reflect the magnitude of business activities of the

94
cooperative. It is therefore expected that the greater the level of expenditure the more likely the
cooperative is to demand credit - both probability of borrowing and amount demanded.
Experience in coffee business (LENBUSS): Coffee business (in terms of processing and
marketing) requires substantial amount of capital. Cooperatives with longer experience in coffee
business are more likely to establish links with various institutions and may undertake better and
larger business activities. Moreover, experience enhances the technical and managerial skills of
cooperatives. It is thus anticipated that the length of experience in coffee business (in years)
increases the probability and amount of loan demands.
Primary activities of the cooperative (MBUSACT): The primary activity/sector in which the
borrower is engaged, as Mpuga (2010) notes, can influence its demand for credit. Moreover,
lenders may relate the growth or riskiness of a firm to the nature and riskiness of the sector
which it operates in (Aga and Reilly, 2011). On the other hand, involvement in various business
activities may enable cooperatives to generate cash that would help them self-finance and relax
their financial constraints. It is also possible that engagement in diverse business activities can
raise their appetite for loan. Thus the association of this variable with loan demand can be
positive or negative. This is a dummy variable that takes the value of 1 if the cooperative is
engaged in coffee and other trade activities, and 0 if only involved in coffee trade.
Membership to union (UNIMEMB): A study in Ethiopia (Aga and Reilly, 2011) reports that a
firm that is a member of a business association is more likely to have access to credit. This could
be due to the fact that membership of such organisations can increase links, information flow and
trust among member (sister) firms and with others. Experience also shows that cooperatives
affiliated to unions appear to have better business activities than non-members. This variable is
thus expected to positively associate with demand for loan – both probability of demand for and
volume of loan demanded.
Regional Location (LOCSNNP and LOCOROMO): The location of the firm could be an
important factor that determines its demand for and access to credit. This can be related to
population density, loan scarcity, market opportunity, and spatial distribution of financial
institutions (Aga and Reilly, 2011). In relation to coffee production, location can also be related

95
to water availability (which influences productivity and choice of processing method), coffee
farming system, infrastructure, service provisions (extension, finance, etc), union’s strength and
operations, and economic activities. Barslund and Tarp (2008) found huge regional difference in
the demand for credit in Vietnam. However, a priori expectation about the sign of this
association is not clear. Taking the cooperatives in the SNNP region as a reference dummy
variable, dummy for cooperatives in Oromia (LOCOROMO) was considered in the model. In
other words, a value of 1 was assigned to cooperatives from the Oromia region and 0 otherwise.
Distance from banks (DISBANK): The distance from the lending financial institution could be an
important factor determining access to loans. It can have implications for awareness about the
service, trust between the lender and borrower, and transaction costs. Several studies (e.g. Khan
and Hussain, 2011; Barslund and Tarp, 2008) report that the demand for a loan is negatively
related to the distance between the borrower and the lending institution. This was however not
expected to have significant impact on the volume of loan demanded.
Previous default (DEFAULT): This is a dummy variable whereby a value of 1 was assigned if a
particular cooperative had ever defaulted and 0 otherwise. Cases of previous default can prevent
cooperatives from accessing new loans. Therefore, it was hypothesised that those cooperatives
which defaulted on previous loans would have less probability of demanding for loans. This was
however not expected to significantly affect the amount to borrow.

96
3.3. Intervening Through a Loan Guarantee
This section provides literature review and theoretical discussions on issues related to various
aspects of loan guarantee interventions.
3.3.1. What is a loan guarantee and why it is chosen?
Small scale farmers, urban poor and small entrepreneurs often encounter difficulties in accessing
financial resources which largely emanate from imperfect financial markets. Governments,
donors and other agencies often intervene in financial markets through various measures to
address the financial constraints facing the poor and small enterprises. The major tools used to
foster flow of financial resources to small enterprises include direct and special lending
programmes, government-funded wholesale credit, credit guarantee scheme, interest subsidy and
regulative subsidies (Tunahan and Dizkirici, 2012; Saldana, 2000). Many scholars (e.g. Tunahan
and Dizkirici, 2012; Zecchini and Ventura, 2009; Kuo et al, 2011; Back et al, 2010; Kang and
Heshmati, 2008) posit that credit guarantee is the most popular measure accepted as an effective
mechanism to alleviate SMEs’ financing constraints, and help to attain national economic and
social development goals. Some (e.g. Saadani et al, 2010) note that partial credit guarantees
cause less market distortions compared to other financial intervention measures due to their
limited interference in credit allocations of financial institutions. Though the origin of credit
guarantees is traced back to the developed countries of the West and North, donor agencies and
national governments have widely supported the set-up of such schemes across many developing
world in recent decades. Cowling and Mitchell (2003) note that loan guarantee is a central
element of Governments’ SME policy in both developed and developing countries. Apart from
national governments, donors, non-governmental organisations and private agencies have been
widely involved in supporting loan guarantee programmes that target small entrepreneurs.
A credit guarantee16
is ‘‘a financial product that a small entrepreneur can buy as a partial
substitute for collateral; it is a promise by a guarantor to pay to the lender all or part of the
defaulted loan amount’’ (Deelen and Molenaar, 2004: 11). According to Beck et al (2010), a
16
In the literature the expressions of credit guarantees and loan guarantees are used interchangeably (Jonson, 2009).

97
partial credit guarantee fund is a risk transfer and risk diversification mechanism. Loan
guarantees cover an agreed percentage of the loan losses, depending on the risk coverage
arrangement. In case of any default, the lending institution under such an arrangement claims the
value of the guaranteed loan loss from the guarantee fund based on the agreed coverage level.
Credit guarantees primarily aim at encouraging financial institutions to boost their lending to
those sectors that are traditionally perceived as risky and/or without adequate assets to pledge as
collateral. Many (e.g. Deelen and Molenaar, 2004; Green, 2003; Tunahan and Dizkirici, 2012)
note that the main target group for a loan guarantee programme are small and micro
entrepreneurs who have feasible projects and repayment capacity, but who cannot obtain bank
loan due to limitations in meeting lending requirements such as loan security. The reluctance on
the part of the lenders to extend loans to rural-based smallholders and other small enterprises
could be mitigated at least in part by introducing a credit guarantee (World Bank, 1994). Saldana
(2000) indicates the need for credit guarantees to support three types of firms, namely: those with
insufficient collateral, those with insufficient credit history and for start-up projects. Deelen and
Molenaar (2004) however argue that a guarantee fund should not be normally needed at start-up
phase of an enterprise. They go on to suggest that the aim of CGSs is to support productive loans
that promote enterprise development that generate income, and not to promote consumption
loans. Designers of a guarantee programme thus need to carefully consider the objective of the
intervention as well as critically analyse the situation of the targeted borrowers in deciding
appropriate loan and target group eligibility criteria and whether to promote initiation of new
projects/businesses or to support operations of existing ones.
Some studies (e.g. D’Ignazio and Menon, 2013; Green, 2003; World Bank, 1994) claim that in
addition to mitigating credit rationing, loan guarantees have a role in improving the terms of a
loan as well as in reducing borrowing costs. In addition, some analysts (e.g. Kuo et al, 2011;
Craig et al, 2009) suggest that loan guarantees can minimise problems of adverse selection and
moral hazard. Because the lower interest rate (expected to be offered because of the guarantee)
encourages or allows less risky borrowers to participate in the borrowing activities. Likewise,
some (e.g. Levitsky, 1997; DFID, 2005; Freedman, 2004) suggest that credit guarantee schemes
can be an effective tool in changing lender’s behavior as it allows them to test and check that
lending to this market segment may not be that risky. In other words, through learning-by-

98
lending, credit guarantees offer banks an opportunity to gain a better understanding about small
entrepreneurs, their businesses, their financial requirements, challenges, and better ways of
dealing with them. Another important contribution of a credit guarantee, as Green (2003) notes,
is that it may induce some sort of competition in the banking sector, which can improve credit
allocations with better terms. In addition, some (e.g. Deelen and Molenaar, 2004; Green, 2003)
claim that credit guarantees can rectify information asymmetries that often lead to credit market
imperfections and the resultant credit rationing. However, as Beck et al (2010) noted, this
informational advantage can be realised only when the guarantor has better information about the
borrower than the lender, which might not be the case in many guarantee programmes.
Moreover, Deelen and Molenaar (2004) argue that many banks in developing countries are over-
liquid but do not put their funds to use because of the perceived high risk of potential borrowers
(such as small entrepreneurs). Guarantee funds can thus help to channel such un-utilised
resources into the economy. However, in reality this does not seem to be the case under the
Ethiopian context where most banks experience problems related to limited financial position.
Riding and Haines (2001) note that loan guarantee programmes are an efficient means of
creating jobs. Such merits of loan guarantee funds are usually used by governments to justify
their expenditure in such programmes, especially as a job creation mechanism for the youth.
According to Green (2003), in addition to their role in enabling investments in physical capital,
through consultancy, training and other services, such intervention can contribute to the
development of human capital. Moreover, supporting enterprises and entrepreneurs in rural and
marginalised areas can contribute to regional development and help to reduce rural-urban
migration. Green further states that CGSs can pursue social goals, such as reducing social
tensions, empowering marginalised groups or assisting in post-war reconstruction efforts.
3.3.2. Typology, design and modes of operation of Loan Guarantee Schemes
Although all credit guarantee schemes aim at improving access of small enterprises to
institutional credit, they often differ in their design features, mode of operation, funding source,
target group and so forth. All loan guarantee programmes involve at least three parties who take
part with different motives (Riding et al, 2007) - borrower, lender and guarantor. According to
Deelen and Molenaar (2004), credit guarantee programmes date back to the 19th
century, when

99
the first CGSs were set-up in Europe in 1840s. Those early schemes were essentially mutual
guarantee associations, whereby several entrepreneurs come together and contribute their own
funds to provide guarantees for each other. At present, the number of credit guarantee
programmes across the globe has shown substantial growth (Tunahan and Dizkirici, 2012).
Green (2003) reported that there were more than 2250 CGSs in 100 countries, and the largest and
well-established schemes were operating in OECD countries and Asia. Deelen and Molenaar
(2004) note that a series of guarantee fund programmes were tried in developing countries in the
1970s and 1980s, which were largely donor-driven initiatives. Evidence shows that many of
them encountered failures, which caused some pause among the donor communities and
development agencies in promoting them. The failures, as Davies (2007; cited by Panetta, 2012)
argues, were mostly due to deficiencies in the wider institutional environment as the schemes
were highly politicised and undermined financial criterion or economic conditions affecting the
borrower’s ability to effectively utilise and repay. However, interest in and support for credit
guarantee programmes were revived in 1990s (Green, 2003; Deelen and Molenaar, 2004). This
could be, at least partly, attributed to the removal of other forms of financial intervention
following adoption of the SAP measures in the 1980s and 1990s.
Based on data from 76 countries, Beck et al (2010) reported that while many countries have such
schemes, their ownership, pricing, risk assessment, management and funding structures vary.
Likewise, reviewing the experiences of various schemes, Levitsky (1997) reported variations in
eligibility, leverage, risk sharing, guarantee administration, fees and claim procedures across
different schemes. Studies (e.g. Beck et al, 2008) show prevalence of various specialisations in
partial credit guarantee programmes, whereby most of them were restricted to certain groups
(such as small enterprises) or specific regions or sectors. Green (2003) argues that the key
distinction of loan guarantee programmes should not be the terminology assigned to them but the
operators of the scheme. Green (2003: 18) outlines five major types of guarantee systems based
on the operators of the schemes: mutual guarantee associations, publicly operated national
schemes, corporate schemes17
, schemes initiated through bilateral or multilateral cooperation and
those operated by NGOs. Several authors (e.g. Tunahan and Dizkirici, 2012; Navajas, 2001;
Green, 2003) discussed various classifications of credit guarantee programmes operating in
17 Corporate associations are established, funded and operated by the private sector (Beck et al, 2010).
100
various countries. The major types include: mutual versus non-mutual programmes;
closed/targeted programmes versus open programmes; partial guarantee programme versus those
with full guarantee; funded versus unfunded programmes; direct guarantee versus indirect
guarantee programmes; guarantee based on business versus guarantee based on portfolio; and ex-
ante versus ex-post programmes18
. Navajas (2001) notes that since these classifications are
related to different aspects, they are not mutually exclusive. Many (e.g. Deelen and Molenaar,
2004) argue that in reality any single CGS combines features of the different models. One of
popular classification of a credit guarantee scheme is related to the role and responsibility in
screening eligible borrowers, i.e. individual versus portfolio approach. In some schemes lending
institutions are responsible for credit decisions (screening and approval of loans), while in other
cases guarantors (guarantee administrators) play an active role in evaluating each and every
application for guaranteed loans. Evidence (e.g. Beck et al, 2010) suggest that guaranteeing
individual loans (as opposed to the portfolio approach) has the advantage of reducing risk for the
guarantor, while such undertaking obviously involves substantial costs.
Deelen and Molenaar (2004) underscore that there is no blueprint or one particular model that
always works better than others under all situations. The most important thing is choosing and
devising the most relevant model for that particular context. Deelen and Molenaar suggest that
when designing a guarantee scheme, the existing financial landscape, the socio-cultural set-ups,
and the prevailing rules and regulations have to be taken into account. More importantly, CGSs
have to exhibit some flexibility and be adapted and changed based on the experience gained and
changing situations during the course of their actual implementation (Levitsky, 1997).
18 In the case of Direct Guarantee, the donor agency acts as the guarantor and pays the agreed percentage upon default. The
borroer is presented for guaranteeing by a lender and the guarantor decides whether to guarantee the loan or not. In the case of
Indirect Guarantee, a third party administers the fund established by the donor agency and the claim is debited to the fund by the
third party and can take place without direct involvement of the donor. In the Individual model, each borrower is approved by
the guarantor, while the borrowers still have to fulfil the lender’s requirements. In the Portfolio model, the guarantor does not
approve single loans, but negotiates the criteria for the portfolio it is guaranteeing. All loans meeting these criteria will be
automatically guaranteed by the fund. The funded and unfunded schemes classification relates to the funding of the scheme.
Funded schemes can be financed only by the central bank, or by banks participating in the fund; or by banking and non-banking
institutions. In the case of Unfunded schemes, the government finances the guarantees and pays claims on loan defaults. On the
other hand, commercial banks administrate the fund and decide if a loan is to be guaranteed or not. If there is no special
requirement for the target group, the scheme is said to be open. But the Targeted (closed) scheme is introduced to support a
particular target group. But not every member of the target group will be automatically guaranteed. In Ex-ante schemes, the
borrower presents his/her project and request to the guarantor. If the guarantor agrees to guarantee, it issues a letter of
guarantee favouring the borrower. In the case of Ex-post schemes, the lender evaluates the borrower and once the loan is
approved, the latter is referred to a CGS and applies to the guarantee. The Intermediary model is especially suitable for micro
finance. It consists of a guarantee from a bank to a non-bank micro finance institution. Then, the micro lender uses the funds to
loan or finance a line of credit for micro entrepreneurs (Navajas, 2001).

101
.
3.3.2.1. Risk sharing in a loan guarantee scheme
There are many variations in the risk sharing arrangements of credit guarantee schemes designed
in different countries. The common practice is a partial guarantee scheme whereby the lender
and the guarantor each bear a fixed portion of the loan loss. There are also some schemes that
require the guarantor to cover all of the loss up to some fixed portion of the total guaranteed
loans. Each approach and type has different incentives and costs (Honohan, 2010). Deelen and
Molenaar (2004) recommend that in all guaranteed lending arrangements it would be good if all
the three parties involved in the scheme have something at stake. This would motivate them to
exert genuine efforts in minimising the risk of loan loss. Levitsky (1997) similarly argues that a
100% risk coverage is liable to moral hazards on the part of both the lending bank and the
guaranteed loan borrower. The author notes that at present, a 100% guarantee coverage is mainly
confined to countries like Canada, Japan, Luxembourg, Spain and, to a certain extent, to South
Africa, where the financial sector and banking system are well developed. Based on the
experiences from a credit guarantee programme in Japan, Iichiro et al (2006) argue that a 100%
risk coverage had a number of undesirable effects by reducing the efforts of the borrower firms
to improve their capacity and eligibility. Moreover, such high risk coverage resulted in moral
hazard both among lenders and borrower firms (who tried to strategically default).
A number of factors dictate the level of risk coverage that the guarantor of a guarantee
programme should absorb. In general, the risk sharing arrangement needs to take into account the
loan screening, delivery and recovery mechanisms, and the nature of the targeted borrowers and
their enterprise, among others. Deelen and Molenaar (2004) propose that if a lender has
consistently extended poorly performing guaranteed loans, the guarantor should lower the
percentage of risk coverage on future loans or increase its fees. A study based on the Canadian
scheme (Riding and Haines, 2001) shows that tiny reduction in the level of a guarantee coverage
could lead to substantial reductions in default rates. Deelen and Molenaar (2004) however warn
that lenders are unlikely to find an offer of less than 50% risk coverage attractive as they have to
undertake the loan appraisal, follow up and recovery process. Under schemes with other
attractive incentives for the participating banks, a reasonably low level risk-sharing may not
cause significant reluctance in extending guaranteed loans. Most of the CGSs reviewed earlier by

102
Levitsky (1997) have guarantees of between 60% and 80% of the loan amount, while few (25%)
had 50% cover and just 11% were providing 100% coverage. In general, as Freedman (2004)
notes, choosing the level of risk coverage represents a trade-off between minimising moral
hazard and maximising the ability of the intervention to promote additional lending activities.
Thus, as Deelen and Molenaar (2004) suggest, the level of risk coverage has to be carefully
negotiated with the lending bank and mutually agreed up on. In some schemes, the borrowers are
also required to have some contribution in the form of equity. The level of such equity
contribution may differ from country to country depending on the conditions of the financial
markets and the internal regulatory environment (Deelen and Molenaar, 2004).
3.3.3. Additionality and loan fund leverage
Many agree that one of the primary contributions of a credit guarantee is generating additionality
or incrementality19
. Providing a precise definition of additionality is not that easy as it is
understood and expressed in various ways. In its simplest form, additionality refers to the
additional loans extended to targeted borrowers as a result of the guarantee provided to the
lender or the amount of loans that the lending bank has in its portfolio that it would have rejected
were it not for the guarantee (Levitsky, 1997: 14; Saldana, 2000: 42). This definition however
appears to focus only on one aspect of additionality, i.e. financial additionality20
. In short,
financial additionality measures the direct effect of the credit guarantee scheme on the
relationship between the bank and the borrowing firm (Panetta, 2012). Various authors (Green,
2003; Meyer and Nagarajan, 1996; Levitsky, 1997; Panetta, 2012) maintain that the presence of
a loan guarantee may improve the loan terms and conditions, which can be taken as another form
of financial additionality. These include a longer repayment period, larger loan size, a less
stringent collateral requirement, reduction in interest rate, faster loan processing time, and
provision of loans on a more-timely basis. Thus studies that attempt to assess financial
additionality should not solely concentrate on the additional loans extended to the target
beneficiaries. Another important aspect is that credit guarantee schemes finally aim to achieve
19
The term additionality is popularly used in Europe, while incrementally is used in North America (Riding et al,
2007).But both refer to the same concept. 20
Financial additionality refers to an increase in access to institutional loans by targeted borrowers that would have
not been possible in the absence of a scheme.
103
economic additionality, which refers to the outcomes and long-term impacts such as
improvements achieved in borrowers’ business activities and economic returns and in the overall
economy. Such impacts may include an increase in the income, profit, survival rates of firms,
employment, wages, sales, new product development, competitiveness, productivity, output,
investment, economic growth and increase in tax revenue for the government (Green, 2003;
Panetta, 2012; Saadani et al, 2010). Economic additionality can take two dimensions: direct and
indirect economic additionality. The former refers to the direct impacts of the guaranteed loans
on the borrowers, while the later implies the indirect and wider benefits generated as a result of
the business and economic activities of the users of the guaranteed loans.
More importantly, a credit guarantee can act as a lever for generating substantial loan funds with
limited volume of guarantee funds. This can be realised by encouraging banks to channel more
loan funds to small entrepreneurs than they would normally have done. Thus leverage helps to
measure the amount of funds that have been supplied to borrowers because of the provision of
such loan guarantee. It is expressed as a ratio that is obtained by dividing the amount of loans
extended by the capital of the scheme. Tunahan and Dizkirici (2012) note that one of the key
indicators in evaluating financial sustainability of a credit guarantee programme is its leverage
ratio. Given the partial risk sharing nature of the guarantees and the unlikelihood of defaulting on
all disbursed guaranteed loans, guarantee funds are able to generate large amount of loans
compared to their capital (Ibid). For instance, a CGS with leverage ratio of 5 and 50% risk
coverage, can provide 5 USD guarantee by its 1 USD equity. Thus it provides 10 USD of loan
because of the 50% risk sharing. Deelen and Molenaar (2004: 54) provide an example of a
guarantee fund that has a capital of 1 million Euro. They report that past experiences show that
the average loss rate on guaranteed loans extended to small entrepreneurs is not more than 20%.
Thus for every 100 Euro loaned, not more than 20 Euro will be lost. That means banks can safely
extend loans up to five times the size of the guarantee fund with 100% coverage. So with a one
million Euro guaranteed fund, a total of five million Euros loans can be guaranteed even with
100% risk coverage, i.e. can generate a leverage of 5.
Many (e.g. Deelen and Molenaar, 2004) generally claim that the higher the leverage, the greater
the achievement of the guarantee fund. Tunahan and Dizkirici (2012) however suggest that a

104
healthy guarantee programme has to keep its leverage ratio under a certain level without heavily
reducing the ratio as it will restrict borrowers benefiting from the guarantees. Many (e.g.
Levitsky, 1997; Deelen and Molenaar, 2004) point out that with a well-functioning guarantee
fund, it is possible to generate a reasonable level of leverage (5:1 or 10:1), i.e. a loan portfolio of
5 to 10 times the amount of the guarantee fund within a period of about 10 years of its operation.
They however warn that the default rate has to be taken into account before determining the most
appropriate level of leverage.
3.3.4. What do critics say about loan guarantees?
There is no consensus about the effectiveness and impacts of a credit guarantee scheme in
enhancing financial flow to the small enterprise sector and its outcomes. Evidence is not only
scant, the findings of available studies are also inconsistent. Zecchini and Ventura (2009)
maintain that it is still subject to debates whether state-funded CGS is an effective instrument to
promote lending to small enterprises. Some scholars (e.g. Riding et al, 2007; Craig et al, 2009)
note that though in theory loan guarantees are said to reduce credit rationing, presence of market
imperfection may not necessarily need government intervention to correct it. Some argue that
lack of collateral is not a decisive factor in discouraging banks from widely reaching out to small
enterprises (Levitsky, 1997). In particular, under a financial market that experiences heavy state
intervention and operate in tighter monetary and regulatory environments, such schemes may fail
to generate substantial financial additionality. Some (e.g. Craig et al, 2009) even argue that such
selective credit allocation is likely to be an inefficient and possibly counterproductive policy
instrument. Green (2003: Vii) highlights the arguments advanced by critics against governments’
efforts to intervene in the financial market through publicly-funded schemes. Firstly, we are not
sure whether CGSs are a first-best measure to address the credit market failures. Secondly, it is
doubtful whether CGSs effect the desired changes in the financial sector and result in substantial
financial and economic additionality. In addition, others (e.g. Zecchini and Ventura, 2009;
Navajas (2001) posit that credit guarantees are costly instruments and may not be sustainable
over time. An assessment by Levitisky (1997) shows that transaction costs of such interventions
appear to be much higher than losses through defaults. Levitisky thus warns that credit
guarantees should not be taken as a substitute for correcting financial market or failure in the

105
legal system that often lead to credit rationing. In discussing potential drawbacks of the
government-supported partial CGSs Honohan (2010: 1 - 2) states that:
“while the market can find uses for partial credit guarantees, the attractions for public
policy can be illusory. Politicians can easily underestimate the true costs of such
guarantees. Lack of clarity in the goals of these schemes complicates a cost-benefit
analysis. Thus with many competing demands for public funds, the argument that such
schemes would increase credit allocations might not be strong enough to justify the need
for a subsidised credit guarantee system. Moreover, although CGS can help address the
adverse information problem that causes credit rationing, government-funded guarantee
administrators might not be at a better position in this regard. However, despite this
vulnerability of the CGSs to opportunistic politicians, they can offer genuine advantages
over direct government lending”.
Oh et al. (2008) on their part argue that the too generous and non-selective guarantee provision
may generate undesirable effects by impeding the development of an innovative financial market
and by making small entrepreneurs highly dependent on external interventions. The authors warn
that access of weak firms to guaranteed loans may prevent competitive firms from getting loans,
which inevitably result in a decline in the market share and economic returns of such competitive
and innovative firms. Likewise, as Craig et al. (2009) note, critics of the US’s Small Business
Administration (SBA) programmes claim that they unfairly benefit the financial institutions that
participate in the guaranteed lending programmes. Furthermore, some (e.g. Levitsky, 1997;
Posey and Reichert, 2011) warn that loan guarantees may introduce moral hazard if the lending
banks relax their screening, loan disbursement and recovery processes. Likewise, being aware of
the presence of such a loan guarantee may have an influence on the will and commitment of the
borrowers to properly repay the guaranteed loans. Levitsky (1997), however, noted that moral
hazard may not be a real danger since lending banks are zealous of their reputation for high loan-
portfolio performance, and will exert genuine efforts to avoid loan defaults. Moreover, though
borrowers are also aware of the fact that failure to repay their current debt will prevent them
from accessing future loans, they may still exhibit some degree of reluctance and opportunistic
behavior (for example by strategically defaulting). Some (e.g. Meyer and Nagarajan, 1996) argue
that since lending requires capital, which is often scarce, the excessive demand for guaranteed
loans by the targeted borrowers may surpass the amount of available loanable capital. Thus
credit guarantees may struggle to produce sufficient additionality due to lack of adequate
loanable fund.

106
3.3.5. What do empirical studies say about the role and impacts of loan guarantee
schemes?
Several studies attempted to measure the role and effectiveness of credit guarantee programmes
in alleviating credit constraints of small enterprises and their impacts on the economy. The
findings of most of such studies have been inconsistent and at times conflicting. Panetta (2012)
asserts that such notable variations in the findings of the different studies could be attributed to
the differences in the structure of the credit guarantee scheme analysed, in the nature of the
economy/market in which they operate and in the research methodology employed in analysing
it. Overall, a number of studies (e.g. Zecchini and Ventura, 2009; Mafimisebi et al, 2010; Craig
et al, 2007; Riding et al, 2007; 2008; Cowling and Mitchell, 2003; D’Ignazio and Menon, 2013;
Allinson et al, 2013) reported positive contributions and some successes of credit guarantee
schemes in various countries. For instance, Zecchini and Ventura (2009) in their study to assess
the impact of Italy’s public guarantees for SMEs reported that the scheme was effective in easing
SMEs’ financing constraints and in reducing their borrowing costs. The same study reported a
cost reduction between 16 and 20%, and an estimated additional loan of about 12.4%. A review
of various guarantee schemes (by Levitsky, 1997) reports that at least 30 to 35% additionality is
realised in all CGSs that were properly designed and implemented. Levitsky suggests that
additionality of at least 60% should be the minimum acceptable target for justifying existence of
a credit guarantee scheme. In their study of the Nigerian Agricultural CGS, Mafimisebi et al
(2010) found that, among other things, there has been growth in maximum amount of loan
obtainable by farmers, number and value of loans guaranteed, volume and value of loans fully
repaid and volume and value of default claims settled. More interestingly, they found that there
was a long-run convergence between the number and volume of guaranteed loans and the Gross
Agricultural Product.
A study by Craig et al (2007) assessed whether or not the USA’s SBA guaranteed lending has
generated a significant impact on local economic performance. They found a positive and
significant relationship between the levels of SBA’s guaranteed lending in the local market and
the future per capita income growth in that market. Posey and Reichert (2011) similarly tried to
examine the role of a loan guarantee in lines of credit granted to small businesses in the USA.
The findings confirm that the presence of a loan guarantee is indeed associated with lower

107
interest rates and smaller lines of credit. A study conducted in Korea (Oh et al, 2008) attempted
to evaluate the effect of the credit guarantee policy on various aspects. The results suggest that
credit guarantees significantly influenced firms’ ability to maintain their size as well as increased
their survival rate, but did not increase their R & D, investment and growth in productivity. A
study by Cowling and Mitchell (2003) on a CGS in the UK reported that the scheme has
successfully addressed the financial constraints of the majority of small businesses who obtained
loans under the scheme.
Some studies reported that the evaluated CGSs had partially achieved their goals. For instance,
Kang and Heshmati (2008), in their study to examine the effects of a credit guarantee scheme on
survival and performance of SMEs in Republic of Korea, reported that the scheme enhanced
performance of the beneficiary firms. On the contrary, they found that the effect of the guarantee
amount is ambiguous due to the difference between the contemporary effect and lagged effect.
They conclude that CGS partially attained its goal of alleviating SMEs’ difficulty in acquiring
finance and in stabilising employment. On the other hand, some studies revealed a total failure or
ineffectiveness of credit guarantee schemes in a number of countries. For example, a study by
Boocock and Sharif (2005; quoted by Oh et al, 2008) concluded that a Malaysian CGS in general
failed to satisfy financial additionality. Similarly, Zhang and Ye (2010) in their study of the
credit guarantee system for SMEs in China found complete inefficiency and failure of the
scheme in facilitating flow of financial resources to the SME sector, which severely hindered the
development of SMEs in China.
3.3.6. Factors influencing effectiveness and success of a credit guarantee scheme
The effectiveness of a credit guarantee programme could be enhanced or impaired by a host of
factors such as regulatory framework, financial situations of the lending banks, design and
operational features of the scheme, situations of the borrowing firms, input and output markets,
among other factors. Many (e.g. Green, 2003; Deelen and Molenaar, 2004; Honohan, 2010)
emphasise that proper functioning and success of a guarantee scheme is largely determined by its
operational design. These include, among others, whether the objectives are clearly defined or
not, procedures of extending the guarantees, eligibility criteria, risk sharing arrangements, fund
administration, and internal control and reporting systems. Particularly setting clear and precise

108
goals, realistic pricing, and integrating incentive features for the creditors are among the critical
conditions for such schemes to be able to achieve significant impacts (Honohan, 2010; Saldana,
2000). Thus in designing such a guarantee scheme efforts should be made to align the social and
economic incentives of the guarantor and the lending banks. In this regard, Green (2003) notes
that incentives for the lenders and borrowers to actively participate depend on the scheme’s
marketing efforts, risk sharing arrangement, presence of additional accompanying services, cost
effectiveness in screening and monitoring, level of fees, credibility of the guarantor and their
relation with the lender.
Green (2003) suggests that in order to achieve additionality, CGSs need to effect changes in the
banking sector, which may include influencing their risk perception of small firms or enterprises
and developing institutional capacity in small business lending. Some analysts (e.g. Hansen et
al., 2012) highlight the importance of selecting the right partners for the scheme and the
complementary role of capacity building. Experiences of other countries suggest that one of the
challenges of the guarantee programmes established in developing countries is persuading the
banks to participate in the programme (Tunahan and Dizkirici, 2012). According to Deelen and
Molenaar (2004) often banks can promise to participate in a CGS but eventually may fail to
actively participate in the actual lending activity. They claim that this is largely due to the
attitude of the bank officers, who are trained to deal with asset-based collateral and expect
borrowers to provide full coverage. In the views of Tunahan and Dizkirici (2012) ownership
structure of the banks can also influence their participation in such credit guarantee programmes.
They go on to suggest that participation of many banks whereby each one will have only a few
guaranteed loans can cause complications and increase the cost; thus the preferred approach
could be to include bigger banks with larger shares in the market. However, some have
reservation in that such an approach can discriminate the emerging, more innovative and
enthusiastic banks. In addition, the financial status of the participating banks obviously
influences its lending capacity. In order to overcome such a challenge, some (e.g. Deelen and
Molenaar, 2004) suggest that guarantees have to be liquid or have to have a relatively high liquid
value. These would allow the lending institution to obtain sufficient cash to meet its depositors’
cash withdrawal needs.

109
More importantly, Deelen and Molenaar (2004: 20) underscore that guarantee programmes are
not intended to mitigate the problems of weak entrepreneurship or poorly performing banks.
They argue that guarantee funds cannot automatically turn a bad investment into a viable one and
emphasise that CGSs are only likely to be successful when the four Ps are all present: well-
prepared entrepreneurs who present good projects to good performing banks that have
professional staff to carry out an evaluation. Levitsky (1997) similarly remarks that CGSs can
only work when there are competent and financially sound banks with experienced and
competent staff that can effectively manage such guaranteed loan portfolios. DFID (2005:4)
outlined a range of key factors influencing the success or otherwise of a CGS in effectively
promoting financial sector deepening. As outlined in Table 3.1, the factors for success and
failure were categorised as macro and micro level factors.
Table 3.1: Factors contributing to successes and failures of a credit guarantee programme
Some macro factors for success Some macro factors for failure
An open and competitive banking
environment
A conducive monetary and regulatory
environment
A dynamic and expanding business sector
with viable opportunities
Supportive political, policy and regulatory
framework that is supportive for businesses
A thin banking sector that is controlled by
a few powerful vested interest
Restricted liquidity among the lending
banks; high interest rate
A weak business sector that is not under
pressure to change or reform
Corruption or incompetence that distorts or
restricts the operation of market forces
Some micro factors for success Some micro factors for failure
An influential ‘champion within the
lending institution who actively participate
in the CGS for commercial reasons
A financial sector approach to CGS design
that strives to deepen the financial sector
An understanding of the market forces
A long-term approach that emphasises
institutional and financial sustainability
Lack of support or understanding of the
commercial logic of the CGS among lender
A social sector approach that focuses
exclusively on a short-term goal of pushing
finance to the SME sector
Focus on the social obligation of lenders or
compliance with regulations or policies
A project approach that focuses on short-

110
Transfer of appropriate lending technology
with necessary technical assistance
A participative approach with a balanced
partnership between the three actors
Ownership by the lending institutions that
stems from significant benefits
term objectives
Focus on achievement of project lending
objectives without regard for sustainability
Coercion of lenders through a non-
transparent benefits or pressure from
political and regulatory authorities
Source: Extracted from DFID (2005)
Earlier credit guarantee schemes emerged in countries that largely pursue liberal economic
thinking, which had a vibrant private sector and a strong tradition of associations of people
engaged in different sectors. When one looks at the Ethiopian context, the government exercises
heavy intervention in the key sectors of the economy (including the financial sector) with
accompanying tighter regulatory systems, which may significantly influence the effectiveness
and successes of such a guarantee scheme. Because such state interventions and control would
inevitably alter normal operations of the market forces. For instance, tighter regulation may
discourage commercial banks from lending to the marignalised groups such as farmers and their
cooperatives. As Green (2003) notes, earlier experiences with such initiatives in Latin America
and Africa demonstrate that political interferences, business and economic environments affect
guarantee funds’ proper utilisation and repayment. Green suggests that such shortcomings can
largely be overcome through private sector involvement in funding and management of such
schemes. However, evidence (Green, 2003; Levitsky, 1997) suggests that though globally there
has been an increasing trend in the participation of private sector actors in such programmes,
most of the guarantee schemes in Africa were government or multilateral initiatives. In
particular, under the Ethiopian context, limitations in the development of the private sector can
pose severe challenges in this regard. Despite such limitations and challenges, at least in the
long-run, heading towards that direction in promoting credit guarantee is critical and inevitable.
In other words, if such programmes have to be expanded and sustained, participation of the
private sector should be nurtured and seriously promoted in terms of guarantee fund provision (at
least by making some contribution), fund administration and, of course, in the guaranteed
lending activities.

111
3.3.7. Analytical Approach in Evaluating Loan Guarantee Schemes
Several scholars (e.g. Cowling and Mitchell, 2003; Kang and Heshmati, 2008; Green, 2003)
concur on the fact that, despite their widespread use and massive resource commitment,
evaluations of CGSs have not been granted adequate attention. Green (2003) notes that though
there are a number of evaluations of individual guarantee schemes, they are often limited in
scope and few schemes have been evaluated consistently. Consequently, many schemes often
continue operating despite massive losses, poor performances and little economic and social
contributions. This section presents the analytical and methodological approaches employed in
evaluating credit guarantee schemes. The section finally provides the analytical approach chosen
for analyzing the performance and impacts of the credit guarantee scheme under analysis.
3.3.7.1. Measuring additionality
Despite its popularity in assessing the impacts of credit guarantees, many scholars (e.g. Riding et
al, 2007; Meyer and Nagarajan, 1996; Levitsky, 1997; Tunahan and Dizkirici, 2012; Vogel and
Adams, 1997) allude to the difficulty of measuring additionality, particularly the challenges
related to methodological complexity and costs of such an assessment. These scholars
argue that it is not easy to determine correctly how much less lending would have occurred if
there were no guarantee schemes. Some (e.g. Honohan, 2010) argue that, if not all, some of the
loans might have been forthcoming even in the absence of the guarantee. Moreover,
measurement of additionality is not straight forward as it is expressed in various forms (Riding et
al, 2007; Green, 2003). Problems related to definition of additionality, clarity of their objectives
and targets further complicate evaluations of guarantee schemes. Green (2003) comments that
particularly measuring economic additionality is costly since the post-intervention activities of
the borrowers and their outcomes need to be closely monitored in terms of increased outputs,
sales, profits, employment, improvements in living standards, etc. Honohan (2010) underscores
that it is even more challenging to evaluate the social benefits generated by the credit guarantee
as the volume of loans guaranteed is not sufficient to measure such a benefit.
With regard to aspects that should be measured in evaluating a credit guarantee scheme, the
common and most obvious approach is measuring additional loans extended to targeted
borrowers as a result of the guarantee provided to the lender. This aspect is normally known as

112
financial additionality. Many agree that improvements in the terms of loans should also be
considered as another dimension of additionality. Thus studies that aim at assessing financial
additionality should also look into improvements in the terms and conditions of loans, which are
often neglected in such studies. D’Ignazio and Menon (2013) argue that even if no financial
additionality is achieved, replacing short-term debt with long-term debt can improve the firm’s
financial structure, avoid diversion of short-term loans to long-term investment activities and
eventually lower their probability of default.
Several scholars (e.g. Navajas, 2001; Meyer and Nagarajan, 1996; Green, 2003) highlighted a
number of issues that need to be analysed in addition to financial additionality. These include the
impacts on the three actors, namely: the guarantor, the lender and the borrowers. The authors
note that the relevant variables to monitor in assessing CGSs in relation to the three parties vary.
In examining the impacts on the guarantor, scheme design, its management, cost effectiveness
and sustainability are crucial aspects that need to be evaluated. The authors further note that the
impact on the lenders may include assessing changes in awareness and behavior of lenders,
improved relationships with small scale borrowers and improvements in their lending terms and
requirements. With regard to the impact on borrowers, additionality (financial and economic
additionality) is often taken as an important aspect. Such studies should also look into whether
the ultimate aim of the scheme (i.e. economic additionality) is achieved or not. This refers to the
outcomes and long-term impacts on the borrowers and in the overall economy, which may
include an increase on the commercial and economic activities of the borrowers in terms of
income, profit, survival rates of firms, employment, sales, new product development,
productivity, output, investment, economic growth and increase in tax revenue for the
government (Green, 2003; Panetta, 2012; Saadani et al, 2010). In this regard, Panetta (2012)
stresses that although economic additionality refers to the indirect benefits of a CGS, its
assessment is of great importance in helping policy-makers decide whether or not to continue
supporting such schemes. Apart from additionality, Honohan (2010) suggests that it is also
important to consider default rates as it affects the effectiveness and sustainability of the scheme,
and the perception of the lending banks towards such small enterprises.

113
In its simplest form, as Meyer (1992; cited by Saldana, 2000) points out, a currently accepted
method to measure the impacts of such a programme is to assume a positive impact if the
beneficiaries access the loan, fully repay and repeat the transaction cycle. D’Ignazio and Menon
(2013: 9) summarised the aspects that need to be considered in assessing the effectiveness of a
CGS into four groups. (1) Whether this measure led to an increase in the amount of credit
granted to the targeted firms; (2) whether the CGS resulted in lower interest rate; (3) Whether the
CGS improved the financial structure of the beneficiary firms; (4) Whether the CGS led to an
increase in the level of output, investments and employment. Likewise, Dalberg (Hansen et al,
2012: 43) proposed an analytical model in assessing the performance of a credit guarantee
scheme, which focuses on four aspects - inputs (credit guarantee offer); output (bank utilisation);
outcome (borrower access); and impact (bank exposure). On the other hand, in analysing the
effectiveness and outcomes of a credit guarantee scheme, Saadani et al (2010) looks into three
main dimensions: outreach, additionality and financial sustainability. Overall, the implication of
the above discussions is that there is no single and best way of evaluating a credit guarantee
scheme. The choice of tools and approaches depends on the aspects that need to be assessed, the
time and resources available to the researcher, among others. In general, as Navajas (2001) notes,
since additionality is more complex than it appears, a simple research is not enough to confirm
that CGS in fact yields these results.
3.3.7.2. Focus areas of past studies on credit guarantee schemes
Most of the studies that attempted to evaluate loan guarantees focused on schemes in developed
countries such as USA and Canada (Riding and Haines, 2001; Riding et al, 2007; Graig et al,
2007 and 2009; Posey and Reichert, 2011), Europe (Cowling and Mitchel, 2003; Zecchini and
Ventura, 2009; Tunahani and Dizkirici, 2012) and Asia (Saldana, 2000; Iichiro et al, 2006; Kang
and Heshmati, 2008; Oh et al, 2008; Zhang and Ye, 2010; Kuo et al, 2011). A few examined
schemes in Africa (Okon and Nkang, 2009; Mafimisebi et al, 2010; Hansen et al, 2012), while
others (DFID, 2005; Beck et al, 2010; Honohan, 2010) explored global practices. Although Beck
et al (2010) analysed typologies of partial credit guarantees around the world taking samples of
76 credit guarantee funds in 46 countries, their study included only one scheme in Africa.

114
In terms of areas of focus, though different studies examined various aspects of credit guarantee
schemes, majority tended to narrowly focus on assessing the financial additionality achieved as a
result of the guarantee intervention. A number of studies (e.g. Cowling and Mitchel, 2003;
Iichiro et al, 2006; Kang and Heshmati, 2008; Mafimisebi et al, 2010; Posey and Reichert, 2011;
Athreya et al, 2011; Tunahani and Dizkirici, 2012) tried to identify financial and economic
additionality. Others (e.g. Riding et al, 2007; Okon and Nkang, 2009; Zecchini and Ventura,
2009) focused on financial additionality. A few studies (e.g. Oh et al, 2008; Craig et al, 2007;
2009) concentrated on exploring the economic additionality realised by the borrowed firms,
and/or the impact of the intervention on the economy at large. In addition, a few studies (e.g.
Saldana, 2000; Tunahani and Dizkirici, 2012) looked into the economic value of credit guarantee
schemes to creditors.
DFID (2005) argues that studies related to the impact on the guarantor and lender has been
restricted to the extent to which additional lending took place, and the mechanisms, design and
management of guarantee schemes. In particular, little emphasis has been placed on the medium-
to long-term impacts on the lending institutions involved in the scheme and the wider financial
sector. In addition, most of the past studies focused on assessing the impacts of a credit guarantee
scheme on the SME sector. Very few studies (e.g. Okon and Nkang, 2009; Mafimisebi et al,
2010) looked into CGSs that explicitly targeted the agricultural sector. Moreover, some studies
(e.g. Iichiro et al, 2006) tended to focus their analysis on the successful and surviving firms.
Nevertheless, including poorly performing borrowers and defaulters in the study and closely
analysing their situation could have provided a better understanding of their experience,
bottlenecks and challenges.
A significant number of past studies (e.g. Levitsky, 1997; Beck et al, 2010; Zhang and Ye, 2010;
Honohan, 2010; Kuo et al, 2011) were devoted to describing design features and modes of
operations of CGSs across countries. Apparently such studies have limitations in providing
deeper understanding and lessons on the processes and context specific results. As Beck et al
(2010) and Panetta (2012) point out, such studies do not allow proper assessment of the effects
of operational contexts and the impacts of the different characteristics of the schemes on their
performance and effectiveness. Mthimkhulu and Aziakpono (2012: 5) similarly comment that

115
across country studies face the challenge of a universally acceptable benchmark since each
scheme will be uniquely designed to treat context-specific credit market problems making it
difficult for definitive comparisons to be established. In general, as Panetta (2012) notes, most
studies that attempted to compare the outcomes of credit guarantee schemes across different
countries empirically suffer from poor data quality. The above discussion points to the need for
context specific studies (in terms of target sector and country) that systematically generate
comprehensive and reliable data on all relevant aspects of the scheme.
3.3.7.3. Methodologies used by past studies on credit guarantee schemes
Various studies cited the challenges related to the complexity of evaluating a credit guarantee
scheme, especially in terms of methodology. A review of literature shows that studies that
attempted to evaluate the effectiveness and impacts of CGSs used various methodologies. Even
those studies that attempted to assess common aspects of credit guarantees such as financial
additionality at times employ different methodologies and approaches. Some of the studies
employed quantitative approaches (econometric models and/or descriptive statistics) to measure
the effectiveness and impacts of a credit guarantee scheme (often based on cross-sectional data
and/or data obtained from secondary sources). Others employed qualitative approaches,
especially to provide descriptions of the different design and operational features of the schemes.
According to a review work by Panetta (2012), researchers mainly used the following methods in
measuring financial additionality: Analysis of guarantee programme files (the most commonly
used method); structured and semi-structured interviews with borrowers and/or lenders (the
second most commonly used method); analysis of bank and surveys of lenders; analysis of
lending activity under loan guarantee programmes as compared to lending activity to small
entrepreneurs in general. Studies that rely on a single tool and data collected at a single point in
time have obvious limitations in providing continuous and in-depth analysis of the process,
complex realities, variations in the operational contexts, and underlying causes for the successes
recorded or failures encountered.
The discussions in the following paragraphs provide the different methodological approaches
employed by previous studies in assessing the effectiveness and impacts of CGSs in different
countries. In a macro-econometric analysis of the operation of Nigeria’s Agricultural credit

116
guarantee fund, Okon and Nkang (2009), used vector auto-regression methodology, modeling the
volume by number and value of loans guaranteed and repaid, with the addition of a credit-
determining policy instrument. Likewise, Mafimisebi et al. (2010), in undertaking an assessment
of the performance of the Nigerian Agricultural partial CGS, tried to calculate growth rates of
various variables. Time-series data were analysed with exponential growth function to examine
the rate of growth in relevant variables, and multiple co-integration to determine whether or not
there is a long-run relationship between agriculture GDP and credit-related factors. In assessing
incrementality of the Canadian loan guarantee programme, Riding et al. (2007) used a two-stage
process. Initially, they estimated a logistic regression-based model of loan outcomes, a credit-
scoring model. The model was then used to classify a sample of borrower firms under the
scheme. The proportion of loan guarantee recipients that the model classified as turndowns was
considered as a direct measure of incrementality.
Iichiro et al (2006) examined the impacts of the government-backed credit guarantee programme
on credit allocation and economic efficiency in Japan. Using a panel data set of firms, they
empirically tested the theoretical predictions of Makiw’s (1986) adverse selection model.
Zecchini and Ventura (2009) applied a new econometric approach to test whether Italy’s CGS is
an effective tool in promoting SMEs’ access to bank credit and in decreasing borrowing costs.
They carried out a fixed-effect panel data estimation using data on financial statements of
beneficiary SMEs and compared them with the non-guaranteed firms. To account for temporal
variation in the relationship, a Difference-in-difference approach was applied and tested for time
trends. A study by Athreya et al. (2011) provides another quantitative assessment of the prices,
allocation and welfare-related outcomes of the household guaranteed loans. They used a model
that incorporates both a meaningful private information and limited commitment problem into a
rich life-cycle model of consumption and savings.
On the other hand, Oh et al. (2008) carried out an evaluation of credit guarantees using
propensity score matching methodology to construct a comparison group to overcome the
problems of selection bias and counterfactuals. They compared key institutional, business and
economic characteristics of a sample of guaranteed firms and matched non-guaranteed firms.
Craig et al. (2007), using time series loan specific data and data on economic conditions from

117
three sources in the USA, tried to assess whether or not the SBA-guaranteed lending has
generated a significant impact on local economic performance. To test the null hypothesis, they
extended the analysis of Craig, Jackson & Thomson (2005), who used weighted least squares to
estimate a regression model (stacked regression) relating measures of local economic
performance to past economic performance, measures of SBA loan guarantees. To this effect,
they estimated a similar regression model, using classic Arellano-Bond Panel regression
estimation.
Saldana (2000) tried to examine the economic value of a CGS to creditors by analysing
creditor’s loss function. Cowling and Mitchell (2003) tried to empirically test the default
specification outlined in Stiglitz and Weiss (1981), using a dataset of small firms who were
credit rationed prior to successful application for guaranteed loans. They adopted an econometric
modeling of defaults which focused on two aspects: probit models to investigate the type of
firms and loan parameters most likely to default and duration models to investigate the factors
that determine the default probability. Riding and Haines (2001), on their part, tried to conduct
cost-benefit analysis of the Canadian LGS, using an equation that predicts the default rate as a
function of the loan guarantee. In their study, two measures of default rates were employed. The
first was long-term default rates on guaranteed loans, while the second default measure was the
rate of default during the initial year of the intervention. Moreover, based on structured
questionnaire and some descriptive statistics, they tried to determine the impacts of the
guaranteed loan on revenue, profit, employment and survival.
In analysing the features and performance of guarantee schemes in four African countries
(Ghana, Kenya, South Africa and Tanzania), Hansen et al. (2012) used a descriptive framework
that consists of three basic dimensions: (1) targets - guarantee model, borrower type and loan
characteristics; (2) processes - initiation, utilisation, reporting, claims, capacity building; and (3)
financial terms - risk sharing, fees and funding. They further tried to assess the performance of
the credit guarantees using a simplified logical framework in terms of input (guarantee), output
(bank utilisation), outcome (borrower access), and impact (bank exposure). As Riding et al
(2007) remarks a notable attempt to evaluate incrementality was that undertaken by KPMG
(Clark et al, 1998) in their evaluation of the LGS in the UK, which used two complementary

118
approaches. The first approach entailed a series of in-depth interviews with borrowers and their
loan account managers with regard to the processes of loan application, approval and
disbursement. The authors comment that these approaches were useful in providing accurate
information and as a means of understanding about the lender-borrower relationship based on
rich qualitative data. They, however, note that as a mechanism of assessing incrementality, the
approaches entail shortcomings in that they reflect recollected data which has obvious
limitations. In addition, the costs of such in-depth interview data restrict the sample size. The
second approach used by KPMG was based on a survey of owners of the guaranteed loan
recipient firms. They argue that while allowing for higher accuracy, this approach also relied on
recollected data and was subject to the biases resulting from the potential optimism exhibited by
the firms.
3.3.7.4. Issues requiring precautions in evaluating a credit guarantee scheme
Several scholars outline a number of issues that need precautions in conducting evaluations of a
credit guarantee scheme. Riding et al (2007) and Green (2003) point out that the effects of intra-
portfolio substitution and inter-lender substitution21
can lead to an overestimation of additionality
during evaluations. The authors argue that under such a situation, little net changes of the loan
extended to the target borrowers are likely to occur and additionality will be overestimated. They
also warn that lenders might employ ‘Column-shifting’, moving poorly performing loans into the
guaranteed loan portfolio, which distorts the accuracy of real loan additionality. Many agree that
the most obvious challenge is to distinguish between the scheme’s contributions and other
factors that might have influenced the borrowers’ performance and lenders’ activities and
decisions. Thus in order to measure the true impacts of the guaranteed loans, the counter-factual
has to be systematically identified. In other words, one needs to know what the borrowers would
have done without the guarantee and compare this to what they actually did with the guarantee
(Green, 2003; Vogel and Adams, 1997). Many, however, note the difficulty of correctly
estimating the counter-factual for both borrowers and lenders. The commonly used approach to
overcome such a problem, as Green (2003) notes, is to collect baseline information on borrowers
21
The former emerges when a lender transfers part or all of the qualifying portion of its existing loan portfolio to the
guarantee programme and then expands lending in non-targeted areas. The later refers to a situation where small
enterprises serviced by other banks are captured by those banks operating under a guarantee scheme (Riding et al,
2007; Green, 2003).

119
prior to the implementation of the scheme and to compare with their situation some time later
(after participating in the scheme). Alternately, a control group of borrowers with similar
characteristics but without a guarantee intervention can be taken to simulate the counter-factual.
More importantly, many (e.g. Levitsky, 1997; Green, 2003) recommend the need to carry out
regular monitoring and evaluations of borrowers and lenders activities and behavior. Levitsky
(1997) suggests that such sample studies can take place every two to three years to ascertain the
degree of additionality achieved as a result of the intervention.
3.3.7.5. Analytical approaches used by the current study
The present study adopted different components of the approaches and methods used and/or
proposed by various researchers. In undertaking the current analysis, as outlined in the next
chapter, both quantitative and qualitative approaches and tools were employed. Though financial
additionality was one of the major aspects assessed in the current study, efforts were made to
examine other dimensions of additionality as informed by the theoretical and conceptual
framework. Among others, the study explored loan additionality and related benefits; number of
cooperatives received guaranteed loans; volume of granted loans; improvements in terms and
conditions of loans; borrowing/lending relationships established between the banks and the
cooperatives; changes and improvements in business activities of cooperatives; new investment
activities realised; improvements in cooperatives’ institutional capacity, and other relevant
issues. Among others, some of the relevant elements of the analytical frameworks proposed by
Dalberg (Hansen et al, 2012) and Saadani et al (2010) were adapted and used to guide both
qualitative and quantitative assessments of the performance and preliminary outcomes of the
credit guarantee scheme under analysis.
Dalberg proposed two simple analytical frameworks for assessing the features and performance
of a credit guarantee scheme (see Figures 3.1 and 3.2). While we borrowed some components
from the first framework in analysing the features of the current credit guarantee scheme, in the
second framework emphasis was placed on the first three components of the model – input
(credit guarantee offer), output (bank utilisation); outcome (borrower access and utilisation). In
addition, from the three components of the analytical approach proposed by Saadani et al (2010)
(outreach, additionality and financial sustainability), the current analysis focused on the first two

120
components. However, it was not possible to comprehensively assess long-term economic
impacts as the scheme has been operated for a few years and was still ongoing when the write-up
of this thesis took place. Details of the analytical approaches and methodologies used in the
current study are outlined in the next chapter.
Figure 3.1: Framework for assessing the features and performance of guarantee schemes
Targets Process Financial terms
Source: Dalberg Analysis (Hansen et al, 2012).
Figure 3.2: Simplified logical framework for assessing credit guarantee performance
Source: Dalberg Analysis (Hansen et al, 2012).
Summary
The main thrust of this chapter is to review relevant literature and provide a theoretical and
conceptual framework for the analysis of various dimensions of rural financial systems in the
context of developing countries, and particularly as related to agriculture and coffee cooperatives
in Ethiopia. The chapter provided comprehensive discussions of relevant concepts, features,
challenges and other aspects of rural finance. The chapter has explained that rural financial
markets in developing countries are highly segmented and imperfect. Literature also argues that
limited participation by rural households in the formal financial market is not solely attributed to
gaps in the supply end. Demand side constraints also play a profound role even though they are
often overlooked. The chapter also highlighted that a number of factors affect farmers’ credit
Input
(guarantee)
Output
(utilisation)
Outcome
(borrower access)
Impact
(bank exposure)
Guarantee model
Borrower type
Loan characteristics
Initiation
Utilisation/reporting
Claims
Capacity building
Risk sharing
Fees
Funding

121
sectoral choice and overall credit demand. Analytical approaches in estimating credit demand
and its demands were also outlined.
The chapter went on to discuss credit guarantee schemes as one of the popular instruments used
by governments and non-governmental agencies to intervene in the financial markets. They have
been designed in various forms and widely used across the globe. The chapter argues that having
their roots in the liberal and neoliberal economic systems, credit guarantees may have limited
impacts in financial markets that operate under tight monetary and regulatory frameworks.
Different studies that attempted to evaluate credit guarantee schemes used various methods and
approaches. Assessing additionality (especially financial additionality) was among the aspects
that have been widely addressed by most existing studies. Literature report mixed findings
regarding the effectiveness and impacts of credit guarantees in different countries. Some of the
factors that influence the successes of a CGS were also discussed. The literature study concluded
that there are appreciable methodological and information gaps and highlighted the need for
further investigation on some aspects using a combination of tools and approaches. The chapter
finally provided analytical frameworks for assessing additionalities achieved under the current
credit guarantee scheme.

122
CHAPTER 4
4. DESIGN AND METHODOLOGY OF THE STUDY
4.1. Introduction
This chapter presents the research design and methodologies employed by the present study,
including description of the study area, sampling strategy, data collection and analytical methods
used by the study. Measures taken in relation to research ethics are also explained.
4.2. Description of the study areas
The study was conducted in eight zones of the two major coffee growing regions of Ethiopia –
Oromia and Southern Nations Nationalities and Peoples’ (SNNP). The main considerations in
choosing the two regions were their involvement in the present coffee cooperatives’ credit
guarantee scheme, and their potential in terms of coffee production. Oromia and SNNP regions
account for the bulk (99%) of the coffee produced in Ethiopia; whereby the former and the later
claim 64% and 35% of the national share, respectively (CSA, 2014). The two regions are known
for producing the reputable coffee types of Ethiopia that are renowned for their unique taste and
flavor. The country’s remaining forest resource is predominantly found in the two regions. The
coffee forests that harbor diverse Arabica coffee genetic resources in the South-west and South-
Eastern parts of Ethiopia are also located in the two regions. Arabica coffee grows wild in some
parts of the forests of the highlands of these regions, which evidently demonstrates the fact that
these areas are the original home for coffee arabica.
Oromia is the largest National Regional State in Ethiopia both in terms of population size and
area coverage. With its elongated shape, Oromia stretches from the Western border across
central parts of Ethiopia to the South and South-east corner of the country. Oromia shares
common borders with all national regional states except with the Tigray region. According to the
Oromia Bureau of Finance and Economic Development (2012), the estimated area of Oromia is
about 363,375 square kilometers, which accounts for over 34% of the country’s total area.

123
According to the CSA’s population projection for 2014, Oromia has a total population of 32.82
million. On the other hand, the SNNP region covers most of the South-western and Southern
parts of the country. The SNNP region borders Kenya to the South and South Sudan to the West,
and the Gambela region to the northwest, and the Oromia region to the north and east. The
SNNP region has a projected total population of 17.84 million (CSA, 2014), which constitutes
about one-fifth of the country’s population. Various sources indicate that SNNP has a total land
area of about 112,000 square kilometer. In fact SNNP is one of the regions with the densest rural
populations in Ethiopia.
Administratively, the regions are divided into zones, districts (woredas) and kebeles22
. Oromia
regional state is classified in to 18 zones and 304 districts (265 rural and 39 urban districts)
(OBoFED, 2012). Out of these, 13 zones and 153 districts are coffee producers to a varying
degree. According to the CSA report (2014), about 1.68 million smallholders produce coffee in
the Oromia region, with a total coffee land coverage of 359,728 hectares and annual production
of 251,824 tons. Likewise, SNNP region is divided into 14 zones and 136 districts. Out of these,
113 districts produce coffee widely, while 47 of them specialise in coffee production. In total, in
SNNP about 162,767 hectares of land is covered by coffee with annual production of 137,347
tons (CSA, 2014).
Some features of the study zones
The study was conducted in eight zones where the credit guarantee scheme under analysis has
been implemented. These are West Wellega, East Wellega, West Hararge, East Hararge, Kaffa,
Wolayita, Hadiya and Kembata Tembaro zones. The zones represent Western, South-Western,
Southern and Eastern parts of the country, and possess different coffee production systems, agro-
ecological conditions and socio-economic set-up. Some of the zones (such as Kaffa, West
Wellega, East and West Hararge) are among the major coffee producing zones of the country
that specialise in coffee production. Kaffa represents the typical forest and semi-forest coffee
producing parts of the country, and is among the areas that receive high rainfall throughout the
year. Hararge produces one of the finest coffees of the country under an entirely different
production system. In Hararge, coffee grows without shade and is intercropped with other food
22
Kebele is the lowest administrative unit

124
crops. Hararge experiences severe moisture shortage, problems of coffee berry disease and an
increasing threat from expansion of another competing crop (khat)23
. The problem related to
coffee berry disease mainly stems from shortage of improved coffee varieties for that particular
area. The recently released new varieties for Hararge are yet to be widely disseminated and reach
the coffee farming community.
Wolayita is among the areas in Southern Ethiopia that produces coffee under different
production system. In addition to coffee, different spices, fruits and cereal crops are grown in the
zone. Kembata Tenbaro and Hadiya are among the marginal coffee producing areas. In addition
to coffee, they widely grow food crops such as cereals. East Wellega has seen recent introduction
and expansion of coffee production, while West Wellega is among the prominent coffee
producing zones of the country with its peculiar coffee farming system.
Table 4.1: Some features of the study zones (2014/15)
Zone Population
as of 2014
Number
of rural
districts
Coffee
area
(ha)
Annual
coffee
production
(Tons)
Number of primary
cooperatives
All types Coffee/mult
ipurpose*
Kaffa 1,029,807 10 12,872 9,577 665 30
Wolayita 1,808,548 12 7,820 6,798 1082 64
Hadiya 1,478,305 11 6,786 3,816 1012 92
Kembata Tembaro 833,832 7 2,724 1,177 370 59
West Hararge 2,260,649 14 14,170 11,600 1100 337
East Hararge 3,286,338 19 6,389 3,302 1052 449
West Wellega 1,637,663 19 70,538 44,592 888 418
East Wellega 1,477,953 17 9,446 6,656 615 265
*Multipurpose does not include those specialised coops, e.g. irrigation, apiary, dairy coops
Source: Population, coffee area and production data were based on CSA 2014 report.
Cooperatives data were obtained from respective zonal Coops Promotion Offices (2013)
23
Khat is a stimulant crop widely produced in the area; its vegetative tips and leaves are chewed as stimulant

125
The study was conducted in 12 districts drawn from the 8 zones, where the credit guarantee
scheme under analysis has been implemented. The below table provides some basic information
and features of the study districts.
Table 4.2: Some features of the selected study districts (as of 2014) District Population Number
of rural
Kebeles
Coffee
area (ha)
Annual
coffee
production
(Tons)
Number of primary
cooperatives
Coffee
producing
farm
families
All type Coffee/mu
ltipurpose
Gewata 82,608 30 32,823 5,294 75 8 7,576
Sasiga 96,688 27 7,997 1,030 53 26 12,000
Genji 71,852 18 14,665 19,064 31 18 9,079
Lalo Asabi 92,123 27 26,537 15,630 53 22 11,565
Boloso Sore 244,501 29 3,175 2,480 87 6 24,000
Sodo Zuria 183,229 31 2,945 2,205 105 6 21,497
Tenbaro 124,103 20 2,903 360 42 6 10,600
W/Badwacho 95,428 22 1,991 783 33 6 116,932
Mesela 181,446 22 12,617 2,000 48 20 12,300
Bedeno 286,228 40 11,023 2,365 75 39 12,321
Melka Belo 213,037 22 12,692 2,400 56 22 25,390
Boke 181,242 22 17,085 2,400 52 17 15,549
Source: Population data were based on the CSA, 2014 population projection. The rest are obtained from reports
of respective zonal and district agriculture and cooperative promotion offices.

126
Figure 4.1: Distribution of coffee growing areas and study zones by production level
Figure 4.2: Production share of coffee producing regions of Ethiopia

127
4.3. Sampling Design, Data Collection and Analysis
4.3.1. Research method and approaches employed by the current study
As discussed in the preceding chapter, the methodologies and approaches used by past studies
that attempted to assess loan demand, and the effectiveness and impacts of credit guarantee
schemes do widely vary. Most of the studies tend to heavily rely on different econometric
models and other quantitative approaches to measure the effectiveness and impacts of CGSs
based on cross-sectional research design and/or secondary data collected for other purposes.
Apparently, these approaches have limitations in providing opportunities to continuously
monitor and closely analyse the processes, complex realities and relationships between the
parties involved in the scheme, and in adequately understanding the operational contexts and
underlying causes for the success or failure of the schemes. Navajas (2001) notes that due to the
complex nature of additionality a simple research approach does not suffice to confirm that CGS
really yielded such outcomes. This particular research therefore employed a mixed-method
approach with data collection activities undertaken at different stages of the intervention. Thus in
carrying out such analysis, the use of a combination of tools and techniques and continuous data
collection process at different stages of the scheme is one of the significant lessons this study has
contributed to knowledge in terms of methodological approach.
A mixed method refers to a study that incorporates both qualitative and quantitative methods of
data collection, analysis and reporting findings in a single study (Creswell, 1999). This type of
study, according to Creswell, enables the researcher to understand complex phenomena
qualitatively as well as to express them quantitatively through numbers, charts and various
statistical analyses. Creswell outlines three key reasons for employing a mixed method. Firstly,
more or better information can be obtained from converging or triangulating the results from
qualitative and quantitative methods. Secondly, the results generated using one method can be
extended by using another method. Thirdly, quantitative measures and instruments grounded in
the views of study participants can be developed. In the context of this study, the first two
aspects are the main motives in choosing this approach.

128
Quantitative research involves gathering numeric and close-ended information through
instruments or a structured form of interviewing and observing, while qualitative research
involves collecting text (e.g. interview data, field notes of the researcher) or visual information
from participants at a site or setting (Creswell, 1999; 1994). Quantitative approaches often aim at
testing pre-determined hypotheses and generating generalisable results. As Marshall (1996)
notes, such studies are useful for answering more mechanistic ‘what’ questions, while qualitative
studies are most useful for answering humanistic ‘why’ and ‘how’ questions. Though
quantitative studies are more standardised and allow systematic comparisons and generalisation,
this technique lacks flexibility and does not allow the researcher to deeply understand the
motivations, attitudes, behaviors and practices of the study participants. In contrary, many agree
that qualitative research approach allows more flexibility, providing opportunities for in-depth
probing and for adapting the interactions between the researcher and the study participants. One
of the limitations of the qualitative method is that generalisation and comparison of the findings
is often not easy. In addition, realistically biases cannot be eliminated in such a research process.
Thus when used together, most of the limitations of each method can be overcome. For instance,
when applied in combination with the quantitative method, qualitative research can help to
interpret, explain and better understand the complex reality of a given situation and the
implications of quantitative data (Mack et al, 2005). Though some critics comment that such
research approaches are cumbersome and demanding in terms of resources and time, many
generally agree that if combined properly they complement each other and jointly address their
deficiencies.
According to Creswell (1999), researchers might apply the methods either sequentially or
concurrently. If the purpose is to build from one method to another or to develop an instrument
from qualitative data, the sequential approach is used. If the intent of the study is to converge or
triangulate the findings, the methods can be administered at the same time. Additionally, the
methods can be used independently as in a sequential approach, or dependently by administering
to the same group of people. The latter two approaches were adopted in this particular study. As
Creswell notes, analysis of the data for the quantitative methods can proceed independently from
the analysis of data obtained through qualitative methods. Thus combining the two components
of the study takes place during the data interpretation and report writing stages.

129
4.3.2. Sampling procedure
A sampling method is the process of choosing a sample from the population with the aim of
obtaining information on the study issues in a way that represents the population of interest
(Brink, 1996). In general, the sampling method used in this study is predominantly purposive.
Purposive sampling technique (also known as judgmental sampling) is the deliberate choice of
informants or respondents due to the experience, attributes or qualities they possess (Tongco,
2007). The selection of study units or participants is carried out on the basis of personal
judgment rather than randomisation, which still in some way, as ILO (2009) notes, can be
representative of the population.
Purposive sampling strategies allow researchers to select information-rich and the most
productive individuals, groups or institutions that provide detailed insight about the research
issues (Devers and Frankel, 2000; Marshall, 1996). Another advantage is that, as Brink (1996)
points out, this sampling technique is more convenient and economical than other sampling
methods. Tongco (2007) argues that the inherent bias of this sampling technique contributes to
its efficiency, and it remains robust even when tested against random probability sampling. As
such there is no blueprint for determining the sample size needed, especially for a qualitative
study. Marshall (1996) suggests that appropriate sample size for a qualitative study is one that
adequately answers the research question. In practice, the number of required subject or study
participants becomes clearer as the research progresses, as new categories, themes or
explanations stop emerging from the data, which is often known as data saturation. This calls for
a flexible research design and an iterative, cyclical approach to sampling, data collection,
analysis and interpretation in such research process (Ibid).
Sampling of the study area
Initially the two major coffee growing regions of the country (Oromia and SNNP) were selected.
Then all the eight zones that have been involved in the coffee cooperatives credit guarantee
scheme under analysis were purposively selected. For the structured formal survey, all the 12
districts participating in the scheme and 26 non-participant coffee producing districts were
purposively selected from the eight zones. The decision to include non-scheme participant
districts was made for comparison purpose. In addition, lack of sufficient number of cooperatives

130
involved in coffee business only from the districts participating in the scheme necessitated
inclusion from other nearby districts. The main criteria in selecting the non-scheme participant
districts were their potential for coffee production, activities of the primary cooperatives, and
their presence in the zones participating in the guarantee scheme. In addition, various institutions
related to cooperatives, coffee, extension and rural finance were purposively chosen to provide
information for the qualitative study.
Sampling study units for the quantitative research
This study takes primary cooperatives as a basic unit of analysis. The quantitative component
that involved formal questionnaire surveys focused on obtaining information from the
management of primary cooperatives. For the initial baseline questionnaire survey, a total of 100
primary cooperatives were chosen from the 38 districts identified above. These include all the 22
cooperatives that were selected to participate in the credit guarantee scheme under analysis and
another group of 78 non-participant cooperatives. This number accounts for close to 12% of the
coffee/multipurpose cooperatives engaged in coffee trade in the selected zones. Either their
managers (where available) or management committee chairpersons were chosen for the
interview. After two years, a group of 80 cooperatives (22 participant and 58 non-participant
coops) were purposively chosen for another round of survey among the previously interviewed
100 cooperatives. The fact that the number of cooperatives targeted by the current guarantee
scheme was small (only 22) posed a challenge in sampling for the quantitative study. The
number of cooperatives that actually obtained guaranteed loans was even smaller than the
targeted ones. We were thus obliged to include all the 22 scheme-participant cooperatives in our
sample. This did not allow use of econometric models in analysing the impacts of the scheme
intervention. In order to compensate for this, in-depth qualitative analysis and inclusion of non-
participant cooperatives were taken as complementary approaches.
Sampling of study units for the qualitative research
For the in-depth qualitative study, selection of study participants for key informant interviews
and focus group discussions were carried out in a purposive manner based on their experience
and knowledge of the study issue. Representatives of all relevant stakeholder groups who are
involved in coffee production, processing, marketing, finance, extension and cooperative

131
promotion were selected and involved in key informant interviews and/or focus group
discussions (see Table 4.3).
Table 4.3: Samples of stakeholders included in the study
Samples Number covered Remark
Farmers’ FGD 4 groups (8 - 10 members in
each group)
In total, 35 participants
Primary cooperatives’
management FGD
4 groups (4 – 5 members in
each group)
In total, 18 participants
Extension/coffee staff
KII
8 At different levels (field, district,
zone, region, national)
Senior bank
officers/officials KII
8 Credit managers and loan officers of
8 banks
Representatives of MFI
KII
2 Senior Directors of MFIs
Staff of coops promotion
agency KII
8 At various levels (national to field
level)
Baseline questionnaire
survey of primary coops
All the 22 scheme
participants and 78 non-
participant coops
Completed by interviewing coops
management and reviewing their
records
Second round
questionnaire survey
All the 22 scheme
participants and 58 non-
participant coops, out of the
previous 100 coops
Took place after 2 years by
interviewing coops and by reviewing
their records
Informal interactions and
discussions with key
stakeholders
Over 65 individuals
representing diverse
stakeholder groups
Took place throughout the research
process and scheme implementation
4.3.3. Data collection
The data collection process employed both qualitative and quantitative approaches and
techniques. Some of the data were collected at one point in time (cross sectional), while data on
various issues were gathered at several stages of the scheme implementation (longitudinally), for
three years to assess changes and trends. In particular, changes in credit supply, access,
utilisation and repayment; cooperatives’ coffee processing, quality improvement and marketing
practices, and economic benefits generated; and changes in cooperatives’ institutional capacity
were assessed over time. In addition, the instruments were designed in such a way that they
allow data collection retrospectively on situations before the scheme intervention, as well as at

132
the beginning and over three years of the intervention. Primary data were collected from multiple
sources using the following techniques and tools.
Structured questionnaire survey
Structured questionnaire is one of the popular instruments used to collect data in a coherent
manner. One of the prominent advantages of using a questionnaire is that it allows the researcher
to systematically collect data from large, diverse and scattered groups of people (Wilkinson and
Bhandarkar, 1992). In the present study structured questionnaires were used at two stages. The
first round survey was administered at an early stage of the scheme implementation (in the last
quarter of 2012 and first quarter of 2013) both for scheme participants and non-participant
cooperatives. This survey covered 22 cooperatives that were targeted by the current scheme and
78 non-scheme participants. It aimed at collecting detailed baseline data on cooperatives profile;
resource ownership, business activities (including coffee processing and marketing practice);
infrastructural and institutional services (such as extension and credit); operations and services of
cooperatives; and other relevant variables (questionnaire attached under Appendix - 3).
The second round questionnaire survey was carried out after two years (in 2015) to obtain data
on some selected variables with the aim of analysing the progresses and changes achieved as a
result of the credit guarantee intervention. These include changes in terms of access to loan and
its utilisation, cooperatives’ institutional capacity, business activities and economic benefits
gained (See Appendix - 3). These were administered to 22 scheme participants and 58 non-
participant cooperatives out of the previously interviewed 100 cooperatives. Senior zonal and
district level cooperative promotion and coffee experts were trained and used as enumerators to
administer the questionnaires during both rounds. Completing the questionnaires involved
interviewing cooperatives’ management committee chairperson or managers (where available),
reviewing cooperatives records and various documents – such as coffee trade, audit reports and
other financial records. With regard to reliability and validity, the researcher made various
efforts to ensure the accuracy of the measurement and to enhance validity. One of the measures
was that the questionnaires were pre-tested on five cooperatives and amended based on the
lessons and feedbacks obtained. Trainings and clear instructions were given to the enumerators
of the surveys. In addition, exhaustive consultations of literature, relevant experts and the
133
researcher’s promoter were made to ensure that the instrument is appropriately designed to
capture all relevant data.
Key informant interviews
Key informant interview is a qualitative in-depth interview with knowledgeable and well
informed individuals about that particular topic or problem and who can provide information
about the history, practices, processes and trends of the study issue and area. Many (e.g. USAID,
1996; Morris and Copestake, 1993) outline several advantages of key informant interviews.
These include that KIIs are inexpensive and simple to conduct; provide flexibility to explore new
ideas and issues that were not anticipated at the outset; allow the researcher to seek information
from various sources. Careful listening, probing and note taking are vital components of the key
informant interview process. The current researcher used interview guides that list the questions
or issues to be explored during the interview (interview guides are attached to Appendix - 2).
As indicated in Table 4.3, carefully selected individuals representing diverse stakeholder groups
were used as key informants. This technique was mainly used to obtain information on: changes
in, experiences and constraints of coffee production, processing and marketing; operations and
services of cooperatives; credit services (credit sources, access, lending terms and conditions,
challenges, etc.); views about the role and significance of a loan guarantee scheme; history of the
area and so on. KIIs were carried out by the present researcher himself in local languages. But
interview notes were taken in English language. Due to the sensitivity of tape recording of
interviews and lack of popularity of this method under the rural Ethiopian context, we relied on
detailed note taking process during the KIIs.
Focus group discussions
A focus group is a qualitative data collection method in which the researcher or facilitator and
carefully chosen members of the group meet as a group to discuss specific research topics. Focus
group, unlike individual interviews, provides additional value in promoting interactions among
members (Wong, 2008). Focus groups allow the researcher to generate substantial amount of
information over a relatively short period of time (Mack et al, 2005). Apart from enabling
tapping of knowledge and collective views, this technique also allows cross-checking of the

134
information obtained from different sources. Many scholars underscore the critical importance of
using ideal group size in such group discussions. Because a group with too many people may not
be able to realise active participation of members, while a group with a few members may fail to
generate deeper ideas and insight. Though the number of participants depends on the objective of
the study, most focus groups consist of 6 to12 people (Wong, 2005). Mack et al (2005) suggest
that FGD session often lasts from one to two hours and should include time for participants to
take a break.
In the current study, FGDs were conducted with groups of coffee farmers and cooperatives’
management committee members. While conducting a FGD, the present researcher acted as a
moderator and facilitated the discussion by asking participants to discuss and respond to open-
ended questions using semi-structured discussion guide. In most cases the researcher himself
took the notes on the discussion, while at some of the places a second person from the local
extension or cooperative office assisted in taking notes. The focus group discussions were held in
local languages, and the issues were captured in Amharic. These were later translated to English.
The use of this technique mainly focused on analysing the following issues: Coffee production,
processing and marketing experiences; credit services (sources, demand, access and utilisation);
views about cooperatives and their services; loan security and role of a loan guarantee; and other
emerging or contentious issues (FGD guide attached to Appendix - 2).
Observation and informal interactions
Observation technique refers to direct observation of the processes, practices and behaviors of
the individuals and institutions participating in the guarantee scheme under analysis. The this
technique allows seeing and recording of behavior and practices as they happen as opposed to
many other research methods which depend on people’s retrospective or anticipatory reports of
their situation (Wilkinson and Bhandarkar, 1992). Apart from generating new information,
observation can be a vital tool to check what people subjectively report about themselves during
interviews and focus group discussions, and help to address inconsistencies (Mack et al, 2005).
This method is especially useful for gaining a better understanding of the physical, socio-cultural
and economic contexts of the participants’ which influence their actions, relationships and
behavior.

135
The current researcher mainly carried out non-participant observation both in a structured (using
simple structured observation form) and non-structured manner. The fact that the present
researcher was participating in the implementation of the guarantee scheme under analysis
provided a great opportunity to carry out some sort of participant observation. The researcher has
made close observations of the behavior and practices of the borrower cooperatives, participating
(lending) banks, guarantor, cooperative promotion and extension institutions. These include loan
application, approval, disbursement, utilisation and recovery processes; coffee processing and
marketing practices; operations of cooperatives, and supports provided by other institutions.
Participation in the project meetings, workshops, monitoring visits and other events also
provided greater opportunity to make observations. The researcher recorded relevant information
in the form of observational notes on the spot or immediately after the event. Extensive and
detailed field and observational notes were generated over three years. The following steps, as
suggested by Creswell (1998: 125), were adapted and used in carrying out some of the
observation activities:
- Select a site/event to be observed and obtain permissions (when necessary).
- Identify who or what to observe, and for how long.
- Determine a role as an observer.
- Design an observational protocol.
- Conduct the observation with proper prior self-introduction where needed,
- Record various aspects of the informants, the physical setting, events and activities,
and researcher’s own reactions.
- Finalise the observation and withdraw by thanking the participants, informing them of
the use of the data and the findings of the study.
In addition, a series of informal interactions and discussions were carried out with officials and
experts of zonal and district agriculture and cooperative promotion offices, field level extension
agents, primary cooperatives and unions’ management. These were carried out in different ways
and on various occasions during the course of scheme implementation and research process. In
fact such kind of extensive and continuous interactions with key stakeholders and close
observation of their behavior and practices is among the unique features of the research

136
techniques and approach used by the current study. This indeed served as a vital mechanism to
understand the processes and complex reality.
Literature and documentation review
Reviewing and analysing relevant literature, documents, statistics and records obtained from
various sources was one of the data collection techniques. These supplemented the primary data
and helped in providing necessary background information as well as to establish theoretical and
analytical frameworks. In addition, during the formal survey review of cooperatives’ records
provided useful information on cooperatives’ institutional, business and financial activities.
4.3.4. Data analysis procedure
The data were analysed both qualitatively and quantitatively. As the study adopted a
convergence model of a mixed method, analysis of the quantitative and qualitative data were
carried out independently from each other. Based on the works of Caracelli and Greene (1993),
Creswell (1999) suggests that with this method an integration of data takes place at the
interpretation stage of the study, rather than at the analysis stage.
4.3.4.1. Qualitative data analysis
Data analysis is the process of bringing order, structure and interpretation to the mass of
collected data (Marshall and Rossman, 1999). As Creswell (1998) notes, though there are some
common features and approaches, generally there is no consensus regarding the analysis of the
qualitative data. In analysing such data, the researcher undertakes a process of analytical circles
rather than pursuing a fixed linear process. Many agree that in qualitative study, data collection,
analysis and report writing are interrelated processes that largely take place simultaneously. This
overlapping of processes, as Creswell (1998) notes, is mainly due to the iterative and emergent
nature of the qualitative research process. According to Marshall and Rossman (1999: 152),
typical analytic procedure for qualitative data involves six phases, namely: organising the data;
generating categories, themes and patterns; coding the data; testing the emerged understandings;
searching for alternative explanations; and writing the report. Marshall and Rossman (1999) state
that analysis of such data is fairly complete when the key categories are defined, the relationships
between them are established, and they are integrated into an elegant and sound interpretation.

137
Likewise, in the present study, analysis of some of the qualitative data was started during the
actual research process. The researcher carried out a continuous process of fine tuning the
collected information through probing, exploring, revising and triangulation throughout the
course of the research. The bulk of the qualitative data set was however analysed as Creswell
(1998) suggests using multiple levels of abstraction. The data were summarised and thoroughly
examined from particulars to general perspectives with the intention of generating key issues and
themes, and establishing relationships and clearer patterns. As Marshall and Rossman (1999:
152-153) note, each phase of data analysis entails data reduction as the masses of collected data
are brought into manageable pieces as the researcher brings meaning and insight to the words
and acts of the study participants. In general, a combination of some basic steps of qualitative
data analysis proposed by Creswell (1998) and Mouton (2001) were used with some adaptation:
Initially the hand written interviews were transferred into electronic form. While typing the
text, interviews conducted in Amharic were translated into English. The researcher then
printed and went through all the information several times, jotting down notes in the margins
of the text. In addition, the researcher wrote the key findings in the form of memos and
reflective notes as a process of initial sorting-out process.
The researcher then carried out the process of reducing the data by developing codes and
categories and through sorting text into categories, which apparently involved discarding
some information. The categories were generated from research questions, interview guides
and responses of the interviews and group discussions. A simple template was developed to
facilitate extraction, sorting and categorisation of the information. A combination of colour
and letters coding was used to mark and distinguish the different categories and themes
emerging from the information. Then all the materials from all the informants who provided
similar responses or highlighted similar themes were put into one category or theme.
Finally, the researcher went through the summarised and categorised information to see the
convergence and divergences between the views of the different categories of key informants
and focus groups. Finally the various categories or themes were related and these themes and
concepts were then integrated into a narrative description. This process largely involved
comparing materials within categories to look for variations and similarities in meanings; and
comparing information across categories to discover links and relations between themes, and

138
critically identifying emerging patterns. The bulk of the materials generated through the
qualitative data analysis was eventually compared against and were largely integrated with
relevant sections of the findings of the quantitative data analysis. However, some of the
findings of the qualitative research were separately reported on.
In addition, the analytical framework proposed by Dalberg (Hansen et al, 2012: 33 & 43) and
Sadaani et al (2010) were adapted and used to guide both qualitative and quantitative
assessments of particularly the features, performance and effectiveness of the credit guarantee
scheme. As outlined under the analytical framework in chapter 3, in assessing the features of the
credit guarantee, Dalberg’s framework focuses on three aspects: (a) Targets (guarantee model,
borrower type, loan characteristics; (b) Processes (Initiation, utilisation and reporting, claims,
capacity building); (c) Risk sharing, type, fees and funding. In assessing the performance of the
guarantee scheme, the framework focuses on the following four aspects. The current analysis
however placed more emphasis on the first three components.
(1) Inputs (credit guarantee offer);
(2) Output (bank utilisation);
(3) Outcome (borrower access – additionality);
(4) Impact (bank exposure - if lending bank maintains its increased exposure to target
borrowers even after the scheme expires).
On the other hand, in analysing the effectiveness and outcomes of a credit guarantee scheme,
Saadani et al (2010: 8) looks into three main dimensions: outreach, additionality and financial
sustainability. Outreach refers to the scale of the guarantee scheme, as measured by the number
of guarantees issued to eligible borrowers and the amount of outstanding guarantees.
Additionality looks into the impact of the guarantee scheme in terms of extending credit to
borrowers that are credit constrained and the economic benefits such loans have generated. The
sustainability aspect looks at risks involved, financial losses and costs in extending loans to
credit constrained borrowers. In our analysis, emphasis was placed on the first two aspects –
outreach and additionality.
In addition, the current research adopted various measures to overcome possible problems of
biases and distortions. Various techniques were employed to maintain a high degree of validity
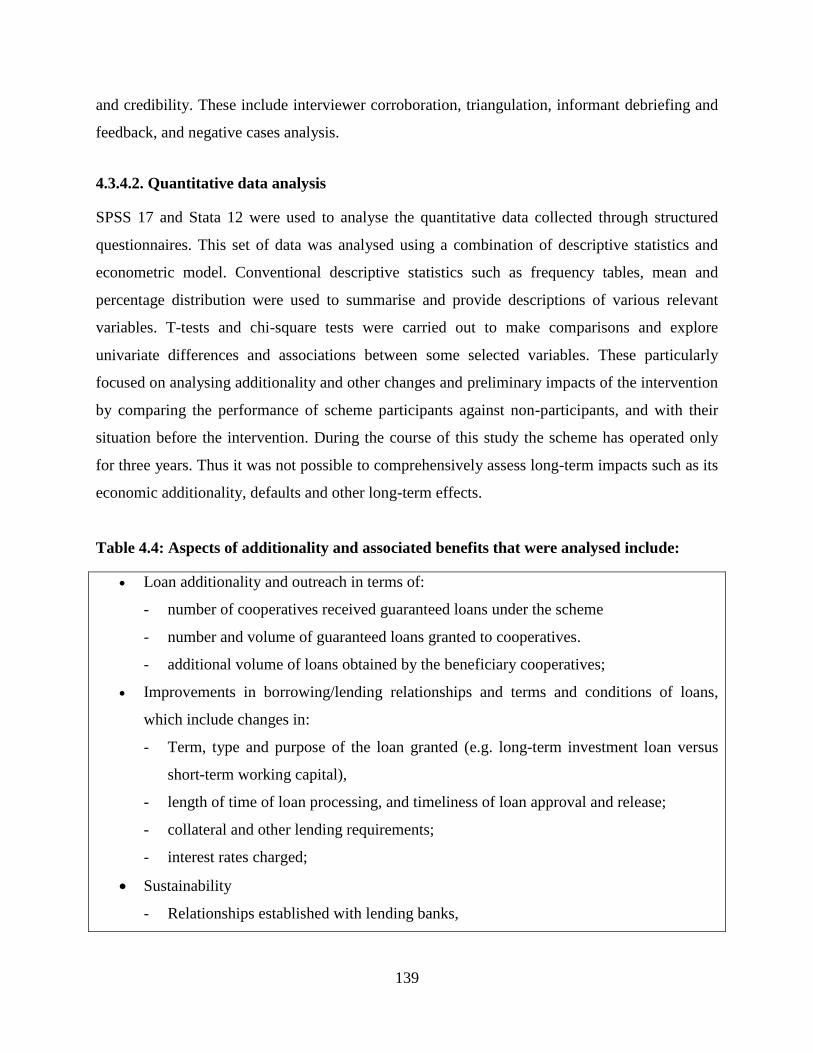
139
and credibility. These include interviewer corroboration, triangulation, informant debriefing and
feedback, and negative cases analysis.
4.3.4.2. Quantitative data analysis
SPSS 17 and Stata 12 were used to analyse the quantitative data collected through structured
questionnaires. This set of data was analysed using a combination of descriptive statistics and
econometric model. Conventional descriptive statistics such as frequency tables, mean and
percentage distribution were used to summarise and provide descriptions of various relevant
variables. T-tests and chi-square tests were carried out to make comparisons and explore
univariate differences and associations between some selected variables. These particularly
focused on analysing additionality and other changes and preliminary impacts of the intervention
by comparing the performance of scheme participants against non-participants, and with their
situation before the intervention. During the course of this study the scheme has operated only
for three years. Thus it was not possible to comprehensively assess long-term impacts such as its
economic additionality, defaults and other long-term effects.
Table 4.4: Aspects of additionality and associated benefits that were analysed include:
Loan additionality and outreach in terms of:
- number of cooperatives received guaranteed loans under the scheme
- number and volume of guaranteed loans granted to cooperatives.
- additional volume of loans obtained by the beneficiary cooperatives;
Improvements in borrowing/lending relationships and terms and conditions of loans,
which include changes in:
- Term, type and purpose of the loan granted (e.g. long-term investment loan versus
short-term working capital),
- length of time of loan processing, and timeliness of loan approval and release;
- collateral and other lending requirements;
- interest rates charged;
Sustainability
- Relationships established with lending banks,

140
- repetition of lending, graduation of borrowers to non-guaranteed loans,
- loan recovery and default rates (if any occurred in the early stage), etc.
Changes in commercial and economic activities of cooperatives in terms of:
- volume and quality of coffee processed and traded;
- access to alternative market outlets,
- new products developed or traded, if any.
- value of coffee and income generated by cooperatives,
- profits generated and dividends distributed to members;
- project additionality - new project/investments such as processing or storage facilities
acquired, and whether this would have occurred in the absence of the scheme.
Cooperative’s institutional capacity development in terms of:
- management (e.g. hiring professional manger, accountant),
- growth/trends in number of workers employed by cooperatives,
- infrastructural facilities and assets acquired,
- growth in membership of cooperatives and members’ participation
- relationships established with various organisations
The econometric model was particularly used to examine determinants of loan demand among
farmers’ cooperatives. In this regard, we adopted Heckman two-step selection model to
determine the impacts of cooperatives’ institutional, managerial and business attributes on their
demand for credit. In the first step, we carried out a Probit model based estimation to examine
factors influencing decision to borrow, while the second step estimation analysed determinants
of the amount of credit demanded by cooperatives. In the first stage, the dependent variable is a
dichotomous or dummy variable, while the dependent variable in the second stage is a
continuous variable. The explanatory variables in both cases are a combination of nominal and
scale measurements. As outlined in the analytical framework, formation of the model was
influenced by a number of working hypothesis. The variables described in the previous section
were hypothesised to influence the decision to borrow and the amount of loan to be borrowed by
farmers’ cooperatives. The Heckman two-step selection model for the present study is expressed
as follows:

141
Using the explanatory variables outlined in the previous section, loan demand (size of loan
demanded) is specified as:
113121110
98765
43210
u2012LOGLIAβPROMANGβLOGTOTEXPβLOCOROMβUNIMEMBβMBUSACTβLOGTOTINCβLOGLENBUSβLOGTOTCAPβ
LOGMSIZEβLOGCOOPAGβEDUCATIONβLOGAGCHAIββ)DemandLog(Loan
and we assumed that loan demand is observed if
02012
21514
13121110987
6543210
uDEFAULTLOGDISBANKLOGLIAPROMANGLOGTOTEXPLOCOROMUNIMEMBMBUSACTLOGTOTINC
LOGLENBUSLOGTOTCAPLOGMSIZELOGCOOPAGEDUCATIONLOGAGCHAI
Where u1 and u2 have correlation ρ.
The elasticity of the kth element of x on its conditional expectation is,
∂E (y/z* > 0,x) = βk - γKρϭ€ᵟ(-wγ) ∂xk
kY
Z
Z
YXZYE
,0
Description of the dependent variables:
Demand for loan-A for the selection equation (Aplon11) – is the dummy dependent variable
captured from a response to the question “Did your cooperative apply for a bank loan in 2011?”
Demand for loan-A for the outcome equation (Amn11) – is the continuous dependent variable
captured from the response to the question “If your cooperative applied for a bank loan in 2011,
what was the amount applied for?”
Demand for loan-B (Needblon3) for the selection equation – this is the dummy dependent
variable captured from the response to the question “Does your cooperative seriously and
genuinely need bank loan for the 2012 coffee season?”
Demand for loan-B (Lonrq12) for the outcome equation – this is the continuous dependent
variable captured from the response to the question “If your cooperative seriously/genuinely
needs a bank loan in 2012, what is the amount you would like to obtain?”

142
Table: 4.5: Description of explanatory variables and how they were used in the model
Variable name Definitions and how these variables were measured
AGCHAI
EDUCATN
COOPAG
MSIZE
TOTCAP
LENBUSS
TOTINC
MBUSACT
UNIMEMB
LOCSNNP and
LOCOROM
DISBANK
TOTEXP
PROMANG
LIA2012
DEFAULT
Age of cooperative’s manager or chairperson in years
Educational level of cooperative chairperson/manager (no and informal
schooling = 0, attending formal education = 1)
Age of the cooperative in years (since its establishment)
Number of members of the cooperative
Total capital (in Birr), is the sum of physical assets, equipment,
shares/bonds, cash in bank and cash on stock
Cooperative’s experience in coffee business in years
Total income generated from coffee and non-coffee business activities
during the year (in Birr)
Primary activity of cooperative (Coffee and other trade activities = 1, and
coffee only = 0).
Membership to cooperative union (Member = 1, and 0 otherwise)
Regional location (taking the cooperatives in the SNNP region as a reference
dummy variable, 1 for locations in Oromia, and 0 otherwise)
Distance from the nearest banks (in Km)
Total expenditure incurred by the cooperative during the year 2012 (Birr)
Having professional manager (have manager = 1, and 0 otherwise)
Liability, which is the sum of all outstanding loans to be repaid by the
cooperative (in Birr)
Previous case of default (Defaulted on previous loan = 1, and 0 otherwise)
Note: Continuous variables have been converted to natural logs.
4.4. Ethical measures
Research ethics deals primarily with the interaction between researchers and the participants of
the study. Whenever we conduct research on people, the well-being of the research participants
must be our top priority (Mack et al, 2005). Thus while undertaking the current study ethical
measures have been seriously considered and ensured through the following approaches:
143
Informed consent
Informed consent is a mechanism for ensuring that people understand what it means to
participate in a particular research study so they can decide in a conscious, deliberate way
whether they want to participate (Mack et al, 2005). Thus the purpose of the current study was
explained to the participants, which is a fulfillment of a PhD study programme, and the fact that
no immediate benefit is gained from participating in the study. They were clearly informed that
participation in the research is completely on a voluntary basis and withdrawal or refusing to
provide information does not entail any unfavourable actions against them. The researcher also
assured the participants about the confidentiality of the information provided by them. Written
permission was obtained from the individuals participated in the survey before they provide the
information. In addition, the Ministry of Agriculture in Ethiopia gave written consent to the
researcher to conduct this research.
Anonymity and confidentiality
Care was taken in presenting the information to avoid possibilities of tracing back to individuals
and institutions participated in providing the information. The identity of the respondents or
informants in relation to the opinions they provided was not revealed, especially when it
appeared sensitive.
Management of information
The original interview scripts and questionnaires were handled with maximum care. Moreover,
names of respondents were not included in the questionnaires and discussion/interview notes.
Summary
This chapter dealt with the study design and methodologies employed to undertake the study.
The chapter started by providing descriptions of the study areas. It then discussed the selected
research approach for the present study and the merits of a mixed method. This was followed by
a section that describes sampling techniques which were mainly purposive. Data sources and

144
data collection methods and tools were also outlined. These include both structured questionnaire
survey and semi-structured qualitative techniques such as key informant interviews, focus group
discussion, observation and document review. In fact data collection process was a demanding
task in this research. This was due to the vastness and remoteness of the study areas; diversity of
the data sources and data collection techniques used, and the need to collect some data over a
couple of years. The process however enabled the researcher to generate comprehensive and rich
data. In fact this is one of the unique features and contributions of the current study in terms of
methodological approach. The chapter then went on to discuss the procedures and processes of
data analysis, which include qualitative and quantitative methods. Analysis of the qualitative data
basically involved summarising and thoroughly examining from particulars to general
perspectives with the intention of generating key issues and themes, and establishing
relationships and clearer patterns. Analysis of the quantitative data employed both descriptive
statistics and econometric model. Based on the experiences with the current study, we can
conclude that if the effectiveness and impacts of a CGS and intervening factors are to be clearly
understood, it is essential to employ a research design that allows continuous and deeper analysis
that is based on comprehensive quantitative and qualitative data collected at various stages of the
intervention. Finally, the chapter highlighted the ethical measures taken in undertaking the study.

145
CHAPTER 5
5. EMPIRICAL FINDINGS ON THE ETHIOPIAN COFFEE AND
COOPERATIVE SECTORS
5.1. Introduction
This chapter presents the findings of both qualitative and quantitative studies on the Ethiopian
coffee and cooperative sectors. The chapter begins by providing the findings on the Ethiopian
coffee sector in terms of its socioeconomic significance, production, processing and marketing
and cooperatives’ role in this regard. Then the findings on sources of finance for agriculture and
the coffee sub-sector, banks’ priority areas for lending, terms and conditions of institutional loan
are presented. This is followed by the findings on farmer cooperatives’ institutional, business and
socio-economic characteristics; access to institutional services and other relevant issues. The
chapter then presents the findings on cooperatives’ loan demand and its determinants.
5.2. The Ethiopian Coffee Sector
This section starts by providing the perspectives of various stakeholders with regard to the
significance of the Ethiopian coffee sector. Then the findings on coffee production, processing
and marketing practices and systems are presented.
5.2.1. Significance of the Ethiopian coffee sector
Unsurprisingly, all the key informants and focus groups of various stakeholder groups concur on
the great role coffee plays in the livelihood of its producers, other actors in the value chain and in
the national economy at large. All emphasised that coffee is of considerable economic, social,
cultural and environmental significance to Ethiopia. In particular, coffee is a major cash crop in
many parts of Oromia and SNNP regions, which account for 99% of the national production
(CSA, 2014). Key informants reiterated that coffee enables farmers to generated cash income
and improve their livelihoods, to educate their children and to make various investments. The

146
study suggests that coffee is a commodity that generates better income with fairly limited
investment. More importantly, coffee globally generates huge reputation for the country and will
continue to play this remarkable role in the future. It plays a great role in strengthening networks,
communication and social ties among neighborhoods and the community at large. Coffee is one
of the most valuable offers to welcome visitors and to present to relatives as a cherished gift.
According to one farmer focus group, ‘‘Saying let’s take or go for coffee is the beginning of any
interaction, friendly offers and hospitality. In our culture, even if one intends to offer someone
food or other drinks, it is a common practice to say let’s take coffee. So if someone says (s)he
does not take coffee, (s)he will miss all those complementary offers’’.
Farmers’ focus group members pointed out that women in particular attach greater importance to
coffee than their male counterparts do. Women largely depend on incomes from coffee to cover
household expenditures, as well as to welcome their visitors. However, almost all expressed with
concern that the Ethiopian coffee sector has been denied adequate support, and underscored that
this prominent national resource deserves serious attention at various levels, particularly in terms
of policy and institutional supports. Such concern seems to be partly addressed as the
government has recently took an important step in setting up an authority that deals with coffee
development and marketing.
5.2.2. Coffee Production Practices and System
Though coffee is a dominant crop in most of the study areas, farmers grow various crops based
on the agro-ecology of that particular area. As in other parts of the country, coffee production
activities in the study areas are predominantly undertaken by small-scale farmers using both
family and hired labour. The coffee production systems in the study areas are diverse and do
vary from place to place. For instance, coffee production in such areas as Wolayita, Hadiya and
Hararge takes place around garden and homestead and is often being intercropped with other
crops. In contrast, forest and semi-forest coffee production and sole cropping of coffee are
widespread in Kaffa. In general, in most parts of Ethiopia, coffee grows under shade of selected
suitable trees, while in Hararge area the crop grows without shade. Farmer focus groups in Kaffa
area indicated that previously, they used to widely rely on coffee that is naturally grown in
forests. However, in recent years, there have been upsurge in plantations and garden coffee

147
production systems. The rise in market demand for coffee (despite some fluctuations), on the one
hand, and government’s effort to promote production of improved seedlings, on the other hand,
motivated farmers to plant improved varieties with enhanced productivity. Famers, however,
indicated that though the improved coffee varieties provide higher yield, they obviously require
intensive management practices, which is one of the challenges in the face of labour shortage.
All categories of key informants indicated that, in general, adoption of improved coffee varieties
and associated management practices is limited. In particular, hybrid varieties have not been
widely promoted among coffee farmers. However, the varieties released through selection of
landraces appear to reach most of the recommendation domains in South-Western Ethiopia.
However, farmers of such areas as Hararge and Wolayita still predominantly grow local
varieties. As a result, Coffee Berry Disease (CBD) still stands as a major problem in these parts
of the country. East Wellega and Walayita are among the zones that have recently witnessed
expansion of new varieties. Key informants indicated that local coffee varieties grown in various
areas are given various local names. As regards use of inputs, farmers in all of the study areas
rarely apply inorganic inputs. Apart from its cost implications, this is related to the tendency to
produce organic products though there appears to be lack of clearer understanding and direction
with regard to production of organic coffee, and the extent of benefits and opportunities
associated with such products.
With respect to its gender dimension, key informants and focus groups noted that women
generally play multiple roles in coffee production. Though planting coffee fields are mainly the
duty of men, women play an important role in managing coffee farms and in harvesting
activities, especially for garden coffee. As related to labour supply, farmers indicated that coffee
production is labour intensive and farmers are often obliged to hire wage labourers, while a few
rely on their family members. In particular, the recent massive migration of youth to towns/cities
has become an alarming situation in terms of accessing farm labour-force. Interviewed
stakeholders identified a number of problems that constrain coffee production in various parts of
the country though the degree of importance varies across regions. The major constraints,
according to key informants, include: lack of awareness, skills and motivation to adopt improved
coffee management by farmers; diseases and pests such as CBD and coffee wilt disease; shortage

148
of seed/seedling and other improved technologies; price fluctuation and lack of alternative
market outlets; aging coffee trees; shortage of labour; climate change; and weak extension and
other institutional support services.
5.2.3. Coffee harvesting and processing practices
All key informants and focus groups indicated that coffee harvesting and processing in most
coffee growing areas of Ethiopia is predominantly carried out in a traditional way. However,
there are notable improvements in recent years. In particular, indiscriminate stripping of cherries
is becoming less prevalent in all study areas. Key informants reported that most farmers pick red
ripe cherries; while farmers in some areas let the cherries to dry on the trees. In its labour
perspective, farmers use both family and hired labour for harvesting coffee. Shortage of labour
during coffee harvest season was cited as a critical problem. Low local prices and lack of
differential prices based on quality appear to influence farmers’ effort and motivation in adopting
improved harvesting and drying practices.
In general, all key informants reported that sun-drying of cherry is the dominant practice both
among individual farmers and cooperatives in the study areas. It was also reported that many
cooperatives are engaged in buying and selling dry coffee, though some have recently started
purchasing fresh cherry and drying at their centres. The results of the questionnaire survey show
that only 34%; 47% and 33% of the cooperatives were carrying out some sort of primary
processing (sun-drying or washing) during the year 2010; 2011 and 2012, respectively. Likewise,
substantial amount of the coffee traded by the cooperatives does not undergo any processing
activities. This could be largely related to lack of adequate awareness, necessary skill and
processing facilities and/or finance to acquire such facilities. Unlike the case in its production
end, cooperatives have some important role in coffee processing activities.
Table 5.1: Percent of cooperatives and volume of coffee processed over years (N = 100)
Year Percent of coops
processed coffee
Amount processed (sun-dried or washed)
Range of volume processed (kg) Average volume processed (kg)
2010 34 735 – 87,667 5,905
2011 47 716 – 600,000 19,681
2012 33 568 – 210,000 8,106

149
53% 34%
6% 4% 3%
Figure 5.1: How cooperatives undertake sun-drying of coffee
On raised bed made of local materials
On cemented floor and raised bed made of
local materials or mesh wire)
On cemented floor
On raised bed made of mesh wire
On plastic mat
Members of different focus groups indicated that previously farmers were drying coffee in
different ways including on the ground. However, such practices were reported to be on the
decline in recent years. As a result of the intensive awareness raising activities carried out by the
government and other agencies, at present most farmers dry their cherries on raised bed made of
local materials or on plastic mats. The findings of the formal survey shows that out of the 98
cooperatives responded to this question (Figure 5.1), 53% reported drying on raised beds made
of local materials, while 34% indicated using both cemented floor and raised beds made of local
materials (and at times mesh wire). A few cooperatives reported drying on raised bed made of
mesh wire and on plastic mats. Given the situation of primary cooperatives, the widespread use
of drying beds made of local materials is somehow commendable.
The results reveal that the vast majority of the primary cooperatives do not have proper drying
and storage facilities. As indicated in Table 5.2, the number of available processing facilities in
the different zones and districts is limited. Some districts such as Tembaro reported complete
absence of washing and hulling facilities in the entire district. However, such areas as Kaffa and
Wolayita have witnessed expansion of wet processing facilities in recent years. Most
cooperatives in South and South-western parts of the country expressed their interest to acquire
and use wet-processing method. However, coffee and cooperative experts in West Wellega and
Wolayita zones indicated that though the government favours promotion of wet processing,
cooperatives in the areas tend to maintain the longstanding practice of sun-drying of cherry.

150
Likewise, cooperatives in East Wellega prefer sun-drying method because of short harvesting
season and due to lack of experience with wet processing technique. Similarly, all interviewed
experts were of the view that owing to shortage of water sources, problems in mucilage
development (that would facilitate pulping) and fragmented nature of coffee farms, wet-
processing method is not feasible for Hararge areas. Moreover, the topography of most parts of
Hararge is not suitable for promoting large scale washing facilities. On the other hand, natural
sun-dried Hararge coffee has been fetching higher prices, at times, higher than that of washed
coffee coming from other areas. Key informants were of the opinion that this practice should not
be undermined and discouraged. All interviewed coffee experts concur on the fact that promotion
of improved drying facilities and small-scale hulling machines are more relevant for Hararge.
However, a few experts indicated that perhaps wet processing machine with mechanical de-
muscilager or manually operating small pulper can be piloted and tested on small-scale.
Table 5.2: Number of coffee processing facilities available in the study zones and districts
Zones
Wet mill Hulling facility Ownership
As of
2011/12
At end
of 2014
As of
2011/12
At end
of 2014
Coops/union Private traders
East Wellega 1 1 2 3 All
Kaffa 13 18 10 15 7 WM 11 WM; all HM
Wolayita 13 18 7 9 5 WM & 1 HM 13 WM; 8 HM
Hadiya 3 6 1 1 All
East Hararge 0 0 3 5 3 HM 2 HM
West Hararge 0 0 32 32 1 HM 31 HM
West Wellega 21 21 131 142 14 WM; 6 HM 7 WM; 136 HM
Kembata T. 16 17 6 8 1 WM 17 WM; 8 HM
Districts
Gewata 4 6 2 5 2 WM 4 WM; all HM
Boloso Sore 5 4 1 1 2 WM 2 WM; 1 HM
Melka Belo 0 0 3 3 1 HM 2 HM
Mesela 0 0 3 3 1 HM 2 HM
Boke 0 0 4 4 All HM
Bedeno 0 0 1 1 1 HM
Tenbaro 0 0 0 0
Genji 0 0 6 9 All HM
Lalo Asabi 3 12 12 All HM
Sodo Zuria 3 4 0 1 1 WM; 1 HM 3 WM
W/Badwacho 1 4 0 0 All
Sasiga 0 0 0 0
WM = Wet mill HM = Hulling machine

151
Key informants indicated that though traditional hulling of coffee using mortar or by crashing on
the ground (merbush preparation) is on the decline, such a problem still persists in some parts of
West Hararge, East Hararge and Wolayita zones. In particular, the findings show that farmers in
East Hararge were reluctant to sell their coffee as dry unhulled cherry (jenfel). Because the husk,
locally known as ashara, is brewed and used for household consumption. Limited or non-use of
available hulling facility by local farmers was also reported as a major problem. For instance,
farmers of Mesela were observed to largely practice such traditional coffee hulling practice
(merbush preparation), while the hulling facilities of the union and private traders were operating
under capacity. In fact, Hararge farmers grow a few coffee trees in their garden and each farmer
produces small lots of coffee (one or two sacks) which are normally sold in small quantities in
the form of merbush as cash need arises. In addition, farmers were of the opinion that big hulling
machine alters the taste of ashara (burns it), making them reluctant in using such modern
processing facility. Interestingly, key informants were of the opinion that private traders
deliberately avoid use of the cooperatives union’s hulling facility as a strategy to weaken it.
Likewise, a key informant from Wolayita indicated that Merbush coffee preparation is reviving
due to illegal trade expansion. Such undesirable practices appear to have serious detrimental
effects on coffee quality in those areas.
During the formal survey, overall, 68% of the surveyed cooperatives showed preference for sun-
drying cherry, while only 21% showed preference for wet method. The rest 11% want to use
both processing techniques. In terms of regional location and preferred coffee processing
method, the majority of cooperatives in the Oromia region (88%) preferred sun-drying method as
compared with less than half (47%) for those in the SNNP region (Table 5.3). The association
was also statistically significant (X2
= 19.561; Sig. = 0.001). This could be due to the fact that
most of the study cooperatives drawn from Oromia were located in Hararge and Wellega, which
traditionally employ sun-drying technique.

152
Table 5.3: Relationship between regional location and preferred processing method (N=99)
Processing method Region
Oromia
No. (%)
SNNP
No. (%)
Sun-drying 44 (88%) 23 (47%)
Wet processing 3 (6%) 18 (36.5%)
Both methods 3 (6%) 8 (16.5%)
Total 50 (100%) 49 (100%)
X2
= 19.561 DF = 2 Sig. = 0.001
Likewise, the results of the formal survey indicate that (Table 5.4), the vast majority of the
cooperatives require mesh wire and other drying facilities alone or together with other processing
facilities. Close to a-third expressed having demand for big hulling machine together with drying
facilities. Close to 20% indicated preference to acquire wet mill and drying facilities, while about
10% reported that they need both hulling and washing facilities as well as drying materials.
Some reported that they want to have small hullers or small hand pulpers alone or together with
drying materials. The findings indicate that agro-ecological conditions of the areas, potential for
coffee production, cooperatives’ experience in coffee business and their institutional capacity
largely influence their demand for coffee processing facility and technique.
Table 5.4. Coffee processing facilities cooperative need most
Facility/materials needed Number of coops
responded (N=98)
Percent of coops
responded
Big hulling machine, mesh wire and other drying
materials
28 28.5
Mesh wire and other drying materials 19 19.5
Wet mill, mesh wire and other drying facilities 19 19.5
Hulling machine and washing facility as well as
mesh wire and other drying materials
10 10
Small hullers 8 8.2
Mesh wire, other drying materials and small huller 7 7.1
Drying materials, small hand pulper and small huller 7 7

153
5.2.4. Coffee marketing system and practices
The coffee sector of Ethiopia in general, and its marketing system in particular, have witnessed
major changes in recent years. The notable changes include frequent restructuring of institutions
dealing with coffee development and marketing, creation of institutions and regulations that
support and promote cooperatives, formation of cooperative unions, creation of new marketing
systems (including creation of cooperatives’ marketing channel, primary coffee market centres
and ECX trading system), emergence of several private financial institutions and policy related
to credit provision. According to the new proclamation on coffee quality control and marketing,
all private traders and primary cooperatives are expected to purchase coffee at primary market
centres. Nevertheless, interviewed coffee experts indicated that so far primary market centres
have been mostly used by private traders in areas where they have gone operational. Our
assessments in the study areas reveal that primary coffee marketing centres have not been fully
functional in most of the districts (see Table 5.5).
Farmers sell their coffee either to private traders or to their cooperatives. Farmer focus groups
indicated that some farmers even sell their coffee to unlicensed traders who often trap coffee on
the way to local market, while others sell at primary market centres. Some still sell at farm-gate
to those traders who move house-to-house and collect coffee. Key informants indicated that
some licensed traders at times tend to be involved in some form of illegal trade. Cooperatives
also tend to collect members’ coffee at their own centres. For instance, the findings of the formal
survey shows that out of the 97 cooperatives responded to this question, only 22% indicated
collecting coffee at primary market centre, while a larger proportion (42%) reported buying at
their coops’ centres. Close to 28% said they procure coffee both at primary market and
cooperative centres. A few cooperatives reported buying in various villages and at local markets.
Table 5.5: Status of primary market centres in the study zones and some districts
Zones/districts Number of planned centres Number of centres completed by
2014/15
Wolayita 79 78
Hadiya 10 6
Kaffa 101 54
Kembata Tembaro 40 20
West Hararge 65 14
East Hararge DN 9

154
East Wellega 23 18*
West Wellega 72 60
Boke 6 1
Melka Belo 8 4
Bedeno 8 6*
Mesela 5 2
Gewata 20 16
W/Badewacho 3 1
Tenbaro 4 3
Genji 4 3
Lalo Asabi 8 5
Sasiga 4 6
*Some of them do not meet required standard, while many of them did not fully go operational
DN = Data not available
Cooperatives in turn sell their coffee to their parent union or at times to a federation, who then
exports the coffee. Primary cooperatives can’t sell their coffee through the ECX auction as they
do not have seats with the ECX. Cooperatives management indicated that their market outlets
depend on their experience in coffee trade and their union’s performance in terms of coffee
marketing and returns to members. Primary cooperatives affiliated to a relatively strong union
sell their coffee to parent unions, while a few (especially those with weak unions) dispose it
through ECX by paying commissions to those who possess seats. The coffee quality control and
marketing regulation does not permit primary cooperatives to sell their coffee to private traders.
The regulation allows producers or cooperatives to directly export their coffee. But primary
cooperatives are not making use of this opportunity due to limitations in their capacity.
As indicated in Table 5.6, the vast majority of primary cooperatives reported selling their coffee
to their unions. Likewise, when asked about the volume they sell to their unions, 88% of the
interviewed cooperatives reported that they sell all of their coffee to their parent unions. The
remaining 12% reported selling about half or less of their coffee to the cooperative union. In
general, majority of the primary cooperatives seem to merely serve as local buying agents for
their parent unions. During marketing, the quality of coffees of primary cooperatives has to be
assessed and given grades at local ECX centres before it is delivered to Addis Ababa. Private
traders sell their coffee with warehouse bond system, which avoids physical delivery of coffee to
Addis Ababa before selling it at ECX centre.

155
Table 5.6: Where did cooperatives sell their coffee over the following years?
Year Percent of cooperatives
To coop union To local traders At ECX
2010 (N= 56) 95 3.5 1.5
2011 (N= 82) 96 4 -
2012 (N = 52) 92 2 6
Almost all categories of key informants reported that cooperatives generally handle a small
proportion of the coffee traded in the areas. In this regard primary cooperatives are less efficient
than the private traders. Cooperatives lack capital and often start buying coffee late in the season
after receiving some loan from their unions. It is also not uncommon for cooperatives to tell
member farmers that they are not in a position to buy their coffee due to shortage of finance.
Similarly, most of the newly created unions are not strong enough to effectively deal with
member cooperatives’ coffee. Some farmer groups indicated that since their cooperative does not
provide cash on spot nor collect their coffee in time, they end up selling to private traders. In
contrary, private traders act in a more competitive and strategic manner. In other words, they
undertake necessary preparations and enter coffee market early in the season. Moreover, they are
also more flexible in revising and setting coffee prices (often upwards), mainly with the intention
of stopping farmers from delivering their coffee to cooperatives. For instance, one of the experts
from a major coffee producing zone, Kaffa, indicated that out of the coffee that enters ECX
quality tasting centre, cooperatives’ share accounts only for 20 - 30 %. The rest is supplied by
private traders and large scale private producers. Likewise, despite the presence of favourable
policy environment and government support, the export volume via this avenue has remained too
low (less than 6% of the total export). The findings show that most cooperatives are not in a
position to make proper use of the privilege and opportunity.
However, in general, most cooperative and coffee experts underlined that the union marketing
route is shorter and more favorable for farmers. One of the advantages is that cooperatives’
participation in the market would shorten the chain and enhance returns for producers. In
addition, involvement of cooperatives in the market creates a competitive environment and
reduces the monopolistic acts of private traders. Moreover, the cooperative marketing channel

156
would enable farmers to get entry to alternative markets that offer better prices such as Fair-trade
market. In addition, cooperatives as also provide dividends and other additional services to
members and the community. Key informants underscored that cooperatives need to be engaged
in trading value added coffee, as currently only 1% of the total export of the country’s coffee is
value added product.
In terms of type of coffee traded, the normal and predominant practice, at least in the current
study areas, is that cooperatives purchase fresh cherry or sun-dried coffee and pass it over to
their respective unions. The results of the formal survey show that as of end of 2012, more than
half of the cooperatives were involved in dry coffee trade. Out of these, 30% were buying and
selling dry cherry, while 23% were buying dry cherry, which were then hulled and sold. About
12% reported buying and selling green beans, which demonstrates prevalence of merbush coffee
preparation and trading in some areas. Only about a quarter reported buying fresh cherry and
undertaking sun-drying, which offers cooperatives an opportunity to dry their coffee with
necessary cares and handling. In particular, key informants in Hararge area indicated that
purchasing fresh cherries and drying at cooperative centres is not a common practice. Some
cooperatives such as Chefe Lelisa of Boke district indicated that they normally purchase some
fresh cherries, semi-dried (locally known as lezaza) and dry coffee. Fresh cherries are
immediately delivered to the union and dried in their facility.
30%
27%
23%
12%
4% 4%
Figure 5.2: How cooperatives trade majority of their coffee (N = 100)
Buy dry cherry and sell as it is
Buy fresh cherry and dry
Buy dry coffee, hull and sell
Buy and sell green beans
Buy fresh cherry and sun-dry +
buy dry cherry and sell
Buy and sell fresh cherry

157
When we asked cooperatives how they make payments for the coffee they collect from members,
the vast majority (91%) reported making full cash payment upon receiving the coffee from
farmers. Only nine percent reported that they make partial payment upon receiving coffee from
farmers and settle the rest latter after sale of coffee. Likewise, coops’ management committees
were asked if member farmers were willing to deliver their coffee to their cooperatives and
receive the payment latter after sale. Only 28% were of the opinion that farmers are willing to
supply their coffee on loan, while close to three-quarters (72%) felt that they are not willing. This
implies lack of trust and commitment among member farmers. We also asked cooperatives when
they normally dispose of their coffee. As indicated in the below table, the vast majority of the
cooperatives were selling their coffee right during the harvest season or soon after. On average,
cooperatives keep their coffee in warehouse for about two and half months. Some reported
selling their coffee immediately in one or two weeks’ time which could be attributed to lack of
proper warehouse, shortage of finance or due to the conditions imposed by their unions.
Table 5.7: Time cooperatives sold their coffee over the three years (2010 – 2012)
Year Percent of cooperatives
Immediately during harvest - (buy
and sell small quantities at a time)
At the end of
harvest season
Latter when price
becomes attractive
2010 (N= 56) 25.00 43.00 32.00
2011 (N= 81) 17.50 49.50 33.00
2012 (N = 49) 24.50 55.00 20.50
Length of storage of coffee in cooperatives’ warehouse (in months)
Year Minimum
storage time
Longest storage
time
Average length of storage time
2010 (N= 56) 0.50 8 2.42
2011 (N= 79) 0.25 12 2.56
2012 (N = 49) 0.25 12 2.48
On the other hand, almost all coffee extension and cooperative experts indicated that the local
market price of coffee is often not based on the quality of the product. As a result, there appears
to be lack of incentives for producers to invest time and extra resources to improve coffee quality
as there is no meaningful differential price at farm-gate. For instance, when asked if their

158
cooperative offers different prices for coffees of different quality, the majority (74%) reported
paying similar prices for all the coffee they collect from members. However, some cooperatives
indicated that they purchase coffee that appears to be of good quality, and reject those which
have not been properly harvested or dried. Private traders who operate washing stations at time
pay higher prices to those farmers who properly harvest fully ripe red cherries. In terms of
setting coffee market price for cooperatives, it was noted that unions or cooperative promotion
office propose prices to cooperatives. Unlike private traders, cooperatives cannot flexibly change
prices from time to time. As a result, they often fail to compete with private traders on the basis
of daily coffee prices. Cooperative experts indicated that though daily coffee prices are supposed
to be set based on local and ECX prices, private traders tend to deliberately manipulate and
dictate it. Some cooperative experts indicated that setting of coffee prices at primary
cooperatives level is subjective, liable to corruption and manipulation. The current researcher
also practically observed such undesirable practices where the management committee of one
cooperative unrealistically raised the coffee purchase prices.
5.2.5. Challenges and constraints of the coffee sector
Different stakeholders outlined a number of problems and constraints facing the various actors in
the coffee sector. As presented in the below table, the prominent ones are related to coffee
marketing (price, outlet, etc.), illegal coffee trade, poor coffee harvesting and processing
practices, lack of proper processing and storage facilities, lack of finance and access to credit,
diseases and pests, lack of improved seeds and other technologies, shortage of labour, weak
capacity of cooperatives, weak extension support and infrastructural facilities, among others.
Different stakeholder groups tended to put special emphasis on the problems prevailing in certain
components of the value chain. For instance, coffee extension experts appear to focus on the
problems/constraints directly related to the production and processing sides. On the other hand,
cooperative promotion experts, cooperatives’ management and farmers tended to pay more
attention to those on the marketing end, followed by processing component.

159
Table 5.8: Major challenges and problems of the coffee sector in the views of stakeholders
Major challenges and problems Number of KIs & FGs cited Total
score
Ran
k Coffee
extension
experts KIs
Coops
promotion
staff KIs
Coops
mangt
FGs
Farme
rs’
FGs
Market problem* (MR) 5 6 3 4 18 1
Illegal coffee trade** (MR) 4 5 2 2 13 2
Poor harvesting and processing
practices*** (HP)
5 4 - 4 13 2
Lack of finance; lack or delay in
getting loan & entering market (MR)
2 4 3 4 13 2
Diseases and pests (such as coffee
berry disease) (PR)
4 - 3 4 11 3
Weak capacity& poor management
of coops and/or new unions (MR)
2 4 1 4 11 3
Lack of proper processing and
storage facilities (HP)
4 2 1 1 8 4
Weak extension and support services
& infrastructure (PR, HP, RM)
4 1 - - 5 5
Shortage of labour (PR & HP) 1 1 3 5 5
Lack of improved variety & seeds
(PR)
5 - - 5 5
Lack of improved management
practices and inputs, reluctance to
adopt recommendations (PR)
4 - - 1 5 5
Lack of awareness, knowledge &
skills among farmers (PR + HP)
4 - - - 4 6
Climate change and/or frost (PR) 2 - 1 - 3 7
Aged coffee trees (PR) 2 - - - 2 8
Declining soil fertility (PR) 1 - 1 - 2 8
Scarcity of land to plant new
varieties (PR)
- - 1 1 2 8
Fluctuating coffee quality (HP, MR) 1 - - - 1 9 PR = Production; HP = Harvesting and processing; MR = Marketing
*Low or fluctuating prices, bulk purchase & lack of differential price; limited market outlet, long market chain,
primary markets not functional or not being used.
**Smuggling, adulteration, lack of price difference, locally purchasing in various ways, involvement of traders
without license, crop advance by illegal money lenders, etc.
***Poor harvesting practices (due to theft, high cost or shortage of labour) and poor processing practices (poor
drying, hulling on ground or with mortar (merbush), old machines & technical problem with wet processing).
In terms of agro-regions, there seems to be variations in the nature and magnitude of the
problems and constraints outlined by various stakeholders. Table 5.9 shows the importance of
some of the problems facing the sector or actors across the different study areas. Key informants,
for instance, underscored that Hararge coffee has faced a great danger as a result of moisture

160
scarcity, coffee berry disease, and stiff competition from rapid expansion of other crops such as
khat. For example, in West Hararge, about 70,873 hectare of land is under coffee production,
while its close competitor, khat, claims 65,000 hectare of land and this has been on the rise. In
addition, experts indicated that dry method seedling production has become difficult due to
extended dry spell. Shortage of farm tools was also cited as one of the major constraints in coffee
production, especially in such areas as Hararge. Problems related to coffee harvesting and
processing, illegal trade, and shortage of finance are among the problems one would come across
all the study areas.
Table 5.9: Major problems facing the coffee sector across some of the study areas in the
views of zonal and district coffee experts
Problems/constraints Gewata
(Kaffa)
Wolayit
a
East
Hararge
West
Hararge
East
Welleg
a
Poor harvesting practices x x X x x
Lack of capital/finance (farmers, coops &
traders)
x x X x x
Lack of capacity among legal private traders x
Lack of improved varieties and seed/seedling x X x x
Lack of conducive institutional structure,
strong extension, budget, human-power
x x x
x x
Shortage of farm inputs, tools, sacks x X x
Pests/diseases* and lack of resistant varieties x x X xx
Illegal trade, and competition among traders xx xx Xx x xx
Prevalence of traditional coffee hulling using
mortars (Merbush)
x X x-
x
Lack of coffee drying and/or processing
materials
x x X x x
Lack of price difference locally and narrow
price margins with ECX’s grading system
X x x
Aged and exhausted coffee trees X x
Labour and land shortage xx
Water shortage; erratic and inadequate rainfall Xx xx
Coffee price fall or fluctuation pushing
farmers to other crops
X x x
Weak operations of primary market centres x x
*Scale insect in Sodo Zuria; coffee berry disease in Hararge, Kaffa, Wolayita and Tembaro.
X- = on the decline

161
5.2.6. Views about coffee or multipurpose cooperatives’ operations, services and benefits
The findings show that different stakeholders have mixed views about cooperatives and their
services. However, in general, almost all the interviewed key informants understand that despite
some setbacks, cooperatives are important agents to catalyse socio-economic development
among smallholders and the community. They noted that cooperatives have a potential to help
members in accessing various services such as extension information, market, credit, education,
critical assets, inputs and other external supports. More importantly, cooperation boosts farmers’
bargaining power, shields them from exploitation and opportunistic acts of private traders,
stabilises market, generate economies of scale advantage, and promotes self-help and social
cohesion. Key informants noted that Ethiopia’s development strategy recognises that
cooperatives are instrumental in addressing problems of scale and fragmentation. It was noted
that though the pace and scope is not yet satisfactory, in Ethiopia cooperatives have started
generating some notable benefits in recent years. In particular, their performance and
contribution in marketing members’ coffee were mentioned as a remarkable achievement. Coffee
and cooperative experts in particular commended cooperatives’ role in improving coffee quality,
in helping farmers to access better and alternative markets such as certification and fair-trade
markets, which help them earn better income for their members and country at large. But such an
important role appears to be limited only to cooperatives with strong capacity and substantial
experience in coffee business.
According to the cooperative experts, the major services provided by coffee and/or multipurpose
cooperatives include: output marketing, supply of farm inputs and tools/materials, education of
members, supply of consumer items and flour mill services, among others. Key informants
however indicated that though cooperatives are expected to provide multiple services to
members, they often tend to concentrate on supply of farm inputs such as fertilizer with the
government intervention. As a result, their involvement in distributing fertilizer is more valued
by farmers in some areas than their role in marketing members produce. However, key
informants noted that in some of the coffee growing areas such as Kaffa, coffee cooperatives are
not encouraged to be involved in supply of fertilizers. If coffee cooperatives are wishing to
provide fertilizer, they need to have separate warehouse for such items. Cooperatives in marginal
coffee producing areas such as Wolayita indicated that their operations are diverse, which

162
include trading root crops, fruits, maize, haricot bean, fertilizer, consumable items, improved
seeds and coffee.
In general, almost all key informants pointed out that majority of the cooperatives in Ethiopia
have weak capacity (finance and management). This has severely hindered their access to
various services as well as limited their role in marketing members’ output and capacity to
sustainably generate benefit for their members. One farmer amongst the groups in Wolayita said
‘‘I joined my cooperative long time ago, but have never received any dividend. Currently, let
alone providing other significant services, most of the cooperatives in the area are not in a
position to collect all members’ coffee’’. The manager of one of the new unions indicated that
primary cooperatives do not operate with proper and strategic planning. According to him, the
common practice is that unions provide some loan to primary cooperatives and instruct them to
get to the market and purchase coffee, which they then pass on to the union with no or little value
adding activities.
In general, almost all key informants indicated that despite some shortcomings, cooperative
unions play a more active role in marketing members’ coffee than primary cooperatives. The
current researcher also observed that cooperatives play an important role where there are
stronger and vibrant unions. Such cooperatives were able to attract more farmers because of the
dividends and other services rendered to members and their community at large. However, some
cooperative management and farmers groups reported that unions sometimes tend to monopolise
and retain most of the returns and benefits. In other words, the popular principal-agent problem
arises as the unions or their managers sometimes fail to act in the best interest of member
cooperatives. It was emphasised that it would be of little use if unions focus on developing
themselves without supporting and benefiting primary cooperatives. The need to support primary
cooperatives and grow together was said to be critical. Though they commended the attention
rendered by the government in recent years, most key informants and focus groups were of the
opinion that primary cooperatives still were not receiving sufficient support. Farmers’ focus
groups suggested that like the unique marketing system put in place for cooperatives, the
government needs to provide privileges and improved access to institutional finance as well. All

163
key informants emphasised that further efforts need to be exerted in terms of strengthening and
making cooperatives more effective, beneficial and vibrant development actors.
In terms of trust and members’ participation in their cooperatives, there appears to be mixed
views. Most of the cooperative management focus groups and some cooperative experts were of
the view that members’ confidence in their cooperatives and commitment of cooperatives'
management is commendable. Other stakeholder groups however argue that there are substantial
gaps in members’ confidence, sense of ownership and participation in their cooperative’s
business and affairs (meetings, elections and key decisions). Despite some improvements in their
organisation, management and operation in recent years, almost all key informants noted that
most primary cooperatives still experience poor governance and management. Their
management is led by non-professional (is committee-based), who often lack competence,
transparency and commitment. For instance, none of the 33 coffee cooperatives operating in
Kaffa zone has a professional manager. Key informants noted that some self-serving
management committee members and managers still tend to misuse cooperatives’ resources and
this has continued to affect farmers’ attitude towards cooperatives. Moreover, some experts were
of the opinion that the government took an interventionist approach in promoting the cooperative
sector. They went on to note that the government has maintained interference in cooperatives’
internal affairs, which include influencing election of management committee members and the
type of businesses to be undertaken by cooperatives.
In general, members’ confidence and participation largely depends on the performance of
cooperatives business and management, which vary across cooperatives. Well established and
strong cooperatives with committed management appear to enjoy better confidence and interest
among farmers because of the benefits generated for members. Those cooperatives which
undertake value addition have good market linkage, provide dividend, and other services are well
accepted among members. Key informants indicated that the member size of such strong
cooperatives is on the rise. It was reported that in some districts of Kaffa and Wolayita a few
member farmers have started delivering coffee to their cooperatives on loan. In addition, even if
they could not collect all members’ coffee, farmers in some areas continued delivering to their
cooperatives the volume they are able to purchase. However, majority still prefer to sell their

164
coffee to private traders. This is mainly due to the fact that private traders often have the
opportunity to enter coffee market in time (early in the season) as well as have the capacity to
flexibly, sometimes irrationally, change coffee prices. Key informants and focus groups
indicated that the recent cooperative restructuring and reforms have played an important role in
boosting farmers’ confidence in cooperatives and their management. Key informants also
underscored that the effectiveness of cooperatives largely depends on the presence of committed
professional cooperative promoter.
5.3. Are coffee/multipurpose cooperatives suitable to act as intermediaries for
bank loans?
We tried to find out views of the various stakeholders with regard to coffee or multipurpose
cooperatives’ potential and suitability to serve as intermediaries for bank loans. In general,
though all agree on the benefits and advantages of channeling loan funds (such as cherry
advance) to individual cooperative members, there was no consensus on whether primary
cooperatives can effectively serve as intermediaries for such loans. Out of the interviewed 100
cooperatives’ chairperson or managers, a large majority (62%) were surprisingly of the opinion
that cooperatives cannot handle such responsibility, while 38% felt that they can take on such
roles. Likewise, various key informants pointed out that such task is a delicate and complicated
duty that may cause problems to primary cooperatives as they are non-professionals in this area.
However, some key informants said cooperatives know their members very well as well as have
strong roots in the community, thus can effectively play such intermediary role depending on the
strength of their institutional and managerial capacity. They however warn that as it is a sensitive
undertaking, such responsibility should be assumed by carefully selected and strong
cooperatives, preferably with the involvement or guarantee of unions. For instance, in the views
of key informants, unions may take bank loan and pass on to primary cooperatives, who then
lend to individual farmers. Moreover, prior to their involvement in such tasks, their capacity
needs to be properly built and effective system needs to be put in place for loan delivery,
monitoring and recovery. Parallel to these efforts, member farmers need to be sensitised and
educated on proper loan utilisation and repayment.

165
Some key informants pointed out that even if it is carried out in an informal way, some
cooperatives are already involved in such activities. When we asked multipurpose/coffee
cooperatives if they ever gave loans or advances to member farmers, half of them said yes, while
the rest had never provided any advance/loan. Most key informants however noted that currently
many cooperatives provide loans to members in kind; i.e. in the form of farm inputs such as
fertiliser and improved seeds. It was noted that farmers are in dire need of cash in
September/October and start selling immature cherries to meet their financial needs. Coffee and
cooperatives experts thus emphasised the significance of providing crop/cherry advance to
cooperative member farmers. One interviewed expert noted that provision of such crop advance
previously worked well during the Wolayita Agricultural Development Unit programme. Key
informants were of the opinion that such an intervention can address some emergency cash needs
among primary cooperatives. This would in turn help cooperatives to overcome the challenges
posed by private traders (informal money lenders24
) and enable them to get sufficient access to
members’ coffee.
On the other hand, key informants of microfinance institutions do not support such involvement
of multipurpose cooperatives in financial service delivery. They pointed out that it is illegal for
the commodity-based cooperatives to provide lending services nor to mobilise savings. One MFI
key informant emphasised that they also previously tried to provide such services and failed. He
was of the opinion that specialised cooperatives have to be used if such services have to be
effectively delivered. In general, most stakeholder groups were of the opinion that such financial
intermediary roles should be handled by special institutions such as SACCOs or MFIs.
5.4. Challenges and constraints of coffee or multipurpose cooperatives
During the qualitative in-depth analysis, different stakeholders outlined a range of problems and
constraints faced by primary cooperatives (Table 5.10). Among others, cooperatives’ weak
capacity (financial, governance/management, technical, business, etc.), shortage of capital and
lack of access to loan, lack of infrastructure and critical facilities, and government interference
and lack of adequate support and weak market linkage were identified as the major challenges
24
Some local traders or informal money lenders provide loan to farmers during the months preceding the harvest
season when farmers face critical financial gap with the agreement to collect their cherry during the harvest season.

166
and constraints of cooperatives in the study areas. As the number of informants in the below
table suggests, the importance attached to each of them vary across stakeholder groups. For
instance, poor governance and management and shortage of capital were considered as a critical
challenge by cooperative and bank experts, while farmers and coffee experts appear to view
overall weak institutional capacity of cooperatives and lack of sound business enterprise and skill
as the major limiting factors. The management of cooperatives understandably failed to view
poor governance and management as a major problem. They rather strongly complained about
lack of access to loan finance and adequate external support.
Table 5.10: Challenges and constraints of cooperatives as outlined by different stakeholders
Challenges and constraints of
cooperatives
Number
of coffee
experts
cited
Number
of coops
experts
cited
Number
of coops
mangt
FGs cited
Number
of farmers
FGs cited
Number
of bank
KIs cited
Weak institutional and operational
capacity and skills*
4 5 3 4 4
Problem of governance or
management**
3 7 - 3 6
Shortage of capital, and lack of access to
credit (on time)
2 7 4 3 5
Market problem (lack of alternative
market outlets; price fluctuation; illegal
trade, pressure from private traders)
2 2 2 2 5
Lack of facility/infrastructure –
warehouse, processing facility, transport
2 1 3 2 4
Government intervention, lack of
adequate monitoring, commitment and
support from the promoting agency
4 2 1 3 3
Members’ poor participation and lack of
awareness and commitment
1 2 - 1 2
Weak link with and support from union 1 1 3 - 1
Lack of collateral 1 1 4
Lack of strategic plan and vision 1 3
Coffee yield reduction and/or nature of
agricultural enterprise
1 1 2
*Includes marketing, management, finance, documentation, technical and business, etc.
**Includes lack of professional manager (committee-based management); lack of commitment; resource
misuse; lack of managerial and financial skills.

167
5.5. Credit for Agriculture, Coffee and Cooperatives
5.5.1. What are the priority areas for banks’ lending activities?
This section presents the views of various key informants and focus groups with regard to credit
supply to agriculture, coffee and cooperative sectors, with special focus on priority sectors for
bank lending. Banks provide different loan products and loans with different terms. Among the
Government Commercial Bank (CBE), short-, medium- and long-term loans are for up to 3, 7,
and 15 years duration, respectively. The terms are up to 3, 5 and 10 years among the private
banks. The recent directive of the National Bank however compels banks to limit the maturity of
short-term loan to one year, and this component should not account for less than 40% of their
loan portfolio. Most banks expressed preference for extending short-term loan because of its low
perceived risk level. As one bank officer indicated, long-term loan can also bring about fund
mismatch; i.e. a situation whereby depositors want to withdraw money but banks face liquidity
problem. Exceptionally, one private bank officer indicated preference for long-term loans
because of the high interest rate it attracts. This key informant was of the opinion that with the
disbursement of long-term loans, they are not required to purchase NB bill25
every year as they
do with short-term loans.
All categories of key informants concur that there is limited supply of financial resources to the
coffee sub-sector and to the agriculture sector in general. They were of the opinion that
agriculture, primary cooperatives and smallholder farmers are not treated as priority sectors,
particularly among the private banks. In its sector perspective, export, agriculture (especially
mechanisation and agro-industry), manufacturing and domestic trade have been mentioned
almost by all bank informants as priority sectors in that order. This, however, appears to be a
national policy direction, rather than actual priority lending areas for all banks. In reality
understandably private banks heavily focus on profit maximisation. Agriculture claims a tiny
proportion of the loan portfolio of most commercial banks. As presented in Table 5.11,
25 Most banks indicated that the directive of National Bank restricts their loan disbursement capacity. For every
disbursement they undertook, they have to purchase government bond of five years at 3% interest rate. This
appeared to affect their liquidity and profit. Banks stated that they are devising strategies to overcome the
challenges, indicating that they will shy away from making conventional lending, and focus on selected areas such
as importers and exporters, and those who can make some deposits.

168
information extracted from the annual reports of the major private banks reveals that less than
3% of their loan portfolio goes to agricultural production. Domestic trade and services,
international trade and construction enjoy the lion’s share of the loan portfolio of private banks.
Private banks divulge that at present they highly focus on export-oriented activities in an attempt
to generate foreign currencies. As a result, the export sector enjoys lower interest rate, around
9% amongst most private banks. Services come second in terms of lending preference of banks
as this sector is more liquid with high turn-over, as well as involves some saving deposits.
Almost all key informants, including bank officers, were of the view that banks are reluctant and
hardly make efforts to reach out to smallholder farmers and their cooperatives.
Key informants noted that though CBE and DBE26
used to be the major sources of finance for
cooperatives, in recent years their focus has shifted to financing major government development
projects, export promotion and selected priority private investments. Institutional loans for coffee
are mainly channeled to private coffee traders (suppliers and exporters) and unions. In general, in
terms of credit allocation, the production end of the coffee supply chain has been suffering. It
was noted that even the loans provided to farmers’ cooperatives (by the state owned commercial
bank) are usually for non-coffee activities such as input for food crops with government’s
guarantee. The key informant from the government commercial bank indicated that their bank
focuses on large scale commercial farmers (with over 30 ha coffee plantation), irrigated and
mechanised farming, traders who supply coffee to the ECX centre and exporters. Among all
commercial banks, CBO appears to undertake a commendable work in reaching out to
cooperatives, at least through their unions. However, since it is a cooperative bank, individual
farmers request cannot be considered by CBO. Some key informants comment that though three-
quarters of the share of CBO belongs to cooperatives, there is a tendency to favour private
traders when it comes to loan supply.
26
DBE is a policy bank and focuses on project financing and on new business developments. It primarily supports
government’s policies and regulations, focusing on high priority areas such as export-oriented and manufacturing
industries, skin and hide and flower. The production side of coffee falls under the non-priority areas.

169
Table 5.11: Sectoral distribution of loans and advances by economic sector for some private
banks for the period July 2011 - June 2012
Economic sector Percent
CBO Abyssini
a Bank
Oromia
Int.
Bank
NIB
Bank
United
Bank
Awash
Int.
Bank
Dashen
Bank
Agricultural
(production)
2.05 0 2 3 2.41 2.07
Domestic trade and
services, including
hotel and tourism
83.64 43 37 22.40 21.6 27.59 33.09
International trade
(Import and export)
9.80 33 16 30.20 39.40 32.67 15.29
Building/construction 0.71 14 17 18.50 12.20 21.27 18.56
Industry/manufacturing 1.93 6 7 12 17 6.95 21.30
Transport &
communication
2 5 2.2 4.70 5.58 6.34
Financial institutions 4.2
Others/personal 1.87 3 1.5 0.7 5.10 2.53 3.87
Total 100 100 100 100 100 100 100
Source: Extracted and converted from annual reports of the respective banks (July 2011 – June 2012)
Almost all bank key informants understand that cooperatives are vast and important market
segments. They were however of the opinion that at present there are plenty less risky, more
lucrative and premiere urban-based borrowers, whose demand has not been met. Given the
current situation of cooperatives and tightness of the financial system, most of the interviewed
bank officers doubted the profitability and feasibility of lending to farmers cooperatives unless
they are linked to export markets. In contrast, two bank and MFI officers and most cooperative
experts were of the opinion that lending to this sector is indeed profitable and feasible as long as
their business is feasible and well managed. They, however, emphasised the need for enhancing
cooperatives’ awareness and strengthen their management, business and institutional capacity.
This should be complemented by proper screening during approval of loan application.
Key informants identified a number of factors that constrain banks’ loan supply to the
cooperative sector and cooperatives’ access to such loans. These among others include: lack of
collateral, liquidity problem (among lending banks), cooperatives’ poor financial system/record,
lack of credit history, lack of awareness and knowledge about lending institutions and their
requirements, failure to repay loans in the past, high perceived risk level of the agriculture and

170
coffee sector, problems related to output markets and cooperatives’ weak business, leadership
and management capacity. In particular, bank officers tended to largely attribute the gaps to
limitations in bankability of cooperatives’ business and their poor management and institutional
capacity, lack of credit history, lack of viable collateral, remoteness and associated costs of
lending. Discussions with some key informants highlighted allegations of bribes among some
bank managers and/or loan officers in allocating loan, and noted that cooperatives cannot be
involved in such acts. In addition, government’s intervention in cooperatives’ business, lengthy
and complicated bank requirements and processes, lack of alternative lending institutions in rural
areas and loan products of their choice were highlighted by cooperatives as additional constraints
in accessing commercial loans.
5.5.2. What are the sources of loan for cooperatives?
The findings show that most primary cooperatives never received loans directly from banks. For
instance, officers from Mesela district in West Hararge indicated that primary cooperatives in
their district never had direct access to bank loan prior to the launch of the current credit
guarantee scheme. Unions were almost the sole providers of loans to primary cooperatives.
Similarly, a cooperative promotion expert from Kaffa indicated that prior to the initiation of the
current guarantee scheme, the sole source of credit for coffee cooperatives in the zone was their
coffee farmers’ cooperative union. In other words, unions act as intermediaries for bank loans as
they have better facilities (assets of better quality and value) and market linkage that boost
confidences of the lending institution. However, unions provide small amount of loans (often
about two to five thousand Birr to each member cooperative), which is of short-term (for few
weeks or months) and often reaches cooperatives late in the season. In addition, cooperatives that
have not been affiliated to any union cannot access such loans. Some of the unions were
struggling in obtaining bank loans due to their poor business performance and/or weak
institutional capacity. In this regard, the younger unions seem to suffer most. For instance,
discussion with Kaffa union reveals that during the 2013/14 coffee season, they submitted a loan
application of 20 million Birr to four banks. However, their request was not favoured by all the
banks. Consequently, this union failed to supply any loan to its member cooperatives during that
entire season. The amount of loan applied for was also so meager as compared to the number of
cooperatives they are supposed to cater for (33 cooperatives). This particular union was obliged

171
to retain the previously generated profits and to use for coffee purchase instead of distributing it
to member cooperatives as dividends.
Almost all key informants were of the opinion that MFIs do not cater for financial needs of
cooperatives at present. For instance, the Oromia MFI, which is the second largest MFI in the
country, reported that they have not reached out to farmers’ cooperatives yet. MFIs often provide
short-term loans with high interest rates, while their loan volume is too small for cooperatives’
business. In general, the loan products of MFIs do not seem to be suitable for cooperatives
dealing with cash crops such as coffee, which requires substantial amount of money. A senior
official of one MFI indicated that paradoxically at times cooperatives and MFIs tend to view
each other as competitors. Moreover, in order to qualify for loans of MFIs, borrowers need to
deposit 50% saving. Interviewed mangers of some MFIs admitted that their large loan portfolio
share goes to the livestock sector. In addition, one senior official of MFI was of the opinion that
their services tend to focus on urban community such as SMEs, youth and other urban poor.
Consequently, MFIs were cited by most key informants as the least preferred option of loan
source for farmer cooperatives.
Almost all key informants and focus groups indicated that the main and preferred sources of loan
for agriculture and coffee are still remain to be banks. In particular, some of the key informants
from Oromia region were of the opinion that CBO is a preferred source of loan since it is more
coops-friendly. Some key informants mentioned RUSACCO as potentially suitable source of
loans for farmers and cooperatives in the future. The government expects that RUSACCO should
cater for the financial needs of the rural community, and there seems to be a direction for having
one rural SACCO in one Kebele. However, as of now most of the RUSACCOs are at their infant
stage and have weak financial and managerial capacities. One key informant emphasised that
diverse sources and providers of finance should compete and serve the rural population. This
plays an important role in improving efficiency as well as helps to overcome monopoly.

172
5.5.3. Cooperatives experience with credit services
5.5.3.1. Cooperatives’ loan access
When asked if they were able to obtain loan during 2010, 2011 and 2012, only 39%, 61% and
41% of the cooperatives, reported receiving loans from some sources over the three years,
respectively. The mean amount of loan cooperatives were able to receive over the three years
(2010; 2011 and 2012), was 347,901; 486,015 and 580,847 Birr, respectively. Some of them
received as small as 20,000 and 50,000 Birr which is too meager to undertake coffee trade
activities. In this respect, when we asked cooperatives if the amount of loan they had received
was adequate for the purposes they needed for, less than 10% believe that the amount was indeed
sufficient.
Table 5.12: Summary of cooperatives’ loan access
Year Did take loan? (N=100)* If took loan, how much (Birr)
Yes No Max Min Mean
2010 39 (42%) 61 (58%) 1,873,858 20,000 347,901
2011 61 (62%) 39 (38%) 3,467,104 43,250 486,015
2012 41 (44%) 59 (56%) 2,182,549 50,000 580,847
*Some of these loans were obtained from their respective unions
When we analysed the differences in accessing loans among cooperatives located in the two
regions, over three-quarters of the cooperatives in the Oromia region were able to receive loans
in 2011 (immediately before the launch of the current scheme), as compared with 44% for those
located in SNNP region (Table 5.13). The association between the two variables was also
statistically significant (X2 = 12.148; P = 0.001).
Table 5.13: Relationship between regional location and loan access in 2011 (N = 100)
Received loan in 2011 Cooperatives’ regional location
Oromia (No and % of coops) SNNP (No. and % of coops)
Yes 39 (78%) 22 (44%)
No 11 (22%) 28 (56%)
Total 50 (100%) 50 (100%)
X2
= 12.148 DF = 1 Sig. = 0.001

173
We also asked cooperatives the sources of loans they had obtained over years (2010 to 2012).
The vast majority (74 – 84.50%) indicated receiving loans from their respective unions. In
addition, 10%, 13% and 17% reported receiving loans both from unions and banks over the three
years under analysis. As indicated in Figure 5.3, a few cooperatives reported receiving loans
directly from banks. The survey similarly shows that MFIs and RUSACCOs were not serving
cooperatives for various reasons, such as lack of financial capacity and suitable loan products.
*Union loans are also coming from banks through the mediation of unions
5.5.3.2. Purpose for which loan was taken
When asked the purpose for which the cooperatives used loan they had acquired, they reported
using it for trading various types of coffee and other commodities. As indicated in Table 5.14,
about 58 – 63% of the cooperatives used the loans to purchase dry cherry during the period 2010
to 2012. In addition, some reported purchasing dry coffee alongside red cherries or other
commodities. Another interesting aspect of this finding is that a few cooperatives used the loans
to acquire processing facilities or to undertake long-term investment. This could be due to the
fact that the loans were of short-term nature and do not allow such long-term investments.
84 84.5 74
4 2.5 5 5 13 17 0 0 2 0 0 3 0
10
20
30
40
50
60
70
80
90
2010 2011 2012
P
e
r
c
e
n
t
Figure 5.3: Source of loans taken over years (percent of cooperatives)
Coops union*
Banks (direct)
Banks & union
MFI
RUSACCO

174
Table 5.14: Purpose for which previous loan was used
Purpose of loan
2010 & 2011 (N = 76) 2012 (N = 69)
No. and percent of
coops
No. and percent of
coops
To purchase fresh cherries 13 (17%) 8 (11.50%)
To purchase dry coffee 44 (58%) 43 (63%)
To buy and sell both fresh & dry cherry 5 (6.50%) 4 (6%)
To purchase dry coffee and/or inputs 2 (2.50%) 6 (9%)
To purchase & sell grains and/or spices 5 (6.50%) 4 (6%)
To buy dry/fresh cherries and/or drying material 4 (5.50%) 2 (3%)
To buy fresh & dry cherries, install wet mill 3 (4%) 1 (1.50%)
5.5.4. Terms and conditions of institutional loans
5.5.4.1. Loan duration, loan repayment schedule and length of loan processing
The findings show that the duration of the bulk of the loans obtained over the three years (2010 –
2012) ranges between 1 and 12 months. More than half of the cooperatives who received loans
over the three years indicated obtaining loans with one year maturity period. The rest reported
receiving loans of six month and shorter maturity period. However, only three cooperatives
reported obtaining loans with repayment period of 18 to 48 months. This seems to refer to the
three cooperatives that were able to acquire medium-term loan in 2012 under the current scheme.
Bank key informants indicated that loan repayment schedule depends on the nature of the
business of the applicant and is normally aligned with cash generation and inflow. The shortest
repayment schedule for bank loan is one month. Bank officers indicated that loans for agriculture
and coffee trade activities are usually paid back annually or sometimes semi-annually. In
particular, working capital for cooperatives is often repaid once annually, while loan for
processing machinery is repaid once per annum over some years. Key informants and focus
groups were of the opinion that an annual lamp-sum repayment arrangement at the end of the
harvest season is more suitable for coffee cooperatives. They further pointed out that repayment
schedule should be aligned with proper time of marketing of coffee to avoid the price fall during

175
the harvest season. One of the challenges raised by cooperatives is that bank loan often tends to
be of shorter duration, and does not allow them to undertake long-term investment activities.
On the other hand, interviewed cooperatives indicated that loan processing for the loans obtained
over the three years (2010 to 2012) took less than a week and up to 6 months. The average loan
processing time for the three years was 5 to 6 weeks. The findings of the qualitative study
confirm that loan processing time with unions is often shorter than the time taken to directly
obtain from banks. This is due to the fact that unions obtain loans from commercial banks and
pass on to member primary cooperatives even without the request of those cooperatives. But it
was reported that such union loans arrive late in the season and are small in amount.
5.5.4.2. Interest rate
Bank key informants indicated that the interest rate charged on loans depends on tenure of the
loan, type of loan product, economic sector, collateral type, and time horizon (increases with
time because of risk and uncertainty). In general, private banks reported that they charge interest
rates that vary between 8.5% and 15%. Long term-loans extended by private banks for such
sectors as agriculture usually attract high interest rate of up to 14% or 15%, while that of export
is as low as 9%. The interest rate charged by the state commercial bank appears to be lower; i.e.
loans for agriculture and manufacturing attract about 9.5% interest rate, while that of final export
is 7.5%. Cooperatives participating in the current credit guarantee scheme are charged 12% for
the short-term working capital and 13% to 14% for the medium-term loans acquired for coffee
processing machine. This was in fact viewed by some key informants as a relatively higher rate.
Some key informants indicated that one of the attractive features of SACCOs is their low interest
rate. In contrary, the study found that the interest rate of most MFIs is too high (i.e. as high as
26%), which may make them potentially preferred source in the future.
5.5.4.3. Collateral and other lending requirements
In terms of collateral requirement or coverage level, there seems to be flexibility based on
borrower type (customer reputation and relationship with the bank), nature of the project or
business (profitability and riskiness), collateral type, financial standing of the borrower and other
factors. Some bank officers indicated that there could be instances when clean-based loans are

176
provided to reputable and premiere customers, which are in fact minute as compared to the
proportion of other borrowers. Among the state commercial bank, low risk grade projects are
expected to provide a collateral coverage of up to 75%, while medium risk grade is required to
cover 85%. Moreover, investment projects are expected to contribute 30% equity, with some
flexibility depending on the nature of the collateral provided. Banks pointed out that provision of
loan security is relatively easier with cooperative unions and exporters, who have better facilities
that can be pledged as collateral. In addition, their sales contract can serve as collateral.
At present CBO is the sole provider of clean based-loans to carefully screened (their) shareholder
cooperatives. In this instance, a support letter from the cooperative promoting government body
has to be furnished. It was however noted that many cooperatives are not shareholders of CBO,
thus do not qualify for such borrowing facilities. The findings show that collateral requirement
for private banks are often in the range of 100 to 120%. For instance, CBO requires a collateral
security of 80 to 120% coverage when lending to private borrowers. In terms of collateral type,
banks prefer fixed assets such as buildings, though vehicles and machines can also be taken as
collateral. Collateral requirement could be up to 80% for buildings and 200% for vehicle or
machine. On the other hand, if a cooperative wants to purchase coffee processing machine, the
lending bank may cover only up to 50 - 70% of the cost, while the borrowing cooperative is
expected to provide the rest as an equity. In general, various key informants indicated that
collateral requirement is generally a serious impediment to farmers’ cooperatives in accessing
loans from private banks, apart from the CBO.
In addition to collateral, banks ask for other documents such as legal entity, license (for private
traders), up-to-date financial statements, support letter from government body, business plan,
proforma invoice (if the loan is for purchase processing machine), among others. In addition,
screening criteria for cooperatives’ loan application may consider credit track records,
governance and strength of management of the cooperative and viability of their business.
Cooperative promotion experts and cooperatives’ management were of the opinion that banks
often put forward lengthy, cumbersome and prohibitive lending requirements and procedures,

177
some of which are unclear. In particular, securing TIN27
numbers and lengthy negotiation
process with the bank were the major challenges in obtaining loans from CBO even under the
current guarantee scheme. One cooperative management focus group emphasised that lending
criteria and requirements for cooperatives have to relax and differ from other borrowers since
cooperatives serve the community, and have unique mission and objectives. On the other hand,
MFIs representatives pointed out that loan security or issue of collateral is not a major problem
with their service. Because they follow the Grameen model which is based on group approach (6
to 60 people); i.e. social guarantee or cross guarantee system.
5.6. Cooperatives’ Institutional, Socio-economic & Business Characteristics
5.6.1. Profile of study cooperatives
The cooperatives included in the formal survey were selected from 38 districts of the eight zones
of Oromia and Southern Nations Nationalities and Peoples (SNNP) regions that have been
involved in the credit guarantee scheme under analysis (See Table 5.15). Out of the total 100
cooperatives included in the baseline study, half were drawn from Oromia, while the remaining
half were selected from the SNNP region. The study areas represent different coffee farming
systems, agro-ecological conditions and socio-economic set up.
Table 5.15: Regional locations of the primary cooperatives included in the (baseline) study
S.N. Zones (location) Region Number of coops surveyed
1 East and West Wellega (Western) Oromia 25
2 Kaffa (South West) SNNP 18
3 Wolayita (South-1) SNNP 12
4 K/Tembaro and Hadiya (South-2) SNNP 20
5 East and West Hararge (Eastern) Oromia 25
Total 100
27
Borrowing cooperatives have to produce two TIN numbers (one in the name of the coops and another one by the
name of one of the members of the management committee). Every loan applicant has to be recorded in the system
of credit centre of the NB. The bank needs to provide up-dates (to the system) on loans released and additional loans
provided. It is basically a means of credit information sharing. Such requirement was introduced in late 2012. It has
no tax implication as cooperatives are exempted from tax.

178
As regards their age distribution, some of the cooperatives were as old as 43 years, while a few
were just 2 years old during the survey (as of late 2012 and early 13), with a mean age of about
13 years. More than half (54%) of the cooperatives were 10 years old and younger. The sampled
cooperatives were established between 1970 and 2010, out of which close to 85% were
established after 1989, towards and after the end of the military regime. Out of these, 37% were
formed just between 2003 and 2005, which seems to overlap with the creation of the Federal
Cooperatives Agency, a government body that promotes and regulates cooperatives.
The member size for the study cooperatives varies from 44 to 2500 farmers, with a mean of 579
farmers. As regards variation across regions, on average, cooperatives in the SNNP region
appear to have larger number of members than their counterparts in the Oromia region (Table
5.16). The T-test results however show that the difference between the member size of the
cooperative’s located in the two regions is not statistically significant (P = 0.132).
Table 5.16: Relationship between regional location & cooperatives’ member size (N = 100)
Regional location No of respondents Mean member size SD
Coops in Oromia 50 499 392
Coops in SNNP 50 660 641
Total 100
T-value = -1.520 DF = 81 Significance = 0.132 (NS)
In its gender dimension, the number of female cooperative members varies between zero and
650, with an average of 72 female members per cooperative. Interestingly, one of the
cooperatives did not have any female member at all. Age and educational status of the people
managing cooperatives are among the variables presumed to influence quality of cooperatives’
management and performance of their business activities. The findings show that the mean age
of cooperatives’ chairpersons is 41 year, and ranges between 27 and 62 years. The vast majority
(close to 81%) are found in the age group of 32 to 50 years, which seems to be ideally productive
as well have acquired adequate experience.

179
Table 5.17: Summary of some demographic characteristics of the study cooperatives
Attributes Min Max Mean
Age of cooperatives (year) 2 43 13.40
Cooperatives member size 44 2500 579
Age of cooperative chairperson (year) 27 62 41
In terms of educational status, only the chairpersons of management of two cooperatives were
illiterate, while 16% can just read and write (i.e. attended some form of informal education). The
vast majority of the cooperatives’ chairpersons or managers (82%) attended formal education.
Out of these, 32% and 45, respectively, completed primary school and attended secondary
school, while only five of them (5%) attended post-secondary education.
5.6.2. Economic/business activities and resource ownership
5.6.2.1. Type of cooperatives and their main business activities
The sampled cooperatives reported that their experience in coffee business varies from 1 to 15
years, with a mean of about 6 years as of end of 2012. With respect to coops type, out of the total
100 cooperatives included in this analysis, six are exclusively coffee cooperatives, while the vast
majority (94%) are multipurpose ones, who are also engaged in coffee trade. As regards sector of
primary occupation, three-quarters (76%) of the cooperatives reported being involved in diverse
business activities including coffee and grain trade (such as wheat, beans, etc.), input supply and
other trade activities. About a quarter were involved only in coffee trade. However, nearly all of
2%
16%
32%
45%
5%
Figure 5.4: Educational level of coops chairperson/manager
Illiterate
Attended informal schooling
Completed primary
Attended secondary
Attended post-secondary

180
the study cooperatives were engaged either solely in coffee trade or in combination with other
business activities. When we examine the difference across regions, SNNP had relatively more
cooperatives that were solely dedicated to coffee trade than Oromia. The Chi-Square test shows
that cooperatives located in the two regions do differ significantly at 10% (X2 = 2.837; P = 0.092)
with regard to their type. Nevertheless, observations and interactions of the current researcher
with cooperatives in the Oromia region reveals that though they are named multipurpose coops,
most of those located in coffee producing areas are predominantly engaged in coffee business.
Table 5.18: Relationship between regional location and type of cooperatives (N = 100)
Type of coops Regional location
Oromia
No. (%)
SNNP
No. (%)
Coffee coops 1 (2%) 5 (10%)
Multipurpose coops 49 (98%) 45 (90%)
Total 50 (100%) 50 (100%)
X2
= 2.837 DF = 1 Significance = 0.092
5.6.2.2. Employed workers and manager
As of September 2012, the sampled cooperatives had 0 to 7 employees with a mean of 2
employed workers. A substantial proportion of the surveyed cooperatives (20%) did not have any
permanent workers, while more than half had 1 or 2 workers. Only 8 cooperatives reported
having 5 and more employees. It is important to note that the majority of these workers are
security guards who have limited direct professional contribution to cooperatives’ business
operations and management. It was however noticed that most of the cooperatives involved in
coffee business hire a number of seasonal wage laborers. On the other hand, as of September
2012, only 11 cooperatives reported having full-time professional manager, while the vast
majority (89%) were being managed by part time committee. This has serious implications for
the performance and quality of their organisation and business management. When we examine
the difference across regions, as indicated in Table 5.19, though more cooperatives in the Oromia
region appear to have professional managers than their counterparts in the SNNP region, the
difference was not statistically significant (X2
= 2.554; P = 0.110).

181
Table 5.19: Relationship between coops regional location and having manager (N=100)
Having professional
manager
Regional location
Oromia
No. (%)
SNNP
No. (%)
Have manager 8 (16%) 3 (6%)
Do not have manager 42 (84%) 47 (94%)
Total 50 (100%) 50 (100%)
X2
= 2.554 DF = 1 Sig. = 0.110 (NS)
On the other hand, the majority of the surveyed cooperatives (55%) reported having an
accountant as of September 2012. It was however noticed that most of the persons working as
accountants are not qualified professionals; they are rather local people with some sort of formal
education.
Table 5.20: Summary of cooperatives’ human resources as of September 2012
Human resource Min Max Mean
Number of permanent employees 0 7 2
Percent of coops with no employed workers 20%
Percent of cooperatives with 1 - 2 employees Over 50%
Percent of cooperatives with 1 – 3 employees 64%
Percent of cooperatives with 5 – 7 employees 8%
Percent of coops with professional manager 11%
Percent of cooperatives that have accountant 55%
5.6.2.3. Cooperatives’ asset/capital ownership
In terms of capital ownership, as of September 2012, the cooperatives included in the analysis
have a maximum total capital that is worth 12.86 million Birr, while some had no capital at all.
The mean total capital of the cooperatives was 1.19 million Birr. Likewise, the interviewed
cooperatives on average had 119,393 Birr in bank, whereby 10 cooperatives had nothing in the
bank while a few had up to 1.24 million Birr. The value of capital in stock ranges between zero
and 11.5 million Birr. Over 20% did not have any capital in stock. It is important to note that
some of the items in stock are fertilizers received on credit, while the rest are coffee, grain and

182
spices (such as ginger) collected from members. On the other hand, the amount of outstanding
liabilities cooperatives had to repay varies from zero to 2.18 million Birr. In fact more than half
of the interviewed cooperatives did not have any outstanding liability. This possibly shows the
fact that primary cooperatives have limited participation in borrowing.
In terms of physical asset ownership, as of September 2012, the vast majority (98%) had their
own offices and office facilities. In addition, 95% and 92% have some kind of warehouses
(mostly substandard) and weighing scale, respectively. Moreover, some have house/rooms for
rent (23%), shop (27%), flour mill (22%), coffee wet mill (5.5%) and coffee huller (1%)
alongside other items. A few cooperatives reported having vehicle (3%), motor bike (2%), safe
box (3%), power generator (1%), water pump (1%), and pharmacy (1%). In terms of value, the
average estimated value of physical assets owned by cooperatives range between zero and 3.74
million Birr, with a mean of 441,567 Birr. Surprisingly, we came across a cooperative with an
asset of no book value, and a cooperative without any fixed asset apart from one weighing scale.
Table 5.21: Cooperatives’ capital ownership as of September 2012
Capital owned Min Max Mean
Amount of total capital 0 12,862,549 1,186,100
Amount of capital cooperatives have in bank (Birr) 0 1,247,245 119,393
Value of capital cooperatives have in stock (Birr) 0 11,500,000 625,096
Amount of outstanding liabilities of cooperatives (Birr) 0 2,182,549 216,276
Value of physical assets owned by cooperatives (Birr) 0 3,735,000 441,567
In terms of regional location, cooperatives located in the Oromia region reported having more
total capital; i.e. on average, 1.4 million Birr as compared with 0.97 million Birr for those from
the SNNP region. However, as indicated in Table 5.22, the difference between the cooperatives
located in the two regions was not statistically significant (T-value = 1.184; P = 0.239).
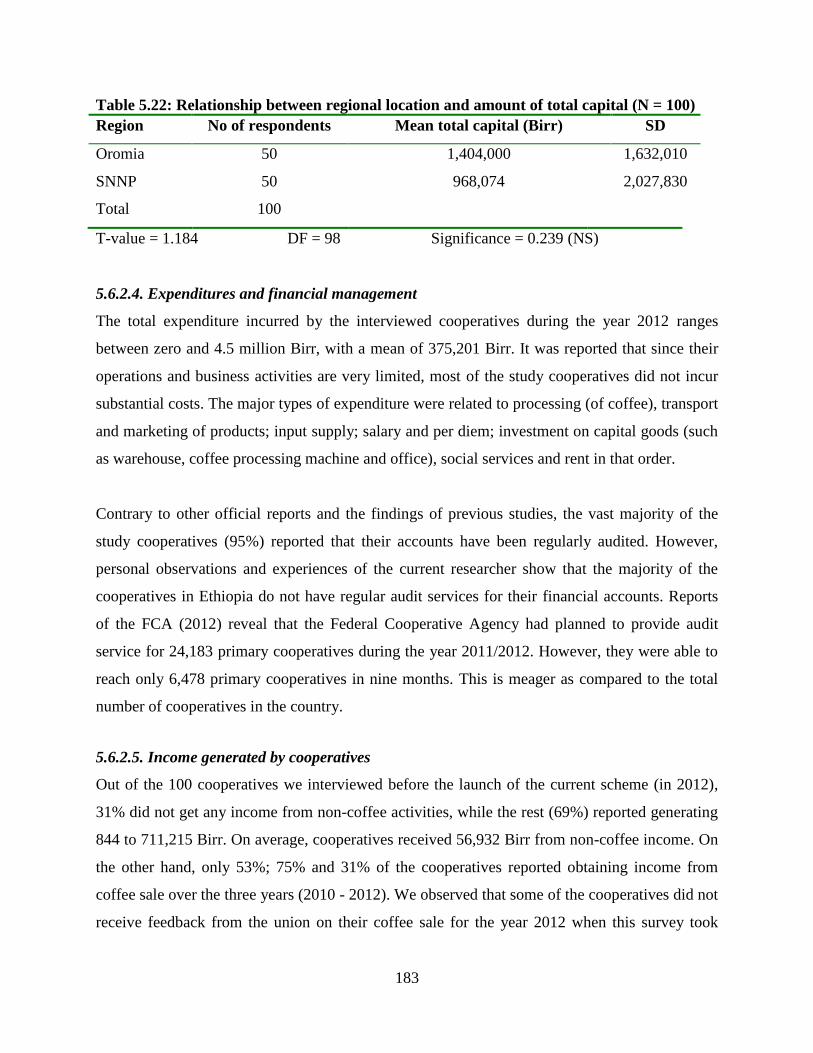
183
Table 5.22: Relationship between regional location and amount of total capital (N = 100)
Region No of respondents Mean total capital (Birr) SD
Oromia 50 1,404,000 1,632,010
SNNP 50 968,074 2,027,830
Total 100
T-value = 1.184 DF = 98 Significance = 0.239 (NS)
5.6.2.4. Expenditures and financial management
The total expenditure incurred by the interviewed cooperatives during the year 2012 ranges
between zero and 4.5 million Birr, with a mean of 375,201 Birr. It was reported that since their
operations and business activities are very limited, most of the study cooperatives did not incur
substantial costs. The major types of expenditure were related to processing (of coffee), transport
and marketing of products; input supply; salary and per diem; investment on capital goods (such
as warehouse, coffee processing machine and office), social services and rent in that order.
Contrary to other official reports and the findings of previous studies, the vast majority of the
study cooperatives (95%) reported that their accounts have been regularly audited. However,
personal observations and experiences of the current researcher show that the majority of the
cooperatives in Ethiopia do not have regular audit services for their financial accounts. Reports
of the FCA (2012) reveal that the Federal Cooperative Agency had planned to provide audit
service for 24,183 primary cooperatives during the year 2011/2012. However, they were able to
reach only 6,478 primary cooperatives in nine months. This is meager as compared to the total
number of cooperatives in the country.
5.6.2.5. Income generated by cooperatives
Out of the 100 cooperatives we interviewed before the launch of the current scheme (in 2012),
31% did not get any income from non-coffee activities, while the rest (69%) reported generating
844 to 711,215 Birr. On average, cooperatives received 56,932 Birr from non-coffee income. On
the other hand, only 53%; 75% and 31% of the cooperatives reported obtaining income from
coffee sale over the three years (2010 - 2012). We observed that some of the cooperatives did not
receive feedback from the union on their coffee sale for the year 2012 when this survey took

184
place. As indicated in Table 5.23, though fluctuations were observed across years, the volume of
income generated by cooperatives on average showed a rising trend over the three years.
Table 5.23: Income generated through coffee business in Birr
Year Minimum Maximum Mean
2010 (N= 53) 2,000 9,062,638 888,475
2011 (N= 75) 1,400 8,160,644 962,057
2012 (N = 31) 6,000 12,005,825 1,728,100
5.6.2.6. Distance from institutional service providers
The distance between the cooperatives and various service providers such as banks, extension
office, market centres and others apparently affects access to services such as credit, information,
market, new technologies, etc. Access to these services also involves costs related to the distance
from their providers. We find that the majority of the cooperatives are located far away from the
local bank branch offices. In this respect, on average, cooperatives have to travel close to 18 Km
to reach the nearest bank, while the farthest cooperatives are located up to 89 Km away from the
nearest bank. When we examine the difference across regions, we found that cooperatives in the
Oromia region were relatively closer to the local bank branches (Table 5.24). The T-test result,
however, shows that the difference is not statistically significant (T-value = -0.858; P = 0.393).
Table 5.24: Relationship between regional location and distance to nearest bank (N = 100)
Region No of respondents Mean distance (Km) SD
Oromia 50 16 13
SNNP 50 19 20
Total 100
T-value = -0.858 DF = 98 Significance = 0.393 (NS)
On average, cooperatives are located about 2.8 Km away from all-weather road. The majority
(about 70%) are located within 2 Km distance from all-weather road, while some have to travel
up to 22 Km to get to all-weather vehicle road. The average distance from a cooperative centre to
the district office is close to 12 Km, while the farthest cooperatives are 43 Km away from the
district head quarter. Similarly, the average distance from the nearest primary coffee market

185
centre (where available) is 4.6 Km, while close to half are located within up to 1 Km distance.
The longest distance to the primary market centre is 50 Km. Similarly, the average distance from
the nearby coffee hulling station is 18 Km, while the farthest is 89 Km. Over two-thirds (68%) of
the cooperatives can access hulling facility within 20 Km distance. As regard the distance from
coffee washing stations, only 48 cooperatives indicated having washing facilities somewhere in
their district. These facilities are owned either by private traders or primary cooperatives. The
average distance to the nearest washing station is about 13 Km, while the farthest is 49 Km.
With respect to access to extension service, over 98% of the cooperatives indicated that they had
contacts with local cooperative/extension agent during the year 2012. In terms of frequency of
contact, on average, the agents visited the interviewed cooperatives 78 times during the year. In
other words, the extension agent visits a cooperative more than 6 times a month, which indicates
presence of a close interaction. On the other hand, when asked if they think that their cooperative
has received adequate support from the cooperative promotion office and agents, the majority of
the cooperatives’ management (81%) confirmed that they indeed got sufficient support, while
19% felt that they did not.
In terms of union membership, 90% were members of a cooperative union, while the rest 10%
were non-members. As regards regional differences, 96% and 84% of the cooperatives from
Oromia and SNNP regions, respectively, are members of a cooperative union (Table 5.25). The
0
10
20
30
40
50
60
70
80
90
Mean distance
(Km)
Minimum distance
(Km)
Maximum
distance (Km)
Figure 5.5: Distance (of cooperatives) from service providers
From all-weather road
From nearest bank
From district coops office
From primary market center
From nearest coffee hulling station
(where available)
From nearest washing station
(where available)

186
Chi-Square results show that the association between cooperatives’ regional location and union
membership is statistically significant (X2 = 4.00; P = 0.046). In respect of service provision,
according to the respondents, union provides the following services at varying degrees. These
include provision of loan, marketing of coffee, education and advice, farm inputs (fertilizer),
access to fair-trade and coffee processing facilities. The vast majority of the cooperatives (94%)
reported that loan supply is the major service they receive alongside some other supports. Over
three-quarters of the cooperatives reported that marketing (alongside some other services) is the
major service they receive from their parent unions. About 64%, 35.5% and 6.5%, respectively,
reported having access to education and training, farm inputs, and fair-trade market along with
other services. When asked if they think that unions are beneficial for member primary
cooperatives, almost all the respondents were of the opinion that unions indeed offer some
benefits to their members.
Table 5.25: Relationship between regional location and union membership (N=100)
Union membership Regional location
Oromia
No. (%)
SNNP
No. (%)
Member of a union 48 (96%) 42 (84%)
Not member of union 2 (4%) 8 (16%)
Total 50 (100%) 50 (100%)
X2
= 4.00 DF = 1 Sig. = 0.046
We also wanted to know if the study cooperatives had experience with other projects previously.
Out of the 100 cooperatives who responded to this question, the vast majority (87%) indicated
that they never participated in any project that targeted improving coffee quality or access to
credit. The remaining 13% reported receiving certain support from some agencies in the form of
coffee drying materials or other service. On the other hand, we observed that a number of
agencies have been involved in supporting coffee development and/or financial service
provision, which mainly target individual farmers or higher level cooperative structures.

187
5.7. Cooperatives’ Demand for Institutional Credit and its Determinants
This section presents the views of various key informants and focus groups with regard to farmer
cooperatives’ loan demand, as well as examines determinants of loan demand with relevant
econometric model based on the survey data.
5.7.1. Cooperatives’ loan demand: views of the key informants and focus groups
We found that external loan tends to be the only source of finance for the vast majority of
primary cooperatives for running their operations such as collecting, processing and selling
members’ coffee. This is due to the fact that most cooperatives have very limited capital of their
own to undertake coffee and other business activities. Cooperatives particularly stressed that lack
of access to long-term investment capital is a severe constraint and acts as one of the major
constraints to their growth and further development. Though some of the cooperatives obtain
small amount of seasonal working capital through the mediation of their union, banks seem to be
reluctant to provide long-term loans to primary cooperatives. All the interviewed cooperatives
concur that lack of access to appropriate financial resources is a major impediment to the growth
of their business and institutional development.
Majority of the key informants and focus groups were of the view that most cooperatives need to
acquire loan at the current market price. They believe that cooperatives can undertake a
profitable business if loans are accessed in time and put into proper use. All stated that various
aspects of coffee business (production, processing and trade) require substantial amount of
money. In particular, the emergence of a large number of new cooperatives in recent years has
resulted in increasing demand for loans. For instance, according to a cooperative promotion
officer from East Hararge, during the 2010/11 coffee season, cooperatives in his zone applied for
90 million Birr loan from different sources. However, finally they were able to secure only less
than 15 million Birr. Similarly, one bank officer gave an example whereby farmers borrow from
micro-finance institutions with high interest rates of up to 22%, and still make profit out of it. A
cooperative management focus group in Wolayita said ‘‘We got organised to undertake effective
business, to provide various services to our members and to transform ourselves. In order to
effectively attain this goal, we need finance because our cooperatives have weak financial

188
capacity’’. One of the farmer focus groups in Kaffa zone indicated that if their cooperative is
adequately supported in accessing loans in the right volume and time, they will be able to
generate considerable benefit from their coffee business. They feel that this allows them to
acquire washing facility, to undertake proper coffee processing and supply good quality coffee
that fetches better return.
Some key informants were however of the opinion that limitations in their institutional and
managerial capacity and other internal and external factors may restrict cooperatives from
effectively demanding for, accessing and utilising loans. In particular, one bank loan officer
expressed doubt about the presence of high demand for credit among primary cooperatives. He
argues that it is not only scarcity of a loan supply which limits cooperatives’ access to loans. A
number of micro and macro factors such as reduction in coffee yield, decline in coffee market
price and weak capacity of cooperatives can depress their demand for institutional loan.
Moreover, some bank officers mentioned that primary cooperatives have not been coming
forward to approach their bank for loans for various reasons. They speculate that this may
emanate from the perception that they cannot meet banks’ lending requirements. One
cooperative expert in fact indicated that many primary cooperatives often struggle to fulfill
banks’ cumbersome lending requirements.
In respect of the purpose for which loans are needed, key informants and focus groups indicated
that cooperatives have various finance requirements in terms of volume, duration and purpose for
which loan is required, including for non-coffee activities. However, most bank key informants
think that cooperatives require working capital for fresh cherry or dry coffee purchase, while a
few mentioned loans to acquire processing facilities and crop advance to member farmers. Most
of the bank officers in particular do not seem to favour extending loans for crop/cherry advance
to cooperative members. They feel that such lending activity is of high risk venture. Cooperative
and coffee experts, however, underscored that cooperatives equally need long-term loans to
acquire washing, drying and hulling facilities. In terms of loan duration and repayment schedule,
as discussed in the above section, key informants suggest that the working capital could be of
one year to be repaid once annually or semi-annually after coffee sale. Investment loan for coffee
processing facilities could be of medium-term of about 3 years with annual installments.

189
In terms of amount of loan needed by cooperatives, one key informant from the private bank
reported that cooperatives may need about 8 to 10 million Birr loan. This in fact seems to be on
the higher side for an average coffee or multipurpose cooperative located in the current study
areas. The majority of the bank key informants generally lack an idea about the volume of loan
needed by primary cooperatives since they have never worked with such groups. Majority of the
interviewed cooperatives’ management and experts indicated that cooperatives in the current
study areas, on average, need one to four million Birr loan per year depending on their
institutional capacity and level of business activity, while a few may even require as high as five
million Birr and above. Key informants noted that non-coffee business such as grain trade
require less amount of capital, probably a loan size of less than one million Birr. It was noted that
there are huge variations in terms of the volume of loans needed by cooperatives located in
different areas. For instance, we observed that cooperatives in East Hararge were more active in
seeking loans from banks than their counterparts in West Hararge, who often depend on their
union in accessing small amount of loans. Moreover, cooperatives in Kaffa and Wolayita zones
revealed demand for larger volume of loan than their counterparts in Hadiya and Kembata
Tembaro zones.
5.7.2. Quantitative analysis of cooperatives’ loan demand
5.7.2.1. Descriptive findings of the formal survey
As outlined in the analytical framework, we employed two approaches to capture cooperatives’
loan demand. When we look at the actual number of cooperatives applied for a bank loan during
the period that precedes the launch of the guarantee scheme under analysis, the findings show
that a small proportion submitted loan requests. As indicated in Table 5.26, only 29% in 2010,
45% in 2011 and 38% in 2012 reported applying for loans directly or through their union. In
terms of volume of loan applied for, as shown in Table 5.26, the amount applied for over the
three years (2010 to 2012) appeared to show a rising trend. The amount applied for by an
individual cooperative varies between 50 thousands and 7 million Birr. When we look at the
actual amount cooperatives asked for during 2011 (the year preceding the launch of the current
scheme), it ranges between 100 thousands and 5 million Birr, with a mean of 1.31 million Birr
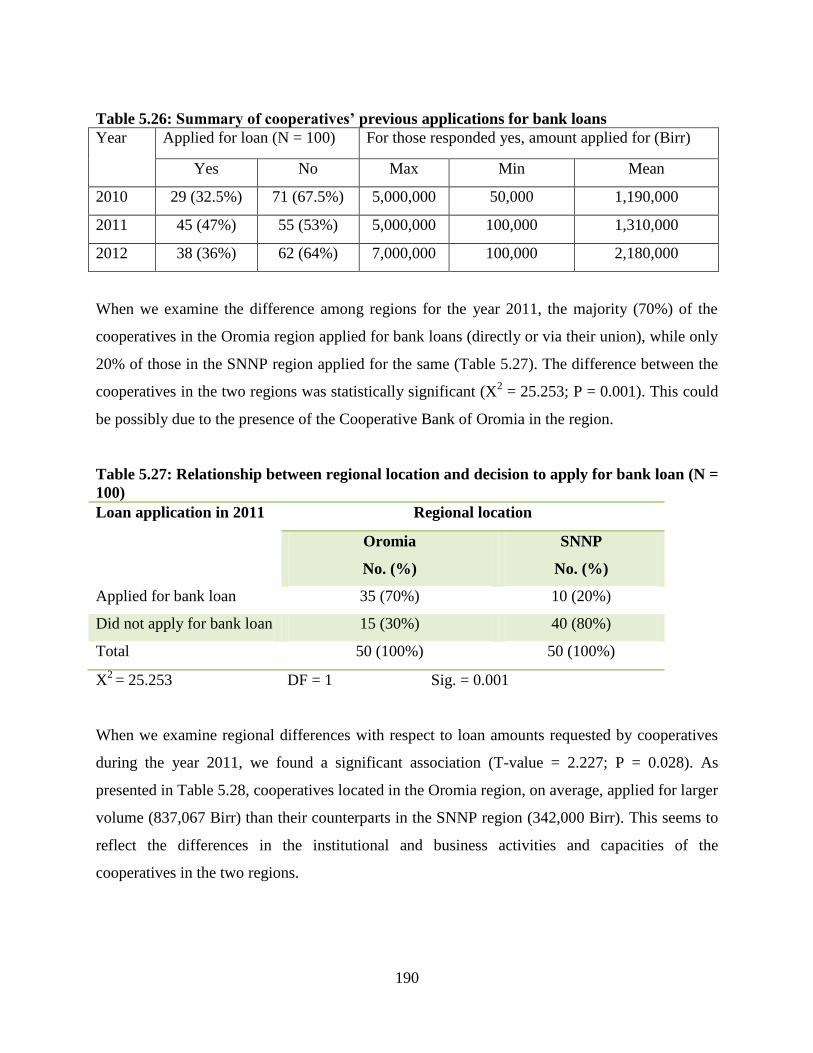
190
Table 5.26: Summary of cooperatives’ previous applications for bank loans
Year Applied for loan (N = 100) For those responded yes, amount applied for (Birr)
Yes No Max Min Mean
2010 29 (32.5%) 71 (67.5%) 5,000,000 50,000 1,190,000
2011 45 (47%) 55 (53%) 5,000,000 100,000 1,310,000
2012 38 (36%) 62 (64%) 7,000,000 100,000 2,180,000
When we examine the difference among regions for the year 2011, the majority (70%) of the
cooperatives in the Oromia region applied for bank loans (directly or via their union), while only
20% of those in the SNNP region applied for the same (Table 5.27). The difference between the
cooperatives in the two regions was statistically significant (X2 = 25.253; P = 0.001). This could
be possibly due to the presence of the Cooperative Bank of Oromia in the region.
Table 5.27: Relationship between regional location and decision to apply for bank loan (N =
100)
Loan application in 2011 Regional location
Oromia
No. (%)
SNNP
No. (%)
Applied for bank loan 35 (70%) 10 (20%)
Did not apply for bank loan 15 (30%) 40 (80%)
Total 50 (100%) 50 (100%)
X2
= 25.253 DF = 1 Sig. = 0.001
When we examine regional differences with respect to loan amounts requested by cooperatives
during the year 2011, we found a significant association (T-value = 2.227; P = 0.028). As
presented in Table 5.28, cooperatives located in the Oromia region, on average, applied for larger
volume (837,067 Birr) than their counterparts in the SNNP region (342,000 Birr). This seems to
reflect the differences in the institutional and business activities and capacities of the
cooperatives in the two regions.

191
Table 5.28: Relationship between regional location and amount of loan applied for in 2011
Region No of respondents Mean amount of loan applied
for (Birr)
SD
Oromia 50 837,067 1,164,490
SNNP 50 342,000 1,055,420
Total 100
T-value = 2.227 DF = 98 Significance = 0.028
In addition, as outlined in the analytical framework, with the aim of capturing the loan demand
of self-constrained cooperatives, we asked all study cooperatives if they would seriously and
genuinely need a bank loan at the prevailing market interest rate for the 2012 coffee season. The
vast majority (88%) reported that they would seriously need a loan, while only 12% expressed
lack of demand for credit during that particular year. The amounts demanded by a cooperative
vary from 120 thousands to 7 million Birr, with a mean of 1.47 million Birr.
5.7.2.2. Purpose and duration of the loan needed
As indicated in Table 5.29, when asked the purpose for which cooperatives need loan, close to
40% said they would use to trade dry cherry. The rest indicated that they would use the loan for
marketing dry and/or fresh cherry as well as to obtain processing and other facilities. In terms of
preferred time to receive loans, out of the 89 cooperatives responded to this question, 78% want
to obtain between September and December which is a peak coffee harvest season. A significant
number of cooperatives reported that they would need loan after January which implies that they
need it for traditional trade activities that does not add value to their coffee.
Table 5.29: Purpose for which loan is needed (as per the views obtained in April/May 2013)
Purpose of loan Percentage of coops
responded (N = 100)
Purchase and sell dry coffee 40
Purchase & sell or dry fresh cherry, trade dry coffee, buy wet
mill, drying materials & hullers, purchase inputs (and grain)
22
Purchase and sell dry coffee, install wet mill 14

192
Purchase and dry fresh cherry 10
Purchase hulling machine alongside coffee 4.50
Purchase drying materials alongside coffee 4
Purchase and immediately sell fresh cherry 2
Purchase & sell fresh cherry, purchase and sell dry coffee 2
Build office/warehouse 2
Total 100
On the other hand, when asked for how long they would need loan, cooperatives reported
seeking a loan with 3 to 48 month maturity period. In general, the majority (70%) expressed
demand for a loan with 4 to 12 months duration. A good proportion (29%) indicated that they
would need a loan of one year duration. About 11% prefer a loan with maturity period of 3 to 4
years. In terms of loan repayment schedule, as indicated in Table 5.30, the larger proportion
(67%) favour annual repayment schedule, at the end of harvest season. Only 4%; 14.5% and
14.5%, respectively, preferred monthly repayment (during harvest time), quarterly or biannually.
Table 5.30: Preferred time of loan repayment
Preferred time of repayment Number and percent of coops (N=97)
Monthly during coffee harvest time 4 (4%)
Quarterly 14 (14.5%)
Every six months 14 (14.5%)
Annually at the end of harvest season 65 (67%)
When asked how they determine their cooperative’s loan requirement, 95% of the respondent
chairpersons or managers indicated that it is based on their business plan. In reality, this does not
seem to be practiced as majority of the cooperatives rarely annually develop up-to-date business
plan. The remaining 5% said it is estimated by the management committee or cooperative
promotion agent. Other key informants and focus groups indicated that cooperatives’ loan
requirement is mainly estimated by committee members, cooperative promotion agents or
unions. We observed that some cooperatives submit unrealistically high loan request which
failed to convince the lending banks.

193
5.7.3. Results of the Econometric Analysis
This section examines farmer cooperatives’ loan demand and its determinants – both decision to
borrow and the volume of loan needed. The section particularly focuses on presenting the
findings of the Heckman two-step selection model. Discussions and explanations of the findings
in relation to existing literature will be provided later in chapter 7. As outlined in the conceptual
framework, various explanatory variables were identified to capture cooperatives’ institutional,
managerial and business attributes that may influence their loan demand.
5.7.3.1. Factors affecting cooperatives’ loan demand
As outlined in the analytical framework, we employed two approaches to capture cooperatives’
loan demand. In the first approach, we considered cooperatives actual applications for loan
during the year 2011 (directly or through their unions) and amount applied for as proxies for
probability of demanding loan and volume of loan demanded, respectively. Apparently, this
approach tends to underestimate loan demand among cooperatives as it fails to capture
information on self-constrained or self-credit rationed cooperatives. Because a number of factors
prevent cooperatives from transforming their potential demand into revealed demand. In the
second approach, we asked cooperatives if they would seriously and genuinely need a bank loan
and the amount they would like to obtain during the following year (2012 coffee season). The
later approach tends to reflect their desire and potential to demand for loans which may not be
necessarily transformed into actual or revealed demand without further interventions. We denote
the first and later demands as loan-A demand and loan-B demand, respectively.
We run a Heckman two-step selection model to examine factors influencing cooperatives’ loan
demand. This section presents the results of the empirical analyses and the outcomes of the two
approaches. Table 5.31 presents the results from the Heckman two-step selection model based on
the loan applications submitted by the cooperatives in 2011, loan-A demand. The empirical
findings of loan-B demand are provided in Table 5.32. In addition, it is important to note that
natural logs were considered in the model for all continuous variables to identify their likely
relative effects on credit demand. Thus coefficients on continuous variables measure elasticity in

194
percentage points on amount of credit demanded by cooperatives. The following formula was
used to get the expected relative effects for all continuous variables (Exp(Coef) ^-1)*100.
As one can see from Table 5.31, the results reveal that out of the variables included in the model,
five and two variables significantly influenced decision to demand for loan-A and amount of
loan-A demanded by cooperatives, respectively. Among these, interestingly, outstanding liability
significantly (at 1%) and positively affects the probability of demanding for loan-A. In other
words, cooperatives with higher liability are more likely to demand for a new loan. Likewise, as
expected, amount of total capital positively and significantly (at 1%) influences the probability of
demanding for loans. This implies that as the value of total capital increases, cooperatives are
more likely to seek and successfully access institutional loans. Similarly, education and regional
dummies for Oromia positively and significantly affect probability of demanding for bank loans
at 10% and 5%, respectively. Cooperatives that are managed by persons with formal education
are more likely to demand for loans than the ones managed by illiterate or person with only
informal education. Age of cooperatives was found to significantly and negatively affect
probability of demanding for a bank loan-A. Primary activities of the cooperative, age of its
chairperson/manager, being a member of union, total expenditure, member size, total income,
experience in coffee business, distance from the nearest bank, previous case of default and
having professional manger did not significantly affect the likelihood that cooperatives seek for a
bank loan-A.
In respect of factors influencing its amount, our analysis found a few variables to significantly
affect volume of loan-A demanded by cooperatives. Consistent with the theoretical framework,
cooperative’s member size and affiliation to a cooperative union positively and significantly (at
10%) influence the volume of loan-A demanded by cooperatives. In other words, membership of
a union, on average, increases the amount of loan demanded by a cooperative by 331%, while
one percent increase in member size of a cooperative raises the volume of loan-A demanded by
that particular cooperative by 54%. The remaining variables were not statistically significant at
any conventional level of significance in influencing volume of loan-A demanded by the study
cooperatives.
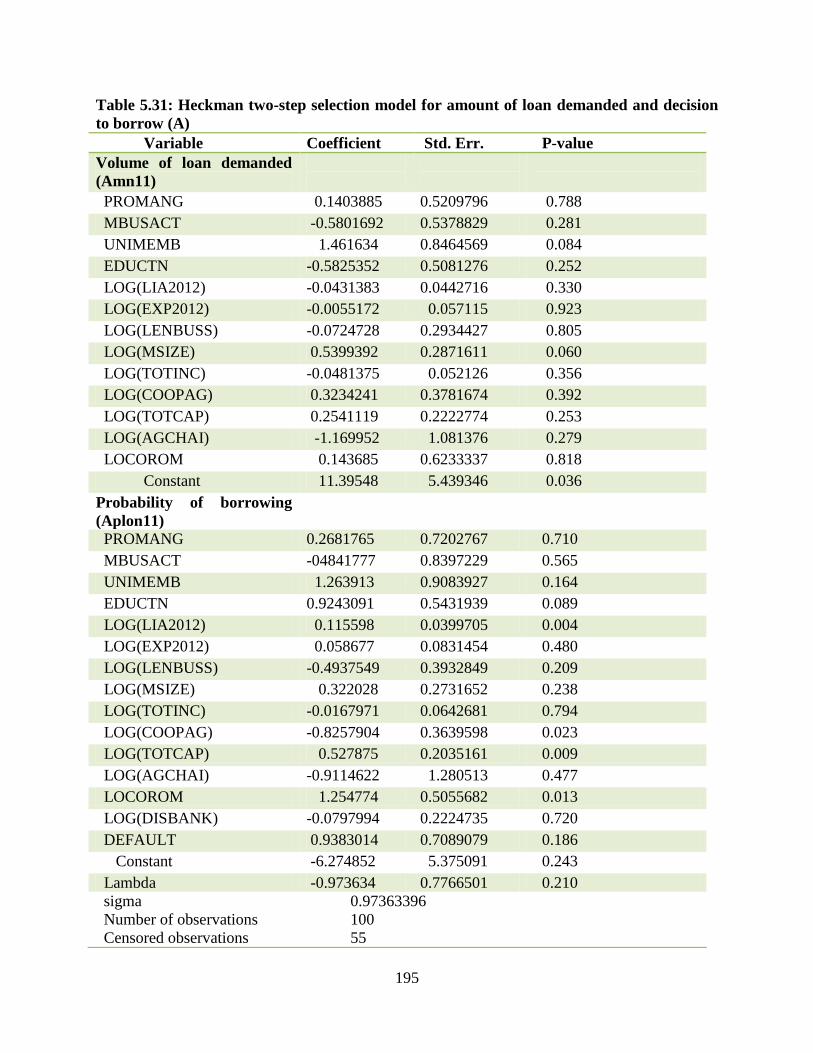
195
Table 5.31: Heckman two-step selection model for amount of loan demanded and decision
to borrow (A)
Variable Coefficient Std. Err. P-value
Volume of loan demanded
(Amn11)
PROMANG 0.1403885 0.5209796 0.788
MBUSACT -0.5801692 0.5378829 0.281
UNIMEMB 1.461634 0.8464569 0.084
EDUCTN -0.5825352 0.5081276 0.252
LOG(LIA2012) -0.0431383 0.0442716 0.330
LOG(EXP2012) -0.0055172 0.057115 0.923
LOG(LENBUSS) -0.0724728 0.2934427 0.805
LOG(MSIZE) 0.5399392 0.2871611 0.060
LOG(TOTINC) -0.0481375 0.052126 0.356
LOG(COOPAG) 0.3234241 0.3781674 0.392
LOG(TOTCAP) 0.2541119 0.2222774 0.253
LOG(AGCHAI) -1.169952 1.081376 0.279
LOCOROM 0.143685 0.6233337 0.818
Constant 11.39548 5.439346 0.036
Probability of borrowing
(Aplon11)
PROMANG 0.2681765 0.7202767 0.710
MBUSACT -04841777 0.8397229 0.565
UNIMEMB 1.263913 0.9083927 0.164
EDUCTN 0.9243091 0.5431939 0.089
LOG(LIA2012) 0.115598 0.0399705 0.004
LOG(EXP2012) 0.058677 0.0831454 0.480
LOG(LENBUSS) -0.4937549 0.3932849 0.209
LOG(MSIZE) 0.322028 0.2731652 0.238
LOG(TOTINC) -0.0167971 0.0642681 0.794
LOG(COOPAG) -0.8257904 0.3639598 0.023
LOG(TOTCAP) 0.527875 0.2035161 0.009
LOG(AGCHAI) -0.9114622 1.280513 0.477
LOCOROM 1.254774 0.5055682 0.013
LOG(DISBANK) -0.0797994 0.2224735 0.720
DEFAULT 0.9383014 0.7089079 0.186
Constant -6.274852 5.375091 0.243
Lambda -0.973634 0.7766501 0.210
sigma
Number of observations
Censored observations
0.97363396
100
55

196
As stated above, we further examined cooperatives’ potential demand for loan by asking them if
they seriously and genuinely need loan during the following year (2012 coffee season). We
found that the number of cooperatives reported demanding for loan-B and the amount demanded
were much greater than the actual number of cooperatives applied for a loan and the amount
requested for during the year 2011. In particular, regardless of their institutional, managerial and
business characteristics and capabilities, most cooperatives appear to show potential demand for
a loan. As Table 5.32 shows, among the variables included in the model analysis, three variables
were found to significantly affect probability of demanding for bank loan-B, while four variables
showed statistical significance in influencing amount of loan-B demanded. Among these,
understandably age of the cooperative manager or chairperson significantly (at 1%) and
negatively influence probability of demanding for loan-B. Another interesting finding is that the
statistically significant, but negative association between the probability of demanding for loan-B
and being located in the Oromia region (at 1%) and educational level of the cooperative manager
or chairperson (at 10%). The aforementioned finding of loan-A demand analysis however
revealed a positive relationship between locations in Oromia and probability of demanding for
loan. Surprisingly, the results of model-B indicate that cooperatives with less educated
chairperson were more likely to demand for institutional loan.
As regards factors significantly affecting amount of loan-B demand, the results of the Heckman
model reveal that total capital, total expenditure, member size and being located in the Oromia
region significantly (all at 5%) and positively affect the amount of loan demanded by
cooperatives. One percent increase in cooperatives’ total capital results in an increase of loan-B
demand by 17%. On the other hand, a one percent increase in the cooperative’s expenditure
raises its loan demand by 14%. Discussions with cooperatives and personal observations by the
current researcher reveal that those cooperatives with little business activities were incurring
very minimal costs. Similar to its effects on amount of loan-A demanded, member size was
found to positively relate to the volume of loan-B demanded by cooperatives. One percent
increase in member size of a cooperative leads to an increase in its loan-B demand by 45%. More
Uncensored observations
Wald chi2
(13)
Prob >chi2
45
25.74
0.0184

197
interestingly, contrary to its effect on the probability of demanding for loan-A, cooperatives in
the Oromia region appear to demand for larger volume of loan-B than their counterparts in the
SNNP region. Being located in the Oromia region, on average, increases cooperatives’ loan-B
demand by 162% as compared to their counterparts in the SNNP region. In other words,
whenever they decide to apply for loans, cooperatives found in Oromia region appear to seek for
larger volume.
Table 5.32: Heckman two-step selection model for amount of loan demanded and decision
to borrow (B)
Variable Coefficient Std. Err. P-value
Volume of loan demanded
(Lonrq12)
PROMANG -0.138373 0.3452198 0.689
MBUSACT -0.5187034 0.3214322 0.107
UNIMEMB -0.1323564 0.4121789 0.748
EDUCTN 0.0107203 0.3801742 0.978
LOG(TOTACAP) 0.1675386 0.0683333 0.014
LOG(LIA2012) -0.0016561 0.019319 0.932
LOG(EXP2012) 0.141438 0.0670573 0.035
LOG(LENBUSS) -0.1829646 0.164264 0.265
LOG(MSIZE) 0.4466184 0.1789763 0.013
LOG(TOTINC) -0.0372878 0.0255494 0.144
LOG(COOPAG) -0.062153 0.1859289 0.738
LOG(AGCHAI) 1.082387 1.133738 0.340
LOCOROM 0.9647641 0.4481761 0.031
Constant 4.410085 4.156586 0.289
Probability of borrowing
(Needblon3)
PROMANG 0.5271658 0.8258265 0.523
MBUSACT 0.2898444 0.6568349 0.659
UNIMEMB -0.0694663 0.8176807 0.932
EDUCTN -1.325225 0.6925296 0.056
LOG(TOTACAP) -0.117231 0.1096042 0.285
LOG(LIA2012) 0.0166001 0.0401665 0.679
LOG(EXP2012) 0.1047639 0.0901406 0.245
LOG(LENBUSS) -0.0572499 0.3291322 0.862
LOG(MSIZE) 0.2004843 0.2830207 0.479
LOG(TOTINC) 0.0163903 0.053449 0.759
LOG(COOPAG) 0.1066444 0.3979884 0.789
LOG(AGCHAI) -3.528254 1.256949 0.005

198
LOCOROM -1.527995 0.5658038 0.007
LOG(DISBANK) 0.2796042 0.2287041 0.221
DEFAULT 0.6749462 0.6741069 0.317
Constant 13.95016 5.22519 0.008
Lambda -0.7542114 0.8904642 0.397
rho
sigma
Number of observations
Censored observations
Uncensored observations
Wald chi2
(13)
Prob >chi2
-0.90731
0.83126135
100
20
80
52.74
0.0000
Summary
This chapter has presented the findings of both qualitative and quantitative research on the
Ethiopian coffee sector and the role of farmer cooperatives in coffee production, processing and
marketing as well as their suitability for credit service provision to member farmers. The results
underscore the critical role coffee plays in the livelihood of its producers and other value chain
actors and in the national economy at large. The study shows that smallholder farmers who
produce the bulk of Ethiopia’s coffee predominantly employ traditional coffee production and
processing practices and technologies. However, there have been substantial improvements in
recent years. The findings reveal that at present cooperatives do not play a meaningful role in the
production end of the coffee value chain, but they play an important role in the marketing aspect.
In particular, higher level cooperative structures such as unions have a vital role in this regard.
Cooperatives are uniquely entitled to privileged marketing system; but they have not been able to
fully utilise this opportunity. Their role and contribution in coffee marketing has been
constrained by a number of factors including lack of finance and weak institutional, managerial
and business capacity. The findings show that cooperatives undertake little or no value adding
activities to the coffee they trade. It was also revealed that demand for coffee processing methods
and facilities vary across regions depending on a number of factors.
The findings show that the agricultural sector in general and the coffee sub-sector in particular
are suffering from shortage of financial resources, currently claiming a tiny share of institutional
loans. Though there have been rapid expansion in the financial sector of the country, the

199
regulatory and monetary environments do not seem to favour flow of financial resources to the
smallholder agriculture in general and to the cooperative sector in particular. The findings
suggest that multipurpose cooperatives as such are not ideally suitable to serve as intermediaries
for bank loans. The chapter went on to present the study cooperatives’ institutional, socio-
economic and business characteristics which exhibit huge variations. Most primary cooperatives
generally have weak institutional, business and financial capacities, and limited access to various
institutional services, including credit. The finding shows that the vast majority of the
cooperatives included in the study have potential demand for bank loans, which are required for
various purposes. Nevertheless, the actual or revealed demand was found to be very low. Finally,
the findings of the econometric model that examines factors influencing cooperatives’ loan
demand were presented. Different sets of variables with different signs were found to affect the
decision to borrow and the volume of loan demanded by cooperatives. Among the internal
(demand side) variables member size, age of cooperative, age and educational level of co-ops
chairperson, regional location, union membership, expenditure and total capital are the
significant factors that influence credit demand in different ways. These factors appear to vary
with the approaches used in estimating loan demand. In addition, some external factors such as
natural factors that influence coffee yield, national policy and regulatory framework, bank’s
lending requirements, access to infrastructure, market (and attractive price) and other services
were identified as the main influencing factors for cooperatives’ loan demand.

200
CHAPTER 6
6. EMPIRICAL FINDINGS ON THE PERFORMANCE AND
PRELIMINARY IMPACTS OF THE CREDIT GUARANTEE SCHEME
6.1. Introduction
This chapter presents the findings of the qualitative and descriptive analyses on the performance,
contributions and effects of the credit guarantee scheme under analysis and factors influencing
its performance and effectiveness. The credit guarantee scheme under analysis was still ongoing
and has operated only for a few years. Thus we carried out a preliminary assessment of its
performance and the effects and benefits generated as a result of this intervention. In addition to
cooperatives’ self-reported assessment of the contribution and benefits of the scheme, the study
generated information from diverse stakeholders using a variety of techniques.
6.2. Views about the role and benefits of the Ethiopian coffee credit guarantee scheme
Almost all key informants and focus groups of various stakeholder groups underscored that
cooperatives are in dire need of loan fund as coffee business (production, processing and
marketing activities and facilities) require substantial amount of money. They noted that today
coffee business and cooperatives’ demand for loan have grown with improvements in the
capacity of cooperatives and because of the rising coffee price. On the other hand, it is
increasingly becoming difficult for primary cooperatives to get access to bank loans. In
particular, a significant proportion of the cooperatives are new and have little or no credit history
and valuable assets. A focus group of cooperative management in Wolayita indicated that
without such an intervention, they would not have any opportunity to directly access bank loans.
For example, during the 2011/12 season, they submitted loan application to the state commercial
bank (CBE) and after repeatedly visiting and following up with the bank (for 3 months), their
application was eventually turned down. Almost all interviewed non-bank key informants and
focus groups were of the opinion that intervening through such a credit guarantee is helpful in
easing credit constraints among primary cooperatives. Some key informants were, however, of

201
the opinion that there is huge demand for bank loans among various borrower groups and
lending banks may encounter liquidity problem. This inevitably leads to credit rationing which
obviously favours urban-based and economically better off borrowers.
The views and attitudes of the mainstream commercial banks towards such partial guarantee
arrangements were quite variable. Four of the eight interviewed bank officers were of the view
that loan guarantee can somehow enhance loan allocations to cooperatives as it partially
addresses concerns related to loan security. About half of the bank key informants were,
however, of the opinion that though in principle CGS can help banks to widely reach out to such
groups, in reality it may have limited impact. This is in view of the prevailing tight financial and
regulatory system, limitations in the capacity of lending banks, limited time span of the scheme,
extra admin and reporting works, follow up and loan recovery with rural-based farmer
cooperatives, cost of utilisation fee, lack of experience in lending to cooperatives, presence of
other priority areas for lending and banks’ tendency to link loan to other benefits such as export
and saving deposits.
Among the eight interviewed bank officers, only two private banks indicated possibilities of
participating in such a partial guarantee scheme for farmer cooperatives with 50% risk sharing.
Even there is no evidence if such willingness can be practically realised when it comes to actual
implementation of the scheme. The rest were of the opinion that banks will not be satisfied with
the 50% risk sharing. Some bank officers indicated that banks might initially show interest in
such a guarantee scheme, especially in a bid to promote strategic partnership, to get access to
other incentive packages (such as training and foreign currency); but they will not be attracted
solely in the partial guarantee itself.
6.3. Scheme design and operation
The design and operational features of the scheme have been outlined in chapter one. Our
assessment reveals that most of the scheme design features are in line with international practices
and experiences. However, some design features and operationalisation of the scheme appear to
have some limitations and gaps.

202
6.3.1. Views about design and operation of the current guarantee scheme
While some of the bank key informants felt that the design of the current guarantee scheme is
fairly good, majority expressed reservations regarding its ability to attract and motivate lending
banks. The latter group was of the opinion that the 50% risk sharing is not attractive enough to
open up their appetite unless it is backed by other incentive packages. All private banks, apart
from CBO, indicated that if they are to participate in such schemes, they would expect borrower
cooperatives to provide additional collateral to cover the remaining 50% risk, a requirement that
is evidently not easy for most cooperatives to meet. Almost all of the interviewed bank officers
suggest that risk sharing coverage has to be increased (to about 70 or 80%), at least during the
initial stage of scheme implementation. One bank key informant said “There are many risk free
borrowers; there is no reason for banks to be interested in taking 50% risk’’. However, one bank
officer indicated that 50% risk sharing could be acceptable for lending to reliable and strong
cooperatives.
Moreover, four of the ten interviewed banks and MFIs officers indicated that paper guarantee
may not be attractive enough to banks. In contrary, one bank key informant said that such
arrangement (of keeping the guarantee fund in third party’s account) is a normal and acceptable
practice. In line with this, another bank officer stated that a guarantee scheme normally provides
guarantee, and not fund to be deposited in the lender’s account. They, however, emphasised that
the guarantor has to be reputable institution that meets certain standards. In this regard, the
representative of the participating bank (CBO) expressed his conviction that the guarantee
administrator under the current scheme is reputable and reliable with extensive experience in the
areas of agri-finance. On the other hand, most of the other key informants and focus groups, such
as coffee and cooperative experts, cooperative management and farmers could not comment on
the strengths and limitations of the design of the scheme under review. However, a few (who
responded) were of the opinion that design features and components of the current scheme
appear to be fairly good and acceptable.
One of the important components of a scheme design is its guarantee fee. One bank officer
pointed out that if banks have sufficient loanable capital and could not lend due to fear of risk,

203
they will be willing to absorb the utilisation fees levied on such guaranteed loans. But with the
current limited financial supply in the banking system of Ethiopia, banks do not seem to be
interested in paying utilisation fees. Such fees may rather act as additional disincentive for banks
in lending to farmers’ cooperatives. In this respect, the majority of the interviewed bank officers
said annual guarantee utilisation fees have to be transferred to and absorbed by borrowers.
Though the bank officers were of the opinion that the fees associated with guarantee schemes
make the loan more expensive, they however viewed it as a normal and inevitable practice in
such arrangements. But they prefer to pay such fees upon disbursing the loan, and not on the
total guarantee amount. Some of the interviewed banks mentioned having experiences with other
guarantee schemes that involved various forms of fees including initiation fee, agreement fee,
utilisation fee, etc. Our study found that the participating bank under the current scheme appears
to be reluctant in paying annual guarantee fees. In other words, they did not pay any fee over the
three years of lending. In general, the lending bank was not notifying the guarantee administrator
about the lending activities which could be related to reluctance to pay annual risk fees.
Moreover, though the verbal agreement and understanding among the lending bank is that the
annual guarantee fee is to be paid on the basis of disbursed loan amount, analysis of the
guarantee contract, however, shows that such fees will be charged on the total guarantee volume.
This appears to be one of the gaps under the agreement of the current scheme. Consequently, the
study found that the lending bank tended to increase unguaranteed loans to the targeted
cooperatives through their unions.
6.3.2. Strengths and drawbacks of the design and operations of the current scheme
Observations and experiences of the current researcher during the course of the scheme’s
implementation and through discussions held with various key informants highlighted a number
of strengths and limitations/gaps of the credit guarantee scheme under analysis. Table 6.1
presents the summaries of these findings.

204
Table 6.1: Strong/effective design and operational features and shortcomings of the
Ethiopian coffee guarantee scheme
Strong or effective design and
operation features
Shortcomings of design features and operations
that affect scheme performance
All vital scheme design features and
terms and conditions were clearly
set out in the guarantee contract
signed between the two parties.
These include: its objective,
eligibility (target group, sector, type
and purpose of guaranteed loans,
maximum volume of guarantee,
individual loan limit, loan tenure),
responsibilities and rights of both
the guarantor and lending bank,
screening procedure, claims
procedure, etc.
Given the location of the guarantor
(remotely located in the
Netherlands) and other advantages,
the portfolio model adopted by the
scheme can be taken as the right
choice.
The fact that the guarantee fund is
resident in the Rabo Bank
(guarantee administrator) account
has helped the scheme to avoid
creating separate administrative
structure and to reduce overhead
costs that are needed to manage/run
it.
The ceiling for the maximum
The agreement was signed with the head quarter of
the participating bank. There have been gaps in
properly informing branch managers and local loan
officers about the procedures and arrangements.
There was a gap in information transfer and
reporting between the lending bank and the
guarantee administrator; the lending bank failed to
share information on new guaranteed loans, status
of loan portfolio and defaults. Surprisingly, the
lending bank (especially the headquarter) did not
have complete and accurate records of all the loans
disbursed under the scheme.
The level of risk coverage has been considered low
by most banks; it is also on the lower side as
compared with the most of the international
practices. With the mainstream commercial banks
such 50% risk sharing does not seem to effectively
work.
Involvement of and reliance on a single lending
bank was another important gap, which has
resulted in lack of alternative and competition (
when this particular bank showed reluctance to
widely and timely extend guaranteed loans to the
targeted cooperatives)
The scheme lacks mechanisms that would address
liquidity problem among the lending bank. Under
the prevailing financial market in Ethiopia, many
(private) banks face shortage of loanable fund.

205
amount of individual guaranteed
loan to be disbursed by the lending
bank under the scheme is USD
250,000. This is in line with the
volume of loan demand of most of
the study cooperatives, though
periodic revision of such a ceiling is
necessary.
The scheme makes use of bank’s
existing lending procedures,
requirements, expertise and
experiences. Thus moral hazard
such as deliberate default among
borrower cooperatives does not
seem to be a serious problem.
Follow ups are carried out by a
number of parties such as PEA,
PIA, Coops Promotion Agency and
the lending bank. These combined
efforts somehow contributed to the
effectiveness of loan utilisation and
its recovery.
The capacity building component
embedded in the scheme both for
the lending bank and borrower
cooperatives is one of the greatest
assets of the scheme.
Involvement of CBO, which is a
more coops-friendly bank, with
The scheme did not seem to pay sufficient
attention to market linkage (especially to those
high in the value chain) for the participating coops.
The scheme is of five year duration with effective
lending period28
of less than four years which was
indeed short. It did not take into account the time
required for ground work and capacity building
prior to extending loans to such groups.
There was some gap with regard to the guarantee
fee. It was stated in the guarantee contract that the
local bank will pay 1.50% annual risk fee on the
total risk participation. But the understanding
among the lending bank is that the fee is to be paid
on the amount of disbursed guaranteed loans. The
agreement states that the first annual risk fee shall
be paid 30 working days after the signing date,
which implies that it was to be paid on the total
guarantee fund. However, no risk fee was paid
after 3 years of lending under scheme.
It was spelt out in the agreement that the local
bank will undertake monitoring of performance of
the guaranteed loans. In practice the lending bank
had limited involvement in monitoring and
supervising proper utilisation of the loans
disbursed to cooperatives.
Some cooperatives tried to finance long-term
investment (such as warehouse construction) using
the short-term loans received under the guarantee.
This can lead to problems in loan recovery can
28
In the agreement it was stated that loan maturity date shall fall at least a hundred and eighty business days before
the expiry date of this agreement.

206
expertise and experience in lending
to such a group, is one of the
commendable decisions in the
arrangements of the scheme.
cause delays in loan repayment.
The targets and eligibility criteria (targeted coops,
type of activity, single loan limit, etc.) have
witnessed no change and adaptation over time
Source: Author’s analysis
6.4. Utilisation of the loan guarantee and coverage of the scheme
Utilisation of the guarantee fund by banks is one of the essential aspects in such guarantee
arrangements. For a guarantee scheme to be effective and impactful, banks have to be willing
and interested to actively participate in the guaranteed lending activities. We tried to assess the
performance of the scheme under analysis in terms of its outreach; i.e. number and volume of
guaranteed loans disbursed to targeted cooperatives. There is some evidence that the current
credit guarantee scheme has contributed in enhancing bank’s lending to the targeted
cooperatives. Those cooperatives which were formerly denied access to formal credit markets
have been able to directly access bank loans. However, the findings show that outreach of the
guarantee scheme was limited, particularly in terms of number of cooperatives reached. At the
outset, a total of 22 primary cooperatives were selected to benefit from the current guarantee
scheme. Out of these, eventually 14 cooperatives have accessed guaranteed loans since the
inception of the scheme. Two, eleven and four of the targeted cooperatives had accessed
guaranteed loans from the partner bank during the second (2012/13), third (2013/14) and fourth
(2014/15) seasons29
, respectively. These figures, however, do not include the number of
cooperatives that gained improved access to loans provided by parent unions. One of the positive
indirect contributions of the current scheme is that it had triggered sense of concern and
motivation among unions and made them increase their loan allocations to the primary
cooperatives targeted by the scheme. Consequently, during the third year of lending (2014/15
season), 13 of the scheme participant cooperatives were able to receive substantial amount of
loans (7,347,000 Birr) from their parent unions. In addition, some of the cooperatives were
29
The first year of the scheme (2011/12 season) was dedicated to preparations and necessary ground works such as
awareness raising and capacity building activities, and engagement of relevant stakeholders.

207
granted extension of loan maturity duration by the lending bank for loans received during the
2013/14 season.
We also tried to assess the role of the scheme in encouraging cooperatives to demand for bank
loans. As indicated in Figure 6.1, cooperatives targeted by the scheme seemed to aggressively
move forward in applying for bank loans. Overall, 82% and 81% of the cooperatives targeted by
the scheme applied for a bank loan as compared with 53.5% and 59% for the non-participants
during 2013 and 2014, respectively. Further probing with the non-participant cooperatives
reveals that even most of those who reported applying for a loan approached the banks through
their parent unions.
When we examine the changes in loan applications among the cooperatives targeted by the
current scheme, as expected, the percentage of those applied for bank loans substantially
increased after launch of the scheme. As indicated in Table 6.2, only 36% and 59% of the
cooperatives targeted by the scheme applied for bank loans, respectively, in 2010 and 2011
(before the launch of the scheme). When one looks at the percentage of cooperatives targeted by
the current scheme, 77% to 82% submitted loan applications (to banks) over the period 2012 to
2014; i.e. during the scheme operation.
2013 2014
82% 81%
53.50% 59%
Figure 6.1: Difference between scheme participants and non-
participant coops in applying for bank loans
Coops targeted by the
scheme
Non-participant coops

208
Table 6.2: Changes in decision to apply for bank loans after being chosen to participate in
the scheme
Loan application Before the scheme
No. & percent of coops
After launch of the scheme
No. & percent of coops
2010 2011 2012 2013 2014
Applied for bank loan 8 (36%) 13 (59%) 17 (77%) 18 (82%) 17 (81%)
Did not apply 14 (64%) 9 (41%) 5 (23%) 4 (18%) 4 (19%)
Total 22 (100%) 22 (100%) 22 (100%) 22 (100%) 21 (100%)
In terms of volume of guaranteed loans, the agreement signed between the guarantee
administering body and the lending bank indicates that the scheme will provide a total of
partially guaranteed loan of up to 60 million Birr. However, a total of 18.40 million Birr worth
guaranteed loans were provided to the borrower cooperatives over the first three years of lending
(2012/13 – 2014/15). In other words, 61% of the total guaranteed fund was disbursed to the
beneficiary cooperatives. This is only about 31% of the loanable fund under such a partial
guarantee scheme with 50% risk sharing. The total guaranteed loans disbursed under the scheme
during 2012/13; 2013/14; 2014/15 coffee seasons, respectively, were amounting to 2.37 million;
13.8 million and 2.20 million Birr. In respect of individual loan size, the smallest amount was
200,000 Birr, while the larger loan volume was 3 million Birr. On average, loan volume of 1.32
million Birr was granted to individual beneficiary cooperatives over the three years of lending.
We found that though 20 cooperatives (out of the 22 targeted cooperatives) had submitted loan
applications at least once over the first three years of lending (2012/13 – 2014/15), close to two-
thirds (70%) were able to access guaranteed loans. On average, 11.76%; 61% and 30% of all
applications were accepted by the banks over the three years (2012/13; 2013/14 and 2014/15).
This shows improved acceptance level during the second year of lending (year 2013/14). It is
important to note that the above figures did not include the increased volume of loans extended
by unions following the launch of the scheme.

209
There were some obvious signs that most of the participating bank branches still tend to avoid
the risk of lending to cooperatives that have never borrowed before, as well as appeared to be
hesitant to provide a new type of loan product such as long-term investment loans. We also
observed that even after the cooperatives fulfilled all the lending requirements and submitted
their loan applications, banks kept delaying loan approval and disbursement. For instance, during
the 2012/13 season, out of the 17 cooperatives who submitted their loan applications, only two
cooperatives were able to meet the rigorous screening criteria and lending requirements and
accessed bank loans. Some cooperatives with viable business plans and complete loan
applications were not able to benefit from the guarantee scheme mainly due to the reluctance of
and constraints facing the lending banks.
The findings also reveal that there were shortfalls when one compares the volume of loans
applied for with the actual amount of guaranteed loans disbursed to beneficiary cooperatives.
Given the institutional capacity and current state of business activities of the targeted
cooperatives, the volume of loans requested by most of them was considered both by the lending
banks and other experts unrealistically high. We observed the case where some weak
cooperatives were applying for a loan amount of as high as 10 million Birr. Interviewed bank
officers noted that such exaggerated loan request would lead to rejection of cooperatives’ loan
application. Discussions with cooperatives’ management and promoters reveal that failure of a
substantial number of cooperatives to get access to guaranteed loans is largely attributed to the
lengthy, cumbersome and complicated bank lending requirements; liquidity problems among
banks and their officers’ reluctance to lend to primary cooperatives. Bank key informants on
their part emphasise that weak institutional, managerial and business capacities of cooperatives,
poor coffee production during some years, coffee market fluctuations or decline and national
policy and regulations of the NB are among the constraints preventing banks in widely reaching
out to cooperatives. According to some bank officers constraints related to the regulatory
framework and monetary environment will continue to hinder commercial banks’ outreach to
this kind of target group.
210
6.5. Loan fund leverage ratio
One of the significance of such a credit guarantee scheme is its role in leveraging substantial
amount of loans with limited volume of guarantee fund. This refers to a ratio that is obtained by
dividing the amount of guaranteed loans extended under the scheme by its guarantee capital.
When we assess this aspect under the current scheme, we found a leverage ratio of 0.61:1 for the
bank loan, and a ratio that is slightly over 1:1 when loans obtained through their unions are
included. Moreover, the fact that unions30
have started showing renewed interest in lending to
cooperatives participating in the current scheme can be taken as a positive step in this respect. It
is also important to note that, possibly in an attempt to avoid guarantee fees, the partner bank has
started increasing non-guaranteed loan allocations to scheme participant cooperatives through
their unions.
6.6. Assessment of Additionalities attained under the current scheme
As the case with most studies that attempted to evaluate the performance and effectiveness of a
credit guarantee scheme, the current study focused on assessing additionality as one of the
crucial aspects. The research primarily focused on exploring the role of the scheme under
analysis in improving financial additionality and other related benefits, including preliminary
outcomes in terms of economic additionality. The scheme was still ongoing and has operated for
a few years, which makes a comprehensive analysis of economic additionality and other long-
term impacts difficult.
6.6.1. Financial additionality: in terms of additional loans obtained
Overall, initial results demonstrate that despite some challenges and limitations, there are
positive contributions in improving credit allocations to cooperatives that have never had direct
access to bank loan before. The scheme somehow enabled those cooperatives without adequate
collateral and/or credit track record to directly get access to bank loans. The findings suggest that
30
Unions appear to intervene by providing unusually high amount of loan to the coops targeted by the scheme. They
have started providing record high loan of up to 2.1 million Birr to individual scheme cooperatives.

211
the vast majority of the bank loans that were accessed by the beneficiary cooperatives are
additional finance which would have not occurred in the absence of the guarantee scheme. In
other words, 11 of the 14 beneficiary cooperatives (78%) previously had never had direct access
to bank loans. Therefore, in the current analysis, we considered all the loans obtained from the
banks by those 11 cooperatives as financial additionality. Even the remaining three cooperatives
indicated that they would have not been able to receive such substantial volume of loans if it was
not for the support of the scheme. They were not even sure if they would have been able to
obtain bank loans during those particular years (scheme period) in the absence of the scheme’s
support. In general, about 87% of the total loans disbursed by the participating bank branches (to
the scheme cooperatives) over the three years can be taken as additional loans that were made
possible because of the scheme’s intervention.
We tried to examine the difference between scheme participants and non-participant
cooperatives in terms of succeeding in accessing bank loans. As indicated in Table 6.3, though
this might not be entirely attributed to the scheme, cooperatives targeted by the scheme had
better access to loans in that 82% of the cooperatives targeted by the scheme obtained loan as
compared with 68% for the non-participants in 2013. The difference is however not statistically
significant (X2 = 1.418; P = 0.234). However, little difference was observed during the 2014
coffee season in that 86% of the scheme participants acquired loans as compared with 80.5% for
their non-participant counterparts. Further discussion with the study cooperatives and in-depth
analysis of the loans obtained show that the vast majority of the non-participants accessed small
amount of loans through their unions while majority of the cooperatives targeted by the scheme
were able to directly approach and access loans from banks (especially during 2013).
Table 6.3: Difference between scheme participant and non-participants in accessing loan
Access to loan Participants Non-participants
Took loan in 2013 N % N % X2 – value
Yes 18 82% 39 68% 1.418 (NS)
No 4 18% 18 32%
Took loan in 2014
Yes 18 86 % 46 81% 0.262 (NS)

212
No 3 14% 11 19%
The changes among the cooperatives targeted by the scheme after participating in the scheme are
examined in Table 6.4. The analysis shows that the vast majority (82% and 86%), respectively,
took loan during 2013 and 2014 as compared with 32% and 68% before participating in the
scheme (2010 and 2011, respectively). However, we were not able to see statistical significance
of the association because of the insufficient number of cases.
Table 6.4: Difference in accessing loans before and after participating in the scheme
Access to loan Before the scheme After (during) the scheme
2010 2011 2013 2014
Took loan 7 (32%) 15 (68%) 18 (82%) 18 (86%)
Did not take loan 15 (68 %) 7 (32%) 4 (18%) 3 (14%)
Total 22 (100%) 22 (100%) 22 (100%) 21 (100%)
As regards amount of loan borrowed, as expected, the cooperatives targeted by the scheme, on
average, received almost two-folds of the amount obtained by non-participant cooperatives
during 2012 to 2014 (Table 6.5). The difference between the two groups was also statistically
significant (T = 2.201; P = 0.037), which can be largely attributed to the intervention.
Table 6.5: Difference between participants and non-participants in the amount of loan
obtained (2012 - 2014) (N = 68)
Participation status Number of coops Mean amount of loan
obtained (Birr)
SD
Participants 20 1,992,900 1,828,650
Non-participants 51 1,018,300 1,214,010
Total 71
T-value = 2.201 DF = 25 Significance = 0.037
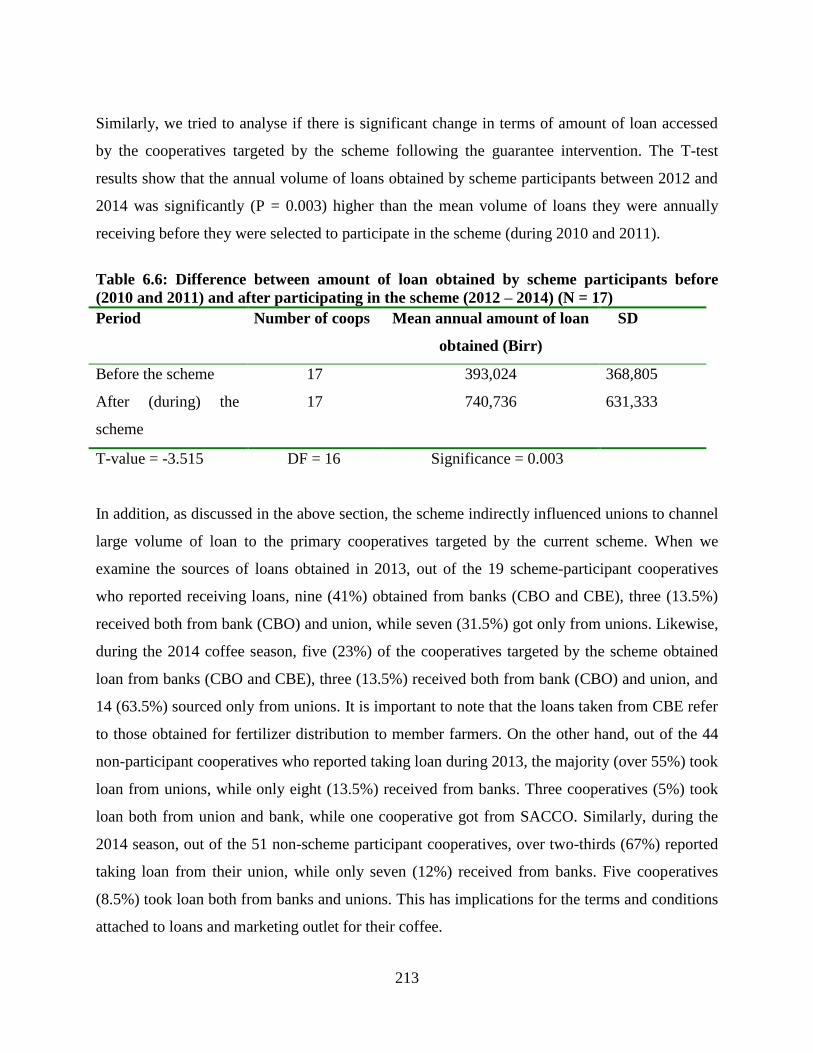
213
Similarly, we tried to analyse if there is significant change in terms of amount of loan accessed
by the cooperatives targeted by the scheme following the guarantee intervention. The T-test
results show that the annual volume of loans obtained by scheme participants between 2012 and
2014 was significantly (P = 0.003) higher than the mean volume of loans they were annually
receiving before they were selected to participate in the scheme (during 2010 and 2011).
Table 6.6: Difference between amount of loan obtained by scheme participants before
(2010 and 2011) and after participating in the scheme (2012 – 2014) (N = 17)
Period Number of coops Mean annual amount of loan
obtained (Birr)
SD
Before the scheme 17 393,024 368,805
After (during) the
scheme
17 740,736 631,333
T-value = -3.515 DF = 16 Significance = 0.003
In addition, as discussed in the above section, the scheme indirectly influenced unions to channel
large volume of loan to the primary cooperatives targeted by the current scheme. When we
examine the sources of loans obtained in 2013, out of the 19 scheme-participant cooperatives
who reported receiving loans, nine (41%) obtained from banks (CBO and CBE), three (13.5%)
received both from bank (CBO) and union, while seven (31.5%) got only from unions. Likewise,
during the 2014 coffee season, five (23%) of the cooperatives targeted by the scheme obtained
loan from banks (CBO and CBE), three (13.5%) received both from bank (CBO) and union, and
14 (63.5%) sourced only from unions. It is important to note that the loans taken from CBE refer
to those obtained for fertilizer distribution to member farmers. On the other hand, out of the 44
non-participant cooperatives who reported taking loan during 2013, the majority (over 55%) took
loan from unions, while only eight (13.5%) received from banks. Three cooperatives (5%) took
loan both from union and bank, while one cooperative got from SACCO. Similarly, during the
2014 season, out of the 51 non-scheme participant cooperatives, over two-thirds (67%) reported
taking loan from their union, while only seven (12%) received from banks. Five cooperatives
(8.5%) took loan both from banks and unions. This has implications for the terms and conditions
attached to loans and marketing outlet for their coffee.

214
6.6.2. Other aspects of financial additionality: improvements in the terms and conditions of
loans
Gudger (1998) notes that guarantees can modify the terms of the loan, for example, by allowing
banks to extend larger volume of loan for a longer period. From this perspective, we tried to
assess whether the current scheme has improved the terms and conditions of the guaranteed
loans. One of the aspects we looked at is changes in the purpose and duration of the loans
granted. Prior to the introduction of the current guarantee scheme, banks appeared to be hesitant
to extend loans of longer maturity to primary cooperatives31
. Primary cooperatives underlined
that lack of access to long-term investment capital is severe and had constrained their growth and
further improvement. Experiences with the current scheme demonstrate that in the absence of
long-term loans, cooperatives tend to divert short-term working capital loans to long-term
investment activities, which eventually affects their loan repayment capacity. In this regard,
despite its limited outreach, the current scheme has played an important role in introducing
medium-term loans of up to three years, which have promoted investment in critical facilities
such as wet mills and storage facilities.
When we examine the length of loans received during 2012 (first year of guaranteed lending),
scheme participants had obtained loan for a longer period (on average 13.50 months) than their
non-participant counterparts, whose average loan length was nine months. When we further look
at the situation for the year 2013 and 2014, though the cooperatives selected to be reached
through the scheme tended to have loans with slightly longer duration, the difference between
the two groups was not statistically significant. Lack of a statistical significance could be related
to the small number of cooperatives that benefited from such lending activities. In general, short-
term loans of one year duration dominate the lending activities under the scheme both in terms of
number of loans granted and total volume of loans provided. Among the three years lending
activities under the scheme, medium-term loans of three years accounted for less than 4% of the
total loans granted and 21% of the cooperatives received guaranteed loans.
31
Banks tend to consider such loans as very risky venture in the absence of collateral of sufficient value and quality

215
As other lending terms and conditions are concerned, evidence suggests that the current scheme
had no or little impacts. The terms and conditions of bank lending to the targeted cooperatives
have not seen much change following the intervention of the scheme. For instance, the
intervention did not make credit accessibility processes simpler and shorter as the lending bank
has not adapted its lending approaches, procedures and requirements32
. The speed of loan
application screening and approval process, and timeliness of loan release is critical in terms of
facilitating effective and efficient utilisation of the disbursed loans. In this regard, cooperatives
applied for the guaranteed loan complained about the slow, lengthy and cumbersome loan
application and approval processes. We generally found that in most cases guaranteed loans were
not timely disbursed, with a waiting time of up to 3 and 4 months among some beneficiary
cooperatives33
. Banks often grant loan approval in late November and December, which had
forced cooperatives to use the loan funds to mainly purchase dry cherries. In addition, we
observed that some branch managers were deliberately delaying the screening process of loan
applications as a strategy to discourage cooperatives.
32
Cooperatives need to fulfill the following requirements in applying for bank loans. Minutes of general assembly
indicating that they need loan and those committee members (with list of names) will represent them; TIN number
(2 TIN - for the coop and management committee member); business plan; license to establish and operate washing
station; certificate of legal entity and bylaw of the cooperative; support letter from the zone/district coops promotion
office; audit report, financial statements of recent years and invoice quotation if needed for processing machine. 33
There were also cases where cooperative applications were lost on their way to the head office (for approval).
13.5
8.88 9 9 7.71
8.8
0
2
4
6
8
10
12
14
16
2012 2013 2014
Figure 6.2. Mean length (in month) of loans obtained by
participants and non-participants (2012 - 2014)
Average for participants
Average for non-participants

216
When we empirically examine the length of loan processing time for scheme participant
cooperatives over the past years, we found that some were obtaining loan in less than a week
while others took as long as 20 weeks (5 months). In-depth key informant interviews with
cooperative management and their promoters indicate that union loan is normally obtained in a
few days as it does not face all the bank requirements and procedures. In other words, unions
deal with the bank processes and obtain loans which they pass on to member cooperatives.
However, union loans normally arrive late in the season as they often take substantial time in
dealing with banks and acquiring the loans. Such loans are also small in amount as unions
attempt to thinly distribute to all or most member cooperatives. In general, the mean length of
loan processing time for scheme participant cooperatives somehow showed a declining trend
over years from 6.18 weeks in 2010 to 3.42 weeks in 2014.
Table 6.7: Changes in length of loan processing time after participating in the scheme
Length of
loan
processing
time
Before the scheme (week) After launch of the scheme (week)
2010
(N = 8)
2011
(N = 17)
2012
(N = 14)
2013
(N = 21)
2014
(N = 19)
Minimum 0.40 0.40 0.20 0.05 1
Maximum 12 12 20 12 12
Mean 6.18 4.88 7 4.33 3.42
Surprisingly, as outlined in Table 6.8, when we compare the experiences of cooperatives targeted
by the scheme and non-participant cooperatives, the mean length of loan processing time for the
former group is much longer than that of the latter. The differences are also statistically
significant, particularly for the years 2013 (at 5% significance level) and 2014 (at 10% level).
This shows the fact that the loans directly obtained from banks have longer processing time as
compared with that of the loans obtained from unions (on which most of the non-participant
cooperatives rely).

217
Table 6.8: Difference between participants and non-participants in terms of length of loan
processing time (between 2012 and 2014)
Year
N
Participants
Mean length of
loan processing
time (week)
SD
N
Non-participants
Mean length of
loan processing
time (week)
SD
T-value
2012 14 7.07 6.70 33 4.79 5.55 1,212 (NS)
2013 21 4.33 4.05 52 2.29 2.50 2.153**
2014 19 3.42 3.33 55 2.12 2.34 1.848*
** Significant at 5%; *Significant at 10%; NS = Not significant
In terms of collateral requirement, being a cooperative bank, the participating bank does not
require additional collateral apart from the 50% risk sharing covered by the guarantor. This
particular bank rather asks for expression of commitment and support letter from the cooperative
promoting agency (government body). Nevertheless, we noted that CBO’s clean-based loans are
highly rationed and provided to critically screened cooperatives. They are often channeled
through the mediation of unions and are hardly accessed by individual primary cooperatives.
Other banks indicated that if they have to participate in such an arrangement, the remaining 50%
needs to be covered by the borrower cooperatives. Most banks require a collateral coverage of
100% to 120% for such high perceived risk group or sector. On the other hand, the scheme had
little or no impacts in reducing the lending costs such as interest rate. The 12% and 14% interest
rates charged on short-term and medium-term loans, respectively, were viewed as high rate
among the borrower cooperatives and their promoters. This, in the cooperative management
view, somehow affected the profitability and benefits of the borrower cooperatives.
6.6.3. Economic additionality under the current guarantee scheme
It is a fact beyond dispute that attaining substantial economic additionality requires sufficient
time in terms of accessing and making use of the loans. However, the guarantee scheme under
analysis has operated for a few years. As a result, we were not able to obtain adequate data to
draw comprehensive and firm conclusions in terms of economic additionality and other long-

218
term impacts. Moreover, in-depth analysis of the wider economic impact was far beyond the aim
of this study, and could be a subject for further research after some time. However, the results of
preliminary assessments show that there have been some economic gains at least at the borrower
cooperatives level. Both self-reported information from the beneficiary cooperatives and
empirical assessments of their actual performance (from the records of cooperatives)
demonstrate some improvements in their business activities and institutional capacity. This
section presents some of the early indicative impacts of the scheme in terms of economic
additionality and associated benefits.
6.6.3.1. Changes in the commercial and economic activities of cooperatives
6.6.3.1.1. Changes in the volume and type of coffee traded
We tried to assess the volume and type of coffee traded by the participating cooperatives as
compared with the non-participants, as well as with their situation before the intervention. As
presented in Table 6.9, we found that the majority of both scheme participants and non-
participant cooperatives were engaged in trading dry cherry, without undertaking processing
activities. The number of cooperatives (both scheme participants and non-participants) involved
in buying fresh cherries did not show much change over time. Even the number of scheme
participant cooperatives did not show significant change after participating in the scheme in
terms of purchasing fresh cherry. However, the number of cooperatives involved in purchasing
dry cherry has shown a rising trend with participation in the scheme. Out of the 22 cooperatives
selected to participate in the scheme, 14 reported purchasing dry cherry during the year 2010 and
2011, while this figure was raised to 17 after participating in the scheme (2012 to 2014). In fact
the number of non-participant cooperatives involved in trading dry cherry has also shown a
rising tendency.

219
Table 6.9: Difference between scheme participant and non-participant cooperatives in
terms of type of coffee traded
Coffee type traded Participants (Number) Non-participants (Number)
Before
(2010-2011)
After
(2012-2014)
Before
(2010-2011)
After
(2012-2014)
Fresh cherry 10 9 18 18
Dry cherry 14 17 32 39
Likewise, when we compare the volume of fresh cherry purchased by the scheme participant
cooperatives before and after participating in the scheme, we did not find a significant change in
the mean volume annually bought over the two periods (Table 6.10). However, there was a
statistically significant (P = 0.028) change in the mean volume of dry cherry purchased by the
cooperatives participated in the scheme in that, on average, they annually bought 16,037 kg
during the year 2010 and 2011 (before the scheme), while this volume reached 54,036 kg after
participating in the scheme (2012 to 2014).
Table 6.10: Relationship between participation in the scheme and volume of coffee bought
by coops – before (2010 – 2011) and after participating in the scheme (2012 – 2014) (N = 22)
Coffee
bought
N
Before (annual
mean in kg)
SD
N
After (annual
mean in kg)
SD
T-value
Fresh cherry 8 65,535 99,131 8 67,837 66,211 -0.051(NS)
Dry coffee 14 16,037 15,298 14 54,036 60,367 -2.479*
* Significant at P < 0.05 NS = Not significant
We also examined the difference between scheme participants and non-participant cooperatives
in terms of volume of coffee purchased. In this respect, while the former purchased, on average,
slightly larger volume of fresh cherries (135,457 kg) than the latter group (123,110 kg) during
2013 and 2014, the difference was not statistically significant. Nevertheless, in terms of volume
of dry cherry, scheme participants significantly differ from non-participants (P = 0.041) in that
the former, on average, bought 140,996 kg of dry coffee over the two years, while the latter
group bought only 46,982 kg during the same period.
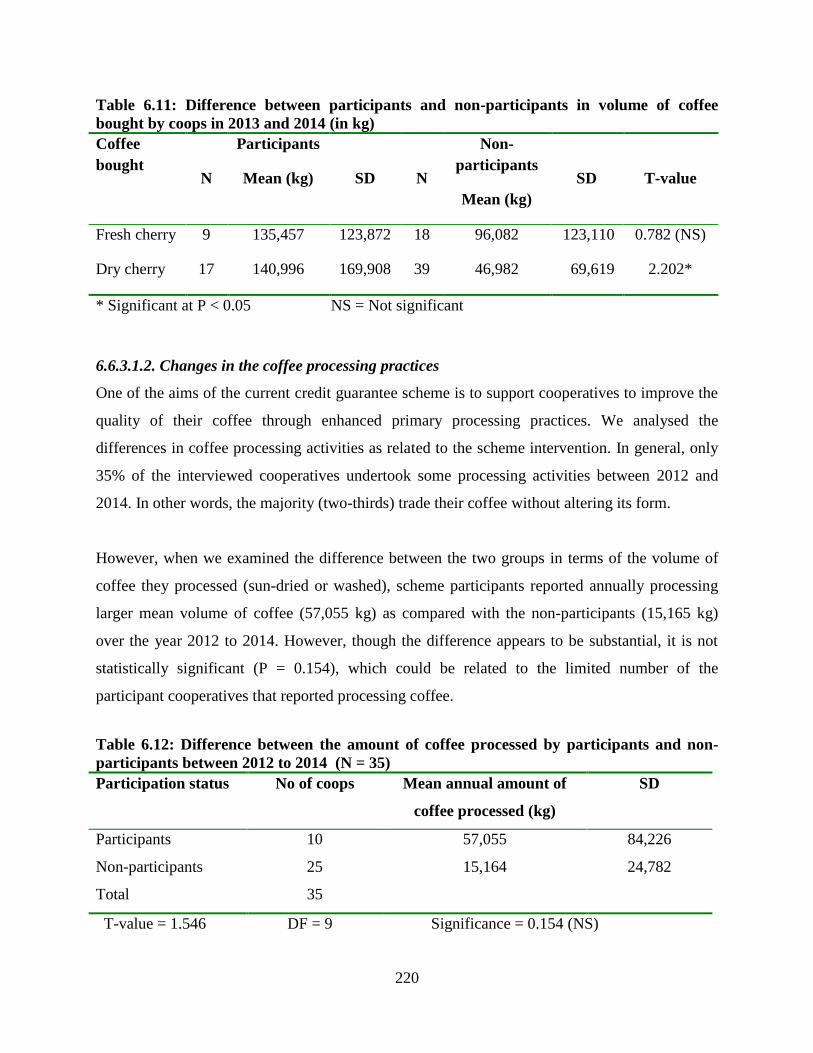
220
Table 6.11: Difference between participants and non-participants in volume of coffee
bought by coops in 2013 and 2014 (in kg)
Coffee
bought
N
Participants
Mean (kg)
SD
N
Non-
participants
Mean (kg)
SD
T-value
Fresh cherry 9 135,457 123,872 18 96,082 123,110 0.782 (NS)
Dry cherry 17 140,996 169,908 39 46,982 69,619 2.202*
* Significant at P < 0.05 NS = Not significant
6.6.3.1.2. Changes in the coffee processing practices
One of the aims of the current credit guarantee scheme is to support cooperatives to improve the
quality of their coffee through enhanced primary processing practices. We analysed the
differences in coffee processing activities as related to the scheme intervention. In general, only
35% of the interviewed cooperatives undertook some processing activities between 2012 and
2014. In other words, the majority (two-thirds) trade their coffee without altering its form.
However, when we examined the difference between the two groups in terms of the volume of
coffee they processed (sun-dried or washed), scheme participants reported annually processing
larger mean volume of coffee (57,055 kg) as compared with the non-participants (15,165 kg)
over the year 2012 to 2014. However, though the difference appears to be substantial, it is not
statistically significant (P = 0.154), which could be related to the limited number of the
participant cooperatives that reported processing coffee.
Table 6.12: Difference between the amount of coffee processed by participants and non-
participants between 2012 to 2014 (N = 35)
Participation status No of coops Mean annual amount of
coffee processed (kg)
SD
Participants 10 57,055 84,226
Non-participants 25 15,164 24,782
Total 35
T-value = 1.546 DF = 9 Significance = 0.154 (NS)

221
Similarly, we analysed the volume of coffee each scheme participant cooperative annually
processed before participating in the scheme and after. As presented in Figure 6.3, we found a
huge difference between the mean volume of coffee processed before the scheme (12,415 kg)
and after participating in the scheme (57,055 kg). The improvement in the processing activity
can be directly translated to better market access and improved price for the product. However,
we could not test its statistical significance due to the smaller number of scheme-participant
cooperatives that reported undertaking coffee processing activities.
When we analysed how cooperatives undertake sun-drying of their coffee, none of them reported
drying on bare ground. The interesting and encouraging finding is that the majority of both
scheme participants and non-participants reported using some sort of raised beds to dry their
coffee. Nevertheless, it was surprising to find that non-participant cooperatives were using raised
beds made of local materials or mesh wire more widely (90% of the coops) as compared with the
scheme participants (74%). The difference was also statistically significant (X2
= 3.082; P =
0.079). Observations and informal discussions reveal that the vast majority of the non-participant
cooperatives were using raised beds made of local materials. About a quarter (26%) of the
scheme participant cooperatives reported drying on cemented floor or plastic mats, as compared
with 10% for the non-participants. We noted that having cemented drying floor appears to be
viewed as a practice commonly used by better-off traders and cooperatives.
0
10,000
20,000
30,000
40,000
50,000
60,000
Vol. processed by
participants before the
scheme
Vol. processed by non-
participants during the
scheme
Vol. processed by
participants during the
scheme
12,415 15,164
57,055
Figure 6.3: Comparison of mean amount of coffee processed by
coops before & after and with & without the scheme (Kg)

222
Table 6.13: Relationship between participation in the scheme and sun-drying methods used
Sun-drying techniques used Participation status of coops
Participants
No. (%)
Non-participants
No. (%)
On cemented floor or plastic mat 5 (26%) 5 (10%)
On raised beds (made of local
materials or mesh wire)
14 (74%) 46 (90%)
Total 19 (100%) 51 (100%)
X2
= 3.082 DF = 1 Sig. = 0.079
6.6.3.1.3. Length of coffee storage
Although prolonged storage of coffee is not recommended34
, keeping coffee for a few months
and looking out for better market opportunities is one form of value addition. This is, however,
not a common practice among most of the study cooperatives, who traditionally buy small
quantity and immediately pass on to their union. Cooperative unions, especially the young ones,
often provide small amount of loan and instruct primary cooperatives to purchase coffee and
immediately deliver to them and get some cash replenishment. Having access to a relatively
longer term loans and better storage facilities, it was expected that scheme participant
cooperatives would be able to keep their coffee for a relatively longer period. We analysed the
length of coffee storage among scheme participants and non-participant cooperatives for the year
2013, which marks the season when many of the participant cooperatives had access to
guaranteed loans. Surprisingly, scheme participants on average stored their coffee for a slightly
shorter period (1.96 months) as compared with the non-participants (2.24 months). The
difference between the two groups in terms of length of coffee storage was however not
statistically significant (P = 0.630).
34
Coffee Quality Control and Marketing Regulation obliges producers or traders to sell parchment, hulled green
beans and un-hulled dry cherry within six month, within two weeks and before the next harvest season, respectively.

223
Table 6.14: Difference between participants and non-participants in the length of coffee
storage in 2013 (N = 52)
Participation status No of coops Mean length of
storage time (month)
SD
Participants 14 1.96 1.31
Non-participants 38 2.24 1.94
Total 52
T-value = -0.485 DF = 50 Significance = 0.630 (NS)
6.6.3.1.4. Improvements in coffee quality
We made attempts to assess changes in the quality of coffee traded by the scheme participant
cooperatives as compared with that of the non-participants as well as with their situation before
the intervention. However, though we found some indications that the quality of the coffee
processed and traded by most of the scheme beneficiary cooperatives seems to witness some
improvement, we were not able to draw conclusive findings due to lack of adequate and reliable
information on the coffee quality grades for the majority of the cooperatives. Most cooperatives
indicated that they do not have any idea about the quality grades of their coffee over the past
years. It was noticed that some of the unions mix coffees collected from different cooperatives.
Moreover, those unions which have information on quality grades of individual cooperative’s
coffee also often do not provide feedback on the quality status and limitations of their coffee, at
least among the study cooperatives.
6.6.4. Value of products and income generated by beneficiary cooperatives
The findings suggest that primary cooperatives were normally purchasing small quantity and
passing over to their unions with no or little value addition activity at least in the form of proper
sun-drying of cherry, pulping and washing or in terms of time and place of marketing. This
situation seems to improve among some of the beneficiary cooperatives following their
participation in the current scheme. The findings show that gaining direct access to bank finance
without the mediation of unions somehow boosted primary cooperatives’ bargaining power for
better price. In particular, the fact that beneficiary cooperatives have started producing large

224
volume of good quality coffee has attracted buyers (mainly unions). This section highlights some
of the economic benefits gained in relation to the guarantee scheme under analysis.
6.6.4.1. Income generated through coffee business activities
It was expected that participation in the scheme would increase the amount of income generated
from coffee business. When we examine the difference between the scheme participants and
non-participants, as expected, on average the former generated higher income (4.12 million Birr)
from coffee trade than the latter group (2.89 million Birr) during the period 2012 to 2014. This
however does not mean that the difference is totally attributed to the intervention. The
association was however not statistically significant (P = 0.532), which is likely to emanate from
the small number of scheme participant cooperatives who reported obtaining income.
Table 6.15: Difference between participants and non-participants in the income obtained
from coffee (2012 – 2014) (N = 39)
Participation status No of coops Mean coffee income (Birr) SD
Participants 13 4,136,500 6,196,710
Non-participants 26 2,887,900 5,635,220
Total 39
T-value = 0.631 DF = 37 Significance = 0.532 (NS)
6.6.4.2. Profit generated from coffee trade
We tried to assess if there is any association between participation in the scheme and profits
obtained from coffee business. In this respect, 75% and 69% of the cooperatives targeted by the
current scheme had obtained profit from coffee trade as compared with 68% and 67% for the
non-participants during the years 2013 and 2014, respectively. The differences are not
statistically significant for both years (Table 6.16). This shows the fact that, regardless of their
participation status, most primary cooperatives have weak coffee business activities.

225
Table 6.16: Difference between participants and non-participants in the profit obtained
from coffee trade in 2013 and 2014
Obtained profit Participants Non-participants
In 2013 N % N % X
2 – value
Yes 15 75% 39 68% 0.306 (NS)
No 5 25% 18 32%
In 2014
Yes 11 69% 32 67% 0.024 (NS)
No 5 31% 16 33%
However, though this might not be entirely attributed to the intervention, scheme participants on
average generated much higher profit (over three-folds) than the non-participant cooperatives
during the year 2013 and 2014, However, due to the small number of participant cooperatives
that reported obtaining profit, we refrained from testing for statistical significance. It is also
important to note that some of the cooperatives did not receive feedback on the profit they got
from coffee trade for the year 2014 by the time this survey took place.
Table 6.17: Difference between participants and non-participants in the amount of profit
obtained from coffee trade in 2013 and 2014 (N = 30)
Participation status No of coops Mean amount of profit (Birr) SD
Participants 11 309,819 404,633
Non-participants 30 99,475 121,160
Total 41
6.6.4.3. Dividends paid out to member farmers
There is a time lag between the coffee sale period and when unions provide feedback to
cooperatives on the profits generated from their coffee sale. While some of the cooperatives have

226
been informally notified of the profits generated, most of them have not received the money from
their union for the recent years. For instance, one of the unions distributed in 2014 the surpluses
from coffee trades that took place in 2010/11. The results of key informant interviews with
cooperatives management shows that some of the scheme participant cooperatives have recently
started giving dividends to member farmers for the first. However, owning to the small number
of cooperatives that gave dividends to members, it was not possible to make a sound statistical
comparison between the scheme participants and non-participants as well as with their situation
before the intervention. In general, out of the 80 interviewed cooperatives, only 15 and 12 had
paid out dividends to member farmers during the year 2013 and 2014, respectively. Out of these,
only four and three scheme participant cooperatives distributed dividends to members over the
two years, respectively.
6.7. Improvements in the institutional capacity of beneficiary cooperatives
Preliminary findings suggest that there are some improvements in the beneficiary cooperatives’
institutional and business performance. One of the improvements reported by the management
committees of the participant cooperatives is that their capacities have been substantially
strengthened through the awareness creation, training and experience sharing activities
undertaken. Such support particularly appeared to be critical for the new and weak cooperatives.
This enabled some of these cooperatives to gain access to bank loan for the first time.
6.7.1. Change in member size of cooperatives
We found a substantial difference in member size between scheme participant and non-
participant cooperatives in that, on average, the former and the later had 713 and 559 members,
respectively. However, the association was not statistically significant (T-value = 1.257; P-value
= 0.213). Non-proportionality of the sample sizes of the two groups appears to influence its
statistical significance. This is due to the fact that only 22 cooperatives were targeted to be
supported by the current scheme.

227
Table 6.18: Difference between member size of participant and non-participant coops as of
June 2015 (N = 80)
Participation status No of respondents Mean member size SD
Participants 22 713 486
Non-participants 58 559 490
Total 80
T-value = 1.257 DF = 78 Significance = 0.213 (NS)
On the other hand, when we examine the changes in member size among scheme participant
cooperatives following their participation in the scheme, we found a significant difference (T-
value = -4.626; P = 001) between mean member size before and after participating in the
scheme. The mean member size at the beginning of the scheme implementation was 639 farmers
as compared with 713 farmers after participating in the scheme. This shows growth in the
interest of farmers in the cooperatives as a result of the improved business activities and access
to processing facilities.
Table 6.19: Relationship between participation in the scheme and member size of coops –
before (as of 2012) and after participating in the scheme (as of 2015) (N = 22)
Before and after (during) No of respondents Mean member size SD
Before the scheme 22 639 492
After participating in the scheme 22 713 486
T-value = -4.626 DF = 21 Significance = 0.001
6.7.2. Changes in human resources and management of cooperatives
This section discusses the changes recorded in terms of management and human resources
following the intervention of the scheme.
6.7.2.1. Change in number of permanent workers
Participation in the scheme was expected to increase manpower of the beneficiary cooperatives
because of their improved access to loan and increased business capacities. As shown in Table
6.20, the number of permanent workers employed by the cooperatives targeted by the scheme
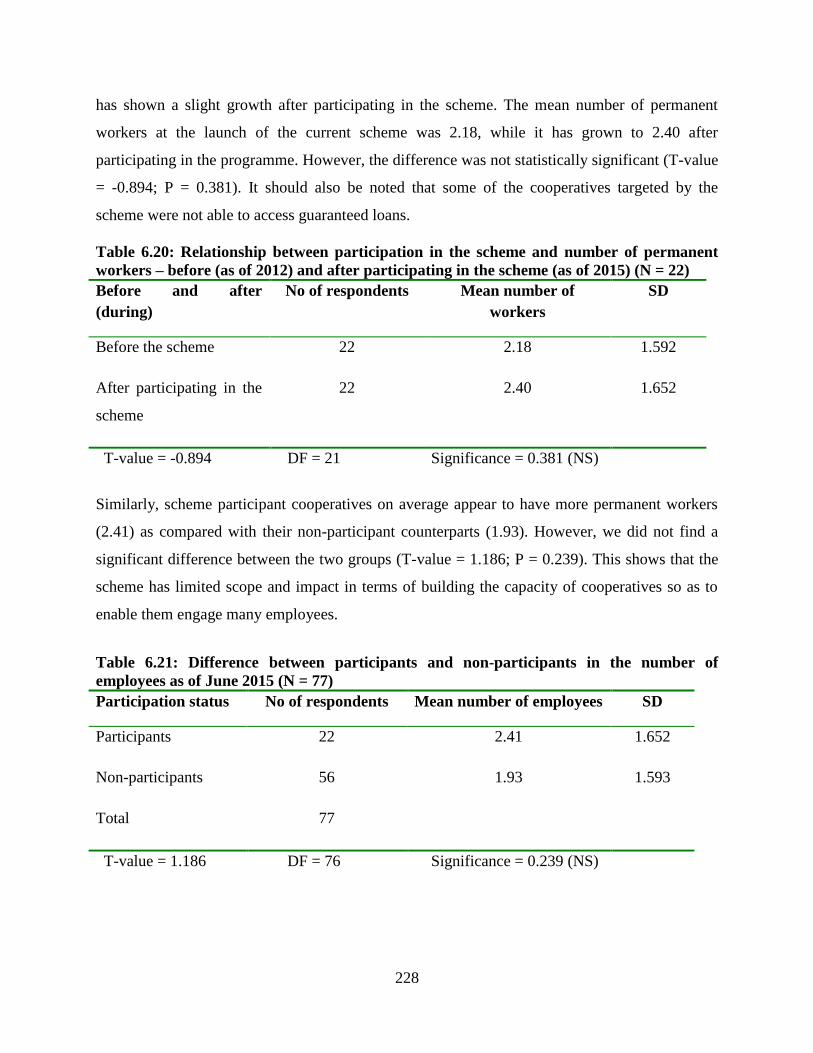
228
has shown a slight growth after participating in the scheme. The mean number of permanent
workers at the launch of the current scheme was 2.18, while it has grown to 2.40 after
participating in the programme. However, the difference was not statistically significant (T-value
= -0.894; P = 0.381). It should also be noted that some of the cooperatives targeted by the
scheme were not able to access guaranteed loans.
Table 6.20: Relationship between participation in the scheme and number of permanent
workers – before (as of 2012) and after participating in the scheme (as of 2015) (N = 22)
Before and after
(during)
No of respondents Mean number of
workers
SD
Before the scheme 22 2.18 1.592
After participating in the
scheme
22 2.40 1.652
T-value = -0.894 DF = 21 Significance = 0.381 (NS)
Similarly, scheme participant cooperatives on average appear to have more permanent workers
(2.41) as compared with their non-participant counterparts (1.93). However, we did not find a
significant difference between the two groups (T-value = 1.186; P = 0.239). This shows that the
scheme has limited scope and impact in terms of building the capacity of cooperatives so as to
enable them engage many employees.
Table 6.21: Difference between participants and non-participants in the number of
employees as of June 2015 (N = 77)
Participation status No of respondents Mean number of employees SD
Participants 22 2.41 1.652
Non-participants 56 1.93 1.593
Total 77
T-value = 1.186 DF = 76 Significance = 0.239 (NS)

229
6.7.2.2. Shift to professional management
Having professional manager is expected to lead to effective organisational and business
management, innovativeness and enhanced uptake of new technologies. In general, out of the
total 79 cooperatives who responded to this question, only 10 and 9 cooperatives reported having
professional managers as of 2012 and 2015, respectively. It was surprising to see a slight
declining trend after three years. More interestingly, participating in the scheme did not
contribute much in helping cooperatives to shift from committee-based management to full-time
professional management. Out of the 22 cooperatives targeted by the scheme, only two (9%) had
reported having professional manager at the beginning of the intervention, while this just reached
three cooperatives (13.50%) after participating in the scheme.
6.7.2.3. Change in having accountant
It was expected that participating in the scheme and having access to loans would increase the
number of cooperatives having a professional personnel dealing with their financial accounts. In
this regard, as indicated in the below table, though slightly more number of participant
cooperatives appear to have some sort of accountants as compared with the non-participants, the
difference was not statistically significant (X2 = 0.258; P = 0.612).
Table 6.22: Difference between participants and non-participants in having accountant as
of June 2015 (N = 80)
Having accountant Participation status
Participants
No. (%)
Non-participants
No. (%)
Have accountant 15 (68%) 36 (62%)
Do not have accountant 7 (32%) 22 (37%)
Total 22 (100%) 58 (100%)
X2
= 0.258 DF = 1 Sig. = 0.612 (NS)
Similarly, when we examine the change after participating in the scheme, 12 cooperatives (54%)
reported having an accountant as of September 2012 as compared with 15 cooperatives (68%)
after participating in the intervention (as of 2015). The association between the two periods in

230
terms of number of cooperatives having accountants was also statistically significant (X2
=
12.320; P = 0.001). This could be at least partly attributed to the scheme’s intervention.
Table 6.23: Relationship between participation in the scheme and having an accountant –
before (as of 2012) and after the scheme (as of 2015) (N = 22)
Having accountant Before and after participating in the scheme
Before the scheme
No. (%)
After participation
No. (%)
Have accountant 12 (54%) 15 (68%)
Do not have accountant 10 (46%) 7 (32%)
Total 22 (100%) 22 (100%)
X2
= 12.320 DF = 1 Sig. = 0.001
6.7.3. Effects on members’ participation and confidence in the cooperatives
One of the challenges of primary cooperatives is lack of active participation and commitment of
member farmers in their business and key decisions. Commitment of members and confidence in
their organisation, among other things, would enable cooperatives to collect members’ coffee
without necessarily making cash payments on the spot. This is particularly important when loans
did not arrive on time, which is often the case with primary cooperatives. We examined this
situation with and without the scheme, and before and after participating in the scheme. As
indicated in Table 6.24, the Chi-square test shows that there is no statistically significant
difference (P = 0.770) between scheme participant and non-participant cooperatives with regard
to members’ willingness to deliver coffee to their cooperative on loan. The current researcher’s
observation and interaction with cooperatives reveal that it is not a common practice among the
vast majority of member farmers to supply their coffee with the arrangement to receive the
payment after sometime (when loans arrive or after the cooperatives sold their coffee).

231
Table 6.24: Difference between coops participants and non-participants in the members’
willingness to deliver coffee without payment on spot (N = 72)
Willingness to deliver
without payment on spot
Participation status
Participants
No. (%)
Non-participants
No. (%)
Willing 10 (50%) 24 (46%)
Not willing 10 (50%) 28 (54%)
Total 20 (100%) 52 (100%)
X2
= 0.086 DF = 1 Sig. = 0.770
We also examined the difference between the situation before and after participating in the
scheme with regard to members’ willingness to deliver coffee without receiving payment upon
delivery. As indicated in Table 6.25, there is no substantial change among the cooperatives as a
result of their participation in the scheme. Two of the current scheme participant cooperatives
indicated collecting coffee from a few member farmers on credit (until they get bank loan).
Another interesting finding is that members’ participation in supplying their coffee (of course,
with payment on spot) and interest among new members has shown improvements among the
loan beneficiary cooperatives. Access to finance has enabled some of the beneficiary
cooperatives to collect members’ coffee as well as to acquire valuable assets such as processing
facilities that attract farmers.
Table 6.25: Changes in terms of farmers’ willingness to deliver coffee without payment on
spot (in management committees’ opinion) – before and after the scheme
Willingness to deliver
without payment on spot
Before the scheme
No. (%)
After the scheme
No. (%)
Willing 10 (45.5%) 10 (50%)
Not willing 12 (54.5%) 10 (50%)
Total 22 (100%) 20 (100%)
6.7.4. Relationship and linkages established with other institutions
As discussed in the earlier section of this chapter, prior to the launch of the current scheme,
unions used to act as the major intermediaries for the bulk of bank loans that are channeled to

232
primary cooperatives. One of the prominent contributions of the current guarantee scheme is that
it helped primary cooperatives to establish direct link with commercial banks, to properly
understand their lending procedures and requirements, and to develop repayment reputation that
can improve their future access to bank loans. A number of cooperatives indicated that the
intervention helped them to borrow from CBO for the first time in their history. More
importantly, the scheme played a vital role in building cooperatives’ capacity and in enhancing
awareness about possibility of borrowing from banks without the mediation of unions.
Discussions with some of the guaranteed loan recipient cooperatives indicated that banks started
showing favourable approach during repeated borrowing. For instance, the management of
Meliyu (scheme participant cooperative from Kaffa) reported that they submitted a loan
application of 700,000 Birr during the 2013/14 coffee season. After assessing their application,
the manager of the partner bank felt that the requested amount is too small to undertake
meaningful coffee business activity and encouraged them to borrow 1.5 million Birr. They
indicated that this kind of genuine relationship and trust had never existed before, and
establishing such customer-ship is a great opportunity and asset for their cooperative. The
majority of the cooperatives, however, obtained smaller amount of guaranteed loans than they
applied for. Moreover, the role of this intervention in enabling cooperatives to graduate to non-
guaranteed loans remains to be seen in the long run. The scheme also appeared to play some role
in strengthening the relationship between farmers’ cooperatives and extension agency. It has
catalysed the interaction between primary cooperatives, cooperative promoting agents and coffee
extension officers to work together in improving coffee quality.
6.7.5. Change in asset accumulation: was there any project additionality?
The survey reveals that most of the cooperatives lack proper/modern office, processing and
storage facilities. Majority of the available warehouses are in poor state and not suitable for
coffee storage. It was expected that access to medium-term loan would enable cooperatives to
acquire fixed assets as well as to launch new projects such as wet processing. Following the
awareness raising and training activities and improved access to bank loans, some of the scheme
participant cooperatives have had access to modern processing and storage facilities. Close to
46% of the scheme participants made investments in some sort of facility as compared with only
29% for the non-participants during the year 2013 and 2014. Five, four, three and two of the

233
scheme participant cooperatives reported acquiring new warehouse, office, wet mills and drying
facilities, respectively. One of the scheme participant cooperatives was in the process of
obtaining hulling facility. It is important to note that these facilities were not totally financed by
the scheme; i.e. some were financed by the cooperatives themselves or by other agencies such as
unions which might have been motivated by cooperatives’ enhanced capacity and demand for
such facility. On the other hand, none of the non-participant cooperatives acquired wet-mills nor
hulling facility during the same period. For instance, the management of Shola Koda cooperative
from Wolayita reported that they have realised great development and improvement in terms of
acquiring assets, such as washing facilities, warehouse and others. They said “We have
accumulated assets that can be pledged as collateral; we started paying dividends to our
members; we have reached the stage of hiring full-time workers; we will own a vehicle in the
near future as well as participate on social and local development activities. We have
established strong relationship with the lending bank. We will graduate from the guaranteed
loan very soon’’.
In particular, the guaranteed medium term loans were critical to the three recipient cooperatives
in acquiring processing and storage facilities, which they could have not been able to acquire at
least in the short run. As a result, some of the cooperatives which were previously engaged solely
in trading natural sun-dried cherry were able to shift to wet processing. Such medium-term loans
appear to more significantly contribute to the improvements in coffee quality and asset-base of
the cooperatives as compared with short-term loans provided for seasonal coffee purchase.
Nevertheless, the coverage of such loans has been limited as the bulk of the lending activity
predominantly focused on traditional trade activities such as seasonal coffee purchase and sale.
When we examine the value of fixed assets, the T-test result shows that, on average, scheme
participant cooperatives had relatively higher value of assets (655,099 Birr) as compared with the
non-participants, who reported having 579,138 Birr worth asset. The difference was, however,
not statistically significant (P = 0.841).

234
Table 6.26: Difference between participants and non-participants in the value of fixed
assets as of June 2015 (N = 80)
Participation status No of respondents Mean value of fixed asset SD
Participant 22 655,099 970,843
Non-participant 58 579,138 1,662,010
Total 80
T-value = 0.201 DF = 78 Significance = 0.841 (NS)
We also tried to examine the difference between the net capital owned by scheme participants
and non-participant cooperatives. The former appears to have slightly higher net capital (853,029
Birr) than the latter group (789,381 Birr) though the association was not statistically significant
(T-value = 0.142; P = 0.888).
6.7.6. Some of the benefits generated for the participating banks
We asked the participating bank if they view their involvement in the scheme implementation as
a mutually beneficial arrangement. In this regard, the partner bank reported that they gained
some benefits from participating in the scheme, particularly in terms of building their own
capacity and in gaining experience on such areas as coffee or agri-financing, financial and risk
analyses, and other related areas. In addition, the intervention played an important role in terms
of helping the bank to get to know borrower cooperatives by allowing them to experiment with
new market segments in a new region. In this regard, the Oromia based CBO was able to lend to
cooperatives in the SNNP region for the first time. Based on the experiences gained with the
cooperatives that received guaranteed loans, CBO expanded its branches to the locality of the
participating cooperatives (e.g. Wolayita) in the SNNP region. The scheme also somehow helped
the participating bank to promote itself and for strategic positioning. Reducing the risks of
borrowing to such rural-based farmer cooperatives was apparently the obvious advantage of such
an arrangement.

235
6.8. Impacts on lenders’ and borrowers’ behavior: Incidence of moral hazard
Taking a closer look at the prevalence of moral hazard and default rates is another relevant area
that needs to be assessed in relation to the impacts of such a guarantee intervention. In this
regard, almost all categories of key informants and focus groups were of the opinion that moral
hazard will not be a real problem among the lenders in such partial risk coverage under the
Ethiopian context. Because since it is a partial guarantee fund whereby banks have some stake,
lenders will pay serious attention and exercise prudent practice in the screening, supervision and
loan recovery processes. They underscored that even if the risk coverage is raised to a higher
percentage, banks still want to maintain their reputation. They go on to note that the regulation of
the National Bank also compels banks to keep their non-performing loans under 5%.
On the other hand, when we asked if provision of the partial credit guarantee may cause moral
hazard among the borrower cooperatives, we received mixed responses. Almost all of the
interviewed coffee/extension and cooperative experts were of the opinion that such intervention
will not have significant impacts on the behavior of the borrower cooperatives. Nevertheless,
four of the ten interviewed bank and MFI key informants were of the view that being aware of
the presence of such a guarantee, borrowers (cooperatives) may show some reluctance in
repaying their loans. In contrary, majority of the bank key informants indicated that cooperatives
want to demonstrate their credit worthiness by properly repaying their loans and to establish
good relationship with the lending banks. In addition, various key informants noted the fact that
the government body (such as coops promotion agency) plays an important role in supervising
and supporting loan repayment process. Many underscored that the effectiveness of loan
repayment generally depends on the screening process, approaches employed in introducing the
scheme, awareness creation activities, intensity of follow up and supervision, collateral (equity)
provision, etc. They were of the opinion that in the absence of adequate prior awareness creation
activity, cooperatives may tend to consider the guaranteed loan as a form of grant provided by
donors that might not be necessarily repaid. In the view of one bank officer the best remedy to
overcome problems of moral hazard is to make borrower cooperatives cover some percent in the
form of equity.

236
We tried to assess the actual performance of the beneficiary cooperatives in repaying their loans
under the current guarantee scheme. The scheme has operated for a few years and it was too
early to fully assess the rate of loan recovery or to generate conclusive evidence on the rate of
default. In general, as at the write up of this thesis, no loan was declared as default by the lending
bank under the current scheme though a few cooperatives appear to delay payment of
installments due to some reasons such as market problem. As such none of the borrower
cooperatives has shown opportunistic behavior such as deliberate unwillingness to repay their
loans. In particular, none of the borrower cooperatives failed to repay full amount within the loan
due period, while only five of the fourteen cooperatives (35%) struggled to pay certain
proportion of the loan with its interest. Three of the cooperatives negotiated with the lending
bank and extended loan repayment to one more year. Out of the 18.40 million Birr loan
disbursed by the partner bank over the first three years of lending, over 14.50 million Birr of the
principal and about 400,000 Birr interest were already recovered from the borrower cooperatives.
However, it is important to note that some of the disbursed loans have not completed their full
maturity period by the time this study took place. Thus we were not able to definitely identify
which of the remaining cooperatives are willing and able to make the outstanding repayment
sometime later or which ones may totally stop to pay back the outstanding balance.
We also tried to assess if loan diversion has been a real problem among the borrower
cooperatives. None of the cooperatives reported diverting or putting the guaranteed loans to
different uses other than the purposes they were intended for. However, we noticed loan
diversion practices among some cooperatives whereby they tried to use the short-term working
capital loan for building warehouses, to acquire power generator, or to carry out other trade
activities such as khat. Moreover, observations and interactions with the borrower cooperatives
reveal some attempts by the management committee to misappropriate the guaranteed loans they
had received. For example, the management of one borrower cooperative was observed buying
coffee at unrealistically higher prices than the prevailing local market price. Overall, the findings
show that cooperatives have shown better performance with their loans utilisation where there
was strong support and follow up from the coop promoting agency. On the other hand, we
observed some sort of column shifting among one branch office of the lending bank whereby
they tried to link previous poorly performing non-guaranteed loans to the new guaranteed loans.

237
6.9. Factors affecting effectiveness of a CGS for farmer cooperatives (under the
Ethiopian context)
The fact that a small number of cooperatives received guaranteed loans under the current scheme
did not allow us to undertake rigorous econometric analysis to determine factors determining
effectiveness and success of the current scheme. The findings reported here are based on in-
depth qualitative interviews and observations. Key informants and focus groups outlined a
number of challenges and constraints that potentially affect the performance and effectiveness of
such a loan guarantee scheme targeting farmer cooperatives under the Ethiopian context. The
degree of importance various stakeholder groups attach to the different constraints or challenges
appear to vary. The most severe ones as reported by most of the interviewed bank and MFIs
officers (Table 6.27), are problem of liquidity, National Bank’s Bond Bill purchase directive35
and other policy and regulatory issues, high risk nature of cooperative/agricultural enterprise,
weak management and leadership of cooperatives, and failure to meet other bank lending
requirements. Most of the private banks indicated that the recent directive of the National Bank
(which came to effect in 2011) restricts their loan disbursement capacity and profitability of their
business. They noted that private banks are devising strategies to overcome such challenges,
which include restricting supply of conventional lending only on the basis of interest charges.
They will make very selective lending that tries to link loan supply to other benefits such as
capacity to deposit cash and businesses that generates foreign currency. A key informant from
the state bank was however of the opinion that such imposition on private banks is legitimate in
order to bring them on board of national development endeavours. According to him, private
banks are purely profit-oriented and tend to look for lucrative businesses and not necessarily
target government priority areas. Moreover, out of the interviewed six private banks, officers of
the two pioneer and well-established banks indicated that NB bill and liquidity problem are not
serious constraints to their banks.
Various key informants emphasised the appreciable gaps in the capacity of cooperatives and
limitations in meeting other bank lending requirements as the main hindrance in effectively
35
For every loan disbursement the private banks undertook, they have to purchase a 27% worth five-year
government investment (saving) bond, at an interest rate of 3% (which is lower than the rate they pay on saving
deposits, which is 5% and above). This appeared to affect their liquidity, income, and lending appetite.

238
accessing and utilising loans under such an arrangement. Lack of confidence in the feasibility of
cooperatives’ project or business activities, poor coffee production, dwindling and/or fluctuating
market price, and weak market linkage were also mentioned as some of the challenges in this
regard. In addition, as discussed in the earlier sections, limitations in some of the scheme design
features were cited as additional contributory factors that contribute to banks’ reluctance in
actively participating in such lending activity. For instance, four out of the 10 interviewed banks
and MFIs officers stated that such low risk sharing percentage (50%) will not be able to
effectively attract banks to actively participate in such an arrangement. Some of the banks
indicated that fees associated with the scheme makes the guaranteed loans costly to borrowers. In
addition, limited time span of the scheme, extra reporting and admin work associated with such
an arrangement, banks’ lack of experience in cooperative lending, uncertainty and possible
lengthy claims procedure in case of default were reported as potential constraints to effective
utilisation of CGSs among banks.
Table 6.27: Constraints and challenges to the success of CGSs as outlined by banks & MFIs
Major constraints and challenges of CGS Number of key informants
cited
Problem of liquidity (shortage of loanable fund) 8
National Bank Bond purchase and other regulatory/policy
issues
5
Feasibility and attractiveness of coops business, high risk
nature of coops/agricultural enterprise, poor coffee yield, etc
5
Low risk sharing percentage, especially at initial stage 4
Weak management of cooperatives (risk and low demand) 3
Utilisation fees (will make loan costly) 1
Weak market linkage 1
Extra reporting and admin work 1
Banks’ lack of experience in lending to cooperatives 1
Limited time span (of scheme) 1
Uncertainty and possible lengthy process to secure claims 1

239
As related to the above potential constraints, various stakeholders proposed a number of
measures that could contribute to the effectiveness of such credit guarantee schemes. As
presented in Table 6.28, in particular, bank and cooperative experts outlined a number of factors
or interventions that could enhance the effectiveness of such guarantee programmes. On the part
of the government, various support measures are needed, which include strengthening
cooperatives, creating supportive and enabling environment, strengthening market access and
linkages to alternative markets (for primary cooperatives). As related to scheme design and
operation, integrating other incentive packages; increasing risk sharing percentage; reducing or
removing guarantee fees for such target groups; designing a scheme with a fairly longer life
span; and paying due attention to market linkage were cited as important aspects. In relation to
the lending bank, experience sharing, capacity building, addressing liquidity problems and
encouraging them to undertake proper follow up and supervision were highlighted as important
factors. The importance of prompt loan approval process and timely release was also stressed as
one of the success factors. With respect to the borrower cooperatives, intensive awareness raising
and sensitisation, improving their management and overall capacity; strengthening members’
participation and market linkage were outlined as the major success factors for guarantee
schemes. In particular, the need to assist cooperatives in gaining access to certification and other
schemes such as specialty and fair-trade was emphasised. In addition, provision of intensive
technical training on all aspects of coffee production, processing and marketing was another
critical area highlighted by the study participants. In the views of senior officials of one bank and
two MFIs, for a loan guarantee scheme to be effective, both the guarantor and the lender have to
be genuine and committed partners. As regards the interests of MFIs to participate in such a
guarantee scheme, they noted that it has to be a cash guarantee with higher risk coverage (at least
75%, particularly at the initial stage). They were of the opinion that provision of access to hard
currency and cash guarantee to the participating banks is a crucial element in motivating banks to
participant in such an arrangement.

240
Table 6.28: Factors that could enhance the effectiveness of a credit guarantee scheme
(according to the views of bank and cooperative officers):
Factors enhancing/influencing effectiveness of CGS Number of
bank officers
(KIs) cited
Number of
coops experts
(KIs) cited
Raise awareness, improve capacity (management) of coops* 4 7
Enhance government support** 4 3
Improve backward and forward integration with members &
market, link with export market, value addition
3 4
Improve scheme design (e.g. increasing level of risk sharing,
adapt to local situation, reduce guarantee fee)
6 1
Inclusion of other incentive packages for banks*** 4 1
Proper follow up, monitoring and support 1 3
Provide long term guarantee scheme 1
Enhanced relations, common understanding and commitment
among banks and guarantors
1 2
Facilitate experience sharing (for banks) 1 1
Helping coops to build fixed assets through the loan obtained 1
Involvement of government to guarantee the rest 50% risk 1
Minimise government intervention in cooperatives’ activities 1 *Awareness raising (to enable them properly utilise the loan or avoid moral hazard), and capacity building for
targeted cooperatives (technical, marketing, finance literacy, managerial).
**Policy direction and regulation that encourage banks to lend to cooperatives; e.g. imposing some quota on banks
to direct certain percentage of their loan to the cooperative sector. Relaxing loan procedures and requirements for
cooperatives, e.g. reconsidering issues of NB bills with cooperatives lending
***For example, training and experience sharing for bank staff, devise ways of accessing foreign currencies by
depositing funds in the account of lending bank and from export of products, and so forth.
Summary
This chapter has presented the findings of both qualitative and quantitative research on the
features, performance and preliminary outcomes of the credit guarantee scheme under analysis.
The chapter highlighted that though most of the scheme design features and operations are in line
with international experiences and practices, there have been some obvious limitations which
particularly influenced its attractiveness to the lending banks. The findings in this chapter
suggest that the scheme under review has demonstrated mixed performance and achievements.
Above all, there have been limitations in the actual utilisation of the loan guarantee and outreach
by the participating bank. The findings suggest that given the prevailing liquidity problem among
most private banks, in the absence of some sort of capital enhancement mechanism, banks show
reluctance in widely reaching out to the targeted cooperatives. In addition, particularly the 50%

241
risk sharing does not seem to be attractive to most of the lending banks. It was also noted that
involving only one bank in such lending activities had some drawbacks. However, the scheme to
a certain extent improved accessibility of bank credit to some of the targeted primary
cooperatives and generated substantial loan additionality. It also indirectly played a pivotal role
in stimulating unions to channel substantial loan fund to the primary cooperatives targeted by the
current scheme. In addition, provision of a credit guarantee and associated supports seem to play
an important role in motivating cooperatives to seek for bank loans. However, the scheme had
limited impacts in improving the terms and conditions of bank loans.
The chapter also presented some preliminary impacts in terms of economic additionality and
other related benefits. The intervention helped some of the beneficiary cooperatives to acquire
some critical assets such as processing and storage facilities, which helped them to add value to
their coffee through primary processing activities The volume of coffee processed as well as the
amount of dry cherry traded by scheme participant cooperatives has shown substantial
increment. This somehow enabled beneficiary cooperatives to generate better income. However,
such improved coffee processing was realised only by a few beneficiary cooperatives while the
majority of cooperatives appear to stick to traditional coffee processing and trade activities. The
intervention also had limited impacts in terms of improving institutional capacity of the
beneficiary cooperatives, such as human resources and management. However, there has been a
significant increase in the member size of beneficiary cooperatives. There are also indications
that the lending bank generated some benefits from participating in the scheme. The findings
suggest that the intervention had very limited impacts on lenders’ and borrowers’ behavior in
terms of causing moral hazard. The chapter finally outlined factors that affect the effectiveness
of a credit guarantee scheme targeting farmer cooperatives under the Ethiopian context. The
chapter concludes that provision of a credit guarantee does not necessarily guarantee massive
supply of loan funds as a number of internal and external factors may constrain banks’ outreach
to the targeted primary cooperatives. In particular, the effectiveness and contribution of a credit
guarantee scheme in the financial markets with pervasive state intervention and tight regulatory
system could be limited.

242
CHAPTER 7
7. DISCUSSIONS OF THE KEY FINDINGS
7.1. Introduction
The chapter presents synthesis and discussions of the key findings of the empirical study in
relation to existing literature or theory. Discussions of the key empirical findings are organised
according to the corresponding objectives set for the study. The first part of the chapter discusses
the Ethiopia coffee sector and the role of cooperatives in its processing and marketing and as
intermediaries for channeling bank credit to member farmers. This is followed by a discussion on
farmer cooperatives’ demand for institutional credit and factors influencing their credit demand,
with especial emphasis on demand side constraints.
7.2. The role of cooperatives in coffee processing, marketing and as
intermediaries for channeling bank credit to smallholder farmers
7.2.1 Significance of the coffee sector
In agreement with many previous studies (e.g. Negussie et al, 2007; Admasu et al, 2008,
Alemayehu and Esayas, 2008; Minten et al, 2014), the current study underscores that coffee is of
considerable economic, social, cultural and environmental significance to Ethiopia. It is a major
cash crop both in the Oromia and SNNP regions, which according to CSA (2014), account for
99% of the country’s coffee production. This commodity can arguably generate substantial
economic benefits with a fairly limited investment, which underscores its pronounced potential
returns if resources are properly and sufficiently channeled to this sector. The study found that,
unfortunately, the Ethiopian coffee sector has not enjoyed the support and investment that is
commensurate with its contribution. This prominent national wealth thus needs to be accorded
the attention it deserves in terms of policy and institutional supports. These may include creating
enabling policy environments that facilitate producers’ access to better inputs (such as farm
tools, processing and storage facilities, etc.), output markets, credit and other support services.

243
Such efforts call for the need to establish and/or strengthen institutions dealing with and support
coffee development, marketing and other service provision at various levels.
7.2.2 Coffee Production, Processing and Marketing: The role of cooperatives
The study suggests that the partially liberal economic policy of the current government has both
positive and undesirable effects on the coffee sector. While its interventionist policy allowed the
government to support the sector in various ways, the tighter regulatory and control interventions
in the sector itself and in the support service providing institutions seem to have some adverse
effects on the performance of the sector.
7.2.2.1. Coffee production practices and system
The fact that the study areas practice diverse coffee production systems that vary from place to
place (based on agro-ecology and socio-economic set-up) makes blanket approach in the
provision of extension and other support services ineffective. As in most other parts of the
country, the bulk of the coffee production activities in the study areas are undertaken by small-
scale farmers who largely employ traditional practices. Previous studies (e.g. Admasu et al,
2008; Negussie et al, 2008; Alemayehu and Esayas, 2008; Negussie et al, 2007) point out that
though there have been improvements in recent years, particularly, adoption of the improved
coffee management practices by smallholder producers is still limited. Despite the commendable
efforts made by research in generating improved varieties and associated management practices,
their suitability for and adoption is still limited in certain areas such as Hararge. Agro-ecology
based technology generation and dissemination thus needs to be further strengthened and
promoted. Though cooperatives are not directly involved in coffee production, they have a great
potential to support the production end through provision of necessary inputs (including
multiplication and distribution of seeds/seedlings of improved varieties), farm tools, processing
facilities, credit and effective output marketing. Apart from supporting farmers, provision of
such services will go a long way in helping cooperatives to win farmers’ interest and active
participation in their association.
As regards use of inputs, farmers in all study areas do not use any inorganic inputs. Previous
studies similarly confirm (e.g. Admasu et al, 2008) absence of use of inorganic inputs among

244
smallholder coffee producers, who produce the bulk of the coffee produced in Ethiopia. This is
mainly related to the tendency to produce organic products though there appears to be lack of
clearer understanding and direction with regard to threshold level for use of inorganic inputs and
extent of benefits and opportunities associated with the production and marketing of organic
products. This could be one important area for future research. The current study identified a
number of problems that constrain coffee production and productivity in particular and the
development of the sector in general. They are related to lack of various inputs (seeds, credit,
agronomic practices, labour, farm tools and other facilities) diseases and pests, climate change,
problems related to output markets and so forth. Most of the challenges and constraints identified
by the current study are in agreement with the findings of previous studies (such as Admasu et
al, 2008; Alemayehu and Esayas, 2008), which suggests persistence of such problems and the
fact that they are commonly faced by various actors in the value chain across regions. The nature
and diversity of the problems suggest the need for various actors36
to join force if such problems
have to be effectively addressed. Cooperatives can play an important role in catalysing such
collaboration between key actors of the sector. More importantly, cooperatives can assume a
vital role in lobbying for adequate support and better services for their members. This may
include lobbying for more favourable policy and regulations that provide conducive and enabling
regulatory and institutional environments for the development of the coffee sector.
7.2.2.2. Coffee harvesting and processing practices
Concurring with the findings of previous studies (Admasu et al, 2008; Alemayehu and Esayas,
2008; Negussie et al, 2007), the current study reveals that coffee harvesting and processing in
most coffee growing areas of the country is predominantly traditional, though there have been
improvements in recent years. Unlike the case in its production end, cooperatives play an
important role in coffee processing activities. The improvements revealed in the harvesting and
processing practices could be attributed to the efforts made by multiple actors of the sector,
including cooperatives. In general, sun-drying of cherries is the dominant practice both among
individual farmers and cooperatives in the study areas. Existing documents (e.g. Musebe et al,
2011; Minten et al, 2014) show that the bulk (close to 70%) of the coffee exported by Ethiopia is
36
These may include those actors involved in coffee research, extension, marketing (inputs and outputs), policy,
financial providers, cooperatives promotion institutions, among others.

245
sun-dried coffee. That means primary cooperatives are predominantly engaged in coffee
businesses that do not involve much value adding activities. Such practices of merely buying and
selling dry cherries have obvious implications for coffee quality and the prices it attracts.
Unsurprisingly, most cooperatives in the South and South-West parts of the country wish to use
wet-processing method, while those in Eastern Ethiopia such as Hararge tend to continue with
sun-drying, but using improved drying facilities. Existing studies (Minten et al, 2014) also point
to unsuitability of wet-processing method in some areas such as Hararge due to climatic
constraints and other related factors. The fact that more cooperatives from the Oromia region
preferred sun-drying technique than those in the SNNP region could be attributed to the fact that
most of the study samples drawn from Oromia are located in Hararge and Wellega, which
traditionally rely on sun-drying technique. This finding, however, may not represent the views
and needs of the cooperatives located in other major coffee producing areas of South and South-
West Ethiopia (such as Jimma, Sidama and Gedio), which have better experience, processing
facilities and water sources to set up wet processing mills. In general, there seems to be lack of
awareness, skills and necessary facilities to undertake wet-processing activities among the
cooperatives in the study areas. This calls for interventions that build cooperatives’ capacity in
terms of raising awareness (about the importance of preparing washed coffee), in equipping them
with relevant skills (on the use of this method), and in improving access to processing facilities
and competitive market for the product.
Promotion of wet-processing methods to such areas as West and East Wellega, and Wolayita
zones needs a cautious move as farmers and cooperatives tend to maintain the longstanding
practice of sun-drying. Such efforts may need to be preceded by intensive awareness raising
activities. Moreover, given some of the merits of the natural sun-drying practice and shortage of
water sources for establishing wet mills, interventions aiming to improve coffee processing and
quality in Hararge areas need to focus on promoting improved sun-drying (of cherry) technique.
As many (e.g. Minten et al, 2014) confirmed, it is also important to note that natural sun dried
Hararge coffee has been fetching higher prices, at times, higher than that of washed coffee. Thus
this practice should be improved and maintained as a viable alternative. In general, promotion of
improved drying facilities and small scale hulling machines are more relevant for Hararge area,

246
though introduction of small pulping machines could be tested on pilot scale at some areas. In
general, a host of natural, socio-economic and institutional factors determine cooperatives’
demand for processing facility and technique. Interventions targeting cooperatives in various
parts of the country thus should consider and cater for their varying needs for processing
facilities and methods.
In terms of cherry drying practices, the majority of the interviewed cooperatives were drying on
raised beds made of local materials and cemented floor. This finding is in agreement with
previous studies (e.g. Musebe et al, 2011) which report that use of modern drying facilities is
very limited in many parts of the country. Though the widespread use of drying beds made of
local materials and cemented floor can be taken as a commendable practice, it is crucial to
encourage cooperatives to use modern drying beds made of mesh/chicken wire in view of their
significance in maintaining coffee quality. On the other hand, under the free market economic
system of the current government, the vast majority of primary cooperatives seem to struggle in
obtaining necessary processing and proper storage facilities. Because following removal of
various targeted supports, cooperatives have been made to act on their own in acquiring such
basic facilities. Thus it is crucial to devise ways of improving cooperatives’ access to modern
processing facilities (including drying materials) and loan finance to enable them acquire these
facilities. Limited or non-use of existing hulling facilities by farmers in some of the study areas
was also reported as a major problem. It is thus equally important to create adequate awareness
and motivation so as to enhance use of available hulling facilities by farmers. Overall,
cooperatives can play a vital role in supporting members to improve coffee harvesting and
processing practices.
7.2.2.3. Coffee marketing practices and system
The coffee marketing system of Ethiopia has seen a number of changes in recent years. Though
the interventionist policy and tighter regulatory environment appear to have some adverse
effects, most of the economic liberalisation measures taken by the current government have
favourable impacts in promoting the development of the coffee sector in general and its export
activities in particular. In general, the subsequent reforms undertaken by the government have
had substantial impacts on institutions related to the coffee sector, with both positive and

247
negative outcomes. In view of coffee’s vital economic importance and in line with its
developmental state ideology, the Ethiopian government is exercising strong control over and
interference in issues related to coffee marketing. For instance, there are tight control and
regulations both on domestic trades and export of this commodity. Minten et al (2014) note that
the evolving policy environment and the domestic policy reforms that have taken place over the
last decade have led to tremendous changes in the structure and performance of the coffee export
activities.
Level of involvement of the study cooperatives in coffee business hugely vary. But their
participation is on the rise which could be attributed to the supportive policy environment for
cooperatives’ marketing system. In agreement with the views in existing literature (e.g.
Dempsey, 2006; USAID, 2005; ATA, 2012), the findings of the current study suggest that
existing marketing system favours the cooperative sector though effective utilisation of this
opportunity has been jeopardised by a number of factors. On the other hand, as many (e.g.
Ayana, 1999; Kodama, 2007) noted, unlike the case under the socialist regime, at present farmers
are not obliged to deliver their coffee solely to cooperatives. The current marketing regulation
permits producer farmers to sell their coffee either to private traders or to their cooperatives.
Farmers’ participation in terms of delivering coffee to their cooperatives depends on the strength
of their association and the benefits they generate for member farmers. The level of
concentration of private traders in a particular area also hugely influences farmers’ participation
in cooperatives’ business. In areas with large number of private traders and weak unions, farmers
often end up surrendering their coffee to private traders. Thus there is a critical need for
strengthening cooperatives and unions if farmers have to actively participate in and benefit from
their marketing services.
Creation of a cooperative/union marketing channel that allows cooperatives to enjoy a number of
privileges appears to be a unique practice and one of the policy supports of the Ethiopia
government towards this sector. In general, unions are the principal marketing outlet for most
coffee cooperatives. A few cooperatives, especially those with weak unions, dispose of their
coffee through ECX by paying commission to those who possess seats with the centre. This is
not surprising as cooperatives heavily rely on unions for seasonal loans for coffee purchase.
Cooperatives receiving such loans will be in obligation to deliver their coffee to parent unions

248
without much value adding activities in terms of form (processing), timing and place of sale. In
addition, as some (e.g. ATA, 2012; Kodama, 2007) noted, unions’ marketing route appears to be
shorter as well as generates better income for farmers and their cooperatives. Apart from
providing alternative market outlets, involvement of cooperatives in the coffee market obviously
injects some competition to the market that would help farmers to secure better price. Moreover,
the cooperative marketing channel enables farmers to access alternative market outlets that pay
better prices such as fair-trade and other certification schemes. This is in addition to the
dividends and other complementary services provided by cooperatives and their unions.
Nevertheless, as many previous studies (e.g. ATA (2012; Dempsey, 2006; Minten et al, 2014)
point out, due to weak institutional and financial capacity and other constraints, most of the
current study cooperatives are not in a position to make proper use of this opportunity. For
instance, according to a recent study (Minten et al, 2014), the export volume via the cooperatives
avenue remained too low (i.e. less than 6% of the total coffee export). In particular, they lack
necessary financial capacity and institutional innovativeness and flexibility to cope with or match
the competition exerted by private traders. Private traders are more efficient in collecting
farmers’ coffee as they enter the market early in the season, which offers them an opportunity to
manipulate prices and exploit farmers. The fact that farmers are often in dire need of cash early
in the season provides a fertile ground for private traders to be in control of the play field. Thus if
cooperatives get strengthened and have timely access to loan, they are obviously better
alternative marketing option for farmers. Thus there is a need to strengthen provision of strategic
and targeted support particularly to the recently created unions which did not get an opportunity
to access the kind of privileges the first generation of unions enjoyed.
On the other hand, the fact that most cooperatives do carry out no or little value adding activities
in the coffee they trade is mainly attributed to lack of necessary awareness, drying materials,
storage facilities and finance. Thus cooperatives and their member farmers need to be supported
and encouraged to carry out at least basic primary processing activities such as proper cherry
drying or wet-processing as one way of value addition. Apart from primary processing activities,
cooperatives also need to gradually start exporting value added products. At present only 1% of
the total coffee export of the country is value added product. On the other hand, the fact that

249
some cooperatives were engaged in buying and selling green beans demonstrates persistence of
traditional (merbush) coffee hulling and trading in some parts of the country, which obviously
compromises the quality of their coffee. This is one of the critical areas for intervention so as to
create greater awareness as well as to promote small hulling facilities as this does not alter the
test of the by-product or husk which they use for their own household consumption.
In agreement with the findings of previous studies (such as Musebe et al, 2011; Negussie et al,
2007), the findings of the current study revealed that usually local price of coffee is not based on
the quality of the product. In particular, primary cooperatives lack flexibility in offering prices
based on quality, which has serious implication for coffee quality. Because farmers may lack
incentives and motivation to invest time and resources in improving coffee quality. It is thus
critical to raise awareness and encourage cooperatives to mobilise and reward members that
deliver coffee of enhanced quality. In addition, as setting of coffee purchase prices at primary
cooperatives level is subjective, liable to corruption and manipulations, such practices need to be
monitored, supervised and corrected if cooperatives have to undertake sound businesses that
genuinely benefit their members.
On the other hand, most farmers were not willing to supply their coffee to their cooperatives
without receiving cash upon delivery. Though farmers’ pressing demand for cash could be one of
the main contributing factors, such practices can also be partly attributed to lack of confidence in
their cooperatives. Previous studies (e.g. Dempsey, 2006; ATA, 2012; Bernard et al, 2013) point
to the prevalence of such widespread lack of trust, confidence and participation among member
farmers. In terms of time of coffee sale, the fact that the vast majority of cooperatives had been
selling their coffee right during the harvest season or soon after reflects lack of opportunity
among primary cooperatives to wait and look for better market prices and outlets. This could be
largely attributed to lack of proper warehouse, and the conditions imposed by their unions in
relation to the loans offered. In general, majority of the primary cooperatives appear to merely
serve as local buying agents for their parent unions, who provide loans, set prices, and time of
delivery. This suggests the need for interventions that support cooperatives to acquire proper
storage facilities, and direct access to loan finance. On the other hand, many of the primary
cooperatives were not provided feedback on the quality grades of their coffee and its defects.
250
Lack of such information would obviously have detrimental effects on their future efforts in
addressing the prevailing limitations and needs to be given serious consideration.
7.2.3. Cooperatives’ operations and services in relation to coffee business
Despite the mixed views expressed about cooperatives and their current services, almost all
concur on the fact that cooperatives are important agents to effect changes and socio-economic
development among smallholders and the rural community. The current government’s market-
oriented economic policy has created conducive environment for the expansion of cooperatives
in Ethiopia. Cooperatives are no longer set up with a coercive action to serve as tools that
primarily execute government plans and promote its political ideology. Concurring with previous
studies (such as Assefa, 2005; Emana, 2009; Bernard et al, 2010), the current study suggests that
the new generation of cooperatives are somehow established in line with the basic principles of
cooperative societies. Unlike the experience under the Derg’s socialist system, the real
importance and contribution of cooperatives seems to become increasingly understood among
farmers. However, the distorted and tainted image of cooperatives that existed during the
military regime somehow continued to influence popular participation in cooperatives.
Moreover, the policy reform packages introduced under the structural adjustment programme in
the 1990s and efforts made towards liberalising the economy forced the government to pull out
(from providing direct and targeted support), leaving the cooperatives to the forces of the market.
As many (e.g. Develtere and Pollet, 2008; Schwettmann, 1997; Bernard et al, 2010) noted, as in
many other countries this initially created some gaps in the cooperative movement in Ethiopia as
well. However, through the subsequent policy and support frameworks provided by the
government, the cooperative sector has revived and massively expanded in recent years.
In agreement with the findings of previous studies (e.g. Dempsey, 2006; USAID, 2005; Minten
et al, 2014; ATA, 2012), the current study has identified cooperatives’ role in marketing
members’ coffee in most of the study areas as one of the crucial contributions. Cooperatives in
particular play an important role in helping farmers to access better markets including
certification schemes and fair-trades, which help them earn better income. Those cooperatives
with strong capacity and experience can undertake sound business and generate substantial profit
for members. Nevertheless, the majority tend to concentrate on input distribution activities such

251
as fertilizer supply. As a result, this role seems to be more valued by farmers in some areas than
their role in marketing members’ produce. In general, many of the member farmers have been
selling their produce to private traders and deliver negligible amount to cooperatives. The
findings of previous studies (e.g. Dempsey, 2006; ATA, 2012; Bernard et al, 2013) also confirm
presence of similar scenario among cooperatives in different parts of the country.
The majority of study cooperatives have weak capacity (particularly in terms of finance and
management), which severely hinders their role and contribution in marketing members’ produce
and in sustainably generating benefits for members. Their management is predominantly led by
non-professionals, who often lack necessary competence, transparency and commitment.
Another critical challenge is that cooperatives heavily rely on unreliable external finance to
undertake their business activities. In highlighting this problem, ATA (2012) indicated that an
average primary cooperative possesses only about 100,000 Birr capital of its own. Most primary
cooperatives do not operate with proper and strategic planning, and tend to carry out businesses
as opportunity arises. For instance, unions provide some loans and instruct cooperatives to
purchase some amount of coffee and deliver to that particular union with no or little value adding
processing activities. This calls for the need to support primary cooperatives in developing their
institutional, managerial and business capacities (including skills in business planning), as well
as in terms of improving access to finance and alternative market outlets.
In general, most of the primary cooperatives are not in a position to provide dividends to
members, nor participate in social and community development. However, some of the stronger
cooperatives with committed management and those which are affiliated to vibrant unions play
an important role in this regard. Obviously, provision of such services and benefits go a long way
in stimulating motivation and enthusiasm among farmers to join cooperatives and actively
participate in their affairs and businesses. The study also reveals that member size of such strong
cooperatives is on the rise. Despite the various supportive measures taken by the current
government, its interventionist policy (towards cooperatives and institutional service providers)
appears to have some adverse effects on the performance of the cooperatives. The fact that the
study suggests persistence of some sort of government interference in cooperatives internal
affairs point to the need to limit government’s intervention to a facilitative and promoting role

252
rather than dictating cooperatives’ organisation and operations. More importantly, many (e.g.
Emana, 2009; Benson, 2013; Gessese, 2010) maintain that making cooperatives competent and
vibrant development actors requires presence of competent and committed professional
cooperative promoters.
On the other hand, despite their important role in marketing members’ outputs, some unions tend
to monopolise and un-proportionally enjoy the lion’s share of the returns and benefits generated
from cooperatives’ coffee business. If primary cooperatives are to actively and enthusiastically
participate in unions’ coffee business, it is thus crucial for unions to operate in a fair and
transparent manner, effectively support primary cooperatives and provide a reasonable share of
the benefits. In general, the recent cooperative restructuring and reform efforts seem to play an
important role in boosting farmers’ confidence in cooperatives and their management. Likewise,
primary cooperatives need to operate in a transparent manner and demonstrate clearer benefits if
they are to generate interest in and attract many farmers. More importantly, if their performance,
efficiency and the quality of their services are to substantially improve, cooperatives need to
move away from committee-based management to full time professional management. In line
with this view, Ortmann and King (2007a) noted that poor management and leadership was one
of the critical reasons for cooperatives’ failure in South Africa.
7.2.4. Suitability of cooperatives as intermediaries for bank loans
In agreement with the views in previous studies, the finding of the current study largely suggests
that coffee or multipurpose cooperatives (MPCs) are not ideally suitable to serve as
intermediaries for bank loans. For instance, a World Bank study (1994) concludes that
multipurpose cooperatives in many countries have generally not been successful in providing
savings and credit services. Previous experiences in Ethiopia similarly reveal that such credit
service provision by some primary cooperatives was not successful. According to Chanyalew
(2015) this traditional practice of credit provision by MPCs has continued by some to the present
time due to failure to strictly observe the existing regulatory acts that leave credit services to
specialised cooperatives such as (RU)SACCOs and other financial institutions. This is also partly
related to the low capital base and capacity problem of RUSACCOs. Chanyalew further states
that such financial service by MPCs is done haphazardly and the delivery focuses on periodical

253
problem solving. In contrary, experiences from the Philippines (Briones, 2009) shows that
cooperatives can serve as conduits of credit funds to individual members.
Given the current gaps in the rural financial markets of Ethiopia, carefully chosen and strong
cooperatives with committed management can temporarily serve as intermediaries to channel
bank loans to their loyal members. In particular, there is a critical need for providing cherry
advance to cooperative members early in the season or during the months preceding the harvest
season to address their emergency (cash) needs. Such intervention would help to avoid stripping
and sale of immature cherries as well as to counter the undesirable practices of informal money
lenders and illegal coffee traders. One of the attractive features in using primary cooperatives as
intermediaries for bank loans is possibly their wider presence on the ground, close interaction
with and knowledge member farmers. However, engagement of multipurpose cooperatives in
such responsibilities should be taken as a short-term solution. Given the current gaps in the
capacities and management of primary cooperatives in the country, a few might be able to
effectively play a role in such financial service provision. The study also suggests that this duty
can be more effectively undertaken in collaboration and under the supervision of parent unions.
Parallel to these efforts, farmers need to be educated and sensitised on proper utilisation and
repayment of such loans. Likewise, prior to their involvement in such tasks, cooperatives’
capacity (organisational and financial management) needs to be properly built as well as
effective system needs to be put in place for loan delivery, monitoring and recovery.
However, in the long-run, attention should be paid to promoting expansion and strengthening37
of specialised cooperatives (SACCOs) or MFIs if such services are to be effectively and
sustainably delivered to farmers. In agreement with this, Chanyalew (2015) argues that credit
provision cannot and should not continue as the function of multipurpose cooperatives. He warns
that when there is a critical need to involve multipurpose cooperatives in the agricultural finance
service provision, such undertakings should be anchored on best international practices. He goes
on to stress that such temporary responsibility should not be considered as a substitute to the role
of MFIs and RUSSACOs.
37
As of now, as many (e.g. Chanyalew, 2015) note that RUSSACOs financial products and services are currently
very limited and lack diversity, thus could not meet the demands of farmers and cooperatives.

254
7.2.5. Challenges and constraints of cooperatives as related to coffee
Unsurprisingly, the findings show that the problems and constraints facing coffee cooperatives,
like other actors in the coffee sector, are diverse and stem both from internal and external factors.
Most of the constraints and challenges identified by the current study are, to a larger extent, in
line with what had been highlighted in past studies (such as Wolday, 2009a,b; Emana, 2009;
ATA, 2012; Gessese, 2010; Chanyalew, 2015). This shows persistence of those problems and the
need to intervene if their cycle has to be altered. The internal problems (such as weak financial,
institutional, governance, technical and business capacities) appear to be severe bottlenecks and
the sources of most of the other problems. The importance attached to the different problems and
constraints tend to focus on the segment of the value chain where that particular stakeholder
operates. Understandably, while the cooperatives management emphasised the external
challenges such as lack of access to loan, market and necessary infrastructure as the main
constraining factors, the rest of the stakeholder groups attributed most of the problems to internal
limitations of the cooperatives. Thus interventions that aim at tackling problems faced by
cooperatives need to integrate strategies and activities that would systematically address these
diverse and multifaceted problems/bottlenecks across the entire value chain. More importantly, if
they have to keep pace with the rapidly changing political, economic and business environments,
cooperatives need to enhance their innovativeness, dynamism and adaptive capacity. Ortmann
and King (2007a) suggest that the rapidly changing environment, reflected in increasing
globalisation, technological changes and agricultural industrialisation particularly necessitates
substantial structural changes among agricultural cooperatives.
7.3. Credit for agriculture and coffee
7.3.1 Are agriculture and coffee priority areas for bank lending?
Concurring with previous studies (such as Admasu and Paul, 2010; Admassie, 2004; Chanyalew,
2015), the current study suggests that access to institutional loans is very limited when it comes
to cooperatives and those engaged in agriculture (production) activities. As compared with other
economic sectors, agriculture is claiming a tiny proportion of the loan portfolio of most

255
commercial banks. In discussing the fact that agriculture has been denied adequate support in
terms of access to finance, Chanyalew (2015: 22; 23; 145) comments that:
“A complete neglect of the main engine of the agriculture-led industrialisation
transformation process is prevalent in Ethiopia. The credit system in the country does not
provide a comprehensive national system of competitive agricultural credit to farmers.
Most of the benefits gained from the growth of the agriculture sector have been diverted
to the promotion of service, industry, energy and telecommunications sectors. Ethiopia’s
agriculture sector gets less than 2% of the capital goods imported as of late 2000s
(CAADP, 2009), thus the sector is deprived of modernisation and continued to be
exploited to generate revenues from labour- and land-intensive production undertakings
to make the other sectors grow”.
In general, the study suggests that banks do not seem to treat agriculture, primary cooperatives
and smallholder farmers as priority sectors. While the focus of the state banks (CBE and DBE)
has recently shifted to financing major government development projects, selected priority
private investments and export promotion, private commercial banks highly focus on export-
oriented activities in an attempt to generate foreign currencies. The fact that the service sector
tends to be more liquid with high turn-over as well as involves some saving deposits seems to
favour lending to this sector, which comes second in terms of lending preference amongst banks.
In the Ethiopian context, institutional loans for coffee are mainly provided to unions (who are
involved in coffee export), private coffee suppliers and exporters, and to a certain extent to large
scale commercial producers. Interestingly, even the government commercial bank focuses on
large scale commercial farmers and coffee traders (suppliers in channeling loan finance). This
finding is in agreement with previous studies (e.g. Wolday, 2010; World Bank, 2015) which
report that larger and well-established borrowers, estates, wealthier individuals and traders are
more likely to access institutional finance with better terms and conditions than small-scale
farmers operating in the production end. In discussing similar scenario in South Africa, Ortmann
and King (2007b) pointed out that commercial banks were reluctant to provide credit to
smallholders due to the high risks associated with lending to them, which include insufficient or
lack of collateral, poor financial records and high transaction costs associated with such small
lending activities. As regards the coffee sector, a World Bank study (2015) notes that the levels
of creditworthiness are influenced by the nature of the coffee business in that access to loan
increases as coffee moves up the supply chain, which enjoys more value, profit, and income.
256
In fact adoption of the market-led economic policy in the early 1990s by the Ethiopian
government resulted in greater changes in the organisation and operation of the financial sector,
which among others, resulted in the emergence and rapid expansion of private financial
institutions. Nevertheless, though the current government has adopted a free market economic
policy, it did not want to fully open up all economic sectors to the market forces, and has
particularly maintained pervasive intervention in the financial sector. Some of the regulations
(such as the National Bank’s bond directives) and other state intervention appear to influence
banks’ lending policies, abilities and motivation. ATA (2012), based on the works of Wolday
and Peck (2010), reported that despite the substantial progresses recorded in recent years, many
rural financial institutions in Ethiopia have insufficient capital, reach and capacity to provide
agricultural cooperatives with the type and level of services they need. At present unions are
almost the sole providers of loan fund to primary cooperatives in the study areas. In other words,
they act as intermediaries for bank loans as they have better facilities and market linkage that
boost confidences of the lending banks. However, unions provide small amount of loans of short-
term duration, which often reaches cooperatives late in the season. In addition, those
cooperatives which are not affiliated to unions cannot access such loans. Moreover, some of the
unions appear to struggle in obtaining institutional loans due to their weak business performance
and institutional capacity. As a result, some of the new unions were obliged to retain the profits
generated from previous coffee trade and to use for coffee purchase and finance other operations
(instead of distributing as dividends to member cooperatives). This has obvious implications for
members’ confidence, motivation and participation in their cooperatives.
Lack of access to loan finance seems to emanate both from limitations related to the borrower
cooperatives and constraints facing the lending banks. Lack of collateral, poor financial records
and system, lack of credit history, lack of awareness (whom to approach and how to apply for
loans), weak business and management capacity and failure to repay loans in the past are among
the prominent constraints on the part of the cooperatives. High perceived risk level of the
agriculture and coffee sector, lengthy and complicated bank requirements and processes, lack of
alternative lending institutions in rural areas, lack of loan products with the right choice, and
liquidity problem are among the limiting factors on the parts of the lending banks. These are in
addition to the challenges posed by policy and regulatory frameworks. Bank officers tend to

257
largely attribute the problem to the shortcomings on the cooperatives’ side, while understandably
cooperatives and their promoters mainly attribute the shortfalls to the lending banks and their
financial products/services. Thus interventions aiming at improving farmer cooperatives’ access
to loan fund need to target addressing both supply and demand (borrower) side constraints.
Despite their thin presence in rural areas and heavy focus on urban-based clients, banks remain
to be the main and preferred sources of loan for agriculture and coffee. In particular, CBO
appears to be a preferred source of loan for cooperatives in the Oromia region since it is a more
coops-friendly bank. Despite their potential to serve as good source of loan for farmers and
cooperatives in the future, at present most RUSACCOs seem to be at their infant stages with
weak financial and managerial capacities. ATA (2012) similarly comments that as of now the
ability of SACCOs and MFIs to serve the needs of agricultural cooperatives is limited. ATA goes
on to note that though there were 7,233 SACCOs in the country in 2012, they were able to
provide less than one percent of the country’s total financing. It is thus decisive to strengthen the
capital base, as well as the managerial and financial capacities of SACCOs. Likewise, MFIs do
not serve farmer cooperatives as they primarily target (grouped) individuals, as well as provide
loan products that do not meet the needs of cooperatives dealing with cash crops such as coffee,
which requires substantial amount of money. The other severe constraint of MFIs is their limited
financial capacity and tendency to focus on urban-based borrowers. Provision of revolving fund
or cash-based loan guarantee can help MFIs to relax the liquidity constraints facing them. In
general, the study suggests that diverse sources and providers of finance should compete and
serve the rural population as these would enhance efficiency and help to overcome monopoly.
7.4. Demand for institutional credit and factors influencing demand among coffee
farmers’ cooperatives with emphasis on demand side constraints
The first part of this section provides discussions on the study cooperatives’ institutional and
socio-economic characteristics and is largely based on the baseline information that was obtained
at the end of 2012 and beginning of 2013. The latter section focuses discussions on cooperatives’
demand for institutional credit and factors influencing their demand with emphasis on demand-
side constraints.

258
7.4.1. Institutional, business and socio-economic features of cooperatives
7.4.1.1. Profile of the study cooperatives
The cooperatives included in the study were drawn from selected districts of eight zones of
Oromia and SNNP regions that have been involved in the credit guarantee scheme under
analysis. However, this does not mean that all the selected districts typically represent the major
coffee producing areas. Some of the districts targeted by the scheme under analysis are marginal
coffee producers. This implies that some of the findings such as loan demand may not
necessarily represent the situation of all the cooperatives located in other major coffee producing
zones like Jimma and Sidama. Though the mean age of the study cooperatives is about 13 years,
some were as old as 43 years, which may have implications for their credit history and
experience in coffee business. Some (e.g. Zapata, 2006) argue that the length of the firms’
existence affects the lender’s rationing behaviors. As many (e.g. Wolday, 2008a; 2009a) note,
some of the older cooperatives that existed during the previous socialist regime had bad
experience with loan funds. This points to the need to adequately raise awareness and build the
capacity of such cooperatives prior to loan disbursement. In fact reorganisation of the
cooperatives that were established under the socialist system claimed substantial efforts in
promoting and revitalising cooperatives during the early years of the current government.
However, the majority of the interviewed cooperatives were formed over the past two decades,
out of which over one-third were formed just between 2003 and 2005. This is not surprising as
the recent fairly conducive policy environment has provided a fertile ground for the emergence
of several forms of cooperatives. This could be largely attributed to the issuance of a law (in
2002) that provided legal foundation for the creation of the cooperative promotion commission.
Previous study (Bernard et al, 2013) similarly reveals that majority of the agricultural or
multipurpose cooperatives were established or re-established over the past 20 years after the
regime change, out of which about 66% were established after the promulgation of the new
proclamation for the promotion of cooperatives in 1998.
The mean member size for the current study cooperatives (579 farmers) is slightly lower than
what was reported in the findings of previous study (Bernard et al, 2013), which reported that the
average number of members of the agricultural cooperatives in Ethiopia was 672 during the year

259
2012. The fact that cooperatives in the SNNP region had a larger number of members than their
counterparts in the Oromia region may need further investigation to establish the reason. In terms
of their gender composition, the number of female cooperative members is very low, which
reflects that female farmers were generally less likely to be members of cooperatives. Though
the current cooperative law allows both the wife and the husband to join cooperatives, the
longstanding tradition and perception that considers the husband as representative of the
household still acts as a major hindrance to women’s participation. Moreover, as the study
cooperatives are commodity-based, it is not surprising to witness the dominance of men, who
traditionally exercise control over cash crops. Thus there is a need to step up efforts that aim at
encouraging and supporting female farmers’ participation in cooperative societies.
Age and educational status of the people managing cooperatives are among the variables
expected to influence cooperatives’ management and the performance of their businesses. Mpuga
(2010) suggests that the young may tend to save and/or borrow more for investment while the
old may be less inclined to borrow. In the current study, the vast majority of the cooperatives’
chairpersons were found in the middle age group (32 to 50 years) which appears to be ideally
productive and active in pursuing alternative business avenues as well as in terms of gaining
sufficient management experience. As regards the role of education, several studies (e.g. Ajagbe
et al, 2012; Mpuga, 2010; Zapata, 2006) report that education positively affects entrepreneur’s
decision to apply for a credit, the amount applied for and the chances of accessing it. While the
vast majority of the chairpersons or managers of the study cooperatives attended some sort of
formal education, surprisingly, 18% have no education or attended only informal education. This
clearly demonstrates the fact that most cooperatives were being managed by non-professionals,
with obvious implications for their institutional and resource management and overall business
performance. In fact the vast majority of the study cooperatives were being managed by part time
management committees. This thus calls for interventions that promote engagement of
professionals in cooperatives’ management and measures to modernise their systems. In this
regard, the fact that more cooperatives from the Oromia region appeared to have professional
managers than their counterparts in the SNNP region may reflect presence of cooperatives with a
relatively stronger institutional capacity and coffee business activity in the former region.

260
On the other hand, the fact that most of the study cooperatives were lacking a professional
person with formal education in accounting would inevitably compromise the quality and
soundness of their financial management, record keeping and reliability of their financial
documents. This in turn will have adverse effects on the successes of cooperatives’ loan
application and proper utilisation and management of received loans. In general, primary
cooperatives employ a few permanent workers, if at all, who are mainly non-professionals (such
as casual security guards) with limited direct professional contribution to cooperatives’ business
operation and management. Thus wherever their financial status permits them, cooperatives need
to be encouraged to engage a properly trained professional personnel.
7.4.1.2. Type of cooperatives and their main business activities
With respect to the sector of primary occupation and main business activities, though the vast
majority were registered as multipurpose co-operatives, most of the study cooperatives were
engaged in diverse activities including marketing of various agricultural products (such as coffee
and grain trade) and allied business activities (such as input supply and other business
undertakings). This could be possibly attributed to (a) risk aversion tendency, and/or (b) a bid to
deal with members’ diverse products, and an attempt to provide multiple services to members.
On the other hand, more cooperatives in the SNNP region tend to specialise in coffee
(particularly those in Kaffa zone) than the ones sampled from Oromia. Nevertheless, though
most of the cooperatives in Oromia are named multipurpose, almost all of those located in coffee
producing areas are predominantly engaged in coffee business. On the other hand, the fact that
some of the study cooperatives were new and have limited experience in coffee business
necessitates further capacity building and support on coffee processing and trade, financial
literacy and good governance, among other issues.
7.4.1.3. Cooperatives’ asset/capital ownership
The surveyed cooperatives exhibited considerable variations in terms of capital ownership. Most
cooperatives had small amount of cash in bank, as well as own limited fixed assets. Surprisingly,
we came across a cooperative with an asset of no book value, and a cooperative without any
fixed asset apart from one weighing scale. A study conducted by ATA (2012) similarly reveals
that an average multipurpose cooperative in Ethiopia has only about 100,000 Birr capital of its

261
own. This clearly demonstrates the fact that a substantial number of cooperatives have poor
capacity in terms of resource ownership. This has implications in accessing loan as banks may
lack confidence in cooperatives with assets of poor quality and/or value. On the other hand, the
fact that majority of the study cooperatives did not have any outstanding liability obviously
suggests cooperatives’ weak participation in borrowing.
7.4.1.4. Cooperatives’ income, expenditure and financial management
The fact that some of the cooperatives were not obtaining income from coffee trade was not
surprising as some of them were not participating in coffee business during some years for
various reasons. Though the volume of income generated by cooperatives, on average, showed a
rising trend over years (between 2010 and 2012), understandably, fluctuations were observed in
the volume of income generated by individual cooperative across years. This demonstrates
prevalence of substantial variations in cooperatives’ institutional capacity, business activities and
coffee production. On the other hand, the fact that over two-thirds of the study cooperatives
obtained income from non-coffee activities during the survey year shows their involvement in
multiple business activities and services though the magnitude of their transactions and volume
of income are quite limited. Thus interventions that aim at improving cooperatives’ access to
institutional loans need to take into account this multiple activities, their diverse cash demand
and inflows.
On the other hand, the fact that most of the study cooperatives were incurring very limited
expenditures (which are mainly related to operational costs such as coffee trade and input
supply) reflects their weak operations and business activities. On the other hand, though the vast
majority of cooperatives reported that their accounts are regularly audited, official reports and
existing studies show that most cooperatives in Ethiopia do not have access to regular audit
services for their accounts. For instance, Benson (2013) reported that the financial records of
only 40% of cooperatives in Ethiopia are audited each year. Likewise, FCA (2012) report reveals
that the Federal Cooperative Agency had planned to provide audit service to 24,183 primary
cooperatives during the year 2011/2012. However, they were able to reach out only to 6,478
primary cooperatives in nine months (July 2011 to March 2012). Apparently this has serious
implications for the transparency of their operations, financial system and distribution of

262
surpluses to members in the form of dividend. Lack of audited financial records also affects
cooperatives’ access to loan finance as lending banks, among other documents, ask for recent
audit reports.
7.4.1.5. Distance from institutional service providers
Distance to service providers such as banks, extension office, market centres and so forth
apparently affects access to different services such as credit, information, market, new
technologies, etc. The fact that the majority of the study cooperatives are located far away from
the local bank branch offices could possibly affect their interaction and relationship with lenders;
access to information (e.g. about borrowers and lending requirements) and efforts in monitoring
and supervising loan utilisation. On the other hand the fact the cooperatives located in the
Oromia region appeared to be relatively closer to bank branches could be related to the presence
of CBO branch offices in various parts of Oromia. In contrary, majority of the study
cooperatives, regardless of their regional location, have better access to all-weather roads. This
shows that most of the cooperatives do not face major difficulties in transporting and marketing
their products. However, most of them were located far away from the district office, which
could inevitably affect their access to information, new technologies and technical support from
experts. The study revealed that though there are some limitations in the quality of the services,
study cooperatives have close interactions with frontline cooperative extension workers. Such
close interaction can be directly attributed to the presence of extension agents in village or
cooperative centre. The study also shows that the surveyed cooperatives have limited access to
coffee hulling and washing stations. This leaves the cooperatives with the mere option of selling
their coffee in the form of fresh or sun-dried cherry (jenfel). Lack of hulling facility is also one of
the contributory factors to traditional coffee hulling process (merbush preparation).
The fact that the vast majority of the study cooperatives were members of unions shows that
most of the primary cooperatives in cash crop growing areas are members of some form of
secondary level cooperative structures. The fact that more cooperatives from the Oromia region
were members of some kind of union was not surprising as the union in this particular region
seems to be stronger than those operating in the vicinity of the study cooperatives in the SNNP
region. As regards supports provided, the overwhelming majority of the cooperatives reported

263
that loan supply is the major service they receive (alongside some other supports) from their
respective unions. This suggests that unions need to strengthen provision of other services that
would enhance the capacities and benefits of member cooperatives and farmers.
7.4.1.6. Cooperatives’ past experience with credit services
7.4.1.6.1. Cooperatives’ loan access
While a small proportion of the study cooperatives reported receiving some sort of loan
particularly during the year 2010 and 2012, there have been fluctuations across years, which
could be related to changes in coffee yield, market price and other internal and external factors.
Interestingly, the fact that the percentage of cooperatives that applied for loan (during 2010 to
2012) was lower than those of who actually received loans largely implies that most of the loans
were coming from the unions which do not require cooperatives to undergo normal loan
application process. In fact very few cooperatives reported directly receiving loans from banks,
while MFIs and RUSACCOs were not serving the cooperatives at all, which could be attributed
to their weak financial capacity and unsuitability of their loan products for cooperatives’
business (especially in terms of loan size and duration). Previous studies (e.g. ATA, 2012)
similarly observed that MFIs are not well-positioned to extend loan service to cooperatives. This
calls for the need to promote interventions that improve direct access (of primary cooperatives)
to bank loans. These could include enhancing cooperatives’ capacity as well as creating
facilitative and enabling regulatory environment for the lending financial institutions.
In terms of volume of loans obtained, some of the cooperatives received a loan amount of as
small as 20,000 and 50,000 Birr which is too meager to undertake meaningful coffee processing
and trade activities. The vast majority of the cooperatives, unsurprisingly, indicated that the
amount of loans they had received was not adequate for the intended purposes. This shows the
presence of substantial gaps between credit demand and supply; i.e. cooperatives were indeed
experiencing severe credit rationing. The fact that a significantly larger number of cooperatives
from Oromia were able to access loans than those located in the SNNP region could be due to the
presence of CBO as well as operations of relatively stronger cooperatives and unions in the
Oromia region.

264
On the other hand, the fact that more than half of the interviewed cooperatives reported that their
loan applications have never been turned down in the past may imply that some of them simply
never applied for bank loans. In particular, very few cooperatives were aware of why their loan
request was not favoured in the past. This points to the critical need for timely provision of such
feedbacks (by the lending banks) if cooperatives have to properly understand the limitations and
work towards addressing these gaps in their future loan application.
7.4.1.6.2. Length of loan duration, loan processing time and collateral requirement
Following the transition from the centrally planned economic system to the free market
economy, coupled with the adoption of SAP measures, in Ethiopia cooperatives were made to act
on their own. Those cheap and targeted loans were removed, forcing cooperatives to look for
loan finance based on their merits, including their institutional and business capacity and
creditworthiness. Like any other private business entity cooperatives were expected to meet all
the lending requirements of commercial banks, which many primary cooperatives often fail to
meet. One of the major challenges of cooperatives is lack of access to loans of long-term
duration. The maturity period of the loans obtained by most of the cooperatives during the period
2010 to 2012 was less than one year, which obviously does not allow them to undertake long-
term investment activities. This shows the prevailing gaps in terms of medium- or long-term loan
supply to cooperatives. Previous studies (e.g. Emana, 2009; Admasu and Paul, 2010) similarly
note that the Government backed loans for farmers are often meant for short-term purposes such
as for acquisition of fertilizers. In discussing the experiences of developing countries, Freedman
(2004: 3) comments that without longer repayment period for loans, it is not possible to commit
finance for investments in new equipment or technology. Freedman claims that by reducing
lender’s perceived level of risk for new types of loans, a partial loan guarantee may help to
improve the terms and conditions of guaranteed loans. This may include provision of loans with
longer maturity period which allow borrowers to make investments in equipment, technology or
infrastructure that enhance their productivity and the quality of their produce.
Length of loan processing time is another critical aspect in accessing and putting loans to proper
use. The length of loan processing time among most cooperatives was found to be too long,

265
(where some were taking up to six months). Those cooperatives which reported enjoying shorter
loan processing time seem to refer to loans obtained from their unions, which often requires
shorter process time than the ones directly obtained from banks. This is due to the fact that
unions often obtain loans from commercial banks and pass over certain amount to member
primary cooperatives without putting in formal application for such loans. However, a number of
conditions are attached to loans supplied by unions. For instance, it is a common practice for
unions to instruct primary cooperatives to purchase coffee (at fixed prices, in the form and time
needed by the union) and deliver to them. Such a practice seems to make primary cooperatives
mere market agents that purchase coffee and channel to their unions. Undoubtedly, this creates
persisting sense of dependence among primary cooperatives, and thus needs to be altered through
continuous sensitisation and capacity building activities.
In terms of interest rate, long-term loan for such sectors as agriculture usually attracts higher
rate, while export sector enjoys the lowest rate. It was surprising to find that even the state banks
charge slightly higher rate on loans for agriculture. As regards collateral requirement, though
there is flexibility (based on borrower type, nature of the project/business, collateral type and
other factors), obviously primary cooperatives are not favoured on the basis of these criteria.
Loan security appears to be relatively easier with cooperative unions and exporters, who have
better facilities and sales contract that can be pledged as collateral. Most primary cooperatives
lack fixed assets of acceptable quality and value to pledge as collateral, nor equity contributions
required by the lending banks. Thus collateral requirement seems to be a serious impediment to
farmer cooperatives in accessing loans from most private banks. In addition, cooperatives are
required to meet various other lending requirements, which most of them struggle to fulfill. It is
thus important to treat cooperatives differently and relax banks’ lending requirements and criteria
since cooperatives serve the wider community, and operate with unique mission and objectives.
7.4.2. Cooperatives’ Demand for Institutional Credit and its Determinants
7.4.2.1. Discussion of the qualitative and descriptive findings on cooperatives’ loan demand
All aspects of coffee business (production, processing and trade) require substantial amount of
capital. In general, external loans remain to be the sole source of finance for the vast majority of
266
primary cooperatives for funding their operations such as collecting, processing and selling
members’ coffee. This is due to the fact that most primary cooperatives have very limited capital
of their own. Chanyalew (2015) notes that the amount of finance generated from members is
very negligible to support the business operations of cooperatives. A study conducted by ATA
(2012) reveals that an average multipurpose cooperative in Ethiopia has only about 100,000 Birr
capital of its own. As a result, they need to revert to external financing to fund their operations,
to provide marketing and other services to members as well as to invest in necessary
infrastructural facilities. In particular, the emergence of a large number of new primary
cooperatives and unions in recent years has resulted in increasing demand for external finance.
Nevertheless, the study suggests that many cooperatives were not coming forward to apply for
bank loan for various reasons. Limitations in the cooperatives’ institutional and managerial
capacity and other internal and external factors may prevent them from effectively demanding
for institutional loans. In particular, such hesitation in asking for bank loans may largely emanate
from the perception that they may not meet banks’ lending requirements or lack of awareness
about possibilities of borrowing from banks. They may even doubt their ability to properly
manage, effectively utilise and repay the loans. However, the vast majority of the study
cooperatives revealed having potential demand for institutional loan. Contrary to the general
belief that loan demand is predominantly (if not solely) depressed by supply side constraints, the
current study reveals that limitations in the capacity of borrower cooperatives, poor economic
and business activities, weak market integration and poor coffee production also prevent
cooperatives from seeking for loans. This points to the need for multifaceted support
interventions if such gaps are to be effectively addressed and the availed guaranteed loans are to
be taken up and utilised by cooperatives as expected.
7.4.2.1.1. Amount of credit demanded by cooperatives
There have been variations between cooperatives’ actual and potential loan demands, whereby
the volume of potential demand (indicated by cooperatives) appears to be higher than the actual
amount they had applied for. Given the cash requirements of coffee business, in fact the actual
volume of loan cooperatives applied for seems to be on the lower side. As highlighted above, this
variation possibly points to the presence of inhibiting factors that stop cooperatives from

267
effectively applying for bank loans or from asking for a larger volume. It is also important to
note that the volume of loan demand expressed by the cooperatives included in the current study
may not fully represent the demands of some of the well-established and strong coffee
cooperatives with vast coffee processing and marketing activities in other parts of the country
such Jimma and Sidama zones. Obviously, such cooperatives would need a relatively larger
volume of loan to finance their operations, business and investment activities.
In addition, there seems to exist substantial variations in terms of volume of loan demanded
among cooperatives located in different regions and zones, which could be attributed to
differences in their institutional and managerial capacity, level of supports provided by the
promoting body, cooperatives’ experience in coffee trade and potential for coffee production.
The amount of loan applied for by the surveyed cooperatives showed a rising trend over years,
with some fluctuations among cooperatives and across years. The fact that some cooperatives did
not express demand for loans during a particular season does not mean that they do not need loan
at all. Most of these cooperatives may have poor coffee yield during that particular season, or
have been constrained by the factors outlined above.
7.4.2.1.2. Purpose for which loan is demanded
Cooperatives have various financial requirements in terms of volume, duration and purpose for
which loan is needed, which include non-coffee activities as well. However, most banks tend to
believe that cooperatives just require working capital for seasonal fresh or dry cherry purchase.
The critical need for long-term loans for acquiring processing facilities and short-term crop
advance to member farmers is often undermined. In fact lack of access to long-term investment
capital appears to be a severe constraint and was considered by many as a lost opportunity in
terms of realising better growth and development. The design of such a credit guarantee scheme
thus needs to take into account these diverse needs for loan products as well as should be able to
motivate lending banks to cater for such financial needs.
The fact that, surprisingly, a larger proportion of the cooperatives indicated requiring loans for
trading dry cherry alone or together with some amount of fresh cherries indicates that they
predominantly purchase and sell coffee without undertaking meaningful value adding activities.

268
Such low demand for long-term loans for processing facilities and other investment activities
could also be largely attributed to the nature of the loan products commonly provided by parent
unions or commercial banks, which are often short-term loans. This could also be related to
cooperatives’ weak capacity in strategically planning to undertake long-term investment
activities. This calls for interventions that would enhance cooperatives’ awareness and capacity
to add value to the products they trade at least through primary processing activities, time and
place of marketing. Encouraging and supporting them in acquiring and using necessary
processing facilities for which they need long-term loans is one of the critical intervention areas.
Though the majority of the study cooperatives showed preference to obtain loan between
September and December (which is a peak coffee harvest season), some of them wanted to
receive latter after January. This implies that the latter group needs the loans for traditional trade
activities (such as dry cherry purchase and sale) that do not add value to their coffee. This is one
of the areas that need interventions to encourage and support cooperatives to apply for and obtain
loans early in the season. In terms of loan repayment schedule, the majority preferred annual
repayment schedule at the end of harvest season. Interventions in the financial market targeting
farmer cooperatives thus need to take these varying needs in terms of length of loan duration and
repayment schedule.
7.4.2.2. Econometric Analysis
This section discusses the findings of the econometric analysis on cooperatives’ loan demand
and its determinants; i.e. both decision to borrow and volume of loan demanded. As outlined in
the conceptual framework, various explanatory variables were identified to capture cooperatives’
institutional, managerial and business attributes that may influence their loan demand.
7.5.2.2.1. Factors affecting cooperatives’ credit demand
As outlined in the analytical framework, two approaches were employed to capture cooperatives’
actual and potential loan demands; which were denoted as loan-A demand and loan-B demand,
respectively. Overall, some of the findings of the current study on factors influencing
cooperatives’ loan demand are consistent with the theoretical framework and existing empirical
studies, while others were not in agreement with the results of previous studies. Such

269
inconsistencies could be largely attributed to the fact that existing studies focused on households’
and SMEs’ loan demand, whose nature, activities and needs are not identical with that of famers’
cooperatives.
Among others, interestingly, the positive and significant influence of the outstanding liability on
the probability of demanding for loan-A could be explained by the fact that cooperatives with
higher amount of liabilities may seek additional loan to settle their outstanding balance that may
approach maturity dates. It is also logical to assume that cooperatives with higher liability might
be short of own cash to finance their operations; thus may be obliged to seek additional external
finance. Likewise, the significant and positive influence of the amount of total capital on the
probability of demanding for loan-A was not surprising. This implies that as the value of total
capital increases, cooperatives are more likely to seek and/or successfully access institutional
loans. This is logically expected as well-established cooperatives with valuable assets are more
likely to win lenders’ confidence and/or to provide collateral and access bank loans. Moreover,
such cooperatives are more likely to further expand their business activities which may require
additional external financing. This finding, at least in the current context, disproves the argument
that firms with large amount of capital at their disposal may show low demand for bank loans as
they might be able to partly self-finance their activities. The finding is however in agreement
with the results of some previous studies (e.g. Zapata, 2006; Mpuga, 2010; Aga and Reilly,
2011) which reported that firms with better asset endowment are more likely to seek and/or
secure loans from formal financial institutions.
Similarly, the fact that cooperatives that were managed by persons with formal education were
more likely to demand loans (than those led by illiterate person or only with informal education)
was not surprising. Because cooperatives that have managers with higher educational status are
more likely to undertake sound businesses as well as may prepare viable business plans that can
convince lending institutions. Previous studies (e.g. Ajagbe et al, 2012; Mpuga, 2010; Zapata,
2006) similarly reported that education positively affects entrepreneur’s decision to apply for
credit, the amount applied for and the chances of accessing it. On the other hand, the positive
influence of being located in the Oromia region on the probability of demanding for loans could
be explained by the strength of the cooperative marketing system (through the Oromia union),
the widespread presence of the Cooperative Bank of Oromia, and the presence of some relatively

270
stronger cooperatives in the region (among the study cooperatives). For instance, among those
included in the current analysis, cooperatives with professional managers were only found in the
Oromia region. Aga and Reilly (2011) also reported presence of substantial differences in
accessing loans among micro- and small enterprises located in different regions of Ethiopia,
whereby firms located in Oromia had better access. The current result corroborates the findings
of Barslund and Tarp (2008) who similarly found huge regional differences in the demand for
credit in Vietnam. This considerable regional difference in terms of credit demand suggests the
need for strengthening access to alternative market outlets and promoting lessons and experience
sharing between cooperatives in the two regions. Age of cooperatives was found to significantly
and negatively affect probability of demanding for bank loan-A. This can possibly suggest the
fact that the newly formed cooperatives are short of resources and in dire need of external loans
to finance their operations.
Surprisingly, a number of the hypothesised variables were not found to significantly affect the
likelihood that cooperatives seek bank loan-A. Among these, the insignificance of the influence
of having a professional manager could be attributed to the fact that a few cooperatives actually
had full-time hired professional manager. In addition, most of the cooperative managers or
chairpersons are in a fairly productive age group, which might have contributed to the lack of
significant effect on the probability of demanding bank loan. Similarly, lack of a statistically
significant association between previous cases of default and the decision to demand loans could
be attributed to the fact that generally a few cooperatives reported defaulting on previous loans.
Likewise, the fact that the vast majority of the study cooperatives are members of unions appears
to undermine the influence of such membership in demanding for loans. These results call for
further investigation by taking larger sample size, with more cooperatives that have not been
affiliated to any union. Again, the insignificance of the effects of the distance from the local
banks could be possibly explained by the fact that majority of the rural-based farmer
cooperatives are located far away from urban based lending banks. On the other hand, lack of a
statistically significant relationship between sector of primary engagement and loan demand
could be due to the fact that nearly all of the study cooperatives were engaged in coffee trade
alone or in combination with other business activities. Lack of a significant association between
member size and the probability of demanding a loan may not be taken as a surprising outcome.

271
Because logically member size can determine the level of business activities of a cooperative and
correspondingly volume of their loan demand. Nevertheless, though the volume of loan required
by the study cooperatives has shown a huge variation, most of them showed low actual demand
(in terms of applying) for bank loans.
On the other hand, a few variables were found to significantly affect the volume of loan-A
demanded by cooperatives. Among these, the positive and significant influence of both member
size and affiliation to a cooperative union on the volume of loan-A demanded by cooperatives
was already expected. This is an indication of the presence of backward and forward linkages
with members (who supply their produce to cooperatives) and output markets for their products
through their unions. Access to members’ produce and alternative market outlets may reflect the
level of their business activities and a corresponding need for financial resources to support these
operations. This is in line with the findings of previous studies (e.g. Aga and Reilly, 2011) which
reported that membership to a business or social organisation enhances demand for and/or access
to institutional loans. This underscores the importance of providing support to cooperatives in
mobilising and promoting members’ participation as well as in facilitating their up-ward
integration with higher level cooperative structures. Absence of a statistically significant
influence among the remaining variables on the volume of loan-A demand could possibly reflect
the fact that majority of the surveyed cooperatives did not have huge variations in terms of the
volume of loan they applied for in 2011. However, in particular, absence of a statistically
significant relationship between sector of primary engagement and amount of loan demanded
needs further investigation with a larger number of cooperatives and data collected over years as
coffee production and prices fluctuate across seasons.
Among the variables included in the analysis of cooperatives’ potential (loan-B) demand,
understandably age of the cooperative manager or chairperson significantly and negatively
influences probability of demanding for loan-B. This is consistent with existing literature and
empirical findings which claim that farmers become skeptical and reserved as age progresses,
while the younger ones are more open to innovation, to take risk and start new business or
expand existing ones, which may require additional finance. Another interesting finding is the
statistically significant, but negative association observed between the probability of demanding
272
for loan-B and both being located in the Oromia region and educational level of the cooperative
manager or chairperson. The aforementioned finding of loan-A demand analysis, however,
revealed a positive relationship between being located in Oromia and the probability of
demanding for loan. As observations and discussions with key informants reveal the inverse
relation between the two variables could probably be related to the poor coffee yields in most
districts of Oromia (such as West Wellega) during the 2012 coffee season. Moreover, among the
interviewed cooperatives, it was observed that those located in the Oromia region appear to have
better experience in coffee business. Thus they could be probably more rational and realistic in
applying for bank loans by seriously considering prospects of coffee yield, level of their business
activity, its real financial requirement and market projection. This may call for further
investigation to examine cooperatives’ loan demand across seasons to account for variations in
coffee production and market price. Contrary to its effect on probability of demanding for loan-
A, the results of model-B indicate that those cooperatives with less educated chairperson were
more likely to demand for loan-B. The reluctance of the more educated chairpersons/managers in
demanding for loan-B could be attributed to their ability to articulate, analyse and carefully plan
by looking into costs, risks, and potential benefits. Because this set of loan demand tends to
reflect an ambition and desire to get bank loans and may not be necessarily grounded on sound
analysis and decisions.
As regards factors influencing amount of loan-B demanded by cooperatives, four variables were
found to significantly and positively affect the amount of loan demand. Total capital again
significantly and positively influences cooperative’s loan-B demand as well. As discussed in the
above section (under loan-A demand), the presence of a positive association between total capital
and amount of loan demanded was not surprising. Previous studies (e.g. Zapata, 2006) also
confirm that size of assets has a direct relationship with the amount demanded and volume of
loan allocated by lending institutions. The significant effect of total expenditure on amount of
loan demanded could probably be due to the fact that higher expenditure might be a reflection of
an increase in the magnitude of business activities, which necessitates additional external
funding. It could also be probably related to the need to make further investment in business
expansions and infrastructural facilities. Discussions held with cooperatives and personal
observations by the current researcher reveal that those cooperatives with little or no business

273
activities were indeed incurring very negligible expenses. Similar to its effect on amount of loan-
A demand, member size was found to positively and significantly relate to volume of loan-B
demanded by cooperatives. Again, as discussed in the above section (under loan-A demand), the
reasons for the positive impact of member size on the amount of loan demanded are obvious.
This clearly shows the importance of raising the number of cooperatives’ members and the need
for promoting their active participation in cooperatives’ businesses and decisions. More
interestingly, contrary to its effects on the probability of demanding for loan-B, cooperatives in
the Oromia region appear to demand for larger volume (of loan-B) than their counterparts in the
SNNP region. In other words, whenever they decide to apply for a loan, cooperatives in the
Oromia region tend to ask for a larger volume. The positive association between the two
variables could be attributed to the fact that cooperatives in the Oromia region have better coffee
business activities and strong linkage with the Oromia union, which is one of the pioneer and
strongest unions in the country. This could also be related to the presence of CBO in the region,
which is a more coops-friendly bank. This underscores the importance of having such
cooperative banks in other regions of Ethiopia.
Overall, different sets of variables appear to influence cooperatives’ actual and potential demand
for loan. One of the limitations in the first approach is that it fails to capture the demands of self-
constrained cooperatives and thus tends to underestimate cooperatives’ demand for loans. In
contrary, the second approach encounters the risk of reflecting desire of cooperatives in
obtaining loans which might not be immediately transformed to actual or revealed demand.
However, carrying out such separate exercises using both approaches could help to pin point to
potential demands that could be transformed to revealed demand with additional support
measures that would help cooperatives to overcome the barriers that prevent them from
effectively demanding and utilising loans.

274
7.5. Influence of a credit guarantee on institutional (bank) credit supply to coffee
farmers’ cooperatives
7.5.1. Role and contribution of a credit guarantee in stimulating bank lending
The vast majority of the study cooperatives are in dire need of loan finance as coffee business
(production, processing and marketing activities and facilities) require substantial amount of
capital. This has shown a steady growth in recent years with the emergence of new cooperatives,
improvements in the capacity of existing cooperatives, an increase in their coffee business
activities and due to the rising coffee price. On the other hand, it is increasingly becoming
difficult, especially for the new primary cooperatives to get access to bank loans. Among other
things, this is due to lack of credit history and fixed assets of required quality and value to pledge
as collateral. In line with this, past studies (Wolday, 2009a, b; Emana, 2009) similarly noted the
fact that such challenges were acting as a barrier in accessing loans. However, though provision
of a partial loan guarantee is potentially helpful in stimulating bank lending to the cooperative
sector, in reality its role and effectiveness may be limited under the prevailing tight regulatory
environment and financial system. Unlike the case under the neo-liberal economic system where
most credit guarantees trace their roots, the Ethiopian government has sustained heavy
intervention in the economy in general and in the financial market in particular, which have
greater implications in influencing banks’ lending behavior and practices. Because lack of
collateral or loan security may not be the sole or major barrier to cooperatives in accessing loans
under a financial market operating in such environments. Restrictive regulatory framework,
limitations in the capacity of the lending banks, presence of other priority areas for bank lending
and unfavourable perception towards the cooperative sector are also among the constraining
factors in this regards.
In particular, presence of huge demand for loans among various urban-based borrowers seems to
depress banks’ lending appetite towards rural-based farmers’ cooperatives. Studies carried out
elsewhere (e.g. Hansen, 2012) also reveal that banks showed reservation in viewing credit
guarantees as a single most important instrument in addressing credit constraints. Banks may
show interest in such guarantee schemes especially in a bid to promote strategic partnership and
to get access to other incentive packages. Though its outreach is limited the scheme under

275
analysis somehow played a role in encouraging the partner bank to explore possibility of lending
to new cooperatives and to test their creditworthiness. However, provision of the partial
guarantee had little impact in making banks flexible in terms of easing their lending procedures
and processes. Borrowing cooperatives still have to fulfill all the robust conventional lending
requirements, which have prevented many cooperatives from accessing guaranteed loans.
7.5.2. Scheme design and operation: Is it attractive enough to the lending banks?
For a guarantee scheme to be effective and impactful, banks have to be willing and interested to
participate in the guaranteed lending activities. Analysts (e.g. Tunahan and Dizkiric, 2012;
Hansen et al, 2012; Levitsky, 1997) underscore the need for securing such willingness and
interest among the lending banks (to actively participate) if such guarantee programmes have to
be successful. However, as indicated above, given the current financial and banking situations in
Ethiopia, the majority of the commercial banks doubted the ability of such a partial credit
guarantee to effectively attract them and leverage substantial loan fund. This is partly related to
limitations in some of the scheme’s design and operational features. Almost all banks did not
seem to be solely attracted in the partial guarantee itself, which provides 50% risk sharing. All
private banks, apart from CBO, would expect cooperatives to provide collateral to cover the
remaining 50% risk, a requirement that is evidently not easy for most cooperatives to meet. This
aspect thus reveals limitations of the scheme in effectively helping such borrower groups, which
are less attractive to banks.
Thus given the current situation of farmer cooperatives financial market in Ethiopia, risk sharing
coverage under such an arrangement has to be increased (to about 70 or 80%), at least during the
initial stage of scheme implementation to boost bank’s confidence and interest. This can be
revised and reduced during subsequent years of scheme operation once the banks have
established good relationship with the borrower cooperatives. However, in raising the risk
coverage, care should be taken as such high coverage may result in moral hazard among the two
parties – creditors and borrowers. Many (e.g. Saadani et al, 2010) suggest that the risk coverage
needs to provide sufficient protection against risks of default, while it also reserves incentives to
motivate banks to undertake proper screening, monitoring of borrowers and loan recovery
efforts. There might also be a need for some sort of intervention from the government if such

276
arrangements have to be widely accepted among the lending banks. This could include devising
policies that impose some sort of quota on commercial banks to channel certain proportion of
their loan portfolio to the targeted sector (such as farmer cooperatives or smallholder coffee).
Moreover, though provision of such a paper guarantee is taken as a normal practice across the
globe, given the current limited financial capacity of private banks in Ethiopia, such guarantee
arrangement may not be attractive enough to most banks. This implies that provision of a cash
guarantee whereby funds are deposited in the accounts of the participating bank can play an
important role in motivating the lenders. More importantly, such an arrangement can help at least
to partly address the prevailing liquidity problem among many (private) banks.
On the other hand, given the limited financial supply in the banking system and massive loan
demand among various borrowers in Ethiopia, banks seem to be reluctant to pay guarantee fees.
Thus charging various fees will inevitably act as a disincentive for banks in widely lending to
farmers’ cooperatives. Though both lenders and borrowers benefit from the presence of a loan
guarantee and are logically expected to pay risk fees, international experiences demonstrate that
lenders end up directly or indirectly transferring the fees to the borrowers. This would make the
guaranteed loans more expensive to borrowers, which may discourage them from aggressively
coming forward to seek for such loans. Evidences emerging from the current scheme also show
that the participating bank (CBO) appears to be reluctant in paying annual guarantee fees. For
example, CBO was not notifying the guarantee administrator about the status of the lending
activities which possibly reflects lack of interest to pay annual risk fee. In fact CBO did not pay
any guarantee fee over the three years of lending. This has obvious implications for the validity
of the guarantee and can eventually lead to refusal of claims payment in the events of default.
Moreover, banks prefer to pay such fees on the basis of the actual disbursed loan amount and not
on the total guarantee fund. From the outset it is important for such an arrangement to develop
mutual understanding and consent among the two parties on the level and nature of the guarantee
fees. The fact that the lending bank has started to increase supply of unguaranteed loans to the
targeted cooperatives (through their unions) implies bank’s tendency to avoid such commitment
(payment of guarantee fees). In describing similar experience, Saadani et al (2010) note that fees
can play an important role in enhancing additionality. This is due to the fact that when fees are

277
on the higher side, banks may start shifting to granting loans to good clients without any
guarantee. Thus such practices of increasing non-guaranteed lending could be regarded as a
positive, but indirect, effect of the scheme. The above discussion generally points to the need to
integrate various complementary incentive packages for the participating banks and the
importance of removing components that may act as disincentives to them.
7.5.3. Utilisation of the loan guarantee and outreach of the scheme
Utilisation of the guarantee fund by the commercial banks is one of the essential aspects under
such a loan guarantee arrangement. Existing literature suggest that selecting the right partner
bank is one of the crucial aspects in the operation of such a scheme. Tunahan and Dizkiric (2012)
note that one of the chief problems of the guarantee schemes created in developing countries is to
convince the commercial banks to participate in the programmer’s operations and risk sharing. In
this regard, only one commercial bank was found to be willing and interested in participating in
the current partial guarantee scheme with 50% risk sharing. Hansen et al (2012) note that bank’s
commitment to utilising the guarantee must emanate from a strategic alignment of interest that
leads to genuine engagement at various levels of the bank. Otherwise, banks may initially show
interest to participate in the scheme to eventually end up losing interest and become unwilling to
actively participate when actual operation has commenced. Levitsky (1997) suggests that
involving many banks in such a guarantee arrangement enhances the financial and economic
impacts of a loan guarantee scheme. However, though participation of several banks may play an
important role in stimulating competitive behaviour, dealing with different lending banks would
inevitably pose administrative challenges. Moreover, spreading such small guarantee fund across
a number of banks may not make much economic sense to the users of the fund.
Analysis of the current credit guarantee suggests that the intervention has somehow contributed
to bank’s enhanced lending to the targeted group. Cooperatives that were previously excluded
from the formal credit market were somewhat able to directly access bank loans. The fact that
the cooperatives selected to participate in the current scheme more aggressively moved forward
in applying for bank loans as compared with the non-participants shows the potential role of such
an intervention in opening up cooperatives’ eyes and appetite for such institutional loan.
Unsurprisingly, the latter group had to heavily rely on their unions in getting access to loans,

278
while the majority of the former group was able to establish direct contact with commercial
banks. In addition, the fact that loan applications submitted by scheme participant cooperatives
had better chance of success in getting acceptance than those of the non-participants as well as
when compared with their situation before the intervention demonstrates the importance of such
an intervention in helping cooperatives to meet banks’ lending requirements. One of the positive
indirect contributions of the current intervention is that it had alerted unions38
and triggered sense
of concern, which led to increased union loan allocation to the primary cooperatives targeted by
the current scheme. Consequently, during the subsequent years, scheme participant cooperatives
were able to receive substantial amount of loan fund from their parent unions.
However, the outreach of the guarantee scheme both in terms of the number of cooperatives
targeted by the scheme and those that were actually reached by the guaranteed loans was limited.
One of the possible constraining factors was that most of the branch offices of the participating
bank appeared to be reluctant in widely reaching out even to cooperatives with viable business
plan and complete business application, while some tended to deliberately delay loan approval
and disbursement of particularly cooperatives that had never borrowed before. In fact such
interventions in the financial markets are normally intended to improve loan access of previously
credit constrained such groups. Prevalence of such reluctance among the participating banks in
schemes operating in other countries was also reported in studies carried out in different
countries (e.g. Hansen et al, 2012; Tunahan and Dizkiric, 2012). For instance, a study undertaken
by Hansen et al (2012) in four countries in Africa similarly noted that even after banks have
invested time and resources in signing a guarantee agreement, a significant number failed to
exceed 60% utilisation of the guarantee fund. Similar scenario has happened under the current
scheme where 61% of the total guarantee fund was disbursed to the beneficiary cooperatives. In
38
Unions have started to intervene by providing unusually high amount of loan (a record high loan fund of up to 2.1
million Birr to individual coops) to those targeted by the guarantee scheme. This appears to be the indirect influence
of the intervention. Possible reasons include: (1) Fear of loss of control over the cooperatives participating in the
scheme; (2) The improved access to loan and capacity building activities provided by the scheme somehow made
cooperatives attractive to unions in terms of improved technical capacity, processing facilities acquired and volume
and quality of coffee produced/processed. This sort of intervention and loan provision by unions has two
implications: (a) It has a positive implication in that it reveals unions’ confidence and interest in the scheme –
participant coops, and demonstrates scheme’s role in leveraging loan funds from other sources. (b) However, coops
may become reluctant to repay their previous guaranteed loans when they receive new (union) loans without fully
settling their outstanding bank loan. This may affect coops’ relation with the bank. In addition, the increase in union
loans is likely to be at the expense of weak cooperatives, which cannot access bank loans.

279
fact cumbersome lending requirements, lengthy approval process and late disbursement of the
guaranteed loans had partly contributed to such gaps in terms of accessing and utilising
guaranteed loans. The constraints on the supply side could be at least partly mitigated by
integrating effective complementary incentive packages for the lending banks. In addition,
constraints related to the regulatory framework and monetary environment and liquidity problem
among the lending banks seem to continue hindering (particulalry private) banks’ outreach to
such target groups.
The success of cooperatives’ loan applications in getting acceptance among the lending banks
showed fluctuation over the three years of lending. It had substantially increased during the
second year of lending and declined during the third year. Logically, limited achievement during
the first year is not surprising as the lenders and borrowers were just starting to get to know each
other. Moreover, most cooperatives were not fully conversant with the banks’ lending procedures
and requirements. The decline during the third year could be attributed to a number of factors:
(1) unions intervention with increased loan allocation, and bank’s tendency to prefer channeling
non-guaranteed loan via unions; (2) banks’ reluctance to make repeated lending to some of the
beneficiary cooperatives (may be due to unsatisfactory achievement in loan repayment among
some coops); (3) poor coffee yield or market price during the year; (4) some of the cooperatives
had negotiated with the bank and extended the maturity dates of the previously received loans
rather than going for settling it and applying for fresh loans. In most cases, this was done on a
mutual consent between the lender and the borrowers.
In terms of volume of guaranteed loans, there were shortfalls when one compares the amount
applied for with the actual volume of guaranteed loans disbursed to the beneficiary cooperatives.
The average guaranteed loan size (1.32 million Birr) granted to individual beneficiary
cooperatives over the three years of lending is substantial as compared to the small loan volume
(200,000 to 500,000 Birr) most primary cooperatives were often receiving from their unions. The
amount of loans extended under the scheme is however on the lower side as compared with the
volume of loans applied for, which shows prevalence of credit (volume) rationing. This may
partly be related to the weak institutional and business capacities of the targeted cooperatives. Of
course, limitations among the lending banks in terms of availability of loanable funds could be
280
another contributory factor. On the other hand, given the capacity and current state of the
business activities of the study cooperatives, the volume of loans requested by some of them
appears to be unrealistically high. In addition, owing to their poor capacity, some of the study
cooperatives struggled to fully utilise the approved guaranteed loans. Previous studies (e.g.
Chanyalew, 2015; Emana, 2009) also reported the fact that in Ethiopia cooperatives often do not
operate with proper and strategic planning, especially in acquiring and utilising loan fund. This
underscores the need for intensive support and capacity building activities to enable cooperatives
develop sound business plan, as well as to ensure proper utilisation of the acquired loans. Parallel
to such efforts, there is a critical need for interventions that boost motivation and lending
capacity of the participating banks. Hansen et al (2012) suggest that enabling business
environments both for the participating cooperatives and the lending banks are indispensable for
such schemes to be successful.
7.5.4. Loan fund leverage ratio
One of the significance of such a guarantee scheme is its role in leveraging substantial amount of
loan fund with limited volume of guarantee fund. According to Levitsky (1997), a well
performing guarantee fund can possibly attain a leverage level of five times the fund (5:1) after
five years of operation. Deelen and Molenaar (2004) similarly note that after three years of
operation, a guarantee scheme should attain a leverage of 2:1 or 3:1 and after five years, this
should reach 5:1. The leverage ratio39
attained under the current guarantee scheme is below 1:1
only for the bank loan, and slightly over 1:1 when loans obtained through the unions are
included. This is obviously small when compared with the internationally recommended ratio of
at least 2:1 or 3:1 in three years of operation for such a partial guarantee scheme. This shows that
provision of the current guarantee had limited impact in terms of mobilising substantial amount
of loanable bank fund. Deelen and Molenaar (2004) argue that a guarantee fund that provides a
level of leverage less than 1:1 can be considered as failing in its mission. They however go on to
note that it is normal for guarantee schemes to attain low leverage rates during their early stages.
Levitsky (1997) similarly notes that growth in leverage takes time as trust and confidence has to
be developed between the three parties involved in the scheme – guarantors, lenders and
borrowers. Therefore, we expect some improvement in the level of leverage during the
39
LR was obtained by dividing the amount of guaranteed loans extended under the scheme by its capital

281
remaining final year of the guarantee scheme under analysis. Moreover, as indicated above, the
fact that unions have started showing greater interest in lending to the cooperatives targeted by
the current scheme can be taken as an encouraging step in this respect. More importantly, given
the prevailing situation of the targeted cooperatives (most of whom are weak and marginal) and
the tight regulatory and financial system in the country, the leverage ratio attained under the
current guarantee scheme should not be considered as a complete failure. If the scheme was
implemented in areas with huge coffee potential and stronger cooperatives, obviously the
achievements in terms of bank lending activities could have been different.
7.5.5. Salient design and operational features and drawbacks of the scheme
The findings show that despite some drawbacks, the scheme under analysis has a number of
commendable design and operational features. Most of these design and operational features are
in line with international practices and experiences.
7.5.5.1. What can be considered as strong or effective design and operational features?
One of the strongest aspects of the scheme under analysis is that most of the vital scheme design
features, terms and conditions were clearly spelt out in the guarantee contract or agreement.
Given the location of the guarantor (who is remotely located in Europe) and considering other
scenarios, the portfolio approach adopted by the scheme can be considered as the right choice.
The lending activities rely on the bank’s existing loan screening and approval processes. As
many (e.g. Beck et al, 2010; Navajas, 2001) note, this makes it less demanding in terms of time,
labour and operational costs for the guarantor of the fund. Moreover, use of bank’s existing
lending procedures, requirements and expertise would help to carry out proper screening and to
minimise problems of moral hazard. Existing studies (e.g. Hansen et al, 2012) suggest that the
portfolio model is more flexible and a better approach in that it can increase the number and
volume of guaranteed loans extended to targeted borrowers. In addition, the fact that the
guarantee fund is resident in the Rabo Bank account has avoided the need to create separate
administrative structure which has direct implication in reducing overhead and operational costs.
Based on the experience from Nigeria, Mafimisebi et al (2010) recommends that whenever
possible, existing structures should be used to run the CGS rather than setting up a new structure
to administer it.

282
The ceiling for the maximum amount of the individual guaranteed loan is in line with the
demand of most of the study cooperatives. Thus it can be adopted by future schemes that target
similar group/sector though periodic revision of such a loan ceiling is necessary. More
importantly, follow ups of utilisation of disbursed loans and their repayment have been carried
out by a number of parties such as PEA, PIA, Coops Promotion Agency and the lending bank.
These combined efforts somehow contributed to the effectiveness of the loan utilisation (in terms
of putting to the right use) and its recovery. Another key strength is the capacity building
component embedded in the scheme both for the lending bank and borrower cooperatives. Apart
from its role in building capacities of the two parties, such intervention would serve as additional
incentive for the participating bank. The critical role of embedding such complementary services
for the participating banks was also underscored by previous studies (e.g. Saldana, 2000; Deelen
& Molenaar, 2004). On the other hand, involvement of the Cooperative Bank of Oromia, which
is a more coops-friendly bank with expertise and some experience in lending to such a group, is
one of the commendable decisions in the arrangement of the current scheme.
7.5.5.2. What were the shortcomings of the design features and operations of the scheme?
One of the shortcomings of the scheme operations is limitation among the partner bank in
passing on information about the guarantee arrangements to its branch offices (which was signed
at higher level with the head quarter). As a result, branch managers and loan officers appeared to
lack adequate awareness and sufficient information on the procedures and arrangement of the
guarantee, which have affected implementation and effectiveness of the scheme. The high
rejection rate of cooperatives’ applications for guaranteed loans, especially during the first year
of lending can be largely attributed to lack of sufficient awareness among branch officers.
Likewise, though it was set out in the agreement that the lending bank periodically informs the
guarantee administrator of all new guaranteed loans, the status of such loan portfolio and any
defaults, there has been apparent gap in reporting and sharing such information with the party
that administers the guarantee. This has obvious implications for the payment of fees and claims
settlement in the event of default. International experiences suggest that if the risk fee is not paid
for the disbursed loan, that particular guarantee is automatically considered invalid. Surprisingly,
the lending bank itself (especially at the head office level) does not seem to have complete and

283
accurate records of all the loans disbursed under the scheme. This has obvious implications for
follow up and monitoring activities and loan recovery and claims on default.
One of the important limitations of the scheme components was that the level of risk coverage
appears to be on the lower side at least at the initial stage. This is in view of the prevailing high
risk perception of banks (towards farmer cooperatives and their businesses), and the stiff
competition exerted from other borrowers with more lucrative businesses. In particular, with the
mainstream commercial banks such 50% risk sharing does not seem to practically work. Many
scholars (e.g. Deelen and Molenaar, 2004; Levitsky, 1997) emphasise the importance of risk
coverage level and fees in influencing lending banks’ motivation as related to loan disbursement
and recovery. Reliance of the scheme on a single bank for the guaranteed lending was another
important gap as it has resulted in lack of alternative sources when this particular bank showed
reluctance to lend to the targeted cooperatives as anticipated. International experiences (e.g.
Tunahan and Dizkirici, 2012; Deelen and Molenaar, 2004) suggest that participation of more
than one competent banks may provide alternatives as well as induce some sort of competition
among the lending banks. Another notable gap was that the scheme lacks mechanisms that would
help address liquidity problems among the lending bank. Under the current financial market in
Ethiopia, shortage of loanable fund among some of the private banks is a critical challenge.
Under such a situation, it would be useful to include some sort of liquidity boosting mechanism
for the lending bank. Previous studies (e.g. Meyer and Nagarajan, 1996) suggest that since such
lending activity requires capital, credit guarantees may fail to generate sufficient additionality
due to lack of adequate loanable fund among the participating banks.
If borrowers have to be successful in their business and effectively repay their loans, they need to
be strongly supported in linking up with better and reliable market outlets for their products. In
this regard, the current scheme operation had limitations in creating market linkage for the
targeted cooperatives. Such an intervention needs intensive awareness raising and capacity
building prior to any effective lending activity. In addition, for such interventions to create a
stronger relationship between the lending institutions and the borrowers as well as to generate
meaningful economic impacts, it has to operate fairly for a longer period of time. In this regard,
the duration (life span) of the current scheme was found to be very short for such a target group.

284
International experiences (e.g. Levitsky, 1997) show that the most successful schemes across the
world take 5 to 10 years to develop effective collaborative relationships between the guarantor
and lenders. Another obvious gap is that though it was stated in the scheme agreement that the
local (lending) bank will undertake monitoring of utilisation of the disbursed guaranteed loans, in
reality it had limited involvement in this regard. In addition, diversion of short-term working
capital loans to finance long-term investment by some cooperatives led to some delays in loan
repayment. This reflects lack of sufficient follow up and supervision by the lending bank and the
cooperatives promoting body. In addition, this also implies lack of access to long-term loans,
which calls for further efforts in terms of boosting supply of such loans. More importantly, after
operating for some time changes and adaptations are needed in such guarantee scheme based on
the experiences gained and challenges encountered. Many scholars (e.g. Deelen and Molenaar,
2004; Levitsky, 1997) underscore the need to periodically review and adapt scheme’s design and
operational features. However, the targets and eligibility criteria being considered under the
current scheme have not seen changes and adaptations over time since its inception.
7.5.6. What can be proposed for future guarantee schemes?
Based on the above anaylsis and discussions, the following adaptations and/or new dimension
can be proposed for a guarantee scheme targeting such a group under the Ethiopian context and
possibly in some other developing counties with similar contexts.
Table 7.1: Proposed adaptations and additions to the structure, design and operational
features of a guarantee scheme targeting farmer cooperatives in Ethiopia.
Design and
operational
features
Features (and limitations) of
the current guarantee
scheme
Proposed adaptation or revised features for
future schemes targeting farmer coops in
Ethiopia
Funding Funded by CFC (donor
agency) and Rabo Bank
(private sector)
Involve various actors (Donors, government,
private sector, NGOs) in funding the scheme;
gradually shift majority of the funding to the
private sector
Fund
administration
Netherlands based Rabo Bank Identify international or suitable local
institution; look into possibility of depositing
some fund in the account of the lending bank to
improve their liquidity
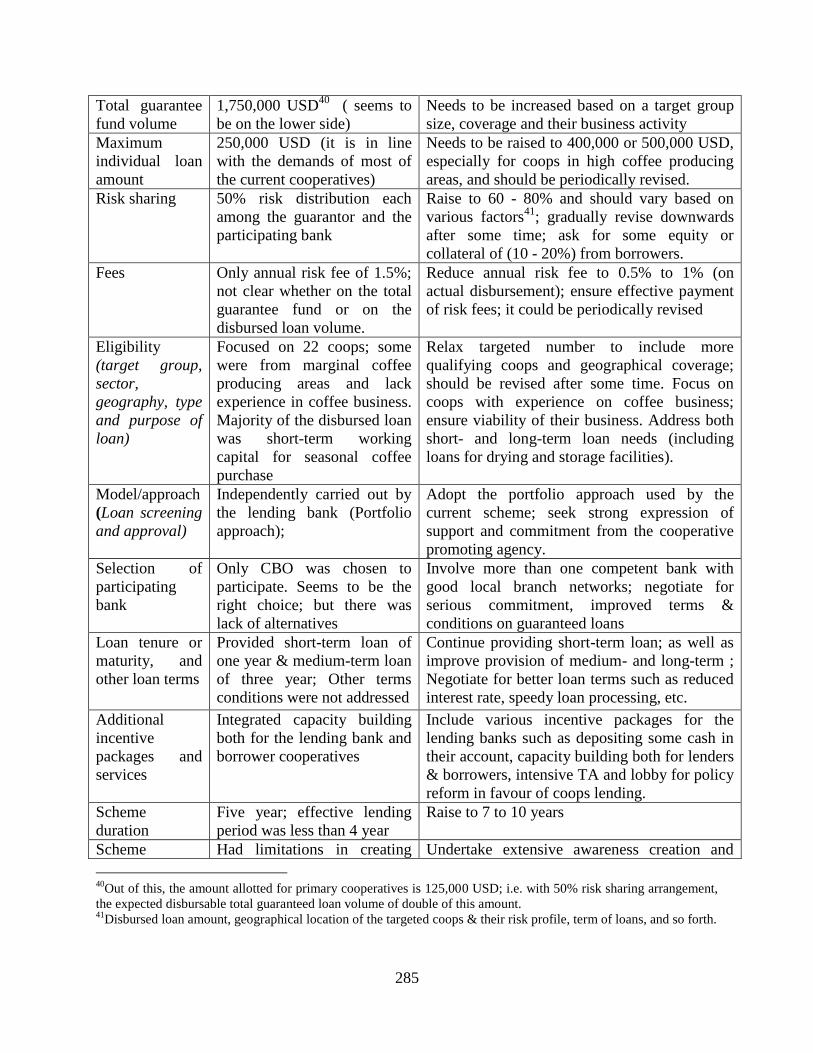
285
Total guarantee
fund volume
1,750,000 USD40
( seems to
be on the lower side)
Needs to be increased based on a target group
size, coverage and their business activity
Maximum
individual loan
amount
250,000 USD (it is in line
with the demands of most of
the current cooperatives)
Needs to be raised to 400,000 or 500,000 USD,
especially for coops in high coffee producing
areas, and should be periodically revised.
Risk sharing 50% risk distribution each
among the guarantor and the
participating bank
Raise to 60 - 80% and should vary based on
various factors41
; gradually revise downwards
after some time; ask for some equity or
collateral of (10 - 20%) from borrowers.
Fees Only annual risk fee of 1.5%;
not clear whether on the total
guarantee fund or on the
disbursed loan volume.
Reduce annual risk fee to 0.5% to 1% (on
actual disbursement); ensure effective payment
of risk fees; it could be periodically revised
Eligibility
(target group,
sector,
geography, type
and purpose of
loan)
Focused on 22 coops; some
were from marginal coffee
producing areas and lack
experience in coffee business.
Majority of the disbursed loan
was short-term working
capital for seasonal coffee
purchase
Relax targeted number to include more
qualifying coops and geographical coverage;
should be revised after some time. Focus on
coops with experience on coffee business;
ensure viability of their business. Address both
short- and long-term loan needs (including
loans for drying and storage facilities).
Model/approach
(Loan screening
and approval)
Independently carried out by
the lending bank (Portfolio
approach);
Adopt the portfolio approach used by the
current scheme; seek strong expression of
support and commitment from the cooperative
promoting agency.
Selection of
participating
bank
Only CBO was chosen to
participate. Seems to be the
right choice; but there was
lack of alternatives
Involve more than one competent bank with
good local branch networks; negotiate for
serious commitment, improved terms &
conditions on guaranteed loans
Loan tenure or
maturity, and
other loan terms
Provided short-term loan of
one year & medium-term loan
of three year; Other terms
conditions were not addressed
Continue providing short-term loan; as well as
improve provision of medium- and long-term ;
Negotiate for better loan terms such as reduced
interest rate, speedy loan processing, etc.
Additional
incentive
packages and
services
Integrated capacity building
both for the lending bank and
borrower cooperatives
Include various incentive packages for the
lending banks such as depositing some cash in
their account, capacity building both for lenders
& borrowers, intensive TA and lobby for policy
reform in favour of coops lending.
Scheme
duration
Five year; effective lending
period was less than 4 year
Raise to 7 to 10 years
Scheme Had limitations in creating Undertake extensive awareness creation and
40
Out of this, the amount allotted for primary cooperatives is 125,000 USD; i.e. with 50% risk sharing arrangement,
the expected disbursable total guaranteed loan volume of double of this amount. 41
Disbursed loan amount, geographical location of the targeted coops & their risk profile, term of loans, and so forth.

286
introduction,
and marketing
adequate awareness & clearer
understanding at various
levels and in its marketing
aspects.
publicity at different levels using various
mechanisms - among borrowers & lenders (to
enhance participation) and policy-makers &
other actors (to secure support)
Monitoring,
follow up and
loan recovery
Carried out by PIA, PEA and
CPA, to some extent by the
lending bank as well.
All relevant partners should play active role.
Especially lending bank should play a more
proactive role. Outline clear division of
responsibility.
Reporting and
guarantor-lender
relationship
Gaps in communication and
information sharing between
the lending bank and the
guarantor (fund administrator)
Facilitate regular information sharing among
the lending bank, guarantor, PIA & PEA.
Ensure strong trust, transparency and
commitment between the guarantor and lenders.
Defaults and
claims
procedure
Properly outlined in the
agreement42
The current arrangement and process sound
comprehensive and acceptable. But need to fix
ceiling on claims rate, which may not exceed
about 10 - 20% of the total fund, i.e. should not
deplete all the guarantee fund.
Source: Author’s analysis and proposal
42
A loss shall be any amount of the qualifying disbursed loan that the CBO was not able to collect including
principal, interest (up to a maximum of 1 year interest). Loss shall be deemed to occur being 180 calendar days after
default date. Rabo shall share 50% of risk of loss with CBO, provided always that the maximum amount
reimbursable in respect of the cumulative losses shall not exceed USD 1,250,000. In the event of loan loss, CBO
shall inform Rabo of such loss & claim for reimbursement of the corresponding risk participation. Rabo shall
transfer to CBO the claimed amount within 15 business days of receipt of the loss notice & a written confirmation
from the PEA.
287
7.6. Additionalities obtained under the current guarantee scheme
In this section the discussion focuses on different dimensions of additionality that have been
attained in relation to the credit guarantee scheme under analysis. It particularly explores the
financial additionality and other related benefits such as preliminary outcomes in terms of
economic additionality and intervening factors.
7.6.1. What does the financial additionality attained tell us?
7.6.1.1. Additional loans obtained by the beneficiary cooperatives
Despite some challenges and constraints, the guarantee scheme under assessment has made some
positive contributions in improving credit allocations to cooperatives that had never had direct
access to bank loan before. Scheme participant cooperatives have shown better access to bank
loan after participating in the scheme, whereby the majority of the loans accessed by the targeted
cooperatives was additional finance which would have not occurred in the absence of the
guarantee scheme. The relatively high level of loan additionality attained under the current
scheme (about 87%) shows the fact that in the past borrower cooperatives were severely (bank)
credit constrained. Levitsky (1997) suggests that additionality of at least 60% should be the
minimum acceptable target for justifying operation of a credit guarantee scheme. Thus the fact
that the loan additionality attained under the current scheme exceeds this rate can be taken as a
remarkable achievement. The fact that scheme participant cooperatives obtained significantly
higher volume of loans than their non-participant counterparts suggests that, though the outreach
is limited, the scheme indeed has played an important role in increasing loan additionality among
the (few) scheme participant cooperatives. The improvements achieved in accessing bank loan
among the beneficiary cooperatives can be largely attributed to the credit guarantee and the
associated capacity building activities provided by the scheme (in terms of technical skills,
management and processing facilities).
While majority of the scheme participant cooperatives obtained loans from diverse sources (both
banks and unions), the non-participant cooperatives were solely relying on unions. Such
improvements among the participant cooperatives in accessing loans from different sources can
288
be largely attributed to the scheme’s intervention. As discussed in the preceding sections,
obtaining loans through unions have implications for cooperatives’ coffee business activities.
Because provision of such loans impose a number of conditions on the borrower cooperatives,
which include selling their coffee to that particular union at a time and price determined by the
union. This practice results in continued dependence of primary cooperatives on the parent
union. In addition, loans obtained from unions are often small in volume and of short-term
nature, which were merely used for seasonal coffee purchase and not for investment in
processing facilities and other infrastructure. Moreover, those cooperatives which are not
member of unions cannot access such loans. Thus boosting primary cooperatives’ direct access
to bank loan has a number of advantages and benefits.
Another interesting finding was that, as highlighted in the preceding sections, the scheme
generated indirect financial additionality by influencing unions to channel large volume of loan
to the primary cooperatives targeted by the current scheme. The number of cooperatives that
received loans from unions and the volume of loans channeled to the cooperatives targeted by
the scheme have shown a steady rise over the life of the scheme. Such increased lending activity
by cooperative unions appears to be motivated by their desire to maintain control over those
cooperatives as well as by the improved capacity and attractiveness of the primary cooperatives
(in terms of improved technical capacity, coffee quality and volume).
7.6.1.2. Improvements in the terms and conditions of loans
Gudger (1998) notes that provision of a credit guarantee can improve the terms of the loan; for
example, by encouraging banks to extend large volume of loan for a longer period. In this regard,
banks were generally reluctant to extend loans of longer maturity to primary cooperatives43
.
Experiences with the current scheme demonstrate that in the absence of long-term loans,
cooperatives tend to divert short-term working capital loan to long-term investment activities,
which as D’Ignazio and Menon (2013) note eventually affects their loan repayment capacity. The
current scheme somehow played a role in introducing medium-term loans (of up to three years)
among a few cooperatives. This has promoted investment in processing (e.g. wet mills) and
storage facilities among those cooperatives. Such improved access to loans of a relatively longer
43
Banks tend to consider such loans as very risky in the absence of collateral of sufficient value and quality

289
period for the scheme participant cooperatives is one of the areas where the scheme, to a certain
extent, positively contributed. However, this needs to be further encouraged and promoted as
currently a few cooperatives have enjoyed such privileges. Apart from improving coffee quality,
acquisition of such processing facilities would go a long way in building cooperatives’ asset base
which can be taken as collateral by the lending banks. Nevertheless, short-term loan of one year
duration has dominated the lending activities under the current scheme both in terms of number
of loans granted and total volume of loans provided. This underlines the need for negotiating
with and motivating the participating banks to increase medium- and long-term loan supply to
the targeted cooperatives.
The longer loan duration noticed among the scheme participant cooperatives during the first year
of lending (2012) than the subsequent years (2013 and 2014) could be attributed to the fact that
some of the beneficiary cooperatives obtained medium-term loans during the early stage of the
scheme. Once they have acquired processing and storage facilities, cooperatives may then
annually require only working capital of short-term duration during the following years. The
demand for medium- or long-term loans would logically decline over years as more and more
cooperatives have acquired necessary processing facilities. However, the pattern of short-term
working capital demand would obviously rise or at least remain stable across years. Therefore,
the design of such a credit guarantee scheme needs to take into account the changing trends of
the demand for the different term loans. Moreover, a scheme with a longer life span is needed if
the targeted cooperatives are to widely benefit from medium- and longer-term loan provisions.
Nevertheless, as other lending terms and conditions are concerned, contrary to the general belief
and views in existing literature (e.g. Gudger, 1998; D’Ignazio and Menon, 2013), the guarantee
scheme under analysis had no or little impacts in terms of easing lending procedures and
requirements. In particular, a speedy loan application process and timeliness of loan release are
critical if cooperatives have to effectively collect members’ coffee within the narrow window of
coffee season. The fact that the guaranteed loans were in most cases disbursed in late November
and December forced most borrower cooperatives to use the loans mainly to purchase dry
cherries. Such delays in receiving loans have had adverse effects on the performance and
profitability of the cooperatives’ businesses.

290
The fact that the mean length of loan processing time for the scheme participant cooperatives
was significantly longer than that of the non-participants was indeed surprising. This could be
explained by the fact that the non-participant cooperatives were receiving short-term loans from
their unions for seasonal coffee purchase. Such small and short-term union loans can be obtained
through informal, less complicated and short communications. However, this does not mean that
union loans reach cooperatives in time. Such loans normally arrive late in the season as borrower
unions (especially the younger ones) often take time in dealing with banks’ requirements and in
acquiring the loans. Loans sourced from unions are also small in amount as they attempt to thinly
distribute to all or most of their member cooperatives. This underscores the need for intensive
negotiations with the partner banks to relax some of their lending requirements if such
guaranteed loans have to be timely accessed and effectively used by the targeted cooperatives.
However, most of these lending requirements are imposed by the National Bank, which leaves
little room for the lending banks to relax them. This requires policy interventions that would
allow cooperatives to be treated differently given the nature of their institution businesses, and
significance for the community.
In terms of collateral requirement, being a cooperative bank, the participating bank under the
current scheme in fact did not require additional collateral apart from the 50% risk sharing
covered by the guarantor. This particular bank rather asked for expression of commitment and
support letter from the cooperatives promoting agency (government body). On the other hand,
the scheme had little or no impact in reducing the lending costs, such as interest rate. This
contrasts the literature on international experiences (e.g. Craig et al, 2007) which claim that
provision of a credit guarantee can lead to reduced lending rates as it minimises the risks of loss
in case of default. This could imply the fact that other critical factors were playing an important
role in constraining bank’s lending activities to the cooperative sector in addition to issues of
loan security. This could be mainly related to the regulatory environment and liquidity problems
among the lending banks.

291
7.6.3. What are the economic additionalities attained under the current scheme?
Apparently attaining substantial economic additionality requires sufficient time in terms of
establishing good relationship with the lending banks, in accessing and making use of the
guaranteed loans. In general, given the infancy of the scheme during the major part of the study,
the size of the guarantee fund and its limited outreach, it is not realistic to expect huge impacts
across a large number of cooperatives and on the wider economy. However, the results of the
preliminary assessments show that there have been some economic benefits at least at the
borrower cooperatives level. This section discusses some of the early indicative impacts of the
scheme in terms of economic additionality and associated benefits.
7.6.3.1. Changes in the commercial and economic activities of participant cooperatives
7.6.3.1.1. Improvements in coffee processing, quality and trade
If cooperatives have to generate meaningful benefits to their members, they need to undertake
some value adding activities to the coffee they collect from member farmers. Value addition at
the primary cooperative level can happen at least in the form of buying fresh cherries and sun-
drying and hulling, or buying fresh cherries and subjecting it to wet processing and selling in the
form of parchment. Undertaking proper primary processing activities would obviously enable
cooperatives to produce coffee of better quality. However, regardless of their participation status
in the scheme, majority of the study primary cooperatives trade their coffee without undertaking
any value adding activities in the form of processing, time and place of marketing. In other
words, the majority were engaged in trading sun-dried cherry, which is not a desirable practice.
This implies that even most of those cooperatives which had access to guaranteed loans tended to
stick to the traditional way of trading sun-dried coffee. Thus further effort is required in creating
necessary awareness, building capacity and encouraging cooperatives to undertake at least basic
primary processing activities to the coffee they collect from member farmers. Of course, access
to finance and processing facility is critical in this respect.
292
However, the fact that scheme participant cooperatives reported annually processing (sun-drying
or washing) larger volume of coffee than that of the non-participants as well as when compared
with the volume they were processing before participating in the scheme could be attributed to
the loan finance and processing facilities acquired through the guaranteed loans. The awareness
creation and capacity building activities accompanied the intervention also appear to play some
role in this regard. In particular, some of the scheme participant cooperatives have started
purchasing fresh cherries and undertaking wet processing activities, which need to be further
promoted and expanded. Such improvements in coffee processing can be directly translated to
better market access and price for the product.
Likewise, the significant increase in the number of cooperatives involved in purchasing dry
cherry and the mean volume of dry coffee purchased by scheme participant cooperatives could
be largely attributed to the improved access to guaranteed loans. Thus this can be considered as
one of the areas where the scheme can claim to positively contribute. However, as discussed in
the above sections, if they have to gain meaningful benefits, cooperatives need to be encouraged
to purchase fresh cherry and add value in the form of wet processing or by undertaking proper
sun-drying activities. In addition, the fact that scheme participant cooperatives did not
demonstrate improvements in terms of using modern raised drying beds suggests that the loans
obtained under the current scheme were used either for purchasing dry cherry or to obtain wet-
processing facilities, and were not invested in improved drying materials. Thus parallel to
encouraging cooperatives to use modern drying beds, it is critical to negotiate with and convince
the lending banks to allocate loans for drying facilities.
Another important gap was that most primary cooperatives did not obtain feedback on the quality
grades of the coffee they traded over the past years. This could be largely attributed to the fact
that some of the unions were mixing coffees collected from different cooperatives, while others
were simply not providing feedback to member cooperatives on the quality of their coffee (at
least among the study cooperatives), This has two major implications: (1) Lack of information on
the shortcomings of their coffee quality makes it difficult for cooperatives to identify and work
towards addressing it, (2) Cooperatives do not seem to receive payments based on the quality of
their coffee. As a result, the current study was not able to assess improvements attained in coffee

293
quality as a result of the intervention. If cooperatives have to understand their limitations and
work towards addressing them, they need to be given timely feedback on the quality grades and
shortcomings of their coffee and associated problems. This calls for the following measures: (1)
Sensitise and encourage unions to provide timely feedback on quality grades of member
cooperatives’ coffee; (2) Encourage unions to pay differential prices based on quality as well as
to avoid mixing coffees collected from different cooperatives; (3) Devise interventions that
would help primary cooperatives to have access to cup quality tasting services locally.
On the other hand, though it is not recommended to store coffee for a prolonged period, retaining
coffee for a few months and looking out for better market opportunities could be one form of
value adding. The fact that most primary cooperatives traditionally buy small quantity and
immediately pass on to their parent unions could be largely attributed to lack of adequate
finance, loan of a relatively longer duration and appropriate storage facilities. Absence of a
significant difference between scheme participant and non-participant cooperatives with respect
to length of coffee storage could be explained by the following reasons: (1) Persisting tendency
among primary cooperatives to stick to the traditional practice of buying and immediately selling
fresh/dry cherry; (2) Lack of proper storage facilities among most primary cooperatives, which
needs further intervention and support; (3) Coffee of scheme participant cooperatives might have
attracted buyers without much delay (this is true especially for cooperatives that had acquired
modern processing facilities).
7.6.3.2. Economic benefits generated by beneficiary cooperatives
Though the scope was limited, gaining direct access to bank finance without the mediation of
unions somehow boosted market bargaining power among some scheme participant
cooperatives. In particular, the fact that scheme participant cooperatives have started producing a
relatively large volume and coffee of better quality has attracted buyers (mainly unions) that
offer better prices. Thus the fact that scheme participant cooperatives generated higher income
from coffee business after participating in the scheme as well as when compared with the non-
participants can be at least partly attributed to the scheme. But such benefit was restricted to a
few cooperatives and such efforts need to be further strengthened and reach out to more
cooperatives.

294
In terms of the benefits gained by member farmers, though some of the scheme participant
cooperatives have recently started giving dividends for the first, it cannot be claimed that the
scheme has made a significant contribution in this regard. In general, a small number of
cooperatives gave out dividends. Such low records in terms of distributing surplus benefits to
member farmers could emanate from three possible reasons: (1) Some cooperatives were not
making any profit; (2) Some cooperatives may have decided to retain and use the surplus for
coffee purchase and finance their operations (this is especially the case when they could not
obtain bank loans); (3) Financial audit has not been carried out which is a precondition in
distributing dividends to members. In particular, there is a time lag between coffee sale and
provision of feedback (by unions) on the profits generated from members’ coffee sale. This has
obvious implication for members’ confidence, motivation and participation, and thus needs to be
rectified in the future.
7.6.4. Improvements in the institutional capacity of beneficiary cooperatives
7.6.4.1. Changes in human resources and management of cooperatives
The fact that scheme participant cooperatives witnessed a significant increase in member size
after participating in the scheme was not surprising as the loans, processing facilities, training
and capacity building activities acquired by the targeted cooperatives are likely to play an
important role in attracting new members. Such an increase in member size is crucial as it
reflects farmers’ interest and confidence in the cooperative societies. Having large member size
is also an important asset for cooperatives as their business heavily relies on the produce
supplied by member farmers. Unlike the case under the socialist regime which was using
coercive measures, currently membership of cooperatives is largely a voluntary decision made
by farmers.
One of the unexpected findings was that the intervention as such did not have significant effects
on cooperatives’ employed human resources. Lack of a significant influence could be explained
by the fact that the intervention has operated for a few years and it might be too early to
significantly build cooperatives’ institutional and business capacities so as to enable them engage
many employees. Based on the findings of the study it can be concluded that all of the study

295
cooperatives, regardless of their participation status, still have poor financial, institutional and
business capacity.
On the other hand, having a professional manager is expected to lead to proper organisational
and business management, innovativeness and enhanced uptake of new technologies. In this
regard, the current study did not find any improvement in terms of having full-time professional
manager both after participating in the scheme, as well as when compared with the non-
participant cooperatives. This shows persistence of committee-based management which reflects
cooperatives’ weak institutional and business capacity. This will thus continue to negatively
impact on cooperatives’ performance. It was also expected that participating in the scheme and
having access to formal loan would increase the number of cooperatives that engage a
professional personnel dealing with their financial accounts. As expected, among the scheme
participants, the number of cooperatives with accountants significantly increased after
participating in the intervention. This could be at least partly attributed to the scheme
intervention. This could possibly imply that having increased access to external loans helped
cooperatives to generate improved income that would allow them to engage a more professional
person to handle their accounts.
7.6.4.2. Effects on members’ participation and confidence
One of the challenges of primary cooperatives is lack of active participation and commitment of
member farmers in their business and key decisions. This problem mainly stems from lack of
transparency in the cooperatives’ operations and weak members’ confidence in their
cooperatives and management. One of the consequences of a weak relationship between
cooperatives and their members is reluctance of farmers in delivering their produce to their
associations. Moreover, commitment of members and confidence in their organisation plays an
important role in allowing cooperatives to collect members’ coffee on loan. This is particularly
important when loans did not arrive on time, which is often the case with many primary
cooperatives. Because of the improved access to loan finance, beneficiary cooperatives under the
current scheme somehow were able to collect larger volume of members’ coffee as well as
acquired valuable assets such as processing facilities. As a result, members’ participation in
supplying their coffee and interest among new farmers has shown some improvement among the

296
scheme beneficiary cooperatives. However, apparently the scale of this intervention is too small
when compared with the total number of cooperatives operating in coffee growing areas.
On the other hand, the fact that the vast majority of both participant and non-participant
cooperatives were collecting members’ coffee with full cash payment upon delivery was not
surprising. This suggests persistence of lack of commitment and confidence of farmers in their
cooperatives, on the one hand, and farmers’ pressing demand for cash early in the season, on the
other hand. In particular, the fact that cooperatives were largely set up and used to promote the
socialist ideology and to execute government’s plans during the previous regime, on the one
hand, and the compulsory membership, misappropriation and embezzlement of cooperatives’
resources by the leaders appointed by the military government, on the other hand, remain in the
memory of many farmers. Though, as some analysts (e.g. Assefa, 2005; Lemma, 2008) noted,
the progresses made under the current government in terms of reorganising and revitalising
cooperatives is a commendable achievement, still intensive and continuous efforts are needed:
(1) to mobilise and fully convince the rural community and effect the desired attitudinal change
about cooperatives, (2) to improve the culture, practices and behaviors of cooperatives (and their
management) with regard to loan utilisation and repayment.
7.6.4.3. Relationships and linkages established with other institutions
One of the prominent contributions of the current guarantee scheme is that it helped scheme
participant cooperatives to properly understand banks’ lending procedures, requirements and
possibility of directly approaching and borrowing from commercial banks. Beneficiary
cooperatives were able to establish links with the lending bank and somehow demonstrated their
creditworthiness. More importantly, the scheme under analysis has enabled primary cooperatives
to gain some sense of independence (such as seeking loans on their own without the mediation of
the union). This has allowed some of the beneficiaries of the guaranteed loans to look for
alternative market channels and timing. However, the role of this intervention in enabling
cooperatives to graduate to non-guaranteed loan remains to be seen in the long-run. On the other
hand, traditionally extension workers tend to view cooperatives as their non-target groups as they
often tend to focus on individual farmers. The current intervention brought together primary
cooperatives, their promoters and coffee extension officers to join force in improving coffee

297
quality. Such strong interaction and collaboration between the two agencies need to be
institutionalised and sustained.
7.6.4.4. Changes in asset accumulation: was there any project additionality?
Most of the study cooperatives generally lack proper office, coffee processing and storage
facilities. As a result of the improved access to bank loans (especially medium-term loans),
scheme participants have gained access to some critical assets such as improved processing and
storage facilities, which they could have not been able to acquire at least in the short run. The
loans obtained under the current scheme was crucial in enabling a few of the borrower
cooperatives to undertake value adding activities such as improved sun-drying of cherry or wet
processing), or to change the scale of their businesses. Some of the cooperatives which were
previously engaged solely in trading sun-dried coffee were able to shift to wet processing.
Likewise, the fact that scheme participant cooperatives appeared to have higher value of assets
and net capital as compared with the non-participants suggests that such intervention has a
potential to improve the capital base of such resource-poor rural people’s organization. The
medium-term loans provided for investment in processing facilities seem to more significantly
contribute to improvements in coffee quality and asset-base of the cooperatives as compared to
the short-term loans provided for seasonal coffee purchase. Nevertheless, the coverage of such
loans has been limited as the bulk of the guaranteed lending activity focused on traditional trade
activities such as loans for seasonal coffee purchase and sale. It is therefore imperative to
enhance access to loans that support new type and innovative businesses, long-term investments
and value adding activities.
7.6.4.5. Benefits generated for the participating bank
The findings suggest that the partner (lending) bank (CBO) has gained some benefits from
participating in the current guarantee scheme, particularly in terms of capacity building and
experience sharing for their branch managers and loan officers. In addition, the intervention
played an important role in terms of helping the partner bank to get to know and start borrowing
to cooperatives in a new region. Based on the experiences gained with the cooperatives that
received guaranteed loans, CBO started expanding its branches to the vicinity of the participating
cooperatives in the SNNP region. Though this expansion could be taken as part of their strategic
298
plan, the speed with which they moved to the new areas could be at least partly attributed to the
experience they gained through working with the scheme-participant cooperatives. The scheme
somehow helped the participating bank to promote and strategically position itself.
7.7. Effect of the credit guarantee scheme on lenders’ and borrowers’ behavior
One of the possible effects of such a guarantee provision is that it may lead to some reluctance
among the lending banks in properly screening loan applicants and in closely following up loan
utilisation and recovery. Some argue that presence of such a guarantee may also encourage
borrowers to deliberately default. In view of possibilities of such incidences, Allinson et al
(2013) notes that the main cost centre for the guarantors in such programmes is meeting the costs
of loan defaults. Tunahan and Dizkiric (2012) emphasise that the rates of loss are crucial for such
a guarantee scheme to survive and to develop positive perception among banks. However, due to
its partial risk sharing nature, moral hazard does not seem to be a serious problem among the
lending banks under the current guarantee scheme. The fact that the lending banks have some
stake in the risk sharing arrangement seems to motivate them to apply prudent practices in the
loan screening and recovery process. Moreover, the prevailing strong regulatory framework
appears to help in minimising possibilities of moral hazard among the lending banks which as
they are expected to follow a number of standard lending procedures and requirements. In
addition, the fact that the National Bank’s regulation compels commercial banks to keep their
non-performing loans portfolio under certain limit (which is 5% under the Ethiopian context)
also seems to play an important role in this regard.
Likewise, though it is too early to fully assess the rate of loan recovery and/or the probability and
rate of default under the current scheme, manifestation of opportunistic behavior among the
borrower cooperatives such as reluctance to repay their loans and deliberate default does not
seem to be a serious problems. The fact that cooperatives have keen interest to establish good
relationship with the lending banks by demonstrating their creditworthiness, on the one hand,
and the follow ups and monitoring activities carried out by the cooperative promoting body, on
the other hand, appeared to enhance the effectiveness of loan repayment. However, further study
is needed after sometime to assess whether such repayment performance is maintained or

299
diminishing over time. As Riding and Haines (2001) note, among the two measures of default
rates, the rates of long-term default on guaranteed loans will not be known until the loans have
run their entire maturity course. They note that the second default measure which is the rate of
default during the early years of the loan tend to be higher. Levitsky (1997) argues that although
there might be exceptions, complete absence of default and/or claim may indicate that there had
been an overcautious approach to the approval of guaranteed loans, indicating that a 2 - 3%
default claim rate as a best practice. A default claim rate exceeding 5% of the total guaranteed
amount could be an indication for the need to take some remedial measure. For instance, Hansen
et al (2012), in their study of 18 guarantee schemes in some selected countries in Africa found
that one-third had moderately high (10% - 20%) or very high (over 20%) default rates.
In fact the cooperatives established under the Derg’s socialist regime were used to receiving
cheap and targeted credit with lending requirements and practices that were not paying serious
attention to bankability and creditworthiness of the borrower cooperatives. Such lending
practices resulted in widespread defaults and bad credit culture among the cooperatives that
operated during that regime. Thus concerted efforts are needed to create adequate awareness and
to build capacity of the targeted cooperatives prior to loan disbursement in order to make them
genuine and competent borrowers and business operators under the current free market economy.
In general, a careful screening process, well-thought and systematic approach in introducing the
scheme, intensity of follow up and supports provided to borrower cooperatives play a crucial role
in boosting the effectiveness of loan recovery. In fact making the borrower cooperatives to cover
the remaining 50% risk or to provide some sort of equity can minimise moral hazard. This,
however, needs to be employed with greater care as it may suppress cooperative’s appetite for
such loans as most of them may struggle to provide such equity or collateral.
On the other hand, incidences of loan diversion to other purposes are often cited (e.g. by
D’Ignazio and Menon, 2013) as one of the causes of failure in properly repaying loans. The loan
diversion attempts made by a few cooperatives under the current scheme can be corrected or
prevented through adequate awareness raising, follow up and monitoring activities. Such
supervisory responsibility can be shared by all relevant actors under the scheme. The study also
suggests the need for stepping up efforts to convince and encourage lending banks to improve
supply of medium- and long-term loans to avoid diversion of short-term working capital loan to

300
long-term investment. Likewise, the column shifting tendency displayed by one of the branches
of the lending bank (whereby they had tried to move poorly performing previous non-guaranteed
loans to the new guaranteed loans) calls for a stronger engagement, follow up and negotiation
with the lending banks.
7.8. What are the factors that affect effectiveness and performance of a CGS
targeting farmers’ cooperatives in the Ethiopian context?
A number of internal and external factors appear to enhance or constrain the performance and
effectiveness of a loan guarantee scheme targeting farmers’ cooperatives under the Ethiopian
context. Though there are some context specific issues, they largely overlap with the ones
outlined by DFID (2005) in chapter three as macro and micro factors for success and failure.
Though the degree of importance attached to them (by different stakeholders) appears to vary,
most of these factors affect the interest, willingness and capacity of the lending banks in widely
reaching out to farmers’ cooperatives. Some of them have direct influence on the targeted
cooperatives’ ability, interest and willingness to effectively seek and utilise such guaranteed
loans. The external factors among others include: Output market; natural/environmental factors;
access to input and infrastructural facility and support services (e.g. farm inputs, processing
facility, extension advice and training); policy and regulatory frameworks. Among these, the
most severe ones seem to be factors affecting agricultural enterprise, output markets and policies
and regulations that influence financial institutions to tighten their lending policy, requirements
and priority. In particular, the directive issued by the National Bank of Ethiopia in relation to the
government bond purchase inhibits banks’ lending motivation as well as has adversely affected
their loan disbursement capacity and profitability of their business.
The internal factors that may affect performance and successes of a credit guarantee programme
can be related to: Scheme design feature and operations, parties involved in the scheme such as
the guarantor and lending banks (capacity, competitiveness, priority, commitment and motives),
and borrower cooperatives’ institutional and business conditions. On the other hand, the memory
of poor credit repayment performance among cooperatives that existed during the socialist
system still persists in the minds of bank officers and has continued to influence their perception

301
about cooperatives’ bankability and creditworthiness. This calls for efforts that aim at changing
banks’ attitude and perception towards cooperatives and bankability of their business.
Thus if such interventions have to effectively attain the intended target, there is a critical need to
design other complementary packages that would address policy related issues as well as
interventions that enhance the capacity, commitment and interests of both the lenders and the
borrowers. Hansen et al (2012) note that in addition to building the capacity of the borrowing
firms, lending banks require their own capacity building in order to efficiently and effectively
utilise the guarantees and/or to develop new suitable products for the targeted borrowers.
Genuine commitment and engagement of both the guarantor and lender is also critical for such
guarantee schemes to be effective. In addition, the importance of various support measures on
the part of the government, including strengthening cooperatives and their market access, and
creating supportive and enabling environment both for the borrower cooperatives and lending
institutions cannot be overemphasised.

302
CHAPTER 8
8. CONCLUSIONS AND RECOMMENDATIONS
8.1. Introduction
This study explored the role and effectiveness of a credit guarantee scheme designed for coffee
farmers’ cooperatives in Ethiopia. The findings show that the effectiveness and successes of a
credit guarantee programme is influenced by a number of internal and external factors. Thus in
designing and operationalising an effective and successful credit guarantee scheme critical
internal and external factors for success and/or failure need to be identified and taken into
account. Based on the findings of the study, this chapter draws relevant conclusions as well as
makes recommendations that need to be considered at various levels. The recommendations
outline measures that need to be taken in relation to scheme design and operation, the parties
involved in the scheme and on the part of the government. Finally relevant areas for further
research are highlighted.
8.2. In relation to scheme design features and implementation strategies
It can be concluded that most of the design features and operational practices of the current
guarantee scheme are in line with international practices. However, there are some obvious
drawbacks, which have particularly influenced its attractiveness to and up-take by the lending
banks in terms of actively participating and widely providing appropriate loan products to the
targeted cooperatives.
The conclusion that can be drawn in relation to the performance and achievements of the scheme
under review is that it generated mixed performance and achievements. In terms of its positive
contributions and strengths, evidence suggests that provision of a credit guarantee and associated
supports have played an important role in motivating primary cooperatives to seek bank loans.
The intervention has increased awareness about the possibility of directly borrowing from banks,
enhanced primary cooperatives’ understanding and ability to meet banks’ lending requirements
as well as provided an opportunity to establish links with lending banks and demonstrate their

303
creditworthiness. As a result, though the scope and outreach is limited, the scheme to some
extent made positive contributions in improving accessibility of bank credit to the targeted
primary cooperatives. In other words, despite their limited number, the scheme has attained
substantial financial additionality among the beneficiary cooperatives. Moreover, the scheme
indirectly influenced unions, who have started channeling more loan fund to the primary
cooperatives targeted by the scheme. More importantly, the scheme somehow positively affected
business activities and incomes of the beneficiary cooperatives.
The findings also reveal that there are some limitations in the scheme design features, operation
and outcomes. In terms of bank’s utilisation of the guarantee fund and outreach, the scheme has
demonstrated limited achievement. In general, most commercial banks have shown reluctance to
participate in the lending activities of the current guarantee scheme. Therefore, if such guarantee
arrangements have to be effectively taken up by many commercial banks, there is a need to
carefully identify and integrate other attractive and effective financial and non-financial
incentive packages and support mechanisms. These may include the following:
Relevant and targeted training, capacity building and experience sharing activities. In
this regard, though the current scheme has embedded a fairly strong training and
capacity building component for both parties, there have been some gaps in tailoring
bank trainings to the contexts of the current scheme.
Capital enhancement mechanism that helps to enhance bank’s liquidity, which could
be provided in the form of cash guarantee or revolving fund for the lending banks.
Promotion, publicity and other strategic benefits for the participating bank.
Another important limitation was that the design features and operational strategies of the
guarantee scheme under analysis have not witnessed changes and adaptation over time. Thus
there should be some flexibility and room for periodically (often annually) revising some of the
features of the original scheme design. These may include revisions to the eligibility criteria
(such as targeted cooperatives, geographical area, purpose of loan), guarantee level,
guarantee/risk fee rate, ceiling on maximum amount of individual loan, etc. Such adaptation
should be based on experiences gained and challenges encountered during the early stages of

304
scheme implementation. However, such adaptations should not cause substantial changes to the
key objectives and the basic operational models of the scheme.
The total volume of the guarantee fund and the maximum limit to individual loan amount are
among the vital components of a guarantee scheme and need to be carefully determined based on
evidence and existing reality. Such decisions should be based on proper assessments and
thorough consultations with the local banks, potential borrowers and other relevant partners.
However, changes in socio-economic, market and financial conditions (e.g. rate of inflation) and
cooperatives’ changing demand for loan (due to changes in coffee price, coffee processing
facilities, institutional and business capacity, etc.) call for the need to revise the maximum loan
amount after sometime.
Given the current tighter financial conditions and regulatory framework, it can be concluded that
in the absence of some sort of capital enhancement mechanism (in the form of cash guarantee or
revolving fund) and other incentives for the lending bank, the 50% risk sharing does not seem to
be adequate in motivating them to actively participate in the lending activity. Apparently the
ideal level of risk coverage depends on a number of factors such as nature and risk level of the
borrowers and their business, guarantee model and other operational features of the scheme. If
such a loan guarantee targeting farmer cooperatives have to be effectively taken up by many
commercial banks, the guarantee level should be raised to about 60 – 80%, at least initially. This
could be gradually revised downwards to allow the lending bank to start absorbing more risk.
This is mainly due to the fact that: (a) the lender and borrower will have established good
relation and overcome the challenges of information asymmetry and lack of trust; (b) the
borrowers will have accumulated some assets that can be offered as collateral or boost
confidence of the lending bank.
Though the floor coverage may remain unaltered, guarantee percentage should vary depending
on the following:
Disbursed loan amount; i.e. risk coverage may decrease as the loan volume increases. For
instance, for loans of up to 1 million Birr, the coverage could be 80%, while it can be
reduced to 70% for loan amounts between 1 and 3 million Birr. The coverage can be further

305
reduced to 60% for a loan above 3 million Birr. This is intended to encourage more bank
lending to cooperatives with weaker capacities.
Geographical location of the targeted cooperatives and their risk profile; for instance, risk
coverage for loans to coops in less developed and remote areas could be put at a higher level
than those in more accessible and relatively well developed areas. Likewise, new coops and
those without sufficient credit history can be treated in a similar manner.
Term of loans; i.e. it would be important to provide differential guarantee levels for loans
with different terms as their risk levels vary. For instance, risk coverage can increase for
medium- and long-term loans which are perceived as riskier ventures.
Though the main essence of designing a guarantee scheme is to overcome problems related to
lack of collateral, complete absence of collateral may result in adverse selection and moral
hazard problems among the borrowers. Thus such schemes should be allowed to shift certain
reasonable percentage of the risk (10 - 20%) to the borrowers in the form of collateral or at least
equity contribution. Apart from boosting the confidence of lending banks, this measure would
encourage borrowers to be genuine and serious, and eventually reduces rate of defaults. This
however should be exercised with greater care and prudence as it may stop some of the targeted
borrowers from accessing guaranteed loans.
International experiences show that it is a common practice for most guarantee schemes to
charge various type of fees. Annual risk fee is the common one in this respect, which often
ranges between 1% and 2% of the total disbursed loans, while some even charge lesser amount.
However, while charging annual guarantee/risk fee is especially important for covering admin
costs and in sustaining the scheme, its inclusion in such short-term donor-funded scheme that
targets smallholder farmers and their cooperatives may act as a significant disincentive to the
lending banks and may need to be considered carefully. Though the level of guarantee fee under
the current scheme (1.5%) seems to be in line with international practices, given the nature of
farmer cooperatives’ business and their rural-based locations, lending banks might not be willing
to absorb higher fees.

306
Thus with such development-oriented donor-funded schemes that aim to generate various direct
and indirect benefits to the community, such guarantee fees should be kept to a minimum (e.g.
0.5 or 1% of the disbursed guaranteed loans). Moreover, it is crucial to charge different fee rates
based on the following conditions:
The guaranteed loan amount, i.e. risk fee rate can increase with volume of guaranteed loans.
For example, 0.5% may be charged on a loan amount of up to 1 million Birr. This can be
raised to 1% for a loan volume of 1 to 3 million Birr, and to 1.5% for loans of over 3 million
Birr.
Level of guarantee coverage, whereby higher percentage of guarantee attracts higher fee
rates. However, this needs to be applied with greater care as it may affect the weaker
cooperatives that received higher guarantee coverage.
Geographical location and risk level; i.e. loans extended to new and coops without credit
history, and those located in disadvantaged areas can be charged low fee rates.
Differential fee rates for different terms of loans, whereby medium- and long-term loans may
attract low fee rates.
Loans guaranteed under the portfolio approach apparently involve less administrative works
from the guarantor’s end. Thus fees charged on such loans should be lower than the rates for
loans approved under individual approach.
The findings strongly suggest that the duration of the current guarantee scheme in general and
the effective lending period in particular was too short. This appears to underestimate the time
and efforts needed to carry out necessary ground works and capacity building activities before
such lending activities take place. More importantly, establishing firm relationships and mutual
understanding between the two key actors (lenders and borrowers), and making necessary
changes to the systems and operations of the lending banks obviously need substantial time. In
addition, if they have to generate significant economic additionality, credit guarantee
programmes should operate for a fairly longer period. Thus we recommend that future schemes
have to be of a reasonably longer-term arrangement (of at least 7 to 10 years) with considerable
amount of guarantee fund if such schemes have to generate meaningful and sustainable impacts.
As Levitsky (1997) notes the most successful schemes across the world took 5 to 10 years to
develop effective collaborative relationships between the guarantor and lenders.
307
In terms of causing moral hazard, provision of the partial guarantee did not have substantial
impacts on the behaviour of the lending institutions and borrower cooperatives. However, though
deliberate default was not a major problem, some degree of malpractice and fund diversion was
revealed among the management of a few borrower cooperatives, particularly where there had
been gaps in supervision and monitoring activities. Properly designing and taking necessary care
in introducing the scheme and closely monitoring borrowers’ practices can minimise moral
hazards and other malpractices in the supplied loans.
8.3. As related to the participating (lending) bank
Commitment and active participation by the lending banks is one of the critical factors that
determine the successes of a credit guarantee scheme. Despite initial interests shown by banks to
participate in such an arrangement, a number of internal and external factors may constrain their
actual lending activities to such target groups. Thus the following recommendations can be made
in relation to the lending bank under such a guarantee scheme.
Sufficient assessment should be carried out during the scheme design and prior to its
implementation to identify suitable, committed and competent banks for such lending activities.
This step should also involve, among other things, thorough assessment and identification of the
needs, requirements, experiences, capacities (financial and institutional) and challenges of the
available banks. In this regard, as Hansen et al (2012) recommends, it is important to map banks
by commitment to the targeted beneficiaries based on various criteria.
The findings of the current analysis and international experiences pinpoint to the limitations of
involving and relying on a single lending bank. Thus where possible, it would be important to
consider involving more than one lending bank in such a partial loan guarantee arrangement.
This may stimulate competitive behavior among the lending banks as well as facilitate
participation of banks with varying commitment, experience and capacities. Moreover, it is
crucial to carefully choose and engage banks with sufficient local branch networks closer to the
targeted borrowers.

308
Engaging a cooperative bank with some lending experience in the cooperative sector somehow
helped in facilitating the lending activities to the targeted cooperatives. This particular bank has
better understanding of cooperatives’ demand, capacity, strength and limitations than other
mainstream commercial banks. However, the positive responses demonstrated by the current
partner bank (Cooperative Bank of Oromia) may not give a true picture of the interest and
response of the mainstream commercial banks towards such a partial guarantee arrangement.
In addition to facilitating flow of additional loan fund to the targeted group, such guarantee
intervention should also pay adequate attention to unleashing other potential benefits such as
improving the terms and conditions of loans. However, the current guarantee scheme did not
have significant influence in making the lending banks adapt and relax their lending approaches,
loan terms and conditions (including reducing loan processing time, interest rates, etc.). The
lengthy loan processing procedures and delay in loan disbursement appeared to act as a major
constraint in effectively utilising guaranteed loans under the current scheme. It is thus important
to make sure that cooperatives’ application for guaranteed loans are treated promptly and loans
are disbursed in time. Thus if such rural-based farmers’ cooperatives have to have easy and
timely access to suitable loan products, the participating banks need to be committed to revisit
and improve some of their lending terms and requirements. It is critical to negotiate and provide
the participating banks with incentive packages that would motivate them to do so.
Evidence reveals that cooperatives require loan for various purposes, which include seasonal
working capital to purchase coffee, and medium- or long-term loans to acquire processing
equipment (including drying materials) and storage facilities. The current study further reveals
that medium-term loans provided for investment in processing facilities appeared to more
significantly contribute to improvements in coffee quality and asset base of the cooperatives as
compared with the short-term loans provided merely for seasonal coffee purchase and sale.
However, commercial banks largely tend to focus on providing short-term working capital loans
for seasonal coffee purchase. Thus there is a need to convince, motivate and encourage
commercial banks to increase their medium- and long-term loan allocations to the targeted
cooperatives.

309
Lack of adequate awareness about the scheme design and operational arrangements (among bank
officers at different levels, particularly at branch offices) appeared to severely affect proper
implementation and success of the scheme under analysis. If such a guaranteed lending activity
has to take place effectively, all relevant bank branch managers and loan officers need to be
provided with adequate information and awareness about the scheme and its operational
arrangements. This may include information on the scheme’s objectives, target groups and
eligibility, risk sharing arrangements, mode of operation and other key features. Such awareness
raising activity should take place right at the outset of the scheme implementation and on a
continuous manner as changes in bank staff may result in new informational gaps.
8.4. As related to the borrower cooperatives
The study reveals that primary cooperatives have huge potential demand for loan as compared
with the currently revealed actual demand. Among other things, weak institutional, managerial
and business capacities prevent cooperatives from transforming their potential demand into
revealed demand. Thus if farmer cooperatives have to effectively demand for, access and utilise
such guaranteed loans, they need to be provided with various support measures. These may
include sensitisation and intensive awareness creation activities (about scheme objectives,
guarantee arrangement, mode of operation, benefits, eligibility, lending procedures, etc.), bank’s
lending requirements, and proper and genuine loan utilisation and repayment. These should be
accompanied by training and capacity building interventions for borrower cooperatives, which
may aim at improving their organisational, financial management, business (including assistance
in identifying viable business enterprises and developing sound and acceptable business plan)
and other specific technical skills such as coffee production, processing and marketing.
The findings of the current study reveal that cooperatives that had received adequate support and
follow up from the cooperative promoting body appeared to demonstrate better access to,
effective utilisation and repayment of guarantee loans. Thus such close follow up, supervision
and technical support need to be given serious considerations in implementing such loan
guarantee programmes targeting farmers and their associations. In this respect though the
cooperatives promoting body plays a leading role, all the actors participating in the scheme need
to play an active role.

310
Banks’ confidence and interest in cooperatives’ business and willingness to provide them with
appropriate loan products is hugely influenced by cooperatives’ access to attractive markets for
their products such as export markets. In view of their strong market linkage and asset
ownership, commercial banks often tend to favour higher cooperative structures (such as unions)
in extending loans. Having strong market linkage would also enhance cooperatives’ loan
utilisation and repayment performance. It is thus critical for such guarantee programmes to pay
adequate attention to strengthening or facilitating access of primary cooperatives to alternative
and attractive market outlets for their products in a sustainable manner.
Like any other business enterprise, if cooperatives are to operate effectively and manage their
organisation, business and resources efficiently and in a sound manner, they need to have
professional managers and leaders. Therefore, it is crucial to support and encourage primary
cooperatives to gradually shift from committee-based management to engaging full-time
professional manager and finance personnel. This apparently depends on the strength of their
business activities and financial capacity.
Cooperatives’ business is directly related to the activities and participation of their member
farmers. The current study concludes that there is an apparent gap among the study cooperatives
in ensuring full participation of member farmers in their businesses and major decisions. Thus if
cooperatives have to have access to adequate volume of members’ produce, there is a critical
need to foster their relationship with member farmers. Such strong relationship and mutual trust
would also help cooperatives to collect members’ coffee on loan, which is crucial especially in
the face of loan scarcity or persisting delay in loan approval and disbursement.
The study observed that cooperatives often encounter difficulties in properly utilising and
repaying their loans during the seasons with poor coffee yield. Therefore, cooperatives’ loan
application assessment under such credit guarantee programmes should take into account
prospects of coffee yield for that particular season and members’ willingness and readiness to
deliver their coffee to their cooperatives. This in fact requires availability of bank loan officers
with such knowledge and experience.

311
There is a great opportunity for cooperatives in the current coffee marketing system. The
findings, however, suggest that primary cooperatives’ participation and contribution in coffee
processing and marketing have been hindered largely by their weak capacity (institutional,
financial, managerial and business) and lack of access to loan finance. If such opportunities and
potential have to be fully tapped, it is critical to build their capacity and improve their access to
appropriate financial resources. In the short-run provision of such guarantee schemes could play
an important role in, at least partly, addressing such financial gaps. In addition, in the long-run it
is important to strengthen the financial capacity and asset base of cooperatives through sale of
shares and other strategic income/fund raising activities. In the long-run it is also important to
look into possibilities of creating arrangements that may mobilise some sort of external equity
capital which may have policy implications.
The findings suggest that primary cooperatives experience lack of modern coffee processing
facilities (including drying materials), which is directly related to lack of finance and other
capacities. Above all, it is critical to raise cooperatives’ awareness especially with regard to use
of modern drying beds made of mesh wire and their significance in improving coffee quality.
Parallel to this effort, there is a need to improve cooperatives’ access to improved processing
facilities (especially drying materials) and financial services to enable them acquire these
materials. Likewise, most cooperatives tend to trade dry cherries without undertaking value
adding activities. It is therefore important to encourage and support primary cooperatives to
undertake at least basic primary processing activities to the coffee they trade.
The study suggests that pre-harvest cherry advance to cooperative members is critical as it would
help them avoid forced early selling of cherries and engagement in unfavourable arrangements
with informal money lenders and private coffee traders. However, coffee or multipurpose
cooperatives do not seem to be ideally suitable to serve as intermediaries for bank loans, nor
have the legal support to get involved in credit service provision. If they have to be involved in
provision of financial services to meet members’ emergency needs, there is a need for a cautious
move and appropriate system for its delivery and recovery. However, as Chanyalew (2015)
suggests, in the long-run provision of such financial services should be left to specialised
cooperatives such as SACCOs, which in fact require further strengthening and capacity building.

312
8.5. In relation to national policy, regulatory framework and institutional
supports
Despite the rapid expansion observed in the financial sector of Ethiopia in recent years, the
smallholder agriculture in general and the coffee sub-sector in particular are suffering from
shortage of financial resources. In particular, the production side faces severe constraints in this
respect. Apparently efficient supply of financial resources and its effective utilisation require
enabling policy and regulatory environments and provision of other complementary support
services.
Based on the findings of the study, our conclusion is that credit guarantee programmes
intervening in the financial markets operating under tight regulatory and monetary systems and
pervasive government intervention may face challenges in effectively meeting their targets. In
particular, such strong state intervention in the financial markets and stringent regulatory system
have serious implications for banks’ lending behaviour and priorities. Thus if commercial banks
have to widely reach out to smallholder farmers and their cooperatives with suitable and
alternative loan products, there is a need to create a more favourable policy and regulatory
environment. Likewise, if farmers’ cooperatives have to effectively participate in and benefit
from such guarantee programmes, there is a need to relax some of the regulatory frameworks that
restrict cooperatives’ demand for, access to and effective utilisation of institutional loans. In
particular, the cooperative promoting body needs to render a more proactive and comprehensive
support services to facilitate cooperatives’ institutional and business development. However, it is
critical to limit government’s intervention to playing a more facilitative role rather than tending
to dictate cooperatives’ affairs and businesses.
The regulations of the National Bank compel commercial banks to exert a number of lending
requirements (e.g. requirement for two TIN numbers) which appear to hinder cooperatives’
access to bank loans. Apparently farmer cooperatives are vital rural institutions that generate
direct economic and social benefits to the farming community. It is therefore worthwhile to treat
farmer cooperatives differently in providing financial resources and other support services. This

313
may involve reconsidering some of the policies and regulations in terms of allowing banks to
adapt their lending terms and conditions for the rural-based farmers’ cooperatives.
In particular, the directive of the National Bank, which requires private banks to purchase
government bond for 27% of the disbursed loan amount seems to have adverse effect on banks’
motivation and interest to lend to farmer primary cooperatives. Future schemes targeting farmer
cooperatives thus need to consider ways of helping lending banks in terms of relaxing such
constraints, for example by providing some capital to cover the fund required for bond purchase.
However, if sustainable changes have to be realised in this regard, it would be important to lobby
and negotiate with the NB for policy change in favour of cooperative lending (e.g. exemption
from NB bond purchase).
In view of the limited loanable funds among commercial (private) banks and presence of other
more attractive sectors that readily seek loans, banks have shown reluctance in lending to
smallholder farmers and their cooperatives. This again calls for policy intervention that may
require commercial banks to reach out to such disadvantaged groups through their lending
activities. One of such measures could be imposing certain quota on banks to channel some
percent of their loan funds (portfolio) to the currently marginalised sectors in terms of accessing
financial resources (such as smallholder farmers and their primary cooperatives).
At present microfinance institutions and even to some extent commercial banks seem to lack
coops-friendly loan products and lending requirements. Therefore, the government should
nurture and strengthen the infant financial cooperatives such as SACCOs (RUSACCOs) through
appropriate incentive and support packages. Such institutions can play an important role in
catering for the financial needs of sister commodity-based cooperatives by providing reasonably
cheaper, timely and suitable loan products. They can also play a vital role in promoting saving
culture among multipurpose cooperatives and member farmers.

314
8.5. Recommendations on areas for Further Research
In terms of methodological approach, the experience of the current study shows that such studies
require a research design that allows deeper and continuous analysis (of the performance and
impacts of the scheme) that is based on comprehensive quantitative and qualitative data collected
at various stages of the intervention. Such an approach would help to closely monitor and
analyse the processes of the lending activities, loan utilisation and its outcomes, loan recovery
and relationships established between the parties involved in the scheme. It also helps to
understand the underlying causes for the successes or failure of the guarantee programme.
This study was conducted with a limited number of cooperatives and did not cover all coffee
growing areas of Ethiopia. Some of the study areas (where the credit guarantee under analysis
has been implemented) are marginal coffee growing zones. Moreover, the study was largely
based on data collected in the early stages of the scheme implementation. Thus undertaking
further study at a later stage or after the end of the scheme would help to draw a definitive
conclusion. Additional specific areas or issues that seek further investigation may include:
Undertaking further research after sometime on the following focus areas and issues:
o How are the long-term impacts of the scheme (such as economic additionality, on
institutional capacity of cooperatives, default rates),
o Have long-term changes been realised in the system, behavior and practices of the
lending banks? Are the lending-borrowing relationships established between the two
parties sustainable?
o How are the costs (including admin and/or other transaction costs and costs related to
claims on defaults) and benefits of the intervention compared?
Exploring possible ways of establishing alternative coffee market outlets for primary
cooperatives that take part in such guarantee schemes.
o What are the available alternative markets and their requirements, what support
mechanisms are needed for cooperatives to effectively access them?
o What are the pros and cons and challenges of accessing such markets?
Conducting similar studies in other major coffee growing areas by involving more number of
cooperatives in order to be able to make a definitive conclusion on certain aspects such as
cooperatives’ loan demand and their determinants.

315
REFERENCES:
Adal, Y., (2002). Review of landholding system and policies in Ethiopia under the different
regimes. EEA/Ethiopian Economic Policy Research Institute Working Paper No 5/2002.
Adal, Y., (2000). ‘Rural organisations and rural development in Ethiopia’, in Issues in Rural
Development: Proceedings of the Inaugural Workshop of the Forum for Social Studies.
Zenebework T., (Ed.). 18 September, 1998. Addis Ababa. pp. 45-79.
Admassie, A., Ageba, G., and Demeke, M., (2005). Rural finance in Ethiopia: Assessment of the
financial products of microfinance institutions. Association of Ethiopian Microfinance
Institutions, Occasional paper No. 12. P. 119.
Admassie, A., (2004). A review of the performance of Agricultural Finance in Ethiopia: Pre- and
post reform periods. A paper presented on the International Conference on macro-
economic, agrarian change and poverty reduction. December 2004. Addis Ababa
Admasu, A., and Paul, I., (2010). Assessment on the mechanisms and challenges of small scale
agricultural credit from Commercial Banks in Ethiopia: The case of Ada’a Liben woreda
of Ethiopia. Journal of Sustainable Development in Africa. Vol. 12, No. 3, 2010.
Admasu, S., Zekarias, S., and Tsegaye, Y., (2008). Adoption of improved coffee production
technologies in Ethiopia. In: Coffee Diversity and Knowledge. Proceedings of the
workshop on Four Decades of Coffee Research and Development in Ethiopia, 14-17
August, 2007. Addis Ababa. Ethiopian Institute of Agricultural Research. pp. 357-363.
Aga, G., and Reilly, B., (2011). Access to credit and informality among micro and small
enterprises in Ethiopia. International review of applied economics. 25 (3). PP.313-329.
Ajagbe, F., Oyelere, B., and Ajetomobi., J., (2012). Determinants of small-scale enterprise credit
demand: evidence from Oyo state, Nigeria. American journal of social and management
sciences. ISSN Print: 2156-1540, Online: 2151-1559, doi:10.5251/ajsms.2012.3.1.45.48
Akpan, S., Patrick, I., Udoka, S., Offiong, E., and Okon, U., (2013). Determinants of Credit
Access and Demand among Poultry Farmers in Akwa Ibom State, Nigeria. American
Journal of Experimental Agriculture 3(2): 293-307, 2013.
Akudugu, M., (2012): “Estimation of the Determinants of Credit Demand by Farmers and
Supply by Rural Banks in Ghana’s Upper East Region”, Asian Journal of Agriculture and
Rural Development, Vol. 2, No. 2, pp. 189-200.
Alemayehu, T., and Esayas, K., (2008). Coffee Development and marketing improvement plan

316
in Ethiopia. In: Coffee Diversity and Knowledge. Proceedings of the workshop on Four
Decades of Coffee Research and Development in Ethiopia, 14-17 August, 2007. Addis
Ababa. Ethiopian Institute of Agricultural Research. Pp. 375-381.
Allinson, G., Robson, P., and Stone, I., (2013). Economic Evaluation of the enterprise finance
guarantee scheme. Department for Business Innovation and Skills. February 2013.
(www.bis.gov.uk).
Anbes, T., and Gowda, S., (2008). Factors affecting credit use by small farmers: A study in Dire
Dawa area, Eastern Ethiopia. pp. 293-310.
Aryeetey, E., Hettige, H., Nissanke, M., and Steel, W., (1997). Financial Market
Integration and Reforms in Ghana, Malawi, Nigeria and Tanzania. World Bank Economic
Review. 11 (2).World Bank, Washington, D. C.
Aryeetey, E., (1996). Rural finance in Africa: Institutional developments and access for the poor.
The WB Annual conference on Development Economics, 25-26 April. Washington, D. C.
Assefa, T., (2005). Revitalising market-oriented agricultural cooperatives in Ethiopia: A case
study. USAID’s Cooperative Development Programme. Washington, D.C. March 2005.
ATA (2012). Agricultural Coopertaives Sector Development Strategy (2012 – 2016).
MoA/FCA/ATA. June 2012, Addis Ababa.
Atieno, R., (2001). Formal and informal institutions’ lending policies and access to credit by
small-scale enterprises in Kenya: An empirical assessment. African Economic Research
Consortium Research paper 111. November 2001. Nairobi, Kenya
Athreya, K., Tam, X., Young, E., (2011). Loan guarantees for consumer credit markets.
Working paper No. 11-06. September 30, 2011. University of Cambridge.
Ayana, I., (1999). Ethiopian Economy Performance and Evaluation: Proceedings of the Eighth
Annual Conference on the Ethiopian Economy. Alemayehu, G., and Berhanu, N., (Eds.).
October 30 – November 1, 1998. Addis Ababa, Ethiopia
Bagersh, A., (2012). Ethiopian Coffee Today. A paper presented on the 9th
African Fine Coffee
Conference and Exhibition. 16-18, Addis, Ababa, Ethiopia.
Barslund, M., and Tarp, F., (2008). Formal and informal rural credit in four provinces of
Vietnam. Journal of Development Studies, Vol. 44, No. 4, 485–503, April 2008.
Bastin, A., and Matteucci, N., (2007): Financing Coffee farmers in Jimma zone, Ethiopia:
Challenges and Opportunities. International Conference on Rural Finance Research:

317
Moving Results in to Policies and Practices. FAO, Rome, Italy, 19 – 21 March, 2007.
Beck, T., Klapper, L., Mendoza, C., (2010). The Typology of partial credit guarantee
funds around the world. Journal of Financial Stability 6 (2010): 10-25.
Benson, T., (2013). How regular financial audit services are provided to agricultural cooperatives
elsewhere: Lessons for Ethiopia. 15 December 2013. Research for Ethiopia’s Agriculture
Policy (REAP). IFPRI, Washington DC.
Berhanu, H., (2005). Issues and Trends of microfinance Development in Ethiopia. In the
proceedings of the workshop on Trends, challenges and other key issues in microfinance
development in Ethiopia. 9 – 10, December 2004. Meklit microfinance institution,
Progynist and Alisei NGO. Addis Ababa, Ethiopia
Bernard, T., Abate, G., and Lemma, S., (2013). Agricultural cooperatives in Ethiopia: Results of
the 2012 ATA Baseline Survey. May 2013. Research For Ethiopia’s Agriculture Policy
(REAP). IFPRI, Washington DC.
Bernard, T., Spielman, D., Taffesse, A., and Gebre-Madhin, E., (2010). Cooperatives for Staple
Crop Marketing. IFPRI Research Monograph 164. Washington D.C.
Bing, Z., Guo-yu., Ping-gui, Z., Yang, C., and Shuai, Y., (2008). Empirical study on the financial
repression of rural households’ debit and credit and the effects on their welfare in less
developed regions – Take Suqian city of Jiangsu provice as an example. Journal of
Modern Accounting and Auditing, Dec. 2008, Vol.4, No.12 (Serial No.43).
Bolesta, A., (2007). China as a Developmental State. Montenegrin journal of Economics No 5.
(Received: June 27, 2007)
Borchgrevink, A., Woldehanna, T., Ageba, G., and Teshome, W. (2005). Marginalised groups,
Credit and Empowerment: The case of Dedebit Credit and Saving Institution of Tigray,
Ethiopia. AEMFI Occasional Paper, No. 14. September.
Bresser-Pereira, L., (2009). Assault on the State and on the Market: Neoliberalism and
Economic Theory. ESTUDOS AVANÇADOS 23 (66).
Brink, H. I, (1996). Fundamentals of research methodology for health care professionals.
Kelwyn: Juta and Company.
Briones, M., (2009). Do small holder farmers borrow less when the lending rate increases?
Interest rate elasticity of rice farmers in the Philippines. Asian Economic Journal 2009,
Vol. 23, No 4, 439-455.
Bushway, S., Johnson, B., and Slocum, L., (2007). Is the Magic Still There? The Use of the

318
Heckman Two-Step Correction for Selection Bias in Criminology. Springer Science +
Business Media, llC 2007.
Butabaev, R., (2015). There is no growth without change: policy implications for transition
economies. Montenegrin journal of economics, vol. 11, no. 1 (July 2015), pp. 69-84
Chang, H., (1999). The Economic Theory of the Developmental State. In Meredith Woo-
Cummings (Ed.), The Developmental State. Ithaca: Cornell University Press. pp.183–199
Chanyalew, D., (2015). Ethiopia’s Indigenous Policy and Growth: Agriculture, Pastoral and
Rural Development. Addis Ababa, Ethiopia. P. 892.
Chanyalew, D., (2006). Policies for commercial transformation of Ethiopian Agriculture. In
Commercialisation of Ethiopian Agriculture. Proceedings of the 8th
Annual Conference
of the Agricultural Economics Society of Ethiopia. April 2006, Addis Ababa. pp 9-26.
Chaves, R., Sanchez, S., Schor, S., and Tesliuc, E., (2001). Financial markets, credit constraints,
and investment in rural Romania. Europe and Central Asia Environmentally and Socially
Sustainable Development Series. World Bank Technical Paper No. 499. Washington D.C
Common Fund for Commodities (CFC) (2011). Sustainable credit guarantee scheme to promote
scaling up/out of enhanced coffee processing practices in Ethiopia and Rwanda.
Appraisal Report. January 2011. The Netherlands
Cowling, M. and Mitchell, P., (2003). Is the small firms loan guarantee scheme hazardous for
banks or helpful to small business? Small Business Economics 21: 63-71, 2003. Kluwer
Academic Publishers. The Netherlands.
Craig, B., Jackson, W., and Thomson, J., (2009). The economic impact of small business
administration’s intervention in the small firm credit market: A review of the research
literature. Journal of small business management 2009 47(2), pp. 221-231.
Craig, B., Jackson, W., and Thomson, J., (2007). Small firm finance, credit rationing, and the
impact of SBA-Guaranteed lending on local economic growth. Journal of small business
management 2007, 45(1), pp. 116-132.
Creswell, J. W., (1999). Mixed-method Research: Introduction and application. Handbook of
Educational Policy. Academic Press. pp. 455-472.
Creswell, J.W., (1998). Qualitative inquiry and research design: Choosing among five traditions.
Thousand Oaks, CA: Sage
Creswell, J. W., (1994): Research design: Qualitative and quantitative approaches. Thousand

319
Oaks, CA: Sage
CSA (2014). The Federal Democratic Republic of Ethiopia Central Statistical Agency,
Agricultural Sample Survey 2013/2014 (2006 E.C.). Volume I, Report on area and
production of major crops (private peasant holdings, Meher season), Addis Ababa, May
2014. Statistical Bulletin 532.
CSA (2013). The Federal Democratic Republic of Ethiopia Central Statistical Agency,
Population Projection of Ethiopia for all Regions at Wereda level from 2014 – 2017.
August 2013, Addis Ababa.
Croppenstedt, A., Mulat, D. and Meschi, M., (2003). Technology adoption in the presence of
constraints: the case of fertilizer demand in Ethiopia. Review of Development
Economics, 7 (1), 58-70, 2003.
Dadzie, R., (2012). Developmental State and Economic Development: Prospects for Sub-
Saharan Africa. Journal of Sustainable Development; Vol. 5, No. 9.
Davis, K., Swanson, B., Amudavi, D., Ayalew, D., Flohrs, A., Riese, J., Lamb, C., Zerfu, E.,
(2010). In-Depth Assessment of the Public Agricultural Extension System of Ethiopia &
Recommendations for Improvement. IFPRI Discussion Paper 01041, December 2010.
Deelen, L., and Molenaar, K., (2004). Guarantee funds for small enterprises. A manual for
guarantee fund managers. International Labour Organisation.
Demeke, D., (1999). ‘The Challenge of Increasing Food Production in Ethiopia’, in The
Ethiopian Economy Performance and Evaluation: In the Proceedings of the Eighth
Annual Conference on the Ethiopian Economy. Alemayehu, G., and Berhanu, N., (Eds.).
October 30 – Novenmber 1, 1998. Addis Ababa, Ethiopia
Dempsey, J., (2006). A case study of institution building and value chain strengthening to link
Ethiopian cooperative coffee producers to international markets. ACDI/VOCA –
Ethiopia, January 2006, Addis Ababa
Develtere, P., (2008). Cooperative Development in Africa up to the 1990s. In Cooperating out of
poverty. The renaissance of the African cooperative movement. Develtere et al (eds.).
International Labour Office, Geneva. pp. 1- 37.
Develtere, P., and Pollet, I., (2008). Renaissance of African cooperatives in the 21st century:
Lessons from the field. In Cooperating out of poverty. The renaissance of the African
cooperative movement. Develtere et al (eds.). International Labour Office. pp. 38-90.

320
Devers, K., and Frankel, R., (2000). Study design in qualitative research-2: Sampling and data
collection strategies. Education for Health, Vol. 13, No. 2, 2000, pp. 263-271.
DFID (2005). Do credit guarantees lead to improved access to financial services? Recent
evidence from Chile, Egypt, India and Poland. Department for International
Development. Policy Division Working Paper. London, February 2005.
Diagne, A. and Zeller, M. (2001). Access to credit and its impact on welfare in Malawi. Research
Report 116. Washington D.C. International Food Policy Research Institute.
Diagne, A., Zeller, M., and Sharma, M., (2000). Empirical measurements of households’ access
to credit and credit constraints in developing countries: Methodological issues and
evidence. IFPRI Food Consumption and Nutrition Division Discussion Paper No. 90.
July 2000. Washington D.C.
D’ignazio, A., and Menon, C., (2013). The causal effect of credit guarantees for SMEs: evidence
From Italy. Banca D’Italia Eurosistema. Working paper, Number 900. February 2013.
Dobrohoczki, R., (2006). Cooperatives as Social Policy Means for Creating Social Cohesion in
Communities. Journal of Rural Cooperation, 34 (2) 2006:135-158.
Dohcheva, D., (2009). Credit rationing in agricultural credit markets in Bulgaria. Trakia Journal
of Sciences, Vol. 7, No. 3, pp 57-62, 2009 [http://www.uni-sz.bg]
Emana, B., (2009). Cooperatives: a path to economic and social empowerment in Ethiopia.
COOP-Africa Working Paper No. 9. ILO, 2009.
Emana, B., Gemtessa, K., Lemessa, D. and Ayele, G. (2005). Informal finance in Ethiopia.
Occasional Paper No. 13. A/Ababa, Association of Ethiopian Microfinance Institution.
Esayas, K., (2010). The Role of Commercial Coffee Farms in Coffee Development. A paper
presented on the 7th
African Fine Coffee Conference & Exhibition, 10-13 February 2010,
Mombassa, Kenya.
Federal Cooperative Agency (FCA) (2013). Annual Bulletin of the Federal Cooperative Agency
of Ethiopia. June 2013
Fletschner, D., Guirkinger, C., and Boucher, S., (2010). Risk, credit constraints and financial
efficiency in Peruvian agriculture. Journal of Dev’t Studies, 46 (6), 981–1002, July 2010.
Frangos, C., Fragkos, K., Sotiropoulos, L., Manolopoulos, G., and Valvi, A., (2012). Factors
affecting customers’ decision for taking out bank loans: A case of Greek Customers.
Journal of marketing research and case studies. Vol. 2012 (2012), 16 pages.

321
Freedman, P. L., (2004). Designing loan guarantee schemes to spur growth in developing
countries. US Agency for International Development, Washington DC.
Gandhimathi, S., and Vanitha, S., (2009). Repayment and overdue determinants of agricultural
credit: Some results for commercial and cooperative banks. The IUP Journal of Bank
Management. Vol. VIII, Nos. 3 and 4, 2009
Gebreselassie, S., (2006). Land, Land Policy and Smallholder Agriculture in Ethiopia: Options
and Scenarios. Future Agricultures, Discussion paper 008. www.future-agricultures.org
Geda, A., (2000). Institutional aspects of reforming the financial sector: The case of regulating
banking in post-reform Ethiopia. In Institutions, resources and development in Ethiopia.
Proceedings of the 9th
Annual Conference on the Ethiopian Economy. Mekonen, A. and
Aredo, D. (eds.). 8-9 October 1999. Addis Ababa. pp. 165-178.
Geda, A., (1999). The structure and performance of Ethiopia’s financial sector in the pre and
post reform period: with special focus on banking. In The Ethiopian Economy:
Performance and evaluation. Proceedings of the 8th
Annual Conference on the Ethiopian
Economy. Geda, A. and Nega, B. (eds.). October 30 – November 1, 1998. Nazareth,
Ethiopia. pp. 133-162.
Gemtessa, K., Emana, B., Lemessa, D., Ayele, G., (2006). The role of informal finance in rural
economy: The case of Gurage and Sidama zones. In Commercialisation of Agriculture:
Proceedings of the 8th
Annual conference of the Agricultural Economics Society of
Ethiopia. Addis Ababa. pp.117–144.
Gessese, D., (2010). Current status, challenges and panorama of financial cooperatives in
Ethiopia. In Building the performance of inclusive finance providers. Proceedings of the
6th
Bi-Annual Conference on Microfinance Development in Ethiopia. Alemu, T.,
(ed).Dire Dawa, Ethiopia. pp. 58 – 79.
Getnet, K., and Anullo, T., (2012). Agricultural cooperatives and rural livelihoods: Evidence
from Ethiopia. Annals of public and cooperative economics, 83: 2, 2012. pp. 181-198.
Girma, M., and Abebaw, D., (2015). Determinants of Formal Credit Market Participation by
Rural Farm Households: Micro-level evidence from Ethiopia. Paper for presentation at
the 13th
International Conference on the Ethiopian Economy. Ethiopian Economic
Association (EEA) Conference Centre, Addis Ababa, Ethiopia, July 23-25, 2015
Gobeze, G., (2008). Sustainable Rural Finance: Prospects, challenges and implications. In

322
Recent Experiences of Microfinance Institutions in Ethiopia: Growth, Sustainability and
Challenges. Proceedings of the 5th
Biannual Conference on Microfinance Development in
Ethiopia. Assosa, Ethiopia. pp. 76-107.
Green, A., (2003). Credit Guarantee Schemes for Small Enterprises: An Effective Instrument to
Promote Private Sector-Led Growth? SME Working Paper Series No 10. UNIDO.
Gronau, R., (1974). Wage comparison. A selectivity bias. Journal of Political Economy, 82:
1119-1143.
Gudger, M., (1998). Credit Guarantee: An assessment of the state of knowledge and new
avenues of research, FAO Agricultural Services Bulletin 129, 1998.
Hansen, A., Kimeria, C., Ndirangu, B., Oshry, N., and Wendle., J., (2012). Assessing credit
guarantee schemes for SNE finance in Africa. Evidence from Ghana, Kenya, South
Africa & Tanzania. Agence Francaise de Development. Working Paper 123. April, 2012
Harvey, D., (2005). A brief history of neo-liberalism. Oxford University Press Inc., New York
Heckman, J., (1979). Sample Selection Bias as a Specification Error. Econometrica, 47: pp. 153-
161.
Heckman, J., (1976). The common structure of statistical models of truncation, sample selection
and limited dependent variables and a simple estimator for such models. Annals of
Economic and Social Measurement, 5 (4); pp. 475-492.
Honohan, P., (2010). Partial credit guarantees: Principles and practice. Journal of Financial
Stability 6(1): pp. 1‐9.
Human Development Report (HDR) (2013). Human development Report 2013. The Rise of the
South: Human Progress in a Diverse World. UNDP
Iichiro, U., Kojia, U., and Yamashiro, G., (2006). Effectiveness of credit guarantees in the
Japanese Loan Market. Research Institute of Economy, Trade and Industry (RIETI).
Discussion Paper Series 06-E-004, February 2006.
International Cooperative Alliance (ICA) (1995). Statement on the Cooperative Identity, in
Review of International Cooperation, Vol. 88, No. 3.
International Coffee Organisation (ICO) (2013). Historical data on the Global Coffee Trade.
http://www.ico.org/new_historical.asp
International Coffee Organisation (ICO) (2005). Trade statistics:
http://www.ico.org/trade_statistics.asp

323
International Labour Organization (ILO) (2009). Sampling methodology. ILO school-to-work
transition survey: A methodological guide. International Labour Organization. Geneva.
International Labour Organization (ILO) (2008). Cooperating out of poverty. The renaissance of
the African coops movement. Develtere et al (eds.). International Labour Office, Geneva.
International Labour Organization (ILO) (2003). Rediscovering the cooperative advantage:
Poverty reduction through self-help. International labour Office, Geneva.
International Trade Centre (ITC) (2011). Microfinance in East Africa. Schemes for Women in
The Coffee Sector. Technical Paper. Geneva: ITC, 2011. No. SC-11-195, E. 33 pages.
Iqbal, M., Ahamad, M, & Abbas, K., (2003). The impact of institutional credit on agricultural
production in Pakistan. The Pakistan Development Review, 42(2), pp. 469-485
Jonson, M., (2009). Performance of credit guarantee schemes (CGS). HD Graduate Diploma in
Finance. Copenhagen Business Scholl. Paper No. 24. Spring 2009.
Kanoh, S., and Pumpaisanchai, C., (2006). Listening to the market: Estimating credit demand
and supply from survey data. Discussion paper series No 137. Hitotsubashi University
Research Unit for Statistical Analysis in Social Sciences; Institute of Economic Research.
February 2006. http://hi-stat.ier.hit-u.ac.jp/
Kang, J. and Heshmati, A., (2008). Effect of credit guarantee policy on survival and performance
of SMEs in Republic of Korea. Small Business Economics (2008) 31:445-462.
Karlan, D., Kutsoati, E., McMillan, M., and Udry, C., (2011). Crop price indemnified loans for
farmers: A pilot experiment in rural Ghana. The Journal of risk & insurance, 2011, 78
(1), pp. 37–55.
Kebret, H., (2000). Land reform: Revisiting the public versus private ownership controversy. In
Institutions, resources and development in Ethiopia. Proceedings of the 9th
Annual
Conference on the Ethiopian Economy. Mekonen, A. and Aredo, D. (eds.). 8-9 October
1999. Addis Ababa. pp. 47-66.
Khan, R., and Hussain, T., (2011). Demand for formal and informal credit in agriculture: A case
study of cotton growers in Bahawalpur. Interdisciplinary journal of contemporary
research in business. Vol 2, No. 10 February 2011.
KIT and IIRR (2010). Value Chain Finance. Beyond microfinance for rural entrepreneurs. Royal
Tropical Institute, Amsterdam; and International Institute for Rural Reconstruction.
Klerk, T., (2008). The Rural Financial Landscape. A Practitioners Guide. Agrodok-Series No.

324
49. Agromisa Foundation and CTA, Wageningen, 2008.
Kodama, Y., (2007). New role of cooperatives in Ethiopia: The case of Ethiopian coffee farmers’
cooperatives. African Study Monographs, Suppl. 35: 87-108, March 2007.
Komicha, H., (2008). Credit Sector Choice of Farm Households and its Determinants in
Imperfect Credit Markets of South-eastern Ethiopia. In Rural Development and
Environment in Ethiopia: Prospects and challenges. Proceedings of the 10th
Annual
Conference of the Ethiopian Agricultural Economics Society. May 2008. A. Ababa,
Ethiopia. pp. 255-292.
Kuo, C., Chen., and Sung, C., (2011). Evaluating guarantee fees for loans to small and medium-
sized enterprises. Small Business Economics (2011), 37, pp. 205-218.
Lemma, T., (2008). Growth without structures: the cooperative movement in Ethiopia. In
Cooperating out of poverty. The renaissance of the African cooperative movement.
Develtere et al (eds.). International Labour Office, Geneva. pp. 128-152
Levitsky, J., (1997). Credit guarantee schemes for SMEs – an international review. Small
Enterprise Development, Vol. 8 (2). June 1997
Mack, N., Woodsong, A., Macqueen, K., Guest, G. and Namey, E., (2005). Qualitative Research
Methods: A data Collector’s Field Guide. Family Health International. USA
Mafimisebi, T., Oguntade, A., and Misebi, O., (2010). Re-engineering agriculture for enhanced
performance through financing. Journal of Economics, Finance and Administrative
Science, 15 (29), 2010.
Mahmood, A., Khalid, M., and Kouser, S., (2009). The role of agricultural credit in the growth of
livestock sector: A case study of fiasalabad. Paksitan Vet. J., 2009, 29 (2), pp. 81 – 84.
Marshall, C., and Rossman, G., (1999). Designing qualitative research, 3rd
Edition. Sage
Publications.
Marshall, M., (1996). Sampling for qualitative research. Family Practice 1996: 13, pp. 522-525.
Oxford University Press.
Mcloughlin, C., (2011). Cooperatives and development. Helpdesk Research Report. Governance
and Social Development Resource Centre. April 2011.
MEDAC (1999). Survey of the Ethiopian Economy. Review of Post Reform Development
(1992/93-1997/98). MEDAC, Addis Ababa.
Messah, O., and Wanjai, P., (2011). Factors that influence the demand for credit among small

325
-scale investors: a case study of Meru Central District, Kenya. Research journal of
finance and accounting. www.iiste.org (Online). Vol 2 (2). 2011.
Meyer, R. & Nagarajan, G., (1996). Evaluating credit guarantee programmes in developing
countries, Paper Presented at the Meetings of the American Agricultural Economics
Association, San Antonio, TX, July.
Minten, B., Tamru, S., Kuma, T., and Nyarko, Y., (2014). Structure and performance of
Ethiopia’s coffee export sector. Ethiopia Strategy Support Programme. EDRI/IFPRI,
Working Paper No 66. June 2014.
Mohan, R., (2004). Agricultural Credit in India: Status, Issues and Future agenda. Reserve Bank
of India, November Bulletin 2004.
Morris, J., and Copestake, J., (1993). Qualitative Enquiry for Rural development: A
Review. Intermediate Technology Publications. London. UK.
Motamed, M., (2010). Role of cooperative companies in sustainable rice production and poverty
alleviation in Guilan state of Iran. African Journal of Biotechnology, 9(11): 1592-1599.
Mouton, J., (2001). How to succeed in your Master’s and Doctoral Studies; Pretoria. Van Schaik
Publishers.
Mpuga, P., (2010). Constraints in access to and demand for rural credit: Evidence from Uganda.
African Development Review, Vol. 22, No. 1, 2010, pp. 115-148.
Mthimkhulu, A., and Aziakpono, M, (2012). Do credit guarantee schemes address credit
market failures for small businesses? Preliminary evidence from South Africa. Paper for
presentation at the Africa Development Finance Workshop, 7 – 8 August 2012.
University of Stellenbosch Business School, Cape Town, South Africa.
Muayila, K., and Tollens, E., (2012). Assessing the impact of credit constraints on farm
household economic welfare in the hinterland of Kinshasa, DRC. African Journal of
Food, Agriculture, Nutrition and Development. 12(3). May 2012. pp. 6095 – 6109.
Muthuma, E., (2012). Do cooperative development policies really lead to the development of
cooperatives? Lessons from Kenya. Africa insight, Vol. 41, No 4, 2012.
Nagarajan, G., Meyer, R. and Hushak, J., (1998). Demand for agricultural loans: A
theoretical and econometric analysis of the Philippine credit market. Savings and
Development – No. 3 – 1998 – xxii. The Ohio State University.
Navajas, A., (2001). Credit guarantee schemes: conceptual frame. Financial System

326
Development Project. GTZ/FONDESIF. November 2011.
Nega, B., and Nuru, S., (1999). ‘Performance of the Ethiopian Economy 1991-1998’, in The
Ethiopian Economy Performance and Evaluation: Proceedings of the Eighth Annual
Conference on the Ethiopian Economy. Alemayehu, G., and Berhanu, N., (Eds.). October
30 – November 1, 1998. A.A, Ethiopia.
Negussie, E., Derese, T., Berhanu, M. and Getachew, W., (2008). Research Center-based
Extension Interventions on Improved Coffee Technologies. In Coffee Diversity and
Knowledge. Proceedings of the workshop on Four Decades of Coffee Research and
Development in Ethiopia, 14 - 17 August, 2007. Addis Ababa. pp. 345 – 356.
Negussie, E., Mitiku, M., and Agwanda, C., (2007). Does Acquisition of Information and
Knowledge Suffice? Lessons in improving coffee quality through an innovative and
integrated approach in Ethiopia. In: the proceedings of the 8th
African Crop Science
Society Conference, El-Minia, Egypt. Vol. 8. pp. 1237-1241.
Oh, I., Lee, J., and Heshmati, A. and Choi, G., (2008). Evaluation of credit guarantee policy
using propensity score matching. Small Business Economics (2009) 33, pp. 335-351.
Okon, X., and Nkang, N., (2009). An assessment of Nigeria’s agricultural credit guarantee
scheme fund: evidence from time-series analysis. Global Journal of Agricultural
Sciences. Vol 8 (2).
Okurut, N., Schoombee, A., and Berg, S., (2004). Credit demand and credit rationing in the
informal financial sector in Uganda. A Paper for the conference on African Development
and Poverty Reduction: The Macro-Micro Linkage. 13-15 October, 2004. South Africa.
Okwoche, V, Asogwa, B., and Obinne, P., (2010). Evaluation of agricultural credit utilisation by
cooperative farmers in Benue State of Nigeria. European Journal of Economics, Finance
and Administrative Sciences. Issue 47, 2012. http://www.eurojournals.com/EJEFAS.htm
Olagunju, F., and Ajiboye, A., (2010). Agricultural lending decision: A tobit regression analysis.
African journal of food, agriculture, nutrition and development. Vol.10. No. 5, May 2010.
Oni, O., Aamao, J., and Ogbowa, O., (2005). Determinants of credit demand among rural
farming household in Ose local government area: Ondo state of Nigeria. Journal of
Financial Management and Analysis, 18 (2): pp. 76-80.
Ono, A. and Uesugi, I. (2009). Role of collateral and personal guarantees in relationship lending:
Evidence from Japan’s SME loan market. Journal of money, credit & banking. Vol.41(5)

327
Oromia Bureau of Finance and Economic Development (2012): Oromia National Regional State
Brief Part IV. December 2012.
Ortmann, GF., and King, RP., (2007a). Agricultural Cooperatives I: History, Theory and
Problems. Agrekon, Vol 46, No 1, pp. 40 – 68.
Ortmann, GF., and King, RP., (2007b). Agricultural cooperatives II: Can they facilitate access of
small-scale farmers in South Africa to input and product markets? Agrekon, Vol 46, No 2,
pp. 219 – 244.
Otieno, R., (1997). Determinants of credit demand by smallholder farmers in kenya: an empirical
analysis. Der Tropenlandwirt, Beitrage zur tropischen Landwirtschaft und
Veterinarmedizin, 98. Jahrgang, April 1997, pp. 63 – 71.
Pal, S., (2002). Household Sectoral Choice and Effective Demand for Credit in India. Applied
Economics. 14: 1743-1755.
Panetta, I., (2012). An analysis of Credit Guarantee Schemes: Suggestion provided by
literature, In Leone, P. and Vento, GA (ed): Credit Guarantee Institutions and SME
Finance, Palgrave MacMillan, New York. pp. 11 -37
Pollet, I., (2009). Cooperatives in Africa: The age of reconstruction – synthesis of a survey in
nine Africa countries. Coop Africa, Working paper No. 7. ILO, 2009.
Posey, R., and Reichert, A., (2011). Terms of lending for small business lines of credit: The role
of loan guarantees. The International Journal of Business & Finance Research. Vol. 5 (1).
Rahji, M., and Adeoti, A., (2010). Determinants of agricultural credit rationing by commercial
banks in South-Western Nigeria. International Research Journal of Finance and
Economics. ISSN 1450-2887 Issue 37 (2010). http://www.eurojournals.com/finance.htm.
Riding, A., Madill, J., and Haines, G., (2007). Incrementality of SME loan guarantees. Small
Business Economics (2007), 29: pp. 47-61
Riding, A., and Haines, G., (2001). Loan guarantees: Costs of default and benefits to small firms.
Journal of Business Venturing, 16, pp. 595-612.
Rui, L., and Xi, Z., (2010). Econometric analysis of credit constraints of Chinese rural
Households’ and welfare loss. Applied Economics, 201, 42, pp. 1615-1625. Taylor &
Francis 1615 http://www.informaworld.com
Saadani, Y., Arvai, Z., and Rocha, R., (2010). A review of credit guarantee schemes in the
Middle East & North Africa Region. Financial Flagship, The World Bank. October 2010.
Saldana, C., (2000). Assessing the economic value of credit guarantees. Journal of Philippine
Development. Number 49, Volume XXVII, No.1, First September 2000.

328
Schwettmann, J., (2011). Capacity building for Africa’s cooperatives and social economy
organizations. A contribution to the Expert Group Meeting. Cooperatives in social
Development: Beyond 2012; 3 – 6 May, 2011, Ulaanbaatar, Mongolia.
Schwettmann, J., (1997). Cooperatives and employment in Africa. ILO, Occasional Discussion
Paper 97-1. ILO, Geneva
Sebopetji, O., (2008). An application of probit analysis to factors affecting small-scale farmers’
decision about credit. A case study of Greater Letaba Local Municipality, Limpopo
province. MSc thesis. University of Limpopo. 2008.
Sial, M., Awan, M., and Waqas, M., (2011). Role of institutional credit on agricultural
production: A time series analysis of Pakistan. International Journal of Economics and
Finance Vol. 3, No. 2; May 2011. [www.ccsenet.org/ijef]
Sigelman, L. and Zeng, L., (1999). Analysing censored and sample-selected data with Tobit and
Heckit models. The George Washington University. Political Analysis 8, pp. 167-182.
Sinha, S., and Martin, I., (1998). Informal Credit Transactions of Microcredit Borrowers in Rural
Bangladesh. IDS Bulletin 29.
Stiglitz, J., and Weiss, A., (1981). Credit rationing and markets with imperfect information.
American Economic Review, 71 (3), pp. 393-410.
Swain. R., (2007). The demand and supply of credit for households. Applied Economics.
Taylor & Francis 2681. http://www.tandf.co.uk/journals.
Swain, R., (2002). Credit rationing in rural India. Journal of Economic Development. 27 (2).
Tang, S., Guan, Z., and Jin, S., (2010). Formal and informal credit markets and rural credit
demand in China. Selected paper prepared for presentation at the Agricultural and
Applied Economics Association. AAEA, CAES and WAEA joint annual meeting,
Denvere, Colorado, July 25-27, 2010.
Toomet, O., and Henningsen, A., (2008). Sample Selection Models in R: Package Sample
Selection. Journal of Statistical Software. Vol. 27, Issue 7. http://www.jstatsoft.org/
Tongco, M. D., (2007). Purposive sampling as a tool for informant selection. Ethnobotany
Research and Application 5: pp. 147-158.
Tunahani, H., and Dizkirici, A., (2012). Evaluating the credit guarantee fund of Turkey as a
partial guarantee programme in the light of international practices. International journal
of business and social science, Vol. 3, No. 10. (Special Issue – May 2012. pp. 79-82.

329
Ukurut, N,. Schoombee, A., and van der Berg, S., (2004). Credit demand and credit rationing in
the informal financial sector in Uganda. Paper to the DPRU/Tips/Cornell Conference on
African Development and Poverty Reduction: The Macro-Micro Linkage, 13-14 October,
2004. Forum Paper. Somerset West, South Africa.
USAID (2005). Evaluation of Agricultural Cooperatives in Ethiopia programme Activities.
December 2005, Washington D.C.
USAID (1996). Conducting Key Informant Interviews. Performance Monitoring and Evaluation.
USIAD Centre for Dev’t Information & Evaluation. TIPS No.2, 1996. Washington D.C.
Verbeeck, M., (2004). A guide to modern econometrics. 2nd
Edition, Erasmus University
Rotterdam. John and Sons Ltd. England. p 429.
Vogel, R., and Adams, D., (1997). Costs and Benefits of Loan Guarantee Programmes. The
Financier 4(1 & 2), pp. 22-29.
Wale, E., (2000). The challenges in the search for efficient and sustainable rural credit
institutions and their policy implications in Ethiopia. In Institutions for Rural
Development. Proceedings of the 4th
Annual Conference of the Agricultural Economics
Society of Ethiopia. Negatu et al (eds.). 23-24 November, 1999. Addis Ababa. pp. 93-124
Wanyama, F., (2012). The Social and Solidarity economy in African Development: The role of
cooperatives. A paper prepared for a Cooperative Symposium on Perspectives for
Cooperatives in Southern Africa, Protea Hotel, Lusaka, Zambia, 20–21 August, 2012.
Wanyama, F., Develtere, P., and Pollet, I., (2008). Encountering the evidence: Cooperatives and
poverty reduction in Africa. Working papers on social and cooperative entrepreneurship.
WP-SCE 08.02, 2008.
Wiboonpongse, A., Sriboonchitta, S., and Chaovanapoonphol, Y., (2006). The demand for loans
for major rice in the Upper North of Thailand. Contributed paper for presentation at the
International Association of Agricultural Economics Conference, Gold Coast, Australia,
August 12-18, 2006. http://ageconsearch.umn.edu/bitstream/25303/1/cp060396.pdf
Wilkinson, T., and Bhandarkar, P., (1992). Methodology and Techniques of Social Research.
Himalaya Publishing House. Mumbai.
Wolday, A., (2010). A road map to build inclusive finance in Ethiopia (2011 – 2015). Building
the performance of inclusive finance providers. Proceedings of the 6th
Bi-annual
conference on microfinance dev’t in Ethiopia, Dire Dawa. AEMFI, 2008. pp. 11-57.
330
Wolday, A., (2009a). Meeting the financial needs of smallholder farmers in Ethiopia. In
Proceedings of the 10th
Anniversary of AEMFI Ethiopia. Alemu, T., (ed.). Addis Ababa,
Ethiopia. 2009. pp. 9 - 46.
Wolday, A., (2009b). Microfinance Institutions in Agriculture: The Ethiopian Experience.
Managing risk in financing agriculture. In Proceedings of the Expert meeting convened
and co-sponsored by AFRACA, FAO, the Lank Bank of South Africa, and the World
Bank. 01– 03 April, 2009. Johannesburg, South Africa.
Wolday, A., (2008a). A decade of Microfinance Institutions Development in Ethiopia: Growth,
Performance, Impact and prospect (2008 – 2017). Association of Ethiopian Microfinance
Institutions. Occasional Paper No. 21. January 2008. Addis Ababa. P. 118.
Wolday, A., (2008b). Value Chain Financing: Changing the perspective of providing financial
services to the livestock sector in Ethiopia. In Recent experiences of microfinance
institutions in Ethiopia: Growth, sustainability and challenges. Proceedings of the 5th
Bi-
annual conference on microfinance dev’t in Ethiopia, Assosa. AEMFI, 2008. pp. 26–75.
Wong, L P., (2008). Focus group discussion: a tool for health and medical research. Medical
Education J 2008; 49 (3), pp. 256-261.
World Bank (2015). Risk and finance in the coffee sector: A compendium of case studies related
to improving risk management and access to finance in the coffee sector. Agriculture
Global Practice, Discussion Paper 02. The World Bank.
World Bank (2008). Increasing access to rural finance in Bangladesh. The forgotten ‘’missing
middle’’. Directions in Development Finance. Washington DC.
World Bank (2006a). Attacking Africa’s Poverty. Editors (louise Fox and Robert Liebenthal).
Experience from the ground. Washington DC. 2006.
World Bank (2006b). Strategic Alliances to scale up financial services in rural areas. World
Bank Working paper 76. Washington DC.
World Bank (1994). Development of Rural Financial Markets in Sub-Saharan Africa. World
Bank Discussion Paper 219. Washington DC.
Yu, B., Diao, X., Seyoum, A., and Wamisho, K., (2008). An overview of the performance of
Ethiopian Economy. In Rural Development and Environment in Ethiopia: Prospects and
challenges. Proceedings of the 10th
Annual Conference of the Agricultural Economics
Society of Ethiopia. Tadesse et al. (eds). May 2008, Addis Ababa. pp. 1-34.

331
Zapata, N., (2006). Credit decision and rationing rules: A study of informal lenders in the
Philippines. Philippines management review, 2006, Vol. 13, pp.117-126.
Zecchini, S., and Ventura, M., (2009). The impact of public guarantees on credit to SMEs. Small
Business Economics (2009) 32, pp. 191-206.
Zeller, M., (1994). Determinants of credit rationing: A study of informal lenders and formal
credit groups in Madagascar. World Development, 22, pp. 1895-1907.
Zewde, B., (2000). The problems of institutionalization in modern Ethiopia: A historical
perspective. In Institutions, resources and development in Ethiopia. Proceedings of the 9th
Annual Conference on the Ethiopian Economy. Mekonen, A. and Aredo, D. (eds.). 8-9
October 1999. Addis Ababa. pp. 13-22.
Zhang, P., and Ye, Y., (2010). Study on the effective operation models of credit guarantee
system for small and medium enterprises in China. International Journal of Business and
management. Vol. 5, No. 9, September 2010.

332
APPENDICES
APPENDIX 1. INFORMATION SHEET AND CONSENT FORMS
Study on the Role of Credit Guarantee in Alleviating Credit Constraints among Coffee
Farmers’ Cooperatives in Ethiopia
INFORMATION SHEET AND CONSENT FORM – FGD
Good morning/afternoon. My name is Negussie Efa, and I am a PhD student with the University
of South Africa. My research project aims at exploring the role of a credit guarantee scheme in
addressing credit constraints among coffee farmers’ cooperatives in Ethiopia. The study will take
as a case the current CFC/MoA/CABI credit guarantee scheme to promote enhanced coffee
processing practices in Ethiopia. The study will examine the role of such scheme, its
effectiveness and factors affecting its performance and successes. The study will also look both
at the demand and supply side credit constraints. The findings of the study will be of great
significance in designing effective schemes in the future. It will also help to effectively
implement the current project.
I am requesting you to allow me to conduct a focus group discussion with you to obtain your
views on such issues as rural credit, role of credit guarantee, coffee processing and marketing
and cooperatives. The discussion will take slightly over an hour. I would like to inform you that
your participation is completely voluntary and you are not forced to take part in this study. You
are absolutely free to choose whether to participate or not. Your decision not to take part in the
study will not entail any effect on you. There will be no penalties or any other negative
consequences for stopping participating in the discussion at any stage.
I also seek your permission to allow me take notes of the discussion. Though complete
confidentiality may not be ensured in such group discussions, all notes and records of the study
that may identify you will be kept confidential. But confidentiality cannot be guaranteed in such
group discussions. I will however encourage group participants to maintain confidentiality of any
sensitive issues. The records from your participation may be reviewed by my supervisor or other
relevant people from the university to make sure that the research is done properly, but they will
also keep your identity confidential. All information that may identify participants will be kept

333
with me at a secure place and will not be available to others. If need arises, I will refer to you by
a code number in any report or publication.
Please kindly note that there are no direct and immediate benefits to you from participating in
this study. However, the study will be of great importance in enhancing the effectiveness of the
current project and in helping designing effective and appropriate interventions in the future.
This will obviously directly or indirectly benefit your community and the coffee cooperatives in
other parts of the country at large.
If you have any concern or complaints in relation to this study, please call the UNISA learning
centre in Ethiopia (0114-352089/ 0114-352093).
You may also contact me if you have any concern or queries on my telephone number:
0911882355, or email me: [email protected]
Focus Group Discussion Schedule
Good morning/afternoon, I'm Negussie Efa and I am conducting a study for my PhD research
project. I am undertaking my PhD study at the University of South Africa. My research aims at
exploring the role of credit guarantee in alleviating credit constraints among coffee farmers’
cooperatives in Ethiopia. The research will focus on issues related to credit demand, supply,
utilisation and recovery, role of credit guarantee, coffee cooperatives, coffee processing and
marketing by cooperatives. Today I would like to ask you some questions about these issues and
to discuss on them.
I have chosen your area purposively based on some predetermined criteria that are relevant for
the study. The fact that you are chosen is also deliberate. I would therefore like to request you to
answer the questions that follow as honestly as possible. Your opinion and views are important
in helping me attain the purpose of the research. I absolutely value your views and opinion
during the group discussion. The information discussed in this focus group is confidential though
it is difficult to guarantee confidentiality in a group context. The information you provide will be
kept in a secure place and used only for this study. If need be it may be shared with my

334
supervisor and other relevant people in the university. However, you will not be identified by
name; we will use codes in referring to your groups.
Particulars of the FGD
Date of FGD_________________________________
Time started ______________________________ Time Completed ____________________
Name of interviewer/moderator _______________ Type of the ________________________
Number of FG members ________________________
INFORMATION SHEET AND CONSENT FORM - KII
Hello, good morning/afternoon, my name is Negussie Efa, and I am a PhD student with the
University of South Africa. My research project aims at exploring the role of a credit guarantee
scheme in addressing credit constraints among coffee farmers’ cooperatives in Ethiopia. The
study will take as a case the current CFC/MoA/CABI credit guarantee scheme to promote
enhanced coffee processing practices in Ethiopia. The study will examine the role of such
scheme, its effectiveness and factors affecting its performance and successes. The study will also
look both at the demand and supply side credit constraints. The findings of the study will be of
great significance in designing effective schemes in the future. It will also help to effectively
implement the current project.
I am requesting you to allow me to ask you some questions to obtain your views on such issues
as rural credit, role of credit guarantee, coffee processing and marketing and cooperatives. The
interview will take about an hour and half. I would like to inform you that your participation is
completely voluntary and you are not forced to take part in this study. You are absolutely free to
choose whether to participate or not. Your decision not to take part in the study will not entail
any effect on you. There will be no penalties or any other negative consequences for stopping
participating in the study at any stage.
I also seek your permission to allow me take notes of the interview. All notes and records of the
study that may identify you will be kept confidential. We will note record your name anywhere.

335
The records from your interviews may be reviewed by my supervisor or other relevant people
from the university to make sure that the research is done properly, but they will also keep your
identity confidential. All information that may identify participants will be kept with me at a
secure place and will not be available to others. If need arises, I will refer to you by a code
number in any report or publication.
Please kindly note that there are no direct and immediate benefits to you from participating in
this study. However, the study will be of great importance in enhancing the effectiveness of the
current project and in helping designing effective and appropriate interventions in the future.
This will obviously directly or indirectly benefit your community or organisation and the coffee
cooperatives and other institutions in various parts of the country at large.
If you have any concern or complaints in relation to this study, please call the UNISA learning
centre in Ethiopia (0114-352089/ 0114-352093).
You may also contact me if you have any concern or queries on my telephone number:
0911882355, or email me: [email protected]
Key informant interview guides
Good morning/afternoon, I'm Negussie Efa and I am conducting a study for my PhD study. I am
currently undertaking my PhD study with the University of South Africa. My research aims at
exploring the role of credit guarantee in alleviating credit constraints among coffee farmers’
cooperatives in Ethiopia. The research will focus on issues related to credit demand, supply,
utilisation and recovery, role of credit guarantee, coffee cooperatives, coffee processing and
marketing by cooperatives. Today I would like to ask you some questions about these issues.
I have chosen your area or organisation purposively based on some predetermined criteria that
are relevant for the study. The fact that you are chosen is also deliberate based on your
knowledge and experience of the study issues. To obtain reliable information I kindly request
that you answer the questions that follow as honestly and frankly as possible. Your opinion and
views are important in helping meeting the purpose of the research. I absolutely value your
opinion and views. The information you provide to me will be kept confidential. If need be it

336
may be shared with my supervisor and other relevant people in the university. However, you will
not be identified by name or address in any of the research report or publication.
Particulars of the Interview
Date of KII__________________________
Time started _________________________ Time Completed _____________________
Type of KI___________________________ Name of interviewer __________________

337
Cooperative’s chairperson or manager questionnaire
Good morning/afternoon; my name is Negussie Efa, and I am a PhD student with the University
of South Africa. My research aims at exploring the role of credit guarantee in alleviating credit
constraints among coffee farmers’ cooperatives and factors influencing its effectiveness. The
research will focus on issues related to credit demand, supply, utilisation and recovery, role of
credit guarantee, coffee cooperatives, coffee processing and marketing by cooperatives. I would
like to ask you to answer questions related to these issues, which I hope will directly or indirectly
benefit your cooperative and possibly cooperatives in other coffee producing areas of the
country. The study will generate useful findings for designing relevant and appropriate
interventions as well as to effectively implement the current credit guarantee scheme.
Your cooperative has been purposively selected to take part in this study. The study is carried out
in 11 coffee producing districts of eight zones. In total, 100 cooperatives have been selected to
take part in this study. Please note that participation in this study is absolutely voluntary and I
would appreciate it if you can take some time to respond to the following questions. I would also
like to inform you that you are free to withdraw from participating in the study at any stage if
you decide not to take part in the study. Decision to withdraw from the study will not entail any
penalties or any undesirable consequences. However, I would greatly appreciate it if you could
kindly share your views with me.
All the information you provide will be kept confidential and will never be related to your name
or address. As your name will not be recoded anywhere on the questionnaire, no one would be
able to link you to the information you provided. I will refer to you by a code in the study report
or any other publication. Only myself and my supervisor will have access to the anonymous
information.
The interview will last for about an hour. I will be asking you a number of questions and request
you to bear with me and provide genuine answers as possible. If you have any question or seek
clarification, please stop us at any time and ask.
If you wish to have any further information about the study, please feel free to contact me.
Thank you very much for your willingness to take part in this study.

338
Negussie Efa
PhD Candidate, University of South Africa
Tel. 0911882355; email: [email protected]
The interviewer (Mr/Mrs/Ms_______________________) will be contacting you on my behalf.
CONSENT
I _____________________________, the undersigned, hereby willingly volunteer to participate
in a research on the Role of Credit Guarantee in Alleviating Credit Constraints among Coffee
Farmers’ Cooperatives in Ethiopia.
The purpose, procedures and expected benefits of the study have been explained to me and I
have been given a chance to seek clarifications. I understand that I am participating freely and
without being forced to do so. I am fully aware that I can freely withdraw from taking part in the
study at any time without facing any penalty.
I have been told that this is a study that will not necessarily generate immediate personal benefit
to me.
I understand that the information I provide will remain confidential and that this consent form
will not be related to the answers I provide. I also agree to the note taking of my participation in
the study.
Signature ............................... Place ...................... Date:…………………..

339
APPEDIX 2. KEY INFORMANT INTERVIEWs, FOCUS GROUP DISCUSSION AND
OBSERVATION GUIDES
Key Informant Interviews Guides
1. Coffee production, processing and marketing:
a. What is the cultural and economic significance of coffee in this area?
b. What are the major coffee varieties you commonly grow in this area?
c. Can you describe practices and constraints of coffee production in the area?
d. Can you describe practices, key changes & constraints of coffee processing in the area?
e. In your view, which processing method do cooperatives in your area prefer; why?
f. Can you describe experiences, key changes and constraints of coffee marketing practices?
g. What are the major coffee marketing channels for primary cooperatives?
h. Which market outlets are preferred by cooperatives? Why?
i. Are there differential market prices for coffee of different qualities?
j. How do you set the prices of coffee during marketing (during selling or purchase)?
2. Views and information on credit services for agriculture and coffee:
a. What are the major credit sources for agriculture and coffee in the area?
b. How is the banks’ loan portfolio for the agriculture and coffee sector over years?
c. Can you describe the lending policies, procedures, terms and conditions of the financial
institutions, which may include:
Priority sectors, types & terms of loan, interest rate, collateral requirement, loan
processing, disbursement, monitoring and recovery mechanisms
d. What factors are taken into account in determining loan amount, duration of loan,
repayment schedule, interest rate, etc?
e. What kind of loan do banks prefer to supply to cooperatives, which may include:
For processing facilities, crop advance to their members, for purchasing and
locally selling coffee, for exporting coffee, etc)?
f. How do you see coffee cooperatives’ demand for credit and is it currently satisfied?
g. Are loans from formal financial institutions accessible to coffee coops? If not, why?
h. What kind of loan do most coffee farmers and cooperatives require, in terms of:

340
Type, amount, purpose, mode of disbursement, duration, repayment schedule?
i. What do you think about efforts made by formal financial institutions to reach
smallholder coffee farmers and their cooperatives?
j. Do banks think that lending to farmers coops is profitable and feasible? If not, why?
k. In your opinion, what are the major causes of default among coffee cooperatives?
3. Views regarding cooperatives credit history and experience:
a. Has your cooperative ever obtained loan from banks?
b. If yes, from which banks, how much, for what purpose?
c. Have you ever borrowed from other sources? If yes, which sources, how much and
for what purpose?
d. Which lending institution does your cooperative prefer; why?
e. What was the largest and smallest amount you borrowed?
f. Did previous loans meet your cooperative’s demand? If not, why?
g. Has your cooperative been ever denied loans? If yes, why?
h. Did you have difficulties in repaying the loan? What were reasons for default or
delay, if any?
i. Is there any case of loan diversions among your cooperative? If any, how and what
were the reasons?
j. Is your cooperative ready and willing to repay future loans?
k. What were the major challenges & constraints of your cooperative in obtaining and
utilising bank loans?
4. Views regarding role of credit guarantee fund in easing loan constraints?
a. Do you think that most cooperatives want to acquire loans at the prevailing interest
rate if credit guarantee is provided?
b. What is your view regarding the design & arrangement of the current guarantee fund?
c. Do you think that credit guarantee scheme can enable banks widely reach farmers’
cooperatives? How? If not why?
d. In your opinion can such intervention improve bank’s flexibility in extending loans to
cooperatives – in terms of easing procedures, conditions, timing, etc.
e. What other conditions do banks expect cooperatives to fulfill if CG is provided?
f. Are banks interested and willing to be involved in such schemes?

341
g. Are banks satisfied with the 50% risk sharing guarantee fund? If not why?
h. Who should pay guarantee fees; are banks ready and willing to pay guarantee fees?
i. What features of this guarantee scheme did you like and dislike? Why?
j. Do you think that cooperatives really need loan (and the investment they have
planned) or they just want to obtain because it is available under the current scheme?
k. What other challenges/constraints do you foresee in supplying credit to cooperatives
after getting credit guarantee? Which ones are most important?
l. Do banks have previous experience with use of credit guarantee? If yes, with whom?
Was it successful?
m. What do you think can enhance the effectiveness of a guarantee scheme?
n. Do you think that availability of credit guarantee would have impact on borrowers’
and banks loan recovery behavior and efforts?
5. Views about perception and attitude towards cooperatives and their services?
a. Can you describe operations and major services provided by your cooperative?
b. Are coffee/multipurpose cooperatives involved in SACCOs?
c. Do you think that cooperatives are effective and beneficial to member farmers?
d. How do you see member farmers’ confidence in their cooperatives and management?
e. What is your view regarding commitment of management to serve their members?
f. What is your opinion and experience regarding how the board & committee are
elected, general assembly, business plan preparation and approval, etc.
g. What is your view regarding suitability of cooperatives to serve as intermediaries for
bank loans - how? If not why?
h. How do you see the performance & benefits of coops in marketing members’ coffee?
i. Do you think that more farmers are interested to join cooperatives?
j. How do you see the capacities of cooperatives? What are the gaps?
k. How is cooperatives’ working relationship with extension and other institutions?
l. What are the main cost centres for the cooperatives?
m. How do you look at good governance in cooperatives?
n. What type of committee does your cooperative have and which ones are active?
o. What financial and accountability documents do you have?
p. What are the major challenges and constraints facing cooperatives in your area?

342
Focus Group Discussion guides
1. Significance of (economic and cultural) coffee in the area:
a. What is the importance of coffee in this area?
b. What are the socio-cultural uses of coffee in this area?
c. What importance do women in your area attach to coffee & why?
2. What meanings/importance do men in this area/ Ethiopia attach to coffee and why?
a. Coffee production, processing and marketing experiences:
b. Describe the different varieties of coffee that you know and/or grow.
c. Which varieties of coffee do well in this area and why?
d. Can you describe trends and experiences of coffee production, processing and
marketing practices in the area?
e. How is the labour for coffee production in this area organised?
f. What are the major challenges of coffee production, processing & marketing?
g. How do you see coffee marketing channels in relation to cooperatives?
3. Views on credit services in the area:
a. What are the major credit sources for cooperatives in the area?
b. What do you think are the pros and cons of these different credit sources?
c. What are your views about formal financial institutions’ terms and conditions of
existing loan products, lending procedures and policies, etc?
d. How do you see coffee cooperatives’ demand for, access to and utilisation of credit?
What are the major challenges?
e. How do you see loan repayment behavior among cooperatives and its determinants?
f. What are the loan preferences of cooperatives in terms of purpose, amount,
duration, repayment schedule, etc?
4. Perception and views about cooperatives and their services/operations.
a. Can you describe background of your cooperatives (year of establishment, purpose,
membership, etc)?
b. How do you see the operations and services provided by your cooperatives (coffee
purchasing, processing, selling, input supply, etc)?
c. How do you see the trust and confidence of members in their coops and management?

343
d. Has there been improvement in cooperatives’ operation in recent years in this area?
e. What do you think about suitability and possibility of using cooperatives as
intermediaries for bank loans?
f. What is your perception of union’s services and support to cooperatives?
5. Views about loan security and role of loan guarantee fund.
a. Do you think that loan security (collateral) is a major constraint among cooperatives
in obtaining bank loan?
b. How do you see the role of the partial credit guarantee in easing coops’ credit
constraints?
c. Do coffee cooperatives seriously need loan or they just wanted to obtain because it is
available through the scheme?
d. Do they really need the investment they have planned to make or they just wanted to
have it because fund is available?
e. What setbacks do you expect of such credit guarantee schemes?
6. Views on other emerging or contentious issues (identified during the research process).

344
Observational protocol
1. Introductions – self and the research project
2. Record information on date, time, event and/or place of observation
3. Conduct observations at various places and events with different groups:
a. Interactions between different actors (farmers, coops, financial institutions, etc)
b. Coffee farmers’ cooperatives activities, practices and behaviors.
c. Coffee farmers coops’ coffee production, harvesting, processing and marketing
d. Loan application, screening, disbursement, utilisation and monitoring practices.
e. Traders activities and practices – in coffee processing and marketing
f. Extension and cooperative workers activities in supporting farmers and cooperatives
4. Thank the individuals or groups for participating or allowing to observe.

345
APPEDIX 3. Questionnaires
Questionnaire for coffee cooperatives’ chairperson or manager – 1st round survey
Date of interview ________________; Region _________________; District_______________
Name of cooperative ___________________; Name of interviewer ______________________
A. Background information and resource ownership
1. In which year was your cooperative established _____________(E.C)
2. What is the member size of your cooperative________________ ?
3. Out of the total, how many are female members ______________?
4. What is the type of your cooperative? (1) Coffee cooperative (2) Multipurpose coops
5. What is the main business activity of your cooperative? (1) Coffee trade (2) Grain trade (3)
Other trade activities (4) Fertilizer & other input supply (5) 1 and 2 (6) 1, 2 & 3 (7) 1, 2,
3 and 4 (8) Others (specify) ________________
6. How old is the chairperson of your cooperative ______years?
7. What is the educational level of your cooperative’s chairperson? (1) Illiterate (2) Only read
and write (3) Completed primary (4) Attended secondary school (5) Post-secondary school
8. How many employed workers does your coop have as of September 2012 (2005 E.C)? _____
9. Does your coop have professional manager as of September 2012? (1) Yes (2) No
10. Does your coop have an accountant as of September 2012 (2005 E.C.)? (1) Yes (2) No
11. Has your coop been selected to participate in the credit guarantee scheme? (1)Yes (2) No
12. How much capital does your coop have in bank as of September 2012 (2005 E.C.)?____ Birr
13. What was the amount of your coop’s capital in stock as of September 2012?__Birr
14. How much is your outstanding liability as of September 2012 (2005 E.C.), if any? ____ Birr
15. Has your cooperative been regularly auditing its accounts? (1) Yes (2) No
16. Asset ownership and their current value (as of end of 2012):

346
Resource Number Value (Birr) Resource Number Value (Birr)
Weighing scale Coffee huller
Office Wet mill
Warehouse Floor mill
Houses/rooms for
rent
Others
(specify)
Shop
B. Expenditures
17. Expenditures (investment and other expenses) incurred during the year (January –Dec) 2012
17.1. Investment on capital goods (warehouse, coffee machine, office, etc)
17.2. Processing, transport and marketing of products
17.3. Tax and rents
17.4. Salaries
17.5. Labour cost and inputs
17.6. For social purposes; e.g. school, road, water development and other
community services
17.7. Others (specify)
C. Infrastructural and institutional services
18. How far is your cooperative located from the nearest vehicle accessible road? _______Km
19. How far is your cooperative from the nearest bank (any bank)?_______Km
20. How far is your cooperative located from the district/woreda office ?_______Km
21. How far is your cooperative located from the nearest primary coffee market centre?_____Km
22. How far is your cooperative from the nearest coffee hulling station? _____Km
23. How far is your cooperative from the nearest coffee washing station? _____Km
24. Did your coop have any contact with extension/cooperative DA in 2012? (1) Yes (2) No
25. If yes, how many times did the extension agent visit your cooperative in the year 2012?_____
26. Do you think that your cooperative has received adequate support from cooperative
promotion office and agents? (1) Yes (2) No
27. Is your cooperative a member of coffee union? (1) Yes (2) No

347
28. If 27 is yes, what services have you received from the cooperative union? (1) Farm inputs
(2) Loan (3) Coffee processing and drying facility/materials (4) Coffee marketing (5)
Education or training and consultancy (6) All (7) Others (specify)__________________
29. If your coop is a member of coffee union, do you think that it is beneficial? (1) Yes (2) No
30. Did your cooperative participate in other previous projects that targeted coffee quality
improvement or credit service? (1) Yes (2) No
D. Cooperatives experience with credit services (credit history)
31. Did your cooperative apply for bank loans during the following years?
31.1 Year 2010 (January 2002 – December 2003 E.C.) (1)Yes (2) No
31.2 Year 2011 (January 2003 – December 2004 E.C.) (1)Yes (2) No
31.3 Year 2012 (January 2004 – December 2005 E.C.) (1)Yes (2) No
32. If number 31 is yes, what was the amount you requested for in Birr?
32.1 Year 2010
32.2 Year 2011
32.3 Year 2012
33. Did your cooperative take loan during the following years?
33.1 Year 2010 (January 2002 – December 2003 E.C.) (1) Yes (2) No
33.2 Year 2011 (January 2003 – December 2004 E.C.) (1) Yes (2) No
33.3 Year 2012 (January 2004 – December 2005 E.C.) (1) Yes (2) No
34. If your coop obtained loan during the following years, how much did you borrow in Birr?
34.1 Year 2010
34.2 Year 2011
34.3 Year 2012
35. If your cooperative had received loans during the following years, what was the source?
35.1 Year 2010 (1) Cooperative Bank of Oromia (2) Commercial Bank of Ethiopia
(3) Microfinance Institute (4) Coop Union (5) SACCO/RUSACCO
(6) Other private banks (Specify) ______________

348
35.2 Year 2011 (1) Cooperative Bank of Oromia (2) Commercial Bank of Ethiopia
(3) Microfinance Institute (4) Coop Union (5) SACCO/RUSACCO
(6) Other private banks (Specify) ________________
35.3 Year 2012 (1) Cooperative Bank of Oromia (2) Commercial Bank of Ethiopia
(3) Microfinance Institute (4) Coop Union (5) SACCO/RUSACCO
(6) Other private banks (Specify) _________________
36. If you took loan in 2010 and 2011, what was the purpose for which loan was taken? (1) To
purchase fresh cherries (2) To purchase dry coffee (3) To install wet-mill (4) To buy
drying materials (5) To buy hulling machine (6) To buy inputs (7) Others (specify)_____
37. If you took loan in 2012 (January 2004 – December 2005 E.C), what was the purpose for
which loan was taken? (1) To purchase fresh cherries (2) To purchase dry coffee (3) To
install wet-mill (4) To buy drying materials (5) To purchase hulling machine (6) To
purchase inputs (7) Others (specify) _____________
38. If your coop received loan during the following years, how long was the duration of the loan
(in months)?
38.1 Year 2010
38.2 Year 2011
38.3 Year 2012
39. If your coop took loans during the following years, was the amount obtained adequate for the
purpose you needed for?
39.1 Year 2010 (1) Yes (2) No
39.2 Year 2011 (1) Yes (2) No
39.3 Year 2012 (1) Yes (2) No
40. If your coop obtained loan in the past years, how long did loan processing take you (in
weeks) from application to loan approval and release?
40.1 Year 2010
40.2 Year 2011
40.3 Year 2012

349
41. Was your cooperative’s application for a bank loan ever rejected? (1) Yes (2) No
42. If 41 is yes, why? (1) Lack of collateral (2) Problem of liquidity (shortage of loan fund)
among the bank (3) Lack of good quality business activity that deserve financing (4) We
were not told the reason (5) Due to previous default (6) Others (specify) ___________
43. Did your cooperative ever fail to repay its loan as per the contract? (1) Yes (2) No
44. If number 43 is yes, what was the reason? (1) Could not repay due to lack of capacity (2)
Did not want to repay or was just reluctant (3) Others (specify) ___________
45. If you ever borrowed from cooperative union, was it bearing interest? (1) Yes (2) No
E. Cooperatives’ institutional (bank) credit demand
46. Does your coop seriously need a bank loan at the prevailing interest rate? (1) Yes (2) No
47. If your cooperative needs a loan, what is the amount of loan you require as of September
2012 (2005 E.C.)? ________ Birr
48. If your cooperative needs a loan, what is the amount of loan you require at present?____ Birr
49. If number 46 is yes, what purpose do you need the loan for (1) To purchase and immediately
sell fresh cherries (2) To purchase and dry fresh cherries (3) To purchase and sell dry
coffee (4) To install wet-mill (5) To purchase drying materials (6) To purchase hulling
machine (7) To purchase inputs (8) All (9) Others (specify)______________
50. If 46 is yes, when do you want to receive the loan (write the preferred month)? ________
51. If number 46 is yes, for how long do you need the loan (loan duration)? ________Months
52. What is your preferred loan repayment schedule? (1) Monthly any time (2) Monthly during
coffee harvesting time (3) Quarterly (4) Every six month (5) Annually (6) At the end of
harvesting season (7) Other suggestion (specify) _______________
53. How do you determine your cooperatives loan requirement? (1) Based on our business plan
(2) Estimation by committee (3) Estimation by cooperative agent/office (4) Others (specify)
54. Do you think that lack of collateral is a major bottleneck to your cooperative to access bank
credit? (1) Yes (2) No
55. Do you think that availability of credit guarantee will enhance your cooperative’s loan
demand (need)? (1) Yes (2) No
56. Do you think that availability of credit guarantee will enhance your cooperative’s access to
bank loan? (1) Yes (2) No

350
57. Do you think that your cooperative is ready and willing to repay loans provided under the
current guarantee scheme? (1) Yes (2) No
58. If your cooperative does not need to apply for a bank loan, what is the reason? (1) Have
enough capital (2) Do not have viable business to finance (3) Fear of being indebted or
failure to repay (4) Lack of awareness about possibility of borrowing from bank (5)
Thought unable to meet banks’ lending requirements (6) Banks do not provide loans that suit
you needs (7) High interest rate (8) Others (specify) ________
59. What do you think affects credit repayment by cooperatives? (1) Lack of capacity
(2) Lack of awareness & reluctance (3) Poor monitoring & follow up by banks
(4) Nature of contractual agreement and repayment schedule (5) Others (specify) _______
60. What is your opinion regarding main constraints and challenges of cooperatives in accessing
bank loan? (1) Collateral requirement (2) High interest rates (3) Time of availability (4)
Repayment schedule (5) Loan size/amount (6) Lack of awareness (7) Distance from the
lending institutions (8) Loan procedure and processing time (9) Others (specify)_________
F. Opinions about services provided by cooperatives
61. Do you think that cooperatives are beneficial to their members? (1) Yes (2) No (3) Not sure
62. Do you think that many farmers have confidence in coops & its management? (1) Yes (2)No
63. Do you think that many farmers are interested to be members of cooperatives? (1) Yes (2) No
64. Do most members sell their coffee to their cooperatives? (1) Yes (2) No
65. Do you think cooperatives play important role in marketing farmers’ coffee? (1)Yes (2) No
66. Do you think that cooperatives can borrow from bank and in turn pass on (lend) to its
individual members? (1) Yes (2) No
67. Has your coop ever given loans or advances to its individual members? (1) Yes (2) No
68. In your opinion, what capacities and skills do cooperatives and their management lack? (1)
Financial literacy (2) Management skills (3) Good governance (4) Coffee processing (5)
Business skills (6) All (7) Others (specify)___________________
G. Coffee processing and marketing experiences
69. For how long has your cooperative been involved in coffee business? _________(years)
70. How does your cooperative trade majority of its coffee? (1) Buy and sell fresh cherry (2)
Buy fresh cherry & sun-dry (3) Buy dry cherry & sell as it is (4) Buy dry cherry & hull

351
(5) Buy & sell green beans (6) 1 and 2
71. Which processing method does your coop prefer to use? (1) Sun-drying (2) Washed method
72. If you use sun-drying technique, how does your cooperative undertake sun-drying of
cherries? (1) On the ground/soil (2) On brick/cemented floor (3) On raised bed (made of
local materials) (4) On raised bed (made of wire mesh) (5) Others (specify) __________
73. Which coffee processing facilities does your cooperative need most? (1) Wire mesh & other
drying facilities (2) Small hand pulper (3) Small hullers (4) Big washing station
(5) Big hulling machine (6) Others (specify)__________________
74. Where does your cooperative buy coffee from? (1) At primary market centre (2) In various
villages (3) At cooperative centre (4) In local markets (5) Others (specify)_________
75. When your cooperative buy coffee from members, how is payment for cherries or dry coffee
made? (1) Full cash payment upon delivery by farmers (2) Partial payment on delivery (3)
Full payment later after sale of coffee (4) Others (specify)_________________
76. Are farmers willing to supply their coffee to your coop on loan? (1) Yes (2) No
77. How does your cooperative prefer to sell its coffee? (1) Fresh cherry (2) Dry Jenfel coffee
(3) Hulled green beans (4) Washed parchment (5) Others________________________
78. What proportion of your cooperatives coffee do you sell to the union? (1) All (2) About
half (3) Less than half (4) More than half
79. During purchase, does your coop pay different prices based on coffee quality? (1)Yes (2)No
80. During coffee sales, does traders or union pay your cooperative different prices for coffee of
different quality? (1)Yes (2) No
81. How much income did your cooperative get from non-coffee activities in 2012 (January
2004-December 2005 E.C)?_______ Birr
82. What volume of fresh cherry did your coop buy (in Kg) during the following coffee seasons?
82.1 Year 2010 (2003 E.C)
82.2 Year 2011 (2004 E.C)
82.3 Year 2012 (2005 E.C)
83. What volume of dry coffee did your cooperative buy (in Kg) during the following years?
83.1 Year 2010 (2003 E.C)
83.2 Year 2011 (2004 E.C)

352
83.3 Year 2012 (2005 E.C)
84. What was the amount of coffee your cooperative processed (sun-dried or washed) in Kg?
84.1 Year 2010 (2003 E.C)
84.2 Year 2011 (2004 E.C)
84.3 Year 2012 (2005 E.C)
85. What amount of coffee did your cooperative directly sell without processing (in Kg)?
85.1 Year 2010 (2003 E.C)
85.2 Year 2011 (2004 E.C)
85.3 Year 2012(2005 E.C)
86. Where did your cooperative sell its coffee over the following years?
86.1 Year 2010 (2003 E.C) (1) Union (2) Local traders (3) Processors (4) ECX
(5) Private exporters (6) Directly exported
86.2 Year 2011 (2004 E.C) (1) Union (2) Local traders (3) Processors (4) ECX
(5) Private exporters (6) Directly exported
86.3 Year 2012 (2005 E.C) (1) Union (2) Local traders (3) Processors (4) ECX
(5) Private exporters (6) Directly exported
87. What time did your cooperative sell its coffee over the past years?
87.1 Year 2010
(2003 E.C)
(1) Immediately during harvesting (2) At the end of harvesting
(3) Later when market was attractive (4) Others ( specify)_____
87.2 Year 2011
(2004 E.C)
(1) Immediately during harvesting (2) At the end of harvesting
(3) Later when market was attractive (4) Others ( specify)_____
87.3 Year 2012
(2005 E.C)
(1) Immediately during harvesting (2) At the end of harvesting
(3) Later when market was attractive (4) Others ( specify)_____
88. On average, for how long did your coop store coffee in its warehouse over the past years?
88.1 Year 2010 (2003 E.C) Month
88.2 Year 2011 (2004 E.C) Month
88.3 Year 2012 (2005 E.C). Month

353
89. What was the quality grade of the majority of your cooperatives coffee over years?
89.1 Year 2010 (2003 E.C) (1) 1st (2) 2
nd (3) 3
rd (4) 4
th (5) 5
th and below
89.2 Year 2011 (2004 E.C) (1) 1st (2) 2
nd (3) 3
rd (4) 4
th (5) 5
th and below
89.3 Year 2012 (2005 E.C) (1) 1st (2) 2
nd (3) 3
rd (4) 4
th (5) 5
th and below
90. How much income did your cooperative get from coffee sale?
90.1 Year 2010 (2003 E.C)
90.2 Year 2011 (2004 E.C)
90.3 Year 2012 (2005 E.C)
91. Did your cooperative get profit from coffee sale over the following years?
91.1 Year 2010 (2003 E.C) (1) Yes (2) No
91.2 Year 2011 (2004 E.C) (1) Yes (2) No
91.3 Year 2012 (2005 E.C) (1) Yes (2) No
92. If number 91 is yes, how much profit (in Birr) did your cooperative get over years?
92.1 Year 2010 (2003 E.C)
92.2 Year 2011 (2004 E.C)
92.3 Year 2012 (2005 E.C)
93. How much (total) dividend did you pay to your members over the past years (in Birr)?
93.1 Year 2010 (2003 E.C)
93.2 Year 2011 (2004 E.C)
93.3 Year 2012 (2005 E.C)
94. What additional investment did you make in 2012 (2005 E.C)? (1) Built warehouse (2)
Installed wet-mills (3) Built new office (4) Acquired drying facilities (5) Acquired hulling
machines (6) Acquired vehicle (7) Built school (8) Bought vehicle (9) Others (specify) __

354
Questionnaire for coffee cooperatives’ chairperson or manager – 2nd
round survey
(both scheme participant and non-participant cooperatives)
Date of interview _________________; Region ______________; District______________
Name of cooperative ___________________; Name of interviewer __________________
Background information and resource ownership
1. What is the member size of your cooperative? ________ Male ______ Female
2. How many permanent workers are currently employed by your cooperative?________
3. Does your cooperative have professional manager at present? (1) Yes (2) No
4. Does your cooperative have an accountant at present? (1) Yes (2) No
5. How much capital does your cooperative currently have in bank? _________ Birr
6. What is the amount of capital of your cooperative in stock? _________ Birr
7. How much is your current outstanding liability (if any)? ________ Birr
8. Asset ownership and value of assets owned
Resource Number Value (Birr) Resource Number Value (Birr)
Weighing scale Vehicle
Office Motorbike
Warehouse Generator
Coffee huller Water pump
Coffee wet mill Safe box
Floor mill Others
(specify)
Shop
Cooperatives experience with credit services (credit history)
2013 2014
9. Did your cooperative apply for a bank loan in? (Yes/No)
10. Did your cooperative take loan in? (Yes/No)
11. Was your application for a bank loan rejected in? (Yes/No)
12. If your cooperative obtained loan, how much did you borrow in Birr?

355
13. If you received loan, how long was the duration of the loan? _months.
14. If your cooperative obtained loan in, how long did loan processing
take (in weeks)
15. If your coops took loan in 2013, what was the source? (1) Coop Bank of Oromia (2)
Commercial Bank of Ethiopia (3) MFI (4) Coop Union (5) Other private banks
16. If your cooperative took loan in 2014, what was the source? (1) Coop Bank of Oromia (2)
Commercial Bank of Ethiopia (3) MFI (4) Coop Union (5) Other private banks
Coffee processing and marketing experiences
17. Are farmers willing to deliver their coffee to your cooperative & receive payment latter after
sale? (1) Yes (2) No
18. How does your cooperative trade the majority of its coffee at present? (1) Sell fresh cherry
(2) Buy fresh cherry & sun-dry (3) Buy dry cherry & sell as it is (4) Buy dry cherry & hull
(5) Buy & sell green beans
19. If you use sun-drying technique, how do you undertake sun-drying of cherries? (1) On
cemented floor (2) On the ground/soil (3) On raised bed (made of local materials) (4) On
raised bed (mesh wire)
2013 (Kg) 2014 (Kg)
20. What volume of fresh cherry did you buy?
21. What volume of dry coffee did you buy?
22. What was the amount of coffee you processed?
23. What amount of coffee did you directly sell without processing
(without sun-drying or washing)?
24. On average, for how long did you store coffee in your warehouse in 2013? ________Month
25. What was the quality grade of the majority of your coffee in 2013? (1) 1st (2) 2
nd (3) 3
rd
(4) 4th
and below
2013 (Birr) 2014 (Birr)
26. How much income did you get from coffee sale during?
27. How much income did your cooperative get from non-
coffee business activities during?

356
28. Did you get profit from coffee sale during? (Yes/No)
29. If number 27 is yes, how much profit did you get in?
30. How much dividend did you pay your members in?
31. What additional investment did you make in 2013 and 2014? (1) Built warehouse (2)
Installed wet-mills (3) Built new office (4) Acquired drying facilities (5) Acquired hulling
machines (6) Acquired vehicle (7) Built school (8) Others (specify) _______
Copyright © 2022 FDOKUMEN