The Road to Success - Rigshospitalet
142
1 The Road to Success Long-term prognosis for persons living with HIV in Denmark -time trends and risk factors by Nicolai Lohse Copenhagen 2014
-
Upload
khangminh22 -
Category
Documents
-
view
0 -
download
0
Transcript of The Road to Success - Rigshospitalet
1
The Road to Success
Long-term prognosis for persons living with HIV in Denmark
-time trends and risk factors
by
Nicolai Lohse
Copenhagen
2014

2
TABLE OF CONTENTS
1 Introduction .................................................................................................................. 6
1.1 The HIV epidemic ....................................................................................................................... 6
2 Aims of this thesis ....................................................................................................... 7
2.1 Specific aims .............................................................................................................................. 7
2.2 Scope of this work related to my PhD thesis ............................................................................. 7
3 Data sources ................................................................................................................ 8
3.1 The Danish HIV Cohort Study (DHCS) ...................................................................................... 8
3.2 DHCS Greenland ....................................................................................................................... 8
3.3 Danish National Patient Registry (DNPR) ................................................................................. 8
3.4 Danish Civil Registration System (DCRS) ................................................................................. 8
3.5 Danish Cancer Registry (DCR) .................................................................................................. 9
3.6 Danish HIV Sequence Database (DHSD) ................................................................................. 9
4 Methodological considerations .................................................................................. 9
4.1 Utility of the DHCS cohort .......................................................................................................... 9
4.2 Outcomes ................................................................................................................................. 10
4.3 Descriptive and analytic studies ............................................................................................... 11
4.4 Measures of frequency and effect ............................................................................................ 11
4.5 Bias and confounding ............................................................................................................... 11
4.6 Statistical analyses ................................................................................................................... 14
4.7 Data safety end ethics .............................................................................................................. 14
5 Early detection ........................................................................................................... 14
5.1 Background .............................................................................................................................. 14
5.2 Trends in late diagnosis and late presentation ........................................................................ 15
5.3 Boosting early diagnosis and presentation for care (paper I) .................................................. 16
5.4 Conclusion ................................................................................................................................ 19
3
6 Access to good health care ...................................................................................... 19
6.1 Background .............................................................................................................................. 19
6.2 Uptake of antiretroviral therapy (paper II) ................................................................................ 19
6.3 Conclusion ................................................................................................................................ 21
7 Virological control ..................................................................................................... 21
7.1 Background .............................................................................................................................. 21
7.2 ART combinations .................................................................................................................... 22
7.3 Triple-class virological failure (paper III) .................................................................................. 22
7.4 Consequences of suboptimal virological control (paper IV) .................................................... 23
7.5 Conclusion ................................................................................................................................ 24
8 Drug resistance ......................................................................................................... 25
8.1 Background .............................................................................................................................. 25
8.2 Time trends in drug resistance development (paper V) .......................................................... 26
8.3 Time trends in transmission of drug-resistant HIV (paper VI) ................................................. 27
8.4 Consequences of harbouring drug resistance mutations (paper VII)...................................... 29
8.5 Conclusion ................................................................................................................................ 30
9 Life expectancy .......................................................................................................... 31
9.1 Background .............................................................................................................................. 31
9.2 Long-term survival (paper VIII) ................................................................................................ 32
9.3 Conclusion ................................................................................................................................ 34
10 Comorbidity ............................................................................................................ 35
10.1 Background .............................................................................................................................. 35
10.2 Mechanisms by which non-AIDS conditions could be related to HIV ..................................... 36
10.3 Comorbidity and survival (paper IX)......................................................................................... 36
10.4 Conclusion ................................................................................................................................ 39
11 Perspectives ........................................................................................................... 39
11.1 Status of the epidemic .............................................................................................................. 39

4
11.2 Future opportunities ................................................................................................................. 40
12 Conclusion .............................................................................................................. 42
13 Summary ................................................................................................................. 42
14 References .............................................................................................................. 44

5
This review is based on the following papers
I. Søgaard OS, Lohse N, Østergaard L, Kronborg G, Røge B, Gerstoft J, Sørensen HT, Obel N.
Morbidity and risk of subsequent diagnosis of HIV: a population based case control study
identifying indicator diseases for HIV infection. PLoS One. 2012;7(3):e32538. (1)
II. Lohse N, Ladefoged K, Obel N. Implementation and effectiveness of antiretroviral therapy in
Greenland. Emerg Infect Dis. 2008 Jan;14(1):56-9. (2)
III. Lohse N, Obel N, Kronborg G, Laursen A, Pedersen C, Larsen CS, Kvinesdal B, Sørensen
HT, Gerstoft J. Declining risk of triple-class antiretroviral drug failure in Danish HIV-infected
individuals. AIDS. 2005 May 20;19(8):815-22. (3)
IV. Lohse N, Kronborg G, Gerstoft J, Larsen CS, Pedersen G, Pedersen C, Sørensen HT, Obel N.
Virological control during the first 6-18 months after initiating highly active antiretroviral
therapy as a predictor for outcome in HIV-infected patients: a Danish, population-based, 6-
year follow-up study. Clin Infect Dis. 2006 Jan 1;42(1):136-4. (4)
V. Audelin AM, Lohse N, Obel N, Gerstoft J Jørgensen LB. The incidence rate of HIV type-1 drug
resistance in patients on antiretroviral therapy: a nationwide population-based Danish cohort
study 1999-2005. Antivir Ther 2009; 14(7):995-1000. (5)
VI. Lohse N, Obel N, Kronborg G, Jørgensen LB, Pedersen C, Larsen CS, Kvinesdal B, Sørensen
HT, Gerstoft J. Declining prevalence of HIV-infected individuals at risk of transmitting drug-
resistant HIV in Denmark during 1997-2004. Antivir Ther. 2006;11(5):591-600. (6)
VII. Lohse N, Jørgensen LB, Kronborg G, Møller A, Kvinesdal B, Sørensen HT, Obel N, Gerstoft
Genotypic drug resistance and long-term mortality in patients with triple-class antiretroviral
drug failure. Antivir Ther. 2007;12(6):909-17. (7)
VIII. Lohse N, Hansen AB, Pedersen G, Kronborg G, Gerstoft J, Sørensen HT, Vaeth M, Obel N.
Survival of persons with and without HIV infection in Denmark, 1995-2005. Ann Intern Med.
2007 Jan 16;146(2):87-95. (8)
IX. Lohse N, Gerstoft J, Kronborg G, Larsen CS, Pedersen C, Pedersen G, Nielsen L, Sørensen
HT, Obel N. Comorbidity Acquired Before HIV Diagnosis and Mortality in Persons Infected
and Uninfected With HIV: A Danish Population-Based Cohort Study. J Acquir Immune
Defic Syndr. 2011 Aug 1;57(4):334-339. (9)
Papers previously included in academic theses
Papers III, IV, and VI were three of the five papers included in my PhD thesis HIV in Denmark and
Greenland, 1995-2004: The effect of highly active antiretroviral therapy and characteristics of the
HIV-infected population: An observational study, University of Southern Denmark, 2006. Paper V
was part of Anne Audelin’s PhD thesis Molecular-epidemiological studies of HIV-1 and antiretroviral
resistance in Denmark, Copenhagen University, 2011. Papers I, II, VII, VIII, and IX have not
previously been submitted for obtainment of an academic degree.

6
1 INTRODUCTION
1.1 The HIV epidemic
The HIV epidemic is a marvellous example of a new disease hitting the medical community – and
the whole world - by surprise, and then going through the stages from being overwhelming to
gradually becoming a disease, which is largely manageable with regard to both prevention and
treatment. The immense progress would not have been possible were it not for a concerted action
by patients, civil society groups, doctors, scientists, donors, politicians, the pharmaceutical industry,
and many others. Fortunately, the HIV epidemic possessed the right cocktail of scientific challenge,
urgency, despair, human discrimination, and geographical distribution to stimulate these various
groups.
In 2003, when I started the work providing the basis for this thesis, the global HIV epidemic was out
of control, increasing in incidence in most parts of the World(10), with the prevalence being kept
down only due to the high death rates. Antiretroviral therapy (ART) combinations showing high
efficacy towards HIV had been known for 6-7 years (11), but only a minority of all persons with HIV
were getting the full benefit (10). In many places, treatment was not available, people could not
afford it, or they did not have access to trained health care professionals. For those who did have
access, some were burdened by considerable side effects, or they were infected with virus that had
developed drug resistance after previous years’ exposure to less effective single drugs or drug
combinations. Many found it extremely difficult to adhere to the strict requirements for taking the
medication at specific times of the day, and without interruptions – not made easier by the often
large pill burden of the drug combinations. Finally, it was unknown how long the drugs could
maintain their efficacy in the individual even if administered as intended.
Thus, despite many individual stories of success, there was reasonable doubt as to whether these
successes would translate into a positive population effect, and result in decreased morbidity and
mortality. On the contrary, there was a fear that the increased drug pressure would increase the
prevalence of drug resistance in the population, subsequently leading to transmission of resistant
virus from one individual to another, and thereby waning the treatment options available.
Absolute prevention of new infections will always be the key to eradicating this epidemic (12), and
for those already infected, finding a cure is the optimal goal(13–18). However, until we have
overcome these obstacles, we must optimize infection control and management both in the
individual and at the population level. Ideally, an HIV-infected individual should know immediately
that he/she is infected, should have access to specialized medical and social support, receive a
drug combination which effectively suppresses the virus and has no side effects, and should be
without comorbid conditions both before and after he/she gets infected.
As a country with free access to health care including treatment for HIV infection, and a limited
number of highly specialized HIV clinics, Denmark is one of few countries providing the basic
ingredients for optimal HIV control at the population level (19). Further, the systematized collection
of clinical and paraclinical data on all persons with HIV in the Danish HIV Cohort Study (DHCS)
(20,21), combined with access to excellent population-based administrative databases that can all

7
be linked to DHCS through a unique person identification number, makes Denmark an ideal place
to study the prerequisites for and effects of good population control.
2 AIMS OF THIS THESIS
2.1 Specific aims
The papers on which this thesis is based each aimed to provide new knowledge to different aspects
of the above. Accordingly, the aims of the thesis were:
i. To explore the potential for an indicator disease-based HIV testing strategy (paper I).
ii. To compare temporal trends in quality and quantity of ART introduction in countries with
optimal and sub-optimal health systems for HIV care (paper II).
iii. To assess temporal trends of virological failure and the importance of virological control at the
population level (papers III and IV).
iv. To assess temporal trends of drug resistance development and drug resistance transmission
at the population level (papers V and VI).
v. To assess the implications of drug resistance at the population level (paper VII).
vi. To project long-term survival in an HIV population with excellent access to treatment and care
(paper VIII).
vii. To assess the impact of non-HIV related morbidity on the prognosis for HIV patients in a health
system delivering high-quality HIV care (paper IX).
2.2 Scope of this work related to my PhD thesis
The work that was part of my PhD thesis (papers III, IV, and VI) was focused primarily on
biomarkers, i.e. virological control and virological failure, and associated risk factors and prognosis,
and was based on DHCS only. Papers V and VII added resistance data from DHSD, allowing these
studies to detail and explore previous findings of time trends and risks by relating these to specific
resistance mutations. Papers I, II, VIII, and IX took a much broader view and compared findings
from DHCS with other populations. This expansion in scope reflected the evolving focus from the
individual with HIV to popuations with HIV. By taking advantage of the unique availability of other
databases, the latter papers allowed us to study pertinent questions such as: How do we identify
those at increased risk of HIV in a mixed clinical population? (paper I); What is the positive effect of
being diagnosed with HIV within a good healthcare system? (paper II): How long can persons with
HIV expect to live compared to the general population? (paper VIII); and What would have been
the impact of HIV if the comorbidity pattern had been similar to that of the general population?
(paper IX).

8
3 DATA SOURCES
3.1 The Danish HIV Cohort Study (DHCS)
DHCS is an open, prospective, population-based cohort(20,22), initiated in 1998 as a collaborative
effort by Denmark's eight HIV treatment centres(23). Data going back to 1 January 1995 were
retrieved from patient files and entered into the database. Hence, the cohort includes all prevalent
HIV cases as of 1 January 1995 and all incident cases since then. Types of data collected are
comparable to other HIV cohort studies around the world(24–38), namely individual characteristics,
biochemical test results, treatment history, and clinical events. DHCS was founded at Aarhus
University Hospital. It was later moved to Odense University Hospital and is currently, as of 2014,
based at Copenhagen University Hospital Rigshospitalet. Physicians and research nurses collect
clinical data at the participating clinics. The individual identity is kept anonymous, but an
identification link exists locally at each participating clinic, to detect double counting when a patient
moves between clinics. Crosschecking and validation algorithms are incorporated into the database
in order to catch data retrieval and typing errors. In addition, 5-10 percent of records are monitored
during annual visits to participating clinics. DHCS covers the whole country and is virtually
complete.
3.2 DHCS Greenland
A database with the same design as DHCS was established in Greenland in 2003(39). To include
every HIV-infected individual seen at Greenland’s clinics since 1995, personal contact was initiated
with all 18 district health clinics, and old patient files were retrieved by searching the archives of the
Venereal Disease Clinic at Dronning Ingrid’s Hospital in Nuuk. Doctors from this clinic were
responsible for HIV treatment and care during the first years of the epidemic(40). The files thus
obtained were compared with the records collected by the Chief Medical Officer of Greenland(41–
44). This provided presumably complete coverage in the study database of known HIV patients
since 1995. Data is now updated through the Department of Internal Medicine at Dronning Ingrid’s
Hospital, which has assumed responsibility for all HIV treatment in Greenland.
3.3 Danish National Patient Registry (DNPR)
DNPR was established in 1977 and covers all Danish hospitals and records all hospital admissions,
and diagnoses. Since 1995, all outpatient and emergency visits are registered as well(45). The
DNPR covers both private and public hospitals.
3.4 Danish Civil Registration System (DCRS)
DCRS is a national registry of all residents of Denmark and Greenland, containing information on
date of birth, sex, immigration, residency, date of migration, and death(46,47). Each individual is
assigned a 10-digit personal identification number (CPR number). DCRS is updated within less
than a week after a person is born, changes address, dies, or emigrates. We used CPR numbers to
link data between the registries.

9
3.5 Danish Cancer Registry (DCR)
DCR has recorded all incident cancers in Denmark since 1943, classifying cancers registered after
1977 according to ICD-10(48).
3.6 Danish HIV Sequence Database (DHSD)
DHSD is a prospective, nationwide, population-based database of all genotypic HIV drug resistance
tests performed in Denmark after 31 December 1999.
4 METHODOLOGICAL CONSIDERATIONS
4.1 Utility of the DHCS cohort
A cohort is a group of individuals who are followed over a period of time (49). A cohort study may
be experimental, for example a randomized clinical trial (RCT), or non-experimental (synonymous
with observational study). The Danish HIV Cohort Study (DHCS) is a non-experimental cohort
study(50), and it is prospective, because it is assembled in the present and followed into the
future(51). Individuals in the cohort compose the study base; in DHCS the study base is all HIV-
infected persons in Denmark and Greenland(20,22,39). DHCS is open, because new individuals
join the cohort over time, and it is population-based, because it aims to include all HIV patients in
the geographic area under study (52). Even though RCTs are considered the gold standard for
comparing the efficacy(53) of drugs and other treatments, observational studies of HIV confer a
number of distinct advantages over RCTs(54,55). They provide information on the clinical history
and spectrum of HIV disease, they are useful for exploring patterns of antiretroviral drug use (56)
and monitoring the course of side effects (37,57), and they give an opportunity to examine
questions as they crop up (58). Further, in contrast to the efficacy(53) examined by RCTs,
observational studies shed light on the effectiveness of treatment. Thus, advantages of DHCS
include the ability to study population-based prevalences and incidences, as well as population
trends over time (papers II, III, V, and VI). Furthermore, the unique personal identifier enables
linkage to numerous Danish registries (papers I, VIII, IX) (59). The size of DHCS limits studies of
rare events or subgroups with rare characteristics; and results obtained in Denmark may not be
generalizable to other countries because of regional differences in the composition of study
populations(60,61). Data in one cohort may be compared with data in another cohort in a double-
cohort study (62). Papers I, II, VIII, and IX used a double-cohort study design to compare the
outcome of interest in people who were “exposed” (infected with HIV) with mortality in people who
were “unexposed” (the general population). Papers III, IV, V, VI, and VII were single-cohort studies
based on DHCS, with papers V and VII expanding the available information by including resistance
mutation data from DHSD. An overview of data sources and study design is shown in Table 1.
Many HIV cohorts are prevalent cohorts, in which patients are included at some time point after the
initiating event(63,64). In an inception cohort, all individuals are followed from the time of an
initiating event, (e.g., the date of infection with HIV) (49,65). DHCS may be considered both an
inception and a prevalence cohort. If the initiating event is defined as initiation of combination ART,
10
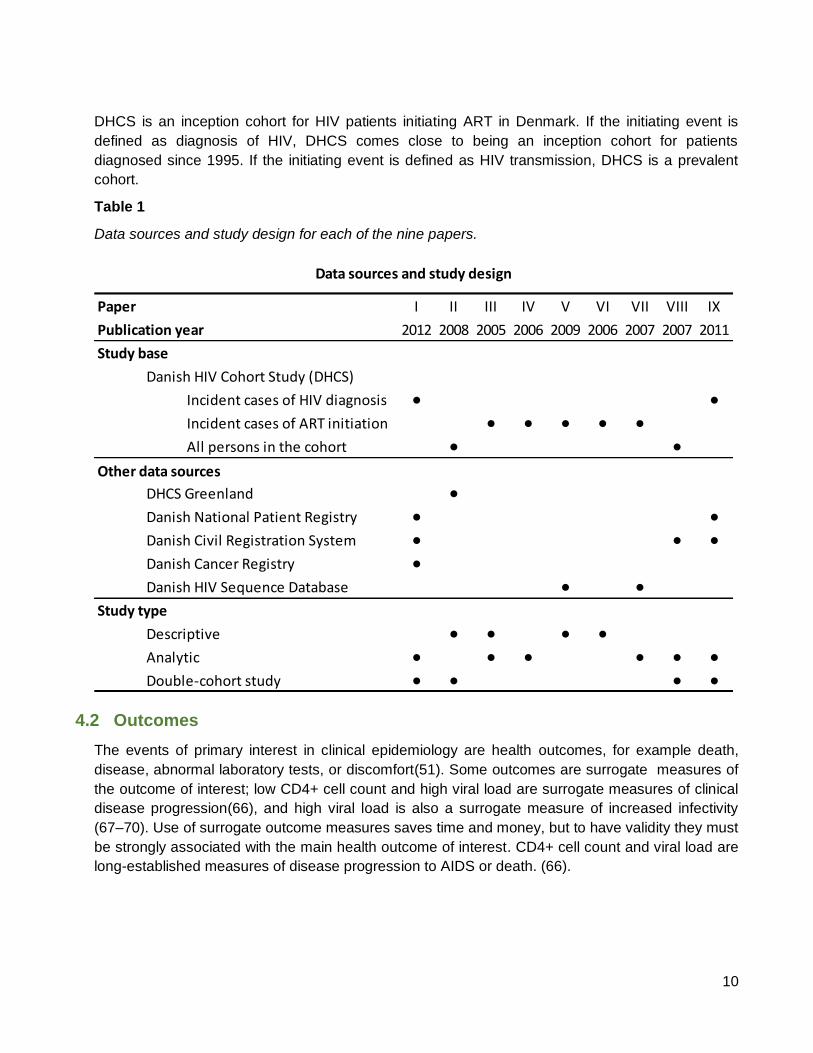
DHCS is an inception cohort for HIV patients initiating ART in Denmark. If the initiating event is
defined as diagnosis of HIV, DHCS comes close to being an inception cohort for patients
diagnosed since 1995. If the initiating event is defined as HIV transmission, DHCS is a prevalent
cohort.
Table 1
Data sources and study design for each of the nine papers.
Paper I II III IV V VI VII VIII IX
Publication year 2012 2008 2005 2006 2009 2006 2007 2007 2011
Study base
Danish HIV Cohort Study (DHCS)
Incident cases of HIV diagnosis • •Incident cases of ART initiation • • • • •All persons in the cohort • •
Other data sources
DHCS Greenland •Danish National Patient Registry • •Danish Civil Registration System • • •Danish Cancer Registry •Danish HIV Sequence Database • •
Study type
Descriptive • • • •Analytic • • • • • •Double-cohort study • • • •
Data sources and study design
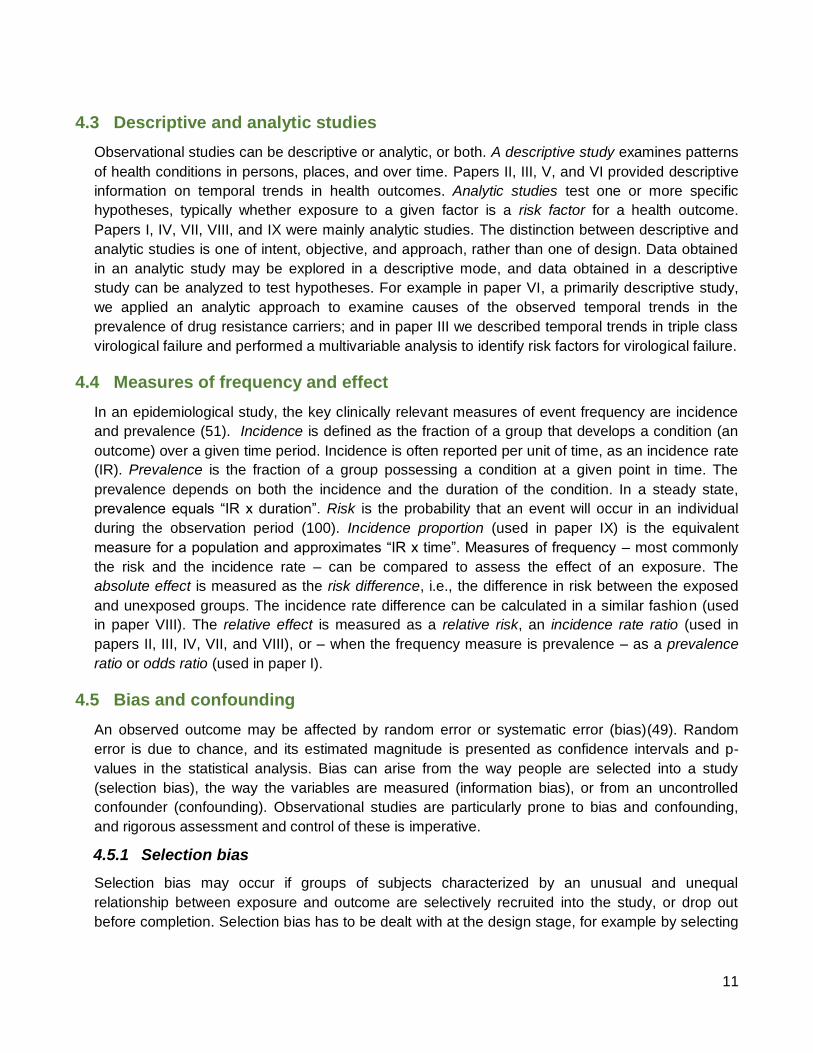
4.2 Outcomes
The events of primary interest in clinical epidemiology are health outcomes, for example death,
disease, abnormal laboratory tests, or discomfort(51). Some outcomes are surrogate measures of
the outcome of interest; low CD4+ cell count and high viral load are surrogate measures of clinical
disease progression(66), and high viral load is also a surrogate measure of increased infectivity
(67–70). Use of surrogate outcome measures saves time and money, but to have validity they must
be strongly associated with the main health outcome of interest. CD4+ cell count and viral load are
long-established measures of disease progression to AIDS or death. (66).
11
4.3 Descriptive and analytic studies
Observational studies can be descriptive or analytic, or both. A descriptive study examines patterns
of health conditions in persons, places, and over time. Papers II, III, V, and VI provided descriptive
information on temporal trends in health outcomes. Analytic studies test one or more specific
hypotheses, typically whether exposure to a given factor is a risk factor for a health outcome.
Papers I, IV, VII, VIII, and IX were mainly analytic studies. The distinction between descriptive and
analytic studies is one of intent, objective, and approach, rather than one of design. Data obtained
in an analytic study may be explored in a descriptive mode, and data obtained in a descriptive
study can be analyzed to test hypotheses. For example in paper VI, a primarily descriptive study,
we applied an analytic approach to examine causes of the observed temporal trends in the
prevalence of drug resistance carriers; and in paper III we described temporal trends in triple class
virological failure and performed a multivariable analysis to identify risk factors for virological failure.
4.4 Measures of frequency and effect
In an epidemiological study, the key clinically relevant measures of event frequency are incidence
and prevalence (51). Incidence is defined as the fraction of a group that develops a condition (an
outcome) over a given time period. Incidence is often reported per unit of time, as an incidence rate
(IR). Prevalence is the fraction of a group possessing a condition at a given point in time. The
prevalence depends on both the incidence and the duration of the condition. In a steady state,
prevalence equals “IR x duration”. Risk is the probability that an event will occur in an individual
during the observation period (100). Incidence proportion (used in paper IX) is the equivalent
measure for a population and approximates “IR x time”. Measures of frequency – most commonly
the risk and the incidence rate – can be compared to assess the effect of an exposure. The
absolute effect is measured as the risk difference, i.e., the difference in risk between the exposed
and unexposed groups. The incidence rate difference can be calculated in a similar fashion (used
in paper VIII). The relative effect is measured as a relative risk, an incidence rate ratio (used in
papers II, III, IV, VII, and VIII), or – when the frequency measure is prevalence – as a prevalence
ratio or odds ratio (used in paper I).
4.5 Bias and confounding
An observed outcome may be affected by random error or systematic error (bias)(49). Random
error is due to chance, and its estimated magnitude is presented as confidence intervals and p-
values in the statistical analysis. Bias can arise from the way people are selected into a study
(selection bias), the way the variables are measured (information bias), or from an uncontrolled
confounder (confounding). Observational studies are particularly prone to bias and confounding,
and rigorous assessment and control of these is imperative.
4.5.1 Selection bias
Selection bias may occur if groups of subjects characterized by an unusual and unequal
relationship between exposure and outcome are selectively recruited into the study, or drop out
before completion. Selection bias has to be dealt with at the design stage, for example by selecting

12
only incident cases, restricting inclusion to a geographical area, minimizing the number lost to
follow up or implementing a procedure to track those who drop out. Selection bias in papers I-IX
was dealt with by all of the above. Many HIV observational cohorts recruit from only one or a few
HIV clinic(s) where the clientele may be self-selected, may be predominantly patients with
complicated or advanced disease referred from general practitioners, or may be lost to follow-up. A
patient who does not keep a regular visit at the HIV clinic, and is therefore considered lost to follow
up, may not have moved from the area; rather, the patient may be hospitalised elsewhere for a
non-HIV- related condition or may have died. This type of selection bias, in which censoring is
associated with the outcome (e.g., death), is called informative censoring in survival analysis. In
some cohorts, requirements for informed consent may lead to selective recruitment, and persons
may later withdraw their consent, leading to selective dropout.
4.5.2 Information bias
Information bias may occur if the methods of measurements are consistently dissimilar in different
groups of patients(51). The study design is crucial for minimizing information bias, for example by
ensuring a standardized measurement process, and by using objective, pre-defined criteria for
exposure and outcome. Most HIV observational cohorts, including DHCS, retrieve information from
patient files, and many exposures and outcomes (e.g., AIDS-defining events, deaths, and
laboratory test results) are defined from objective criteria, all of which will tend to minimize
information bias. Some data depend on the patients’ own information and are more prone to cause
information bias, e.g., information on alcohol use or mode of HIV transmission.
4.5.3 Confounding
To be a potential confounder, a variable has to be an independent risk factor for the outcome of
interest, it must be associated with the exposure, and it must not be an intermediate variable.
Several variables are related to health outcomes and therefore commonly act as confounders in
HIV cohort studies.
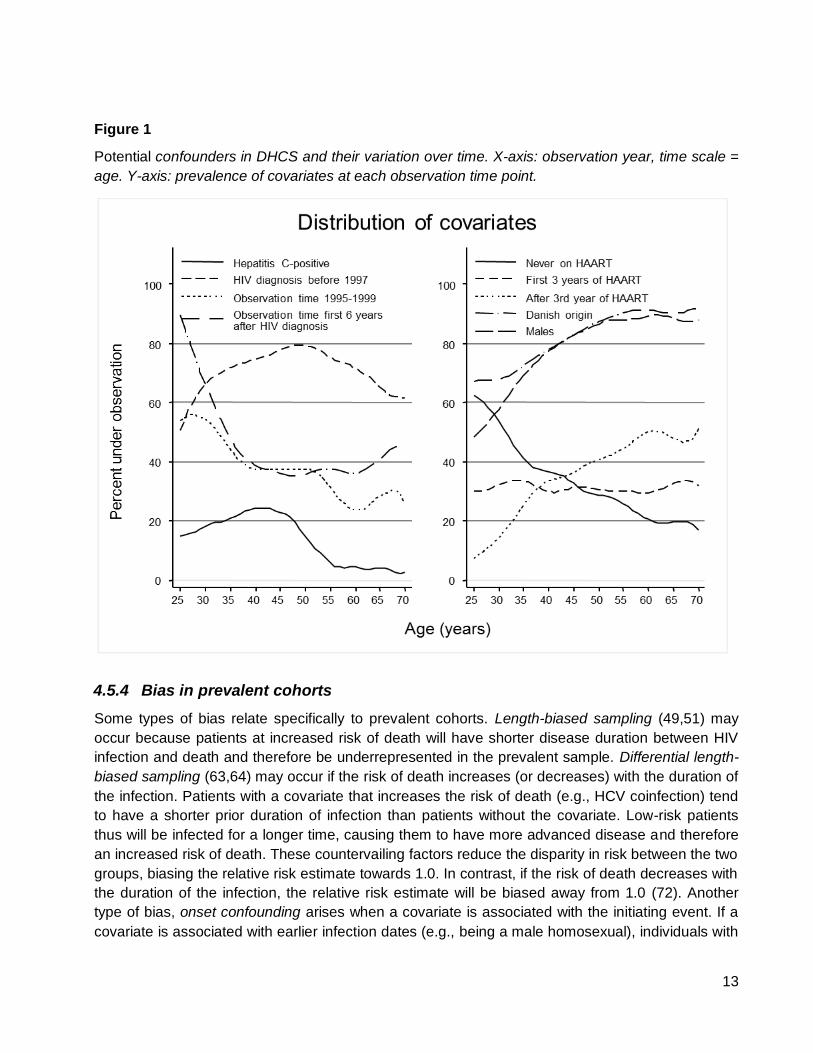
These include for example AIDS, mode of infection, coinfection with hepatitis C virus (HCV), age,
time on ART, time since HIV diagnosis, and observation year. Figure 1 shows an analysis of the
cohort used in paper VIII and depicts how the prevalence of confounders in DHCS vary according
to age, for all persons observed during 1995-2006. It draws attention to the complexity of clinical
epidemiological studies of HIV. The fatal natural history counteracts with the continuous emergence
of improved treatment options, rendering it highly important for researchers to know the details of
their cohort. Incidence rates may change considerably when analyses are stratified by the
observations’ position on different time scales (papers III and VIII).
Confounding control can take place both at the design stage or analytical stage, using tools such as
randomization, matching, exclusion, restriction in design, restriction in analysis, standardization,
stratification, and multivariable analysis and modelling(71). With the exception of randomization, all
of the above methods were used in papers I-IX.
13
Figure 1
Potential confounders in DHCS and their variation over time. X-axis: observation year, time scale =
age. Y-axis: prevalence of covariates at each observation time point.
4.5.4 Bias in prevalent cohorts
Some types of bias relate specifically to prevalent cohorts. Length-biased sampling (49,51) may
occur because patients at increased risk of death will have shorter disease duration between HIV
infection and death and therefore be underrepresented in the prevalent sample. Differential length-
biased sampling (63,64) may occur if the risk of death increases (or decreases) with the duration of
the infection. Patients with a covariate that increases the risk of death (e.g., HCV coinfection) tend
to have a shorter prior duration of infection than patients without the covariate. Low-risk patients
thus will be infected for a longer time, causing them to have more advanced disease and therefore
an increased risk of death. These countervailing factors reduce the disparity in risk between the two
groups, biasing the relative risk estimate towards 1.0. In contrast, if the risk of death decreases with
the duration of the infection, the relative risk estimate will be biased away from 1.0 (72). Another
type of bias, onset confounding arises when a covariate is associated with the initiating event. If a
covariate is associated with earlier infection dates (e.g., being a male homosexual), individuals with

14
this covariate will have longer infection times, causing the covariate to appear associated with any
outcome dependent on time from infection (e.g., the risk of dying). Results may be biased in both
directions depending on the direction of the effect of the covariate. To avoid bias related to
prevalent cohorts, we restricted our study populations to either incident cases of HIV diagnosis
(papers I and IX) or incident cases of ART initiation (papers III-VII).
4.6 Statistical analyses
4.6.1 Comparing individual characteristics
Individual characteristics between study groups were compared using the chi-square test for
categorical variables, and the Student’s t-test or one-way analysis of variance for continuous
variables.
4.6.2 Comparing outcomes
Time-to-event analyses were used to estimate incidence rates of TCF, mortality rates, and
cumulative incidence proportions (papers III, IV, VII, VIII, and IX), using the Cox proportional
hazards regression and log-rank test to compare outcomes between groups. A time-to-event model
with left truncation was used to estimate incidence rates on two different timelines (papers III and
VIII). Logistic regression was used to compare proportions with undetectable viral load (paper IV),
and conditional logistic regression was used in a matched case control design to compare the odds
of subsequent HIV diagnosis (paper I). Trends over time in incidence rates and prevalence were
estimated with Poisson regression (papers II, III, V, and VI), and changes over time in CD4+ cell
count were estimated in a linear regression model (paper IV). Population attributable risk was used
to estimate the proportion of deaths attributable to comorbidity acquired before HIV diagnosis, and
interaction risk was used to estimate the interaction between the effects of HIV and comorbidity on
mortality (paper IX).
4.7 Data safety end ethics
Establishment of DHCS and the linkage to other registries were approved by the Danish Data
Protection Agency (journal number 2012-41-0005). As none of the studies included direct patient
contact, approval from the national or regional committees on health research ethics were not
required. Data were handled and protected in compliance with Danish law (73).
5 EARLY DETECTION
5.1 Background
Early detection is one of the cornerstones of optimal HIV management both at the individual and on
the population level(74). Detecting persons with HIV as early as possible will allow for timely
initiation of ART and lower the risk of disease progression in the individual(74,75). Persons initiating
ART at very low CD4+ cell counts are at higher risk of death(76,77) and take longer to experience
good immune reconstitution(78–80) than those commencing therapy with higher CD4+ cell counts.
15
Most current guidelines, including those published by the World Health Organization (WHO),
recommend ART initiation when the CD4+ cell count falls below 350 cells/mcl (81,82), Further,
timely and adequate prevention efforts require knowledge of where the next new infection is most
likely to be (83–85). As local HIV epidemics change over time, early detection is an important tool in
mapping this. Finally, with recent evidence that ART can effectively reduce the risk of HIV
transmission(86), there are speculations that bringing down the population viral load by
comprehensive treatment of all persons infected will lead to fewer new infections and thereby have
a positive effect on the HIV incidence (87–90). Whether such a “treatment as prevention” strategy is
feasible(91), cost-effective (92,93), and ethically acceptable(94,95), and in which populations and
areas it might be recommended (96,97), is still up for discussion(98–102). Also not known is the
coverage level required, and the potential added impact on HIV-associated comorbidities such as
tuberculosis (103,104). Numerous modelling exercises are being conducted, and at least three
cluster-randomized trials are underway to give answers to some of the above-mentioned questions
(97,105–111).
5.2 Trends in late diagnosis and late presentation
5.2.1 Epidemiology
A considerable barrier to optimal HIV care in both high-income countries (HIC) and low- and
middle-income countries (LMIC) are the many late presenters (112–117), defined as presenting to
HIV care with a CD4+ cell count below 350 cells/mL or with an AIDS-defining event (74,118,119).
These are either diagnosed late (120–124), or the time from diagnosis until they reach clinical care
is long. Although improvements are observed in some countries (112,114,121,125), recent reports
estimate late diagnosis and/or late presentation to occur in 35-60% of newly diagnosed
(112,126,127), similar to 2005 figures for Denmark (128).
5.2.2 Risk factors
Those who are diagnosed late are more often males, older, with low education level and low
socioeconomic status, and belong to marginalized groups such as immigrants (115,120,121). They
often do not perceive themselves at risk of infection or have not gone for testing due to fear of the
disease itself and of stigmatization(90,115), and they have not routinely been offered HIV
testing(121). In addition, many do not have easy access to HIV testing facilities. Timely diagnosis,
on the other hand, has been associated with belonging to a known risk group such as men who
have sex with men (MSM) or injecting drug users (IDUs) (120,129), and perceived effectiveness of
treatment (115).
Those who are late presenters will naturally share the risk factors of those who are diagnosed late
(121). Specific additional conditions associated with longer time from diagnosis until care are IDU
(129), lack of disclosure of HIV status to spouse or partner, and being unmarried (130). Associated
with early presentation are current pregnancy, having young children, and consuming alcohol in the
previous year (130)

16
5.2.3 Clinical and economic consequences:
The consequences of late presentation are grave (131). Late presenters have higher rates of
morbidity (132) and mortality (75,133–135), and they are more likely to be admitted to the Intensive
Care Unit (123). They have higher likelihood of poor adherence, exacerbated by the same factors
that contribute to their late diagnosis such as lack of knowledge on HIV and the benefits of highly
active antiretroviral therapy (74,116). They are also more likely to transmit HIV, not only because of
the high viral load when not on ART (68,136), but also because they have low general awareness
of the risk of transmission (137). Finally, these medical conditions translate into higher medical
costs (138–140).
5.3 Boosting early diagnosis and presentation for care (paper I)
5.3.1 Testing strategies
More than 30% of persons with HIV in Europe are estimated to be undiagnosed(141). To turn the
epidemic, we need to diagnose more persons earlier and make sure they present to clinical care
without undue delay. The optimal screening strategy will depend on the nature of the local
epidemic: transmission patterns, risk groups, healthcare system, and cultural norms. Client-initiated
screening (opt-in) voluntary counselling and testing has been the dominant form of testing for many
years. However, due to the often disappointingly low uptake of testing by this strategy, provider-
initiated “opt-out” counselling and testing (142,143) is now being widely introduced in various
forms(144).
A number strategies that could permit earlier testing are currently being recommended or used in
low-prevalence countries(90,143,145,146). These include screening of high-risk groups such as
MSM, IDUs, and sex workers; universal screening in selected healthcare facilities such as patients
in sexually transmitted disease (STD) clinics(147), pregnant women in antenatal care facilities, and
persons newly-diagnosed with viral hepatitis or tuberculosis(121); and symptom-guided screening
in all healthcare facilities based on selected indicator conditions associated with high risk of HIV
infection (87,148,149). Further, newer self-testing technologies recently being approved in the
United States(150–153) might be able to reach populations who would not reach a medical facility
for testing, or be used more frequent than facility-based services and thereby lead to earlier
detection of persons with HIV (154). To have the desired effect, however, emphasis must be on
linking the self-test to timely HIV care.
5.3.2 Indicator condition-based HIV testing
Conditions and diseases that should lead to HIV testing fall into three basic categories: conditions
for which, in case the presence of HIV infection is identified, their clinical management can have
deleterious consequences for the individual; conditions that are AIDS defining in persons with HIV;
and conditions that are otherwise associated with high prevalence of undiagnosed HIV. The latter
two categories are called indicator conditions. As the prevalence threshold above which testing has
been shown to be cost-effective in high-income settings is 0.1% (155–157), this has become the
target prevalence in studies of new indicator conditions. With the greatly varying economic status
and HIV prevalence in countries affected by HIV, the set of indicator conditions that should lead to
17
an offer of HIV testing will naturally be different from one setting to another. Apart from AIDS-
defining illnesses, some of the conditions first shown to be associated with HIV prevalence higher
than 0.1% were Guillain Barré syndrome / acute inflammatory demyelinating polyneuropathy
(158,159), unexplained fever (160), visceral leishmaniasis (161,162), candidaemia (163),
community-acquired pneumonia (164) mononucleosis-like illness(165–167), HCV infection
(168,169), anal or cervical cancer or dysplasia(170–173), herpes zoster (174,175), malignant
lymphoma (176), and psoriasis (177). As the population effect of modern ART kicked in during the
first decade of this millennium, HIV and public health experts and advocates expressed several
calls for action to identify and implement better strategies for early detection (178,179).
With access to complete diagnostic history for in-patients in Danish hospitals since 1977, we used
a case-control design to study the association between potential indicator conditions and HIV
diagnosis one, three, and five years later (paper I). We identified a broad range of conditions with
an adjusted odds ratio (aOR) of being diagnosed with HIV at between 3.0 and 94.7. With the
controls in our study population identified by incidence density sampling, the OR was a direct
estimate of the relative risk of HIV. We confirmed already known associations between HIV and
polyneuropathy (aOR=4.52), candida infection (aOR=25.5), lower respiratory tract infections
(aOR=3.98), mononucleosis (aOR=8.64), hepatitis B and C (aOR=23.6), herpes zoster
(aOR=33.7), and lymphoma (aOR=5.83). Other broader disease groups which we identified as
having an increased risk of HIV were “STIs and viral hepatitis” (aOR=12.3), “CNS infections”
(aOR=3.44), “skin infections” (aOR=3.05), “other infections” (aOR=4.64), and “haematological
diseases” (OR=4.28). Detailing the above disease groups, we identified a number of specific
potential indicator conditions who all had adjusted ORs above 10: opioid abuse (aOR=43.5),
hepatitis A (aOR=41.6), thrombocytopenia (aOR=24.0), endocarditis (aOR=23.2), bacterial
meningitis (aOR=14.7), seborrheic dermatitis (aOR=11.8), and drug poisoning (aOR=11.2). Our
data allowed us to look at future HIV risk at various distances in time from the occurrence of the
indicator condition (Figure 2). Thrombocytopenia, seborrhoeic dermatitis, and bacterial infections
are manifestations of the HIV infection and were highly associated with being diagnosed with HIV
during the coming year and less so during the 3 to 5-year period. Substance abuse, hepatitis A,
and drug poisoning, on the other hand, were associated with an almost constant 5-year long
increased risk of HIV diagnosis. These conditions share behavioural risk factors with HIV and are
therefore indicators of not only current HIV but also of future HIV acquisition.
As a response to the urgent need for guidance, the HIV in Europe Initiative, with contributions from
the European Center for Disease Control and the World Health Organization published in late 2012
a guidance for indicator-based HIV testing (180). While there is evidence of undiagnosed HIV
prevalence of >0.1% for some of the recommended indicator conditions, many of the indicators are
included based on the opinion of experts who consider them likely to be associated with an HIV
prevalence of >0.1%. The document acknowledges the paucity of evidence to robustly identify
indicator conditions, and the document is likely to be modified during the coming years as we gain
more knowledge.
Published in 2013, a case-control study using the UK-based general practice database THIN (The
Health Improvement Network) tested the 37 indicator conditions recommended in the UK National

18
Guidelines for HIV testing 2008 (178). and found 12 of these to be associated with HIV infection
(181). Another recent study from England and Wales found an HIV prevalence of 2.4% among
persons with invasive pneumococcal disease (182), while a small Spanish study tested a strategy
of four indicator diseases and found an HIV prevalence of 4.7% (95% CI 1.3%-11.6), corresponding
to a cost per new diagnosis of only €129 (183).
Figure 2
Forest plot of selected indicator diseases showing how some risk estimates may vary depending on
time to future HIV diagnosis. (Source: paper I)
19
The HIV in Europe Initiative (149) is currently running the HIV Indicator Diseases across Europe
Study (HIDES), which aims to identify indicator diseases and develop a model for implementation
of targeted HIV testing in clinical settings. Eight conditions tested in HIDES I were all found to be
associated with an HIV prevalence of >0.1% (148). These included STIs, malignant lymphoma,
cervical dysplasia or anal cancer, herpes zoster, hepatitis B or C, ongoing mononucleosis-like
illness, unexplained leukocytopenia/thrombocytopenia, and seborrhoeic dermatitis/exanthema.
HIDES II is now expanding to >50 sites across Europe and will include, in addition, the diseases
hospitalized pneumonia, unexplained lymphadenopathy, peripheral neuropathy, lung cancer, and
recalcitrant psoriasis (184).
5.4 Conclusion
Late diagnosis and late presentation to clinical care continue to be major barriers to improved HIV
management, and we need to find ways to identify those who are not yet diagnosed. New testing
strategies must be tailored to the settings in which they are to be used to ensure they are feasible
and cost-effective. The body of knowledge on indicator conditions is increasing rapidly, and studies
confirming previous findings and adding new pieces to the puzzle continue to improve our
knowledge on where and when indicator condition-based testing can be applied and have a
positive effect. Thus, indicator condition-based testing may turn out to be a valuable addition to the
existing practice in many settings.
6 ACCESS TO GOOD HEALTH CARE
6.1 Background
Before a person with HIV can get the life-saving medication, the drugs need to be available,
accessible, and affordable. While this is the case in most high-income countries, successful roll-out
of antiretroviral therapy (ART) furthermore requires a functional health care system with trained
medical staff (185,186). Some evidence suggests that personal support from friends, family and
peers improves drug effectiveness even further (187). Sub-optimal health care systems are most
prevalent in poorer parts of the world (188), but they also exist in wealthy countries. Washington
DC has recently been portrayed as an example of a city with poor access to care for many of its
HIV-infected population (189). The causes of poor ART uptake are often complex and not
immediately visible, and there is an increasing need to identify these barriers.
6.2 Uptake of antiretroviral therapy (paper II)
6.2.1 Factors associated with ART uptake
Uptake of ART is influenced by individual as well as health system-related factors. Characteristics
such as sex (being male), age (being younger), and employment status (being unemployed) and
homelessness are associated with lower ART uptake (190–192), but also less visible, psycho-
socio-cultural issues such as illness ideology, unfamiliarity with chronic disease management,
depression, interpersonal challenges, stigma, and values of church or marriage have been shown

20
to provide barriers to ART initiation (192,193). System-related factors include distance to the
nearest clinic (191), waiting times for medical care (194–196) poor linkage between HIV testing and
HIV care and treatment services, and shortage of HIV/AIDS specialists (197). While psycho-socio-
cultural barriers are found in both LMIC and HIC, the economic and health system barriers are
predominantly described in LMIC (198).
Figure 3
ART introduction in Denmark and Greenland 1996-2006. Numerator, proportion of patients who
were receiving antiretroviral therapy as part of a highly effective ART regimen on Jan 1st each year.
Denominator, all patients under observation. NNRTI, non-nucleoside reverse transcriptase inhibitor;
PI, protease inhibitor. (Source: paper II)

21
6.2.2 ART uptake in Greenland
The health care system in Greenland is well funded, public, and with free access for all citizens
(39). Health care provision, however, is challenged by the vast geography and staffing issues. Fifty-
six thousand people live in 74 towns and settlements between which transportation is only possible
by air or sea, making them frequently inaccessible due to bad weather; only 18 of these have
facilities with permanent physician staffing, and frequent use of locums impedes the consistency of
care for patients with chronic conditions. We compared the uptake of ART and changes in HIV
mortality over time in Greenland with Denmark, its former colonial power (paper II). Both are high-
income countries with public health care offered free of charge, and the Greenland health care
system is staffed with physicians trained in Denmark. We found that ART introduction had been
delayed in Greenland, with the total coverage level among persons with HIV only catching up in
2003, and with newer combination regimens such as those including ritonavir-boosted protease
inhibitors reaching levels in Denmark only in 2006 (Figure 3).
These patterns were also found among the proportion with suppressed viral load, and reflected in
the mortality rates that dropped dramatically in Denmark in years 1998-2000 to 29/1,000 per year,
and although steadily declining in Greenland were still 59/1,000 per year in 2004-2006. A later
study found a slight further decline in mortality until 2011 of 53.4/1,000 per year (199).
6.3 Conclusion
Despite similar levels of health worker education and economic resources, ART implementation
and mortality decline in Greenland lacked several years behind Denmark. Geography, lack of
consistency in clinic staffing, and difficult infrastructure with less access to advanced laboratories,
hospital care, and HIV specialist clinics most likely bear part of the cause. Furthermore, the HIV
epidemic in Greenland is characterized by a mainly middle-aged, heterosexually transmitted
population with low socio-economic status, and these issues related to the individual might have
further challenged timely and effective introduction of new treatments. While we were not able to
single out the main reason for the observed differences, the study reminded us that although
economy may be a prerequisite for implementing an effective HIV care system, it is certainly not all
it takes.
7 VIROLOGICAL CONTROL
7.1 Background
The goal of modern antiretroviral therapy is continuous suppression of HIV replication in the body,
so-called virological control. This will delay the HIV-induced deterioration of the immune system
(81) and postpone or even avoid immune-deficiency-related morbidity and eventually death.
Assessing the drug efficacy in persons on ART is done by regular measurements of the amount of
virus (HIV RNA) in the blood (viral load), which serves as a proxy measure for HIV replication in the
cells.

22
Obtaining and sustaining virological control can be challenging. Primarily, the prescribed drugs
must be efficacious and able to suppress HIV replication, but HIV is a chronic disease, and the
drugs must remain effective and acceptable to the patient also after long-term use. Factors that
determine long-term effectiveness include properties of the ART combination used, the genotype
and phenotype of the dominant HIV strain in the individual, and the person´s ability to adhere to the
prescribed treatment. Some drugs have lower efficacy and are less forgiving if one or several doses
are missed, some are more likely to cause side effects, and some should be taken twice or even
three times daily. Some viral strains are resistant to the most commonly used drugs, and some
patients are highly burdened by side effects, find it very difficult to take medication at designated
hours, or find that psychosocial aspects of their life keep them from adhering to a rigorous
treatment scheme.
7.2 ART combinations
The first ART combinations that were able to induce virological control for more than a few months
consisted of a PI and two nucleoside reverse transcriptase inhibitors (NRTIs)(11), so-called PI-
based regimens. Later came regimens based on NNRTIs or ritonavir-boosted PIs (200–202), and
more recently we have seen the advent of the newer drug classes (203) such as fusion inhibitors
(204), integrase inhibitors (205–209) and entry inhibitors(210,211). Each new drug or drug
combination has offered improvements in terms of fewer side effects, lower long-term drug toxicity,
lower pill burden, or more forgivingness to inconsistent adherence with lower risk of drug-induced
resistance development (212–216). Other new drugs have found their place in “salvage therapy” to
persons who harbour multi-drug resistant virus, often due to a long and complex treatment history
(217,218).
7.3 Triple-class virological failure (paper III)
Along with the advent of efficacious drug combinations around the millennium came a decrease in
mortality (77,219–221), but also a concern about how long the effect would last. When people failed
their first regimen, they had to start so-called second-line or third-line therapy because their virus
had become drug-resistant and thereby rendered previously administered ART combinations
ineffective. Experts were uncertain as to whether this evolvement would be avoidable even in the
individual with perfect treatment adherence, and whether the invention of new antiretroviral drugs
could keep up with the rate of resistance development and drug failure in the population. Early
studies showed multi-drug class failure to be associated with poor prognosis (222), but only little
was known about the incidence and prevalence of virological failure (223).
In paper III, we estimated time trends in both incidence and prevalence of drug failure towards
three drug classes, so-called triple-class failure (TCF). Many studies of time trends in failure up to
2005 had been rather pessimistic with regard to failure rates and prevalence at the population level
(224,225), but most of these studies had been prone to bias because their design was cross-
sectional and based on observations from a single clinic. These cohorts are often ill suited for
measuring temporal trends because they have a higher accumulation of difficult cases. DHCS, with
its nation-wide design, is much less prone to this type of bias. In paper III, we found a declining
23
population incidence of TCF during the years 1997-2003. When looking at incidence rates
according to time since ART initiation, the incidence of TCF was declining from the 4th year
onwards. Later studies have come to similar conclusions. The Collaboration of Observational HIV
Epidemiological Research Europe (COHERE) Group found a rising TCF incidence until 2005,
followed by a decline during the subsequent 4 years until 2009. In another large study containing
almost 46,000 observation years, the same group found the cumulative incidence of TCF to be
3.4% at 5 years and 8.6% at 9 years after starting ART, and a study from the UK Collaborative HIV
Cohort (UK CHIC) containing >27,000 observation years found a 9.2% risk of TCF after 10 years of
ART (226). These results correspond well to the cumulative incidence of 7.0% after 7 years of ART
that we found in paper III (227). Of note, DHCS is part of COHERE but contributes less than 10% of
total patient years, so this cohort overlap has only contributed marginally to the similar findings in
the two studies.
7.4 Consequences of suboptimal virological control (paper IV)
The risk of virological failure in HIV populations with access to well-functioning health care is now
quite low (paper III), but a proportion does not obtain full virological control (228–230). Getting full
control requires a tailored ART combination that suits the individual in terms of virus susceptibility,
side effects, and pill burden. Despite such “technical optimization” with regard to efficacy, however,
some individuals experience temporary or permanent viraemia.
We do not always know the causes of these single or repeated episodes of detectable viral load,
but we need to know their clinical relevance and role as predictors of long-term effectiveness. Many
other predictors of poor outcome are present before starting therapy and include both biological
and biochemical markers such as low CD4+ cell count, high viral load, malnutrition, and anaemia
(77,219,231–233); and social determinants such as substance use (234), low socioeconomic status
(235), mental disorders, and distress (236,237). Once a person has started ART, additional and
valuable information is obtained from the virological response during the first 6 months, where
increased viral load is associated with higher risk of death (238,239).
In paper IV, we went one step further and looked at whether virological control during the post-
primary treatment period (7-18 months after ART initiation) was related to long-term clinical and
paraclinical outcome. We found a clear difference in prognosis between persons with virological
suppression 100% of the time (Group 1), persons with virological suppression part of the time
(Group 2), and persons with no virological suppression at all during the 12-month period (Group 3).
Whereas 89% of persons in Group 1 would be alive and virologically suppressed 6 years later (7.5
years after starting ART), this would be true for just 71% in Group 2 and 43% on Group 3 (Table 2).
Even the subgroup with virological suppression 75-99% of the time had a 2.17 times higher risk of
death than the fully suppressed Group 1 (95% confidence interval 1.31-3.61). In all three groups,
CD4+ cell counts continued to rise for 7.5 years, mostly so in Group 1. Later published studies
similarly found that the number of episodes with viral rebound >500 copies/mL was inversely
related to CD4+ cell count increase (240), and that the percentage of time with virological
suppression was inversely related to future risk of virological failure (241).

24
Table 2
6-year prognosis from 1.5 to 7.5 years after ART initiation, according to level of viral suppression
during the preceding 12-months. Group 1=fully suppressed, Group 2=partly suppressed, Group
3=not suppressed. (Source: paper IV)
1 93 ( 90 - 94 ) 96 89 ( 87 - 90 ) ††
2 86 ( 82 - 89 ) 83 71 ( 68 - 74 ) ††
3 76 ( 71 - 81 ) 57 43 ( 40 - 46 ) ††
Baseline: 18 months after HAART initiation
VL: viral load
†: Kaplan-Meier survival estimates
††: 95% CI estimated as [95% CI for survival] * [percent undetectable at 72 months]
Survival and viral suppression 72 months after baseline (7½ years after HAART initiation)
95% CIGroup
Cumulative survival from
0 to 72 months after
baseline (percent) †
Percent with VL<400
copies/ml 72 months
after baseline
Percent alive and with
VL<400 copies/ml 72
months after baseline
95% CI
7.5 Conclusion
Fortunately, the prevalence of TCF seems to have stabilized in Denmark (paper III) and in other
settings (242). Hence, the concerns expressed 10 years ago that the majority of persons with HIV
might exhaust their treatment options due to accumulation of multi-drug class failure have been
somewhat allayed, but the risk remains relevant in many settings (243). With an estimated annual
risk of TCF of 0.5-1.5% (227,242), the cumulative risk in children (244) and other HIV-infected
persons with a long life ahead of them is far from negligible. Further, we must be aware that
measured prevalences can be influenced downward by newly infected persons entering the
population, i.e. increasing the denominator, and by increased mortality in persons with TCF, i.e.
decreasing the numerator (paper VI) (226,245). Not only is comprehensive virological failure
associated with increased risk of death (paper VI), a worsened long-time prognosis is also seen
even after modest viraemia (paper IV). Many persons experience viraemia because they find it hard
to adhere to treatment, and they often require more intensive support from the health care system
or from peer groups, family or friends (187). Teams providing care for persons with HIV should
keep in mind that “partial virological responders” compose a group at high risk of future failure and
death and who should be given increased attention and support. Despite the positive trends,
continued investments in development of new antiretroviral drugs will be required to ensure future
treatment options for all persons with HIV.

25
8 DRUG RESISTANCE
8.1 Background
8.1.1 Emergence of drug resistance
HIV mutates heavily, and thus has the potential to mutate into new strains that are resistant
towards ART. The wild type virus phenotype is the most fit and will therefore remain the dominant
sub type in persons who are infected with this type, as long as they are not exposed to antiretroviral
drugs. When treating with ART, though, the virus can escape pressure from the antiretroviral drugs
by emergence and proliferation of new mutations that are resistant towards the given treatment
(246). It is therefore ultimately important to suppress viral replication completely (81), thereby
avoiding the vicious cycle of ongoing replication and subsequent emergence of drug-resistant virus.
8.1.2 Relation between ART and drug resistance
Whether an ART combination is effective in the individual depends on both behavioural and
biological factors. A multitude of factors influence adherence in the individual (195,237,247–250),
and each drug has specific pharmacokinetic and pharmacodynamic properties (214,251–253).
Each drug selects for up to several specific mutations (252), and some mutations confer cross-
class resistance (254) to other drugs within the same class. Even though it is possible to fully
suppress viral load for years and thereby avoid emergence of drug resistance, longer time on ART
is invariably associated with increased risk of drug resistance both in the individual (255) and at the
population level (5,256)(paper V). The clinical implications of individual mutations vary (257,258),
but the accumulation of multiple resistance mutations towards several drugs and drug classes is
associated with poor prognosis (7,259–262) (paper VII).
8.1.3 Relation between viral load and HIV transmission
Whether exposure to HIV results in HIV transmission depends on factors such as properties of the
virus, properties of the recipient’s immune system, genetics (e.g., the CCR532 mutation) (263),
mode of exposure, and the amount of virus that enters the recipient (264). Evidence from early
observational studies supported the theory that transmission was markedly diminished with low
viral load (67,70,265,266), but only recently has it been confirmed in randomized trials that the risk
of sexual HIV transmission from partners on ART with fully suppressed viral load is extremely low,
both through heterosexual (86) and homosexual (267,268) intercourse.
8.1.4 Public debate
Before these game-changing RCTs, it was vividly discussed which kind of advice should be given
to discordant couples comprising an HIV-infected person and an HIV-negative partner. In the so-
called “Swiss Statement” from 2008 (269,270), the Swiss public health authorities publicly stated:
“HIV positive individuals do not risk transmitting HIV to an HIV negative partner if the person has
had undetectable HIV in the blood for at least 6 months has adhered strictly to his/her antiretroviral
regimen, and is free of any other sexually transmitted infections”. The statement was heavily
criticized by a range of international bodies (271) for being over-concluding on available evidence.

26
While the above dispute predominantly concerned the transmission risk from individual to individual
and the associated advice on HIV prevention, experts also discussed and studied the potential
population effect of more and more persons being on ART, and the associated lower viral load in
the population. The number of persons diagnosed with HIV was increasing as a result of rising or
stable incidence combined with longer survival. Could it be, though, that the positive effect of better
treatment coverage would counterweight this trend and thereby would result in lower population
viral load, ultimately reducing transmission?
8.2 Time trends in drug resistance development (paper V)
With an ever-larger cumulated time on ART in the population, and an increasing number of persons
no longer on first-line treatment, there was fear that this would translate into an increasing
incidence of new resistance mutations (272). On the other hand, the continuous advent of new
drugs less likely to induce resistance could pull the trends in the other direction, as could a natural
“saturation” of mutations occurring in the individual during the first months or years of treatment.
Many studies reported scaringly high prevalences of drug resistance (273–276) and increasing time
trends (277), but these studies were often cross-sectional in design and based on data collected
from convenience-sampling. Thus, drawing conclusions on the incidence of new mutations was not
possible.
As HIV genotyping started to become a more frequent procedure, large resistance databases
became a valuable tool to estimate not just prevalence, but also incidence of new mutations. We
used DHCS and DHSD to create a nationwide, Danish data set where genotypic test results were
combined with clinical and paraclinical data. By applying strict criteria to when a new mutation was
detected in an individual, related to when this individual had experienced virological failure, and
with which ART regimen, we were able to estimate time trends in the incidence of new mutations
(paper V).
We found decreasing population-based incidence rates of drug resistance acquisition during 1999-
2005 for all three drug classes (Figure 4). Later studies from Italy and Switzerland have reported a
decline in the prevalence of resistance-conferring mutations (215,278–280), and a very recent pan-
European analysis found not only a moderate decline in the prevalence of resistance, but also a
steep drop from 31% in 2000 to 1% in 2008 of persons who had exhausted available drug options
(281). Even though most studies report declining trends, there may be geographical areas and
subgroups in which the forecast is less optimistic. A recent Spainsh study in children with HIV
reported rising prevalence of resistance mutations for all three major drug classes (282), while a
study from the United Kingdom found a 17% 8-year cumulative risk of any mutation, although the
cumulative risk of a PI mutation among those who started ART with a ritonavir-boosted PI regimen
was only 7% (283).

27
Figure 4
Declining incidence rates of new drug resistance mutations from 1999 to 2005 for the three major
drug classes. PI=protease inhibitor. NRTI=nucleoside reverse transcriptase inhibitor. NNRTI=non-
NRTI. (Adapted from paper V)
8.3 Time trends in transmission of drug-resistant HIV (paper VI)
A worst-case scenario of the population effect of introducing ART would be if drug resistance
induced by antiretroviral drug pressure was widely transmitted from person to person and thereby
increasing the proportion of persons newly infected with HIV who had limited treatment options
already from the beginning. This concern grew along with the wide expansion of ART availability,
changing thresholds for ART initiation putting more people on therapy, and the longer cumulated
time on ART in the populations. Indeed, early studies found higher than 20% prevalence of
transmitted drug resistance (TDR) on both sides of the Atlantic Ocean (284–288), increasing over
time, and with multidrug-resistance prevalence up to 10.2% (289). Another issue adding further
concern were reports of changes in risk behaviour: the general opinion that HIV was becoming a
treatable disease meant that persons without HIV were less worried about protecting themselves;
and the improved health among persons with HIV was leading to a more active life and sex life
(290). Pulling in the other direction, towards less transmission of drug-resistant virus, was the

28
growing scientific evidence that persons with fully suppressed HIV replication are de facto non-
transmitters (67,265,266), and the fact that drug-resistant viral strains are less fit and therefore
possibly less likely to be transmitted(246,261,291,292). Indeed, a number of studies reporting
declining or stable levels of TDR were published in the early 2000s (293–297).
Based on the availability of comprehensive data on ART regimens and viral load in our cohort of
Danish persons with HIV we were able to estimate temporal changes in the prevalence of persons
with HIV who could potentially transmit drug-resistant virus (paper VI). We found a decrease from
1997 to 2004 in the prevalence of potential transmitters of drug-resistant HIV (Figure 5), brought
about by successful re-suppression of viral load in potential transmitters as well as a decline in the
incidence of drug resistance.
Figure 5
Prevalence of persons in DHCS at risk of transmitting drug-resistant HIV during 1997-2004.
(Source: paper VI)

29
Later studies from different parts of the world have expressed diverging trends: a decline and
stabilisation of TDR (298,299) and a projected stabilisation of persons with extensive triple-class
failure and viral load >50 copies/mL (300) in the UK, stable TDR in France (301), and an increase
in TDR in Canada (302) driven by NRTI and NNRTI resistance. Recent reports from Sub-Saharan
Africa, the Dominican Republic, and other part of Latin America (303–306) indicate emergence of
TDR in locations where viral load testing and resistance monitoring are not routine practices.
8.4 Consequences of harbouring drug resistance mutations (paper VII)
Virological failure, drug resistance, and mortality are intertwined. Virological failure increases the
emergence of drug-resistant mutations, mutations decrease the chance of virological re-
suppression (307–311) and immunological recovery (312), and the result of this vicious cycle is
increased risk of death (222,259,260,262,313).
Our results should be interpreted together with a range of related findings: increased mortality in
patients with multidrug-resistance (314–316); specific individual mutations related to the prognosis
(317); and the link between viral load suppression, increased CD4+ cell count (318) and reduced
clinical progression (319) after TCF. The prognosis after TCF has improved during later years, and
recent studies point towards the introduction of new antiretroviral drugs having been the prime
driver (245,320).If a patient experiences virological failure, a resistance test is used to guide the
clinician in choosing a different and efficacious drug regimen. If no drug resistance is found, the
clinical team will have confidence in attempting to improve adherence on the current treatment
regimen. Such a drug-conservation strategy is often preferred, because a regimen change could
mean one less treatment option for future use, and because second-line regimens are often more
costly than first-line combinations. Unfortunately, in areas with no easy access to drug resistance
tests, the clinical decision has to be made as a qualified guess, predominantly based on HIV RNA
measurements. Testing for drug resistance was not yet routine in the early years of combination
ART (and still is not in most low- and middle-income countries). More knowledge was therefore
needed concerning the association between observed virological failure and existence of drug
resistance, and on the association between drug resistance and death in persons with virological
failure.
In Denmark, drug resistance testing had long been routine every time a patient experienced
virological failure, so the testing pattern was less influenced by convenience sampling seen in many
previous studies. Combined with the nationwide nature of the cohort, DHCS therefore provided a
very good setting for assessing both the prevalence of resistance mutations in patients with
virological failure, as well as the influence of these on mortality (paper VII). In our population of
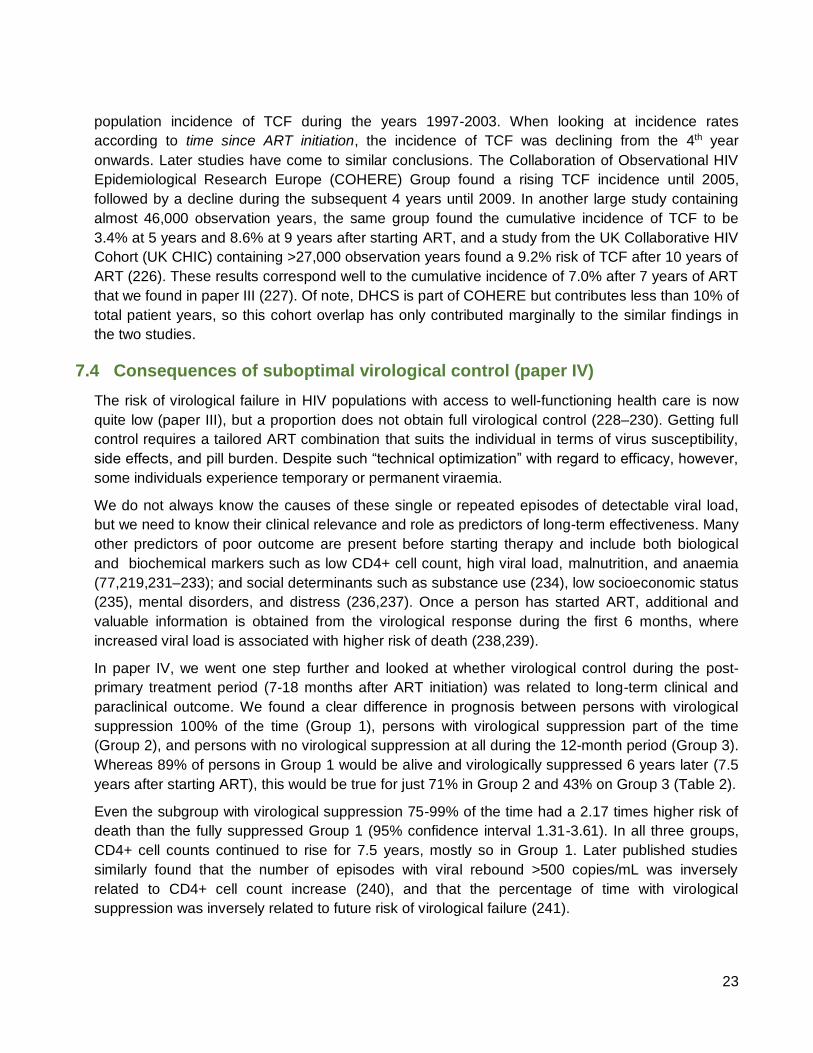
persons with triple-class virological failure, 88% had resistance mutations towards at least one drug
class, and 61% had resistance mutations towards all three major drug classes. A high overall
number of mutations as well as three individual mutations, one from each drug class, were
independent predictors of death. The relationship between resistance mutations and death seemed
to be mediated by low CD4+ cell count (Table 3).
30
Table 3
Mortality after triple-class virological failure according to number and pattern of drug-resistance
mutations. (Adapted from paper VII)
Mortality after TCF
MRR 95% CI P MRR 95% CI P MRR 95% CI P MRR 95% CI P
Number of mutations
<=8 1.0 - - 1.0 - - 1.0 - - 1.0 - -
>=9 2.3 1.1-4.8 0.020 1.4 0.7-2.9 0.348 0.9 0.4-2.3 0.896 0.8 0.3-1.9 0.556
CD4 count at baseline
>200 1.0 - - - - - 1.0 - - - - -
50-200 3.6 1.5-8.8 0.005 - - - 3.4 1.4-8.4 0.008 - - -
<50 8.6 3.0-24.7 <0.001 - - - 10.5 3.6-30.5 <0.001 - - -
CD4 count, time-updated
>200 - - - 1.0 - - - - - 1.0 - -
50-200 - - - 3.1 1.2-8.0 0.020 - - - 3.0 1.1-7.9 0.026
<50 - - - 9.9 3.9-25.4 <0.001 - - - 9.6 3.7-25.1 <0.001
T215Y - - - - - - 3.0 1.3-7.4 0.014 3.0 1.2-7.0 0.014
G190A/S - - - - - - 2.7 1.2-6.4 0.023 1.7 0.7-3.9 0.228
V82F/A/T/S - - - - - - 1.1 0.5-2.7 0.760 0.8 0.4-1.9 0.656
Adjusted for CD4 cell count at
baseline*
Adjusted for time-updated
CD4 cell count*
Adjusted for for CD4 cell
count at baseline and
influential individual
mutations*
Adjusted for time-updated
CD4 cell count and influential
individual mutations*
Cox regression analysis of time to all-cause death after triple-class virological failure (TCF). *Further adjusted for log(10) viral load (VL) and age at baseline,
gender, year of TCF, and being antiretroviral therapy (ART)-naive at initiation of highly active ART. CI, confidence interval; MRR, mortality rate ratio.
8.5 Conclusion
The fear of a vicious cycle of virological failure drug
resistance transmission of resistance virological failure
remains relevant in 2014. Local epidemics are not yet under
control (321), and while the positive reports are examples of
what can be achieved in privileged settings; the negative
reports remind us of how much needs to be done to get every
corner of the epidemic under control. Our findings in papers V
and VI underline the crucial importance of always having an
effective treatment option available for the patient with drug-
resistant virus. Access to viral load testing and resistance
monitoring needs to be expanded to allow every person with
HIV initiate ART with an efficacious drug combination, detect
virological failure in time, and change to the best possible
second or third line regimens when needed.

31
9 LIFE EXPECTANCY
9.1 Background
9.1.1 Improved HIV management
The decade around the millennium saw a tremendous improvement in HIV management. Drugs
and drug regimens became more efficacious and effective, they were less likely to induce
resistance if a pill or two were forgotten, they had fewer side effects, and one tablet a day drug
combinations became available (200,202,203,213,216). Overall, it was becoming easier to live with
HIV, in particular for those who were not infected with drug-resistant virus and who were to receive
ART for the first time. Not only had the drugs become better, medical staff was also learning how
best to use the available drugs and monitoring tests. Further, being an HIV patient in a state-of-the-
art clinic meant access to psychosocial support such as counselling and peer groups, important
ingredients in the package offered to persons with HIV (187).
9.1.2 Reduced mortality
Positive reports were emerging, comparing mortality rates in successfully treated HIV-infected
persons with those of the general population. Mortality rate ratios were as low as 3-10 and thus
approaching those of other chronic diseases (39,219,322,323), and in a subgroup of the Swiss HIV
Cohort Study the excess mortality rate was found to be below just 5 deaths per 1,000 persons per
year (324). A computer model estimated that patients in the Collaborations in HIV Outcomes
Research/US (CHORUS) cohort had a median survival from diagnosis to death of 20.4 years (325),
about twice as long as in untreated patients.
9.1.3 The need to plan for the future
As persons with HIV were now clearly surviving longer in countries where HIV treatment was
available (220), affordable and accessible, many started to ask the question of how long they might
expect to live. Many persons with HIV were banned from privileges which most persons take for
granted such as obtaining mortgage, life insurance or even health insurance, because HIV was still
largely seen as a disease which would only allow you few years of survival. Other important
decisions such as having a child or saving up for retirement pension might also become relevant
and necessary if death was no longer near coming.
There was a strong desire among persons with HIV to know their life expectancy, but many experts
considered available knowledge too uncertain to try to answer this question. The first highly
effective ART combination regimens had been introduced in 1996-1997 (11), so any predictions
would be based on less than 10 years of experience. There were many unanswered questions:
How long would people be able to adhere to treatment? Would any effective treatment eventually
lead to virological failure? Would mutations emerge, either being a result of the failing treatment or
even be the primary cause of failure? Would the speed of new and more effective drugs arriving on
the market be able to keep up with the accumulation of drug mutations in the population? While it
was likely that we would continue to see individual success stories, might one dare hope that this
would translate into substantial improvement on the population level?

32
9.2 Long-term survival (paper VIII)
9.2.1 Measuring survival
Whatever method used to estimate survival in a population, it has shortcomings. A cohort life table
created from direct observation of mortality in a very large cohort followed for a very long time will
allow for accurate estimates of both median survival time (the time until half of the studied
population has died) and life expectancy (the arithmetic mean of the survival times (326)) in that
cohort. Due to the many years of data collection involved in this approach, the measurements
would likely be outdated and therefore not useful to predict survival in a current cohort. Another
approach is to use a period life table, whereby age-specific mortality observed in a cohort over a
shorter period of time is assumed to apply to an individual over a life span (327). The clear
disadvantage of this approach when studying the effect of ART on population survival is that we
estimate survival way beyond the current maximum experience with ART. A third approach is to
use mathematical computer models. These models, based on cohort data, can apply different
assumptions to the effect of uncertain and potentially influential factors such as future effectiveness
of ART and drug-resistance development, but their reliability is highly dependent on the quality of
the data that are driving the assumptions that go into the model.
9.2.2 Survival in persons with and without HIV
In Paper VIII, we used period life table methods to estimate age-specific mortality rates and median
survival for the entire DHCS cohort in different time periods, compared with a cohort from the
general population. The previously described advantages of DHCS being nationwide and with very
few persons lost to follow-up allowed us to interpret the results as a largely unbiased picture of the
impact of a cross-healthcare system effort to manage HIV. We found a clear improvement in
survival over time from the period before availability of highly effective combination ART (1995-
1996), to the period immediately thereafter (1997-1999), with further improvements to the period
after 2000 when highly effective ART had become established across the health care system. Most
importantly, we estimated that a 25-year old person with HIV had a 50 percent chance of surviving
another 32.5 years (Figure 6) if he/she was under care in the period 2000-2005.
In DHCS, HCV coinfection is correlated to injecting drug use (IDU) and is a marker of family-related
increased risk of death (328,329). During the period 2000-2005, persons with HCV represented
16% of the cohort. The median survival for a 25-year old HIV/HCV coinfected person was just 20
years (Table 4), whereas for a person with HIV but without HCV infection the median survival was
39 years, only 12.2 years less than in the matched general population cohort. We saw no signs of
increased mortality with increasing years on ART, nor with increasing time after diagnosis. Thus,
although we had less than 10 years observation of any individual, we carefully assumed that our
results were a valid estimate of long-term survival.

33
Figure 6
Cumulative survival curve for persons with HIV and persons from the general population. Persons
with HIV infection are divided into 3 calendar periods of observation. (Adapted from paper VIII)
9.2.3 Current status
Not surprisingly, studies estimating life expectancy and mortality have been booming in later years.
The gap between persons with HIV and the general population is consistently reported to have
declined over time, shown in single- and multi-cohort studies from China (330), the United States
(76), and across Europe(76,331). The difference in life expectancy between persons with HIV and
the general population reported in recent studies range from 7 to 18 years (332–337). In selected
subpopulations for example non-IDUs or persons with good CD4+ cell response to ART or high
CD4+ cell count at ART initiation, life expectancy approaches (338), equals(333,339–342) or in
some cases even exceeds (332) that of the general population. Recent review studies come to the
conclusion that the life expectancy for persons with HIV equals that of the general population
“under ideal circumstances” (343–346). A recent Australian study showed no signs of increasing
standardized mortality ratios (SMRs) in persons who had been on ART for up to 15 years (347),

34
compared to the general population. Further, in those countries most affected by HIV, we are even
beginning to see the overall population impact. In Kwazulu-Natal in South Africa, life expectancy
increased from 49.2 years in 2003 to 60.1 years in 2011, predominantly due to the introduction and
expansion of ART (348).
Table 4
Mortality rates and median survival at age 25 years for persons in DHCS, stratified according to
“time on ART”, “time after diagnosis”, “observation period”, and HCV status. (Adapted from paper
VIII)
9.3 Conclusion
The uncertainness and fear about the durability of the HIV response at the population level is
gradually changing towards a positive feeling for the future. Our study (paper VIII) was one of the
first to put an age to the life expectancy, and with several subsequent, similar reports from other
corners of the world, it has become evident that the overall prognosis for persons with HIV is
moving rapidly in the right direction.

35
10 COMORBIDITY
10.1 Background
10.1.1 AIDS-related comorbidity
Comorbidity in persons with HIV has always been in focus, simply because the clinical
manifestation of HIV infection occurs through emergence of infections and other diseases as the
virus gradually breaks down the immune system. Unusually high prevalence of Pneumocystis
Carinii pneumonia and Kaposi Sarcoma (349,350) were some of the first observations which lead
to characterization of AIDS (351) and later discovery of human immunodeficiency-related virus
(HIV) (352). As most AIDS-defining conditions are associated with different levels of immune
deterioration, the pattern of comorbidity changes when the CD4+ cell count decreases (353). ART-
induced immune recovery not only lowers the incidence of AIDS, it also results in many of the
AIDS-defining conditions waning or disappearing as the CD4+ cell count restores; this has been
observed even for the malignancy Kaposi sarcoma (354–357).
10.1.2 Non-AIDS related comorbidity
The pattern of non-AIDS comorbidity is equally complex; the epidemiology of the comorbidity is far
from fully explored and understood, and the pattern of comorbidity changes from one cohort to
another. Some comorbid conditions are present before the person acquires HIV, and some
diseases emerge after the HIV infection. In scientific studies, diseases and conditions occurring
after the person has been diagnosed with HIV are sometimes called “non-AIDS events”. These
events can be related to HIV, or they might be no different from those observed in a similar non-HIV
population with regard to aetiology and incidence rate.
Several non-AIDS diseases are more common in persons with HIV compared to the general
population (358–361). A recent review focusing on anal cancer, Hodgkin’s lymphoma,
hepatocellular carcinoma, and lung cancer found two-fold increased rates of these four cancer
types (362). Highly increased risk of anal cancer was also found in studies from Denmark (363),
and the United States (364), the latter additionally finding a 21-fold increased rate of vaginal
cancer, as well as moderately increased rates of melanoma, oropharyngeal, colorectal and renal
cancer. A meta-analysis studied cancers in 444,172 persons with HIV and performed a similar
analysis for 31,977 transplant patients to control for possible confounding by immune suppression.
This study found increased standardized incidence ratios for lung cancer, leukaemia, renal cancer,
oesophagus cancer and stomach cancer (365). A study among US Veterans showed a doubled risk
of end-stage renal disease for HIV-infected compared with uninfected among black persons (366),
and other studies have shown increased risk of cardiovascular disease(CVD) (367)(368) and liver
disease (369) compared to the general population.
Despite their label, the prevalence of many “non-AIDS” diseases is inversely related to CD4+ cell
count. This includes liver diseases (369), non-AIDS malignancies (358,370), renal diseases
(358,371), and bacterial non-AIDS infections (372–375). An exception is perhaps CVD (358,376)

36
which doesn’t seem to follow this pattern. In some cohorts, non-AIDS morbidity has decreased over
time as the CD4+ cell levels in the population has increased (377,378).
10.2 Mechanisms by which non-AIDS conditions could be related to HIV
There are numerous possible ways by which non-AIDS related conditions and diseases could be
higher in persons with HIV than in persons without HIV (358): Common risk: Some comorbidities
share risk factors and transmission mode with HIV, for example sexually transmitted diseases,
HCV, IDU overdose, and human papilloma virus (HPV)-associated cancers. Immune activation:
HIV induces alterations in the immune and inflammatory systems and activates the coagulation
system (379–383). The immune activation leads to increased lymphocyte turnover which might be
linked to cancer (384,385), in particular those types which might be associated with infections
(361). These include Chlamydia pneumoniae and lung cancer (386); Helicobacter Pylori and gastric
cancer (387); HPV and anal, cervical, and oropharyngeal cancer (388); HBV/HCV and liver cancer
(389); and Ebstein-Barr virus and Hodgkin Lymphoma (390). Immune activation might also be
related to CVD (391), faster progression of liver disease in persons co-infected with HBV and HCV
(392,393), and renal disease such as HIV associated nephropathy (HIVAN) and immune complex
glomerulonephritis (394). Age: With persons with HIV now living longer, they acquire the same age-
related diseases as persons without HIV, for example cancer, neurocognitive impairment, diabetes
(395), CVD, and chronic obstructive pulmonary disease. These have to be recognised by the HIV
physician, but they also pose new challenges of multi-drug pharmacotherapy and potential drug
interactions (396,397). ART: Lipodystrophia, hyperlipidemia, CVD, and renal disease are all related
to specific antiretroviral drugs (398–407), and antiretroviral therapy might also play a role in the
premature frailty observed in persons with HIV(408–410). Lifestyle and social conditions: Smoking
and rough living conditions are all more common among groups of persons with HIV (411,412),
associated with increased risk of for example lung diseases, violent injuries and psychiatric illness
(413). Chronic disease: As HIV is now a chronic disease, we might see conditions found more
frequently among persons with chronic diseases such as depression(414–416).
10.3 Comorbidity and survival (paper IX)
10.3.1 Measuring comorbidity and causes of death
As mortality has declined towards that of the general population, the pattern of diseases and
conditions causing death have changed (221,417–421). Fewer persons with HIV now die from
AIDS, and while this has led to an increase in the relative contribution of non-AIDS causes of
deaths (Paper VIII) (Table 5), several studies report a simultaneous decline in absolute mortality
from non-AIDS deaths (419,422,423). The association between high CD4+ cell count and lower risk
of death also seems consistent across different causes of both AIDS deaths and non-AIDS deaths
(358,424,425).
While comorbidity is indeed related to mortality, there is no direct relationship between causes of
death and the incidence and prevalence of different comorbidities. Some non-AIDS diseases might
not be fatal and therefore never be registered on a death certificate, and others might be overtaken
by other non-AIDS events causing immediate death. Thus, diseases associated with shorter time

37
between occurrence and death will more frequently be registered as causes of death, for example
in a person with a deadly disease such as cancer who dies from a myocardial infarction. A person
might be registered as dying from an acute event, even if an underlying chronic disease is causing
this, for example a person with diabetes who dies from a stroke caused by diabetic angiopathy.
Different practices in coding of deaths from one hospital to another might also lead to quite different
results, or the validity of causes of death, which are often quickly registered by the physician who
happens to be on-call when the person dies, can be rather low. This is of course improved if the
standardized coding of deaths (CODE) is used (426,427).
Table 5
Cause-specific mortality in DHCS. (Source: paper VIII)
Mortality rates according to cause of death and calendar period
Cause of death PYR EventsMR per 1000 PYR
(95% CI)
Percent of all
cause mortality
rate
Percent of
mortality rate by
known causes
Observed 95-96
All causes 3243 402 124 (112-137) 100%
HIV-related do 231 71.2 (62.6-81.0) 57% 76%
Non-HIV related do 75 23.1 (18.4-29.0) 19% 24%
Unknown do 96 29.6 (24.2-36.2) 24%
Observed 97-99
All causes 5857 222 37.9 (33.2-43-2) 100%
HIV-related do 104 17.8 (14.7-21.5) 47% 57%
Non-HIV related do 80 13.7 (11.0-17.0) 36% 43%
Unknown do 38 6.5 (4.7-8.9) 17%
Observed 00-05
All causes 13644 346 25.4 (22.8-28.2) 100%
HIV-related do 96 7.0 (5.8-8.6) 28% 43%
Non-HIV related do 128 9.4 (7.9-11.2) 37% 57%
Unknown do 122 8.9 (7.5-10.7) 35%
The above-mentioned “pitfalls” make analyses of cause-specific survival complicated, because of
the many “competing risks” involved. Competing risk statistical models do exist (428), but exploring
the relative contribution of comorbidity on mortality is best done by computing relative survival. The
relative survival method is a standard approach that can be applied to any disease (429,430).
Study groups are stratified into different modes of exposure (disease versus no disease) and all-
cause survival and mortality rates are compared between the two groups.
10.3.2 Survival according to comorbidity present before HIV acquisition
In paper IX, we used relative survival methods to explore the impact of comorbidity acquired before
HIV acquisition on mortality. Access to morbidity records going back 10-20 years before persons in
our cohort were diagnosed with HIV enabled us to compare strata with or without comorbidity.
Further, access to good survival data in a matched general population enabled us to estimate and
adjust for background mortality. We identified comorbidity acquired before HIV as at least one point

38
on the Charlson Comorbidity Index (CCI) score at the time of HIV diagnosis. We found that persons
with HIV, compared to the general population, had more CCI comorbidity (11.3% vs 8.0%). All-
cause mortality increased with higher CCI score. In an adjusted analysis, having a CCI score of at
least one was associated with a 1.84 times increased risk of death, compared a CCI score of zero.
We also found that any CCI comorbidity had more impact on mortality in persons with HIV than in
persons without HIV, with 34.1%-58.8% of the excess mortality caused by this interaction effect.
Figure 7
Visual presentation of the total mortality in persons with HIV and the relative contribution of
background mortality (13.6%), HCV coinfection and CCI (31.5%), and HIV (55%). (Source: paper
IX)
Finally, we estimated the size of the proportion of deaths in DHCS could be attributed to
comorbidity acquired before HIV or to comorbidity otherwise not on the causal pathway between
HIV infection and death. For this analysis, we included background mortality as well as mortality
due to CCI score and HCV coinfection. We first calculated the population attributable risk (PAR) of
comorbidity (HCV and CCI) in our cohort. The PAR is the relative reduction in incidence rate (IR) if
a given population had been unexposed: PAR = (IRpop - IRunexp) / IRpop. All-cause mortality in the

39
population with HIV was 2.09% per year. Among those persons unexposed to HCV (HCV=0) and
other comorbidity (CCI=0), all-cause mortality was 1.43%. This gives a PAR of 0.32 (0.66/2.09).
Thus, if all persons with in our HIV cohort had been without HCV and CCI comorbidity, 32% of
deaths would have been avoided. We now calculated the excess risk (ER) of HIV, compared to the
general population, in persons free of HCV and CCI comorbidity. The ER is the difference between
the incidence rate in the exposed population, and the incidence rate in the unexposed population:
ER = IRexp – IRunexp. All-cause mortality in the population with HIV (HCV=0, CCI=0) was 1.43% per
year. Among matched general population controls (HCV=0, CCI=0), all-cause mortality was 0.28%.
Thus, the ER of being infected with HIV is 1.15% per year. Our final calculation estimated that 32%
of the observed mortality in our cohort was due to HCV and CCI comorbidity, 55% (1.15/2.09) was
due to HIV, and the remaining 13% (0.28/2.09) corresponded to the background mortality in the
population (Figure 7).
10.4 Conclusion
The results in paper IX can help us focus and set ambition levels for future efforts to reduce
mortality in persons with HIV (344,431). Our findings confirm that persons acquiring HIV differ at
large from the general population, and that we cannot expect overall mortality rates to reach the
level of the general population. Instead, we need to identify groups with increased, preventable risk
of death. The origin, aetiology, and consequences of each comorbid condition should be explored
and characterised, both at the population level and in the individual; including behavioural, social
and biological root causes.
11 PERSPECTIVES
11.1 Status of the epidemic
This work has given a brief overview of the immense improvements in morbidity and mortality for
persons infected with HIV during the first 30 years of the epidemic - with particular focus on how the
nine papers included in this thesis might have played a role. The “road to success” for the individual
starts with early diagnosis, followed by early enrolment into a health care system that provides high
quality HIV care at all levels. Timely initiation of effective ART is essential, and continued
monitoring of viral load is the key to avoiding the development of drug resistance and ensuring the
shift to appropriate second-line regimens when needed. If the person is fortunate to stay free of
other diseases, a successful trip down this road will be rewarded with a life expectancy that is very
close to that of a comparable person who is not infected with HIV. This scenario has become reality
for many persons in high-income countries, but many groups and individuals have not yet
experienced the full benefit (321). Further, although we have also seen immense improvements in
countries where the epidemic has hit the hardest (348), only 45% of those living with HIV in sub-
Saharan Africa in 2013 knew their status, only 39% received ART, and only 29% had fully
suppressed viral load (321).
The good news is that the overall feeling for the future in the HIV community is optimistic. UNAIDS
has dared to set ambitious, although not unrealistic targets for the future: a 90% reduction in new

40
infections, a 90% reduction in stigma and discrimination, a 90% reduction in AIDS-related deaths;
and an end to the AIDS epidemic as a public health threat by 2030 (321,432). Achieving these
goals will require a concerted effort from the HIV community, including targeted research to gain
new knowledge as well as a strong focus on scaling up implementation of existing solutions.
11.2 Future opportunities
11.2.1 Integrated solutions
The successful HIV response is causing fewer new infections, lowering mortality, and reducing
AIDS-related discrimination, while other diseases are climbing up the ladder as important
contributors to the global burden of disease (433,434). The days of AIDS exceptionalism are over
(435,436), and HIV needs to find its natural place as a chronic disease. More than ever do we need
stronger health systems that can provide HIV care and management integrated with that of other
diseases in horizontal programmes (437,438). Although the feasibility of integrated care models
has been shown in some settings (439–441), more implementation science is required to identify
solutions that are scalable and sustainable.
11.2.2 Timely diagnosis
An unacceptably large gap exists between the number of persons living with HIV, and the
proportion of those who have yet been diagnosed (321). To fill the gap, countries need detailed
knowledge on the demographics of their local epidemic (345). Which groups and geographical
areas have high prevalence of persons with HIV, and how can they be reached? “Know your
epidemic” was a slogan originally used to describe the need to tailor HIV prevention efforts (83,85),
but it is equally relevant (84) when it comes to finding those persons who are unaware of their
positive HIV status. Several current initiatives support this challenge: The European HIDES Study
aims to develop a model for implementation of targeted HIV testing in clinical settings (149), WHO
and UNAIDS have produced guidelines on how countries can use available data for a more
effective response to their local HIV epidemic (84), and the systematic collection and compilation of
detailed global epidemiological data by UNAIDS provides an invaluable backbone for many of
these efforts(442). Ultimately, each country needs to develop its own HIV detection strategy,
optimally suited to the local epidemic.
11.2.3 Improved care
Today´s increased life expectancy in persons with HIV calls for improved understanding of aging
and comorbidity. There is a growing need for age-specific guidelines (345), for clinicians across
specialties who can provide care for an aging population with multiple morbidities (358), and for
health systems that can deliver the continuity of care required by older people (443,444). As
comorbidity patterns have changed, there is also a growing need to identify groups and individuals
with increased, preventable risk of death and disease. We must re-evaluate screening programmes
for cancer and other diseases to assess their cost and effectiveness in HIV populations (359,445),
and put greater focus on promoting healthy lifestyle (345). Better understanding of the drivers
behind non-AIDS comorbidity will allow us to develop and prioritize interventions that are targeted
to a specific clinic, cohort, or population.

41
Despite the undisputable success of ART, a number of questions pertinent to HIV treatment and
care remain to be answered. It is currently debated whether individuals will benefit from starting
ART at a higher level than the most commonly used CD4+ cell count threshold of 350 cells/µL
(89,446). Current evidence is largely based on observational studies (447) and should therefore be
interpreted with caution due to the inherent risk of confounding by indication in this type of study.
The ongoing Strategic Timing of AntiRetroviral Treatment (START) trial (448) is enrolling study
subjects with CD4+ cell count above 500 cells/µL who are randomized to start ART immediately or
defer initiation until the CD4+ cell count falls below 350 cells/µL. The START trial should be able to
provide new and valuable knowledge on the subject. We also need more knowledge on how to
control the chronic immune activation and inflammation which seems to play an important role in
the changing patterns of comorbidity (449,450).
Human, technical, and financial resources in health systems are not equally distributed, and many
local HIV epidemics are not yet under control (321). Being a key component of effective HIV care,
access to viral load testing and drug resistance monitoring needs to be expanded to allow every
person with HIV to initiate ART with an efficacious drug combination, detect virological failure in
time, and change to the best possible second or third line regimens when needed. If we continue to
improve and implement new models of HIV care delivery, mortality can decline even further. These
models should be based on an inclusive and individualized approach to patient management,
taking into account the biological and psychosocial properties of each person with HIV.
11.2.4 New therapies
The world must not stop investing in the development of new therapies. New antiretroviral drugs will
be essential to ensure continued availability of effective treatment options for those who have failed
one or more drug combinations and are therefore accumulating multi-drug resistant virus. The
scientific community should also continue to look for ultimate solutions such as a preventive
vaccine (451) or an HIV cure (15–18). The allogeneic bone marrow transplantation from a donor
homozygous for CCR532 to the so-called “Berlin Patient” was the proof-of-concept that HIV
eradication is technically possible (263), and the most promising current methods being
investigated are gene therapy (452) or purging of viral reservoirs(453,454).
11.2.5 Prevention
HIV prevention is outside the scope of this thesis, but deserves a few lines due to the recent
advances in effective prevention strategies, the dual effect of ART as prevention and treatment at
the same time, and the role of prevention as the ultimate goal to eliminate HIV. The immense
amount of HIV prevention research has revealed a range of effective behavioural, biomedical, and
structural interventions. Combination prevention combines these interventions in tailored
programmes, and is hoped to have a considerable impact on reducing new infections in the coming
years (455,456). More simple in its approach is treatment as prevention, which in the most radical
version relies on a population-based test-and-treat-all strategy to reduce the population viral load
and thereby the incidence of new infections (88,457–459). Upcoming results of cluster-randomized
trials will be awaited with excitement (97,105–108,110,111).
42
12 CONCLUSION
This thesis attempted to map the “road to success”, i.e., the road leading to increased survival of
individuals and populations with HIV, ultimately to levels approaching those of the general
population. Each of the nine studies explored and discussed some of the many bumps and other
challenges that one needs to navigate in order to proceed safely down this road. Through a
massive global effort for decades, HIV research has taken a giant leap to get this far. The studies in
this thesis have each paid their modest contribution to show how crucially important it is to be
diagnosed in time, to have access to a well-functioning health system, and to keep free of
comorbidity both before and after acquiring HIV. After many years of struggle and despair, the HIV
response is on the right track. Thanks to enormous advances in prevention and treatment, we are
now looking towards a promising future. With a continued, relentless effort from every corner of the
HIV community, we will be able to continue rapid expansion and implementation of current and new
knowledge to benefit persons with HIV, persons at risk of acquiring HIV, and global public health.
13 SUMMARY
The work on this thesis began in 2003 when the global HIV epidemic was out of control. A minority
of persons with HIV were benefitting fully from the recently introduced highly efficacious
antiretroviral therapy (ART) combinations. Among the global challenges were lack of access to
good health care, drug toxicity, and emergence of drug-resistant virus. It was unknown how long
the drugs could maintain their efficacy in the individual even if administered as intended, and there
was a fear that the increased drug pressure would increase the prevalence of drug resistance,
subsequently leading to transmission of resistant virus from one individual to another, and thereby
waning the treatment options available. Hence, we were far from the ideal conditions where an HIV-
infected individual gets to know immediately that he/she is infected, has access to specialized
medical and social support, receives a drug combination which effectively suppresses the virus and
has no side effects, and is free of comorbid conditions both before and after he/she gets infected.
The nine papers on which this thesis is based each aimed to provide new knowledge to aspects of
the above.
Late diagnosis and late presentation to clinical care continue to be major barriers to improved HIV
management. We used nationwide hospital registries to explore the potential for an indicator
disease-based HIV testing strategy. A range of conditions that were manifestations of the HIV
infection itself were found to be associated with highly increased risk of HIV diagnosis during the
coming year, but less so 3 to 5 years later. Other conditions were associated with an almost
constant 5-year long increased risk of being diagnosed with HIV because they share behavioural
risk factors with HIV, making them indicators of not only current HIV but also of future HIV
acquisition. Hence, indicator condition-based testing should be adapted to the local epidemic and
could be a valuable addition to the existing detection practice.
Once diagnosed, getting the full benefit of modern HIV care requires access to a good health care
system. We compared temporal trends in quality and quantity of ART introduction in Denmark and
Greenland. Despite similar levels of health worker education and economic resources, ART

43
implementation and mortality decline in Greenland lacked several years behind Denmark. The
study reminded us that although economy may be a prerequisite for implementing an effective HIV
care system, it is certainly not all it takes.
The nationwide nature of the Danish HIV Cohort Study also allowed us to study a number of time
trends at the population level. Despite what was feared, we found that the prevalence of triple-drug
class virological failure (TCF) seemed to have stabilized after 2000; that the incidence rates of drug
resistance acquisition were decreasing during 1999-2005; and that the prevalence of potential
transmitters of drug-resistant HIV decreased during 1997-2004. We also looked at some of the
consequences of virological failure and drug resistance and found that even modest levels of
viraemia were associated with a high risk of future failure and death, and that in persons who have
experienced TCF, the number and pattern of resistance mutations were independent predictors of
death. Hence, despite the overall positive trends in virological failure and drug-resistance
development at the population level, our findings underline the crucial importance of always having
an effective treatment option available for the individual patient with drug-resistant virus.
As mortality was declining for persons with access to ART and good HIV care, it became important
to know how long persons with HIV could expect to live compared to the general population. We
projected long-term survival and found that a 25-year old person with HIV and without hepatitis C
virus (HCV) coinfection had a 50 percent chance of surviving another 39 years, only 12.2 years less
than a person in a matched general population cohort would survive.
With improved survival and declining HIV-related comorbidity, non-HIV related comorbidity became
a more visible contributor to the health status of persons with HIV. We assessed the impact of non-
HIV related comorbidity acquired before the person became infected with HIV. We found that 32%
of the observed mortality in our cohort was due to HCV and comorbidities measured by the
Charlson Comorbidity Index, 13% corresponded to the background mortality in the population, and
that only 55% of the mortality could be attributed to HIV. Our findings confirmed that persons
acquiring HIV differ at large from the general population, and that we should not expect overall
mortality rates in populations with HIV to reach the levels in the general population.
This thesis attempted to map some of the many challenges on the road towards increased survival
of individuals and populations with HIV up to a level, which today in many settings is close to that of
the general population. The studies in this thesis have each paid their modest contribution to show
how crucially important it is to be diagnosed in time, to have access to a well-functioning health
system, and to keep free of comorbidity both before and after acquiring HIV. After many years of
struggle and despair, and thanks to enormous advances in prevention and treatment, we are now
looking towards a promising future.

44
14 REFERENCES
1. Søgaard OS, Lohse N, Østergaard L, Kronborg G, Røge B, Gerstoft J, et al. Morbidity and risk of subsequent diagnosis of HIV: a population based case control study identifying indicator diseases for HIV infection. PLoS One. 2012 Jan;7(3):e32538.
2. Lohse N, Ladefoged K, Obel N. Implementation and effectiveness of antiretroviral therapy in Greenland. EmergInfectDis. 2008 Jan;14(1):56–9.
3. Lohse N, Obel N, Kronborg G, Laursen A, Pedersen C, Larsen CS, et al. Declining risk of triple-class antiretroviral drug failure in Danish HIV-infected individuals. Aids. 2005 May 20;19(8):815–22.
4. Lohse N, Kronborg G, Gerstoft J, Larsen CS, pedersen G, Pedersen C, et al. Virological Control during the First 6-18 Months after Initiating HAART as a Predictor for Mortality, CD4+ Cell Increase, and Viral Suppression. ClinInfectDis. 2006;
5. Audelin AM, Lohse N, Obel N, Gerstoft J, Jørgensen LB. The incidence rate of HIV type-1 drug resistance in patients on antiretroviral therapy: a nationwide population-based Danish cohort study 1999-2005. Antivir Ther. 2009 Jan;14(7):995–1000.
6. Lohse N, Obel N, Kronborg G, Jørgensen LB, Pedersen C, Larsen CS, et al. Declining prevalence of HIV-infected individuals at risk of transmitting drug-resistant HIV in Denmark during 1997-2004. Antivir Ther. 2006 Jan;11(5):591–600.
7. Lohse N, Jørgensen LB, Kronborg G, Møller A, Kvinesdal B, Sørensen HT, et al. Genotypic drug resistance and long-term mortality in patients with triple-class antiretroviral drug failure. Antivir Ther. 2007 Jan;12(6):909–17.
8. Lohse N, Hansen A-BEB, Pedersen G, Kronborg G, Gerstoft J, Sorensen HT, et al. Survival of persons with and without HIV infection in Denmark, 1995-2005. Ann Intern Med. 2007 Jan 16;146(2):87–95.
9. Lohse N, Gerstoft J, Kronborg G, Larsen CS, Pedersen C, Pedersen G, et al. Comorbidity acquired before HIV diagnosis and mortality in persons infected and uninfected with HIV: a Danish population-based cohort study. J Acquir Immune Defic Syndr. 2011 Aug 1;57(4):334–9.
10. UNAIDS. 2004 Report on the Global AIDS Epidemic. 2004;
11. Palella FJ, Delaney KM, Moorman AC, Loveless MO, Fuhrer J, Satten GA, et al. Declining morbidity and mortality among patients with advanced human immunodeficiency virus infection. HIV Outpatient Study Investigators. N Engl J Med. 1998 Mar 26;338(13):853–60.
12. UNAIDS. UNAIDS I 2011–2015 STRATEGY: GETTING TO ZERO [Internet]. 2011. Available from: http://www.unaids.org/en/media/unaids/contentassets/documents/unaidspublication/2010/jc2034_unaids_strategy_en.pdf
13. Fauci AS, Folkers GK, Dieffenbach CW. HIV-AIDS: much accomplished, much to do. Nat Immunol. 2013 Nov;14(11):1104–7.
14. Richman DD, Margolis DM, Delaney M, Greene WC, Hazuda D, Pomerantz RJ. The challenge of finding a cure for HIV infection. Science (80- ). 2009;323(5919):1304–7.
15. Lewin SR. Finding a Cure for HIV: Much Work to Do. Ann Intern Med. 2014 Jul 22;

45
16. Fauci AS, Marston HD, Folkers GK. An HIV Cure: Feasibility, Discovery, and Implementation. JAMA. 2014 Jul 23;312(4):335–6.
17. Lewin SR, Deeks SG, Barré-Sinoussi F. Towards a cure for HIV—are we making progress? Lancet. 2014 Jul 19;384(9939):209–11.
18. Passaes CP, Sáez-Cirión A. HIV cure research: advances and prospects. Virology. 2014 Apr;454-455:340–52.
19. Helleberg M, Häggblom A, Sönnerberg B, Obel N. HIV care in the Swedish-Danish HIV cohort 1995-2010, closing the gaps. PLoS One. 2013 Jan;8(8):e72257.
20. Obel N, Engsig FN, Rasmussen LD, Larsen M V, Omland LH, Sørensen HT. Cohort profile: the Danish HIV cohort study. Int J Epidemiol. 2009 Oct;38(5):1202–6.
21. Omland LH, Ahlström MG, Obel N. Cohort Profile Update: The Danish HIV Cohort Study (DHCS). Int J Epidemiol. 2014 Jul 28;
22. Lohse N, Hansen A-BEB, Jensen-Fangel S, Kronborg G, Kvinesdal B, Pedersen C, et al. Demographics of HIV-1 infection in Denmark: results from the Danish HIV Cohort Study. Scand J Infect Dis. 2005 Jan;37(5):338–43.
23. Jensen-Fangel S, Pedersen C, Larsen CS, Tauris P, Møller A, Obel N. Changing demographics in an HIV-infected population: results from an observational cohort study in Western Denmark. ScandJInfectDis. 2001;33(10):765–70.
24. Arrivé E, Kyabayinze DJ, Marquis B, Tumwesigye N, Kieffer M-P, Azondekon A, et al. Cohort profile: the paediatric antiretroviral treatment programmes in lower-income countries (KIDS-ART-LINC) collaboration. Int J Epidemiol. 2008 Jun;37(3):474–80.
25. Dabis F, Balestre E, Braitstein P, Miotti P, Brinkhof WGM, Schneider M, et al. Cohort Profile: Antiretroviral Therapy in Lower Income Countries (ART-LINC): international collaboration of treatment cohorts. Int J Epidemiol. 2005 Oct;34(5):979–86.
26. Egger M, Ekouevi DK, Williams C, Lyamuya RE, Mukumbi H, Braitstein P, et al. Cohort Profile: the international epidemiological databases to evaluate AIDS (IeDEA) in sub-Saharan Africa. Int J Epidemiol. 2012 Oct;41(5):1256–64.
27. IeDEA. International epidemiological Databases to Evaulate AIDS (IeDEA). http://www.iedea-hiv.org/. 2006;
28. Ma Y, Zhang F, Zhao Y, Zang C, Zhao D, Dou Z, et al. Cohort profile: the Chinese national free antiretroviral treatment cohort. Int J Epidemiol. 2010 Aug;39(4):973–9.
29. Mary-Krause M, Grabar S, Lièvre L, Abgrall S, Billaud E, Boué F, et al. Cohort Profile: French hospital database on HIV (FHDH-ANRS CO4). Int J Epidemiol. 2014 Feb 17;
30. May MT, Ingle SM, Costagliola D, Justice AC, de Wolf F, Cavassini M, et al. Cohort profile: Antiretroviral Therapy Cohort Collaboration (ART-CC). Int J Epidemiol. 2013 Apr 18;
31. Palmer AK, Klein MB, Raboud J, Cooper C, Hosein S, Loutfy M, et al. Cohort profile: the Canadian Observational Cohort collaboration. Int J Epidemiol. 2011 Feb;40(1):25–32.
32. Schoeni-Affolter F, Ledergerber B, Rickenbach M, Rudin C, Günthard HF, Telenti A, et al. Cohort profile: the Swiss HIV Cohort study. Int J Epidemiol. 2010 Oct;39(5):1179–89.
33. EuroSIDA [Internet]. 2014. Available from: http://www.chip.dk/Ongoing-Studies/EuroSIDA/About

46
34. The creation of a large UK-based multicentre cohort of HIV-infected individuals: The UK Collaborative HIV Cohort (UK CHIC) Study. HIVMed. 2004;5(2):115–24.
35. Women’s Interagency HIV Study (WHIS) [Internet]. 2014. Available from: https://statepiaps.jhsph.edu/wihs/
36. Australian HIV Observational Database (AHOD) [Internet]. 2014. Available from: https://kirby.unsw.edu.au/projects/australian-hiv-observational-database-ahod
37. Data Collection on Adverse events of Anti-HIV Drugs (DAD) [Internet]. 2014. Available from: http://www.cphiv.dk/DAD
38. HIV Monitoring Foundation [Internet]. 2014. Available from: http://www.hiv-monitoring.nl/index.php/nederlands/
39. Lohse N, Ladefoged K, Pedersen L, Jensen-Fangel S, Sorensen HT, Obel N. Low effectiveness of highly active antiretroviral therapy and high mortality in the Greenland HIV-infected population. Scand J Infect Dis. 2004;36(10):738–42.
40. From E, Olsen J, Melbye M, Misfeldt J. Monitoring the Stop-AIDS campaign in Greenland. A study of knowledge, behaviour, and practice among patients at the STD clinic in Nuuk. Arct MedRes. 1991;50(2):62–6.
41. Misfeldt J, Olsen J, Melbye M. [The AIDS/HIV situation in Greenland 1991]. UgeskrLaeger. 1991;153(51):3630–2.
42. Greenland S. No Title. http://www.statgreen.gl/english/. 2006.
43. Annual Report from the Chief Medical Officer in Greenland 2002. http://www.nanoq.gl/imageblob/showimage.aspx?type=image&id=57673. 2006.
44. Stenz F, Koch AL, Friborg J, Olsen OR. Infectious Diseases in Greenland, part 2. Copenhagen. Available at: http://www.ssi.dk/sw6519.asp. Accesed on 20 May 2004.; 2003.
45. Andersen TF, Madsen M, Jorgensen J, Mellemkjoer L, Olsen JH. The Danish National Hospital Register. A valuable source of data for modern health sciences. DanMedBull. 1999;46(3):263–8.
46. Pedersen CB, Gøtzsche H, Møller JO, Mortensen PB. The Danish Civil Registration System. A cohort of eight million persons. Dan Med Bull. 2006 Nov;53(4):441–9.
47. The Civil Registration System in Denmark [Internet]. [cited 2014 May 30]. Available from: https://cpr.dk/in-english/executive-order-on-the-civil-registration-system-act/
48. Olsen JH, Andersen A, Dreyer L, Pukkala E, Tryggvadottir L, Gerhardsson de Verdier M, et al. Summary of avoidable cancers in the Nordic countries. APMIS Suppl. 1997 Jan;76:141–6.
49. Rothman KJ. Epidemiology: An Introduction. Oxford University Press; 2002.
50. McNamee R. Regression modelling and other methods to control confounding. OccupEnvironMed. 2005;62(7):472,500–6.
51. Fletcher RW, Fletcher SW. Clinical Epidemiology: The Essentials. 4th ed. Lippincott Williams & Williams; 2005.
52. Olsen J, Basso O, Sorensen HT. What is a population-based registry? ScandJPublic Heal. 1999;27(1):78.
53. Last JM. A Dictionary of Epidemiology. 4th ed. Oxford University Press, USA; 2000.

47
54. Schneeweiss S, Avorn J. A review of uses of health care utilization databases for epidemiologic research on therapeutics. JClinEpidemiol. 2005;58(4):323–37.
55. Vandenbroucke JP. When are observational studies as credible as randomised trials? Lancet. 2004;363(9422):1728–31.
56. Jensen-Fangel S, Pedersen C, Larsen CS, Tauris P, Møller A, Obel N. Trends in the use of highly active antiretroviral therapy in western Denmark 1996-2000. ScandJInfectDis. 2002;34(6):460–5.
57. Phillips AN, Grabar S, Tassie JM, Costagliola D, Lundgren JD, Egger M. Use of observational databases to evaluate the effectiveness of antiretroviral therapy for HIV infection: comparison of cohort studies with randomized trials. EuroSIDA, the French Hospital Database on HIV and the Swiss HIV Cohort Study Groups. AIDS. 1999;13(15):2075–82.
58. Brookmeyer R. AIDS, epidemics, and statistics. Biometrics. 1996;52(3):781–96.
59. Frank L. Epidemiology. When an entire country is a cohort. Science (80- ). 2000;287(5462):2398–9.
60. Blaxhult A, Kirk O, Pedersen C, Dietrich M, Barton SE, Gatell JM, et al. Regional differences in presentation of AIDS in Europe. EpidemiolInfect. 2000;125(1):143–51.
61. Chiesi A, Mocroft A, Dally LG, Miller V, Katlama C, Ledergerber B, et al. Regional survival differences across Europe in HIV-positive people: the EuroSIDA study. AIDS. 1999;13(16):2281–8.
62. Cummings SR, Ernster V, Hulley SB. Designing a New Study: I: Cohort Studies. In: Hulley SB, editor. Designing Clinical Research: An Epidemiological Approach. 1st ed. Williams & Wilkins; 1988.
63. Alcabes P, Pezzotti P, Phillips AN, Rezza G, Vlahov D. Long-term perspective on the prevalent-cohort biases in studies of human immunodeficiency virus progression. AmJEpidemiol. 1997;146(7):543–51.
64. Brookmeyer R, Gail MH, Polk BF. The prevalent cohort study and the acquired immunodeficiency syndrome. AmJEpidemiol. 1987;126(1):14–24.
65. Perez-Hoyos S, Ferreros I, Amo JD, Muga R, Romero JD, de Olalla PG, et al. Survival and progression to AIDS in a seroconverter cohort in the post-highly active antiretroviral therapy era: effectiveness goes on. AIDS. 2006;20(2):289–91.
66. O’Brien WA, Hartigan PM, Martin D, Esinhart J, Hill A, Benoit S, et al. Changes in plasma HIV-1 RNA and CD4+ lymphocyte counts and the risk of progression to AIDS. Veterans Affairs Cooperative Study Group on AIDS. NEnglJMed. 1996;334(7):426–31.
67. Gray RH, Wawer MJ, Brookmeyer R, Sewankambo NK, Serwadda D, Wabwire-Mangen F, et al. Probability of HIV-1 transmission per coital act in monogamous, heterosexual, HIV-1-discordant couples in Rakai, Uganda. Lancet. 2001 Apr 14;357(9263):1149–53.
68. Quinn TC, Wawer MJ, Sewankambo N, Serwadda D, Li C, Wabwire-Mangen F, et al. Viral load and heterosexual transmission of human immunodeficiency virus type 1. Rakai Project Study Group. N Engl J Med. 2000;342(13):921–9.
69. Jamieson DJ, Sibailly TS, Sadek R, Roels TH, Ekpini ER, Boni-Ouattara E, et al. HIV-1 Viral Load and Other Risk Factors for Mother-to-Child Transmission of HIV-1 in a Breast-Feeding Population in Cote d’Ivoire. JAcquirImmuneDeficSyndr. 2003;34(4):430–6.
48
70. Shaffer N, Roongpisuthipong A, Siriwasin W, Chotpitayasunondh T, Chearskul S, Young NL, et al. Maternal virus load and perinatal human immunodeficiency virus type 1 subtype E transmission, Thailand. Bangkok Collaborative Perinatal HIV Transmission Study Group. JInfectDis. 1999;179(3):590–9.
71. Strom BL. Pharmacoepidemiology. John Wiley & Sons, Ltd; 2005.
72. Ray WA. Evaluating medication effects outside of clinical trials: new-user designs. AmJEpidemiol. 2003;158(9):915–20.
73. Lov om behandling af personoplysninger [Internet]. 2000. Available from: https://www.retsinformation.dk/Forms/R0710.aspx?id=828&exp=1
74. Kozak M, Zinski A, Leeper C, Willig JH, Mugavero MJ. Late diagnosis, delayed presentation and late presentation in HIV: proposed definitions, methodological considerations and health implications. Antivir Ther. 2013 Jan;18(1):17–23.
75. Chadborn TR, Delpech VC, Sabin CA, Sinka K, Evans BG. The late diagnosis and consequent short-term mortality of HIV-infected heterosexuals (England and Wales, 2000-2004). AIDS. 2006 Nov 28;20(18):2371–9.
76. Antiretroviral Therapy Cohort Collaboration. Life expectancy of individuals on combination antiretroviral therapy in high-income countries: a collaborative analysis of 14 cohort studies. Lancet. 2008 Jul 26;372(9635):293–9.
77. Egger M, May M, Chene G, Phillips AN, Ledergerber B, Dabis F, et al. Prognosis of HIV-1-infected patients starting highly active antiretroviral therapy: a collaborative analysis of prospective studies. Lancet. 2002;360(9327):119–29.
78. Kelley CF, Kitchen CMR, Hunt PW, Rodriguez B, Hecht FM, Kitahata M, et al. Incomplete peripheral CD4+ cell count restoration in HIV-infected patients receiving long-term antiretroviral treatment. Clin Infect Dis. 2009 Mar 15;48(6):787–94.
79. McKinnon LR, Kimani M, Wachihi C, Nagelkerke NJ, Muriuki FK, Kariri A, et al. Effect of baseline HIV disease parameters on CD4+ T cell recovery after antiretroviral therapy initiation in Kenyan women. PLoS One. 2010 Jan;5(7):e11434.
80. Siddique MA, Hartman KE, Dragileva E, Dondero M, Gebretsadik T, Shintani A, et al. Low CD4+ T cell nadir is an independent predictor of lower HIV-specific immune responses in chronically HIV-1-infected subjects receiving highly active antiretroviral therapy. J Infect Dis. 2006 Sep 1;194(5):661–5.
81. Williams I, Churchill D, Anderson J, Boffito M, Bower M, Cairns G, et al. British HIV Association guidelines for the treatment of HIV-1-positive adults with antiretroviral therapy 2012. HIV Med. 2012 Sep;13 Suppl 2:1–85.
82. Hirnschall G, Harries AD, Easterbrook PJ, Doherty MC, Ball A. The next generation of the World Health Organization’s global antiretroviral guidance. J Int AIDS Soc. 2013 Jan;16:18757.
83. Wilson D, Halperin DT. “Know your epidemic, know your response”: a useful approach, if we get it right. Lancet. 2008;372(9637):423–6.
84. UNAIDS/WHO Working Group on Global HIV/AIDS and STI Surveillance. Guidelines for second generation HIV surveillance: an update: Know your epidemic. 2013.
85. Buse K, Dickinson C, Sidibe M. HIV: know your epidemic, act on its politics. J R Soc Med. 2008;101(12):572–3.
86. Cohen MS, Chen YQ, McCauley M, Gamble T, Hosseinipour MC, Kumarasamy N, et al. Prevention of HIV-1 infection with early antiretroviral therapy. N Engl J Med. 2011 Aug 11;365(6):493–505.

49
87. Scognamiglio P, Chiaradia G, De Carli G, Giuliani M, Mastroianni CM, Aviani Barbacci S, et al. The potential impact of routine testing of individuals with HIV indicator diseases in order to prevent late HIV diagnosis. BMC Infect Dis. 2013 Jan;13:473.
88. Granich RM, Gilks CF, Dye C, De Cock KM, Williams BG. Universal voluntary HIV testing with immediate antiretroviral therapy as a strategy for elimination of HIV transmission: a mathematical model. Lancet. 2009 Jan 3;373(9657):48–57.
89. Franco RA, Saag MS. When to start antiretroviral therapy: as soon as possible. BMC Med. 2013 Jan;11:147.
90. Yazdanpanah Y, Lange J, Gerstoft J, Cairns G. Earlier testing for HIV--how do we prevent late presentation? Antivir Ther. 2010 Jan;15 Suppl 1:17–24.
91. Socías ME, Rotryng F, Lapadula P, Medrano M, Paz D, Stern L, et al. Treatment as prevention in resource-limited settings: is it feasible to maintain HIV viral load suppression over time? J Infect Dev Ctries. 2013 Aug;7(8):593–9.
92. Meyer-Rath G, Over M. HIV treatment as prevention: modelling the cost of antiretroviral treatment--state of the art and future directions. PLoS Med. 2012 Jan;9(7):e1001247.
93. Bärnighausen T, Salomon JA, Sangrujee N. HIV treatment as prevention: issues in economic evaluation. PLoS Med. 2012 Jan;9(7):e1001263.
94. Rennie S. Ethical use of antiretroviral resources for HIV prevention in resource poor settings. Dev World Bioeth. 2013 Aug;13(2):79–86.
95. Ostmann F, Saenz C. Separate goals, converging priorities: on the ethics of treatment as prevention. Dev World Bioeth. 2013 Aug;13(2):57–62.
96. Muessig KE, Smith MK, Powers KA, Lo Y-R, Burns DN, Grulich AE, et al. Does ART prevent HIV transmission among MSM? AIDS. 2012 Nov 28;26(18):2267–73.
97. Delva W, Eaton JW, Meng F, Fraser C, White RG, Vickerman P, et al. HIV treatment as prevention: optimising the impact of expanded HIV treatment programmes. PLoS Med. 2012 Jan;9(7):e1001258.
98. Cohen MS, Dye C, Fraser C, Miller WC, Powers KA, Williams BG. HIV treatment as prevention: debate and commentary--will early infection compromise treatment-as-prevention strategies? PLoS Med. 2012 Jan;9(7):e1001232.
99. Fidler S, Anderson J, Azad Y, Delpech V, Evans C, Fisher M, et al. Position statement on the use of antiretroviral therapy to reduce HIV transmission, January 2013: the British HIV Association (BHIVA) and the Expert Advisory Group on AIDS (EAGA). HIV Med. 2013 May;14(5):259–62.
100. Mayer K, Gazzard B, Zuniga JM, Amico KR, Anderson J, Azad Y, et al. Controlling the HIV epidemic with antiretrovirals: IAPAC consensus statement on treatment as prevention and preexposure prophylaxis. J Int Assoc Provid AIDS Care. 12(3):208–16.
101. Dieffenbach CW. Preventing HIV transmission through antiretroviral treatment-mediated virologic suppression: aspects of an emerging scientific agenda. Curr Opin HIV AIDS. 2012 Mar;7(2):106–10.
102. Ambrosioni J, Calmy A, Hirschel B. HIV treatment for prevention. J Int AIDS Soc. 2011 Jan;14:28.
103. Wood R, Lawn SD. Antiretroviral treatment as prevention: impact of the “test and treat” strategy on the tuberculosis epidemic. Curr HIV Res. 2011 Sep;9(6):383–92.

50
104. Kranzer K, Lawn SD, Johnson LF, Bekker L-G, Wood R. Community viral load and CD4 count distribution among people living with HIV in a South African Township: implications for treatment as prevention. J Acquir Immune Defic Syndr. 2013 Aug 1;63(4):498–505.
105. Cori A, Ayles H, Beyers N, Schaap A, Floyd S, Sabapathy K, et al. HPTN 071 (PopART): A Cluster-Randomized Trial of the Population Impact of an HIV Combination Prevention Intervention Including Universal Testing and Treatment: Mathematical Model. Polis MA, editor. PLoS One. 2014 Jan 15;9(1):e84511.
106. Granich R, Williams B, Montaner J. Fifteen million people on antiretroviral treatment by 2015: treatment as prevention. Curr Opin HIV AIDS. 2013 Jan;8(1):41–9.
107. Williams BG, Lima V, Gouws E. Modelling the impact of antiretroviral therapy on the epidemic of HIV. Curr HIV Res. 2011 Sep;9(6):367–82.
108. Eaton JW, Johnson LF, Salomon JA, Bärnighausen T, Bendavid E, Bershteyn A, et al. HIV treatment as prevention: systematic comparison of mathematical models of the potential impact of antiretroviral therapy on HIV incidence in South Africa. PLoS Med. 2012 Jan;9(7):e1001245.
109. Boily MC, Baggaley RF, Wang L, Masse B, White RG, Hayes RJ, et al. Heterosexual risk of HIV-1 infection per sexual act: systematic review and meta-analysis of observational studies. Lancet Infect Dis. 2009;9(2):118–29.
110. Boily M-C, Mâsse B, Alsallaq R, Padian NS, Eaton JW, Vesga JF, et al. HIV treatment as prevention: considerations in the design, conduct, and analysis of cluster randomized controlled trials of combination HIV prevention. PLoS Med. 2012 Jan;9(7):e1001250.
111. Delva W, Wilson DP, Abu-Raddad L, Gorgens M, Wilson D, Hallett TB, et al. HIV treatment as prevention: principles of good HIV epidemiology modelling for public health decision-making in all modes of prevention and evaluation. PLoS Med. 2012 Jan;9(7):e1001239.
112. Wohlgemut J, Lawes T, Laing RBS. Trends in missed presentations and late HIV diagnosis in a UK teaching hospital: a retrospective comparative cohort study. BMC Infect Dis. 2012 Jan;12:72.
113. Lazarus J V, Jürgens R, Weait M, Phillips A, Hows J, Gatell J, et al. Overcoming obstacles to late presentation for HIV infection in Europe. HIV Med. 2011 Apr;12(4):246–9.
114. Seal PS, Jackson DA, Chamot E, Willig JH, Nevin CR, Allison JJ, et al. Temporal trends in presentation for outpatient HIV medical care 2000-2010: implications for short-term mortality. J Gen Intern Med. 2011 Jul;26(7):745–50.
115. Mukolo A, Villegas R, Aliyu M, Wallston KA. Predictors of late presentation for HIV diagnosis: a literature review and suggested way forward. AIDS Behav. 2013 Jan;17(1):5–30.
116. Waters L, Sabin CA. Late HIV presentation: epidemiology, clinical implications and management. Expert Rev Anti Infect Ther. 2011 Oct;9(10):877–89.
117. Battegay M, Fluckiger U, Hirschel B, Furrer H. Late presentation of HIV-infected individuals. Antivir Ther. 2007 Jan;12(6):841–51.
118. Antinori A, Coenen T, Costagiola D, Dedes N, Ellefson M, Gatell J, et al. Late presentation of HIV infection: a consensus definition. HIV Med. 2011 Jan;12(1):61–4.
119. Mocroft A. Late presentation to HIV/AIDS testing, treatment or continued care: clarifying the use of CD4 evaluation in the consensus definition. HIV Med. 2014 Mar;15(3):129.

51
120. Wolbers M, Bucher HC, Furrer H, Rickenbach M, Cavassini M, Weber R, et al. Delayed diagnosis of HIV infection and late initiation of antiretroviral therapy in the Swiss HIV Cohort Study. HIV Med. 2008;
121. Girardi E, Sabin CA, Monforte AD. Late diagnosis of HIV infection: epidemiological features, consequences and strategies to encourage earlier testing. J Acquir Immune Defic Syndr. 2007 Sep;46 Suppl 1:S3–8.
122. Camoni L, Raimondo M, Regine V, Salfa MC, Suligoi B. Late presenters among persons with a new HIV diagnosis in Italy, 2010-2011. BMC Public Health. 2013 Jan;13:281.
123. Shrosbree J, Campbell LJ, Ibrahim F, Hopkins P, Vizcaychipi M, Strachan S, et al. Late HIV diagnosis is a major risk factor for intensive care unit admission in HIV-positive patients: a single centre observational cohort study. BMC Infect Dis. 2013 Jan;13:23.
124. Adler A, Mounier-Jack S, Coker RJ. Late diagnosis of HIV in Europe: definitional and public health challenges. AIDS Care. 2009 Mar;21(3):284–93.
125. Vital signs: HIV testing and diagnosis among adults--United States, 2001-2009. MMWR Morb Mortal Wkly Rep. 2010 Dec 3;59(47):1550–5.
126. Celesia BM, Castronuovo D, Pinzone MR, Bellissimo F, Mughini MT, Lupo G, et al. Late presentation of HIV infection: predictors of delayed diagnosis and survival in Eastern Sicily. Eur Rev Med Pharmacol Sci. 2013 Aug;17(16):2218–24.
127. De Olalla PG, Manzardo C, Sambeat MA, Ocaña I, Knobel H, Humet V, et al. Epidemiological characteristics and predictors of late presentation of HIV infection in Barcelona (Spain) during the period 2001-2009. AIDS Res Ther. 2011 Jan;8(1):22.
128. Hoegh S, Lohse N, Hansen AB, Gerstoft J, Kronborg G, Larsen CS, et al. [Changes in immunological status among newly-diagnosed HIV-infected in Denmark 1995-2005]. UgeskrLaeger. 2008;170(9):740–4.
129. Girardi E, Aloisi MS, Arici C, Pezzotti P, Serraino D, Balzano R, et al. Delayed presentation and late testing for HIV: demographic and behavioral risk factors in a multicenter study in Italy. J Acquir Immune Defic Syndr. 2004 Aug 1;36(4):951–9.
130. Kigozi IM, Dobkin LM, Martin JN, Geng EH, Muyindike W, Emenyonu NI, et al. Late-disease stage at presentation to an HIV clinic in the era of free antiretroviral therapy in Sub-Saharan Africa. J Acquir Immune Defic Syndr. 2009 Oct 1;52(2):280–9.
131. Moreno S, Mocroft A, Monforte A d’Arminio. Medical and societal consequences of late presentation. Antivir Ther. 2010 Jan;15 Suppl 1:9–15.
132. Gandhi NR, Skanderson M, Gordon KS, Concato J, Justice AC. Delayed presentation for human immunodeficiency virus (HIV) care among veterans: a problem of access or screening? Med Care. 2007 Nov;45(11):1105–9.
133. Montlahuc C, Guiguet M, Abgrall S, Daneluzzi V, de Salvador F, Launay O, et al. Impact of late presentation on the risk of death among HIV-infected people in France (2003-2009). J Acquir Immune Defic Syndr. 2013 Oct 1;64(2):197–203.
134. Lanoy E, Mary-Krause M, Tattevin P, Perbost I, Poizot-Martin I, Dupont C, et al. Frequency, determinants and consequences of delayed access to care for HIV infection in France. Antivir Ther. 2007 Jan;12(1):89–96.
135. Lawn SD, Harries AD, Anglaret X, Myer L, Wood R. Early mortality among adults accessing antiretroviral treatment programmes in sub-Saharan Africa. AIDS. 2008 Oct 1;22(15):1897–908.

52
136. Das M, Chu PL, Santos G-M, Scheer S, Vittinghoff E, McFarland W, et al. Decreases in community viral load are accompanied by reductions in new HIV infections in San Francisco. PLoS One. 2010 Jan;5(6):e11068.
137. Marks G, Crepaz N, Janssen RS. Estimating sexual transmission of HIV from persons aware and unaware that they are infected with the virus in the USA. AIDS. 2006 Jun 26;20(10):1447–50.
138. Krentz HB, Gill MJ. The Direct Medical Costs of Late Presentation (<350/mm) of HIV Infection over a 15-Year Period. AIDS Res Treat. 2012 Jan;2012:757135.
139. Krentz HB, Auld MC, Gill MJ. The high cost of medical care for patients who present late (CD4 <200 cells/microL) with HIV infection. HIV Med. 2004 Mar;5(2):93–8.
140. Fleishman JA, Yehia BR, Moore RD, Gebo KA. The economic burden of late entry into medical care for patients with HIV infection. Med Care. 2010 Dec;48(12):1071–9.
141. Hamers FF, Phillips AN. Diagnosed and undiagnosed HIV-infected populations in Europe. HIV Med. 2008 Jul;9 Suppl 2:6–12.
142. World Health Organization. Guidance on provider-initiated HIV testing and counselling in health facilities. 2007.
143. Topp SM, Li MS, Chipukuma JM, Chiko MM, Matongo E, Bolton-Moore C, et al. Does provider-initiated counselling and testing (PITC) strengthen early diagnosis and treatment initiation? Results from an analysis of an urban cohort of HIV-positive patients in Lusaka, Zambia. J Int AIDS Soc. 2012 Jan;15(2):17352.
144. Testing for HIV: concise guidance. Clin Med. 2009 Oct;9(5):471–6.
145. Mounier-Jack S, Nielsen S, Coker RJ. HIV testing strategies across European countries. HIV Med. 2008 Jul;9 Suppl 2:13–9.
146. Limb M. Offer regular HIV tests to high risk groups to reduce late diagnoses, says public health agency. BMJ. 2012 Jan;345:e8169.
147. Cortes Martins H, Paixao M. Settings for identifying recent HIV infections: the Portuguese experience. Euro Surveill. 2008 Sep 4;13(36).
148. Sullivan AK, Raben D, Reekie J, Rayment M, Mocroft A, Esser S, et al. Feasibility and effectiveness of indicator condition-guided testing for HIV: results from HIDES I (HIV indicator diseases across Europe study). PLoS One. 2013 Jan;8(1):e52845.
149. Lazarus J V, Hoekstra M, Raben D, Delpech V, Coenen T, Lundgren JD. The case for indicator condition-guided HIV screening. HIV Med. 2013 Aug;14(7):445–8.
150. FDA. First Rapid Home-Use HIV Kit Approved for Self-Testing [Internet]. 2013. Available from: http://www.fda.gov/forconsumers/consumerupdates/ucm310545.htm
151. Krause J, Subklew-Sehume F, Kenyon C, Colebunders R. Acceptability of HIV self-testing: a systematic literature review. BMC Public Health. 2013 Jan;13:735.
152. Pant Pai N, Sharma J, Shivkumar S, Pillay S, Vadnais C, Joseph L, et al. Supervised and unsupervised self-testing for HIV in high- and low-risk populations: a systematic review. PLoS Med. 2013 Jan;10(4):e1001414.
153. Napierala Mavedzenge S, Baggaley R, Corbett EL. A review of self-testing for HIV: research and policy priorities in a new era of HIV prevention. Clin Infect Dis. 2013 Jul;57(1):126–38.
53
154. Choko AT, Macpherson P, Webb EL, Ball H, Sambakunsi R, Mdolo A, et al. One-year outcomes following community-based HIV self-testing: a prospective study in Malawi. 21st Conference on Retroviruses and Opportunistic Infections, Boston. 2014. p. Abstract 147.
155. Paltiel AD, Weinstein MC, Kimmel AD, Seage GR, Losina E, Zhang H, et al. Expanded screening for HIV in the United States--an analysis of cost-effectiveness. N Engl J Med. 2005 Feb 10;352(6):586–95.
156. Sanders GD, Bayoumi AM, Sundaram V, Bilir SP, Neukermans CP, Rydzak CE, et al. Cost-effectiveness of screening for HIV in the era of highly active antiretroviral therapy. N Engl J Med. 2005 Feb 10;352(6):570–85.
157. Yazdanpanah Y, Sloan CE, Charlois-Ou C, Le Vu S, Semaille C, Costagliola D, et al. Routine HIV screening in France: clinical impact and cost-effectiveness. PLoS One. 2010 Jan;5(10):e13132.
158. Howlett WP, Vedeler CA, Nyland H, Aarli JA. Guillain-Barré syndrome in northern Tanzania: a comparison of epidemiological and clinical findings with western Norway. Acta Neurol Scand. 1996 Jan;93(1):44–9.
159. Thornton CA, Latif AS, Emmanuel JC. Guillain-Barré syndrome associated with human immunodeficiency virus infection in Zimbabwe. Neurology. 1991 Jun;41(6):812–5.
160. Doherty JF, Grant AD, Bryceson AD. Fever as the presenting complaint of travellers returning from the tropics. QJM. 1995 Apr;88(4):277–81.
161. Pintado V, Martín-Rabadán P, Rivera ML, Moreno S, Bouza E. Visceral leishmaniasis in human immunodeficiency virus (HIV)-infected and non-HIV-infected patients. A comparative study. Medicine (Baltimore). 2001 Jan;80(1):54–73.
162. Leishmania/HIV co-infection. Epidemiological analysis of 692 retrospective cases. Wkly Epidemiol Rec. 1997 Feb 21;72(8):49–54.
163. Tortorano AM, Biraghi E, Astolfi A, Ossi C, Tejada M, Farina C, et al. European Confederation of Medical Mycology (ECMM) prospective survey of candidaemia: report from one Italian region. J Hosp Infect. 2002 Aug;51(4):297–304.
164. Falguera M, Martín M, Ruiz-González A, Pifarré R, García M. Community-acquired pneumonia as the initial manifestation of serious underlying diseases. Am J Med. 2005 Apr;118(4):378–83.
165. Coco A, Kleinhans E. Prevalence of primary HIV infection in symptomatic ambulatory patients. Ann Fam Med. 3(5):400–4.
166. Bottieau E, Clerinx J, Van den Enden E, Van Esbroeck M, Colebunders R, Van Gompel A, et al. Infectious mononucleosis-like syndromes in febrile travelers returning from the tropics. J Travel Med. 13(4):191–7.
167. Hsu DTS, Ruf M, O’Shea S, Costelloe S, Peck J, Tong CYW. Diagnosing HIV infection in patients presenting with glandular fever-like illness in primary care: are we missing primary HIV infection? HIV Med. 2013 Jan;14(1):60–3.
168. Bini EJ, Currie SL, Shen H, Bräu N, Schmidt W, Anand BS, et al. National multicenter study of HIV testing and HIV seropositivity in patients with chronic hepatitis C virus infection. J Clin Gastroenterol. 2006 Sep;40(8):732–9.
169. Cacoub P, Renou C, Rosenthal E, Cohen P, Loury I, Loustaud-Ratti V, et al. Extrahepatic manifestations associated with hepatitis C virus infection. A prospective multicenter study of 321 patients. The GERMIVIC. Groupe d’Etude et de Recherche en Medecine Interne et Maladies Infectieuses sur le Virus de l'Hepatite C. Medicine (Baltimore). 2000 Jan;79(1):47–56.
54
170. Calkins A, Stehman FB, Bundy B, Benda JA, Mannel RS, Seago P, et al. Human immunodeficiency virus testing in patients with invasive cervical carcinoma: a prospective trial of the gynecologic oncology group. Int J Gynecol Cancer. 16(2):660–3.
171. Briggs A, Partridge DG, Bates S. HIV testing in colposcopy and termination of pregnancy services: a missed opportunity? J Fam Plann Reprod Health Care. 2011 Oct;37(4):201–3.
172. Creighton S, Dhairyawan R, Millett D, Stacey L. Routine HIV testing in colposcopy. J Fam Plann Reprod Health Care. 2012 Apr;38(2):139.
173. Kietpeerakool C. Human immunodeficiency virus infection in women undergoing treatment for cervical neoplasia: prevalence and the feasibility of routine screening. Asian Pac J Cancer Prev. 9(1):36–8.
174. Naveen KN, Tophakane RS, Hanumanthayya K, Pv B, Pai V V. A study of HIV seropositivity with various clinical manifestation of herpes zoster among patients from Karnataka, India. Dermatol Online J. 2011 Jan;17(12):3.
175. Sharvadze L, Tsertsvadze T, Gochitashvili N, Stvilia K, Dolmazashvili E. Hiv prevalence among high risk behavior group persons with herpes zoster infection. Georgian Med News. 2006 Mar;(132):60–4.
176. Cave J, Edwards SG, Miller RF, Ardeshna KM, Lee SM. Should we implement “opt-out” HIV testing for patients with lymphoma? Clin Med. 2009 Aug;9(4):320–2.
177. Morar N, Willis-Owen SA, Maurer T, Bunker CB. HIV-associated psoriasis: pathogenesis, clinical features, and management. Lancet Infect Dis. 2010 Jul;10(7):470–8.
178. BHIVA. UK National Guidelines for HIV Testing 2008. 2008.
179. Gazzard B, Clumeck N, d’Arminio Monforte A, Lundgren JD. Indicator disease-guided testing for HIV--the next step for Europe? HIV Med. 2008 Jul;9 Suppl 2:34–40.
180. HIV in Europe Initiative. HIV Indicator Conditions: Guidance for Implementing HIV Testing in Adults in Health Care Settings. 2012.
181. Damery S, Nichols L, Holder R, Ryan R, Wilson S, Warmington S, et al. Assessing the predictive value of HIV indicator conditions in general practice: a case-control study using the THIN database. Br J Gen Pract. 2013 Jun;63(611):e370–7.
182. Yin Z, Rice BD, Waight P, Miller E, George R, Brown AE, et al. Invasive pneumococcal disease among HIV-positive individuals, 2000-2009. AIDS. 2012 Jan 2;26(1):87–94.
183. Menacho I, Sequeira E, Muns M, Barba O, Leal L, Clusa T, et al. Comparison of two HIV testing strategies in primary care centres: indicator-condition-guided testing vs. testing of those with non-indicator conditions. HIV Med. 2013 Oct;14 Suppl 3:33–7.
184. HIV in Europe Initiative. HIDES II [Internet]. Available from: http://hiveurope.eu/Ongoing-Projects/HIDES/HIDES-2
185. Eholié S-P, Aoussi FE, Ouattara IS, Bissagnéné E, Anglaret X. HIV treatment and care in resource-constrained environments: challenges for the next decade. J Int AIDS Soc. 2012 Jan;15(2):17334.
186. Munderi P, Grosskurth H, Droti B, Ross DA. What are the essential components of HIV treatment and care services in low and middle-income countries: an overview by settings and levels of the health system? AIDS. 2012 Dec;26 Suppl 2:S97–S103.

55
187. Canadian Agency for Drugs and Technologies in Health. Peer Support for Diabetes, Heart Disease and HIV/AIDS: A Review of the Clinical Effectiveness, Cost-effectiveness, and Guidelines. Canadian Agency for Drugs and Technologies in Health. Canadian Agency for Drugs and Technologies in Health; 2013.
188. UNAIDS. Access to Antiretroviral Therapy in Africa. 2013.
189. Greenberg AE, Hader S, Masur H, Young T, Skillicorn J, Dieffenbach CW. Fighting HIV/AIDS In Washington, D.C. Health Aff. 2009;28(6):1677–87.
190. Milloy M-J, Kerr T, Bangsberg DR, Buxton J, Parashar S, Guillemi S, et al. Homelessness as a structural barrier to effective antiretroviral therapy among HIV-seropositive illicit drug users in a Canadian setting. AIDS Patient Care STDS. 2012 Jan;26(1):60–7.
191. Ndambakuwa P. Factors associated with antiretroviral treatment (ART) uptake at primary health care level in the Africa Centre Surveillance Area of the Hlabisa HIV Treatment and Care Programme. University of the Witwatersrand, Johannesburg; 2012.
192. Pecoraro A, Mimiaga MJ, O’Cleirigh C, Safren SA, Blokhina E, Verbitskaya E, et al. Lost-to-care and engaged-in-care HIV patients in Leningrad Oblast, Russian Federation: barriers and facilitators to medical visit retention. AIDS Care. 2014 Mar 25;
193. Murray LK, Semrau K, McCurley E, Thea DM, Scott N, Mwiya M, et al. Barriers to acceptance and adherence of antiretroviral therapy in urban Zambian women: a qualitative study. AIDS Care. NIH Public Access; 2009 Jan 1;21(1):78–86.
194. Musheke M, Bond V, Merten S. Individual and contextual factors influencing patient attrition from antiretroviral therapy care in an urban community of Lusaka, Zambia. J Int AIDS Soc. 2012 Jan;15 Suppl 1:1–9.
195. Coetzee B, Kagee A, Vermeulen N. Structural barriers to adherence to antiretroviral therapy in a resource-constrained setting: the perspectives of health care providers. AIDS Care. 2011 Feb;23(2):146–51.
196. Coetzee B, Kagee A. The development of an inventory to assess the structural barriers to clinic attendance and pill-taking amongst users of antiretroviral therapy. AIDS Behav. 2013 Jan;17(1):319–28.
197. Tran DA, Shakeshaft A, Ngo AD, Rule J, Wilson DP, Zhang L, et al. Structural barriers to timely initiation of antiretroviral treatment in Vietnam: findings from six outpatient clinics. PLoS One. 2012 Jan;7(12):e51289.
198. Gari S, Doig-Acuña C, Smail T, Malungo JRS, Martin-Hilber A, Merten S. Access to HIV/AIDS care: a systematic review of socio-cultural determinants in low and high income countries. BMC Health Serv Res. 2013 Jan;13:198.
199. Bjorn-Mortensen K, Ladefoged K, Obel N, Helleberg M. The HIV epidemic in Greenland--a slow spreading infection among adult heterosexual Greenlanders. Int J Circumpolar Health. 2013 Jan;72:19558.
200. Walmsley S, Bernstein B, King M, Arribas J, Beall G, Ruane P, et al. Lopinavir-ritonavir versus nelfinavir for the initial treatment of HIV infection. NEnglJMed. 2002;346(26):2039–46.
201. Kirk O, Katzenstein TL, Gerstoft J, Mathiesen L, Nielsen H, Pedersen C, et al. Combination therapy containing ritonavir plus saquinavir has superior short-term antiretroviral efficacy: a randomized trial. AIDS. 1999;13(1):F9–16.
202. Scott JD. Simplifying the treatment of HIV infection with ritonavir-boosted protease inhibitors in antiretroviral-experienced patients. AmJHealth SystPharm. 2005;62(8):809–15.
203. Arribas JR, Eron J. Advances in antiretroviral therapy. Curr Opin HIV AIDS. 2013 Jul;8(4):341–9.
56
204. Cervia JS, Smith MA. Enfuvirtide (T-20): a novel human immunodeficiency virus type 1 fusion inhibitor. ClinInfectDis. 2003;37(8):1102–6.
205. Rathbun RC, Lockhart SM, Miller MM, Liedtke MD. Dolutegravir, a Second-Generation Integrase Inhibitor for the Treatment of HIV-1 Infection. Ann Pharmacother. 2014 Mar;48(3):395–403.
206. Walmsley SL, Antela A, Clumeck N, Duiculescu D, Eberhard A, Gutiérrez F, et al. Dolutegravir plus abacavir-lamivudine for the treatment of HIV-1 infection. N Engl J Med. 2013 Nov 7;369(19):1807–18.
207. Hicks C, Gulick RM. Raltegravir: The First HIV Type 1 Integrase Inhibitor. Clin Infect Dis. 2009;
208. Cooper DA, Gatell J, Rockstroh J, Katlama C, Yeni P, Lazzarin A, et al. 48-Week Results from BENCHMRK-1, a Phase III Study of Raltegravir in Patients Failing ART with Triple-class Resistant HIV-1. 15th Conference on Retroviruses and Opportunistic Infections. Los Angeles; 2007.
209. Steigbigel R, Kumar P, Eron J, Schechter M, Markowitz M, Loutfy M, et al. 48-Week Results from BENCHMRK-2, a Phase III Study of Raltegravir in Patients Failing ART with Triple-class Resistant HIV-1. 15th Conference on Retroviruses and Opportunistic Infections. Los Angeles; 2007.
210. Maraviroc approved in the European Union. AIDS Patient Care STDS. 2007 Oct;21(10):779.
211. FDA approves maraviroc tablets. AIDS Patient Care STDS. 2007 Sep;21(9):702.
212. FDA. Antiretroviral drugs used in the treatment of HIV infection [Internet]. 2014. Available from: http://www.fda.gov/ForConsumers/byAudience/ForPatientAdvocates/HIVandAIDSActivities/ucm118915.htm
213. Jayaweera D, Dilanchian P. New therapeutic landscape of NNRTIs for treatment of HIV: a look at recent data. Expert Opin Pharmacother. 2012 Dec;13(18):2601–12.
214. Hughes CA, Robinson L, Tseng A, MacArthur RD. New antiretroviral drugs: a review of the efficacy, safety, pharmacokinetics, and resistance profile of tipranavir, darunavir, etravirine, rilpivirine, maraviroc, and raltegravir. Expert Opin Pharmacother. 2009 Oct;10(15):2445–66.
215. Dunn D, Geretti AM, Green H, Fearnhill E, Pozniak A, Churchill D, et al. Population trends in the prevalence and patterns of protease resistance related to exposure to unboosted and boosted protease inhibitors. Antivir Ther. 2008 Jan;13(6):771–7.
216. Wood E, Hogg RS, Yip B, Moore D, Harrigan PR, Montaner JSG. Superior virological response to boosted protease inhibitor-based highly active antiretroviral therapy in an observational treatment programme. HIV Med. 2007 Mar;8(2):80–5.
217. Deeks SG, Hellmann NS, Grant RM, Parkin NT, Petropoulos CJ, Becker M, et al. Novel four-drug salvage treatment regimens after failure of a human immunodeficiency virus type 1 protease inhibitor-containing regimen: antiviral activity and correlation of baseline phenotypic drug susceptibility with virologic outcome. JInfectDis. 1999;179(6):1375–81.
218. Lazzarin A, Clotet B, Cooper D, Reynes J, Arasteh K, Nelson M, et al. Efficacy of enfuvirtide in patients infected with drug-resistant HIV-1 in Europe and Australia. NEnglJMed. 2003;348(22):2186–95.
219. Jensen-Fangel S, Pedersen L, Pedersen C, Larsen CS, Tauris P, Møller A, et al. Low Mortality in HIV-infected Patients Starting HAART in Advance of Immunological Deterioration: A Comparison with the General Population. AIDS. 2004;18(1):89–97.

57
220. Mocroft A, Ledergerber B, Katlama C, Kirk O, Reiss P, D’Arminio MA, et al. Decline in the AIDS and death rates in the EuroSIDA study: an observational study. Lancet. 2003;362(9377):22–9.
221. Mocroft A, Vella S, Benfield TL, Chiesi A, Miller V, Gargalianos P, et al. Changing patterns of mortality across Europe in patients infected with HIV-1. EuroSIDA Study Group. Lancet. 1998;352(9142):1725–30.
222. Ledergerber B, Lundgren JD, Walker AS, Sabin C, Justice A, Reiss P, et al. Predictors of trend in CD4-positive T-cell count and mortality among HIV-1-infected individuals with virological failure to all three antiretroviral-drug classes. Lancet. 2004;364(9428):51–62.
223. Mocroft A, Ledergerber B, Viard JP, Staszewski S, Murphy M, Chiesi A, et al. Time to virological failure of 3 classes of antiretrovirals after initiation of highly active antiretroviral therapy: results from the EuroSIDA study group. JInfectDis. 2004;190(11):1947–56.
224. Mocroft A, Devereux H, Kinloch-de-Loes S, Wilson D, Madge S, Youle M, et al. Immunological, virological and clinical response to highly active antiretroviral therapy treatment regimens in a complete clinic population. Royal Free Centre for HIV Medicine. AIDS. 2000;14(11):1545–52.
225. Lucas GM, Chaisson RE, Moore RD. Highly active antiretroviral therapy in a large urban clinic: risk factors for virologic failure and adverse drug reactions. AnnInternMed. 1999;Jul 20;131(2):81–7.
226. Phillips AN, Leen C, Wilson A, Anderson J, Dunn D, Schwenk A, et al. Risk of extensive virological failure to the three original antiretroviral drug classes over long-term follow-up from the start of therapy in patients with HIV infection: an observational cohort study. Lancet. 2007 Dec 8;370(9603):1923–8.
227. Lodwick R, Costagliola D, Reiss P, Torti C, Teira R, Dorrucci M, et al. Triple-class virologic failure in HIV-infected patients undergoing antiretroviral therapy for up to 10 years. Arch Intern Med. 2010 Mar 8;170(5):410–9.
228. Barfod TS, Gerstoft J, Rodkjaer L, Pedersen C, Nielsen H, Møller A, et al. Patients’ answers to simple questions about treatment satisfaction and adherence and depression are associated with failure of HAART: a cross-sectional survey. AIDS Patient Care STDS. 2005 May;19(5):317–25.
229. Incomplete adherence to antiretroviral therapy is associated with higher levels of residual HIV-1 viremia. AIDS. 2014 Jan 14;28(2):181–6.
230. Nieuwkerk PT, Oort FJ. Self-Reported Adherence to Antiretroviral Therapy for HIV-1 Infection and Virologic Treatment Response: A Meta-Analysis. JAcquirImmuneDeficSyndr. 2005;38(4):445–8.
231. Mocroft A, Kirk O, Barton SE, Dietrich M, Proenca R, Colebunders R, et al. Anaemia is an independent predictive marker for clinical prognosis in HIV-infected patients from across Europe. EuroSIDA study group. AIDS. 1999;13(8):943–50.
232. Palella Jr FJ, Chmiel JS, Moorman AC, Holmberg SD. Durability and predictors of success of highly active antiretroviral therapy for ambulatory HIV-infected patients. AIDS. 2002;16(12):1617–26.
233. Argemi X, Dara S, You S, Mattei JF, Courpotin C, Simon B, et al. Impact of malnutrition and social determinants on survival of HIV-infected adults starting antiretroviral therapy in resource-limited settings. AIDS. 2012 Jun 1;26(9):1161–6.
234. Carrico AW. Substance use and HIV disease progression in the HAART era: implications for the primary prevention of HIV. Life Sci. 2011 May 23;88(21-22):940–7.
235. Giordano TP, Gifford AL, White Jr. AC, Suarez-Almazor ME, Rabeneck L, Hartman C, et al. Retention in care: a challenge to survival with HIV infection. ClinInfectDis. 2007;44(11):1493–9.

58
236. Farinpour R, Miller EN, Satz P, Selnes OA, Cohen BA, Becker JT, et al. Psychosocial risk factors of HIV morbidity and mortality: findings from the Multicenter AIDS Cohort Study (MACS). J Clin Exp Neuropsychol. 2003 Aug;25(5):654–70.
237. Malow R, Dévieux JG, Stein JA, Rosenberg R, Jean-Gilles M, Attonito J, et al. Depression, substance abuse and other contextual predictors of adherence to antiretroviral therapy (ART) among Haitians. AIDS Behav. 2013 May;17(4):1221–30.
238. Chene G, Sterne JA, May M, Costagliola D, Ledergerber B, Phillips AN, et al. Prognostic importance of initial response in HIV-1 infected patients starting potent antiretroviral therapy: analysis of prospective studies. Lancet. 2003;362(9385):679–86.
239. Ormaasen V, Bruun JN, Sandvik L, Holberg-Petersen M, Gaarder PI. Prognostic value of changes in CD4 count and HIV RNA during the first six months on highly active antiretroviral therapy in chronic human immunodeficiency virus infection. ScandJInfectDis. 2003;35(6-7):383–8.
240. Trotta MP, Cozzi-Lepri A, Ammassari A, Vecchiet J, Cassola G, Caramello P, et al. Rate of CD4+ cell count increase over periods of viral load suppression: relationship with the number of previous virological failures. Clin Infect Dis. 2010 Aug 15;51(4):456–64.
241. Reekie J, Mocroft A, Ledergerber B, Beniowski M, Clotet B, van Lunzen J, et al. History of viral suppression on combination antiretroviral therapy as a predictor of virological failure after a treatment change. HIV Med. 2010 Aug;11(7):469–78.
242. Nakagawa F, Lodwick R, Costagliola D, van Sighem A, Torti C, Podzamczer D, et al. Calendar time trends in the incidence and prevalence of triple-class virologic failure in antiretroviral drug-experienced people with HIV in Europe. J Acquir Immune Defic Syndr. 2012 Mar 1;59(3):294–9.
243. Mocroft A, Horban A, Clotet B, d’Arminio Monforte A, Bogner JR, Aldins P, et al. Regional differences in the risk of triple class failure in European patients starting combination antiretroviral therapy after 1 January 1999. HIV Med. 2008 Jan;9(1):41–6.
244. Castro H, Judd A, Gibb DM, Butler K, Lodwick RK, van Sighem A, et al. Risk of triple-class virological failure in children with HIV: a retrospective cohort study. Lancet. 2011 May 7;377(9777):1580–7.
245. Castagliola D, Ledergerber B, Torti C, van Sighem A, Podzamczer D, Mocroft A, et al. Trends in virological and clinical outcomes in individuals with HIV-1 infection and virological failure of drugs from three antiretroviral drug classes: a cohort study. Lancet Infect Dis. 2012 Feb;12(2):119–27.
246. Martinez-Picado J, Martínez MA. HIV-1 reverse transcriptase inhibitor resistance mutations and fitness: a view from the clinic and ex vivo. Virus Res. 2008 Jun;134(1-2):104–23.
247. Ammassari A, Trotta MP, Murri R, Castelli F, Narciso P, Noto P, et al. Correlates and predictors of adherence to highly active antiretroviral therapy: overview of published literature. J Acquir Immune Defic Syndr. 2002 Dec 15;31 Suppl 3:S123–7.
248. Cardarelli R, Weis S, Adams E, Radaford D, Vecino I, Munguia G, et al. General Health Status and Adherence to Antiretroviral Therapy. J Int Assoc Physicians AIDS Care (Chic Ill). 2008;
249. Adherence strategies. Religion is important difference among HIV-infected Southern minority population. Adherence barriers largely are the same as the coasts. AIDS Alert. 2008;23(5):56–7.
250. Ladefoged K, Andersson M, Koch A, Rendal T, Rydbacken M. Living conditions, quality of life, adherence and treatment outcome in Greenlandic HIV patients. Int J Circumpolar Health. 2012 Jan;71:18639.

59
251. Adams JL, Greener BN, Kashuba ADM. Pharmacology of HIV integrase inhibitors. Curr Opin HIV AIDS. 2012 Sep;7(5):390–400.
252. Usach I, Melis V, Peris J-E. Non-nucleoside reverse transcriptase inhibitors: a review on pharmacokinetics, pharmacodynamics, safety and tolerability. J Int AIDS Soc. 2013 Jan;16(1):1–14.
253. Zha W, Zha BS, Zhou F, Zhou H, Wang G. The cellular pharmacokinetics of HIV protease inhibitors: current knowledge and future perspectives. Curr Drug Metab. 2012 Oct;13(8):1174–83.
254. Hertogs K, Bloor S, Kemp SD, Van den Eynde C, Alcorn TM, Pauwels R, et al. Phenotypic and genotypic analysis of clinical HIV-1 isolates reveals extensive protease inhibitor cross-resistance: a survey of over 6000 samples. AIDS. 2000 Jun 16;14(9):1203–10.
255. Hosseinipour MC, Gupta RK, Van Zyl G, Eron JJ, Nachega JB. Emergence of HIV drug resistance during first- and second-line antiretroviral therapy in resource-limited settings. J Infect Dis. 2013 Jun 15;207 Suppl S49–56.
256. Wensing AM, Boucher CA. Worldwide transmission of drug-resistant HIV. AIDS Rev. 2003;5(3):140–55.
257. Ibe S, Sugiura W. Clinical significance of HIV reverse-transcriptase inhibitor-resistance mutations. Future Microbiol. 2011 Mar;6(3):295–315.
258. Shafer RW, Schapiro JM. HIV-1 drug resistance mutations: an updated framework for the second decade of HAART. AIDS Rev. 10(2):67–84.
259. Recsky MA, Brumme ZL, Chan KJ, Wynhoven B, Yip B, Dong WW, et al. Antiretroviral resistance among HIV-infected persons who have died in British Columbia, in the era of modern antiretroviral therapy. JInfectDis. 2004;190(2):285–92.
260. Zaccarelli M, Tozzi V, Lorenzini P, Trotta MP, Forbici F, Visco-Comandini U, et al. Multiple drug class-wide resistance associated with poorer survival after treatment failure in a cohort of HIV-infected patients. AIDS. 2005;19(10):1081–9.
261. Lucas GM. Antiretroviral adherence, drug resistance, viral fitness and HIV disease progression: a tangled web is woven. JAntimicrobChemother. 2005;55(4):413–6.
262. Lucas GM, Gallant JE, Moore RD. Relationship between drug resistance and HIV-1 disease progression or death in patients undergoing resistance testing. AIDS. 2004;18(11):1539–48.
263. Hutter G, Nowak D, Mossner M, Ganepola S, Mussig A, Allers K, et al. Long-term control of HIV by CCR5 Delta32/Delta32 stem-cell transplantation. N Engl J Med. 2009;360(7):692–8.
264. Blower SM, Aschenbach AN, Kahn JO. Predicting the transmission of drug-resistant HIV: comparing theory with data. Lancet InfectDis. 2003;3(1):10–1.
265. Castilla J, Del Romero J, Hernando V, Marincovich B, Garcia S, Rodriguez C. Effectiveness of highly active antiretroviral therapy in reducing heterosexual transmission of HIV. JAcquirImmuneDeficSyndr. 2005;40(1):96–101.
266. Quinn TC, Wawer MJ, Sewankambo N, Serwadda D, Li C, Wabwire-Mangen F, et al. Viral load and heterosexual transmission of human immunodeficiency virus type 1. Rakai Project Study Group. N Engl J Med. 2000 Mar 30;342(13):921–9.
267. Rodger A, Bruun T, Weait M, Vernazza P, Collins S, Estrada V, et al. Partners of people on ART - a New Evaluation of the Risks (The PARTNER study): design and methods. BMC Public Health. 2012 Jan;12:296.

60
268. Rodger A. HIV transmission risk through condomless sex if HIV+ partner on suppressive ART: PARTNER study. 21st Conference on Retroviruses and Opportunistic Infections. Boston; 2014. p. Abstract 153LB.
269. Vernazza P, Hirschel B, Bernasconi E, Flepp M. Les personnes séropositives ne souffrant d’aucune autre MST et suivant un traitement antirétroviral efficace ne transmettent pas le VIH par voie sexuelle. Eidgenössische Kommission für Aids-Fragen; 2008.
270. Kuzoe-Liengme B, Hirschel B, Schiffer V. [Swiss statements: a two-year follow-up]. Rev Med Suisse. 2010 Apr 7;6(243):714–8, 720.
271. UNAIDS. Antiretroviral therapy and sexual transmission of HIV. Geneva; 2008.
272. Brenner BG, Turner D, Wainberg MA. HIV-1 drug resistance: can we overcome? Expert Opin Biol Ther. 2002 Oct;2(7):751–61.
273. Costagliola D, Descamps D, Assoumou L, Ph M, Morand-Joubert L, Marcelin AG, et al. Prevalence of HIV-1 Drug Resistance in Treated Patients: A French Nationwide Study. JAcquirImmuneDeficSyndr. 2007;
274. Vella S, Palmisano L. The global status of resistance to antiretroviral drugs. Clin Infect Dis. 2005 Aug 15;41 Suppl 4:S239–46.
275. Richman DD, Morton SC, Wrin T, Hellmann N, Berry S, Shapiro MF, et al. The prevalence of antiretroviral drug resistance in the United States. AIDS. 2004;18(10):1393–401.
276. Scott P, Arnold E, Evans B, Pozniak A, Moyle G, Shahmenesh M, et al. Surveillance of HIV antiretroviral drug resistance in treated individuals in England: 1998-2000. J Antimicrob Chemother. 2004 Mar;53(3):469–73.
277. Novak RM, Chen L, MacArthur RD, Baxter JD, Huppler HK, Peng G, et al. Prevalence of antiretroviral drug resistance mutations in chronically HIV-infected, treatment-naive patients: implications for routine resistance screening before initiation of antiretroviral therapy. ClinInfectDis. 2005;40(3):468–74.
278. Di Giambenedetto S, Bracciale L, Colafigli M, Colatigli M, Cattani P, Pinnetti C, et al. Declining prevalence of HIV-1 drug resistance in treatment-failing patients: a clinical cohort study. Antivir Ther. 2007 Jan;12(5):835–9.
279. Di Giambenedetto S, Prosperi M, Fanti I, Bruzzone B, Paolucci S, Penco G, et al. Update on emergence of HIV-1 resistance to antiretroviral drug classes in an Italian national database: 2007-2009. Clin Microbiol Infect. 2011 Sep;17(9):1352–5.
280. Von Wyl V, Yerly S, Boni J, Burgisser P, Klimkait T, Battegay M, et al. Long-Term Trends of HIV Type 1 Drug Resistance Prevalence among Antiretroviral Treatment-Experienced Patients in Switzerland. Clin Infect Dis. 2009;
281. De Luca A, Dunn D, Zazzi M, Camacho R, Torti C, Fanti I, et al. Declining prevalence of HIV-1 drug resistance in antiretroviral treatment-exposed individuals in Western Europe. J Infect Dis. 2013 Apr 15;207(8):1216–20.
282. De Mulder M, Yebra G, Navas A, Martin L, de Jose MI, Navarro ML, et al. Trends in drug resistance prevalence in HIV-1-infected children in Madrid: 1993 to 2010 analysis. Pediatr Infect Dis J. 2012 Nov;31(11):e213–21.
283. Long-term probability of detecting drug-resistant HIV in treatment-naive patients initiating combination antiretroviral therapy. Clin Infect Dis. 2010 May 1;50(9):1275–85.
284. Pillay D. Current patterns in the epidemiology of primary HIV drug resistance in North America and Europe. AntivirTher. 2004;9(5):695–702.
285. Tang JW, Pillay D. Transmission of HIV-1 drug resistance. J Clin Virol. 2004 May;30(1):1–10.

61
286. Yerly S, Kaiser L, Race E, Bru JP, Clavel F, Perrin L. Transmission of antiretroviral-drug-resistant HIV-1 variants. Lancet. 1999 Aug 28;354(9180):729–33.
287. Little SJ. Transmission and prevalence of HIV resistance among treatment-naive subjects. Antivir Ther. 2000 Mar;5(1):33–40.
288. Grant RM, Hecht FM, Warmerdam M, Liu L, Liegler T, Petropoulos CJ, et al. Time trends in primary HIV-1 drug resistance among recently infected persons. JAMA. 2002 Jul 10;288(2):181–8.
289. Little SJ, Holte S, Routy JP, Daar ES, Markowitz M, Collier AC, et al. Antiretroviral-drug resistance among patients recently infected with HIV. NEnglJMed. 2002;347(6):385–94.
290. Hamers FF, Downs AM. The changing face of the HIV epidemic in western Europe: what are the implications for public health policies? Lancet. 2004;364(9428):83–94.
291. Leigh Brown AJ, Frost SD, Mathews WC, Dawson K, Hellmann NS, Daar ES, et al. Transmission fitness of drug-resistant human immunodeficiency virus and the prevalence of resistance in the antiretroviral-treated population. JInfectDis. 2003;187(4):683–6.
292. Yerly S, Jost S, Telenti A, Flepp M, Kaiser L, Chave JP, et al. Infrequent transmission of HIV-1 drug-resistant variants. AntivirTher. 2004;9(3):375–84.
293. Ammaranond P, Cunningham P, Oelrichs R, Suzuki K, Harris C, Leas L, et al. No increase in protease resistance and a decrease in reverse transcriptase resistance mutations in primary HIV-1 infection: 1992-2001. AIDS. 2003 Jan 24;17(2):264–7.
294. Bezemer D, Jurriaans S, Prins M, van der HL, Prins JM, De Wolf F, et al. Declining trend in transmission of drug-resistant HIV-1 in Amsterdam. AIDS. 2004;18(11):1571–7.
295. Routy JP, Machouf N, Edwardes MD, Brenner BG, Thomas R, Trottier B, et al. Factors associated with a decrease in the prevalence of drug resistance in newly HIV-1 infected individuals in Montreal. AIDS. 2004;%19;18(17):2305–12.
296. Ammaranond P, Cunningham P, Oelrichs R, Suzuki K, Harris C, Leas L, et al. Rates of transmission of antiretroviral drug resistant strains of HIV-1. JClinVirol. 2003;26(2):153–61.
297. Wensing AM, van de Vijver DA, Angarano G, Asjo B, Balotta C, Boeri E, et al. Prevalence of Drug-Resistant HIV-1 Variants in Untreated Individuals in Europe: Implications for Clinical Management. JInfectDis. 2005;192(6):958–66.
298. Evidence of a decline in transmitted HIV-1 drug resistance in the United Kingdom. AIDS. 2007;21(8):1035–9.
299. Dolling D, Sabin C, Delpech V, Smit E, Pozniak A, Asboe D, et al. Time trends in drug resistant HIV-1 infections in the United Kingdom up to 2009: multicentre observational study. BMJ. 2012 Jan;345:e5253.
300. Bansi L, Sabin C, Delpech V, Hill T, Fisher M, Walsh J, et al. Trends over calendar time in antiretroviral treatment success and failure in HIV clinic populations. HIV Med. 2010 Aug;11(7):432–8.
301. Chaix ML, Descamps D, Wirden M, Bocket L, Delaugerre C, Tamalet C, et al. Stable frequency of HIV-1 transmitted drug resistance in patients at the time of primary infection over 1996-2006 in France. Aids. 2009;23(6):717–24.
302. Burchell AN, Bayoumi AM, Rourke SB, Major C, Gardner S, Sandstrom P, et al. Increase in transmitted HIV drug resistance among persons undergoing genotypic resistance testing in Ontario, Canada, 2002-09. J Antimicrob Chemother. 2012 Nov;67(11):2755–65.

62
303. Geretti AM. Epidemiology of antiretroviral drug resistance in drug-naïve persons. Curr Opin Infect Dis. 2007 Feb;20(1):22–32.
304. Pineda-Peña A-C, Bello D-C, Sussmann O, Vandamme A-M, Vercauteren J, van Laethem K, et al. HIV-1 transmitted drug resistance in Latin America and the Caribbean: what do we know? AIDS Rev. 14(4):256–67.
305. Myers JE, Taylor BS, Rojas Fermín RA, Reyes EV, Vaughan C, José L, et al. Transmitted drug resistance among antiretroviral-naive patients with established HIV type 1 infection in Santo Domingo, Dominican Republic and review of the Latin American and Caribbean literature. AIDS Res Hum Retroviruses. 2012 Jul;28(7):667–74.
306. Hamers RL, Sigaloff KCE, Kityo C, Mugyenyi P, de Wit TFR. Emerging HIV-1 drug resistance after roll-out of antiretroviral therapy in sub-Saharan Africa. Curr Opin HIV AIDS. 2013 Jan;8(1):19–26.
307. Chaix M-L, Desquilbet L, Descamps D, Costagliola D, Deveau C, Galimand J, et al. Response to HAART in French patients with resistant HIV-1 treated at primary infection: ANRS Resistance Network. Antivir Ther. 2007 Jan;12(8):1305–10.
308. Napravnik S, Edwards D, Stewart P, Stalzer B, Matteson E, Eron Jr. JJ. HIV-1 drug resistance evolution among patients on potent combination antiretroviral therapy with detectable viremia. JAcquirImmuneDeficSyndr. 2005;40(1):34–40.
309. Ciancio BC, Trotta MP, Lorenzini P, Forbici F, Visco-Comandini U, Gori C, et al. The effect of number of mutations and of drug-class sparing on virological response to salvage genotype-guided antiretroviral therapy. Antivir Ther. 2003 Dec;8(6):611–6.
310. De Luca A, Cozzi-Lepri A, Perno C-F, Balotta C, Di Giambenedetto S, Poggio A, et al. Variability in the interpretation of transmitted genotypic HIV-1 drug resistance and prediction of virological outcomes of the initial HAART by distinct systems. Antivir Ther. 2004 Oct;9(5):743–52.
311. Tozzi V, Zaccarelli M, Bonfigli S, Lorenzini P, Liuzzi G, Trotta MP, et al. Drug-class-wide resistance to antiretrovirals in HIV-infected patients failing therapy: prevalence, risk factors and virological outcome. Antivir Ther. 2006 Jan;11(5):553–60.
312. Sühs K-W, Stoll M, Diem R, Schmidt RE, Heiken H. Impaired CD4+ cell recovery during antiretroviral therapy in patients with HIV resistance mutations. Arch Virol. 2012 Mar;157(3):433–40.
313. Deeks SG, Gange SJ, Kitahata MM, Saag MS, Justice AC, Hogg RS, et al. Trends in multidrug treatment failure and subsequent mortality among antiretroviral therapy-experienced patients with HIV infection in North America. Clin Infect Dis. 2009 Nov 15;49(10):1582–90.
314. Liao L, Xing H, Su B, Wang Z, Ruan Y, Wang X, et al. Impact of HIV drug resistance on virologic and immunologic failure and mortality in a cohort of patients on antiretroviral therapy in China. AIDS. 2013 Jul 17;27(11):1815–24.
315. Cozzi-Lepri A, Phillips AN, Clotet B, Mocroft A, Ruiz L, Kirk O, et al. Detection of HIV drug resistance during antiretroviral treatment and clinical progression in a large European cohort study. Aids. 2008 Oct 18;22(16):2187–98.
316. Grover D, Copas A, Green H, Edwards SG, Dunn DT, Sabin C, et al. What is the risk of mortality following diagnosis of multidrug-resistant HIV-1? J Antimicrob Chemother. 2008 Mar;61(3):705–13.
317. Di Giambenedetto S, Colafigli M, Pinnetti C, Bacarelli A, Cingolani A, Tamburrini E, et al. Genotypic resistance profile and clinical progression of treatment-experienced HIV type 1-infected patients with virological failure. AIDS Res Hum Retroviruses. 2008 Feb;24(2):149–54.

63
318. Costagliola D, Ledergerber B, Torti C, van Sighem A, Podzamczer D, Mocroft A, et al. Predictors of CD4(+) T-cell counts of HIV type 1-infected persons after virologic failure of all 3 original antiretroviral drug classes. J Infect Dis. 2013 Mar 1;207(5):759–67.
319. Bracciale L, Di Giambenedetto S, Colafigli M, La Torre G, Prosperi M, Santangelo R, et al. Virological suppression reduces clinical progression in patients with multiclass-resistant HIV type 1. AIDS Res Hum Retroviruses. 2009 Mar;25(3):261–7.
320. Palella FJ, Armon C, Buchacz K, Chmiel JS, Novak RM, D’Aquila RT, et al. Factors associated with mortality among persistently viraemic triple-antiretroviral-class-experienced patients receiving antiretroviral therapy in the HIV Outpatient Study (HOPS). J Antimicrob Chemother. 2014 Jun 16;
321. UNAIDS. The Gap Report. 2014.
322. Van Sighem A, Danner S, Ghani AC, Gras L, Anderson RM, De Wolf F. Mortality in Patients With Successful Initial Response to Highly Active Antiretroviral Therapy Is Still Higher Than in Non-HIV-Infected Individuals. JAcquirImmuneDeficSyndr. 2005;40(2):212–8.
323. Keiser O, Taffe P, Zwahlen M, Battegay M, Bernasconi E, Weber R, et al. All cause mortality in the Swiss HIV Cohort Study from 1990 to 2001 in comparison with the Swiss population. AIDS. 2004;18(13):1835–43.
324. Jaggy C, von Overbeck J, Ledergerber B, Schwarz C, Egger M, Rickenbach M, et al. Mortality in the Swiss HIV Cohort Study (SHCS) and the Swiss general population. Lancet. 2003;362(9387):877–8.
325. Braithwaite RS, Justice AC, Chang CC, Fusco JS, Raffanti SR, Wong JB, et al. Estimating the proportion of patients infected with HIV who will die of comorbid diseases. AmJMed. 2005;118(8):890–8.
326. Porta M. A Dictionary of Epidemiology. 5th ed. Oxford University Press, USA; 2008.
327. Chiang CL. The life table and its applications. Robert E Krieger Publishing Company; 1984.
328. Hansen A-BEB, Lohse N, Gerstoft J, Kronborg G, Laursen A, Pedersen C, et al. Cause-specific excess mortality in siblings of patients co-infected with HIV and hepatitis C virus. PLoS One. 2007 Jan;2(1):e738.
329. Hansen AB, Gerstoft J, Kronborg G, Pedersen C, Sorensen HT, Obel N. Mortality in siblings of patients coinfected with HIV and hepatitis C virus. JInfectDis. 2007;195(2):230–5.
330. Zhu H, Napravnik S, Eron JJ, Cole SR, Ma Y, Wohl DA, et al. Decreasing excess mortality of HIV-infected patients initiating antiretroviral therapy: comparison with mortality in general population in China, 2003-2009. J Acquir Immune Defic Syndr. 2013 Aug 15;63(5):e150–7.
331. Simmons RD, Ciancio BC, Kall MM, Rice BD, Delpech VC. Ten-year mortality trends among persons diagnosed with HIV infection in England and Wales in the era of antiretroviral therapy: AIDS remains a silent killer. HIV Med. 2013 Nov;14(10):596–604.
332. Samji H, Cescon A, Hogg RS, Modur SP, Althoff KN, Buchacz K, et al. Closing the gap: increases in life expectancy among treated HIV-positive individuals in the United States and Canada. PLoS One. 2013 Jan;8(12):e81355.
333. May MT, Gompels M, Delpech V, Porter K, Orkin C, Kegg S, et al. Impact on life expectancy of HIV-1 positive individuals of CD4+ cell count and viral load response to antiretroviral therapy: UK cohort study. AIDS. 2014 Feb 19;
334. Nakagawa F, Lodwick RK, Smith CJ, Smith R, Cambiano V, Lundgren JD, et al. Projected life expectancy of people with HIV according to timing of diagnosis. AIDS. 2012 Jan 28;26(3):335–43.
64
335. Mills EJ, Bakanda C, Birungi J, Chan K, Ford N, Cooper CL, et al. Life expectancy of persons receiving combination antiretroviral therapy in low-income countries: a cohort analysis from Uganda. Ann Intern Med. 2011 Aug 16;155(4):209–16.
336. Losina E, Schackman BR, Sadownik SN, Gebo KA, Walensky RP, Chiosi JJ, et al. Racial and sex disparities in life expectancy losses among HIV-infected persons in the united states: impact of risk behavior, late initiation, and early discontinuation of antiretroviral therapy. Clin Infect Dis. 2009 Nov 15;49(10):1570–8.
337. May M, Gompels M, Delpech V, Porter K, Post F, Johnson M, et al. Impact of late diagnosis and treatment on life expectancy in people with HIV-1: UK Collaborative HIV Cohort (UK CHIC) Study. BMJ. 2011 Jan;343:d6016.
338. Guaraldi G, Cossarizza A, Franceschi C, Roverato A, Vaccher E, Tambussi G, et al. Life expectancy in the immune recovery era: the evolving scenario of the HIV epidemic in northern Italy. J Acquir Immune Defic Syndr. 2014 Feb 1;65(2):175–81.
339. Lewden C, Chene G, Morlat P, Raffi F, Dupon M, Dellamonica P, et al. HIV-infected adults with a CD4 cell count greater than 500 cells/mm3 on long-term combination antiretroviral therapy reach same mortality rates as the general population. J Acquir Immune Defic Syndr. 2007 Sep 1;46(1):72–7.
340. Van Sighem AI, Gras LAJ, Reiss P, Brinkman K, de Wolf F. Life expectancy of recently diagnosed asymptomatic HIV-infected patients approaches that of uninfected individuals. AIDS. 2010 Jun 19;24(10):1527–35.
341. Lewden C, Bouteloup V, De Wit S, Sabin C, Mocroft A, Wasmuth JC, et al. All-cause mortality in treated HIV-infected adults with CD4 ≥500/mm3 compared with the general population: evidence from a large European observational cohort collaboration. Int J Epidemiol. 2012 Apr;41(2):433–45.
342. Wada N, Jacobson LP, Cohen M, French A, Phair J, Muñoz A. Cause-specific mortality among HIV-infected individuals, by CD4(+) cell count at HAART initiation, compared with HIV-uninfected individuals. AIDS. 2014 Jan 14;28(2):257–65.
343. May MT, Ingle SM. Life expectancy of HIV-positive adults: a review. Sex Health. 2011 Dec;8(4):526–33.
344. Sabin CA. Do people with HIV infection have a normal life expectancy in the era of combination antiretroviral therapy? BMC Med. 2013 Jan;11:251.
345. Nakagawa F, May M, Phillips A. Life expectancy living with HIV: recent estimates and future implications. Curr Opin Infect Dis. 2013 Feb;26(1):17–25.
346. Rodger AJ, Lodwick R, Schechter M, Deeks S, Amin J, Gilson R, et al. Mortality in well controlled HIV in the continuous antiretroviral therapy arms of the SMART and ESPRIT trials compared with the general population. AIDS. 2013 Mar 27;27(6):973–9.
347. McManus H, O’Connor CC, Boyd M, Broom J, Russell D, Watson K, et al. Long-term survival in HIV positive patients with up to 15 Years of antiretroviral therapy. PLoS One. 2012 Jan;7(11):e48839.
348. Bor J, Herbst AJ, Newell M-L, Bärnighausen T. Increases in adult life expectancy in rural South Africa: valuing the scale-up of HIV treatment. Science. 2013 Feb 22;339(6122):961–5.
349. Masur H, Michelis MA, Greene JB, Onorato I, Stouwe RA, Holzman RS, et al. An outbreak of community-acquired Pneumocystis carinii pneumonia: initial manifestation of cellular immune dysfunction. N EnglJMed. 1981;305(24):1431–8.
350. Hymes KB, Cheung T, Greene JB, Prose NS, Marcus A, Ballard H, et al. Kaposi’s sarcoma in homosexual men-a report of eight cases. Lancet. 1981;2(8247):598–600.

65
351. Ancelle-Park R, Klein JP, Stroobant A, Smith E, Haikala O, Koch MA, et al. Expanded European AIDS case definition. Lancet. 1993;341:441.
352. Broder S, Gallo RC. A pathogenic retrovirus (HTLV-III) linked to AIDS. N EnglJMed. 1984;311(20):1292–7.
353. Jung AC, Paauw DS. Diagnosing HIV-related disease: using the CD4 count as a guide. J Gen Intern Med. 1998 Feb;13(2):131–6.
354. Aboulafia DM. Kaposi sarcoma flares during effective antiretroviral treatment. AIDS Read. 2005 Apr;15(4):190–1.
355. Stebbing J, Portsmouth S, Nelson M, Mandalia S, Kandil H, Alexander N, et al. The efficacy of ritonavir in the prevention of AIDS-related Kaposi’s sarcoma. Int J Cancer. 2004 Feb 10;108(4):631–3.
356. Stebbing J, Portsmouth S, Gazzard B. How does HAART lead to the resolution of Kaposi’s sarcoma? J Antimicrob Chemother. 2003 May;51(5):1095–8.
357. Cattelan AM, Calabrò ML, De Rossi A, Aversa SML, Barbierato M, Trevenzoli M, et al. Long-term clinical outcome of AIDS-related Kaposi’s sarcoma during highly active antiretroviral therapy. Int J Oncol. 2005 Sep;27(3):779–85.
358. Phillips AN, Neaton J, Lundgren JD. The role of HIV in serious diseases other than AIDS. AIDS. 2008 Nov 30;22(18):2409–18.
359. Wang C-CJ, Silverberg MJ, Abrams DI. Non-AIDS-Defining Malignancies in the HIV-Infected Population. Curr Infect Dis Rep. 2014 Jun;16(6):406.
360. Cutrell J, Bedimo R. Non-AIDS-defining cancers among HIV-infected patients. Curr HIV/AIDS Rep. 2013 Sep;10(3):207–16.
361. Helleberg M, Gerstoft J, Afzal S, Kronborg G, Larsen CS, Pedersen C, et al. Risk of cancer among HIV-infected individuals compared to the background population: impact of smoking and HIV. AIDS. 2014 Jun 19;28(10):1499–508.
362. Vaccher E, Serraino D, Carbone A, De Paoli P. The Evolving Scenario of Non-AIDS-Defining Cancers: Challenges and Opportunities of Care. Oncologist. 2014 Jun 26;
363. Legarth R, Helleberg M, Kronborg G, Larsen CS, Pedersen G, Pedersen C, et al. Anal carcinoma in HIV-infected patients in the period 1995-2009: a Danish nationwide cohort study. Scand J Infect Dis. 2013 Jun;45(6):453–9.
364. Patel P, Hanson DL, Sullivan PS, Novak RM, Moorman AC, Tong TC, et al. Incidence of types of cancer among HIV-infected persons compared with the general population in the United States, 1992-2003. Ann Intern Med. 2008 May 20;148(10):728–36.
365. Grulich AE, van Leeuwen MT, Falster MO, Vajdic CM. Incidence of cancers in people with HIV/AIDS compared with immunosuppressed transplant recipients: a meta-analysis. Lancet. 2007 Jul 7;370(9581):59–67.
366. Choi AI, Rodriguez RA, Bacchetti P, Bertenthal D, Volberding PA, O’Hare AM. Racial differences in end-stage renal disease rates in HIV infection versus diabetes. J Am Soc Nephrol. 2007 Nov;18(11):2968–74.
367. Triant VA, Lee H, Hadigan C, Grinspoon SK. Increased acute myocardial infarction rates and cardiovascular risk factors among patients with human immunodeficiency virus disease. J Clin Endocrinol Metab. 2007 Jul;92(7):2506–12.
368. Obel N, Thomsen HF, Kronborg G, Larsen CS, Hildebrandt PR, Sorensen HT, et al. Ischemic heart disease in HIV-infected and HIV-uninfected individuals: a population-based cohort study. Clin Infect Dis. 2007;44(12):1625–31.

66
369. Towner WJ, Xu L, Leyden WA, Horberg MA, Chao CR, Tang B, et al. The effect of HIV infection, immunodeficiency, and antiretroviral therapy on the risk of hepatic dysfunction. J Acquir Immune Defic Syndr. 2012 Jul 1;60(3):321–7.
370. Reekie J, Kosa C, Engsig F, Monforte A d’Arminio, Wiercinska-Drapalo A, Domingo P, et al. Relationship between current level of immunodeficiency and non-acquired immunodeficiency syndrome-defining malignancies. Cancer. 2010 Nov 15;116(22):5306–15.
371. Lederman MM, Funderburg NT, Sekaly RP, Klatt NR, Hunt PW. Residual immune dysregulation syndrome in treated HIV infection. Adv Immunol. 2013 Jan;119:51–83.
372. Søgaard OS, Reekie J, Ristola M, Jevtovic D, Karpov I, Beniowski M, et al. Severe bacterial non-aids infections in HIV-positive persons: incidence rates and risk factors. J Infect. 2013 May;66(5):439–46.
373. Sogaard OS, Lohse N, Gerstoft J, Kronborg G, Ostergaard L, Pedersen C, et al. Hospitalization for pneumonia among individuals with and without HIV infection, 1995-2007: a Danish population-based, nationwide cohort study. Clin Infect Dis. 2008 Nov 15;47(10):1345–53.
374. Harboe ZB, Larsen MV, Ladelund S, Kronborg G, Konradsen HB, Gerstoft J, et al. Incidence and Risk Factors for Invasive Pneumococcal Disease in HIV-infected and non-HIV infected Individuals Before and After the Introduction of Combination Antiretroviral Therapy: Persisting High Risk among HIV-infected Injecting Drug Users. Clin Infect Dis. 2014 Jul 17;
375. Larsen M V, Harboe ZB, Ladelund S, Skov R, Gerstoft J, Pedersen C, et al. Major but differential decline in the incidence of Staphylococcus aureus bacteraemia in HIV-infected individuals from 1995 to 2007: a nationwide cohort study*. HIV Med. 2012 Jan;13(1):45–53.
376. Longenecker CT, Triant VA. Initiation of antiretroviral therapy at high CD4 cell counts: does it reduce the risk of cardiovascular disease? Curr Opin HIV AIDS. 2014 Jan;9(1):54–62.
377. Allen J, Smith C, Bhagani S. Will antiretroviral therapy reduce HIV-related liver risk? Curr Opin HIV AIDS. 2014 Jan;9(1):48–53.
378. Ribeiro SR, Luz PM, Campos DP, Moreira RI, Coelho L, Japiassu A, et al. Incidence and determinants of severe morbidity among HIV-infected patients from Rio de Janeiro, Brazil, 2000-2010. Antivir Ther. 2014 Jan 20;
379. Baker J V. Chronic HIV disease and activation of the coagulation system. Thromb Res. 2013 Nov;132(5):495–9.
380. Hunt PW. HIV and inflammation: mechanisms and consequences. Curr HIV/AIDS Rep. 2012 Jun;9(2):139–47.
381. Tenorio AR, Zheng Y, Bosch RJ, Krishnan S, Rodriguez B, Hunt PW, et al. Soluble Markers of Inflammation and Coagulation but Not T-Cell Activation Predict Non-AIDS-Defining Morbid Events During Suppressive Antiretroviral Treatment. J Infect Dis. 2014 May 1;
382. Ipp H, Zemlin AE, Erasmus RT, Glashoff RH. Role of inflammation in HIV-1 disease progression and prognosis. Crit Rev Clin Lab Sci. 2014 Apr;51(2):98–111.
383. Funderburg NT. Markers of coagulation and inflammation often remain elevated in ART-treated HIV-infected patients. Curr Opin HIV AIDS. 2014 Jan;9(1):80–6.
384. Borges ÁH, Silverberg MJ, Wentworth D, Grulich AE, Fätkenheuer G, Mitsuyasu R, et al. Predicting risk of cancer during HIV infection: the role of inflammatory and coagulation biomarkers. AIDS. 2013 Jun 1;27(9):1433–41.
385. Borges AH, Dubrow R, Silverberg MJ. Factors contributing to risk for cancer among HIV-infected individuals, and evidence that earlier combination antiretroviral therapy will alter this risk. Curr Opin HIV AIDS. 2014 Jan;9(1):34–40.

67
386. Littman AJ, Jackson LA, Vaughan TL. Chlamydia pneumoniae and lung cancer: epidemiologic evidence. Cancer Epidemiol Biomarkers Prev. 2005 Apr;14(4):773–8.
387. El-Omar EM, Rabkin CS, Gammon MD, Vaughan TL, Risch HA, Schoenberg JB, et al. Increased risk of noncardia gastric cancer associated with proinflammatory cytokine gene polymorphisms. Gastroenterology. 2003 May;124(5):1193–201.
388. Monk BJ, Tewari KS. The spectrum and clinical sequelae of human papillomavirus infection. Gynecol Oncol. 2007 Nov;107(2 Suppl 1):S6–13.
389. Cho LY, Yang JJ, Ko K-P, Park B, Shin A, Lim MK, et al. Coinfection of hepatitis B and C viruses and risk of hepatocellular carcinoma: systematic review and meta-analysis. Int J Cancer. 2011 Jan 1;128(1):176–84.
390. Jarrett RF. Viruses and Hodgkin’s lymphoma. Ann Oncol. 2002 Jan;13 Suppl 1:23–9.
391. Nordell AD, McKenna M, Borges ÁH, Duprez D, Neuhaus J, Neaton JD. Severity of cardiovascular disease outcomes among patients with HIV is related to markers of inflammation and coagulation. J Am Heart Assoc. 2014 Jun;3(3):e000844.
392. Peters L, Neuhaus J, Duprez D, Neaton JD, Tracy R, Klein MB, et al. Biomarkers of inflammation, coagulation and microbial translocation in HIV/HCV co-infected patients in the SMART study. J Clin Virol. 2014 Jul;60(3):295–300.
393. Clausen LN, Lundbo LF, Benfield T. Hepatitis C virus infection in the human immunodeficiency virus infected patient. World J Gastroenterol. 2014 Sep 14;20(34):12132–43.
394. Szczech LA, Gupta SK, Habash R, Guasch A, Kalayjian R, Appel R, et al. The clinical epidemiology and course of the spectrum of renal diseases associated with HIV infection. Kidney Int. 2004 Sep;66(3):1145–52.
395. Rodriguez-Penney AT, Iudicello JE, Riggs PK, Doyle K, Ellis RJ, Letendre SL, et al. Co-morbidities in persons infected with HIV: increased burden with older age and negative effects on health-related quality of life. AIDS Patient Care STDS. 2013 Jan;27(1):5–16.
396. Costagliola D. Demographics of HIV and aging. Curr Opin HIV AIDS. 2014 Jul;9(4):294–301.
397. Mallon PWG. Aging with HIV: osteoporosis and fractures. Curr Opin HIV AIDS. 2014 Jul;9(4):428–35.
398. Guaraldi G, Stentarelli C, Zona S, Santoro A. HIV-associated lipodystrophy: impact of antiretroviral therapy. Drugs. 2013 Sep;73(13):1431–50.
399. Carr A. Cardiovascular risk factors in HIV-infected patients. JAcquirImmuneDeficSyndr. 2003;34 Suppl 1:S73–S78.
400. Jevtovic DJ, Dragovic G, Salemovic D, Ranin J, Djurkovic-Djakovic O. The metabolic syndrome, an epidemic among HIV-infected patients on HAART. Biomed Pharmacother. 2008/11/11 ed. 2009;63(5):337–42.
401. Friis-Møller N, Thiébaut R, Reiss P, Weber R, Monforte AD, De Wit S, et al. Predicting the risk of cardiovascular disease in HIV-infected patients: the data collection on adverse effects of anti-HIV drugs study. Eur J Cardiovasc Prev Rehabil. 2010 Oct;17(5):491–501.
402. Worm SW, Sabin C, Weber R, Reiss P, El-Sadr W, Dabis F, et al. Risk of myocardial infarction in patients with HIV infection exposed to specific individual antiretroviral drugs from the 3 major drug classes: the data collection on adverse events of anti-HIV drugs (D:A:D) study. J Infect Dis. 2010 Feb 1;201(3):318–30.
403. De Waal R, Cohen K, Maartens G. Systematic review of antiretroviral-associated lipodystrophy: lipoatrophy, but not central fat gain, is an antiretroviral adverse drug reaction. PLoS One. 2013 Jan;8(5):e63623.

68
404. Szczech LA. Renal Dysfunction and Tenofovir Toxicity in HIV-infected Patients. Top HIV Med. 2008;16(4):122–6.
405. Costagliola D, Lang S, Mary-Krause M, Boccara F. Abacavir and cardiovascular risk: reviewing the evidence. Curr HIV/AIDS Rep. 2010 Aug;7(3):127–33.
406. Cruciani M, Zanichelli V, Serpelloni G, Bosco O, Malena M, Mazzi R, et al. Abacavir use and cardiovascular disease events: a meta-analysis of published and unpublished data. AIDS. 2011 Oct 23;25(16):1993–2004.
407. Sabin C. Is there continued evidence for an association between abacavir and myocardial infarction risk? 21st Conference on Retroviruses and Opportunistic Infections. 2014.
408. Önen NF, Overton ET. A review of premature frailty in HIV-infected persons; another manifestation of HIV-related accelerated aging. Curr Aging Sci. 2011 Feb;4(1):33–41.
409. Hearps AC, Martin GE, Rajasuriar R, Crowe SM. Inflammatory co-morbidities in HIV+ individuals: learning lessons from healthy ageing. Curr HIV/AIDS Rep. 2014 Mar;11(1):20–34.
410. Torres RA, Lewis W. Aging and HIV/AIDS: pathogenetic role of therapeutic side effects. Lab Invest. 2014 Feb;94(2):120–8.
411. Shirley DK, Kaner RJ, Glesby MJ. Effects of smoking on non-AIDS-related morbidity in HIV-infected patients. Clin Infect Dis. 2013 Jul;57(2):275–82.
412. Helleberg M, Afzal S, Kronborg G, Larsen CS, Pedersen G, Pedersen C, et al. Mortality attributable to smoking among HIV-1-infected individuals: a nationwide, population-based cohort study. Clin Infect Dis. 2013 Mar;56(5):727–34.
413. Riley ED, Neilands TB, Moore K, Cohen J, Bangsberg DR, Havlir D. Social, structural and behavioral determinants of overall health status in a cohort of homeless and unstably housed HIV-infected men. PLoS One. 2012 Jan;7(4):e35207.
414. Prados-Torres A, Calderón-Larrañaga A, Hancco-Saavedra J, Poblador-Plou B, van den Akker M. Multimorbidity patterns: a systematic review. J Clin Epidemiol. 2014 Mar;67(3):254–66.
415. Rodkjaer L, Laursen T, Balle N, Sodemann M. Depression in patients with HIV is under-diagnosed: a cross-sectional study in Denmark. HIV Med. 2010 Jan;11(1):46–53.
416. Rodkjaer L, Laursen T, Christensen NB, Lomborg K, Ostergaard L, Sodemann M. Changes in depression in a cohort of Danish HIV-positive individuals: time for routine screening. Sex Health. 2011 Jun;8(2):214–21.
417. Lohse N, Hansen A-BEB, Gerstoft J, Obel N. Improved survival in HIV-infected persons: consequences and perspectives. J Antimicrob Chemother. 2007 Sep;60(3):461–3.
418. Lewden C, May T, Rosenthal E, Burty C, Bonnet F, Costagliola D, et al. Changes in causes of death among adults infected by HIV between 2000 and 2005: The “Mortalite 2000 and 2005” surveys (ANRS EN19 and Mortavic). J Acquir Immune Defic Syndr. 2008;48(5):590–8.
419. Helleberg M, Kronborg G, Larsen CS, Pedersen G, Pedersen C, Gerstoft J, et al. Causes of death among Danish HIV patients compared with population controls in the period 1995-2008. Infection. 2012 Dec;40(6):627–34.
420. Grinsztejn B, Luz PM, Pacheco AG, Santos DVG, Velasque L, Moreira RI, et al. Changing mortality profile among HIV-infected patients in Rio de Janeiro, Brazil: shifting from AIDS to non-AIDS related conditions in the HAART era. PLoS One. 2013 Jan;8(4):e59768.

69
421. Smith CJ, Ryom L, Weber R, Morlat P, Pradier C, Reiss P, et al. Trends in underlying causes of death in people with HIV from 1999 to 2011 (D:A:D): a multicohort collaboration. Lancet. 2014 Jul 19;384(9939):241–8.
422. Morlat P, Roussillon C, Henard S, Salmon D, Bonnet F, Cacoub P, et al. Causes of death among HIV-infected patients in France in 2010 (national survey): trends since 2000. AIDS. 2014 May 15;28(8):1181–91.
423. Weber R, Ruppik M, Rickenbach M, Spoerri A, Furrer H, Battegay M, et al. Decreasing mortality and changing patterns of causes of death in the Swiss HIV Cohort Study. HIV Med. 2013 Apr;14(4):195–207.
424. Sackoff JE, Hanna DB, Pfeiffer MR, Torian L V. Causes of death among persons with AIDS in the era of highly active antiretroviral therapy: New York City. AnnInternMed. 2006;145(6):397–406.
425. Smit C, Geskus R, Walker S, Sabin C, Coutinho R, Porter K, et al. Effective therapy has altered the spectrum of cause-specific mortality following HIV seroconversion. AIDS. 2006 Mar 21;20(5):741–9.
426. Programme CHI V. CoDe (“Coding of Death in HIV”) Project. http://www.chip.dk/CoDe/tabid/55/Default.aspx. 2006.
427. Kowalska JD, Friis-Møller N, Kirk O, Bannister W, Mocroft A, Sabin C, et al. The Coding Causes of Death in HIV (CoDe) Project: initial results and evaluation of methodology. Epidemiology. 2011 Jul;22(4):516–23.
428. Andersen PK, Geskus RB, de Witte T, Putter H. Competing risks in epidemiology: possibilities and pitfalls. Int J Epidemiol. 2012 Jun;41(3):861–70.
429. EDERER F, AXTELL LM, CUTLER SJ. The relative survival rate: a statistical methodology. Natl Cancer Inst Monogr. 1961 Sep;6:101–21.
430. McLean IW, Gamel JW. Cause-specific versus all-cause survival. Ophthalmology. 1998 Nov;105(11):1989–90.
431. Ingle SM, May MT, Gill MJ, Mugavero MJ, Lewden C, Abgrall S, et al. Impact of Risk Factors for Specific Causes of Death in the First and Subsequent Years of Antiretroviral Therapy Among HIV-Infected Patients. Clin Infect Dis. 2014 Jul 15;59(2):287–97.
432. UNAIDS Programme Coordinating Board. 34th Meeting of the UNAIDS PBC - decisions. 2014.
433. Murray CJL, Lopez AD. Measuring the global burden of disease. N Engl J Med. 2013 Aug 1;369(5):448–57.
434. Murray CJL, Ortblad KF, Guinovart C, Lim SS, Wolock TM, Roberts DA, et al. Global, regional, and national incidence and mortality for HIV, tuberculosis, and malaria during 1990–2013: a systematic analysis for the Global Burden of Disease Study 2013. Lancet. 2014 Jul 21;
435. Smith JH, Whiteside A. The history of AIDS exceptionalism. J Int AIDS Soc. 2010 Jan;13:47.
436. Whiteside A, Smith J. Exceptional epidemics: AIDS still deserves a global response. Global Health. 2009 Jan;5:15.
437. Marais BJ, Lönnroth K, Lawn SD, Migliori GB, Mwaba P, Glaziou P, et al. Tuberculosis comorbidity with communicable and non-communicable diseases: integrating health services and control efforts. Lancet Infect Dis. 2013 May;13(5):436–48.
438. Remais J V, Zeng G, Li G, Tian L, Engelgau MM. Convergence of non-communicable and infectious diseases in low- and middle-income countries. Int J Epidemiol. 2013 Feb;42(1):221–7.
439. Aantjes CJ, Quinlan TK, Bunders JF. Practicalities and challenges in re-orienting the health system in Zambia for treating chronic conditions. BMC Health Serv Res. 2014 Jan;14(1):295.

70
440. Janssens B, Van Damme W, Raleigh B, Gupta J, Khem S, Soy Ty K, et al. Offering integrated care for HIV/AIDS, diabetes and hypertension within chronic disease clinics in Cambodia. Bull World Heal Organ. 2007;85(11):880–5.
441. Rabkin M, Melaku Z, Bruce K, Reja A, Koler A, Tadesse Y, et al. Strengthening Health Systems for Chronic Care: Leveraging HIV Programs to Support Diabetes Services in Ethiopia and Swaziland. J Trop Med. 2012 Jan;2012:137460.
442. UNAIDS. Data tools [Internet]. 2014. Available from: http://www.unaids.org/en/dataanalysis/
443. Rabkin M, Kruk ME, El-Sadr WM. HIV, aging and continuity care: strengthening health systems to support services for noncommunicable diseases in low-income countries. AIDS. 2012 Jul 31;26 Suppl 1:S77–83.
444. Chirch LM, Hasham M, Kuchel GA. HIV and aging: a clinical journey from Koch’s postulate to the chronic disease model and the contribution of geriatric syndromes. Curr Opin HIV AIDS. 2014 Jul;9(4):405–11.
445. Cachay ER, Mathews WC. Human papillomavirus, anal cancer, and screening considerations among HIV-infected individuals. AIDS Rev. 15(2):122–33.
446. Lundgren JD, Babiker AG, Gordin FM, Borges ÁH, Neaton JD. When to start antiretroviral therapy: the need for an evidence base during early HIV infection. BMC Med. 2013 Jan;11:148.
447. Kitahata MM, Gange SJ, Abraham AG, Merriman B, Saag MS, Justice AC, et al. Effect of early versus deferred antiretroviral therapy for HIV on survival. N Engl J Med. 2009 Apr 30;360(18):1815–26.
448. Babiker AG, Emery S, Fätkenheuer G, Gordin FM, Grund B, Lundgren JD, et al. Considerations in the rationale, design and methods of the Strategic Timing of AntiRetroviral Treatment (START) study. Clin Trials. 2013 Jan;10(1 Suppl):S5–S36.
449. Hsu DC, Sereti I, Ananworanich J. Serious Non-AIDS events: Immunopathogenesis and interventional strategies. AIDS Res Ther. 2013 Jan;10(1):29.
450. Taiwo B, Barcena L, Tressler R. Understanding and controlling chronic immune activation in the HIV-infected patients suppressed on combination antiretroviral therapy. Curr HIV/AIDS Rep. 2013 Mar;10(1):21–32.
451. Haynes BF, McElrath MJ. Progress in HIV-1 vaccine development. Curr Opin HIV AIDS. 2013 Jul;8(4):326–32.
452. Stan R, Zaia JA. Practical considerations in gene therapy for HIV cure. Curr HIV/AIDS Rep. 2014 Mar;11(1):11–9.
453. Søgaard OS. The HDAC inhibitor romidepsin is safe and effectively reverses HIV-1 latency in vivo as measured by standard clinical assays. AIDS 2014, Abstract TUAA0106LB.
454. Rasmussen TA, Tolstrup M, Brinkmann CR, Olesen R, Erikstrup C, Solomon A, et al. Panobinostat, a histone deacetylase inhibitor, for latent-virus reactivation in HIV-infected patients on suppressive antiretroviral therapy: a phase 1/2, single group, clinical trial. Lancet HIV. 2014;
455. Hankins CA, de Zalduondo BO. Combination prevention: a deeper understanding of effective HIV prevention. AIDS. 2010 Oct;24 Suppl 4:S70–80.
456. Jones A, Cremin I, Abdullah F, Idoko J, Cherutich P, Kilonzo N, et al. Transformation of HIV from pandemic to low-endemic levels: a public health approach to combination prevention. Lancet. 2014 Jul 19;384(9939):272–9.
457. Lima VD, Thirumurthy H, Kahn JG, Saavedra J, Cárceres CF, Whiteside A. Modeling scenarios for the end of AIDS. Clin Infect Dis. 2014 Jul;59 Suppl 1:S16–20.
71
458. Sidibé M, Zuniga JM, Montaner J. Leveraging HIV treatment to end AIDS, stop new HIV infections, and avoid the cost of inaction. Clin Infect Dis. 2014 Jul;59 Suppl 1:S3–6.
459. Sigaloff KCE, Lange JMA, Montaner J. Global Response to HIV: Treatment as Prevention, or Treatment for Treatment? Clin Infect Dis. 2014 Jul 1;59 Suppl 1:S7–S11.

Morbidity and Risk of Subsequent Diagnosis of HIV: APopulation Based Case Control Study IdentifyingIndicator Diseases for HIV InfectionOle S. Søgaard1*, Nicolai Lohse2, Lars Østergaard1, Gitte Kronborg3, Birgit Røge4, Jan Gerstoft5, Henrik T.
Sørensen2,6, Niels Obel5
1 Department of Infectious Diseases, Aarhus University Hospital, Skejby, Denmark, 2 Department of Clinical Epidemiology, Aarhus University Hospital, Aarhus, Denmark,
3 Department of Infectious Diseases, Copenhagen University Hospital, Hvidovre, Denmark, 4 Department of Infectious Diseases, Kolding Hospital, Kolding, Denmark,
5 Department of Infectious Diseases, Rigshospitalet, Copenhagen, Denmark, 6 Department of Epidemiology, Boston University School of Public Health, Boston,
Massachusetts, United States of America
Abstract
Background: Early identification of persons with undiagnosed HIV infection is an important health care issue. We examinedassociations between diseases diagnosed in hospitals and risk of subsequent HIV diagnosis.
Methods: In this population-based case control study, cases were persons with incident HIV infection diagnosed inDenmark between 1 January 1995 and 1 June 2008. Risk-set sampling was used to identify 19 age- and gender-matchedpopulation controls for each HIV case, using the HIV diagnosis date as the index date for both cases and controls. Priorhospital diagnoses obtained from Danish medical databases were first categorized into 22 major disease categories(excluding AIDS-defining diseases except tuberculosis) and then subdivided into 161 subcategories, allowing us to examinespecific diseases as potential HIV indicators by conditional logistic regression.
Results: The study included 2,036 HIV cases and 35,718 controls. Persons with the following disease categories had a highrisk of HIV diagnosis during the subsequent 5-year period: sexually transmitted infections and viral hepatitis (adjusted oddsratio [aOR] = 12.3, 95% CI: 9.60–15.7), hematological diseases (aOR = 4.28, 3.13–5.85), lower respiratory tract infections(aOR = 3.98, 3.14–5.04)), CNS infections (aOR = 3.44, 1.74–6.80), skin infections (aOR = 3.05, 2.47–3.75), other infections(aOR = 4.64, 3.89–5.54), and substance abuse (aOR = 2.60, 2.06–3.29). Several specific diseases were associated with aORs.20 including syphilis, hepatitis A, non ‘‘A’’ viral hepatitis, herpes zoster, candida infection, endocarditis, thrombocytopenia,and opioid abuse.
Conclusions: Targeted testing for HIV in patients diagnosed with diseases associated with HIV may lead to earlier treatmentand thereby reduced morbidity, mortality and HIV transmission.
Citation: Søgaard OS, Lohse N, Østergaard L, Kronborg G, Røge B, et al. (2012) Morbidity and Risk of Subsequent Diagnosis of HIV: A Population Based CaseControl Study Identifying Indicator Diseases for HIV Infection. PLoS ONE 7(3): e32538. doi:10.1371/journal.pone.0032538
Editor: Jialin Charles Zheng, University of Nebraska Medical Center, United States of America
Received August 4, 2011; Accepted January 31, 2012; Published March 5, 2012
Copyright: � 2012 Søgaard et al. This is an open-access article distributed under the terms of the Creative Commons Attribution License, which permitsunrestricted use, distribution, and reproduction in any medium, provided the original author and source are credited.
Funding: This study was supported by the Institute of Clinical Medicine at Aarhus and Copenhagen University. The funders had roles in the study design, datacollection and analysis, decision to publish, or preparation of the manuscript. All authors had full access to all of the data (including statistical reports and tables)in the study and can take responsibility for the integrity of the data and the accuracy of the data analysis. The corresponding author had the final responsibility tosubmit for publication.
Competing Interests: The authors have declared that no competing interests exist.
* E-mail: [email protected]
Introduction
Despite three decades of concerted effort, the HIV epidemic
remains a tremendous public health challenge in both low- and
high-income countries [1,2]. Many individuals newly diagnosed
with HIV present at a late stage of the disease with severe immune
depletion, resulting in delayed initiation of antiretroviral therapy
(ART) which worsens their prognosis [3] and increases further
transmission of HIV [4,5,6]. Recently, the European Center for
Disease Control and Prevention’s Dublin Declaration Progress
Report 2010 concluded that ‘‘the rates of late diagnosis remain
unacceptably high’’ in Europe and Central Asia [7]. Thus,
intensified HIV testing and treatment has been advocated to lower
the prevalence of undiagnosed HIV infection and to control the
HIV epidemic [8,9].
The U.S. Centers for Disease Control and Prevention (CDC)
recommend routine HIV testing for all persons under age 65 who
come into contact with the health care system [10]. While this
approach may be cost-effective in areas with high HIV prevalence
[11] and does prolong life expectancy [3], alternative approaches
such as targeted HIV testing may be more appropriate in other
settings with lower HIV prevalence or different health care systems
[2].
Targeted HIV testing based on risk groups (e.g. injecting drug
users [IDU] [12]), presence of AIDS-defining illnesses, or coming
from a high-HIV prevalence country is practised in most
PLoS ONE | www.plosone.org 1 March 2012 | Volume 7 | Issue 3 | e32538

European countries [13]. However, many opportunities for HIV
testing are missed by the health care system prior to HIV diagnosis
[14]. In 2007, the pan-European initiative ‘‘HIV in Europe’’
recommended that targeted testing based on the presence of
diseases associated with HIV, so-called indicator diseases [15],
should be developed as an additional tool to guide targeted HIV
testing. HIV indicator diseases may be a result of individual risk
behavior or coexisting HIV infection. Several studies have
identified indicator diseases within a narrow spectrum of
conditions [16,17,18,19], but to date there has been no
comprehensive study of HIV indicator diseases. In the absence
of adequate data, guidance is based mainly on expert opinion [15].
There is substantial information regarding the prevalence of
indicator diseases in the HIV-infected population. In contrast, the
relative risk of HIV among patients with indicator diseases remains
poorly described. The goal of this study was to delineate medical
conditions that identify individuals at increased risk of subsequent
HIV diagnosis.
Methods
Ethics statementThe Danish Data Protection Agency approved the establish-
ment of the cohort and the linkage between the four registries in
this study (J.-no. 2008-41-1781). The study was not subject to
approval by the ethics committee because data collection did not
involve direct patient contact and all data was fully de-identified.
We conducted a population-based nested case control study
among persons with and without an incident HIV diagnosis in
Denmark. The adult population of Denmark is 4.3 million with an
estimated HIV infection prevalence of 0.09% [20]. The Danish
healthcare system provides free, tax-supported medical care for all
residents, including antiretroviral treatment of HIV.
Data sourcesThe civil registration system (CRS) number, assigned at birth,
uniquely identifies each person living in Denmark since 1968 and
is used for personal identification in all Danish administrative and
medical databases. We used this unique 10-digit CRS-number to
link data among the following registries: The Danish HIV Cohort
Study (DHCS) is a prospective, open, nationwide, population-based
cohort of all HIV-infected individuals receiving care in Danish
HIV clinics since 1 January 1995 [20]. The study is ongoing, with
continuous enrolment of newly diagnosed patients. The Danish Civil
Registration System records demographic information, vital status,
and immigration and emigration dates for all Danish citizens
beginning in 1967 [21]. The Danish National Registry of Patients
(DNRP) contains information on all patients discharged from
Danish hospitals since 1977 [22]. It includes diagnoses coded by
the treating physician according to the International Classification of
Diseases, 8th revision (ICD-8) up to the end of 1993 and according
to the 10th revision (ICD-10) thereafter. The registry covers public
as well as private hospitals and so constitutes a virtually complete
population-based database. The Danish Cancer Registry (DCR) has
recorded all incident cancers in Denmark since 1943, classifying
cancers registered after 1977 according to ICD-10 [23].
Study populationCases. Cases were identified from DHCS and included all
individuals who (I) were diagnosed with HIV between 1 January
1995 and 1 June 2008; (II) were at least 16 years of age on the date
of HIV diagnosis; and (III) were living in Denmark for at least 5
years prior to HIV diagnosis. The index date for HIV cases was
defined as the date of first positive HIV test as registered in the
DHCS.
Population controls. Controls not diagnosed with HIV were
identified from the CRS using incidence density sampling, which
involves matching each case to a sample of those who are at risk at
the time of case occurrence [24]. To ensure sufficient statistical
power to detect differences in the occurrence of rare events, we
sampled for each case 19 random age- and gender-matched
population controls that were alive on the HIV diagnosis date of
their respective case. The date of HIV diagnosis/sampling
constituted the index date for both cases and controls. Controls
who, according to the CRS, had not been living in Denmark for at
least 5 years prior to the index date were excluded. Hence, all
study subjects were living in Denmark during the 5-year period
prior to their index date and therefore at risk of both exposure and
outcome.
Identification of hospital diagnoses and grouping ofdisease categories
For all study subjects we extracted hospital diagnoses from
outpatient contacts and hospital stays from the DNRP and DCR,
up to the day prior to the index date. ICD-10 codes were the
primary source for grouping diseases. We defined 22 disease
categories of interest according to the type and anatomical
location of the disease (Table S1). ICD-8 codes were translated to
the corresponding ICD-10 disease categories and first-time
diagnoses were assigned to the appropriate category. In addition,
a total of 161 subcategories were created for the 22 disease
categories, allowing us to examine specific diseases as potential
HIV indicators (Table S1). Except for tuberculosis, we excluded
AIDS-defining diseases, because their association with HIV
infection is well established [25].
Statistical analysesFor cases and controls, we tabulated gender, age (16–39 years,
40–49 years, 50–59 years, and 60+ years), and hospital contact(s)
in the 5-year period prior to the index date for each of the 22
disease categories (yes/no). For cases, the following variables were
also included: race, most likely mode of HIV acquisition, presence
of AIDS [25] at diagnosis, first CD4+ cell count, and HIV RNA
measurement (within 180 days of HIV diagnosis). Frequencies and
percentages were computed for all variables.
Conditional logistic regression analysesFor each of the 22 disease categories, conditional logistic
regression analysis was used to estimate odds ratios (OR), which is
an unbiased estimate of the incidence rate ratio (IRR) for
subsequent HIV diagnosis [24]; unadjusted ORs as well as ORs
adjusted for the remaining 21 disease categories were estimated.
Observation data were subsequently stratified into three time
periods prior to the index date (less than 1 year, 1–2 years, and 3–
5 years,) to explore changes in ORs in the years following a given
disease or disease category. We used first-time diagnoses
registered within each time stratum for a given disease/disease
category. Adjusted ORs were calculated for each disease category
and time period (adjusted for the remaining 21 disease
categories). To identify specific HIV-indicator diseases, we
explored risk estimates for the 161 specific subcategories within
each of the 22 disease categories. We computed both unadjusted
odds ratios for each subcategory and odds ratios adjusted for
other diseases within the same disease category (Table S1). In all
analyses, only first-time diagnoses for a given disease/disease
category were utilized.
Indicator Diseases for HIV Infection
PLoS ONE | www.plosone.org 2 March 2012 | Volume 7 | Issue 3 | e32538

Results
We identified 2,363 individuals diagnosed with HIV between 1
January 1995 and 1 June 2008 and 38,684 controls. Of these, 327
cases and 2,966 controls were excluded because they immigrated
to Denmark less than 5 years prior to their index date. Thus, a
total of 2,036 cases and 35,718 controls were included resulting in
an average of 17.5 controls per case.
In the 5 years prior to their index date, there were a total of
138,416 hospital contacts for both cases and controls, of which
34,520 represented a first-time diagnosis for one of the 22 disease
categories. Table 1 shows characteristics of cases and controls on
their index date. In the 5 years preceding the index date, 69.8% of
cases (1,421 of 2,036 cases) and 53.6% of controls (19,148 of
35,718 controls) had at least one hospital contact for one of the 22
disease categories delineated below.
Disease category and risk of subsequent HIV diagnosisSeveral disease categories were associated with an increased risk
of HIV diagnosis during the following 5-year period (Figure 1).
Persons diagnosed a disease in the category ‘‘sexually transmitted
infections (STIs) and viral hepatitis’’ had the highest risk of
subsequent HIV diagnosis (adjusted OR [aOR] = 12.3, 95%
confidence interval [CI], 9.60–15.7). Also persons with infections
(lower respiratory tract infections, CNS infections, skin infections,
and other infections), hematological diseases, non-AIDS defining
cancers, substance abuse, poisoning, ear, nose, and throat diseases,
skin diseases, and gastrointestinal diseases had higher risk of HIV
diagnosis during the following 5 years. Seven disease categories
were not associated with subsequent HIV diagnosis: eye diseases,
kidney diseases, lung diseases, ischemic heart disease (IHD), non-
IHD vascular diseases, neurological diseases, and trauma. A
decreased risk of subsequent HIV diagnosis was found for persons
with rheumatological diseases (aOR = 0.72, 95% CI:0.62–0.85),
non-diabetes endocrine diseases (aOR = 0.60, 95% CI:0.42–0.86),
and diabetes (aOR = 0.40, 95% CI:0.23–0.69).
Time trends in risk of HIV diagnosis following hospitalcontact
Figure 2 shows the relative risk of subsequent HIV in 3 time
periods: ,1 year, 2–3 years, and 3–5 years after each of the 22
disease categories. The time trends can be categorized in four
main groups: 1) no time trend (eye diseases, lung diseases, kidney
diseases, IHD, neurological diseases, trauma, rheumatological
diseases, non-diabetic endocrine diseases, and diabetes); 2) A
highly increased risk of HIV in the first year after diagnosis and no
or only a slightly increased risk thereafter (hematological diseases,
non-AIDS malignancy, skin diseases, gastrointestinal diseases, and
non-IHD vascular diseases); 3) gradually decreased risk of HIV
over time (lower respiratory tract infections, CNS infections, skin
infections, other infections, and ear, nose, and throat diseases); 4)
persistently increased risk both in the short and the long term
(STIs and viral hepatitis, substance abuse, and poisoning).
Specific HIV-indicator diseasesTo determine whether any specific diseases were strong
indicators of subsequent HIV diagnosis, we further divided the
22 disease categories into 161 subcategories. Table 2 reports risk
estimates for subcategories associated with at least a 3-fold elevated
risk of subsequent HIV diagnosis (all 161 subcategories shown in
Table S2). We found strong associations between all groups of
STIs and viral hepatitis and subsequent HIV diagnosis. Several
other specific groups of infectious diseases, including meningitis,
herpes zoster, endocarditis, and malaria, were closely associated
with later HIV diagnosis. Among hematological diseases and
cancers: thrombocytopenia, anemia, lymphadenitis, non-AIDS
defining lymphomas, and secondary and unspecified malignant
neoplasm of lymph nodes were associated with later HIV
diagnosis. Genital cancers were not. In the group of gastrointes-
tinal diseases, diseases of the oral cavity, liver diseases, and
fissures/abscesses of the anal cavity were strongly associated with
Table 1. Baseline characteristicsa of HIV cases and HIV-uninfected controls.
Cases Controls
(n = 2,036) (n = 35,718)
Sex, n (%)
Female 380 (18.7) 6,555 (18.4)
Male 1,656 (81.3) 30,819 (81.6)
Age at diagnosis, n (%)
16–39 years 1,122 (55.1) 18,899 (52.91)
40–49 years 510 (25.1) 9,266 (25.9)
50–59 years 290 (14.2) 5,410 (15.2)
60+ years 114 (5.6) 2,143 (6.0)
Hospital contact, n (%)b
Yes 1,421(69.8) 19,148 (53.6)
No 615 (30.2) 16,570 (46.4)
Race, n (%)
Caucasian 1,798 (88.7) –
Black 119 (5.9) –
Asian 55 (2.7) –
Inuit 19 (0.9) –
Other 36 (1.8) –
Mode of HIV exposure, n (%)
MSM 975 (47.9) –
Heterosexual 722 (35.5) –
IDU 210 (10.3) –
Other 49 (2.4) –
Unknown 80 (3.9) –
AIDS at diagnosis, n (%)
No 1,847 (90.7) –
Yes 189 (9.3) –
First CD4+ count (cells/mL)c
,350 999 (49.1) –
$350 829 (40.7) –
missing 208 (10.2)
First HIV RNA measurement (copies/mL)c
#104 343 (16.9) –
.104 & #105 622 (30.6) –
.105 660 (32.4) –
missing 411 (20.2)
aBaseline was defined as the index date which was the date of HIV diagnosis forcases and their corresponding controls (matched on the day the case wasdiagnosed with HIV).
bIn the 5 years prior to the index date for at least one of the 22 diseasecategories in Table S1.
cWithin 180 days of HIV diagnosis. The table shows data on HIV cases and HIV-uninfected controls with at least 5 years of continuous observation prior to theindex date. MSM, men who have sex with men; IDU, injection drug use.
doi:10.1371/journal.pone.0032538.t001
Indicator Diseases for HIV Infection
PLoS ONE | www.plosone.org 3 March 2012 | Volume 7 | Issue 3 | e32538

later HIV diagnosis. Among skin diseases, seborrhoeic dermatitis
was associated with increased risk of HIV diagnosis. Ischemic
heart disease, including myocardial infarction (aOR = 0.81,
95%:0.39–1.69) and other cardiovascular diseases, were not
associated with later HIV diagnosis, with the notable exception
of thrombophlebitis (aOR = 5.29, 95% CI:3.51–7.96).
Among fourteen individuals diagnosed with hepatitis A
infection, 12 (85.7%) were men who had sex with men (MSM).
Five (50%) of ten cases with malaria were non-Caucasian
immigrants. In 62 of 68 cases (91.2%) with opioid abuse-related
diagnoses, IDU was registered as the mode of HIV transmission.
First-time diagnoses for the 52 diseases in Table 2 represented
3,257 (1.9%) of all 138,416 hospital contacts registered in the 5
years prior to the index date. In the HIV cohort of 2,036
individuals, 782 (38.4%) had at least one hospital contact for an
indicator disease, while this occurred for only 2,475 (6.9%) of
35,718 controls. For the 1,826 cases not reporting IDU as mode of
HIV infection, 613 (34.1%) had a first-time hospital contact for
diseases listed in Table 2.
Discussion
We found that HIV indicator diseases identified over one-third
of all individuals who would become diagnosed with HIV in the
subsequent 5-year period. Recognition of these HIV indicator
diseases could aid healthcare personnel in identifying individuals at
increased risk of undiagnosed HIV. The time-dependent associ-
ation between the date of diagnosis of some disease categories and
HIV diagnosis suggests that for several categories repeated (e.g.
yearly) HIV testing is advisable.
To our knowledge, this is the first population-based study
conducted to identify HIV indicator diseases across all disease
categories. While some indicator diseases we identified were
previously recognized [15,16,17,26], the size of our study
population and completeness of hospitalization data allowed us
to provide risk estimates with high statistical precision for the
majority of disease groups. Our results thus can be used to guide
strategies for targeted HIV testing in the hospital settings.
Figure 1. Association between subsequent risk of HIV diagnosis and hospital contact for 22 major disease categories.doi:10.1371/journal.pone.0032538.g001
Indicator Diseases for HIV Infection
PLoS ONE | www.plosone.org 4 March 2012 | Volume 7 | Issue 3 | e32538

Our study also had some limitations. As in other observational
HIV cohort studies, an unknown proportion of people with HIV
may have died without being diagnosed with the condition. Thus,
we may have underestimated the relative risk of subsequent HIV
diagnosis after life-threatening conditions such as cancer [26].
Additionally, we had access only to hospital diagnoses, which may
have caused us to underestimate the occurrence of diseases
diagnosed outside the hospital system, such as syphilis, fungal skin
infections, and herpes zoster. If patients at risk of HIV are more
prone to be diagnosed in a hospital setting this will lead to a
potential overestimation of the predictive value of some HIV
predictor diseases if compared with those from a non-hospital
setting. Another potential shortcoming is inaccuracies in diagnoses
reported to national hospital databases. However, the positive
predictive value of registry diagnoses (i.e. the proportion of
subjects with a given registry diagnosis which is correct when
compared to medical records) is generally high (70%–99%)
[22,27]. Furthermore, risk of subsequent HIV diagnosis may be
elevated if a given disease diagnosis increases the likelihood of HIV
testing, regardless of its actual association with HIV infection. This
phenomenon would produce a close association between the
timing of the disease and HIV diagnoses. Although persons with
some disease categories had increased risk of HIV in the first year
thereafter (Figure 2), the increased risk of subsequent HIV
diagnosis was also observed more than 1 year after the disease.
Hence, this phenomenon could only have a moderate effect on the
5-year estimates. Finally, it should be noted that due to our use of
hospital diagnoses, we were unable to identify clinical features that
may further enhance the predictive value of given indicator
diseases (e.g. ‘‘florid or hard to treat’’ fungal skin infection).
HIV indicator diseases can be grouped into three major types.
First, disease manifestations of acute HIV infection (e.g. acute viral
Figure 2. Association between risk of subsequent HIV diagnosis and time of hospital contact.doi:10.1371/journal.pone.0032538.g002
Indicator Diseases for HIV Infection
PLoS ONE | www.plosone.org 5 March 2012 | Volume 7 | Issue 3 | e32538

Table 2. Specific diseases (diagnosed in the 5 years before the index date) associated with at least 3-fold elevated risk ofsubsequent HIV diagnosis.
Disease category Specific diseaseCasesn = 2,036
Controlsn = 35,718 aOR (95% CI)a
Infections
STIs and viral hepatitis Syphilis 15 2 94.7 (20.9–429)
STIs and viral hepatitis Hepatitis A 14 4 41.6 (11.7–148)
STIs and viral hepatitis Non ‘‘A’’ viral hepatitisb 77 55 23.6 (16.5–33.7)
STIs and viral hepatitis Anogenital herpes simplex 7 10 12.7 (4.65–34.8)
STIs and viral hepatitis Condyloma 55 95 8.99 (6.32–12.8)
STIs and viral hepatitis Other STIs 18 12 14.8 (6.35–34.6)
Lower respiratory tract infections Unspecified pneumonia 126 290 7.56 (6.03–9.48)
Lower respiratory tract infections Pneumococcal pneumonia 9 14 4.33 (1.63–11.5)
Lower respiratory tract infections Influenza and viral pneumonia 9 43 3.21 (1.51–6.81)
CNS infections Bacterial meningitis 5 9 14.7 (5.63–38.1)
CNS infections Viral meningitis or encephalitis 9 25 6.33 (2.90–13.8)
CNS infections Other CNS infections 9 10 5.51 (1.60–19.0)
Skin infections Abscess, furuncle, carbuncle 137 409 5.15 (4.17–6.35)
Skin infections Fungal skin infections 3 11 4.41 (1.18–16.5)
Skin infections Erysipelas 25 76 3.92 (2.39–6.45)
Skin infections Other skin infections 45 95 5.29 (3.56–7.86)
Other infections Herpes zoster 22 8 33.7 (14.3–79.6)
Other infections Candida infectionc 40 22 25.5 (14.6–44.6)
Other infections Endocarditis 11 7 23.2 (8.71–61.9)
Other infections Tuberculosis and other mycobacterial infections 24 21 15.2 (7.99–29.1)
Other infections Malaria 10 12 9.53 (3.86–23.5)
Other infections Mononucleosis 11 19 8.64 (4.04–18.5)
Other infections Lymphangitis 5 8 7.88 (2.40–25.9)
Other infections Unspecified viral illness 23 44 7.87 (4.56–13.6)
Other infections Sepsis 23 34 4.90 (2.52–9.52)
Other infections Infectious gastroenteritis 50 216 3.48 (2.49–4.87)
Other infections Other types of infection 67 182 4.77 (3.46–6.56)
Hematological diseases and cancers
Hematological diseases Thrombocytopenia 15 10 24.0 (10.5–54.7)
Hematological diseases Unspecified anemia 24 44 7.26 (4.19–12.6)
Hematological diseases Lymphoma 18 43 5.83 (3.22–10.5)
Hematological diseases Aplastic and other specified anemias 7 17 4.58 (2.38–8.79)
Hematological diseases Lymphadenitis 13 42 3.44 (1.42–8.30)
Hematological diseases Nutrition deficiency anemia 7 27 3.11 (1.11–8.70)
Hematological diseases Other hematological diseases 5 18 4.30 (1.54–12.0)
Non-AIDS defining cancers Secondary and unspec. malignant neoplasm of lymph nodes 11 22 6.74 (3.14–14.5)
Substance abuse and poisoning
Substance abuse Substance abuse opioids 69 17 43.5 (24.6–76.8)
Substance abuse Substance abuse other 51 55 6.54 (4.07–10.5)
Drug poisoning Narcotics and hallucinogens 47 43 11.2 (7.08–17.8)
Other disease categories
Ear, nose, and throat diseases Other acute upper respiratory tract infection 10 30 5.02 (2.38–10.6)
Ear, nose, and throat diseases Chronic disease of tonsils and adenoids 43 129 4.95 (3.45–7.09)
Skin diseases Seborrhoeic dermatitis 9 8 11.8 (4.30–32.6)
Gastrointestinal diseases Fissure/abscess of anal and rectal regions 50 202 4.35 (2.87–6.61)
Gastrointestinal diseases Liver diseases 31 103 4.06 (2.27–7.25)
Gastrointestinal diseases Disease of salivary glands, oral mucosa, tongue and lips 15 58 3.97 (2.88–5.48)
Indicator Diseases for HIV Infection
PLoS ONE | www.plosone.org 6 March 2012 | Volume 7 | Issue 3 | e32538
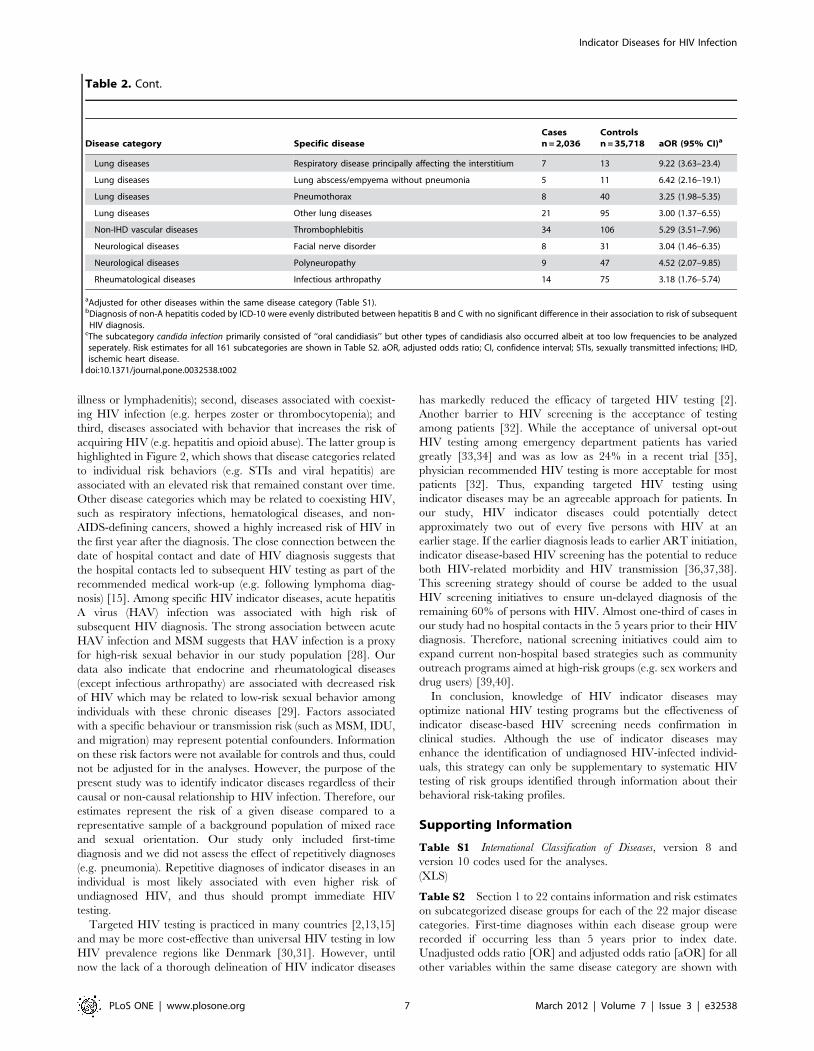
illness or lymphadenitis); second, diseases associated with coexist-
ing HIV infection (e.g. herpes zoster or thrombocytopenia); and
third, diseases associated with behavior that increases the risk of
acquiring HIV (e.g. hepatitis and opioid abuse). The latter group is
highlighted in Figure 2, which shows that disease categories related
to individual risk behaviors (e.g. STIs and viral hepatitis) are
associated with an elevated risk that remained constant over time.
Other disease categories which may be related to coexisting HIV,
such as respiratory infections, hematological diseases, and non-
AIDS-defining cancers, showed a highly increased risk of HIV in
the first year after the diagnosis. The close connection between the
date of hospital contact and date of HIV diagnosis suggests that
the hospital contacts led to subsequent HIV testing as part of the
recommended medical work-up (e.g. following lymphoma diag-
nosis) [15]. Among specific HIV indicator diseases, acute hepatitis
A virus (HAV) infection was associated with high risk of
subsequent HIV diagnosis. The strong association between acute
HAV infection and MSM suggests that HAV infection is a proxy
for high-risk sexual behavior in our study population [28]. Our
data also indicate that endocrine and rheumatological diseases
(except infectious arthropathy) are associated with decreased risk
of HIV which may be related to low-risk sexual behavior among
individuals with these chronic diseases [29]. Factors associated
with a specific behaviour or transmission risk (such as MSM, IDU,
and migration) may represent potential confounders. Information
on these risk factors were not available for controls and thus, could
not be adjusted for in the analyses. However, the purpose of the
present study was to identify indicator diseases regardless of their
causal or non-causal relationship to HIV infection. Therefore, our
estimates represent the risk of a given disease compared to a
representative sample of a background population of mixed race
and sexual orientation. Our study only included first-time
diagnosis and we did not assess the effect of repetitively diagnoses
(e.g. pneumonia). Repetitive diagnoses of indicator diseases in an
individual is most likely associated with even higher risk of
undiagnosed HIV, and thus should prompt immediate HIV
testing.
Targeted HIV testing is practiced in many countries [2,13,15]
and may be more cost-effective than universal HIV testing in low
HIV prevalence regions like Denmark [30,31]. However, until
now the lack of a thorough delineation of HIV indicator diseases
has markedly reduced the efficacy of targeted HIV testing [2].
Another barrier to HIV screening is the acceptance of testing
among patients [32]. While the acceptance of universal opt-out
HIV testing among emergency department patients has varied
greatly [33,34] and was as low as 24% in a recent trial [35],
physician recommended HIV testing is more acceptable for most
patients [32]. Thus, expanding targeted HIV testing using
indicator diseases may be an agreeable approach for patients. In
our study, HIV indicator diseases could potentially detect
approximately two out of every five persons with HIV at an
earlier stage. If the earlier diagnosis leads to earlier ART initiation,
indicator disease-based HIV screening has the potential to reduce
both HIV-related morbidity and HIV transmission [36,37,38].
This screening strategy should of course be added to the usual
HIV screening initiatives to ensure un-delayed diagnosis of the
remaining 60% of persons with HIV. Almost one-third of cases in
our study had no hospital contacts in the 5 years prior to their HIV
diagnosis. Therefore, national screening initiatives could aim to
expand current non-hospital based strategies such as community
outreach programs aimed at high-risk groups (e.g. sex workers and
drug users) [39,40].
In conclusion, knowledge of HIV indicator diseases may
optimize national HIV testing programs but the effectiveness of
indicator disease-based HIV screening needs confirmation in
clinical studies. Although the use of indicator diseases may
enhance the identification of undiagnosed HIV-infected individ-
uals, this strategy can only be supplementary to systematic HIV
testing of risk groups identified through information about their
behavioral risk-taking profiles.
Supporting Information
Table S1 International Classification of Diseases, version 8 and
version 10 codes used for the analyses.
(XLS)
Table S2 Section 1 to 22 contains information and risk estimates
on subcategorized disease groups for each of the 22 major disease
categories. First-time diagnoses within each disease group were
recorded if occurring less than 5 years prior to index date.
Unadjusted odds ratio [OR] and adjusted odds ratio [aOR] for all
other variables within the same disease category are shown with
Disease category Specific diseaseCasesn = 2,036
Controlsn = 35,718 aOR (95% CI)a
Lung diseases Respiratory disease principally affecting the interstitium 7 13 9.22 (3.63–23.4)
Lung diseases Lung abscess/empyema without pneumonia 5 11 6.42 (2.16–19.1)
Lung diseases Pneumothorax 8 40 3.25 (1.98–5.35)
Lung diseases Other lung diseases 21 95 3.00 (1.37–6.55)
Non-IHD vascular diseases Thrombophlebitis 34 106 5.29 (3.51–7.96)
Neurological diseases Facial nerve disorder 8 31 3.04 (1.46–6.35)
Neurological diseases Polyneuropathy 9 47 4.52 (2.07–9.85)
Rheumatological diseases Infectious arthropathy 14 75 3.18 (1.76–5.74)
aAdjusted for other diseases within the same disease category (Table S1).bDiagnosis of non-A hepatitis coded by ICD-10 were evenly distributed between hepatitis B and C with no significant difference in their association to risk of subsequent
HIV diagnosis.cThe subcategory candida infection primarily consisted of ‘‘oral candidiasis’’ but other types of candidiasis also occurred albeit at too low frequencies to be analyzedseperately. Risk estimates for all 161 subcategories are shown in Table S2. aOR, adjusted odds ratio; CI, confidence interval; STIs, sexually transmitted infections; IHD,ischemic heart disease.
doi:10.1371/journal.pone.0032538.t002
Table 2. Cont.
Indicator Diseases for HIV Infection
PLoS ONE | www.plosone.org 7 March 2012 | Volume 7 | Issue 3 | e32538
95% confidence intervals [95% CI]. The number of persons in the
analyses were: Cases (n = 2,036) and controls (n = 35,718).
(XLS)
Acknowledgments
The authors thank the staff of their clinical departments for their
continuous support and enthusiasm.
Author Contributions
Conceived and designed the experiments: OSS NL JG HTS NO.
Performed the experiments: OSS NL NO. Analyzed the data: OSS NL.
Contributed reagents/materials/analysis tools: OSS NL LØ GK BR JG
HTS NO. Wrote the paper: OSS NL LØ GK BR JG HTS NO. Data
collection and linkages were undertaken by: OSS LØ GK BR JG NO.
References
1. Hall HI, Song R, Rhodes P, Prejean J, An Q, et al. (2008) Estimation of HIVincidence in the United States. JAMA 300: 520–529.
2. Coenen T, Lundgren J, Lazarus JV, Matic S (2008) Optimal HIV testing andearlier care: the way forward in Europe. HIV Med 9 Suppl 2: 1–5.
3. Chadborn TR, Delpech VC, Sabin CA, Sinka K, Evans BG (2006) The latediagnosis and consequent short-term mortality of HIV-infected heterosexuals
(England and Wales, 2000–2004). AIDS 20: 2371–2379.
4. Donnell D, Baeten JM, Kiarie J, Thomas KK, Stevens W, et al. (2010)Heterosexual HIV-1 transmission after initiation of antiretroviral therapy: a
prospective cohort analysis. Lancet 375: 2092–2098.5. Montaner JS, Lima VD, Barrios R, Yip B, Wood E, et al. (2010) Association of
highly active antiretroviral therapy coverage, population viral load, and yearly
new HIV diagnoses in British Columbia, Canada: a population-based study.Lancet 376: 532–539.
6. Quinn TC, Wawer MJ, Sewankambo N, Serwadda D, Li C, et al. (2000) Viralload and heterosexual transmission of human immunodeficiency virus type 1.
Rakai Project Study Group. N Engl J Med 342: 921–929.7. Prevention ECfDCa (2010) HIV testing: increasing uptake and effectiveness in
the European Union.: ECDC.
8. Marks G, Crepaz N, Janssen RS (2006) Estimating sexual transmission of HIVfrom persons aware and unaware that they are infected with the virus in the
USA. AIDS 20: 1447–1450.9. Montaner JS, Hogg R, Wood E, Kerr T, Tyndall M, et al. (2006) The case for
expanding access to highly active antiretroviral therapy to curb the growth of the
HIV epidemic. Lancet 368: 531–536.10. Branson BM, Handsfield HH, Lampe MA, Janssen RS, Taylor AW, et al. (2006)
Revised recommendations for HIV testing of adults, adolescents, and pregnantwomen in health-care settings. MMWR Recomm Rep 55: 1–17; quiz CE11–14.
11. Paltiel AD, Weinstein MC, Kimmel AD, Seage GR, Losina E, et al. (2005)
Expanded screening for HIV in the United States - An analysis of cost-effectiveness. N Engl J Medicine 352: 586–595.
12. Mathers BM, Degenhardt L, Ali H, Wiessing L, Hickman M, et al. (2010) HIVprevention, treatment, and care services for people who inject drugs: a
systematic review of global, regional, and national coverage. Lancet 375:1014–1028.
13. Mounier-Jack S, Nielsen S, Coker RJ (2008) HIV testing strategies across
European countries. HIV Med 9 Suppl 2: 13–19.14. Burns FM, Johnson AM, Nazroo J, Ainsworth J, Anderson J, et al. (2008) Missed
opportunities for earlier HIV diagnosis within primary and secondary healthcaresettings in the UK. AIDS 22: 115–122.
15. Gazzard B, Clumeck N, d’Arminio Monforte A, Lundgren JD (2008) Indicator
disease-guided testing for HIV–the next step for Europe? HIV Med 9 Suppl 2:34–40.
16. Bini EJ, Currie SL, Shen H, Brau N, Schmidt W, et al. (2006) Nationalmulticenter study of HIV testing and HIV seropositivity in patients with chronic
hepatitis C virus infection. J Clin Gastroenterol 40: 732–739.17. Bottieau E, Clerinx J, Van den Enden E, Van Esbroeck M, Colebunders R, et al.
(2006) Infectious mononucleosis-like syndromes in febrile travelers returning
from the tropics. J Travel Med 13: 191–197.18. Klein D, Hurley LB, Merrill D, Quesenberry CP, Jr. (2003) Review of medical
encounters in the 5 years before a diagnosis of HIV-1 infection: implications forearly detection. J Acquir Immune Defic Syndr 32: 143–152.
19. Noskin GA, Glassroth J (1996) Bacterial pneumonia associated with HIV-1
infection. Clin Chest Med 17: 713–723.20. Obel N, Engsig FN, Rasmussen LD, Larsen MV, Omland LH, et al. (2008)
Cohort Profile: The Danish HIV Cohort Study. Int J Epidemiol.21. Pedersen CB, Gotzsche H, Moller JO, Mortensen PB (2006) The Danish Civil
Registration System. A cohort of eight million persons. Danish med bulletin 53:441–449.
22. Nickelsen TN (2001) Data validity and coverage in the Danish National Health
Registry. A literature review. Ugeskrift for laeger 164: 33–37.
23. Olsen JH, Andersen A, Dreyer L, Pukkala E, Tryggvadottir L, et al. (1997)
Summary of avoidable cancers in the Nordic countries. APMIS Suppl 76:
141–146.
24. Richardson DB (2004) An incidence density sampling program for nested case-
control analyses. Occup Environ Med 61: e59.
25. No authors listed (1992) 1993 Revised classification system for HIV infection
and expanded surveillance case definition for AIDS among adolescents and
adults. MMWR Recomm Rep 41: 1–19.
26. Chiao EY, Dezube BJ, Krown SE, Wachsman W, Brock MV, et al. (2010) Time
for oncologists to opt in for routine opt-out HIV testing? JAMA 304: 334–339.
27. Sogaard OS, Lohse N, Gerstoft J, Kronborg G, Ostergaard L, et al. (2008)
Hospitalization for pneumonia among individuals with and without HIV
infection, 1995–2007: a Danish population-based, nationwide cohort study. Clin
Infect Dis 47: 1345–1353.
28. Mazick A, Howitz M, Rex S, Jensen IP, Weis N, et al. (2005) Hepatitis A
outbreak among MSM linked to casual sex and gay saunas in Copenhagen,
Denmark. Euro Surveill 10: 111–114.
29. Lindau ST, Gavrilova N (2010) Sex, health, and years of sexually active life
gained due to good health: evidence from two US population based cross
sectional surveys of ageing. BMJ 340: c810.
30. Paltiel AD, Walensky RP, Schackman BR, Seage GR, Mercincavage LM, et al.
(2006) Expanded HIV screening in the United States: Effect on clinical
outcomes, HIV transmission, and costs. Ann Intern Med 145: 797–806.
31. Sanders GD, Bayoumi AM, Sundaram V, Bilir SP, Neukermans CP, et al.
(2005) Cost-effectiveness of screening for HIV in the era of highly active
antiretroviral therapy. N Engl J Med 352: 570–585.
32. Haukoos JS, Hopkins E, Byyny RL (2008) Patient acceptance of rapid HIV
testing practices in an urban emergency department: assessment of the 2006
CDC recommendations for HIV screening in health care settings. Ann Emerg
Med 51: 303–309, 309 e301.
33. Brown J, Shesser R, Simon G, Bahn M, Czarnogorski M, et al. (2007) Routine
HIV screening in the emergency department using the new US Centers for
Disease Control and Prevention Guidelines: results from a high-prevalence area.
J Acquir Immune Defic Syndr 46: 395–401.
34. Kendrick SR, Kroc KA, Couture E, Weinstein RA (2004) Comparison of point-
of-care rapid HIV testing in three clinical venues. AIDS 18: 2208–2210.
35. Haukoos JS, Hopkins E, Conroy AA, Silverman M, Byyny RL, et al. (2010)
Routine opt-out rapid HIV screening and detection of HIV infection in
emergency department patients. JAMA 304: 284–292.
36. Granich RM, Gilks CF, Dye C, De Cock KM, Williams BG (2009) Universal
voluntary HIV testing with immediate antiretroviral therapy as a strategy for
elimination of HIV transmission: a mathematical model. Lancet 373: 48–57.
37. Kitahata MM, Gange SJ, Abraham AG, Merriman B, Saag MS, et al. (2009)
Effect of Early versus Deferred Antiretroviral Therapy for HIV on Survival.
N Engl J Med.
38. Wood E, Kerr T, Marshall BD, Li K, Zhang R, et al. (2009) Longitudinal
community plasma HIV-1 RNA concentrations and incidence of HIV-1 among
injecting drug users: prospective cohort study. BMJ 338: b1649.
39. de la Fuente L, Delgado J, Hoyos J, Belza MJ, Alvarez J, et al. (2009) Increasing
early diagnosis of HIV through rapid testing in a street outreach program in
Spain. AIDS Patient Care STDS 23: 625–629.
40. Wolfe D, Carrieri MP, Shepard D (2010) Treatment and care for injecting drug
users with HIV infection: a review of barriers and ways forward. Lancet 376:
355–366.
Indicator Diseases for HIV Infection
PLoS ONE | www.plosone.org 8 March 2012 | Volume 7 | Issue 3 | e32538

INTERNATIONAL POLAR YEAR DISPATCHES
Implementation and Effectiveness
of Antiretroviral Therapy in Greenland
Nicolai Lohse,*† Karin Ladefoged,‡ and Niels Obel†1
Analyses from the Danish HIV Cohort Study showed that, despite comparable economic means and general education of healthcare personnel, antiretroviral treatment of HIV in Greenland began later and has been implemented at a slower pace with lower therapeutic effectiveness than in Denmark. However, implementation and quality of care improved considerably in recent years.
Like in Western Europe, the fi rst case of HIV was ob-served in Greenland in the mid-1980s (1), but the
epidemic in this isolated polar country has evolved differ-ently compared with other industrialized countries (2). In a previous study we showed that most patients were infected through heterosexual contact and were middle-aged at the time of diagnosis. Many patients belonged to a socially marginalized group characterized by low income, unem-ployment, and heavy drinking. Even though highly active antiretroviral therapy (HAART) is tax-supported and free, we found an overall mortality rate of 11% per year for pa-tients given HAART during 1997–2003 (2). In a molecular epidemiologic study, we showed that HIV was introduced at least 9 times into Greenland, and that one of these in-troductions has given rise to a circulating epidemic that has included 76% of all infected persons (3). Recently, we found 28% prevalence of transmitted drug resistance, cor-responding well with the impression of low drug adherence and high risk behavior (T.V. Madsen et al., unpub. data). Contributing to the disappointing results could be the vast geography with often long distances to healthcare facilities, the short supply of specialized physicians, and the compo-sition of the HIV-infected population. In 2002 the overall responsibility for treating HIV patients was transferred to the Department of Internal Medicine at Dronning Ingrids Hospital, Greenland’s main hospital, located in the capi-tal, Nuuk. The chief physician at that department takes care of HIV patients in Nuuk and supervises treatment of HIV patients in other areas. With access to data from all HIV-
infected persons in Greenland and Denmark, we aimed to compare the Implementation and effectiveness of HAART during 1997–2007 in 3 areas: Nuuk; Greenland’s remote districts (all towns and settlements except Nuuk); and the Western European country of Denmark, the former colo-nial power with which Greenland still has tight economical, social, and constitutional bonds.
The StudyThe population-based Danish HIV Cohort Study
(DHCS) collects clinical and paraclinical data on all HIV-infected persons under care in Denmark and Greenland since 1995 (2,4), including antiretroviral treatment, HIV RNA (viral load), and date of death or emigration. Patients from DHCS were followed from fi rst visit to an HIV clinic until date of death, emigration, or last visit to the clinic. To estimate viral loads and CD4 cell counts between measure-ments, we carried forward the last observed value. HAART was defi ned as combination antiretroviral treatment with at least 3 drugs, including at least 1 protease inhibitor (PI), or 1 non-nucleoside reverse transcriptase inhibitor (NNRTI), or abacavir. On January 1 for each year of the study we es-timated the proportion of patients receiving HAART, each antiretroviral drug class, and selected antiretroviral drugs. National guidelines in both countries have recommended HAART initiation at a CD4 cell count <300 cells/μL, a threshold that has not changed since 1997. Among patients who had never received HAART, we estimated the pro-portion with a CD4 cell count <300 cells/μL, and among patients who had begun a HAART regimen at least 90 days previously, we estimated the proportion with a viral load <400 copies/mL. Annual mortality rates (MR) in the HIV population were estimated by person-years analysis; Pois-son regression was used to test for trends over time.
ConclusionsAmong 124 HIV patients in Greenland, 98 (79%)
were infected through heterosexual contact, 78 (63%) were male, 111 (90%) were Inuit, and 98 (79%) were infected in Greenland. The median age at diagnosis was 50 years (in-terquartile range [IQR] 40–57 years), and the median CD4 cell count at diagnosis was 350 cells/μL (IQR 220–530 cells/μL). Among 4,702 HIV patients in Denmark, 2,114 (45%) were infected through homosexual contact, 1,745 (37%) through heterosexual contact, and 537 (11%) through intravenous drug use; 3,542 (75%) were male; 3,723 (79%) were Caucasian, and 650 (14%) black African. Half, 2,370,
56 Emerging Infectious Diseases • www.cdc.gov/eid • Vol. 14, No. 1, January 2008
*Århus University Hospital, Århus, Denmark; †Copenhagen Univer-sity Hospital Rigshospitalet, Copenhagen, Denmark; and ‡Dron-ning Ingrids Hospital, Nuuk, Greenland
1The Danish HIV Cohort Study: Departments of Infectious Diseases at Copenhagen University Hospitals Rigshospitalet (J. Gerstoft, N. Obel) and Hvidovre (G. Kronborg), Odense University Hospital (C. Pedersen), Aarhus University Hospitals, Skejby (C.S. Larsen) and Aalborg (G. Pedersen), Herning Hospital (A.L. Laursen), Helsingør Hospital (B. Kvinesdal), and Kolding Hospital (A. Møller).

Antiretroviral Therapy in Greenland
were infected in Denmark, 725 (15%) in Africa, and 1,046 (22%) unknown; the median age at diagnosis was 34 years (IQR 28–42). The median CD4 cell count at diagnosis was 284 cells/μL (IQR 108–490 cells/μL).
In Greenland only 3% had begun HAART on January 1, 1997, as opposed to 28% in Denmark (Figure 1). The proportion on HAART increased gradually up to 81% in 2006, but not until 2003 did the proportion in Greenland reach the level in Denmark. Further, as late as 2001, 96% of all treatment regimens in Greenland included an un-boosted PI (26% in Denmark), and in 2002 only 7% were NNRTI based (40% in Denmark). At that time the Interna-tional AIDS Society USA guidelines carefully encouraged the use of boosted PIs, and NNRTI-based regimens were considered an equally effective alternative to PI-based regi-mens (5). Only after 2002 did the pattern shift, and in 2006 it was similar to that in Denmark, with approximately half of the combinations being NNRTI based, the other half PI based, with ritonavir-boosted lopinavir used in 65% of all PI regimens on January 1. The newer PI atazanavir was used in only 9% of PI regimens in 2006 (28% in Denmark). NNRTI used in Greenland has almost exclusively been efavirenz, whereas in Denmark 24% of NNRTI use on January 1, 2006, was nevirapine. The difference between the curves “ever on HAART” and “currently on HAART” in Figure 1 refl ects the number of persons currently inter-rupting their treatment; the proportion with interruption is higher in Greenland than in Denmark. Structured treatment interruptions have not been recommended in Greenland or Denmark, so these persons supposedly have interrupted their therapy because of compliance problems. There was no difference in the uptake of HAART between Nuuk and the remote districts in Greenland (data not shown).
Until 2002, >30% of patients not yet receiving HAART in Greenland had a CD4 cell count <300 cells/μL (Figure 2). In comparison, the proportion in Denmark has been <30% since 1998, with <5% having a CD4 cell count <200 cells/μL since 2001. Among patients ever starting a HAART regimen, the proportion with suppressed viral load in Greenland was <45% until 2003 but has increased to 73% in 2006 (Figure 2). Nuuk reached the 75% mark in 2004, whereas the increase in the remote districts started later and reached 69% in 2006. The proportions in Den-mark were 62% in 1998, 81% in 2003, and 88% in 2006.
The overall mortality rate among HIV patients in Greenland decreased from 139 (95% confi dence interval [CI] 81–239) per 1,000 person-years in 1995–1997 to 59 (95% CI 35–99) in 2004–2006, corresponding to a 9% de-crease per year (mortality rate ratio [MRR] = 0.91, 95% CI 0.84–0.98, p = 0.014) (Table). The decrease was most marked in patients in Nuuk (MRR = 0.86, 95% CI 0.77–0.96, p = 0.006) and less in the districts (MRR = 0.96, 95% CI 0.86–1.08, p = 0.533).
Treatment of HIV patients in Greenland began at a later stage of disease and has been implemented at a slower pace with lower therapeutic effectiveness than in Denmark, despite comparable economic means, general education of healthcare personnel, and common therapeutic guidelines. From other studies we know that patient support and edu-cation improve adherence (6) and that guideline-recom-mended therapy is more likely to be chosen if the physician is specialized in HIV and has >20 HIV patients in care (7), regardless of whether this physician is a generalist or in-fectious disease specialist. We observed marked improve-ments in the choice of antiretroviral drug combinations and effectiveness of HAART from 2003 onwards. These advances coincided with the establishment of a dedicated
Emerging Infectious Diseases • www.cdc.gov/eid • Vol. 14, No. 1, January 2008 57
Figure 1. Proportion of patients receiving treatment on January 1, 1996–2006 in A) Denmark and B) Greenland. Numerator, patients who were receiving antiretroviral therapy as part of a HAART (highly active antiretroviral therapy) regimen. Denominator, all patients under observation. NNRTI, non-nucleoside reverse transcriptase inhibitor; PI, protease inhibitor.

team in Nuuk and were most pronounced in that city when compared with the remote districts. Even though this tem-poral association does not prove causation, the improve-ments are likely to be partly attributable to the increased focus on HIV in the capital. The MR among HIV patients in Nuuk in recent years was higher than that in Denmark,
but part of this difference may be attributable to a high background mortality rate among HIV-uninfected persons in Greenland (2,8) and an older HIV-infected population. As previously reported, sexually active persons in Green-land undergo frequent HIV testing (2), and CD4 cell counts were high at diagnosis, ruling out late testing as a contribu-tor to the high MR. In conclusion, healthcare systems in the sparsely populated and isolated polar areas may be less fi t to take on state-of-the-art care and treatment for HIV or other diseases previously unknown in the area, and an extra effort from the such providers may be needed to maximize control of the disease.
This study was supported by unrestricted grants from the Greenland Health Science Foundation, the Greenland AIDS Foundation, and the Danish AIDS Foundation. N. Obel has re-ceived research funding from Roche, Bristol-Myers Squibb, Merck Sharp & Dohme, GlaxoSmithKline, Abbott, Boehringer Ingelheim, Janssen-Cilag, and Swedish Orphan.
Dr Lohse is a senior researcher at the Department of Clinical Epidemiology, Århus University Hospital, and the Danish HIV Cohort Study, Copenhagen University Hospital, Rigshospitalet, Denmark. His primary research interests include the clinical epi-demiology of HIV.
References
1. Misfeldt J, Melbye M, Hansen JP. An international meeting on pre-venting AIDS in the polar regions. Ilulissat/Jakobshavn 26–28 Sep-tember 1989 [in Danish]. Ugeskr Laeger. 1989;151:3496.
2. Lohse N, Ladefoged K, Pedersen L, Jensen-Fangel S, Sorensen HT, Obel N. Low effectiveness of highly active antiretroviral therapy and high mortality in the Greenland HIV-infected population. Scand J Infect Dis. 2004;36:738–42.
3. Madsen TV, Leitner T, Lohse N, Obel N, Ladefoged K, Gerstoft J, et al. Introduction of HIV type 1 into an isolated population: molecular epidemiologic study from Greenland. AIDS Res Hum Retroviruses. 2007;23:675–81.
4. Lohse N, Hansen AB, Jensen-Fangel S, Kronborg G, Kvinesdal B, Pedersen C, et al. Demographics of HIV-1 infection in Denmark: results from The Danish HIV Cohort Study. Scand J Infect Dis. 2005;37:338–43.
58 Emerging Infectious Diseases • www.cdc.gov/eid • Vol. 14, No. 1, January 2008
INTERNATIONAL POLAR YEAR DISPATCHES
Figure 2. A). Proportion of patients with low CD4 cell count on January 1, 1996–2006. Numerator, patients with a CD4 cell count <300 cells/μL. Denominator, all patients who had not yet been prescribed a highly active antiretroviral therapy (HAART) regimen. B) Proportion of patients with suppressed viral load on January 1, 1996–2006. Numerator, patients with an HIV RNA <400 copies per mL. Denominator, all patients who had ever started a HAART regimen.
Table. Mortality rate per 1,000 person-years among HIV patients in Greenland and Denmark, 1995–2007* Greenland
Variable All Nuuk Remote districts DenmarkYears 1995–1997 139 (81–239) 178 (89–356) 103 (43–247) 96 (88–105) 1998–2000 82 (47–144) 62 (26–148) 107 (51–225) 29 (25–34) 2001–2003 84 (50–141) 107 (58–199) 54 (20–144) 25 (22–28) 2004–2006 59 (35–99) 43 (19–96) 81 (41–162) 24 (21–28) Mortality rate ratio change per year, 1995–2006
0.91 (0.84–0.98) 0.86 (0.77–0.96) 0.96 (0.86–1.08) 0.82 (0.80–0.84)
p value† 0.014 0.006 0.533 <0.001*Ranges in parentheses are 95% confidence intervals. †Test for trend.

Antiretroviral Therapy in Greenland
5. Yeni PG, Hammer SM, Carpenter CC, Cooper DA, Fischl MA, Gatell JM, et al. Antiretroviral treatment for adult HIV infection in 2002: updated recommendations of the International AIDS Society-USA Panel. JAMA. 2002;288:222–35.
6. Rueda S, Park-Wyllie LY, Bayoumi AM, Tynan AM, Antoniou TA, Rourke SB, et al. Patient support and education for promoting adher-ence to highly active antiretroviral therapy for HIV/AIDS. Cochrane Database Syst Rev. 2006;3:CD001442.
7. Landon BE, Wilson IB, McInnes K, Landrum MB, Hirschhorn LR, Marsden PV, et al. Physician specialization and the quality of care for human immunodefi ciency virus infection. Arch Intern Med. 2005;165:1133–9.
8. Lohse N, Hansen AB, Pedersen G, Kronborg G, Gerstoft J, Sorensen HT, et al. Survival of persons with and without HIV infection in Denmark, 1995–2005. Ann Intern Med. 2007;146:87–95.
Address for correspondence: Nicolai Lohse, Department of Clinical Epidemiology, Århus University Hospital, DK-8000 Århus C, Denmark; email: [email protected]
Emerging Infectious Diseases • www.cdc.gov/eid • Vol. 14, No. 1, January 2008 59
All material published in Emerging Infectious Diseases is in the public domain and may be used and reprinted without special permission; proper citation, however, is required.

Declining risk of triple-class antiretroviral drug failurein Danish HIV-infected individuals
Nicolai Lohsea, Niels Obela, Gitte Kronborgb, Alex Laursenc, Court
Pedersena, Carsten S. Larsend, Birgit Kvinesdale, Henrik Toft
Sørensenf,g and Jan Gerstofth
Objectives: To analyse the incidence, prevalence, and predictors for development oftriple-class antiretroviral drug failure (TCF) in individuals infected with HIV.
Design: Population-based observational cohort study from 1 January 1995 to 31December 2003, focusing on all 2722 recipients of highly active antiretroviral therapy(HAART) in Denmark.
Methods: We used person-years analysis, Kaplan–Meier survival curves and Coxregression analysis. TCF was defined as a minimum of 120 days with viral load> 1000 copies/ml on treatment with each of the three major drug classes.
Results: We observed 177 TCFs, yielding a crude incidence rate (IR) of 1.8 per 100person-years [95% confidence interval (CI), 1.6–2.1]. Seven years after initiation ofHAART, 17.2% (95% CI, 14.5–20.5) of antiretroviral (ART)-experienced patients, butonly 7.0% (95% CI, 4.3–11.2) of ART-naive patients were estimated to have failed. Afteran initial rise, the IR from the third to the sixth year of HAART declined significantly forART-experienced patients [incidence rate ratio (IRR), 0.80 per year (95% CI, 0.66–0.97); P ¼ 0.022], and non-significantly for ART-naive patients [IRR, 0.79 per year(95% CI, 0.53–1.18); P ¼ 0.255]. The IR for all patients being followed each yeardeclined from 1997 to 2003 [IRR, 0.88 (95% CI, 0.81–0.96); P ¼ 0.002]. The pre-valence of TCF remained stable at less than 7% after 2000. Predictors of TCF atcommencement of HAART were a CD4 cell count below 200, a previous AIDS-definingevent, previous antiretroviral exposure, earlier year of HAART initiation, and young age.
Conclusions: The risk of TCF is declining in Denmark and the prevalence remainsstable. � 2005 Lippincott Williams & Wilkins
AIDS 2005, 19:815–822
Keywords: HIV, AIDS, cohort studies, highly active antiretroviral therapy,treatment failure
Introduction
Highly active antiretroviral therapy (HAART) effectivelysuppresses viral load (VL) in individuals infected withHIV [1]. HIV-related morbidity and mortality havedecreased to less than one-fifth since HAART was
introduced in 1996–1997 [2–5]. However, severalcontrolled trials with strict intention-to-treat designshave indicated failure rates of 20–55% during the firstyear of HAART [6–8], but also in observational cohortstudies the number of patients on HAART found to havedetectable VL has been substantial [9,10]. High failure
From the aOdense University Hospital, and University of Southern Denmark, Odense, the bCopenhagen University HospitalHvidovre, Hvidovre, the cAarhus University Hospital Skejby, Aarhus, the dAalborg Hospital, Aalborg, the eHelsingør Hospital,Helsingør, the fDepartment of Clinical Epidemiology, Aarhus University Hospital, Aarhus, Denmark, the gDepartment ofEpidemiology, Boston University, Boston, Massachusetts, USA, and the hCopenhagen University Hospital Rigshospitalet,Denmark.
Correspondence to Nicolai Lohse, Department of Infectious Diseases, Odense University Hospital, Sdr. Boulevard 29, DK-5000Odense C, Denmark.
E-mail: [email protected]
Received: 27 September 2004; revised: 30 January 2005; accepted: 14 February 2005.
ISSN 0269-9370 Q 2005 Lippincott Williams & Wilkins 815

rates are associated both with regimens that have lowefficacy and with poor patient compliance (often due toside effects), resulting in development of drug resistance.A high prevalence of resistance has been documented inthe HIV Cost and Services Utilization Study (HCSUS)[11], and mathematical models predict a 42% prevalenceof resistant virus in San Francisco by 2005 [12].Whenfailure occurs during an initial regimen (recommended toinclude two drug classes), general practice is to include anew drug class in the next regimen [13–16], since full orpartial cross-resistance within a class is the rule. Thuspatients who fail their second or third regimen oftenharbour multi-resistant viruses that are unresponsiveto the three major drug classes: nucleoside reversetranscriptase inhibitors (NRTIs), protease inhibitors (PIs),and non-nucleoside reverse transcriptase inhibitors(NNRTIs) [17,18]. Not all patients with triple classfailure (TCF) experience virological failure andprogressive disease [19]; however the majority of patientswhose disease progresses despite HAART belong to theTCF group and this group is expected to grow in comingyears [20]. It would thus be of interest to analysethe incidence and prevalence of TCF, as the developmentin these parameters over time would give an indication ofthe proportion of patients who experience diseaseprogression despite HAART. Recently the consequencesof TCF have been delineated in a large study of2488 patients with TCF [19], but little is known aboutthe prevalence of TCF. The current study defines TCFaccording to detectable HIV-RNA despite treatment anddoes not include genotypic and phenotypic assays. Weexamine the incidence, prevalence, and predictors forTCF development in a cohort consisting of all DanishHIV-infected patients who received HAART.
Methods
The Danish HIV cohort studyThe Danish HIV Cohort Study (which started as TheHIV Cohort Study inWestern Denmark) is a prospective,population-based cohort study of all HIV-positiveindividuals seen at Danish HIV clinics since 1 January1995. Data collection and processing have been describedin detail elsewhere [21,22]. The Danish health caresystem provides free tax-supported medical care andantiretroviral treatment to HIV-infected individuals.Treatment for HIV infection in Denmark is restrictedto five departments of infectious diseases and fourdepartments of internal medicine with one or moreinfectious disease specialists. The drugs are delivered tothe patients directly from these hospital departments. HIVmedicine cannot be prescribed by general practitioners orbought from Danish pharmacies. Patients treated at allHIV centres in Denmark have been enrolled in thecohort, and complete data on all patients seen in any ofthe centres since 1 January 1995 have been collected from
patient files and entered into the database. As of 1 January2004, the cohort consisted of 3974 patients, 2722 ofwhom received HAART. Use of the Danish 10-digitpersonal identification number enables the centres toavoid multiple registrations of the same patient, and todocument whether patients lost to follow-up have diedor moved outside the country. The database is regularlyupdated with information on prophylactic andantiretroviral treatment, development of opportunisticinfections and other AIDS-defining illnesses, andlaboratory values including VL, CD4 cell count andblood lipids. All patients who began HAART wereeligible for the study. We had information on the datewhen the patient started antiretroviral monotherapy ordual treatment (ART).
DefinitionsThe following definitions were used for the purposes ofthis study.
HAARTAt least three antiretroviral drugs, including at least one PIor NNRTI, or abacavir.
AIDSDefined using the 1993 expanded European AIDS casedefinition, based on the clinical definition of AIDSdeveloped by the US Centers for Disease Control andPrevention [23,24].
Virological failureDefined as a VL of more than 1000 copies/ml/ for a totalof 120 days (not necessarily successive) while receivingtreatment with a given drug class. Periods of treatmentinterruptions, whether doctor or patient initiated, did notcount as time with failure. VL was considered as beingmore than 1000 copies/ml only in time periods betweentwo consecutive viral load measurements above1000 copies/ml. Failure of a drug class could occurwhen it was administered alone or as part of a multi-drugregimen [19].
Time of TCFThe date the patient met the failure requirements forthree drug classes. VL and CD4 cell counts at initiation ofHAARTwere recorded as the last available measurementbefore this date, or the following measurement after thisdate up to 14 (VL) or 90 (CD4) days after.
Unboosted PI-regimenDefined as any antiretroviral regimen that contains one ormore PIs but not ritonavir, or a regimen containingritonavir as the only PI.
Statistical analysisWe calculated time from start of HAART (baseline) totriple-class failure and summarized failure over time.Patients were followed from initiation of HAART, and
816 AIDS 2005, Vol 19 No 8

were censored at death or at last visit to the clinic. Westratified data by calendar period and constructedKaplan–Meier survival curves for each period. The useof a model with left truncation (delayed entry) [25,26]allowed us to estimate long-term, event-free survivalfrom baseline (initiation of HAART), based on data froma short observation period (i.e. observation years 2001–2003). Log rank test was used to test for differencesbetween curves. We estimated TCF incidence rates (IRs)using person-years analysis, stratified according to pre-baseline ART-experience, and either according to timesince HAART initiation or according to calendar time.Point prevalence of TCF was estimated as the proportionof living patients with TCF among all patients receivingHAARTon 1 July each year. Poisson regression was usedto estimate trends in IRs and prevalence. We performedCox’ regression analyses to find predictors for TCF,using time since initiation of HAART as the time scale,and time zero at baseline þ 18 months to ensure a cohorttruly at risk of an event (due to the conditions includedin our event definition). The following four variables:pre-baseline ART-experience; pre-baseline AIDS-defining event; baseline CD4 cell count; and baselineVL were mutually examined for interaction by stratifiedanalysis. Due to hereby observed variation in the riskestimates, the adjusted analysis was stratified into ART-naive and ART-experienced patients, whereas the otherthree variables were kept in the model. The following fivevariables were then entered into the adjusted model ifthey caused a 10% change in the point estimates of theeffect of any of the three variables included in the modelabove: age, gender, mode of infection, race/ethnicity, andyear of HAART initiation. In ART-experienced patientswe additionally tested the variable: time since startingantiretroviral drugs. The proportional hazards assumptionwas checked using Schoenfeld’s residuals [27]. Seventy-three of 177 patients lacked measurement of VL atbaseline. These patients were followed up in the same wayas the other patients from time of initiating HAART, butthey could not count any failure time until their firstmeasured VL, as stated in our definition of failure.Seventy-two of these 73 patients started HAART beforemid-1997. Viral loads were measured a median of 3.98times a year [inter-quartile range (IQR), 3.3–4.7].
Approvals and permissionsThe Danish Data Protection Agency approved theestablishment of the cohort study. The study was notsubject to approval by the ethics committee as thecollection of data did not involve direct patient contact.
Results
Incidence and prevalence of triple-class drugfailureOf the 3974 patients in the cohort, 2722 started HAART,and 1092 were exposed to all three drug classes. We
observed 177 events (TCF) among patients initiatingHAART during a median observation period of 3.7 years(IQR, 1.7–5.4) following treatment initiation, yieldingan incidence rate (IR) of 1.8 per 100 person-years at risk(PYR) [95% confidence interval (CI), 1.6–2.1]. The IRreached a maximum of 2.9 (95% CI, 2.2–3.8) and 3.0(95% CI, 2.2–4.1) per 100 PYR in the third and fourthyear after HAART initiation, thereafter declining to 1.2(95% CI, 0.6–2.5) in the sixth year (Fig. 1) [trend third tosixth year: IRR, 0.84 per year (95% CI, 0.70–1.00);P ¼ 0.047]. For patients exposed to ART beforeHAART, the overall IR was 2.9 per 100 PYR (95%CI, 2.4–3.4), reaching a maximum of 4.6 (95% CI,3.3–6.4) in the fourth year following HAART initiation,declining to 1.4 (95% CI, 0.6–3.2) in the sixth year [trendfrom third to sixth year: IRR, 0.80 per year (95% CI,0.66–0.97); P ¼ 0.022]. For ART-naive patients, theoverall IR was 0.8 per 100 PYR (95% CI, 0.6–1.1). Aftera rise to 1.6 (95% CI, 0.9–2.7) in the third year followingHAART initiation, the IR declined with no significanttrend [third to sixth year: IRR, 0.79 per year (95% CI,0.53–1.18); P ¼ 0.255].
The IR per calendar year, for patients being followed upthat year, peaked in 2000 at 3.7 (95% CI, 2.9–4.8) withdeclines to 1.6 (95% CI, 1.1–2.3) in 2001; 0.7 (95% CI,0.4–1.3) in 2002, and 0.4 (95% CI, 0.2–1.1) in 2003.There was a significant declining trend in the IR from1997 to 2003 [IRR, 0.88 per year (95% CI, 0.81–0.96);P ¼ 0.002].
Sevenyears after baseline, 12.4% (95%CI, 10.4–14.8) of allpatients; 17.3% (95%CI, 14.5–20.5) of ART-experiencedpatients; and 7.0% (95% CI, 4.3–11.2) of ART-naivepatients were estimated to have failed. When theobservations were split into three observation periods
Declining risk of triple-class failure Lohse et al. 817
1
0
1
2
3
4
5
6
7
2 3 4 5
Naïve
All
Experienced
6
Years after starting HAART
Inci
denc
e ra
te o
f TC
F p
er 1
00 P
YR
Fig. 1. Incidence of triple-class drug failure for each yearafter initiation of highly active antiretroviral therapy. Verticallines indicate 95% confidence intervals. HAART, highlyactive antiretroviral therapy; TCF, triple-class antiretroviraldrug failure; PYR, person-years at risk.
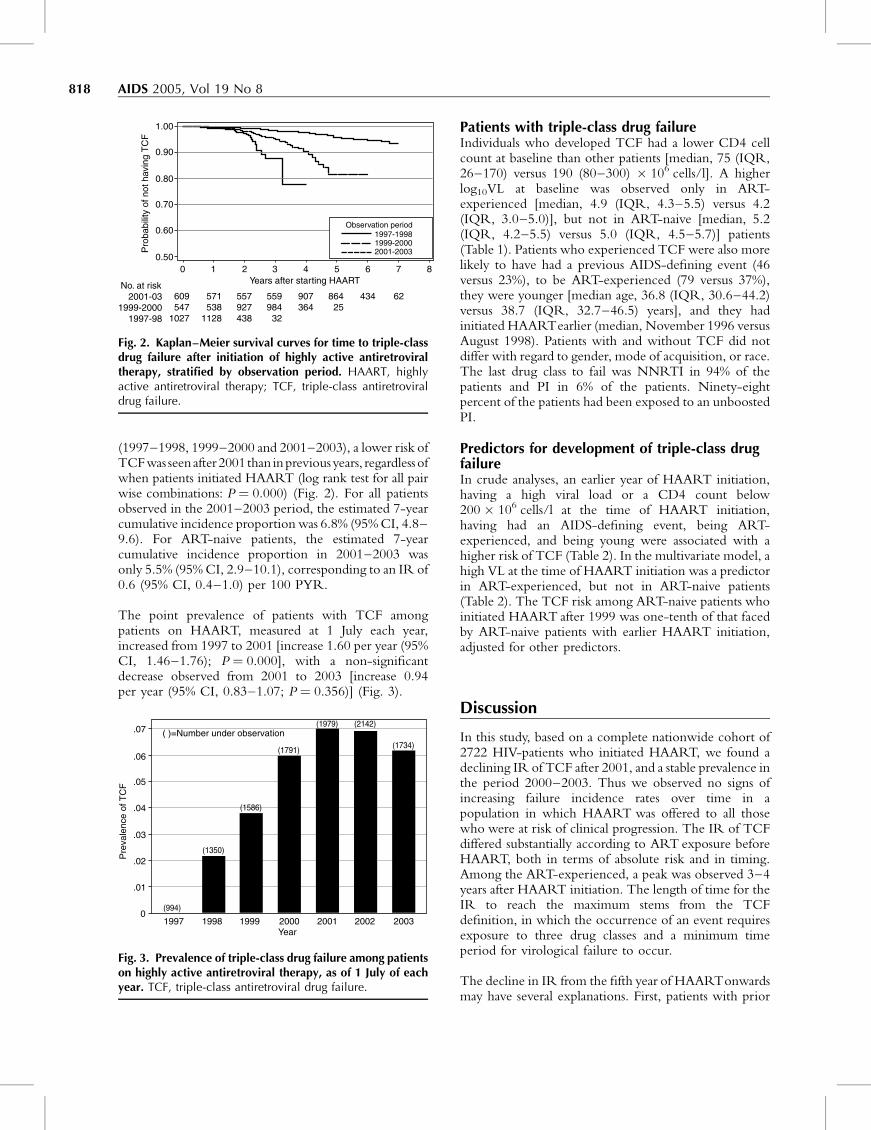
(1997–1998, 1999–2000 and 2001–2003), a lower risk ofTCFwas seenafter 2001 than inpreviousyears, regardlessofwhen patients initiated HAART (log rank test for all pairwise combinations: P ¼ 0.000) (Fig. 2). For all patientsobserved in the 2001–2003 period, the estimated 7-yearcumulative incidence proportion was 6.8% (95%CI, 4.8–9.6). For ART-naive patients, the estimated 7-yearcumulative incidence proportion in 2001–2003 wasonly 5.5% (95%CI, 2.9–10.1), corresponding to an IR of0.6 (95% CI, 0.4–1.0) per 100 PYR.
The point prevalence of patients with TCF amongpatients on HAART, measured at 1 July each year,increased from 1997 to 2001 [increase 1.60 per year (95%CI, 1.46–1.76); P ¼ 0.000], with a non-significantdecrease observed from 2001 to 2003 [increase 0.94per year (95% CI, 0.83–1.07; P ¼ 0.356)] (Fig. 3).
Patients with triple-class drug failureIndividuals who developed TCF had a lower CD4 cellcount at baseline than other patients [median, 75 (IQR,26–170) versus 190 (80–300) � 106 cells/l]. A higherlog10VL at baseline was observed only in ART-experienced [median, 4.9 (IQR, 4.3–5.5) versus 4.2(IQR, 3.0–5.0)], but not in ART-naive [median, 5.2(IQR, 4.2–5.5) versus 5.0 (IQR, 4.5–5.7)] patients(Table 1). Patients who experienced TCF were also morelikely to have had a previous AIDS-defining event (46versus 23%), to be ART-experienced (79 versus 37%),they were younger [median age, 36.8 (IQR, 30.6–44.2)versus 38.7 (IQR, 32.7–46.5) years], and they hadinitiated HAARTearlier (median, November 1996 versusAugust 1998). Patients with and without TCF did notdiffer with regard to gender, mode of acquisition, or race.The last drug class to fail was NNRTI in 94% of thepatients and PI in 6% of the patients. Ninety-eightpercent of the patients had been exposed to an unboostedPI.
Predictors for development of triple-class drugfailureIn crude analyses, an earlier year of HAART initiation,having a high viral load or a CD4 count below200 � 106 cells/l at the time of HAART initiation,having had an AIDS-defining event, being ART-experienced, and being young were associated with ahigher risk of TCF (Table 2). In the multivariate model, ahigh VL at the time of HAART initiation was a predictorin ART-experienced, but not in ART-naive patients(Table 2). The TCF risk among ART-naive patients whoinitiated HAART after 1999 was one-tenth of that facedby ART-naive patients with earlier HAART initiation,adjusted for other predictors.
Discussion
In this study, based on a complete nationwide cohort of2722 HIV-patients who initiated HAART, we found adeclining IR of TCF after 2001, and a stable prevalence inthe period 2000–2003. Thus we observed no signs ofincreasing failure incidence rates over time in apopulation in which HAART was offered to all thosewho were at risk of clinical progression. The IR of TCFdiffered substantially according to ART exposure beforeHAART, both in terms of absolute risk and in timing.Among the ART-experienced, a peak was observed 3–4years after HAART initiation. The length of time for theIR to reach the maximum stems from the TCFdefinition, in which the occurrence of an event requiresexposure to three drug classes and a minimum timeperiod for virological failure to occur.
The decline in IR from the fifth year of HAARTonwardsmay have several explanations. First, patients with prior
818 AIDS 2005, Vol 19 No 8
0
609547
1027
571538
1128
557927438
559984
32
907364
86425
434 62
0.50
0.60
Pro
babi
lity
of n
ot h
avin
g T
CF
0.70
0.80
0.90
1.00
1 2 3 4 5 6 7 8
No. at risk2001-03
1999-20001997-98
Years after starting HAART
1997-19981999-20002001-2003
Observation period
Fig. 2. Kaplan–Meier survival curves for time to triple-classdrug failure after initiation of highly active antiretroviraltherapy, stratified by observation period. HAART, highlyactive antiretroviral therapy; TCF, triple-class antiretroviraldrug failure.
1997 1998
(994)
(1350)
(1586)
(1791)
( )=Number under observation(1979) (2142)
(1734)
1999 2000 2001 2002 20030
.01
.02
.03
.04
Pre
vale
nce
of T
CF .05
.06
.07
Year
Fig. 3. Prevalence of triple-class drug failure among patientson highly active antiretroviral therapy, as of 1 July of eachyear. TCF, triple-class antiretroviral drug failure.
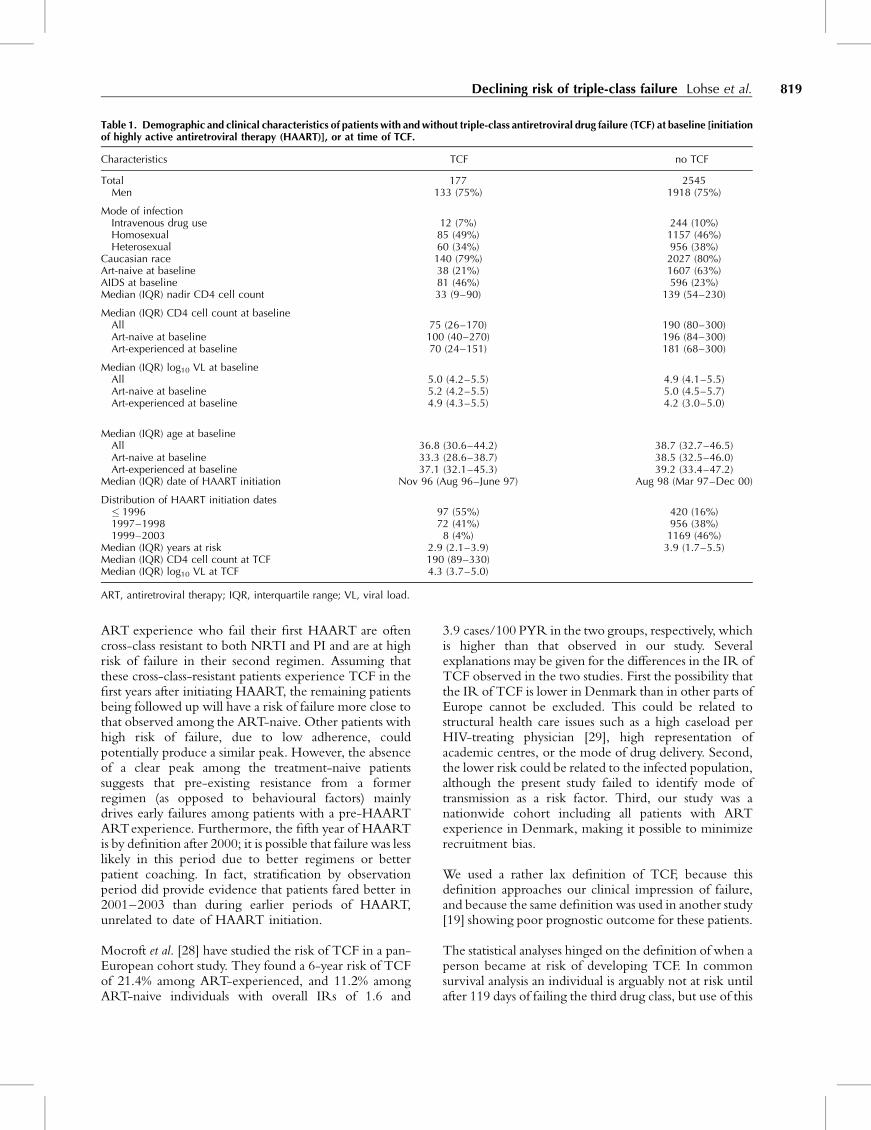
ART experience who fail their first HAART are oftencross-class resistant to both NRTI and PI and are at highrisk of failure in their second regimen. Assuming thatthese cross-class-resistant patients experience TCF in thefirst years after initiating HAART, the remaining patientsbeing followed up will have a risk of failure more close tothat observed among the ART-naive. Other patients withhigh risk of failure, due to low adherence, couldpotentially produce a similar peak. However, the absenceof a clear peak among the treatment-naive patientssuggests that pre-existing resistance from a formerregimen (as opposed to behavioural factors) mainlydrives early failures among patients with a pre-HAARTARTexperience. Furthermore, the fifth year of HAARTis by definition after 2000; it is possible that failure was lesslikely in this period due to better regimens or betterpatient coaching. In fact, stratification by observationperiod did provide evidence that patients fared better in2001–2003 than during earlier periods of HAART,unrelated to date of HAART initiation.
Mocroft et al. [28] have studied the risk of TCF in a pan-European cohort study. They found a 6-year risk of TCFof 21.4% among ART-experienced, and 11.2% amongART-naive individuals with overall IRs of 1.6 and
3.9 cases/100 PYR in the two groups, respectively, whichis higher than that observed in our study. Severalexplanations may be given for the differences in the IR ofTCF observed in the two studies. First the possibility thatthe IR of TCF is lower in Denmark than in other parts ofEurope cannot be excluded. This could be related tostructural health care issues such as a high caseload perHIV-treating physician [29], high representation ofacademic centres, or the mode of drug delivery. Second,the lower risk could be related to the infected population,although the present study failed to identify mode oftransmission as a risk factor. Third, our study was anationwide cohort including all patients with ARTexperience in Denmark, making it possible to minimizerecruitment bias.
We used a rather lax definition of TCF, because thisdefinition approaches our clinical impression of failure,and because the same definition was used in another study[19] showing poor prognostic outcome for these patients.
The statistical analyses hinged on the definition of when aperson became at risk of developing TCF. In commonsurvival analysis an individual is arguably not at risk untilafter 119 days of failing the third drug class, but use of this
Declining risk of triple-class failure Lohse et al. 819
Table 1. Demographic and clinical characteristics of patients with and without triple-class antiretroviral drug failure (TCF) at baseline [initiationof highly active antiretroviral therapy (HAART)], or at time of TCF.
Characteristics TCF no TCF
Total 177 2545Men 133 (75%) 1918 (75%)
Mode of infectionIntravenous drug use 12 (7%) 244 (10%)Homosexual 85 (49%) 1157 (46%)Heterosexual 60 (34%) 956 (38%)
Caucasian race 140 (79%) 2027 (80%)Art-naive at baseline 38 (21%) 1607 (63%)AIDS at baseline 81 (46%) 596 (23%)Median (IQR) nadir CD4 cell count 33 (9–90) 139 (54–230)
Median (IQR) CD4 cell count at baselineAll 75 (26–170) 190 (80–300)Art-naive at baseline 100 (40–270) 196 (84–300)Art-experienced at baseline 70 (24–151) 181 (68–300)
Median (IQR) log10 VL at baselineAll 5.0 (4.2–5.5) 4.9 (4.1–5.5)Art-naive at baseline 5.2 (4.2–5.5) 5.0 (4.5–5.7)Art-experienced at baseline 4.9 (4.3–5.5) 4.2 (3.0–5.0)
Median (IQR) age at baselineAll 36.8 (30.6–44.2) 38.7 (32.7–46.5)Art-naive at baseline 33.3 (28.6–38.7) 38.5 (32.5–46.0)Art-experienced at baseline 37.1 (32.1–45.3) 39.2 (33.4–47.2)
Median (IQR) date of HAART initiation Nov 96 (Aug 96–June 97) Aug 98 (Mar 97–Dec 00)
Distribution of HAART initiation dates� 1996 97 (55%) 420 (16%)1997–1998 72 (41%) 956 (38%)1999–2003 8 (4%) 1169 (46%)
Median (IQR) years at risk 2.9 (2.1–3.9) 3.9 (1.7–5.5)Median (IQR) CD4 cell count at TCF 190 (89–330)Median (IQR) log10 VL at TCF 4.3 (3.7–5.0)
ART, antiretroviral therapy; IQR, interquartile range; VL, viral load.
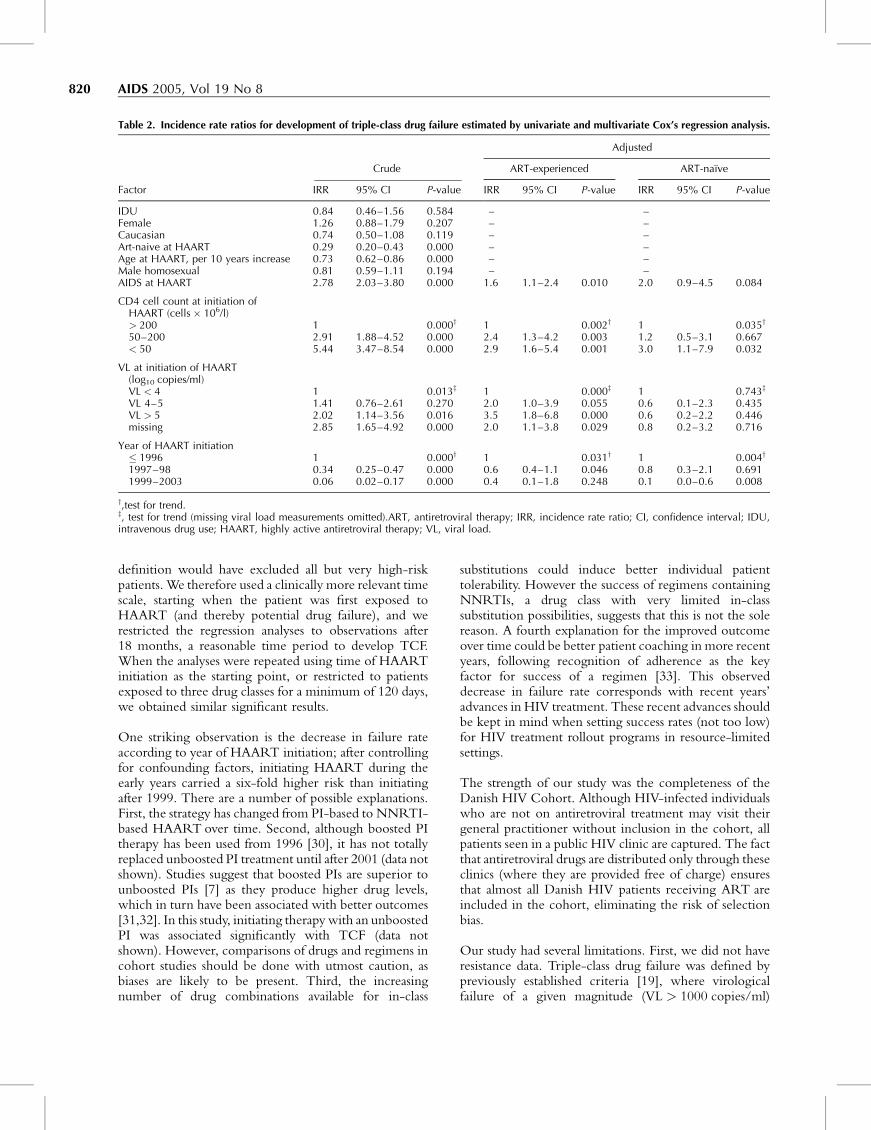
definition would have excluded all but very high-riskpatients. We therefore used a clinically more relevant timescale, starting when the patient was first exposed toHAART (and thereby potential drug failure), and werestricted the regression analyses to observations after18 months, a reasonable time period to develop TCF.When the analyses were repeated using time of HAARTinitiation as the starting point, or restricted to patientsexposed to three drug classes for a minimum of 120 days,we obtained similar significant results.
One striking observation is the decrease in failure rateaccording to year of HAART initiation; after controllingfor confounding factors, initiating HAART during theearly years carried a six-fold higher risk than initiatingafter 1999. There are a number of possible explanations.First, the strategy has changed from PI-based to NNRTI-based HAART over time. Second, although boosted PItherapy has been used from 1996 [30], it has not totallyreplaced unboosted PI treatment until after 2001 (data notshown). Studies suggest that boosted PIs are superior tounboosted PIs [7] as they produce higher drug levels,which in turn have been associated with better outcomes[31,32]. In this study, initiating therapy with an unboostedPI was associated significantly with TCF (data notshown). However, comparisons of drugs and regimens incohort studies should be done with utmost caution, asbiases are likely to be present. Third, the increasingnumber of drug combinations available for in-class
substitutions could induce better individual patienttolerability. However the success of regimens containingNNRTIs, a drug class with very limited in-classsubstitution possibilities, suggests that this is not the solereason. A fourth explanation for the improved outcomeover time could be better patient coaching in more recentyears, following recognition of adherence as the keyfactor for success of a regimen [33]. This observeddecrease in failure rate corresponds with recent years’advances in HIV treatment. These recent advances shouldbe kept in mind when setting success rates (not too low)for HIV treatment rollout programs in resource-limitedsettings.
The strength of our study was the completeness of theDanish HIV Cohort. Although HIV-infected individualswho are not on antiretroviral treatment may visit theirgeneral practitioner without inclusion in the cohort, allpatients seen in a public HIV clinic are captured. The factthat antiretroviral drugs are distributed only through theseclinics (where they are provided free of charge) ensuresthat almost all Danish HIV patients receiving ART areincluded in the cohort, eliminating the risk of selectionbias.
Our study had several limitations. First, we did not haveresistance data. Triple-class drug failure was defined bypreviously established criteria [19], where virologicalfailure of a given magnitude (VL > 1000 copies/ml)
820 AIDS 2005, Vol 19 No 8
Table 2. Incidence rate ratios for development of triple-class drug failure estimated by univariate and multivariate Cox’s regression analysis.
Factor
Crude
Adjusted
IRR 95% CI P-value
ART-experienced ART-naıve
IRR 95% CI P-value IRR 95% CI P-value
IDU 0.84 0.46–1.56 0.584 – –Female 1.26 0.88–1.79 0.207 – –Caucasian 0.74 0.50–1.08 0.119 – –Art-naive at HAART 0.29 0.20–0.43 0.000 – –Age at HAART, per 10 years increase 0.73 0.62–0.86 0.000 – –Male homosexual 0.81 0.59–1.11 0.194 – –AIDS at HAART 2.78 2.03–3.80 0.000 1.6 1.1–2.4 0.010 2.0 0.9–4.5 0.084
CD4 cell count at initiation ofHAART (cells � 106/l)> 200 1 0.000y 1 0.002y 1 0.035y
50–200 2.91 1.88–4.52 0.000 2.4 1.3–4.2 0.003 1.2 0.5–3.1 0.667< 50 5.44 3.47–8.54 0.000 2.9 1.6–5.4 0.001 3.0 1.1–7.9 0.032
VL at initiation of HAART(log10 copies/ml)VL < 4 1 0.013z 1 0.000z 1 0.743z
VL 4–5 1.41 0.76–2.61 0.270 2.0 1.0–3.9 0.055 0.6 0.1–2.3 0.435VL > 5 2.02 1.14–3.56 0.016 3.5 1.8–6.8 0.000 0.6 0.2–2.2 0.446missing 2.85 1.65–4.92 0.000 2.0 1.1–3.8 0.029 0.8 0.2–3.2 0.716
Year of HAART initiation� 1996 1 0.000y 1 0.031y 1 0.004y
1997–98 0.34 0.25–0.47 0.000 0.6 0.4–1.1 0.046 0.8 0.3–2.1 0.6911999–2003 0.06 0.02–0.17 0.000 0.4 0.1–1.8 0.248 0.1 0.0–0.6 0.008
y,test for trend.z, test for trend (missing viral load measurements omitted).ART, antiretroviral therapy; IRR, incidence rate ratio; CI, confidence interval; IDU,intravenous drug use; HAART, highly active antiretroviral therapy; VL, viral load.

during a given time period (120 days) was interpreted as asurrogate marker for drug failure. Resistance does notnecessarily develop to all drugs in a regimen despitefailure [7,34], and resistance might have been developedto all three major drug classes in patients not meeting ourdefinition of TCF. Individuals with TCF did havedifficulty attaining full viral suppression, however, as only19% of viral load measurements after the time of TCFwere below 400 copies/ml; this contrasts with 70% of VLsin other patients in the cohort after HAART initiation.Furthermore another study has revealed a high risk ofdeath among patients with triple class failure [19]. Thuswe do believe that the majority of disease progression-related morbidity and mortality would occur in patientswithin this group, although we cannot exclude that a fewpatients receiving HAART will experience diseaseprogression without fulfilling our criteria for TCF, forexample, due to intolerance to a whole class.
Second, we had no information about patient compli-ance. Some patients may not have taken any of theprescribed drugs, and may have fulfilled our criteriawithout developing drug resistance.
Third, although HIV-RNA assays were initiated in 1995,they only became available for all patients from mid-1997on, and we may have missed some early HAART failures.We did not include failure prior to HAART in theanalyses, but used prior ART experience as anexplanatory variable. NNRTIs were not available inDenmark before 1997 so we were only concerned aboutPI or NRTI failure before 1997. However, 167 of ourTCF-patients failed NNRTI as the last drug class, andanother seven initiated therapy with HAART after mid-1997, leaving only three patients (1.7%) that could havebeen observed with TCF at an earlier date. Had any ofthese been picked up earlier it would only havestrengthened our finding of a declining IR. Of the 40patients who met the criteria for NNRTI-failure, but didnot develop TCF, only seven (0.3% of all non-TCF) hadreceived HAART before mid-1997. The temporaldistribution of these NNRTI failures was similar to thatfor TCFs in general, thus they are unlikely to have biasedour results. Only failure with the three major drug classeswas investigated, as fusion inhibitors have been used in lessthan 15 patients in Denmark. Our study was carried outduring a time when surveillance revealed a yearlyprevalence of transmitted resistance in the countrybetween 0 and 5% [35]. If transmitted resistance increases,the IR of TCF is likely to increase as well. On the otherhand the low level of transmitted resistance could be aconsequence of the low IR of TCF.
In conclusion, we found a declining IR of TCF in theDanish HIV-infected population. Importantly, the studyprovides evidence that high drug pressure on HIV at thepopulation level does not inevitably result in increasingrates of drug failure.
Acknowledgements
Sponsorship: The study was supported by grants fromthe Danish AIDS Foundation; Odense UniversityHospital, Denmark; Preben and Anna Simonsen’sFoundation; The Foundation of the Danish Associationof Pharmacists; Clinical Institute, University of SouthernDenmark.
References
1. Ledergerber B, Egger M, Opravil M, Telenti A, Hirschel B,Battegay M, et al. Clinical progression and virological failureon highly active antiretroviral therapy in HIV-1 patients: aprospective cohort study. Swiss HIV Cohort Study. Lancet1999; 353:863–868.
2. Mocroft A, Ledergerber B, Katlama C, Kirk O, Reiss P,D’Arminio MA, et al. Decline in the AIDS and death ratesin the EuroSIDA study: an observational study. Lancet 2003;362:22–29.
3. Egger M, May M, Chene G, Phillips AN, Ledergerber B, DabisF, et al. Prognosis of HIV-1-infected patients starting highlyactive antiretroviral therapy: a collaborative analysis of pro-spective studies. Lancet 2002; 360:119–129.
4. Jensen-Fangel S, Pedersen L, Pedersen C, Larsen CS, Tauris P,Møller A, et al. Low mortality in HIV-infected patients startingHAART in advance of immunological deterioration: a com-parison with the general population. AIDS 2004; 18:89–97.
5. Mocroft A, Vella S, Benfield TL, Chiesi A, Miller V, GargalianosP, et al. Changing patterns of mortality across Europe inpatients infected with HIV-1. EuroSIDA Study Group. Lancet1998; 352:1725–1730.
6. Gulick RM, Ribaudo HJ, Shikuma CM, Lustgarten S, SquiresKE, Meyer WA III, et al. Triple-nucleoside regimens versusefavirenz-containing regimens for the initial treatment ofHIV-1 infection. N Engl J Med 2004; 350:1850–1861.
7. Walmsley S, Bernstein B, King M, Arribas J, Beall G, Ruane P,et al. Lopinavir-ritonavir versus nelfinavir for the initial treat-ment of HIV infection. N Engl J Med 2002; 346:2039–2046.
8. Bartlett JA, DeMasi R, Quinn J, Moxham C, Rousseau F.Overview of the effectiveness of triple combination therapyin antiretroviral-naive HIV-1 infected adults. AIDS 2001;15:1369–1377.
9. Mocroft A, Devereux H, Kinloch-de-Loes S, Wilson D, MadgeS, Youle M, et al. Immunological, virological and clinicalresponse to highly active antiretroviral therapy treatmentregimens in a complete clinic population. Royal Free Centrefor HIV Medicine. AIDS 2000; 14:1545–1552.
10. Lucas GM, Chaisson RE, Moore RD. Highly active antiretro-viral therapy in a large urban clinic: risk factors for virologicfailure and adverse drug reactions. Ann Intern Med 1999;131:81–87.
11. Richman DD, Bozzette S, Morton S, Chien S, Wrin T, DawsonK and Hellman N. The prevalence of antiretroviral drugresistance in the US. 41st Interscience Conference on Anti-microbial Agents and Chemotherapy 2001 [abstract 324].
12. Blower SM, Aschenbach AN, Gershengorn HB, Kahn JO.Predicting the unpredictable: transmission of drug-resistantHIV. Nat Med 2001; 7:1016–1020.
13. Deeks SG. Treatment of antiretroviral-drug-resistant HIV-1infection. Lancet 2003; 362:2002–2011.
14. Pozniak A, Gazzard B, Anderson J, Babiker A, Churchill D,Collins S, et al. British HIV Association (BHIVA) guidelines forthe treatment of HIV-infected adults with antiretroviral ther-apy. HIV Med 2003; 4(suppl 1):1–41.
15. Anon. European guidelines for the clinical management andtreatment of HIV-infected adults in Europe. AIDS 2003;17(suppl 2):S3–S26.
16. Deeks SG, Hellmann NS, Grant RM, Parkin NT, PetropoulosCJ, Becker M, et al. Novel four-drug salvage treatmentregimens after failure of a human immunodeficiency virustype 1 protease inhibitor-containing regimen: antiviral activ-ity and correlation of baseline phenotypic drug susceptibilitywith virologic outcome. J Infect Dis 1999; 179:1375–1381.
Declining risk of triple-class failure Lohse et al. 821

17. Hammer SM, Vaida F, Bennett KK, Holohan MK, Sheiner L,Eron JJ, et al. Dual vs single protease inhibitor therapy follow-ing antiretroviral treatment failure: a randomized trial. JAMA2002; 288:169–180.
18. Lazzarin A, Clotet B, Cooper D, Reynes J, Arasteh K, Nelson M,et al. Efficacy of enfuvirtide in patients infected with drug-resistant HIV-1 in Europe and Australia. N Engl J Med 2003;348:2186–2195.
19. Ledergerber B, Lundgren JD, Walker AS, Sabin C, Justice A,Reiss P, et al. Predictors of trend in CD4-positive T-cell countand mortality among HIV-1-infected individuals with virolo-gical failure to all three antiretroviral-drug classes. Lancet2004; 364:51–62.
20. LaBonte J, Lebbos J, Kirkpatrick P. Enfuvirtide. Nat Rev DrugDiscov 2003; 2:345–346.
21. Jensen-Fangel S, Pedersen C, Larsen CS, Tauris P, Møller A,Obel N. Changing demographics in an HIV-infectedpopulation: results from an observational cohort studyin Western Denmark. Scand J Infect Dis 2001; 33:765–770.
22. Lohse N, Hansen AB, Jensen-Fangel S, Kronborg G, KvinesdalB, Pedersen C, et al. Demographics of HIV-1 infection inDenmark: Results from The Danish HIV Cohort Study. ScandJ Infect Dis (in press).
23. Castro KG. 1993 Revised Classification System for HIV In-fection and Expanded Surveillance Case Definition for AIDSAmong Adolescents and Adults. MMWR 1992; 41:1–19.
24. Ancelle-Park R, Klein JP, Stroobant A, Smith E, Haikala O,Koch MA, et al. Expanded European AIDS case definition.Lancet 1993; 341:441.
25. Clayton D, Hills M. Statistical Methods in Epidemiology.Oxford: Oxford University Press; 1993.
26. Cleves M, Gould W, Gutierrez RG. An Introduction toSurvival Analysis using STATA. College Station, Texas: StataPress; 2002.
27. Schoenfeld D. Partial residuals for the proportional hazardsregression models. Biometrica 1982; 69:239–241.
28. Mocroft A, Ledergerber B, Viard JP, Staszewski S, Murphy M,Chiesi A, et al. Time to virological failure of 3 classes ofantiretrovirals after initiation of highly active antiretroviraltherapy: results from the EuroSIDA study group. J Infect Dis2004; 190:1947–1956.
29. Kitahata MM, Koepsell TD, Deyo RA, Maxwell CL, Dodge WT,Wagner EH. Physicians’ experience with the acquired immu-nodeficiency syndrome as a factor in patients’ survival. N EnglJ Med 1996; 334:701–706.
30. Kirk O, Katzenstein TL, Gerstoft J, Mathiesen L, Nielsen H,Pedersen C, et al. Combination therapy containing ritonavirplus saquinavir has superior short-term antiretroviral effi-cacy: a randomized trial. AIDS 1999; 13:F9–F16.
31. Burger DM, Hoetelmans RM, Hugen PW, Mulder JW,Meenhorst PL, Koopmans PP, et al. Low plasma concentra-tions of indinavir are related to virological treatment failurein HIV-1-infected patients on indinavir-containing tripletherapy. Antivir Ther 1998; 3:215–220.
32. Durant J, Clevenbergh P, Garraffo R, Halfon P, Icard S, DelGiudice P, et al. Importance of protease inhibitor plasmalevels in HIV-infected patients treated with genotypic-guidedtherapy: pharmacological data from the Viradapt Study. AIDS2000; 14:1333–1339.
33. Dybul M, Fauci AS, Bartlett JG, Kaplan JE, Pau AK. Guidelinesfor using antiretroviral agents among HIV-infected adultsand adolescents. Ann Intern Med 2002; 137 (5 Pt 2):381–433.
34. Roge B, Barfod T, Kirk O, Katzenstein T, Obel N, Nielsen H,et al. Resistance profiles and adherence at primary virologicalfailure in three different highly active antiretroviral therapyregimens: analysis of failure rates in a randomized study. HIVMed 2004; 5:344–351.
35. Jorgensen LB, Christensen MB, Gerstoft J, Mathiesen LR, ObelN, Pedersen C, et al. Prevalence of drug resistance mutationsand non-B subtypes in newly diagnosed HIV-1 patients inDenmark. Scand J Infect Dis 2003; 35:800–807.
822 AIDS 2005, Vol 19 No 8
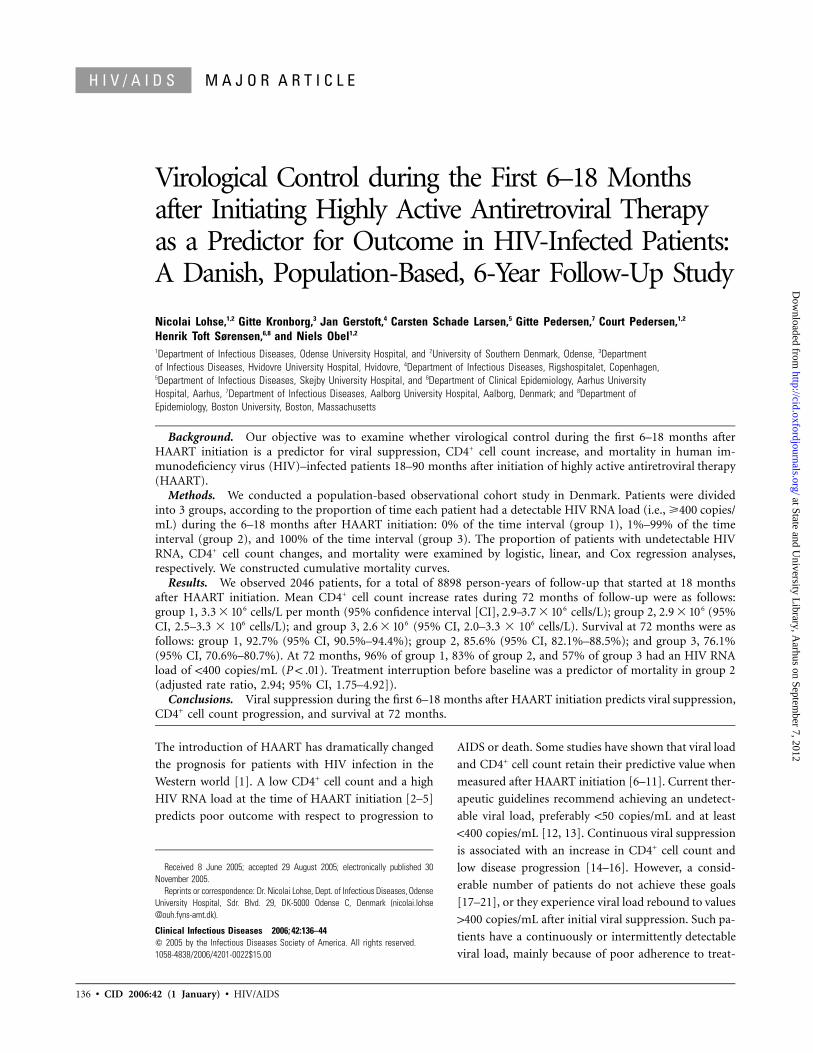
136 • CID 2006:42 (1 January) • HIV/AIDS
H I V / A I D S M A J O R A R T I C L E
Virological Control during the First 6–18 Monthsafter Initiating Highly Active Antiretroviral Therapyas a Predictor for Outcome in HIV-Infected Patients:A Danish, Population-Based, 6-Year Follow-Up Study
Nicolai Lohse,1,2 Gitte Kronborg,3 Jan Gerstoft,4 Carsten Schade Larsen,5 Gitte Pedersen,7 Court Pedersen,1,2
Henrik Toft Sørensen,6,8 and Niels Obel1,2
1Department of Infectious Diseases, Odense University Hospital, and 2University of Southern Denmark, Odense, 3Departmentof Infectious Diseases, Hvidovre University Hospital, Hvidovre, 4Department of Infectious Diseases, Rigshospitalet, Copenhagen,5Department of Infectious Diseases, Skejby University Hospital, and 6Department of Clinical Epidemiology, Aarhus UniversityHospital, Aarhus, 7Department of Infectious Diseases, Aalborg University Hospital, Aalborg, Denmark; and 8Department ofEpidemiology, Boston University, Boston, Massachusetts
Background. Our objective was to examine whether virological control during the first 6–18 months afterHAART initiation is a predictor for viral suppression, CD4+ cell count increase, and mortality in human im-munodeficiency virus (HIV)–infected patients 18–90 months after initiation of highly active antiretroviral therapy(HAART).
Methods. We conducted a population-based observational cohort study in Denmark. Patients were dividedinto 3 groups, according to the proportion of time each patient had a detectable HIV RNA load (i.e., �400 copies/mL) during the 6–18 months after HAART initiation: 0% of the time interval (group 1), 1%–99% of the timeinterval (group 2), and 100% of the time interval (group 3). The proportion of patients with undetectable HIVRNA, CD4+ cell count changes, and mortality were examined by logistic, linear, and Cox regression analyses,respectively. We constructed cumulative mortality curves.
Results. We observed 2046 patients, for a total of 8898 person-years of follow-up that started at 18 monthsafter HAART initiation. Mean CD4+ cell count increase rates during 72 months of follow-up were as follows:group 1, cells/L per month (95% confidence interval [CI], cells/L); group 2, (95%6 6 63.3 � 10 2.9–3.7 � 10 2.9 � 10CI, 2.5–3.3 � 106 cells/L); and group 3, (95% CI, 2.0–3.3 � 106 cells/L). Survival at 72 months were as62.6 � 10follows: group 1, 92.7% (95% CI, 90.5%–94.4%); group 2, 85.6% (95% CI, 82.1%–88.5%); and group 3, 76.1%(95% CI, 70.6%–80.7%). At 72 months, 96% of group 1, 83% of group 2, and 57% of group 3 had an HIV RNAload of !400 copies/mL ( ). Treatment interruption before baseline was a predictor of mortality in group 2P ! .01(adjusted rate ratio, 2.94; 95% CI, 1.75–4.92]).
Conclusions. Viral suppression during the first 6–18 months after HAART initiation predicts viral suppression,CD4+ cell count progression, and survival at 72 months.
The introduction of HAART has dramatically changed
the prognosis for patients with HIV infection in the
Western world [1]. A low CD4+ cell count and a high
HIV RNA load at the time of HAART initiation [2–5]
predicts poor outcome with respect to progression to
Received 8 June 2005; accepted 29 August 2005; electronically published 30November 2005.
Reprints or correspondence: Dr. Nicolai Lohse, Dept. of Infectious Diseases, OdenseUniversity Hospital, Sdr. Blvd. 29, DK-5000 Odense C, Denmark ([email protected]).
Clinical Infectious Diseases 2006; 42:136–44� 2005 by the Infectious Diseases Society of America. All rights reserved.1058-4838/2006/4201-0022$15.00
AIDS or death. Some studies have shown that viral load
and CD4+ cell count retain their predictive value when
measured after HAART initiation [6–11]. Current ther-
apeutic guidelines recommend achieving an undetect-
able viral load, preferably !50 copies/mL and at least
!400 copies/mL [12, 13]. Continuous viral suppression
is associated with an increase in CD4+ cell count and
low disease progression [14–16]. However, a consid-
erable number of patients do not achieve these goals
[17–21], or they experience viral load rebound to values
1400 copies/mL after initial viral suppression. Such pa-
tients have a continuously or intermittently detectable
viral load, mainly because of poor adherence to treat-
at State and University L
ibrary, Aarhus on Septem
ber 7, 2012http://cid.oxfordjournals.org/
Dow
nloaded from

HIV/AIDS • CID 2006:42 (1 January) • 137
ment [22, 23]. Previous prognostic studies have focused pri-
marily on the first 6 months after HAART initiation as the
“prognostic period” [24], but analysis of this period is often
hampered by episodes of acute toxicity and changes in regimen,
and viral load does not reach its nadir until the end of the
period. After receiving HAART for 6 months, a patient’s viral
load should remain undetectable; in addition, episodes of acute
toxicity should have passed, or the regimen should have been
adjusted. At this time, although long-term toxicities have not
emerged yet, HAART recipients have probably entered a period
that is representative for the remaining lifelong treatment pe-
riod. Our aim was to examine whether virological control dur-
ing the first year of this period (6–18 months after HAART
initiation) is a predictor for viral suppression, CD4+ cell in-
crease, and mortality in HIV-infected patients 18–90 months
after HAART initiation in a nation-wide, population-based co-
hort with complete follow-up, and to study the impact of base-
line characteristics on these outcomes.
SUBJECTS AND METHODS
The Danish HIV Cohort Study
The Danish HIV Cohort Study is a prospective, nation-wide,
population-based cohort study of all HIV-infected individuals
treated in Danish HIV clinics since 1 January 1995. Study meth-
ods have been described in detail elsewhere [25, 26]. Treatment
for HIV infection in Denmark is restricted to 8 specialized
treatment centers. The Danish health care system provides free,
tax-supported medical care for all residents, including antiret-
roviral treatment for HIV-infected individuals. As of 1 March
2005, 4084 adult patients were enrolled in the study. The cohort
study is ongoing, with continuous enrollment of both newly
diagnosed HIV-infected individuals and individuals with HIV
infection who move into the country. Use of the Danish 10-
digit personal identification number enables treatment centers
to avoid multiple registrations of the same patient and allows
tracking of deaths and losses to follow-up due to emigration.
Updates are performed annually.
Study Population
Eligible for the study were patients who initiated HAART before
1 January 2002, had at least 1 viral load measurement within
6 months after HAART initiation, and were alive at 18 months
after HAART initiation. Patients not known to have died and
not seen in the clinic since 1 January 2004 were considered to
be lost to follow-up.
Antiretroviral Therapy
HAART was defined as combination antiretroviral treatment
with at least 3 drugs, including 1 protease inhibitor (PI), or 1
nonnucleoside reverse transcriptase inhibitor (NNRTI), or aba-
cavir. Patients classified as “naive” had been unexposed to an-
tiretroviral treatment as of 2 weeks before HAART initiation.
Treatment Interruption
Treatment interruption was defined as a period of at least 2
weeks in which the patient was not taking antiretroviral drugs,
after receiving HAART for the first time.
CD4+ Cell Count and Viral Load Measurements
To determine CD4+ cell counts at time points between mea-
surements, the last measured value was carried forward. To
model viral load values at time points between measurements,
each measured value was carried forward for 30 days or until
the next measurement, whichever came first. The measured
viral load was extrapolated back to 30 days after the previous
measurement. A viral load was considered to be detectable at
a value of at least 400 copies/mL. We used this model because
a (high) viral load measured at a visit to the health care clinic
often leads to revision of the antiretroviral treatment regimens
and, therefore, subsequent changes in viral load.
Prognostic Groups
We calculated the proportion of time that each patient had a
detectable viral load during the 1-year period extending from
6 to 18 months after HAART initiation. For analysis purposes,
on the basis of this proportion, patients were divided into 3
subgroups: group 1 had detectable HIV RNA for 0% of the
time interval, group 2 had detectable HIV RNA for 1%–99%
of the time interval, and group 3 had detectable HIV RNA for
100% of the time interval. For some analyses, patients were
divided into 6 “detectable viral load” subgroups: 0% (group
1), 1%–25% (group 2A), 26%–50% (group 2B), 51%–75%
(group 2C), 76%–99% (group 2D), and 100% (group 3).
Statistical Analyses
Viral load. The prevalence of patients with an undetectable
viral load was calculated at baseline (18 months after HAART
initiation) and every 18 months thereafter. Ratios between
groups calculated at 72 months were analyzed using a logistic
regression model.
CD4+ cell count. CD4+ cell count increases were computed
for each of 4 consecutive 18-month periods after baseline and
for the whole 72-month period. Individual increases were cal-
culated for all patients observed throughout each period. Dif-
ferences in mean CD4+ cell increases between groups were ex-
amined using a linear regression model.
Mortality. We computed the amount of time from baseline
to death or end of follow-up and constructed cumulative mor-
tality curves. Patients were censored at the time of their last
clinic visit. We performed Cox proportional hazards regression
at State and University L
ibrary, Aarhus on Septem
ber 7, 2012http://cid.oxfordjournals.org/
Dow
nloaded from

138 • CID 2006:42 (1 January) • HIV/AIDS
Table 1. Number of patients who underwent follow-up at differentperiods after baseline, by patient group.
Variable, by observation period
No. of patients, by group
TotalGroup 1 Group 2 Group 3
0–18 months after baseline
Underwent observation at thebeginning of the period 1173 546 327 2046
Censored 61 19 10 90
Died 19 28 25 72
Total observed during the period 1093 499 292 1884
18–36 months after baseline
Censored 275 56 16 347
Died 20 24 23 67
Total observed during the period 798 419 253 1470
36–54 months after baseline
Censored 235 77 35 347
Died 11 12 14 37
Total observed during the period 552 330 204 1086
54–72 months after baseline
Censored 312 143 80 535
Died 9 5 8 22
Total observed during the period 231 182 116 529
NOTE. Baseline was 18 months after HAART initiation.
analyses to estimate mortality rate ratios (MRRs) and to adjust
for covariates.
Model building. Variables entered into the regression mod-
els included patient group, injection drug use as the mode of
infection, hepatitis C antibody status, antiretroviral exposure
preceding HAART initiation, having an AIDS diagnosis before
HAART initiation, CD4+ cell count at HAART initiation (used
in Cox and logistic models) or at the beginning of each period
(used in the linear model), white race, sex, age at HAART
initiation, initiation of HAART before 1 January 1999, and
known treatment interruption before baseline. Using the pa-
tient group as the predictor variable, all other variables causing
a 10% change in the risk estimates were entered into the re-
gression models one by one [27]. Because of variation in the
risk estimates, patients with a known treatment interruption
were analyzed separately in the Cox model.
Prediction of survival with undetectable viral load.
To predict the chance of being alive with an undetectable viral
load at 72 months after baseline, cumulative survival and con-
fidence intervals were multiplied by the proportion of patients
with an undetectable viral load at that time.
RESULTS
Study population. There were 2404 patients who had initiated
HAART before 1 January 2002. The cumulative survival at 18
months after HAART initiation was 94.5% (95% CI, 93.5%–
95.3%). There were 2046 patients who met the inclusion criteria
at 18 months (baseline). Of the 358 patients who did not meet
the inclusion criteria, 132 patients died before baseline, and 45
patients could not be observed for a full 18 months. Of these
45 patients, 28 left the country, and 17 had initiated HAART
!18 months before their most recent clinic visit. An additional
181 patients who started HAART were excluded because their
first viral load measurement occurred 16 months after HAART
initiation. Of these 181 patients, 131 initiated HAART before
mid-1997, when viral load measurements became routine for
all patients. Of the 2046 patients, 1173 had undetectable viral
loads throughout the whole period extending from 6 to 18
months after initiating HAART (group 1), 546 had detectable
viral loads part of the time (group 2), and 327 had detectable
viral loads throughout the whole period (group 3). The 2046
patients were observed for a total of 8898 person-years after
baseline. Sixty-seven patients (3.2%) were lost to follow-up.
Five hundred twenty-nine patients remained under observation
at 72 months after baseline: 231, 182, and 116 patients from
groups 1, 2, and 3, respectively (table 1). During the prediction
period, 6–18 months after HAART initiation, viral loads were
measured a median of 4 times for all groups, and the mean
number of viral load measurements were as follows: 3.8 mea-
surements, group 1; 4.3 measurements, group 2A; 4.2 mea-
surements, group 2B; 4.2 measurements, group 2C; 4.0 mea-
surements, group 2D; and 3.7 measurements, group 3. Patient
characteristics are shown in table 2. The groups differed with
respect to several characteristics, including CD4+ cell count at
HAART initiation, injection drug use as the mode of infection,
hepatitis C antibody status, having previous antiretroviral ex-
posure at HAART initiation, having an AIDS diagnosis at
HAART initiation, and date of HAART initiation.
Prevalence of patients with undetectable viral load.
The final adjusted logistic regression model included no vari-
ables other than “patient group.” At 72 months after baseline,
96% of patients in group 1 (95% CI, 93%–98%), 83% of group
2 (95% CI, 78%–89%), and 57% of group 3 (95% CI, 47%–
66%) had an undetectable viral load ( for individualP ! .01
group comparisons). Figure 1 shows the prevalence of patients
with an undetectable viral load (i.e., !400 copies/mL) com-
mencing from baseline.
Progression of CD4+ cell counts. The final adjusted linear
regression model for CD4+ cell count increase included CD4+
cell count at the beginning of each period. The mean CD4+
cell count increased significantly for 4 consecutive 18-month
periods in all groups. The crude mean CD4+ cell count increase
during the 72-month period after baseline was cells/63.3 � 10
L per month (95% CI, 2.9–3.7 � 106 cells/L per month) for
group 1, cells/L per month (95% CI, 2.5–3.3 � 10662.9 � 10
cells/L per month) for group 2, and cells/L per month62.6 � 10
(95% CI, 2.0–3.3 � 106 cells/L per month) for group 3 (table
3). The difference between groups in this 72-month period was
significant in the adjusted model ( for individual groupP ! .01
at State and University L
ibrary, Aarhus on Septem
ber 7, 2012http://cid.oxfordjournals.org/
Dow
nloaded from
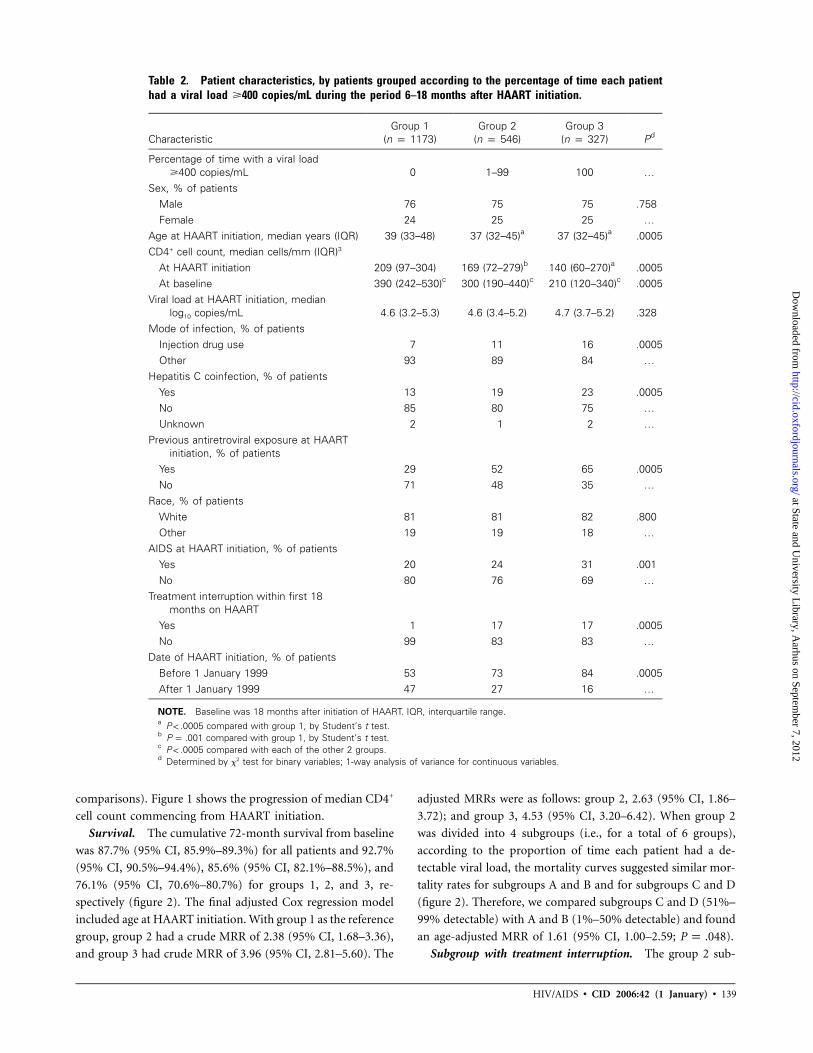
HIV/AIDS • CID 2006:42 (1 January) • 139
Table 2. Patient characteristics, by patients grouped according to the percentage of time each patienthad a viral load �400 copies/mL during the period 6–18 months after HAART initiation.
CharacteristicGroup 1
(n p 1173)Group 2
(n p 546)Group 3
(n p 327) Pd
Percentage of time with a viral load�400 copies/mL 0 1–99 100 …
Sex, % of patientsMale 76 75 75 .758Female 24 25 25 …
Age at HAART initiation, median years (IQR) 39 (33–48) 37 (32–45)a 37 (32–45)a .0005CD4+ cell count, median cells/mm (IQR)3
At HAART initiation 209 (97–304) 169 (72–279)b 140 (60–270)a .0005At baseline 390 (242–530)c 300 (190–440)c 210 (120–340)c .0005
Viral load at HAART initiation, medianlog10 copies/mL 4.6 (3.2–5.3) 4.6 (3.4–5.2) 4.7 (3.7–5.2) .328
Mode of infection, % of patientsInjection drug use 7 11 16 .0005Other 93 89 84 …
Hepatitis C coinfection, % of patientsYes 13 19 23 .0005No 85 80 75 …Unknown 2 1 2 …
Previous antiretroviral exposure at HAARTinitiation, % of patients
Yes 29 52 65 .0005No 71 48 35 …
Race, % of patientsWhite 81 81 82 .800Other 19 19 18 …
AIDS at HAART initiation, % of patientsYes 20 24 31 .001No 80 76 69 …
Treatment interruption within first 18months on HAART
Yes 1 17 17 .0005No 99 83 83 …
Date of HAART initiation, % of patientsBefore 1 January 1999 53 73 84 .0005After 1 January 1999 47 27 16 …
NOTE. Baseline was 18 months after initiation of HAART. IQR, interquartile range.a compared with group 1, by Student’s t test.P ! .0005b compared with group 1, by Student’s t test.P p .001c compared with each of the other 2 groups.P ! .0005d Determined by x2 test for binary variables; 1-way analysis of variance for continuous variables.
comparisons). Figure 1 shows the progression of median CD4+
cell count commencing from HAART initiation.
Survival. The cumulative 72-month survival from baseline
was 87.7% (95% CI, 85.9%–89.3%) for all patients and 92.7%
(95% CI, 90.5%–94.4%), 85.6% (95% CI, 82.1%–88.5%), and
76.1% (95% CI, 70.6%–80.7%) for groups 1, 2, and 3, re-
spectively (figure 2). The final adjusted Cox regression model
included age at HAART initiation. With group 1 as the reference
group, group 2 had a crude MRR of 2.38 (95% CI, 1.68–3.36),
and group 3 had crude MRR of 3.96 (95% CI, 2.81–5.60). The
adjusted MRRs were as follows: group 2, 2.63 (95% CI, 1.86–
3.72); and group 3, 4.53 (95% CI, 3.20–6.42). When group 2
was divided into 4 subgroups (i.e., for a total of 6 groups),
according to the proportion of time each patient had a de-
tectable viral load, the mortality curves suggested similar mor-
tality rates for subgroups A and B and for subgroups C and D
(figure 2). Therefore, we compared subgroups C and D (51%–
99% detectable) with A and B (1%–50% detectable) and found
an age-adjusted MRR of 1.61 (95% CI, 1.00–2.59; ).P p .048
Subgroup with treatment interruption. The group 2 sub-
at State and University L
ibrary, Aarhus on Septem
ber 7, 2012http://cid.oxfordjournals.org/
Dow
nloaded from
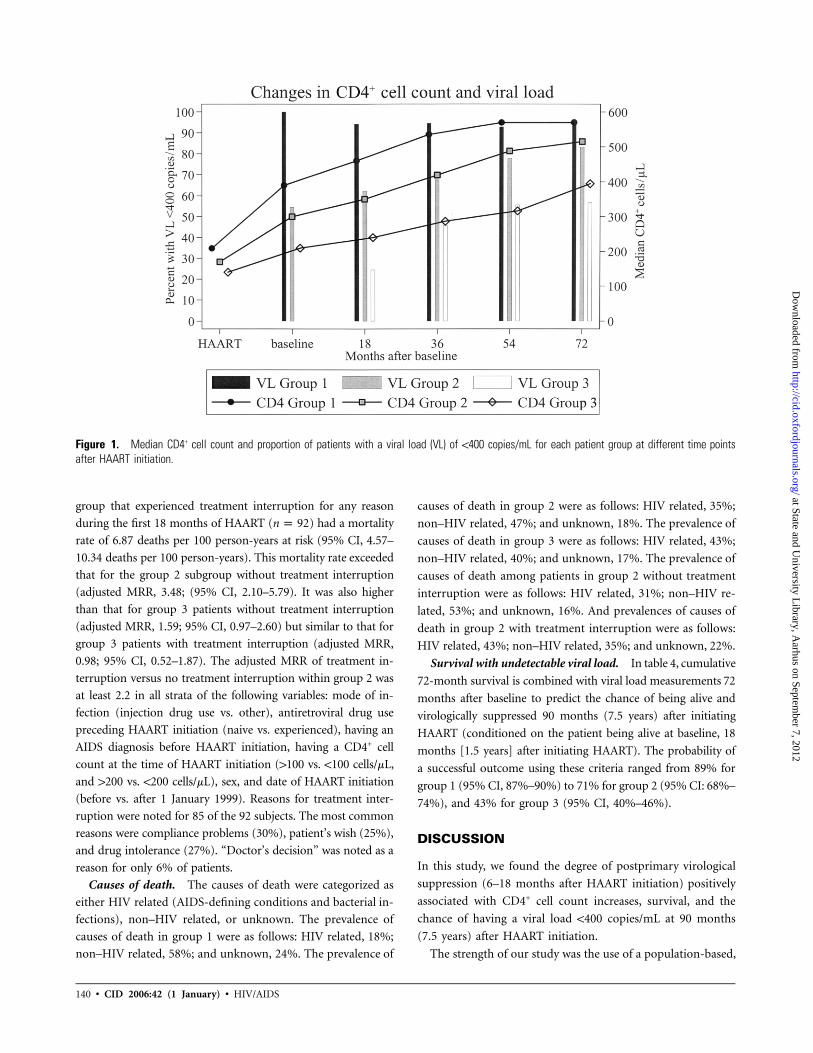
140 • CID 2006:42 (1 January) • HIV/AIDS
Figure 1. Median CD4+ cell count and proportion of patients with a viral load (VL) of !400 copies/mL for each patient group at different time pointsafter HAART initiation.
group that experienced treatment interruption for any reason
during the first 18 months of HAART ( ) had a mortalityn p 92
rate of 6.87 deaths per 100 person-years at risk (95% CI, 4.57–
10.34 deaths per 100 person-years). This mortality rate exceeded
that for the group 2 subgroup without treatment interruption
(adjusted MRR, 3.48; (95% CI, 2.10–5.79). It was also higher
than that for group 3 patients without treatment interruption
(adjusted MRR, 1.59; 95% CI, 0.97–2.60) but similar to that for
group 3 patients with treatment interruption (adjusted MRR,
0.98; 95% CI, 0.52–1.87). The adjusted MRR of treatment in-
terruption versus no treatment interruption within group 2 was
at least 2.2 in all strata of the following variables: mode of in-
fection (injection drug use vs. other), antiretroviral drug use
preceding HAART initiation (naive vs. experienced), having an
AIDS diagnosis before HAART initiation, having a CD4+ cell
count at the time of HAART initiation (1100 vs. !100 cells/mL,
and 1200 vs. !200 cells/mL), sex, and date of HAART initiation
(before vs. after 1 January 1999). Reasons for treatment inter-
ruption were noted for 85 of the 92 subjects. The most common
reasons were compliance problems (30%), patient’s wish (25%),
and drug intolerance (27%). “Doctor’s decision” was noted as a
reason for only 6% of patients.
Causes of death. The causes of death were categorized as
either HIV related (AIDS-defining conditions and bacterial in-
fections), non–HIV related, or unknown. The prevalence of
causes of death in group 1 were as follows: HIV related, 18%;
non–HIV related, 58%; and unknown, 24%. The prevalence of
causes of death in group 2 were as follows: HIV related, 35%;
non–HIV related, 47%; and unknown, 18%. The prevalence of
causes of death in group 3 were as follows: HIV related, 43%;
non–HIV related, 40%; and unknown, 17%. The prevalence of
causes of death among patients in group 2 without treatment
interruption were as follows: HIV related, 31%; non–HIV re-
lated, 53%; and unknown, 16%. And prevalences of causes of
death in group 2 with treatment interruption were as follows:
HIV related, 43%; non–HIV related, 35%; and unknown, 22%.
Survival with undetectable viral load. In table 4, cumulative
72-month survival is combined with viral load measurements 72
months after baseline to predict the chance of being alive and
virologically suppressed 90 months (7.5 years) after initiating
HAART (conditioned on the patient being alive at baseline, 18
months [1.5 years] after initiating HAART). The probability of
a successful outcome using these criteria ranged from 89% for
group 1 (95% CI, 87%–90%) to 71% for group 2 (95% CI: 68%–
74%), and 43% for group 3 (95% CI, 40%–46%).
DISCUSSION
In this study, we found the degree of postprimary virological
suppression (6–18 months after HAART initiation) positively
associated with CD4+ cell count increases, survival, and the
chance of having a viral load !400 copies/mL at 90 months
(7.5 years) after HAART initiation.
The strength of our study was the use of a population-based,
at State and University L
ibrary, Aarhus on Septem
ber 7, 2012http://cid.oxfordjournals.org/
Dow
nloaded from

HIV/AIDS • CID 2006:42 (1 January) • 141
Table 3. Univariate and multivariate linear regression analysis of CD4+ cell count increases after baseline.
Group variable, by time period
Crude Adjusted
Value 95% CI P Value 95% CI P
0–18 months after baselineMean CD4+ increase per
month, cells � 106/LGroup 1 (constant) 4.7 4.1–5.2) !.01a 8.4 7.6 to 9.3 !.01a
Group 2 (added to group 1) �1.8 �2.7 to �0.8 !.01 �2.5 �3.4 to �1.6 !.01Group 3 (added to group 1) �3.7 �4.8 to �2.6 !.01 �5.2 �6.3 to �4.1 !.01
CD4+ cell count at baseline … … … �0.0089 �0.0105 to �0.0073 !.0118–36 months after baseline
Mean CD4+ increase permonth, cells � 106/L
Group 1 (constant) 3.3 2.7–3.9 .27a 7.0 5.8 to 8.1 !.01a
Group 2 (added to group 1) 0.0 �1.1 to 1.0 .96 �0.8 �1.9 to 0.3 .13Group 3 (added to group 1) �0.8 �2.1 to 0.4) .20 �2.5 �3.8 to �1.2 !.01
CD4+ cell count at 18 months … … … �0.0071 �0.0090 to �0.0052 !.0136–54 months after baseline
Mean CD4+ increase permonth, cells � 106/L
Group 1 (constant) 2.3 1.6–3.1 .46a 5.7 4.3 to 7.1 .23a
Group 2 (added to group 1) 1.0 �0.2 to 2.2 .11 0.3 �0.9 to 1.6 .60Group 3 (added to group 1) 0.2 �1.2 to 1.7 .76 �1.2 �2.7 to 0.3 .11
CD4+ cell count at 36 months … … … �0.0059 �0.0079 to �0.0038 !.0154–72 months after baseline
Mean CD4+ increase permonth, cells � 106/L
Group 1 (constant) 2.5 1.4–3.7 .32a 7.2 5.3 to 9.0 .01a
Group 2 (added to group 1) �1.7 �3.4 to �0.1 .04 �2.3 �4.0 to �0.7 .01Group 3 (added to group 1) �0.6 �2.5 to 1.3 .53 �2.1 �4.0 to �0.1 .04
CD4+ cell count at 54 months … … … �0.0079 �0.0106 to �0.0053 !.010–72 months after baseline
Mean CD4+ increase permonth, cells � 106/L
Group 1 (constant) 3.3 2.9–3.7 .04a 4.2 3.6 to 4.8 !.01a
Group 2 (added to group 1) �0.4 �1.0 to 0.2 .16 �0.6 �1.2 to 0.0 .04Group 3 (added to group 1) �0.7 �1.3 to 0.0 .05 �1.0 �1.7 to �0.3 !.01
CD4+ cell count at baseline … … … �0.0024 �0.0036 to �0.0012 !.01
NOTE. Baseline was 18 months after HAART initiation. Baseline value is expressed as �106 cells/L. For example, duringthe 52–72-month period after baseline, univariate analysis reveals that a patient in group 2 has an expected increase of
cells/L ( cells/L). If the CD4+ cell count at 54 months is cells/L, multivariate analysis6 6 6 60.8 � 10 2.5� 10 cells/L� 1.7 � 10 400� 10shows that the expected increase per month is cells/L ([ ]).6 6 61.74 � 10 7.2� 10 cells/L� 2.3 � 10 cells/L] + [400� �0.0079
a Test for trend.
nationwide cohort and the large number of patients who were
observed for at least 72 months after baseline. Few patients
were lost to follow-up, and most of the viral load data were
entered electronically into the database. The study recorded
planned treatment interruptions as well as patient-reported
noncompliance, both obtained from the medical chart. Al-
though the algorithm for modelling viral load between mea-
surements may be questioned, we obtained similar results when
we reanalyzed data by carrying forward the previous viral load
measurement. Therefore, we believe that measurement bias is
likely to be small and that such bias could be in either direction.
Of 2404 patients who had initiated HAART, 181 patients
were excluded because their first viral load measurement oc-
curred 16 months after HAART initiation. These 181 patients
had a cumulative 72-month survival from baseline of 91% (95%
CI, 85%–94%), which is similar to survival for patients included
in the study. The potential selection bias introduced by the
exclusion of this patient group is minor and could be in both
directions. Not all patients were observed for the whole study
period. Thus, the observed increase in CD4+ cell counts over
time from baseline could be caused by patients with a decreas-
ing CD4+ cell count ending follow-up early. However, only a
at State and University L
ibrary, Aarhus on Septem
ber 7, 2012http://cid.oxfordjournals.org/
Dow
nloaded from

142 • CID 2006:42 (1 January) • HIV/AIDS
Figure 2. Mortality curves after baseline (i.e., 18 months after HAART initiation), stratified by 6 patient subgroups with viral loads that were detectablefor 0% (group 1), 1%–25% (group 2A), 26%–50% (group 2B), 51%–75% (group 2C), 76%–99% (group 2D), and 100% (group 3) of the 6–18 months afterHAART initiation.
Table 4. Survival and viral suppression 72 months after baseline, by patient group.
Patientgroup
Cumulative survival from0 to 72 months after
baseline, % (95% CI)a
Percentage of patients witha viral load of !400 copies/mL
72 months after baseline
Percentage of patients aliveand with a viral load of
!400 copies/mL 72 monthsafter baseline (95% CI)b
1 93 (90–94) 96 89 (87–90)2 86 (82–89) 83 71 (68–74)3 76 (71–81) 57 43 (40–46)
NOTE. Baseline is 18 months after HAART initiation.a Kaplan-Meier survival estimates.b 95% CI estimated as [95% CI for survival] * [percentage undetectable at 72 months].
few patients died, few were lost to follow-up, and there was an
even distribution over time of patients who were censored be-
cause they reached the end of their observation period. Fur-
thermore, we analyzed individual CD4+ cell count changes
rather than computed means at different time points. There-
fore, we believe that the observed CD4+ cell count increases
reflect an actual improvement in immunological status.
A treatment interruption during the first 18 months of
HAART was a strong predictor of death in patients with partial
virological suppression. Treatment interruption could be as-
sociated with other risk factors for death, such as end-stage
AIDS, drug toxicities, or non–HIV-associated conditions re-
lated to poor adherence. However, the excess mortality ob-
served in patients who had an episode of treatment interruption
before baseline remained constant throughout the 6-year period
after baseline, making it unlikely that the excess could be ex-
plained by end-stage AIDS or drug toxicities at the time of
treatment interruption. A smaller proportion of patients died
of non–HIV-related causes of death in the subgroup with treat-
ment interruption than in the subgroup without treatment in-
terruption, suggesting that non–HIV-associated conditions
were not responsible for the excess mortality. Treatment inter-
ruptions were not advocated in Denmark during the study
period, and, therefore, comparison with the outcomes of trials
examining the effect of physician-guided structured treatment
interruption [28] should be performed with caution.
Episodes of low-level viremia after full virological suppres-
sion have been associated with higher levels of viral replication,
at State and University L
ibrary, Aarhus on Septem
ber 7, 2012http://cid.oxfordjournals.org/
Dow
nloaded from

HIV/AIDS • CID 2006:42 (1 January) • 143
drug resistance, impaired CD4+ cell count increases, and higher
risk of subsequent sustained viral rebound [29–31], but other
studies have used a number of different cutoff levels to define
viremia, and the results have not been consistent. A recent study
has shown that transient viremia in the range 50–200 copies/
mL is due to random variation in the HIV RNA load around
a steady state below this level [32], but, in another study, math-
ematical modelling has shown that these episodes are not evenly
distributed among patients [33]. Our findings are in accordance
with Easterbrook et al. [30], indicating strong clinical and par-
aclinical implications following even a short period of having
an HIV RNA load of 1400 copies/mL.
To our knowledge, this is the first study to take into account
all available viral load measurements during a predetermined
period to assess the prognostic value of intermittent viremia.
Interestingly, we found that any degree of viremia involving a
vial load of �400 copies/mL (groups 2A–D) was associated
with higher mortality, compared with full virological suppres-
sion (group 1). The poor prognosis can be the result of a
number of reasons. First, it could be associated with a drug-
resistant virus emerging during the initial viremic period. Sec-
ond, it could be associated with less strict virological targets in
patients with competing comorbidity. Third, and what we be-
lieve is most likely, viremia and treatment interruption could
be markers of poor adherence and even markers of non–HIV-
related risk factors for death.
In conclusion, achieving an undetectable viral load is the pri-
mary treatment goal in daily clinical practice. Our study indicates
that patients experiencing �1 viral load measurements 1400 cop-
ies/mL are at considerably higher risk of clinical progression than
are patients with fully suppressed virus. Additional studies are
needed to explore the underlying causes of this treatment failure.
Physicians should be aware of the even worse prognosis for these
patients following a treatment interruption and should focus on
improving adherence by means of intensive patient coaching,
individualizing drug regimens, and treatment of underlying com-
orbidity to avoid these interruptions.
Acknowledgments
Financial support. The Danish AIDS Foundation; Odense UniversityHospital (Odense, Denmark); Preben and Anna Simonsen’s Foundation;The Foundation of the Danish Association of Pharmacists; and ClinicalInstitute, University of Southern Denmark.
Potential conflicts of interest. N.O. has received unrestricted researchgrants from GlaxoSmithKline, Roche, Abbott, Merck Sharp & Dohme, andBoehringer Ingelheim. All other authors: no conflicts.
References
1. Mocroft A, Katlama C, Johnson AM, et al. AIDS across Europe,1994–98: the EuroSIDA Study. Lancet 2000; 356:291–6.
2. Mocroft A, Kirk O, Barton SE, et al. Anaemia is an independent pre-dictive marker for clinical prognosis in HIV-infected patients fromacross Europe. EuroSIDA Study Group. AIDS 1999; 13:943–50.
3. Egger M, May M, Chene G, et al. Prognosis of HIV-1-infected patientsstarting highly active antiretroviral therapy: a collaborative analysis ofprospective studies. Lancet 2002; 360:119–29.
4. Palella Jr FJ, Chmiel JS, Moorman AC, Holmberg SD. Durability andpredictors of success of highly active antiretroviral therapy for am-bulatory HIV-infected patients. AIDS 2002; 16:1617–26.
5. Jensen-Fangel S, Pedersen L, Pedersen C, et al. Low Mortality in HIV-infected patients starting HAART in advance of immunological dete-rioration: a comparison with the general population. AIDS 2004; 18:89–97.
6. Chene G, Sterne JA, May M, et al. Prognostic importance of initialresponse in HIV-1 infected patients starting potent antiretroviral ther-apy: analysis of prospective studies. Lancet 2003; 362:679–86.
7. Ormaasen V, Bruun JN, Sandvik L, Holberg-Petersen M, Gaarder PI.Prognostic value of changes in CD4 count and HIV RNA during thefirst six months on highly active antiretroviral therapy in chronic hu-man immunodeficiency virus infection. Scand J Infect Dis 2003; 35:383–8.
8. Anastos K, Barron Y, Cohen MH, et al. The prognostic importance ofchanges in CD4+ cell count and HIV-1 RNA level in women afterinitiating highly active antiretroviral therapy. Ann Intern Med 2004;140:256–64.
9. Lundgren JD, Mocroft A, Gatell JM, et al. A clinically prognostic scoringsystem for patients receiving highly active antiretroviral therapy: resultsfrom the EuroSIDA Study. J Infect Dis 2002; 185:178–87.
10. Perneger TV, Abrahamowicz M, Bartlett G, Yerly S. Time-dependenceof survival predictions based on markers of HIV disease. Swiss HIVCohort Study. J Investig Med 2000; 48:207–12.
11. Miller V, Phillips AN, Clotet B, et al. Association of virus load, CD4cell count, and treatment with clinical progression in human immu-nodeficiency virus–infected patients with very low CD4 cell counts. JInfect Dis 2002; 186:189–97.
12. Pozniak A, Gazzard B, Anderson J, et al. British HIV Association(BHIVA) guidelines for the treatment of HIV-infected adults with an-tiretroviral therapy. HIV Med 2003; 4(Suppl 1):1–41.
13. European guidelines for the clinical management and treatment ofHIV-infected adults in Europe. AIDS 2003; 17(Suppl 2):S3–26.
14. Hunt PW, Deeks SG, Rodriguez B, et al. Continued CD4 cell countincreases in HIV-infected adults experiencing 4 years of viral sup-pression on antiretroviral therapy. AIDS 2003; 17:1907–15.
15. Gulick RM, Meibohm A, Havlir D, et al. Six-year follow-up of HIV-1-infected adults in a clinical trial of antiretroviral therapy with in-dinavir, zidovudine, and lamivudine. AIDS 2003; 17:2345–9.
16. Viard JP, Burgard M, Hubert JB, et al. Impact of 5 years of maximallysuccessful highly active antiretroviral therapy on CD4 cell count andHIV-1 DNA level. AIDS 2004; 18:45–9.
17. Gulick RM, Ribaudo HJ, Shikuma CM, et al. Triple-nucleoside regi-mens versus efavirenz-containing regimens for the initial treatment ofHIV-1 infection. N Engl J Med 2004; 350:1850–61.
18. Walmsley S, Bernstein B, King M, et al. Lopinavir-ritonavir versusnelfinavir for the initial treatment of HIV infection. N Engl J Med2002; 346:2039–46.
19. Bartlett JA, DeMasi R, Quinn J, Moxham C, Rousseau F. Overview ofthe effectiveness of triple combination therapy in antiretroviral-naiveHIV-1 infected adults. AIDS 2001; 15:1369–77.
20. Mocroft A, Devereux H, Kinloch-de-Loes S, et al. Immunological,virological, and clinical response to highly active antiretroviral therapytreatment regimens in a complete clinic population. Royal Free Centrefor HIV Medicine. AIDS 2000; 14:1545–52.
21. Lucas GM, Chaisson RE, Moore RD. Highly active antiretroviral ther-apy in a large urban clinic: risk factors for virologic failure and adversedrug reactions. Ann Intern Med 1999; 131:81–7.
22. Dybul M, Fauci AS, Bartlett JG, Kaplan JE, Pau AK. Guidelines forusing antiretroviral agents among HIV-infected adults and adolescents.Ann Intern Med 2002; 137:381–433.
23. Sethi AK, Celentano DD, Gange SJ, Moore RD, Gallant JE. Association
at State and University L
ibrary, Aarhus on Septem
ber 7, 2012http://cid.oxfordjournals.org/
Dow
nloaded from

144 • CID 2006:42 (1 January) • HIV/AIDS
between adherence to antiretroviral therapy and human immunode-ficiency virus drug resistance. Clin Infect Dis 2003; 37:1112–8.
24. Egger M, Chene G, Sterne JA, et al. Prognostic importance of initialresponse in HIV-1 infected patients starting potent antiretroviral ther-apy: analysis of prospective studies. Lancet 2003; 362:679–86.
25. Jensen-Fangel S, Pedersen C, Larsen CS, Tauris P, Møller A, Obel N.Changing demographics in an HIV-infected population: results froman observational cohort study in Western Denmark. Scand J Infect Dis2001; 33:765–70.
26. Lohse N, Hansen AB, Jensen-Fangel S, et al. Demographics of HIV-1infection in Denmark: results from The Danish HIV Cohort Study.Scand J Infect Dis 2005; 37:338–43.
27. Greenland S. Modeling and variable selection in epidemiologic analysis.Am J Public Health 1989; 79:340–9.
28. The SMART Study. Available at: http://www.smart-trial.org. Accessed14 November 2005.
29. Havlir DV, Bassett R, Levitan D, et al. Prevalence and predictive valueof intermittent viremia with combination hiv therapy. JAMA 2001;286:171–9.
30. Easterbrook PJ, Ives N, Waters A, et al. The natural history and clinicalsignificance of intermittent viraemia in patients with initial viral sup-pression to !400 copies/mL. AIDS 2002; 16:1521–7.
31. Cohen Stuart JW, Wensing AM, Kovacs C, et al. Transient relapses(“blips”) of plasma HIV RNA levels during HAART are associated withdrug resistance. J Acquir Immune Defic Syndr 2001; 28:105–13.
32. Nettles RE, Kieffer TL, Kwon P, et al. Intermittent HIV-1 viremia (blips)and drug resistance in patients receiving HAART. JAMA 2005; 293:817–29.
33. Percus JK, Percus OE, Markowitz M, Ho DD, Di Mascio M, PerelsonAS. The distribution of viral blips observed in HIV-1 infected patientstreated with combination antiretroviral therapy. Bull Math Biol2003; 65:263–77.
at State and University L
ibrary, Aarhus on Septem
ber 7, 2012http://cid.oxfordjournals.org/
Dow
nloaded from
©2009 International Medical Press 1359-6535 (print) 2040-2058 (online) 995
Antiviral Therapy 2009 14: 995–1000 (doi: 10.3851/IMP1412)
Background: Newer antiretroviral treatment regimens for HIV carry a lower risk of inducing drug resistance muta-tions. We estimated changes in incidence rates (IRs) of new mutations in HIV-infected individuals receiving highly active antiretroviral therapy (HAART).Methods: Population-based data were obtained from the Danish HIV Cohort Study and the Danish HIV Sequence Database. We included treatment-naive patients initiat-ing HAART after December 1997 and computed time to first drug resistance mutation, identified as new muta-tions detected within 1 year after a 60-day period of treatment failure (HIV RNA>1,000 copies/ml). We esti-mated annual IRs of new resistance mutations towards nucleoside reverse transcriptase inhibitors (NRTIs), non-NRTIs (NNRTIs) and protease inhibitors (PI), and of new specific resistance mutations.
Results: A total of 1,829 individuals were observed for 7,294 person-years at risk (PYR). The IR of NRTI resist-ance decreased from 13.1 per 1,000 PYR (95% confi-dence interval [CI] 4.9–35.0) in 1999 to 3.7 (1.9–7.2) in 2004– 2005 (test for trend P=0.024). The IR of NNRTI resistance decreased from 15.4 (2.2–109.6) in 1999 to 7.9 (4.6–13.6) in 2004–2005 (P=0.077). The IR of PI resistance decreased from 7.5 (1.4–21.8) in 1999 to 2.9 (0.7–11.4) in 2002–2003 (P=0.148). The IRs were low for specific resistance mutations, except for M184V (IR 5.6 [4.0–7.9]) and K103N (IR 8.2 [5.6–12.0]).Conclusions: The incidence of acquired drug resistance has decreased among HIV-infected patients treated with HAART in Denmark during 1999–2005.
The presence of antiretroviral drug resistance mutations in individuals infected with HIV might hamper the effec-tiveness of antiretroviral treatment (ART) because the mutations reduce the chances of full viral suppression. The increasing use of ART in both high- and low-income settings could lead to an increase in incidence and preva-lence of drug resistance. By contrast, newer highly active antiretroviral therapy (HAART) regimens for HIV treat-ment carry a lower risk of inducing drug resistance than older regimens [1]. Some studies have shown increasing prevalence of drug resistance in treatment-experienced populations [2–4], but there are recent reports from areas with high treatment coverage of decreasing prevalence of both resistance mutations [5,6], and of individuals who could potentially transmit drug resistance [7]. Whether
the decreasing prevalence is accompanied by a similar trend in population-based incidence has not been shown. With access to all HIV RNA (viral load [VL]) measure-ments, genotypic drug resistance test results and treat-ment history in a nationwide population-based cohort of individuals with HIV type-1 (HIV-1), this study aimed to estimate changes over time in the incidence of anti-retroviral drug resistance mutations among ART-naive patients initiating HAART.
Methods
Data sourcesThe Danish HIV Cohort Study (DHCS) is a prospec-tive, nationwide, population-based cohort study of all
Original article
The incidence rate of HIV type-1 drug resistance in patients on antiretroviral therapy: a nationwide population-based Danish cohort study 1999–2005
Anne Margrethe Audelin1*, Nicolai Lohse2,3, Niels Obel3,4, Jan Gerstoft4 and Louise Bruun Jørgensen1
1Department of Virology, Statens Serum Institut, Copenhagen, Denmark2Department of Clinical Epidemiology, Århus University Hospital, Århus, Denmark3The Danish HIV Cohort Study, Copenhagen University Hospital, Rigshospitalet, Copenhagen, Denmark4Department of Infectious Diseases, Copenhagen University Hospital, Rigshospitalet, Copenhagen, Denmark
*Corresponding author: e-mail: [email protected]
Introduction
AVT-09-OA-1150_Audelin.indd 995 30/10/09 15:18:50

©2009 International Medical Press996
AM Audelin et al.
HIV-1-infected individuals treated in Danish HIV clinics since 1 January 1995 [8]. The study cohort is ongoing with continuous enrolment. The study data are updated annually and include details such as demographics, treatment information and measurements of VL and CD4+ T-cell counts. Data are collected from patient files and entered into the database annually. As anti-retroviral medication is administered exclusively from nine departments of infectious diseases in Denmark, the database contains all patients on treatment.
The Danish HIV Sequence Database (DHSD) is a prospective, nationwide, population-based database of all genotypic resistance tests performed in Denmark after 31 December 1999. Genotypic resistance tests in the DHSD are performed on the initiative of the treat-ing physician, mainly in patients with virological fail-ure. Data from the DHCS are linked to the sequences in the DHSD by an identification number unique to each patient. No information was available on the patients’ genotypic resistance profile prior to drug initiation.
Study populationAll ART-naive patients in the DHCS initiating HAART after 31 December 1997 and who had more than one HIV RNA (VL) measurement were included in the study.
Antiretroviral therapyHAART was defined as a regimen of at least three antiretroviral drugs consisting of two nucleoside reverse transcriptase inhibitors (NRTIs) in combina-tion with either a non-NRTI (NNRTI), a protease inhibitor (PI) or abacavir, or in the absence of NRTIs, a combination of boosted lopinavir and efavirenz. The Danish national guidelines for initiating HAART have remained largely unchanged since 1997. Treatment ini-tiation is recommended for patients with CD4+ T-cell counts <300 cells/µl, acute or symptomatic infection or pregnancy [9]. A VL>100,000 copies/ml was an indication for treatment initiation only until 2001.
Virological failureVirological failure was defined as VL>1,000 copies/ml for a minimum of 60 days, while receiving treatment with a given drug class. Accordingly, periods with VL>1,000 copies/ml during a treatment interruption did not count as time with virological failure. VL was considered to be >1,000 copies/ml only during time periods between two consecutive VL measurements >1,000 copies/ml. The cut-off value of 1,000 copies/ml corresponds with the official guidelines of the ViroSeqTM Genotyping System version 2 by Abbott Diagnostics (Foster City, CA, USA).
Genotypic drug resistanceThe sequences containing the reverse transcriptase and the protease gene collected for the DHSD were
obtained through sequencing using the ViroSeqTM HIV-1 Genotyping System version 2 (Abbott Diagnos-tics). All sequences were analysed for the International AIDS Society (IAS)–USA 2007 primary drug resistance mutations [10] and only these mutations were included in the actual analysis.
Date of drug resistance acquisitionIn accordance with the main purpose of the study – to look at incidence trends over time and not crude rates of resistance development – we applied strict criteria to define the date of drug resistance acquisition. This increased the specificity and minimized misclassifica-tion with regards to time of resistance development. We were aware that this could lead to an underesti-mation of the crude rate of resistance development. For each class of drugs, we linked the date when the first genotypic resistance mutation was detected to the most recent virological failure during treatment with the given class of drugs. If the virological failure had occurred no earlier than 365 days before the date of the detected genotypic resistance, the event date (date of drug resistance acquisition) was defined as day 30 (out of 60) with VL>1,000 copies/ml. Using this defini-tion, the resistance mutations detected (for example, in the year 2000) could have a corresponding event date in 1999. If no virological failure had occurred during the 365 days before the first detected resistance muta-tion, the date of acquisition could not be defined and no event was registered. We only used the first performed genotypic resistance test after a virological failure. The 365-day period was increased to 730 days in a sensi-tivity analysis. Another sensitivity analysis defined the date of drug resistance acquisition as the day of resist-ance testing, dismissing the requirement of previous virological failure; thus, allowing us to use all available resistance test results.
Risk timeTime at risk for acquiring a mutation conferring resistance towards a drug class was defined as the cumulative time a patient was treated with a HAART regimen including at least one drug from that drug class. We computed time at risk from either the start of the HAART or 31 December 1998, whichever came last, until the first event (date of drug resistance acquisition), death, emigration or 31 December 2005. A patient could change from one risk set to another as he changed treatment regimen.
Incidence ratesIncidence rates (IRs) of acquiring drug resistance mutations were stratified according to calendar peri-ods and were estimated in three ways: as the IR of the first new mutation within a drug class, as the IR of any
AVT-09-OA-1150_Audelin.indd 996 30/10/09 15:18:50

Incidence rate of HIV-1 drug resistance mutations
Antiviral Therapy 14.7 997
new mutation within a drug class and as the IR of each specific mutation. For the second estimate, we counted all new resistance mutations within each drug class; thus, a person with more than one mutation within a drug class could have multiple events that all counted towards calculation of the IR. Trends over calendar time were analysed by Poisson regression. We used Stata statistical software version 9.2 (College Station, TX, USA) for all analyses.
Results
Patient characteristicsA total of 1,829 treatment-naive patients (1,275 men and 554 women) initiated HAART after 31 Decem-ber 1997 and had >1 VL measurement. The median CD4+ T-cell count at the time of HAART initiation was 239 cells/µl (interquartile range [IQR] 119–350) and the median log10 VL was 4.0 copies/ml (IQR 2.6– 5.1). Median follow-up time after HAART initiation was 3.8 years (IQR 1.7–5.7). A total of 317 individuals experienced virological failure while on treatment. During the 60 days of VL>1,000 defining failure, 316 had received NRTIs, 174 had received NNRTIs and 186 had received PIs. Of all the 1,829 study patients, 247 had at least one genotypic resistance test result. Of these 247 patients, 123 had no foregoing virologi-cal failure within the defined time frame, leaving 124 patients with a resistance test after a virological failure. Of these, only 74 patients (23% of the 317 patients with virological failure) had a test within the required 365 days. VL at time of resistance testing did not change in the study period (data not shown).
Incidence rates of first new drug resistance mutations within a drug classOf the 1,751 individuals exposed to NRTIs, 35 acquired at least one new drug resistance mutation to this drug class during 1999–2005, yielding an IR of 5.9 per 1,000 person-years at risk (PYR; 95% confi-dence interval [CI] 4.3–8.3; Table 1). The IR decreased significantly throughout the study period from 13.1 per 1,000 PYR (95% CI 4.9–35.0) in 1999 to 3.7 per 1,000 PYR (95% CI 1.9–7.2) in 2004–2005 (test for trend P=0.024; Table 1). Of the 1,428 patients exposed to NNRTIs, 35 acquired at least one new NNRTI resistance mutation, yielding an overall IR of 10.6 per 1,000 PYR (95% CI 7.6–14.8). The IR decreased from 15.4 per 1,000 PYR (95% CI 2.2– 109.6) in 1999 to 7.9 per 1,000 PYR (95% CI 4.6–13.6) in 2004–2005 (test for trend P=0.077). Of the 982 individu-als exposed to PI, only 5 acquired at least one new primary (according to the IAS–USA [10]) PI resist-ance mutation during the study period. The overall IR of PI resistance was 2.0 per 1,000 PYR (95% CI
0.8–4.8) and decreased non-significantly from 7.5 per 1,000 PYR (95% CI 1.4–21.8) in 1999 to 2.9 per 1,000 PYR (95% CI 0.7 –11.4) in 2002–2003 (test for trend P=0.148). When the allowed period between virological failure and resistance was increased from 1 to 2 years, we found slightly higher rates of resist-ance but similar trends of resistance rate changes over time for all three major drug classes. When previous virological failure was not taken into account, we found 2–3× higher crude IR rates but similar decreas-ing trends over time.
Incidence rates of any new drug resistance mutation within a drug classThe IR of any new NRTI-related mutation was 10.2 new mutations per 1,000 PYR (95% CI 5.95– 10.38), whereas it was 14.2 per 1,000 PYR (95% CI 7.38–14.18) for any new NNRTI-related mutations and 2.8 per 1,000 PYR (95% CI 0.40–3.78) for any new PI-related mutation (Table 1). The IR for NRTIs and NNRTIs decreased significantly between 1999 and 2005 (P<0.001 and P=0.017, respectively).
Incidence rates of specific drug resistance mutationsThe most frequent new NRTI-related drug resistance mutation was M184V/I, with an overall IR of 5.6 per 1,000 PYR (95% CI 4.0–7.8). The IR decreased from 9.8 per 1,000 PYR (95% CI 3.2–30.5) in 1999 to 3.7 per 1,000 PYR (95% CI 1.9–7.4) in 2004–2005 (test for trend P=0.049). K103N was the most frequent NNRTI-related drug resistance mutation, with an IR of 8.2 per 1,000 PYR (95% CI 5.6–12.0), decreasing over time from 15.4 per 1,000 PYR (95% CI 2.2–109.6) in 1999 to 6.1 per 1,000 PYR (95% CI 3.3–11.3) in 2004–2005 (test for trend P=0.270). D30N and L90M were the two most frequent PI-related drug resistance mutations, each occurring at an IR of 0.81 per 1,000 PYR (95% CI 0.2–3.2). The IR of other specific drug mutations are listed in Table 2.
Discussion
In this study, based on Danish nationwide data from individuals infected with HIV-1, we found decreasing population-based IR of drug resistance acquisition during 1999–2005 for all three major antiretroviral drug classes, although non-significantly for PIs. The most frequent mutations were M184V and K103N. To our knowledge, this study is the first to estimate resist-ance acquisition trends in a population where the total time on treatment prior to an event for all patients is counted in the denominator. The major strength of our study was the access to all HIV patients, VLs, treat-ment history and resistance tests performed within a geographical area.
AVT-09-OA-1150_Audelin.indd 997 30/10/09 15:18:50
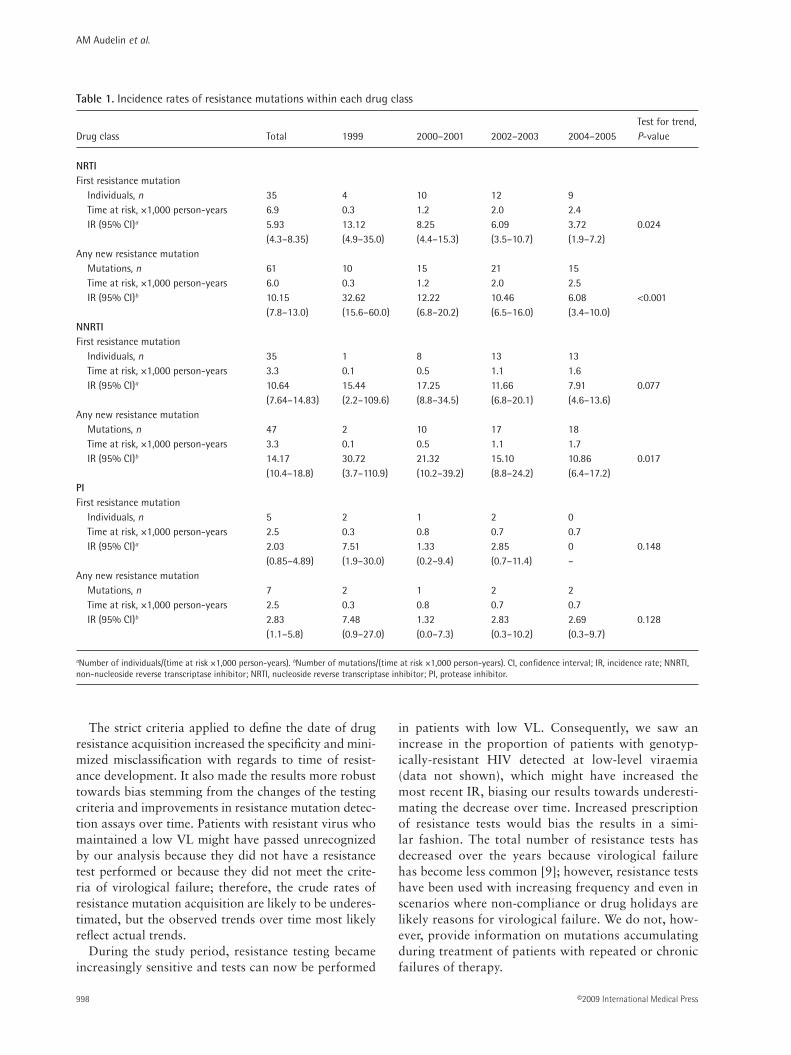
AM Audelin et al.
©2009 International Medical Press998
The strict criteria applied to define the date of drug resistance acquisition increased the specificity and mini-mized misclassification with regards to time of resist-ance development. It also made the results more robust towards bias stemming from the changes of the testing criteria and improvements in resistance mutation detec-tion assays over time. Patients with resistant virus who maintained a low VL might have passed unrecognized by our analysis because they did not have a resistance test performed or because they did not meet the crite-ria of virological failure; therefore, the crude rates of resistance mutation acquisition are likely to be underes-timated, but the observed trends over time most likely reflect actual trends.
During the study period, resistance testing became increasingly sensitive and tests can now be performed
in patients with low VL. Consequently, we saw an increase in the proportion of patients with genotyp-ically-resistant HIV detected at low-level viraemia (data not shown), which might have increased the most recent IR, biasing our results towards underesti-mating the decrease over time. Increased prescription of resistance tests would bias the results in a simi-lar fashion. The total number of resistance tests has decreased over the years because virological failure has become less common [9]; however, resistance tests have been used with increasing frequency and even in scenarios where non-compliance or drug holidays are likely reasons for virological failure. We do not, how-ever, provide information on mutations accumulating during treatment of patients with repeated or chronic failures of therapy.
Test for trend, Drug class Total 1999 2000–2001 2002–2003 2004–2005 P-value
NRTI First resistance mutation
Individuals, n 35 4 10 12 9 Time at risk, ×1,000 person-years 6.9 0.3 1.2 2.0 2.4 IR (95% CI)a 5.93 13.12 8.25 6.09 3.72 0.024 (4.3–8.35) (4.9–35.0) (4.4–15.3) (3.5–10.7) (1.9–7.2)
Any new resistance mutation Mutations, n 61 10 15 21 15 Time at risk, ×1,000 person-years 6.0 0.3 1.2 2.0 2.5 IR (95% CI)b 10.15 32.62 12.22 10.46 6.08 <0.001 (7.8–13.0) (15.6–60.0) (6.8–20.2) (6.5–16.0) (3.4–10.0)
NNRTI First resistance mutation
Individuals, n 35 1 8 13 13 Time at risk, ×1,000 person-years 3.3 0.1 0.5 1.1 1.6 IR (95% CI)a 10.64 15.44 17.25 11.66 7.91 0.077 (7.64–14.83) (2.2–109.6) (8.8–34.5) (6.8–20.1) (4.6–13.6)
Any new resistance mutation Mutations, n 47 2 10 17 18 Time at risk, ×1,000 person-years 3.3 0.1 0.5 1.1 1.7 IR (95% CI)b 14.17 30.72 21.32 15.10 10.86 0.017 (10.4–18.8) (3.7–110.9) (10.2–39.2) (8.8–24.2) (6.4–17.2)
PI First resistance mutation
Individuals, n 5 2 1 2 0 Time at risk, ×1,000 person-years 2.5 0.3 0.8 0.7 0.7 IR (95% CI)a 2.03 7.51 1.33 2.85 0 0.148 (0.85–4.89) (1.9–30.0) (0.2–9.4) (0.7–11.4) –
Any new resistance mutation Mutations, n 7 2 1 2 2 Time at risk, ×1,000 person-years 2.5 0.3 0.8 0.7 0.7 IR (95% CI)b 2.83 7.48 1.32 2.83 2.69 0.128 (1.1–5.8) (0.9–27.0) (0.0–7.3) (0.3–10.2) (0.3–9.7)
Table 1. Incidence rates of resistance mutations within each drug class
aNumber of individuals/(time at risk ×1,000 person-years). bNumber of mutations/(time at risk ×1,000 person-years). CI, confidence interval; IR, incidence rate; NNRTI, non-nucleoside reverse transcriptase inhibitor; NRTI, nucleoside reverse transcriptase inhibitor; PI, protease inhibitor.
AVT-09-OA-1150_Audelin.indd 998 30/10/09 15:18:51
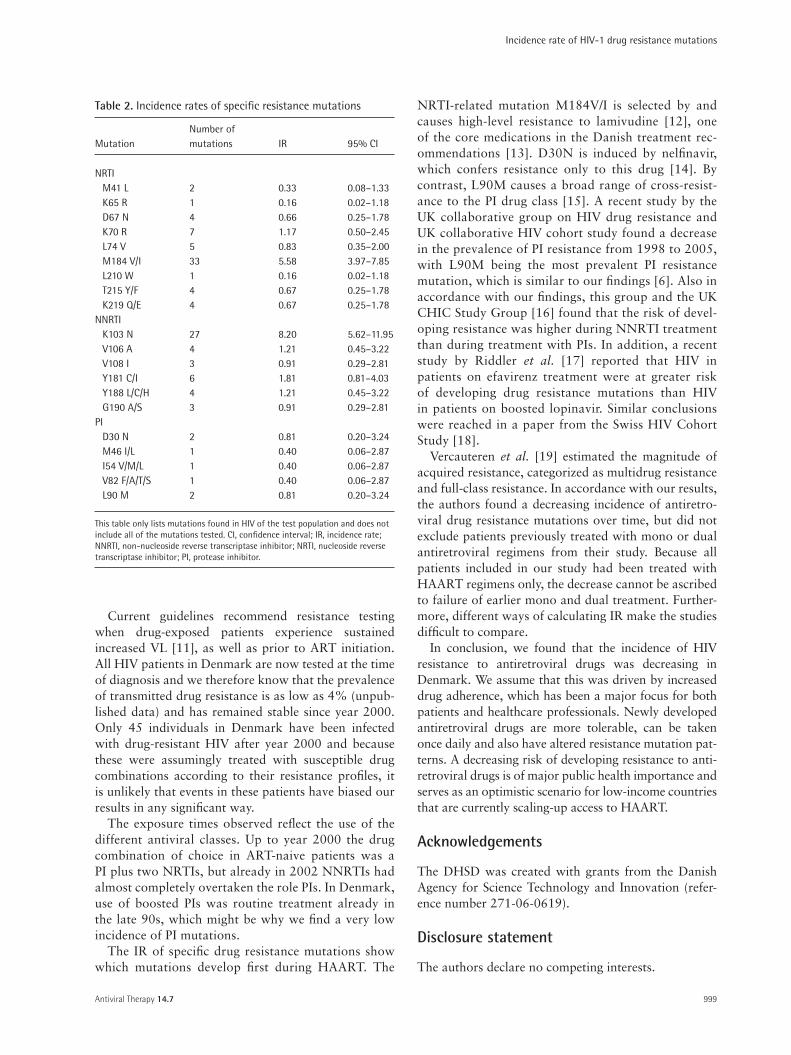
Incidence rate of HIV-1 drug resistance mutations
Antiviral Therapy 14.7 999
Current guidelines recommend resistance testing when drug-exposed patients experience sustained increased VL [11], as well as prior to ART initiation. All HIV patients in Denmark are now tested at the time of diagnosis and we therefore know that the prevalence of transmitted drug resistance is as low as 4% (unpub-lished data) and has remained stable since year 2000. Only 45 individuals in Denmark have been infected with drug-resistant HIV after year 2000 and because these were assumingly treated with susceptible drug combinations according to their resistance profiles, it is unlikely that events in these patients have biased our results in any significant way.
The exposure times observed reflect the use of the different antiviral classes. Up to year 2000 the drug combination of choice in ART-naive patients was a PI plus two NRTIs, but already in 2002 NNRTIs had almost completely overtaken the role PIs. In Denmark, use of boosted PIs was routine treatment already in the late 90s, which might be why we find a very low incidence of PI mutations.
The IR of specific drug resistance mutations show which mutations develop first during HAART. The
NRTI-related mutation M184V/I is selected by and causes high-level resistance to lamivudine [12], one of the core medications in the Danish treatment rec-ommendations [13]. D30N is induced by nelfinavir, which confers resistance only to this drug [14]. By contrast, L90M causes a broad range of cross-resist-ance to the PI drug class [15]. A recent study by the UK collaborative group on HIV drug resistance and UK collaborative HIV cohort study found a decrease in the prevalence of PI resistance from 1998 to 2005, with L90M being the most prevalent PI resistance mutation, which is similar to our findings [6]. Also in accordance with our findings, this group and the UK CHIC Study Group [16] found that the risk of devel-oping resistance was higher during NNRTI treatment than during treatment with PIs. In addition, a recent study by Riddler et al. [17] reported that HIV in patients on efavirenz treatment were at greater risk of developing drug resistance mutations than HIV in patients on boosted lopinavir. Similar conclusions were reached in a paper from the Swiss HIV Cohort Study [18].
Vercauteren et al. [19] estimated the magnitude of acquired resistance, categorized as multidrug resistance and full-class resistance. In accordance with our results, the authors found a decreasing incidence of antiretro-viral drug resistance mutations over time, but did not exclude patients previously treated with mono or dual antiretroviral regimens from their study. Because all patients included in our study had been treated with HAART regimens only, the decrease cannot be ascribed to failure of earlier mono and dual treatment. Further-more, different ways of calculating IR make the studies difficult to compare.
In conclusion, we found that the incidence of HIV resistance to antiretroviral drugs was decreasing in Denmark. We assume that this was driven by increased drug adherence, which has been a major focus for both patients and healthcare professionals. Newly developed antiretroviral drugs are more tolerable, can be taken once daily and also have altered resistance mutation pat-terns. A decreasing risk of developing resistance to anti-retroviral drugs is of major public health importance and serves as an optimistic scenario for low-income countries that are currently scaling-up access to HAART.
Acknowledgements
The DHSD was created with grants from the Danish Agency for Science Technology and Innovation (refer-ence number 271-06-0619).
Disclosure statement
The authors declare no competing interests.
Number of Mutation mutations IR 95% CI
NRTI M41 L 2 0.33 0.08–1.33K65 R 1 0.16 0.02–1.18D67 N 4 0.66 0.25–1.78K70 R 7 1.17 0.50–2.45L74 V 5 0.83 0.35–2.00M184 V/I 33 5.58 3.97–7.85L210 W 1 0.16 0.02–1.18T215 Y/F 4 0.67 0.25–1.78K219 Q/E 4 0.67 0.25–1.78
NNRTI K103 N 27 8.20 5.62–11.95V106 A 4 1.21 0.45–3.22V108 I 3 0.91 0.29–2.81Y181 C/I 6 1.81 0.81–4.03Y188 L/C/H 4 1.21 0.45–3.22G190 A/S 3 0.91 0.29–2.81
PI D30 N 2 0.81 0.20–3.24M46 I/L 1 0.40 0.06–2.87I54 V/M/L 1 0.40 0.06–2.87V82 F/A/T/S 1 0.40 0.06–2.87L90 M 2 0.81 0.20–3.24
Table 2. Incidence rates of specific resistance mutations
This table only lists mutations found in HIV of the test population and does not include all of the mutations tested. CI, confidence interval; IR, incidence rate; NNRTI, non-nucleoside reverse transcriptase inhibitor; NRTI, nucleoside reverse transcriptase inhibitor; PI, protease inhibitor.
AVT-09-OA-1150_Audelin.indd 999 30/10/09 15:18:51
AM Audelin et al.
©2009 International Medical Press1000
References1. Phillips AN, Staszewski S, Lampe F, et al. Human
immunodeficiency virus rebound after suppression to <400 copies/mL during initial highly active antiretroviral therapy regimens, according to prior nucleoside experience and duration of suppression. J Infect Dis 2002; 186:1086–1091.
2. Costagliola D, Descamps D, Assoumou L, et al. Prevalence of HIV-1 drug resistance in treated patients: a French nationwide study. J Acquir Immune Defic Syndr 2007; 46:12–18.
3. Scott P, Arnold E, Evans B, et al. Surveillance of HIV antiretroviral drug resistance in treated individuals in England: 1998-2000. J Antimicrob Chemother 2004; 53:469–473.
4. Richman DD, Morton S, Wrin T, et al. The prevalence of antiretroviral drug resistance in the United States. AIDS 2004; 18:1393–1401.
5. Di Giambenedetto S, Bracciale L, Colatigli M, et al. Declining prevalence of HIV-1 drug resistance in treatment-failing patients: a clinical cohort study. Antivir Ther 2007; 12:835–839.
6. The UK Collaborative Group on HIV Drug Resistance and the UK Collaborative HIV Cohort Study. Population trends in the prevalence and patterns of protease resistance related to exposure to unboosted and boosted protease inhibitors. Antivir Ther 2007; 13:771–777.
7. Lohse N, Obel N, Kronborg G, et al. Declining prevalence of HIV-infected individuals at risk of transmitting drug-resistant HIV in Denmark during 1997–2004. Antivir Ther 2006; 11:591–600.
8. Lohse N, Hansen A, Jensen-Fangel S, et al. Demographics of HIV-1 infection in Denmark: results from the Danish HIV Cohort Study. Scand J Infect Dis 2005; 37:338–343.
9. Lohse N, Obel N, Kronborg G, et al. Declining risk of triple-class antiretroviral drug failure in Danish HIV-infected individuals. AIDS 2005; 19:815–822.
10. Johnson VA, Brun-Vézinet F, Clotet B, et al. Update of the drug resistance mutations in HIV-1: 2007. Top HIV Med 2007; 15:119–125.
11. Vandamme AM, Sönnerborg A, Ait-Khaled M, et al. Updated European recommendations for the clinical use of HIV drug resistance testing. Antivir Ther 2004; 9:829–848.
12. Frost SDW, Nijhuis M, Schuurman R, Boucher CAB, Brown AJL. Evolution of lamivudine resistance in human immunodeficiency virus type 1-infected individuals: the relative roles of drift and selection. J Virol 2000; 74:6262–6268.
13. Jensen-Fangel S, Pedersen C, Larsen CS, Tauris P, Moller A, Obel N. Trends in the use of highly active antiretroviral therapy in western Denmark 1996–2000. Scand J Infect Dis 2002; 34:460–465.
14. Perry CM, Frampton JE, McCormack PL, Siddiqui MAA, Cvetkovic RS. Nelfinavir: a review of its use in the management of HIV infection. Drugs 2005; 65:2209–2244.
15. Hertogs K, Bloor S, Kemp SD, et al. Phenotypic and genotypic analysis of clinical HIV-1 isolates reveals extensive protease inhibitor cross-resistance: a survey of over 6000 samples. AIDS 2000; 14:1203–1210.
16. Phillips AN, Dunn D, Sabin C, et al. Long term probability of detection of HIV-1 drug resistance after starting antiretroviral therapy in routine clinical practice. AIDS 2005; 19:487–494.
17. Riddler SA, Haubrich R, DiRienzo AG, et al. Class-sparing regimens for initial treatment of HIV-1 infection. N Engl J Med 2008; 358:2095–2106.
18. Von Wyl V, Yerly S, Boni J, et al. Emergence of HIV-1 drug resistance in previously untreated patients initiating combination Antiretroviral treatment - A comparison of different regimen types. Arch Intern Med 2007; 167:1782–1790.
19. Vercauteren J, Deforche K, Theys K, et al. The incidence of multidrug and full class resistance in HIV-1 infected patients is decreasing over time (2001–2006) in Portugal. Retrovirology 2008; 5:12.
Accepted for publication 06 July 2009
AVT-09-OA-1150_Audelin.indd 1000 30/10/09 15:18:51
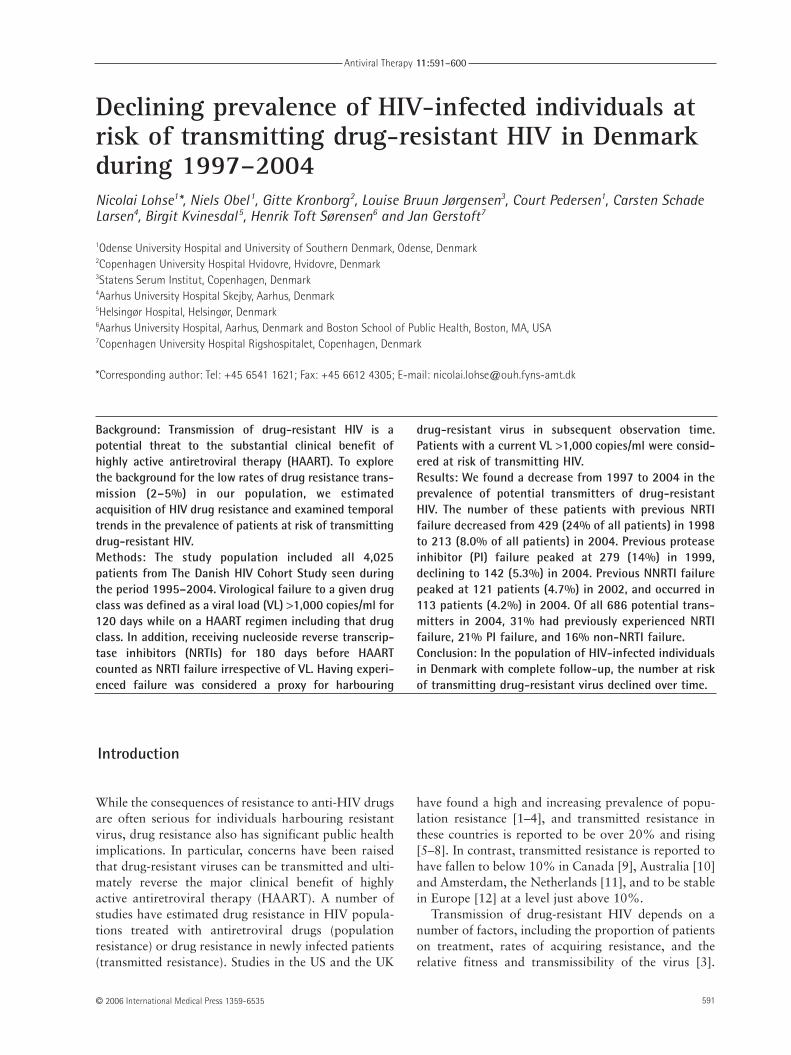
Background: Transmission of drug-resistant HIV is apotential threat to the substantial clinical benefit ofhighly active antiretroviral therapy (HAART). To explorethe background for the low rates of drug resistance trans-mission (2–5%) in our population, we estimatedacquisition of HIV drug resistance and examined temporaltrends in the prevalence of patients at risk of transmittingdrug-resistant HIV.Methods: The study population included all 4,025patients from The Danish HIV Cohort Study seen duringthe period 1995–2004. Virological failure to a given drugclass was defined as a viral load (VL) >1,000 copies/ml for120 days while on a HAART regimen including that drugclass. In addition, receiving nucleoside reverse transcrip-tase inhibitors (NRTIs) for 180 days before HAARTcounted as NRTI failure irrespective of VL. Having experi-enced failure was considered a proxy for harbouring
drug-resistant virus in subsequent observation time.Patients with a current VL >1,000 copies/ml were consid-ered at risk of transmitting HIV.Results: We found a decrease from 1997 to 2004 in theprevalence of potential transmitters of drug-resistantHIV. The number of these patients with previous NRTIfailure decreased from 429 (24% of all patients) in 1998to 213 (8.0% of all patients) in 2004. Previous proteaseinhibitor (PI) failure peaked at 279 (14%) in 1999,declining to 142 (5.3%) in 2004. Previous NNRTI failurepeaked at 121 patients (4.7%) in 2002, and occurred in113 patients (4.2%) in 2004. Of all 686 potential trans-mitters in 2004, 31% had previously experienced NRTIfailure, 21% PI failure, and 16% non-NRTI failure.Conclusion: In the population of HIV-infected individualsin Denmark with complete follow-up, the number at riskof transmitting drug-resistant virus declined over time.
Declining prevalence of HIV-infected individuals atrisk of transmitting drug-resistant HIV in Denmarkduring 1997–2004Nicolai Lohse1*, Niels Obel 1, Gitte Kronborg2, Louise Bruun Jørgensen3, Court Pedersen1, Carsten SchadeLarsen4, Birgit Kvinesdal5, Henrik Toft Sørensen6 and Jan Gerstoft7
1Odense University Hospital and University of Southern Denmark, Odense, Denmark2Copenhagen University Hospital Hvidovre, Hvidovre, Denmark3Statens Serum Institut, Copenhagen, Denmark 4Aarhus University Hospital Skejby, Aarhus, Denmark5Helsingør Hospital, Helsingør, Denmark6Aarhus University Hospital, Aarhus, Denmark and Boston School of Public Health, Boston, MA, USA7Copenhagen University Hospital Rigshospitalet, Copenhagen, Denmark
*Corresponding author: Tel: +45 6541 1621; Fax: +45 6612 4305; E-mail: [email protected]
Antiviral Therapy 11:591–600
While the consequences of resistance to anti-HIV drugsare often serious for individuals harbouring resistantvirus, drug resistance also has significant public healthimplications. In particular, concerns have been raisedthat drug-resistant viruses can be transmitted and ulti-mately reverse the major clinical benefit of highlyactive antiretroviral therapy (HAART). A number ofstudies have estimated drug resistance in HIV popula-tions treated with antiretroviral drugs (populationresistance) or drug resistance in newly infected patients(transmitted resistance). Studies in the US and the UK
have found a high and increasing prevalence of popu-lation resistance [1–4], and transmitted resistance inthese countries is reported to be over 20% and rising[5–8]. In contrast, transmitted resistance is reported tohave fallen to below 10% in Canada [9], Australia [10]and Amsterdam, the Netherlands [11], and to be stablein Europe [12] at a level just above 10%.
Transmission of drug-resistant HIV depends on anumber of factors, including the proportion of patientson treatment, rates of acquiring resistance, and therelative fitness and transmissibility of the virus [3].
Introduction
© 2006 International Medical Press 1359-6535 591

Despite the importance of the problem, accurate dataon these risk factors are lacking. Surveillance inDenmark since 2000 has revealed a very low and stableprevalence of transmitted drug resistance (5% or less)[13], in a context of high treatment coverage. In orderto gain insight into trends underlying this low trans-mitted resistance prevalence, we aimed to examinetemporal changes in the prevalence of individuals at riskof transmitting drug-resistant HIV. Using data from acomplete nationwide cohort of Danish HIV-infectedindividuals, we combined detailed information on indi-vidual treatment regimens and periods of incompletevirological suppression to estimate both acquisition ofdrug-resistant viruses and subsequent risk of transmit-ting them to other individuals.
Methods
The Danish HIV Cohort StudyThe Danish HIV Cohort Study is a prospective, nation-wide population-based cohort study of all HIV-positiveindividuals seen at Danish HIV clinics since 1 January1995 [14,15]. The Danish healthcare system providesfree tax-supported antiretroviral treatment and othermedical care to these patients. Treatment for HIV infec-tion occurs in only eight hospital clinics, whichdistribute HIV drugs directly to patients. HIV medicinescannot be prescribed by general practitioners orpurchased from Danish pharmacies. Use of the Danish10-digit personal identification number enables treat-ment facilities to avoid multiple registrations of thesame patient, and to document whether patients lost tofollow-up have died or moved outside the country. Allpatients who were seen in Danish HIV clinics up to 1 January 2004 were included in the study. Patients whohad not been seen since 1 January 2003 and were notknown to have died were considered lost to follow-up.
Antiretroviral therapyHAART was defined as use of at least three antiretro-viral drugs, including at least one protease inhibitor(PI) or non-nucleoside reverse transcriptase inhibitor(NNRTI), or abacavir. Treatment interruptions longerthan 14 days were documented, including temporaryinterruptions during infections and pregnancy.National guidelines for initiating HAART haveremained almost unchanged since 1997 and havemainly been CD4-driven, with a CD4+ T-cell count of300×106 cells/ml used as the threshold for treatmentinitiation. A minor guideline revision concerned HIV-RNA level: until 2001, HIV-RNA >100,000 copies/mlwas considered an indication for treatment initiation,but since then there has been no upper HIV-RNA limit.However, this indication accounted for only a minorproportion of HAART initiations, as did the three
additional indications: acute HIV infection, clinicalsymptoms and pregnancy. Treatment interruptionshave not been recommended in Denmark.
Prolonged virological failure as a proxy for acquireddrug resistanceDuring HAART, virological failure of a drug class(nucleoside reverse transcriptase inhibitor [NRTI], PI orNNRTI) was defined as an HIV RNA viral load (VL) of>1,000 copies/ml for a total of 120 days (not necessarilysuccessive) while on treatment with that drug class.Hence, periods of treatment interruption did not countas time with virological failure. VL was considered to be>1,000 copies/ml only during time periods between twoconsecutive VL measurements >1,000 copies/ml. Failureof a drug class could occur when it was administered asmonotherapy or as part of a multi-drug regimen[16,17]. In addition, administration of mono- or dual-drug therapy including NRTIs for 180 days prior toHAART counted as NRTI failure, irrespective of VL inthis period. Cohort study data included information onthe date when the patient started mono- or dual-NRTItherapy, as well as detailed information on drug combi-nations and timing of combination changes in theHAART regimen. A patient was considered to have‘previous virological failure’ of a drug class at allfollow-up times after meeting the definition of virolog-ical failure. Previous virological failure was considereda proxy for acquired drug resistance [18,19].
Population at risk of transmitting drug-resistant HIVPatients with a current VL >1,000 copies/ml wereconsidered potential transmitters of HIV. To define the‘current VL’, we computed VL values at time pointsbetween measurements [20]: each measured value wascarried forward for 30 days or until the next measure-ment, whichever came first. The measured VL wasextrapolated back to 30 days following the previousmeasurement. This model was used because detectionof a high VL at a clinic visit often leads to revision of the antiretroviral treatment regimen, therebyproducing a change in VL. Patients with previous viro-logical failure of a given drug class were considered atrisk of transmitting resistance to that class if a subse-quent ‘current VL’ was >1,000 copies/ml.
Statistical analysisThe following point prevalences were computed on 1 January of each year during 1997–2004 amongpatients under observation on that day: (i) prevalence ofpatients with a current VL >1,000 copies/ml (denomi-nators: [A] all patients, [B] patients who were receivingor had ever received HAART, [C] patients who hadnever received any antiretroviral treatment); (ii) preva-lence of patients with an ongoing treatment interruption
N Lohse et al.
© 2006 International Medical Press592

(denominator: patients who had ever received HAART);(iii) prevalence of patients with previous virologicalfailure (denominators: [A] all patients, [B] patients whohad never received mono- or dual-NRTI therapy]; and(iv) prevalence of patients with a current VL >1,000copies/ml and previous virological failure (denomina-tors: [A] all patients, [B] patients with a current VL>1,000 copies/ml). VL measurements did not becomeroutine for all patients until mid-1997, and thereforeannual point prevalences were calculated only based onthose patients in the Danish HIV Cohort Study who hadalready had a VL measured. Thus the 1997 point preva-lences were based on 55% of all patients; this increasedto 92% in 1998, 95% in 1999, 97% in 2000, 98% in2001, 99% in 2002, 99% in 2003 and 99% in 2004. Ofthe patients, 511 never had a VL measured; 420 of thesedied during 1995–1997. Among those who had a VLmeasured, the mean number of VL measurements/yearper patient was: 0.1 in 1995, 1.2 in 1996, 3.5 in 1997,3.6 in 1998, 3.8 in 1999, 3.8 in 2000, 3.7 in 2001, 3.5in 2002 and 3.6 in 2003. Poisson regression was used toestimate relative changes in prevalence during the mostrecent 4 years (2000–2004), since this period is mostlikely to mirror future trends. Patient characteristicswere compared using the χ2 test. Trends in medianCD4+ T-cell count and VL over time were examinedusing Spearman’s rank correlation.
Results
Patient characteristicsOf the 4,025 patients in the Danish HIV Cohort Study,2,816 initiated HAART during the observation period(1 January 1995–1 January 2004). The median CD4+
T-cell count was 181 cells/µl (interquartile range[IQR]: 72–290), the median log10 viral load was 4.9(IQR: 4.1–5.4) copies/ml, and 38% had receivedmono- or dual-NRTI therapy prior to HAART initia-tion. During the years of the study, no change wasobserved in median CD4+ T-cell count at HAART initi-ation (P=0.40). However, there was a statisticallysignificant increase in median log10 VL from 4.6 in1997 to 5.0 in 2004 (P=0.02). The proportion ofpatients receiving HAART increased gradually from44% in 1997 to 65% in 1998 and then further to 82%in 2004. Out of the total number of patients, 4.6%were lost to follow-up and 2.3% of patients initiatingHAART were lost to follow-up. Patient characteristicsare shown in Table 1.
Prevalence of patients with a current VL >1,000copies/mlThe proportion of all patients with a current VL>1,000 copies/ml decreased from 69% in 1997 to 26%in 2004. The relative change between 2000 and 2004
was 0.88 per year (95% confidence interval [CI]:0.86–0.90). Additionally, among patients who werereceiving or had ever received HAART, a steady declinewas noted in the percentage of those with a current VL>1,000 copies/ml, for example, from 58% in 1997 to14% in 2004, with a relative change between 2000 and2004 of 0.84 per year (95% CI: 0.81–0.86). Amongpatients who had never received any antiretroviral treat-ment, the percentage with a current VL >1,000copies/ml varied between 78% and 85%, with no trend.
Prevalence of patients with treatment interruptionsThe prevalence of patients ever receiving HAART whowere currently interrupting their regimen on 1 Januaryeach year was 6.1% in 2004 and varied from 5.4% in1998 to 7.8% in 1999.
Prevalence of patients with previous virological failureThe prevalence of previous NRTI failure was identicalto the prevalence of previous ‘failure of any drug class’,because at the time of failing a PI or an NNRTI, allpatients had either previously failed an NRTI (that is, asmonotherapy), or they had an NRTI included in theregimen they received at the time of PI- or NNRTI-failure. Isolated first failures of a PI, a NNRTI, or acombination of the two did not occur. In 1997, 62% ofall patients had a previous NRTI failure, and thispercentage steadily decreased to 37% in 2004 (Figure 1).The relative change between 2000 and 2004 was 0.94per year (95% CI: 0.92–0.96). Previous PI failurepeaked at 19% in 2001 and decreased to 16% in 2004,with a relative change of 0.94 per year between 2000and 2004 (95% CI: 0.92–0.97). Previous NNRTIfailure increased steadily to 7.0% in 2004, with a rela-tive change of 1.14 per year during the period2000–2004 (95% CI: 1.08–1.20). In 2004, 998 patientshad previously failed the NRTI drug class, 416 hadpreviously failed the PI class, and 187 had previouslyfailed the NNRTI class. Among patients who had neverreceived mono- or dual-NRTI therapy, the prevalence ofprevious NRTI failure increased from 1997 to 2000 andstabilized at about 8% thereafter. The relative changebetween 2000 and 2004 was 1.00 per year (95% CI:0.95–1.06; Figure 2). The prevalence of previous PIfailure decreased after an initial rise, with a relativechange of 0.93 per year between 2000 and 2004 (95%CI: 0.87–0.99), and the prevalence of previous NNRTIfailure increased during that period with a relativechange of 1.29 per year (95% CI: 1.16–1.44).
Prevalence of patients with previous virologicalfailure and a current VL >1,000 copies/mlThe number of patients considered at risk of transmit-ting HIV because of a VL >1,000 copies/ml followingNRTI failure decreased from 429 (24% of all cohort
Antiviral Therapy 11:5 593
Risk of transmitting drug-resistant HIV

patients) in 1998 to 213 (8.0% of all cohort patients) in2004 (Figure 3). This represented a relative change inprevalence of 0.81 per year between 2000 and 2004(95% CI: 0.78–0.84). The number with previous PIfailure and a current VL >1,000 copies/ml peaked at279 (14% of all cohort patients) in 1999 and declinedto 142 (5.3% of all cohort patients) in 2004. This wasa relative change in prevalence of 0.80 per year between2000 and 2004 (95% CI: 0.77–0.84). The number ofcohort patients experiencing a previous NNRTI failureand a current VL >1,000 copies/ml peaked at 121(4.7% of all cohort patients) in 2002 and was 113(4.2% of all cohort patients) in 2004; this correspondsto a relative change in prevalence of 1.04 per yearbetween 2000 and 2004 (95% CI: 0.97–1.10). Figure 4shows the number of patients at risk of transmittingdrug-resistant HIV each year and their status 1 yearlater in terms of remaining at risk, achieving re-suppres-sion, having died or being lost to follow-up. For eachyear from 1998 to 2003, fewer patients remained at riskcompared with the year before, and fewer new patientsentered the risk group. Of all 686 potential transmitters
in 2004, 31% had previously experienced NRTI failure,21% PI failure and 16% NNRTI failure (Figure 5). The median viral load was lower among the 213patients with previous drug failure than among theother 473 patients [log10 VL=4.02, (IQR: 3.25–4.91)versus log10 VL=4.37 (IQR: 3.79–4.75); P<0.01]. Out ofthe 473 patients with no previous failure, 286 were anti-retroviral therapy-naive. Patient characteristics for thesetwo groups are detailed in Table 1.
Analyses restricted to homosexual menOn repeating all analyses for the 1,775 patientsinfected through male homosexual contact, weobserved similar temporal trends in the prevalence of acurrent VL >1,000 copies/ml, treatment interruptions,previous virological failure and the potential totransmit drug-resistant HIV.
Discussion
This study, encompassing all HIV-infected individualsreceiving care in Denmark, indicates a decrease in the
N Lohse et al.
© 2006 International Medical Press594
Table 1. Characteristics of all study patients and of patients at risk of transmitting HIV on 1 January 2004
Patients with viral load >1,000 copies/ml on 1 January 2004
All study patients Previous viral failure
n % n No, % Yes, % P-value
Total 4,027 100 686 69 31 –
GenderMale 3,019 75 462 69 31 0.79Female 1,008 25 224 70 30 –
RaceCaucasian 3,219 80 524 70 30 0.14Black African 541 13 115 62 38 –Other races 258 6 45 78 22 –Unknown 9 0 2 100 0 –
OriginDenmark 2,959 73 491 70 30 0.16Europe excluding Denmark 229 6 30 57 43 –Africa 540 13 114 62 38 –Other countries 282 7 50 76 24 –Unknown 17 0 1 100 0 –
Risk behaviourMSM 1,775 44 263 68 32 0.06IDU 484 12 110 75 25 –Heterosexual 1,488 37 287 69 31 –Other 104 3 10 30 70 –Unknown 176 4 16 63 38 –
Log10 viral load, copies/mlMedian – – – 4.37 4.02 0.02IQR – – – 3.79–4.75 3.25–4.91 –
IDU, injection drug users; IQR, interquartile range; MSM, men having sex with men.

prevalence of potential transmitters of HIV, and inparticular a decrease in the prevalence of potentialtransmitters of drug-resistant HIV between 1997 and2004. The decrease stemmed from declining incidence(fewer patients failing their treatment), as well assuccessful re-suppression of viral load to below 1,000copies/ml following failure. Mortality and loss tofollow-up did not play a role.
Among patients unexposed to mono- or dual-NRTItherapy, we observed a steady prevalence of previousfailure of ‘any drug class’ since 2000 (equal to NRTIfailure). However, in the same time period there was adecrease in previous PI failure and an increase in previousNNRTI failure. The decline in previous PI failure corre-sponded temporally with the shift from non-boosted toritonavir (RTV)-boosted PIs, for which development ofresistance occurs slowly [21,22], and with the increaseduse of NNRTIs in initial regimens instead of PIs. Thestable and low prevalence of resistance to ‘any drug class’since 2000 corresponds well with HIV treatment
advances in recent years, with emphasis on adherence asthe key factor for success of a regimen [23].
Most studies attempting to estimate the prevalence ofdrug resistance use data from phenotypic [1,7,19,20] orgenotypic resistance [2,5,9–12] tests. However, it is chal-lenging to compare such test results from different timeperiods because the indication for testing has changedover time, and the interpretation of mutations has alsochanged. Furthermore, patients can harbour mutationsundetected in a particular sample, thus introducing biasto the prevalence estimates. Several additional factorsmake it difficult to accurately estimate the prevalence ofdrug resistance based on resistance tests: the cohort fromwhich the samples are taken is seldom representative ofthe HIV-infected population as a whole; assays areusually available only for a proportion of the HIV-infected population; and the assays are performedprimarily at the decision of the treating physician.
The Danish HIV Cohort Study confers a number ofresearch advantages. Because it includes almost all
Antiviral Therapy 11:5 595
Risk of transmitting drug-resistant HIV
Figure 1. Prevalence of patients with previous virological failure
Label numbers indicate numerator values. Numerator: patients with previous virological failure (viral load >1,000 copies/ml for 120 days whilst on highly active anti-retroviral therapy, or 180 days of mono- or dual-nucleoside reverse transcriptase inhibitor [NRTI] therapy). Denominator: all patients under observation on 1 Januaryeach year. NNRTI, non-nucleoside reverse transcriptase inhibitor; PI, protease inhibitor.
0.6
0.1
0.2
0.3
0.4
0.5
0
Denominator values Year
2004200320022001200019991998
970
584
1,026
1,0451,059
1,0621,049 998
416438441419368
276
62
1 742 75
140 168 185 187
452
1997
2,6712,7212,5842,3602,1922,0031,801944
NNRTI failure
PI failure
NRTI failure

patients in Denmark with a known HIV infection andhas few losses to follow-up, it provides an ideal settingfor measuring temporal trends. Frequent VL measure-ments for all patients and detailed data on antiretro-viral therapy permit use of previous virological failureas a proxy for carrying drug-resistant virus. A recentstudy among patients with continuous detectable VLand no mutations at baseline, estimated the incidencerate of acquiring a new resistance mutation to be 3.11mutations per year (highest among patients with a VLbetween 1,000 and 10,000 copies/ml) [18].
At the same time, a number of limitations must benoted. First, the chance of resistance mutations beingpresent at the time when virological failure is recordedvaries by drug and drug combination, and resistancemay not be present towards both drugs when failing atwo-drug combination. The 180 days of mono- or dual-NRTI therapy required before NRTI resistance isassumed may underestimate the true resistance to somedrugs, for example, the M184V lamivudine resistance
mutation. Additionally, acquiring PI resistance occursslowly for a patient on a HAART regimen that includesa RTV-boosted PI, and resistance mutations may not bepresent at resistance tests performed shortly after failure[21,22]. We may therefore have overestimated theprevalence of PI resistance in later years. Furthermore,development of NNRTI resistance occurs quickly,leading to underestimation of the prevalence of NNRTIresistance. In later years the use of NNRTIs and RTV-boosted PIs has increased, and the use of mono- anddual-NRTI regimens has ceased. These three factorswould inflate our observations of decreasing NRTIfailure, of decreasing PI failure combined withincreasing NNRTI failure among patients who receivedHAART as their initial antiretroviral regimen, and ofsimilar trends in the prevalence of drug resistance trans-mitters. Finally, we may record virological failure inpatients not taking their drugs at all, in which case resis-tance will not have emerged. The more tolerable regi-mens used during recent years may have improved
N Lohse et al.
© 2006 International Medical Press596
Figure 2. Prevalence of previous virological failure among mono- or dual-NRTI therapy-naive patients
Label numbers indicate numerator values. Numerator: patients with previous virological failure (viral load >1,000 copies/ml for 120 days whilst on highly active anti-retroviral therapy). Denominator: all mono- or dual-nucleoside reverse transcriptase inhibitor (NRTI) therapy-naive patients under observation on 1 January eachyear. The denominator includes both patients who have initiated highly active antiretroviral therapy and patients who have not yet received any antiretroviral treat-ment. NNRTI, non-nucleoside reverse transcriptase inhibitor; PI, protease inhibitor.
0.15
0.05
0.1
0
Denominator values Year
2004200320022001200019991998
29
63
102
131144 154 160
102113
11089
59
28
5
0 0 211
28
46 5665
111
1997
1,8271,8161,6521,4191,2381,022813242
NNRTI failure
PI failure
NRTI failure

compliance and therefore contributed to the observeddecrease in failure.
It is important to note that our data did not accountfor transmitted resistance, potentially causing anunderestimation of drug resistance in our population.This may contribute substantially to population resis-tance in populations with high transmitted resistance.However, such resistance was as low as 2% inDenmark in 2000 [13] and surveillance does notsuggest it is currently rising (LB Jørgensen, unpublisheddata). Another issue is the pool of undiagnosed HIV-infected individuals in Denmark, estimated at around1,000 individuals; we have assumed that most individ-uals in this group do not harbour drug-resistant virus,in light of the low level of transmitted drug resistance.Also, the possible reduced transmission capacity ofresistant viral strains [3,24,25] may lead to overestima-tion of the number of drug resistance transmitters.
Furthermore, we did not have data on all factorsthat might influence the risk of HIV transmission, for
example circumcision [26] or the presence of othersexually transmitted diseases [27]. We identified poten-tial transmitters of HIV using a cut-off of 1,000copies/ml, because transmission has been documentedto be low in patients with VL <1000 copies/ml, and toincrease with higher VL [28–31].
Thus, our methods may lead to misclassification ofboth transmitters and carriers of drug resistance;however, we believe that such misclassification isconstant over time. Given our well-defined and almostcomplete study population, we are confident that thetemporal trends estimated in this study mirror actualdecreasing trends in potential transmitters of antiretro-viral drug resistance.
Nevertheless, approximately one third of individ-uals in care with VL >1,000 copies/ml were estimatedto be potential carriers of drug-resistant virus. Riskbehaviour and its possible association with health-care-seeking behaviour remain unknown factorscontributing to the transmission rates. Recent
Antiviral Therapy 11:5 597
Risk of transmitting drug-resistant HIV
Figure 3. Prevalence of patients at risk of transmitting drug-resistant HIV
Label numbers indicate numerator values. Numerator: patients with previous virological failure (viral load >1,000 copies/ml for 120 days whilst on highly active anti-retroviral therapy, or 180 days of mono or dual-nucleoside reverse transcriptase inhibitor [NRTI] therapy) and a current viral load >1,000 copies/ml. Denominator: allpatients under observation on 1 January each year. NNRTI, non-nucleoside reverse transcriptase inhibitor; PI, protease inhibitor.
0.4
0.1
0.2
0.3
0
Denominator values Year
2004200320022001200019991998
142163209
264279
226
393
429
420
391
340311
250213
60
1 739
71110 121 119 113
241
1997
2,6712,7212,5842,3602,1922,0031,801944
NNRTI failure
PI failure
NRTI failure

surveillance has revealed that since 2002 anincreasing number of men having sex with men(MSM) are among those newly diagnosed with HIVinfections [32], and there has been a concomitantepidemic of syphilis among the MSM group inCopenhagen [33]. Although the results of ouranalyses for MSM were similar to those for the studypopulation as a whole, risky behaviours may beincreasing in this group, both among individualsknown and unknown to be infected with HIV.
Two studies have estimated the prevalence of popu-lation resistance in the United States [1,3]. In 2001Blower et al. [3] predicted an increasing prevalence ofdrug resistance based on data from the first years ofHAART. The decline found in our study accords withthe improved treatment success on the population levelin later years [16,20,34]. Richman et al. [1] detected78% drug resistance in late 1998 in a US population inwhich most patients had previously received mono- ordual-NRTI therapy. Our study also found a high preva-lence (60%) of potential drug resistance in 1997. Thedecline we documented since then may well be due to anincrease in the denominator: mono- or dual-NRTI-naive
patients receiving HAART as their first antiretroviralregimen, who are less likely to fail.
A recent study from the UK [4] pooled results fromgenotypic resistance tests over several years andcombined them with registry data for patients receivingtreatment, in order to estimate the prevalence of drugresistance among patients receiving antiretroviraltherapy. Interestingly, the research team found a trendof initial increase followed by stabilization, mostmarked for PI resistance, together with continuouslyincreasing NNRTI resistance. This is similar to ourfindings for mono- or dual-NRTI-naive patients. Thedrug resistance prevalence found in the UK study bythe end of 2002 is higher than our estimates, notsurprising for a population with a high prevalence oftransmitted resistance (>20%) [5,8]. A recent cross-European study of transmitted drug resistance in 2,208drug-naive patients found that 10.4% carried resistantHIV, with underlying increases in NNRTI mutationsand decreases in PI mutations, and with large regionaldifferences (0–23%) [12].
To our knowledge our study is the first to combineinformation on previous drug failure with a current VL
N Lohse et al.
© 2006 International Medical Press598
Figure 4. Number of patients at risk of transmitting drug-resistant HIV on 1 January each year
Patients with previous virological failure (viral load [VL] >1,000 copies/ml for 120 days whilst on highly active antiretroviral therapy, or 180 days of mono- or dual-nucleoside reverse transcriptase inhibitor therapy) and a current VL >1,000 copies/ml. Each bar is divided according to the patients´ status one year later: still at risk(VL >1,000 copies/ml), re-suppressed (VL <1,000 copies/ml), dead or lost to follow-up.
20032002200120001999
400
300
200
100
019981997
Still VL>1,000
Dead Lost to follow-up
Suppressed to VL<1,000

in order to detect patients at risk of transmitting drug-resistant viral strains to others. The prevalence ofprevious drug failure tended to stabilize, while theprevalence of potential transmitters decreased due tosuccessful viral re-suppression, in accordance withrecent years’ therapeutic improvements. Declines intransmitted drug resistance found in the Netherlands[11] and Canada [9] may be signs of a similar reductionin potential transmitters in those areas. However,NNRTI failure in particular must be closely monitoredin the future. The observed increase in failure of thisdrug class reflects current drug prescribing patterns,and the weak genetic barrier makes it more likely fordrug resistance to develop to these drugs than to RTV-boosted PIs administered as part of a HAART regimen.
Among the population of Danish HIV-infectedindividuals, subject to intense and complete follow-up, we have found that the number of HIV-infectedindividuals at risk of transmitting drug-resistant virusis declining. These positive trends have come about
despite heavy exposure to antiretroviral drugs anddespite the continuous accumulation at the popula-tion level of patients with a history of virologicalfailure. Continuation of these trends would meanpreserving initial therapeutic options for the majorityof newly infected individuals in the future. Thiswould enable the HIV-infected population to fullybenefit from new drugs on the market without fear ofbeing ‘hit from behind’ by drug resistance carried onfrom less successful therapeutic strategies onprevious occasions.
Acknowledgements
The study was supported by grants from The DanishAIDS Foundation; Odense University Hospital,Denmark; Preben and Anna Simonsen’s Foundation;The Foundation of the Danish Association ofPharmacists; and Clinical Institute, University ofSouthern Denmark.
Antiviral Therapy 11:5 599
Risk of transmitting drug-resistant HIV
Figure 5. Prevalence of patients with possible drug-resistant HIV among all patients at risk of transmitting HIV
Label numbers indicate numerator values. Numerator: patients with previous virological failure (viral load [VL] >1,000 copies/ml for 120 days while on highly activeantiretroviral therapy, or 180 days of mono- or dual-nucleoside reverse transcriptase inhibitor [NRTI] therapy) and a current VL >1,000 copies/ml. Denominator: allpatients with a current VL >1,000 copies/ml under observation on 1 January each year. NNRTI, non-nucleoside reverse transcriptase inhibitor; PI, protease inhibitor.
0.6
0.2
0.1
0.3
0.4
0.5
0
Denominator values Year
2004200320022001200019991998
142163
209264
279
226
393
429 420
391340
311
250213
60
1 7
39
71
110121 119 113
241
1997
686776822851926922918653
NNRTI failure
PI failure
NRTI failure
References1. Richman DD, Morton SC, Wrin T, et al. The prevalence of
antiretroviral drug resistance in the United States. AIDS2004; 18:1393–1401.
2. Phillips AN, Dunn D, Sabin C, et al. Long term probabilityof detection of HIV-1 drug resistance after starting anti-retroviral therapy in routine clinical practice. AIDS 2005;19:487–494.
3. Blower SM, Aschenbach AN, Gershengorn HB, Kahn JO.Predicting the unpredictable: transmission of drug-resistantHIV. Nat Med 2001; 7:1016–1020.
4. Pillay D, Green H, Matthias R, et al.; UK CollaborativeGroup on HIV Drug Resistance. Estimating HIV-1 drugresistance in antiretroviral-treated individuals in the UnitedKingdom. J Infect Dis 2005; 192:967–973.
5. Health Protection Agency. An update on HIV drug resis-tance in the United Kingdom. Communicable DiseaseWeekly Review 2004; 13. Available from:http://www.hpa.org.uk/cdr/PDFfiles/2004/cdr4804.pdf.
6. Dunn DT, Green H, Matthias R, et al. Prevalence ofreduced drug susceptibility in treatment-naive patients inthe UK. 13th International HIV Drug ResistanceWorkshop. 8–12 June 2004, Tenerife, Spain. Abstract 96.
7. Little SJ, Holte S, Routy JP, et al. Antiretroviral-drug resis-tance among patients recently infected with HIV. N Engl JMed 2002; 347:385–394.
8. Pillay D. Current patterns in the epidemiology of primaryHIV drug resistance in North America and Europe. AntivirTher 2004; 9:695–702.
9. Routy JP, Machouf N, Edwardes MD, et al. Factors associ-ated with a decrease in the prevalence of drug resistance innewly HIV-1 infected individuals in Montreal. AIDS 2004;18:2305–2312.
10. Ammaranond P, Cunningham P, Oelrichs R, et al. Rates oftransmission of antiretroviral drug resistant strains of HIV-1. J Clin Virol 2003; 26:153–161.
11. Bezemer D, Jurriaans S, Prins M, et al. Declining trend intransmission of drug-resistant HIV-1 in Amsterdam. AIDS2004; 18:1571–1577.
12. Wensing AM, van de Vijver DA, Angarano G, et al.Prevalence of drug-resistant HIV-1 variants in untreatedindividuals in Europe: implications for clinical manage-ment. J Infect Dis 2005; 192:958–966.
13. Jorgensen LB, Christensen MB, Gerstoft J, et al. Prevalenceof drug resistance mutations and non-B subtypes in newlydiagnosed HIV-1 patients in Denmark. Scand J Infect Dis2003; 35:800–807.
14. Jensen-Fangel S, Pedersen C, Larsen CS, Tauris P, Møller A,Obel N. Changing demographics in an HIV-infected popu-lation: results from an observational cohort study inWestern Denmark. Scand J Infect Dis 2001; 33:765–770.
15. Lohse N, Hansen AB, Jensen-Fangel S, et al. Demographicsof HIV-1 infection in Denmark: Results from The DanishHIV Cohort Study. Scand J Infect Dis 2005; 37:338–343.
16. Lohse N, Obel N, Kronborg G, et al. Declining risk oftriple-class antiretroviral drug failure in Danish HIV-infected individuals. AIDS 2005; 19:815–822.
17. Ledergerber B, Lundgren JD, Walker AS, et al. Predictorsof trend in CD4-positive T-cell count and mortality amongHIV-1-infected individuals with virological failure to allthree antiretroviral-drug classes. Lancet 2004; 364:51–62.
18. Napravnik S, Edwards D, Stewart P, Stalzer B, Matteson E,Eron JJ Jr. HIV-1 drug resistance evolution among patientson potent combination antiretroviral therapy with
detectable viremia. J Acquir Immune Defic Syndr 2005;40:34–40.
19. Mocroft A, Ledergerber B, Viard JP, et al. Time to virolog-ical failure of 3 classes of antiretrovirals after initiation ofhighly active antiretroviral therapy: results from theEuroSIDA study group. J Infect Dis 2004; 190:1947–1956.
20. Lohse N, Kronborg G, Gerstoft J, et al. Virological controlduring the first 6–18 months after initiating HAART as apredictor for mortality, CD4+ cell increase, and viralsuppression. Clin Infect Dis 2006; 42:136–144.
21. Roge B, Barfod T, Kirk O, et al. Resistance profiles andadherence at primary virological failure in three differenthighly active antiretroviral therapy regimens: analysis offailure rates in a randomized study. HIV Med 2004;5:344–351.
22. Walmsley S, Bernstein B, King M, et al. Lopinavir-ritonavirversus nelfinavir for the initial treatment of HIV infection.N Engl J Med 2002; 346:2039–2046.
23. Dybul M, Fauci AS, Bartlett JG, Kaplan JE, Pau AK.Guidelines for using antiretroviral agents among HIV-infected adults and adolescents. Ann Intern Med 2002;137:381–433.
24. Yerly S, Jost S, Telenti A, et al. Infrequent transmission ofHIV-1 drug-resistant variants. Antivir Ther 2004;9:375–384.
25. Leigh Brown AJ, Frost SD, Mathews WC, et al.Transmission fitness of drug-resistant human immunodefi-ciency virus and the prevalence of resistance in theantiretroviral-treated population. J Infect Dis 2003;187:683–686.
26. Auvert B, Taljaard D, Lagarde E, Sobngwi-Tambekou J,Sitta R, Puren A. Randomized, controlled intervention trialof male circumcision for reduction of HIV infection risk:The ANRS 1265 Trial. PLoS Med 2005; 2:e298.
27. Sexton J, Garnett G, Rottingen JA. Metaanalysis andmetaregression in interpreting study variability in theimpact of sexually transmitted diseases on susceptibility toHIV infection. Sex Transm Dis 2005; 32:351–357.
28. Shaffer N, Roongpisuthipong A, Siriwasin W, et al.Maternal virus load and perinatal human immunodefi-ciency virus type 1 subtype E transmission, Thailand.Bangkok Collaborative Perinatal HIV Transmission StudyGroup. J Infect Dis 1999; 179:590–599.
29. Quinn TC, Wawer MJ, Sewankambo N, et al. Viral loadand heterosexual transmission of human immunodeficiencyvirus type 1. Rakai Project Study Group. N Engl J Med2000; 342:921–929.
30. Gray RH, Wawer MJ, Brookmeyer R, et al. Probability ofHIV-1 transmission per coital act in monogamous, hetero-sexual, HIV-1-discordant couples in Rakai, Uganda. Lancet2001; 357:1149–1153.
31. Castilla J, Del Romero J, Hernando V, Marincovich B,Garcia S, Rodriguez C. Effectiveness of highly active anti-retroviral therapy in reducing heterosexual transmission ofHIV. J Acquir Immune Defic Syndr 2005; 40:96–101.
32. Statens Serum Institut. Annual HIV/AIDS Report 2004.EPI-news 36; 2005. Available from: http://www.ssi.dk/sw32677.asp.
33. Kofoed K, Gerstoft J, Mathiesen LR, Benfield T. Syphilisand human immunodeficiency virus (HIV)-1 coinfection:influence on CD4 T-cell count, HIV-1 viral load, and treat-ment response. Sex Transm Dis 2006; 33:143–148.
34. Mocroft A, Ledergerber B, Katlama C, et al. Decline in theAIDS and death rates in the EuroSIDA study: an observa-tional study. Lancet 2003; 362:22–29.
N Lohse et al.
© 2006 International Medical Press600
Accepted for publication 5 April 2006

Objective: To examine the prevalence of drug-resistance-associated mutations in HIV patients with triple-drugclass virological failure (TCF) and their association withlong-term mortality.Design: Population-based study from the Danish HIVCohort Study (DHCS).Methods: We included all patients in the DHCS whoexperienced TCF between January 1995 and November2004, and we performed genotypic resistance tests forInternational AIDS Society (IAS)-USA primary muta-tions on virus from plasma samples taken around thedate of TCF. We computed time to all-cause deathfrom date of TCF. The relative risk of death accordingto the number of mutations and individual mutationswas estimated by Cox regression analysis and adjustedfor potential confounders.
Results: Resistance tests were done for 133 of the 179patients who experienced TCF. The median number ofresistance mutations was eight (interquartile range2–10), and 81 (61%) patients had mutations conferringresistance towards all three major drug classes. In aregression model adjusted for CD4+ T-cell count, HIVRNA, year of TCF, age, gender and previous inferior anti-retroviral therapy, harbouring ≥≥9 versus ≤≤8 mutationswas associated with increased mortality (mortality rateratio [MRR] 2.3 [95% confidence interval (CI) 1.1–4.8]),as were the individual mutations T215Y (MRR 3.4 [95%CI 1.6–7.0]), G190A/S (MRR 3.2 [95% CI 1.6–6.6]) andV82F/A/T/S (MRR 2.5 [95% CI 1.2–5.3]).Conclusions: In HIV patients with TCF, the total numberof genotypic resistance mutations and specific singlemutations predicted mortality.
Genotypic drug resistance and long-term mortality inpatients with triple-class antiretroviral drug failureNicolai Lohse1,2*, Louise B Jørgensen3, Gitte Kronborg4, Axel Møller 5, Birgit Kvinesdal 6,Henrik T Sørensen1,7, Niels Obel2,8, Jan Gerstoft 9 and the Danish HIV Cohort Study
1Department of Clinical Epidemiology, Århus University Hospital, Århus, Denmark2The Danish HIV Cohort Study, Copenhagen University Hospital, Rigshospitalet, Copenhagen, Denmark3Statens Serum Institut, Copenhagen, Denmark4Department of Infectious Diseases, Copenhagen University Hospital, Hvidovre, Denmark5Department of Infectious Diseases, Kolding Hospital, Kolding, Denmark6Department of Infectious Diseases, Helsingør Hospital, Helsingør, Denmark7School of Public Health, Boston University, Boston, MA, USA8Department of Infectious Diseases, Odense University Hospital, Odense, Denmark9Department of Infectious Diseases, Copenhagen University Hospital, Rigshospitalet, Copenhagen, Denmark
*Corresponding author: Tel: +45 89424800; Fax: +45 89424801; E-mail: [email protected]
Antiviral Therapy 12:909–917
Virological failure to all three major drug classes(nucleoside reverse transcriptase inhibitors [NRTIs],non-nucleoside reverse transcriptase inhibitors[NNRTIs] and protease inhibitors [PIs]), that is, triple-class failure (TCF), in HIV patients is an importantclinical problem and is associated with a poor prog-nosis [1,2], with CD4+ T-cell count and plasma HIVRNA (viral load [VL]) at time of TCF as independentprognostic factors for death [3]. Virological failure isassociated with development of drug resistance [4].Therefore, patients with TCF are likely to harbourmultiple drug resistance mutations. A few studies haveexamined the association between resistance muta-tions and mortality in treatment-experienced patients
[5–7]. Lucas et al. [7] found no association betweenthe number of resistance mutations and mortality,whereas Zaccarelli et al. [6] found that mortality wasassociated with multiple-drug class-wide resistance.Most attempts to clarify the association between resis-tance mutations and clinical outcome have beenhampered by convenience sampling (that is, includingonly patients in whom resistance testing wasperformed for reasons other than inclusion in thestudy), and no previous studies have examined theassociation between resistance mutations and clinicaloutcome in a population of patients with TCF.Therefore, the goals of the present study were to (i)examine the prevalence of mutations in patients with
Introduction
© 2007 International Medical Press 1359-6535 909
Lohse 29/8/07 17:11 Page 909

TCF and (ii) examine how resistance mutations influencelong-term mortality in TCF patients, while controlling forother prognostic factors.
Materials and methods
The Danish HIV Cohort Study (DHCS)DHCS is a prospective, nationwide, population-basedcohort study of all HIV-infected individuals treated inDanish HIV clinics since 1 January 1995 [8]. Thestudy is ongoing, with continuous enrolment. HIVtreatment in Denmark is restricted to eight specializedcentres, and the Danish health care system providesfree tax-supported medical care, including antiretro-viral treatment. Updates of the study cohort areperformed annually. Complete data on all patientsseen in any of the centres since 1 January 1995 havebeen collected from patient files and entered into theDHCS database.
Virological failureTCF was defined as in a previous study [1]. Virologicalfailure was defined as a VL>1,000 copies/ml for a totalof 120 days (not necessarily successive) while receivingtreatment with a given class of drug. Periods of treat-ment interruptions, whether physician- or patient-initiated, were not counted as failure time. VL wasdefined as >1,000 copies/ml during the period betweentwo consecutive VL measurements >1,000 copies/ml.Failure of a drug class could occur whether it wasadministered alone or as part of a multidrug regimen.The time that TCF occurred was the date the patientmet the failure requirements for three drug classes. AllDHCS patients that experienced TCF up to 1November 2004 were eligible for the study.
GenotypingWe performed genotypic resistance tests forInternational Aids Society (IAS)-USA 2005 primary drugresistance mutations [9] on virus from plasma samplestaken during a period 1 month before to 6 months afterthe date of TCF. We chose this interval to ensure thatresistance mutations were also present on the date ofTCF. On the basis of our dynamic definition of virolog-ical failure, the date of TCF typically occurs at a timebetween two dates of VL measuring. Consequently,samples were rarely available for that specific date.
Mortality dataDates of death and migration were obtained frompatient files and confirmed by the Civil RegistrationSystem [10]. Causes of death were registered in DHCSand were divided into HIV-related (AIDS-definingillnesses and bacterial infections), non-HIV-related(other causes) and unknown.
Statistical methodsFollow up began at the date of TCF onset (baseline)and continued until death, last clinic visit or 1 May2006. We computed Kaplan–Meier survival curves forthe patients according to the main study variables. Therelative risk of death associated with individual muta-tions, and the number of mutations (that is, more thanversus fewer than the median) were estimated by Coxproportional hazard analysis. The influence of thefollowing covariates on mortality estimates was evalu-ated in bivariate models, and in a model including themall: CD4+ T-cell count at baseline (<50, 50–200 or >200cells/μl) or time-updated CD4+ T-cell count, carryingforward the most recent observation; log10 VL at base-line (<4, 4–5, >5 log10 copies/ml); gender; age at base-line; being antiretroviral-drug-naive prior to initiatinghighly active antiretroviral therapy (HAART); and yearof TCF onset. As proposed by others [11], the influenceof individual mutations was not assessed if the muta-tion was present in <10% of the study population. Theproportional hazards assumption was tested based onSchoenfeld residuals and was found to be appropriate.Interactions of key variables were examined by strati-fied analyses. Patient characteristics were comparedwith χ2 test and Student’s t-test. A significance level of0.05 was used for all analyses. Analyses wereperformed using Stata (College Station, TX, USA)statistical software, version 9.2.
Approvals and permissionsThe study was approved by the Danish Data ProtectionAgency. Because the study did not entail any interac-tion with patients, it was not necessary to obtainpatient consent or approval from the ethics committee.
Results
Study populationHAART was initiated in 2,797 DHCS patients duringthe study period. The median time of follow up afterHAART initiation was 4.1 years (interquartile range[IQR] 1.9–6.3).
One-hundred and seventy-nine patients developedTCF. For 133 of those patients, a resistance test, donewithin the required interval surrounding the date ofTCF, was available. Twenty-nine percent of the testswere done within 1 month of the date of TCF, and74% were done within 3 months. Only one patientexperienced TCF after 2001. At the time of TCF, themean number of days with failure while on HAARTfor each drug class was 754 days for NRTIs,167 days for NNRTIs and 688 days for PIs.Comparison of the 133 patients with and the 46patients without an available resistance test revealeda significant difference in a single variable: number of
N Lohse et al.
© 2007 International Medical Press910
Lohse 29/8/07 17:11 Page 910

days with NNRTI failure (167 days versus 192 days,P=0.01) (Table 1).
Resistance patternThe 133 patients with an available resistance test hada mean of 6.3 mutations (median 8; IQR 2–10),including 3.6 NRTI-associated mutations, 1.3NNRTI-associated mutations and 1.4 primary PI-associated mutations. Of those patients 127 (95%)had ≥1 drug resistance mutation. If only primary PImutations were counted, the number of patients with≥1 resistance mutation was 117 (88%). One-hundredand one (76%) of the patients had resistance muta-tions to ≥2 drug classes, and 81 (61%) had resistancemutations towards all three major drug classes. Thefrequency of individual resistance mutations isshown in Table 2. The six most frequent NRTI-associated mutations observed were at codons 215
(60%), 184 (50%), 41 (49%), 67 (40%), 210 (35%)and 219 (29%). The most frequent NNRTI-associ-ated mutations were at codons 103 (53%) and 181(25%), and the most frequent primary PI-associatedmutations were at codons 90 (41%), 82 (33%), 46(30%) and 84 (14%).
Mortality after TCFThe median time of follow up of the 179 patients afterbaseline was 4.3 years (IQR 2.8–5.5). The mortalityrate after baseline was 70 (95% confidence interval[CI] 54–92) per 1,000 person-years (PYR), as opposedto an overall mortality in DHCS after initiation ofHAART of 29 (95% CI 26–32) per 1,000 PYR.Patients in the upper half, harbouring ≥9 mutations,had increased mortality compared with patientsharbouring ≤8 mutations (MRR 2.3; 95% CI 1.2–4.3)(Table 3; Figure 1). None of the other covariates
Antiviral Therapy 12:6 911
Drug resistance and mortality
Characteristics Patients with resistance test Patients without resistance test P-value*
Total, n (%) 133 (100) 46 (100)Male gender, n (%) 101 (76) 34 (74) 0.783†
ART-naive at initiation of HAART, n (%) 24 (18) 14 (30) 0.077†
Risk exposure, n (%)MSM 71 (53) 22 (48) 0.573†
Heterosexual contact 45 (34) 15 (33)IDU 5 (4) 4 (9)Other 12 (9) 5 (11)
AIDS before initiation of HAART, n (%) 65 (49) 17 (37) 0.162†
Race, n (%)Caucasian 109 (82) 35 (76) 0.510†
Black African 20 (15) 8 (17)Other 4 (3) 3 (7)
Year of TCF, n (%)1997 24 (18) 5 (11) 0.241†
1998 32 (24) 15 (33)1999 37 (28) 16 (35)2000 29 (22) 6 (13)2001 10 (8) 2 (4)2002 1 (1) 1 (2)2003 0 (0) 1 (2)
CD4+ T-cell count at initiation of HAART‡, cells/μl 80 (30–170) 100 (22–220) 0.363§
CD4+ T-cell count at time of TCF‡, cells/μl 194 (88–340) 180 (80–310) 0.643§
Log10 VL at initiation of HAART‡, cells/μl 5.2 (4.3–5.6) 5.1 (4.1–5.4) 0.553§
Log10 VL at time of TCF‡, cells/μl 4.3 (3.7–4.9) 3.9 (3.5–5.0) 0.376§
Age at initiation of HAART‡, cells/μl 36.8 (30.1–46.4) 38.9 (34.1–43.9) 0.734§
Age at time of TCF‡, years 40.0 (33.2–49.3) 42.8 (37.4–46.0) 0.609§
Mean time with failure, daysNRTI 754 696 0.373§
NNRTI 167 192 0.010§
PI 688 610 0.230§
*Comparison of patients with and without resistance test. †χ2 test. ‡Values given as median (interquartile range). §Student´s t-test. ART, antiretroviral therapy; HAART,highly active antiretroviral therapy; IDU, intravenous drug users; MSM, men who have sex with men; NNRTI, non-nucleoside reverse transcriptase inhibitor; NRTI,nucleoside reverse transcriptase inhibitor; PI, protease inhibitor; TCF, triple-class failure; VL, viral load.
Table 1. Patient characteristics
Lohse 29/8/07 17:11 Page 911

examined changed the estimated regression coefficientmore than 15%, and in the full adjusted model theMRR remained at 2.3 (95% CI 1.1–4.8).
Other prognostic factors for death were CD4+ T-cellcount at baseline (50–200 versus >200, MRR 2.9 [95%CI 1.4–6.2]; <50 versus >200, MRR 7.5 [95% CI
N Lohse et al.
© 2007 International Medical Press912
Cox regression analysis of time to all-cause death after TCFPatients with Distribution of individual Unadjusted Adjusted*
Position mutation, n % mutations (n patients) MRR 95% CI P–value MRR 95% CI P–value
NRTIT215C/E/F/I/V/Y 80 (60) C (2), E (1), F (13), 1.9 0.9–4.0 0.071 1.9 0.9–4.2 0.110
I (2), V (2), Y (60)T215Y mutation only 60 (45) Y 2.8 1.4–5.3 0.003 3.4 1.6–7.0 0.008T215F mutation only 13 (10) F 0.6 0.2–2.0 0.413 0.4 0.1–1.5 0.184M184V/I 66 (50) I (3), V (63) 0.8 0.5–4.6 0.605 0.9 0.5–1.8 0.847M41L 65 (49) L (65) 2.2 1.1–4.4 0.020 1.8 0.8–3.9 0.138D67N 53 (40) N (53) 1.0 0.5–1.9 0.980 0.9 0.4–1.7 0.656L210W 47 (35) W (47) 2.0 1.1–3.8 0.028 1.8 0.9–3.6 0.114K219Q/E 38 (29) E (16), Q (22) 0.7 0.3–1.4 0.264 0.5 0.2–1.0 0.054K70R 33 (25) R (33) 0.6 0.3–1.3 0.211 0.5 0.2–1.1 0.098L74V 31 (23) V (31) 1.5 0.8–2.9 0.228 1.9 0.9–3.9 0.074V118I 25 (19) I (25) 2.3 1.1–4.7 0.019 1.9 0.9–4.1 0.083T69D/N 21 (16) D (11), N (10) 1.0 0.4–2.4 0.988 0.7 0.3–1.7 0.429E44D 18 (14) D (18) 2.4 0.5–4.8 0.019 2.0 0.9–4.3 0.079
NRTI (MDR)A62V 2 (2) V (2) – – – – – –
NNRTIK103N 71 (53) N (71) 0.8 0.4–1.5 0.444 1.0 0.5–1.9 0.927Y181C/I 33 (25) C (28), I (5) 2.0 1.6–3.8 0.033 1.6 0.8–3.4 0.179G190A/S 26 (20) A (21), S (5) 3.0 1.6–5.8 0.001 3.2 1.6–6.6 0.002L100I 17 (13) I (17) 1.2 0.5–2.9 0.691 1.5 0.6–3.8 0.398V108I 12 (9) I (12) – – – – – –V106A/M 8 (6) A (3), M (5) – – – – – –Y188L/C/H 7 (5) C (1), H (1), L (5) – – – – – –P225H 3 (2) H (3) – – – – – –
Primary PIL90M 54 (41) M (54) 1.0 0.5–1.9 0.987 1.0 0.5–2.0 1.000V82F/A/T/S 44 (33) A (30), F (4), S (3), T (7) 1.8 1.0–3.4 0.058 2.5 1.2–5.3 0.018M46I/L 40 (30) I (33), L (7) 1.1 0.6–2.2 0.677 1.0 0.5–2.0 0.989I84V 18 (14) V (18) 1.0 0.4–2.4 0.959 0.8 0.3–2.1 0.694G48V 6 (5) V (6) – – – – – –D30N 6 (5) N (6) – – – – – –N88D/S 4 (3) D (2), S (2) – – – – – –L33F 3 (2) F (3) – – – – – –V32I 2 (2) I (2) – – – – – –I47V 2 (2) V (2) – – – – – –I50V/L 1 (1) V (1) – – – – – –
No major resistance 16 (12) – – – – – –mutations
One class 16 (12) – – – – – –
Two classes 20 (15) – – – – – –
Three classes 81 (61) – – – – – –
The following International AIDS Society mutations were not detected in any of the study patients: K65R, Y115F, T69(SXX), V75I, F77L, F116Y, Q151M, M230L and P236L.Mortality rate ratio (MRR) was estimated only for those mutations present in ≥10% of the study patients. *Adjusted for CD4+ T-cell count, log10VL, age at baseline, gender,year of triple class failure (TCF) and being antiretroviral therapy (ART)-naive at initiation of highly active ART. CI, confidence interval; MDR, multidrug resistance mutations;NNRTI, non-nucleoside reverse transcriptase inhibitor mutations; NRTI, nucleoside reverse transcriptase inhibitor mutations; PI, protease inhibitor mutations; VL, viral load.
Table 2. Mutations present at time of TCF and their association with mortality
Lohse 29/8/07 17:11 Page 912
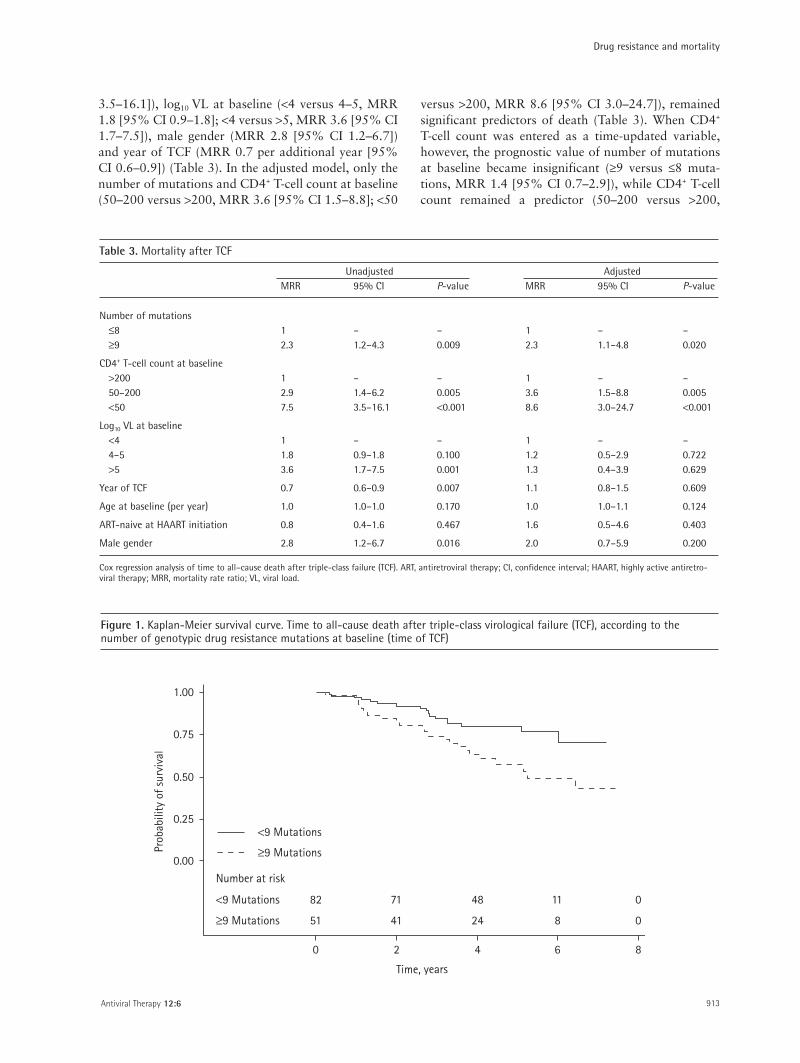
3.5–16.1]), log10 VL at baseline (<4 versus 4–5, MRR1.8 [95% CI 0.9–1.8]; <4 versus >5, MRR 3.6 [95% CI1.7–7.5]), male gender (MRR 2.8 [95% CI 1.2–6.7])and year of TCF (MRR 0.7 per additional year [95%CI 0.6–0.9]) (Table 3). In the adjusted model, only thenumber of mutations and CD4+ T-cell count at baseline(50–200 versus >200, MRR 3.6 [95% CI 1.5–8.8]; <50
versus >200, MRR 8.6 [95% CI 3.0–24.7]), remainedsignificant predictors of death (Table 3). When CD4+
T-cell count was entered as a time-updated variable,however, the prognostic value of number of mutationsat baseline became insignificant (≥9 versus ≤8 muta-tions, MRR 1.4 [95% CI 0.7–2.9]), while CD4+ T-cellcount remained a predictor (50–200 versus >200,
Antiviral Therapy 12:6 913
Drug resistance and mortality
Unadjusted AdjustedMRR 95% CI P-value MRR 95% CI P-value
Number of mutations≤8 1 – – 1 – –≥9 2.3 1.2–4.3 0.009 2.3 1.1–4.8 0.020
CD4+ T-cell count at baseline>200 1 – – 1 – –50–200 2.9 1.4–6.2 0.005 3.6 1.5–8.8 0.005<50 7.5 3.5–16.1 <0.001 8.6 3.0–24.7 <0.001
Log10 VL at baseline<4 1 – – 1 – –4–5 1.8 0.9–1.8 0.100 1.2 0.5–2.9 0.722>5 3.6 1.7–7.5 0.001 1.3 0.4–3.9 0.629
Year of TCF 0.7 0.6–0.9 0.007 1.1 0.8–1.5 0.609
Age at baseline (per year) 1.0 1.0–1.0 0.170 1.0 1.0–1.1 0.124
ART-naive at HAART initiation 0.8 0.4–1.6 0.467 1.6 0.5–4.6 0.403
Male gender 2.8 1.2–6.7 0.016 2.0 0.7–5.9 0.200
Cox regression analysis of time to all–cause death after triple-class failure (TCF). ART, antiretroviral therapy; CI, confidence interval; HAART, highly active antiretro-viral therapy; MRR, mortality rate ratio; VL, viral load.
Table 3. Mortality after TCF
0.75
0.50
0.25
0.00
1.00
0 2 4 6 8
Time, years
Prob
abili
ty o
f sur
viva
l
Number at risk
<9 Mutations
≥9 Mutations
82
51
71
41
48
24
11
8
0
0
≥9 Mutations
<9 Mutations
Figure 1. Kaplan-Meier survival curve. Time to all-cause death after triple-class virological failure (TCF), according to thenumber of genotypic drug resistance mutations at baseline (time of TCF)
Lohse 29/8/07 17:11 Page 913

MRR 3.1 [95% CI 1.2–8.0]; <50 versus >200, MRR9.9 [95% CI 3.9–25.4]) (Table 4).
The following individual mutations were significantlyassociated with increased mortality in the adjustedmodel (Table 2): G190A/S, MRR 3.4 (95% CI 1.6–7.0);T215Y, MRR 3.2 (95% CI 1.6–6.6); and V82F/A/T/S,MRR 2.5 (95% CI 1.2–5.3). When these three muta-tions and number of mutations were included in thesame regression model, the prognostic value of numberof mutations (MRR 0.9 [95% CI 0.4–2.3]) andV82F/A/T/S (MRR 1.1 [95% CI 0.5–2.7]) decreased,whereas CD4+ T-cell count at baseline, T215Y andG190A/S remained marked and statistically significantprognostic factors for death (Table 4). Finally, whenincluding time-updated CD4+ T-cell count instead ofCD4+ T-cell count at baseline in that same model, onlythe T215Y mutation remained a prognostic factor fordeath (MRR 3.0 [95% CI 1.3–7.0]), along with thelatest CD4+ T-cell count (50–200 versus >200, MRR 3.0[95% CI 1.1–7.9]; <50 versus >200, MRR 9.6 [95% CI3.7–25.1]) (Table 4). Substituting the thymidineanalogue mutation (TAM)-1 pattern [12,13](M41L+L210W+T215Y present at the same time) forT215Y in the model gave similar and significant results(data not shown). No mutations were significantly asso-ciated with decreased mortality, and we found no asso-ciation between mortality and the number of drugclasses with resistance mutations (data not shown).Causes of death were 60% HIV-related, 30% non-HIVrelated and 10% unknown.
The above-mentioned Cox models included a largenumber of variables for a dataset with only 40 deaths.However, if the analyses were repeated withoutadjusting for log10 VL at baseline, age at baseline,gender, year of TCF and being antiretroviral-drug-naive before initiation of HAART, the resulting regres-sion coefficients were of equal magnitude and equallystatistically significant (data not shown). Intravenousdrug use (IDU) was seen in only five persons (Table 1)and therefore not assessed as an independent risk factor.To explore the potential confounding effect, we addedIDU to the four multivariate regression models, butobserved no substantial change in regression coefficientsor their precision (data not shown).
Discussion
In this population-based study we found that morethan three of five HIV patients with TCF had resistancemutations to all three drug classes. Patients with a highnumber of drug resistance mutations had a 2.3-foldincreased risk of death, independent of CD4+ T-cell countat time of TCF. Furthermore, some specific mutationswere associated with increased mortality.
Our study had a number of strengths. For instance,the population-based design allowed us to identify allpatients with TCF in Denmark with complete follow upand extensive covariate data. We were able to identifyresistance test results on most patients near the date ofTCF. Follow up after TCF was long-term, loss of follow
N Lohse et al.
© 2007 International Medical Press914
Adjusted for time-updated Adjusted for time-updated Adjusted for influential CD4+ T-cell count and
CD4+ T-cell count* individual mutations* influential individual mutations*MRR 95% CI P-value MRR 95% CI P-value MRR 95% CI P-value
Number of mutations≤8 1 – – 1 – – 1 – –≥9 1.4 0.7–2.9 0.348 0.9 0.4–2.3 0.896 0.8 0.3–1.9 0.556
CD4+ T-cell count at baseline>200 – – – 1 – – – – –50–200 – – – 3.4 1.4–8.4 0.008 – – –<50 – – – 10.5 3.6–30.5 <0.001 – – –
CD4+ T-cell count, time–updated>200 1 – – – – – 1 – –50–200 3.1 1.2–8.0 0.020 – – – 3.0 1.1–7.9 0.026<50 9.9 3.9–25.4 <0.001 – – – 9.6 3.7–25.1 <0.001
T215Y – – – 3.0 1.3–7.4 0.014 3.0 1.2–7.0 0.014
G190A/S – – – 2.7 1.2–6.4 0.023 1.7 0.7–3.9 0.228
V82F/A/T/S – – – 1.1 0.5–2.7 0.760 0.8 0.4–1.9 0.656
Cox regression analysis of time to all–cause death after triple-class failure (TCF). *Further adjusted for log10 viral load (VL) and age at baseline, gender, year of TCF and beingantiretroviral therapy (ART)-naive at initiation of highly active ART. CI, confidence interval; MRR, mortality rate ratio; VL, viral load.
Table 4. Mortality after TCF
Lohse 29/8/07 17:11 Page 914

up was minimal, and we evaluated a clear clinicalendpoint: death.
Increased mortality in patients with greaternumbers of resistance mutations could reflect a directeffect whereby resistance mutations cause lowersusceptibility to antiviral drugs and lead to fasterdisease progression. The effect of the most recent(time-updated) CD4+ T-cell count on the relative riskestimates supports this theory, revealing an associationbetween a high number of mutations at the time ofTCF and subsequent low CD4+ T-cell count. However,the T215Y mutation, part of the TAM-1 pattern[12,13], was a predictor of death at all time-updatedCD4+ T-cell count levels, indicating that the effect ofmutations on mortality was indirect and exertedthrough mechanisms other than lowering of the CD4+
T-cell count. The T215Y mutation is frequently gener-ated during non-suppressive mono- or dual-NRTItherapy, which was restricted to patients withadvanced HIV disease before HAART was a standardHIV treatment in Denmark. Thus, the T215Y muta-tion might be a marker for patients who were alreadyimmunodeficient in the early 1990s and not only amarker for cross-resistance to the NRTI class of drug.The T215Y mutation is also a marker for the TAM-1pattern, which is associated with more extensive cross-resistance [14], longer use of HAART [15] and greaterrelative fitness [16] than the TAM-2 pattern.
It is reassuring that, in our study of TCF, one mutationfrom each of the three drug classes was associated withmortality, independent of the total number of mutations.All three mutations are associated with a number ofother mutations. For instance 215Y is associated withmutations in positions 41, 44, 67, 118 and 210 [20];G190A/S is associated with mutations in position 181of the reverse transcriptase gene [21]; and V82A isassociated with mutations in positions 46 and 48 of theprotease gene [22]. The G190A/S mutation [21] hasbeen observed primarily during therapy with nevi-rapine, didanosine and zidovudine, an outdated combi-nation; the V82F/A/T/S mutation confers resistance toregimens such as ritonavir and indinavir [23], as well asto ritonavir-boosted saquinavir [9]. Thus, all threemutations are associated with exposure to antiretro-viral regimens rarely used anymore. In summary, muta-tions and mortality seemed to be associated withprevious non-suppressive therapy, longer duration ofHIV infection and more advanced early disease. Thus,the mutations could be proxies for unmeasured factorsknown to be associated with poor survival. Anotherfactor could be low compliance to treatment regimens,which is associated with increased mortality throughcoexisting conditions like mental illness and substanceabuse [17–19], and presumably also through non-compliance to other essential therapies. On the other
hand the assumption that hard-core non-compliersfailing with wild-type virus fared worst was notsupported by our data. Other potential confounderscould be inferior HIV care and/or treatment by inexpe-rienced physicians, but this would be unlikely in oursetting where treatment and care is free and limited tospecialized clinics. Hence, these numerous identified orpotential associations might all be contributory causesto the observed mortality, but no conclusion can bemade from our data.
Drug-resistant HIV can be less fit than wild-typevirus [24], and cross-sectional studies have found a U-shaped association between the number of resis-tance mutations and plasma concentrations of HIVRNA, suggesting that an increasing number of muta-tions will eventually overcome the reduced fitness thatallows virological suppression at lower levels of resis-tance [11,25]. Twelve percent of our patients had noresistance mutations detected at the time of TCF.Some of these patients could be totally non-compliant, fulfilling our criteria for virological failurewithout ever taking drugs that would induce resis-tance mutations. In fact, the very low rate of trans-mitted resistance in Denmark [26,27] makes it likelythat the majority of totally non-compliant patientswill have no resistance mutations. In our follow-upstudy, these patients had plenty of time to improvecompliance, which might explain why we did not finda similar U-shaped association between the number ofmutations and mortality.
Previous studies of mutations and mortality[6,7,28] included only 14–19 patients with triple-class mutations, whereas in the present study 81(61%) of the patients with confirmed TCF had majormutations to all three drug classes. Thus, our datasuggest that the virological failure model [2,3]captures patients in whom viral resistance is anessential component of the failure.
Because we analysed a fairly large number ofmutations (that is, 21) the observed effect of indi-vidual mutations might be a chance finding.However, the panel of mutations that we analysed wereselected by the IAS-USA and on the basis of biologicalrelevance [9], and we used a minimum prevalence crite-rion of 10% as suggested by others [11].
Our study has some further limitations. Firstly,resistance tests within the analytical window wereavailable for only 133/179 patients with TCF.However, comparison of characteristics of the twogroups revealed no significant differences, makingmajor bias in selection unlikely. Secondly, the numberof resistance mutations we detected is likely to be anunderestimation, because particular mutationsselected during previous antiretroviral regimens mightgo undetected when the test is performed without
Antiviral Therapy 12:6 915
Drug resistance and mortality
Lohse 29/8/07 17:11 Page 915
pressure on the mutation in question. However, thenumber of undetected mutations is assumed to besimilar in all patients, because all were triple-drug-class-experienced and would, therefore, previouslyhave been exposed to drugs not included in theirregimen at the time of resistance testing. Thus, thisinformation bias would probably not affect the associ-ation between mortality and the number of mutations.Thirdly, with only 40 deaths, the study was not largeenough for more advanced analyses. For example, wecould not analyse the effect of rare resistance mutationpatterns or the effect of individual drug combinationregimens in association with different resistance muta-tions. Nor did we analyse outcome in relation to thenumber of drugs to which the virus was sensitivebecause of frequent regimen switches and becausebeing drug-resistant versus drug-sensitive in thisscenario is often not an all-or-none phenomenon.Finally, the development and appearance of drugmutations depend on the drug combinations used andthe order in which they are used. The vast majority ofthe failures occurred early in the study period, at atime when most PI regimens were unboosted, and ourfindings might not apply to patients experiencing TCFtoday, who would probably have a different treatmenthistory. However, the prevalence and distribution ofmutations in our study was comparable to that foundin other studies [25].
We conclude that in patients with TCF the totalnumber of genotypic resistance mutations and specificsingle mutations predict mortality and are associatedwith a further decline in CD4+ T-cell count. Themajority of these mutations appear to have accumu-lated during suboptimal therapies in the 1990s. WhenTCF occurs, resistance is an important contributor tothe increased mortality associated with the condition.We await the introduction of further drug classes tosee whether this will eliminate failure-relatedmortality, or whether we will face resistance to five orsix drug classes in the future.
Acknowledgements
The study was supported by grants from the DanishAIDS Foundation, Odense University Hospital,Preben and Anna Simonsen’s Foundation, theFoundation of the Danish Association of Pharmacists,the Danish Medical Research Council and the ClinicalInstitute of the University of Southern Denmark. Nofunding sources were involved in study design, datacollection, analysis, report writing or the decision tosubmit the paper.
Centres in The Danish HIV Cohort Study:Departments of Infectious Diseases at CopenhagenUniversity Hospitals, Rigshospitalet (J Gerstat,
N Obel) and Hvidovre (G Kronborg), OdenseUniversity Hospital (C Pedersen), Aarhus UniversityHospitals, Skejby (CS Larsen) and Aalborg(G Pedersen), Herning Hospital (AL Laursen),Helsingør Hospital (B Kvinesdal) and KoldingHospital (A Møller).
References1. Lohse N, Obel N, Kronborg G, et al. Declining risk of
triple-class antiretroviral drug failure in Danish HIV-infected individuals. AIDS 2005; 19:815–822.
2. Mocroft A, Ledergerber B, Viard JP, et al. Time to virologicalfailure of 3 classes of antiretrovirals after initiation of highlyactive antiretroviral therapy: results from the EuroSIDA studygroup. J Infect Dis 2004; 190:1947–1956.
3. Ledergerber B, Lundgren JD, Walker AS, et al. Predictorsof trend in CD4-positive T-cell count and mortality amongHIV-1-infected individuals with virological failure to allthree antiretroviral-drug classes. Lancet 2004; 364:51–62.
4. Napravnik S, Edwards D, Stewart P, Stalzer B, Matteson E,Eron JJ Jr. HIV-1 drug resistance evolution among patientson potent combination antiretroviral therapy withdetectable viremia. J Acquir Immune Defic Syndr 2005;40:34–40.
5. Recsky MA, Brumme ZL, Chan KJ, et al. Antiretroviralresistance among HIV-infected persons who have died inBritish Columbia, in the era of modern antiretroviraltherapy. J Infect Dis 2004; 190:285–292.
6. Zaccarelli M, Tozzi V, Lorenzini P, et al. Multiple drugclass-wide resistance associated with poorer survival aftertreatment failure in a cohort of HIV-infected patients.AIDS 2005; 19:1081–1089.
7. Lucas GM, Gallant JE, Moore RD. Relationship betweendrug resistance and HIV-1 disease progression or death inpatients undergoing resistance testing. AIDS 2004;18:1539–1548.
8. Lohse N, Hansen AB, Jensen-Fangel S, et al. Demographicsof HIV-1 infection in Denmark: Results from The DanishHIV Cohort Study. Scand J Infect Dis 2005; 37:338–343.
9. Johnson VA, Brun-Vezinet F, Clotet B, et al. Update of thedrug resistance mutations in HIV-1: Fall 2005. Top HIVMed 2005; 13:125–131.
10. Pedersen CB, Gøtzsche H, Møller JØ, Mortensen PB. TheDanish Civil Registration System. Dan Med Bull 2006;53:441–449.
11. Brun-Vezinet F, Costagliola D, Khaled MA, et al. Clinicallyvalidated genotype analysis: guiding principles and statisticalconcerns. Antivir Ther 2004; 9:465–478.
12. Flandre P, Descamps D, Joly V, et al. Predictive factors andselection of thymidine analogue mutations by nucleosidereverse transcriptase inhibitors according to initial regimenreceived. Antivir Ther 2003; 8:65–72.
13. Cozzi-Lepri A, Ruiz L, Loveday C, et al. Thymidineanalogue mutation profiles: factors associated with acquiringspecific profiles and their impact on the virological responseto therapy. Antivir Ther 2005; 10:791–802.
14. Marcelin AG, Delaugerre C, Wirden M, et al. Thymidineanalogue reverse transcriptase inhibitors resistance muta-tions profiles and association to other nucleoside reversetranscriptase inhibitors resistance mutations observed in thecontext of virological failure. J Med Virol 2004;72:162–165.
15. De Luca A, Di Giambenedetto S, Romano L, et al.Frequency and treatment-related predictors of thymidine-analogue mutation patterns in HIV-1 isolates afterunsuccessful antiretroviral therapy. J Infect Dis 2006;193:1219–1222.
16. Hu Z, Giguel F, Hatano H, Reid P, Lu J, Kuritzkes DR.Fitness comparison of thymidine analog resistance path-ways in human immunodeficiency virus type 1. J Virol2006; 80:7020–7027.
N Lohse et al.
© 2007 International Medical Press916
Lohse 29/8/07 17:11 Page 916
17. Wood E, Hogg RS, Yip B, Harrigan PR, O’ShaughnessyMV, Montaner JS. Effect of medication adherence onsurvival of HIV-infected adults who start highly active anti-retroviral therapy when the CD4+ cell count is 0.200 to0.350 × 10(9) cells/L. Ann Intern Med 2003; 139:810–816.
18. Bangsberg DR, Perry S, Charlebois ED, et al. Non-adherence to highly active antiretroviral therapy predictsprogression to AIDS. AIDS 2001; 15:1181–1183.
19. Bangsberg DR, Charlebois ED, Grant RM, et al. Highlevels of adherence do not prevent accumulation of HIVdrug resistance mutations. AIDS 2003; 17:1925–1932.
20. Gonzales MJ, Wu TD, Taylor J, et al. Extended spectrumof HIV-1 reverse transcriptase mutations in patientsreceiving multiple nucleoside analog inhibitors. AIDS2003; 17:791–799.
21. Hanna GJ, Johnson VA, Kuritzkes DR, et al. Patterns ofresistance mutations selected by treatment of humanimmunodeficiency virus type 1 infection with zidovudine,didanosine, and nevirapine. J Infect Dis 2000; 181:904–911.
22. Wu TD, Schiffer CA, Gonzales MJ, et al. Mutation patternsand structural correlates in human immunodeficiency virustype 1 protease following different protease inhibitor treatments. J Virol 2003; 77:4836–4847.
23. Marcelin AG, Dalban C, Peytavin G, et al. Clinicallyrelevant interpretation of genotype and relationship toplasma drug concentrations for resistance to saquinavir-ritonavir in human immunodeficiency virus type 1protease inhibitor-experienced patients. AntimicrobAgents Chemother 2004; 48:4687–4692.
24. Lucas GM. Antiretroviral adherence, drug resistance, viralfitness and HIV disease progression: a tangled web iswoven. J Antimicrob Chemother 2005; 55:413–416.
25. Machouf N, Thomas R, Nguyen VK, et al. Effects of drugresistance on viral load in patients failing antiretroviraltherapy. J Med Virol 2006; 78:608–613.
26. Jorgensen LB, Christensen MB, Gerstoft J, et al.Prevalence of drug resistance mutations and non-Bsubtypes in newly diagnosed HIV-1 patients in Denmark.Scand J Infect Dis 2003; 35:800–807.
27. Lohse N, Obel N, Kronborg G, et al. Declining prevalenceof HIV-infected individuals at risk of transmitting drug-resistant HIV in Denmark during 1997–2004. Antivir Ther2006; 11:591–600.
28. Hogg R, Bangsberg D, Lima VD, et al. Emergence of drugresistance is associated with an increased risk of deathamong patients first starting HAART. PLoS Med 2006;3:1570–1578.
Antiviral Therapy 12:6 917
Drug resistance and mortality
Accepted for publication 5 May 2007
Lohse 29/8/07 17:11 Page 917

Lohse 29/8/07 17:11 Page 918

Survival of Persons with and without HIV Infection in Denmark,1995–2005Nicolai Lohse, MD, PhD; Ann-Brit Eg Hansen, MD; Gitte Pedersen, MD, PhD; Gitte Kronborg, MD, DMSc; Jan Gerstoft, MD, DMSc;Henrik Toft Sørensen, MD, PhD, DMSc; Michael Væth, PhD; and Niels Obel, MD, DrSci, DMSc
Background: The expected survival of HIV-infected patients is ofmajor public health interest.
Objective: To estimate survival time and age-specific mortalityrates of an HIV-infected population compared with that of thegeneral population.
Design: Population-based cohort study.
Setting: All HIV-infected persons receiving care in Denmark from1995 to 2005.
Patients: Each member of the nationwide Danish HIV CohortStudy was matched with as many as 99 persons from the generalpopulation according to sex, date of birth, and municipality ofresidence.
Measurements: The authors computed Kaplan–Meier lifetables with age as the time scale to estimate survival fromage 25 years. Patients with HIV infection and correspondingpersons from the general population were observed fromthe date of the patient’s HIV diagnosis until death, emigration,or 1 May 2005.
Results: 3990 HIV-infected patients and 379 872 persons from thegeneral population were included in the study, yielding 22 744 (me-
dian, 5.8 y/person) and 2 689 287 (median, 8.4 years/person) person-years of observation. Three percent of participants were lost to follow-up. From age 25 years, the median survival was 19.9 years (95% CI,18.5 to 21.3) among patients with HIV infection and 51.1 years (CI,50.9 to 51.5) among the general population. For HIV-infected pa-tients, survival increased to 32.5 years (CI, 29.4 to 34.7) during the2000 to 2005 period. In the subgroup that excluded persons withknown hepatitis C coinfection (16%), median survival was 38.9 years(CI, 35.4 to 40.1) during this same period. The relative mortality ratesfor patients with HIV infection compared with those for the generalpopulation decreased with increasing age, whereas the excess mortalityrate increased with increasing age.
Limitations: The observed mortality rates are assumed to applybeyond the current maximum observation time of 10 years.
Conclusions: The estimated median survival is more than 35 yearsfor a young person diagnosed with HIV infection in the late highlyactive antiretroviral therapy era. However, an ongoing effort is stillneeded to further reduce mortality rates for these persons com-pared with the general population.
Ann Intern Med. 2007;146:87-95. www.annals.orgFor author affiliations, see end of text.
Knowing the expected survival of HIV-infected patientsis of major public health interest. Mortality rates have
decreased substantially in recent years as a result of im-proved effectiveness of highly active antiretroviral ther-apy (HAART) (1). Studies comparing mortality rates forHIV-infected persons with age- and sex-specific mortal-ity rates for the general population (2–5) have reported3- to 10-fold increase in successfully treated patients.The relative mortality rate, however, is highly depen-dent on the age distribution of the study sample anddoes not in itself answer questions about survival. Wetherefore aimed to estimate median survival and age-specific mortality rates for an entire HIV-infected pop-ulation compared with a cohort from the general popu-lation. Persons with HIV infection were followed frombefore initiation of HAART and included those withsuch predictors of lower survival as poor response totherapy, AIDS diagnosis, low CD4 count, high viralload, and poor adherence to treatment (6, 7). Linkingdata from the population-based Danish HIV CohortStudy (DHCS) (8) and the Danish Civil RegistrationSystem (CRS) (9, 10) allowed us to use product-limitmethods that are analogous to the period life tables usedby national authorities for estimating median survival(11).
METHODS
Study SampleThe DHCS is a prospective, nationwide, population-
based cohort study of all HIV-infected persons treated inDanish HIV clinics since 1 January 1995 (8, 12). Thestudy is ongoing, with continuous enrollment of bothnewly diagnosed residents and immigrants with existingHIV infection. Treatment for HIV infection in Denmarkis restricted to 8 specialized centers, and the Danish healthcare system provides free tax-supported medical care, in-cluding antiretroviral treatment for HIV infection. Thestudy databases are updated annually. Adult (�16 years)DHCS participants with residency in Denmark were in-cluded at their first visit to an HIV clinic. The Civil Reg-istration System (CRS) is a national registry of all Danish
See also:
PrintEditors’ Notes . . . . . . . . . . . . . . . . . . . . . . . . . . . . . . 88Summary for Patients. . . . . . . . . . . . . . . . . . . . . . . I-39
Web-OnlyConversion of figure and tables into slidesCME quiz
Annals of Internal Medicine Article
© 2007 American College of Physicians 87

residents; this registry contains information on date ofbirth; sex; address; date of migration; and date of death, ifapplicable (9). A 10-digit personal number (Central PersonRegistry [CPR] number), assigned at birth, uniquely iden-tifies each person. The CRS is updated within a week of aperson’s birth, address change, death, or emigration. Use ofthe CPR number enables treatment centers to avoid mul-tiple registrations of the same patient and allows trackingof deaths and persons lost to follow-up due to emigration.Using the CRS records, we drew a random sample of per-sons from the general population and matched them toeach HIV-infected patient according to sex and month ofbirth and residence in the same municipality as the patienton the date of diagnosis (Denmark has a population ofapproximately 5.3 million persons living in 270 municipal-ities). We aimed to sample 99 persons from the generalpopulation for each HIV-infected person. However, be-cause of a shortage of eligible persons in some municipal-ities, the mean number of persons from the general popu-lation per patient was 95.2 in the final sample.
Patients with at least 1 positive result on a hepatitis Cvirus (HCV)–antibody test or a positive result on an HCVRNA test were considered to be HCV-positive; the otherpatients were considered to be HCV-negative. The HCV-antibody status was available for 88.4% of all patients andfor 95.4% of patients observed during 2000 to 2005. Wedid not have individual data on HCV infection in thegeneral population, but the estimated prevalence in Den-mark is only 3 per 1000 (13). Highly active antiretroviraltherapy was defined as the combination of antiretroviraltreatment with at least 3 drugs, including at least 1 pro-tease inhibitor, 1 nonnucleoside reverse transcriptase inhib-itor, or abacavir; or the 2-drug combination of efavirenz-
and ritonavir-boosted lopinavir. Treatment interruptionwas defined as a period of at least 2 weeks after initiation ofHAART during which the patient did not take antiretro-viral drugs. Structured treatment interruptions have gener-ally not been recommended in Denmark. Causes of deathextracted from patient files were available for patients inDHCS and were divided into HIV-related causes (AIDS-defining illnesses and bacterial infections, corresponding toInternational Classification of Disease, Tenth Revision[ICD-10], codes A02, A07.2-07.3, A15-19, A31, A81.2,B00, B20-25, B37-39, B45, B58, C46, C53, C83.4,C83.9, F02.4, and J13-17), non–HIV-related other causes,and unknown causes.
Statistical AnalysisWe computed Kaplan–Meier life tables using age as
the time scale. Persons with HIV infection were observedfrom the date of HIV diagnosis or from the first visit to anHIV clinic, if the visit occurred at a later date; personsfrom the general population were observed starting at thesame time as their matched HIV-infected patients. All per-sons were censored at emigration or on 1 May 2005. Deathfrom any cause was the outcome event.
We estimated median survival times and computedmortality rates from age 25 years separately for men andwomen and for the subgroup of HCV-negative persons.We chose 25 years because this was the youngest age groupwith a sufficient number of patients (n � 170) being ob-served. We performed analyses for 3 clinically relevant pe-riods: 1995 to 1996 (pre-HAART), 1997 to 1999 (earlyHAART), and 2000 to 2005 (late HAART) and with re-spect to the length of HAART treatment: before HAART,first year, second and third years, fourth and fifth years,and sixth year onward.
We computed mortality rates in 5-year age intervalsand estimated crude relative (mortality rate ratio [mortalityrate for patients with HIV infection divided by the mor-tality rate for the general population]) and absolute (excessmortality rate [mortality rate for the general populationsubtracted from the mortality rate for patients with HIVinfection]) effects in HIV-infected patients compared withpersons from the general population. In accordance withthe matched design, we used a stratified Cox regressionmodel for the mortality rate ratio estimations. When com-paring mortality rate ratios from the stratified model withcrude mortality rate ratios, we found only small deviations(median, 4.3% [interquartile range, 1.2% to 7.0%]) andtherefore used standard statistical methods for the excessmortality rates. We further examined mortality rate ratiosand excess mortality rates for the late HAART period andfor HCV-negative and HCV-positive persons during thelate HAART period.
Data analysis was performed by using Stata statisticalsoftware, version 9.0 (Stata Corp., College Station, Texas).
Context
The expected survival of HIV-infected patients has beendifficult to measure by comparing selected HIV samplesand control groups.
Contribution
Denmark carefully tracks each of its residents’ vital status,which makes it possible to accurately compare survival ofHIV-infected persons and uninfected persons. In 2000 to2005, life expectancy at age 25 years was 51 years in thegeneral population and 39 years for HIV-infected personswithout hepatitis C virus infection (HCV).
Cautions
Denmark provides excellent access to HIV and HCV care,so the results may be atypical.
Implications
Persons with HIV infection have a good, but far from nor-mal, life expectancy.
—The Editors
Article Survival in Patients with HIV Infection
88 16 January 2007 Annals of Internal Medicine Volume 146 • Number 2 www.annals.org

Approvals and PermissionsThe Danish Data Protection Agency approved the es-
tablishment of the cohort study. The study was not subjectto approval by the ethics committee because data collectiondid not involve direct patient contact.
Role of the Funding SourcesThe Danish HIV Cohort study receives funding from
the Danish AIDS Foundation, Odense University Hospi-tal, Preben and Anna Simonsen’s Foundation, the Foun-dation of the Danish Association of Pharmacists, and theClinical Institute at the University of Southern Denmark.The funding sources were not involved in the design, datacollection, analysis, or writing of the study.
RESULTS
Study SampleWe included 3990 HIV-infected persons and 379 872
persons from the general population: The respective me-dian observation time after age 25 years was 5.8 person-years (interquartile range, 2.2 to 9.9 person-years) and 8.4person-years (interquartile range, 4.3 to 10.3 person-years),respectively (Table 1). One hundred twenty-one (3.0%)HIV-infected patients and 11 552 (3.0%) persons from thegeneral population were lost to follow-up; of these, 107(2.7%) patients with HIV infection and 10 234 (2.7%)persons from the general population emigrated. There were2045 (51%) incident HIV cases diagnosed after 1 January1995; 75% were observed within 31 days of diagnosis, and95% came under observation within the first 181 days afterdiagnosis. After HAART was introduced in 1996, the prev-alence of patients receiving this treatment gradually in-creased, surpassing 75% in 2002 to 2004. At any giventime, fewer than 5% of HIV-infected patients were inter-rupting treatment. The number of patients under observa-tion varied with age and was highest (range, 515 to 1004)for those who were 30 to 50 years of age (Table 2).
Survival from Age 25 YearsAll participants were observed from age 25 years: HIV-
infected persons had a median survival of 19.9 years (17.5years for men and 24.2 years for women), whereas personsfrom the general population had a median survival of 51.1years (50.8 years for men and 54.8 years for women) (Ta-ble 3). During the late HAART period (2000 to 2005),median survival of HIV-infected patients had increased to32.5 years (32.1 years for men and 32.3 years for women)overall, and to 38.9 years (37.8 years for men and 40.1years for women) after persons with known HCV infectionwere excluded (Figure).
Mortality RatesThe mortality rate was 43 per 1000 person-years (95%
CI, 40 to 45) for HIV-infected persons and 4.7 per 1000person-years (CI, 4.6 to 4.8) for the general population(Table 3). The highest mortality rate, 124 per 1000 per-son-years (CI, 112 to 137), was observed in the pre-HAART period (1995 to 1996). This rate decreased to 38per 1000 person-years (CI, 33 to 43) in the early HAARTperiod (1997 to 1999) and to 25 per 1000 person-years(CI, 23 to 28) in the late HAART period (2000 to 2005).In patients receiving HAART, the highest mortality rate of48 per 1000 person-years (CI, 40 to 57) was observedduring the first year of treatment but decreased to 27 per1000 person-years (CI, 22 to 32) during the second andthird years of HAART, to 26 per 1000 person-years (CI,21 to 32) during the fourth and fifth years of HAART, andto 26 per 1000 person-years (CI, 21 to 31) from the sixthyear onward. Mortality rates were even lower among pa-tients treated during the late HAART period. Althoughmortality rates declined with calendar time, we found nochange in mortality rates from the first to the tenth yearafter the diagnosis of HIV infection. In the late HAARTperiod, the mortality rate was 26 per 1000 person-years(CI, 19 to 34) during the first 2 years after diagnosis, 17
Table 1. Characteristics of Study Participants*
Variable Patients with HIVInfection
General Populationwithout HIV Infection
Persons, n 3990 379 872Men, % 77 77Median age at study entry (interquartile range), y 37.2 (31.0–44.8) 36.9 (30.9–44.6)Median observation time (interquartile range), y 5.8 (2.2–9.9) 8.4 (4.3–10.3)Incident cases (diagnosed after 1 January 1995), n (%) 2045 (51) –
Entered the cohort within 31 days after diagnosis 1556 (76) –Entered the cohort within 181 days after diagnosis 1943 (95) –
Most likely method of infection, n (%)Male homosexual activity 1863 (47) –Heterosexual activity 1377 (35) –Intravenous drug use 480 (12) –Other 270 (7) –
Race, n (%)Caucasian 3287 (82) NABlack 446 (11) NAOther 257 (6) NA
Positive for hepatitis C infection 668 (17) –
* HIV � human immunodeficiency virus; NA � not available.
ArticleSurvival in Patients with HIV Infection
www.annals.org 16 January 2007 Annals of Internal Medicine Volume 146 • Number 2 89

per 1000 person-years (CI, 12 to 24) during the third andfourth years, 18 per 1000 person-years (CI, 13 to 25) dur-ing the fifth and sixth years, 21 per 1000 person-years (CI,15 to 29) during the seventh and eighth years, and 17 per1000 person-years (CI, 11 to 25) during the ninth andtenth years after diagnosis. Persons with HIV and HCVcoinfection had considerably higher mortality rates thanthose who were HCV-negative (mortality rate, 59 [CI, 52to 67] vs. 39 [CI, 36 to 42]), and this finding was evenmore marked in the late HAART period (mortality rate, 57[CI, 48 to 67] vs. 19 [CI, 17 to 22]).
Age-Specific Mortality RatesMortality rates increased with age for HIV-infected
persons and for the general population (Table 2). AmongHCV-negative persons with HIV infection who wereyounger than 50 years, mortality rates during the lateHAART period did not exceed 15.0 per 1000 person-years(CI, 10.0 to 22.6).
The mortality rates for HIV-infected persons relativeto those for the general population (mortality rate ratio)were highest in the younger age groups. The decrease inmortality rate ratio with age was driven by the naturalage-dependent increase in mortality rates in the referencepopulation. The mortality rate ratio decreased from 44.5(CI, 32.0 to 61.9) for persons who were age 25 to 30 yearsto 3.4 (CI, 2.3 to 5.1) for those who were age 65 to 70years. Among persons observed in the late HAART period,the mortality rate ratio varied from 15.1 (CI, 9.7 to 23.5)to 3.0 (CI, 2.0 to 4.6) for all HIV-infected patients. AfterHCV-positive persons were excluded, the mortality rateratio during this period ranged from 11.5 (CI, 8.0 to 16.6)to 2.8 (CI, 2.0 to 4.0).
In contrast to the age-related decrease in mortality rateratio, the excess mortality rate for HIV-infected patientscompared with that for the general population was lowestin the younger age groups and increased with age. The
Table 2. Age-Specific Mortality Rates*
Variable Age
25–30 y >30–35 y >35–40 y >40–45 y
Under observation at the beginning of each age period, nPatients with HIV infection 170 566 959 950General population 17 045 60 322 107 786 112 343
PYR (in thousands), nPatients with HIV infection 1.77 3.97 4.92 4.13General population 184 432 567 505
Events, nPatients with HIV infection 54 113 176 189General population 128 385 761 1296
Mortality rate for patients with HIV infection, per 1000 PYR 30.5 (23.4 to 39.9) 28.5 (23.7 to 34.3) 35.8 (30.8 to 41.4) 45.7 (39.7 to 52.7)
Mortality rate for general population, per 1000 PYR 0.7 (0.6 to 0.8) 0.9 (0.8 to 1.0) 1.3 (1.3 to 1.4) 2.6 (2.4 to 2.7)
Mortality rate ratio (patients vs. general population) 44.53 (32.0 to 61.9) 32.04 (25.9 to 39.7) 27.4 (23.1 to 32.4) 18.04 (15.4 to 21.1)
Excess mortality rate (patients vs. general population, per 1000 PYR) 29.8 (21.7 to 38.0) 27.6 (22.3 to 32.9) 34.4 (29.1 to 39.7) 43.2 (36.6 to 49.7)
Patients observed during the years 2000–2005Patients with HIV infection, PYR (in thousands) 0.77 1.98 3.04 2.58Mortality rate for patients with HIV infection, per 1000 PYR 6.5 (2.7 to 15.6) 11.6 (7.7 to 17.5) 17.4 (13.3 to 22.8) 24.0 (18.7 to 30.8)Mortality rate for general population, per 1000 PYR 0.6 (0.5 to 0.8) 0.8 (0.7 to 0.9) 1.2 (1.1 to 1.3) 2.3 (2.1 to 2.4)Mortality rate ratio (patients vs. general population) 8.88 (3.2 to 24.7) 15.14 (9.7 to 23.5) 14.36 (10.7 to 19.3) 10.55 (8.1 to 13.8)Excess mortality rate (patients vs. general population), per 1000 PYR 5.8 (1.6 to 11.5) 10.9 (6.1 to 15.6) 16.2 (11.5 to 20.9) 21.8 (15.8 to 27.8)
HCV-negative patients observed during the years 2000–2005Patients with HIV infection, PYR (in thousands) 0.67 1.66 2.45 1.99Mortality rate for patients with HIV infection, per 1000 PYR 1.5 (0.2 to 10.6) 8.5 (5.0 to 14.3) 13.5 (9.6 to 19.0) 14.1 (9.7 to 20.4)Mortality rate for general population, per 1000 PYR 0.6 (0.5 to 0.8) 0.8 (0.7 to 0.9) 1.2 (1.1 to 1.3) 2.3 (2.1 to 2.5)Mortality rate ratio (patients vs. general population) 2.6 (0.4 to 19.3) 10.7 (6.2 to 18.6) 11.5 (8.0 to 16.6) 6.3 (4.3 to 9.3)Excess mortality rate (patients vs. general population), per 1000 PYR 0.9 (�2.1 to 3.8) 7.7 (3.2 to 12.1) 12.3 (7.7 to 16.9) 11.8 (6.5 to 17.0)
HCV-positive patients observed during the years 2000–2005Patients with HIV infection, PYR (in thousands) 0.10 0.32 0.59 0.59Mortality rate for patients with HIV infection, per 1000 PYR 38.5 (14.5 to 102.7) 28.2 (14.7 to 54.2) 33.7 (21.7 to 52.2) 57.8 (41.3 to 81.0)Mortality rate for general population, per 1000 PYR 0.8 (0.4 to 1.6) 0.7 (0.5 to 1.0) 1.3 (1.1 to 1.6) 2.1 (1.8 to 2.5)Mortality rate ratio (patients vs. general population) 41.6 (10.8 to 160.9) 42.1 (19.2 to 92.6) 24.5 (14.8 to 40.6) 24.4 (16.6 to 35.8)Excess mortality rate (patients vs. general population), per 1000 PYR 37.8 (0.0 to 75.5) 27.5 (9.1 to 46.0) 32.4 (17.6 to 47.2) 55.7 (36.3 to 75.2)
* Values in parentheses are 95% CIs. HCV � hepatitis C virus; HIV � human immunodeficiency virus; NA � not available; PYR � person-years at risk.
Article Survival in Patients with HIV Infection
90 16 January 2007 Annals of Internal Medicine Volume 146 • Number 2 www.annals.org

excess mortality rate during the late HAART period wasnot higher than 12.3 per 1000 person-years (CI, 7.7 to16.9) among HCV-negative persons who were youngerthan 50 years but increased gradually with age to 53.8 per1000 person-years (CI, 12.1 to 95.5) among persons whowere 65 to 70 years. These figures were 2- to 4-fold higherif all patients and observation years were included (Table2).
Causes of DeathThe mortality rate for HIV-related death decreased
from 71 per 1000 person-years (CI, 63 to 81) in the earlyHAART period to 7.0 per 1000 person-years (CI, 5.8 to8.6) in the late HAART period, and non–HIV-relateddeaths decreased from 23 per 1000 person-years (CI, 18 to29) to 9.4 per 1000 person-years (CI, 7.9 to 11.2) (Table4). Thus, the proportion of known causes of death thatwere related to HIV infection decreased from 76% in 1995
to 1996, to 57% in 1997 to 1999, and to 43% in 2000 to2005.
DISCUSSION
In this population-based cohort study, we estimate amedian remaining lifetime of more than 35 years for a25-year-old, HIV-positive person without HCV infectionwho received care in the twenty-first century. We expectthis estimate to be robust because the study included allpatients, regardless of such prognostic factors as CD4-pos-itive cell count, HIV RNA, disease stage, history of AIDS,treatment adherence, or time receiving HAART. The in-crease in survival over time was attributable mainly to adecrease in HIV-related deaths. Despite the encouragingsurvival expectations, the study still shows large, age-de-pendent excess mortality rates in the HIV-infected cohortcompared with the general population. The excess mortal-
Table 2—Continued
Age
>45–50 y >50–55 y >55–60 y >60–65 y >65–70 y
727 517 373 224 7790 759 65 254 45 872 27 170 11 023
3.07 2.26 1.53 0.67 0.28386 280 185 86 40
155 111 69 49 261795 2036 2031 1543 1169
50.5 (43.1 to 59.1) 49.2 (40.8 to 59.2) 45.2 (35.7 to 57.3) 73.4 (55.4 to 97.1) 93.1 (63.4 to 136.7)
4.7 (4.4 to 4.9) 7.3 (7.0 to 7.6) 11.0 (10.5 to 11.4) 18.0 (17.1 to 18.9) 29.1 (27.5 to 30.8)
10.81 (9.1 to 12.8) 7.24 (6.0 to 8.8) 4.05 (3.2 to 5.2) 4.23 (3.2 to 5.6) 3.43 (2.3 to 5.1)
45.9 (37.9 to 53.8) 41.9 (32.7 to 51.0) 34.3 (23.6 to 45.0) 55.4 (34.8 to 75.9) 64.0 (28.2 to 99.8)
1.93 1.40 1.14 0.51 0.1832.2 (25.1 to 41.3) 33.5 (25.2 to 55.6) 34.3 (25.0 to 46.9) 49.3 (33.3 to 73.0) 81.3 (49.1 to 134.9)4.5 (4.3 to 4.8) 7.1 (6.7 to 7.5) 10.6 (10.0 to 11.1) 17.0 (16.1 to 18.1) 28.5 (26.6 to 30.5)
6.81 (5.2 to 8.9) 5.14 (3.8 to 7.0) 3.16 (2.3 to 4.4) 3.04 (2.0 to 4.6) 3.11 (1.9 to 5.2)27.6 (19.6 to 35.7) 26.4 (16.8 to 36.0) 23.7 (12.9 to 34.4) 32.3 (12.9 to 51.6) 52.8 (11.7 to 94.0)
1.53 1.22 1.10 0.49 0.1815.0 (10.0 to 22.6) 27.8 (19.9 to 39.0) 30.1 (21.4 to 42.4) 47.0 (31.3 to 70.8) 82.3 (49.6 to 136.5)4.6 (4.3 to 4.9) 7.0 (6.6 to 7.5) 10.6 (10.0 to 11.2) 17.0 (16.0 to 18.1) 28.5 (26.6 to 30.5)3.0 (2.0 to 4.7) 4.3 (3.1 to 6.2) 2.8 (2.0 to 4.0) 3.0 (2.0 to 4.6) 3.1 (1.9 to 5.2)
10.4 (4.3 to 16.6) 20.8 (11.4 to 30.2) 19.5 (9.2 to 29.8) 30.0 (10.8 to 49.3) 53.8 (12.1 to 95.5)
0.40 0.18 0.04 0.02 0.0098.5 (72.0 to 134.8) 71.3 (41.4 to 122.7) 141.3 (63.5 to 314.6) 109.9 (27.5 to 439.3) NA4.3 (3.8 to 4.9) 7.3 (6.4 to 8.3) 10.1 (8.0 to 12.8) 17.3 (13.0 to 23.0) 27.9 (20.4 to 38.0)21.6 (15.2 to 30.8) 10.3 (5.7 to 18.8) 13.7 (5.3 to 35.5) 3.5 (0.5 to 26.0) NA94.2 (63.3 to 125.1) 64.0 (25.2 to 102.8) 131.2 (18.1 to 244.3) 92.6 (�59.8 to 244.9) NA
ArticleSurvival in Patients with HIV Infection
www.annals.org 16 January 2007 Annals of Internal Medicine Volume 146 • Number 2 91
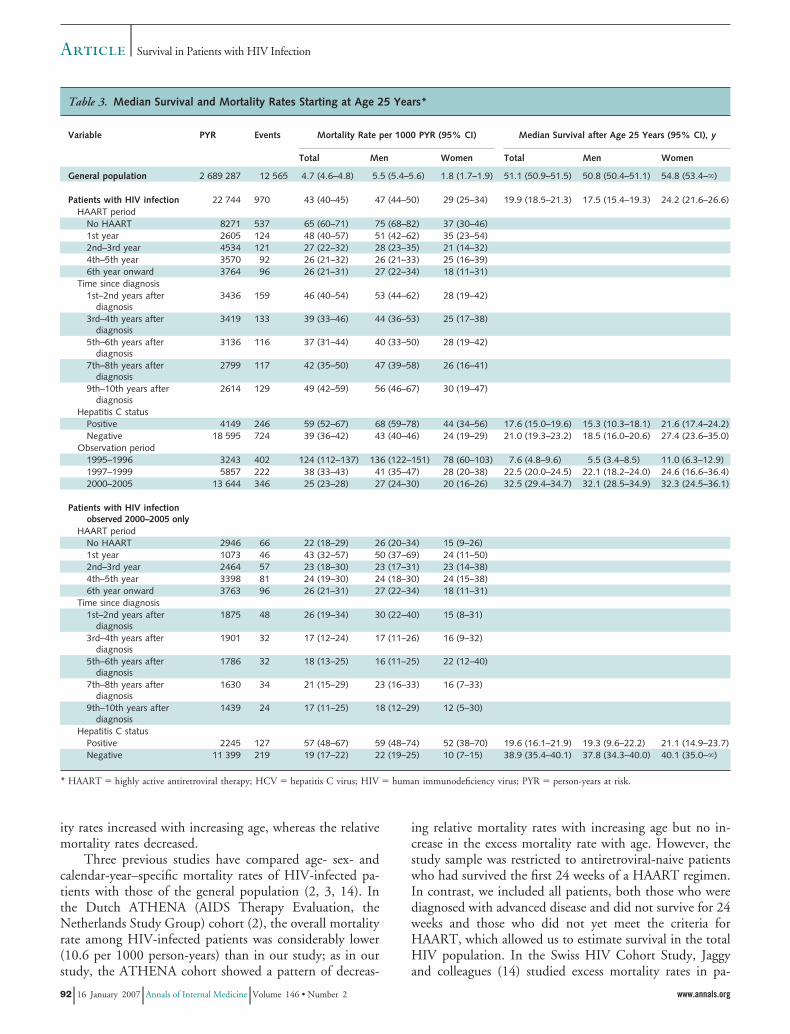
ity rates increased with increasing age, whereas the relativemortality rates decreased.
Three previous studies have compared age- sex- andcalendar-year–specific mortality rates of HIV-infected pa-tients with those of the general population (2, 3, 14). Inthe Dutch ATHENA (AIDS Therapy Evaluation, theNetherlands Study Group) cohort (2), the overall mortalityrate among HIV-infected patients was considerably lower(10.6 per 1000 person-years) than in our study; as in ourstudy, the ATHENA cohort showed a pattern of decreas-
ing relative mortality rates with increasing age but no in-crease in the excess mortality rate with age. However, thestudy sample was restricted to antiretroviral-naive patientswho had survived the first 24 weeks of a HAART regimen.In contrast, we included all patients, both those who werediagnosed with advanced disease and did not survive for 24weeks and those who did not yet meet the criteria forHAART, which allowed us to estimate survival in the totalHIV population. In the Swiss HIV Cohort Study, Jaggyand colleagues (14) studied excess mortality rates in pa-
Table 3. Median Survival and Mortality Rates Starting at Age 25 Years*
Variable PYR Events Mortality Rate per 1000 PYR (95% CI) Median Survival after Age 25 Years (95% CI), y
Total Men Women Total Men Women
General population 2 689 287 12 565 4.7 (4.6–4.8) 5.5 (5.4–5.6) 1.8 (1.7–1.9) 51.1 (50.9–51.5) 50.8 (50.4–51.1) 54.8 (53.4–�)
Patients with HIV infection 22 744 970 43 (40–45) 47 (44–50) 29 (25–34) 19.9 (18.5–21.3) 17.5 (15.4–19.3) 24.2 (21.6–26.6)HAART period
No HAART 8271 537 65 (60–71) 75 (68–82) 37 (30–46)1st year 2605 124 48 (40–57) 51 (42–62) 35 (23–54)2nd–3rd year 4534 121 27 (22–32) 28 (23–35) 21 (14–32)4th–5th year 3570 92 26 (21–32) 26 (21–33) 25 (16–39)6th year onward 3764 96 26 (21–31) 27 (22–34) 18 (11–31)
Time since diagnosis1st–2nd years after
diagnosis3436 159 46 (40–54) 53 (44–62) 28 (19–42)
3rd–4th years afterdiagnosis
3419 133 39 (33–46) 44 (36–53) 25 (17–38)
5th–6th years afterdiagnosis
3136 116 37 (31–44) 40 (33–50) 28 (19–42)
7th–8th years afterdiagnosis
2799 117 42 (35–50) 47 (39–58) 26 (16–41)
9th–10th years afterdiagnosis
2614 129 49 (42–59) 56 (46–67) 30 (19–47)
Hepatitis C statusPositive 4149 246 59 (52–67) 68 (59–78) 44 (34–56) 17.6 (15.0–19.6) 15.3 (10.3–18.1) 21.6 (17.4–24.2)Negative 18 595 724 39 (36–42) 43 (40–46) 24 (19–29) 21.0 (19.3–23.2) 18.5 (16.0–20.6) 27.4 (23.6–35.0)
Observation period1995–1996 3243 402 124 (112–137) 136 (122–151) 78 (60–103) 7.6 (4.8–9.6) 5.5 (3.4–8.5) 11.0 (6.3–12.9)1997–1999 5857 222 38 (33–43) 41 (35–47) 28 (20–38) 22.5 (20.0–24.5) 22.1 (18.2–24.0) 24.6 (16.6–36.4)2000–2005 13 644 346 25 (23–28) 27 (24–30) 20 (16–26) 32.5 (29.4–34.7) 32.1 (28.5–34.9) 32.3 (24.5–36.1)
Patients with HIV infectionobserved 2000–2005 only
HAART periodNo HAART 2946 66 22 (18–29) 26 (20–34) 15 (9–26)1st year 1073 46 43 (32–57) 50 (37–69) 24 (11–50)2nd–3rd year 2464 57 23 (18–30) 23 (17–31) 23 (14–38)4th–5th year 3398 81 24 (19–30) 24 (18–30) 24 (15–38)6th year onward 3763 96 26 (21–31) 27 (22–34) 18 (11–31)
Time since diagnosis1st–2nd years after
diagnosis1875 48 26 (19–34) 30 (22–40) 15 (8–31)
3rd–4th years afterdiagnosis
1901 32 17 (12–24) 17 (11–26) 16 (9–32)
5th–6th years afterdiagnosis
1786 32 18 (13–25) 16 (11–25) 22 (12–40)
7th–8th years afterdiagnosis
1630 34 21 (15–29) 23 (16–33) 16 (7–33)
9th–10th years afterdiagnosis
1439 24 17 (11–25) 18 (12–29) 12 (5–30)
Hepatitis C statusPositive 2245 127 57 (48–67) 59 (48–74) 52 (38–70) 19.6 (16.1–21.9) 19.3 (9.6–22.2) 21.1 (14.9–23.7)Negative 11 399 219 19 (17–22) 22 (19–25) 10 (7–15) 38.9 (35.4–40.1) 37.8 (34.3–40.0) 40.1 (35.0–�)
* HAART � highly active antiretroviral therapy; HCV � hepatitis C virus; HIV � human immunodeficiency virus; PYR � person-years at risk.
Article Survival in Patients with HIV Infection
92 16 January 2007 Annals of Internal Medicine Volume 146 • Number 2 www.annals.org

tients “successfully treated with HAART” (excess mortalityrate, 3.1 to 8.0 [HCV-negative] and 20.5 to 25.9 [HCV-positive] per 1000 person-years) vs. “unsuccessfully treatedwith HAART” (excess mortality rate, 117.4 [HCV-nega-tive] and 112.7 [HCV-positive] per 1000 person-years).These authors did not report the distribution of ages intheir study groups or the age-specific excess mortality rates.In another analysis based on the Swiss HIV Cohort Study,Keiser and colleagues (3) found a decrease in the mortalityrate from 130 per 1000 person-years during 1990 to 1995to 30 per 1000 person-years during 1997 to 2001, and aconcomitant decrease in standardized mortality rate ratiofrom 79.3 to 15.3. There was a 21% withdrawal rate inthat study, and no information was available regarding par-
ticipants’ age distributions. Because mortality rates amongHIV-infected and noninfected persons are highly age-dependent, the age-specific mortality rates reported in ourstudy allow transparency and easier comparison amongstudies and samples. Further, the 2 Swiss Cohort Studyreports were based on data up to 2001 and did not incor-porate the advances in treatment effectiveness obtainedduring the subsequent 4 years. Braithwaite and coworkers(15) used data from the Collaborations in HIV OutcomesResearch/US (CHORUS) cohort (16) to develop a com-puter model that incorporated time-updated CD4-positivecell counts, viral load, adherence to treatment, and devel-opment of resistance; the estimated median survival fromthat model was 20.4 years for newly diagnosed patients.Compared with CHORUS, which is a clinic-based, multi-state cohort study requiring informed consent from thepatients, DHCS is geographically based with almost com-plete inclusion of HIV-infected patients in our area. There-fore, we may interpret our findings as a result of the totalhealth care effort in our area.
The mortality rates for HIV-infected patients may beput into clinical perspective by comparison with mortalityrates among patients with type 1 diabetes mellitus, anotherserious chronic disease of young adults. Laing and cowork-ers (17) estimated age- and sex-specific mortality rates forpatients with type 1 diabetes (per 1000 person-years). Theyreported the following mortality rates for women and men,respectively: for age 30 to 39 years, 3.2 and 4.2; for age 40to 49 years, 8.5 and 11.6; for age 50 to 59 years, 19.1 and26.2; and for age 60 to 69 years, 44.6 and 63.2. These ratesare slightly lower than the rates we found among personswithout HCV infection during the late HAART era.
The strengths of our study are its population-basedsetting, minimal participants lost to follow-up, high qualityof the death registration (that is, we are certain that all
Figure. Survival from age 25 years.
Cumulative survival curve for HIV-infected persons (without hepatitis Ccoinfection) and persons from the general population. Persons with HIVinfection are divided into 3 calendar periods of observation. Dashed linesindicate 95% CIs. HIV � human immunodeficiency virus; HAART �highly active antiretroviral therapy.
Table 4. Mortality Rates according to Cause of Death and Calendar Period*
ObservationPeriod
Cause of Death PYR, n Events, n Mortality Rate per1000 PYR (95% CI)
All-Cause MortalityRate, %
Mortality Rate byKnown Causes, %
1995–1996All causes 3243 402 124 (112–137) 100HIV-related 3243 231 71.2 (62.6–81.0) 57 76Non–HIV-related 3243 75 23.1 (18.4–29.0) 19 24Unknown 3243 96 29.6 (24.2–36.2) 24
1997–1999All causes 5857 222 37.9 (33.2–43.2) 100HIV-related 5857 104 17.8 (14.7–21.5) 47 57Non–HIV-related 5857 80 13.7 (11.0–17.0) 36 43Unknown 5857 38 6.5 (4.7–8.9) 17
2000–2005All causes 13 644 346 25.4 (22.8–28.2) 100HIV-related 13 644 96 7.0 (5.8–8.6) 28 43Non–HIV-related 13 644 128 9.4 (7.9–11.2) 37 57Unknown 13 644 122 8.9 (7.5–10.7) 35
* HIV � human immunodeficiency virus; PYR � person-years at risk.
ArticleSurvival in Patients with HIV Infection
www.annals.org 16 January 2007 Annals of Internal Medicine Volume 146 • Number 2 93

dates were correct for all registered deaths), clearly defineddate of inclusion of all prevalent and incident cases of HIVinfection in Denmark (1 January 1995), and large propor-tion of incident cases observed shortly after patients werediagnosed with HIV infection, which allowed us to followup on most patients from before initiation of HAART.
Despite the advantages of good-quality data, our studyhas limitations. First, survival predictions were based onthe assumption that the observed mortality rates alsowould apply in subsequent years, whereas actual observa-tion time of any individual patient was at most 10 years.However, we found no increase in mortality rates throughthe first 10 years of infection or increase in mortality rateswith increasing time receiving HAART, and we found adecrease in mortality rates with increasing calendar period.These findings agree with a previous study from DHCS, inwhich we observed a decreasing incidence of triple-classdrug failure with successive calendar periods (18). Thus,we did not see any signs of waning effectiveness ofHAART, which is currently debated and considered to bea potential health threat because of multiclass drug failure,accumulation of drug resistance, and long-term drug tox-icities (19, 20) Although our predictions reach far beyondthe current experience with HIV and HAART, we saw nosigns that a 50-year-old patient who was infected severalyears previously had a higher mortality rate than a recentlyinfected 50-year-old patient. Second, some eligible HIV-infected persons may not have been included in the study.Because dispensing antiretroviral drugs in Denmark is re-stricted to HIV clinics and is free, many of the missedpatients are probably those who do not fulfill the criteriafor HAART and therefore have low mortality rates. Thiswould cause overestimation of mortality rates in the HIV-infected cohort. In contrast, many patients may not seekcare despite being eligible for antiretroviral treatment andmay belong to a group with such comorbid conditions asmental health disorders or addiction problems. This groupwould have a higher risk for death, because of HIV infec-tion and comorbid conditions, thus leading to an underes-timation of the mortality rates in the HIV-infected cohort.Third, the HIV-infected population is thought to differfrom the general population regarding socioeconomic andbehavioral factors (8, 21) and having acquired HIV infec-tion probably indicates a tendency toward risk behaviors.Studies have shown a higher frequency of smoking andalcohol consumption among HIV-infected patients (22,23). Matching the cohort of persons from the general pop-ulation according to sex, age, and place of residence maypartly correct for these group differences, but any residualconfounding by lifestyle or comorbid conditions wouldcause an overestimation of the observed excess mortalityrates because of HIV infection. Fourth, the results are in-fluenced by the composition of the study sample. In ourcohort, and in most other HIV-infected populations, themortality rates differ in subgroups (defined by HCV coin-fection status, ethnicity, risk behaviors, and sex), and may
be influenced by the person’s position on different timescales (age, time receiving HAART, and calendar time). Toexplore and clarify the effect of these covariates, we pre-sented mortality rates in selected time strata. The subgroupwith the best prognosis (persons without HCV coinfec-tion) comprised 84% of all persons observed in the lateHAART era and was therefore chosen as a clinically usefulreference group.
The survival projections in our study depend on con-tinuous treatment success beyond the 10 years of currentexperience with HAART. Further, with the easy access toHAART and HIV care in Denmark, our findings mayrepresent a best-case scenario. Not all subgroups of patientshave the same prognosis, and treatment must be individu-alized according to actual risk estimates. Our study sug-gests that most young persons with HIV infection can ex-pect to survive for more than 35 years, but an ongoingeffort is still needed to further reduce mortality rates inthese persons.
From Odense University Hospital and University of Southern Denmark,Odense, Denmark; Århus University Hospital and Århus University,Århus, Denmark; Hvidovre University Hospital, Hvidovre, Denmark;Rigshospitalet, Copenhagen, Denmark; and Boston University, Boston,Massachusetts.
Acknowledgments: The authors thank the staff of their clinical depart-ments for their continuous support and enthusiasm.
Grant Support: The Danish HIV Cohort study receives funding fromthe Danish AIDS Foundation, Odense University Hospital, Preben andAnna Simonsen’s Foundation, the Foundation of the Danish Associationof Pharmacists, and the Clinical Institute at the University of SouthernDenmark.
Potential Financial Conflicts of Interest: Consultancies: J. Gerstoft(Roche, Glaxo, Abbott, Boehringer Ingelheim, Merck Sharp & Dohme,Swedish-Orphan Drugs); Honoraria: J. Gerstoft (Roche, Glaxo, Abbott,Boehringer Ingelheim, MSD, Swedish-Orphan Drugs); Grants received:N. Obel (Roche, Bristol-Meyers Squibb, Merck Sharp & Dohme,GlaxoSmithKline, Abbott, Boehringer Ingelheim, Janssen-Cilag, Swed-ish-Orphan Drugs).
Requests for Single Reprints: Nicolai Lohse, MD, PhD, Departmentof Infectious Diseases, Odense University Hospital, Sdr. Boulevard 29,DK-5000 Odense C, Denmark; e-mail, [email protected].
Current author addresses and author contributions are available at www.annals.org.
References1. Mocroft A, Ledergerber B, Katlama C, Kirk O, Reiss P, D’Arminio MA, etal. Decline in the AIDS and death rates in the EuroSIDA study: an observationalstudy. Lancet. 2003;362:22-29. [PMID: 12853195]2. van Sighem A, Danner S, Ghani AC, Gras L, Anderson RM, De Wolf F, etal. Mortality in patients with successful initial response to highly active antiretro-viral therapy is still higher than in non-HIV-infected individuals. J Acquir Im-mune Defic Syndr. 2005;40:212-18. [PMID: 16186740]3. Keiser O, Taffe P, Zwahlen M, Battegay M, Bernasconi E, Weber R, et al.All cause mortality in the Swiss HIV Cohort Study from 1990 to 2001 in com-
Article Survival in Patients with HIV Infection
94 16 January 2007 Annals of Internal Medicine Volume 146 • Number 2 www.annals.org

parison with the Swiss population. AIDS. 2004;18:1835-43. [PMID: 15316345]4. Jensen-Fangel S, Pedersen L, Pedersen C, Larsen CS, Tauris P, Møller A, etal. Low mortality in HIV-infected patients starting highly active antiretroviraltherapy: a comparison with the general population. AIDS. 2004;18:89-97.[PMID: 15090834]5. Lohse N, Ladefoged K, Pedersen L, Jensen-Fangel S, Sørensen HT, Obel N.Low effectiveness of highly active antiretroviral therapy and high mortality in theGreenland HIV-infected population. Scand J Infect Dis. 2004;36:738-42.[PMID: 15513400]6. Press N, Tyndall MW, Wood E, Hogg RS, Montaner JS. Virologic andimmunologic response, clinical progression, and highly active antiretroviral ther-apy adherence. J Acquir Immune Defic Syndr. 2002;31 Suppl 3:S112-7. [PMID:12562032]7. Lundgren JD, Mocroft A, Gatell JM, Ledergerber B, D’Arminio MA, Her-mans P, et al. A clinically prognostic scoring system for patients receiving highlyactive antiretroviral therapy: results from the EuroSIDA study. J Infect Dis. 2002;185:178-87. [PMID: 11807691]8. Lohse N, Hansen AB, Jensen-Fangel S, Kronborg G, Kvinesdal B, PedersenC, et al. Demographics of HIV-1 infection in Denmark: results from the DanishHIV Cohort Study. Scand J Infect Dis. 2005;37:338-43. [PMID: 16051569]9. The Civil Registration System in Denmark. Accessed at www.cpr.dk/index/dokumenter.asp?o�7&n�0&d�141&s�5 on 3 September 2006.10. Frank L. Epidemiology. When an entire country is a cohort. Science. 2000;287:2398-9. [PMID: 10766613]11. National Center for Health Statistics. United States Life Tables, 2002. Ac-cessed at www.cdc.gov/nchs/products/pubs/pubd/lftbls/life/1966.htm on 3 Sep-tember 2006.12. Jensen-Fangel S, Pedersen C, Larsen CS, Tauris P, Møller A, Obel N.Changing demographics in an HIV-infected population: results from an obser-vational cohort study in Western Denmark. Scand J Infect Dis. 2001;33:765-70.[PMID: 11728045]13. Christensen PB. [Epidemiology of hepatitis C]. Ugeskr Laeger. 1998;160:3529-32. [PMID: 9641037]14. Jaggy C, von Overbeck J, Ledergerber B, Schwarz C, Egger M, Rickenbach
M, et al. Mortality in the Swiss HIV Cohort Study (SHCS) and the Swiss generalpopulation. Lancet. 2003;362:877-8. [PMID: 13678976]15. Braithwaite RS, Justice AC, Chang CC, Fusco JS, Raffanti SR, Wong JB,et al. Estimating the proportion of patients infected with HIV who will die ofcomorbid diseases. Am J Med. 2005;118:890-8. [PMID: 16084183]16. The Collaborations in HIV Outcomes Research/US (CHORUS) Cohort.Accessed at www.hivforum.org/uploads/cohorts/CHORUS%203May2005.pdfon 3 September 2006.17. Laing SP, Swerdlow AJ, Slater SD, Botha JL, Burden AC, Waugh NR, etal. The British Diabetic Association Cohort Study, I: all-cause mortality in pa-tients with insulin-treated diabetes mellitus. Diabet Med. 1999;16:459-65.[PMID: 10391392]18. Lohse N, Obel N, Kronborg G, Laursen A, Pedersen C, Larsen CS, et al.Declining risk of triple-class antiretroviral drug failure in Danish HIV-infectedindividuals. AIDS. 2005;19:815-22. [PMID: 15867496]19. Phillips AN, Dunn D, Sabin C, Pozniak A, Matthias R, Geretti AM et al.Long term probability of detection of HIV-1 drug resistance after starting anti-retroviral therapy in routine clinical practice. AIDS. 2005;19:487-94. [PMID:15764854]20. Zwahlen M, Lundgren JD. Commentary: Death in the era of potent anti-retroviral therapy: shifting causes, new challenges. Int J Epidemiol. 2005;34:130-1. [PMID: 15649955]21. Saves M, Chene G, Ducimetiere P, Leport C, Le Moal G, Amouyel P, et al.Risk factors for coronary heart disease in patients treated for human immuno-deficiency virus infection compared with the general population. Clin Infect Dis.2003;37:292-8. [PMID: 12856222]22. Galvan FH, Bing EG, Fleishman JA, London AS, Caetano R, Burnam MA,et al. The prevalence of alcohol consumption and heavy drinking among peoplewith HIV in the United States: results from the HIV Cost and Services Utiliza-tion Study. J Stud Alcohol. 2002;63:179-86. [PMID: 12033694]23. Mamary EM, Bahrs D, Martinez S. Cigarette smoking and the desire to quitamong individuals living with HIV. AIDS Patient Care STDS. 2002;16:39-42.[PMID: 11839217]
ArticleSurvival in Patients with HIV Infection
www.annals.org 16 January 2007 Annals of Internal Medicine Volume 146 • Number 2 95
Current Author Addresses: Drs. Lohse, Hansen, and Obul: Depart-ment of Infectious Diseases, Odense University Hospital, Sdr. Boulevard29, DK-5000 Odense C, Denmark.Dr. Pedersen: Department of Infectious Diseases, Aalborg UniversityHospital, DK-9000 Aalborg, Denmark.Dr. Kronborg: Department of Infectious Diseases, Hvidovre Hospital,DK-2650 Hvidovre, Denmark.Dr. Gerstoft, Department of Infectious Diseases, Rigshospitalet, Bleg-damsvej 9, DK-2100 Copenhagen Ø, Denmark.Dr. Sørensen: Department of Clinical Epidemiology, Århus UniversityHospital, Ole Worms Alle 1150, DK-8000 Århus C, Århus, Denmark.Dr. Væth: Department of Biostatistics, University of Århus, DK-8000Århus C, Denmark.
Author Contributions: Conception and design: N. Lohse, A.-B.E. Han-sen, H.T. Sørensen, N. Obel.
Analysis and interpretation of the data: N. Lohse, H.T. Sørensen,M. Væth, N. Obel.Drafting of the article: N. Lohse.Critical revision of the article for important intellectual content: N.Lohse, A.-B.E. Hansen, G. Pedersen, G. Kronborg, J. Gerstoft, H.T.Sørensen, M. Væth, N. Obel.Final approval of the article: N. Lohse, A.-B.E. Hansen, G. Pedersen,G. Kronborg, J. Gerstoft, H.T. Sørensen, M. Væth, N. Obel.Provision of study materials or patients: G. Pedersen, G. Kronborg, J.Gerstoft, N. Obel.Statistical expertise: N. Lohse, M. Væth.Obtaining of funding: N. Obel.Administrative, technical, or logistic support: N. Lohse, N. Obel.Collection and assembly of data: N. Lohse, A.-B.E. Hansen, G. Kron-borg, J. Gerstoft, N. Obel.
Annals of Internal Medicine
www.annals.org 16 January 2007 Annals of Internal Medicine Volume 146 • Number 2 W-15
EPIDEMIOLOGY AND PREVENTION
Comorbidity Acquired Before HIV Diagnosis and Mortalityin Persons Infected and Uninfected With HIV: A Danish
Population-Based Cohort Study
Nicolai Lohse, MD, PhD,* Jan Gerstoft, MD, DMSc,† Gitte Kronborg, MD, DMSc,‡
Carsten Schade Larsen, MD, DMSc,§ Court Pedersen, MD, DMSc,k Gitte Pedersen, MD, PhD,¶
Lars Nielsen, MD, PhD,# Henrik Toft Sørensen, MD, PhD, DMSc,* and Niels Obel, MD, DMSc†
Background: We aimed to estimate the impact of comorbidity
acquired before HIV diagnosis on mortality in individuals infected
with HIV.
Methods: This cohort study compared 2 different cohorts. The
prospective population-based nationwide observational Danish HIV
Cohort Study was used to compare all adults diagnosed with HIV in
Denmark from 1997 with a matched general population cohort.
Comorbidity history was ascertained from the Danish National
Patient Registry and vital statistics obtained from the Danish Civil
Registration System. Cox regression was used to estimate the impact
of Charlson comorbidity index (CCI) and hepatitis C virus
coinfection on mortality, and population attributable risk was used
to assess the proportional impact of comorbidity on mortality.
Results: CCI comorbidity was present before HIV diagnosis in
11.3% of 1638 persons with HIV, and in 8.0% of 156,506 persons in
the general population. The risk for death in patients with HIV with at
least 1 CCI point was 1.84 times higher than in those with no CCI
points (adjusted mortality rate ratio, 95% confidence interval: 1.32 to
2.57). The annual risk of dying for patients with HIV vs general
population with 0, 1, 2, and 3+ CCI points was 1.70% (1.44 to
2.00) vs 0.27% (0.26 to 0.28), 4.37% (3.01 to 6.32) vs 1.36% (1.26 to
1.47), 8.06% (4.94 to 13.16) vs 2.44% (2.22 to 2.68), and 10.15%
(5.08 to 20.30) vs 5.84% (5.19 to 6.58), respectively. Comorbidity
acquired before HIV, hepatitis C virus coinfection, and background
mortality accounted for 45% of total mortality in the population
infected with HIV.
Conclusions: Almost half of deaths in persons diagnosed with HIV
in a health care setting with free access to highly active antiretroviral
therapy stemmed from factors unrelated to HIV disease.
Key Words: HIV, comorbidity, mortality, cohort study, population based
(J Acquir Immune Defic Syndr 2011;57:334–339)
INTRODUCTIONMortality and morbidity among persons infected with
HIV has decreased dramatically since the introduction ofhighly active antiretroviral therapy in 1996–1997.1 Despite thisprogress, mortality remains markedly higher than in un-infected persons.2 The proportion of all deaths among personsinfected with HIV due to non-AIDS and noninfectious causessuch as drug-induced toxicity,3 cardiovascular disease,4 renaldisease,5 cancer,6 and HIV-induced morbidity other thanAIDS7 has increased to as much as 46%.2,8–12 Several recentstudies have focused on coexisting non-AIDS and non-infectious morbidity as prognostic factors in these patients,6,8–15
but the impact of diseases acquired by patients before their HIVdiagnosis remains poorly understood, with the exception ofhepatitis C virus (HCV) infection.16,17 We aimed to estimate theimpact of comorbidity acquired before HIV diagnosis onmortality in individuals infected with HIV.
METHODS
Study TypeThis matched cohort study investigates the impact of
non-HIV comorbidity on all-cause mortality in a cohort ofpersons infected with HIV compared with a cohort of personsfrom the general population.
Study PopulationOur study population consisted of all persons who were
diagnosed with HIV in Denmark between January 1, 1997, and
Received for publication December 27, 2010; accepted March 30, 2011.From the *Department of Clinical Epidemiology, �Arhus University Hospital,
�Arhus, Denmark; †Department of Infectious Diseases, Rigshospitalet,Copenhagen, Denmark; ‡Department of Infectious Diseases, HvidovreHospital, Hvidovre, Denmark; §Department of Infectious Diseases,Skejby Hospital, �Arhus University Hospital, �Arhus, Denmark;kDepartment of Infectious Diseases, Odense University Hospital, Odense,Denmark; {Department of Infectious Diseases, Aalborg Hospital, �ArhusUniversity Hospital, Aalborg, Denmark; and #Department of InfectiousDiseases, Helsingør Hospital, Helsingør, Denmark.
Danish HIV Cohort Study is funded by the Danish AIDS Foundation.Presented as a poster (P18.4/07) at the European AIDS Clinical Society
conference in Madrid 2007. This article is based on updated data that havebeen reanalyzed using a different and an improved approach, includingnew additional analyses.
Danish AIDS Foundation did not have any influence on this study’s design,data analysis, or manuscript preparation. No authors have ties with thefoundation, except Jan Gerstoft who is a member of the board. The studywas approved by the Danish Data Protection Agency. Approval from anethics committee was not required.
Correspondence to: Nicolai Lohse, MD, PhD, Ordrupdalvej 12A, DK-2920Charlottenlund, Denmark (e-mail: [email protected]).
Copyright � 2011 by Lippincott Williams & Wilkins
334 | www.jaids.com J Acquir Immune Defic Syndr � Volume 57, Number 4, August 1, 2011

May 1, 2005; who were at least 16 years old; and who wereDanish residents at the time of HIV diagnosis. These inclusiondates allowed for at least 2 years of observation time for allsubjects. For each patient with HIV, we sampled generalpopulation controls, matched on sex and year and month ofbirth, who were alive and living in the same municipality as thepatient on the patient’s diagnosis date. Denmark hasa population of approximately 5.3 million persons living in270 municipalities. We aimed to sample 99 controls for eachindividual infected with HIV, but because of a shortageof eligible controls in some municipalities, the mean numberof controls per patient in the final general population cohortwas 95.5.
Data SourcesPersons with HIV were identified from the Danish HIV
Cohort Study (DHCS), which has established an openpopulation-based cohort that includes all persons infectedwith HIV seen in 8 HIV clinics in Denmark since January 1,1995.18,19 Denmark provides free, tax-supported health careincluding treatment for HIV. Antiretroviral drugs and specialisttreatment are available exclusively through the HIV clinics,and persons diagnosed with HIV are referred directly to one ofthese clinics for care and treatment. It is estimated that morethan 99% of patients accept this offer, so the cohort is virtuallycomplete regarding incident cases of HIV in Denmark. Theannually updated data of DHCS include antiretroviraltreatment, development of AIDS-defining illnesses, CD4+
cell counts, HIV RNA [viral load (VL)], and deaths, inaddition to sex, age, ethnicity, most likely mode of infection,HCV coinfection at time of diagnosis, and preexisting AIDS-defining illness.18 General population control subjects weresampled from the Danish Civil Registration System (DCRS),which has maintained information on all Danish residentssince 1968, using unique personal identifiers (CPR num-bers).20 The DCRS records date of birth, sex, place ofresidence, date of migration, and date of death.20 Its database isupdated within a week of a person’s birth, address change,death, or emigration. Comorbidity before an HIV diagnosiswas assessed both for persons with HIV and for generalpopulation controls through the Danish National PatientRegistry (DNPR). This registry, established in 1977, covers allDanish hospitals and records all hospital admissions, di-agnoses, and, since 1995, outpatient and emergency visits.21
The DNPR covers private and public hospitals. We used CPRnumbers to link data between these registries.
Study Variables
Outcome Variable
Death from any cause was obtained through the DCRS.
Main Explanatory VariablesWe computed a Charlson comorbidity index (CCI) score
for all study subjects based on their complete hospital historyin the DNPR. The CCI22 was developed to classify comorbidconditions that alter the risk for 1-year mortality afterhospitalization in longitudinal studies. The CCI has beenadapted and validated for use with hospital discharge data inInternational Classification of Diseases databases for the
prediction of short- and long-term mortality.23 The following19 disease categories are included in the CCI: myocardialinfarction (1 point), congestive heart failure (1 point), peripheralvascular disease (1 point), cerebrovascular disease (1 point),dementia (1 point), chronic pulmonary disease (1 point), con-nective tissue disease (1 point), ulcer disease (1 point), mildliver disease (1 point), diabetes (1 point), hemiplegia (2 points),moderate to severe renal disease (2 points), diabetes with end-organ failure (2 points), any tumor (2 points), leukemia(2 points), lymphoma (2 points), moderate to severe liverdisease (3 points), metastatic solid tumor (6 points), and AIDS(6 points). A CCI score was calculated for each patient infectedwith HIV as of the date of HIV diagnosis. For each patient’sgeneral population control, we computed a CCI score as of thesame date. The disease category ‘‘AIDS’’ was excluded in ourcomputations because it was closely related to the mainexposure in our study.
HCV infection is not included in the CCI score but iscommon in individuals infected with HIV due to shared routesof transmission. We thus included it as a study variable,assuming that HCV infection occurred at the same time orbefore HIV acquisition. Patients with at least 1 positive HCVantibody test or a positive HCV RNA test were consideredHCV-positive; others were considered HCV-negative. HCVstatus was available for 98.0% of study patients infected withHIV. We did not have individual data on HCV infection amongthe general population controls mainly because HCV infectionis often asymptomatic and therefore not diagnosed; also, it wasnot a separate diagnosis in the International Classification ofDiseases, 8th Revision, which was used in the DNPR until1993. As the estimated prevalence of HCV in Denmark is just3 per 1000,24 all individuals in the general population cohortwere considered HCV-negative in our analyses.
Other Explanatory VariablesInformation on the sex (male/female), age (in years),
ethnicity (white yes/no), mode of infection (injecting drug useyes/no, men who have sex with men yes/no, heterosexual yes/no,blood transfusion yes/no, hemophilia yes/no, other yes/no,unknown yes/no), CD4+ T-cell count at time of diagnosis(median, interquartile range), VL at time of diagnosis (median,interquartile range), and HCV serostatus of the subjects wasobtained from the DHCS.
Statistical Analyses
Basal Characteristics
Chi-square test was used to examine differences indistribution of characteristics between persons with HIV andthe general population.
Survival AnalysisWe linked all study subjects to the DCRS and computed
observation times from their date of HIV diagnosis until deathfrom any cause, migration, or June 1, 2007, whichever camefirst. We used Cox regression analysis to compute unadjustedhazard ratios as a measure of mortality rate ratios (MRRs) forpatients with HIV diagnosed after January 1, 1997, comparingdifferent covariate strata (model A). In addition to CCI(0 points vs $1 points), the following covariates were included
� 2011 by Lippincott Williams & Wilkins www.jaids.com | 335
J Acquir Immune Defic Syndr � Volume 57, Number 4, August 1, 2011 Comorbidity and HIV Mortality

in the analysis: CD4+ T-cell count at time of diagnosis, definedas the first measurement within 90 days after diagnosis(.200 cells/mL, 50–200 cells/mL, ,50 cells/mL, or missing);age at time of diagnosis; history of injecting drug use; whiterace; sex; and log(VL) at time of diagnosis, defined as the firstmeasurement within 90 days after diagnosis (,4 copies/mL,4–5 copies/mL, .5 copies/mL, or missing). We estimated theMRRs in a multivariate model including all covariates(model B), and in adjusted models including CCI and oneof each of the other covariates successively (models C and D).Model C examined the influence of each covariate on CCIscore. Model D examined the influence of CCI score on eachof the other covariates. To assess the potential bias introducedby immigrants with previous hospital admissions notregistered in the DNPR, we carried out a sensitivity analysisrestricting the population to individuals infected with HIVborn in Denmark. Another sensitivity analysis excludedlymphoma from the CCI score because some lymphomasmight have been AIDS-defining events.
Interaction Between HIV and Comorbidity EffectsMortality rates (MRs) were computed within 4 CCI
strata (0, 1, 2, and .3 points), separately for patients and forgeneral population controls. Kaplan–Meier curves wereconstructed, and log-rank test was used to compare survivalwithin each stratum. For controls, observation time wascomputed starting from the date of HIV diagnosis of thecorresponding HIV-infected person. To estimate the interac-tion between baseline comorbidity and HIV effects, defined asdeviation of MRs from an additive model,25 we assessed theeffect measure modification on MR differences. The in-teraction between the prognostic effects of HIV andcomorbidity was computed as the interaction risk (IAR)25
with a bootstrap 95% confidence interval (CI)26: IARhiv,x =(MRhiv,x 2 MRhiv,0) 2 (MRpop,x 2 MRpop,0), where IARhiv,x isthe IAR difference for persons with HIV and CCI = X; MRhiv,x
and MRhiv,0 are the MRs for patients with HIV with CCI = X (Xcan take the values 1, 2, or 3) and CCI = 0, respectively; andMRpop,x and MRpop,0 are the MRs for population controls withCCI = X and CCI = 0, respectively. The proportion of excessdeaths in persons infected with HIV due to interaction withineach comorbidity stratum CCI = X was IARhiv,x/(MRhiv,x 2MRhiv,0) = 1 2 (MRpop,x 2 MRpop,0)/(MRhiv,x 2 MRhiv,0). Asensitivity analysis restricted the population to persons notcoinfected with HCV.
Population Attributable RiskThe population attributable risk (PAR) of death due to
CCI points in the population infected with HIV was calculatedas follows27: If MRhiv is the MR in the population with HIVand MRhiv,0 is the MR in the unexposed population (no CCIpoints), then PAR is (MRhiv – MRhiv,0)/MRhiv.
RESULTSAmong the 1638 patients with HIV diagnosed from
January 1, 1997, to May 1, 2005, we observed 195 deaths in9350 person-years of follow-up, yielding an MR of 2.09% (95%CI: 1.81 to 2.40) per year. In comparison, the 3676 deaths
observed among 156,506 general population control cohortmembers followed for 939,560 person-years yielded an MR of0.39% (95% CI: 0.38 to 0.40) per year. Morbidity was presentbefore HIV diagnosis in 354 (21.6%) of 1638 patients with HIV,of whom 185 (11.3%) had acquired at least 1 CCI point and 211(12.9%) were coinfected with HCV; morbidity was present in12,531 (8.0%) of 156,506 general population controls (Table 1).The most common CCI comorbidities were liver disease in 48(2.9%) patients vs 793 (0.51%) general population controls,lymphoma in 11 (0.67%) patients vs 232 (0.15%) controls, andsolid malignant tumors in 22 (1.34%) patients vs 1773(1.13%) controls. Among 1638 patients with HIV, 155 (9.5%)did not have available CD4+ T-cell count data and 187 (11.4%)did not have available VL data at the time of diagnosis.
Comorbidity as a Predictor of All-CauseMortality in Patients With HIV
The MRR for patients with HIV with at least 1 CCI pointcompared with patients with HIV with no CCI points was 3.27(95% CI: 2.38 to 4.50; Table 2, model A). This estimatedecreased after adjustment for other prognostic factors fordeath (Table 2, model C), but the CCI score remaineda predictor of death in the fully adjusted model (MRR = 1.84,95% CI: 1.32 to 2.57; Table 2, Model B). CCI score did not
TABLE 1. Characteristics of the Study Populations
Persons WithHIV, n (%)
GeneralPopulation,
n (%) P
No. persons 1638 156,506 NA
Person-y at risk 9350 939,560 NA
End points (deaths) 195 3676 NA
Female sex 437 (27) 42,846 (27) NA*
Median (IQR) age atHIV diagnosis (y)
37 (31–45) NA NA
White race 1216 (74) NA NA
Most likely mode of infection
Heterosexual 741 (45) NA NA
Men who have sex with men 655 (40) NA NA
Injecting drug use 144 (9) NA NA
Blood transfusion 6 (0.4) NA NA
Hemophilia 3 (0.2) NA NA
Other 17 (1) NA NA
Unknown 72 (4) NA NA
Median (IQR) CD4 at HIVdiagnosis (cells/mL)
286 (110–490) NA NA
Median (IQR) log(VL) at HIVdiagnosis (copies/mL)
4.8 (4.1–5.4) NA NA
HCV positive 211 (13) NA† ,0.01‡
CCI points at HIV diagnosis
0 1453 (89) 143,975 (92) ,0.01
1 122 (7.4) 8341 (5.3) ,0.01
2 44 (2.7) 3212 (2.1) 0.07
$3 19 (1.2) 978 (0.6) 0.01
*The general population was matched on sex.†The prevalence of HCV in Denmark is estimated at 0.3%.24
‡Based on estimated prevalence of HCV in Denmark of 0.3%.24
CD4, CD4+ T-cell count; IQR, interquartile range; NA, not applicable/available.
336 | www.jaids.com � 2011 by Lippincott Williams & Wilkins
Lohse et al J Acquir Immune Defic Syndr � Volume 57, Number 4, August 1, 2011
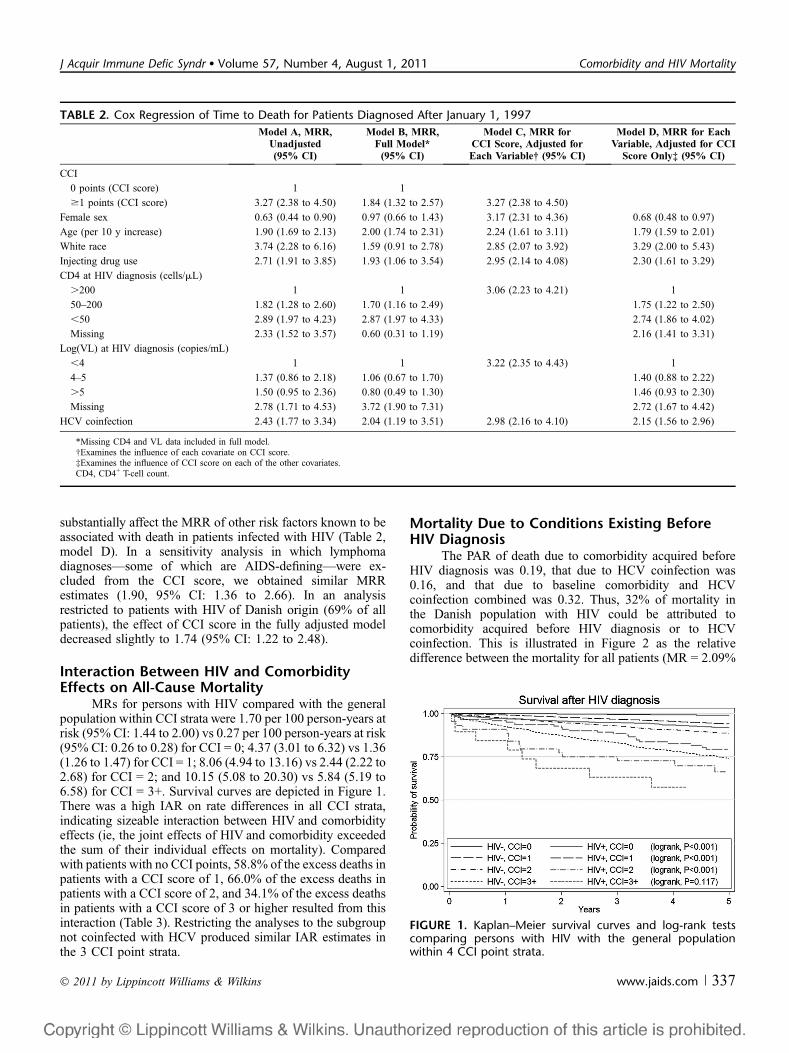
substantially affect the MRR of other risk factors known to beassociated with death in patients infected with HIV (Table 2,model D). In a sensitivity analysis in which lymphomadiagnoses—some of which are AIDS-defining—were ex-cluded from the CCI score, we obtained similar MRRestimates (1.90, 95% CI: 1.36 to 2.66). In an analysisrestricted to patients with HIV of Danish origin (69% of allpatients), the effect of CCI score in the fully adjusted modeldecreased slightly to 1.74 (95% CI: 1.22 to 2.48).
Interaction Between HIV and ComorbidityEffects on All-Cause Mortality
MRs for persons with HIV compared with the generalpopulation within CCI strata were 1.70 per 100 person-years atrisk (95% CI: 1.44 to 2.00) vs 0.27 per 100 person-years at risk(95% CI: 0.26 to 0.28) for CCI = 0; 4.37 (3.01 to 6.32) vs 1.36(1.26 to 1.47) for CCI = 1; 8.06 (4.94 to 13.16) vs 2.44 (2.22 to2.68) for CCI = 2; and 10.15 (5.08 to 20.30) vs 5.84 (5.19 to6.58) for CCI = 3+. Survival curves are depicted in Figure 1.There was a high IAR on rate differences in all CCI strata,indicating sizeable interaction between HIV and comorbidityeffects (ie, the joint effects of HIV and comorbidity exceededthe sum of their individual effects on mortality). Comparedwith patients with no CCI points, 58.8% of the excess deaths inpatients with a CCI score of 1, 66.0% of the excess deaths inpatients with a CCI score of 2, and 34.1% of the excess deathsin patients with a CCI score of 3 or higher resulted from thisinteraction (Table 3). Restricting the analyses to the subgroupnot coinfected with HCV produced similar IAR estimates inthe 3 CCI point strata.
Mortality Due to Conditions Existing BeforeHIV Diagnosis
The PAR of death due to comorbidity acquired beforeHIV diagnosis was 0.19, that due to HCV coinfection was0.16, and that due to baseline comorbidity and HCVcoinfection combined was 0.32. Thus, 32% of mortality inthe Danish population with HIV could be attributed tocomorbidity acquired before HIV diagnosis or to HCVcoinfection. This is illustrated in Figure 2 as the relativedifference between the mortality for all patients (MR = 2.09%
TABLE 2. Cox Regression of Time to Death for Patients Diagnosed After January 1, 1997
Model A, MRR,Unadjusted(95% CI)
Model B, MRR,Full Model*
(95% CI)
Model C, MRR forCCI Score, Adjusted forEach Variable† (95% CI)
Model D, MRR for EachVariable, Adjusted for CCI
Score Only‡ (95% CI)
CCI
0 points (CCI score) 1 1
$1 points (CCI score) 3.27 (2.38 to 4.50) 1.84 (1.32 to 2.57) 3.27 (2.38 to 4.50)
Female sex 0.63 (0.44 to 0.90) 0.97 (0.66 to 1.43) 3.17 (2.31 to 4.36) 0.68 (0.48 to 0.97)
Age (per 10 y increase) 1.90 (1.69 to 2.13) 2.00 (1.74 to 2.31) 2.24 (1.61 to 3.11) 1.79 (1.59 to 2.01)
White race 3.74 (2.28 to 6.16) 1.59 (0.91 to 2.78) 2.85 (2.07 to 3.92) 3.29 (2.00 to 5.43)
Injecting drug use 2.71 (1.91 to 3.85) 1.93 (1.06 to 3.54) 2.95 (2.14 to 4.08) 2.30 (1.61 to 3.29)
CD4 at HIV diagnosis (cells/mL)
.200 1 1 3.06 (2.23 to 4.21) 1
50–200 1.82 (1.28 to 2.60) 1.70 (1.16 to 2.49) 1.75 (1.22 to 2.50)
,50 2.89 (1.97 to 4.23) 2.87 (1.97 to 4.33) 2.74 (1.86 to 4.02)
Missing 2.33 (1.52 to 3.57) 0.60 (0.31 to 1.19) 2.16 (1.41 to 3.31)
Log(VL) at HIV diagnosis (copies/mL)
,4 1 1 3.22 (2.35 to 4.43) 1
4–5 1.37 (0.86 to 2.18) 1.06 (0.67 to 1.70) 1.40 (0.88 to 2.22)
.5 1.50 (0.95 to 2.36) 0.80 (0.49 to 1.30) 1.46 (0.93 to 2.30)
Missing 2.78 (1.71 to 4.53) 3.72 (1.90 to 7.31) 2.72 (1.67 to 4.42)
HCV coinfection 2.43 (1.77 to 3.34) 2.04 (1.19 to 3.51) 2.98 (2.16 to 4.10) 2.15 (1.56 to 2.96)
*Missing CD4 and VL data included in full model.†Examines the influence of each covariate on CCI score.‡Examines the influence of CCI score on each of the other covariates.CD4, CD4+ T-cell count.
FIGURE 1. Kaplan–Meier survival curves and log-rank testscomparing persons with HIV with the general populationwithin 4 CCI point strata.
� 2011 by Lippincott Williams & Wilkins www.jaids.com | 337
J Acquir Immune Defic Syndr � Volume 57, Number 4, August 1, 2011 Comorbidity and HIV Mortality
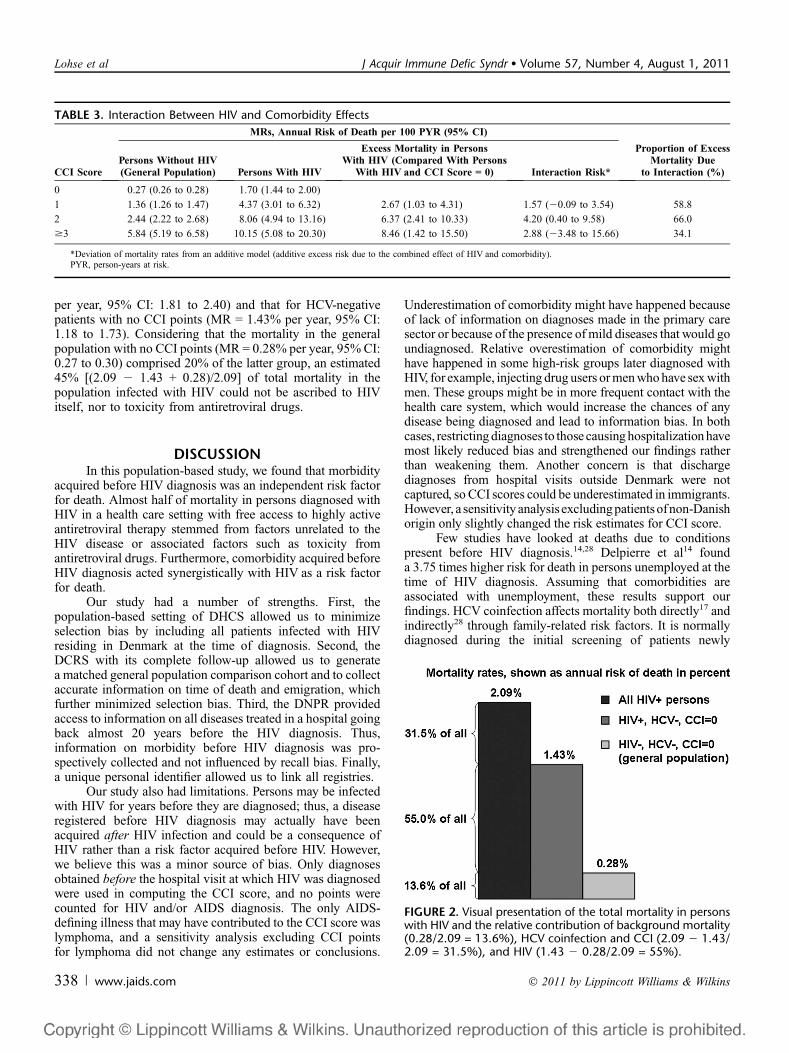
per year, 95% CI: 1.81 to 2.40) and that for HCV-negativepatients with no CCI points (MR = 1.43% per year, 95% CI:1.18 to 1.73). Considering that the mortality in the generalpopulation with no CCI points (MR = 0.28% per year, 95% CI:0.27 to 0.30) comprised 20% of the latter group, an estimated45% [(2.09 2 1.43 + 0.28)/2.09] of total mortality in thepopulation infected with HIV could not be ascribed to HIVitself, nor to toxicity from antiretroviral drugs.
DISCUSSIONIn this population-based study, we found that morbidity
acquired before HIV diagnosis was an independent risk factorfor death. Almost half of mortality in persons diagnosed withHIV in a health care setting with free access to highly activeantiretroviral therapy stemmed from factors unrelated to theHIV disease or associated factors such as toxicity fromantiretroviral drugs. Furthermore, comorbidity acquired beforeHIV diagnosis acted synergistically with HIV as a risk factorfor death.
Our study had a number of strengths. First, thepopulation-based setting of DHCS allowed us to minimizeselection bias by including all patients infected with HIVresiding in Denmark at the time of diagnosis. Second, theDCRS with its complete follow-up allowed us to generatea matched general population comparison cohort and to collectaccurate information on time of death and emigration, whichfurther minimized selection bias. Third, the DNPR providedaccess to information on all diseases treated in a hospital goingback almost 20 years before the HIV diagnosis. Thus,information on morbidity before HIV diagnosis was pro-spectively collected and not influenced by recall bias. Finally,a unique personal identifier allowed us to link all registries.
Our study also had limitations. Persons may be infectedwith HIV for years before they are diagnosed; thus, a diseaseregistered before HIV diagnosis may actually have beenacquired after HIV infection and could be a consequence ofHIV rather than a risk factor acquired before HIV. However,we believe this was a minor source of bias. Only diagnosesobtained before the hospital visit at which HIV was diagnosedwere used in computing the CCI score, and no points werecounted for HIV and/or AIDS diagnosis. The only AIDS-defining illness that may have contributed to the CCI score waslymphoma, and a sensitivity analysis excluding CCI pointsfor lymphoma did not change any estimates or conclusions.
Underestimation of comorbidity might have happened becauseof lack of information on diagnoses made in the primary caresector or because of the presence of mild diseases that would goundiagnosed. Relative overestimation of comorbidity mighthave happened in some high-risk groups later diagnosed withHIV, for example, injecting drug users or men who have sex withmen. These groups might be in more frequent contact with thehealth care system, which would increase the chances of anydisease being diagnosed and lead to information bias. In bothcases, restricting diagnoses to those causing hospitalization havemost likely reduced bias and strengthened our findings ratherthan weakening them. Another concern is that dischargediagnoses from hospital visits outside Denmark were notcaptured, so CCI scores could be underestimated in immigrants.However, a sensitivity analysis excludingpatients of non-Danishorigin only slightly changed the risk estimates for CCI score.
Few studies have looked at deaths due to conditionspresent before HIV diagnosis.14,28 Delpierre et al14 founda 3.75 times higher risk for death in persons unemployed at thetime of HIV diagnosis. Assuming that comorbidities areassociated with unemployment, these results support ourfindings. HCV coinfection affects mortality both directly17 andindirectly28 through family-related risk factors. It is normallydiagnosed during the initial screening of patients newly
TABLE 3. Interaction Between HIV and Comorbidity Effects
CCI Score
MRs, Annual Risk of Death per 100 PYR (95% CI)
Proportion of ExcessMortality Due
to Interaction (%)Persons Without HIV(General Population) Persons With HIV
Excess Mortality in PersonsWith HIV (Compared With Persons
With HIV and CCI Score = 0) Interaction Risk*
0 0.27 (0.26 to 0.28) 1.70 (1.44 to 2.00)
1 1.36 (1.26 to 1.47) 4.37 (3.01 to 6.32) 2.67 (1.03 to 4.31) 1.57 (20.09 to 3.54) 58.8
2 2.44 (2.22 to 2.68) 8.06 (4.94 to 13.16) 6.37 (2.41 to 10.33) 4.20 (0.40 to 9.58) 66.0
$3 5.84 (5.19 to 6.58) 10.15 (5.08 to 20.30) 8.46 (1.42 to 15.50) 2.88 (23.48 to 15.66) 34.1
*Deviation of mortality rates from an additive model (additive excess risk due to the combined effect of HIV and comorbidity).PYR, person-years at risk.
FIGURE 2. Visual presentation of the total mortality in personswith HIV and the relative contribution of background mortality(0.28/2.09 = 13.6%), HCV coinfection and CCI (2.09 2 1.43/2.09 = 31.5%), and HIV (1.43 2 0.28/2.09 = 55%).
338 | www.jaids.com � 2011 by Lippincott Williams & Wilkins
Lohse et al J Acquir Immune Defic Syndr � Volume 57, Number 4, August 1, 2011
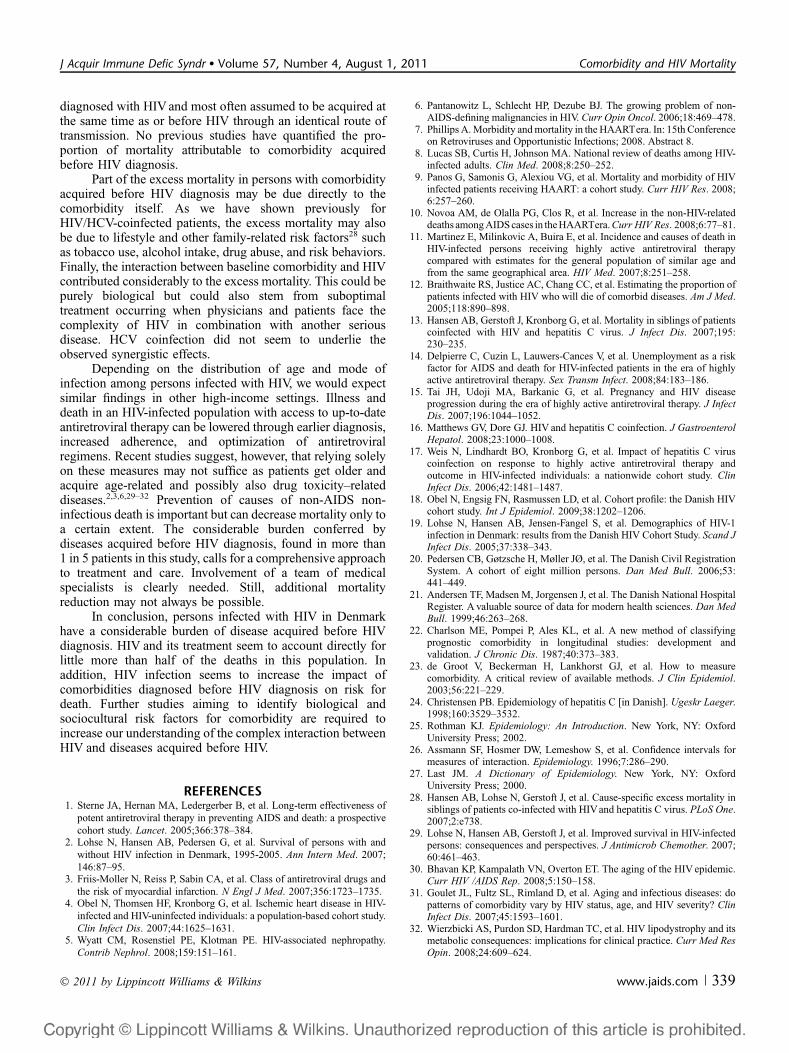
diagnosed with HIV and most often assumed to be acquired atthe same time as or before HIV through an identical route oftransmission. No previous studies have quantified the pro-portion of mortality attributable to comorbidity acquiredbefore HIV diagnosis.
Part of the excess mortality in persons with comorbidityacquired before HIV diagnosis may be due directly to thecomorbidity itself. As we have shown previously forHIV/HCV-coinfected patients, the excess mortality may alsobe due to lifestyle and other family-related risk factors28 suchas tobacco use, alcohol intake, drug abuse, and risk behaviors.Finally, the interaction between baseline comorbidity and HIVcontributed considerably to the excess mortality. This could bepurely biological but could also stem from suboptimaltreatment occurring when physicians and patients face thecomplexity of HIV in combination with another seriousdisease. HCV coinfection did not seem to underlie theobserved synergistic effects.
Depending on the distribution of age and mode ofinfection among persons infected with HIV, we would expectsimilar findings in other high-income settings. Illness anddeath in an HIV-infected population with access to up-to-dateantiretroviral therapy can be lowered through earlier diagnosis,increased adherence, and optimization of antiretroviralregimens. Recent studies suggest, however, that relying solelyon these measures may not suffice as patients get older andacquire age-related and possibly also drug toxicity–relateddiseases.2,3,6,29–32 Prevention of causes of non-AIDS non-infectious death is important but can decrease mortality only toa certain extent. The considerable burden conferred bydiseases acquired before HIV diagnosis, found in more than1 in 5 patients in this study, calls for a comprehensive approachto treatment and care. Involvement of a team of medicalspecialists is clearly needed. Still, additional mortalityreduction may not always be possible.
In conclusion, persons infected with HIV in Denmarkhave a considerable burden of disease acquired before HIVdiagnosis. HIV and its treatment seem to account directly forlittle more than half of the deaths in this population. Inaddition, HIV infection seems to increase the impact ofcomorbidities diagnosed before HIV diagnosis on risk fordeath. Further studies aiming to identify biological andsociocultural risk factors for comorbidity are required toincrease our understanding of the complex interaction betweenHIV and diseases acquired before HIV.
REFERENCES1. Sterne JA, Hernan MA, Ledergerber B, et al. Long-term effectiveness of
potent antiretroviral therapy in preventing AIDS and death: a prospective
cohort study. Lancet. 2005;366:378–384.2. Lohse N, Hansen AB, Pedersen G, et al. Survival of persons with and
without HIV infection in Denmark, 1995-2005. Ann Intern Med. 2007;
146:87–95.3. Friis-Moller N, Reiss P, Sabin CA, et al. Class of antiretroviral drugs and
the risk of myocardial infarction. N Engl J Med. 2007;356:1723–1735.4. Obel N, Thomsen HF, Kronborg G, et al. Ischemic heart disease in HIV-
infected and HIV-uninfected individuals: a population-based cohort study.
Clin Infect Dis. 2007;44:1625–1631.5. Wyatt CM, Rosenstiel PE, Klotman PE. HIV-associated nephropathy.
Contrib Nephrol. 2008;159:151–161.
6. Pantanowitz L, Schlecht HP, Dezube BJ. The growing problem of non-AIDS-defining malignancies in HIV. Curr Opin Oncol. 2006;18:469–478.
7. Phillips A. Morbidity and mortality in the HAARTera. In: 15th Conferenceon Retroviruses and Opportunistic Infections; 2008. Abstract 8.
8. Lucas SB, Curtis H, Johnson MA. National review of deaths among HIV-infected adults. Clin Med. 2008;8:250–252.
9. Panos G, Samonis G, Alexiou VG, et al. Mortality and morbidity of HIVinfected patients receiving HAART: a cohort study. Curr HIV Res. 2008;6:257–260.
10. Novoa AM, de Olalla PG, Clos R, et al. Increase in the non-HIV-relateddeaths among AIDS cases in the HAARTera. Curr HIV Res. 2008;6:77–81.
11. Martinez E, Milinkovic A, Buira E, et al. Incidence and causes of death inHIV-infected persons receiving highly active antiretroviral therapycompared with estimates for the general population of similar age andfrom the same geographical area. HIV Med. 2007;8:251–258.
12. Braithwaite RS, Justice AC, Chang CC, et al. Estimating the proportion ofpatients infected with HIV who will die of comorbid diseases. Am J Med.2005;118:890–898.
13. Hansen AB, Gerstoft J, Kronborg G, et al. Mortality in siblings of patientscoinfected with HIV and hepatitis C virus. J Infect Dis. 2007;195:230–235.
14. Delpierre C, Cuzin L, Lauwers-Cances V, et al. Unemployment as a riskfactor for AIDS and death for HIV-infected patients in the era of highlyactive antiretroviral therapy. Sex Transm Infect. 2008;84:183–186.
15. Tai JH, Udoji MA, Barkanic G, et al. Pregnancy and HIV diseaseprogression during the era of highly active antiretroviral therapy. J InfectDis. 2007;196:1044–1052.
16. Matthews GV, Dore GJ. HIV and hepatitis C coinfection. J GastroenterolHepatol. 2008;23:1000–1008.
17. Weis N, Lindhardt BO, Kronborg G, et al. Impact of hepatitis C viruscoinfection on response to highly active antiretroviral therapy andoutcome in HIV-infected individuals: a nationwide cohort study. ClinInfect Dis. 2006;42:1481–1487.
18. Obel N, Engsig FN, Rasmussen LD, et al. Cohort profile: the Danish HIVcohort study. Int J Epidemiol. 2009;38:1202–1206.
19. Lohse N, Hansen AB, Jensen-Fangel S, et al. Demographics of HIV-1infection in Denmark: results from the Danish HIV Cohort Study. Scand JInfect Dis. 2005;37:338–343.
20. Pedersen CB, Gøtzsche H, Møller JØ, et al. The Danish Civil RegistrationSystem. A cohort of eight million persons. Dan Med Bull. 2006;53:441–449.
21. Andersen TF, Madsen M, Jorgensen J, et al. The Danish National HospitalRegister. A valuable source of data for modern health sciences. Dan MedBull. 1999;46:263–268.
22. Charlson ME, Pompei P, Ales KL, et al. A new method of classifyingprognostic comorbidity in longitudinal studies: development andvalidation. J Chronic Dis. 1987;40:373–383.
23. de Groot V, Beckerman H, Lankhorst GJ, et al. How to measurecomorbidity. A critical review of available methods. J Clin Epidemiol.2003;56:221–229.
24. Christensen PB. Epidemiology of hepatitis C [in Danish]. Ugeskr Laeger.1998;160:3529–3532.
25. Rothman KJ. Epidemiology: An Introduction. New York, NY: OxfordUniversity Press; 2002.
26. Assmann SF, Hosmer DW, Lemeshow S, et al. Confidence intervals formeasures of interaction. Epidemiology. 1996;7:286–290.
27. Last JM. A Dictionary of Epidemiology. New York, NY: OxfordUniversity Press; 2000.
28. Hansen AB, Lohse N, Gerstoft J, et al. Cause-specific excess mortality insiblings of patients co-infected with HIV and hepatitis C virus. PLoS One.2007;2:e738.
29. Lohse N, Hansen AB, Gerstoft J, et al. Improved survival in HIV-infectedpersons: consequences and perspectives. J Antimicrob Chemother. 2007;60:461–463.
30. Bhavan KP, Kampalath VN, Overton ET. The aging of the HIV epidemic.Curr HIV /AIDS Rep. 2008;5:150–158.
31. Goulet JL, Fultz SL, Rimland D, et al. Aging and infectious diseases: dopatterns of comorbidity vary by HIV status, age, and HIV severity? ClinInfect Dis. 2007;45:1593–1601.
32. Wierzbicki AS, Purdon SD, Hardman TC, et al. HIV lipodystrophy and itsmetabolic consequences: implications for clinical practice. Curr Med ResOpin. 2008;24:609–624.
� 2011 by Lippincott Williams & Wilkins www.jaids.com | 339
J Acquir Immune Defic Syndr � Volume 57, Number 4, August 1, 2011 Comorbidity and HIV Mortality