The Road to a Digitalized Supply Chain Management - EconStor
340
Kersten, Wolfgang (Ed.); Blecker, Thorsten (Ed.); Ringle, Christian M. (Ed.) Proceedings The Road to a Digitalized Supply Chain Management: Smart and Digital Solutions for Supply Chain Management Proceedings of the Hamburg International Conference of Logistics (HICL), No. 25 Provided in Cooperation with: Hamburg University of Technology (TUHH), Institute of Business Logistics and General Management Suggested Citation: Kersten, Wolfgang (Ed.); Blecker, Thorsten (Ed.); Ringle, Christian M. (Ed.) (2018) : The Road to a Digitalized Supply Chain Management: Smart and Digital Solutions for Supply Chain Management, Proceedings of the Hamburg International Conference of Logistics (HICL), No. 25, ISBN 978-3-7467-6535-8, epubli GmbH, Berlin, https://doi.org/10.15480/882.1777 This Version is available at: http://hdl.handle.net/10419/209194 Standard-Nutzungsbedingungen: Die Dokumente auf EconStor dürfen zu eigenen wissenschaftlichen Zwecken und zum Privatgebrauch gespeichert und kopiert werden. Sie dürfen die Dokumente nicht für öffentliche oder kommerzielle Zwecke vervielfältigen, öffentlich ausstellen, öffentlich zugänglich machen, vertreiben oder anderweitig nutzen. Sofern die Verfasser die Dokumente unter Open-Content-Lizenzen (insbesondere CC-Lizenzen) zur Verfügung gestellt haben sollten, gelten abweichend von diesen Nutzungsbedingungen die in der dort genannten Lizenz gewährten Nutzungsrechte. Terms of use: Documents in EconStor may be saved and copied for your personal and scholarly purposes. You are not to copy documents for public or commercial purposes, to exhibit the documents publicly, to make them publicly available on the internet, or to distribute or otherwise use the documents in public. If the documents have been made available under an Open Content Licence (especially Creative Commons Licences), you may exercise further usage rights as specified in the indicated licence. https://creativecommons.org/licenses/by-sa/4.0/
-
Upload
khangminh22 -
Category
Documents
-
view
0 -
download
0
Transcript of The Road to a Digitalized Supply Chain Management - EconStor
Kersten, Wolfgang (Ed.); Blecker, Thorsten (Ed.); Ringle, Christian M. (Ed.)
Proceedings
The Road to a Digitalized Supply ChainManagement: Smart and Digital Solutions for SupplyChain Management
Proceedings of the Hamburg International Conference of Logistics (HICL), No. 25
Provided in Cooperation with:Hamburg University of Technology (TUHH), Institute of Business Logistics and GeneralManagement
Suggested Citation: Kersten, Wolfgang (Ed.); Blecker, Thorsten (Ed.); Ringle, Christian M. (Ed.)(2018) : The Road to a Digitalized Supply Chain Management: Smart and Digital Solutions forSupply Chain Management, Proceedings of the Hamburg International Conference of Logistics(HICL), No. 25, ISBN 978-3-7467-6535-8, epubli GmbH, Berlin,https://doi.org/10.15480/882.1777
This Version is available at:http://hdl.handle.net/10419/209194
Standard-Nutzungsbedingungen:
Die Dokumente auf EconStor dürfen zu eigenen wissenschaftlichenZwecken und zum Privatgebrauch gespeichert und kopiert werden.
Sie dürfen die Dokumente nicht für öffentliche oder kommerzielleZwecke vervielfältigen, öffentlich ausstellen, öffentlich zugänglichmachen, vertreiben oder anderweitig nutzen.
Sofern die Verfasser die Dokumente unter Open-Content-Lizenzen(insbesondere CC-Lizenzen) zur Verfügung gestellt haben sollten,gelten abweichend von diesen Nutzungsbedingungen die in der dortgenannten Lizenz gewährten Nutzungsrechte.
Terms of use:
Documents in EconStor may be saved and copied for yourpersonal and scholarly purposes.
You are not to copy documents for public or commercialpurposes, to exhibit the documents publicly, to make thempublicly available on the internet, or to distribute or otherwiseuse the documents in public.
If the documents have been made available under an OpenContent Licence (especially Creative Commons Licences), youmay exercise further usage rights as specified in the indicatedlicence.
https://creativecommons.org/licenses/by-sa/4.0/
Wolfgang Kersten, Thorsten Blecker and Christian M. Ringle (Eds.)
The Road to a Digitalized Supply Chain Management
Proceedings of the Hamburg International Conference of Logistics (HICL) – 25

HICL Proceedings
Editors: Kersten, W., Blecker, T., Ringle, C.M. and Jahn, C. 2018The Road to a Digitalized Supply Chain ManagementLogistics 4.0 and Sustainable Supply Chain Management
Editors: Kersten, W., Blecker, T., Ringle, C.M. and Jahn, C. 2017Digitalization in Supply Chain Management and Logistics ISBN 978-3-7450-4328-0 Digitalization in Maritime Logistics and Sustainable Supply Chain ManagementISBN 978-3-7450-4332-7
Editors: Kersten, W., Blecker, T. and Ringle, C.M. 2015Innovations and Strategies for Logistics and Supply Chains ISBN 978-3-7375-6206-5 Sustainability in Logistics and Supply Chain Management ISBN 978-3-7375-4057-5 Operational Excellence in Logistics and Supply Chains ISBN 978-3-7375-4056-8
Editors: Kersten, W., Blecker, T. and Ringle, C.M. 2014Innovative Methods in Logistics and Supply Chain Management ISBN 978-3-7375-0341-9 Next Generation Supply Chains ISBN 978-3-7375-0339-6
Editors: Kersten, W., Blecker, T. and Ringle, C.M. 2013Pioneering Solutions in Supply Chain Performance Management ISBN 978-3-8441-0267-3 Sustainability and Collaboration in Supply Chain Management ISBN 978-3-8441-0266-6
…findmore proceedings on https://hicl.org/publications
Proceedings of the Hamburg International Conference of Logistics (HICL)25
The Road to a Digitalized Supply ChainManagementSmart and Digital Solutions for Supply Chain Management
Prof. Dr. Dr. h. c. Wolfgang KerstenProf. Dr. Thorsten Blecker
Prof. Dr. Christian M. Ringle(Editors)

This work is licensed under the Creative Commons Attribution-ShareAlike 4.0 In-ternational License. To view a copy of this license, visit https://creativecommons.org/licenses/by-sa/4.0/ or send a letter to Creative Commons, PO Box 1866, Moun-tain View, CA 94042, USA.
Edition 1st edition, September 2018Publisher epubli GmbH, Berlin, www.epubli.deEditors Wolfgang Kersten, Thorsten Blecker, Christian M. Ringle
Cover (Photo) Christoph Mahlstedt – unsplash.com/@_senator_Layout Luis Brunswick Franco, Francisco Williams Riquer
ISBNISSN (print) 2635-4430ISSN (online) 2365-5070
978-3-746765-35-8
Contents
Preface . . . . . . . . . . . . . . . . . . . . . . . . . . . . . . . . . . . . vii
I Advanced Manufacturing and Industry 4.0 1
Running the Machine Faster: Acceleration, Humans and Warehousing . . . . 3Tony Cragg, Thierry Sauvage, Mohammed Haouari, Sarrah Chraibi, Oussama El Khalil Houssaini
Supplier Integration in Industry 4.0 – Requirements and Strategies . . . . . . 23Julian Marius Müller, Johannes W. Veile, Kai-Ingo Volgt
Scope for Industry 4.0 in Agri-food Supply Chains . . . . . . . . . . . . . . 37Claudine Soosay, Raja Kannusamy
Advanced Scientific Algorithms in Digital Factory Design Applications . . . . 57Jacob Lohmer, Armin Klausnitzer, Rainer Lasch
Additive Manufacturing in Supply Chains – The Future of Purchasing Processes 79Stephanie Niehues, Laura Berger, Michael Henke
II Innovation and Technology Management 97
Efficiency Analysis for Digitalised Working Systems of Truck Drivers . . . . . 99Dominic Loske, Matthias Klumpp
Alternative Development Paths for Supply Chains in 2030 . . . . . . . . . . 121Denis Daus, Ana Cristina Barros, Dimitra Kalaitzi, Victoria Muerza, Irene Marchiori
About the Future Role of Software in the Product . . . . . . . . . . . . . . . 143Henning Skirde, Robert Steinert
v
Contents
Environmental Innovation of Transportation Sector in OECD Countries . . . . 157Duygu Şahan, Okan Tuna
Design of an Added Plan with Social Responsibility . . . . . . . . . . . . . . 171Kathya Alexandra Suesca Rozo, Andrés Felipe Santos Hernández
III Supply Chain Analytics 195
Multi-Method Decision Support Framework for Supply Network Design . . . 197Giuseppe Timperio, Robert de Souza, Boy Panjaitan Bernado, Sumit Sakhuja, Yoseph Sunardhi
Business Model of Aircraft Fleet Planning using ANN . . . . . . . . . . . . . 221Partha Kumar Pandit, M. Ahsan Akhtar Hasin
IV Risk and Security Management 249
Adequate Flexibility Potential to handle Supply Chain Uncertainties . . . . . 251Immanuel Zitzmann, David Karl
Remote Sensing in Humanitarian Logistics: An Integrative Approach . . . . . 271Christian Hein, Henning Hünemohr, Rainer Lasch
Impact of Managerial Risk-taking and IRM on Innovation . . . . . . . . . . . 291Fatemeh Seidiaghilabadi, Ebrahim Abbassi , Zahra Seidiaghilabadi
Enhanced FMEA for Supply Chain Risk Identification . . . . . . . . . . . . . 311Lu Lu, Zhou Rong, Robert de Souza
vi
Preface
Digitalization is changing the way organizations manage their supply chain andtheir daily logistical processes. The development of digitalized solutions andindustry 4.0 have created a completely new business ecosystem. Additionally,customers are demanding more innovative, more diverse and greener products.This creates numerous challenges for all actors in the supply chain; yet, they alsopresent an opportunity to create solutions and practices that improve perfor-mance and productivity.
This year’s edition of the HICL proceedings complements the last years’ volume:Digitalization in Supply Chain Management and Logistics. All entities along thesupply chain are challenged to adapt new business models, techniques and pro-cesses to enable a smooth transition into a digitalized supply chain manage-ment.
This book focuses on core topics of digitalization in the supply chain. It containsmanuscripts by international authors providing comprehensive insights into top-ics such as industrial internet of things, digital factory design, risk managementor aircraft fleet planning and provide future research opportunities in the field ofsupply chain management. All manuscripts contribute to theory developmentand verification in their respective research area.
We would like to thank the authors for their excellent contributions, which ad-vance the logistics research process. Without their support and hard work, thecreation of this volume would not have been possible.
Hamburg, September 2018Prof. Dr. Dr. h. c. Wolfgang KerstenProf. Dr. Thorsten BleckerProf. Dr. Christian M. Ringle
vii


Part I
Advanced Manufacturing andIndustry 4.0

Running the Machine Faster:Acceleration, Humans andWarehousing
Tony Cragg1, Thierry Sauvage1, Mohammed Haouari1, Sarrah Chraibi1, OussamaEl Khalil Houssaini1
1 – Ecole Supérieure de Logistique Industrielle
To reduce the lead-time, modern logistics seeks to respond faster by acceleratingphysical and information flows. However, what are the impacts on logistics work-ers of an ever-faster logic? The purpose of this paper is to examine the relationshipbetween process acceleration and the autonomy of order pickers. The method isto use exploratory qualitative research, based on fifteen visits to different regionaldistribution centers (RDCs) in the retail supermarket sector. The contribution ofthis paper is to apply Rosa’s (2013) social acceleration theory to the specific con-text of logistics warehousing and to demonstrate how speeding up order pickingsystems is a key driver of change that has an impact on worker autonomy.
Keywords: Acceleration; autonomy; warehousing; order pickingFirst recieved: 28.May.2018 Revised: 19.Jun.2018 Accepted: 03.Jul.2018
3
Running the Machine Faster: Acceleration, Humans andWarehousing
1 Introduction
In France, the warehousing and transport sector employs 1.37 million people(Stratégies Logistique 2017) and the surface of the regional distribution centers(RDCs) of supermarkets now doubles in size every two years. Three reasons canexplain this rapid growth in the sector: supply, internal capacity and demand.Firstly, on the supply side, the growth in world trade, maritime shipping and thetrend towards global sourcing in the last forty years has resulted in more andmore goods circulating that require an effective logistic industry to make themavailable to the final customer.
Secondly, technological advances enable the automation of processes and mech-anization in RDCs. The demand for automated warehouse systems is worldwide.In the USA, forecasters expect the robotics market in warehousing and logisticsto have increasedmore than tenfold to $22.4 billion by 2021, up from $1.9 billionin 2016 (Yale Materials Handling 2017).
Thirdly, on the demand side, the advent of e-commerce and omni-channel distri-bution has led to the further expansion of the sector, making the modern ware-house the place “where the virtual becomes physical” (Moore, 2018). Informationtechnology now instantaneously relays point of sales information to the distri-bution center, requiring demand-pull systems to bemore andmore responsive.Indeed, following the acceleration of information flows, the acceleration of physi-cal flows becomes essential in order to fulfil the demand promise.
Owing to earlier advances in communications technology anddigitalization, accel-erated information flowspredate acceleratedphysical flowsand this has impactedthe order picking process in the intervening period. Pick-by-voice systems, in-troduced in the late 2000’s, were symptomatic of speeding up information flowtechnology, while we are only now seeing the installation of fully automated andmechanized warehousing systemsmore widely in the sector. The consequenceof this desynchronization of the two flows has been borne by warehouse orderpickers. Before the introduction of pick-by-voice systems, order pickers used theirknowledge and skills to plan a route around the warehouse and stack their palletin an efficient manner. With its introduction, algorithm–based software instructworkers via headsets which product to pick next: ”the savoir-faire of order pickershas been reduced to a physical engagement” (Gaborieau 2012, p.1). While processacceleration increases productivity, it can also have consequences for humanoperators.
4
1 Introduction
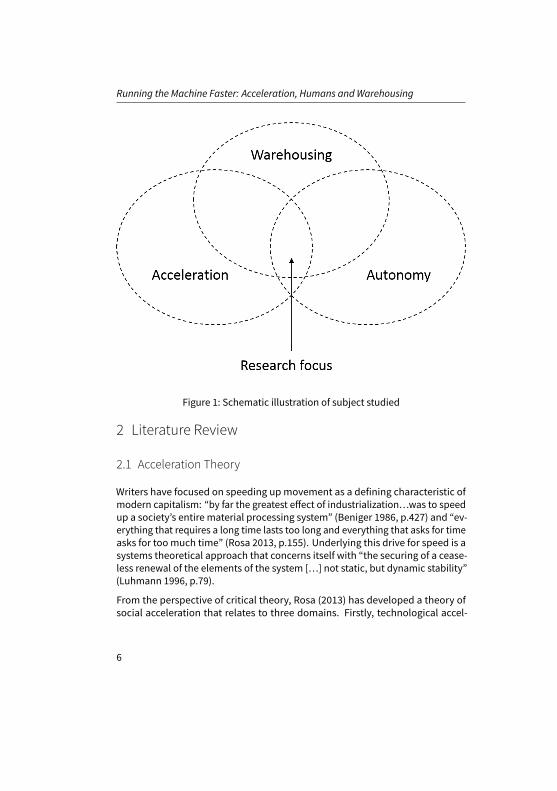
Therefore, the research question is as follows: what is the relationship betweenthe acceleration of warehouse processes in RDCs and the autonomy of orderpickers? Fig.1 presents the research focus. We choose to focus on order picking,because it is an important and expensive warehouse operation that is either laboror capital intensive (Gu et al. 2007). As such, from a technical perspective it hasbeen the subject of performance evaluation studies with a view to optimization(Gu et al. 2010). A research gap exists because, although studies into the role ofhumans in warehouses can be found from a sociological perspective (Gaborieau,2012; 2016), logistics research into this subject is rare. One exception is a literaturereviewbyGrosseet al. (2015)which found that researchers’ orderpickingplanningmodels have focused on cost efficiency rather than on human operators. Theydescribe the human factor as the “missing link” in order picking system design.
To explore this missing link and its relationship with process acceleration, we useexploratory qualitative research methods, involving 15 visits to warehouse sitesmanaged by four brand nameRDCs and two leading third party logistics providers.A questionnaire about order picking was administered at one of the sites anddiscussions were held with managers. We structure this paper as follows. Firstlywe examine the literature related to acceleration theory, warehousing, desyn-chronization, dynamic capabilities and the notion of worker autonomy withinthe context of social sustainability. Then we explain the researchmethodologyand present the findings and propositions. This leads to a discussion and conclu-sion.
5
Running the Machine Faster: Acceleration, Humans andWarehousing
Figure 1: Schematic illustration of subject studied
2 Literature Review
2.1 Acceleration Theory
Writers have focused on speeding upmovement as a defining characteristic ofmodern capitalism: “by far the greatest effect of industrialization…was to speedup a society’s entire material processing system” (Beniger 1986, p.427) and “ev-erything that requires a long time lasts too long and everything that asks for timeasks for toomuch time” (Rosa 2013, p.155). Underlying this drive for speed is asystems theoretical approach that concerns itself with “the securing of a cease-less renewal of the elements of the system […] not static, but dynamic stability”(Luhmann 1996, p.79).
From the perspective of critical theory, Rosa (2013) has developed a theory ofsocial acceleration that relates to three domains. Firstly, technological accel-
6
2 Literature Review
eration is found in production and transport and is defined as “the intentionalacceleration of goal-directed processes” (2013, p.74). Secondly, the accelerationof social change is defined as a contraction of the present in all areas of life anda growing instability of our time horizons and expectations. Finally, the pace oflife speeds up despite the increased free time that technological accelerationshould enable, as a result of a scarcity of time resources. Importantly, he assertsthat technological acceleration not only alters our experience of space and time(put simply, things seem to be happening more quickly), it also changes the qual-ity and quantity of our social relationships. Acceleration can be viewed as theantonym of ‘depth’ in relationships. For our purposes, this analysis is interestingbecause it relates technological acceleration, on the one hand, to its possibleimpacts on humans, on the other. Before we explore this connection in moredetail, it is necessary to consider acceleration in the context of warehousing.
2.2 Acceleration and Warehousing
Acceleration is an imperative of the modern RDC for three main reasons. Firstly,because the quantity of goods moving through a given site is steadily increasing,due to rising demand and the advent of multiple distribution channels. In orderto maintain performance levels, there is no choice other than to speed up theorder fulfillment process. Secondly, commodities (and above all perishable com-modities) progressively lose economic value for the producer the longer they arein storage. The role of the logistic warehouse is therefore to minimize the timegoods spend immobile and to speed up processing time, thereby reducing inven-tory costs through faster rotation. Finally, margins are tight and competition isintense in the supermarket sector, so advantage can be gained through investingin speeding up processes and replenishing supermarket shelves with the rightproducts rapidly.
For these three reasons of growth, value and competition, the notion of stocks/s-tores/storage as something stable or fixed, or as provisions set aside until needarises, is now outmoded. Gu et al. (2006) define the major roles of warehousingas buffering and consolidation. We can add that the underlying logic of RDCs ismovement, not immobility. In a picker-to-parts order picking systemminimizingthe order retrieval time is themain priority, since it has been estimated that orderpicking comprises as much as 55% of warehouse operating costs (de Koster etal. 2007). The sooner an order is ready for shipping the better. In order to speedup manual order picking, travel time and therefore travel distance around the
7
Running the Machine Faster: Acceleration, Humans andWarehousing
warehouse has to be reduced to a minimum. This can be achieved by layout,grouping and storage assignment practices and by augmenting the work of theorder picker by linking him/her to IT systems via headsets andmicrophones.
2.3 Desynchronization
However, warehouse acceleration risks the desynchronization of processes andfunctions (Rosa 2013) – a serious risk, given the importance of synchronizingflows for coordination, as advocated in the logistics literature (Simatupang etal. 2002). For example, speeding up warehouse materials handling will have animpact on inbound and outbound transport flows. Queuing and bottlenecks canoccur because of improvements to one flow. Desynchronization, not only appliesto material and data flows, but also to organizational functions: introducing anEnterprise Resource Planning (ERP) system, for example, will not produce therequired results if the warehouse operations department is not appropriatelytrained in the new software. A reconfigured supply chain only operates at thespeed of its slowest sub systemwith potentially dysfunctional consequences forthe system as a whole (Rosa 2013).
Attempts to accelerate through automation and improved labor productivity al-ways face risks, which are both technical and human. Because data processingand transmission now outpace material handling systems, the relative slownessof the latter becomes theweak link in the chain, demanding attention. Desynchro-nization and non-compatibility are an inevitable consequence of an accelerationof one part of the system, necessitating a holistic upstream and downstream vi-sion of the whole system. For warehouse management, piloting parallel mergingflows that function at different speeds becomes essential to avoid zero benefitfrom accelerating one of the flows.
2.4 Dynamic Capabilities
Efficient logistics increases the volumeof transactions and availability of goods bymanaging time and eliminating barriers to circulation. The objective of a logisticswarehouse is to minimize the lead time (the time taken from order reception toproduct delivery) by accelerating processing time. In the academic literature,a company’s capacity to accelerate its supply chain is presented as “dynamiccapabilities” (Teece et al. 1997; Beske et al. 2014). Specifically, Eisenhardt and
8
2 Literature Review
Martin (2000) definedynamic capabilities as “organizational and strategic routinesby which firms achieve new resource configurations”. Logistics capabilities helpto build competitiveness for organizations. Therefore, in the highly competitiveretail sector, where margins are tight, the capability to accelerate processing timeenables a firm to gain a competitive advantage over another.
Helfat and Peteraf (2003) introduced the concept of the capability lifecycle todevelop further this notion of dynamic capabilities. In the sameway that productshave a lifecycle of growth, maturity and decline, so too do capabilities. Therefore,logistics processes are capabilities that develop and eventually lose their ability toprovide a competitive supply chain advantage. Acceleration theory, postulatingthat society is in an incessant cycle of speeding up processes, suggests that thelifecycle of logistic capabilities in themodernRDC is becoming shorter and shorter,as the organizational environment becomes increasingly turbulent and complex,requiring adaptability and regular reconfiguration.
Reconfiguring resources in the food industry is seen as essential, given the con-stant changes in consumer demands (Wiengarten et al. 2011; Trienekens et al.2012) and the need to respond to them. Faster communications technology cyclesand big data (Waller and Fawcett 2013) mean that firms seeking to maintain orgain market share, have to constantly monitor, evaluate and reconfigure theirresources. The pull flow logic of demand chain management places the finalcustomer as the driving force that the modern logistics warehouse aims to satisfythrough product availability via multiple delivery channels:
“The implication of today’s turbulent and unpredictable business environmentis that demand chain solutions are required. That is, we need solutions that areflexible and capable of responding rapidly to structural change on both the supplyside and the demand side of the business” (Christopher and Ryals 2014, p.29).
‘Responding rapidly to structural change’ involves accelerating warehouse pro-cesses. Yet the ‘ever-faster’ logic raises important questions about the socialsustainability of the modern warehousing sector and the impact on the peoplewho work in it.
2.5 Social sustainability and autonomy
This article considers the relationship between the acceleration of warehouseprocesses and the autonomy of workers. Of the three sustainability dimensions
9
Running the Machine Faster: Acceleration, Humans andWarehousing
(social, environmental and economic), Ahmadi et al. (2017) show that socialsustainability in supply chains has been under-researched, compared with envi-ronmental and economic sustainability. They conclude that this is “a researchtopic that will only gain in importance in years to come” (p.105). The importanceof the human dimension as a research agenda is confirmed by Wieland et al.(2016) in data collected from 141 SCM researchers. After analyzing the differencebetween what should and what will become important, the people dimension ofSCM was ranked the most underestimated research theme out of 35 subjects, fol-lowed in second place by ethical issues. They write: “Feedback from participantsnotes that supply chains are not “soullessmachines,” but complex socio-technicalsystems involving cognitive elements and impacted by face-to-face negotiationsand conversations” (Wieland et al. 2016, p.207).
In a study of ten cases of sustainable supply chain management exemplars Pagelland Wu (2009) found that sustainable firms invest in human capital, aim to in-crease employee wellbeing, enhance organizational commitment andmaintain aculture that values people and the environment. Workers in these organizationsdescribed their employers as thoughtful, caring, and committed. Varsei et al.(2014) evaluated the social performance of partners in a global supply chain. Theyfocused on the four primary social dimensions specified in the Global ReportingInitiative (GRI 2012), namely, labor practices and decent work conditions, humanrights, society and product responsibility.
2.6 Defining autonomy
In the warehousing context in France, where arguably, labor rights and systemsof social protection exist, the focus for researchers into social sustainability isprimarily on the experience of working conditions (Gaborieau 2012; 2016) and inthe case of this research, on job autonomy. This has been defined as the degree ofcontrol thatworkershaveover their ownwork situation (Brey 1999) andas spheresof independence that are directly or indirectly delegated by the organization toemployees (Katz 1966).
In seeking to explain the paradox of disempowered industrial employees col-laborating and engaging in a firm’s activities, Katz (1966) argued that it was theundefined time left to workers within work time, to bring their culture into the bu-reaucratic workplace, which rendered the work tolerable for employees. In otherwords, worker autonomy engenders integration into an organization, through
10
2 Literature Review
allowing a continuity between non-work life and the working life. Therefore, re-ducingworker autonomy in a tightly controlledwork environment, with little timefor association, could negatively affect worker commitment to the organization.
Importantly, Brey (1999) noted that even if organizations limit goal setting bywork-ers, deciding on the means to achieve those goals can still provide autonomousspaces for meaningful and rewarding work. However, Brey describes three waysinwhich autonomy can be compromised. Firstly, monitoring and constant surveil-lance, enhanced by digitalization, removemoral autonomy and cause a loss ofa sense of dignity and a perception of outside judgement. Similarly, task pre-structuring by computer-defined systems imposes conformity on the employeeand reduces his/her scope for freedom of action and decision-making. Finally,new computer systems create dependency on third parties, such as managers orsystem operators, who possess the necessary skills to install and maintain thetechnology, whereas the worker does not.
Vidal (2013) argues that there is a connection between an acceleration in the paceof work and low-autonomy work particularly in highly competitive sectors: thefaster the process, the less time the worker has to decide what action to take orto communicate with colleagues. Where, as in the case of order pickers, a firmemphasizes and rewards the speed of a worker to complete a task accurately,little value is seen in allowing autonomous worker input.
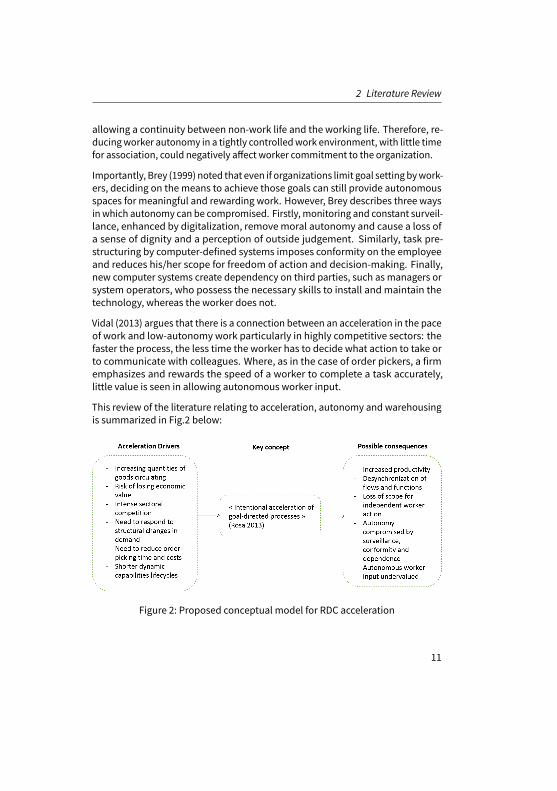
This review of the literature relating to acceleration, autonomy and warehousingis summarized in Fig.2 below:
Figure 2: Proposed conceptual model for RDC acceleration
11
Running the Machine Faster: Acceleration, Humans andWarehousing
3 Methodology
Warehousing academic literature considers design, operation and performanceevaluation, rather than understanding and contextualizing working conditionsor the transformation of the modern warehouse. In a literature review of ware-housing research, Davarzani and Norrman (2015, p.15) find that the “results ofthis study reveal a lack of reality-based investigations. Most of the scholars fo-cus on quantitative research methods andmathematical modeling without anyexamples from real cases”. They conclude: “that more empirical investigationsshould be conducted to understand and capture complexities of the real environ-ment”. Warehousing literature review articles (Gu et al. 2007; 2010; Davarzani andNorrman 2015) reveal an absence of theoretical frameworks and an emphasis onoperational and technical solutions without reference to sustainability issues.
A systems approach rests on positivist assumptions of objective reality and inde-pendence from context. Such an approach, aimed at process optimization andimproving productivity, encourages the progressive introduction of technologicalsolutions, seen as neutral. Alternatively, complexity theory (Nilsson and Gamel-gaard 2012) aims to take into account the diversity of human involvement in theorganization of logistic processes.
The difference between the two approaches is made clear if we consider thequestion of self-organization or autonomy – to what extent is a worker able toplan his/her workload his/herself. For a systems approach, self-organizationbrings uncertainty and needs to be minimized. On the other hand, complexitytheory recognizes that human intervention is an integral and inevitable part ofthe logistics process.
12
3 Methodology
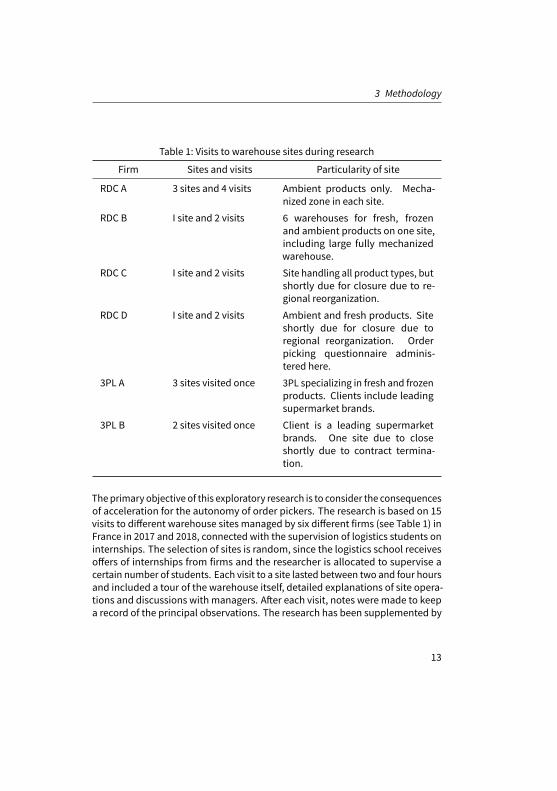
Table 1: Visits to warehouse sites during research
Firm Sites and visits Particularity of site
RDC A 3 sites and 4 visits Ambient products only. Mecha-nized zone in each site.
RDC B I site and 2 visits 6 warehouses for fresh, frozenand ambient products on one site,including large fully mechanizedwarehouse.
RDC C I site and 2 visits Site handling all product types, butshortly due for closure due to re-gional reorganization.
RDC D I site and 2 visits Ambient and fresh products. Siteshortly due for closure due toregional reorganization. Orderpicking questionnaire adminis-tered here.
3PL A 3 sites visited once 3PL specializing in fresh and frozenproducts. Clients include leadingsupermarket brands.
3PL B 2 sites visited once Client is a leading supermarketbrands. One site due to closeshortly due to contract termina-tion.
The primary objective of this exploratory research is to consider the consequencesof acceleration for the autonomy of order pickers. The research is based on 15visits to different warehouse sites managed by six different firms (see Table 1) inFrance in 2017 and 2018, connected with the supervision of logistics students oninternships. The selection of sites is random, since the logistics school receivesoffers of internships from firms and the researcher is allocated to supervise acertain number of students. Each visit to a site lasted between two and four hoursand included a tour of the warehouse itself, detailed explanations of site opera-tions and discussions with managers. After each visit, notes were made to keepa record of the principal observations. The research has been supplemented by
13
Running the Machine Faster: Acceleration, Humans andWarehousing
discussions with and reports from logistics students on internships. Additionallya questionnaire was administered at RDC D that focused on managers’ and or-der pickers’ evaluations of pick-by-voice. The warehouses visited either handledfrozen, fresh or ambient goods or in some cases all three types. The siteswere alsoat different stages of automation andmechanization and had different strategiesfor their implementation. Supermarkets ran themajority of the sites visited, whilespecialist third party logistics service providers (3PLs) ran the minority.
4 Research findings
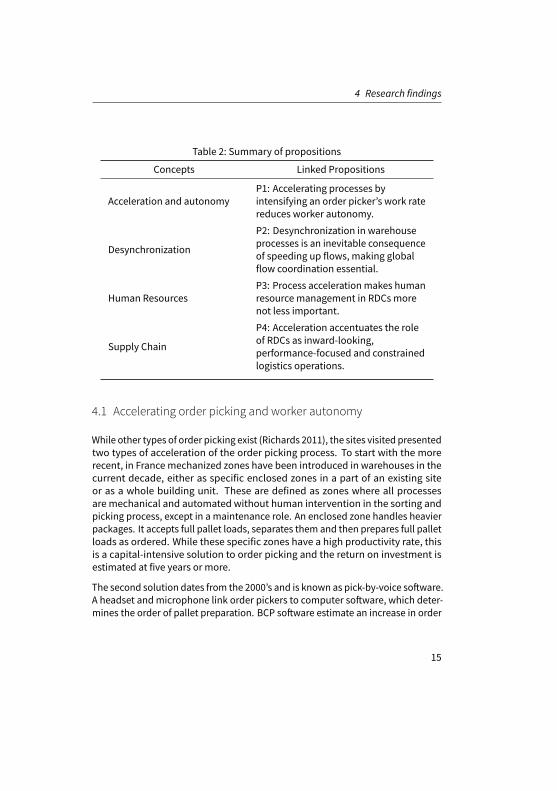
This chapter sets out four findings from this initial exploratory research, whichare pertinent to the question of RDCs and acceleration and lead onto proposi-tions, intended as possible future research directions. Table 2 sets out thesepropositions. The research initially focused on the impact of flow acceleration onworker autonomy. It has led to extra findings illustrating further consequences ofacceleration on warehouse processes and organization.
14
4 Research findings
Table 2: Summary of propositions
Concepts Linked Propositions
Acceleration and autonomyP1: Accelerating processes byintensifying an order picker’s work ratereduces worker autonomy.
Desynchronization
P2: Desynchronization in warehouseprocesses is an inevitable consequenceof speeding up flows, making globalflow coordination essential.
Human ResourcesP3: Process acceleration makes humanresource management in RDCs morenot less important.
Supply Chain
P4: Acceleration accentuates the roleof RDCs as inward-looking,performance-focused and constrainedlogistics operations.
4.1 Accelerating order picking and worker autonomy
While other types of order picking exist (Richards 2011), the sites visited presentedtwo types of acceleration of the order picking process. To start with the morerecent, in France mechanized zones have been introduced in warehouses in thecurrent decade, either as specific enclosed zones in a part of an existing siteor as a whole building unit. These are defined as zones where all processesare mechanical and automated without human intervention in the sorting andpicking process, except in a maintenance role. An enclosed zone handles heavierpackages. It accepts full pallet loads, separates them and then prepares full palletloads as ordered. While these specific zones have a high productivity rate, thisis a capital-intensive solution to order picking and the return on investment isestimated at five years or more.
The second solution dates from the 2000’s and is known as pick-by-voice software.A headset andmicrophone link order pickers to computer software, which deter-mines the order of pallet preparation. BCP software estimate an increase in order
15
Running the Machine Faster: Acceleration, Humans andWarehousing
picker productivity of 15%with pick-by-voice technology. However, it increasesthe workload, leading to concerns about risks to health (Anact 2010).
To ascertain the appreciation of pick-by-voice technology, a questionnaire wasadministered to 8managers and 24 order pickers at RDC D. This revealed differentevaluations of the pick-by-voice technology by the two groups. Managers’ averagescore out of ten was 7.4, while workers gave a score of 5.1. Managers appreciatethe technology because it enables tracking of activity, optimizes picking routes,reduces picking errors and improves productivity. From a human resource man-agement perspective, it enables an accurate planning of the number of pickersneeded each day. It also leads to better ergonomics for the worker, who now hashis/her hands and eyes free.
The order pickers, on the other hand, found that the computer voice leads toa sentiment of dehumanization. During a visit to this site by the author, themanager asked a worker to explain how the headset and picking process works.He replied: “I just follow orders like an idiot”. Order pickers using pick-by-voicealso reported a feeling of beingmonitored and controlled; an increased workloadleading to tiredness; limited possibility of communication between colleagues; adiminution of collective working; no global visibility of an order, making the jobless interesting. The technology itself was criticized for frequent malfunctions,failures of the network, headaches and lack of comfort caused by wearing theheadset all day and the regular repetitions needed to communicate with thesoftware.
These findings confirm those of Gaborieau (2012; 2016) that pick-by-voice accel-erates the pace of work, renders the work repetitive, reduces the opportunity forsocializing and increases the weight carried per day. The first proposition relatesto the human consequences of acceleration.
P1: : Accelerating processes by intensifying an order picker’s work rate re-duces worker autonomy.
4.2 Merging flows and desynchronization
At a site managed by RDC A, a manager presented the following problem of fourdifferent types of flow, operating at different speeds, both push and pull, somepredictable and others not. These flows have to merge to be loaded onto thesame truck, requiring piloting to minimize delays. The first flow is that of order
16
4 Research findings
pickers in pull flow using the pick-by-voice technology to stack pallets and deliverto the loading bays. The second flow is cross docking, where goods arrive fromother RDCs of the same retailer for immediate dispatch to stores in the region.The third flow concerns special offers, launched by the centralized marketingdepartment and operating in push flow.
Finally, the newly constructed mechanized zone, operating in pull flow, addscomplexity to the site, for threemain reasons. Firstly because there has to be avery careful selection of references that are suitable for this zone, which mustrespect both the specificmaterials handling criteria and the required pace of entryof goods into the zone. Secondly, because the zone handles 30% of referencesand the number of full pallet loads entering and exiting the zone is high, extraflows circulate within the same warehouse space. Finally, because the transferof completed pallets from the mechanized zone to the loading bays is carriedout by automatic guided vehicles (AGVs or robots). However, the route of AGVsfrom the mechanized zone to the loading bays crosses the “main highway” at thesite and impedes the progress of order pickers and forklift drivers, whose pay isperformance linked. (At another site of this group with the same configuration,this had led to incidences of sabotage of the AGVs by workers.)
Speeding up one flow or creating a newone and finding a solution to one problem- in this case that of heavy loads of 10 to 15 kilos, which can now be handled bythe mechanized zone and not order pickers manually – has a knock on effect andsets up new challenges to be resolved. The shortening of dynamic capabilitieslifecycles (Helfat and Peteraf 2003) suggests that the desynchronization of flowsand the need to audit and pilot flows effectively are set to recur more frequently.The second proposition is about desynchronization. P2: Desynchronization inwarehouse processes is an inevitable consequence of speeding up flows, makingglobal flow coordination essential.
4.3 The roles of humans in warehousing
Changing flows in RDCs has an impact on the organization of work tasks. Becausemanagement realizes that order picking is an unattractive task, many of the sitesvisited had moved towards greater flexibility or polyvalence. In general, whileorder pickers were content to be trained to take on the role of forklift drivers, theinverse was not the case. One manager at RDC site D acknowledged this problemand refused to accept that staff could choose not to do order picking. It was clear
17
Running the Machine Faster: Acceleration, Humans andWarehousing
that within the site requiring staff to do order picking as part of their differenttasks had become a delicate issue.
Sites visited had different levels of temporary staff, reflecting the recruitment dif-ficulties that affect the sector. At RDC site C, due to close in 2018 and be relocated,the percentage of temporary staff had reached 50% and wasmaking the task ofmanagement in planning and organizing a workforce difficult. The best run sitesalso had the lowest levels of temporary staff. The overall impression from thevisits to the 15 different sites was one of a sector undergoing rapid change. Somesites were due to close as part of a national restructuring programme. Other siteswere in the process of introducing mechanized zones and robotic systems. RDCsite B had recently completed a fully mechanized warehouse for full pallet loads,where the only humans are those in the truck loading and unloading areas andmaintenanceworkers. Somemanagerswere awareof the impact of these changeson workers and stressed the need for retraining, upskilling and recruiting morehighly qualified staff. This leads to the third proposition that concerns humanresources. P3: Process accelerationmakes human resourcemanagement in RDCsmore not less important.
4.4 The bow tie metaphor
The structure of a supply chain, in which RDCs operate, can be likened to a bowtie, as they are at the center of high volume inbound and outbound flows. (MostRDCs stock around 10,000 different product references.) Here, the main featureof the bow-tie metaphor is that there are complex and variable inputs or inboundflows, that a compact core accepts, then recomposes and distributes what hasbeen stored to a wide variety of destinations. Two observations can be madeabout the impact of acceleration on the organization of the supply chain. Firstly,due to the need to accelerate and reconfigure processes, the pressure to reachperformance targets, the difficulty in recruiting and retaining qualified staff andtheir position at the center of massive inbound and outbound flows, RDCs focuspurely on themanagement of internal flows and arriving and departing transport.A 50,000m2warehouse that serves as a conduit formany suppliers and customersonly has contact with them in matters directly related to flowmanagement, suchas packaging problems. In concerning themselves primarily with their own logis-tics, RDCs exemplify the strict division of labor and functions along the supplychain and the rigid boundaries that characterize this sector of activity.
18

5 Discussion and Conclusion
The second observation relates to what Carter et al. (2015), in their developmentof a theory of the supply chain, refer to as the “horizon or visibility boundary”.These authors suggest as a formal premise that: “the supply chain is boundedby the visible horizon of the focal agent”. Although RDCs are central nodes inthe supply chain, they are more hidden from view than visible, bounded moreby confidentiality and security than openness. Moore (2018) comments: “It istempting to say that these buildings make the internet visible, except that theirvisibility is strictly limited”. It would be interesting to ascertain suppliers’ andcustomers’ level of knowledge of RDC operations, since they represent the nextnode in the supply chain. Furthermore, has the acceleration of processes in RDCsled to greater or lesser visibility of them by suppliers and customers? If the latteris the case and there is less visibility, following Carter et al.’s premise, can RDCs beviewed as part of supply chains or are they more accurately described as special-ized constrained logistics operations. This leads us to the fourth proposition thatrelates to supply chain structure. P4: Acceleration accentuates the role of RDCsas inward-looking, performance-focused and constrained logistics operations.
5 Discussion and Conclusion
This exploratory research has shown that speeding up information flows throughtechnology in labor-intensive order picking processes reduces worker autonomyand that process acceleration is an underlying logic of the modern RDC. In thisfinal chapter, we discuss further the propositions made and consider where thismight lead a warehousing research agenda.
To optimize information and physical flows the boundaries or borders, in thewidest meaning of the terms, between and within firms have to be managed– boundaries between buyers and suppliers or between different departmentswithin the same firm or between different zones in the samewarehouse. For flowsof goods and information to operate efficiently, boundaries have to be almostinvisible or frictionless, soft rather than hard. The management of logistic pro-cesses across and within organizations aims to be seamless and the boundariesblurred.
Boundaries reflect the constraints imposed in the functioning of organizationsand exist for purposes of control, channeling or connecting (Mezzadra andNielsen2012). However, process acceleration puts these boundaries under stress, dis-turbs established configurations, provokes desynchronization (P2) and requires
19
Running the Machine Faster: Acceleration, Humans andWarehousing
the reorganization of different flows. The disruptive power of acceleration sets inmotion a series of impacts, both positive and negative, anticipated and unfore-seen, that bring into question the stability of existing boundaries (Hernes andPaulsen 2003). As Vakkayil (2012, p.206) has observed: “In constantly changingenvironments it is impossible to draw permanent lines of demarcation”.
We have noted that one of the imperatives driving acceleration in warehousingis economic value loss. Rosa (2013, p.163) describes the time goods spend instorage and distribution as time when “the realization of created surplus value isdelayed”. He sees one of the basic systemic problems of capitalist economies asthe need to maintain accelerated circulation to avoid such value loss. He arguesthat it is for this reason that logistics has to bemore technically advanced thanproduction – to ensure that the sphere of potential value loss does not negativelyaffect the whole value creation process and eventually, value capture.
Through applying Rosa’s theory of social acceleration to RDCs, the contributionof this exploratory research is to demonstrate that there is an ongoing tensionbetween the systemic need for acceleration in logistics warehousing and theexisting boundaries or constraints that have been negotiated and established inthe supply chain and in the workplace. An example of these tensions, presentedin this paper, is the autonomy of order pickers (P1), defined either as controlover the work situation (Brey 1999) or as spheres of independence (Katz 1966). Afuture case study research agenda could examine in more detail how this tensionbetween the established boundaries, which allow a degree ofworker autonomy inwarehousing and the imperative to accelerate is evolving. Additionally the natureof relationships betweenRDCs and suppliers/customers, and the changes to theserelationships and supply chain structure associatedwithRDCprocess acceleration(P4) could be studied. Finally, by moving away from technical performance-based optimization of order picking systems, as suggested by Grosse et al. (2015),research could consider the future role of human resources in warehouses (P3)and provide exemplars of valuing human input.
References
(Anact), A. nationale pour l amelioration des conditions de travail (2010). “Preparateurs de com-mandes quelles pistes de prevention”.
(gri), G. R. I. (2012). The GRI Annual Report 2011/2012. Available at.Ahmadi, H. B., S. Kusi-Sarpong, and J. Rezaei (2017). “Assessing the social sustainability of supply
chains using Best Worst Method”. In: Resources, Conservation & Recycling 126, pp. 99–106.
20
REFERENCES
Beniger, J. (2007). “The control revolution”. In: Communication in history: Technology, culture,society, pp. 301–311.
Beske, P., A. Land, and S. Seuring (2014). “Sustainable supply chain management practices anddynamic capabilities in the food industry: A critical analysis of the literature”. In: InternationalJournal of Production Economics 152, pp. 131–143.
Brey, P. (1999). “Worker Autonomy and the Drama of Digital Networks in Organizations”. In: Journalof Business Ethics 22, pp. 15–25.
Carter, C. R., D. S. Rogers, and T. Y. Choi (2015). “Toward the Theory of the Supply Chain”. In: Journalof Supply Chain Management 51.2, pp. 89–97.
Christopher, M. and L. J. Ryals (2014). “The Supply Chain Becomes the Demand Chain”. In: Journalof Business Logistics 35.1, pp. 29–35.
Davarzani, H. and A. Norrman (2015). “Toward a relevant agenda for warehousing research: litera-ture review and practitioners’ input”. In: Logistics Research 8.1, pp. 1–18.
De Koster, R., T. Le-Duc, and K. J. Roodbergen (2007). “Design and control of warehouse orderpicking: a literature review”. In: European Journal of Operational Research 182.2, pp. 481–501.
Eisenhardt, K. M. and J. A. Martin (2000). “Dynamic capabilities: what are they?” In: Strategicmanagement journal 21.10-11, pp. 1105–1121.
Gaborieau, D. (2012). “«Le nez dans le micro». Répercussions du travail sous commande vocaledans les entrepôts de la grande distribution alimentaire”. In: La nouvelle revue du travail 1.
Gaborieau, D. (2016). “Des usines à colis: trajectoire ouvrière des entrepôts de la grande distribu-tion”. PhD thesis. Paris 1.
Grosse, E. H., C. H. Glock, and W. P. Neumann (2015). “Human factors in order picking systemdesign: a content analysis”. In: IFAC-PapersOnLine 48.3, pp. 320–325.
Gu, J., M. Goetschalckx, and L. F. McGinnis (2007). “Research on warehouse operation: a compre-hensive review”. In: European Journal of Operations Research 177.1, pp. 1–21.
Gu, J., M. Goetschalckx, and L. F. McGinnis (2010). “Research on warehouse design and perfor-mance evaluation: a comprehensive review”. In: European Journal of Operations Research 203.3,pp. 539–549.
Handling, Y. M. (2017). The ROI of Robotics: Financial and Operational Sense.Helfat, C. E. and M. A. Peteraf (2003). “The dynamic resource based view: capability lifecycles”. In:
Strategic Management Journal 24, pp. 997–1010.Hernes, T. and N. Paulsen (2003). “Introduction: boundaries and organization”. In: Managing
boundaries in organizations: multiple perspectives. Springer, pp. 1–13.Katz, F. E. (1965). “Explaining informal work groups in complex organizations: the case for auton-
omy in structure”. In: Administrative Science Quarterly 10.2, pp. 204–223.Luhmann,N. (1996). “SozialeSysteme”. In:Grundriss einerallgemeinenTheorie. Frankfurt: Suhrkamp.Mezzadra, S. and B. Neilson (2012). “Between inclusion and exclusion: On the topology of global
space and borders”. In: Theory, Culture & Society 29.4-5, pp. 58–75.Moore, R. (2018). A shed the size of a town:? what Britain’s giant distribution centres? tell? us about
modern life.Nilsson, F. andB. Gammelgaard (2012). “Moving beyond the systems approach in SCMand logistics
research”. In: International Journal of Physical Distribution and Logistics Management 42.8/9,pp. 764–783.
Pagell, M. and Z. Wu (2009). “Building a more complete theory of sustainable supply chain man-agement using case studies of 10 exemplars”. In: Journal of Supply Chain Management 45.2,pp. 37–56.
21

Running the Machine Faster: Acceleration, Humans andWarehousing
Richards, G. (2017).Warehousemanagement: a complete guide to improving efficiency andmini-mizing costs in the modern warehouse. Kogan Page Publishers.
Rosa, H. (2013). Social Acceleration: A new Theory of Modernity. New York: Columbia UniversityPress.
Simatupang, T. M., A. C. Wright, and R. Sridharan (2002). “The knowledge of coordination forsupply chain integration”. In: Business Process Management Journal 8.3, pp. 289–308.
Teece, D. J., G. Pisano, and A. Shuen (1997). “Dynamic capabilities and strategic management”. In:Strategic Management Journal 18.7, pp. 509–533.
Trienekens, J. H., P. M. Wognum, A. J. M. Beulens, and J. G. A. J. van der Vorst (2012). “Transparencyin complex dynamic food supply chains”. In: Advanced Engineering Informatics 26, pp. 55–65.
Vakkayil, J. D. (2012). “Boundaries and organizations: a few considerations for research”. In: Inter-national Journal of Organizational Analysis 20.2, pp. 203–220.
Varsei, M., C. Soosay, B. Fahimnia, and J. Sarkis (2014). “Framing sustainability performance of Sup-ply Chains with multidimensional indicators”. In: Supply Chain Management: An InternationalJournal 19.3, pp. 242–257.
Vidal, M. (2013). “Low-autonomywork and bad jobs in postfordist capitalism”. In:Human Relations66.4, pp. 587–612.
Waller, M. A. and S. E. Fawcett (2013). “Data science, predictive analytics, and big data: a revolutionthat will transform supply chain design and management”. In: Journal of Business Logistics34.2, pp. 77–84.
Wieland, A., R. B. Handfield, and C. F. Durach (2016). “Mapping the landscape of future researchthemes in supply chain management”. In: Journal of Business Logistics 37.3, pp. 205–212.
Wiengarten, F., M. Pagell, and B. Fynes (2011). “Supply chain environmental investments in dy-namic industries: Comparing investment and performance differences with static industries”.In: International Journal of Production Economics 135.2, pp. 541–551.
22
Supplier Integration in Industry 4.0 –Requirements and Strategies
Julian Marius Müller1, Johannes W. Veile2, Kai-Ingo Volgt2
1 – Salzburg University of Applied Sciences
2 – University of Erlangen-Nürnberg
Cross-company networking is essential to successfully implement Industry 4.0. Inthis context, numerous new demands on suppliers arise leading to integrationchallenges that require specific integration strategies. While these topics areimportant in business practice, an aggregated holistic overview is still missing.Therefore, this article examines new demands on suppliers, challenges in theimplementation process, and integration strategies for supplier integration in thecontext of Industry 4.0. Expert interviews with 15 different industrial companiesfromthe sectorsmechanical andplant engineering, electronicsandelectrical engi-neering, automotive, and information and communication technology serve as anempirical basis. This study provides insights into the challenges and strategies ofsupplier integration, helps academia to understand this topic, and indicates needfor future research. Furthermore, this paper develops implications for corporatepractice in the area of supplier management.
Keywords: Industry 4.0; Industrial Internet of Things; Supplier Integration; Inte-gration Strategies
First recieved: 17.May.2018 Revised: 07.Jun.2018 Accepted: 26.Jun.2018
23

Supplier Integration in Industry 4.0 – Requirements and Strategies
1 Introduction
Industry 4.0 aims to establish intelligent, self-managing, and interconnected in-dustrial value creation to ensure future competitiveness of the manufacturingindustry (Kagermann et al., 2013; Kang et al., 2016; Lasi et al., 2014). Both re-search and practice have mainly focused on technological developments and thetechnical implications for value creation so far (Brettel et al., 2014; Emmrich etal., 2015; Kagermann et al., 2013; Kans & Ingwald, 2016; Kowalkowski et al., 2013;Liao et al., 2017; Rennung et al., 2016). Furthermore, almost exclusively largecompanies have been the focus of academia and corporate practice (Kowalkowsiet al., 2013; Radziwon et al., 2014).
Up to the present day, Industry 4.0 is primarily thought within the boundaries of acompany and consequently present efforts aim at implementing the concept in acompany. Yet, the predicted potential of intelligent interconnected value-addedprocesses can only be exploited in its entirety by interconnecting companiesand value chains resulting in networks (Kagermann et al., 2013; Lasi et al., 2014).Therefore, the implementation of the holistic concept Industry 4.0 also requires aholistic approach.
However, integration processes across company boundaries pose numerous chal-lenges. First, such integration requires openness, willingness to cooperate, andcompatible technologies on all sides (Kiel et al., 2017; Müller et al., 2018a). Second,the integration of suppliers requires, e.g., them to have the necessary infrastruc-ture and drive forward the implementation of Industry 4.0. As suppliers are oftensmall andmedium-sized enterprises (SMEs), somemight have neither the nec-essary resources nor access to the required knowledge (Icks et al., 2017, Mülleret al., 2018b). Therefore, especially SMEs need to find adequate partners forcooperation (Müller et al., 2017).
The aim of this study is to analyze how to integrate suppliers in the context ofIndustry 4.0. The following research questions are proposed:
(1) Which requirements need to bemet when integrating suppliers?
(2) Which challenges arise when integrating suppliers?
(3) Which strategies can be used to integrate suppliers?
24

2 Theoretical background
Shedding light into the research object is important for several reasons. Theway suppliers are integrated into the value creation process of a company hasan impact on the extent to which possibilities Industry 4.0 can be used at all(Siepmann, 2016).
Supplier integration represents a source of differentiation and can therefore helpto create sustainable competitive advantages. Last but not least, versatile, real-time-optimized, and autonomous cross-company value creation networks canonly be established through adequate supplier integration, which is the overridinggoal of Industry 4.0 (Bauernhansl, 2014).
2 Theoretical background
2.1 Industry 4.0
The term ”Industry 4.0” refers to a paradigm shift in industrial value creation. It isparticularly widespread in the German-speaking world (Burmeister et al., 2015;Lasi et al., 2014), while the term ”Industrial Internet of Things” is particularly usedin the Anglophonic world (Hartmann & Halecker, 2015; IIC, 2017). The origin ofIndustry 4.0 dates back to the year 2011 and was significantly influenced by thework of Kagermann et al. (2011) in the context of the Hanover Fair. Furthermore,they published implementation recommendations in 2013 in a final report of theWorking Group Industry 4.0 (Kagermann et al., 2013).
In the age of industrialization, technical innovations repeatedly led to paradigmshifts that are called ”industrial revolutions” ex-post (Lasi et al., 2014). The firstindustrial revolution began at the end of the 18th century and was characterizedby the mechanization of the value creation process and the use of water andsteam power. Dated back to the beginning of the 20th century, the second in-dustrial revolution was characterized by mass production through assembly lineproduction, the application of the Taylor principle of division of labor, and theuse of electrical energy. The use of electronics and information technology toautomate and digitize production heralded the third industrial revolution in the1970s. All industrial revolutions have led to an increasing degree of complexity ofthe production systems (Bauernhansl, 2014; Kagermann et al., 2013; Kelkar et al.,2014; Lasi et al., 2014).
25
Supplier Integration in Industry 4.0 – Requirements and Strategies
It is predicted that the present economy is at the beginning of a fourth industrialrevolution, summarized by the term Industry 4.0. This new paradigm shift ischaracterized by a digital interconnection and virtualization of the industrial valuecreation process (Bauernhansl, 2014; Kagermann et al., 2013; Kelkar et al., 2014;Lasi et al., 2014). For the first time in history, a change of paradigm is announceda priori (Drath & Horch, 2014). For this reason, Industry 4.0 is to be understood asa vision whose potential can be realized in the future (Drath & Horch, 2014, Lasiet al., 2014). However, as the technical foundations have existed for some time,while the practical implementation is only gradually developing, some scientistsperceive Industry 4.0 more as an evolution than a revolution (Kagermann, 2014;Sendler, 2013).
Industry 4.0 is controversially discussed in science, hence no common under-standing has emerged so far (Bauer et al., 2014). According to Bauer et al. (2014,p. 18), Industry 4.0 is a ”real-time capable, intelligent, horizontal, and verticalnetworking of people, machines, objects” and information and communicationtechnology systems. Based on intelligent, digitally interconnected systems, peo-ple, machines, plants, logistic processes, and products can communicate andcooperate in real-time with each other (Platform Industrie 4.0, 2017). Industry 4.0is ”a new level of organization and control of the entire value chain across the lifecycle of products” (Platform Industry 4.0, 2017). The interconnection of the oper-ational value creation process takes place across corporate functions, companies,and entire value creation chains (Kagermann et al., 2013). Therefore, a high levelof standardization of interfaces between companies is required (Müller & Voigt,2017).
Using new technologies enables the development of an intelligent value-addedsystemwithin the framework of Industry 4.0. First, cyber-physical systems (CPS)result from the interconnection of embedded systems and link information tech-nologies with mechanical and electrical components (Becker, 2015; Kagermannet al., 2013; Zhou et al., 2015). In addition, the collection, analysis, and use of largeamounts of data play a decisive role and is subsumed among the term ”big data”.Finally, cloud solutions for storing and transmitting data via stable networks areused (Rüßmann et al., 2015; Bauer et al., 2014).
Research on the subject of Industry 4.0 is generally still in its infancy, which isparticular true for the implementationacross companyborders andvalue creationchains.
26
3 Methodology
2.2 Supplier Management and supplier integration
Supplier management is ”the design, management, and development of a com-pany’s supplier portfolio and supplier relationships” (Wagner, 2002, p. 11). Theaim of supplier management is to secure a company’s demand through an effi-cient supplier network and thereby contribute to the value creation (Helmold &Terry, 2016).
Supplier integration is a sub-process of supplier management (Helmold & Terry,2016) representing a formof vertical cooperation (Möller, 2002). This implies closestrategic cooperation with both key suppliers and customers in order to generateadvantages (Schoenherr & Swink, 2012; Thun, 2010; Wiengarten et al., 2016). Thegoal of supplier integration is to design integration strategies, practices, processes,and behaviors in a collaborative, synchronized, and well-controllable manner(Zhao et al., 2015). Combining a company’s resources with the capabilities of itssupplier and realizing joint activities can help to generate sustainable competitiveadvantages (Rink &Wagner, 2007). Shortening product development and productlife cycles and the associated fast, flexible, and efficient production processesin the context of Industry 4.0 increases the importance of supplier integration(Hofbauer et al., 2016).
3 Methodology
3.1 Research design
The study follows a qualitative research design to answer the research questions(Gläser & Laudel, 2010). A qualitative design is characterized by considering andanalyzingdifferentperspectives and integrating the interviewees’ and researchers’views (Flick, 1995). This design is particularly suitable for the research at handbecause supplier integration in the context of Industry 4.0 is a very topical issueand little comprehensive knowledge is available (Kaiser, 2014).
Semi-standardized in-depth expert interviews serve as a data basis (Gläser &Laudel, 2010). All interviews followed an interview guideline and were conductedvia telephone in German. On the one hand, the interview guideline was designedso that the interviewee was able to openly respond to questions and present hisor her subjective perspective. The result was a natural course of conversation
27
Supplier Integration in Industry 4.0 – Requirements and Strategies
in which the interviewee could answer freely. In addition, the interviewer couldfollow up on certain questions or adapt his questions. On the other hand, a partialstandardization of the interviews allowed to compare and evaluate the interviews(Mayring, 2015; Gläser & Laudel, 2010). After general questions, the experts wereasked about their opinion on the topic of supplier integration in the context ofIndustry 4.0. The main part contained specific questions on the sub-topics (1)challenges with suppliers in the context of Industry 4.0, (2) expectations of suppli-ers as for Industry 4.0, (3) and adequate integration strategies. All interviews wereaudio-recorded and subsequently transcribed with the permission of the inter-view partners leading to more than 200 pages of text material. For confidentialityreasons, all interviews were anonymized.
3.2 Data sample
The data sample comprises 15 semi-standardized in-depth expert interviews.Originally, 46 companies were surveyed, and thereof experts from 15 companieswere recruited for an interview, corresponding to a response rate of approximately33 percent.
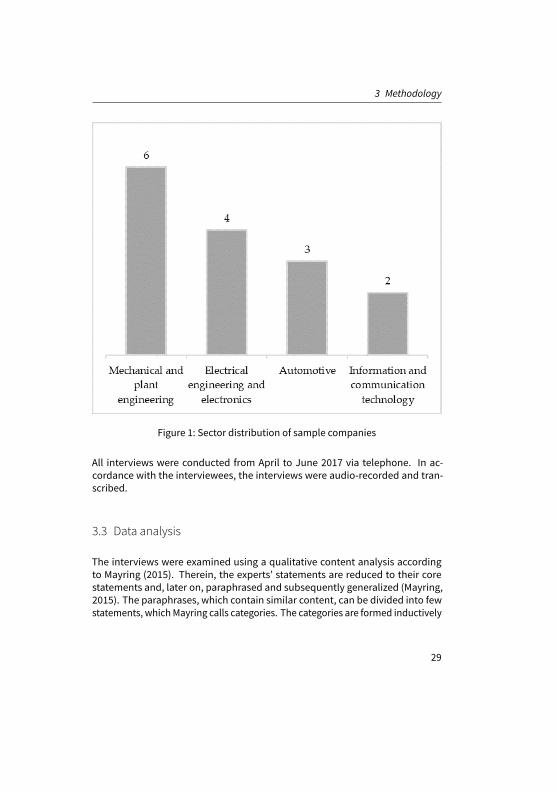
The surveyed experts come from a heterogeneous sample of companies, head-quartered in the Federal Republic of Germany. The sample includes companiesfrom the sectors electrical engineering and electronics, mechanical and plant en-gineering, automotive, and information and communication technology. Thesesectors were chosen because they are representative for the most importantsectors in Germany, and as they are in particular, driving forward Industry 4.0(Kagermann et al., 2013). The following figure shows the distribution of enter-prises within the sample.
The size of the sample companies is heterogeneous. It varies in terms of turnoverfrom approximately 150 million to approximately 80 billion euros and in termsof employees from approximately 3,000 to approximately 400,000 employees.All experts hold a position in either medium or upper management and haveseveral years of business experience. The interviewed positions include ninerepresentatives frompurchasingdepartments, ofwhich six areheadofpurchasing,twoChief Digital Officers, oneChief ExecutiveOfficer, oneChief TechnologyOfficer,one head of external cooperation, and one head of supplier management.
28
3 Methodology
Figure 1: Sector distribution of sample companies
All interviews were conducted from April to June 2017 via telephone. In ac-cordance with the interviewees, the interviews were audio-recorded and tran-scribed.
3.3 Data analysis
The interviews were examined using a qualitative content analysis accordingto Mayring (2015). Therein, the experts’ statements are reduced to their corestatements and, later on, paraphrased and subsequently generalized (Mayring,2015). The paraphrases, which contain similar content, can be divided into fewstatements, whichMayring calls categories. The categories are formed inductively
29
Supplier Integration in Industry 4.0 – Requirements and Strategies
using a keyword analysis (Gläser & Laudel, 2010; Kaiser, 2014). The frequencyanalysis of individual nominations allows an interpretation and analysis of expertstatements fromwhich relevant research results can be extracted (Bogner et al.,2014; Gläser & Laudel, 2010; Mayring, 2015).
4 Analysis and results
4.1 New requirements for suppliers
The increasingly demanded ability to collect, store, and profitably evaluate datais mentioned by ten respondents to be new requirements for suppliers in thecontext of Industry 4.0. At the same time, the company representatives emphasizethat many suppliers have paid little attention to this so far. Therefore, suppliersare demanded expand these abilities by the interviewees, even if those are justsupplying parts or rawmaterials.
Eight respondents considered the creation of interfaces and the implementationof standards to be important requirements. Smooth interfaces are required espe-cially for digital real-time data exchange, as mentioned by the respondents. Fromtheir perspective, suppliers need to be willing to adapt to customer-specific stan-dards and interfaces, even if different standards exist among their customers.
The willingness to provide data as a requirement for their own suppliers in thecontext of Industry 4.0 was mentioned by six respondents. So far, data have oftenbeenpublishedonly if necessary andhesitantly, which should bedoneproactivelyin the future, according to the interviewed experts.
Five respondents named a cultural shift towards common, collaborative valuecreation within the Industry 4.0 concept as important. In the future, suppliersshould no longer respect their own company boundaries as borders, but theyshould think and act beyond these borders, increasing partnership-based ex-change. According to the interviewees, partnership and cooperation needs to beextended, replacing predominant competitive thinking.
The understanding of the shortening innovation cycles by Industry 4.0 to be anessential requirement was named by four respondents. Traditional industrialsectors, such as mechanical engineering, would have to rethink their way ofcreating value, in order to approach short innovation cycles like those of, e.g., the
30
4 Analysis and results
software industry. The interviewees regard this as an essential prerequisite inorder to, e.g., produce cyber-physical systems or offer platform-based businessmodels.
Three respondents described an increased orientation towards the common endcustomer of different supply chain partners. Consequently, the primary goal ofvaluecreation should focuson thecommonendcustomerandhisneeds, followingthe opinion of the interviewed experts.
4.2 Challenges of supplier integration
Nine surveyed company representatives named a high degree of complexity insupplier integration in the context of Industry 4.0. Inhomogeneous standards anddiffering requirements across industrieshinder the implementationof Industry 4.0across value chains. For example, different Enterprise-Resource-Planning systemsmust be harmonized in order to enable a global network.
The lack of resources on the part of suppliers as a hindrance was mentionedby eight respondents. These statements do not only refer to a lack of financialresources, but also to a lack of knowledge and work force.
Another eight respondents stated inadequate structures and interfaces as a chal-lenge. In many companies, different departments work with different standardsand a company-wide coordination does not take place.
The suppliers’ uncertainty about the expected developments was described byfive interviewees. Many suppliers do have a wait-and-see-attitude and, as fornow, do not address the issue of Industry 4.0 proactively. This leads to a lackof competence creation instead of using time to gather information and definestrategies for Industry 4.0.
Five respondents cited a lack of understanding, particularly as for the urgencyof implementing Industry 4.0. This is especially true for SMEs. Instead, sectorswould pursue the typical goals, e.g., mechanical engineering strives rather forimproving mechanical quality, than preparing for future topics.
Another five respondents described issues of data security and data protection.Until now, issues of data security are not completely clarified from a legal perspec-tive and the question of data ownership remains unclear. Further, concerns such
31
Supplier Integration in Industry 4.0 – Requirements and Strategies
as hacker attacks and espionage should be taken care of and secure encryptionmethods should be applied.
Challenges resulting from a changing balance of power were mentioned by fiverespondents. Suppliers would be afraid of losing importance in the future, astheir competence is no longer of central importance in Industry 4.0. In addition,customers are concerned because suppliers could put more pressure on themand even completely bypass or replace them.
Four respondents described possible disruptions because of new competitors asa challenge. There are concerns in particular with regard to platform providers ordata-based businessmodels. These could create the core benefit for the customerin the future and thus degrade existing companies as suppliers or completelydisplace their business model.
A lackofwillingness toexchangedataon thepart of suppliers tobeanobstaclewasalsomentionedby four respondents. For example, there is a lackof understandingthat data can only generate value in the future if it is exchanged across the entirevalue chain. At present, data is considered to be a trade secret and most firmsdisclose it whenever possible. However, a compromise must be found in order tocreate advantages for all partners within a value chain.
4.3 Integration strategies
Eight respondents described precise and comprehensive communication of com-mon standards as an appropriate approach to supplier integration in Industry 4.0.Many suppliers did not know, which standards were required and which typeof cooperation asks for which specific standard. It is therefore essential to clar-ify issues of standards and to make it easy for the suppliers to understand therequirements.
The establishment of digital platforms as a strategy for integrating suppliers is alsomentioned by eight experts. The platforms could be used in different contexts,for example, in procurement, supply chain management, joint tool management,and product development. It is important to increase potentials through jointnetworking and to make them accessible to all partners in the value chain.
Six of the company representatives cited transparency in communication withsuppliers as an essential approach. Thus, honesty and transparency are central
32

5 Conclusion
points here. A clear presentation of the consequences following from a lack of co-operation and an honest communication are indispensable in order to cooperatewith suppliers in the context of Industry 4.0.
Further, contractual security is an important issue described by two respondents.Suppliers need to have a reliable basis with a long-term perspective in order tobe able tomake the corresponding investments for the integration process. Sincesuppliers have to meet different standards for their numerous customers, theyaim for keeping their customers for a long period of time, as otherwise specificinvestmentswouldnotpayoff. Establishing long-termrelationships is theonlywayto encourage the supplier’swillingness to invest in Industry 4.0 and the integrationprocess.
The creation joint businessmodelswasmentioned by two respondents. As suppli-ers can play a key role in new, joint business models in the context of Industry 4.0,this is a way to motivate the suppliers. For example, there are data-driven busi-nessmodels inwhich the supplier is responsible for data evaluation and is therebyoffered an incentive to make investments.
Two of the respondents also mentioned common research and development ac-tivities. For example, joint development of Industry 4.0 components and softwarecould help to qualify suppliers for Industry 4.0. It is in the hands of customersto help their suppliers to implement Industry 4.0 and to accelerate their effortsthrough corresponding demand.
The provision of resources was mentioned by a single respondent. Nevertheless,this integration strategy represents an interesting approach to support suppliers.For instance, specialists canbe lentout for consultationand technical componentscanbemadeavailableat lowcostor freeof charge to speedup the implementationprocess.
5 Conclusion
This article presents the results of 15 in-depth expert interviews as for supplierrequirements, challenges during the implementation process, and the adequateintegration strategies for supplier integration in the context of Industry 4.0.
According to this study’s results, key requirements include developing the abilityto collect, store, and evaluate data, creating smooth interfaces, implementing
33
Supplier Integration in Industry 4.0 – Requirements and Strategies
standards, and creating a willingness to exchange data. In the course of thesupplier integration, various challenges arise. Themost important ones comprisecopingwith thehigh complexity, lacking in resourcebase, andhavingnoadequatestructures and interfaces. The new demands on suppliers and the challenges thatarise in supplier integration can be classified into different fields of action thatrequire specific integration strategies for companies.
In the future, important strategical issues are, among others, undertaking a com-prehensive communication, establishing common standards, andmaintaininglong-term contractual security. These provide the basis for establishing strategiesto face the challenges. Key strategies include creating digital platforms, carryingour joint business models, and undertaking common research and developmentactivities.
It should be noted that the integration strategies presented by the interview part-ners reflect the statusquoand include the strategic environmentof the companies,which represents a limitation of the study at hand. Therefore, companies shouldreview their own strategic options and their individual strategic environment todevelop their own supplier integration strategies.
The study aggregates key information that is relevant to practice, as companiescan use it as a starting point to develop successful supplier integration strategiesin the context of Industry 4.0. Research can also use the results to develop thetheoretical basis for future changes in supplier management caused by Indus-try 4.0.
References
Bauer, W., S. Schlund, D. Marrenbach, and O. Ganschar (2014). Industrie 4.0 - Volks-wirtschaftlichesPotenzial für Deutschland. Berlin: Bundesverband Infor-mationswirtschaft, Telekommunikationund neue Medien e. V., Fraunhofer-Institut für Arbeitswirtschaft und Organisation.
Bauernhansl, T. (2014). “Die Vierte Industrielle Revolution - Der Weg in ein wertschaffendes Pro-duktionsparadigma”. In: T. Ed. by M. t. H. Bauernhansl and B. Vo-gel-Heuser. Industrie 4.0 inProduktion, Automatisierung und Logistik, pp. 5-35, Wiesbaden: Springer Vieweg.
Becker, K.-d. (2015). “Arbeit in der Industrie 4.0 Erwartungen des Instituts fur angewandte Ar-beitswissenschaft e.V”. In: Zukunft der Arbeit in Industrie 4. Ed. by A. Botthof and E. A. Hartmann.Berlin: Springer, pp. 23-29.
Bogner, A., B. Littig, and W. Menz (2014). Interviews mit Experten Eine praxisorien-tierte Einfuhrung.Wiesbaden: Springer.
34
REFERENCES
Brettel, M., N. Friederichsen, M. Keller, and M. Rosenberg (2014). “How Virtualization, Decentraliza-tion and Network Building Change the Manufacturing Land-scape An Industry 4.0 Perspective”.In: International Journal of Mechanical, Aerospace, Industrial, Mechatronic and ManufacturingEngineering 8, pp. 37-44.
Burmeister, C., D. Luttgens, and F. T. Piller (2015). “Business Model Innovation for Industrie 4.0Why the Industrial Internet Mandates a New Perspective on Innovation”. In: Die UnternehmungSwiss Journal of Business Research and Practice 70, pp. 124-152.
Drath, R. and A. Horch (2014). “Industrie 4.0”. In: Hit or Hype IEEE Industrial Electron-ics Magazine 8,pp. 56-58.
Emmrich, V., M. Dobele, T. Bauernhansl, D. Paulus-Rohmer, A. Schatz, and M. Weskamp (2015).Geschaftsmodell-Innovation durch Industrie 4.0: Chancen und Risiken fur den Maschinen- undAnlagenbau. Munchen: Dr. Wieselhuber & Partner.
Flick, U. (1995). Qualitative Forschung: Theorie, Methoden, Anwendung in Psychologie und Sozial-wissenschaften. Reinbek bei Hamburg: Rowohlt.
Glaser, J. and G. Laudel (2010). Experteninterviews und qualitative Inhaltsanalyse: Als Instrumenterekonstruierender Untersuchungen (4. Auflage. Wiesbaden: Springer VS.
Hartmann, M. and B. Halecker (2015). “Management of Innovation in the Industrial Internet ofThings”. In: Proceedings of the 26th International Society for Profes-sional Innovation Manage-ment Conference (ISPIM). Budapest, pp. 421-439.
Helmold, M. and B. Terry (2016). Lieferantenmanagement 2030: Wertschopfung und Sicherung derWettbewerbsfahigkeit in digitalen und globalen Markten. Wiesbaden: Springer Gabler.
Hofbauer, G., T. Mashhour, and M. Fischer (2016). Lieferantenmanagement: Die wert-orientierteGestaltung der Lieferbeziehung (3rd Edition). Berlin/Boston: De Gruyter Oldenbourg.
Icks, A., C. Schroder, S. Brink, C. Dienes, and S. Schneck (2017). Digitalisierungspro-zesse von KMUim Verarbeitenden Gewerbe. Bonn: IfM Bonn.
Kagermann, H., W. Lukas, and W. Wahlster (2011). “Industrie 4.0: Mit dem Internet der Dinge aufdemWeg zur 4. industriellen Revolution”. In: VDI nachrichten, No 13, p. 2.
Kagermann, H., W. Wahlster, and J. Helbig (May 2013). In: Umsatzempfehlungen fur das Zukunft-sprojekt Industrie 4.0 8, p. 2018.
Kaiser, R. (2014). Qualitative Experteninterviews: Konzeptionelle Grundlagen und praktische Durch-fuhrung. Wiesbaden: Springer VS.
Kang, H. S., J. Y. Lee, S. Choi, H. Kim, J. H. Park, and J. Y. Son (2016). “Smart manufacturing:Past research, present findings, and future directions”. In: International Journal of PrecisionEngineering and Manufacturing-Green Technology 3, pp. 111-128.
Kans, M. and A. Ingwald (2016). “Business Model Development: Towards Service Man-agement4.0”. In: Procedia CIRP 47, pp. 489-494.
Kelkar,O., R.Heger, andD.Dao (2014).Studie Industrie 4.0 EineStandortbestim-mungderAutomobil-und Fertigungsindustrie. Reutlingen: Mieschke, Hof-mann und Partner.
Kiel, D., J. M. Müller, C. Arnold, and K.-i. Voigt (2017). “Sustainable Industrial Value Creation:Benefits and Challenges of Industry 4.0”. In: International Journal of Innovation Management21.8, p. 1740015.
Kowalkowski, C., L.Witell, andA.Gustafsson (2013). “Anywaygoes: Identifying value constellationsfor service infusion in SMEs”. In: Industrial Marketing Manage-ment 42, pp. 18-30.
Lasi, H., P. Fettke, H. G. Kemper, T. Feld, and M. Hoffmann (2014). “Industry 4.0”. In: Busi-ness &Information Systems Engineering 6, pp. 239-242.
35

Supplier Integration in Industry 4.0 – Requirements and Strategies
Liao, Y. and L. Pierin Ramos (n.d.). “2017. Past, present and future of Industry 4.0 A systematicliterature review and re-search agenda proposal. International Journal of Production Research,),” in: 55 (), pp. 3609-3629.
Mayring, P. (2015). Qualitative Inhaltsanalyse: Grundlagen und Techniken (12th Edition). Weinheim:Beltz.
Moller, K. (2002).Zuliefererintegration indasTargetCosting: AufBasisderTransak-tionskostentheorie.München: Vahlen.
Müller, J. M., O. Buliga, and K.-i. Voigt (2018). “Fortune favors the prepared: How SMEs approachbusiness model innovations in Industry 4.0”. In: Technological Forecasting and Social Change127, pp. 2–17.
Müller, J. M. and V. K.-i. (2017). “Standardisierung fur Industrie 4.0 in KMU -WelcheHerausforderun-gen werden von kleinen und mittleren Unternehmen durch Standardisierung hinsichtlichIndustrie 4.0 gesehen?” In: Industrie 4.0 Management 4, pp. 25–28.
Müller, J. M., D. Kiel, and V. K.-i. (2018). “What Drives the Implementation of Indus-try 4.0?” In: TheRole of Opportunities and Challenges in the Context of Sustaina-bility. Sustainability 10, p. 1.
Müller, J. M., L. Maier, J. Veile, and K.-i. Voigt (2017). “Cooperation strategies among SMEs forimplementing Industry 4.0”. In: Hamburg International Conference on Logistics (HICL.
Plattform Industrie 4.0 (2017). “Was ist Industrie 4.0?” . In: https://www.plattform-i40.de/I40/ Navigation/DE/Industrie40/WasIndustrie40/was-ist-industrie-40.html
Radziwon, A., A. Bilberg, M. Bogers, and E. S. Madsen (2014). “The Smart Factory: Exploring Adaptiveand Flexible Manufacturing Solutions”. In: Procedia Engi-neering 69, pp. 1184-1190. Rennung,
F., C. T. Luminosu, and A. Draghici (2016). “Service Provision in the Frame-work ofIndustry 4.0”. In: Procedia Social and Behavioral Sciences 221, pp. 372-377.
Rink, C. and S. M. Wagner (2007). “Lieferantenmanagement: Strategien, Prozesse und systemtech-nische Unterstutzung”. In: Elektronische Beschaffung: Stand und Entwicklungstendenzen, pp.
Ed. by W. Brenner and R. Wenger. Berlin/Heidelberg: Springer, pp. 39–62.Russmann, M., M. Lorenz, P. Gerbert, M. Waldner, J. Justus, P. Engel, and M. Harnisch (2015). Industry
4.0: The future of productivity and growth in manufacturing industries. Boston: Consulting Group. Schoenherr, T. and M. Swink (2012). “Revisiting the arcs of integration: Cross-validations and
extensions”. In: Journal of Operations Management 30, pp. 99-115.Sendler, U., ed. (2013). Industrie 4.0. Beherrschung der industriellen Komplexitat mit SysLM. Berlin:
Springer Vieweg.Siepmann, D. (2016). “Industrie 4.0 Funf zentrale Paradigmen”. In: Einfuhrung und Umsetzung
von Industrie 4. Ed. by A. Roth. 0. Grundlagen, Vorgehensmodell und Use Cases aus der Praxis.Berlin/Heidelberg: Springer Gabler.
Thun, J. H. (2010). “Angles of Integration: An Empirical Analysis of the Alignment of internet-basedInformation Technology and global Supply Chain Integra-tion”. In: Journal of Supply ChainManagement 46, pp. 30-44.
Wagner, S. M. (2002). Lieferantenmanagement. Munchen/Wien: Hanser.Wiengarten, F., P. Humphreys, C. Gimenez, andR.McIvor (2016). “Risk, riskmanage-ment practices,
and the success of supply chain integration”. In: International Journal of Production Economics171, pp. 361-370.
Zhao, G., T. Feng, and D. Wang (2015). “Is more supply chain integration always benefi-cial tofinancial performance?” In: Industrial Marketing Management 45, pp. 162-172.
Zhou, K., T. Liu, and L. Zhou (2015). “Industry 4.0: Towards future industrial oppor-tunities and chal-lenges”. In: Proceedings of the 12th International Conference on Fuzzy Systems and KnowledgeDiscovery (FSKD). Zhang-jiajie, pp. 2147–2152.
36
Scope for Industry 4.0 in Agri-foodSupply Chains
Claudine Soosay1, Raja Kannusamy1
1 – University of South Australia
This study investigates the current capabilities and technologies adopted in theagri-food industry in Australia and the scope for transition to Industry 4.0. Datawere collected from 360 firms representing suppliers, producers, manufacturers,wholesalers, logistics providers and retailers to represent a supply chain perspec-tive. The technologies and strategies were grouped based on the various supplychain players against thematurity stages of Industry 4.0 as prescribed by Schuh etal (2017) in order to discern the integration efforts and degree of interoperabilityin the supply chain. We establish that upstream players tend to adopt technologymainly for internal operational efficiencies and B2B transactions. We proposethat the individual orientation, interoperability and capabilities of these firms willneed to be reassessed to derive a systematic plan for progression into a technol-ogy architecture for the overall supply chain. Despite the fragmented adoptionof advance technologies evident at various points of value creation in the supplychain, we recognize and highlight the vulnerability of many small businesses andupstream players in the food industry who appear to be lagging behind in thefourth industrial revolution as well as the disruptive changes entailed to keep upand compete in the digital age.
Keywords: Agri-food supply chain; Industry 4.0; Maturity stages; Surveymethod-ology
First recieved: 28.May.2018 Revised: 11.Jul.2018 Accepted: 16.Jul.2018
37
Scope for Industry 4.0 in Agri-food Supply Chains
1 Introduction
In the agri-food industry, logistics and supply chain management activities aredeemedmore challenging due to the need for time-based approaches, integralquality control and associated tracking and tracing systems of food productsalong the chain. These include meeting temperature control requirements, prod-uct perishability issues and the variability in agri-food quality (Soosay 2008, Sahinet al 2007). These products include grain, livestock (beef and dairy) and horti-culture. Inter-organizational technology systems offer the potential to improveoperational efficiency, responsiveness and traceability by supporting transac-tions andmaterial flowmore efficiently (Kim et al 2018, Johnston & Vitale, 1988).Consequently, integrative efforts are needed between supply chain membersto reach new levels of competencies where firms can willingly share data andbusiness applications.
Industry 4.0 requires supply chains to not only adopt modern technologies andengage in capability development, but also to transform their business modelsand network structures to achieve coherent vertical integration. This is likely tochange traditional relationships between suppliers, manufacturers, wholesalers,retailers and customers. There are already some industries such as electronicsand fast moving consumer goods (FMCG) adopting state of the art technologiesandmoving along the supply chain 4.0 continuum at present; while other indus-tries are still lagging behind. There is concern that the diffusion rate of moderntechnologies in the agri-food industry has beenmuch lower than anticipated, sug-gesting that their implementationmay involve challenges or lack of collaboration(Costa et al 2013, Vlachos 2004, Salin 1998).
There are various empirical studies on supply chain technology adoption in theliterature (Aydin & Parker 2018, Krishnan et al 2015). While the authors haveestablished reasons why firms and some industries struggle with technology im-plementation, the theories, concepts and practices developed in the context offood supply chains need greater understanding as this industry faces distincteconomic settings, such as market imperfections, heterogeneity of actors, infor-mation asymmetries, technology infrastructure, immature supply chain networksand the perishable nature of food products (Solanki & Brewster 2014, Xu et al2004). As a result, this study examines the current capabilities, technologies andinteroperability strategies adopted in agri-food supply chains and the scope fortransition to Industry 4.0. The central research question is ’How is Industry 4.0
38
2 Theoretical Framework
distributed across the stages of value creation in the agri-food industry in Aus-tralia?’
2 Theoretical Framework
Industry 4.0, also known as the fourth industrial revolution, is a collective ap-proach to digitalization, interconnectedness and new technologies. It is increas-ingly gaining consideration from policymakers, businesses and academia world-wide. The term ’Industrie 4.0’ became popular in 2011 with a Working Groupoffering the German federal government a vision for the future of industrial manu-facturing. It subsequently formed part of the government’s ’Action PlanHigh-TechStrategy 2020’ to ensure technological leadership with digitalization, smart fac-tories and Internet of Things (IoT) (Klitou et al 2017). Industry 4.0 is expected toresult in four long-term relationship paradigm shifts and changes to the landscapeof Europeanmanufacturing: Factory and nature, Factory and local community,Factory and value chains (distributed and responsive manufacturing throughcollaborative processes, enabling mass customization of products and services);and Factory and humans. Thesewill have impacts on technology implementationin a wider manufacturing and distribution environment (Santos et al 2017).
Schuh et al (2017) articulate that the fourth industrial revolution extends beyondICT integration in industrial manufacturing to include transformations in organi-zations and their culture. Businesses will need to becomemore agile and adaptto changing environments. These authors prescribe the acatech Industrie 4.0Maturity Index model which delineates the successive maturity stages for Indus-try 4.0. This model assists companies identify which stage they are currently atand their potential capability development and transformation to fully imple-menting Industry 4.0. The stages span from ’Computerization’, ’Connectivity’,’Visibility’, ’Transparency’, ’Predictive Capability’ to ’Adaptability’.
Industry 4.0 should not only be discerned at the organizational level, but will alsorevolutionize manufacturing supply chains with new products, services and busi-ness models through IoT from product design right through to customer delivery(Roblek et al 2016). For instance, it emphasizes the global network of machinesin a manufacturing environment capable of exchanging information, knowingvariations to be made to the product and being able to control each other. This ispossible with collaboration between suppliers, manufacturers and customers to
39
Scope for Industry 4.0 in Agri-food Supply Chains
increase the transparency fromwhen the order is initiated, manufactured and dis-patched until the end of the product’s life cycle. Hence, it is important to analyzehow supply chains are impacted by Industry 4.0.
Supply chain networks today depend on a number of key technologies that en-able integrated planning and execution systems, logistics visibility, autonomouslogistics, smart procurement, smart warehousing, spare part management andadvanced analytics (Schrauf & Berttram 2016). Lee et al (2014) highlight how tech-nology is the key to 21st century global supply chainmanagement for operationalcompetitiveness. By tracking the evolution of supply chain technologies in thetextile and apparel industry, these authors classify the technologies adopted inachieving superior supply chain performance and competitive advantage.
It is evident that digital networks offer higher levels of resilience and responsive-ness with more efficient and transparent service delivery. Mussomeli et al (2017)report the shift from linear, sequential supply chain operations to interconnected,dynamic and integrated networks. Predictive shipping is another emerging con-cept, where according to Alicke et al (2017), a shipment which is already in thelogistics network is matched with customer order at a later stage. Resultantly,demandmanagement will need to be implemented at amore granular level usingtechniques such as micro segmentation, mass customization, innovative distribu-tion concepts and more sophisticated scheduling practices. The emerging trendsin Industry 4.0 can pertain to warehouse robotics, autonomous road transporta-tion, logistics and technology services, supply chain social responsibility, the racefor the last mile, and the rise of the virtual logistics team (O’Byrne 2017). Hence,businesses will need to reframe their business models and invest in how they candigitize their products and systems, starting with the supply chain. They will alsoneed to reassess their capabilities, technologies and interoperability strategies inorder to transition to Industry 4.0.
In this paper, we examine Industry 4.0 in the context of agri-food supply chainsin Australia using the maturity phases from Schuh et al (2017) to understand theextent of technologies used by firms throughout the value creation. These phasesare grouped as ’Computerization & Connectivity’, ’Visibility & Transparency’, ’Pre-dictive capability’, and ’Adaptability & Self-learning’.
40
3 Methods
3 Methods
Datawere collected in three stages over a 12-monthperiod as part of a larger studyon supply chain integration. An online surveywas sent to over 2,000 organizationsobtained fromvarious databases and industry associations. During the first phase,we collected data from suppliers, producers, manufacturers, wholesalers andretailers associated with the agri-food industry. Subsequently, we implemented asecond phase of data collection after identifying the secondary players in the sup-ply chain comprising input suppliers, packaging suppliers and third party logisticsproviders who also service the food industry. Input suppliers include firms whoprovide equipment, machinery, feedstock, fertilizers and other related productsto farmers, growers and agri-food producers. Packaging suppliers include anarray of firms who produce and supply paper, plastic, fibre containers, foam foodtrays, cartons, boxes, glass, closures, foil, film and other products used in the foodindustry. Logistics providers were largely transport companies, although someprovided warehousing, light assembly and secondary packaging services. Thethird phase of data collection were reminders sent to firms in order to increasethe response rate. As a result, a total of 360 usable questionnaires were received,constituting a response rate of 18% andwhere these firms represented a whole ofchain perspective. These firms are illustrated in the following table showing theirposition in the supply chain as well as the firm size as prescribed by the AustralianBureau of Statistics classification. Majority of the firms were small andmediumsized accounting for 74% of the sample population.
41
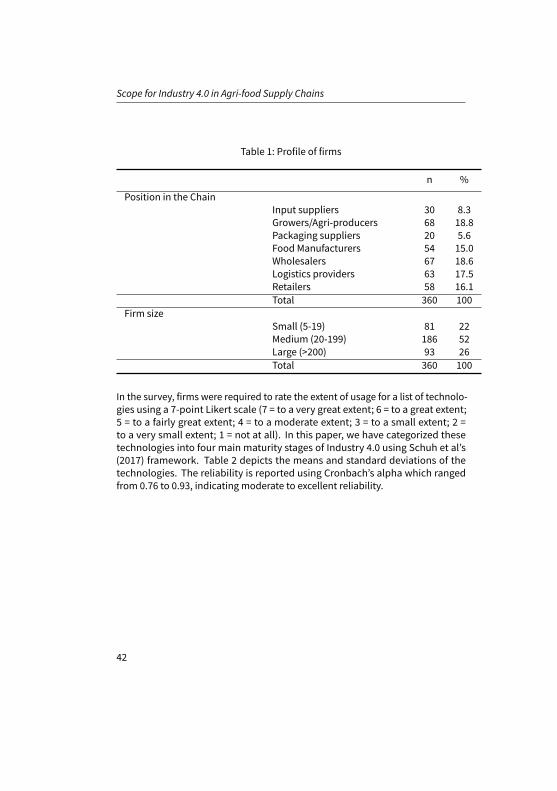
Scope for Industry 4.0 in Agri-food Supply Chains
Table 1: Profile of firms
n %
Position in the ChainInput suppliers 30 8.3Growers/Agri-producers 68 18.8Packaging suppliers 20 5.6Food Manufacturers 54 15.0Wholesalers 67 18.6Logistics providers 63 17.5Retailers 58 16.1Total 360 100
Firm sizeSmall (5-19) 81 22Medium (20-199) 186 52Large (>200) 93 26Total 360 100
In the survey, firms were required to rate the extent of usage for a list of technolo-gies using a 7-point Likert scale (7 = to a very great extent; 6 = to a great extent;5 = to a fairly great extent; 4 = to a moderate extent; 3 = to a small extent; 2 =to a very small extent; 1 = not at all). In this paper, we have categorized thesetechnologies into four main maturity stages of Industry 4.0 using Schuh et al’s(2017) framework. Table 2 depicts the means and standard deviations of thetechnologies. The reliability is reported using Cronbach’s alpha which rangedfrom 0.76 to 0.93, indicating moderate to excellent reliability.
42
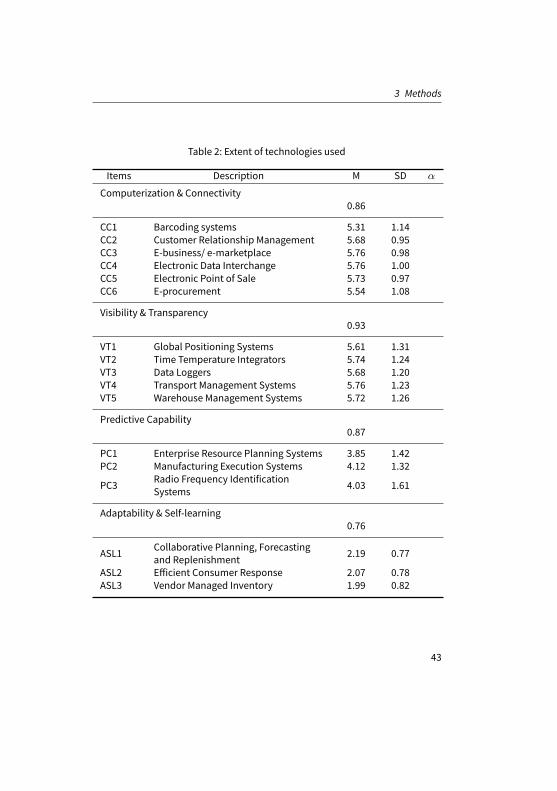
3 Methods
Table 2: Extent of technologies used
Items Description M SD α
Computerization & Connectivity0.86
CC1 Barcoding systems 5.31 1.14CC2 Customer Relationship Management 5.68 0.95CC3 E-business/ e-marketplace 5.76 0.98CC4 Electronic Data Interchange 5.76 1.00CC5 Electronic Point of Sale 5.73 0.97CC6 E-procurement 5.54 1.08
Visibility & Transparency0.93
VT1 Global Positioning Systems 5.61 1.31VT2 Time Temperature Integrators 5.74 1.24VT3 Data Loggers 5.68 1.20VT4 Transport Management Systems 5.76 1.23VT5 Warehouse Management Systems 5.72 1.26
Predictive Capability0.87
PC1 Enterprise Resource Planning Systems 3.85 1.42PC2 Manufacturing Execution Systems 4.12 1.32
PC3 Radio Frequency IdentificationSystems 4.03 1.61
Adaptability & Self-learning0.76
ASL1 Collaborative Planning, Forecastingand Replenishment 2.19 0.77
ASL2 Efficient Consumer Response 2.07 0.78ASL3 Vendor Managed Inventory 1.99 0.82
43
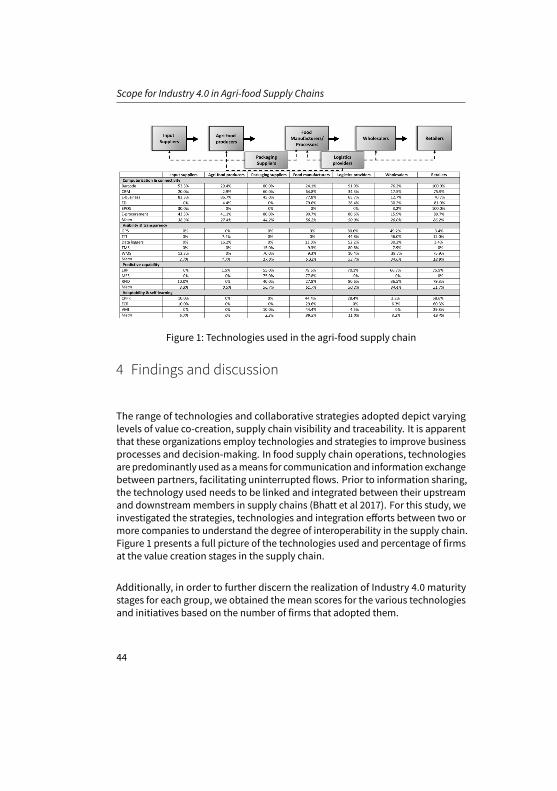
Scope for Industry 4.0 in Agri-food Supply Chains
Figure 1: Technologies used in the agri-food supply chain
4 Findings and discussion
The range of technologies and collaborative strategies adopted depict varyinglevels of value co-creation, supply chain visibility and traceability. It is apparentthat these organizations employ technologies and strategies to improve businessprocesses and decision-making. In food supply chain operations, technologiesare predominantly used as ameans for communication and information exchangebetween partners, facilitating uninterrupted flows. Prior to information sharing,the technology used needs to be linked and integrated between their upstreamand downstreammembers in supply chains (Bhatt et al 2017). For this study, weinvestigated the strategies, technologies and integration efforts between two ormore companies to understand the degree of interoperability in the supply chain.Figure 1 presents a full picture of the technologies used and percentage of firmsat the value creation stages in the supply chain.
Additionally, in order to further discern the realization of Industry 4.0 maturitystages for each group, we obtained the mean scores for the various technologiesand initiatives based on the number of firms that adopted them.
44
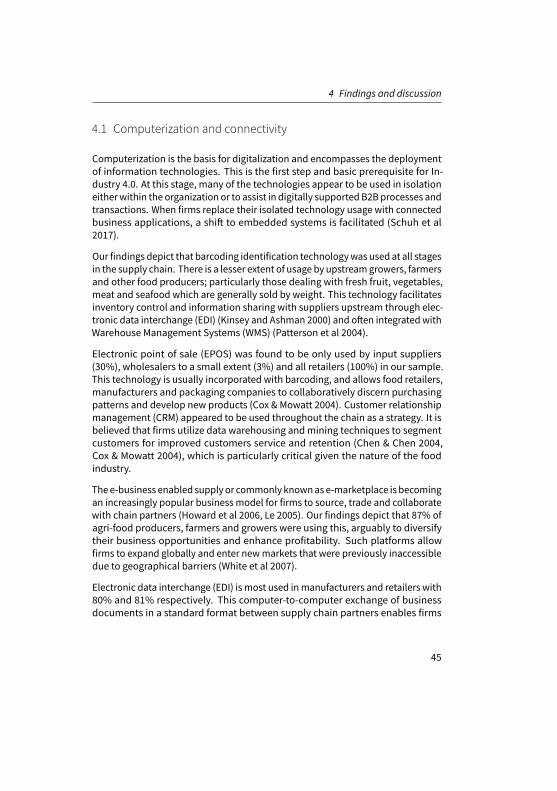
4 Findings and discussion
4.1 Computerization and connectivity
Computerization is the basis for digitalization and encompasses the deploymentof information technologies. This is the first step and basic prerequisite for In-dustry 4.0. At this stage, many of the technologies appear to be used in isolationeitherwithin the organization or to assist in digitally supportedB2Bprocesses andtransactions. When firms replace their isolated technology usage with connectedbusiness applications, a shift to embedded systems is facilitated (Schuh et al2017).
Our findings depict that barcoding identification technologywas used at all stagesin the supply chain. There is a lesser extent of usage by upstreamgrowers, farmersand other food producers; particularly those dealing with fresh fruit, vegetables,meat and seafood which are generally sold by weight. This technology facilitatesinventory control and information sharing with suppliers upstream through elec-tronic data interchange (EDI) (Kinsey and Ashman 2000) and often integrated withWarehouse Management Systems (WMS) (Patterson et al 2004).
Electronic point of sale (EPOS) was found to be only used by input suppliers(30%), wholesalers to a small extent (3%) and all retailers (100%) in our sample.This technology is usually incorporated with barcoding, and allows food retailers,manufacturers and packaging companies to collaboratively discern purchasingpatterns and develop new products (Cox & Mowatt 2004). Customer relationshipmanagement (CRM) appeared to be used throughout the chain as a strategy. It isbelieved that firms utilize data warehousing andmining techniques to segmentcustomers for improved customers service and retention (Chen & Chen 2004,Cox & Mowatt 2004), which is particularly critical given the nature of the foodindustry.
Thee-business enabled supplyor commonly knownase-marketplace is becomingan increasingly popular business model for firms to source, trade and collaboratewith chain partners (Howard et al 2006, Le 2005). Our findings depict that 87% ofagri-food producers, farmers and growers were using this, arguably to diversifytheir business opportunities and enhance profitability. Such platforms allowfirms to expand globally and enter newmarkets that were previously inaccessibledue to geographical barriers (White et al 2007).
Electronic data interchange (EDI) is most used inmanufacturers and retailers with80% and 81% respectively. This computer-to-computer exchange of businessdocuments in a standard format between supply chain partners enables firms
45
Scope for Industry 4.0 in Agri-food Supply Chains
to reduce transaction costs, improve information transparency, efficiency andachieve integrated efforts (Leonard & Davis 2006, Hill & Scudder 2002). EDI inthe food industry is also known to reduce the bullwhip effect, although being acomplexandexpensive systemto implement especially formany small businesses(Vlachos 2004, Kinsey & Ashman 2000).
E-procurement technologies include e-sourcing, e-auctions and EDI to tradewith suppliers online. Our findings depict that this technology is apparent inall stages in the supply chain, and more so among packaging suppliers (80%),foodmanufacturers (91%) and logistics providers (81%). Firms can respondmoreeffectively using real-time information to meet demand patterns and supplierprices, while reducing delivery times and procurement costs (Chibani et al 2018,William 2003). Many organizations operate e-procurement in the food industry toassist with JIT strategies.
Based on our findings, we draw inference that majority of the firms in our samplehave embedded digitally supported processes and transactions for computeriza-tion and connectivity. Based on themean scores, this ismore apparent in retailers,followedby foodmanufacturers and logistics providers. Wehad expected growersand food producers to be less likely to be digitally connected owing to the natureof this industry; however, discovered that the wholesalers in our sample were theleast connected.
4.2 Visibility and transparency
The second phase of maturity in Industry 4.0 is visibility and transparency. Inthe context of supply chains, we argue that this should extend beyond B2B trans-actions and result in end-to-end visibility. The real-time capture of events fromseveral data points in the supply chain enhances visibility, based on informationavailability and quality. Schuh et al (2017) postulate that by aggregating thisinformation and a corresponding contextualization, transparency is enhancedfor faster decision-making. We identified four main types of technologies used inthe food supply chain for this phase which are primarily in the area of logisticsactivities.
Global positioning system (GPS) was found to be used by 81% of third partylogistics providers and 49% of wholesalers in our study. The use of radio signalsfrom satellites is widely implemented to manage logistics and transportationactivities. Firms can locate and monitor the direction of fleet operators and
46

4 Findings and discussion
vehicles, further allowing for optimized vehicle scheduling and routing (Theisset al 2005). This is also prevalent upstream in the food industry where foodproducers can collect data on crops, soils, environmental and climate data, andmonitor the movement of livestock in paddocks, facilitating precision agricultureand farming practice (Opara 2003). However none of the upstream players in oursample adopted this technology.
Transport management system (TMS) on the other hand, was used to a greaterextent by firms in the chain including packaging suppliers, manufacturers andretailers. As expected, a large proportion of logistics providers (81%) adoptedthis technology which is closely related with GPS. TMS optimizes distributionactivities, particularly in the area of fleet planning, truck scheduling and vehiclerouting (Pokharel 2005). The real-time information enables firms to monitorturnaround time, driver productivity and fleet utilization. It could further facilitatecross-docking in warehouses, which is highly pertinent in the food and grocerysector, where the timely flowof perishable products is critical (Apte&Viswanathan2000).
Warehousemanagement system(WMS) is alsoanother technologyadopted through-out the chain except for growers, farmers and food producers. We establish thatthe sale of agri-food products occurs almost immediately or using JIT after har-vest for optimum freshness and quality. Most growers and farmers do not haveadequate storage facilities or keep much inventory. Retailers (76%) and pack-aging suppliers (70%) adopted WMS to a greater extent given the volume andvariety of products they deal with. Surprisingly, WMS was only used in 25 outof the 63 wholesalers (40%). It equips firms with the capabilities in monitoringstock levels, the inbound and outbound flows of inventory and exact locationof items stored in the warehouse. WMS captures data on product dimensionsand characteristics to optimize warehouse space, personnel and material han-dling equipment (Patterson et al 2004). It is often interfaced with TMS, RFID andbarcoding technologies to enhance logistics operations (Mason et al 2003). Weargue that most food products tend to be highly perishable; hence their inventorymanagement is critical at all stages.
Our findings highlight that time-temperature integrators (TTI) and data loggersare being used predominantly by logistics providers (45%& 52%) andwholesalers(46%&30%). These devices or tags are placedwithin a storage container to recordthe temperature of food products throughout the distribution process. Dataare used tomonitor temperature stability, product quality or identify breachesat various points in the supply chain. This is critical for temperature sensitive
47

Scope for Industry 4.0 in Agri-food Supply Chains
or perishable food products. Such technology enables optimum quality, shelf-life and handling throughout the supply chain (Soosay 2008, Sahin et al 2007,Koutsoumanis et al 2005). However, only 7 out of 58 retailers (12%) in our samplehad adopted this technology.
Overall, information integration is required for tracking and tracing, ensuringvisibility and transparency in the chain to meet food safety and regulatory re-quirements. The mean scores shows a varied extent of visibility and transparencyamong various supply chain players. It appears that logistics providers adoptthese technologies the most, followed by wholesalers, manufacturers and re-tailers. We discern that upstream players (farmers, growers and input suppliers)tend to adopt technology to a lesser extent as compared to downstream play-ers; and that these were used mainly for internal operational efficiencies andB2B transactions. Our finding is also in line with Solanki and Brewster’s (2014 p.46) study on agri-food supply chains; where they confirm and highlight how the“flow of data is restricted based on a very conservative ‘need-to-know’ attitudesuch that information flows only ‘one up, one down’”. Moreover, due to culturalbarriers and despite technological solutions, the firms do not appear to use orintegrate data across the supply chain, “thereby greatly increasing the possibilityof interoperability issues arising between supporting applications”. Technologyshould be viewed as the key for SCM development and transformation of the foodindustry ‘from dyadic, material management oriented relationships into com-plex, collaborative, networked, web-enabled, extended architectures’ to enablevisibility, transparency and food integrity throughout the chain (Akyuz & Gursoy2013).
4.3 Predictive capability
The third phase of maturity lies in the ability of firms to use shared data fromend to end supply chain partners to prepare for future scenarios. At a networklevel, the visibility and transparency of operational data, inventory levels andproduction plans provide focal firms with relevant and real-time informationfor supply chain decision-making. Unexpected events such as the bullwhip ef-fect, forecasting errors, production variations or delays in distribution could beminimized to a large extent. These result in time-based approaches to reducecosts, waste, inventory and other supply chain inefficiencies. We identify threetypes of technologies in the food industry that are used to attain this predictivecapability.
48
4 Findings and discussion
Enterprise Resource Planning (ERP) systemswere evident in 188 firms or over halfthe sample surveyed. These consist of integratedmodules that support not onlyvarious functions within the organization, but also across supply chain opera-tions. The IT systems of suppliers and customers could be interfaced for seamlessoperations. Alongside ERP, there are alsomanufacturing execution systems (MES)used to manage factory operations and production systems. 78% of foodmanu-facturers and 75% of packaging suppliers adopted this technology. MES controlsthe movement of materials from point-to-point, assigns and schedules resources,and tracks the costs and status ofmaterials being processed (Beavers 2001). Whenproduction plans are shared with suppliers, retailers and wholesalers, the flow offood products in the supply chain could be better streamlined.
Radio Frequency Identification (RFID) technology was adopted throughout thesupply chain in our sample except for agri-food producers. RFID in food supplychains can determine the location and history of products, which help tomaintainquality and prevent breaches in food integrity (Van Der Vorst et al 2007, Opara2003). When combinedwith other technologies, RFID equips firmswith predictivecapability to achieve reliable and accurate data forecasts, reduced inventory andlabor costs (Wu et al 2006).
From the mean scores, the area of predictive capability shows a stark differencebetween the upstream and downstream activities. Manufacturers, retailers andlogistics providers generally possess the capacity to engage in big data and supplychain analytics, given the extent of technologies adopted, scale and scope of oper-ations. These firms are generally larger in size and have better resources to obtainvalue from large scale data to gain competitiveness in terms of demand volatility,cost fluctuations and inventory management. We argue that the utilization ofsupply chain analytics is still at an early stage in the food industry currently; buthas the potential to assist in strategic demand planning, sourcing, manufacturing,logistics activities, inventory management, and overall network configuration toadvance into a supply chain 4.0 continuum. The use of time temperature sensors,RFID, tracking devices and ERP systems generates big data for the supply chain,which serve as a new frontier for process improvement, demandmanagementand decision-making.
Our findings show that upstream players in the supply chain are generally laggingin this maturity stage of Industry 4.0. Hence it is proposed that the individualorientation, interoperability and capabilities of upstream players will need to bereassessed to derive a systematic plan for progression into a technology archi-tecture for the overall supply chain. Bryceson and Yaseen (2018) illustrate how
49
Scope for Industry 4.0 in Agri-food Supply Chains
various disruptive technologies have been changing the landscape of the agri-food industry including upstream farming and production activities. IoT systemsare conducive to agri-food firms in environmental monitoring, precision farming,precision livestock and cold chain logistics. For example in livestockmanagement,IoT technology coupled with RFID can be used for real-timemonitoring of cattlehealth and behavior. These authors also emphasize how big data analytics canassist businesses overcome environmental degradation, food safety and foodsecurity. Smart farming is increasingly being used with tailored seed varieties,crop nutrients, pathogenmonitoring, and improving crop yields and addressingfood safety concerns. New types of data can be used to measure biophysicalcharacteristics (such as climate, soil alkalinity, seed cultivation, fertilizer andpest control) from the paddocks and farms upstream through to food processing,facilitated storage and food retail downstream (Bryceson & Yaseen 2018). Ad-ditionally, smart packaging is gaining prominence in food supply chains today.They not only help to meet HACCP and QACCP requirements, but also detectreal-time biochemical changes occurring in the food and its environment to helpextend shelf life. Another feature of Industry 4.0 is blockchain technology whichoffers huge potential for food traceability solutions. This technology works as atechnical schema of databases which could contain information of all activities,processes and transactions in the chain forming a digital form of fingerprinting;and through interoperability mechanisms, this could ultimately provide visibilityand traceability of the product’s entire life cycle.
4.4 Adaptability and self-learning
The fourth maturity stage occurs when firms are able to take corresponding mea-sures autonomously based on shared data. According to Schuh et al (2017), thisdelegation of decisions allows for rapid adaptation to changing business en-vironments. Applied at a broader level, we establish that the combination oftechnologies achieves supply chain agility for customization and responsivenessto end consumers. We considered various supply chain strategies and classifythree initiatives for this category.
VendorManaged Inventory (VMI)was the least adopted technology in 13%of firmsonly. It was apparent mainly in manufacturers (44%) and retailers (29%). VMI is apowerful initiative based on technology integration and established transparencyand visibility. Upstream suppliers or manufacturers are authorized to monitorretailers’ real-time inventory levels and replenish accordingly (Waller et al 1999).
50
4 Findings and discussion
Its low uptake in the food industry could be attributed to the effects of inventoryholding costs or high shortage penalty costs (Ru et al 2018). Closely linked tothis initiative is efficient consumer response (ECR) applied in the food industryto alleviate supply chain inefficiencies. Once again, this was apparent mostly infoodmanufacturers (30%) and retailers (60%). This initiative requires retailersto share point-of-sales data with supply chain partners for not only better storeassortment, promotion, product development and replenishment (Harris et al1999), but also better financial and operational performance (Martens & Dooley2010).
Collaborative Planning Forecasting and Replenishment (CPFR) is another sharedIT system to project demand patterns. These were adopted by over half the re-tailers (59%), followed by manufacturers (44%) and logistics providers (28%). Byusing real-time data in the supply chain, this initiative facilitates demand fore-casting, inventory management, production and replenishment planning, andorder fulfilment (Hill et al 2018). CPFR is critical given the price points of foodcommodities, time-sensitivity, perishability and shelf-life. In this context, firmsmake autonomous decisions on a breadth of areas including timely supply, foodproduction, processing, wholesale, distribution, marketing and retail. Our find-ings suggest that these factors are highly considered by downstream players dueto their proximity and reliance on end customers and food consumers’ demandpreferences. This is further confirmed by the mean scores, showing the disparateheterogeneity in the supply chain for adaptability and self-learning. The otherstages in the supply chain (input suppliers, agri-food producers, packaging sup-pliers, logistics providers and wholesalers) had very low values for this maturitystage.
These three powerful initiatives applicable in the food industry require the es-tablishment andmastery of the first three maturity stages. This fourth maturitystage of adaptability and self-learning represents an autonomous supply chain.Characterized by robotics and automated networks, the concept of autonomouslydelivering products is becoming a reality. Heard et al (2018) claim that connectedand autonomous vehicles (CAV) will be embraced first in the food distributionindustry, given the interplay between transportation logistics, food perishabilityand cost. Enabled by logistics innovations and e-commerce, these authors statethat autonomous trucks could one day displace grocery stores, and change thebusiness model of distribution by delivering ordered foods directly to consumersinstead. Similarly, MES and ERP systems have been around for a while; and pos-sess the intelligence to organize and control manufacturing processes and jobsequencing. They mandate using appropriate technologies, achieving stream-
51
Scope for Industry 4.0 in Agri-food Supply Chains
lined visibility and transparency across supply chain partners and facilitating theautonomous and continuous adaptation to changes individually at the firm levelas well as collectively as a network of partners.
5 Conclusions
Considering an end-to-end supply chain model, we deem the autonomous sup-ply chain to be far from achievable in the food industry at this stage, given thepresence of traditional labor intensive methods in some farming and agri-foodproduction activities, especially for fresh and perishable food produce. Despitethe fragmented adoption of advance technologies at various points in the supplychain (such as in manufacturing and logistics), we establish that agri-food supplychains still have a long way in reaching this milestone for Industry 4.0. This isbecause a true autonomous supply chain does not require human intervention(River Logic 2018).
Industry 4.0 requires firms to develop agile capabilities for rapid adaptation tochanging business environments where customization and responsiveness comeinto play to fulfil end consumers’ needs. We argue that the technology infras-tructure provides integrated, empowered andmore responsive decision-making;hence enabling a new frontier for customer receptiveness andmarket changes.The evolving and dynamic nature of food consumption means that customersexpect high quality sensory properties, more variety and better food security (Cas-tro & Jaimes 2017). Additionally the perishability of food products requires moreadvanced handling, transportation and storage solutions that requires firms to beflexible, efficient and responsive. Today’s supply chain transformation involvesthe use of digital technologies, predictive analytics and artificial intelligence. Tocompete and survive, firms must embrace new business models, digital transfor-mation and interoperability aspects. With this inmind, supply chains of the futureshould be viewed as an autonomous ecosystem of firms rather than traditionallinear structures.
6 Limitations and further research
This study has several limitations, which must be taken into account when inter-preting the results and their implications. Firstly, it presents preliminary findings
52
REFERENCES
from a larger study on supply chain integration in the agri-food industry. Notwith-standing that, it extends our knowledge on the issues relating to the impact ofrelevant technologies with respect to different stages of the supply chain andtheir activities. It uncovers the breadth of technologies used and the impactsof technology interface in agri-food supply chains. Secondly, we acknowledgethe reliance on cross-sectional data, which measured technology adopted at onepoint in time that has weaknesses in establishing any causality inferences. Alsomarket factors and stakeholder pressure may differ for various food groups. Fur-ther research could bemore informative by investigating market configurationspertaining to the types of food products (e.g. fruit, vegetables, meat, seafood)and proximity of chain members to end consumers. Additionally, by employing alarger dataset, there is scope to performmeasurement invariance across supplychain nodes and/ormulti-level analyses. These could then provide better insightsinto the technology interface at specific points in value creation in the supplychain in more detail. Additionally, we recognize that our sample comprises a sig-nificant proportion (74%) of small andmedium enterprises which is characterizedby the food industry predominantly. We do not intend to generalize our findings,but highlight the vulnerability of many small businesses and up-stream playersin our sample who appear to be lagging behind in the fourth industrial revolutionas well as the disruptive changes entailed to keep up and compete in the digitalage due to their size, resource constraints, scope and scale of operations. Despitethese limitations, this paper offers discernment to supply chain researchers andpractitioners by illustrating the maturity phases of Industry 4.0 in the context ofagri-food supply chains in Australia.
References
Akyuz, G. A. andG. Gursoy (2013). “Paradigm shift in supply chainmanagement (SCM)”. In: Proceed-ings of the international annual conference of the American Society for Engineering Management2013. ASEM 2013, pp. 291–302.
Albert, L. (2017). “Industry 4.0 and the Transformation of the Supply Chain”.Alicke, K., D. Rexhausen, and A. Seyfert (May 2017). “Supply chain 4.0 in consumer goods”. In:
McKinseny and Company 15, p. 2018.Apte, U. M. and S. Viswanathan (2000). “Effective cross docking for improving distribution efficien-
cies”. In: International journal of logistics: Research and applications 3.3, pp. 291–302.Aydin, A. and R. Parker (2018). “Innovation and technology diffusion in competitive supply chains”.
In: European journal of operational research 265, pp. 1102–1114.Beavers, A. N. (2001). Roadmap to the e-factory. United States: CRC Press.
53
Scope for Industry 4.0 in Agri-food Supply Chains
Bhatt, J., M. Gooch, B. Dent, and G. Sylvia (2017). “Implementing interoperability in the seafoodindustry: Learning from experiences in other sectors”. In: Journal of food science 82, A22–A44.
Bollen, F., C. Kissling, J. P. Emond, R. Crompton, C. Nunes, A. Metz, K. Duval, M. Laniel, and J. Ye(2004). Sea and air container track and trace technologies: Analysis and case studies. Lincolnventures limited supply chain systems research, New Zealand: APEC project.
Bryceson,K. P. andA. Yaseen (2018). “Smart technologies: Disruptive technologies and theagrifoodindustry – fit for practice?” In: E-business and supply chain integration: Strategies and casestudies from industry, ed. by O. Bak. Kogan Page, pp. 27–50.
Castro, J. A. O. andW. A. Jaimes (2017). “Dynamic impact of the structure of the supply chain of per-ishable foods on logistics performance and food security”. In: Journal of industrial engineeringandmanagement 10.4, pp. 687–710.
Chen, Q. and H. M. Chen (2004). “Exploring the success factors of eCRM strategies in practice”. In:Database marketing and customer strategy management 11.4, pp. 333–343.
Chibani, A., X. Delorme, A. Dolgui, and H. Pierreval (2018). Dynamic optimisation for highly agilesupply chains in e-procurement context. International journal of production research, In Press.
Corrado, C., F. Antonucci, F. Pallottino, J. Aguzzi, D. Sarria, and P. Menesatti (2012). “A reviewon agri-food supply chain traceability by means of RFID technology”. In: Food and bioprocesstechnology 6.2, pp. 353–366.
Cox,H. andS.Mowatt (2004). “Consumer-driven innovationnetworks ande-businessmanagementsystems”. In: Qualitative market research: An international journal 7.1, pp. 9–19.
Harris, J. K., P. M. C. Swatman, and S. Kurnia (1999). “Efficient consumer response (ECR): A surveyof the Australian grocery industry”. In: Supply chain management: An international journal 4.1,pp. 35–42.
Heard, B. R., M. Taiebat, M. Xu, and S. A. Miller (2018). “Sustainability implications of connectedand autonomous vehicles for the food supply chain”. In: Resources, conservation and recycling128, pp. 22–24.
Hill, C. A. and G. D. Scudder (2002). “The use of electronic data interchange for supply chaincoordination in the food industry”. In: Journal of operations management 20.4, pp. 375–387.
Hill, C. A., G. P. Zhang, and K. E. Miller (2018). “Collaborative planning, forecasting and replenish-ment and firm performance: An empirical evaluation”. In: International journal of productioneconomics 196, pp. 12–23.
Howard, M., R. Vidgen, and P. Powell (2006). “Automotive e-hubs: Exploring motivations andbarriers to collaboration and interaction”. In: Journal of strategic information systems 15.1,pp. 51–75.
Inc., R. L. (Aug. 2018). “The autonomous supply chain: Possible or impossible?” In: The River LogicBlog 17, p. 2017.
Johnston, H. R. and M. R. Vitale (1988). “Creating competitive advantage with inter-organizationalsystems”. In:MIS quarterly 12.2, pp. 153–165.
Kim, D., R. J. B. Jean, and R. R. Sinkovics (2018). “Drivers of virtual interfirm integration and itsimpact on performance in international customer-supplier relationships”. In: Managementinternational review, pp, pp. 1–28.
Kim, H. J. (2017). “Information technology and firm performance: the role of supply chain integra-tion”. In: Operations management research 10.1, pp. 1–9.
Kinsey, J. andS. Ashman (2000). “Information technology in the retail food industry”. In:Technologyin society 22.2, pp. 83–96.
54

REFERENCES
Klitou, F., J. Conrads, M. Rasmussen, L. Probst, and B. Pedersen (June 2017). “Germany: Industrie4.0”. In: European Commission, European Union 17, p. 2018.
Koutsoumanis, K., P. S. Taoukis, and G. J. E. Nychas (2005). “Development of a safety monitoringand assurance system for chilled food products”. In: International journal of foodmicrobiology100.1, pp. 253–260.
Krishnan, V., O. Mnyshenko, and H. Shin (2015). “Inclusive innovation: Broader market coveragefor innovative products with deliberate supply chain leadership”. San Diego: University ofCalifornia. Working paper.
Le, T. (2005). “Business-to-business electronic marketplaces: Evolving business models and com-petitive landscapes”. In: International journal of services technology and management 6.1,pp. 40–53.
Lee, K. L., Z. M. Udin, and M. G. Hassan (2014). “Supply chain technology adoption: Its clarification,evolution, classificationandparticularly in textile andapparel industry”. In: International journalof business and economics research 3.6, pp. 15–21.
Leonard, L. N. K. and C. C. Davis (2006). “Supply chain replenishment: before-and-after EDI imple-mentation”. In: Supply chain management: An international journal 11.3, pp. 225–235.
Martens, B. J. and F. J. Dooley (2010). “Food and grocery supply chains: A reappraisal of ECRperformance”. In: International journal of physical distribution and logistics management 40.7,pp. 534–549.
Mason, S. J., P. M. Ribera, J. A. Farris, and R. G. Kirk (2003). “Integrating the warehouse andtransportation functions of the supply chains”. In: Transportation research 39.2, pp. 141–159.
McLaren, T., M. Head, and Y. Yuan (2002). “Supply chain collaboration alternatives: Understandingthe expected costs and benefits”. In: Internet research: Electronic networking applications andpolicy 12.4, pp. 348–364.
Mussomeli, A., D. Gish, and S. Laaper (May 2017). “The rise of the digital supply network”. In: SupplyChain, Deloitte [online] < [accessed 15, p. 2108.
O’Byrne, R. (May 2017). “6 Key supply chain and logistics trends to watch in 2017”. In: LogisticsBureau 15, p. 2018.
Opara, L. U. (2003). “Traceability in agriculture and food supply chain: A review of basic concepts,technological implications, and future prospects”. In: Food, agriculture and environment 1.1,pp. 101–106.
Patterson, K. A., C. M. Grimm, and T. M. Corsi (2004). “Diffusion of supply chain technologies”. In:Transportation journal 43.30, pp. 5–23.
Pokharel, S. (2005). “Perception on information and communication technology perspectivesin logistics: A study of transportation and warehouses sector in Singapore”. In: The journal ofenterprise informationmanagement 18.2, pp. 136–149.
Ramamurthy, K. and G. Premkumar (1995). “Determinants and outcomes of electronic data inter-change diffusion”. In: IEEE Transactions on engineering management 42.4, pp. 332–351.
Roblek, V., M. Mesko, and A. Krapez (2016). “A complex view of Industry 4.0, SAGE Open”. In: p,pp. 1–11.
Ru, J., R. Shi, and J. Zhang (2018). “When does a supply chain member benefit from vendor-managed inventory?” In: Production and operations management 27.5, pp. 807–821.
Sahin, E.,M. Z.Babai, andY.Dallery (2007). “Ensuring supply chain safety through time temperatureintegrators”. In: The international journal of logistics management 18.1, pp. 102–124.
Salin, V. (1998). “Information technology in agri-food supply chains”. In: International food andagribusiness management review 1.3, pp. 329–334.
55
Scope for Industry 4.0 in Agri-food Supply Chains
Santos, C., A.Mehrsai, A. C. Barros,M. Araujo, andE. Ares (2017). “Towards Industry 4.0: anoverviewof European strategic roadmaps”. In: Procedia manufacturing 13, pp. 972–979.
Schrauf, S. and P. Berttram (May 2016). “Industry 4.0: How digitization makes the supply chainmore efficient, agile and customer focused”. In: Strategy [online] < [accessed 15, p. 2018.
Schuh, G., R. Anderl, J. Gausemeir, M. T. Hompel, andW. Wahlster (2017). Industrie 4.0 maturityindex: Managing the digital transformation of companies. Acatech Study, Munich: Herbert UtzVerlag.
Solanki, M. and C. Brewster (2014). “Enhancing visibility in EPCIS governing agri-food supplychains via linked pedigrees”. In: International journal on semantic web and information systems10.3, pp. 45–73.
Soosay, C. (2008). “Operational issues and challenges in cold chain logistics management”. In:Proceedings of the 6th Australia andNewZealand Academy ofManagement: Operations. Queens-land, Australia: supply chain and services management symposium, pp. 1–14.
Theiss, A., D. C. Yen, and C. Y. Ku (2005). “Global positioning systems: An analysis of applications,current development and future implementations”. In: Computer standards and interfaces 27.2,pp. 89–100.
Vlachos, I. P. (2004). “Adoption of electronic data interchange by agribusiness organizations”. In:Journal of international food and agribusiness marketing 16.1, pp. 19–42.
Vorst, V. D. and D. S. J. G. A. J. (n.d.). “C.A. and Trienekens, J.H”. In: 2007 ().Waller, M., E. M. Johnson, and T. Davis (1999). “Vendor managed inventory in the retail supply
chain”. In: Journal of business logistics 45.1, pp. 63–68.White, A., E. Daniel, J.Ward, andH.Wilson (2007). “The adoption of consortiumB2B e-marketplace:
An exploratory study”. In: The journal of strategic information systems 16.1, pp. 71–102.William, D. P. J. (2003). “Supply management and e-procurement: Creating value added in the
supply chain”. In: Industrial marketing management 32.3, pp. 219–226.Wu, N. C., M. A. Nystrom, T. R. Lin, and H. C. Yu (2006). “Challenges to global RFID adoption”. In:
Technovation 26.12, pp. 1317–1323.Xu, S., K. Zhu, and J. L. Gibbs (2004). “Global technology, local adoption: A cross-country investiga-
tion of internet adoption by companies in the United States and China”. In: Electronic markets14.1, pp. 13–24.
Zhu, K., K. L. Kraemer, and S. Xu. (2003). “E-business adoption by European firms: A cross countryassessment of the facilitators and inhibitors”. In: European journal of information systems 12.4,pp. 251–277.
56
Advanced Scientific Algorithms inDigital Factory Design Applications
Jacob Lohmer1, Armin Klausnitzer1, Rainer Lasch1
1 – Technische Universität Dresden
In contrast to manual procedures, research constantly develops modern comput-erized factory design approaches applying concepts of Industry 4.0. Nevertheless,literature hardly reveals their practical application. A market review analyzingrecent software applications shows that they still focus on simple and outdated al-gorithms, resulting in limited support for facility arrangement. This study furtheranalyzes the use of scientific approaches implemented in software applicationsfor factory design and suggests new research directions to increase their practicalapplicability. Therefore, we conducted a semi-structured interview study investi-gating four layout design software developers. Applying an iterative approach,semi-structured and guided interviews were performed, coded, grouped into cat-egories referring to similar phenomena, and interpreted to provide proposals forfuture research. The results indicate that innovative, automated methods aremet with skepticism, although their performance is considerably superior to tradi-tional approaches. The interviewed developers for factory design software revealcertain features they expect frommodern approaches emerging from research toensure successful implementation.
Keywords: Factory layout design; Software applications; Metaheuristics; Inter-view study
First recieved: 28.May.2018 Revised: 22.Jun.2018 Accepted: 05.Jul.2018
57
Advanced Scientific Algorithms in Digital Factory Design Applications
1 Introduction
Manufacturing companies are constantly faced with major challenges shapingtheir requirements for success, such as new production technologies, shorterproduct life cycles, as well as frequent changes inmarket dynamics. Certain situa-tionsmay compel companies tomakemajor changes to theirmanufacturing sites,affecting the arrangement of facilities and equipment in the plants. This commonproblem is referred to as the ”facility layout problem” (FLP) in literature. There issubstantial prior research starting from the 1960s (Anjos and Vieira, 2007).
During the last decades, a trend towards metaheuristics and algorithm-basedoptimizationof thearrangementproblemhasevolved (Ahmadi et al., 2017). Never-theless, the practical application of scientific methods, particularly their softwareimplementation, within design projects is scarcely mentioned. However, in thecontext of Industry 4.0 and Smart Manufacturing, advanced software applicationsare gaining importance throughout all subject areas in manufacturing companiesand constitute a worthy area for optimization and further research (Bracht et al.,2018).
In a recent paper, Klausnitzer et al. (2017) conducted a case study to investigatethe application of scientific algorithmic methods in practice. Users of softwareapplications, consulting engineers in this case, and a scientific institute special-ized in factory design were interviewed. Their key findings are that advancedmathematicalmethods are not applied to factory design projects due to the users’unawareness of extant superior methods and lack of algorithmic support regard-ing the applied software solutions. These findings add impetus to the research ofthis paper.
Whereas Klausnitzer et al. (2017) focused on users of factory design applications,we suggest that investigating developers of factory design applications mightproduce interesting findings. It can be safely presumed that the developers ofsoftware applications in digital factory design have a profound knowledge ofmethods and trends in their field of interest and have a high affinity for scientificmethods. To the best of our knowledge, there is no empirical research on theapproach applied by software engineers to develop the applications aswell as theimpact of scientific research on these development procedures. Furthermore, theevolving trend towardsmetaheuristics has produced various scientific algorithmsfor the FLP that produce promising results but little is known about the valuethe software developers for factory design applications give these algorithms.
58
2 State of Research
Therefore, this paper aims to answer the following research questions using amarket review followed by amultiple semi-structured interview study:
- How domodern software applications methodically support the factory designprocess?
- How does scientific research affect developers of those applications?
- Why are advanced scientific algorithms adopted by software developers forfactory design?
Our contribution is two-fold: From a theoretical standpoint, we provide insightsfrom practice, in particular the needs and wishes that software developers haveregarding scientific methods to encourage their implementation in factory designapplications. Researchers are able to focus on specific aspects that will maketheir methods usable outside of the field of research. From a practical stand-point, we aggregate the recent developments in science and highlight importantfuture developments as noted by leading representatives of software developingcompanies.
The remainder of this paper is organized as follows. Section 2 provides a briefoverview of the literature concerning solution methods for the facility arrange-mentanddigital factorydesignapplications. Section3describes themethodologyadopted for the empirical research. Section 4 presents the findings from the mar-ket review aswell as the interview study. Section 5 provides recommendations forpractice, section 6 our conclusions. The limitations of the study and opportunitiesfor future research are discussed in section 7.
2 State of Research
The basic process of factory design as defined in VDI (2011) or Grundig (2015)consists of the following planning phases: Target planning, concept planning,detailed planning, execution planning, and implementation. A large amount ofresearchconsidering theFLP focuseson theconceptanddetailedplanningphases,where several layout variants are generated tominimize thematerial handlingeffort as a function of travel distances. The first steps include determining thefunctions of facilities, dimensioning of required areas, and the arrangement ofthe facilities within the area. Subsequently, the block layout variants need to berefinedwith real life requirements considering structural conditions like walls and
59
Advanced Scientific Algorithms in Digital Factory Design Applications
pillars, as well as ergonomic and logistic requirements. Favored layout variantsare then designed according to specific conditions and restrictions such as facilitydetails and orientation.
The step of arranging the facilities can be reduced to an algorithmic process thatsolves an optimization problem as it depends on material flow intensities andcloseness ratings (Drira et al., 2007; Tompkins et al., 2010). Popular proceduralapproaches for factory planning and solving the FLP (e.g. Schenk et al., 2014;Grundig, 2015) still focus on outdated and simple algorithmic methods, such astheapproachesof Schwerdtfeger (Kettner et al., 1984) andSchmigalla (Schmigalla,1968). These methods illustrate flow relationships between functional areas toarrange them according to a determined pattern. Specific facility areas and real-life requirementsare taken intoaccount subsequently. The solutionquality largelydepends on the experience of the layout planner as well as trial-and-error.
Other approaches to solve the FLP aremathematicalmethods that lead to optimalsolutions. However, the FLP is known to be NP-hard (Garey and Johnson, 1979),resulting in computational intractability for most of the practical problems, dueto the large number of facilities to be arranged. This led to the emergence ofheuristics and, more recently, metaheuristics, such as genetic algorithms, tabusearches, or simulated annealing. They are suitable for large problems that canbe solved in a short time with solution qualities near the optimum, although theoptimum cannot be guaranteed (Drira et al., 2007). In contrast to the traditionalmethods, modern approaches consider a variety of requirements like area con-straints, material handling points, path design, andmultiple floors in one singlestep. A concurrent approach to the arrangement of facilities and the design ofreal life requirements can significantly improve the quality of the layout solutionsand the productivity of the user. Within a short time, several layout variants canbe generated and evaluated without the follow-up work or a costly replanning ofinfeasible layouts obtained during a sequential process.
To support the design process for the FLP there are several factory design softwareapplications. The selection of the suitable software application depends on thespecific problems, data, information and defined goals (Schenk et al., 2014). Inthe context of Industry 4.0/Smart Manufacturing, advanced applications support-ing the ”digital factory” are entering the market. Digital factory is a network ofdigital models, methods, and tools integrating a continuous data managementsystem that aims for holistic planning, evaluation, and improvement of structures,processes, and resources of a factory.
60
2 State of Research
It allows for collaborative planning to consider the experience of various users,which further contributes to an improvement of solution quality and approval(VDI, 2008). The digital factory applications can be categorized into three maingroups that are briefly presented in the following:
Tools for visualization: CAD (Computer Aided Design) tools are used to visualizefacility layouts and draft well-detailed drawings that are easy to create and tochange in a short time. CAD tools are widely utilized in all kinds of manufacturingcompanies worldwide. However, standard applications like AutoCAD rarely pro-vide scientific methods to support the layout design procedure (Grundig, 2015).
Simulation tools: Simulation tools are used to study the dynamic interrelationsof manufacturing systems. Themanufacturing system can be optimized by cre-ating and analyzing different variants to select the best alternative (Arnold andFurmans, 2009). In recent years, CAD tools have been coupled with simulationtools to create layouts based on CAD data directly using standard 3D components.The complexity of the software applications and the needed expertise to generatea coherent representation of the real process flow from a static visualization is stillone of the main challenges of simulative factory design (Schenk et al., 2014).
Virtual reality tools: Intuitive applications like virtual reality and augmentedreality tools are receiving an increased interest regarding layout design. They areable to construct a direct or indirect view of real-world environments augmentedwith additional haptic or visual information (Schenk et al., 2014). 3Dmodelingand optimization of whole factory floors is simplified. So called ”participativeplanning tools” combine two-dimensional representations as in CAD tools withthree-dimensional representations for a better visual experience and cooperativecollaboration in project teams. In addition, users are provided with evaluationand optimization components (Jiang and Nee, 2013).
In summary, new and innovative mathematical methods like metaheuristics poseseveral improvements and advantages over more simplistic methods from ascientific perspective. They are able to solve large problems quickly with solutionqualities near the optimum and concurrently integrate several design aspectsthat have been solved in a sequential process so far. However, the softwareapplications are still focusing on features that support themanual design processwithout the use of advanced algorithms. This gapmotivates the investigation ofthe development procedures of software applications, the underlying intentions,used scientific methods and the assumed but unclear scientific impact on theprocedures.
61
Advanced Scientific Algorithms in Digital Factory Design Applications
3 Research Methodology
As there is no comparable research so far, we used an approach of rather explo-rative nature. First, we conducted a market review to identify promising softwareapplications for facility layout design that use scientific methods to arrange facili-ties in the manufacturing sites. Therefore, a systematic search was conductedusing web databases, project descriptions and scientific articles. We then classi-fied the identified software applications after a thorough review and analysis (seesection 4).
Second, we conducted amultiple semi-structured interview study with expertsfromasubsetof the identified softwareengineeringcompanies. Thesemi-structuredinterview design allows flexibility to adapt to specific but initially unknown cir-cumstances in practice (Yin, 2009). To analyze a representative sample of casesfor the area of interest, the concept of theoretical sampling was used (Eisenhardtand Graebner, 2007). Therefore, four software engineering companies took partin the interview study. The cases develop and distribute software applicationswith implemented scientific methods, especially in factory design. Although thenumber of interviews is relatively small, in the limited field of facility design soft-ware solutions the selected cases and the findings are representative and can betheoretically generalized (Meredith, 1998). The organizational characteristics ofthe examined software companies are shown in Table 1.
CasesA, BandC represent softwareengineering companiesof different size. CasesA and B are small companies operating in Germany with less than 15 employees.In contrast, case C constitutes a large companywith headquarters in Germany andtheUSAandemployingover 9,000people. Inorder to investigate the layoutdesignmethods applied by a scientific organization, we also interviewed an instituteof a university (case D). The interview partner of case D has developed a designsoftware application and distributes it as a freelancer.
62
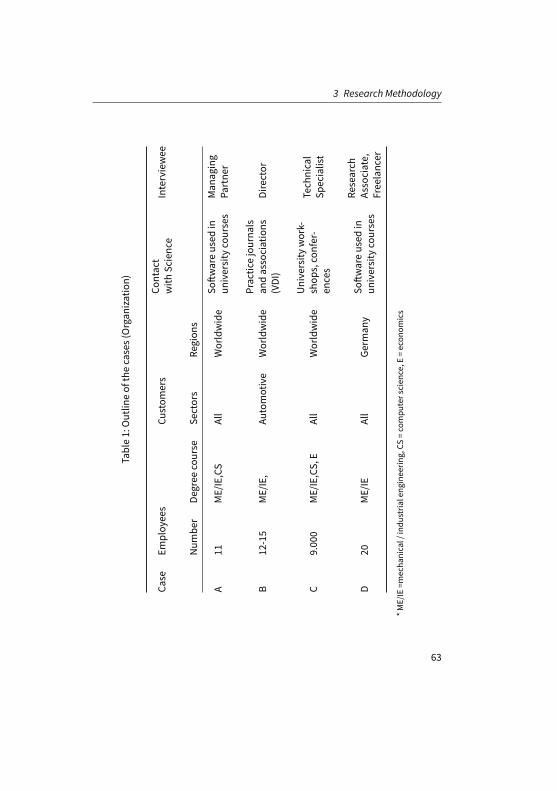
3 Research Methodology
Table1:Outlin
eof
thecases(Organ
ization)
Case
Employ
ees
Custom
ers
Contact
with
Science
Interviewee
Num
ber
Degree
course
Sectors
Region
s
A11
ME/IE,CS
All
Worldwide
Softw
areused
inun
iversity
courses
Man
aging
Partne
r
B12
-15
ME/IE,
Automotive
Worldwide
Practic
ejourna
lsan
dassociations
(VDI)
Director
C9.00
0ME/IE,CS,E
All
Worldwide
University
work-
shop
s,confer-
ences
Tech
nical
Specialist
D20
ME/IE
All
Germ
any
Softw
areused
inun
iversity
courses
Research
Associate,
Free
lancer
*ME/IE=m
echa
nical/
indu
stria
leng
ineerin
g,CS
=compu
terscien
ce,E
=econ
omics
63
Advanced Scientific Algorithms in Digital Factory Design Applications
Besides the distribution of software, all cases provide workshops and trainingcourses to teach their customers as well as consulting services around layoutdesign. The interviewed cases employ a highly skilled workforce with universitydegrees mainly in the fields of mechanical and industrial engineering. The cus-tomers of cases A to D operate in all sectors and industries around the world,thoughmost are manufacturing companies. A comparison of project figures iscomplex since all cases stated that project durations andbudgets differ dependingon the specific customer needs. However,most projects rangebetweena fewdaysfor basic training workshops to about threemonths for additional consultancyandmay be extended by several months for major planning support.
Only case A actively cooperates with universities and scientific institutions regard-ing facility design projects. The interview partner of case B sporadically readsjournals and uses the mutual exchange of information in associations like theVerein Deutscher Ingenieure (VDI) to stay up-to-date. There is no active collabo-ration considering the development of the software application with scientificinstitutions. This also applies for case C. Nevertheless, the interview partner takespart in workshops at universities and is a speaker at certain professional events.The academic institution of case D collaborates with colleagues from the sameuniversity in projects where they often utilize the software application. Furtherfeedback comes from several other universities that use the software applicationfor teaching and project purposes.
After the investigation of general characteristics, we applied an iterative approachfor data collection, coding, and analysis (Eisenhardt, 1989). For preparation pur-poses and the appropriate selection of interview partners in the case companies,we provided the interview partners with a questionnaire prior to the interview asan extract from the guidance document. During the interview, we used the guid-ance document to focus on all relevant aspects. The data from the transcribedinterviews was coded using MAXQDA 2018 to detect important aspects from thetranscript.
All statements were grouped into categories referring to similar phenomena. Ac-cording to a deductive-inductive approach, main categories were establishedprior to the interviewswhereas subcategories were created from the investigationof the first transcript. In a first step, the text passages were grouped into themain categories. Organizational aspects like staff structure, company size, andcustomer features were grouped in ”Organization”. The second main category”Software” covered aspects like application range and development procedures.
64
4 Findings
”Layout Planning” included the implemented scientificmethods for facility designand all comments regarding advancedmathematical methods.
The ”Link to Science”was further analyzed in a fourthmain category including theinformation approach towards current development and an assessment of themutual exchange with scientific institutions. After the inductive determination ofthe subcategories, thewhole documentwas grouped according to a differentiatedsystem of categories (Kuckartz, 2014).
The analysis was carried out case-by-case first and completed with a comparativeanalysis. The resulting conceptual model represents a common understanding ofphenomena regarding the cases. In addition to the interviews, we used companywebsites and providedmaterial by the interview partners (brochures) to triangu-late the interview data. The final reports were sent to the interview partners forvalidation purposes and to maintain participant engagement.
4 Findings
4.1 Market review on software applications
Table 2 illustrates the identified software applications and respective methods,features, and limitations. The software applications were then grouped intofour categories and visualized in Figure 1. The two aspects of interest for thisclassification are the degree of integration of all planning tasks into the basicplanning process of factory design (e.g. VDI, 2011) and the provided scope offunctionalities for the arrangement of objects in the factory layout.
65

Advanced Scientific Algorithms in Digital Factory Design Applications
Table2:Iden
tifiedsoftw
areap
plications
andtheirrespe
ctivescientificmetho
ds,features,an
dlim
itatio
ns
Tool
Scientific
metho
dforfa-
cilityde
sign
Features
Limita
tions
AutoCA
Dno
ne
Widelyused
inthein-
dustry;ena
bles
adigital
represen
tatio
nof
possi-
blerealworld
system
s
Onlysupp
ortstrial-a
nd-er-
rorfor
facilityarrang
e-men
twith
outa
nyqu
anti-
fiedevalua
tion
G-MAF
LAD
Bran
ch-and
-Bo
und(exact)
Considersfacility
di-
men
sion
sfor
afirst
bloc
klayo
utvaria
nt
Usersne
edto
prov
idecer-
tain
feasiblearrang
emen
tsitesfor
each
facility;no
materialp
aths
considered
;lim
itedim
port/exp
ortfea-
tures
FACO
PT
Simulated
An-
nealing/G
e-ne
ticAlgo
-rithm
Considersfacility
and
factory(in
cl.g
ates)d
i-men
sion
sfor
afirst
bloc
klayo
utvaria
nt
Prov
ides
bloc
klayo
uts
with
outcon
side
ringmate-
rialp
aths
orreallifere-
quire
men
ts;n
otcommer-
ciallyavailable
VIP-
PLAN
OPT
Simulated
An-
nealing+
LocalSearch
Considersfacility
di-
men
sion
s;extensive
configurationop
tions
(dim
ension
s,shap
efle
x-ibility,factory
floor)
Considersp
rede
fined
ma-
teria
lpaths
viabloc
kedar-
easinthelayo
ut;scien
tific
metho
dno
tfullydisclosed
66

4 Findings
SIMOGG
AGe
netic
Algo
rithm
Considersv
arious
inpu
tda
ta(fa
ctoryflo
or,m
a-teria
lpaths,facility
di-
men
sion
s)
Onlyusab
leforcellular
layo
utsw
ithredu
ndan
tre-
sources;ne
edsa
ninitial
solutio
nto
startu
pon
MAL
AGA
Gree
dyHeu
ristic
Integrated
plan
tmod
el;
conn
ectio
nto
simula-
tionsoftw
are(Plant
Simulationby
Siem
ens)
Facilitydimen
sion
sne-
glectedforfirststeps
offactoryde
sign
,dim
ension
sne
edto
beman
ually
ap-
pliedsubseq
uently
Tecn
omatix
FactoryDe
-sign
Grap
hical
Metho
d
Conn
ectio
nto
vario
usrelatedsoftw
aremod
-ules
(Plant
Simulation
bySiem
ens)
Nee
dsan
initialsolutio
nto
startw
ithan
optim
ization;
noconsiderationof
mate-
rialp
aths
andinpu
t/ou
t-pu
tpoints
Sketch
Up
MF-VO
Grap
hical
Metho
d
Plug
infor3
Dsoftw
are
”SketchU
p”;p
resenta-
tion,
analysis,and
opti-
mizationof
material
flow;con
side
rspa
ths
Solutio
nmetho
dprov
ides
recommen
datio
nsfora
r-rang
emen
ttha
tnee
dto
beap
pliedman
ually
visTA-
BLE®touc
hGree
dyHeu
ristic
Combine
dtool
forv
isu-
alizationan
dlayo
utde
-sign
;con
side
rspa
ths;
quan
tifiedevalua
tion
Solutio
nmetho
dprov
ides
recommen
datio
nsfora
r-rang
emen
ttha
tnee
dto
beap
pliedman
ually
67
Advanced Scientific Algorithms in Digital Factory Design Applications
Although three identified applications used metaheuristics to arrange objectsin the factory layout (VIP-PLANOPT, FACOPT and SIMOGGA), these applicationsare unable to connect with other commercial applications and therefore cannotbe widely used. They only offer partial support for the factory design phasesproviding first block layout variants that need further fine-tuning, and were there-fore entitled ’specific tools’ in Figure 1. Comprehensive tools with a modern,user-friendly graphical user interfaces like visTABLE®touch or the SketchUpMF-VOPlugin still use simple but outdated methods, such as the method by Schmigalla(1968) or the method by Schwerdtfeger (Kettner et al., 1984).
4.2 Interview Study
Cases A, B, and D provide a single software application while case C providesseveral applications specified for different sectors. The mechanisms that ledto the development of the software applications are similar in all cases. At thetime of development, no product was available on the market which offered thefunctionalities that the interview partners needed for their projects. This led toin-house developments of software applications appropriate for the specified de-sign projects after which cases A to D started offering their applications for sale toother engineering companies. The software was then increasingly enhanced in or-der to improve customer-orientation and user-friendliness. However, hardly anydevelopments considering advanced scientific algorithmswere adopted fromcon-temporary scientific contributions. On the contrary, it is apparent that softwaredevelopers are familiar with the general layout planning procedure of dividingthe design task into several feasible smaller design steps (e.g. Schenk, 2014;Klausnitzer et al., 2017).
All cases use simple methods in their software applications to arrange objectsin the sites. Case A uses greedy heuristics (related to the method by Schmigalla(1968) and the method by Martin (1976)) to optimize existing or initial layouts.Case B uses a modified approach of the method by Schmigalla (1968), while caseC is currently testing an algorithm for a generative design of layout variants togenerate a feasible layout variant. Case D uses the graphical method by Schwerdt-feger (Kettner et al., 1984) to arrange facilities. The interviewees are consistent intheir skepticism towards the use of modern algorithmic approaches and statedthat advanced algorithmic approaches are too difficult to apply in factory lay-out design. Moreover, the additional effort of implementing and applying themetaheuristics in comparison to simple heuristics does not represent a favorable
68

4 Findings
Comprehensive
tools
DetailedplanningConcept planningTarget
planning
Functional scope
FACOPT
G-MAFLAD
Tecnomatix Factory Design
VIP-PLANOPT
Imple-
mentation
Project phase
• arrangement
of facilities
• design real life
requirements• 3D visualization
SIMOGGA
visTable®touch
SketchUp MF-VO
MALAGA
AutoCAD / FactoryCAD
Integrated
tools
Specific
tools
Viewer
• dimen-
sioning• functional
determination
Execution
planning
Figure 1: Classification of reviewed software applications for facility layout plan-ning
cost-benefit ratio. Interviewees A and D further criticize that metaheuristics stillonly produce an initial solution for the layout problem. This solution has to besubsequently adjusted to real life requirements that were not considered by thealgorithm.
The general skepticism about novel approaches suggests a lack of knowledgeconsidering the existence of advanced algorithms. In all cases, the employeesare usually mechanical and computer engineers. Advanced algorithms regardingthe FLP as a long-time challenging discipline of operations research are usuallynot focused on these fields of study. Therefore, the interviewees are not aware ofthe considerable benefit in the quality of the layout solution and the potential ofoptimization of the overall planning. Since the traditional planning proceduresuggests a top-down approachwhere restrictions are considered step by step, theplanning process might run up against infeasible intermediate layout solutions
69
Advanced Scientific Algorithms in Digital Factory Design Applications
several times that requiremultiple setbacks and replications of previous planningphases. In contrast, advanced computer supported layout design approachescan integrate several design elements and restrictions simultaneously within asingle planning step. This leads to feasible layouts with respect to the consideredrestrictions and planning details. If such an algorithm is implemented within asoftware application, it is able to produce several layout variants within a fewminutes that can be qualitatively and quantitatively evaluated andmodified bythe user. As discovered in this study, current software applications often onlyautomate the relative arrangement of facilities using the approaches of Martin(1976) and Schmigalla (1968). Both approaches do not consider any restrictions,not even the areas of facilities and the planning areas. Therefore, solutions ob-tained with current applications frequently get stuck in infeasible intermediatesolutions that require time-consuming replanning.
As regards the scientific education and the lack of implementability of advancedmethods, interviewees A and C noted that the general quality of education has de-creasedand that it is difficult to findqualified employees capable of implementingadvanced algorithms. This is enormously important for software developers likecases A to D since the software as well as the algorithms evolve continuously ac-cording to the design tasks. Moreover, interviewee B noted that there is a generallack of time to proactively enhance the software application. All interviewees arestill occupied by the daily business of layout design projects due to their originsas software providers.
With regard to the customer’s capabilities in factory design and planning, allinterviewees are consistent in their observation that themajority of customers donot grasp the relevance of factory design. Particularly interviewees B and C notedthat the customers are not aware of the overarching objective of minimizing thematerial handling effort in the layout design as a considerable contribution forlong-term efficiency and success.
Instead, objectives like a resemblance to existing testimonial factory layouts orlow alteration costs are prioritized, resulting in low layout performance and a re-design early on. In addition, only a few users of software applications use factorydesignmethods correctly and consistently due to a lack of expertise and constanttime pressure in the planning process. This difficulty could also be overcomeby the use of advanced approaches in software applications for digital factorydesign. Interviewee A believes that with new Big Data analytics there is an oppor-tunity to gain a deeper understanding of the impact of factory designmethods ondecisionmakers. Interviewee D foresees a shifting focus from simulation to Big
70
5 Recommendations for Practice
Data applications. The digital factory and the associated trend towards constantredesigns caused by the volatile markets, new technologies, and changing legalconditions must therefore trigger a rethinking of the users towards a consistentand transparent planning approach.
Moreover, interviewee B sees a nascent conflict between the planning depart-ment and the IT department. An adoption of advanced algorithms that integratedesign aspects of several planning phases would result in major changes in thewell-established planning procedure in all cases. Thus, the IT department is in-creasingly seizing more planning responsibility and decision-making power fromthe factory designers. Additionally, all interviewees hinted that layout designerswant a transparent and comprehensive layout planning procedure. They areskeptical about layout solutions that are generated automatically by pushing abutton. These statements can be summarized as general acceptance problemsconcerning advanced algorithms.
Despite the general wariness about advanced layout design approaches, particu-larly interviewees A and B showed strong interest in these methods and in a closecooperation with specialized scientific institutes. Especially interviewees A andC assume that metaheuristic solutions will play a greater role in future develop-ments, which is closely related to the further increasing computing capacity.
5 Recommendations for Practice
As a result of the conducted study, it is clear that the software developers arecurrently not focusing on advanced algorithmic approaches. They are not awareof their existence, possible benefits and implementation and showed therefore ageneral suspicion. A closer collaboration with universities would pave a directway for the implementation of promising methods and would facilitate superiorsoftware applications. Therefore, scientific institutions like universities havethe task to change and modernize their factory design courses. They shouldenhance the strong engineering view with findings from operations research thathas focused on the layout design problem for more than 60 years as a separatestream of research (Koopmans and Beckmann, 1957). Students need to be betterprepared for the future challenges of factory design resulting from digitization.This includes training in software applications in support of the entire planningprocess. Additionally, the focus should shift from CAD systems to specialized
71
Advanced Scientific Algorithms in Digital Factory Design Applications
factory design applications that consider the overall production planning processand the connected logistic processes.
Software providers often serve as consultants in layout design projects and there-fore focus on employees with engineering skills. They should also consider em-ploying specialists skilled in operations research to continuously develop thedesign software and to implement advanced approaches.
In order to solve the acceptance problems, interviewees A, B, and D noted thatautomated layout design solutions could be valuable if they are used for orienta-tion purposes and in comparison to manually designed layout solutions. Hence,the customers’ acceptance will increase and advanced scientific methods can bepositioned andmarketed as a key feature of the software application. IntervieweeC states that a complete replacement of previous simple, greedy methods bymetaheuristics is conceivable. Moreover, interviewee C noted that software solu-tions are generally acceptable if they are user-friendly without time-consumingtraining and difficult settings.
Interviewee B further recommends well-prepared key users for the usage of ad-vanced solutions in software to ensure a correct use of the generated layouts.The key users should be guided through the design process while automaticallyfocusing on the overarching aim to minimize the material handling effort. Simpleand intuitive software usability as well as certain adjustment possibilities wouldfurther improve customer acceptance.
According to all interviewees, future software applications should support theentire design process. This also requires interface functions to export the solutioninto common data formats for further visualization and simulation. IntervieweeD noted that integrating the algorithms into a three-dimensional planning proce-dure is of further importance. Since the interview partners were concerned aboutthe decreasing influence of the users in case of implementing advanced algo-rithms in the software, literature suggests implementing expert systems (García-Hernandez et al., 2014). These advanced approaches allow for the considerationof the user’s experience at several planning steps.
6 Conclusions
There are a significant number of publications in the scientific area of facility lay-out design, with an apparent trend towards metaheuristics and algorithm-based
72

6 Conclusions
optimization of the arrangement problem. Although these advancedmethodsoffer several advantages over traditional methods from a scientific perspective,our market review indicated that current design software still uses these simpleand outdated methods in the applications. The prevailing part of the design taskremains with the designer without any software support. This answers our firstresearch question regarding the methodical support of factory design processesin software applications.
In order to investigate the reason for this practice-research gap and to identifyfuture research direction, we further conducted amultiple interview study withexperts from software engineering companies and a scientific institution thatdistributes a self-developed software.
As regards our second and third research question, our study showed that allinvestigated cases are connected to science to some extent and apply a similargeneral layout planning procedure that is well-known in manufacturing engineer-ing research. Current advances in advanced algorithmic approaches from thescientific area of operations research are not affecting the interviewed softwaredevelopers due to the fact that the case companies
— lack knowledge regarding the existence of advanced algorithms, causedby the scarcity of employees familiar with operations research;
— lack knowledge regarding the implementation, due to the decreasedquality of the staff’s education;
— lack knowledge regarding the usage of advanced algorithms, due to theuse of the software by customers unskilled in layout design;
— expect problems of acceptance, since advanced algorithms that auto-matically solve design problems would shift reasonability and decision-making power from the designer to the IT department.
Even the scientific institute,with ananticipateddeeper understandingof scientificadvancedmethods, still uses simple algorithms and reveals the same findings asthe other cases. This suggests that the research communities (engineering andoperations research) are segregated, although they focus on the same topic fromdifferent viewpoints.
73
Advanced Scientific Algorithms in Digital Factory Design Applications
This study further derived recommendations for practice in light of Industry 4.0,besides the motivation for an intensified cooperation of software developers andscientific institutes from different disciplines:
— software engineering companies should employ staff with specific opera-tions research skills;
— the education of mechanical engineering in the field of manufacturingdesign should integrate specific operations research issues;
— advanced algorithms should be made user-friendly and be implementedas complementary features at first, until the customers have gained trustin these features.
7 Limitations and further Research
The results of this study are analytically generalizable in terms of correlativevalidity; however, there are some limitations. The validity of this interview studyis within a clearly defined scope:
— Software manufacturers with branches in Germany, specialized in layoutdesign software and services;
— Customers from themanufacturing industry (SMEs to multinationals);
— Individual consultation and fulfillment of customer requests within theprojects.
Future research using a larger sample size with diverse industries and firm char-acteristics would improve reliability of this interview study. An approach whichinvolves interviewing software manufacturers with an international focus shouldalso be expedited in order to validate the findings.
Additionally, we indicate some recommendations for research in order to focusthe research for a better applicability of findings in practice in the imminent trendto Smart Manufacturing and Industry 4.0:
74
7 Limitations and further Research
The interview partners described several features that they expect from an ad-vanced approach to be implemented in their software. Interviewees A and Bdemand real-time capabilities of the solution method to make use of the benefitsof collaborative planning. Interviewees A andC consider severalminutes as a timerequirement for a sophisticated solution to be acceptable in terms of collaborativeplanning.
This allows foradiscussionofoftenuncertain inputdataand the followingsolutionevaluation in collaboration. Moreover, if the algorithm produces several layoutvariants, interviewee C expects a recommendation for a preferred layout variant.Interviewee D emphasizes the relevance of a comparison value with traditionallyobtained solutions to classify the solution quality. Therefore, the software shouldbe able to calculate the material handling effort expected from the obtainedlayout variant and should further enable the user to define customized evaluationcriteria.
Besides the objective function aiming to minimize the material handling effort,several main restrictions were identified in the interview study that should betaken into account by researchers when developing a metaheuristic:
— Facility shapes
— Facility orientations
— Dimensions
— Path and aisle design
— Fixable functional areas
— Structural conditions, e.g. walls and pillars
Most scientific approaches already satisfy several of these requirements sincethey are often rather fast, evaluate an adjustable quantitative objective functionvalue and satisfy most of the required restrictions. However, there are only a fewapproaches that consider three-dimensional layout information (Barbosa-Póvoaet al., 2002) and thematerial path system (Friedrich et al., 2018 ). To the best ofour knowledge, there is still a lack of scientific approaches that explicitly considerthe aisle design.
75
Advanced Scientific Algorithms in Digital Factory Design Applications
In order to make their findings better accessible for practitioners, scientific insti-tutes should proactively support the comprehensibility throughout the researchprocess. Researchers are moreover advised to publish their findings consideringlayout design in practice-relevant journals in addition to scientific journals.
References
Ahmadi, A., M. S. Pishvaee, and M. R. Akbari Jokar (2017). “A survey onmulti-floor facility layoutproblems”. In: Computers & Industrial Engineering 107, pp. 158–170.
Anjos, M. F. and M. V. C. Vieira (2017). “Mathematical optimization approaches for facility lay-out problems: The state-of-the-art and future research directions”. In: European Journal ofOperational Research 261.1, pp. 1–16.
Arnold, D. and K. Furmans (2009).Materialfluss in Logistiksystemen. Springer Berlin.Barbosa-Povoa, A. P., R. Mateus, and A. Q. Novais (2002). “Optimal 3D layout of industrial facilities”.
In: International Journal of Production Research 40.7, pp. 1669–1698.Bracht, U., D. Geckler, andS.Wenzel (2018).Digitale Fabrik -MethodenundPraxisbeispiele. Springer
Berlin.Drira, A., H. Pierreval, and S. Hajri-Gabouj (2007). “Facility layout problems: A survey”. In: Annual
Reviews in Control 31.2, pp. 255–267.Eisenhardt, K. M. (1989). “Building Theories from Case Study Research”. In: The Academy of Man-
agement Review 14.4, pp. 532–550.Eisenhardt, K. M. and M. E. Graebner (2007). “Theory building from cases: Opportunities and
challenges”. In: Academy of Management Journal 50.1, pp. 25–32.Friedrich, C., A. Klausnitzer, and R. Lasch (2018). “Integrated slicing tree approach for solving
the facility layout problem with input and output locations based on contour distance”. In:European Journal of Operational Research 0, pp. 1–15.
García-Hernández, L., M. Pérez-Ortiz, A. Araúzo-Azofra, L. Salas-Morera, and C. Hervás-Martínez(2014). “An evolutionary neural system for incorporating expert knowledge into the UA-FLP”.In: Neurocomputing 135, pp. 69–78.
Garey,M. andD. Johnson (1979).Computersand intractability: aguide to the theoryofNP-completeness.New York: A series of books in the mathematical sciences.
Grundig, C.-G. (2015). Fabrikplanung : Planungssystematik, Methoden, Anwendungen. München:Hanser Verlag.
Jiang, S. and A. Y. Nee (2013). “A novel facility layout planning and optimization methodology”. In:CIRP Annals - Manufacturing Technology 62.1, pp. 483–486.
Kettner, H., J. Schmidt, and H.-R. Greim (1984). Leitfaden der systematischen Fabrikplanung.München: Hanser Verlag.
Klausnitzer, A., S. Stürzel, and R. Lasch (2017). “Facility Layout Planning – Investigating the gapbetween research and practice”. In: Logistikmanagement - Beiträge zur LM 2017. Ed. by R. Large,N. Kramer, A.-K. Radig, M. Schäfer, and A. Sulzbach, pp. 267–276.
Koopmans, T. and M. Beckmann (1957). “Assignment Problems and the Location of EconomicActivities”. In: Econometrica 25.1, pp. 53–76.
76
REFERENCES
Kuckartz, U. (2014). Qualitative Inhaltsanalyse : Methoden, Praxis, Computerunterstützung. Wein-heim: Beltz Juventa Verlag.
Martin, H. (1976). “EineMethode zur integriertenBetriebsmittelanordnungundTransportplanung”.Dissertation. TU Berlin.
Meredith, J. (1998). “Building operations management theory through case and field research”. In:Journal of Operations Management 16.4, pp. 441–454.
Schenk, M., E. Müller, and S. Wirth (2014). Fabrikplanung und Fabrikbetrieb. Springer Berlin.Schmigalla, H. (1968).Methoden zur optimalen Maschinenanordnung. Berlin: Verl. Technik.Tao, J., P. Wang, H. Qiao, and Z. Tang (2012). “Facility layouts based on intelligent optimization
approaches”. In: 2012 IEEE 5th International Conference on Advanced Computational Intelligence,ICACI 2012, pp. 502–508.
Toksari, M. D. (2016). “A hybrid algorithm of Ant Colony Optimization (ACO) and Iterated LocalSearch (ILS) for estimating electricity domestic consumption: Case of Turkey”. In: InternationalJournal of Electrical Power and Energy Systems 78, pp. 776–782.
Tompinks, J. A. (2010). Facilities planning. Wiley.VDI (2008). VDI 4499 - Digitale Fabrik - Grundlagen. Düsseldorf: VDI-Verlag.VDI (2011). VDI 5200 - Fabrikplanung - Planungsvorgehen. Düsseldorf: VDI-Verlag.Yin, R. K. (2009). Case study research : design andmethods. Los Angeles: Sage.
77

Additive Manufacturing in SupplyChains – The Future of PurchasingProcesses
Stephanie Niehues1, Laura Berger1, Michael Henke1
1 – TU Dortmund
Additive manufacturing is one of the leading production technologies when itcomes to the efficient production of individual parts. This paper explains howaddi-tive manufacturing will influence purchasing processes and network structures ofproducing companies in future supply chain networks. Therefore, an exploratoryresearch of relevant literature and recent studies in a systematic literature reviewis conducted, giving an overview of how additive manufacturing will change theprocesses of purchasing. Traditional purchasing andmodern processes affectedby the implementation of additive manufacturing are compared, in order to pointout differences and new requirements. In the future purchasers have to extendtheir knowledge of additive manufacturing, to integrate this production technol-ogy into their sourcing strategy in an effective way. Technological knowledge andcapabilities, supplier relations and internal integration of purchasers need to beimproved, to make use of benefits e.g. reduced inventory. This exploration of theimpact of additive manufacturing is focused on purchasing processes. Therefore,this paper investigates one special field of the supply chain layer, which is theunique characteristic of this submission. The findings are based on a literaturereview of studies and specialized literature, an analysis in collaboration with com-panies was not executed. Additive manufacturing has great advantages in manyfields, but it cannot be integrated in supply chain processes with a significant leapforward. The sourcing strategy has to be changed; employees have to be trained,to interact with the new supply chain members and to learn which componentscan bemanufactured additively.
First recieved: 28.May.2018 Revised: 06.Jul.2018 Accepted: 13.Jul.2018
79
Additive Manufacturing in Supply Chains – The Future of Purchasing Processes
Keywords: Additive Manufacturing; Purchasing; Supply Chains; Additive Manu-facturing in Supply Chains
1 Introduction
Additive Manufacturing is going its way from a pacemaker to a key-manufacturingtechnology. A lot of high technology companies spot the benefits of additiveman-ufactured parts. At the moment, most of these parts are prototypes, spare partsor individualized consumer goods, but in the near future, taking the evolutionof markets into consideration, more andmore individual additive manufacturedparts will be produced to enable individualized mass production (Zeyn, 2017). Inthis scenario, the decision to print additively or to produce a part conventionallyhas to be made during the purchasing process, preferably only in a matter ofseconds. The velocity and the quality of this decision process will be a commer-cial advantage of companies acting on a globalizedmarket. (Johannknecht andLippert, 2015; Gress and Kalafsky, 2015)
A number of up-to-date studies and articles describe the trends and current de-velopments in procurement. They do all point out digitalization as one of themain aspects influencing the future position of Purchasing & Supply Manage-ment (PSM) and the roles of purchasers (e.g. Kushner, 2015; Nowosel, Terrilland Timmermans, 2015; Pellengahr et al., 2016; PricewaterhouseCoopers, 2014).Digitalization, individualization and increasing autonomy as basic principles of In-dustry 4.0 also have an extensive impact on Purchasing and Supply Management(PSM) (Pellengahr, Schulte, Richard and Berg, 2016). Due to these facts and alsobecause of the ongoing digitalization in production and administrative processes,the purchasing processes in companies will reach a new technological level.
On the one hand, digitalization is represented by new categories. Firms purchasedigital products, services, and hybrid components. In order to acquire the de-manded technical expertise, it is evenmore important to collaborate with othercompany functions. Purchasers have to be involved in product development pro-cesses on an early stage. New categories, e.g. related to additive manufacturing,will have to be procured with new sourcing strategies while others might loseimportance or even disappear from the purchasing portfolio. (Arnolds, Heege,Röh and Tussing, 2016; Pellengahr et al., 2016; PricewaterhouseCoopers, 2014;Schuh, Aghassi, Bremer and Graw, 2014)
80

1 Introduction
On the other hand, digital transformation causes not only technological advancesand new requirements but also organizational and process-related changes. Theadministrative purchase-to-pay process will mostly be automated, as digital tech-nologies help in the facilitation process. Further automation of transactionalprocurement decreases involvement of employees in purchase-to-pay and re-leases more personal resources for strategic tasks (Kushner, 2015; Pellengahr etal., 2016; Scharlach, Schuh andStrohmer, 2014; Drake, 2012). The purchasing staffmembers have to develop from former administrators to innovationmanagers,controlling data analysts and engineers in one person.
The network structures of future supply chains containing additivemanufacturingas a production technology will refine and even different network partners willchange their position and scope of duties. The value of data and their transferthrough the supply chain network will be a new key performance indicator foreffective supply chains. (Mellor et al., 2014; Zeyn, 2017)
Data for additive manufacturing processes will contain all information whichis needed for an implementation in the production process. They will not onlycontain construction data but also parametric data and specialized settings forthe building process in 3D-printers e.g. temperatures, feeding velocity andmate-rial advices. Taking this into consideration, one scenario could be that networkpartners that were not considered to produce goods can be enabled to executeadditive manufacturing processes. (Zeyn, 2017)
A great example for this are forwarding companies that are able to become aproducing network partner. The storing and distribution of goods will not betheir main business area. The producing of parts on their 3D printers will becomean important function for the supply chain network. All the parts that causedhigh storing costs for companies and that were no particular fast sellers canthen be produced additively. As an example, these are parts that are only neededsporadically andwere stored for the customer satisfaction, so that they have spareparts for a long period but also parts that had to be stored for legal regulation(e.g. aviation industry). (Mellor et al., 2014)
This paper will give an overview of how processes, especially in purchasing areasand network structures of supply chain, will change and develop because of addi-tive manufacturing making its way to an important manufacturing technology.Based on that, recommended actions can be derived for companies, e.g. regard-ing know-how and competencies for procurement staff necessary for additivemanufacturing, that is, amongst others, process knowledge and optimization,technical knowledge about the new products which need to be sourced.
81
Additive Manufacturing in Supply Chains – The Future of Purchasing Processes
2 Methodology
A literature review is a keymethod to overcome andmanage the broad diversity ofknowledge in management research. The main reason for conducting a literaturereview is to collect and assess already existing literature in order to specify aresearch question. With respect to the research question, the existing base ofknowledge is about to be developed further. (Tranfield et al., 2003)
In addition to the advantages of literature review papers, such as giving a well-structured and up-to-date overview of a specific topic, it adds value by revealingknowledge gaps to the researcher. (Van Wee and Banister, 2016)
Newer technologies such as additive manufacturing that have not been adoptedby a lot of companies yet, need a lot of guidance through its management. Thedifficulty is that there are only a few, if any, experienced employees or manage-ment staffbecause of the circumstances and challenges arisingwith such evolvingtechnologies. Decision making can be really tough without any or only a littleknowledge in this area. Literature reviews can provide the company with a broadbase of information and knowledge. From this standpoint, it is easier for manage-ment and employees to handle decision making around additive manufacturingand develop its own experience and know-how.
The methodology for developing evidence-informedmanagement knowledgeprovides three steps that have to be passed through for a systematic literaturereview. (Tranfield, et al., 2003) These steps are deployed in this paper to providea desirable methodological approach: planning, conducting and evaluate thereview.
2.1 Planning the review
The first step contains the systematic planning of the review. In this phase theguiding research question was developed, which is phrased as follows:
How does the implementation of additive manufacturing as a production tech-nology influence future purchasing processes and the needed qualification ofemployees working in those processes?
The researchquestionwasdevelopedupon the fact that anearlier literature reviewon the influence of additive manufacturing on company processes, in general,
82
2 Methodology
showed that those examinations mostly focused on production processes, valueprocesses or supply chain processes. Due to the fact that purchasing processesget more andmore important for companies, because of a globalized market anda reduction of manufacturing depths, also the impact of additive manufacturingon those processes has to be evaluated.
The database, which was used for the review research, was ”google scholar”. Ina second stage, the searching process was also conducted on the database of”Scopus”, but in this case it did not provide further relevant papers, and so noadditional paper could be added to the detailed review.
In this database, the keywords ”additive manufacturing”, ”3D-Printing”, ”procure-ment”, and ”supply chain management” were combined and in the following themost corresponding papers were selected.
The following combinations of keywords were entered, the number of results forevery combination is specified behind:
”additive manufacturing” AND procurement (2.610 results), ”3D-printing” ANDprocurement (2.390 results), ”additive manufacturing” AND ”supply chain man-agement” (1.630 results), ”3D-printing” AND ”supply chain management” (2.370results)
Because of the two very similar keywords ”additive manufacturing” and ”3D-Printing” a lot of papers appeared in both searches andmade the review processless elaborately.
Statistically, most of the publications on this set of issues were published in theyears 2016 and 2017 and were classified as an Engineering or Business, Manage-ment and Accounting topic.
2.2 Conducting the review
From the first collection of papers, the relevant section was selected to executethe literature review.
For this, a selection of papers and studies was developed, based on a predeter-mined research strategy. The criteria for the selection was the conceptual link ofthe papers to both of the topics ”Additive manufacturing” AND ”Procurement”.Only those papers that had a connection to both of these fields and treated the
83

Additive Manufacturing in Supply Chains – The Future of Purchasing Processes
impacts in those fields were chosen for the literature review. This very restric-tive search criterion has the advantage of avoiding issues that only mention theprocurement process in additive manufacturing as an adjunct.
Beside this criteria, only papers which appeared in the period from 2006 to 2018,were collected in order to develop a current picture of the research field. Thesearch yielded the 11 papers listed in table 1 and represent the final database forour analysis. A second search on the database Scopus was not able to identifyadditional papers concerning additive manufacturing and procurement.
The selection of papers is summarized in the following table.
84
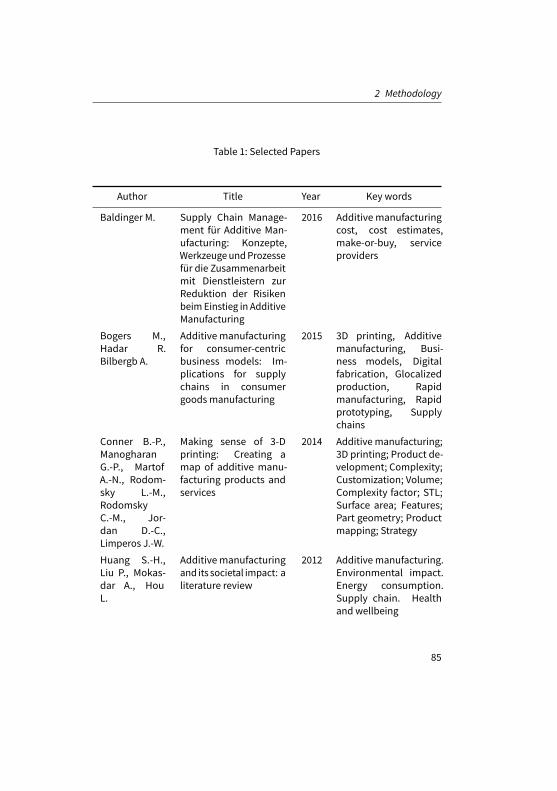
2 Methodology
Table 1: Selected Papers
Author Title Year Key words
Baldinger M. Supply Chain Manage-ment für Additive Man-ufacturing: Konzepte,WerkzeugeundProzessefür die Zusammenarbeitmit Dienstleistern zurReduktion der RisikenbeimEinstieg in AdditiveManufacturing
2016 Additive manufacturingcost, cost estimates,make-or-buy, serviceproviders
Bogers M.,Hadar R.Bilbergb A.
Additive manufacturingfor consumer-centricbusiness models: Im-plications for supplychains in consumergoods manufacturing
2015 3D printing, Additivemanufacturing, Busi-ness models, Digitalfabrication, Glocalizedproduction, Rapidmanufacturing, Rapidprototyping, Supplychains
Conner B.-P.,ManogharanG.-P., MartofA.-N., Rodom-sky L.-M.,RodomskyC.-M., Jor-dan D.-C.,Limperos J.-W.
Making sense of 3-Dprinting: Creating amap of additive manu-facturing products andservices
2014 Additive manufacturing;3D printing; Product de-velopment; Complexity;Customization; Volume;Complexity factor; STL;Surface area; Features;Part geometry; Productmapping; Strategy
Huang S.-H.,Liu P., Mokas-dar A., HouL.
Additive manufacturingand its societal impact: aliterature review
2012 Additive manufacturing.Environmental impact.Energy consumption.Supply chain. Healthand wellbeing
85
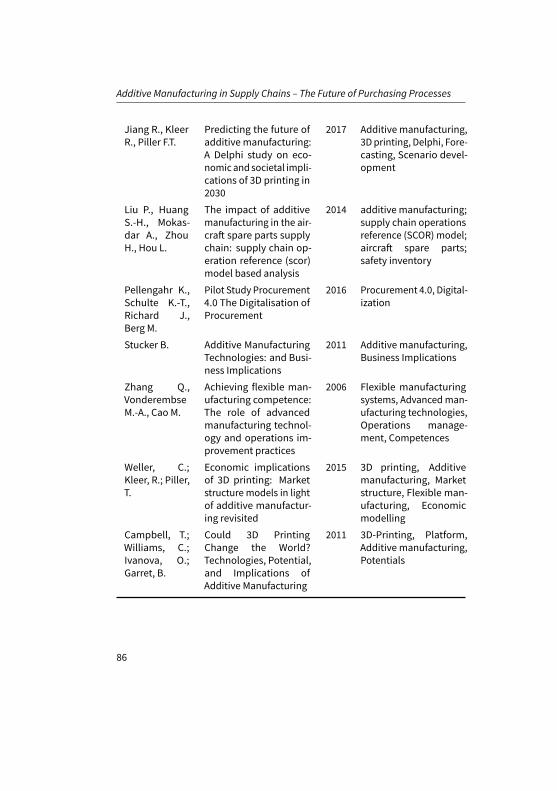
Additive Manufacturing in Supply Chains – The Future of Purchasing Processes
Jiang R., KleerR., Piller F.T.
Predicting the future ofadditive manufacturing:A Delphi study on eco-nomicandsocietal impli-cations of 3D printing in2030
2017 Additive manufacturing,3Dprinting, Delphi, Fore-casting, Scenario devel-opment
Liu P., HuangS.-H., Mokas-dar A., ZhouH., Hou L.
The impact of additivemanufacturing in the air-craft spare parts supplychain: supply chain op-eration reference (scor)model based analysis
2014 additive manufacturing;supply chain operationsreference (SCOR) model;aircraft spare parts;safety inventory
Pellengahr K.,Schulte K.-T.,Richard J.,Berg M.
Pilot Study Procurement4.0 The Digitalisation ofProcurement
2016 Procurement 4.0, Digital-ization
Stucker B. Additive ManufacturingTechnologies: and Busi-ness Implications
2011 Additive manufacturing,Business Implications
Zhang Q.,VonderembseM.-A., Cao M.
Achieving flexible man-ufacturing competence:The role of advancedmanufacturing technol-ogy and operations im-provement practices
2006 Flexible manufacturingsystems, Advancedman-ufacturing technologies,Operations manage-ment, Competences
Weller, C.;Kleer, R.; Piller,T.
Economic implicationsof 3D printing: Marketstructure models in lightof additive manufactur-ing revisited
2015 3D printing, Additivemanufacturing, Marketstructure, Flexible man-ufacturing, Economicmodelling
Campbell, T.;Williams, C.;Ivanova, O.;Garret, B.
Could 3D PrintingChange the World?Technologies, Potential,and Implications ofAdditive Manufacturing
2011 3D-Printing, Platform,Additive manufacturing,Potentials
86
3 Findings
For the actual review the following impact areas, which were developed in theplanning process, were evaluated, Influence of additive manufacturing on thepurchasing portfolio, Influence of additive manufacturing on procurement orga-nization, Impact of additive manufacturing on procurement processes, Influenceof additive manufacturing on buyer-supplier relationships and the Influence ofadditive manufacturing on competence requirements in procurement.
3 Findings
For a first brief dissemination of this review a diagram was developed, whichillustrates the main findings of the literature review on a numerical basis. Thenumber of references of the impact in context with the changes of additive man-ufacturing on the different areas of procurement were counted and applied tocreate a descriptive diagram. This diagram shows in which of the above men-tioned categories the selected authors of the papers see the broadest numberof changes, or rather which ones are most important for the future procurementprocesses and in this connection also for future supply chains. It also showswhichcategory is yet not mentioned that often but can also be an important impact inthe future.The diagram points out that the changing in procurement organization caused byadditive manufacturing is most mentioned in the selected papers. The need ofnew qualification for especially procurement employees is not yet mentioned inmany papersIn the following section the most striking findings about the influence of addi-tive manufacturing on procurement are summarized based on the informationfrom the papers listed in (Table 1: Selected papers). The results are divided intothementioned categories purchasing portfolio, organization, processes, buyersupplier relationships and competence requirements.
3.1 Influence of additive manufacturing on the purchasing portfolio
With the installation of additive manufacturing in a company, new products andservices are included in the purchasing portfolio that are 3D printers, rawmateri-als, construction data, additional devices and equipment for post processing, oreven additive manufacturing services, like design or production services. (Pellen-gahr at al., 2016)
87
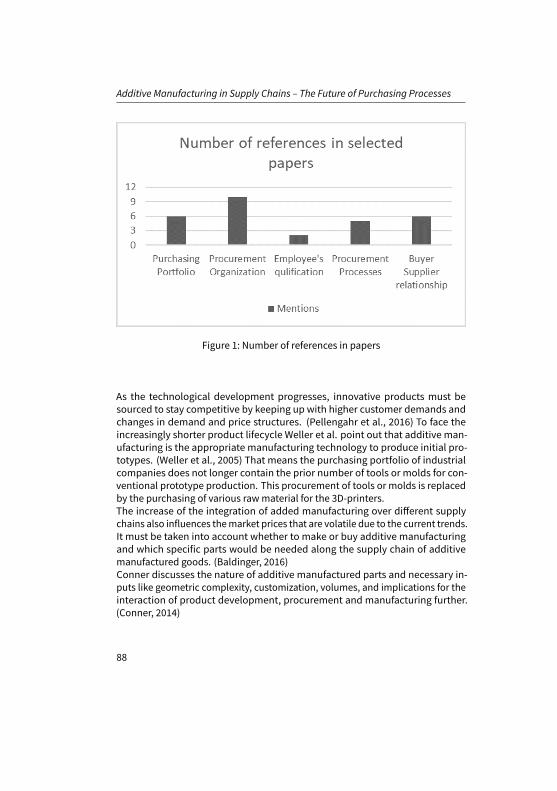
Additive Manufacturing in Supply Chains – The Future of Purchasing Processes
Figure 1: Number of references in papers
As the technological development progresses, innovative products must besourced to stay competitive by keeping up with higher customer demands andchanges in demand and price structures. (Pellengahr et al., 2016) To face theincreasingly shorter product lifecycle Weller et al. point out that additive man-ufacturing is the appropriate manufacturing technology to produce initial pro-totypes. (Weller et al., 2005) That means the purchasing portfolio of industrialcompanies does not longer contain the prior number of tools or molds for con-ventional prototype production. This procurement of tools or molds is replacedby the purchasing of various rawmaterial for the 3D-printers.The increase of the integration of added manufacturing over different supplychains also influences themarket prices that are volatile due to the current trends.It must be taken into account whether to make or buy additive manufacturingand which specific parts would be needed along the supply chain of additivemanufactured goods. (Baldinger, 2016)Conner discusses the nature of additive manufactured parts and necessary in-puts like geometric complexity, customization, volumes, and implications for theinteraction of product development, procurement and manufacturing further.(Conner, 2014)
88
3 Findings
3.2 Influence of additive manufacturing on the procurementorganization
According to Bogers, due to a high customer focus and individualization, supplychains becomemore distributed on a decentralized basis. Production activitiesshift frommanufacturer closer to customer. (Bogers, 2015)In contrast, Liu describes two approaches for the organizational anchoring ofadditivemanufacturing capacity: The capacity can either be centralized to replaceinventories or distributed close to the customers. (Liu, 2014)Additive manufacturing enables direct production of objects and enables the con-sumers to design own products. As an emergingmarket online databases offerproduct designs for additive manufacturing purposes (Jiang, 2017). Customer-centric focus onbusinessmodels gives indications for operations along the supplychain. Flexibility and responsiveness need to be ensured by procurement organi-zations. (Bogers, 2015)Also the integration of additive manufacturing platforms plays a significant rolefor the procurement organization. The option to use a network of companies asa supplier by using digital purchasing platforms can be one of the solutions fora not existing know-how of the production technology additive manufacturing.(Campbell et al., 2011)Procurement along with other involved company functions faces the challengethat regulatory frameworks for additive manufacturing are still premature. Thatincludes design and liability regulations, taking into consideration an outsourcedadditive manufacturing including digital platforms as service providers for datastorage and print. (Gress and Kalafsky, 2015)
3.3 Influence of additive manufacturing on the procurementprocesses
Additivemanufacturing influences supply chains and several enterprise processes.Additive manufacturing methods are used to reduce small batches. It has thepotential to eliminate stocking activities for certain items and enable on-demandpurchasing and production instead. Rapid prototyping becomes part of the strate-gic sourcing process. Supply logistics processes change as on-shoring is standardfor additive manufacturing, different materials have to be procured and the pro-curement of spare part products decreases. (Stucker, 2011)Simplified additive manufacturing increases efficiency and responsiveness insupply chains. (Huang, 2012) One advantage that takes effect in that case is that
89
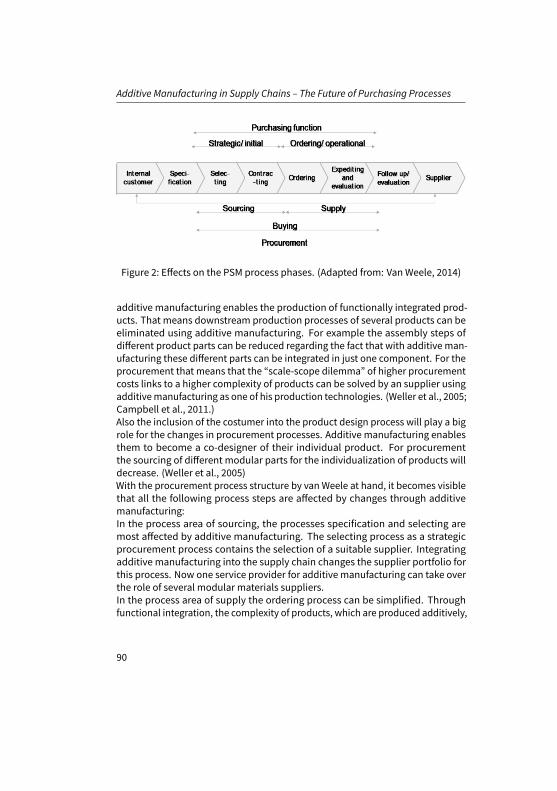
Additive Manufacturing in Supply Chains – The Future of Purchasing Processes
Figure 2: Effects on the PSM process phases. (Adapted from: Van Weele, 2014)
additive manufacturing enables the production of functionally integrated prod-ucts. That means downstream production processes of several products can beeliminated using additive manufacturing. For example the assembly steps ofdifferent product parts can be reduced regarding the fact that with additive man-ufacturing these different parts can be integrated in just one component. For theprocurement that means that the “scale-scope dilemma” of higher procurementcosts links to a higher complexity of products can be solved by an supplier usingadditivemanufacturing as one of his production technologies. (Weller et al., 2005;Campbell et al., 2011.)Also the inclusion of the costumer into the product design process will play a bigrole for the changes in procurement processes. Additive manufacturing enablesthem to become a co-designer of their individual product. For procurementthe sourcing of different modular parts for the individualization of products willdecrease. (Weller et al., 2005)With the procurement process structure by van Weele at hand, it becomes visiblethat all the following process steps are affected by changes through additivemanufacturing:In the process area of sourcing, the processes specification and selecting aremost affected by additive manufacturing. The selecting process as a strategicprocurement process contains the selection of a suitable supplier. Integratingadditive manufacturing into the supply chain changes the supplier portfolio forthis process. Now one service provider for additive manufacturing can take overthe role of several modular materials suppliers.In the process area of supply the ordering process can be simplified. Throughfunctional integration, the complexity of products, which are produced additively,
90
3 Findings
can be reduced. Thatmeans that the supply risk along the supply chain decreases,as these products can be produced in a decentral manner at the point of use andby the lower number of suppliers involved in one product engineering process.
3.4 Influence of additive manufacturing on buyer supplierrelationships
As additivemanufacturing opportunities increase, procurement ismore andmoreobliged to look at the costs and risks for make-or-buy-decisions and the choice ofsuppliers. (Baldinger, 2016)Different and new suppliers are needed triggered by changes in purchasing port-folios. On the other hand, established suppliers might become obsolete. Pro-curement and manufacturing will be challenged to identify which items currentlypurchased from a third party can be developed internally. Companies canmakeuse of offered additivemanufacturing services or, with enough demand, buy theirown printers. As material requirements continue to evolve, procurement continu-ously faces new challenges in identifying and developing strategically relevantsuppliers and network partners. (Connor, 2014)In the case of the special field of spare part supply, additive manufacturing canreplace the buyer supplier process. With additivemanufacturing it is nowpossibleto produce spare parts for products or machines on demand at the point of use.In this case the supplier has to share the design file of the part only and theproduction takes place at the factory site. (Campbell et al., 2011)
3.5 Influence of additive manufacturing on competencerequirements in procurement
PSM can stress its strategic role by gaining additional knowledge and networkingas an equal partner within and outside the company. Besides technical expertise,which ensures that the correct new types of products can be bought, the network-ing as well as innovation scouting and sourcing role of the modern purchasers isfostered by further implementation of additive manufacturing. (Pellengahr et al.,2016)Internal capacity for additive manufacturing projects is built up. This increasesthe knowledge about the technology and its potential applications for the focalfirm. For successful implementation, personnel along the whole supply chainand network of which procurement is one of the essential functions connectingthe involved companies need to be qualified accordingly.
91

Additive Manufacturing in Supply Chains – The Future of Purchasing Processes
Expertise is required for the procurement of the right products and technologies.Therefore, PSM needs to network with other departments, with suitable suppliersand stakeholders which calls for interdisciplinary know-how and interpersonalskills. In addition, entrepreneurial approaches and innovation abilities of theworkforce are fostered. Buyers must have reliable product knowledge about theirnew digital procurement portfolio, e.g. about quality and pricing. As knowledgeabout current supply chain fundamentals andmanufacturing techniques alters,procurement can benefit by remaining flexible and innovative in the face of 3Dprinting and other technologies. (Pellengahr et al., 2016)Beyond explicitly PSM related new skills, technical infrastructure all over thenetworks needs to enhance regarding speed, security, availability of service andreal-time efficiency. Curricula in practice as well academia should focus on in-creasing ICT skills in general. How these tasks can be embedded in the companydepends on existing structures, process and know-how and will turn out clearerin the future. Procurement is one of the functions investigating intelligence solu-tions. Technological progress and related skills development can be pushed andcontrolled top down frommanagement and strategic relevance. (Zhang, 2006)
4 Conclusion
One of the additional findings during the literature review is that the topic of ad-ditive manufacturing in connection with procurement processes or procurementorganization was not often the main topic of the related papers. Most of themfocused on technological or production issues. The changes in the area of pro-curement were only mentioned as a marginal note in the majority of the papers.Still, the systematic literature review has shown that a lot of advantages basedon the production technology additive manufacturing can only be exploited byincorporating the specific features of additive manufacturing very early in theproduct lifecycle, right at the point of designing products in the supply chainsand purchasing.Inaddition to that, someof themainchallengesprocurement faces canbeaffectedby progressing utilization of additive manufacturing in a positive way.Certain risks can beminimized, e.g. by increasing own production of parts insteadof relying on suppliers and by decentralization of production to locations closeto the customer. Being a technology leader enhancing innovation potential canhave positive influence on the company’s reputation. The environmental impactdecreases through the reduction of waste, transportation and inventory, andadditivemanufacturing can contribute to sustainability challenges and goals. It is
92
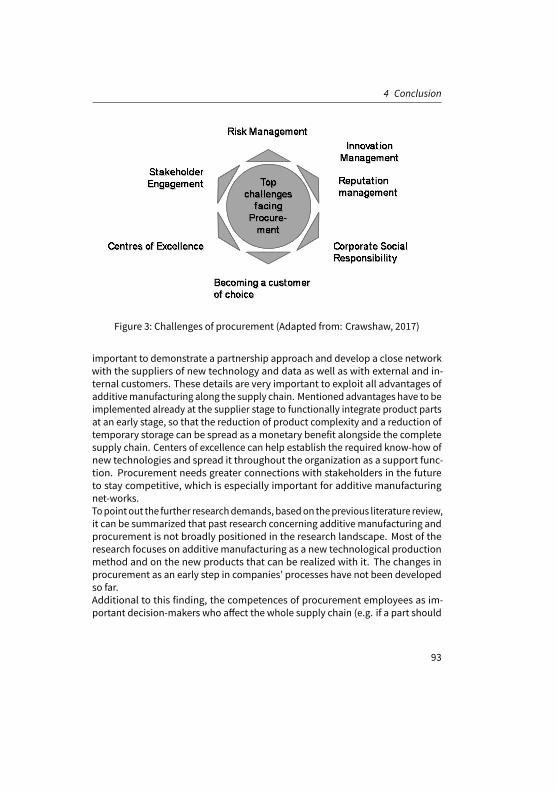
4 Conclusion
Figure 3: Challenges of procurement (Adapted from: Crawshaw, 2017)
important to demonstrate a partnership approach and develop a close networkwith the suppliers of new technology and data as well as with external and in-ternal customers. These details are very important to exploit all advantages ofadditivemanufacturing along the supply chain. Mentioned advantages have to beimplemented already at the supplier stage to functionally integrate product partsat an early stage, so that the reduction of product complexity and a reduction oftemporary storage can be spread as a monetary benefit alongside the completesupply chain. Centers of excellence can help establish the required know-how ofnew technologies and spread it throughout the organization as a support func-tion. Procurement needs greater connections with stakeholders in the futureto stay competitive, which is especially important for additive manufacturingnet-works.Topointout the further researchdemands, basedon theprevious literature review,it can be summarized that past research concerning additive manufacturing andprocurement is not broadly positioned in the research landscape. Most of theresearch focuses on additive manufacturing as a new technological productionmethod and on the new products that can be realized with it. The changes inprocurement as an early step in companies’ processes have not been developedso far.Additional to this finding, the competences of procurement employees as im-portant decision-makers who affect the whole supply chain (e.g. if a part should
93
Additive Manufacturing in Supply Chains – The Future of Purchasing Processes
be bought or produced additively) are not yet explored scientifically in a strate-gic way. Nevertheless, it is obvious that especially at this point in the supplychain process a decision concerning additive manufactured parts is indispens-able. That indicates that especially interdisciplinary research teams containingthe disciplines of engineering and educational science should work together forthe development of new education programs containing additive manufacturingtopics.
ReferencesArnolds, H. (2013). Materialwirtschaft und Einkauf: Grundlagen - Spezialthemen - Übungen. 12.,
aktualisierte und überarbeitete Auflage 2013. Wiesbaden: Springer.Baldinger, M. (n.d.). “Supply chainmanagement für additivemanufacturing: Konzepte, Werkzeuge
und Prozesse für die Zusammenarbeit mit Dienstleistern zur Reduktion der Risiken beim Ein-stieg in additve Manufacturing”. In: ().
Bogers, M., R. Hadar, and A. Bilberg (2016). “Additivemanufacturing for consumer-centric businessmodels: Implications for supply chains in consumer goods manufacturing”. In: TechnologicalForecasting and Social Change 102, pp. 225–239.
Campbell, T., C. Williams, O. Ivanova, and B. Garrett (2018). Could 3D Printing Change the World?Technologies, Potential, and Implications of Additive Manufacturing.
Conner, B. P., G. P. Manogharan, A. N. Martof, L. M. Rodomsky, C. M. Rodomsky, D. C. Jordan, andJ. W. Limperos (2014). “Making sense of 3-D printing: Creating amap of additive manufacturingproducts and services”. In: Additive Manufacturing 1-4, pp. 64–76.
Crawshaw, G. (2017). The top six challenges facing procurement.Drake, M. (2011). Global Supply Chain Management. Business Expert Press.European Environment Agency (2014). Annual EuropeanUniongreenhouse gas inventory 1990-2012
and inventory re-port 2014.Flint, D. J., E. Larsson, B. Gammelgaard, and J. T. Mentzer (2005). “LOGISTICS INNOVATION: A
CUSTOMER VALUE-ORIENTED SOCIAL PROCESS”. In: Journal of Business Logistics 26.1, pp. 113–147.
Gress, D. R. and R. V. Kalafsky (2015). “Geographies of production in 3D: Theoretical and researchimplications stemming from additive manufacturing”. In: Geoforum 60, pp. 43–52.
Huang, S.H., P. Liu, A.Mokasdar, andL.Hou (2013). “Additivemanufacturingand its societal impact:A literature review”. In: The International Journal of Advanced Manufacturing Technology 67.5-8,pp. 1191–1203.
Jiang, R., R. Kleer, and F. T. Piller (2017). “Predicting the future of additive manufacturing: ADelphi study on economic and societal implications of 3D printing for 2030”. In: TechnologicalForecasting and Social Change 117, pp. 84–97.
Johannknecht, F. and R. B. Lippert (n.d.). “Nachhaltigkeit und Business-Cases”. In: pp. 31–44.Kushner, M. (2018). Procurement in 2025: Five Megatrends & Their Implications. GEP, Clark.Liu, P., S. H.Huang, A.Mokasdar, H. Zhou, andL.Hou (2014). “The impact of additivemanufacturing
in the aircraft spare parts supply chain: Supply chain operation reference (scor) model basedanalysis”. In: Production Planning & Control 25.13-14, pp. 1169–1181.
94

REFERENCES
Mellor, S., L. Hao, and D. Zhang (2014). “Additivemanufacturing: A framework for implementation”.In: International Journal of Production Economics 149, pp. 194–201.
Pellengahr, K., A. Schulte, J. Richard, and M. Berg (2018). Pilot Study Procurement 4.0. The Digitali-sation of Procurement. Fraunhofer In-stitute for Material Flow and Logistics.
Plowman, E. G. (1964). Lectures on elements of business logistics (Stanford transportation series).Stanford University.
PricewaterhouseCoopers (2014). Einkauf – Die neue Macht in den Unternehmen.Scharlach, A., C. Schuh, and M. Strohmer (2014). Procurement 2020+. 10 Mega-Trends, die den
Einkauf verändern werden.Schuh, G., S. Aghassi, D. Bremer, and M. Graw (n.d.). “Einkaufsstrukturen”. In: pp. 25–74.Stucker, B. (2011). Additive Manufacturing Technologies. Frontiers of Engineering 2011: Reports on
Leading-Edge Engineering from the 2011 Symposium.Tranfield, D., D. Denyer, and P. Smart (2003). “Towards a Methodology for Developing Evidence-
Informed Management Knowledge by Means of Systematic Review”. In: British Journal of Man-agement 14.3, pp. 207–222.
Weele, A. J. van (2010). Purchasing & supply chain management: Analysis, strategy, planning andpractice. 5. ed. Andover: Cengage Learning.
Weller, C., R. Kleer, and F. T. Piller (2015). “Economic implications of 3D printing: Market structuremodels in light of additive manufacturing revisited”. In: International Journal of ProductionEconomics 164, pp. 43–56.
Zeyn, H. (2017). Industrialisierung der Additiven Fertigung: Digitalisierte Prozesskette - von derEntwicklung bis zum einsetzbaren Artikel Industrie 4.0. Beuth Innovation. Berlin: Beuth Verlag.
Zhang, Q., M. A. Vonderembse, and M. Cao (2006). “Achieving flexible manufacturing competence”.In: International Journal of Operations & Production Management 26.6, pp. 580–599.
95


Part II
Innovation and TechnologyManagement

Efficiency Analysis for DigitalisedWorking Systems of Truck Drivers
Dominic Loske1, Matthias Klumpp1
1 – FOM University of Applied Sciences
The current researchdiscussion postulates a digital transformation, characterizedby new and in its extent unknown development and application potentials. Atthis stage scientists and practitioners know little about how these changes willtransform specific work tasks. And the question is still evenmore opaque, whetherthere are real efficiency gains to be won by digitalization steps. Therefore, thispaper develops an efficiency analysis to evaluate the effect of changing levelsof digitalization within the working systems of professional truck drivers. DataEnvelopment Analysis (DEA) is used in order to quantify truck driver performancein the logistics processes of a German food retailer. As inputs we use loading timeand cost. Outputs are load factor of units, invoice charged to shops and value ofdamage. The findings indicate that a change in the level of digitalization entailsa loss of efficiency in the first instance which can partly be compensated later. Byusing correlation analysis we prove a low statistical linear relationship of age andefficiency plus a strong statistical linear correlation of employer size and efficiencyas well as period of employment and efficiency, always regarding the changinglevels of digitalization in the working system of professional truck drivers. Wederived the importance of employee retention programs for HR managementalong with a positive working environment provided for truck drivers to reducefluctuation effects. Furthermore, we advise to design software for truck drivers ascommonplace as possible and in the style of widespread smart phone softwareuser interfaces.
Keywords: Digitalisation; Data Envelopment Analysis; Efficiency analysis; Truckdriver
First recieved: 15.May.2018 Revised: 28.Jun.2018 Accepted: 03.Jul.2018
99
Efficiency Analysis for Digitalised Working Systems of Truck Drivers
1 Introduction
According to the results of a cross-sectoral survey of more than 500 Germancompanies by the digital association Bitkom, 84% of companies with logisticsprocesses rely on digital technologies (Bitkom, 2017, online). Referring to thisdigital transformation, the current research discussion postulates almost unan-imously a development boost that is characterized by a new and in its extentunknown development with non-foreseeable application potentials (Avent, 2014,p. 2). The trend is referred by different views as ”Second Machine Age” (Bryn-jolfsson and McAfee, 2014, p. 7), ”Third Industrial Revolution” (Rifkin, 2011, p. 2;Markillie, 2012, p. 1), ”Distributed Capitalism” (Zuboff, 2010, p. 1) or ”Industry4.0” (Kagermann, et al., 2011, p. 1). The social and economic consequences canbe described as disruptive and affect logistics as a science discipline, activityand industry (Avent, 2014, p. 2; Koch, et al., 2014, p. 4; Wee, et al., 2015, p. 7).Yet scientists and practitioners know little about what exactly is behind thesebuzz words and how the emerging changes of working systems will transformwork tasks or working relationships - and especially the question of efficiencyimprovements is without widespread empirical answers yet.
Therefore, this paper aims to develop and apply an efficiency analysis to evalu-ate the effect of changing levels of digitalization within the working systems ofprofessional truck drivers. We aspire to answer the following research questions:What are the components of an efficiency analysis aimed to evaluate the effect ofchanging levels of digitalization within the working systems of professional truckdrivers? (RQ1) Which level of efficiency exists before the change in the level of dig-itization, how does it develop during and after the changeover? (RQ2) What effecthas age, size of the employer and period of employment - hence work experience- on the level of efficiency? (RQ3).
After this introduction (section 1) we present a short literature review on impactsof digitalization on the humanworkforce in logistics and identify existing researchgaps (section 2). In section 3, the efficiency analysis for digitalised working sys-tems of truck drivers is elaborated by explaining basics of Data EnvelopmentAnalysis, selecting applicable inputs and outputs for the efficiency analysis andexplaining the setup and data collection. Based on the findings of the case studywhich are presented in section 4, section 5 of the paper discusses these resultsand derives implications for logistics management. The paper concludes with asummary and outlook in section 6.
100
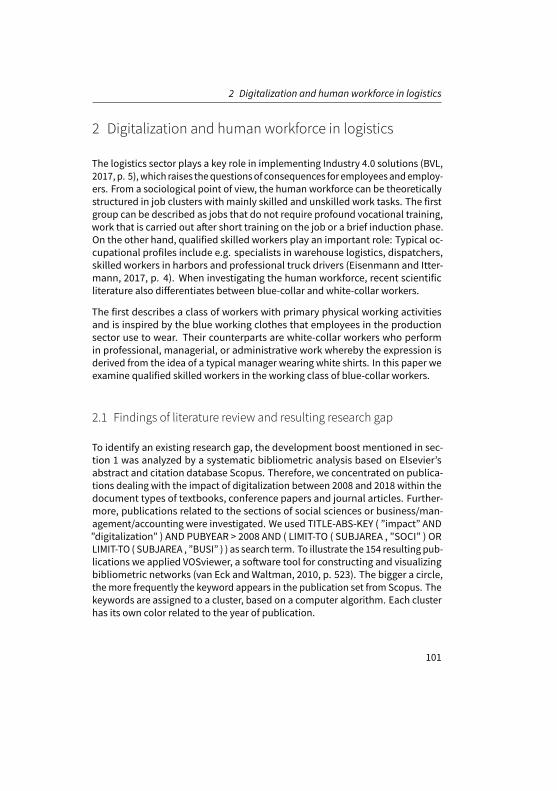
2 Digitalization and human workforce in logistics
2 Digitalization and human workforce in logistics
The logistics sector plays a key role in implementing Industry 4.0 solutions (BVL,2017, p. 5),which raises thequestionsof consequences for employeesandemploy-ers. From a sociological point of view, the human workforce can be theoreticallystructured in job clusters with mainly skilled and unskilled work tasks. The firstgroup can be described as jobs that do not require profound vocational training,work that is carried out after short training on the job or a brief induction phase.On the other hand, qualified skilled workers play an important role: Typical oc-cupational profiles include e.g. specialists in warehouse logistics, dispatchers,skilled workers in harbors and professional truck drivers (Eisenmann and Itter-mann, 2017, p. 4). When investigating the human workforce, recent scientificliterature also differentiates between blue-collar and white-collar workers.
The first describes a class of workers with primary physical working activitiesand is inspired by the blue working clothes that employees in the productionsector use to wear. Their counterparts are white-collar workers who performin professional, managerial, or administrative work whereby the expression isderived from the idea of a typical manager wearing white shirts. In this paper weexamine qualified skilled workers in the working class of blue-collar workers.
2.1 Findings of literature review and resulting research gap
To identify an existing research gap, the development boost mentioned in sec-tion 1 was analyzed by a systematic bibliometric analysis based on Elsevier’sabstract and citation database Scopus. Therefore, we concentrated on publica-tions dealing with the impact of digitalization between 2008 and 2018 within thedocument types of textbooks, conference papers and journal articles. Further-more, publications related to the sections of social sciences or business/man-agement/accounting were investigated. We used TITLE-ABS-KEY ( ”impact” AND”digitalization” ) AND PUBYEAR > 2008 AND ( LIMIT-TO ( SUBJAREA , ”SOCI” ) ORLIMIT-TO ( SUBJAREA , ”BUSI” ) ) as search term. To illustrate the 154 resulting pub-lications we applied VOSviewer, a software tool for constructing and visualizingbibliometric networks (van Eck andWaltman, 2010, p. 523). The bigger a circle,themore frequently the keyword appears in the publication set from Scopus. Thekeywords are assigned to a cluster, based on a computer algorithm. Each clusterhas its own color related to the year of publication.
101
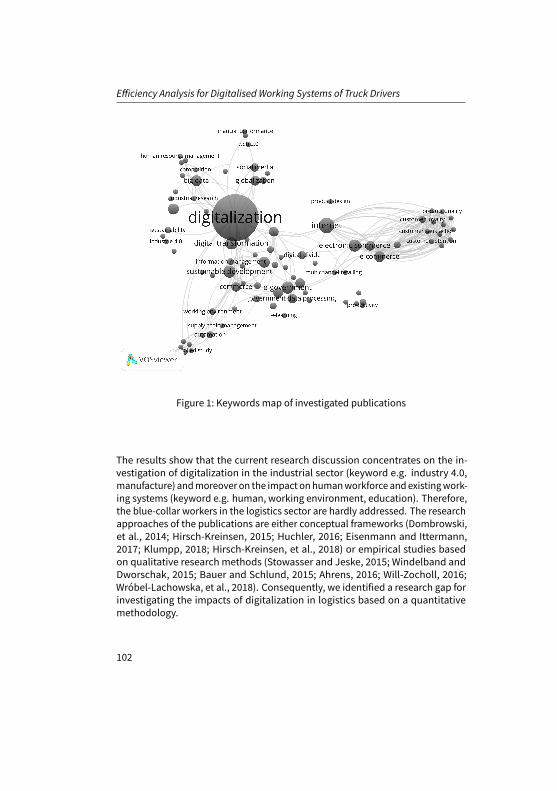
Efficiency Analysis for Digitalised Working Systems of Truck Drivers
Figure 1: Keywords map of investigated publications
The results show that the current research discussion concentrates on the in-vestigation of digitalization in the industrial sector (keyword e.g. industry 4.0,manufacture) andmoreover on the impact onhumanworkforce andexistingwork-ing systems (keyword e.g. human, working environment, education). Therefore,the blue-collar workers in the logistics sector are hardly addressed. The researchapproaches of the publications are either conceptual frameworks (Dombrowski,et al., 2014; Hirsch-Kreinsen, 2015; Huchler, 2016; Eisenmann and Ittermann,2017; Klumpp, 2018; Hirsch-Kreinsen, et al., 2018) or empirical studies basedon qualitative research methods (Stowasser and Jeske, 2015; Windelband andDworschak, 2015; Bauer and Schlund, 2015; Ahrens, 2016; Will-Zocholl, 2016;Wróbel-Lachowska, et al., 2018). Consequently, we identified a research gap forinvestigating the impacts of digitalization in logistics based on a quantitativemethodology.
102
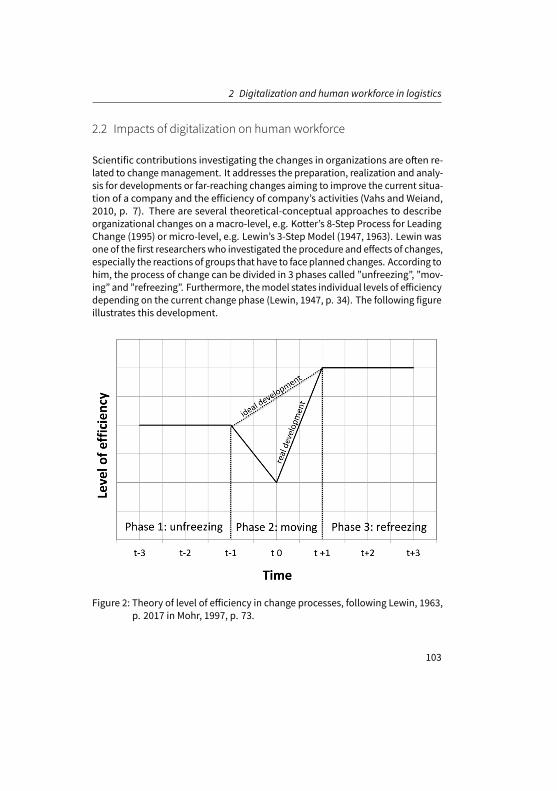
2 Digitalization and human workforce in logistics
2.2 Impacts of digitalization on human workforce
Scientific contributions investigating the changes in organizations are often re-lated to changemanagement. It addresses the preparation, realization and analy-sis for developments or far-reaching changes aiming to improve the current situa-tion of a company and the efficiency of company’s activities (Vahs andWeiand,2010, p. 7). There are several theoretical-conceptual approaches to describeorganizational changes on a macro-level, e.g. Kotter’s 8-Step Process for LeadingChange (1995) or micro-level, e.g. Lewin’s 3-Step Model (1947, 1963). Lewin wasone of the first researcherswho investigated the procedure and effects of changes,especially the reactions of groups that have to face planned changes. According tohim, the process of change can be divided in 3 phases called ”unfreezing”, ”mov-ing” and ”refreezing”. Furthermore, themodel states individual levels of efficiencydepending on the current change phase (Lewin, 1947, p. 34). The following figureillustrates this development.
Figure 2: Theory of level of efficiency in change processes, following Lewin, 1963,p. 2017 in Mohr, 1997, p. 73.
103
Efficiency Analysis for Digitalised Working Systems of Truck Drivers
In order to explain where the change takes place exactly, the model of a workingsystem created by Hardenacke et al. is used (Hardenacke, et al., 1985). The fo-cus of the model is the work task which is derived by a superior mission of theorganization. To accomplish the working task, the human resource impinges onthe work object by using work equipment (Luczak, 1997, p. 13). An interactionbetween humans and the work equipment is necessary and requires a certainlevel of qualification for successful interaction. Besides the inputs into the work-ing system (e.g. energy, material and information) and the output factors (e.g.work results), there are exogenous factors influencing the working system andsubsystems like thephysical and social environment (Schultetus, 2006, p. 15). Thetruck drivers examined in this paper have to face changes in digital innovationsrelated to track and trace systems. Thework equipment is amobile device used todisplay work tasks for the truck driver e.g. to load a certain amount of containersfor a grocery store and deliver it within a given time window. In order to fulfillthe task, the truck driver has to scan all relevant 1D barcodes which are attachedto the containers, load them into his truck and record differences between thedata provided by the mobile device and the determined condition of transportedgoods.
3 Efficiency analysis for digitalised working systems oftruck drivers
There is a wide variety of definitions for the term efficiency in scientific litera-ture. Forsund and Hjalmarsson already described in 1974: ”Efficiency is a wordeasy to use, but very difficult to give a precise operational meaning (Forsundand Hjalmarsson, 1974, p. 152).” Current research approaches postulate almostunanimously that there is no uniformly widespread definition for the conceptof efficiency in business literature (Tzika, et al., 2017, p. 530). Efficiency in thisresearch is understood as the relationship between the results achieved (outputs)and the resources used (inputs) for this purpose (DIN EN ISO 9000, 2000, p. 22). Tomeasure efficiency quantitatively, performancemeasurement differs between keyfigures, parametric (e.g. Ordinary Least Squares, Stochastic Frontier Analysis) andnon-parametric efficiency analysis (e.g. (Stochastic) Data Envelopment Analysis).The main difference is that non-parametric methods do not require a functionalrelationship between input and output factors whereas parametric methods do(Burger, 2008, p. 48).
104
3 Efficiency analysis for digitalised working systems of truck drivers
3.1 Data Envelopment Analysis
The data envelopment analysis (DEA) method is a non-parametric optimizationmethod ofmathematical programming formeasuring the relative efficiency of de-cision making units (DMUs) that have multiple inputs and outputs. A basic modelwas introduced by Charnes et al. (Charnes, et al., 1978, pp. 429–444) and is basedon Pareto’s definition of economic efficiency (Pareto, 1897), Koopmans activityanalysis concept (Koopmans, 1951) together with the publications of Debreu andFarrell dealing with radial efficiency measurement (Farrell, 1957; Debreu, 1951).The increasing use in scientific research is related to the extensive scope of appli-cation where DMUs can be organizations or organizational units such as banks(Chen, et al., 2018; Huang, et al., 2018), universities (Lee and Worthington, 2016;Yang, et al., 2018), airlines (Omrani and Soltanzadeh, 2016; Chen, et al., 2017),employees (Khodamoradi, et al., 2016; Dugelova and Strenitzerova, 2015; AzadehandMousavi, 2014; Du, 2013; Zbranek, 2013; Shirouyehzad, et al., 2012) or nations(Malhotra and Malhotra, 2009). Further advantages beyondmultiple inputs andoutputs included are the facts that DEA is solely based on empirical data withoutthe need of a priori existing production function and the fact that there is no needto weight factors, as this is done endogenously by the mathematics optimizationmodel. The production process or throughput is seen as a black box. The basicmathematical notation is as follows (Wilken, 2007, p. 35):
eff DMU0 =virtual ouputs of DMU0
virtual inputs of DMU0=
∑sj=1 u0.jy0.j∑mi=1 v0.ix0.i
(1)
eff Abbreviation for efficiency
DMU0 DMUwith index 0 as exemplary decision unit
s: Number of outputs to each DMU
m: Number of inputs to each DMU
u0.j : The weight assigned to the output
v0.i: The weight assigned to the input
y0.j : Amount of the j output produced by DMU 0
x0.i: Amount of the i input consumed by DMU 0
105
Efficiency Analysis for Digitalised Working Systems of Truck Drivers
The basic idea is to calculate an efficiency frontier that is used as a best practiceinput-output-combination for the underlying production scenario. DMUs that areon the efficiency frontier are considered as 100% efficient, whereas the relativeinefficiency of a DMU can be determined by measuring the distance betweenindividual DMU performance and the efficiency frontier. As the equation aboverequires n calculations for all n DMUs, the optimization problem is solved bya linear programming formulation (Charnes, et al., 1978, pp. 435–437). Theoptimization method can furthermore be based on constant returns on scale(CRS) in the CCR-model (Charnes, et al., 1978) or variable returns on scale (VRS)in the BCC-model (Banker, et al., 1984) and in each case with an input or outputorientation.
3.2 Selection of applicable inputs and outputs for DEA
In this paper we analyze the efficiency of truck drivers working in the sector ofdistribution logistics for a large German food retailing company. Their transporta-tion unit is responsible for delivering food and non-food items from the centrallogistics center to all grocery shops of the relevant delivery area complete and ontime as well as for returning recyclable materials plus empty load carriers fromthe grocery shops back to the logistics center. To get a clear idea of the underlyingscenario, the description is divided in financial flows and physical material flowsrelated to the retailers supply chain.
From a financial point of view, the sales unit of the retailing company is chargedby the logistics unit with individual service costs based on cost rates determinedat the beginning of a financial year. It can be seen as a revenue stream for thelogistics unit. To deliver all orders, the food retailing company uses solely carriersof different sizes whereby the tours are planned by the dispatchers of the retailingcompany. The carriers receive a payment for the physical distribution which isbased on transported units. On the other hand the carriers have to pay for goodsdamaged in the delivery process.
Focusing the daily business of professional truck drivers and the physicalmaterialflows, the work process can be divided in the following steps: (1) Register at theresponsible dispatcher in the logistics center, (2) Receive data for delivery tourthroughmobile device, (3) Load the truck by scanning barcodes on load carriersthroughmobile device, (4) Receive freight documents from dispatcher, (5) Driveto n grocery shops, (6) Unload cargo at n grocery shops, (7) Return recyclable
106
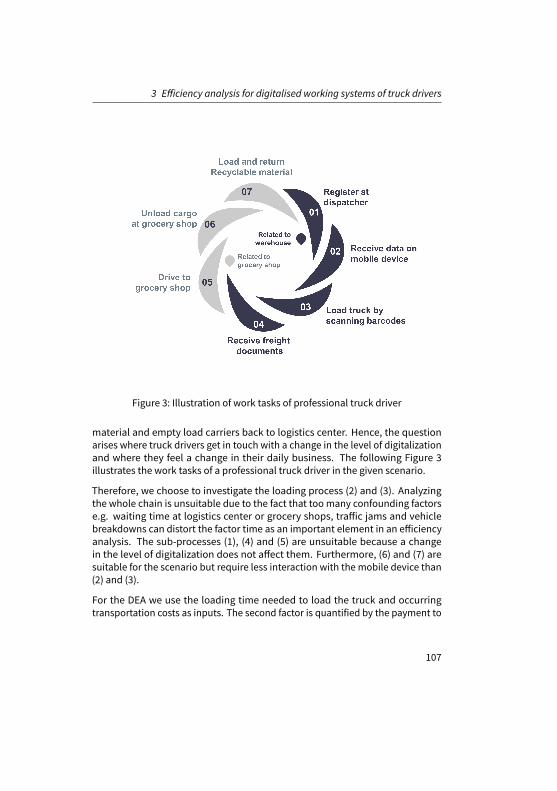
3 Efficiency analysis for digitalised working systems of truck drivers
Figure 3: Illustration of work tasks of professional truck driver
material and empty load carriers back to logistics center. Hence, the questionarises where truck drivers get in touch with a change in the level of digitalizationand where they feel a change in their daily business. The following Figure 3illustrates the work tasks of a professional truck driver in the given scenario.
Therefore, we choose to investigate the loading process (2) and (3). Analyzingthe whole chain is unsuitable due to the fact that toomany confounding factorse.g. waiting time at logistics center or grocery shops, traffic jams and vehiclebreakdowns can distort the factor time as an important element in an efficiencyanalysis. The sub-processes (1), (4) and (5) are unsuitable because a changein the level of digitalization does not affect them. Furthermore, (6) and (7) aresuitable for the scenario but require less interaction with the mobile device than(2) and (3).
For the DEA we use the loading time needed to load the truck and occurringtransportation costs as inputs. The second factor is quantified by the payment to
107
Efficiency Analysis for Digitalised Working Systems of Truck Drivers
carriers for transported units. Choosing the whole payment is unsuitable as thisdoes not take into account that only a sub-process, the process of loading thetruck, is analyzed. Therefore, we use a percentage of the whole payment basedon the ratio of needed loading time and total time of a tour, whereby latter isthe planned total time of a tour based on the calculation of the route planningsoftware to avoid confounding factors like traffic jams or waiting time.
Relevant transportation costs =Actual loading time
P lanned total time of tour×
Total payment
(2)
As outputs we use 3 factors. The first one is the invoice of the transportationunit of the retailing company to the sales unit for all rendered logistics serviceswhere we do not use the whole amount but the equal percentage as for the inputtransportation costs. It can be seen as a revenue for the logistics sector whichis often used as an output factor for performance evaluation of logistics firmsbased on a DEAmodel (Hong and Xu, 2015; Momeni, et al., 2015; Tang, et al., 2015;Ye, 2015). The second output factor is the monetary value of all goods that aredamaged or destroyed while loading the truck. In this case we do not use thesales prices of goods that can be found in the grocery shops but the purchaseprice of the food retailing company which presents the product value at the timeof damage. As high output values increase the efficiency of DMUs we use thereciprocal calculated by the following formula.
Damage value of DMU = Max.observed damage−damage caused by DMU
(3)
The third output factor is related to the transport units that are loaded into thetruck. We could simply use the amount of units and argue that when loadinga roller container (square measure 72cm x 81,5cm and max. load 500kg) or abigger pallet (squaremeasure: 120cm x 80cm andmax. load 1500kg) one barcodescan is required and therefore, the effort is equal. But with regard to the driverloading his truck, the different weights of the transport units cause a fundamentaldifference in the effort of handling. We take this unequal effort into account byrating loading equipment based on their geometrical square measure. Therefore,
108
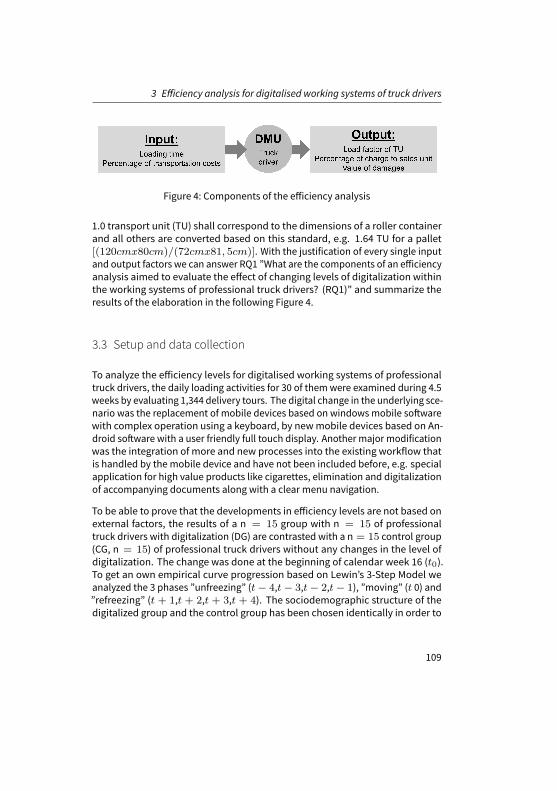
3 Efficiency analysis for digitalised working systems of truck drivers
Figure 4: Components of the efficiency analysis
1.0 transport unit (TU) shall correspond to the dimensions of a roller containerand all others are converted based on this standard, e.g. 1.64 TU for a pallet[(120cmx80cm)/(72cmx81, 5cm)]. With the justification of every single inputand output factors we can answer RQ1 ”What are the components of an efficiencyanalysis aimed to evaluate the effect of changing levels of digitalization withinthe working systems of professional truck drivers? (RQ1)” and summarize theresults of the elaboration in the following Figure 4.
3.3 Setup and data collection
To analyze the efficiency levels for digitalised working systems of professionaltruck drivers, the daily loading activities for 30 of themwere examined during 4.5weeks by evaluating 1,344 delivery tours. The digital change in the underlying sce-nario was the replacement of mobile devices based on windows mobile softwarewith complex operation using a keyboard, by newmobile devices based on An-droid software with a user friendly full touch display. Another major modificationwas the integration of more and new processes into the existing workflow thatis handled by the mobile device and have not been included before, e.g. specialapplication for high value products like cigarettes, elimination and digitalizationof accompanying documents along with a clear menu navigation.
To be able to prove that the developments in efficiency levels are not based onexternal factors, the results of a n = 15 group with n = 15 of professionaltruck drivers with digitalization (DG) are contrasted with a n = 15 control group(CG, n = 15) of professional truck drivers without any changes in the level ofdigitalization. The change was done at the beginning of calendar week 16 (t0).To get an own empirical curve progression based on Lewin’s 3-Step Model weanalyzed the 3 phases ”unfreezing” (t− 4,t− 3,t− 2,t− 1), ”moving” (t 0) and”refreezing” (t + 1,t + 2,t + 3,t + 4). The sociodemographic structure of thedigitalized group and the control group has been chosen identically in order to
109
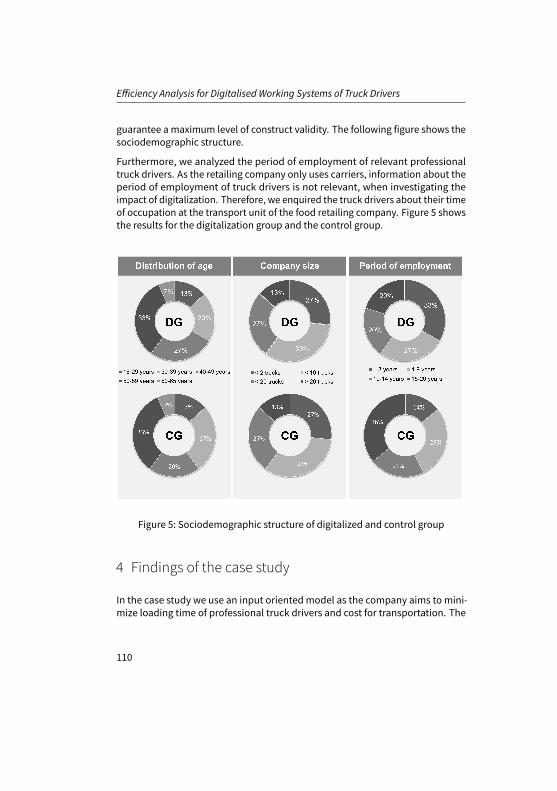
Efficiency Analysis for Digitalised Working Systems of Truck Drivers
guarantee a maximum level of construct validity. The following figure shows thesociodemographic structure.
Furthermore, we analyzed the period of employment of relevant professionaltruck drivers. As the retailing company only uses carriers, information about theperiod of employment of truck drivers is not relevant, when investigating theimpact of digitalization. Therefore, we enquired the truck drivers about their timeof occupation at the transport unit of the food retailing company. Figure 5 showsthe results for the digitalization group and the control group.
Figure 5: Sociodemographic structure of digitalized and control group
4 Findings of the case study
In the case study we use an input orientedmodel as the company aims to mini-mize loading time of professional truck drivers and cost for transportation. The
110
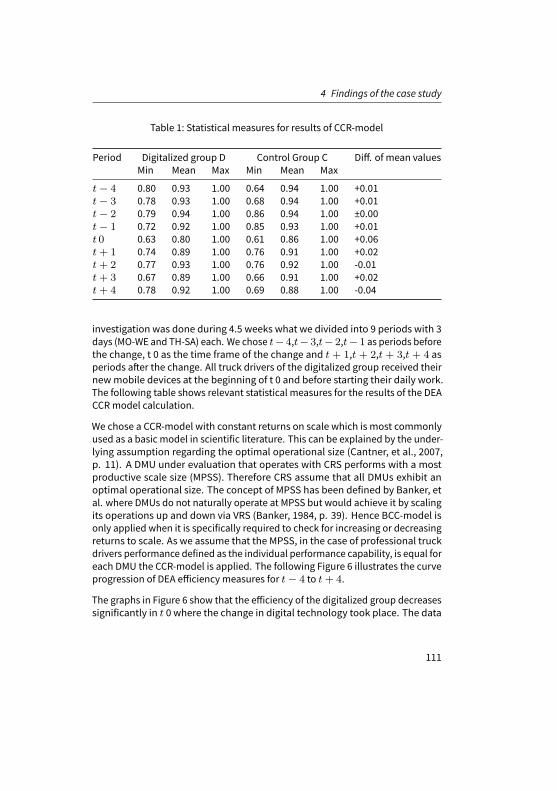
4 Findings of the case study
Table 1: Statistical measures for results of CCR-model
Period Digitalized group D Control Group C Diff. of mean valuesMin Mean Max Min Mean Max
t− 4 0.80 0.93 1.00 0.64 0.94 1.00 +0.01t− 3 0.78 0.93 1.00 0.68 0.94 1.00 +0.01t− 2 0.79 0.94 1.00 0.86 0.94 1.00 ±0.00t− 1 0.72 0.92 1.00 0.85 0.93 1.00 +0.01t 0 0.63 0.80 1.00 0.61 0.86 1.00 +0.06t+ 1 0.74 0.89 1.00 0.76 0.91 1.00 +0.02t+ 2 0.77 0.93 1.00 0.76 0.92 1.00 -0.01t+ 3 0.67 0.89 1.00 0.66 0.91 1.00 +0.02t+ 4 0.78 0.92 1.00 0.69 0.88 1.00 -0.04
investigation was done during 4.5 weeks what we divided into 9 periods with 3days (MO-WE and TH-SA) each. We chose t− 4,t− 3,t− 2,t− 1 as periods beforethe change, t 0 as the time frame of the change and t + 1,t + 2,t + 3,t + 4 asperiods after the change. All truck drivers of the digitalized group received theirnewmobile devices at the beginning of t 0 and before starting their daily work.The following table shows relevant statistical measures for the results of the DEACCRmodel calculation.
We chose a CCR-model with constant returns on scale which is most commonlyused as a basic model in scientific literature. This can be explained by the under-lying assumption regarding the optimal operational size (Cantner, et al., 2007,p. 11). A DMU under evaluation that operates with CRS performs with a mostproductive scale size (MPSS). Therefore CRS assume that all DMUs exhibit anoptimal operational size. The concept of MPSS has been defined by Banker, etal. where DMUs do not naturally operate at MPSS but would achieve it by scalingits operations up and down via VRS (Banker, 1984, p. 39). Hence BCC-model isonly applied when it is specifically required to check for increasing or decreasingreturns to scale. As we assume that the MPSS, in the case of professional truckdrivers performance defined as the individual performance capability, is equal foreach DMU the CCR-model is applied. The following Figure 6 illustrates the curveprogression of DEA efficiency measures for t− 4 to t+ 4.
The graphs in Figure 6 show that the efficiency of the digitalized group decreasessignificantly in t 0 where the change in digital technology took place. The data
111
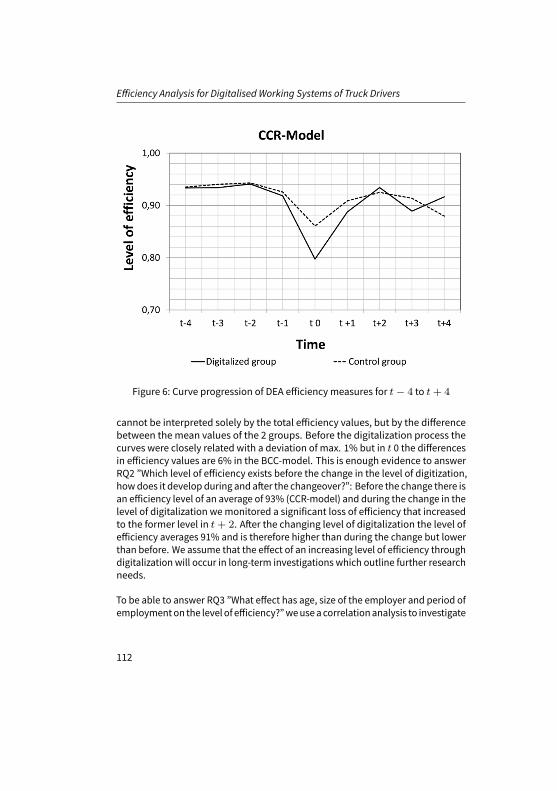
Efficiency Analysis for Digitalised Working Systems of Truck Drivers
Figure 6: Curve progression of DEA efficiency measures for t− 4 to t+ 4
cannot be interpreted solely by the total efficiency values, but by the differencebetween themean values of the 2 groups. Before the digitalization process thecurves were closely related with a deviation of max. 1% but in t 0 the differencesin efficiency values are 6% in the BCC-model. This is enough evidence to answerRQ2 ”Which level of efficiency exists before the change in the level of digitization,howdoes it develop during and after the changeover?”: Before the change there isan efficiency level of an average of 93% (CCR-model) and during the change in thelevel of digitalization wemonitored a significant loss of efficiency that increasedto the former level in t+ 2. After the changing level of digitalization the level ofefficiency averages 91% and is therefore higher than during the change but lowerthan before. We assume that the effect of an increasing level of efficiency throughdigitalization will occur in long-term investigations which outline further researchneeds.
To be able to answer RQ3 ”What effect has age, size of the employer and period ofemploymenton the level of efficiency?”weuseacorrelationanalysis to investigate
112

4 Findings of the case study
the statistical relationship between the level of efficiency and sociodemographicattributes. We chose the efficiency values of t 0 (CCR-model) for the group withdigitalization as it is the period where the change in the level of digitalizationtakes place. A high efficiency in this period proves that the driver is affected bythe change but still efficient in the work he does.
The correlations coefficient r for the relationship of ”age in years” (x) and ”levelefficiency” (y) isr = 0.1496. Therefore, there is a lowstatistical linear relationshipbetween these 2 factors. The following figure shows the correlation graphs forthe relationship of ”total trucks of company” for the carrier’s size (x) and ”level ofefficiency” (y) as well as the relationship of ”period of employment” at the foodretailing company and not as a truck driver (x) and ”level of efficiency” (y).
Due to the correlation coefficients there is a strong positive linear statistical re-lationship between a company’s size and the level of efficiency during a digitalchange. Furthermore, we can determine a strong positive linear statistical rela-tionship between the period of employment in a certain occupation and the levelof efficiency during a digital change. These findings answer RQ3.
Figure 7: Correlation graphs for company size and period of employment
113
Efficiency Analysis for Digitalised Working Systems of Truck Drivers
5 Discussion and implications for management
The curve progression of the analysis indicates a loss of efficiency during thefirst days of the change which has been explained in the previous chapter. Inaddition, the investigation shows that the initial level is not constantly reached inthe periods after. Due to the limited periods included into the analysis we cannotanswer the question if the increasing level of digitalization can increase the levelof efficiency for this case.
The results of the correlation analysis indicate that age is less relevant when dis-cussing the changing levels of digitalization for professional truck drivers. Onereason for this is that mobile devices like mobile phones became a part of ourevery day’s life, independent of our age or social status. More than 10 years agothe use of internet and mobile devices was interpreted as a border that had to becrossed and where users had to intentionally go to. This can be understood byreenacting themotto of the internet conference re:publica in 2007 called ”living inthe internet”. Digital devices and the internet are no parallel worlds to go into anymore, it rather became amedium that permanently and unconsciously expandsthe reality we are living in. All of the professional truck drivers investigated inthis case possess a private smart phone and are therefore used to the full touchdisplay introduced with themobile devices. A recommendation for IT businessunits and software engineers is to design virtual dialogues onmobile devices ascommonplace as possible. For HR management our analysis gives indicationsthat the age of employers will less be a problem in regards to changing levels ofdigitalization. The results of the correlation analysis investigating the size of thecompany can be traced back to the fact that bigger carriers use supervisors tocoordinate truck drivers and their service at the logistics unit of the food retailingcompany. A direct contact for questions has a positive impact on the efficiencylevel when changing the levels of digitalization. This can be a hint for logisticsprocessmanagement to invest in experts helping all truck drivers by placing themon the area of outgoing goods in the logistics center toweaken the negative effectson efficiency levels. The last correlation analysis with the period of employmentat the food retailing company indicated that being proficient in the company’sprocesses can be essential for a successful analog-to-digital conversion. An em-ployment ofmore than 5 years and the knowledge gained in this time seems to bea valuable asset. This means that HRmanagement of carriers should concentrateon developing and promoting employee retention programs to lower fluctuationeffects of professional truck drivers. For the contracting authority, in our case the
114

6 Conclusion and outlook
food retailing company, it also means to provide a positive working environmentwith short waiting times, clear objectives and permanent support.
6 Conclusion and outlook
The aim of this paper was to develop and apply an efficiency analysis to eval-uate the effect of changing levels of digitalization within the working systemsof professional truck drivers. RQ1 ”What are the components of an efficiencyanalysis aimed to evaluate the effect of changing levels of digitalization withinthe working systems of professional truck drivers?” was answered by the devel-opment of a DEA analysis using loading time and percentage of transportationcosts as input factors plus load factor of TU, percentage of charge to sales unitand value of damage (reciprocal) as output factors. We applied the analysis inorder to evaluate the truck driver’s (DMU) performance in the logistics sector of afood retailing company. On the basis of this case study we answered RQ2 ”Whichlevel of efficiency exists before the change in the level of digitization, how doesit develop during and after the changeover?” by deriving the curve progressionof relative efficiency during 4.5 divided in 9 periods with 3 days each. Beforethe change there was an efficiency level of an average of 95% (BCC-model) andduring the change in the level of digitalization wemonitored a significant loss ofefficiency that increased to the former level in t+ 2. Finally RQ3 ”What effect hasage, size of the employer and period of employment on the level of efficiency?”was answered by correlation analysis comparing the level of efficiency during thechange in the level of digitalization (t 0) with the age of the truck drivers, the sizeof their employers and their period of employment at the German food retailer.We showed a low statistical linear relationship of age and efficiency plus a strongstatistical linear relationship of employer size and efficiency as well as period ofemployment and efficiency, always regarding the changing levels of digitalizationin the working system of professional truck drivers.
The contributions and implications presented in this article were taken from aquantitative (DEA analysis) and explanative (related to Lewin’s 3-Stage Model ofChange) approach, which is why the results have limitations and an enlargementof the scope would enable new insights in the future: We did not include furtherqualitative input and output factors like the satisfaction or motivation of truckdrivers. Moreover, we examined a change in the level of digitalization without anytraining methods applied to prepare the professional truck drivers.
115
Efficiency Analysis for Digitalised Working Systems of Truck Drivers
Therefore, research is necessary and interesting along the lines of the followingpossible research questions: (i) How can qualitative soft factors like employee’ssatisfaction and motivation be integrated in an efficiency analysis for profes-sional truck drivers? Current research approaches regarding human resourcemanagement include soft factors into DEA for efficiency measurement of employ-ees (Shirouyehzad, et al., 2012; Zbranek, 2013; Du, 2013; Azadeh and Mousavi,2014; Dugelova and Strenitzerova, 2015; Khodamoradi, et al., 2016). Furthermore,(ii) How and to which extend can training methods like seminar based trainingor self-studies with digital mock ups reduce negative effects in the level of effi-ciency when changing the level of digitalization for professional truck drivers?These questions would constitute interesting research pathways following thefirst quantitative results presented here.
Altogether, the presented analysis andmanagement implications have shown theimportance and value of a quantitative-empirical approach regarding the digitaltransition in specified logistics processes and human work contexts. This will bea long-term research and business practice question for the future of logistics.
References
Ahrens, D. (2016). “Neue Anforderungen im Zuge der Automatisierung von Produktionsprozessen:Expertenwissen und operative Zuverlässigkeit”. In: Arbeits- und Industriesoziologische Studien9.1, pp. 43–56.
Avent, R. (2014). “The third great wave”. In: The Economist Special Report, pp. 1–14.Azadeh, A. and A. Mousavi (2014). “The Impact of Job Security, Satisfaction and Stress on Perfor-
mance Assessment and Optimization of Generation Companies”. In: Journal of Loss Preventionin the Process Industries 32, pp. 343–348.
Banker, R. D. (1984). “Estimating most productive scale size using data envelopment analysis”. In:European Journal of Operational Research 17.1, pp. 35–44.
Banker, R. D., A. Charnes, and W. W. Cooper (1984). “Some Models for Estimating Technical andScale Inefficiencies in Data Envelopment Analysis”. In: Management Science 30.9, pp. 1078–1092.
Bauer, W. and S. Schlund (2015). “Wandel der Arbeit in indirekten Bereichen: Planung und Enge-neering”. In: Digitalisierung industrieller Arbeit. Ed. by H. Hirsch-Kreinsen, P. Ittermann, andJ. Niehaus. Baden-Baden: Nomos Verlagsgesellschaft, pp. 54–69.
Bitkom (2017). Digitalisierung der Logistik.Brynjolfsson, E. and A. McAfee (2014). The secondmachine age: Work, progress, and prosperity in a
time of brilliant technologies. New York: W.W. Norton & Company.Burger, A. (2008). “Produktivität und Effizienz in Banken: Terminologie, Methoden und Status quo”.
In: Frankfurt School – Working Paper Series No. 92.
116
REFERENCES
BVL (2017). “Logistik als Wissenschaft: Zentrale Forschungsfragen in Zeiten der vierten indus-triellen Revolution”. In: Positionspapier Bundesvereinigung Logistik (BVL) e. V.
Cantner, U., H. Hanusch, and J. Krüger (2007). Produktivitäts- und Effizienzanalyse: Der nicht-parametrische Ansatz. Berlin: Springer.
Charnes, A., W. W. Cooper, and E. Rhodes (1978). “Measuring the efficiency of decision makingunits”. In: European Journal of Operational Research 2.6, pp. 429–444.
Chen, Z., R. Matousek, and P. Wanke (2018). “Chinese bank efficiency during the global financialcrisis: A combined approach using satisficing DEA and Support Vector Machines?” In: The NorthAmerican Journal of Economics and Finance 43, pp. 71–86.
Chen, Z., P. Wanke, J. J. M. Antunes, and N. Zhang (2017). “Chinese airline efficiency under CO2emissions and flight delays: A stochastic network DEAmodel”. In: Energy Economics 68, pp. 89–108.
Debreu, G. (1951). “The Coefficient of Resource Utilization”. In: Econometrica 19.3, pp. 273–292.DIN EN ISO 9000 (2000). Qualitätsmanagementsysteme: Grundlagen und Begriffe. Berlin: Beuth.Dombrowski, U., C. Riechel, and M. Evers (2014). “Industrie 4.0: Die Rolle des Menschen in der
vierten industriellenRevolution”. In: Industrie4.0. Ed.byW.Kersten.SchriftenreihederHochschul-gruppe für Arbeits- und Betriebsorganisation e.V. (HAB). Berlin: Gito, pp. 129–153.
Du, J.-Y. (2013). “Staff performance appraisal based on data envelopment analysis (DEA)”. In:Journal of Chemical and Pharmaceutical Research 5.11, pp. 102–105.
Dugelova, M. and M. Strenitzerova (2015). “The Using of Data Envelopment Analysis in HumanResource Controlling”. In: Procedia Economics and Finance 26, pp. 468–475.
Eisenmann, M. and P. Ittermann (2017). “Hybride Dienstleistungen undWandel der Arbeit: Her-ausforderungen und Perspektiven in der Logistik”. In: Soziologisches Arbeitspapier 50, pp. 1–46.
Farrell, M. J. (1957). “Themeasurement of productive efficiency”. In: Journal of Royal StatisticalSociety 120.3, pp. 253–290.
Forsund, F. R. and L. Hjalmarsson (1974). “On the Measurement of Productive Efficiency”. In: TheSwedish Journal of Economics 76.2, pp. 141–154.
Hardenacke,H.,W.Peetz, andG.Wichardt (1985).Arbeitswissenschaft. StudienbücherderWirtschaft.München: Hanser.
Hirsch-Kreinsen, H. (2015). “Gestaltungsperspektiven von Produktionsarbeit bei Industrie 4.0”. In:Arbeit in der digitalisierten Welt. Ed. by C. Schlick. Frankfurt amMain: Campus.
Hirsch-Kreinsen, H., P. Ittermann, and J. Niehaus, eds. (2015). Digitalisierung industrieller Arbeit:Die Version Industrie 4.0 und ihre sozialen Herausforderungen. 1. Auflage. Baden-Baden: NomosVerlagsgesellschaft.
Hirsch-Kreinsen, H., M. ten Hompel, P. Ittermann, J. Dregger, J. Niehaus, T. Kirks, and B. Mättig(2018). “”Social Manufacturing and Logistics”: Arbeit in der digitalisierten Produktion”. In:Zukunft der Arbeit. Ed. by S. Wischmann and E. Hartmann. Berlin: Springer Vieweg.
Hong, H. and D. Xu (2015). “Performance evaluation of logistics firms based on DEAmodel”. In:International Journal of Services, Technology and Management 21.4-6, pp. 199–213.
Huang, T.-H., K.-C. Chen, and C.-I. Lin (2018). “An extension from network DEA to copula-basednetwork SFA: Evidence from the U.S. commercial banks in 2009”. In: The Quarterly Review ofEconomics and Finance 67, pp. 51–62.
Huchler, N. (2016). “Die ”Rolle desMenschen” inder Industrie 4.0: Technikzentrierter vs. humanzen-trierter Ansatz”. In: Arbeits- und Industriesoziologische Studien 9.1, pp. 57–79.
117
Efficiency Analysis for Digitalised Working Systems of Truck Drivers
Kagermann, H., W.-D. Lukas, and W. Wahlster (2011). “Industrie 4.0: Mit dem Internet der Dingeauf demWeg zur 4. industriellen Revolution”. In: VDI Nachrichten 13.
Kersten, W., ed. (2014). Industrie 4.0: Wie intelligente Vernetzung und kognitive Systeme unsereArbeit verändern. Schriftenreihe der Hochschulgruppe für Arbeits- und Betriebsorganisatione.V. (HAB). Berlin: Gito.
Khodamoradi, M., M.-H. Behzadi, and M. Rostamy-MaleKhalifeh (2016). “Evaluating of staff’sperformance with job satisfaction and Organizational Commitment approach by DEA: Casestudy: Khuzestan Oxin Steel Company”. In: International Journal of Data Envelopment Analysis4.2, pp. 945–949.
Klumpp, M. (2018). “Automation and artificial intelligence in business logistics systems: Humanreactions and collaboration requirements”. In: International Journal of Logistics Research andApplications 21.3, pp. 224–242.
Koch, V., R. Geissbauer, S. Kuge, and S. Schrauf (2014). Chancen und Herausforderungen der viertenindustriellen Revolution. Frankfurt and München: Pwc und Strategy&.
Koopmans, T. C., ed. (1951a). Activity Analysis of Production and Allocation: Proceeding of a Confer-ence. London: Wiley.
Koopmans, T. C. (1951b). “An analysis of production as an efficient combination of activities”. In:Activity Analysis of Production and Allocation. Ed. by T. C. Koopmans. London: Wiley, pp. 33–97.
Lee, B. L. andA. C.Worthington (2016). “A networkDEAquantity andquality-orientated productionmodel: An application to Australian university research services”. In: Omega 60, pp. 26–33.
Lewin, K. (1947). “Frontiers in Group Dynamics”. In: Human Relations 1.1, pp. 5–41.Luczak, H. (1997). “Kerndefinition und Systematiken der Arbeitswissenschaft”. In: Handbuch
Arbeitswissenschaft. Ed. by H. Luczak, W. Volpert, and T. Müller. Stuttgart: Schäffer-Poeschel,pp. 11–19.
Luczak, H., W. Volpert, and T. Müller, eds. (1997).Handbuch Arbeitswissenschaft. Stuttgart: Schäffer-Poeschel.
Malhotra, R. and D. K. Malhotra (2009). “Evaluating the efficiency of European Union integration”.In: International Journal of Commerce and Management 19.3, pp. 233–252.
Markillie, P. (2012). “A third industrial revolution”. In: The Economist Special Report, pp. 1–10.Mohr, N. (1997). Kommunikation und organisatorischer Wandel. Heidelberg: Gabler Verlag.Momeni, E., M. Azadi, andR. F. Saen (2015). “Measuring the efficiency of third party reverse logistics
provider in supply chain by multi objective additive network DEA model”. In: InternationalJournal of Shipping and Transport Logistics 7.1, pp. 21–41.
Omrani, H. and E. Soltanzadeh (2016). “Dynamic DEAmodels with network structure: An applica-tion for Iranian airlines”. In: Journal of Air Transport Management 57, pp. 52–61.
Pareto, V. (1897). Cours d’économie politique. Paris.Rifkin, J. (2011). The third industrial revolution: How lateral power is transforming energy, the
economy, and the world. New York: Palgrave Macmillan.Schlick, C., ed. (2015). Arbeit in der digitalisierten Welt: Beiträge der Fachtagung des BMBF 2015. 1.
Aufl. Frankfurt amMain: Campus.Schultetus, W. (2006). Arbeitswissenschaft von der Theorie zur Praxis: Arbeitswissenschaftliche
Erkenntnisse und ihr wirtschaftlicher Nutzen. Köln: Wirtschaftsverl. Bachem.Shirouyehzad, H., F. Hosseinzadeh Lotfi, M. B. Aryanezhad, and R. Dabestani (2012). “A Data
Envelopment Analysis Approach for Measuring Efficiency of Employees: A case study”. In: TheSouth African Journal of Industrial Engineering 23.1, pp. 191–201.
118
REFERENCES
Stowasser, S. and T. Jeske (2015). “Arbeitswelt der Zukunft”. In: Arbeit in der digitalisierten Welt.Ed. by C. Schlick. Frankfurt amMain: Campus.
Tang, L., X. Huang, Y. Peng, and Z. Xiao (2015). “Analysis and evaluation of relative efficiency ofwarehousing and distribution operations based onmixed DEAmodel”. In: Chemical EngineeringTransactions 46, pp. 583–588.
Tzika, A., S. Zelewski, and M. Klumpp (2017). “Effizienzentwicklung von Hochschulen in Deutsch-land”. In: Hochschuleffizienz. Ed. by S. Zelewski, M. Klumpp, and N. Akca. Berlin: Logos Berlin,pp. 517–600.
Vahs, D. and A.Weiand (2010).WorkbookChange-Management: Methoden und Techniken. Stuttgart:Schäffer-Poeschel.
van Eck, N. J. and L. Waltman (2010). “Software survey: VOSviewer, a computer program forbibliometric mapping”. In: Scientometrics 84.2, pp. 523–538.
Wee, D., R. Kelly, J. Cattel, and M. Breunig (2015). Industry 4.0: How to navigate digitization of themanufacturing sector. München et al.: McKinsey & Company.
Wilken, R. (2007). Dynamisches Benchmarking: Ein Verfahren auf Basis der Data EnvelopmentAnalysis. Wiesbaden: Deutscher Universitäts-Verlag.
Will-Zocholl, M. (2016). “Die Verlockung des Virtuellen: Reorganisation von Arbeit unter Bedingun-gen der Informatisierung, Digitalisierung und Virtualisierung”. In: Arbeits- und Industriesoziolo-gische Studien 9.1, pp. 25–42.
Windelband, L. and B. Dworschak (2015). “Arbeit und Kompetenzen in der Industrie 4.0: An-wendungsszenarien Instandhaltung und Leichtbaurobotik”. In: Digitalisierung industriellerArbeit. Ed. by H. Hirsch-Kreinsen, P. Ittermann, and J. Niehaus. Baden-Baden: Nomos Verlags-gesellschaft, pp. 71–86.
Wischmann, S. and E. Hartmann, eds. (2018). Zukunft der Arbeit: Eine praxisnahe Betrachtung.Berlin: Springer Vieweg.
Wróbel-Lachowska, M., Z. Wisniewski, and A. Polak-Sopińska (2018). “The role of the lifelonglearning in Logistics 4.0”. In: International Conference on AppliedHuman Factors and Ergonomics1, pp. 402–409.
Yang, G.-l., H. Fukuyama, and Y.-y. Song (2018). “Measuring the inefficiency of Chinese researchuniversities based on a two-stage network DEAmodel”. In: Journal of Informetrics 12.1, pp. 10–30.
Ye, Y. Y. (2015). “Performance evaluation of logistics enterprise based on DEAmodel”. In: Proceed-ings of the International Conference on Management, Information and Educational Engineering,MIEE 2014 1.
Zbranek,P. (2013). “Dataenvelopmentanalysis asa tool for evaluationof employees’ performance”.In: Acta Oeconomica et Informatica 16.1, pp. 12–21.
Zelewski, S., M. Klumpp, and N. Akca, eds. (2017). Hochschuleffizienz: Konzeptionelle Heraus-forderungen und Lösungsansätze aus Sicht der betriebswirtschaftlichen Forschung. Berlin: LogosBerlin.
Zuboff, S. (2010). Creating value in the age of distributed capitalism. McKinsey Quarterly.
119

Alternative Development Paths forSupply Chains in 2030
Denis Daus1, Ana Cristina Barros2, Dimitra Kalaitzi3, Victoria Muerza4, Irene Mar-chiori 5
1 – Fraunhofer Institute for Material Flow and Logistics (IML)
2 – INESC TEC
3 – Aston University
4 – Zaragoza Logistics Center (ZLC)
5 – Institute of Industrial Technologies and Automation - National Research Council (ITIA-CNR)
Many different megatrends such as digitalization, are posing specific challengesand opportunities for supply chains creating the urgent need to adapt and rethinkthe way they are organized. This paper aims to define development paths (DPs),which constitute projections into the future. The DPs are based on the analysis ofmegatrends, which might have an impact on the design of supply chains until theyear 2030. The results are 51 possible DPs, which are derived from the identifiedmegatrends and clustered under 22 descriptors, which are in turn assigned tothe PESTLE (Political, Economic, Social, Technological, Legal, and Environmental)dimensions. These DPs consider the underlying criteria reasonability and conceiv-ability. They describe how the future might look like in 2030 and can be used toaddress developments, challenges and opportunities that may arise in supplychains. Thus, this paper creates the starting basis for further research that dealswith the creation of holistic industrial scenarios affecting future supply chains.
Keywords: Supply Chain; Megatrends; Development Paths; ScenariosFirst recieved: 28.May.2018 Revised: 22.Jun.2018 Accepted: 11.Jul.2018
121
Alternative Development Paths for Supply Chains in 2030
1 Introduction
The biggest trader and exporter is the political and economic European Union(EU) of 28 member states. It is expected that in the next 10-15 years 90% of theglobal economic growth will come from outside the EU (ALICE, 2014). Therefore,on one hand, the EU companies have to be able to adapt and gain a competi-tive advantage by accessing these newmarkets. On the other hand, companiesmust configure accordingly their supply chains to respond efficiently to incomingchallenges, such as customization and scarcity of resources. Digitalization accom-panied by acceleration of technological developments affect different industries,such as process, discrete manufacturing and logistics industry that are significantsectors for the EU’s economy.
The process industries are industries where the production processes are eithercontinuous, or the batches of materials are indistinguishable (Institute of Indus-trial and Systems Engineers, 2018). The product is created by using a formula torefine the rawmaterials leaving no way to break down the final product into itsbasic components (Cole and O’Donnell, 2017).
Different divisions of the process industry sector such as chemicals, minerals non-ferrous metals, are united under SPIRE - Sustainable Process Industry throughResource and Energy Efficiency (Tello and Weerdmeester, 2012). These divisionscomprise more than 450,000 companies, employ 6.8 million people and have ayearly sales volume of more than EUR 1.6 billion. The common feature betweenthese types of companies is the high dependence on resources (e.g. energy). Theprocess industry is important for Europe since it covers 20% of the overall Euro-pean industry in terms of employment and sales volume (Tello andWeerdmeester,2012).
The discrete manufacturing sector has 29.7 million employees in over 2 millioncompanies generating a turnover of EUR6.98 billion and a value added nearly toEUR 1.63 billion; the sector represents 17% of the EU GDP (EFFRA, 2013). Com-panies in this sector produce distinct items that can be easily counted and theproducts are measurable in distinct units.
The top five branches for value added and employment in the discrete manu-facturing sector are machinery and equipment, food products, metal products,motor vehicles and electric equipment (EFFRA, 2013).
As reportedby Eurostat and the alliance for European Logistics, the logistics sectorconstitutes the single biggest industry in Europe: it creates 7 million employees
122
1 Introduction
and the revenue per year is more than EUR 900 billion, representing around 7%of total European GDP (Savills Investment Management, 2016).
In order to address these challenges and benefit from the opportunities providedby megatrends, companies use mechanisms such as collaboration and reconfig-uration of supply chains. Berger (2015) identified the top ten trends impactingthe supply chain: (i) rising customer requirements regarding reliability, (ii) risingcustomer requirements regarding flexibility, (iii) increasing demand volatility, (iv)rising customer requirements regarding lead times, (v) rising customer require-ments regarding cost, (vi) increasing uncertainty, (vii) increasing complexity, (viii)increasing globalization, (ix) increasing heterogeneous customer requirements,and (x) increasing speed of change. Cost and reliability are revealed as the mostimportant targets in supply chains (Berger, 2015). In the future, lead time andflexibility will also have a high importance. More recently, Kersten et al. (2017)analyzed the trends and opportunities in supply chain management that lead todigital transformation opportunities from a twofold perspective: endogenousand exogenous. Endogenous trends include: digitalization of business processes,business analytics, transparency in the supply chain, automation, networking/collaboration, and decentralization. Exogenous trends comprise: cost pressure,demand fluctuations, government regulations/ compliance, individualization,staff shortages, risks/ interruptions, complexity, sustainability, and changed con-sumer behavior.
The analysis of challenges and opportunities in the supply chain has generallybeen addressed in the literature by focusing on one or several dimensions. Forexample, Zhong, et al. (2016) focus on Big Data technology and identify cur-rent challenges, opportunities and future perspectives from six aspects: datacollection, data transmission, data storage, processing, decision-making, and ap-plications. Similarly, Bechtsis, et al. (2017) study the impact of Automated GuidedVehicles for a sustainable supply chain. Barbosa-Póvoa, da Silva and Carvalho(2018) include three dimensions (economic, environmental and social) in theiranalysis to identify opportunities and challenges from an operational perspective.However, few studies have considered other dimensions (e.g. legal, political).
Challenges increment the complexity of supply chains in three main aspects:operational, logical and administrative (Yami, 2018). According to Yami (2018),a study carried out in 2006 performed a ranking of complexity drivers in thesupply chain leading to the following result: product/ services, customers, directmaterials, ship-to locations, manufacturing locations, suppliers, and distribution
123

Alternative Development Paths for Supply Chains in 2030
centers. The actions focused on the control of the complexity of the supply chainthat will have a positive impact in the competitiveness of the firm.
In this regard, handling change is an integral part of managing supply chains.However, the speed of change is so fast that it is difficult to identify where tofocus the company’s management resources. Under this uncertain environmenta framework for the identification of future scenarios in the supply chain has beendeveloped. The framework comprises a PESTLE analysis to identify megatrendsthat interact to create the challenges and opportunities future supply chainsmight face. This paper uses the process, discrete manufacturing and logisticsindustries as input in order to be able to analyzemegatrends fromdifferent pointsof view. The results of this paper are final DPs that consider these three industrieslike a single system. This approach provides the opportunity to create genericDPs, which are required to build industrial scenarios.
This paper is divided into five sections. Section 2 includes a literature reviewrelated to scenario development in the field of supply chain management (SCM).Section 3 describes the methodology developed for the definition of DPs. Thedefined DPs are summarized in Section 4 and elaborated in detail for the techno-logical dimension in Section 5. Section 6 entails the conclusion and an outlookon further research.
2 Literature Review
Today, supply chains face several challenges and opportunities, such as globaliza-tion and emerging technologies that change and shape the future of industries.Thus, it is crucial for companies to develop robust strategies and prepare for thefuture (Singh, 2004; Melnyk, et al., 2009). To this end, scenario planning is themost appropriate approach for a long-term planning to support decision makingin uncertain situations (Schoemaker, 1993).
Scenario planning has been utilized by several studies in the field of SCM (e.g.Mazzarino, 2012; PwC, 2009; vonderGracht andDarkow, 2010). As for theplanninghorizon, most of the papers in the field of SCM focus on a range of 8–10 years(e.g. von der Gracht and Darkow, 2013) and a few take into account a planninghorizonofmore than10 years (Jiang, Kleer andPiller, 2017). Regarding the contextof the scenarios, the focus of those papers is mainly on the logistics industry(e.g. DHL, 2012; von der Gracht and Darkow, 2016). There are a few papers
124
3 Methodology
that develop scenarios for the discrete manufacturing industry (e.g. Arora andPutcha, 2013; Jiang, Kleer and Piller, 2017) and process industry (e.g. Willigensand von der Gracht, 2013). To the best of our knowledge, there is not any study onindustry scenarios that support decision-making in all of these three industriesso that companies could take a holistic perspective into consideration. Thisrequires amore thorough approach tomanage long-term planning in the process,discrete manufacturing and logistics industry. Our research closes this researchgap by developing alternative DPs that consider all the three aforementionedindustries.
Scenario publications mainly use the Delphi technique to develop and presentonly the final scenarios (e.g. von der Gracht and Darkow, 2010; Jiang, Kleerand Piller, 2017). In the contrary, our study follows the Gausemeier and Plass(2014) approach, which is described in the methodology section. This paperalso presents potential future DPs that enable companies to recognize differentdevelopments based onmegatrends. From the DPs final scenarios, which reflectthe overall system relations between the chosen dimensions, can be developedin further research.
The central idea of developing alternative paths for long-term planning is to leaddecision makers to specific directions within the PESTLE dimensions and providesupport in uncertain times (Powell, 1992). However, most of the studies giveemphasis mainly on the environmental dimension (e.g. Arora and Putcha, 2013;von der Gracht and Darkow, 2013; von der Gracht and Darkow, 2016; PwC, 2009).Only a few studies (e.g. DHL, 2012; Mazzarino, 2012) have addressed all of them.Our focus lies within all of the PESTLE dimensions. Based on the gaps discussedabove, this study tries to answer the following research questions:
1. Whatdevelopmentpathsmight emerge frommegatrends in the industrialsector by 2030?
2. Howwill the technological dimension particularly shape the DPs for theindustrial sector by 2030?
3 Methodology
This paper follows the scenario technique developed by Gausemeier (Gausemeier,et al, 1998; Gausemeier and Plass, 2014) in order to create projections, whichconstitute developments into the future, specifically until the year 2030.
125
Alternative Development Paths for Supply Chains in 2030
The Gausemeier approach has five stages: (i) preparation, (ii) scenario field analy-sis, (iii) scenario prognosis, (iv) scenario development, (v) scenario transfer. Thispaper presents the third stage, in which a range of possible futures (typically 2-4)is defined for each descriptor (i.e. megatrends such as globalization). These pro-jections represent alternative and dissimilar developments of the descriptor.
Thus, this study shows all the potential future developments, which enable com-panies to evaluate different paths for different megatrends, instead of presentingthe final scenarios that result from different combinations of a variety of DPswithin the underlying dimensions. This basis allows building final consistentscenarios in further research.
These DPs are derived from the analysis of identified megatrends in previousresearch (Kalaitzi, et al., 2018), which in turn have been organized according tothe PESTLE dimensions. Somemegatrends have been rephrased if necessary inorder to derive the descriptors. The decision to rephrase a certain megatrend issubject to its tendency. If themegatrend has a positive or negative inclination, it isrephrased to represent a neutral position; e.g. themegatrend “protectionism” hasbeen renamed to the descriptor “trade policy”. A descriptor can have a positive,negative and neutral DP. However, deviating settings are also feasible. Conse-quently, the number of DPs per descriptor is not fixed and varies by descriptor.Each descriptor is characterized by diverging DPs that express possible futurestates of the descriptor and describe circumstances companies and societiesmight face.
The analysis of themegatrends considered statistics, forecasts and descriptions ofthe respective megatrends found in literature (Kalaitzi, et al., 2018). Hence, quan-titative and qualitative data is combined in order to derive the DPs. Additionally,several iterative workshops with three to 17 experts from different departments,sectors and with different backgrounds were conducted in order evaluate theDPs derived from literature as well as elaborate on further possible DPs. Thisapproach provides a comprehensive picture throughout all PESTLE dimensionsas well as the three industries under consideration.
Each DP is assigned to one of the PESTLE dimensions. Nevertheless, certain DPsalso can have impacts on other dimensions since it is rarely that developmentsaffect only one of the PESTLE dimensions. This is due to the comprehensivenature of the study and a holistic analysis of opportunities and challenges ofmegatrends.
126
4 Overview of the Development Paths
Themain criteria for the creation of DPs are its reasonability and conceivability(Gausemeier and Plass, 2014). Hence, we propose that every DP needs to fulfilcertain quality criteria, namely: (i) plausibility - a DP needs to be plausible tothe complete scenario team, (ii) dissimilarity - all DPs have to be distinct to eachother, (iii) completeness - a set of projections within a descriptor has to provide acomprehensive set of possible developments, (iv) relevance - each DP requiresa check regarding its future relevance, and (v) information content - each DPneeds to add further value to the set of DPs within a descriptor. A DP can befuturisticbutneeds to relyonvalidargumentsor requires justificationby statisticaldevelopments.
Suitable DPs must be distinct, so that the consistency check, needed in subse-quent research for the scenario building, does not lead to many different evalua-tions and, hence, to inconsistent scenarios. Rather reasonable combinations ofDPs are necessary for the creation of consistent scenarios.
Section 4 presents the results of this research by listing the descriptors with adefinition and the assigned DPs organized by the six PESTLE dimensions.
4 Overview of the Development Paths
Table 1 contains the descriptors per PESTLE dimension along with a definition foreach descriptor, and provides an overview of the identified DPs per descriptor.
127
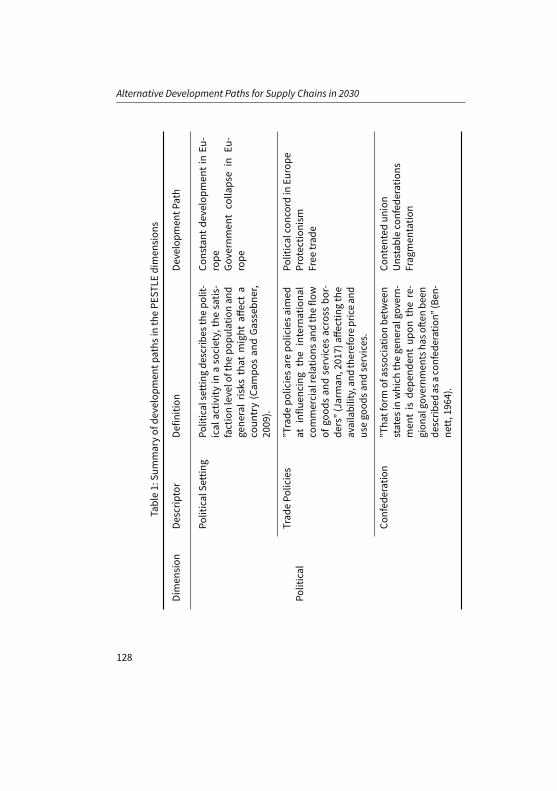
Alternative Development Paths for Supply Chains in 2030
Table1:Su
mmaryof
developm
entp
aths
inthePE
STLE
dimen
sion
s
Dimen
sion
Descrip
tor
Defin
ition
Developm
entP
ath
PoliticalSe
tting
Politicalsettingde
scrib
esthepo
lit-
ical
activ
ityin
asociety,thesatis
-factionlevelo
fthe
popu
latio
nan
dgene
ralris
ksthat
might
affecta
coun
try(Cam
posan
dGa
sseb
ner,
2009
).
Constant
developm
entinEu
-rope
Governmen
tcolla
pse
inEu
-rope
Political
Trad
ePo
licies
”Trade
policiesa
repo
liciesa
imed
atinflu
encing
the
internationa
lcommercialrelatio
nsan
dtheflo
wof
good
san
dservices
across
bor-
ders”(Jarm
an,201
7)aff
ectin
gthe
availability,an
dthereforep
ricea
ndusego
odsa
ndservices.
Politicalconcordin
Europe
Protectio
nism
Free
trad
e
Confed
eration
”Tha
tform
ofassociationbe
twee
nstates
inwhich
thegene
ralgov
ern-
men
tis
depe
nden
tup
onthere-
gion
algo
vernmen
tsha
softe
nbe
ende
scrib
edas
aconfed
eration”
(Ben
-ne
tt,196
4).
Conten
tedun
ion
Unstableconfed
erations
Frag
men
tatio
n
128

4 Overview of the Development Paths
Glob
alTrad
eSh
iftGlob
alTrad
eSh
iftde
scrib
esthe
chan
gesin
locatio
nof
econ
omic
activ
ities
betw
eenindu
stria
lized
coun
triesa
ndem
erging
econ
omies
(Dicken,
2015
;UNCT
AD,201
2).
Thepe
ndulum
shifts
Steady
titan
sUS&Eu
rope
Glob
alCo
rporate
Structures
Glob
alCo
rporateStructures
”de-
finean
dclarify
respon
sibilitiesfor
operationa
l,control,an
drepo
rting
processes”
(Baret,eta
l.,20
13,p
.2)
onaglob
algo
vernan
celevel.
Thinkglob
al,actlocal
Rise
ofbo
rn-globa
lfirm
s
Econ
omic
DigitalEcono
my
DigitalEcon
omy
describ
esthe
chan
ging
environm
entin
which
digitalization
isbe
coming
more
andmoreintegrated
into
thebu
si-
ness
environm
enten
ablin
gne
wbu
sine
ssconcep
ts(Brynjolfsson
andKa
hin,
2000
).
Trad
ition
alecon
omype
rsists
Digitalp
oten
tial
Digitalimpe
dimen
t
Fina
ncialInn
ova-
tions
Fina
ncialinn
ovationis”som
ething
new
that
redu
cescosts,
redu
ces
risks,o
rprovide
sanim
prov
edpro-
duct/service/instrum
enttha
tbet-
tersatisfie
spartic
ipan
ts’dem
ands”
(Framean
dWhite,200
2,p.3)with
inafin
ancialsystem
.
Bank
andFintechcolla
bora-
tion
Aworld
with
outb
anks
Bigfiv
earetheba
nkso
fthe
fu-
ture
129
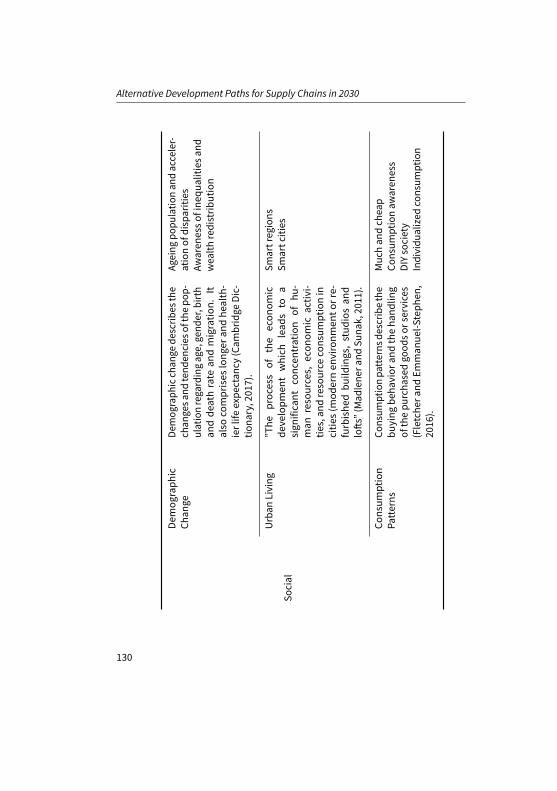
Alternative Development Paths for Supply Chains in 2030
Demog
raph
icCh
ange
Demog
raph
icch
ange
describ
esthe
chan
gesa
ndtend
encies
ofthepo
p-ulationrega
rdingag
e,gend
er,birth
andde
athrate
andmigratio
n.It
also
comprises
long
eran
dhe
alth-
ierlife
expe
ctan
cy(Cam
bridge
Dic-
tiona
ry,201
7).
Ageing
popu
latio
nan
dacceler-
ationof
disparities
Awaren
esso
fine
qualities
and
wealth
redistrib
ution
Social
Urban
Living
”The
process
ofthe
econ
omic
developm
entwhich
lead
sto
asign
ificant
concen
tration
ofhu
-man
resources,
econ
omic
activ
i-tie
s,an
dresource
consum
ptionin
citie
s(m
odernen
vironm
ento
rre-
furbishe
dbu
ildings,stud
iosan
dlofts”(Mad
lene
rand
Suna
k,20
11).
Smartregions
Smartc
ities
Consum
ption
Patterns
Consum
ptionpa
tternsd
escribethe
buying
beha
vior
andtheha
ndlin
gof
thepu
rcha
sedgo
odso
rservices
(Fletche
rand
Emman
uel-S
teph
en,
2016
).
Muc
han
dch
eap
Consum
ptionaw
aren
ess
DIYsociety
Individu
alized
consum
ption
130
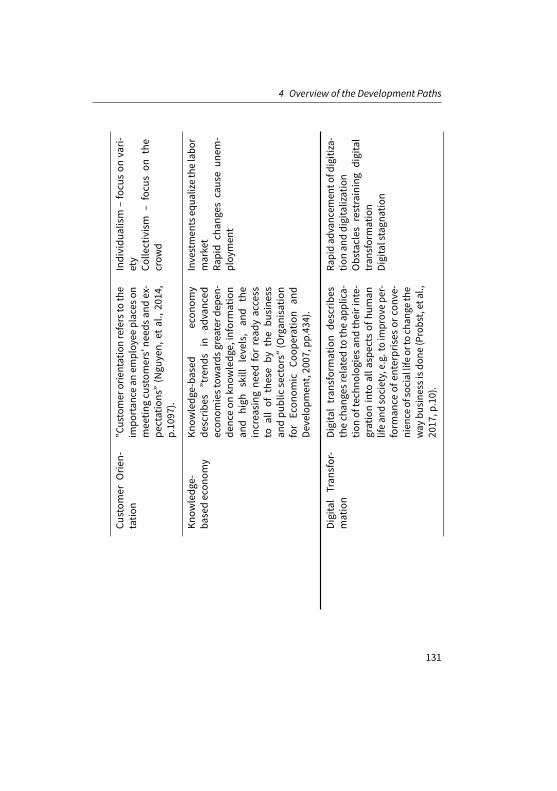
4 Overview of the Development Paths
Custom
erOrie
n-tatio
n”Customer
orientationrefersto
the
impo
rtan
cean
employ
eeplaces
onmeetin
gcu
stom
ers’ne
edsa
ndex-
pectations”(Ngu
yen,
etal.,20
14,
p.10
97).
Individu
alism
–focu
son
vari-
ety
Colle
ctivism
–focu
son
the
crow
d
Know
ledg
e-ba
sedecon
omy
Know
ledg
e-ba
sed
econ
omy
describ
es”trend
sin
advanced
econ
omiestow
ards
greaterd
epen
-de
nceon
know
ledg
e,inform
ation
and
high
skill
levels,an
dthe
increasing
need
forread
yaccess
toallof
theseby
thebu
sine
ssan
dpu
blicsectors”
(Organ
isation
forEcon
omic
Coop
eration
and
Developm
ent,20
07,p
p.43
4).
Investmen
tseq
ualizethelabo
rmarket
Rapid
chan
gescauseun
em-
ploy
men
t
DigitalTran
sfor-
mation
Digitaltran
sformation
describ
esthech
angesrelated
totheap
plica-
tionof
tech
nologies
andtheirinte-
grationinto
alla
spects
ofhu
man
lifean
dsociety,e.g.
toim
prov
epe
r-form
ance
ofen
terpris
esor
conv
e-nien
ceofsociallifeor
toch
ange
the
way
busine
ssisdo
ne(Probst,et
al.,
2017
,p.10).
Rapidad
vancem
ento
fdigitiza-
tionan
ddigitalization
Obstacles
restraining
digital
tran
sformation
Digitalstagn
ation
131
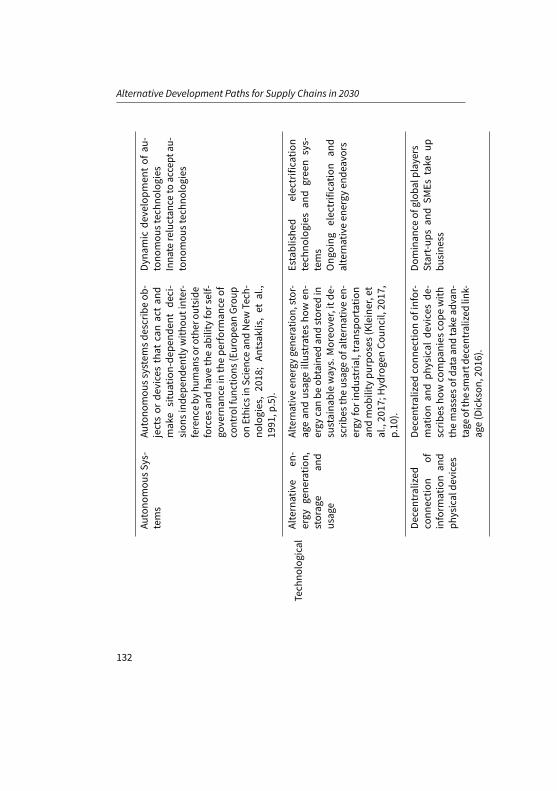
Alternative Development Paths for Supply Chains in 2030
Autono
mou
sSys-
tems
Autono
mou
ssystemsd
escribeob
-jectsor
devicesthat
canactan
dmake
situation-de
pend
entde
ci-
sion
sind
epen
dentlywith
outinter-
ferenceby
human
soro
ther
outside
forces
andha
vetheab
ility
forself-
governan
cein
thepe
rforman
ceof
controlfun
ctions
(Europ
eanGrou
pon
Ethics
inSciencean
dNew
Tech
-no
logies,20
18;An
tsak
lis,et
al.,
1991
,p.5).
Dyna
mic
developm
entof
au-
tono
mou
stechn
olog
ies
Inna
tereluctan
ceto
accept
au-
tono
mou
stechn
olog
ies
Tech
nological
Alternative
en-
ergy
gene
ratio
n,storag
ean
dusag
e
Alternativeen
ergy
gene
ratio
n,stor-
agean
dusag
eillustrates
howen
-ergy
canbe
obtained
andstored
insustaina
bleways.Moreo
ver,itde
-scrib
estheusag
eof
alternativeen
-ergy
forind
ustrial,tran
sportatio
nan
dmob
ility
purposes
(Kleiner,et
al.,20
17;H
ydrogenCo
uncil,20
17,
p.10
).
Establishe
delectrificatio
ntech
nologies
and
gree
nsys-
tems
Ong
oing
electrificatio
nan
dalternativeen
ergy
ende
avors
Decentralized
conn
ectio
nof
inform
ationan
dph
ysicalde
vices
Decentralized
conn
ectio
nof
infor-
mationan
dph
ysical
devicesde
-scrib
esho
wcompa
nies
cope
with
themasseso
fdataan
dtake
advan-
tage
ofthesm
artd
ecen
tralized
link-
age(Dickson
,201
6).
Dominan
ceof
glob
alplayers
Start-up
san
dSM
Estake
upbu
sine
ss
132

4 Overview of the Development Paths
Disrup
tive
Prod
uctio
nTech
nologies
Disrup
tivetech
nologies
describ
ede
velopm
ents
that
bringrevo
lu-
tiona
rych
angesto
social
lifean
dto
theway
compa
nies
unde
rstand
anddo
busine
ss.Inthecontexto
fprod
uctio
ntech
nologies,the
con-
cept
ofIndu
stry
4.0refle
ctsthis
emerging
pattern,
encompa
ssing
theintegrationof
diffe
rent
tech
-no
logies
into
anau
tono
mou
spro-
ductionsystem
that
canregu
late
itselfb
ased
onkn
owledg
ean
dsen-
sors
(Lasi,et
al.,20
14;Hofman
nan
dRü
sch,
2017
).
Continuo
usexploitatio
nof
dis-
ruptivetech
nologies
Coexistenceof
conv
entio
nal
anddisrup
tivetech
nologies
Consum
erProtectio
nLaws
Consum
erprotectio
nlaw
isde
-fin
edas
”alllega
lprin
ciples
and
rulesgo
verningrelatio
nships
and
prob
lemsb
etweenvario
uspa
rties
oreach
othe
rinrelatio
nto
good
san
d/o
rservicesin
theaspe
ctsof
life”
(Azis,20
18,p
.56).
Prom
otion
oflawsan
dfull
prod
ucttranspa
renc
yLegislationis
lagg
ingbe
hind
dyna
micmarketd
evelop
men
t
Lega
lIntelle
ctua
lProp-
erty
Laws
Intelle
ctua
lprope
rty(IP
)law
sdeal
with
thelawsthat
applyfor”cre-
ations
ofthemind:
inventions;lite
r-arya
ndartistic
works;and
symbo
ls,
names
andim
ages
used
incom-
merce”(W
orld
Intelle
ctua
lProp
-erty
Organ
ization,
2018
,p.2).
Fullsecu
rityforinv
entorsan
dda
taprov
iders
Low
confiden
tialityforda
taan
dmarketp
artic
ipan
ts
133

Alternative Development Paths for Supply Chains in 2030
Social
and
Envi-
ronm
entalR
egu-
latio
ns
Social
andEn
vironm
entalregula-
tions
describ
eregulations
thaturge
compa
nies
and
societiesto
act
anduseen
vironm
entalfun
ctions
inan
environm
entally
friend
lyan
dethicalw
ay(Organ
isationforE
co-
nomic
Coop
erationan
dDe
velop-
men
t,20
07,p
p.25
3,72
5;Sh
ift2R
ail,
2017
).
Compreh
ensive
regu
latory
framew
ork
Heterog
eneo
usregu
latio
ns
Clim
ateCh
ange
Itisa“a
chan
geinglob
alor
region
alclim
atepa
tterns,started
from
the
mid
tolate
20th
centuryon
wards
andattributed
totheincreasedlev-
elso
fatm
osph
ericcarbon
dioxide
prod
uced
bytheuseof
fossilfuels”
(Oxford’sd
ictio
nary,201
7).
Our
plan
etisrecoverin
gOur
plan
eton
thebrink
Environm
entalEn
vironm
en-
tal
Resource
Man
agem
ent
Itde
scrib
estheman
agem
ento
fhu-
man
interactionwith
theen
viron-
men
tand
aimsto
assure
that
the
stateof
anen
vironm
entalresou
rce
affectedby
human
sism
aintaine
dforfuture
gene
ratio
ns,an
dfor
ecosystem
integrity
throug
hcon-
side
ringethical,econ
omic,and
sci-
entific(ecological)varia
bles
(Pah
l-Wostl,
2007
).
Coun
terin
gresou
rced
epletio
nRise
inde
pletionof
naturalre-
sources
134
5 Development Paths for Autonomous Systems in the Technological Dimension
Due to numerous DPs in each of the six PESTLE dimension, it is not feasible toillustrate all DPs in detail in this paper. Hence, the focus in Section 5 is on thetechnological dimension. More specifically, ”Autonomous Systems” are chosenas example since these technologies are expected to progress on a high pace withvast impacts on all industries and the related supply chains.
5 Development Paths for Autonomous Systems in theTechnological Dimension
The twoDPsunder thedescriptor ”AutonomousSystems”areexemplarily outlinedfor the technological dimension.
Autonomous systems describe objects or devices that can act andmake situation-dependent decisions independently without interference by humans or otheroutside forces (EuropeanGroup on Ethics in Science andNewTechnologies, 2018).These technologies have an immense impact on ways of working, particularlyhow people will collaborate with other people, machines and virtual formats inentirely new ways (Wisskirchen, et al., 2017).
Based on the previous research (Kalaitzi, et al., 2018), autonomous systems en-compass the trends robots, drones, automated vehicles/ automated guided ve-hicles and cyber-physical systems. The DPs take up on these trends and aredescribed in the following Subsections 5.1 and 5.2.
This section focuses on the DPs. DPs describe how the future in 2030 might looklike. Since this study is part of a comprehensive scenario generation approach, itis subject to further research to analyze which DPs are feasible in the context ofa holistic scenario. The scenarios are composed of combinations of several DPsfrom various descriptors and different PESTLE dimensions. Hence, at this stage ofresearch it is yet not possible to derive which implications arise, how companiesneed to prepare for the future, how supply chains will change concerning theirconfiguration or how the developmentswill affect specific industries (e.g. process,discrete manufacturing or logistics).
135
Alternative Development Paths for Supply Chains in 2030
5.1 Dynamic Development of Autonomous Technologies
This DP describes that companies are taking advantage of digital technologiesto find new markets, business models and revenue streams and that humanworkforce can benefit from this development.
Technology advancements, especially with regard to robots, drones and au-tonomous vehicles are progressing at a rapid pace. Cyber-physical systems play akey role for autonomous systems in the industrial environment. They constituteenablers for efficient communication and control by transferring and exchangingdata over the internet in real time. An increased exploitation of these technolo-gies leads to a highly automated and autonomous environment which permitsto improve the productivity rate (for example robots can perform 24/7) reducingquality problems, errors and down times (Wisskirchen, et al., 2017). Coupled withthe ability to share and act upon the associated data and derived insights, newservice and production related business opportunities arise for global playersas well as start-ups. New business models emerge both within and across orga-nizations, removing traditional silos as well as simplifying trust and contractualagreements. Automation (both physical and virtual) replaces an increasing rangeof human tasks (Bingley, et al., 2016).
Implications on supply chains
The described technological advancements allow the administration of supplychains to be simplified and to operate with less cost and better customer satisfac-tion. In particular, the first step in the advancement of autonomous systems is atthe process level in order to automate non-value added activities. In this regard,rapid changes could lead to high rates of unemployment. In this case, companiesneed to define approaches for reallocation of staff along the supply chain andconsider the possibility to improve their capabilities since these technologiesrequire advanced IT skills. By tracking the whole supply chain, transparency be-tween the supply chain actors can be increased, which improves the capabilityto react efficiently and quick to external influences. If new business models areimplemented to handle the increasing complexity of autonomous systems, thesupply chain can achieve high performance in terms of agility, reliability andtransparency.
136

6 Conclusion and Outlook
5.2 Innate Reluctance to Accept Autonomous Technologies
This DP states that the use of advanced technologies is reshaping the work land-scape intensifying competition on the labor market and causing worker displace-ments.
The technological development enables a high degree of automation and auton-omiztion. Suppliers provide modular and standardized components so that tech-nology solutions become affordable, but still often lack profitability (Gausemeierand Plass, 2014). Since an autonomous technology requires suites of expensivesensors, the average cost of this technology is high and this could slow downthe application of this technology. A particular technological roadmap to reducethose costs is yet to be established (Omohundro, 2014; Anderson, 2016). Althoughautonomous technologies often lack profitability (Gausemeier and Plass, 2014) orregulations prevent the full exploitation of their potentials, automated and partlyautonomous factories are progressively becoming the standard in Europe. Theresult is a shift from assistance of human activities to a more machine-centeredenvironment. This development radically reshapes the work landscape and cre-ates new business models (Bingley et al., 2016). Users struggle with operating thehighly complex machines (Gausemeier and Plass, 2014). Hence, employees fearfor their jobs, get frustrated and demotivated and eventually adopt a negativeattitude towards emerging advanced technologies.
Implications on supply chains
High costs, privacy and cyber security issues, low IT penetration into processesas well as a lag of technology standards make the adoption of new technologiesslower and restrain digital transformation. Supply chains need to revise processesandmove from traditional supply chains towards a connected, smart, and highlyefficient supply chain ecosystem in order to achieve comprehensive agility andtransparency.
6 Conclusion and Outlook
This paper identifies 51 DPs that might emerge frommegatrends in the industrialsector by 2030. DPs constitute projections of each megatrend into the future.
137

Alternative Development Paths for Supply Chains in 2030
They are grouped under 22 so-called descriptors and assigned to the PESTLEdimensions. Each DP creates different conditions that will have an impact onsupply chains and their configuration.
In order to address our first research question, we have extended previous scien-tific publications and grey literature by taking a holistic approach and consideringthree different industries (i.e. process, discrete manufacturing, and logistics) aswell as six PESTLE dimensions. We assessed megatrends and their associatedchallenges and opportunities in order to define DPs for the future. The system-atic collection of information regarding megatrends and their analysis permits acomplete and well-structured illustration of a set of DPs.
To answer our second research question, we exemplarily elaborated on two DPsfor autonomous system by providing a comprehensive description of the twodivergent DPs. Furthermore, possible implications of these DPs on supply chainsand companies are described.
The construction of DPs is part of a comprehensive scenario technique. Future re-search will show the impacts of each DP on each specific industry and the relatedsupply chains. Then, by using the Gausemeier and Plass (2014) methodology, itwill be necessary to create the most plausible and diversified industrial scenar-ios. These scenarios help to define the best strategies to engage the differentchallenges of the future.
Our research is limited in the way that process, discrete manufacturing and logis-tics industries are considered as an input only. The resulting DPs are not classifiedby industries. Thus, this study follows a holistic approach and can be used tocreate scenarios for different industries in future research and to derive specificDPs for the aforementioned industries. Additionally, the DPs were validated witha small group of experts. More experts could provide other insights. Some DPsare concentrated in a European context since the focus was on existing Europeanroadmaps. Practically, this study enables supply chain professionals to under-stand possible DPs and serves as basis to develop future scenarios in subsequentwork.
7 Acknowledgements
This research has received funding from the European Union’s Horizon 2020 Re-search and Innovation Program under the Grant Agreement No. 768884.
138
REFERENCES
The authors thank all contributors of the Next-Net project team and all expertsfrom industry participating in the workshops.
References
ALICE (2014). ALICE Recommendations to H2020 Work Programs 2016-2017.Anderson, J. e. a. (2016). Autonomous Vehicle Technology: A Guide for Policymakers. Ed. by RAND
Corporation.Antsaklis, P. J., K. M. Passino, and S. J. Wang (1991). “An introduction to autonomous control
systems”. In: IEEE Control Systems 11.4, pp. 5–13.Arora, V. and S. Putcha (2013). “Future Scenarios for Green Chemical Supply Chains”. PhD thesis.
Massachusetts Institute of Technology: Massachusetts Institute of Technology.Azis, D. E. P. (2018). “Juridical ReviewThe Implementation of Oral Agreement is associatedwith the
Law of Treaties and Law Number 8 Year 1999 concerning Consumer Protection”. In: SubstantiveJustice International Journal of Law. Vol. 1, pp. 56–64.
Barbosa-Póvoa, A. P., C. da Silva, and A. Carvalho (2018). “Opportunities and challenges in sustain-able supply chain: An operations research perspective”. In: European Journal of OperationalResearch 268.2, pp. 399–431.
Baret, S., N. Sandford, E. Hid, J. Vazirani, and S. Hatfeld (2013). Developing an effective governanceoperating model: A guide for financial services boards andmanagement teams. Ed. by DeloitteDevelopment LLC.
Bechtsis, D., N. Tsolakis, D. Vlachos, and E. Iakovou (2017). “Sustainable supply chainmanagementin the digitalisation era: The impact of Automated Guided Vehicles”. In: Journal of CleanerProduction 142, pp. 3970–3984.
Bennett, W. H. (1964). American Theories of Federalism. Tuscaloosa: University of Alabama Press.Berger, R. (2015). The Supply Chain Excellence Study 2015.Bingley, M., J. F. Esteban Lauzán, J. Hall, G. Jagdale, M. Pfeil, M. Smith, F. Pinheiro, and H. Tardieu
(2016). Journey 2020: Digital Shockwaves in Business. Ed. by Atos SE.Brynjolfsson, E. and B. Kahin (2000).Understanding the Digital Economy: Data, Tools, and Research.Cambridge Dictionary (2017). Demographics.Campos, N. F. and M. Gassebner (2009). “International terrorism, political instability and the
escalation effect”. In: IZA discussion papers 4061.Cole, B. and J. O’Donnell (2017). Discrete vs. process manufacturing.DHL (2012). “Delivering tomorrow Logistics 2050 A Scenario Study”. In:Dicken, P. (2015). Global shift: Mapping the changing contours of the world economy. 7. ed. Los
Angeles, Calif.: Sage Publ.Dickson, B. (2016). Decentralizing IoT networks through blockchain.EFFRA (2013). Factories of the future: Multi-annual roadmap for the contractual PPP under Horizon
2020. Luxembourg: Publications Office of the European Union.European Battery, Hybrid and Fuel Cell Electric Vehicle Congress (2017). Geneva, Switzerland.European Group on Ethics in Science and New Technologies (2018). Artificial Intelligence, Robotics
and ‘Autonomous’ Systems. Ed. by European Commission. Luxembourg.
139
Alternative Development Paths for Supply Chains in 2030
European Union (2015). EU transport in figures: Statistical Pocketbook 2015. EU transport in figures.Luxembourg: Office for Official Publications of the European Communities.
Fletcher, K.-A. P. and C. M. Emmanuel-Stephen (2016). “Social Media Engagement: Reshapingthe Consumption Pattern of Generation Y Caribbean and Latin American Consumers”. In: Con-sumerism and Buying Behavior in Developing Nations. Ed. by IGI Global, pp. 218–238.
Frame, W. S. and L. J. White (2002). Empirical Studies of Financial Innovation: Lots of Talk, LittleAction? Ed. by Federal Reserve Bank of Atlanta. Atlanta, GA, USA.
Gausemeier, J., A. Fink, and O. Schlake (1998). “Scenario Management”. In: Technological Forecast-ing and Social Change 59.2, pp. 111–130.
Gausemeier and Plass (2014). Zukunftsorientierte Unternehmensgestaltung - Strategien, Geschäft-sprozesse und IT-Systeme für die Produktion vonmorgen. 2nd ed. München: Carl Hanser Fach-buchverlag.
Hydrogen Council (2017). “Hydrogen scaling up: A sustainable pathway for the global energytransition”. In:
IGI Global, ed. (2016). Consumerism and Buying Behavior in Developing Nations.Institute of Industrial and Systems Engineers (2018). Process Industries Division.Jarman, H. (2017). “Trade policy governance: What health policymakers and advocates need to
know”. In: Health policy (Amsterdam, Netherlands) 121.11, pp. 1105–1112.Jiang, R., R. Kleer, and F. T. Piller (2017). “Predicting the future of additive manufacturing: A
Delphi study on economic and societal implications of 3D printing for 2030”. In: TechnologicalForecasting & Social Change 117, pp. 84–97.
Kalaitzi, D., A. Matopoulos, R. Fornasiero, A. Zangiacomi, I. Marchiori, A. C. Barros, K. Pires, P.Campos, V. Amorim, V. Muerza, S. Sardesai, D. Daus, M. Witthaut, L. Aerts, and S. Balech (2018).D2.1: Report on trends and key factors.
Kersten,W.,M. Seiter, B. vonSee, N. Hackius, andT.Maurer (2017). Trends AndStrategies In LogisticsAnd Supply Chain Management: Digital Transformation Opportunities. Ed. by BVL International -The Supply Chain Network.
Kleiner, F., M. Beermann, B. Çatay, E. Beers, H. Davies, and O. T. Lim (2017). “Current status ofthe electrification of transport logistic vehicles - Early nichemarkets and commercializationopportunities”. In: European Battery, Hybrid and Fuel Cell Electric Vehicle Congress. Geneva,Switzerland.
Lehmacher, W., F. Betti, P. Beecher, C. Grotemeier, and M. Lorenzen (2017). Impact of the FourthIndustrial Revolution on Supply Chains. Ed. byWorld Economic Forum. Cologny/Geneva, Switzer-land.
Madlener, R. andY. Sunak (2011). “Impactsof urbanizationonurbanstructures andenergydemand:What can we learn for urban energy planning and urbanization management?” In: SustainableCities and Society 1.1, pp. 45–53.
Mazzarino, M. (2012). “Strategic scenarios of global logistics: what lies ahead for Europe?” In:European Transport Research Review 4.1, pp. 1–18.
Melnyk, S. A., R. R. Lummus, R. J. Vokurka, L. J. Burns, and J. Sandor (2009). “Mapping the futureof supply chain management: a Delphi study”. In: International Journal of Production Research47.16, pp. 4629–4653.
Nguyen, H., M. Groth, G. Walsh, and T. Hennig-Thurau (2014). “The Impact of Service Scripts onCustomer Citizenship Behavior and the Moderating Role of Employee Customer Orientation”.In: Psychology & Marketing 31.12, pp. 1096–1109.
140
REFERENCES
Omohundro, S. (2014). “Autonomous Technology and the Greater Human Good”. In: Journal ofExperimental & Theoretical Artificial Intelligence 26.3, pp. 303–315.
Organisation for Economic Co-operation and Development (2007). Glossary of Statistical Terms.Oxford’s dictionary (2017). climate change.Pahl-Wostl, C. (2007). “The implications of complexity for integrated resources management”. In:
Environmental Modelling & Software 22.5, pp. 561–569.Powell, T. C. (1992). “Strategic Planning as Competitive Advantage”. In: Strategic Management
Journal 13.7, pp. 551–558.Probst, L., B. Pedersen, O.-K. Lonkeu, C. Martinez-Diaz, L. Novelle Araujo, PwC, Klitou,Demetrius,
J. Conrads, M. Rasmussen, and CARSA (2017). Digital Transformation Scoreboard 2017: Evidenceof positive outcomes and current opportunities for EU businesses.
PwC (2009). “How will supply chains evolve in an energy-constrained, low-carbon world?” In:Transportation & logistics 2030 series 1.
Savills Investment Management (2016). European Logistics: warehousing the future. Ed. by SavillsInvestment Management LLP. London.
Schoemaker, P. J. H. (1993). “Multiple scenario development: Its conceptual and behavioral foun-dation”. In: Strategic Management Journal 14.3, pp. 193–213.
Shift2Rail (2017). Shift2Rail Joint Undertaking (S2R JU): Annual Work Plan 2018 & Budget.Singh, M. (2004). “A Review of the Leading Opinions on the Future of Supply Chains: Supply Chain
2020 Project Working Paper”. PhD thesis. Boston, MA: MIT.Speranza, M. (2018). “Trends in transportation and logistics”. In: European Journal of Operational
Research 264, pp. 830–836.Substantive Justice International Journal of Law (2018). Vol. 1.Tello, P. and R. Weerdmeester (2012). SPIRE Roadmap.UNCTAD (2012). Global trade trends. Ed. by UNITED NATIONS PUBLICATION.von der Gracht, Heiko A. and I.-L. Darkow (2010). “Scenarios for the logistics services industry:
A Delphi-based analysis for 2025”. In: International Journal of Production Economics 127.1,pp. 46–59.
von der Gracht, Heiko A. and I.-L. Darkow (2013). “The future role of logistics for global wealth –scenarios and discontinuities until 2025”. In: Foresight 15.5, pp. 405–419.
von der Gracht, Heiko A. and I.-L. Darkow (2016). “”Energy-constrained and low-carbon scenar-ios for the transportation and logistics industry””. In: The International Journal of LogisticsManagement 27.1, pp. 142–166.
Willigens, S. E. and von der Gracht, Heiko A. (2013). The Future of the Supply Chain 2020+: Scenariosand Requirements for the Process Industry. Ed. by msg systems ag. Ismaning/Munich.
Wisskirchen, G., Biacabe, B., Bormann, U., Muntz, A., Niehaus, G., Soler, G. and von Brauchitsch, B.(2017). Artificial Intelligence and Robotics and Their Impact on the Workplace.
World Intellectual PropertyOrganization (2004).What is Intellectual Property? Geneva, Switzerland.Yami, Z. (2018). Supply Chain Complexity – Dealing with a Dynamic System.Zhong, R. Y., S. T. Newman, G. Q. Huang, and S. Lan (2016). “Big Data for supply chainmanagement
in the service andmanufacturing sectors: Challenges, opportunities, and future perspectives”.In: Computers & Industrial Engineering 101, pp. 572–591.
141


About the Future Role of Software inthe Product
Henning Skirde1, Robert Steinert1
1 – ID-Consult GmbH
Product development is shifting towards realizing an extended scope of productfunctions in software. This leads to new challenges in terms of a methodologi-cal integration and synchronization of different development disciplines. Thispaper provides insights on how to systematically manage the harmonization oftraditional development disciplines with agile software development based onan integrated data model. To achieve this, the traditional product data modelis extended to a seamless system datamodel that covers – based on a commonfunction structure – the product itself but also services induced by digitalizationand infrastructure backends.
Keywords: ProductDataModelMETUS;SoftwareDevelopment; Agile andSCRUM;Harmonization Digitalization
First recieved: 25.May.2018 Revised: 15.Jun.2018 Accepted: 04.Jul.2018
143
About the Future Role of Software in the Product
1 Software as a Function Owner in Digitalized Products
”Bending sheet metal is not our value creation’s core anymore”, this is – slightlyexaggerated – howmanufacturing companies put a major change into a nutshell,that has become essential in product development. The functions of technicalproducts are to an increasing extent determined by Software and digital connec-tivity, “bent sheet metal” does not ensure market success anymore.
Today, software is an indispensable ingredient of technical products. An exampleis embedded software like in an automobile’s control unit or as a control systemof amachine or plant. Nevertheless, traditional development processes based ona two-stage freezing of requirements often lack the consideration of software anddo not recognize it as an essential element of the development process accordingto its role in the completed product.
Mechanics and electronics may feature different development methods, but theircommon ground and their origin descend from a physical world. Where thesedisciplines think based on product structures, software development choses astructure based on data models. In addition, software development as a disci-pline has come up with its ownmethodology: Agile approaches such as SCRUM(Schwaber & Suther-land 2017) are entirely different from traditional productdevelopment processes.
Up to now, a common solution has been to encapsulate the discipline of softwaredevelopment right into the traditional product development process. By this,software development could retain its own approaches and data models. An inte-gration with other development disciplines’ statuses has been conducted basedon completed releases, milestones and snapshots. Against the background ofmajor differences regardingmethodology and datamodels of other developmentdisciplines, such an approach seemed to be sufficient. Today on the contrary,such a methodological segregation fails to be a promising way to go (Eigner et al.2018).
Why is this the case? Software as an ingredient of technical products in the pre-vious sense contains a system related machine control. It might be embeddedin a control unit’s firmware with the aim to interpret signals from amachine’s orplant’s sensors and pilots corresponding actuators based on algorithms.
In an easy example, the software of a car’s engine control unit uses the values fromsensors at the crankshaft, throttle valve and intake air temperature to calculate
144
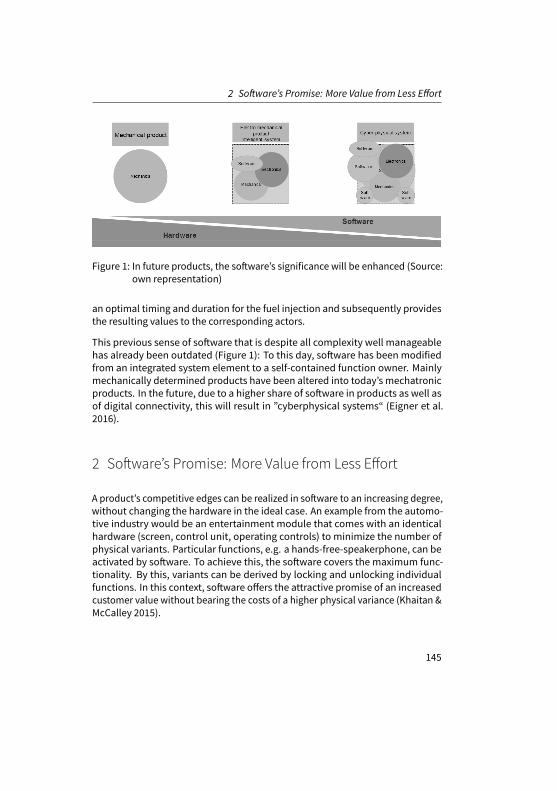
2 Software’s Promise: More Value from Less Effort
Figure 1: In future products, the software’s significance will be enhanced (Source:own representation)
an optimal timing and duration for the fuel injection and subsequently providesthe resulting values to the corresponding actors.
This previous sense of software that is despite all complexity well manageablehas already been outdated (Figure 1): To this day, software has been modifiedfrom an integrated system element to a self-contained function owner. Mainlymechanically determined products have been altered into today’s mechatronicproducts. In the future, due to a higher share of software in products as well asof digital connectivity, this will result in ”cyberphysical systems“ (Eigner et al.2016).
2 Software’s Promise: More Value from Less Effort
A product’s competitive edges can be realized in software to an increasing degree,without changing the hardware in the ideal case. An example from the automo-tive industry would be an entertainment module that comes with an identicalhardware (screen, control unit, operating controls) to minimize the number ofphysical variants. Particular functions, e.g. a hands-free-speakerphone, can beactivated by software. To achieve this, the software covers the maximum func-tionality. By this, variants can be derived by locking and unlocking individualfunctions. In this context, software offers the attractive promise of an increasedcustomer value without bearing the costs of a higher physical variance (Khaitan &McCalley 2015).
145
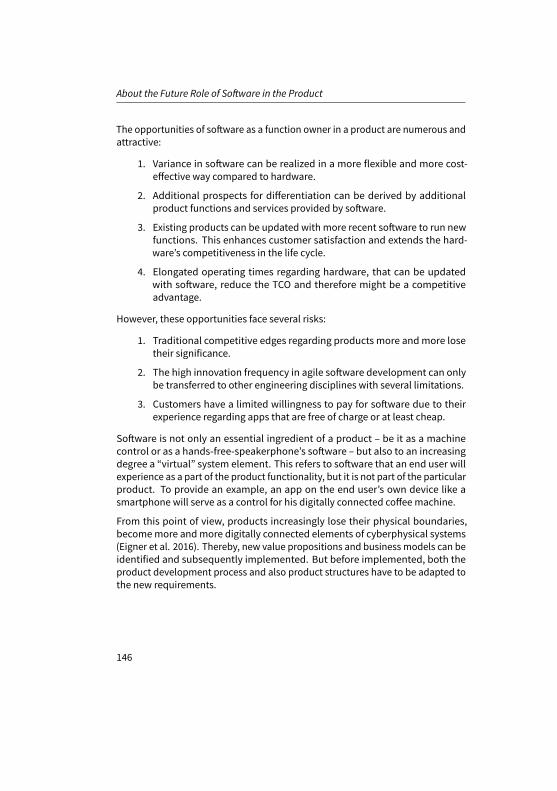
About the Future Role of Software in the Product
The opportunities of software as a function owner in a product are numerous andattractive:
1. Variance in software can be realized in a more flexible and more cost-effective way compared to hardware.
2. Additional prospects for differentiation can be derived by additionalproduct functions and services provided by software.
3. Existing products can be updated with more recent software to run newfunctions. This enhances customer satisfaction and extends the hard-ware’s competitiveness in the life cycle.
4. Elongated operating times regarding hardware, that can be updatedwith software, reduce the TCO and therefore might be a competitiveadvantage.
However, these opportunities face several risks:
1. Traditional competitive edges regarding products more andmore losetheir significance.
2. The high innovation frequency in agile software development can onlybe transferred to other engineering disciplines with several limitations.
3. Customers have a limited willingness to pay for software due to theirexperience regarding apps that are free of charge or at least cheap.
Software is not only an essential ingredient of a product – be it as a machinecontrol or as a hands-free-speakerphone’s software – but also to an increasingdegree a “virtual” system element. This refers to software that an end user willexperience as a part of the product functionality, but it is not part of the particularproduct. To provide an example, an app on the end user’s own device like asmartphone will serve as a control for his digitally connected coffeemachine.
From this point of view, products increasingly lose their physical boundaries,becomemore andmore digitally connected elements of cyberphysical systems(Eigner et al. 2016). Thereby, new value propositions and business models can beidentified and subsequently implemented. But before implemented, both theproduct development process and also product structures have to be adapted tothe new requirements.
146
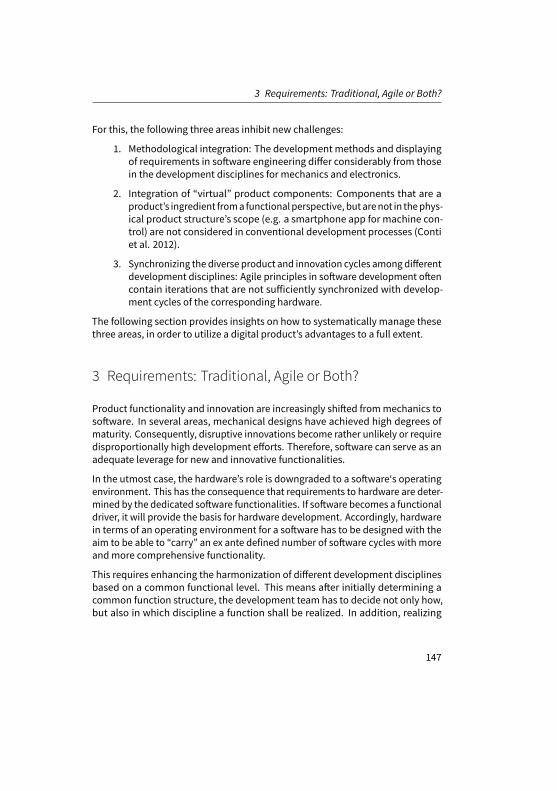
3 Requirements: Traditional, Agile or Both?
For this, the following three areas inhibit new challenges:
1. Methodological integration: The development methods and displayingof requirements in software engineering differ considerably from thosein the development disciplines for mechanics and electronics.
2. Integration of “virtual” product components: Components that are aproduct’s ingredient froma functionalperspective, butarenot in thephys-ical product structure’s scope (e.g. a smartphone app for machine con-trol) are not considered in conventional development processes (Contiet al. 2012).
3. Synchronizing the diverse product and innovation cycles among differentdevelopment disciplines: Agile principles in software development oftencontain iterations that are not sufficiently synchronized with develop-ment cycles of the corresponding hardware.
The following section provides insights on how to systematically manage thesethree areas, in order to utilize a digital product’s advantages to a full extent.
3 Requirements: Traditional, Agile or Both?
Product functionality and innovation are increasingly shifted frommechanics tosoftware. In several areas, mechanical designs have achieved high degrees ofmaturity. Consequently, disruptive innovations become rather unlikely or requiredisproportionally high development efforts. Therefore, software can serve as anadequate leverage for new and innovative functionalities.
In the utmost case, the hardware’s role is downgraded to a software‘s operatingenvironment. This has the consequence that requirements to hardware are deter-mined by the dedicated software functionalities. If software becomes a functionaldriver, it will provide the basis for hardware development. Accordingly, hardwarein terms of an operating environment for a software has to be designed with theaim to be able to “carry” an ex ante defined number of software cycles with moreandmore comprehensive functionality.
This requires enhancing the harmonization of different development disciplinesbased on a common functional level. This means after initially determining acommon function structure, the development team has to decide not only how,but also in which discipline a function shall be realized. In addition, realizing
147
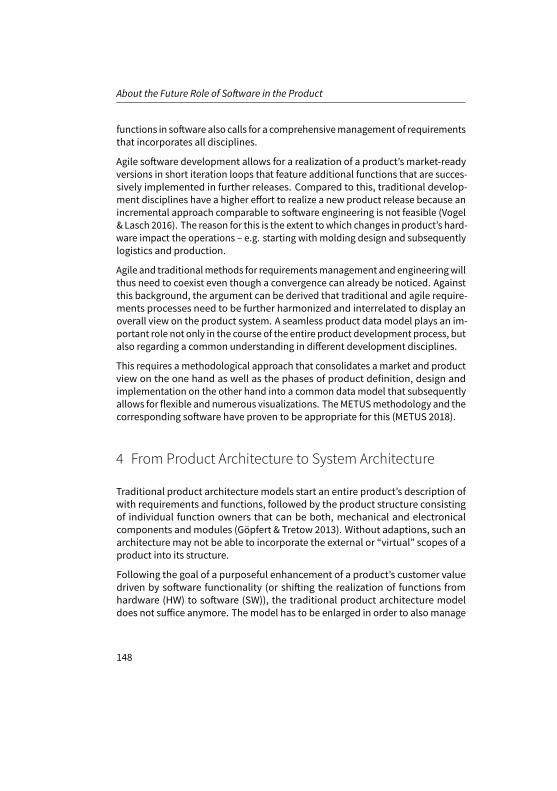
About the Future Role of Software in the Product
functions in software also calls for a comprehensivemanagement of requirementsthat incorporates all disciplines.
Agile software development allows for a realization of a product’s market-readyversions in short iteration loops that feature additional functions that are succes-sively implemented in further releases. Compared to this, traditional develop-ment disciplines have a higher effort to realize a new product release because anincremental approach comparable to software engineering is not feasible (Vogel& Lasch 2016). The reason for this is the extent towhich changes in product’s hard-ware impact the operations – e.g. starting with molding design and subsequentlylogistics and production.
Agile and traditionalmethods for requirementsmanagement and engineeringwillthus need to coexist even though a convergence can already be noticed. Againstthis background, the argument can be derived that traditional and agile require-ments processes need to be further harmonized and interrelated to display anoverall view on the product system. A seamless product data model plays an im-portant role not only in the course of the entire product development process, butalso regarding a common understanding in different development disciplines.
This requires a methodological approach that consolidates a market and productview on the one hand as well as the phases of product definition, design andimplementation on the other hand into a common data model that subsequentlyallows for flexible and numerous visualizations. TheMETUSmethodology and thecorresponding software have proven to be appropriate for this (METUS 2018).
4 From Product Architecture to System Architecture
Traditional product architecture models start an entire product’s description ofwith requirements and functions, followed by the product structure consistingof individual function owners that can be both, mechanical and electronicalcomponents andmodules (Göpfert & Tretow 2013). Without adaptions, such anarchitecture may not be able to incorporate the external or “virtual” scopes of aproduct into its structure.
Following the goal of a purposeful enhancement of a product’s customer valuedriven by software functionality (or shifting the realization of functions fromhardware (HW) to software (SW)), the traditional product architecture modeldoes not suffice anymore. The model has to be enlarged in order to also manage
148
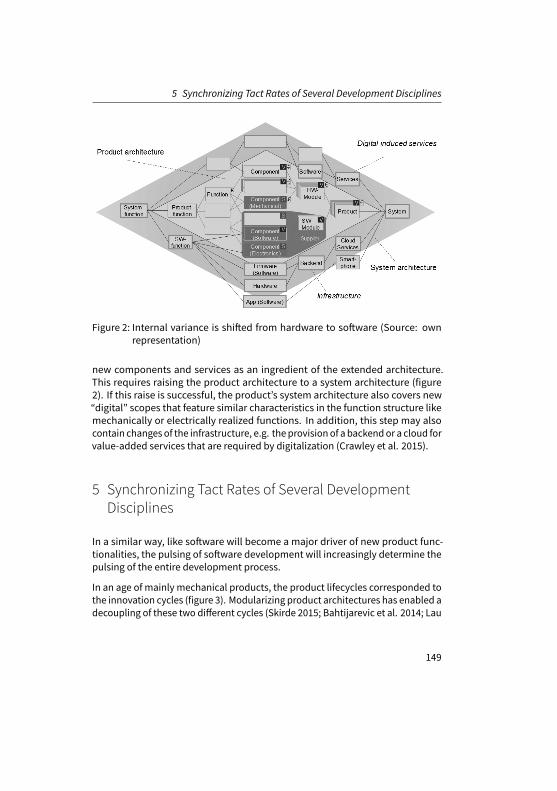
5 Synchronizing Tact Rates of Several Development Disciplines
Figure 2: Internal variance is shifted from hardware to software (Source: ownrepresentation)
new components and services as an ingredient of the extended architecture.This requires raising the product architecture to a system architecture (figure2). If this raise is successful, the product’s system architecture also covers new“digital” scopes that feature similar characteristics in the function structure likemechanically or electrically realized functions. In addition, this step may alsocontain changes of the infrastructure, e.g. the provision of a backendor a cloud forvalue-added services that are required by digitalization (Crawley et al. 2015).
5 Synchronizing Tact Rates of Several DevelopmentDisciplines
In a similar way, like software will become a major driver of new product func-tionalities, the pulsing of software development will increasingly determine thepulsing of the entire development process.
In an age of mainly mechanical products, the product lifecycles corresponded tothe innovation cycles (figure 3). Modularizing product architectures has enabled adecoupling of these two different cycles (Skirde 2015; Bahtijarevic et al. 2014; Lau
149

About the Future Role of Software in the Product
et al. 2011; Mikkola 2006). Technology and innovation leaps can be realized onlyin particular modules that replace outdated modules in the original product. Theincrease of mechatronic products has come with diverging the pulsing of productlifecycle and innovation cycles: New software releases, for example the alreadyexplained automobile engine’s control unit, are deployed without changing theoperating environment provided by the hardware.
To realize an extended scope of product functionalities with software functions,the hardware design has to be adequately dimensioned in advance: it has to beable to operate a software’s future releases right from the start. For this, productmanagement has to define up to which future software releases the hardwareis supposed to remain unmodified. The ability for updates, known by every enduser of a smartphone or tablet computer, will become a feature of nearly everytechnical product.
The conceptual design of updateable products requires a function roadmap con-taining software updates plannedby the productmanagement. This roadmaphasto be transparent for all involved parties and agreed as an ingredient of the entiresystem architecture represented by a product embedded into this architecture. Ifthis succeeds, new perspectives can be raised: particular scopes of the productvariance can be shifted from hardware to software. In total, an extension of theperformance spectrum towards a comprehensive product-service-system is likely(figure 4).
150
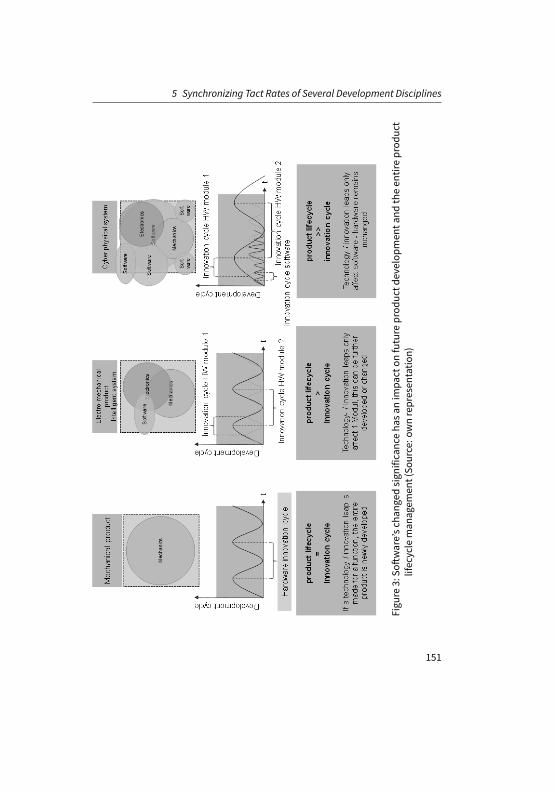
5 Synchronizing Tact Rates of Several Development Disciplines
Figu
re3:So
ftware’sc
hang
edsign
ificanceha
sanim
pacton
future
prod
uctd
evelop
men
tand
theen
tireprod
uct
lifecycleman
agem
ent(So
urce:o
wnrepresen
tatio
n)
151
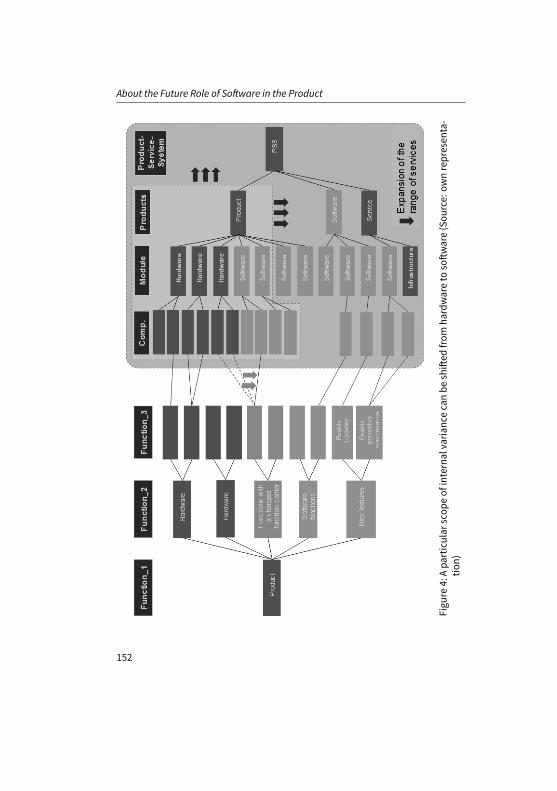
About the Future Role of Software in the Product
Figu
re4:Apa
rticular
scop
eof
internalvaria
ncecanbe
shifted
from
hardwareto
softw
are(Sou
rce:
ownrepresen
ta-
tion)
152
6 Pricing for Software-Based Product Functions
6 Pricing for Software-Based Product Functions
The increasing usage of software as a function owner determines that a highershare of the product requirements has to be fulfilled by software. Consequently,the share of the product’s value proposition that has to be covered by softwareis increased accordingly. From this change, the question can be raised how toachieve an appropriate pricing for software as a function owner.
Today, software development is often accounted into the company‘s indirectcosts. In comparison to the production of physical products, software comes withhigh non-recurring costs (NRC), but causes only very little recurring costs (RC). Interms of transparency, assigning the costs of individual software development tothe corresponding scope of the function structure seems to bemore beneficialfrom an economical perspective than accounting these into the indirect costs(Skirde et al. 2016). An analogous argumentation can be derived for assigningsoftware development costs to requirements as well as the value proposition.
Themajor success factor that canbederived froma function-basedpricing is againthe overall view on the product, which is the basis that allows for a cost-orientedanalysis of functions:
By connecting the value proposition with requirements (traditional and agile),function structure and finally the product structure with its mechanical, electron-ical and now also digital scopes, comprehensive data continuity from the marketto the product view can be established.
If this procedure in the sense of a function analysis is then conducted the otherway around – from the software scope in the direction of the function structure,the software’s contribution towards fulfilling a requirement and realizing thevalue proposition can directly be derived.
The chance to increase a product’s customer value by enhancing the software in-gredients and thus to realize a greater extent of variance in software on a low levelof costs, simultaneously shortening innovation cycles, seems to be exceedinglyattractive.
Completely exploiting the chances outlined in this paper will probably only suc-ceed for those companies, that already today turn their attention to a seamlessproduct development process that interconnects a market and a product per-spective on a reliable methodological basement.
153
About the Future Role of Software in the Product
7 Summary and Conclusion
Product development is shifting towards realizing an extended scope of productfunctions in software, challenging the past development paradigms. In this paper,the new challenges in terms of a methodological integration and synchronizationof different development disciplines have been pointed out. To conclude, ourrecommendation to companies is to systematically manage the harmonization oftraditional and software related development disciplines based on an integratedproduct data model. A common functional structure representing the entireproduct can support this harmonization. In addition, it allows for deriving datafor the pricing of software related functions and product features. An extension ofthe product data model can enable a company to consider new services inducedby digitalization as well as accordingly required infrastructure scopes in theirvalue proposition.
References
Bahtijarevic, J. and M. De Murcia E Paes (2014). “Applying Modular Function Deployment (MFD) tosoftware architecture”. In: KTH Production Engineering and Management.
Conti, M., S. Das, C. Bisdikian, M. Kumar, L. Ni, A. Passarella, G. Roussos, G. Tröster, G. Tsudik, andF. Zambonelli (2012). “Looking ahead in pervasive computing: Challenges and opportunities inthe era of cyber-physical convergence”. In: Pervasive Mobile Computing, Vol. 8 (1), pp. 2–21.
Crawley, E., B. Cameron, and D. Selva (2015). “System Architecture: Strategy and Product Develop-ment for Complex Sys-tems”. In: Prentice Hall Press, Upper Saddle River, NJ, USA.
Eigner,M., H. Apostolov, andP. Schäfer (2018). “„Nachhaltigkeit 4.0“ –NachhaltigeProduktentwick-lung im Zeitalter der vier-ten industriellen (R)evolution”. In: Fort-schritte in der Nachhaltigkeits-forschung, pp. 253–272.
Eigner, M., U. August, and M. Schmich (2016). “Smarte Produkte erfordern ein Umdenken beiProduktstrukturen und Pro-zessen”. In:White Paper, Siemens PLM Software.
Göpfert, J. and G. Tretow (2013). “Produktarchitektur”. In: In: Feldhusen, J. and & Grote, K.-H. [Eds.].Pahl/Beitz Konstruktionslehre, 8. Edi-tion, Springer, Berlin/Heidelberg, p. 252.
Khaitan, S. and J. McCalley (2014). “Design Techniques and Applications of Cyberphysical Systems:A Survey”. In: In: IEEE Systems Journal, Vol. 9 (2), pp. 350–365.
Lau, A., R. Yam, and E. Tang (2011). “The Impact of Product Modularity on New Product Perfor-mance:MediationbyProduct Innovativeness”. In: In: Journal of Product InnovationManagement,Vol. 28 (2), pp. 270–274.
METUS (2018). “DieMETUSSoftware ist die Schaltzentrale für Produktentscheidungen”. In: [online]:https://www.id-consult.com/loesungen/metus-software.html, called on May 15, 2018.
Mikkola, J. (2006). “Capturing the Degree of Modularity Embedded in Product Architectures”. In:Journal of Product Innovation Management, Vol. 23, pp. 128–146.
154

REFERENCES
Schwaber,K. andJ.Sutherland (2017). “TheSCRUMGuide”. In: [online]: http://www.scrumguides.org/docs/scrumguide/v2017/2017-Scrum-Guide-US.pdf, called January 22nd, 2018.
Skirde, H. (2015). “Kostenorientierte Bewertung modularer Produktarchitekturen”. In: Eul Verlag,Lohmar-Köln.
Skirde, H., W. Kersten, and M. Schröder (2016). “Measuring the Cost Effects of Modular ProductArchitectures— A Conceptual Approach”. In: International Journal of Innovation and TechnologyManagement, 13(4).
Skirde, H. and R. Steinert (2018). “The Future Role of Software in the Product – Realizing Variancein Software”. In:Whitepaper, DOI: 10.13140/RG.2.2.25525.17126.
Vogel, W. and R. Lasch (2016). “Complexity drivers in manufacturing companies: a literaturereview”. In: Logistics Research, 9: 25. doi:10.1007/s12159-016-0152-9.
155

Environmental Innovation ofTransportation Sector in OECDCountries
Duygu Şahan1, Okan Tuna1
1 – Dokuz Eylül University Maritime Faculty
Climate change is a global concern and transport sector contributes to it signifi-cantly. This study aims to identify the factors which contribute to the developmentof environmental innovation in transport sector and to examine their effects. Theanalysis is carried out via a panel regressionmodel with a dataset for 23 OECDcountries for the period between 1997-2012. Environmental patent data in trans-portation is used as a proxy for the innovation capacity. The independent vari-ables consist of value added, environmental stringency, CO2 emissions and GDPgrowth. Empirical exercises suggest that innovation in transport has a positiverelationship with CO2 emissions and a negative relationship with environmentalstringency. The negative impact of environmental regulation on innovation intransport sector is an important insight. This can be associated with excessiveadjustment costs of regulationwith respect to benefits of improved efficiency by in-novation. Furthermore, innovationmaybe realized in response to rising fuel pricesrather than in response to environmental mitigation policies. The positive effectof CO2 emissions may imply that as the CO2 emission caused by transport sectorrises, innovation capacity increases through the search for more energy-efficientvehicles. This study contributes to the literature by analyzing the utilization oftechnology for environment specifically in the field of transport. The analysis canbe conducted in amore comprehensive manner includingmanufacturing sector.The results might provide some important insights for policy makers as well asexecutives in transportation sector.
Keywords: environmental innovation; environmental stringency; technology ;transport
First recieved: 28.May.2018 Revised: 25.Jun.2018 Accepted: 10.Jul.2018
157
Environmental Innovation of Transportation Sector in OECD Countries
1 Introduction
Concerns on climate change have caused the adoption of United Nations Frame-work Convention on Climate Change (UNFCC) in 1992 to avoid damage causedby human activity on the climate system (UNFCC, 1992). With Paris Agreement,countries have become dependent on long term climate change goals of keepingthe rise in global temperature under 2 ⁰C above pre-industrial levels and furtherrestricting global warming under 1.5 ⁰C above pre-industrial levels to the end ofthe century (United Nations, 2016).
Transport sector plays an important role in the economies as it serves as an en-abler for international trade by transportation of goods and as a global connectorby passenger transportation. In terms of climate change, transport is one of themost important sectors as a source of greenhouse gas emissions. In a report byIEA (2009, p.3), it is stated that 25% of energy-related CO2 emissions are producedby transport sector which holds crucial importance in climate change mitigation.Moreover, technological transition is designated as a requirement for sustainabil-ity in companion with policies adopted to utilize these technologies in the report.In this context, transport sector experience diligent attention to achieve suchgoals due to its fuel dependency and CO2 emission reduction potential (Rogeljet al. 2015). Technological development and related applications is regarded asan area to mitigate climate change on a large scale (Sims et.al.,2014, p.613). Theprominence of transport sector for stringent climate change mitigation is alsostressed by Zhang et al. (2018), indicating that technological transformation inthe sector offers the most remarkable capacity to lower CO2 emissions.
Climate changemitigation in transportation is an area which attract great atten-tion by policymakers, international organizations, governments and researchers.Jolley (2004) asserts that transportation demand rises at a faster pace than in-come growth in developing countries. Moreover, it is pointed out that technologyholds significant potential to compensate the mismatch between exponentialincrease in transportation demand and relatively fixed environmental capacity inthe long run.
This study aims to detect the determinants of climate change mitigation technol-ogy development in transport sector and to scrutinize their impacts. The rest ofthe paper proceeds as follows. In part 2, literature on the relationship betweeninnovation and environmental regulation is discussed and then studies investigat-ing the role of transport sector in climate changemitigation are reported. In part3, the determinants of innovation in transport sector to mitigate climate change
158
2 Literature Review
are identified in line with the existing studies and empirical analysis is conducted.Afterwards, the results are discussed in section 4. The last part includes conclud-ing remarks on the contribution of the study and recommendations for upcomingresearch.
2 Literature Review
Researchon thedeterminants of environmental innovation in specific to transportsector lacks in the literature to the best of our knowledge. So, the literaturereview startswith presentation of empirical studieswhich explore the relationshipbetween environmental regulation and technology development. Subsequently,studies on climate changemitigation in the transport sector are outlined.
The role of technology in environmental protection is underlined by Porter andVan Der Linde (1995). They argue that environmentalism and industrial competi-tiveness are not necessarily opposites, asserting that it can enhance competitive-ness with higher productivity. Jaffe and Palmer (1997) find that environmentalcompliance costs have a positive effect on R&D expenditures, however they findno significant evidence for the relationship between environmental costs andpatents for a panel of USmanufacturing industries by using Pollution AbatementControl Expenditures (PACE) data as aproxy for stringencyof environmental policy.Lanjouw and Mody (1996) show the correlation between environmental regula-tion and innovation by analyzing patent data and PACE data for the US, Germanyand Japan for the period between 1972-1986. They employ all R&D and patentdata without eliminating groups which are irrelevant to environment. In orderto deduct better insights, they suggest to study chosen industries in focus withdisaggregated data. Moreover, Brunnermeier and Cohen (2003) utilize panel datafor 146 USmanufacturing industries for the span between 1983-1992 to identifydeterminants of environmental innovation. They report that PACE is positivelyassociated with environmental innovation. Popp (2006) analyzes air pollutioncontrol patent data for US, Japan and Germany between 1970-2000. Analysisreveals that environmental regulation has a direct impact on domestic emissioncontrol innovation. From a different perspective, Jaffe et al. (2003) draw attentionto link between technological development and environmental policy within thecontext of environmental economics.
Another line of research gathers on connection between transport, urbanizationand climate changemitigation. Economic growth and transport are intertwined
159
Environmental Innovation of Transportation Sector in OECD Countries
andmobilization of products in large distances along with decentralization be-cause of rapid urbanization has increased transport demand further (Kejun, 2010).Dulal et al. (2011) advocate high-density settlement and high-density employ-ment to mitigate climate change. Emission reduction alternatives are examinedvia scenario analysis in terms of cost and scope for urban transportation in devel-oping countries (Wright and Fulton, 2005). A set of measures with an emphasison modal shift is proposed as the possible minimum cost policy after comparingfuel technology and policies for modal shift.
Technological innovation is not the solution to reduce emissions from transportmerely, but behavioral change to promote modal shift to more environmentallyfriendly modes and policies to control demand for mobility are other areas totackle as discussed in IEA (2015) and EEA (2012). In terms of policy development,Colvile et al. (2001) suggest that as technology and transport system graduallybecome capable of stable decrease of emissions from road transport, policies onair quality will becomemore rigid. This argument implies a long run cointegra-tion between technology and climate change mitigation. In the same manner,Howey et al. (2010) assess climate changemitigation stringent goals of UK andconclude that dramatic changes which dictate innovative technologies coupledwith long run coherent policies are required for UK in fulfilling the CO2 reductioncommitment. Likewise, an important mitigation tool for climate change causedby transport sector is stated as advances in vehicle technology in Shaheen andLipman (2007). These improvements consist of increased utilization of electricvehicles and utilization of alternative energy sources accompanied with the nec-essary technology to use them. By the same token, Chapman (2007) asserts thatimprovements in transport technology is essential to address climate changeissue in the long run. On the other hand, it is also claimed that policy to pro-mote behavioral change holds critical role in the short run to benefit from thetechnological developments in a solid way. Jolley (2004) supports this view bystating that emissions caused by transportation can be reducedwith a sustainabletransportation strategy integrated with developments in transport technologies.Van Der Zwaan et al. (2013) conduct a scenario analysis for the period until 2100to examine technology diffusions to fulfill a predetermined climate change policy.It is predicated that the dominating vehicle technology along with alternativescan be identified by R&D practices of private sector. As implied by this finding,transformation pathway can be designated by innovation. In a recent empiricalwork by Beltrán-Esteve and Picazo-Tadeo (2015), environmental performancein the transport sector is studied for 38 countries between 1995-2009. The re-
160
3 Data and Methodology
sults show that environmental performance improvement is primarily driven byeco-innovations.
3 Data and Methodology
In the scopeof this study, factorswhichdetermineenvironmentally related innova-tion in transport sector are identified to analyze their relationship with innovativeoutput across time and countries. The analysis is conductedwith a panel data cov-ering the period between 1997-2012with annual frequency for 23 OECD countries.The countries are Australia, Austria, Belgium, Czech Republic, Denmark, Finland,France, Germany, Greece, Hungary, Ireland, Italy, Japan, Korea, Netherlands, Nor-way, Portugal, Slovak Republic, Spain, Sweden, Switzerland, United Kingdom,United States. Innovative capacity of transport sector in relation to environmenthas been measured by patents as a dependent variable following Costantini et al.(2017) and Dechezleprêtre et al. (2013). Besides, to capture differences acrosscountries, patent data basedon inventor’s residence is considered. Thenumber ofgranted patents at the European Patent Office (EPO) for climate changemitigationtechnologies related to transportation are retrieved from OECD (2018a).
Explanatory variables set consists of a diverse group of parameters. Firstly, fol-lowing Jaffe and Palmer (2007), value added is taken as an explanatory variable.In order to take the size of the sector into account, data for share of value addedby the transport sector is obtained from OECD (2018b). Environmental regulationis also considered as a determinant in environmental innovation in transport. Forthis variable, Environmental Policy Stringency Index is taken from OECD (2018c).The index measures the degree of penalty for actions causing pollution or en-vironmental damage within a range between 0 and 6, the former implying zerostringency and the latter referring to highest level. Bearing in mind that transportis oneof the primary contributors to emissions as discussed earlier, CO2 emissionsfrom transport sector in relation to GDP data acquired from OECD (2018d) is alsoincluded as an independent variable. From amacroeconomic point of view, theintegration of transport sector and economic growth suggests the inclusion of avariable about demand. Thus, GDP growth series are taken from OECD (2018e) asit is referred to as one of the determinants of transport demand in Zhang et al.(2018). Descriptive statistics for the panel dataset is presented in Table 1.
161
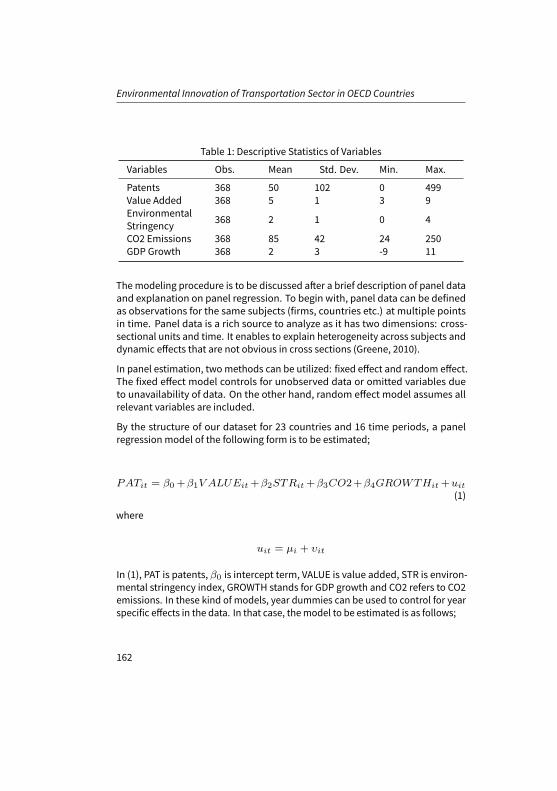
Environmental Innovation of Transportation Sector in OECD Countries
Table 1: Descriptive Statistics of Variables
Variables Obs. Mean Std. Dev. Min. Max.
Patents 368 50 102 0 499Value Added 368 5 1 3 9EnvironmentalStringency 368 2 1 0 4
CO2 Emissions 368 85 42 24 250GDP Growth 368 2 3 -9 11
Themodeling procedure is to be discussed after a brief description of panel dataand explanation on panel regression. To begin with, panel data can be definedas observations for the same subjects (firms, countries etc.) at multiple pointsin time. Panel data is a rich source to analyze as it has two dimensions: cross-sectional units and time. It enables to explain heterogeneity across subjects anddynamic effects that are not obvious in cross sections (Greene, 2010).
In panel estimation, twomethods can be utilized: fixed effect and random effect.The fixed effect model controls for unobserved data or omitted variables dueto unavailability of data. On the other hand, random effect model assumes allrelevant variables are included.
By the structure of our dataset for 23 countries and 16 time periods, a panelregression model of the following form is to be estimated;
PATit = β0+β1V ALUEit+β2STRit+β3CO2+β4GROWTHit+uit
(1)
where
uit = µi + υit
In (1), PAT is patents, β0 is intercept term, VALUE is value added, STR is environ-mental stringency index, GROWTH stands for GDP growth and CO2 refers to CO2emissions. In these kind of models, year dummies can be used to control for yearspecific effects in the data. In that case, themodel to be estimated is as follows;
162

4 Empirical Findings
PATit = β0 + β1V ALUEit + β2STRit + β3CO2+
β4GROWTHit + β5Y Dit + uit (2)
whereuit = µi + υit
In (2), YD stands for year dummies. In these models, µi are assumed to absorbindividual specific effects (Baltagi, 2008, p.14). These two model types will becompared based on Akaike Information Criterion (AIC). AIC developed by Akaike(1973) is a technique to compare different model specifications. In statisticalmodeling, two common considerations about the predictive capacity are over-fitting and under-fitting. An over-fitted model includes unnecessary variableswhich inflate the variation. An under-fitted model lacks relevant information byomitting related variables, in which case the model fails to capture the true rela-tionship. AIC is based on the view that a model should seize the real relationshipbetween variables without including irrelevant parameters. AIC is calculated bythe following equation for eachmodel i:
AICi = −2MLLi + 2ki where MLL stands for the maximum log likelihoodvalue and k is the number of estimated parameters.
4 Empirical Findings
Panelmodeling isnota straightforwardprocessas thepropertiesof cross-sectionaldata impose some restrictions. So, we adopt a stepwise approach. Initially, theevaluation of random effect or fixed effect model specification is carried out byHausman test (Greene, 2010, p.420). This analysis has led to fixed effect model-ing. Afterwards, assessment of model specification (1) and (2) reveals that yeardummy variables improve AIC in the estimation. The estimation results are pre-sented in Table 2. According to the results, all variables except for value addedare significant determinants of innovation capacity building in transport sector.Besides coefficient of determination also known as R2 of 19.28 % indicate thatthe model can explain almost 20% of the deviation in innovation of transportsector. Moreover, the F-statistic of 4.1 with p-value of 0.00 reveals that the modelis significant.
163
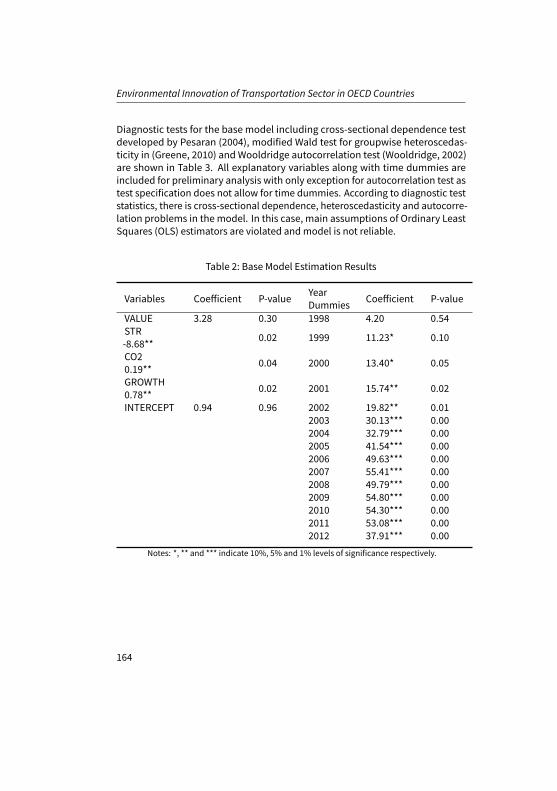
Environmental Innovation of Transportation Sector in OECD Countries
Diagnostic tests for the base model including cross-sectional dependence testdeveloped by Pesaran (2004), modified Wald test for groupwise heteroscedas-ticity in (Greene, 2010) and Wooldridge autocorrelation test (Wooldridge, 2002)are shown in Table 3. All explanatory variables along with time dummies areincluded for preliminary analysis with only exception for autocorrelation test astest specification does not allow for time dummies. According to diagnostic teststatistics, there is cross-sectional dependence, heteroscedasticity and autocorre-lation problems in themodel. In this case, main assumptions of Ordinary LeastSquares (OLS) estimators are violated andmodel is not reliable.
Table 2: Base Model Estimation Results
Variables Coefficient P-value YearDummies Coefficient P-value
VALUE 3.28 0.30 1998 4.20 0.54STR-8.68** 0.02 1999 11.23* 0.10
CO20.19** 0.04 2000 13.40* 0.05
GROWTH0.78** 0.02 2001 15.74** 0.02
INTERCEPT 0.94 0.96 2002 19.82** 0.012003 30.13*** 0.002004 32.79*** 0.002005 41.54*** 0.002006 49.63*** 0.002007 55.41*** 0.002008 49.79*** 0.002009 54.80*** 0.002010 54.30*** 0.002011 53.08*** 0.002012 37.91*** 0.00
Notes: *, ** and *** indicate 10%, 5% and 1% levels of significance respectively.
164

4 Empirical Findings
Table 3: Diagnostic Tests for the Base Model
Test Statistics P-value
Wooldridge Test 50.98*** 0.00Modified Wald Test 5„375.97*** 0.00Pesaran’s CD Test 13.80*** 0.00
Notes: *, ** and *** indicate 10%, 5% and 1% levels of significance respectively.
In order to handle the aforementioned problems, Driscoll and Kraay regressionis employed as it gives heteroscedasticity consistent standard errors and pro-vides robustness to general forms of cross-sectional and temporal dependence(Hoechle, 2007). The results of estimations are displayed in Table 4.
165

Environmental Innovation of Transportation Sector in OECD Countries
Table 4: Regression Results with Driscoll-Kraay Standard Errors
Model 1 Model 2
Variables Coef. P-value Variables Coef. P-
valueVALUE 3.28 0.31 VALUE - -STR -8.68 * 0.05 STR -8.94 ** 0.03CO2 0.19 * 0.06 CO2 0.22 * 0.06GROWTH 0.78 0.45 GROWTH - -INTERCEPT 0.94 0.97 INTERCEPT 19.16 0.16YD YD1998 0.62 *** 0.00 1998 3.83 *** 0.001999 0.63 *** 0.00 1999 11.22 *** 0.002000 1.39 *** 0.00 2000 13.42 *** 0.002001 1.60 *** 0.00 2001 14.46 *** 0.002002 1.99 *** 0.00 2002 18.20 *** 0.002003 3.18 *** 0.00 2003 28.92 *** 0.002004 3.73 *** 0.00 2004 32.94 *** 0.002005 5.24 *** 0.00 2005 41.38 *** 0.002006 6.10 *** 0.00 2006 49.98 *** 0.002007 5.95 *** 0.00 2007 55.98 *** 0.002008 7.81 *** 0.00 2008 48.10 *** 0.002009 10.99 *** 0.00 2009 49.24 *** 0.002010 8.21 *** 0.00 2010 53.72 *** 0.002011 9.05 *** 0.00 2011 51.69 *** 0.002012 9.41 *** 0.00 2012 35.33 *** 0.00
R2 19% R2 19%F-test(19,15) 23.92 *** 0.00 F-test
(17,15) 23.46 *** 0.00
Notes: *, ** and *** indicate 10%, 5% and 1% levels of significance respectively.
In Table 4, Model 1 is estimated with all independent variables along with timedummies and Model 2 is estimated by eliminating insignificant variables to ob-tain a parsimonious model. The F-test results of both models indicate overallsignificance of the variables in explaining innovation in transport. As shown inTable 4, all the year dummies are significant. This result is reasonable as the tech-
166

5 Conclusion
nology development along with environmental regulations entail a long periodof time. Besides, there is a lag between a technological change and its adapta-tion. Environmental stringency is a significant factor and has a negative effecton environmental innovation in transportation. This inverse relationship can beexplained by an implied and indirect negative impact of environmental policieson firms in reference to the lack of consensus on the directional impact of envi-ronmental regulation as stated by Leiter et al. (2011). Companies operating intransport sector may anticipate that cost of adjustment to environmental regula-tions outweighs the efficiency gains of technology development. Moreover, asinnovation process does not give results in short term, firmsmaybe in expectationof looser environmental regulation in the future thereby they don’t undertake cap-ital and organizational responsibility by investing in research and development.In addition, innovationmight be driven by efforts to remedy dependence of trans-port sector on petroleum, likely in response to volatility in energy prices which isanother implication for focus of transport companies on costs. The positive signof CO2 emissions might indicate that search for energy-efficient vehicles resultsin increased technology development when emissions of the sector rise. Thisplausible insight might indicate that transport sector embraces environmentalmitigation after it is realized that the damage is continuous.
5 Conclusion
The role of technology development draws close attention tomitigate environ-mental damage. As an important source of air pollution (Colvile et al., 2001),innovation of transportation sector is important to control climate change. Theobjective of this study is to identify the determinants of such innovative capacityand analyze their effects. To do this, a panel regression for environmental patentsin transport sector is performed on input variables of environmental stringency,CO2 emissions by transportation, GDP growth and share of value added by thesector for the period between 1997-2012 for 23 OECD countries. The empiricalfindings suggest that environmental stringency and sectoral CO2 emissions aresignificant factors determining innovative capacity in transportation. The strin-gency of environmental regulation has negative correlation with innovation intransportation. This might be due to costs being firms’ primary focus rather thanenvironmental mitigation and energy prices acting as a primary catalyst in tech-nology development for transportation. The positive effect of CO2 emissions oninnovation suggest that efforts for higher energy efficiency in transport sector end
167
Environmental Innovation of Transportation Sector in OECD Countries
up with innovation as CO2 emissions rise. This study is limited to the analysis oftransport sector only, however manufacturing sector can be also considered dueto the interaction between one another. Besides the availability of data limits thetime span in the analysis, thus time horizon can be extended by utilizing differentparameters to proxy environmental stringency.
References
(EEA), E. E. A. (2010). Econometric analysis. 7th ed. Essex: Prentice Hall.(EEA), E. E. A. (2012). The contribution of transport to air quality - TERM 2012: Transport indicators
tracking progress towards environmental targets in Europe. (Report No: 10/2012). Copenhagen:Rosendahls-Schultz Grafisk.
(IEA), I. E. A. (2015). “Energy and climate change. World energy outlook special report, 1–200”. In:Akaike, H. (1973). “Information theory and an extension of the maximum likelihood principle”. In:
In Second international symposium on information theory [ Petrov, B. N. and Csaki, B. F. (eds.)]Pp. 267–281.
Baltagi, B. (2008). Econometric analysis of panel data. John Wiley & Sons.Beltrán-Esteve, M. and A. J. Picazo-Tadeo (2015). “Assessing environmental performance trends in
the transport industry: eco-innovation or catching-up?” In: Energy Economics 51, pp. 570–580.Brunnermeier, S. B. and M. A. Cohen (2003). “Determinants of environmental innovation in US
manufacturing industries”. In: Journal of environmental economics and management 45.2,pp. 278–293.
Chapman, L. (2007). “Transport and climate change: a review”. In: Journal of transport geography15.5, pp. 354–367.
Climate Change, I. P. on (2015). Climate change 2014: mitigation of climate change. Vol. 3. Cam-bridge University Press.
Colvile, R., E. Hutchinson, J. Mindell, and R. Warren (2001). “The transport sector as a source of airpollution”. In: Atmospheric environment 35.9, pp. 1537–1565.
Costantini, V., F. Crespi, G. Marin, and E. Paglialunga (2017). “Eco-innovation, sustainable sup-ply chains and environmental performance in European industries”. In: Journal of cleanerproduction 155, pp. 141–154.
Dechezleprêtre, A., M. Glachant, and Y.Méniére (2013). “What drives the international transfer of cli-mate changemitigation technologies? Empirical evidence from patent data”. In: Environmentaland Resource Economics 54.2, pp. 161–178.
Dulal, H. B., G. Brodnig, and C. G. Onoriose (2011). “Climate changemitigation in the transportsector through urban planning: A review”. In: Habitat International 35.3, pp. 494–500.
FCCC, U. (1992). “United Nations Framework Convention on Climate Change. 1992”. In: http ://www.unfccc.de.
Hoechle, D. et al. (2007). “Robust standard errors for panel regressions with cross-sectional de-pendence”. In: Stata Journal 7.3, p. 281.
168
REFERENCES
Howey, D. D., D. R. North, and D. R. Martinez-Botas (2010). “Road transport technology and climatechange mitigation. Grantham Institute for Climate Change(Briefing Paper No. 2).” In: http://workspace.imperial.ac.uk/climatechange/Public/pdfs/press/GranthamTransportBriefingPaper.pdf .
Jaffe, A. B., R. G. Newell, and R. N. Stavins (2003). “Technological change and the environment”. In:Handbook of environmental economics. Vol. 1. Elsevier, pp. 461–516.
Jaffe, A. B. and K. Palmer (1997). “Environmental regulation and innovation: a panel data study”.In: Review of economics and statistics 79.4, pp. 610–619.
Jolley, A. (2004). “New Technologies, Industry Developments and Emission Trends in Key Sectors:The Land Transportation Sector Draft Working Paper No. 1”. In:
Kejun, J. (2010). “Mapping Climate Mitigation Technologies and Associated Goods within theTransport Sector”. In: ICTSD Programme on Trade and Environment, http:// ictsd.org/downloads/2010/11/mappingclimate-change-mitigation-technologies-and-associated-goods-within-the-transport-sector-jm.Pdf .
Lanjouw, J. O. and A. Mody (1996). “Innovation and the international diffusion of environmentallyresponsive technology”. In: Research Policy 25.4, pp. 549–571.
Leiter, A.M., A. Parolini, andH.Winner (2011). “Environmental regulation and investment: Evidencefrom European industry data”. In: Ecological Economics 70.4, pp. 759–770.
Nations, U. (2016). “Paris agreement”. In: https://unfccc.int/ sites/default/ files/english_paris_agreement.pdf .
OECD (2018a). “Climate changemitigation technologies related to transportation. Science, Tech-nology and Patents, Patents, Patents in Environmentally Related Technologies”. In: http://stats.oecd.org/ .
OECD (2018b). “CO2 emissions from transport in tonnes per one million units of current US GDPTransport, Performance Indicators, Energy and Environment”. In: http://stats.oecd.org/ .
OECD (2018c). “Environmental policy stringency. Environment,Environmental Policy”. In: http://stats.oecd.org/ .
OECD (2018d). “GDP growth rate. NationalAccounts, Annual National Accounts, Main Aggregates,Gross Domestic Product”. In: http://stats.oecd.org/ .
OECD (2018e). “Share of value added by the transport sector. Transport, Performance indica-tors.Economic and Social]”. In: http://stats.oecd.org/ .
Pesaran,M.H. (2004). “General diagnostic tests for cross sectiondependence inpanels”. In:Workingpaper (No. 1229), University of Cambridge, Cambridge, United Kingdom.
Popp, D. (2006). “International innovation and diffusion of air pollution control technologies: theeffects of NOX and SO2 regulation in the US, Japan, and Germany”. In: Journal of EnvironmentalEconomics and Management 51.1, pp. 46–71.
Porter, M. E. and C. Van der Linde (1995). “Toward a new conception of the environment competi-tiveness relationship”. In: Journal of economic perspectives 9.4, pp. 97–118.
Rogelj, J., G. Luderer, R. C. Pietzcker, E. Kriegler, M. Schaeffer, V. Krey, and K. Riahi (2015). “Energysystem transformations for limiting end-of-century warming to below 1.5 C”. In: Nature ClimateChange 5.6, p. 519.
Shaheen, S. A. and T. E. Lipman (2007). “Reducing greenhouse emissions and fuel consumption:Sustainable approaches for surface transportation”. In: IATSS research 31.1, pp. 6–20.
Wooldridge, J. M. (2010). Econometric analysis of cross section and panel data. MIT press.Wright, L. and L. Fulton (2005). “Climate changemitigation and transport in developing nations”.
In: Transport Reviews 25.6, pp. 691–717.
169

Environmental Innovation of Transportation Sector in OECD Countries
Zhang, R., S. Fujimori, and T. Hanaoka (2018). “The contribution of transport policies to themitigation potential and cost of 2 C and 1.5 C goals”. In: Environmental Research Letters 13.5,p. 054008.
Zwaan, B. C. van der, H. Rosler, T. Kober, T. Aboumahboub, K. V. Calvin, D. Gernaat, G. Marangoni,and D. McCollum (2013). “A cross-model comparison of global long-term technology diffusionunder a 2 C climate change control target”. In: Climate Change Economics 4.04, p. 1340013.
170
Design of an Added Plan with SocialResponsibility
Kathya Alexandra Suesca Rozo1, Andrés Felipe Santos Hernández1
1 – Escuela Colombiana de Ingeniería ”Julio Garavito”
For decades and worldwide, steel has been one of themost important commodityin the development of the industry due to its multiple uses. At present, the offer ofsteel in Colombia is too low compared to the sector’s demand. This has causedmarket speculation and a lowadded value regarding all productsmadewith steel.In such a competitive market, the organizations involved have been developingstrategies to improve their incomes, someof these are developed in the operationsarea, where the planning is the most important part regarding the cost reduction,minimize the rate of rotation of the personal in the operations area and incrementin the effectivity of the supplies chain. Having this need and tendency created, theinvestigation group designed an added planning model, based on the case of anenterprise that transforms steel in cloves. Using this model in the enterprise willguarantee decrease the shortage in posterior periods and as consequence lowerthe costs and wastes caused by shortfalls, the costs of keeping an inventory andcosts due to high lead time tomarket. Furthermore, the model will minimize therate of rotation of the personal in the operations area, this will result encouragingsocial responsibility which contribute to the organization’s productivity.
Keywords: Steel transformation; Added planning; Optimization; Social respon-sibility
First recieved: 30.May.2018 Revised: 09.Jul.2018 Accepted: 16.Jul.2018
171
Design of an Added Plan with Social Responsibility
1 Introduction
Since the start of the 50’s, steel in Colombia has become a resource quite relevantregarding development of the industry and the country’s infrastructure. 500.000tons of steel are expected to be the demand in the projects of infrastructure,such as the routes 4G (El Espectador, 2017). Nowadays, according to Camacero(Cámara Colombiana del Acero), Colombia produces 1.2 million tons of steel andconsumes 3.6million tons, this shows a shortfall in the primary supply chain of thesector. Therefore, the producers andmarketers must import around 2.4 milliontons per year, so the demand can be satisfied (Portafolio, 2017).
Production of this sector represents 7% of the national industrial GDP and eventhough it creates more than 40.000 jobs, it still shows problems in reducing theproduction and logistics costs. This is a consequence of the lack of knowledge re-garding the practices in the supply chain and exterior facts, such as the incrementof imports in lower prices (Dinero, 2017).
Keeping in mind the late technological and industrial tendencies in the world,China has shown to be the asiatic country with the highest production of steel,with around 800 tons per year, provides about 50% of the global demand (Elnuevo siglo, 2016). Their companies are owned by the state, so they are highlysubsidized and are not governed by market rules (Alacero, 2017). For this reason,their prices are lower than the market, which is known as dumping (El español,2016).
This has generated an oversupply of this product and a drop in internationalprices (Portafolio, 2017). Not to mention the technical stoppages and closures ofsteel plants that the overproduction of this asiatic giant has generated (Alacero,2017).
Consequently, the Chinese government has hardworking to close those compa-nies that produce low quality steel made of scrap. Same, with the objective toreduce its production capacity by more than 50 million tons, increment theirprices andminimize environmental impacts (Infoacero, 2018). In addition, thesedecisions are part of the government’s goal of changing its economic model,with less dependence of the industry and more focalized on new technologies(Angencia EFE, 2018).
Regarding this inconvenient, the sector must know that it will continue to fightwith the price against this rival, since the asiatic country will continue to producesteel at very competitive prices. For this reason, the national companies of sector
172

1 Introduction
should implement best practices throughout the supply chain, specifically in theprimary chain and the planning of its production, to guarantee the supply of thisproduct at a competitive cost.
Given the fact that this product is a commodity, the enterprises involved with thissupply chains have had to deal with the prices, and therefore the organizationsare concerned and have worked slowly in reducing the operational costs with thepurpose of improving their opportunities and therefore their oncomes.
Even though detecting the wasting and overspends along the process is relevant(Nave, 2002), this practice does not reduce the costs significantly in comparisonto an adequate planning in its supply chain. As Chopra (2008) says, an adequateplan will guarantee the focalization of the resources along the chain so that anemergingmarket can be handled, evenmore if there are high lead time tomarket,uncontrolled product portfolios, over-stock, low service quality, lost sales, andunsatisfied customers.
However, the arrival of enterprises such as Gerdau, Votorantim and Techint hasimproved the sectors know how and its technology level. This, marked by thedemand of competitiveness, requires that the customer service and the attentionto themarket demandanexpansion in the investments of the information systemsand adequate planning in the supply chain (Munar, 2008).
By identifying this need in the sector, the research group has built a model ofadded planning, through the application of linear programming, for an enterpriselocated in Bogotá (Colombia) that works in the transformation of steel in con-struction products, such as rod, mesh, cloves, picks, and other products. Themodel’s aim is to lower the costs of the planning in the supply chain, the costs arethe inversions made with the expectations of getting benefits in the future, butalso in the present. How we try to impact in the enterprise is to generate benefitsalong the whole chain so that we can accomplish a balance between the demandand the offer of cloves.
To meet this end, a model has been developed so that the effectivity and theproductivity of the resources is improved. A model like this is a representation ofreality using linear mathematic expressions, in which we can know with certaintythe parameters and by giving it a solution, the model proposes which should bethedecisions tomake inoneormore timeperiods (BohórquezQuiroga , SarmientoLepesqueur, & Jaimes Suárez, 2013).
173
Design of an Added Plan with Social Responsibility
2 Added Planning Models
There are manymethods of added planning which can be divided in three groupsaccording to Boiteux, these are: comparative alternatives, use of decision rulesand based in models of linear programming (Boiteux, 2007). The linear program-ming models are the most used nowadays.
There are some authors that have developed applications, in this sector, thereis Cañas (2013), who planned the production of an industry that belong at themetallurgical industry so that he could maximize utilities by introducing mul-tiphase, multi period, multiproduct models of linear programming and by thedevelopment of a constructive heuristic based on the principles of the restrictionstheory. Chavez (2014), designed amodel of linear programing with the purposeof resolving a problem of added planning in production for Huachipato metallur-gical company, considering the restrictions concerning inventory, demand, andcapacity. Zurito (2010), made a model of linear programming to minimize thelacks in the inventory and therefore the associated costs. Gholamian & Tavakkoli& Nezam (2015), developed an entire mixedmodel of linear programming witha multi objective approach, to minimize the total production cost, improve theservice quality, minimize fluctuations in the rates of change of the work force andmaximize sales.
3 Case Study
3.1 Company and Process Background
The enterprise to be analyzed is part of the labor union Camacero (Cámara colom-biana del acero), which was created in 2014 with the objective of gathering morethan 40 national enterprises dedicated to the production, transformation, andcommercializing of steel. This with the purpose of generating solutions in thevalue chain (El Espectador, 2014). Nowadays, the labor union counts with morethan 400 producers registered.
In Latin-American, Colombia is stablished as the fourth steel producer after Brazil,México, and Argentina (Alacero, 2017). Nevertheless, Colombia must work toincrease its production and improve its competitiveness.
174
3 Case Study
According to theANDI (Asociaciónnacional de empresarios deColombia) between2007 and 2016 the sector grew 13% (Andi, 2018), despite the hard situation that ithas been facing.
Given this need and considering the shortage of rawmaterial, the strong compe-tence with foreign enterprises, a model of added planning is proposed so that itdetermines the ideal production, capacity inventory, stock-out and out-sourcinglevels required to satisfy the cloves demand, the product that was chosen to thiscase of study (Sunil Chopra, 2008). Nevertheless, if the organizations in additionto making a correct planning would add practices of social responsibility, theywould assure not only the decrease of costs, but also will assure an improve intheir competitiveness.
It is also necessary to identify the stage in which the workers are about the learn-ing curve, this means to know if they are beginners, medium or advanced. Ifenterprises reduce the rotation of their advanced personnel, they could assurenot only quality but also the flux in production. We know this because the work-ers with more experience have a more efficient handling of the resources andguarantee the improvement of the production.
3.2 The Process
The fabrication process of the 3”x 24 -kilogram galvanized clove has 5 steps. Therawmaterial for this product is 5-milligramSAE10231 steelwhich comes in approx-imately 2-metric ton rolls. The supplying of this material is made with forklifts,leaving 2 rolls per round in two reelings. These feed two drawing machines,the koch 1 and koch 2. These machines are automatic, the operator handlingis needed during the time of charge and discharge. The drawing is the plasticconformation of a material through tensile continuous stresses, through rows,it is possible it’s thinning (Boca, 2017). In this case, a diameter of 5.5-milligramwas thinned to a diameter of 3.8-milligram. This wire is deposited in coils of up to900-kilogram., which are transported by the forklift to the area of hot galvanizing.On each route, the vehicle can carry up to four coils. In the hot galvanizing line,usually 2 lines are programmed for this type of product.
1It is a quality of lowcarbon steel that canbeused in cold. It has high tenacity and lowmechanicalresistance.
175
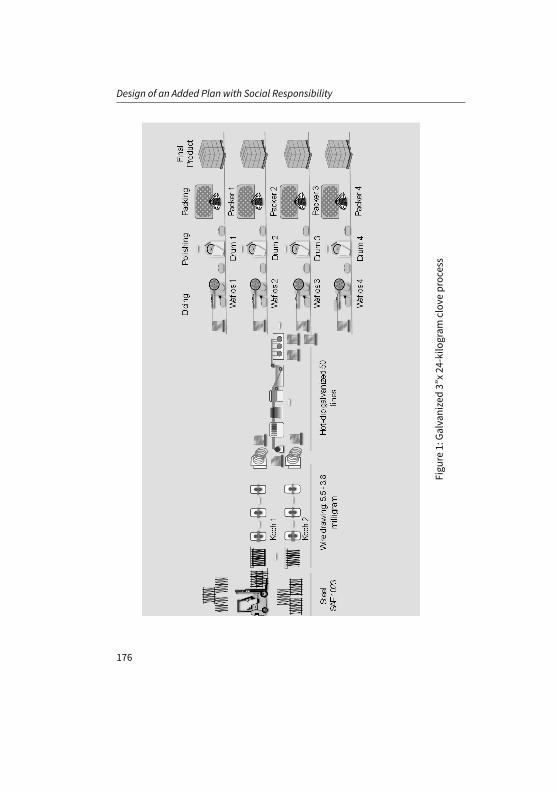
Design of an Added Plan with Social Responsibility
Figu
re1:Ga
lvan
ized
3”x24
-kilo
gram
clov
eprocess
176

3 Case Study
The entire line has 50 threads, but only two lines are programmed for this typeof clove; these coils are unrolled at a slow pace, going through a process of hotgalvanizing, which is a surface treatment in a zinc vat at high temperatures thatallows the wire to be protected from corrosion, so that later, the galvanized wireis winded at the end of the line, also, with up to 900-kilogram (Berto, 2017). Thismaterial is taken by the forklift to the cloves ship, where 4 wafios equipmentare programmed. These machines turn the wire into cloves, temporarily storingthem in baskets of up to 300-kilogram. Using a bridge crane, in the same ship, thebaskets are taken to the polishing area, where 4 drums that turn with sawdust,clean, and polish the clove. These polished cloves are deposited again in thesame baskets and loaded by the bridge crane to the packing section. Generally,4 packers are scheduled for the packing of this material. Each packer manuallyweighs about 600-grams with a tolerance of 10-grams. In each pack, and eachone of these, the packer deposits the clove in a cardboard box of 24-kilogram. Asthey finish each carton they stack it in a stowage, until completing 54 cartons. Theoperator that is completing the stacking, packs the stowage with stretch film2.
2Vinipel, translucid plastic film with a high resistence.
177

Design of an Added Plan with Social Responsibility
Table 1: Statistics of the process of the 3”x 24-kilogram galvanized clove.May 2017.
Operation EquipmentProductionspeed(ton/hour)
Efficiency(%)
Realproduction(ton/hour)
Drawing Koch 1 2.1 65 1.4Koch 2 2.5 57 1.4
Galvanizing 2 lines 3.5 63 2.2Dicing Wafios 1 1.7 72 1.2
Wafios 2 1.3 67 0.9Wafios 3 1.5 70 1Wafios 4 1.2 55 0.7
Polishing drum 1 0.7 85 0.6drum 2 0.8 92 0.7drum 3 0.7 80 0.6drum 4 0.6 89 0.5
Packing packer 1 0.024 78 0.008packer 2 0.024 82 0.008packer 3 0.024 72 0.007packer 4 0.024 86 0.009
178
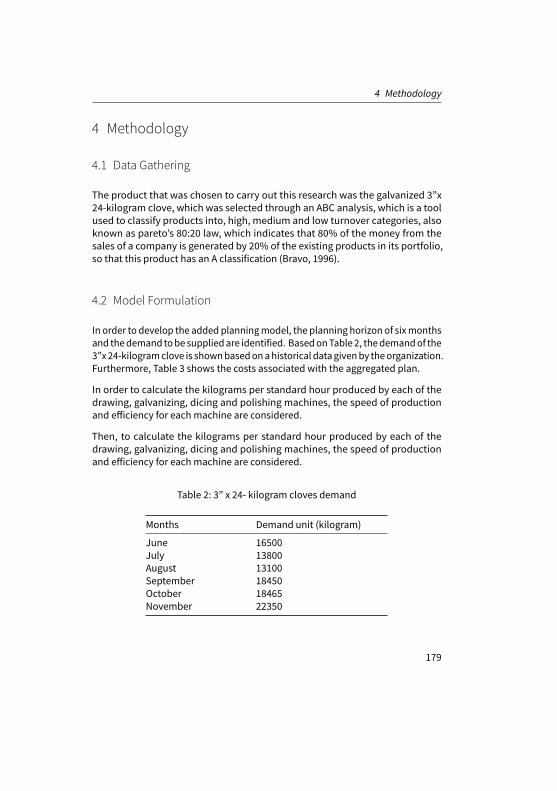
4 Methodology
4 Methodology
4.1 Data Gathering
The product that was chosen to carry out this research was the galvanized 3”x24-kilogram clove, which was selected through an ABC analysis, which is a toolused to classify products into, high, medium and low turnover categories, alsoknown as pareto’s 80:20 law, which indicates that 80% of the money from thesales of a company is generated by 20% of the existing products in its portfolio,so that this product has an A classification (Bravo, 1996).
4.2 Model Formulation
In order to develop the added planningmodel, the planning horizon of sixmonthsand thedemand tobe suppliedare identified. BasedonTable 2, thedemandof the3”x24-kilogramclove is shownbasedonahistorical datagivenby theorganization.Furthermore, Table 3 shows the costs associated with the aggregated plan.
In order to calculate the kilograms per standard hour produced by each of thedrawing, galvanizing, dicing and polishing machines, the speed of productionand efficiency for eachmachine are considered.
Then, to calculate the kilograms per standard hour produced by each of thedrawing, galvanizing, dicing and polishing machines, the speed of productionand efficiency for eachmachine are considered.
Table 2: 3” x 24- kilogram cloves demand
Months Demand unit (kilogram)
June 16500July 13800August 13100September 18450October 18465November 22350
179
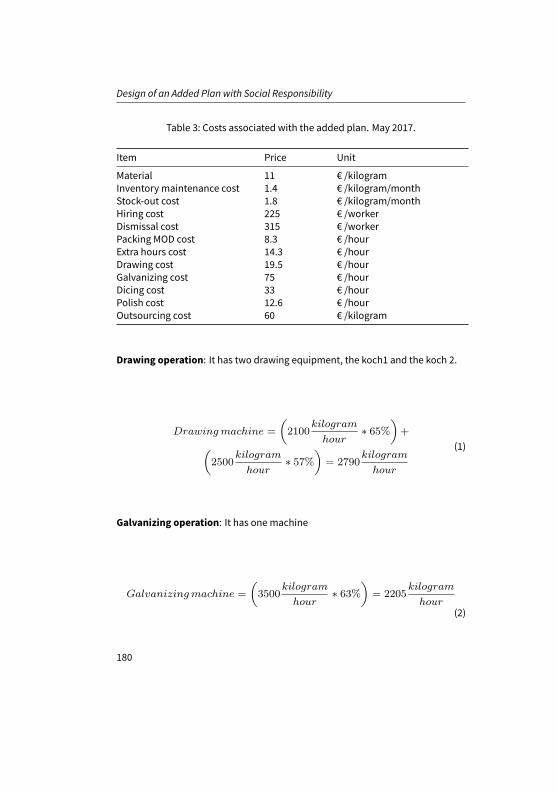
Design of an Added Plan with Social Responsibility
Table 3: Costs associated with the added plan. May 2017.
Item Price Unit
Material 11 € /kilogramInventory maintenance cost 1.4 € /kilogram/monthStock-out cost 1.8 € /kilogram/monthHiring cost 225 € /workerDismissal cost 315 € /workerPacking MOD cost 8.3 € /hourExtra hours cost 14.3 € /hourDrawing cost 19.5 € /hourGalvanizing cost 75 € /hourDicing cost 33 € /hourPolish cost 12.6 € /hourOutsourcing cost 60 € /kilogram
Drawing operation: It has two drawing equipment, the koch1 and the koch 2.
Drawingmachine =
(2100
kilogram
hour∗ 65%
)+(
2500kilogram
hour∗ 57%
)= 2790
kilogram
hour
(1)
Galvanizing operation: It has onemachine
Galvanizingmachine =
(3500
kilogram
hour∗ 63%
)= 2205
kilogram
hour(2)
180
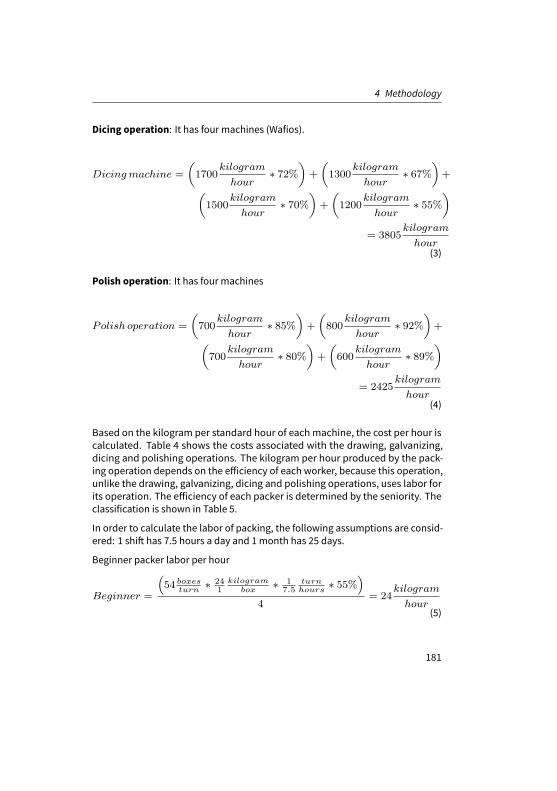
4 Methodology
Dicing operation: It has four machines (Wafios).
Dicingmachine =
(1700
kilogram
hour∗ 72%
)+
(1300
kilogram
hour∗ 67%
)+(
1500kilogram
hour∗ 70%
)+
(1200
kilogram
hour∗ 55%
)= 3805
kilogram
hour(3)
Polish operation: It has four machines
Polish operation =
(700
kilogram
hour∗ 85%
)+
(800
kilogram
hour∗ 92%
)+(
700kilogram
hour∗ 80%
)+
(600
kilogram
hour∗ 89%
)= 2425
kilogram
hour(4)
Based on the kilogram per standard hour of eachmachine, the cost per hour iscalculated. Table 4 shows the costs associated with the drawing, galvanizing,dicing and polishing operations. The kilogram per hour produced by the pack-ing operation depends on the efficiency of each worker, because this operation,unlike the drawing, galvanizing, dicing and polishing operations, uses labor forits operation. The efficiency of each packer is determined by the seniority. Theclassification is shown in Table 5.
In order to calculate the labor of packing, the following assumptions are consid-ered: 1 shift has 7.5 hours a day and 1month has 25 days.
Beginner packer labor per hour
Beginner =
(54 boxes
turn∗ 24
1kilogram
box∗ 1
7.5turnhours
∗ 55%)
4= 24
kilogram
hour(5)
181

Design of an Added Plan with Social Responsibility
Table 4: $ per-kilogram costs. Source: the authors
Operation cost Price Unit
Drawing cost 0.01 € /kilogramGalvanizing cost 0.03 € /kilogramDicing cost 0.01 € /kilogramPolish cost 0.01 € /kilogram
Table 5: Personal classification in the Packing operation
Type Efficiency Seniority
Beginner 55% Less than 3monthsMedium 65% Between 3 and 4Advanced 85% More than 4months
Medium packer labor per hour
Medium =
(54 boxes
turn∗ 24
1kilogram
box∗ 1
7.5turnhours
∗ 65%)
4= 28
kilogram
hour(6)
Advanced packer labor per hour
Advanced =
(54 boxes
turn∗ 24
1kilogram
box∗ 1
7.5turnhours
∗ 85%)
4= 37
kilogram
hour(7)
Furthermore, based on the amount of days we can have an inventory of theproduct in the process of drawing, dicing, and polishing. The used inventorypolicies are shown in Table 6.
The first step to build a model of added planning is to identify the decision thatthe enterprise canmake (Sunil Chopra, 2008).
182
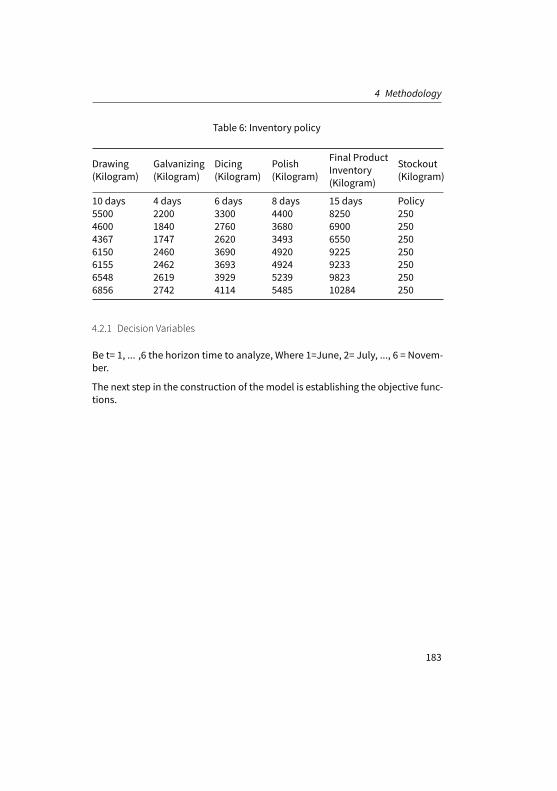
4 Methodology
Table 6: Inventory policy
Drawing(Kilogram)
Galvanizing(Kilogram)
Dicing(Kilogram)
Polish(Kilogram)
Final ProductInventory(Kilogram)
Stockout(Kilogram)
10 days 4 days 6 days 8 days 15 days Policy5500 2200 3300 4400 8250 2504600 1840 2760 3680 6900 2504367 1747 2620 3493 6550 2506150 2460 3690 4920 9225 2506155 2462 3693 4924 9233 2506548 2619 3929 5239 9823 2506856 2742 4114 5485 10284 250
4.2.1 Decision Variables
Be t= 1, ... ,6 the horizon time to analyze, Where 1=June, 2= July, ..., 6 = Novem-ber.
The next step in the construction of the model is establishing the objective func-tions.
183
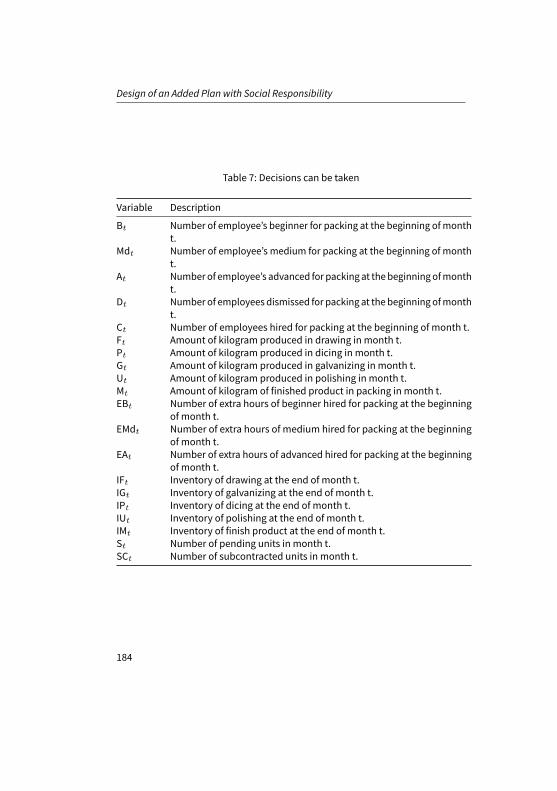
Design of an Added Plan with Social Responsibility
Table 7: Decisions can be taken
Variable Description
Bt Number of employee’s beginner for packing at the beginning ofmontht.
Mdt Number of employee’s medium for packing at the beginning of montht.
At Number of employee’s advanced for packing at thebeginningofmontht.
Dt Number of employees dismissed for packing at the beginning ofmontht.
Ct Number of employees hired for packing at the beginning of month t.Ft Amount of kilogram produced in drawing in month t.Pt Amount of kilogram produced in dicing in month t.Gt Amount of kilogram produced in galvanizing in month t.Ut Amount of kilogram produced in polishing in month t.Mt Amount of kilogram of finished product in packing in month t.EBt Number of extra hours of beginner hired for packing at the beginning
of month t.EMdt Number of extra hours of medium hired for packing at the beginning
of month t.EAt Number of extra hours of advanced hired for packing at the beginning
of month t.IFt Inventory of drawing at the end of month t.IGt Inventory of galvanizing at the end of month t.IPt Inventory of dicing at the end of month t.IUt Inventory of polishing at the end of month t.IMt Inventory of finish product at the end of month t.St Number of pending units in month t.SCt Number of subcontracted units in month t.
184
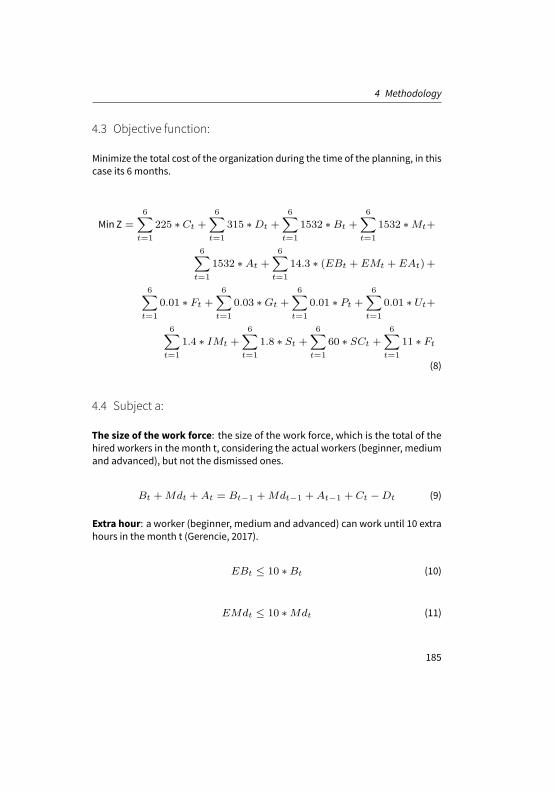
4 Methodology
4.3 Objective function:
Minimize the total cost of the organization during the time of the planning, in thiscase its 6 months.
Min Z =
6∑t=1
225 ∗ Ct +
6∑t=1
315 ∗Dt +
6∑t=1
1532 ∗Bt +
6∑t=1
1532 ∗Mt+
6∑t=1
1532 ∗At +
6∑t=1
14.3 ∗ (EBt + EMt + EAt)+
6∑t=1
0.01 ∗ Ft +6∑
t=1
0.03 ∗Gt +6∑
t=1
0.01 ∗ Pt +6∑
t=1
0.01 ∗ Ut+
6∑t=1
1.4 ∗ IMt +
6∑t=1
1.8 ∗ St +
6∑t=1
60 ∗ SCt +
6∑t=1
11 ∗ Ft
(8)
4.4 Subject a:
The size of the work force: the size of the work force, which is the total of thehired workers in the month t, considering the actual workers (beginner, mediumand advanced), but not the dismissed ones.
Bt +Mdt +At = Bt−1 +Mdt−1 +At−1 + Ct −Dt (9)
Extra hour: a worker (beginner, medium and advanced) can work until 10 extrahours in the month t (Gerencie, 2017).
EBt ≤ 10 ∗Bt (10)
EMdt ≤ 10 ∗Mdt (11)
185
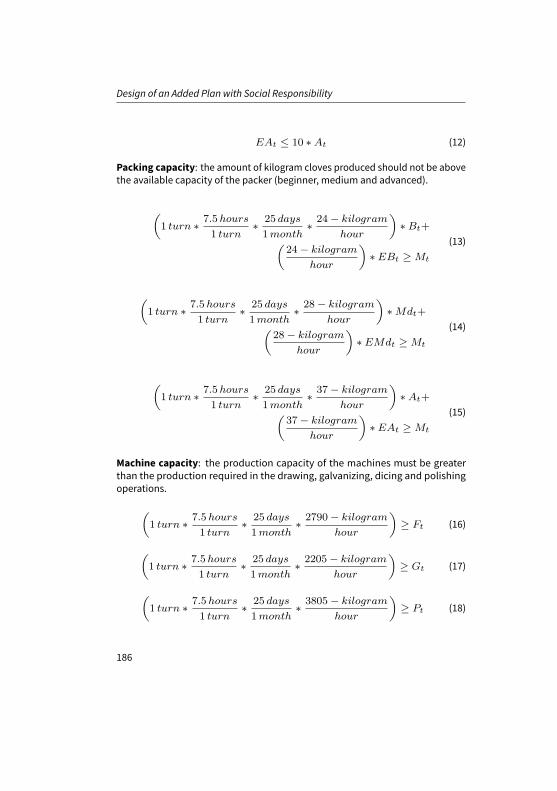
Design of an Added Plan with Social Responsibility
EAt ≤ 10 ∗At (12)
Packing capacity: the amount of kilogram cloves produced should not be abovethe available capacity of the packer (beginner, medium and advanced).
(1 turn ∗
7.5hours
1 turn∗
25 days
1month∗24− kilogram
hour
)∗Bt+(
24− kilogram
hour
)∗ EBt ≥ Mt
(13)
(1 turn ∗
7.5hours
1 turn∗
25 days
1month∗28− kilogram
hour
)∗Mdt+(
28− kilogram
hour
)∗ EMdt ≥ Mt
(14)
(1 turn ∗
7.5hours
1 turn∗
25 days
1month∗37− kilogram
hour
)∗At+(
37− kilogram
hour
)∗ EAt ≥ Mt
(15)
Machine capacity: the production capacity of the machines must be greaterthan the production required in the drawing, galvanizing, dicing and polishingoperations.
(1 turn ∗
7.5hours
1 turn∗
25 days
1month∗2790− kilogram
hour
)≥ Ft (16)
(1 turn ∗
7.5hours
1 turn∗
25 days
1month∗2205− kilogram
hour
)≥ Gt (17)
(1 turn ∗
7.5hours
1 turn∗
25 days
1month∗3805− kilogram
hour
)≥ Pt (18)
186
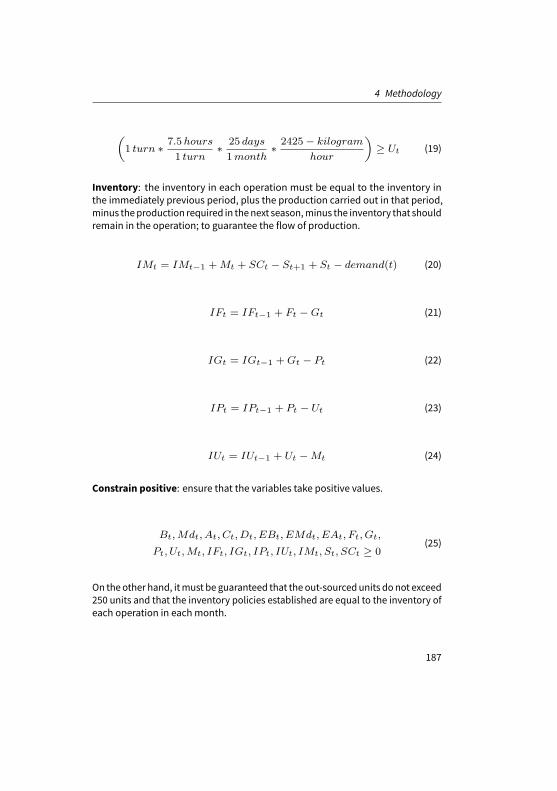
4 Methodology
(1 turn ∗
7.5hours
1 turn∗
25 days
1month∗2425− kilogram
hour
)≥ Ut (19)
Inventory: the inventory in each operation must be equal to the inventory inthe immediately previous period, plus the production carried out in that period,minus theproduction required in thenext season,minus the inventory that shouldremain in the operation; to guarantee the flow of production.
IMt = IMt−1 +Mt + SCt − St+1 + St − demand(t) (20)
IFt = IFt−1 + Ft −Gt (21)
IGt = IGt−1 +Gt − Pt (22)
IPt = IPt−1 + Pt − Ut (23)
IUt = IUt−1 + Ut −Mt (24)
Constrain positive: ensure that the variables take positive values.
Bt,Mdt, At, Ct, Dt, EBt, EMdt, EAt, Ft, Gt,
Pt, Ut,Mt, IFt, IGt, IPt, IUt, IMt, St, SCt ≥ 0(25)
On the other hand, itmust be guaranteed that the out-sourcedunits do not exceed250 units and that the inventory policies established are equal to the inventory ofeach operation in eachmonth.
187
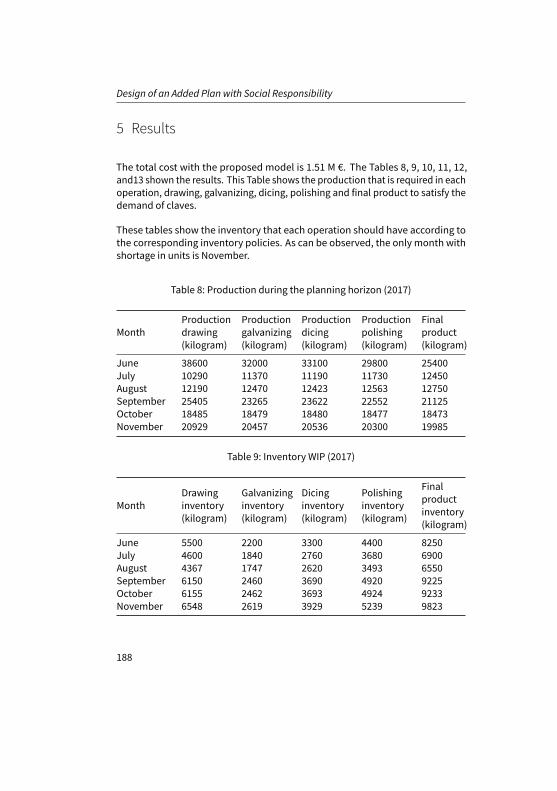
Design of an Added Plan with Social Responsibility
5 Results
The total cost with the proposed model is 1.51 M €. The Tables 8, 9, 10, 11, 12,and13 shown the results. This Table shows the production that is required in eachoperation, drawing, galvanizing, dicing, polishing and final product to satisfy thedemand of claves.
These tables show the inventory that each operation should have according tothe corresponding inventory policies. As can be observed, the only month withshortage in units is November.
Table 8: Production during the planning horizon (2017)
MonthProductiondrawing(kilogram)
Productiongalvanizing(kilogram)
Productiondicing(kilogram)
Productionpolishing(kilogram)
Finalproduct(kilogram)
June 38600 32000 33100 29800 25400July 10290 11370 11190 11730 12450August 12190 12470 12423 12563 12750September 25405 23265 23622 22552 21125October 18485 18479 18480 18477 18473November 20929 20457 20536 20300 19985
Table 9: Inventory WIP (2017)
MonthDrawinginventory(kilogram)
Galvanizinginventory(kilogram)
Dicinginventory(kilogram)
Polishinginventory(kilogram)
Finalproductinventory(kilogram)
June 5500 2200 3300 4400 8250July 4600 1840 2760 3680 6900August 4367 1747 2620 3493 6550September 6150 2460 3690 4920 9225October 6155 2462 3693 4924 9233November 6548 2619 3929 5239 9823
188
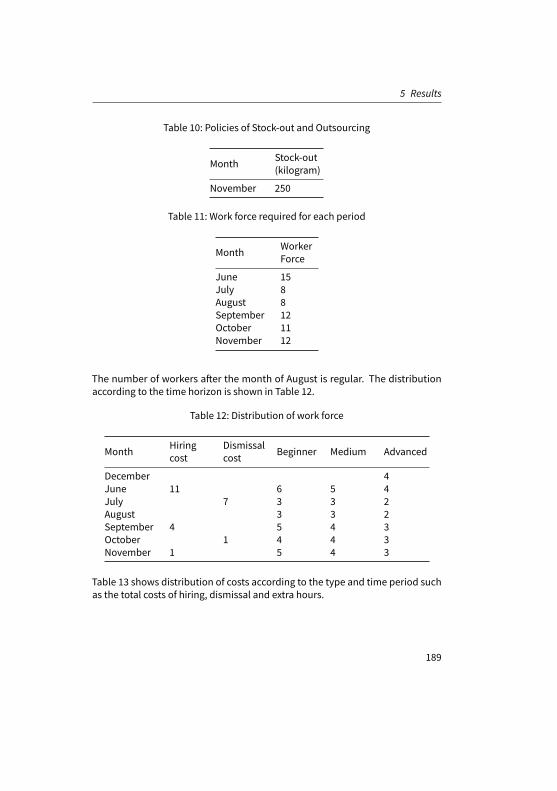
5 Results
Table 10: Policies of Stock-out and Outsourcing
Month Stock-out(kilogram)
November 250
Table 11: Work force required for each period
Month WorkerForce
June 15July 8August 8September 12October 11November 12
The number of workers after the month of August is regular. The distributionaccording to the time horizon is shown in Table 12.
Table 12: Distribution of work force
Month Hiringcost
Dismissalcost Beginner Medium Advanced
December 4June 11 6 5 4July 7 3 3 2August 3 3 2September 4 5 4 3October 1 4 4 3November 1 5 4 3
Table 13 shows distribution of costs according to the type and time period suchas the total costs of hiring, dismissal and extra hours.
189
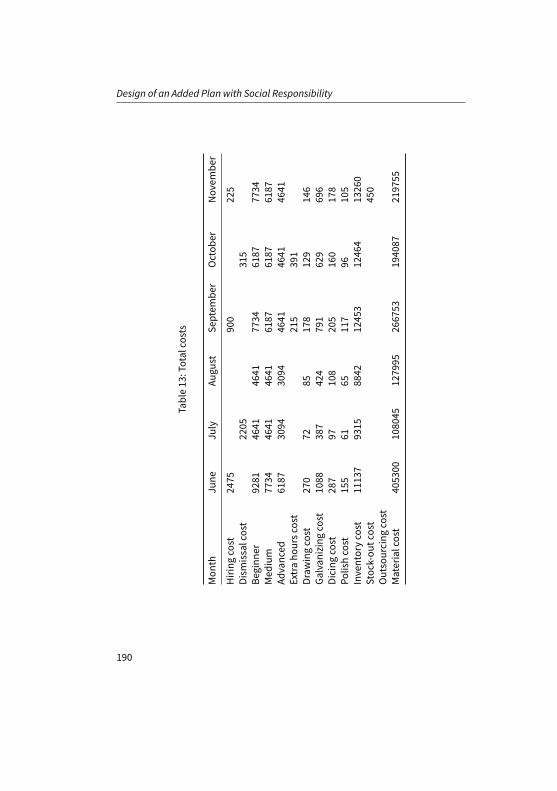
Design of an Added Plan with Social Responsibility
Table13
:Totalcosts
Mon
thJu
neJu
lyAu
gust
Septem
ber
Octob
erNov
embe
r
Hiring
cost
2475
900
225
Dism
issalcost
2205
315
Beginn
er92
8146
4146
4177
3461
8777
34Med
ium
7734
4641
4641
6187
6187
6187
Advanced
6187
3094
3094
4641
4641
4641
Extraho
ursc
ost
215
391
Draw
ingcost
270
7285
178
129
146
Galvan
izingcost
1088
387
424
791
629
696
Dicing
cost
287
9710
820
516
017
8Po
lishcost
155
6165
117
9610
5Inventorycost
1113
793
1588
4212
453
1246
413
260
Stoc
k-ou
tcost
450
Outsourcing
cost
Materialcost
4053
0010
8045
1279
9526
6753
1940
8721
9755
190
6 Improvements
The kilograms of the final product that the organization should produce to satisfythe demand are 110183 kilograms with the rawmaterial unit cost estimated as11 €, which gives a total cost of 1.2 M€ and a total cost of planning of 1.5 M€. Thecost of buying rawmaterial represents 77 % of this cost. This shows a shortage inthe supply chain of this sector.
6 Improvements
Aggregateplanningplays a fundamental role in the supply chain, because it allowsany organization to determine the quantity of production, inventory, outsourcedunits, minimum of inventory shortage and capacity that it must have in a givenperiod, to satisfy the demand. In turn, it will guarantee the reduction of costs andimprove the level of service.
On the other hand, performing an aggregate planning model, considering thelevel of learning of workers, i.e., if the worker is beginner, medium or advanced,allows the organization to classify workers according to their efficiency in eachperiod. In this way, a fair wage could be guaranteed for them.
Whit the proposedmodel, the organization may:
— Determine the optimal level of inventory that this should have, to ensurea good level of service and incur a low cost to maintain inventory.
— Identify the cost in which the organization incurs to keep the three kindsof workers. (beginners, medium and advanced)
— Verify if it complies whit the established inventory policies of the organi-zation.
— Include social responsibility issues to ensure a fair wage for their employ-ees which will depends on their efficiency.
— Reduce the inventory shortage and their associated costs.
— Minimize the operations personnel turnover.
191
Design of an Added Plan with Social Responsibility
— Manage the variability of delivery time and demand.
7 Relevance in the Sector
The combination of aggregate planning with social responsibility is essential iforganizations seek to increase their productivity and consequently their competi-tiveness. Each one fulfills a fundamental role, in the first case it seeks tomake thebest decisions at the aggregate level, and in the second case, to ensure a focus onthe organization’s human capital, so that a fair payment is made.
One of the decisions that any organization should takewhen planning is to decidehowmany workers to hire and howmany to dismiss, if the organization considersthe efficiency of its workers and plans based on this, it will be able to reduce therotation of the Operations personnel, because their workforce will be enough tosupply all the demand. Consequently, their workforce would bemotivated, andthe organization would not have to incur costs for fired.
On the other hand, being steel is one of the scarcest rawmaterials at the nationallevel andwith greater use, its cost of acquisition is high compared to internationalprices, for this reason the organizations immersed in the sector must contend atprice level.
8 Conclusions
The aggregate planning being more than amathematical model, is a tactic toolthat enables the determination of the inventory, production, stock-out levelsas well as the workers that the organization needs to satisfy the demand in thecorresponding period of time. In addition, it guarantees the optimization of cost,time and resources.
The planning guarantees an organization a high level of service, reduced costsand controls the variability of demand. However, the planning should considerthe social responsibility in order to ensure fair wages and level of workforce in allworking periods.
Finally, the organization should considers its operations within the whole supplychain. This includes the added value from the side of raw material to the final
192
REFERENCES
product in order to decrease the lead time to market along with the associatedcosts and waste caused by shortages and inventory.
References
Alacero (2017a). Latin America in figures 2017.Alacero (2017b). Steel subsidized from China puts at risk the employment of thousands of Latin
Americans. We call on our governments to act urgently and ensure fair competition.Alacero (2017c). Uses of Steel.Andi (2018). Colombian Committee of steel producers.Berto, R. and M. Ayatollai (2017). “Mechanical behavior of hot-dip galvanized welded steel under”.Bohorquez Quiroga C., S. L. A. J̃. S. (2013).Mathematical model.Boiteux, O. D. (n.d.). “State of the art on aggregate production planning”. PhD thesis.Bravo, J. (1996). Purchases and inventories.Camacero (2014). “The guild of steel is born, Camacero”. In:Camacero (2017). “Economic information”. In:Cañas Catañeda, J. S. (2013). “Planning of the production applying linear programmingmodels
and theory of restrictions for an industry in the metalworking sector”.Chase, R., R. Jacobs, and N. Aquilano (2009). Production operationsmanagement and supply chain.Chopra, S. (2008).Management of the supply chain Strategy, Planning and Operation.Clifford, F. A. and H. Reinoso (2014). “Formulation of a programming problem for the aggregate
planning of steel company Huachipato”.Dinero (2017a). Despite dumping and low demand, the steel industry does not stop investing.Dinero (2017b). Improve prospects for the steel industry How is it and where is it going?Donald J. Bowersox, David J. Closs, and M. Bixby Cooper (2007). Administracion y logistica en la
cadena de suministros, p. 426.El español (2016).Why China is a growing threat to European steel.El Espectador (2017). An industry that stomps.El Nuevo Siglo (2016). China threatens steel sector in Colombia.F, A. (2018). China will continue to cut capacity for steel and coal production in 2018.Gerencie (2017). It is not legal to work more than 10 hours a day.Gestión (2017). China, the world leader in steel and aluminum accused of ”dumping” by its partners.Herrera, M. (2018). Another year of high prices.Infoacero (2017a). How is the panorama of the steel industry going?Infoacero (2017b). The Academy and its Importance to Promote the Use of Steel.Mahdavi-Amiri, N. G. I. M. R., M. Tavakkoli, and M.-A. Nezam (n.d.). “A Comprehensive fuzzy multi-
objective multi-product multi-site aggregate production planning decisions in a supply chainunder uncertainty”.
Munar, X. V. (2008). Strategic direction for the steel industry in Colombia for the year 2020.pais, E. (2016). China, the great steel super producer.Portafolio (2008).Why does China sell so cheap?Portafolio (2014). In Colombia, production is much lower than demand.Portafolio (2017). Colombian steel, between China and local demand.
193

Design of an Added Plan with Social Responsibility
Quality, A. S. for (2002). “How To Compare Six Sigma, Lean and the Theory of Constraints”. In:American Society for Quality.
República, L. (2017). Contraband and low prices in China, the main problems of the steel industry.Sas-Boca, I. M., M. Tintelecan, M. Pop, D.-A. Iluţiu-Varvara, and A. M. Mihu (2017). “The wire draw-
ing process simulation and the optimization of geometry dies”. In: Procedia Engineering 181,pp. 187–192.
Vargas, L. D. (2016). Steel andmetalworking: a sector of importance for the Colombian industry.Zurito Olea, C. A. (n.d.). “Production planning at the Gerdau Aza steel company. S.A”.
194
Part III
Supply Chain Analytics

Multi-Method Decision SupportFramework for Supply Network Design
Giuseppe Timperio1, Robert de Souza1, Boy Panjaitan Bernado2, Sumit Sakhuja1,Yoseph Sunardhi 2
1 – National University of Singapore
2 – PT Pos Indonesia
In a business context characterized by increased competition due to digital trans-formation and technological breakthroughs, massive penetration of online pur-chasing, greater customers’ expectationsandswitchofmanufacturingparadigms,the role of logistics has become today more critical to firms than ever before. Onecritical initiative that logistics providers can undertake in order to gain a truly com-petitive edge is to optimally seize and utilize key resources such as storage andtransportation assets. This paper is an effort in that direction and proposes a deci-sion support framework to design a cost effective supply network in the last leg ofdeliveries. A case study based approach about a postal service provider in South-east Asia is presented to showcase the applicability of the proposed framework.By leveraging on the integration of data analytics, network optimization and sim-ulation, this work highlights the advantages of adopting a holistic approach todecision making for the used case. Results show that number of storage facilities,and their locations, affect speed and cost-effectiveness of last mile distribution.For the case at hand, 18% of savings in transportation and warehousing cost withno impact on service level can be achieved by reducing the number of facilitiesin the network from 9 to 4. By reading the present paper, decision makers willgain insights on how to address challenges related with supply network design,transportation costs reduction and optimization of overstretched transportationroutes.
Keywords: Network Design; Network Optimization; Last Mile Logistics; Trans-portation Optimization
First recieved: 28.May.2018 Revised: 01.Jun.2018 Accepted: 22.Jun.2018
197
Multi-Method Decision Support Framework for Supply Network Design
1 Introduction
Over the past few years, the attention given by academics and practitioners tosupply chain management and logistics issues is increased tremendously (Yaz-dani et al., 2017). Logistics encompasses several business activities, whichmostlyrelate with planning, organization, and control of the material flow (direct andreverse) from rawmaterial at manufacturers to final points of consumption (Jons-son & Mattsson, 2005). With the surge in online purchasing, the role of logisticshas become today more critical than ever before, with the sector registering aspike in the level of competition accompanied by a severe increase in usage ofThird Party Logistics Service Providers (LSP). Between 2010 and 2016, the LSPindustry has registered a steady yearly growth in revenue, reaching the globalamount of 802.2 billion U.S. dollars in 2016 (+64% compared to 2010) (Statista,2018 a). Worldwide, the market size for LSP in Asia Pacific is the largest. In 2016,the regional market was seized at approximately 305 billion U.S. dollars 2016(38% of total), followed by North America (25% of total), and Europe (21% oftotal) (Statista, 2018 b). Constant regional economic growth and rapid surge ofmiddle-class, demographic profile of consumers and businesses, advantageoustrading conditions, and recent crystallization of the ASEAN Economic Commu-nity (AEC) make in fact Asia Pacific region particularly appealing to global freightforwarders and related firms (Spire Research and Consulting, 2016). Moreover,elements such as low cost for outsourcing, supply chain inefficiencies, and in-creased demand for LSPs, creates evenmore favorable conditions for the furtherincrease in the presence of logistics players in near future (Spire Research andConsulting, 2016 ). Additionally, the gradual liberalization of regional logisticsservices is slowly increasing competitiveness and foreign participation, therebyintroducing more logistics players into the market (Logistics, Insights Asia, 2016).With competition shifting from firm-to-firm to supply chain against supply chain(Christopher & Towil, 2001) there is clear need for LSP to rethink about supplychain and logistics management strategies so as to reduce operational costs andincrease competitiveness (Tartavulea & Radu, 2013).
Thus, for a local LSP thatwants to operate profitably in such a competitive context,there is a burning need of more streamlined logistical processes so as to gainconcurrent cost effectiveness and superior service level. One such importantinitiative that LSP can undertake in order to gain competitiveness is to optimallyallocate andutilize their logistics assets such as storage and transportation. Partic-ularly, practical experience andacademic research suggest that number of storagefacilities, and their locations, greatly affect both speed and cost-effectiveness
198
1 Introduction
of logistics operations (Zhang & Xu, 2014). Therefore, a seamless and effectivenavigation of storage assets through an optimum design of supply network (SN)would be highly beneficial for an LSP that aims at gaining a truly competitive edgein both offline and online marketplaces, particularly in the final leg of deliveries.Last mile logistics is considered in fact the least efficient, costly, and most pol-luting sections of the entire logistics chain [(Gevaers, et al., 2014), (Wang, et al.,2016)]. Therefore, by taking these “last mile problems” into consideration, thepresent work is motivated by the real need to develop location decision modelsfor interested LSPs that aim to streamline their logistics processes through anoptimum design of their last mile distribution network and by the potential gainthat suchmodels can bring into practice. By focusing on the last mile distributionnetwork of the National postal service provider (PSP), one of the major LSP inIndonesia, we will demonstrate how the proposedmodels can lead to significantgains in terms of costs, with no impact on service levels, using a real-life case inthe Asia-Pacific region. The scope of work is on the PSP’ supply network structurewhich, in the context of one of the most populated urban areas in Indonesia, com-prises of 1 large Distribution Centre (DC), 9 intermediate DCs, and several demandpoints. This paper will assist researchers and practitioners in understanding howthe following research questions are to be addressed
RQ1: How to determine the suitable number of intermediate DCs (nodes) toserve a highly populated urban area in one of the fastest developing econ-omy of the Pacific region (Indonesia), and what is the suitable number ofDCs for the particular case at hand?
RQ2: How to decide on the locations for the intermediate DCs of an optimizedsupply network, and what is the optimum network configuration for theparticular case at hand?
The remainder of the paper is structured in the following sections. Section 2presents a review of relevant literature. Section 3 describes the real world ap-plication by presenting the logistics landscape of Indonesia, and by setting thebackground of the case study. Section 4 describes the methodological approach.Section 5 discusses the model implementation for the selected case and resultsto date. Finally, section 6, highlights managerial implications, limitations, andnext steps to reinforce findings to date.
199
Multi-Method Decision Support Framework for Supply Network Design
2 Literature Review
Decisions on logistics system design are typically about number of storage facil-ities, their locations, allocation of products to facilities and tomarket (Korpela& Tuominen, 1996). Logistics system design studies have been largely appliedto commercial sector, and a fair number of research papers are available in thedomain of network design. Some research groups looked at strategic and tacti-cal decisions such as flows of commodities across supply networks [ (Keskin &Uster, 2007), (Qin & Ji, 2010)], or transportation policies (Tancrez, et al., 2012).Some others focused upon operational issues (Chow, et al., 2012) such as servicelevel improvement (Rodziah, 2017). Substantial contributions have beenmade inaddressing cross-level decisions such as inventory control (Ho & Emrouznejad,2009), transportation flows (Lee, et al., 2008), location decisions [ (Sun, 2002),(Balcik & Beamon, 2008)] or warehouse capacity planning (Francas & Minner,2009). In literature, network design problems are typically tackled using eithermathematical modeling/optimization, Multi-Criteria Decision Making (MCDM),and simulation models. Seldom, twomethods of the above are integrated.
2.1 Supply network optimization
Network optimization refers to a series of methods which, by defining objectivefunctions and constraints, are capable of determining the optimal supply chainnetwork design with the lowest total cost structure [ (Beamon, 1998), (SupplyChain Acuity, Management Consulting, 2013)]. A recent work by Kovács, G. et al.(2017) highlighted the need of establishing efficient supply chain operations towithstand the increasing global competition, and suggested to focus onminimumtotal cost and lead time, and improved customer service level, as objectives of thesupply chain optimization. Benyoucef, Xie and Tanonkou (2013) considered a twoperiod SC design model addressing facility location/supplier selection problem.The authors used a Monte Carlo approach in combination with Lagrangian relax-ation, so as to minimize fixed DCs location costs, inventory and safety stock costsat the DCs as well as ordering costs and transportation costs across the network.Zokaee, S. et al. (2017) proposed the use of robust optimization to determine thestrategic locations and tactical allocation for a four-tier supply chain. Their modelwas then extended to incorporate uncertainty in key input parameters such asdemand, supply capacity andmajor cost data including transportation and short-age cost parameters. Ghaffari-Nasab, N. et al. (2015) proposed the use of mixed
200

2 Literature Review
integer nonlinear programmingmodel and linearization using a step-by-step ap-proach to decide on the number, location and operation of hub facilities so as tominimize the total logistics costs for the network for a LSP. Authors compared theperformances of two alternative distribution strategies namely hub-and-spokeand direct shipment, with the first showing significant advantages in terms ofcost.
2.2 Multi-Criteria Decision Making (MCDM)
MCDM is concerned with structuring and solving decision problems on the basisof multiple decision criteria. A common application of MCDM is to tackle thosedecision problems for which a unique optimal solution does not exist and it isnecessary to use decision maker’s qualitative inputs to differentiate betweensolutions [ (Majumder, 2015), (Roh, et al., 2015)] such as facility location problemas per Timperio, et al. (2017). Ho & Emrouznejad (2009), explored the use of acombined approach analytic hierarchy process (AHP) and goal programming (GP)to design a logistics distribution network in consideration of qualitative inputsfrom domain experts (e.g. on delivery and service level elements), with limitedresource availability. Galvez, D. et al. (2015) integrated Mixed Integer LinearProgramming (MILP) optimization and Analytical Hierarchical Process (AHP) forthe implementation of a logistics network in the domain of sustainable energyproduction processes.
2.3 Supply chain simulation
Is used for supply network design decisions or design of supply chain policies.Themain advantage of simulation is that it allows to assess supply chain behaviorin a virtual environment, hence reducing the risk of making costly mistake inimplementation (Thierry, et al., 2008). Munasinghe, I. U. et al. (2017) proposeda simulation-based approach to assess the impact of the facility location andproduct differentiation on supply chain network design. Six different scenarioswere tested, with the goal of minimizing total distribution network cost. SalemR. W. & Haouari M. (2017) proposed the use of a simulation-optimization basedapproach to address a three-echelon stochastic supply chain network designproblem. Outcomes of their work included selection of suppliers, determination
201
Multi-Method Decision Support Framework for Supply Network Design
ofwarehouses locations and sizing, aswell as thematerial flow, with the objectiveof minimizing total expected cost.
2.4 Research Gaps and Contribution of the Current Research
Despite the comprehensive literature available in the domain of network de-sign, to our knowledge, most research groups have handled the facility locationproblem by selecting a single method, and only in few cases twomethods wereintegrated (mostly optimization and simulation). Although previous works pro-vide fair solutions to this category of problems, it is also evident the lack of anadequate holistic support (strategic, tactical, and operational) to decisionmaking.Thus, it appears that none of the research groups have considered an integrationof methodologies, and this paper fills this gap. By reading the present paper,decision makers will be able to gain comprehensive answers to the followingquestions:
How to determine the suitable number of DCs for a cost-effective and time re-sponsive last mile urban delivery?
How to decide on the locations of DCs for a cost-effective and time responsivelast mile urban delivery?
As such, the work presented in this manuscript will apply data analytics, networkoptimization, and dynamic simulation to demonstrate the theoretical and practi-cal relevance of the proposed solution approach. In particular, the study seeks tobring the following contributions:
— Generate deeper insights (static and dynamic) in the domain of networkdesign by uncovering strategic, tactical and operational elements;
— Determine the optimal network configuration for the case study at hand;
— Bridge theoretical knowledge with practice in the nice of network design;
202
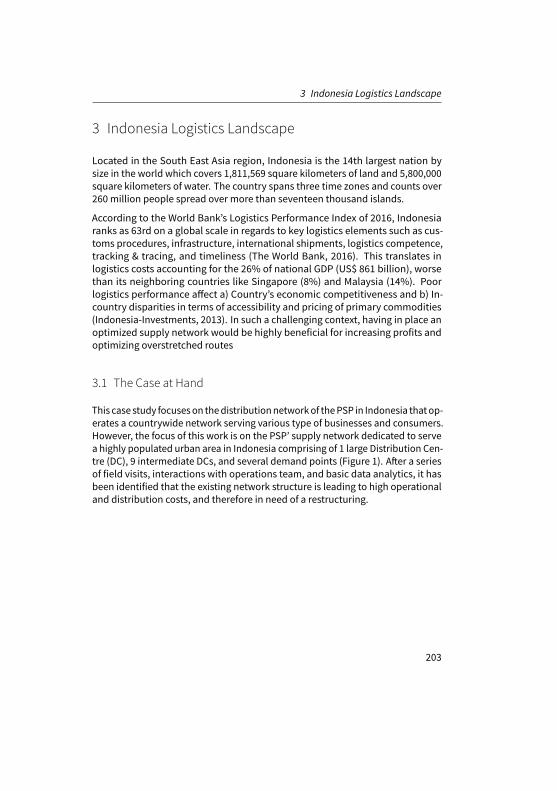
3 Indonesia Logistics Landscape
3 Indonesia Logistics Landscape
Located in the South East Asia region, Indonesia is the 14th largest nation bysize in the world which covers 1,811,569 square kilometers of land and 5,800,000square kilometers of water. The country spans three time zones and counts over260 million people spread over more than seventeen thousand islands.
According to the World Bank’s Logistics Performance Index of 2016, Indonesiaranks as 63rd on a global scale in regards to key logistics elements such as cus-toms procedures, infrastructure, international shipments, logistics competence,tracking & tracing, and timeliness (The World Bank, 2016). This translates inlogistics costs accounting for the 26% of national GDP (US$ 861 billion), worsethan its neighboring countries like Singapore (8%) and Malaysia (14%). Poorlogistics performance affect a) Country’s economic competitiveness and b) In-country disparities in terms of accessibility and pricing of primary commodities(Indonesia-Investments, 2013). In such a challenging context, having in place anoptimized supply network would be highly beneficial for increasing profits andoptimizing overstretched routes
3.1 The Case at Hand
This case study focuseson thedistributionnetworkof thePSP in Indonesia that op-erates a countrywide network serving various type of businesses and consumers.However, the focus of this work is on the PSP’ supply network dedicated to servea highly populated urban area in Indonesia comprising of 1 large Distribution Cen-tre (DC), 9 intermediate DCs, and several demand points (Figure 1). After a seriesof field visits, interactions with operations team, and basic data analytics, it hasbeen identified that the existing network structure is leading to high operationaland distribution costs, and therefore in need of a restructuring.
203
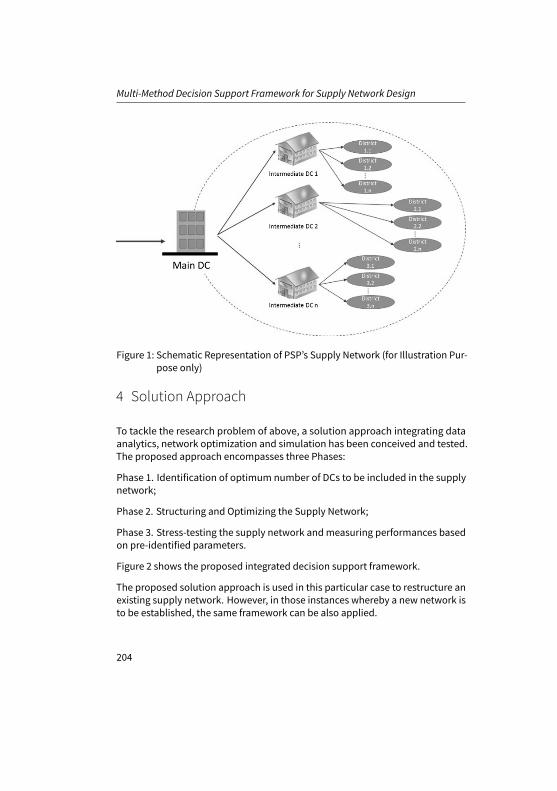
Multi-Method Decision Support Framework for Supply Network Design
Figure 1: Schematic Representation of PSP’s Supply Network (for Illustration Pur-pose only)
4 Solution Approach
To tackle the research problem of above, a solution approach integrating dataanalytics, network optimization and simulation has been conceived and tested.The proposed approach encompasses three Phases:
Phase 1. Identification of optimum number of DCs to be included in the supplynetwork;
Phase 2. Structuring and Optimizing the Supply Network;
Phase 3. Stress-testing the supply network andmeasuring performances basedon pre-identified parameters.
Figure 2 shows the proposed integrated decision support framework.
The proposed solution approach is used in this particular case to restructure anexisting supply network. However, in those instances whereby a new network isto be established, the same framework can be also applied.
204
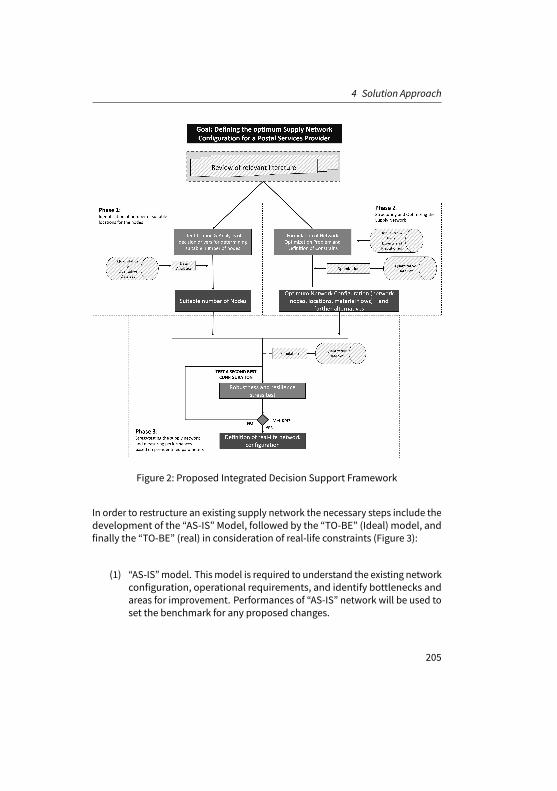
4 Solution Approach
Figure 2: Proposed Integrated Decision Support Framework
In order to restructure an existing supply network the necessary steps include thedevelopment of the “AS-IS” Model, followed by the “TO-BE” (Ideal) model, andfinally the “TO-BE” (real) in consideration of real-life constraints (Figure 3):
(1) “AS-IS”model. Thismodel is required to understand the existing networkconfiguration, operational requirements, and identify bottlenecks andareas for improvement. Performances of “AS-IS” network will be used toset the benchmark for any proposed changes.
205

Multi-Method Decision Support Framework for Supply Network Design
Figure 3: Stages to Supply Network Restructuring
(2) Ideal “TO-BE” model. This intermediate model is needed to identify the“unconstrained solution” (ideal) in terms of number of DCs and theirlocations;
(3) Real “TO-BE” model. This final model will lead to the identification ofreal-life solution, that is an adjustment of “TO-BE” ideal based on real-lifeconstraints set by the PSP;
4.1 Phase 1: Identification of number of suitable locations for thenodes
Network design begins with the identification of number of suitable locations forthe nodes. These decisions are traditionally based on total cost (warehousing,transportation, lost sales). Two different strategies, centralized and decentralizedsupply networks, can be adopted based on logistics requirements. Centralizedwarehousing is a systemwhere a single (or few) DC is used to serve a particulararea whereas a decentralized approach encompasses the use of several facilities
206
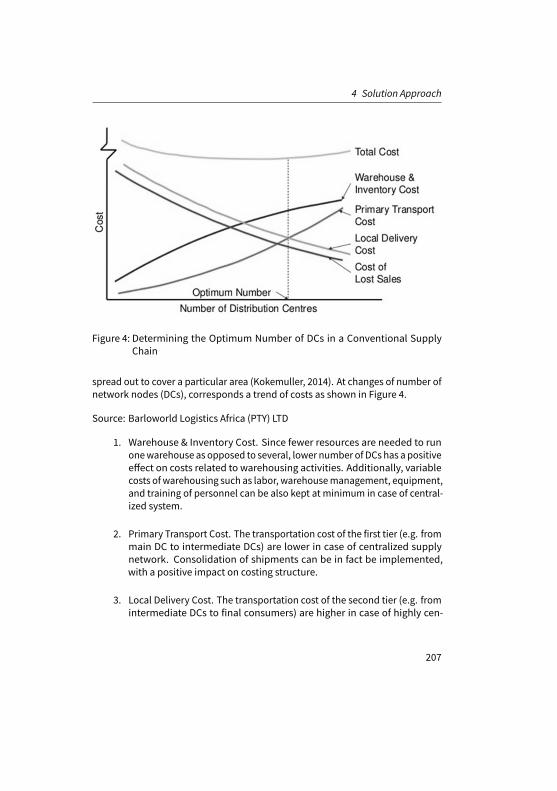
4 Solution Approach
Figure 4: Determining the Optimum Number of DCs in a Conventional SupplyChain
spread out to cover a particular area (Kokemuller, 2014). At changes of number ofnetwork nodes (DCs), corresponds a trend of costs as shown in Figure 4.
Source: Barloworld Logistics Africa (PTY) LTD
1. Warehouse & Inventory Cost. Since fewer resources are needed to runonewarehouse as opposed to several, lower number of DCs has a positiveeffect on costs related to warehousing activities. Additionally, variablecosts of warehousing such as labor, warehousemanagement, equipment,and training of personnel can be also kept at minimum in case of central-ized system.
2. Primary Transport Cost. The transportation cost of the first tier (e.g. frommain DC to intermediate DCs) are lower in case of centralized supplynetwork. Consolidation of shipments can be in fact be implemented,with a positive impact on costing structure.
3. Local Delivery Cost. The transportation cost of the second tier (e.g. fromintermediate DCs to final consumers) are higher in case of highly cen-
207
Multi-Method Decision Support Framework for Supply Network Design
tralized system. In case of decentralized network in fact, the distance inbetween intermediate DCs and customers is lower.
4. Cost of Lost Sales. A decentralized system helps in achieving shorterlead times and higher percentages of on-time delivery, resulting in higherservice level, and thus lower cost of lost sales.
In the case study undertaken in this research, data analytics and green field anal-ysis were used to determine the cost items. Green field analysis is a GIS/centerof gravity based approach (Russel and Taylor, 2010), which seeks to determinethe geographic coordinates for a potential new facility. Computations are basedonminimum transportation cost (calculated as “distance” * “Product Amount”)(AnyLogistix, 2018) in consideration of aggregated demand for each customer andproduct, customer locations (direct distance between customers and DCs/Ware-houses), and service distance (or number of facilities to locate) (AnyLogistix, 2018).To perform green field analysis, 2 years of operational information on historicaldemand (by location, amount, and time distribution), product flows, and costswere required. A template in MS Excel was shared with the company to facili-tate data provision. The company provided the historical data referring to thebiennium 2016 and 2017.
4.2 Phase 2: Structuring and Optimizing the Supply Network
Once Phase 1 is completed and the number of suitable locations for the networknodes is determined, Phase 2will be used to identify the optimumnetwork config-uration in terms of both nodes (location of DCs) and arcs (connections in betweenDCs) using Network Optimization (NO). NO is an optimization technique whichseeks to find the best configuration of a supply chain network structure as wellas the flows based upon an objective function, which typically maximizes profits(Sample in Table 1),
208
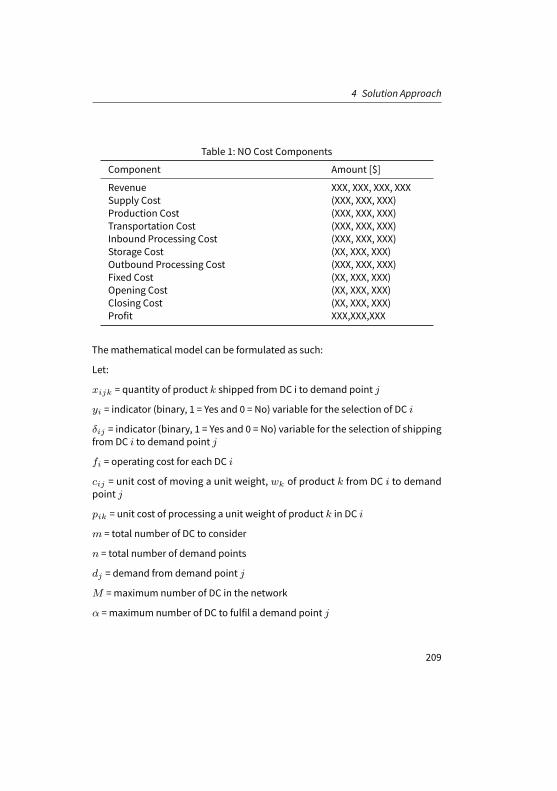
4 Solution Approach
Table 1: NO Cost Components
Component Amount [$]
Revenue XXX, XXX, XXX, XXXSupply Cost (XXX, XXX, XXX)Production Cost (XXX, XXX, XXX)Transportation Cost (XXX, XXX, XXX)Inbound Processing Cost (XXX, XXX, XXX)Storage Cost (XX, XXX, XXX)Outbound Processing Cost (XXX, XXX, XXX)Fixed Cost (XX, XXX, XXX)Opening Cost (XX, XXX, XXX)Closing Cost (XX, XXX, XXX)Profit XXX,XXX,XXX
Themathematical model can be formulated as such:
Let:
xijk = quantity of product k shipped from DC i to demand point j
yi = indicator (binary, 1 = Yes and 0 = No) variable for the selection of DC i
δij = indicator (binary, 1 = Yes and 0 = No) variable for the selection of shippingfrom DC i to demand point j
fi = operating cost for each DC i
cij = unit cost of moving a unit weight, wk of product k from DC i to demandpoint j
pik = unit cost of processing a unit weight of product k in DC i
m = total number of DC to consider
n = total number of demand points
dj = demand from demand point j
M = maximum number of DC in the network
α = maximum number of DC to fulfil a demand point j
209
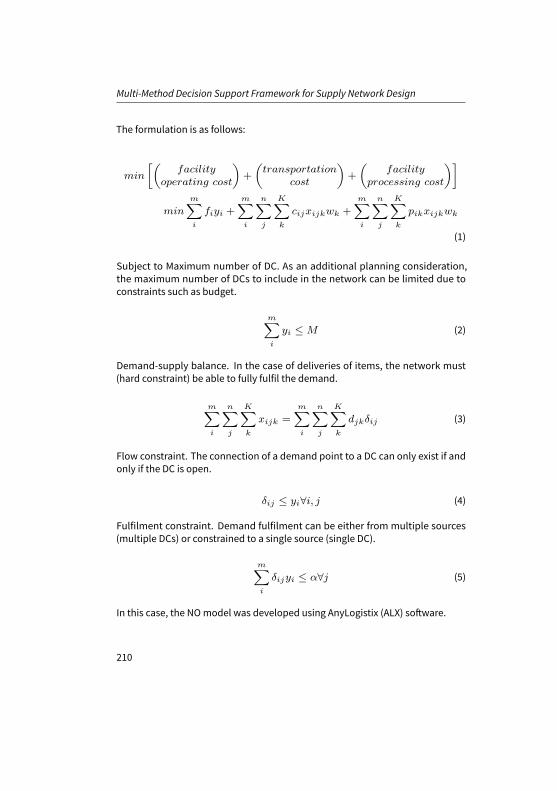
Multi-Method Decision Support Framework for Supply Network Design
The formulation is as follows:
min
[(facility
operating cost
)+
(transportation
cost
)+
(facility
processing cost
)]
minm∑i
fiyi +m∑i
n∑j
K∑k
cijxijkwk +m∑i
n∑j
K∑k
pikxijkwk
(1)
Subject to Maximum number of DC. As an additional planning consideration,the maximum number of DCs to include in the network can be limited due toconstraints such as budget.
m∑i
yi ≤ M (2)
Demand-supply balance. In the case of deliveries of items, the network must(hard constraint) be able to fully fulfil the demand.
m∑i
n∑j
K∑k
xijk =
m∑i
n∑j
K∑k
djkδij (3)
Flow constraint. The connection of a demand point to a DC can only exist if andonly if the DC is open.
δij ≤ yi∀i, j (4)
Fulfilment constraint. Demand fulfilment can be either from multiple sources(multiple DCs) or constrained to a single source (single DC).
m∑i
δijyi ≤ α∀j (5)
In this case, the NOmodel was developed using AnyLogistix (ALX) software.
210
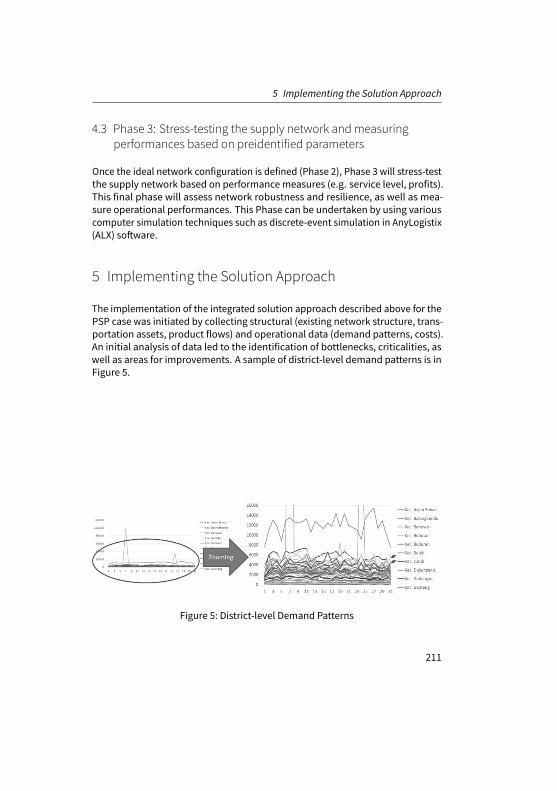
5 Implementing the Solution Approach
4.3 Phase 3: Stress-testing the supply network andmeasuringperformances based on preidentified parameters
Once the ideal network configuration is defined (Phase 2), Phase 3 will stress-testthe supply network based on performancemeasures (e.g. service level, profits).This final phase will assess network robustness and resilience, as well as mea-sure operational performances. This Phase can be undertaken by using variouscomputer simulation techniques such as discrete-event simulation in AnyLogistix(ALX) software.
5 Implementing the Solution Approach
The implementation of the integrated solution approach described above for thePSP case was initiated by collecting structural (existing network structure, trans-portation assets, product flows) and operational data (demand patterns, costs).An initial analysis of data led to the identification of bottlenecks, criticalities, aswell as areas for improvements. A sample of district-level demand patterns is inFigure 5.
Figure 5: District-level Demand Patterns
211
Multi-Method Decision Support Framework for Supply Network Design
5.1 Phase 1: Identification of number of suitable locations for thenodes
Given the unique nature of the business whereby the PSP in consideration oper-ates in, the only cost itemdriving the decision about optimumnumber of facilitiesare transportation cost. In fact:
Warehouse and inventory cost are not relevant due to 1) PSP does not carry anyinventory, and 2) Manpower is fixed, regardless the number of DCs; Cost of lostsales does not apply since there is no other competitor offering the same service;Transportation cost, which includes primary transport cost and local delivery cost,have been calculated using green field analysis in AnyLogistix (ALX) (sample inFigure 6). Transportation cost and marginal cost reduction with changed numberof DCs is in Figure 7.
Results show that by increasing the number of intermediate DCs, the overalltransportation costs to serve final customers would reduce.
5.2 Phase 2: Structuring and Optimizing the Supply Network
Once Phase 1 is completed, next step consists of optimizing the baseline networkconfiguration. This phase will select the optimal network nodes out of the subsetof suitable candidates from Phase 1, based on costs. The optimization problemof calibrating the baseline network configuration consists of finding the optimumnumber and location of the distribution centers as to effectively distribute goods,while satisfying multiple constraints.
In this work, Transportation Cost, Inbound Processing Cost, Outbound ProcessingCost and Fixed Cost were considered for formulating the NOmodel. Other costitems listed in Table 1 were not considered due to a) Data unavailability (open-ing and closing costs) and b) Limited relevance based on the nature of the PSPbusiness (Supply, production, storage).
Results show that the ideal “TO-BE” (ideal) network configuration should beinclusive of 4 intermediate DCs (Figure 8 and Figure 9), whichwill minimize overallsupply chain cost, with no changes on service level as compared to ”AS-IS”.
In order to define the “TO-BE” (REAL) network configuration, the constraint onmaximum distance travelled per delivery man (100 km) in a day was included.Results highlighted that ”TO-BE” Ideal and ”TO-BE” real overlap.
212

5 Implementing the Solution Approach
A comparative analysis of ”TO-BE” network versus ”AS-IS” network shows thatwhile terms of service level the two network perform similarly, in terms of costeffectiveness the ”TO-BE” network surpasses the ”AS-IS” by nearly the 1% of totalcosts. Although a lower number of DC determines higher transportation cost(+7.74%), the saving coming from a lower fixed costs of facilities (-8.76%) is moresubstantial. On these two cost items in fact, an overall improvement of over 4%in costs can be appreciated. Although not yet assessed, further savings could beachieved via economies of scale e.g. through consolidation of manpower and/ortransportation assets.
213
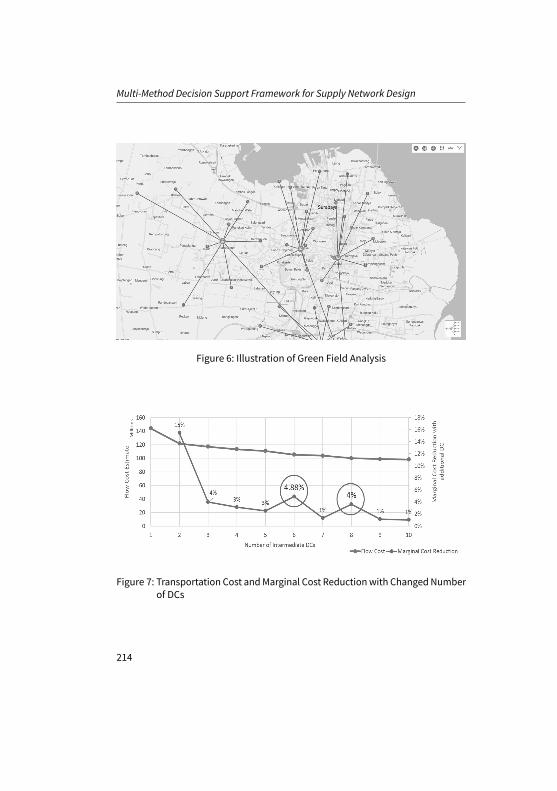
Multi-Method Decision Support Framework for Supply Network Design
Figure 6: Illustration of Green Field Analysis
Figure 7: Transportation Cost andMarginal Cost Reductionwith Changed Numberof DCs
214

5 Implementing the Solution Approach
Figure 8: ”TO-BE” (Ideal) Solution
Figure 9: ”TO-BE” Ideal, Material Flow
215
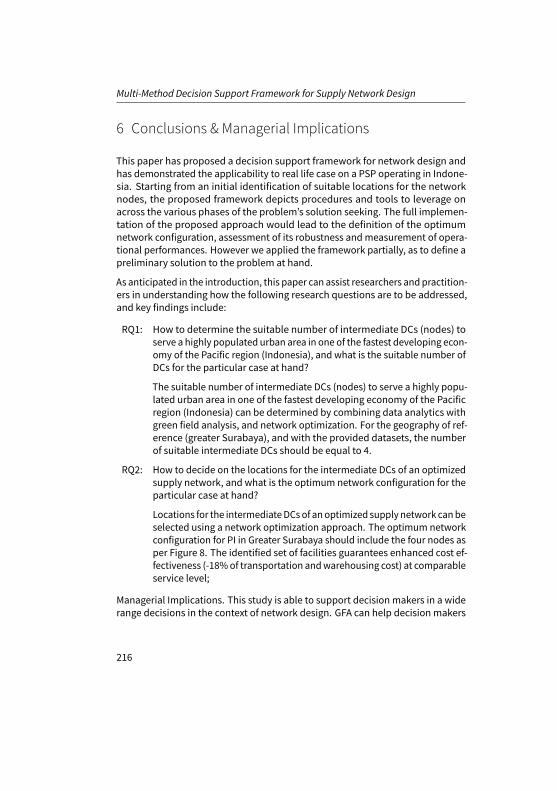
Multi-Method Decision Support Framework for Supply Network Design
6 Conclusions & Managerial Implications
This paper has proposed a decision support framework for network design andhas demonstrated the applicability to real life case on a PSP operating in Indone-sia. Starting from an initial identification of suitable locations for the networknodes, the proposed framework depicts procedures and tools to leverage onacross the various phases of the problem’s solution seeking. The full implemen-tation of the proposed approach would lead to the definition of the optimumnetwork configuration, assessment of its robustness andmeasurement of opera-tional performances. However we applied the framework partially, as to define apreliminary solution to the problem at hand.
As anticipated in the introduction, this paper can assist researchers andpractition-ers in understanding how the following research questions are to be addressed,and key findings include:
RQ1: How to determine the suitable number of intermediate DCs (nodes) toserve a highly populated urban area in one of the fastest developing econ-omy of the Pacific region (Indonesia), and what is the suitable number ofDCs for the particular case at hand?
The suitable number of intermediate DCs (nodes) to serve a highly popu-lated urban area in one of the fastest developing economy of the Pacificregion (Indonesia) can be determined by combining data analytics withgreen field analysis, and network optimization. For the geography of ref-erence (greater Surabaya), and with the provided datasets, the numberof suitable intermediate DCs should be equal to 4.
RQ2: How to decide on the locations for the intermediate DCs of an optimizedsupply network, and what is the optimum network configuration for theparticular case at hand?
Locations for the intermediateDCsof anoptimized supply network canbeselected using a network optimization approach. The optimum networkconfiguration for PI in Greater Surabaya should include the four nodes asper Figure 8. The identified set of facilities guarantees enhanced cost ef-fectiveness (-18%of transportation andwarehousing cost) at comparableservice level;
Managerial Implications. This study is able to support decision makers in a widerange decisions in the context of network design. GFA can help decision makers
216
REFERENCES
with the determination of transportation cost at increased number of DCs, aswell as identification of potentially suitable locations. The NO can help logisticsmanagers to make strategic decisions about DCs’ locations.
Limitations. This work has few limitations. First, the dataset on demand is limitedto the biennium 2016-2017. An extension of the dataset with inclusion of moredata points would provide a more accurate solution to the problem at hand.Secondly, inclusion of cost items such as cost for opening or closing a DC andmanpower allocation would help to fine tune the proposed solution.
Next steps. In order to reinforce the findings to date, a dynamic simulation modelcan be developed (Phase 3). This would allow to:
- Determine transportation (fleet size) and storage requirements;
- Perform what-if analysis with comparison of alternative network configu-rations;
References
Anylogistix (2018). “ALX Documentation, Experiments, GFA”. In:Atan, R. binti (2016). “Enhancing service quality through Service Level Agreement (SLA) full imple-
mentation”. In: Science in Information Technology (ICSITech), 2016 2nd International Conferenceon. IEEE, pp. 1–1.
Balcik, B. and B. M. Beamon (2008). “Facility location in humanitarian relief”. In: 11.2, pp. 101–121.Bank, T. W. (2016). “Global Rankings 2016”. In:Beamon, B. M. (1998). “Supply chain design and analysis:: Models andmethods”. In: 55.3, pp. 281–
294.Benyoucef, L., X. Xie, and G. A. Tanonkou (2013). “Supply chain network design with unreliable
suppliers: a Lagrangian relaxation-based approach”. In: 51.21, pp. 6435–6454.Chow, P.-S., T.-M. Choi, and T. Cheng (2012). “Impacts of minimum order quantity on a quick
response supply chain”. In: 42.4, pp. 868–879.Francas, D. and S. Minner (2009). “Manufacturing network configuration in supply chains with
product recovery”. In: 37.4, pp. 757–769.Galvez, D., A. Rakotondranaivo, L.Morel,M. Camargo, andM. Fick (2015). “Reverse logistics network
design for a biogas plant: An approach based on MILP optimization and Analytical HierarchicalProcess (AHP)”. In: 37, pp. 616–623.
Gattorna, J., W. Selen, and R. Ogulin (2004). “Characteristics, strategies and trends for 3PL/4PL inAustralia”. In: pp. 11–16.
Gevaers, R., E. Van de Voorde, and T. Vanelslander (2014). “Cost modelling and simulation oflast-mile characteristics in an innovative B2C supply chain environment with implications onurban areas and cities”. In: 125, pp. 398–411.
217
Multi-Method Decision Support Framework for Supply Network Design
Ghaffari-Nasab, N., M. Ghazanfari, and E. Teimoury (2016). “Hub-and-spoke logistics networkdesign for third party logistics service providers”. In: 11.1, pp. 49–61.
Ho, W. and A. Emrouznejad (2009). “Multi-criteria logistics distribution network design usingSAS/OR”. In: 36.3, pp. 7288–7298.
“Indonesia-Investments” (2013). In:Jonsson, P. and S.-A. Mattsson (2016). Logistik: Läran omeffektivamaterialflöden. Studentlitteratur.Keskin, B. B. and H. Üster (2007). “Meta-heuristic approaches with memory and evolution for a
multi-product production/distribution system design problem”. In: 182.2, pp. 663–682.Korpela, J. andM. Tuominen (1996). “Adecision aid inwarehouse site selection”. In: 45.1-3, pp. 169–
180.Kovács, G., Z. Varga, and M. Mihalik (2017). “Optimal formation of logistics networks”. In: Vehicle
and Automotive Engineering. Springer, pp. 391–403.Lee, B. K., K. H. Kang, and Y. H. Lee (2008). “Decomposition heuristic to minimize total cost in a
multi-level supply chain network”. In: 54.4, pp. 945–959.Majumder, M. (2015). “Multi criteria decisionmaking”. In: Impact of urbanization onwater shortage
in face of climatic aberrations. Springer, pp. 35–47.Munasinghe, I., T. Rupasinghe, and R. Wickramarachchi (2017). “A simulation-based modeling
approach to assess the multi-echelon supply chain network design”. In: Industrial Engineeringand Engineering Management (IEEM), 2017 IEEE International Conference on. IEEE, pp. 1372–1376.
Nagurney, A. and L. S. Nagurney (2010). “Sustainable supply chain network design: A multicriteriaperspective”. In: 3.3, pp. 189–197.
Qin, Z. and X. Ji (2010). “Logistics network design for product recovery in fuzzy environment”. In:202.2, pp. 479–490.
Roh, S., S. Pettit, I. Harris, and A. Beresford (2015). “The pre-positioning of warehouses at regionaland local levels for a humanitarian relief organisation”. In: 170, pp. 616–628.
Russell, R. S. and B. W. Taylor-Iii (2008). Operations management along the supply chain. JohnWiley & Sons.
Salem, R.W. andM. Haouari (2017). “A simulation-optimisation approach for supply chain networkdesign under supply and demand uncertainties”. In: 55.7, pp. 1845–1861.
Sun, M. (2002). “The transportation problemwith exclusionary side constraints and two branch-and-bound algorithms”. In: 140.3, pp. 629–647.
Tancrez, J.-S., J.-C. Lange, and P. Semal (2012). “A location-inventory model for large three-levelsupply chains”. In: 48.2, pp. 485–502.
Tartavulea, R. I. and R. I. Petrariu (2013). “LogisticsMarket Statistics andOpinions about the SupplyChain Management in Romania”. In: 15.33, p. 180.
Thierry, C., G. Bel, and A. Thomas (2008). Supply chain management simulation: an overview.Timperio, G., G. B. Panchal, A. Samvedi, M. Goh, and R. De Souza (2017). “Decision support frame-
work for location selection and disaster relief network design”. In: 7.3, pp. 222–245.Wang, Y., D. Zhang, Q. Liu, F. Shen, and L. H. Lee (2016). “Towards enhancing the last-mile delivery:
An effective crowd-tasking model with scalable solutions”. In: 93, pp. 279–293.Yazdani, M., P. Chatterjee, E. K. Zavadskas, and S. H. Zolfani (2017). “Integrated QFD-MCDM frame-
work for green supplier selection”. In: 142, pp. 3728–3740.Zhang, W. and D. Xu (2014). “Integrating the logistics network design with order quantity determi-
nation under uncertain customer demands”. In: 41.1, pp. 168–175.
218

REFERENCES
Zokaee, S., A. Jabbarzadeh, B. Fahimnia, and S. J. Sadjadi (2017). “Robust supply chain networkdesign: an optimization model with real world application”. In: 257.1-2, pp. 15–44.
219

Business Model of Aircraft FleetPlanning using ANN
Partha Kumar Pandit1, M. Ahsan Akhtar Hasin2
1 – Bangladesh Airlines Training Center BATC
2 – Bangladesh University of Engineering and Technology
The purpose of Aircraft Fleet Planning is to provide the number and type of air-craft for acquisition, its time of acquisition, and trade-in or phase out of fleet.Airlines select a particular type of aircraft from the manufacturer on the basisof optimum cost, considering a number of constraints. Because of existence ofseveral conflicting criteria, the solution approach becomes an NP-hard problem.As such, a traditional linear programming approach cannot optimize the systemin a reasonable time frame. This paper aims at developing amodel for selectingaircraft using Artificial Neural Networks. Key inputs have been obtained fromthemajor areas of aircraft design characteristics, aircraft physical performance,maintenance needs, operating economics, acquisition cost, operating cost andcustomer satisfaction. The input values are fuzzy in nature. However, severalmethods for combined use of fuzzy logic systems and neural networks have beensuggested. Experience,which is conventionally used for selectingaparticular typeof aircraft, has been used for training of the proposed network. Single-layer ANNmodel provided a good solution with optimality in cost, without sacrificing timeconstraint and algorithmic complexity. The airline business will be immenselybenefited from the solution procedure.
Keywords: Aircraft Fleet Planning; ANN; FuzzyFirst recieved: 24.May.2018 Revised: 04.Jun.2018 Accepted: 22.Jun.2018
221
Business Model of Aircraft Fleet Planning using ANN
1 Introduction
Aircraft Fleet planning process determines type of aircraft the airline should buyand their numbers, in order to achieve organizational goals. Corporate planningdeals with the need of the airlines, current resources, corporate objective, pro-jected industry environment andmarketing strategy. Specific requirement of theairlines is then identified throughmarketing research and analysis on the basis ofthe set company objectives.
Given a flight schedule, which is a set of flight segment with specified departureand arrival times and a set of aircraft, the fleet assignment problem is to deter-mine which aircraft type should fly each flight segment (Clark et al., 1996). Theobjective is to maximize revenueminus operating cost. In the basic fleet assign-ment problem considered by Clark et al.(1996) a daily, domestic fleet assignmentproblem is modeled and solved with up to eleven fleets and 2500 flight legs.
Satisfied customers usually return back and buy more, they tell other peopleabout their experiences. Customer Satisfaction is one of the most importantprocesses in airline industry and is recognized as the key to the success of businesscompetition. Like any other industry, airlines first measure the expectation of itspassenger, analyzes the consumer behaviour, prepares a customer satisfactionprogram to provide a set of standard customer services, identifies the service gapand tries for continual improvement.
This research considered the issues of aircraft cost and customer satisfaction inselecting aircraft and developing models integrating these two separate issues– cost estimation and customer satisfaction. Solution methodologies of FuzzyLogic and Artificial Neural Network have been adopted.
1.1 Aircraft Selection Process
Air transportation offers both passenger and freight services that are essential foreconomic growth and development. In a highly competitive environment, airlinecompanies have to control their operating costs bymanaging their flights, aircraft,and crews effectively.
Fleet assignment involves the optimal allocation of a limited number of fleet typesto flight legs in the schedule subject to various operational constraints (Jacobsand Johnson, 2008). Airlines typically manage their annual business cycle by
222
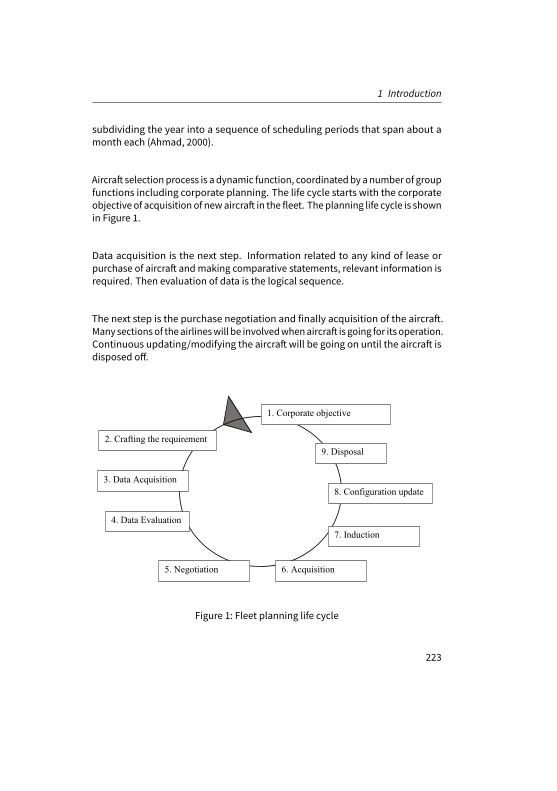
1 Introduction
subdividing the year into a sequence of scheduling periods that span about amonth each (Ahmad, 2000).
Aircraft selection process is a dynamic function, coordinatedby a number of groupfunctions including corporate planning. The life cycle starts with the corporateobjective of acquisition of newaircraft in the fleet. The planning life cycle is shownin Figure 1.
Data acquisition is the next step. Information related to any kind of lease orpurchase of aircraft andmaking comparative statements, relevant information isrequired. Then evaluation of data is the logical sequence.
The next step is the purchase negotiation and finally acquisition of the aircraft.Many sectionsof theairlineswill be involvedwhenaircraft is going for its operation.Continuous updating/modifying the aircraft will be going on until the aircraft isdisposed off.
1. Corporate objective
2. Crafting the requirement
3. Data Acquisition
4. Data Evaluation
5. Negotiation 6. Acquisition
7. Induction
8. Configuration update
9. Disposal
Figure 1: Fleet planning life cycle
223
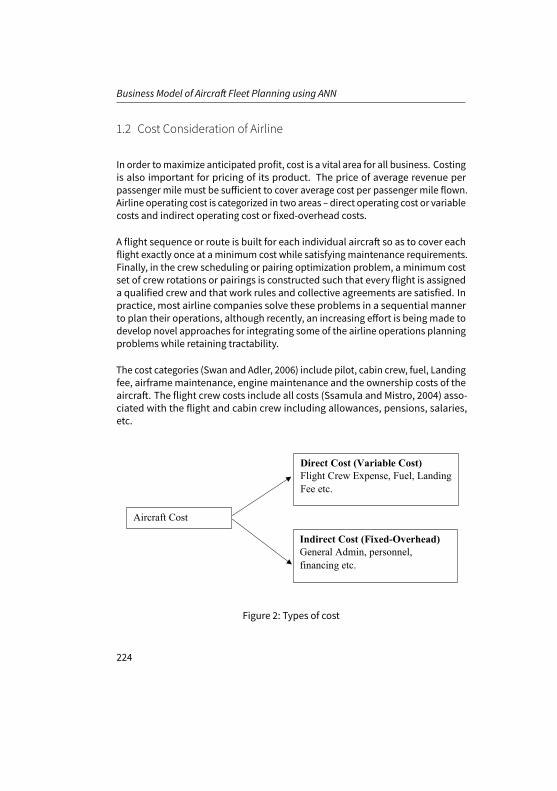
Business Model of Aircraft Fleet Planning using ANN
1.2 Cost Consideration of Airline
In order tomaximize anticipated profit, cost is a vital area for all business. Costingis also important for pricing of its product. The price of average revenue perpassenger mile must be sufficient to cover average cost per passenger mile flown.Airline operating cost is categorized in two areas – direct operating cost or variablecosts and indirect operating cost or fixed-overhead costs.
A flight sequence or route is built for each individual aircraft so as to cover eachflight exactly once at a minimum cost while satisfying maintenance requirements.Finally, in the crew scheduling or pairing optimization problem, a minimum costset of crew rotations or pairings is constructed such that every flight is assigneda qualified crew and that work rules and collective agreements are satisfied. Inpractice, most airline companies solve these problems in a sequential mannerto plan their operations, although recently, an increasing effort is being made todevelop novel approaches for integrating some of the airline operations planningproblems while retaining tractability.
The cost categories (Swan and Adler, 2006) include pilot, cabin crew, fuel, Landingfee, airframemaintenance, engine maintenance and the ownership costs of theaircraft. The flight crew costs include all costs (Ssamula and Mistro, 2004) asso-ciated with the flight and cabin crew including allowances, pensions, salaries,etc.
Aircraft Cost
Direct Cost (Variable Cost) Flight Crew Expense, Fuel, Landing Fee etc.
Indirect Cost (Fixed-Overhead) General Admin, personnel, financing etc.
Figure 2: Types of cost
224
1 Introduction
The costs of an airline incurs in producing available seatmiles (ASM) depend uponthe type of adjustments it is able to make in the amounts of the various resourcesit employs. The quantities of many resources used – labour, fuel and so forth-can be varied relatively quickly in the short run. But amounts of other resourcesdemandmore time of adjustment.
1.3 Customer Satisfaction - a primary Paramater
Introduction of wide body service in the early 1970s marked the climax of produc-tion –sales orientation in the air transport industry. Excess capacity and shortageof customer changed themarketing concept to a customer –oriented approach.
The industry entered into its matured stage since 1960s. Weaker competitorsleft the industry. The remaining competitors have become well entrenched, andthe marketing policy and images are well known. Customer loyalties and marketshares became stabilized.
Evaluation of customer satisfaction differs from one study to another. Studieshave been differing with their focus and coverage. Most of the studies focusedon evaluating factors influencing customer satisfaction or associated customersatisfactionandquality of services (Josephat and Ismail, 2012). Logistic regressionwas used to develop customer satisfaction model for Precision Air.
Customers’ satisfaction degree is customers’ comparative evaluation betweenexpectation and perceived value for the products and the services after makingrelevant payment for their proceeds. Satisfaction or dissatisfaction after the pur-chase, depends not only on the difference between performance that customersactually feel and expected, but also upon their costs that they pay in order to getthe profits, that is to make customers obtain the maximum discount. Customers’delivered value means the difference between the total value of customers andthe total cost of customers.
Service encounters that do not meet expectations should have a bigger impacton customers than service encounters that exceed expectations. Furthermore, ifcustomers are concerned about the possibility of service encounters that do notmeet expectations, future sales and profitability may be negatively influenced(Shaun et al., 2005).
225
Business Model of Aircraft Fleet Planning using ANN
2 Theoretical Background
The flying performance of different aircraftmodel is different, for example, rangeof aircraft, flying altitude ceiling, maximum takeoff weight, maximum zero fuelweight, available cargo space andmanymore. So a particular route is not suit-able for all models of the aircraft to perform. In addition, different models havedifferent seating capacity, layout and their operating costs are not same (Li, andTan, 2013). Profit maximization is the primary goal of an airline whereas cus-tomer satisfaction is considered to be the secondary goal through which strategicadvantage can be achieved.
Conventionally, a computer operates through sequential linear processing tech-nologies. They apply formulas, decision rules, and algorithms instructed by usersto produce outputs from the inputs. Conventional computers are good at numer-ical computation. But ANNs improve their own rules; the more decisions theymake, the better the decisions may become.
ANN can determine the optimal solution to an NP-complete (nondeterministicpolynomial) problem, such as the travelling salesperson problem. This is equiv-alent to linear and integer programming in management sciences, where theobjective functions are optimized using a heuristic search procedure. there is nodoubt that ANNs are feasible for business applications. Many phenomena thatare difficult to describe can bemodeled by ANNs, if carefully designed.
Artificial Neural Networks have emerged as a very popular area of research, bothfrom the design and the usage points of view. There is considerable researchemphasis on designing better andmore efficient neural networks, more powerful”learning algorithms”, better transfer functions etc. On the other hand thereis a great amount of academic interest in the applications of neural networks.Disciplines as diverse as the biological sciences and finance have applicationsthat use neural networks. There is a significant volume of research on neuralnetworks in the engineering and science literature. There also exists a reasonablebody of neural network research as related to business.
2.1 Profit Maximization Model
Considering the features of a particular route and flight plan, under constraints ofpre-announced flight schedules, not considering the flight stopovers and having
226
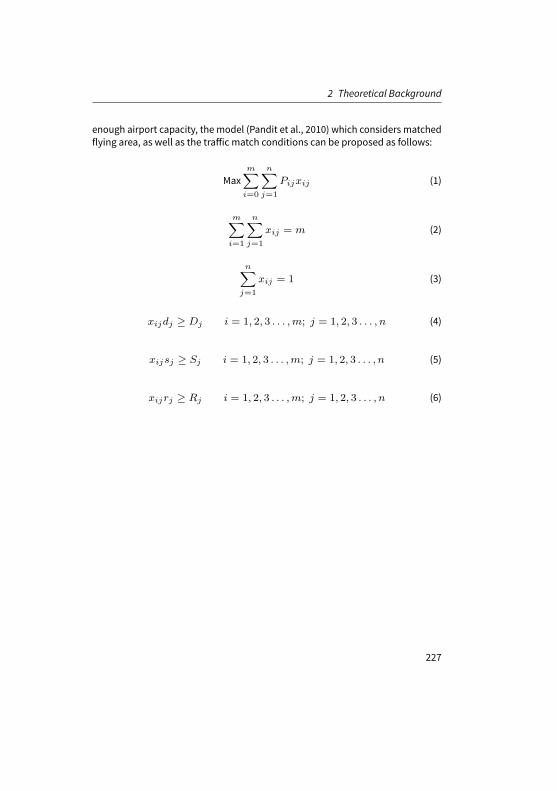
2 Theoretical Background
enough airport capacity, the model (Pandit et al., 2010) which considers matchedflying area, as well as the traffic match conditions can be proposed as follows:
Maxm∑i=0
n∑j=1
Pijxij (1)
m∑i=1
n∑j=1
xij = m (2)
n∑j=1
xij = 1 (3)
xijdj ≥ Dj i = 1, 2, 3 . . . ,m; j = 1, 2, 3 . . . , n (4)
xijsj ≥ Sj i = 1, 2, 3 . . . ,m; j = 1, 2, 3 . . . , n (5)
xijrj ≥ Rj i = 1, 2, 3 . . . ,m; j = 1, 2, 3 . . . , n (6)
227
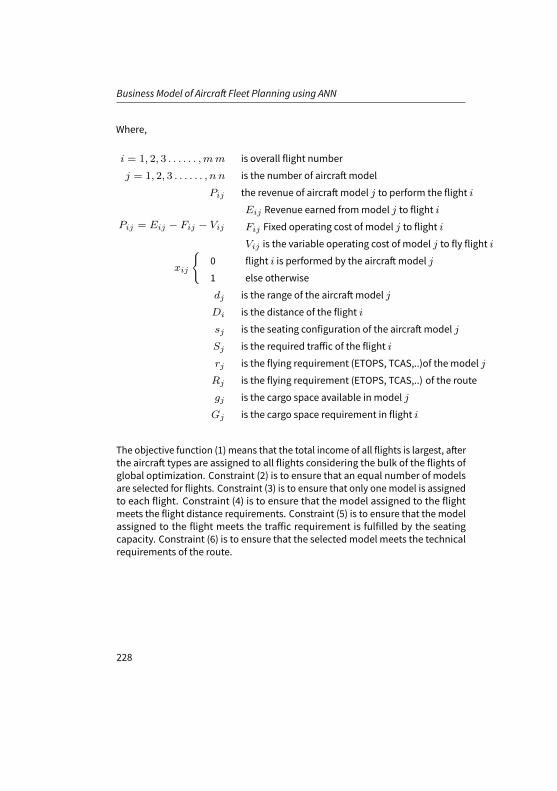
Business Model of Aircraft Fleet Planning using ANN
Where,
i = 1, 2, 3 . . . . . . ,mm is overall flight number
j = 1, 2, 3 . . . . . . , n n is the number of aircraftmodel
Pij the revenue of aircraftmodel j to perform the flight i
Pij = Eij − Fij − Vij
Eij Revenue earned frommodel j to flight i
Fij Fixed operating cost of model j to flight i
Vij is the variable operating cost of model j to fly flight i
xij
{0
1
flight i is performed by the aircraftmodel j
else otherwise
dj is the range of the aircraftmodel j
Di is the distance of the flight i
sj is the seating configuration of the aircraftmodel j
Sj is the required traffic of the flight i
rj is the flying requirement (ETOPS, TCAS,..)of the model j
Rj is the flying requirement (ETOPS, TCAS,..) of the route
gj is the cargo space available in model j
Gj is the cargo space requirement in flight i
The objective function (1) means that the total income of all flights is largest, afterthe aircraft types are assigned to all flights considering the bulk of the flights ofglobal optimization. Constraint (2) is to ensure that an equal number of modelsare selected for flights. Constraint (3) is to ensure that only onemodel is assignedto each flight. Constraint (4) is to ensure that the model assigned to the flightmeets the flight distance requirements. Constraint (5) is to ensure that the modelassigned to the flight meets the traffic requirement is fulfilled by the seatingcapacity. Constraint (6) is to ensure that the selected model meets the technicalrequirements of the route.
228
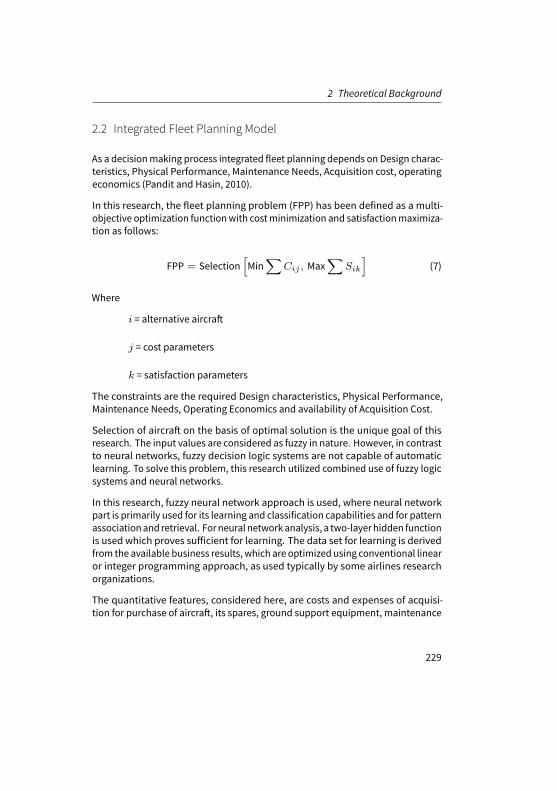
2 Theoretical Background
2.2 Integrated Fleet Planning Model
As a decisionmaking process integrated fleet planning depends on Design charac-teristics, Physical Performance, Maintenance Needs, Acquisition cost, operatingeconomics (Pandit and Hasin, 2010).
In this research, the fleet planning problem (FPP) has been defined as a multi-objective optimization functionwith costminimization and satisfactionmaximiza-tion as follows:
FPP = Selection[Min
∑Cij , Max
∑Sik
](7)
Where
i = alternative aircraft
j = cost parameters
k = satisfaction parameters
The constraints are the required Design characteristics, Physical Performance,Maintenance Needs, Operating Economics and availability of Acquisition Cost.
Selection of aircraft on the basis of optimal solution is the unique goal of thisresearch. The input values are considered as fuzzy in nature. However, in contrastto neural networks, fuzzy decision logic systems are not capable of automaticlearning. To solve this problem, this research utilized combined use of fuzzy logicsystems and neural networks.
In this research, fuzzy neural network approach is used, where neural networkpart is primarily used for its learning and classification capabilities and for patternassociationand retrieval. Forneural networkanalysis, a two-layerhidden functionis used which proves sufficient for learning. The data set for learning is derivedfrom the available business results, which are optimized using conventional linearor integer programming approach, as used typically by some airlines researchorganizations.
The quantitative features, considered here, are costs and expenses of acquisi-tion for purchase of aircraft, its spares, ground support equipment, maintenance
229
Business Model of Aircraft Fleet Planning using ANN
training, flight training, financing, pre-payment, maintenance, fuel, general ad-ministrative activities, sales promotion activities, passenger service and handling,cockpit and cabin crew, dispatcher, insurance and rental charges, landing andnavigation fees.
The fleet planning data used in this research are – available aircraft and specificrequirement of fleet planning in terms of destination, type of load to be carried,time of aircraft acquisition.
Once these features were extracted, their probable fuzzy relations were deter-mined. It is necessary to note that fuzzy relation provides an analyzer with a richframework within which many problems emerging from practical applications ofthe theory are formulated.
This research also utilized this strength of fuzzy relations. However, the greatutility of fuzzy relation equations was somewhat hampered by the rather highcomputational demandof conventional linear programmingoptimizationmodels,which is supported by the existing literatures as well (Oliver, 1997).
A sensitivity analysis was also performed for minimization of deviations fromdesired outputs. The desired response of the network towhich each input patternand its comparisonwith theactual output of thenetworkwereused in the learningalgorithm for appropriate adjustments of the weights. These adjustments whosepurpose was to minimize the difference between the desired and actual outputswere made incrementally.
That is small adjustments in the weights are made in the desired direction foreach training pair. This is essential for facilitating a convergence to a solution(specific values of the weight) in which patterns in the training set are recognizedwith high fidelity.
230
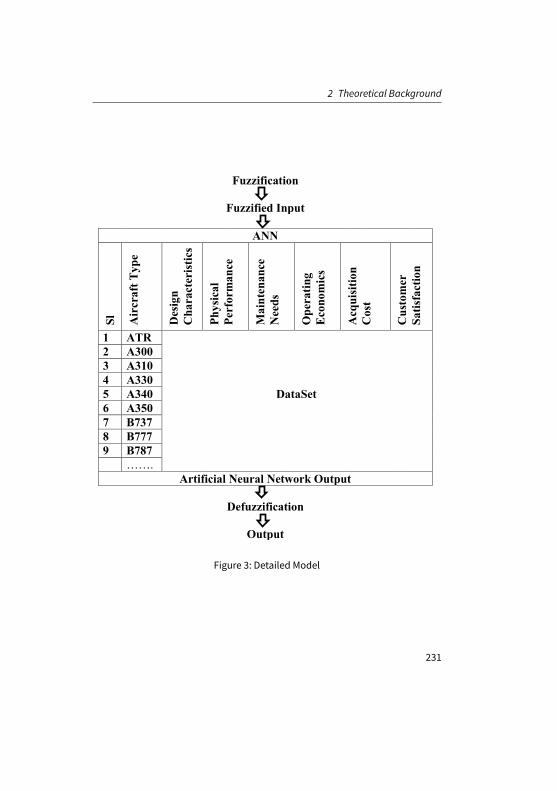
2 Theoretical Background
Fuzzification
Fuzzified Input
ANN
Sl
Air
craf
t Typ
e
Des
ign
Cha
ract
eris
tics
Phys
ical
Pe
rfor
man
ce
Mai
nten
ance
N
eeds
Ope
ratin
g E
cono
mic
s
Acq
uisi
tion
Cos
t
Cus
tom
er
Satis
fact
ion
1 ATR 2 A300 3 A310 4 A330 5 A340 DataSet 6 A350 7 B737 8 B777 9 B787 …….
Artificial Neural Network Output
Defuzzification
Output
Figure 3: Detailed Model
231

Business Model of Aircraft Fleet Planning using ANN
3 Outline of Methodology
In order to carry out this research work, steps that have been adopted are men-tioned below:-
3.1 Fuzzification
Uncertainties regarding all satisfaction data have been handled with the helpof fuzzy membership function and finally Customer Satisfaction fuzzy ranking isprepared for different aircraft.
Passenger satisfaction data was collected from the reviews made by the passen-gers for different flights with different aircraft. In those reviews, they had optionsto give comment andmake ranking on a number of issues like-seat comfort, sat-isfaction for Catering, satisfaction for entertainment, value for money and staffcomfort.
3.2 Neural Network Design
The work flow for the general neural network design process has seven primarysteps:
1. Collection of data
2. Creating the network
3. Configuring the network
4. Initializing the weights and biases
5. Training of the network
6. Validating the network (post-training analysis)
7. Using the network
232
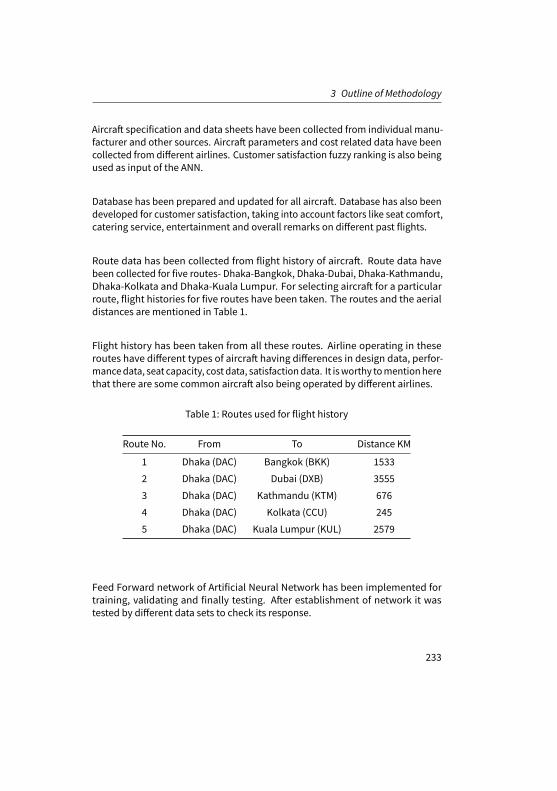
3 Outline of Methodology
Aircraft specification and data sheets have been collected from individual manu-facturer and other sources. Aircraft parameters and cost related data have beencollected from different airlines. Customer satisfaction fuzzy ranking is also beingused as input of the ANN.
Database has been prepared and updated for all aircraft. Database has also beendeveloped for customer satisfaction, taking into account factors like seat comfort,catering service, entertainment and overall remarks on different past flights.
Route data has been collected from flight history of aircraft. Route data havebeen collected for five routes- Dhaka-Bangkok, Dhaka-Dubai, Dhaka-Kathmandu,Dhaka-Kolkata and Dhaka-Kuala Lumpur. For selecting aircraft for a particularroute, flight histories for five routes have been taken. The routes and the aerialdistances are mentioned in Table 1.
Flight history has been taken from all these routes. Airline operating in theseroutes have different types of aircraft having differences in design data, perfor-mancedata, seat capacity, cost data, satisfactiondata. It isworthy tomentionherethat there are some common aircraft also being operated by different airlines.
Table 1: Routes used for flight history
Route No. From To Distance KM
1 Dhaka (DAC) Bangkok (BKK) 1533
2 Dhaka (DAC) Dubai (DXB) 3555
3 Dhaka (DAC) Kathmandu (KTM) 676
4 Dhaka (DAC) Kolkata (CCU) 245
5 Dhaka (DAC) Kuala Lumpur (KUL) 2579
Feed Forward network of Artificial Neural Network has been implemented fortraining, validating and finally testing. After establishment of network it wastested by different data sets to check its response.
233
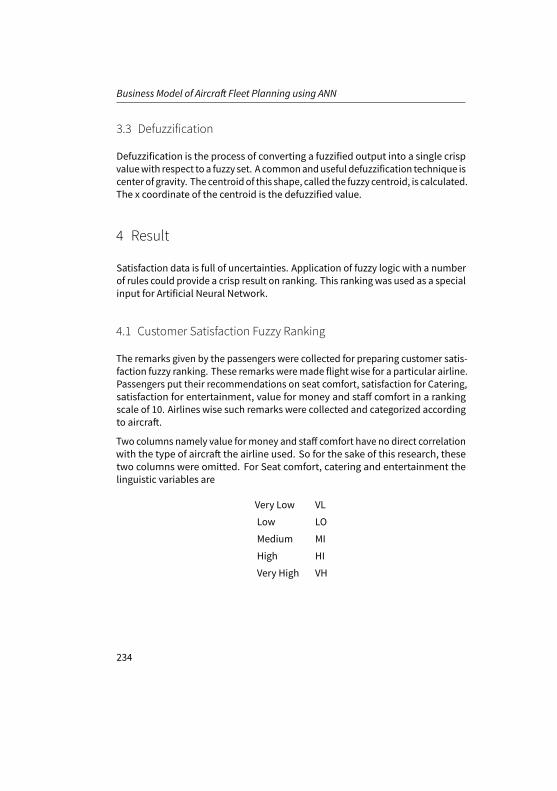
Business Model of Aircraft Fleet Planning using ANN
3.3 Defuzzification
Defuzzification is the process of converting a fuzzified output into a single crispvaluewith respect to a fuzzy set. A commonanduseful defuzzification technique iscenter of gravity. The centroidof this shape, called the fuzzy centroid, is calculated.The x coordinate of the centroid is the defuzzified value.
4 Result
Satisfaction data is full of uncertainties. Application of fuzzy logic with a numberof rules could provide a crisp result on ranking. This ranking was used as a specialinput for Artificial Neural Network.
4.1 Customer Satisfaction Fuzzy Ranking
The remarks given by the passengers were collected for preparing customer satis-faction fuzzy ranking. These remarks weremade flight wise for a particular airline.Passengers put their recommendations on seat comfort, satisfaction for Catering,satisfaction for entertainment, value for money and staff comfort in a rankingscale of 10. Airlines wise such remarks were collected and categorized accordingto aircraft.
Two columns namely value formoney and staff comfort have no direct correlationwith the type of aircraft the airline used. So for the sake of this research, thesetwo columns were omitted. For Seat comfort, catering and entertainment thelinguistic variables are
Very Low VL
Low LO
Medium MI
High HI
Very High VH
234
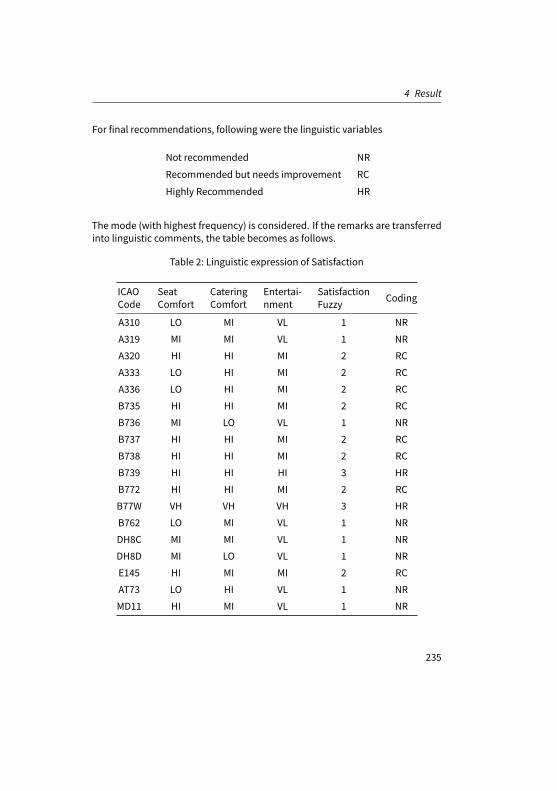
4 Result
For final recommendations, following were the linguistic variables
Not recommended NR
Recommended but needs improvement RC
Highly Recommended HR
Themode (with highest frequency) is considered. If the remarks are transferredinto linguistic comments, the table becomes as follows.
Table 2: Linguistic expression of Satisfaction
ICAOCode
SeatComfort
CateringComfort
Entertai-nment
SatisfactionFuzzy Coding
A310 LO MI VL 1 NRA319 MI MI VL 1 NRA320 HI HI MI 2 RCA333 LO HI MI 2 RCA336 LO HI MI 2 RCB735 HI HI MI 2 RCB736 MI LO VL 1 NRB737 HI HI MI 2 RCB738 HI HI MI 2 RCB739 HI HI HI 3 HRB772 HI HI MI 2 RCB77W VH VH VH 3 HRB762 LO MI VL 1 NRDH8C MI MI VL 1 NRDH8D MI LO VL 1 NRE145 HI MI MI 2 RCAT73 LO HI VL 1 NRMD11 HI MI VL 1 NR
235
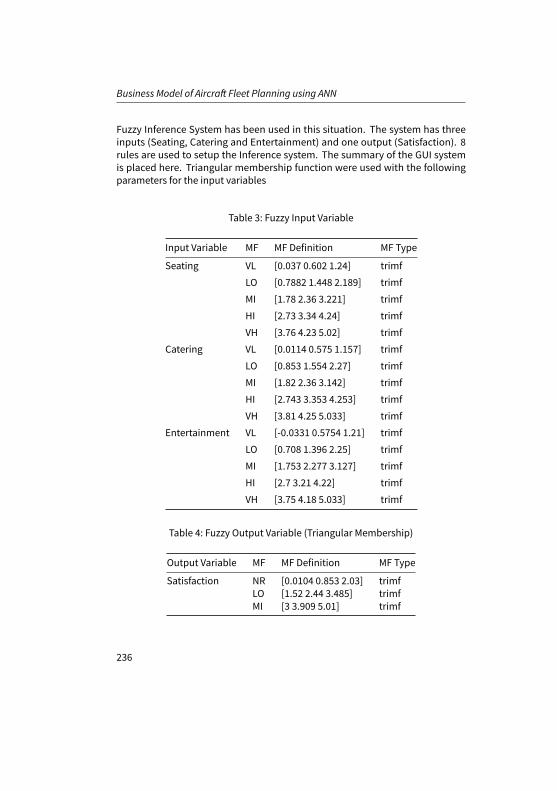
Business Model of Aircraft Fleet Planning using ANN
Fuzzy Inference System has been used in this situation. The system has threeinputs (Seating, Catering and Entertainment) and one output (Satisfaction). 8rules are used to setup the Inference system. The summary of the GUI systemis placed here. Triangular membership function were used with the followingparameters for the input variables
Table 3: Fuzzy Input Variable
Input Variable MF MF Definition MF Type
Seating VL [0.037 0.602 1.24] trimfLO [0.7882 1.448 2.189] trimfMI [1.78 2.36 3.221] trimfHI [2.73 3.34 4.24] trimfVH [3.76 4.23 5.02] trimf
Catering VL [0.0114 0.575 1.157] trimfLO [0.853 1.554 2.27] trimfMI [1.82 2.36 3.142] trimfHI [2.743 3.353 4.253] trimfVH [3.81 4.25 5.033] trimf
Entertainment VL [-0.0331 0.5754 1.21] trimfLO [0.708 1.396 2.25] trimfMI [1.753 2.277 3.127] trimfHI [2.7 3.21 4.22] trimfVH [3.75 4.18 5.033] trimf
Table 4: Fuzzy Output Variable (Triangular Membership)
Output Variable MF MF Definition MF Type
Satisfaction NR [0.0104 0.853 2.03] trimfLO [1.52 2.44 3.485] trimfMI [3 3.909 5.01] trimf
236
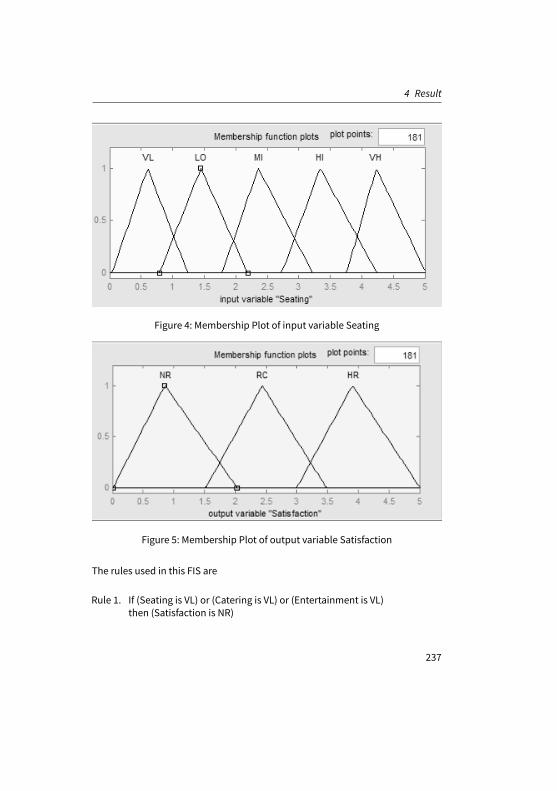
4 Result
Figure 4: Membership Plot of input variable Seating
Figure 5: Membership Plot of output variable Satisfaction
The rules used in this FIS are
Rule 1. If (Seating is VL) or (Catering is VL) or (Entertainment is VL)then (Satisfaction is NR)
237
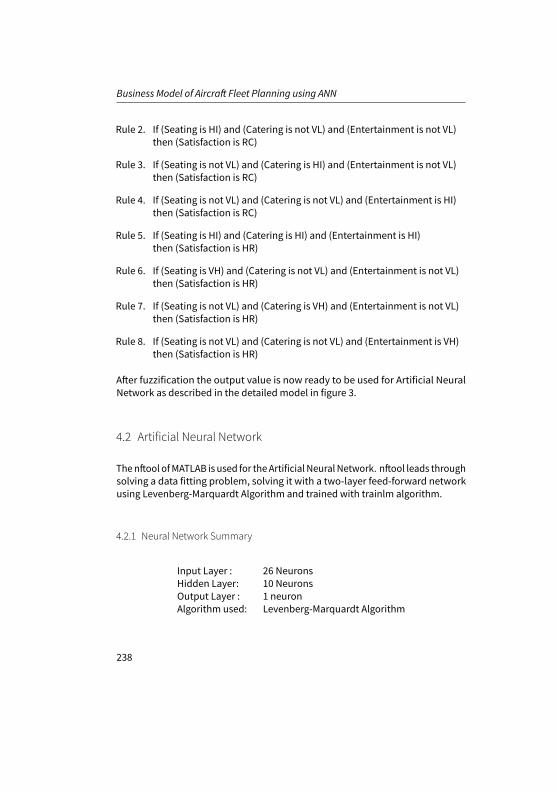
Business Model of Aircraft Fleet Planning using ANN
Rule 2. If (Seating is HI) and (Catering is not VL) and (Entertainment is not VL)then (Satisfaction is RC)
Rule 3. If (Seating is not VL) and (Catering is HI) and (Entertainment is not VL)then (Satisfaction is RC)
Rule 4. If (Seating is not VL) and (Catering is not VL) and (Entertainment is HI)then (Satisfaction is RC)
Rule 5. If (Seating is HI) and (Catering is HI) and (Entertainment is HI)then (Satisfaction is HR)
Rule 6. If (Seating is VH) and (Catering is not VL) and (Entertainment is not VL)then (Satisfaction is HR)
Rule 7. If (Seating is not VL) and (Catering is VH) and (Entertainment is not VL)then (Satisfaction is HR)
Rule 8. If (Seating is not VL) and (Catering is not VL) and (Entertainment is VH)then (Satisfaction is HR)
After fuzzification the output value is now ready to be used for Artificial NeuralNetwork as described in the detailed model in figure 3.
4.2 Artificial Neural Network
Thenftool ofMATLAB is used for theArtificial NeuralNetwork. nftool leads throughsolving a data fitting problem, solving it with a two-layer feed-forward networkusing Levenberg-Marquardt Algorithm and trained with trainlm algorithm.
4.2.1 Neural Network Summary
Input Layer : 26 NeuronsHidden Layer: 10 NeuronsOutput Layer : 1 neuronAlgorithm used: Levenberg-Marquardt Algorithm
238
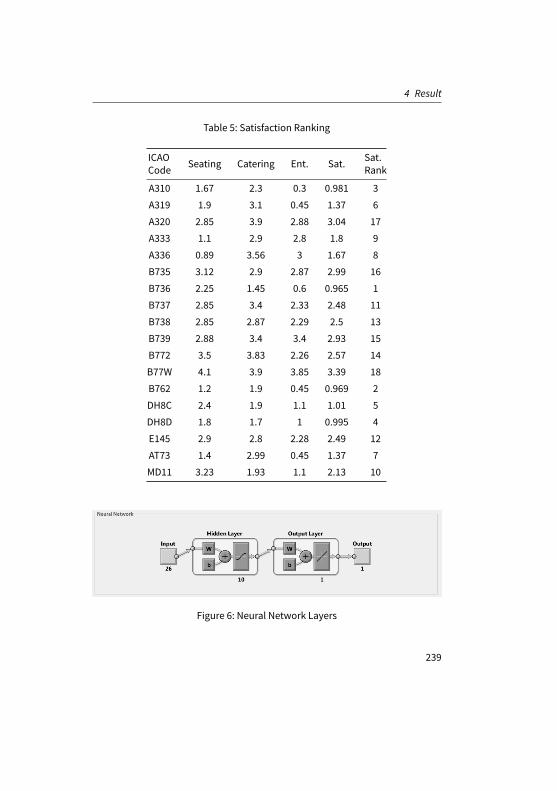
4 Result
Table 5: Satisfaction Ranking
ICAOCode Seating Catering Ent. Sat. Sat.
Rank
A310 1.67 2.3 0.3 0.981 3A319 1.9 3.1 0.45 1.37 6A320 2.85 3.9 2.88 3.04 17A333 1.1 2.9 2.8 1.8 9A336 0.89 3.56 3 1.67 8B735 3.12 2.9 2.87 2.99 16B736 2.25 1.45 0.6 0.965 1B737 2.85 3.4 2.33 2.48 11B738 2.85 2.87 2.29 2.5 13B739 2.88 3.4 3.4 2.93 15B772 3.5 3.83 2.26 2.57 14B77W 4.1 3.9 3.85 3.39 18B762 1.2 1.9 0.45 0.969 2DH8C 2.4 1.9 1.1 1.01 5DH8D 1.8 1.7 1 0.995 4E145 2.9 2.8 2.28 2.49 12AT73 1.4 2.99 0.45 1.37 7MD11 3.23 1.93 1.1 2.13 10
Figure 6: Neural Network Layers
239

Business Model of Aircraft Fleet Planning using ANN
After establishing the network it needs training. For that purpose developed datasets are provided to the network as data_in from a data file. Also the target wasprovided through another data file called data_out. 70% data (772 Samples)are used for training, 15% (166 Samples) for validation and another 15% (166Samples) are used for testing purpose.
Figure 7: Training, Validation and Testing data samples
4.2.2 Training Summary
The process to train a neural network involves tuning the values of the weightsand biases of the network to optimize network performance, as defined by thenetwork performance function. The training of neural network depends onmanyfactors - complexity of the problem, the number of data points in the training set,the number of weights and biases in the network, the error goal and whether thenetwork is being used for function approximation (regression).
In Levenberg-Marquardt Algorithm of feed forward network, trainlm algorithm isused for training. Iteration is one step taken in the gradient descent algorithmtowards minimizing the loss function using a mini-batch. An epoch is the fullpass of the training algorithm over the entire training set. The training state ispresented in Figure 8.
240
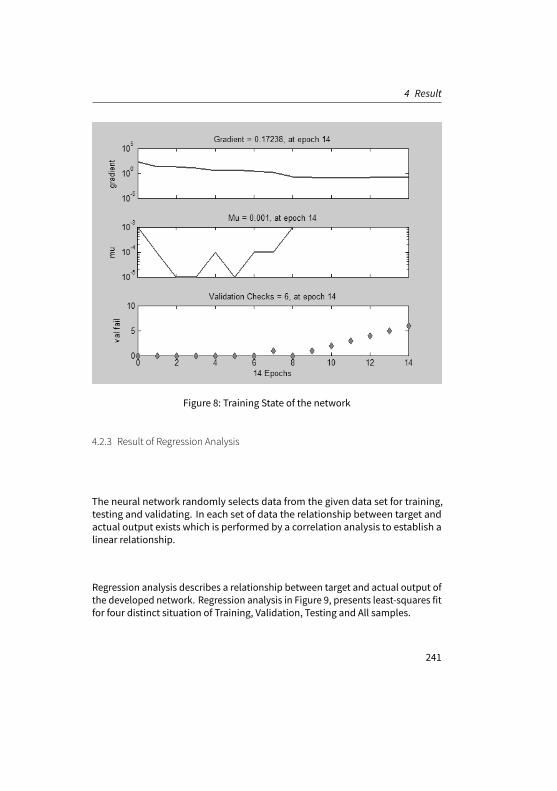
4 Result
Figure 8: Training State of the network
4.2.3 Result of Regression Analysis
The neural network randomly selects data from the given data set for training,testing and validating. In each set of data the relationship between target andactual output exists which is performed by a correlation analysis to establish alinear relationship.
Regression analysis describes a relationship between target and actual output ofthe developed network. Regression analysis in Figure 9, presents least-squares fitfor four distinct situation of Training, Validation, Testing and All samples.
241
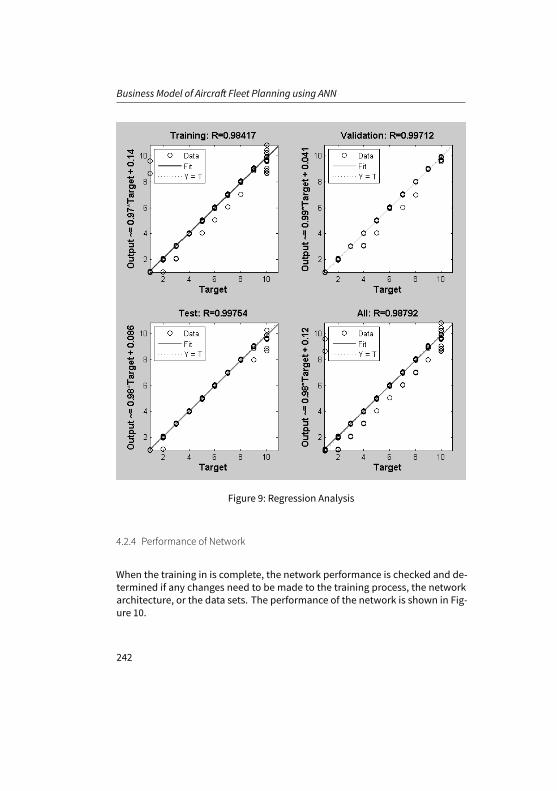
Business Model of Aircraft Fleet Planning using ANN
Figure 9: Regression Analysis
4.2.4 Performance of Network
When the training in is complete, the network performance is checked and de-termined if any changes need to be made to the training process, the networkarchitecture, or the data sets. The performance of the network is shown in Fig-ure 10.
242
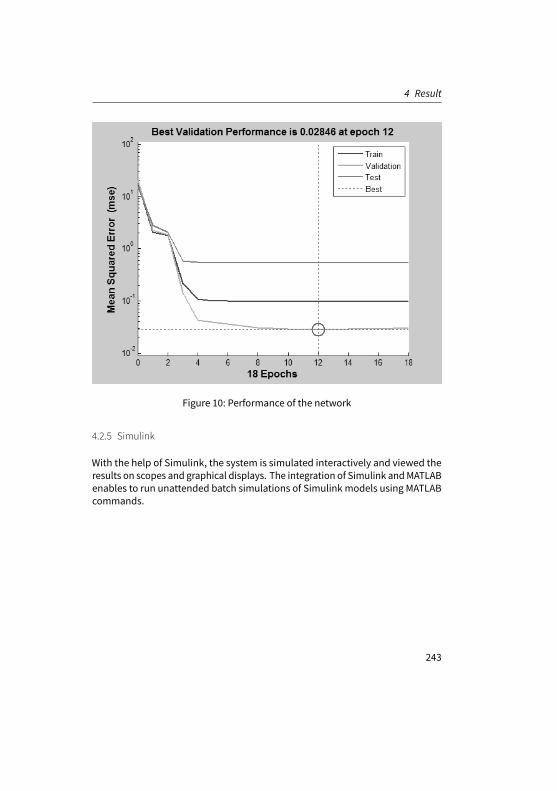
4 Result
Figure 10: Performance of the network
4.2.5 Simulink
With the help of Simulink, the system is simulated interactively and viewed theresults on scopes and graphical displays. The integration of Simulink andMATLABenables to run unattended batch simulations of Simulink models using MATLABcommands.
243
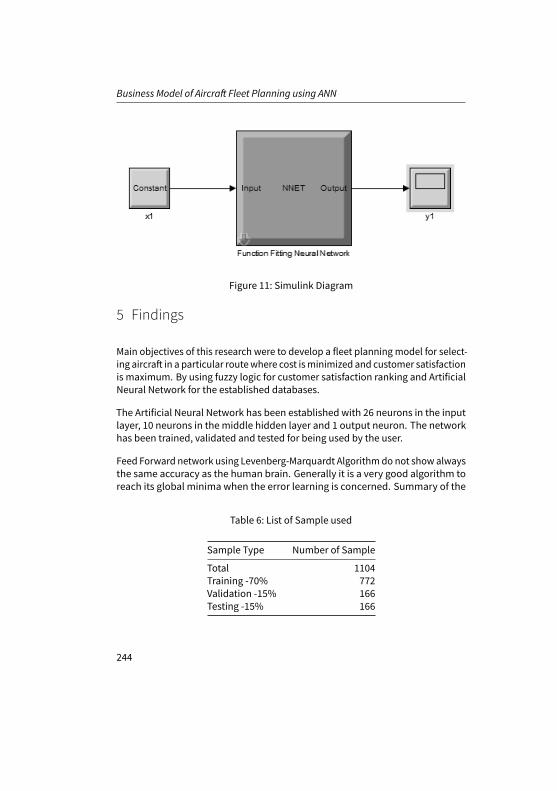
Business Model of Aircraft Fleet Planning using ANN
Figure 11: Simulink Diagram
5 Findings
Main objectives of this research were to develop a fleet planning model for select-ing aircraft in a particular routewhere cost isminimized and customer satisfactionis maximum. By using fuzzy logic for customer satisfaction ranking and ArtificialNeural Network for the established databases.
The Artificial Neural Network has been established with 26 neurons in the inputlayer, 10 neurons in the middle hidden layer and 1 output neuron. The networkhas been trained, validated and tested for being used by the user.
Feed Forward network using Levenberg-Marquardt Algorithmdo not show alwaysthe same accuracy as the human brain. Generally it is a very good algorithm toreach its global minima when the error learning is concerned. Summary of the
Table 6: List of Sample used
Sample Type Number of Sample
Total 1104Training -70% 772Validation -15% 166Testing -15% 166
244
5 Findings
Table 7: Network Accuracy
Epoch MSE RegressionTrain Valid Test Train Valid Test All
13 0.0736 0.0346 0.0422 0.988 0.9635 0.9976 0.98520 0.0402 0.0278 0.0624 0.984 0.9968 0.9968 0.98818 0.0976 0.0284 0.0536 0.992 0.9975 0.9543 0.98714 0.2002 0.0318 0.0342 0.984 0.9971 0.9975 0.987
Mean squared Errors (MSE) and network accuracy (Regression-R) values are asfollows:
The network has been tested for known and unknown inputs for recognizing theoutput.
Sample Input
[5; 202; 2579; 2;56000; 897; 5170; 80142; 142000; 41000; 280; 1204; 5.82; 23591.176;940.65; 1457.43; 320; 26309.256; 1827.92; 28137.176; 280; 100.4899143; 0.981; 3;25.7; 10]
From the Simulink output window, the output is 1 and when it is decoded forfinding the real value of 1, it is found that the selected aircraft is A310.
Aircraft specification, design characteristics, aircraft performance data, powerplant data, customer satisfaction data needs regular updating for correct decisionmaking by the neural network.
245
Business Model of Aircraft Fleet Planning using ANN
Figure 12: Simulink Output window
6 Conclusion
Airline industry is suffering from lack of integrated fleet planning mechanism,considering multiple input factors, along with uncertainties in different formsand at various stages. This research developed amathematical model with dualobjectives ofminimizing operating costs andmaximizing customer satisfaction. Inthis perspective the model developed by the researcher and its implementationthrough fuzzy logic and artificial neural network has given good results withrespect to both objectives. Computer simulation has provided useful sensitivitywith respect to varied input data sets. With slight modifications and updating ofdata on a regular basis, the model can serve the purposes of other regions of theworld.
For specific optimization problem, other optimization algorithmsmay find bettersolutions than Fuzzy Neural Network combination (given the same amount of
246
REFERENCES
computation time). In this particular fleet planning problem, future researchpotential lies in the area of using other algorithms like evolution strategies, evolu-tionary programming, simulated annealing, Gaussian adaptation, hill climbingand swarm intelligence andmethods based on integer linear programming.
References
Clarke, L. W., C. A. Hane, E. L. Johnson, and G. L. Nemhauser (1996). “Maintenance and crewconsiderations in fleet assignment”. In: Transportation Science 30.3, pp. 249–260.
Jacobs, T. L., B. C. Smith, and E. L. Johnson (2008). “Incorporating network flow effects into theairline fleet assignment process”. In: Transportation Science 42.4, pp. 514–529.
Jarrah, A. I., J. Goodstein, and R. Narasimhan (2000). “An efficient airline re-fleeting model forthe incremental modification of planned fleet assignments”. In: Transportation Science 34.4,pp. 349–363.
Josephat, P. and A. Ismail (2012). “A logistic regression model of customer satisfaction of airline”.In: International Journal of Human Resource Studies 2.4, p. 197.
Li, Y. andN.Tan (2013). “Studyon fleetassignmentproblemmodel andalgorithm”. In:MathematicalProblems in Engineering 2013.
Mcquitty, S., M. Hyman, R. Oliver, P. Sautter, and A. Stratemeyer (2005). “Service variability and itseffect on consumer perceptions and intentions”. In: pp. 264–294.
Oliver, R. (1997). Satisfaction: a behavioral perspective on the consumer.Pandit, P. K., M. A. A. Hasin, and M. A. Sharif (2010). “Aircraft Fleet Planning Under Varying De-
mand using Aggregate Resource Planning Concepts”. In: International Journal of Logistics andTransport.
“Pioneering Solutions in Supply Chain Management: A Comprehensive Insight Into Current Man-agement Approaches” (2010). In: Erich Schmidt Verlag, Germany. Chap. Integrated AircraftFleet Planning using Fuzzy Logic and Artificial Neural Network Approach.
Ssamula, B. and R. F. Del Mistro (2004). Developing a cost model for running an airline service.Citeseer.
Swan, W. M. and N. Adler (2006). “Aircraft trip cost parameters: A function of stage length andseat capacity”. In: Transportation Research Part E: Logistics and Transportation Review 42.2,pp. 105–115.
247


Part IV
Risk and Security Management

Adequate Flexibility Potential to handleSupply Chain Uncertainties
Immanuel Zitzmann1, David Karl1
1 – Otto-Friedrich-Universität Bamberg
Risks and uncertainties (e.g. IT-system failure or demand fluctuation) threatenthe performance of supply chains. This paper gives insight into the planning offlexibility potential as a crucial tool for managing the consequences of opera-tional and disruptive uncertainties. A simulation study of lot-sizing decisions in atwo-stage decentralised supply chain is used. Themodelled supply chain facesoperational as well as disruptive uncertainties. It is analysed how capacity and/orstock flexibility on each stage copewith unexpected events. The location of flexibil-ity within the supply chain is key for its ability to handle uncertainties. The papershows that stock flexibility can substitute capacity flexibility to a certain degree.However, disruptive uncertainties cannot be handled by stock flexibility alone.Therefore, trade-offs in flexibility potential have to be considered. In contrast toother studies, this simulation models operational and disruptive uncertaintiesin three areas: internal processes, supply side and demand side. Also flexibilitymanagement in a decentralised decisionmaking process is analysed. Contrary tothe lean thinking approach it is shown that inventory plays an important role inmanaging uncertainties. Therefore, management should use the right amount ofinventory to create flexibility depending on the individual risk situation.
Keywords: Uncertainty; Supply Chain; Flexibility; Simulation StudyFirst recieved: 24.May.2018 Accepted: 07.Jun.2018
251

Adequate Flexibility Potential to handle Supply Chain Uncertainties
1 Introduction
Globalisation, digitalisation and new technologies change the processes of valuecreation. As a result, global and complex supply chains can be observed (Meixelland Gargeya, 2005). The scale of these value creating networks makes themvulnerable (Peck, 2005; Peck, 2006). They are not only affected by unexpectedevents geographically near to the final consumer but also by incidents that occuron the other side of the world (Simangunsong et al., 2012). Examples for suchevents are the eruption of the volcano Eyjafjallajökull on Iceland in 2010 or anearthquake in Taiwan (Papadakis and Ziemba, 2001). In addition to those low-probability/high-impact risks operational uncertainties jeopardize supply chains(Tang and Tomlin, 2008; Sodhi and Tang, 2012). The focus on efficiency has led tosupply chainswhich are not able to compensate even small disorders like delayeddelivery or fluctuation in production rates and consumer demand (Craighead etal., 2007).
The literature on supply chain risks and uncertainties mentions different ap-proaches to handle unexpected situations. Thus, a supply chain should be robust,resilient and agile (Naylor et al., 1999; Christopher and Peck, 2004; Klibi et al.,2010). The importance of each aspect depends on the individual circumstancesof a supply chain (Cabral et al., 2012). However, all three concepts need flexibilityto be utilised (Zitzmann, 2014; Zitzmann, 2016). It is the key ability to handle risksand uncertainties in supply chains and to use opportunities which emerge fromunexpected situations.
Regarding flexibility management and flexibility in supply chains many researchquestions can be explored (Stevenson and Spring, 2007). The focus of this paperis to look into planning flexibility potential. In particular, we aim to give answerson the following questions: Where in the supply chain is flexibility needed? Howcan capacity and stock flexibility substitute each other?
This article is structured as follows. First, we provide background information onrisk and uncertainties in supply chains as well as on flexibility and its creation.Subsequently, in the methodology section a simulation study is introduced. Sec-tion 4 presents the results of the simulation study and discuss its implications.The final section summarises the findings of the paper.
252

2 Review of Relevant Literature
2 Review of Relevant Literature
This paper builds on existing literature regarding risks and uncertainties as well asflexibility in the context of supply chains. First, the terms risk and uncertainty willbe distinguished in section 2.1 as they are often used interchangeably. Afterwards,section 2.2 will consider the complex concept of flexibility, especially flexibility insupply chains. How flexibility can be created will be the subject of section 2.3
2.1 Risk and Uncertainties in Supply Chains
Making decisions under uncertainty is part of every management process andtherefore in supply chain management as well. Uncertainty can be described asinability to predict something (Milliken, 1987). The term risk is often used inter-changeably with uncertainty, but they differ. Figure 1 shows two opinions howthe terms can be distinguished. In both cases, uncertainty encompasses morethan risk. According to decision theory, risk and uncertainty can be differentiatedaccording to their predictability. If it is possible to quantify a probability of oc-currence, it is called risk; if not it is called uncertainty (Knight, 1971). The secondapproach, which will be followed in this paper, considers the consequences ofuncertainty. If they are positive, they are called chances; if they may be negative,then they are risks (Simangunsong et al., 2012).
The literature review of Simangunsong et al. (2012) identifies 14 sources of un-certainties in supply chains which can be classified into three groups: within aninstitution of a supply chain, within the regarded supply chain, or external to thevalue creating network. Chopra and Sodhi (2004), Jüttner (2005), Tang and Tomlin(2008), Sodhi and Tang (2012) as well as Tiwari et al. (2015) also identify thesesources of uncertainties for supply chains.
relationship between risk and
uncertainty
uncertainty
without
probabaility
with
probability
=
risk
uncertainty
positive
impact
=
chance
negative
impact
=
risk
Figure 1: Relationship between risk and uncertainty
253
Adequate Flexibility Potential to handle Supply Chain Uncertainties
The focus of this paper is flexibility in supply chains and its ability to handleuncertainties, and not about reducing uncertainties, as it is done in (supply chain)risk management. Therefore, more important than the sources of uncertaintiesare their impact on the supply chain. According to their magnitude it can bedistinguished between operational and disruptive uncertainties (Chopra andSodhi, 2004; Tang, 2006; Tang and Tomlin, 2008; Sodhi and Tang, 2012):
Operational uncertainties are inherent fluctuations in the processes of a supplychain, e.g. uncertain customer demand, variations in production rate or delays intransportation. Uncertainties are operational when fluctuations are limited to acertain range around an average value.
Disruptive uncertainties refer to events with major impact on the supply chain.These are natural or man-made disruptions that happen rarely like earthquakes,floods, terrorist attacks or machine breakdowns. Their consequences for thesupply chain are massive and cannot be predicted to a certain degree.
Operational as well as disruptive uncertainties can result from the sources men-tioned previously and can affect the flow of goods, information and financewithina supply chain. This paper considers the flow of goods and how flexibility canhandle the impact of emerging uncertainties. Usually, no organisation existsthat manages the whole supply chain. Therefore, decisions about flexibility man-agement are made on the institutional level (Lummus et al., 2003). Taking thisviewpoint, supply chain uncertainties have impact on three different areas: thesupply side, the process of value creation within the regarded institution itselfand the demand side (Chopra and Sodhi, 2004; Tang and Tomlin, 2009). Even asingle source of uncertainty can lead to consequences in more than one area, e.g.the breakdown of a machine is an uncertainty located within the manufacturingprocess. When it happens in the regarded institution, it affects the process ofvalue creation. The supply process is affected when the breakdown occurs at theside of a vendor. Natural disasters which are external uncertainties often affect allthree areas of uncertainty impact. An earthquake may not only destroy factoriesas well as streets and therefore, endanger the supply and manufacturing process,it also affects the demand side.
2.2 Flexibility in Supply Chains
According to Garavelli (2003), “[…] flexibility reflects the ability of a system toproperly and rapidly respond tochanges, coming from insideaswell asoutside the
254
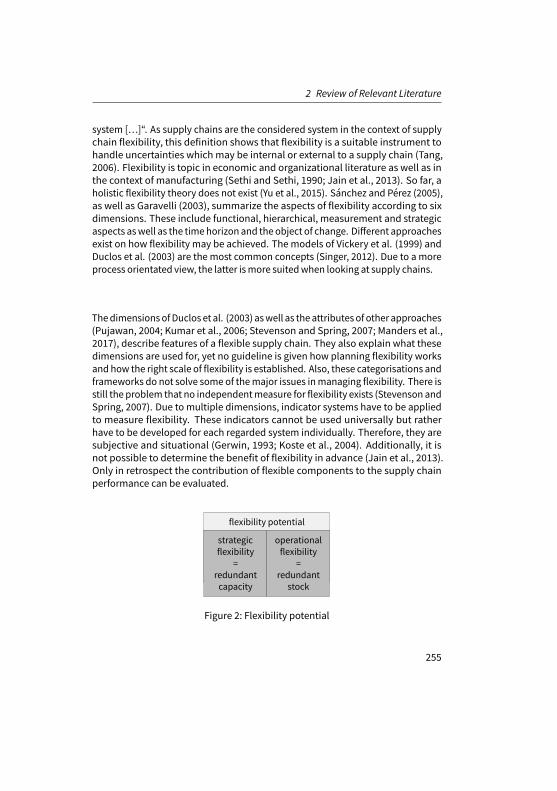
2 Review of Relevant Literature
system […]“. As supply chains are the considered system in the context of supplychain flexibility, this definition shows that flexibility is a suitable instrument tohandle uncertainties which may be internal or external to a supply chain (Tang,2006). Flexibility is topic in economic and organizational literature as well as inthe context of manufacturing (Sethi and Sethi, 1990; Jain et al., 2013). So far, aholistic flexibility theory does not exist (Yu et al., 2015). Sánchez and Pérez (2005),as well as Garavelli (2003), summarize the aspects of flexibility according to sixdimensions. These include functional, hierarchical, measurement and strategicaspects aswell as the timehorizon and the object of change. Different approachesexist on how flexibility may be achieved. The models of Vickery et al. (1999) andDuclos et al. (2003) are the most common concepts (Singer, 2012). Due to a moreprocess orientated view, the latter ismore suitedwhen looking at supply chains.
ThedimensionsofDuclos et al. (2003) aswell as theattributesof other approaches(Pujawan, 2004; Kumar et al., 2006; Stevenson and Spring, 2007; Manders et al.,2017), describe features of a flexible supply chain. They also explain what thesedimensions are used for, yet no guideline is given how planning flexibility worksand how the right scale of flexibility is established. Also, these categorisations andframeworks do not solve some of themajor issues inmanaging flexibility. There isstill the problem that no independentmeasure for flexibility exists (Stevenson andSpring, 2007). Due to multiple dimensions, indicator systems have to be appliedto measure flexibility. These indicators cannot be used universally but ratherhave to be developed for each regarded system individually. Therefore, they aresubjective and situational (Gerwin, 1993; Koste et al., 2004). Additionally, it isnot possible to determine the benefit of flexibility in advance (Jain et al., 2013).Only in retrospect the contribution of flexible components to the supply chainperformance can be evaluated.
flexibility potential
strategic
flexibility
=
redundant
capacity
operational
flexibility
=
redundant
stock
Figure 2: Flexibility potential
255

Adequate Flexibility Potential to handle Supply Chain Uncertainties
Planning flexibility on a strategic level means creating potential through addi-tional capacity in the regarded system. Thus, we describe it as capacity flexibility.It may be established by an additional production line, spare transportation vehi-cles or amultiple instead of a single sourcing concept. Alternative or additional tostrategic flexibility capabilities flexibility potential can also be created on the op-erational level. This operational flexibility is established through stock flexibility(Vickery et al., 1999; Wang, 2008). Thereby, a certain amount of inventory is holdon purpose to react to uncertainties. Safety stocks are an example of flexibilitycreated by inventory. Thus, flexibility potential can be created by capacity or stockpotential as shown in Figure 2. What kind of flexibility is more useful in a supplychain to handle uncertainties and where it should be established is considered inthe simulation study in section 3 and 4 of this paper.
256
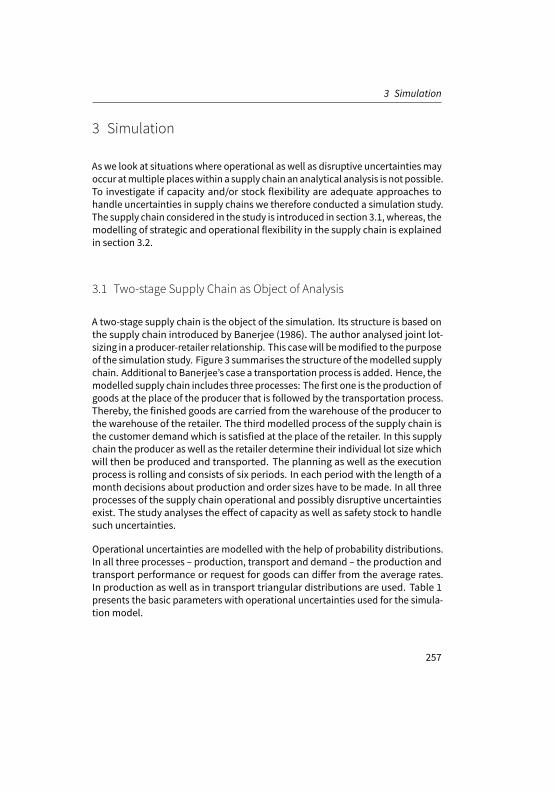
3 Simulation
3 Simulation
As we look at situations where operational as well as disruptive uncertaintiesmayoccur atmultiple placeswithin a supply chain ananalytical analysis is not possible.To investigate if capacity and/or stock flexibility are adequate approaches tohandle uncertainties in supply chains we therefore conducted a simulation study.The supply chain considered in the study is introduced in section 3.1, whereas, themodelling of strategic and operational flexibility in the supply chain is explainedin section 3.2.
3.1 Two-stage Supply Chain as Object of Analysis
A two-stage supply chain is the object of the simulation. Its structure is based onthe supply chain introduced by Banerjee (1986). The author analysed joint lot-sizing in a producer-retailer relationship. This casewill bemodified to the purposeof the simulation study. Figure 3 summarises the structure of themodelled supplychain. Additional to Banerjee’s case a transportation process is added. Hence, themodelled supply chain includes three processes: The first one is the production ofgoods at the place of the producer that is followed by the transportation process.Thereby, the finished goods are carried from the warehouse of the producer tothe warehouse of the retailer. The third modelled process of the supply chain isthe customer demand which is satisfied at the place of the retailer. In this supplychain the producer as well as the retailer determine their individual lot size whichwill then be produced and transported. The planning as well as the executionprocess is rolling and consists of six periods. In each period with the length of amonth decisions about production and order sizes have to bemade. In all threeprocesses of the supply chain operational and possibly disruptive uncertaintiesexist. The study analyses the effect of capacity as well as safety stock to handlesuch uncertainties.
Operational uncertainties are modelled with the help of probability distributions.In all three processes – production, transport and demand – the production andtransport performance or request for goods can differ from the average rates.In production as well as in transport triangular distributions are used. Table 1presents the basic parameters with operational uncertainties used for the simula-tion model.
257
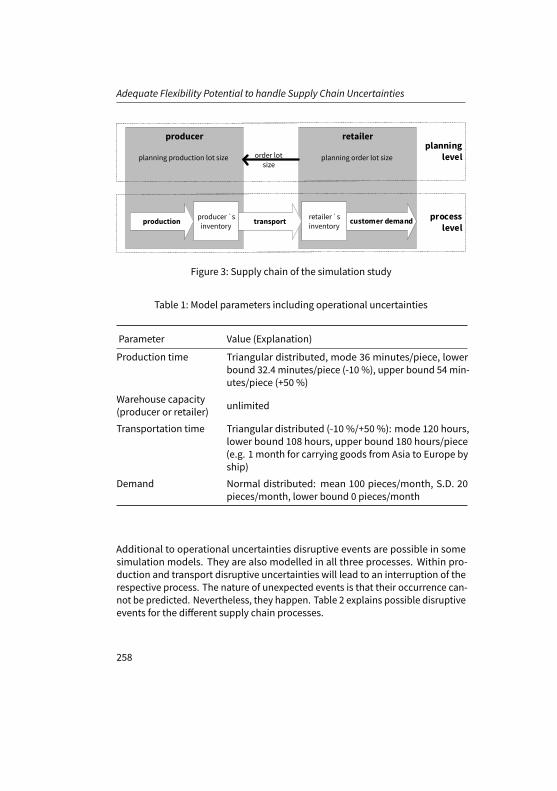
Adequate Flexibility Potential to handle Supply Chain Uncertainties
retailer
planning order lot size
producer
planning production lot size
transportproducer `s
inventory
retailer `s
inventoryproduction
order lot
size
Figure 3: Supply chain of the simulation study
Table 1: Model parameters including operational uncertainties
Parameter Value (Explanation)
Production time Triangular distributed, mode 36 minutes/piece, lowerbound 32.4 minutes/piece (-10 %), upper bound 54 min-utes/piece (+50 %)
Warehouse capacity(producer or retailer) unlimited
Transportation time Triangular distributed (-10 %/+50%): mode 120 hours,lower bound 108 hours, upper bound 180 hours/piece(e.g. 1 month for carrying goods from Asia to Europe byship)
Demand Normal distributed: mean 100 pieces/month, S.D. 20pieces/month, lower bound 0 pieces/month
Additional to operational uncertainties disruptive events are possible in somesimulation models. They are also modelled in all three processes. Within pro-duction and transport disruptive uncertainties will lead to an interruption of therespective process. The nature of unexpected events is that their occurrence can-not be predicted. Nevertheless, they happen. Table 2 explains possible disruptiveevents for the different supply chain processes.
258
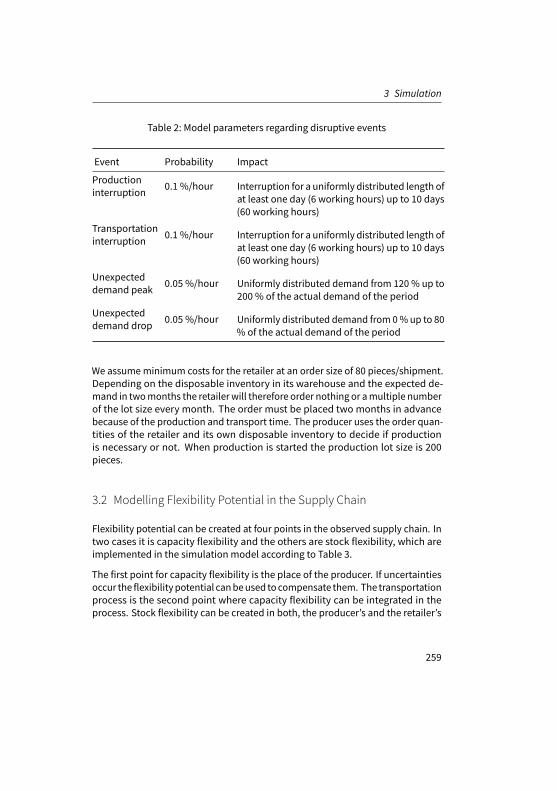
3 Simulation
Table 2: Model parameters regarding disruptive events
Event Probability Impact
Productioninterruption 0.1 %/hour Interruption for a uniformly distributed length of
at least one day (6 working hours) up to 10 days(60 working hours)
Transportationinterruption 0.1 %/hour Interruption for a uniformly distributed length of
at least one day (6 working hours) up to 10 days(60 working hours)
Unexpecteddemand peak 0.05 %/hour Uniformly distributed demand from 120 % up to
200 % of the actual demand of the periodUnexpecteddemand drop 0.05 %/hour Uniformly distributed demand from 0%up to 80
% of the actual demand of the period
We assumeminimum costs for the retailer at an order size of 80 pieces/shipment.Depending on the disposable inventory in its warehouse and the expected de-mand in twomonths the retailer will therefore order nothing or amultiple numberof the lot size every month. The order must be placed two months in advancebecause of the production and transport time. The producer uses the order quan-tities of the retailer and its own disposable inventory to decide if productionis necessary or not. When production is started the production lot size is 200pieces.
3.2 Modelling Flexibility Potential in the Supply Chain
Flexibility potential can be created at four points in the observed supply chain. Intwo cases it is capacity flexibility and the others are stock flexibility, which areimplemented in the simulation model according to Table 3.
The first point for capacity flexibility is the place of the producer. If uncertaintiesoccur the flexibilitypotential canbeused tocompensate them. The transportationprocess is the second point where capacity flexibility can be integrated in theprocess. Stock flexibility can be created in both, the producer’s and the retailer’s
259
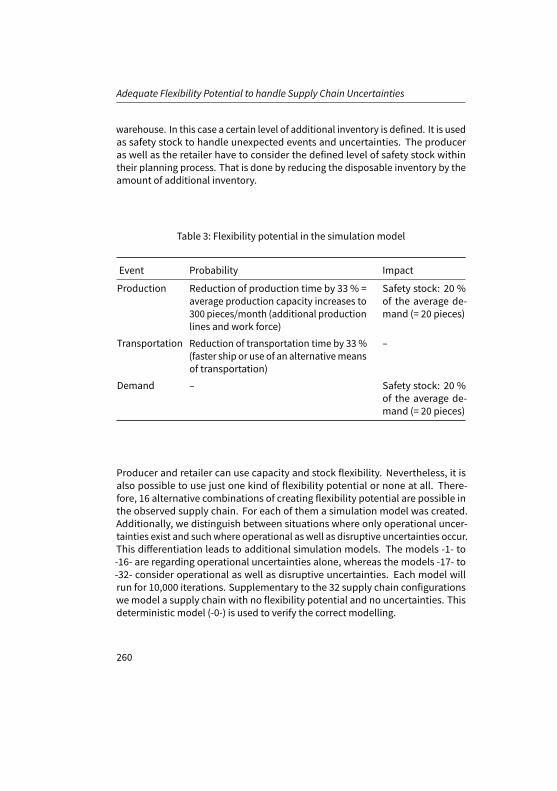
Adequate Flexibility Potential to handle Supply Chain Uncertainties
warehouse. In this case a certain level of additional inventory is defined. It is usedas safety stock to handle unexpected events and uncertainties. The produceras well as the retailer have to consider the defined level of safety stock withintheir planning process. That is done by reducing the disposable inventory by theamount of additional inventory.
Table 3: Flexibility potential in the simulation model
Event Probability Impact
Production Reduction of production time by 33% =average production capacity increases to300 pieces/month (additional productionlines and work force)
Safety stock: 20 %of the average de-mand (= 20 pieces)
Transportation Reduction of transportation time by 33 %(faster ship or use of an alternativemeansof transportation)
–
Demand – Safety stock: 20 %of the average de-mand (= 20 pieces)
Producer and retailer can use capacity and stock flexibility. Nevertheless, it isalso possible to use just one kind of flexibility potential or none at all. There-fore, 16 alternative combinations of creating flexibility potential are possible inthe observed supply chain. For each of them a simulation model was created.Additionally, we distinguish between situations where only operational uncer-tainties exist and suchwhere operational as well as disruptive uncertainties occur.This differentiation leads to additional simulation models. The models -1- to-16- are regarding operational uncertainties alone, whereas the models -17- to-32- consider operational as well as disruptive uncertainties. Each model willrun for 10,000 iterations. Supplementary to the 32 supply chain configurationswemodel a supply chain with no flexibility potential and no uncertainties. Thisdeterministic model (-0-) is used to verify the correct modelling.
260

4 Results and Findings
4 Results and Findings
To analyse what kind of flexibility is best to handle uncertainties in the regardedsupply chain and at which process it should be created a performance index isneeded. As the purpose of a supply chain is to match supply with customer de-mandwewill use hours with out-of-stock situations at the retailer as performanceindicator for the whole supply chain. The simulation calculates the performancewithin six periods which are 720working hours (6 hours per day). We use this timeas basis to calculate the service level. As the focus of the study is on the benefitand location of flexibility, we do not consider the costs of implementing flexibility(Tang and Tomlin, 2008).
Since there are no uncertainties in the deterministic model -0- the demand canalways be satisfied (service level = 100 %). Such a situation with no uncertaintiesis not possible in a real world supply chain.
Section 4.1 presents the performance of the supply chain with uncertainties. Theimplications of the results are explained in section 4.2.
4.1 Simulation Results
Figure 4 shows the performance of the supply chain with operational uncertain-ties (flexibility configurations -1- to -16-) The amount of hours with out-of-stocksituations given in Figure 4 is the mean of 10,000 iterations.
With a mean of 70 hours of out-of-stock situations, the performance of a supplychain with operational uncertainties and no flexibility at all (-13-) is the lowest.Thus, the service level is 90%. The highest service level of 97% can be achieved inthe models -7-, -8- as well as -11- and -12-. These configurations have in commonthat capacity flexibility in the transportation process and stock flexibility at theretailer exists. This is the first indication that the other forms of flexibility are notas important. Especially stock flexibility of 20 % at the producer has low benefitto handle uncertainties in the supply chain. The service level of model -14- whichsimulates a situation where only this kind of flexibility exists is just 1 % abovemodel -13- with no flexibility at all.
Comparing simulations with and without stock flexibility at the place of the pro-ducer but otherwise similar configurations (e.g. -1- with -2-, -3- with -4- or -15with -16-) confirms the small benefit of stock flexibility at the producer.
261
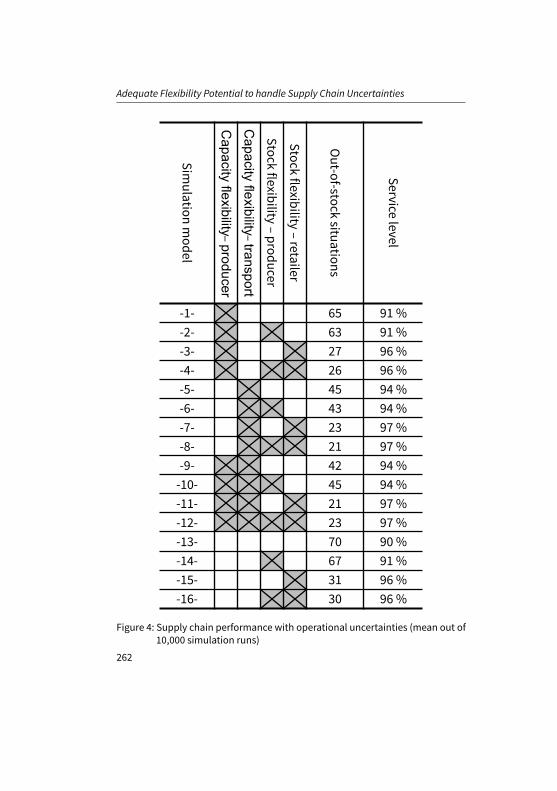
Adequate Flexibility Potential to handle Supply Chain Uncertainties
Sim
ula
tion
mo
de
l
Capacity flexibility–producer
Capacity
flexibility –transportS
tock
flexib
ility –
pro
du
cer
Sto
ck fle
xibility
–re
taile
r
Ou
t-of-sto
ck situ
atio
ns
Se
rvice
leve
l
-1- 65 91 %
-2- 63 91 %
-3- 27 96 %
-4- 26 96 %
-5- 45 94 %
-6- 43 94 %
-7- 23 97 %
-8- 21 97 %
-9- 42 94 %
-10- 45 94 %
-11- 21 97 %
-12- 23 97 %
-13- 70 90 %
-14- 67 91 %
-15- 31 96 %
-16- 30 96 %
Figure 4: Supply chain performance with operational uncertainties (mean out of10,000 simulation runs)
262
4 Results and Findings
The same can be said about capacity flexibility of the producer. Comparing themodels -2- with -14-, -4- with -16- or -6- with -10- the service levels are identical.These configurations only differ in the regard of capacity flexibility at the producer.In models that have this flexibility the amount of out-of-stock hours is lower.Therefore, it can be noted that capacity flexibility helps to handle uncertainties.However, thebenefit is equally small like theoneof stock flexibility at theproducer.In both cases the reduction of out-of-stock hours does not affect the service level.It only changes compared to a supply chain with no flexibility potential.
The kind of flexibility that increases supply chain performance the most is stockflexibility at the retailer. In this simulation model (-15-) a service level of 96 %can be achieved. That is just 1 % below the highest level of models that consideroperational uncertainties alone.
The results of the supply chainwith operational aswell as disruptive uncertaintiessimulated in the models -17- till -32- can be seen in table 4.2. Again, with oneexception the service level does not change when stock flexibility at the producerexists or not (e.g. comparing -17- with -18; -19- with -20- or -31- with -32-). Thisstatement also applies to the comparisonof a situationwith no flexibility potentialand stock flexibility at the producer alone. Overall, the analyses of situations withoperational and disruptive uncertainties together confirm the findings regardingstock flexibility at the producer that were made by analyzing service levels whenonly operational uncertainties exists. The results of table 4.2 also confirm that thecapacity flexibility in transport together with stock flexibility at the retailer leadto the highest service levels (95 % or 94 %). Regarding capacity flexibility at theproducer the results of table 4.2 differ from them in table 4.1. The performance ofmodels without this flexibility potential (e.g. -29- till -32-) is nearly as good as inmodels with capacity flexibility at the producer (-17- till -20-). Therefore, it canagain be noted that capacity flexibility at the producer does not play an importedrole by handling uncertainties.
263
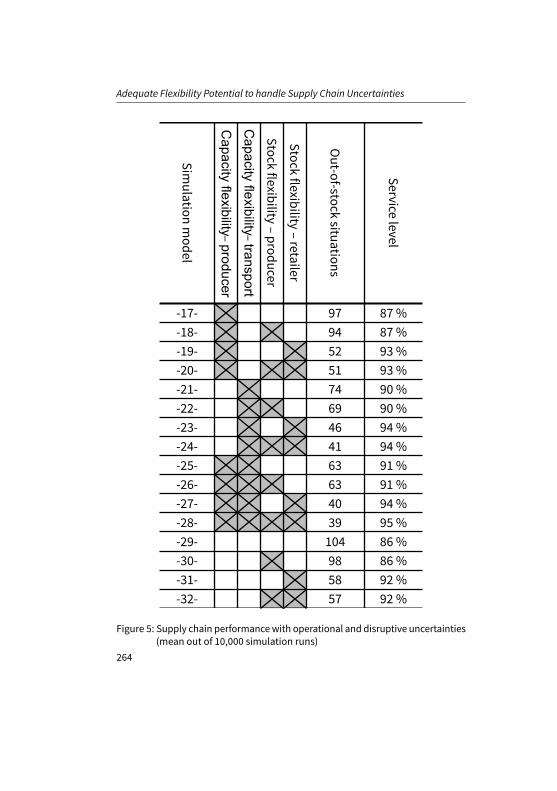
Adequate Flexibility Potential to handle Supply Chain Uncertainties
Sim
ula
tion
mo
de
l
Capacity flexibility–producer
Capacity
flexibility –transportS
tock
flexib
ility –
pro
du
cer
Sto
ck fle
xibility
–re
taile
r
Ou
t-of-sto
ck situ
atio
ns
Se
rvice
leve
l
-17- 97 87 %
-18- 94 87 %
-19- 52 93 %
-20- 51 93 %
-21- 74 90 %
-22- 69 90 %
-23- 46 94 %
-24- 41 94 %
-25- 63 91 %
-26- 63 91 %
-27- 40 94 %
-28- 39 95 %
-29- 104 86 %
-30- 98 86 %
-31- 58 92 %
-32- 57 92 %
Figure 5: Supply chain performancewith operational and disruptive uncertainties(mean out of 10,000 simulation runs)
264
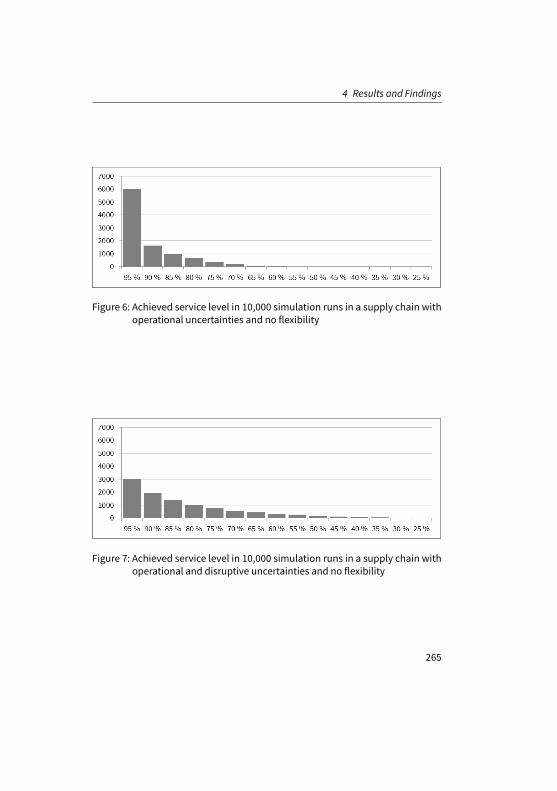
4 Results and Findings
Figure 6: Achieved service level in 10,000 simulation runs in a supply chain withoperational uncertainties and no flexibility
Figure 7: Achieved service level in 10,000 simulation runs in a supply chain withoperational and disruptive uncertainties and no flexibility
265
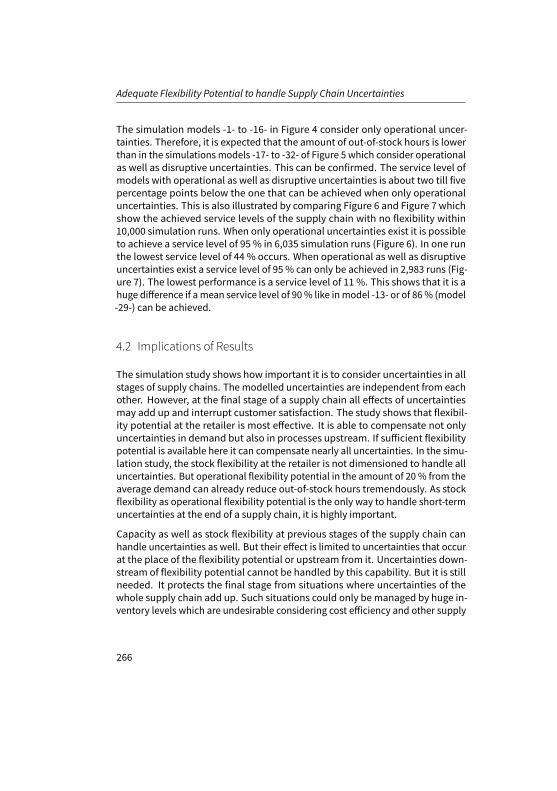
Adequate Flexibility Potential to handle Supply Chain Uncertainties
The simulation models -1- to -16- in Figure 4 consider only operational uncer-tainties. Therefore, it is expected that the amount of out-of-stock hours is lowerthan in the simulations models -17- to -32- of Figure 5 which consider operationalas well as disruptive uncertainties. This can be confirmed. The service level ofmodels with operational as well as disruptive uncertainties is about two till fivepercentage points below the one that can be achieved when only operationaluncertainties. This is also illustrated by comparing Figure 6 and Figure 7 whichshow the achieved service levels of the supply chain with no flexibility within10,000 simulation runs. When only operational uncertainties exist it is possibleto achieve a service level of 95 % in 6,035 simulation runs (Figure 6). In one runthe lowest service level of 44 % occurs. When operational as well as disruptiveuncertainties exist a service level of 95 % can only be achieved in 2,983 runs (Fig-ure 7). The lowest performance is a service level of 11 %. This shows that it is ahuge difference if amean service level of 90% like inmodel -13- or of 86% (model-29-) can be achieved.
4.2 Implications of Results
The simulation study shows how important it is to consider uncertainties in allstages of supply chains. The modelled uncertainties are independent from eachother. However, at the final stage of a supply chain all effects of uncertaintiesmay add up and interrupt customer satisfaction. The study shows that flexibil-ity potential at the retailer is most effective. It is able to compensate not onlyuncertainties in demand but also in processes upstream. If sufficient flexibilitypotential is available here it can compensate nearly all uncertainties. In the simu-lation study, the stock flexibility at the retailer is not dimensioned to handle alluncertainties. But operational flexibility potential in the amount of 20 % from theaverage demand can already reduce out-of-stock hours tremendously. As stockflexibility as operational flexibility potential is the only way to handle short-termuncertainties at the end of a supply chain, it is highly important.
Capacity as well as stock flexibility at previous stages of the supply chain canhandle uncertainties as well. But their effect is limited to uncertainties that occurat the place of the flexibility potential or upstream from it. Uncertainties down-stream of flexibility potential cannot be handled by this capability. But it is stillneeded. It protects the final stage from situations where uncertainties of thewhole supply chain add up. Such situations could only bemanaged by huge in-ventory levels which are undesirable considering cost efficiency and other supply
266
5 Conclusions
chain objectives. However, medium levels are not able to handle situationswhereeffects of different sources of uncertainties add up.
It canbenoted that every kindof flexibility helps in handling uncertainties andwillincrease supply chain performance (Sánchez and Pérez, 2005). That is confirmedby the study. A small degree of flexibility can increase performance enormouswhen it is located at the right place. As Garavelli (2003) as well as Graves andTomlin (2003) already pointed out it is not necessary to build total flexibility intoa system. Crucial in handling uncertainties is stock flexibility (Tsay and Lovejoy,1999). It is available immediately and has its biggest impact when located at theend of a supply chain. The respective models of the simulation study have thehighest service levels.
5 Conclusions
This paper presented insights into handling uncertainties in supply chains withthe help of flexibility. It regarded the effects of existing uncertainties. To overcomethem a supply chain needs flexibility potential which has to be created proactive.As the study shows, the location of flexibility within the supply chain is key forits ability to handle uncertainties. The further down in the supply chain the po-tential is located the more effective it is in compensating uncertainties that occursomewhere in the value creation process. Nevertheless, flexibility only in the laststage of a supply chain is not sufficient to achieve the best performance regardingthe matching of supply and customer demand. As uncertainties cumulate duringthe processes of value creation they may be toomuch to be handled at just onepoint in the supply chain. Therefore, flexibility potential should be established atthe end of the supply chain but also at other critical processes.
Our study has a number of limitations. While the results of the simulation fit intoexisting literature on flexibility in supply chains the findings are limited to theobserved two-stage supply chain. Analyses of different supply chain structurescould validate and generalise our findings. Furthermore, strategic as well as op-erational flexibility is modelled by a certain amount of redundant capacity andadditional stock. Different levels of flexibilitywere not considered. Howvariationsin the level of flexibility potential influences the ability of handling uncertaintiestherefore still have to be studied. As investments in additional capacity are proba-bly more expensive then into stock flexibility cost considerations may be anotherpoint of further research.
267
Adequate Flexibility Potential to handle Supply Chain Uncertainties
If management faces the challenge of handling uncertainties it therefore shouldfirst of all define levels of safety stock near the end customer. To a certain degreethey have to abandon the lean thinking approach. After defining a base level ofstock flexibility the supply chain has to be analysed to identify critical processes.At these processes, additional flexibility potential should be created. This can becapacity and/or stock flexibility. These steps have to be integrated not only in themanagement process of the individual institutions within the supply chain butalso in the process of coordination and collaboration between institutions. Byintegrating considerations about flexibility into cross-institutional supply chainmanagement the full benefit of flexibility potential can only be utilised.
References
Banerjee, A. (1986). “A Joint Economic-Lot-Size Model for Purchaser and Vendor”. In: DecisionScience 17.3, pp. 292–311.
Cabral, I., A. Grilo, and V. Cruz-Machado (2012). “A decision-makingmodel for Lean, Agile, Resilientand Green supply chain management”. In: International Journal of Production Research 50.17,pp. 4830–4845.
Chopra S.; Sodhi, M. S. (2004). “Managing Risk to Avoid Supply-Chain Breakdown”. In:MIT SloanManagement Review 46.1, pp. 53–61.
Christopher M.; Peck, H. (2004). “Building the Resilient Supply Chain”. In: The International Journalof Logistics Management 15.2, pp. 1–14.
Craighead, C. W., J. Blackhurst, M. J. Rungtusanatham, and R. B. Handfield (2007). “The Severityof Supply Chain Disruptions: Design Characteristics and Mitigation Capabilities”. In: DecisionSciences 38.1, pp. 131–156.
Duclos, L. K., R. J. Vokurka, and R. R. Lummus (2003). “A conceptual model of supply chain flexibil-ity”. In: Industrial Management & Data Systems 103.6, pp. 446–456.
Garavelli, A. C. (2003). “Flexibility configurations for the supply chain management”. In: Interna-tional Journal of Production Economics 85.2, pp. 141–153.
Gerwin, D. (1993). “Manufacturing flexibility: a strategic perspective”. In: Management Science39.4, pp. 395–410.
Graves, S. C. and B. T. Tomlin (2003). “Process Flexibility in Supply Chains”. In:Management Science49.7, pp. 907–919.
Gupty, Y. P. and S. Goyal (1989). “Flexibility of manufacturing systems: Concepts and measure-ments”. In: European Journal of Operational Research 43.2, pp. 119–135.
Jain, A., P. K. Jain, T. S. Chan, and S. Singh (2013). “A review on manufacturing flexibility”. In:International Journal of Production Research 51.19, pp. 5946–5970.
Jüttner, U. (2005). “Supply chain risk management – understanding the business requirementsfrom a practitioner perspective”. In: The International Journal of Logistics Management 16.1,pp. 120–141.
Klibi, W., A. Martel, and A. Guitouni (2010). “The design of robust value-creating supply chainnetworks: A critical review”. In: European Journal of Operational Research 203.2, pp. 283–293.
268
REFERENCES
Knight, F. H. (1971). Risk, Uncertainty and Profit. London: The University of Chicago Press.Koste, L. L., M. J. Malhotra, and S. Sharma (2004). “Measuring dimensions of manufacturing
flexibility”. In: Journal of Operations Management 22.2, pp. 171–196.Kumar, V., K. A. Fantazy, U. Kumar, and T. A. Boyle (2006). “Implementation and management
framework for supply chain flexibility”. In: Journal of Enterprise Information Management 19.3,pp. 303–319.
Lummus, R. R., L. K. Duclos, and R. J. Vokurka (2003). “Supply Chain Flexibility: Building a NewModel”. In: Global Journal of Flexible Systems Management 4.4, pp. 1–13.
Manders, J. H. M., M. C. J. Caniels, and P. Ghijsen (2017). “Supply chain flexibility: A systematicliterature review and identification of directions for future research”. In: The InternationalJournal of Logistics Management 28.4, pp. 964–1026.
Meixell, J. M. and V. B. Gargeya (2005). “Global supply chain design: A literature reviewand critique”.In: Transportation Research Part E: Logistics and Transportation Review 41.6, pp. 531–550.
Merschmann, U. and U. W. Thonemann (2011). “Supply chain flexibility, uncertainty and firmperformance: An empirical analysis of Germanmanufacturing firms”. In: International Journalof Production Economics 130.1, pp. 43–53.
Milliken, F. J. (1987). “Three Types of Perceived Uncertainty about the Environment: State, Effectand Response Uncertainty”. In: Academy of Management Review 12.1, pp. 133–143.
Naylor, J. B., M. M. Naim, and D. Berry (1999). “Leagility: Integrating the lean and agile manufac-turing paradigms in the total supply chain”. In: International Journal of Production Economics62.1, pp. 107–118.
Papadakis, I. S. and W. T. Ziemba (2001). “Derivative Effects of the 1999 Earthquake to US PersonalComputer Manufactures in Mitigation and Financing of Seismic Risks”. In: Mitigation and Fi-nancing of Seismic Risks: Turkish and International Perspectives. Ed. by P. R. Kleindorfer andM. R. Sertel. Dordrecht: Springer, pp. 261–276.
Peck, H. (2005). “Drivers of supply chain vulnerability: an integrated framework”. In: InternationalJournal of Physical Distribution and Logistics Management 35.4, pp. 210–232.
Peck, H. (2006). “Reconciling supply chain vulnerability, risk and supply chain management”. In:International Journal of Logistics: Research and Application 9.2, pp. 127–142.
Prater, E., M. Biehl, and M. A. Smith (2001). “International supply chain agility – Tradeoffs betweenflexibility and uncertainty”. In: International Journal of Operations & Production Management21.5/6, pp. 823–839.
Pujawan, I. N. (2004). “Assessing supply chain flexibility: a conceptual framework and case study”.In: International Journal of Integrated Supply Management 1.1, pp. 79–97.
Sánchez, A. M. and M. P. Pérez (2005). “Supply chain flexibility and firm performance”. In: Interna-tional Journal of Operations & Production Management 25.7, pp. 681–700.
Sethi, A. K. and S. P. Sethi (1990). “Flexibility in manufacturing: A Survey”. In: The InternationalJournal of Flexible Manufacturing Systems 2.4, pp. 289–328.
Simangunsong, E., L. C. Hendry, andM. Stevenson (2012). “Supply-chain uncertainty: a review andtheoretical foundation for future research”. In: International Journal of Production Research50.16, pp. 4493–4523.
Singer, C. (2012). Flexibilitätsmanagement zur Bewältigung von Unsicherheiten in der Supply Chain.Köln: Eulverlag.
Slack, N. (1983). “Flexibility as a manufacturing objective”. In: International Journal of ProductionManagement 3.3, pp. 4–13.
Sodhi, M. S. and C. S. Tang (2012).Managing Supply Chain Risk. New York: Springer.
269
Adequate Flexibility Potential to handle Supply Chain Uncertainties
Stevenson, M. and M. Spring (2007). “Flexibility form a supply chain perspective: definition andreview”. In: International Journal of Operations & Production Management 27.7, pp. 685–713.
Tang, C. S. (2006). “Robust strategies for mitigation supply chain disruptions”. In: InternationalJournal of Logistics: Research and Applications 9.1, pp. 33–45.
Tang, C. and B. Tomlin (2008). “The power of flexibility for mitigating supply chain risks”. In:International Journal of Production Economics 116.1, pp. 12–27.
Tang, C. and B. Tomlin (2009). “How Much Flexibility Does It Take to Mitigate Supply Chain Risks?”In: Supply Chain Risk – A Handbook of Assessment, Management and Performance. Ed. by G. A.Zsidisin and B. Ritchie. New York: Springer, pp. 155–174.
Tiwari, A. K., A. Tiwari, and C. Samuel (2015). “Supply chain flexibility: a comprehensive review”.In:Management Research Review 38.7, pp. 767–792.
Tsay, A. A. andW. S. Lovejoy (1999). “Quantity Flexibility Contracts and Supply Chain Performance”.In:Manufacturing & Service Operations Management 1.2, pp. 89–111.
Upton, D. M. (1994). “The Management of Manufacturing Flexibility”. In: California ManagementReview 36.2, pp. 72–89.
Vickery, S., R. Calantone, and C. Dröge (1999). “Supply Chain Flexibility: An Empirical Study”. In:The Journal of Supply Chain Management 35.2, pp. 16–24.
Wang, Y.-C. (2008). “Evaluating flexibility on order quantity and delivery lead time for a supplychain system”. In: International Journal of Systems Science 39.12, pp. 1193–1202.
Yu, K., J. Cadeaux, and B. N. Luo (2015). “Operational flexibility: Review andmeta-analysis”. In:International Journal of Production Economics 169, pp. 190–202.
Zitzmann, I. (2014). “How to Cope with Uncertainty in Supply Chains? – Conceptual Frameworkfor Agility, Robustness, Resilience, Continuity and Anti-Fragility in Supply Chains”. In: NextGeneration Supply Chains. Ed. by T.W. KerstenBlecker andC.M. Ringle. Berlin: Springer, pp. 361–378.
Zitzmann, I. (2016). “RoRA-SCM– Integrating flexibility in the planning process to handle uncertain-ties”. In: Logistics Management – Contributions of the Section Logistics of the German AcademicAssociation for Business Research, 2015, Braunschweig, Germany. Ed. by T. B. J. D. MattfeldSpengler and M. Grunewald. Heidelberg: Springer, pp. 51–62.
270
Remote Sensing in HumanitarianLogistics: An Integrative Approach
Christian Hein1, Henning Hünemohr2, Rainer Lasch1
1 – TU Dresden
2 – Lilienthal Digitaler-Weinbau GmbH
Remote sensing is becoming increasingly important for the acquisition of informa-tion in humanitarian logistics. While different platforms (e.g. satellites, drones)with their own characteristics and advantages exist, the literature often refers tojust one of them. This paper aims at integrating platforms,making full use of theirspecific advantages. The work is conceptual, comparing different remote sensingplatforms according to their advantages and limitations as well as evaluatingthe potentials of their combination drawing on both academic and practitionerliterature. Moreover, drone test flights (hexacopter) demonstrate the practicalimplementation of data acquisition, processing, as well as their integration. Theresults show that the combination of data gathered via different remote sensingplatforms is highly beneficial for the management of humanitarian logistics interms of quality, time, flexibility, and cost. Furthermore, the feasibility has beendemonstrated by the drone experiment and the respective data processing andintegration. To the best of our knowledge, this is the first work systematicallyexamining the integration of data acquired via different remote sensing platformsconsidering their specific advantages and the area of application in the contextof humanitarian logistics as well as demonstrating the feasibility through the useof an experimental drone flight. The results discussed represent the first step inthe use of combined remote sensing data in humanitarian logistics; specific appli-cations should be examinedmore in detail. Furthermore, challenges in the useof such data have to be overcome, such as their integration into the informationmanagement processes of humanitarian actors.
Keywords: Humanitarian Logistics; Humanitarian Operations; Remote Sensing;Drones
First recieved: 28.May.2018 Revised: 21.Jun.2018 Accepted: 08.Jul.2018
271
Remote Sensing in Humanitarian Logistics: An Integrative Approach
1 Introduction
Natural and human-made disasters have unfortunately become almost common-place. Even though some of these tragediesmight be preventable, the occurrenceof others cannot be influenced. Extensivemultifaceted responses are coordinatedby the international community, represented by numerous of humanitarian or-ganizations or agencies, in order to alleviate the suffering of those affected. Inthis context, logistics plays a crucial role (Kovács and Spens, 2011). Informationis increasingly recognized as a key factor of successful humanitarian operations(Altay & Pal, 2014; Kim et al., 2012), whereas, at the same time, information man-agement is recognized as underresearched (Gupta et al., 2016). Concerning therapid acquisition of profound data, remote sensing technologies are of risingimportance. Different platforms are applicable, such as satellites, aircrafts, anddrones, to gather remote sensing data. Previous work consider only one of theseremote sensing platforms (Delmonteil and Rancourt, 2017; Tatham et al., 2017).As each platform inheres specific advantages and limitations, this paper aims tocombine them. Therefore, the different remote sensing platforms will be exam-ined and compared comprehensively in order to answer the following researchquestions: Which are the specific advantages and limitations of different remotesensing platforms in the context humanitarian logistics and are there potentialsof combining data from these platforms? And how can such an integrative ap-proach be realized practically by utilizing drones? The remainder of this work isorganized as follows: After introducing humanitarian logistics and remote sensingin the second section, a systematic overview of the potential humanitarian usesof remote sensing technology is given by not distinguishing between the differentplatforms. In section three, the different platforms are compared according totheir advantages and limitations and the potentials of integration are examined.Following, the experimental drone flight is described concerning themethodol-ogy, the technical realization, as well as the results in section four. Finally, theconclusion and an outlook are provided.
1.1 Humanitarian Logistics
Although logistics has always been involved in relief operations, its appearance inpractice and academic literature was very limited before the beginning of the 21stcentury (Kovács and Spens, 2011). This recognition seems overdue since logisticsplays a particularly important role in humanitarian operations, as it influences
272
1 Introduction
their effectiveness significantly and determines the speed, the coverage, and thecosts of humanitarian organizations (Baumgarten, 2011). Although commercialand humanitarian logistics are closely related, there are significant differenceswhich characterize the humanitarian relief work environment and pose specificchallenges. Nevertheless, humanitarian logistics definitions resemble those oflogistics in general. Thomas and Kopczak (2005) specify humanitarian logistics as‘the process of planning, implementing and controlling the efficient, cost-effectiveflow and storage of goods and materials, as well as related information, fromthe point of origin to the point of consumption for the purpose of alleviatingthe suffering of vulnerable people’. In contrast to commercial logistics, atten-tion here is placed on the reduction of people’s suffering. Humanitarian logisticsincludes a wide range of activities and processes such as preparedness, procure-ment, transport, warehousing, and training (Schwarz, 2012). In order to visualizerelief chain management and humanitarian logistics tasks and to contribute astandardization of terms, definitions, and activities, Blecken (2009) developeda reference task model. He describes the two dimensions of hierarchical andstructural decomposition (Figure 1). Within the dimension of the structural de-composition it is distinguished between assessment, procurement, warehousingand transport activities. Assessment is required to identify the affected people orthe community needs; procurement tasks ensure the availability of all requiredmaterial resources. Warehousing tasks are related to the storage and the trans-shipment of supplies; transportation includes all distribution activities. Finally,vertical and horizontal cross-section functions accompany these tasks. In disastermanagement, there is often a distinction between different phases. While diverseapproaches exist, the cyclic classification into the phases mitigation, prepared-ness, response, and recovery has become commonplace (OCHA, 2013). The firsttwo phases relate to the pre-disaster and the others to the post-disaster phase.The activities cannot be modeled strictly in sequence, as they might vary, repeat,or overlap according to the disaster scenario.
273
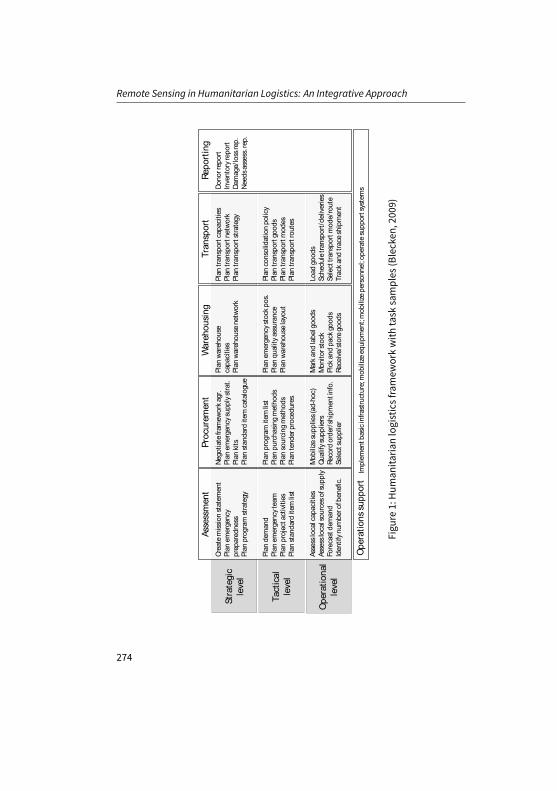
Remote Sensing in Humanitarian Logistics: An Integrative Approach
Asse
ssm
ent
Proc
urem
ent
War
ehou
sing
Tran
spor
tRe
port
ing
Oper
atio
ns su
ppor
t
n
Stra
tegi
c
leve
l
Tact
ical
leve
l
Oper
atio
nal
le
vel
Crea
te m
issio
n st
atem
ent
Plan
em
erge
ncy
prep
ared
ness
Plan
pro
gram
stra
tegy
Plan
dem
and
Plan
em
erge
ncy t
eam
Plan
pro
ject
activ
ities
Plan
stan
dard
item
list
Asse
ss lo
cal c
apac
ities
Asse
ss lo
cal s
ourc
es o
f sup
ply
Fore
cast
dem
and
Iden
tify n
umbe
r of b
enef
ic.
Nego
tiate
fram
ewor
k agr
.Pl
an e
mer
genc
y sup
ply s
trat.
Plan
kits
Plan
stan
dard
item
cata
logu
e
Plan
pro
gram
item
list
Plan
pur
chas
ing m
etho
dsPl
an so
urci
ng m
etho
dsPl
an te
nder
pro
cedu
res
Mob
ilize
supp
lies (
ad-h
oc)
Qual
ify su
pplie
rsRe
cord
ord
er/s
hipm
ent i
nfo.
Sele
ct su
pplie
r
Plan
war
ehou
se
capa
citie
sPl
an w
areh
ouse
net
wor
k
Plan
cons
olid
atio
n po
licy
Plan
tran
spor
t goo
dsPl
an tr
ansp
ort m
odes
Plan
tran
spor
t rou
tes
Plan
em
erge
ncy s
tock
pos
.Pl
an q
ualit
y ass
uran
cePl
an w
areh
ouse
layo
ut
Mar
k and
labe
l goo
dsM
onito
r sto
ckPi
ck a
nd p
ack g
oods
Rece
ive/s
tore
good
s
Plan
tran
spor
t cap
aciti
esPl
an tr
ansp
ort n
etw
ork
Plan
tran
spor
t stra
tegy
Load
good
sSc
hedu
le tr
ansp
ort/d
elive
ries
Sele
ct tr
ansp
ort m
ode/
rout
eTr
ack a
nd tr
ace s
hipm
ent
Dono
r rep
ort
Inve
ntor
y rep
ort
Dam
age/
loss
rep.
Need
s ass
ess.
rep.
Impl
emen
t bas
ic in
frast
ruct
ure;
mob
ilize
equi
pmen
t; m
obili
ze p
erso
nnel
; ope
rate
supp
ort s
yste
ms
Figu
re1:Hum
anita
rianlogisticsframew
orkwith
task
samples
(Blecken
,200
9)
274
1 Introduction
1.2 Remote Sensing
Remote sensing involves the contactless and areal extensive exploration of theearth´s surface (Heipke, 2017). Chen et al. (2016) define this as ”the scienceand technology of capturing, processing and analyzing imagery […] of the earth[…], from sensors in space, in the air and on the ground”. Further terms arecommonly utilized: Photogrammetry, which describes the part of remote sensingfocusing mainly on analysis (Toth and Jutzi, 2017), and earth observation, oftenused interchangeably with remote sensing, but in a more comprehensive way(McInerney and Kempeneers, 2015).
A key component of remote sensing systems are the sensors. They are determinedby their spatial, temporal, and spectral resolution. Passive sensors record thevisible environment - such as photo cameras - and can represent different spectralbandwidths. Active sensors - mainly LiDAR (Light Detection and Ranging) andRadar (Radio Detection and Ranging) - are less determined by visual contact, asthey send electromagnetic waves, which they receive in turn. Hence, they areapplicable in cloudy environments or even at night (Toth and Jutzi, 2017). Remotesensing sensors are installed on so called platforms, which can be divided intosatellite-based, airborne, and drones. Furthermore, there also exist terrestrial(mobile and static) platforms (Toth and Jutzi, 2017). Satellites are very commonin remote sensing. Today, approximately 50 countries operate earth observationsatellites, which can differ in their constellation, sensor type, resolution, stripwidth, their altitude, and their orbit. Airborne platforms have been deployedfor quite some time, exclusively in remote sensing. Most common are aircraftsand helicopters. Drones represent a relatively new form of platform. Here, thereare a number of terms which can be identified: Often used are also the termsunmanned aircraft systems (UAS), remotely piloted aircraft system (RPAS) andunmanned aerial vehicle (UAV) (Heipke, 2017). The range of drones is very diverse,including micro very light weight (under 1 kg) drones, having only a short rangeand altitude, up to drones with the size and capabilities of conventional aircraft.Hence, there is no commonly accepted classification as of yet. Griffin (2014)distinguishes four types of drones: Fixed wing, rotary wing, multi-rotary wing,and airships. In summary, a wide range of technological solutions exists whichcan be applied in humanitarian context.
275
Remote Sensing in Humanitarian Logistics: An Integrative Approach
2 Humanitarian Uses of Remote Sensing
The area of application for remote sensing in humanitarian operations ismanifoldand will be outlined systematically in this section. As stated above, there exists avariety of different platforms for remote sensing. It should be mentioned that allthese platforms are also characterized bymultiple uses, as they can be utilizedin areas other than remote sensing as well. Satellites, for example, enable thefunctionality of positioning technologies, such as portable GPS devices or vehicletracking systems. Further, telecommunication satellites often provide the onlyreliable form of communication in certain disaster situations (Delmonteil andRancourt, 2017). Aircrafts and helicopters are mainly used for tasks other thanremote sensing, primarily for transportation and evacuation services in disastersscenes. The application of drones is relatively new in humanitarian operations.In addition to their application in remote sensing, they can be used for communi-cation support as well as (small) package delivery (Soesilo and Sandvik, 2016).All these other applications are of course of high importance for humanitarianoperations and particularly in humanitarian logistics. However, as this articleconcentrates on remote sensing, in the following possible humanitarian uses ofthis specific technology will be examined.
A uniform systematization of remote sensing applications in humanitarian opera-tions does not yet exist. Terms such as assessment, mapping, or monitoring areused inconsistently andoftenwithout anydefinition. For the followingdescriptionof humanitarian uses, the relevant terminology will be outlined briefly. One of themost common applications of remote sensing can be seen in the field of assess-ments. Aerial images and the resulting maps are used to evaluate the (potential)extent of disasters and to determine the scope of the required help. Assessmentsare regularly performed in the context of humanitarian operations. Risk and vul-nerability assessments pertain to the pre-disaster phase and aim to detect theexposure to hazards and to determine the vulnerability of people regarding theidentified risks (Bündnis Entwicklung Hilft, 2017). Needs assessments are mainlyperformed after the onset of disasters and have an enormous importance in in-ternational relief operations. They should make clear whether an intervention isneeded and how to best being performed. Further, needs assessments can beuseful for the determination of demand regarding relief commodities. However,the main aim of assessments is to understand the situation and to identify theproblems, their sources, as well as their consequences (ICRC and IFRC, 2008). Viadata acquired and processed by remote sensing, adjustments can be made tothese assessment processes. In the context of this work, the term assessment
276
2 Humanitarian Uses of Remote Sensing
will be understood as an umbrella term for all activities related to these tasks. Inorder to specify assessments more in detail, the termmapping will be used if theconcerning activities relate to remotely acquired and accordingly processed mapmaterial. The detection of changes by comparing data over a period of time willcorrespond to the termmonitoring. Finally, the use of remote sensing materialfor management and illustration purposes will relate to the term visualization.As remote sensing techniques can be applied across all disaster managementphases, a respective differentiation is helpful.
2.1 Assessment
Concerning the published works, assessments are the largest and also mostdiverse area of application for remote sensing in humanitarian operations. Intheir simplest form, remotely acquired images or videos can be used to get anoverview of disaster scenes and to estimate the extent of a disaster (Tatham et al.,2017). Immediately after the onset of a disaster, remote sensing can be appliedparticularly in search and rescue activities. Special sensors are often requiredfor these operations. However, for deeper analysis, further processing steps arenecessary, such as creating maps or time series material.
2.1.1 Mapping
Cartographic representation and the related processing of thismaterial can be uti-lized inmanifold ways across the different phases of disastermanagement. In thepre-disaster phase, the main objective is to detect hazards, determine risks, andfinally to develop disaster response plans. Hence, remote sensing supports boththemitigation and preparedness phase. Floodmanagement can be supportedby remotely acquired mapmaterial in order to detect potential breaches in dikesystems or to identify flooding areas (Sharma et al., 2017). Sambah and Miura(2014) propose a tsunami vulnerability assessment by utilizing satellite imagesand processed digital elevationmodels (DEM). Further, for forest fire susceptibilityand risk mapping, remote sensing has been proposed (Pradhan et al., 2007).
In post-disaster scenarios, remote sensing ismostly applied in the response phaseimmediately after the disaster’s onset. Rapid post-disaster assessments are ap-plicable in the management of the aftermaths of various disaster types, such asearthquakes, floods, storms, and fire as well as in the case of man-made disasters
277
Remote Sensing in Humanitarian Logistics: An Integrative Approach
(Griffin, 2014). Automated building damage assessments using remotely acquireddata are proposed by different authors, e.g. Dinesh el al. (2013) for a tsunami caseor Kakooei and Baleghi (2017) for earthquake and hurricane cases. Concerninglogistics activities, the assessment of infrastructure can be beneficial, e.g. forroute planning. Wang, J. et al. (2015) propose a road damage assessment by usinghigh resolution remote sensing images. Also the identification of best locationsfor facilities can be supported bymapping activities. A further application is theestimation of displaced populations (Wang, S. et al., 2015). In the recovery phase,post-disaster restoration and reconstruction assessments are suggested (Adamsand Friedland, 2011).
2.1.2 Monitoring
While the above mentioned mapping applications of remote sensing relate tothe situation analysis at one specific time, monitoring activities are performedcontinuously over a longer period, comparing different stages. In the pre-disasterphase, a typical application can be found in food security management, monitor-ing agriculture assets andwarning in the case of critical developments (Enenkel etal., 2015). Generally, warning is a highly beneficial field of application for remotesensing (Strunz et al., 2017); it might be particularly suitable for some specificdisaster types with a certain lead time or specific indicators, such as tsunamis,hurricanes, or floods. In the post-disaster phase, dynamic disaster events arecritical for monitoring activities. Multitemporal satellite images can be used forthe watershed and floodmonitoring (Rau et al., 2007). In relation to a longer timehorizon, Guo et al. (2010) propose amethod formonitoring the damage reductionand reconstruction after the Wenchuan earthquake via satellite imagery.
2.2 Visualization
In contrast to the above stated areas of applications, remote sensing material canalso be used in order to support generalmanagement processes. On this occasion,the visual presentation of cartographic material is used for the development ofemergency plans or for communication aspects (Voigt et al., 2007). Providing neartime information after the onset of a disaster supports the collaboration effortsof the different humanitarian organizations (Strunz et al., 2017). These activitiescan be performed in both pre-disaster and post-disaster phase.
278
3 Comparison of Platforms
3 Comparison of Platforms
Following the systematic description of the manifold uses of remote sensing inhumanitarian operations and logistics, this section aims to compare the differentplatforms and describe advantages and disadvantages in order to subsequentlydiscuss the potentials of their integration.
3.1 Advantages and Limitations
The comparison of the different remote sensing platforms is to be executed keep-ing various aspects in mind. A complete list of these criteria can be found inTable 1. Even though the spatial resolution of satellite images has increased inrecent years, their maximum is with 30 cm (for some specific satellite sensors) stilllower than those of airborne and drone platforms, whose resolution can be up to1 cm; also the spatial accuracy of geo-positions in the acquired data is higher forthe latter (Toth and Jutzi, 2017). Furthermore, airborne and drone platforms pro-vide the opportunity to acquire oblique images for more specific processing andanalysis methods. Moreover, drones can be applied for ad hoc, quick responseassessments with live broadcasts in a 360° angle and their susceptibility to cloudyweather situations is lower (Kakooei and Baleghi, 2017; Toth and Jutzi, 2017). Thehigher spatial resolution and accuracy of airborne and drone platforms resultfrom the fact that their flying altitude is significantly lower, particularly those ofsmall drones. As one would expect, the observed space and the resulting surfacecoverage is substantially lower as well (Toth and Jutzi, 2017). Here, satellitesmake use of their inherent advantages. Contrarily, satellites are restricted by theirpredefined orbit and speed, which consequently limits their repetition rate andtheir preparation time compared to other platforms. The periodic flight path ofsatellites might be a disadvantage regarding their flexibility; however, it enablesthe availability of pre-disaster images, which is beneficial for comparison reasonsand necessary for specific map analysis methods. Advantages of drones arisefrom their high flexibility; they are rapidly deployable and their application can beadjusted to the operations’ requirements easily (Kakooei and Baleghi, 2017). Boc-cardo et al. (2015) note that drones are only rapidly deployed if they are alreadyon site. Otherwise, the transportation to the disaster scene can restrict their shortpreparation time. Furthermore, the complexity of use as well as the operationalrisk is lower for drones than for the other platforms, whereas skilled personnel is
279
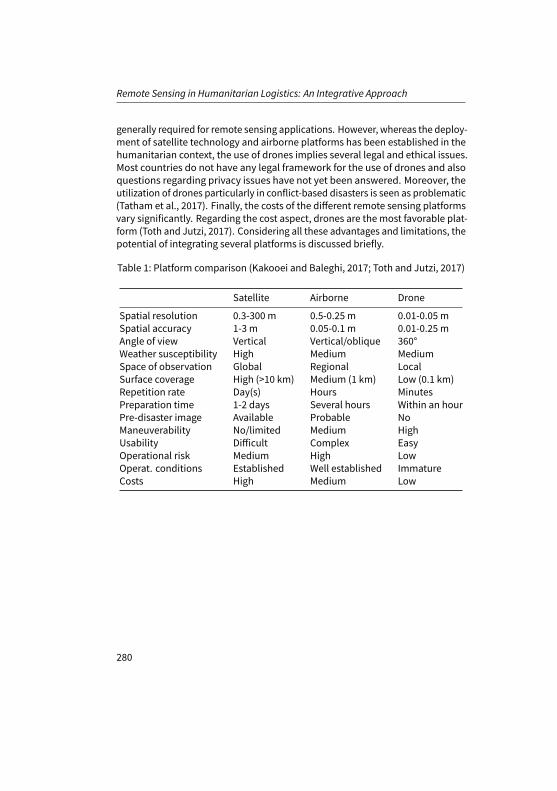
Remote Sensing in Humanitarian Logistics: An Integrative Approach
generally required for remote sensing applications. However, whereas the deploy-ment of satellite technology and airborne platforms has been established in thehumanitarian context, the use of drones implies several legal and ethical issues.Most countries do not have any legal framework for the use of drones and alsoquestions regarding privacy issues have not yet been answered. Moreover, theutilization of drones particularly in conflict-based disasters is seen as problematic(Tatham et al., 2017). Finally, the costs of the different remote sensing platformsvary significantly. Regarding the cost aspect, drones are the most favorable plat-form (Toth and Jutzi, 2017). Considering all these advantages and limitations, thepotential of integrating several platforms is discussed briefly.
Table 1: Platform comparison (Kakooei and Baleghi, 2017; Toth and Jutzi, 2017)
Satellite Airborne Drone
Spatial resolution 0.3-300 m 0.5-0.25 m 0.01-0.05 mSpatial accuracy 1-3 m 0.05-0.1 m 0.01-0.25 mAngle of view Vertical Vertical/oblique 360°Weather susceptibility High Medium MediumSpace of observation Global Regional LocalSurface coverage High (>10 km) Medium (1 km) Low (0.1 km)Repetition rate Day(s) Hours MinutesPreparation time 1-2 days Several hours Within an hourPre-disaster image Available Probable NoManeuverability No/limited Medium HighUsability Difficult Complex EasyOperational risk Medium High LowOperat. conditions Established Well established ImmatureCosts High Medium Low
280
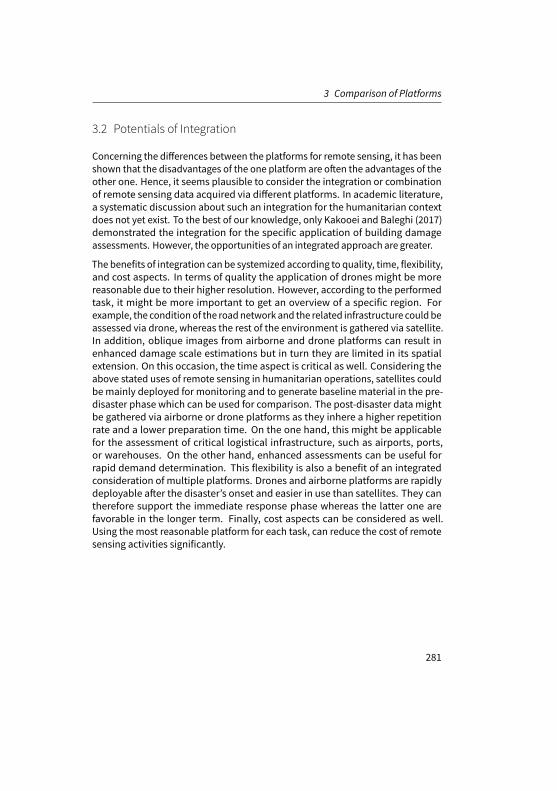
3 Comparison of Platforms
3.2 Potentials of Integration
Concerning the differences between the platforms for remote sensing, it has beenshown that the disadvantages of the one platform are often the advantages of theother one. Hence, it seems plausible to consider the integration or combinationof remote sensing data acquired via different platforms. In academic literature,a systematic discussion about such an integration for the humanitarian contextdoes not yet exist. To the best of our knowledge, only Kakooei and Baleghi (2017)demonstrated the integration for the specific application of building damageassessments. However, the opportunities of an integrated approach are greater.
The benefits of integration can be systemized according to quality, time, flexibility,and cost aspects. In terms of quality the application of drones might be morereasonable due to their higher resolution. However, according to the performedtask, it might be more important to get an overview of a specific region. Forexample, the conditionof the roadnetwork and the related infrastructure couldbeassessed via drone, whereas the rest of the environment is gathered via satellite.In addition, oblique images from airborne and drone platforms can result inenhanced damage scale estimations but in turn they are limited in its spatialextension. On this occasion, the time aspect is critical as well. Considering theabove stated uses of remote sensing in humanitarian operations, satellites couldbemainly deployed for monitoring and to generate baseline material in the pre-disaster phase which can be used for comparison. The post-disaster data mightbe gathered via airborne or drone platforms as they inhere a higher repetitionrate and a lower preparation time. On the one hand, this might be applicablefor the assessment of critical logistical infrastructure, such as airports, ports,or warehouses. On the other hand, enhanced assessments can be useful forrapid demand determination. This flexibility is also a benefit of an integratedconsideration of multiple platforms. Drones and airborne platforms are rapidlydeployable after the disaster’s onset and easier in use than satellites. They cantherefore support the immediate response phase whereas the latter one arefavorable in the longer term. Finally, cost aspects can be considered as well.Using the most reasonable platform for each task, can reduce the cost of remotesensing activities significantly.
281

Remote Sensing in Humanitarian Logistics: An Integrative Approach
4 Experimental Remote Sensing by Drone
In order to demonstrate the practical application of the integration of remotesensing data, experimental drone flights have been performed and the acquireddata processed. The aim is to shown how the data acquired by drone can be pro-cessed. Therefore, a 3Dmodel will be computed in order to generate orthoimagesas well as elevation models, which in turn can be integrated into a GeographicInformation System (GIS). These systems are capable of combining data fromdifferent remote sensing platforms. The technical realization of these tasks in-cludes the three main working steps of data acquisition, processing, as well astheir integration and will be demonstrated more in detail in the following. Finally,results are presented and compared and a judgment in terms of the applicabilityof the proposed integration will be given.
4.1 Technical Realization
The technical realization includes the following three main steps: First of all,the data has to be acquired, followed by the steps of data processing and theintegration into a GIS.
4.1.1 Data Acquisition
For data acquisition, a commercially available hexacoper (Airborne Robotics XR6,diameter : 950 mm,max. payload: 1.2 kg, max. speed: 15 m/s, max. flight time:15 min) was used. The Sony NEX-7 Alpha camera was utilized with a fixed focal-length of 19 mm, providing pictures with a resolution of 24 megapixels. With its25-area contrast autofocus and the quick shutter lag, this camera is particularlysuitable for remote sensing. For flight planning, the software MissionPlanner(1.3.49) was applied. By compiling waypoints, this plan can be transmitted tothe flight-control device of the drone, specifying its precise flight route. For theexperimental flights, a test area was chosen, which meets specific requirements.At a minimum, this area should include one street with one intersection, as wellas accompanying infrastructure (e.g. power cables) and vegetation within a smallrange of about two hectares (this limitation is set by the technical range of thedrone). Optimally, the area further includes different forms of vegetation anddifferent types of streets as well as buildings. Such an area, meeting almost all
282
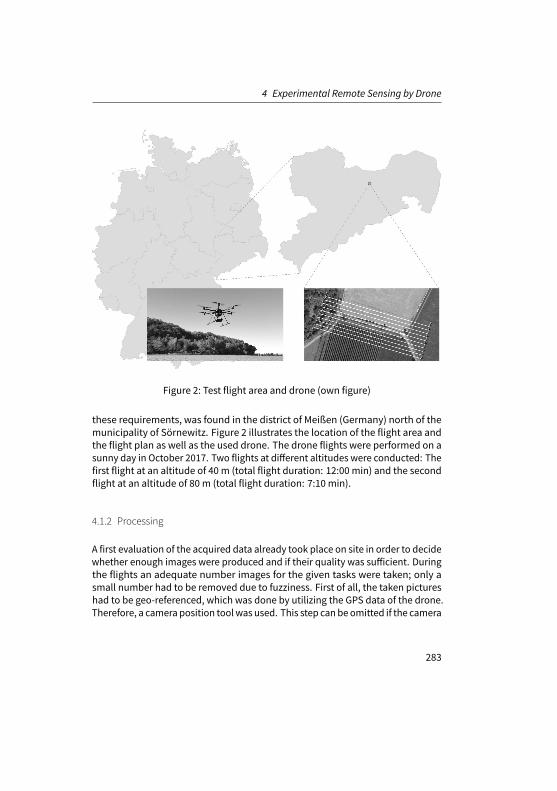
4 Experimental Remote Sensing by Drone
Figure 2: Test flight area and drone (own figure)
these requirements, was found in the district of Meißen (Germany) north of themunicipality of Sörnewitz. Figure 2 illustrates the location of the flight area andthe flight plan as well as the used drone. The drone flights were performed on asunny day in October 2017. Two flights at different altitudes were conducted: Thefirst flight at an altitude of 40 m (total flight duration: 12:00 min) and the secondflight at an altitude of 80 m (total flight duration: 7:10 min).
4.1.2 Processing
A first evaluation of the acquired data already took place on site in order to decidewhether enough images were produced and if their quality was sufficient. Duringthe flights an adequate number images for the given tasks were taken; only asmall number had to be removed due to fuzziness. First of all, the taken pictureshad to be geo-referenced, which was done by utilizing the GPS data of the drone.Therefore, a camera position toolwas used. This step canbe omitted if the camera
283
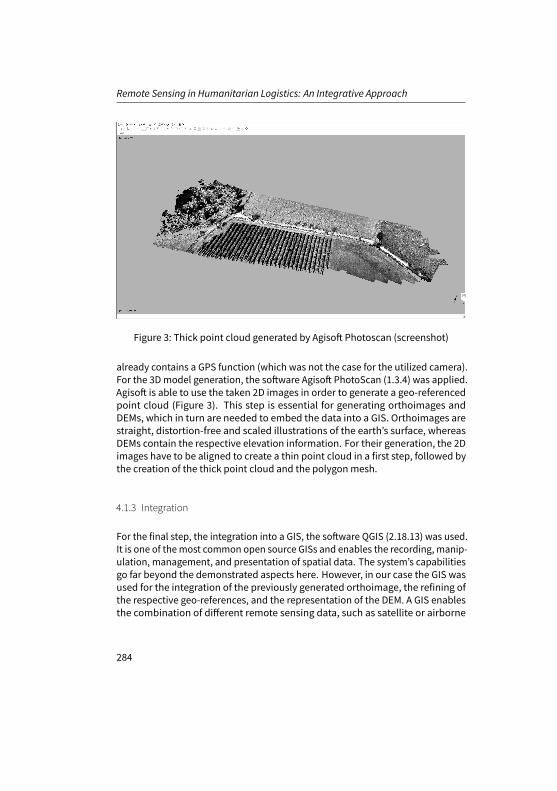
Remote Sensing in Humanitarian Logistics: An Integrative Approach
Figure 3: Thick point cloud generated by Agisoft Photoscan (screenshot)
already contains a GPS function (which was not the case for the utilized camera).For the 3Dmodel generation, the software Agisoft PhotoScan (1.3.4) was applied.Agisoft is able to use the taken 2D images in order to generate a geo-referencedpoint cloud (Figure 3). This step is essential for generating orthoimages andDEMs, which in turn are needed to embed the data into a GIS. Orthoimages arestraight, distortion-free and scaled illustrations of the earth’s surface, whereasDEMs contain the respective elevation information. For their generation, the 2Dimages have to be aligned to create a thin point cloud in a first step, followed bythe creation of the thick point cloud and the polygonmesh.
4.1.3 Integration
For the final step, the integration into a GIS, the software QGIS (2.18.13) was used.It is one of themost common open source GISs and enables the recording, manip-ulation, management, and presentation of spatial data. The system’s capabilitiesgo far beyond the demonstrated aspects here. However, in our case the GIS wasused for the integration of the previously generated orthoimage, the refining ofthe respective geo-references, and the representation of the DEM. A GIS enablesthe combination of different remote sensing data, such as satellite or airborne
284
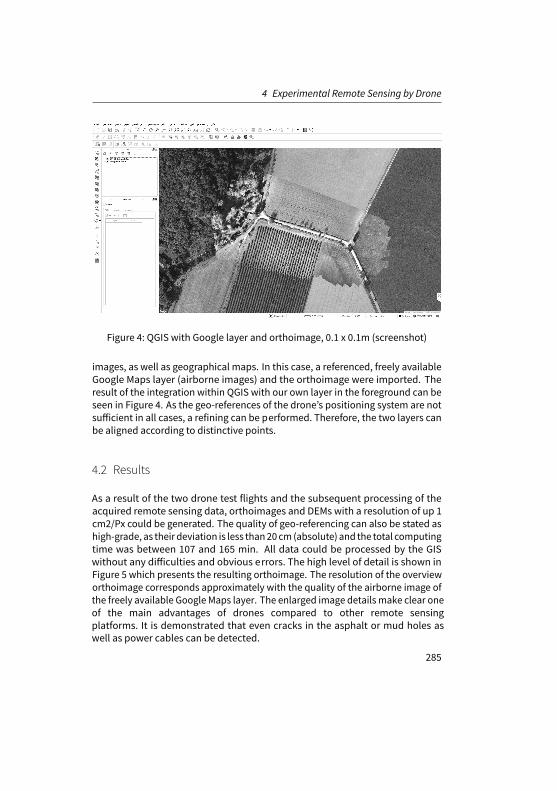
4 Experimental Remote Sensing by Drone
Figure 4: QGIS with Google layer and orthoimage, 0.1 x 0.1m (screenshot)
images, as well as geographical maps. In this case, a referenced, freely available Google Maps layer (airborne images) and the orthoimage were imported. The result of the integration within QGIS with our own layer in the foreground can be seen in Figure 4. As the geo-references of the drone’s positioning system are not sufficient in all cases, a refining can be performed. Therefore, the two layers can be aligned according to distinctive points.
4.2 Results
As a result of the two drone test flights and the subsequent processing of the acquired remote sensing data, orthoimages and DEMs with a resolution of up 1 cm2/Px could be generated. The quality of geo-referencing can also be stated as high-grade, as their deviation is less than 20 cm (absolute) and the total computing time was between 107 and 165 min. All data could be processed by the GIS without any difficulties and obvious errors. The high level of detail is shown in Figure 5 which presents the resulting orthoimage. The resolution of the overview orthoimage corresponds approximately with the quality of the airborne image of the freely available Google Maps layer. The enlarged image details make clear one of the main advantages of drones compared to other remote sensing platforms. It is demonstrated that even cracks in the asphalt or mud holes as well as power cables can be detected.
285

Remote Sensing in Humanitarian Logistics: An Integrative Approach
Figure 5: Orthoimage (40 m, 1 cm2/Px) (own figure)
286
5 Conclusion
5 Conclusion
Remote sensing platforms inhere their specific advantages and limitations asshown in section 3. Hence, it can be assumed that an integrated approach interms of combining data from different platforms will be beneficial for remotesensing activities in humanitarian context. The practical applicability of suchan integration has been demonstrated in section 4. In the following, possibleapplication of an integrated view in humanitarian logistics will be discussed.Moreover, a summary and an outlook for further research will be given.
5.1 Discussion
The above stated integrated approach in remote sensing can be supportive fordifferent humanitarian logistics tasks. First of all, procurement and distributionprocesses are highly affected by sound information beneficiaries’ needs. Know-ing which and where these needs exist is crucial for logistical activities. Here,improved procedures comparing pre-disaster (generated by satellite) and post-disaster data (airborne or drone) could be applied for damage and needs assess-ments. Furthermore, the utilization of remote sensing formapping task should behighlighted. In humanitarian operations, the integrated view could be beneficialin the distribution context. Infrastructure assessments are of high importance andthey should be balanced regarding high surface coverage and high level of detail.Hence, satellite data could be used for general overview assessments, extendedby drone data for detailed infrastructure assessment. According to different typesof disasters, the possible applications are manifold, for example concerning theaccessibility of certain areas by roads blocked by landslides, water or fire. Thestrength of satellite images in getting an overview and drones in providing de-tailed data can be mutual supportive. Further application areas can be foundin warehousing concerning the facility location. Similar aspects as mentionedabove can be beneficial. The initial assessment of best locations for transit pointsor warehouses could be done by satellite, whereas the detailed analysis will besupported by drone images. Finally, the visualization aspect can bementioned.Decisionmakers in humanitarian logistics need to be providedwith detailed infor-mation from the site. As drones are not capable to provide images from all areas,particularly in disasters with a high coverage, the supplement with accordingsatellite images is appropriate. This approach should not be limited solely to thedifferent remote sensing platforms, but should also consider data from differenthumanitarian actors.
287
Remote Sensing in Humanitarian Logistics: An Integrative Approach
5.2 Summary and Outlook
This work shows that the combination of different remote sensing platforms ishighly beneficial in the context of humanitarian operations and logistics. There-fore, the possible areas for application have been categorized and outlined re-garding certain assessment tasks, includingmapping andmonitoring activities aswell as visualization tasks. Following, the advantages and limitations of the plat-forms were highlighted. It was shown that the platforms are mutually supportive.Hence, an integration of remote sensing data from different sources can be highlybeneficial as support for humanitarian logistics activities such as procurement,distribution and warehousing in terms of quality, time, flexibility, and cost. In thelast section, the practical implementation of such an integrative approach wasdemonstrated. Therefore, drone test flights were conducted and the gatheredmaterial processed and integrated.
The area of application for remote sensing in humanitarian operations and partic-ularly for logistics activities is manifold. Further research is necessary to system-atically identify the potentials of remote sensing, regardless of their platform, andaccording to the disastermanagement phases, on the one hand, and the differentdisaster types, on the other. Moreover, the requirements regarding these areas ofapplications have to be identified. This relates mainly to the necessary resolutionand the time horizon concerning the gathered data. Finally, the integration intothe informationmanagement processes of humanitarian organizations and thesharing of information amongst the various actors should be evaluated. Investi-gating these questions could lead to more efficient and expedient humanitarianoperations, not just in terms of logistical aspects.
References
Adams, S. and C. Friedland (2011). “A Survey of Unmanned Aerial Vehicle (UAV) Usage for ImageryCollection in Disaster Research and Management”. In: Proceedings of the 9th InternationalWorkshop on Remote Sensing for Disaster Response. 15-16 September 2011. Stanford, CA, USA.
Altay, N. and R. Pal (2014). “Information Diffusion among Agents: Implications for HumanitarianOperations”. In: Production and Operations Management 23.6, pp. 1015–1027.
Baumgarten, H. (2011). “Humanitäre Logistik: Herausforderungen und Potenziale der Logistik inder humanitären Hilfe”. In: ed. by H. Baumgarten, J. Schwarz, and M. Keßler. Hamburg: DVVMedia Group. Chap. Humanitäre Logistik, pp. 3–15.
Blecken, A. (2009). “A Reference Task Model for Supply Chain Processes of Humanitarian Organi-sations”. PhD thesis. Universität Paderborn.
288

REFERENCES
Bündnis Entwicklung Hilft (2017).WorldRiskReport: Analysis and Prospects 2017. online.Chen, J., I. Dowman, S. Li, Z. Li, M. Madden, J. Mills, N. Paparoditis, F. Rottensteiner, M. Sester,
C. Toth, T. J., and C. Heipke (2016). “Information from Imagery: ISPRS Scientific Vision andResearch Agenda”. In: ISPRS Journal of Photogrammetry and Remote Sensing 115, pp. 3–21.
Delmonteil, F.-X. and M.-È. Rancourt (2017). “The Role of Satellite Technologies in Relief Logistics”.In: Journal of Humanitarian Logistics and Supply Chain Management 7.1, pp. 57–78.
Dinesh, C., A. Bari, R. Dissanayake, and M. Tamura (2013). “Detecting and Assessment of TsunamiBuilding Damage Using High-Resolution Satellite Images with GIS Data”. In: International Jour-nal of Disaster Resilience in the Built Environment 4.2, pp. 132–144.
Enenkel, M., L. See,M. Karner,M. Álvarez, E. Rogenhofer, C. Baraldès-Vallverdú, C. Lanusse, N. Salse,and H. El-Shemy (2015). “Food Security Monitoring via Mobile Data Collection and RemoteSensing: Results from the Central African Republic”. In: PLOS ONE 10.11, e0142030.
Griffin, G. (2014). “The Use of Unmanned Aerial Vehicles for Disaster Management”. In: Geomatica68.4, pp. 265–281.
Guo, H., L. Liu, L. Lei, Y. Wu, L. Li, B. Zhang, Z. Zuo, and Z. Li (2010). “Dynamic Analysis of theWenchuan Earthquake Disaster and Reconstruction with 3-Year Remote Sensing Data”. In:International Journal of Digital Earth 3.4, pp. 355–364.
Gupta, S., M. Starr, R. Farahani, and N. Matinrad (2016). “Disaster Management from a POM Per-spective: Mapping a New Domain”. In: Production and Operations Management 25.10, pp. 1611–1637.
Heipke, C. (2017). “Photogrammetrie und Fernerkundung: Handbuch der Geodäsie”. In: ed. byC. Heipke. Berlin: Springer. Chap. Photogrammetrie und Fernerkundung: Eine Einführung,pp. 1–27.
ICRC and IFRC (2008). Guidelines for Assessment in Emergencies. online.Kakooei, M. and Y. Baleghi (2017). “Fusion of Satellite, Aircraft, andUAVData for Automatic Disaster
Damage Assessment”. In: International Journal of Remote Sensing 38.8-10, pp. 2511–2534.Kim,M., R. Sharman, C. Cook-Cottone,H. Rao, andS.Upadhyaya (2012). “AssessingRoles of People,
Technology and Structure in Emergency Man-agement Systems: A Public Sector Perspective”.In: Behaviour & Information Technology 31.12, pp. 1147–1160.
Kovács, G. and K. Spens (2011). “Trends and Developments in Humanitarian Logistics: A GapAnalysis”. In: International Journal of Physical Distribution& LogisticsManagement 39.6, pp. 506–528.
McInerney, D. and P. Kempeneers (2015). Open Source Geospatial Tools: Applications in EarthObservation. Cham: Springer International Publishing.
OCHA (2013). Disaster Response in Asia and the Pacific. online.Pradhan, B., M. Dini Hairi Bin Suliman, and M. Arshad Bin Awang (2007). “Forest Fire Susceptibility
and Risk Mapping Using Remote Sensing and Geo-graphical Information Systems (GIS)”. In:Disaster Prevention and Management: An International Journal 16.3, pp. 344–352.
Rau, J.-Y., L.-C. Chen, J.-K. Liu, and T.-H. Wu (2007). “Dynamics Monitoring and Disaster Assess-ment for Watershed Management Using Time-Series Satellite Images”. In: IEEE Transactions onGeoscience and Remote Sensing 45.6, pp. 1641–1649.
Sambah, A. and F. Miura (2014). “Remote Sensing and Spatial Multi-Criteria Analysis for TsunamiVulnerabil-ity Assessment”. In: Disaster Prevention and Management: An International Journal23.3, pp. 271–295.
Schwarz, J. (2012). “Humanitäre Logistik für die Versorgungsproblematik in Subsahara-Afrika:Aufbau von Logistikkapazität durch Wissenstransfer”. PhD thesis. Technische Universität Berlin.
289
Remote Sensing in Humanitarian Logistics: An Integrative Approach
Sharma, V., N. Mishra, A. Shukla, A. Yadav, G. Rao, and V. Bhanumurthy (2017). “Satellite DataPlanning for Flood Mapping Activities Based on High Rainfall Events Generated using TRMM,GEFS and Disaster News”. In: Annals of GIS 23.2, pp. 131–140.
Soesilo, D. and K. Sandvik (2016). Drones in Humanitarian Action: A Survey on Perceptions andApplications. Geneva: Swiss Foundation for Mine Action (FSD).
Strunz, G., S. Martinis, and E. Schöpfer (2017). “Photogrammetrie und Fernerkundung: Handbuchder Geodäsie”. In: ed. by C. Heipke. Berlin: Springer. Chap. Beiträge der Fernerkundung zurUnterstützung des Katastrophenmanage-ments und der humanitären Hilfe, pp. 805–839.
Tatham, P., C. Ball, Y. Wu, and P. Diplas (2017). “Long-Endurance Remotely Piloted Aircraft Systems(LE-RPAS) Support for Humanitarian Logistic Operations”. In: Journal of Humanitarian Logisticsand Supply Chain Management 7.1, pp. 2–25.
Thomas, A. and L. Kopczak (2005). From Logistics to Supply Chain Management: The Path in Hu-manitarian Sector. online.
Toth, C. and B. Jutzi (2017). “Photogrammetrie und Fernerkundung: Handbuch der Geodäsie”. In:ed. by C. Heipke. Berlin: Springer. Chap. Plattformen und Sensoren für die Fernerkundung undderen Geopositionierung, pp. 29–64.
Voigt, S., T. Kemper, T. Riedlinger, R. Kiefl, K. Scholte, and H. Mehl (2007). “Satellite Image Analysisfor Disaster and Crisis-Management Support”. In: IEEE Transactions on Geoscience and RemoteSensing 45.6, pp. 1520–1528.
Wang, J., Q. Qin, J. Zhao, X. Ye, X. Feng, X. Qin, and X. Yang (2015). “Knowledge-BasedDetection andAssessment of Damaged Roads Using Post-Disaster High-Resolution Remote Sensing Image”.In: Remote Sensing 7.12, pp. 4948–4967.
Wang, S., E. So, and P. Smith (2015). “Detecting Tents to Estimate the Displaced Populationsfor Post-Disaster Re-lief Using High Resolution Satellite Imagery”. In: International Journal ofApplied Earth Observation and Geoinformation 36, pp. 87–93.
290
Impact of Managerial Risk-taking andIRM on Innovation
Fatemeh Seidiaghilabadi1, Ebrahim Abbassi 1, Zahra Seidiaghilabadi1
1 – Islamic Azad University
Innovation in any business comes with risk. This study aimed to explore the roleof managerial risk-taking and integrated risk management (IRM) on innovation.To verify the hypotheses, a questionnaire was designed. Data were collectedfrom 109 Insurance Managers from Iran Insurance Companies. PLS structuralequationmodelingwas employed to test bothmeasurement and structuralmodel.The results demonstrate that integrated risk management andmanagers’ risk-taking have a positive impact on innovation. This is the first study to explicitlyand separately consider the effects of managerial risk-taking and integrated riskmanagement (IRM) on innovation in the Insurance sector. Due to the lack of scalesto analyze IRM, questionnaires which adopted from previous studies may not bethebest scales tomeasure variables. This study focuses on Iran insurance industry,which limits its generalizability. Our findings highlight the need for managersin high risk-taking behavior to encourage employees to be more creative anddevelop organizational innovation. The authors discovered that firms shouldperform an effective IRM system that oversees many systematic risks throughorganization innovation process.
Keywords: Innovation; Managerial risk-taking; IRM; PLS-SEMFirst recieved: 28.May.2018 Revised: 02.Jul.2018 Accepted: 12.Jul.2018
291
Impact of Managerial Risk-taking and IRM on Innovation
1 Introduction
Innovation is a popular concept that has attracted the interest of both academicandbusiness communities (Santos et al., 2014). In addition, Innovation is criticallyimportant and necessary for firms to respond to rapid changes (Kwak, Seo, andMason, 2018), and dynamic competitive business environment in order to growand survive (Tushman and O’Reilly III, 1996; Dess and Picken, 2000; Bowers andKhorakian, 2014; Wu and Wu, 2014; Kim, Choi and Skilton, 2015). Innovation is ahigh-risk process and is prone to uncertainty in business.
On the other hand, risk management is emerging as an essential contributor tomost fields of decision making and firm’s control in any business at the complex-ity and uncertainty business environment (Giannakis, Croom, and Slack, 2004;Ritchie and Brindley, 2007; Eckles, Hoyt, and Miller, 2014). This complexity showsthat risks arise from various sources. Scholars believe that the extensive use of ex-plicit riskmanagingmight reduce expenditure on innovation failure and if it is wellimplemented, firms will reach their innovative plans more accelerator (Bowersand Khorakian, 2014; Stosic et al., 2017). Clearly, appropriate risk managementwould encourage innovation in the organization.
March (1996), argues that risk-taking is necessary for innovation. ConfirmingMarch’s argument, previous research has shown that there exists a close rela-tionship between risk-taking and innovation. Researchers believe that managersplay the role of strategic decision-makers, capable of identifying opportunitiesandmaking the right decisions about innovation within the organization (García-Granero et al., 2015). In fact, managerial risk-taking requires significant invest-ment that hopes to bring out success or profit, with a high possibility of failure orheavy debt(Latham and Braun, 2008).
Additionally, not only managers and CEO’s risk-taking stimulate innovation, butalso firms need tomanage all sorts of risks surrounded an innovation project fromplanning to implementation (Wu and Wu, 2014). Integrating all risks through thedifferent phases of innovation can (Wu and Wu 2014) help managers make thecritical decision to abandon poor innovation plan (Bowers and Khorakian,2014).This integrated approach provides for real risk management that is coordinatedamong all parties involved in the control of innovation’s risk. It also providesmanagement with the capacity to monitor risk mitigation performance. Besides,the potency of the riskmanagement within an integrated approach is determinedby its clear classification of any levels of business (Bilgin and Danis, 2016).
292
2 Literature Review
The integrated risk-taking management encompasses operational risks. Accord-ing toMeulbroek(2002a), operational risks, generated from individuals, processes,and physical properties, can exert influence on innovation performance. Thus,such risks need to be carefully managed.
Although the effect of risk-taking on innovation has been well documented invarious studies, research has failed to examine the impact of integrated risk-takingmanagement on innovation. Moreover, the effect of these two types of approachon innovation has remained underexplored.
Accordingly, since innovation in the insurance industryhas received little attention,the chief aimof this article is to fill the gap and to examine the effect ofmanagerialrisk-taking and IRM on innovation. The study, therefore, attempts to provideanswers to the following research questions:
1. What is the effect of managers’ risk-taking on insurance companies’ innova-tion?
2. What is the effect of integrated risk-taking management on insurance compa-nies’ innovation?
The article is structured as follows. First, reviewed the literature . Next, a hy-pothetical model will be presented. The SEM model will be tested using datafrom 109 insurancemanagers working in Iran Insurance Companies. The articleconcludes with discussion, conclusion, managerial implications, and limitationsof the study.
2 Literature Review
This chapter, briefly explain innovation within the context of the organization.Then it provides an introduction to the relationship between managers’ risk-taking and integrated risk management which aim at promoting organizationalinnovation.
2.1 Innovation
Within the service industry, the primary way to gain a competitive advantage isinnovation. Birkinshaw et al.,( 2011) showed that product/service innovations are
293
Impact of Managerial Risk-taking and IRM on Innovation
just the tip of the innovation iceberg (Medrano andOlarte-Pascual, 2016).Scholarshave thoroughly mentioned that the quest for innovation can be an importantstrategy which organizations with hyper-competitive characteristics use to re-main competitive in a progressively dynamic, speedily changing and complicatedmarket (Liu et al., 2017). In the innovation literature, various types of innovationhave been considered. It can be product, process, administrative, technological,marketing, radical or incremental, (García-Granero et al., 2015; Liu et al., 2017).Service or product innovation is the first-time commercial usage of a product orservice, which is new to the marketplace, whereas process innovation is the exe-cution of methods that are new to the company, but not necessarily new on themarket (Jeschke et al., 2017). Hence, this process requires clearness of thoughtand the capability to get things done. Evan( 1966), pointed out that administrativeinnovation can be a concept for new policy, the allocation of resources, the struc-turing of responsibilities, of authority, of rewards (Pauget and Dammak, 2018).Administrative innovation increases productivity by guaranteeing efficiency ininternal processes and individuals and business. Specifically, administrative in-novation refers to changes in the characteristics of organizational or institutionalelements. Then, adoption of any types of innovation is determined by an attitudetowards the organization innovation partially.
2.2 Managing Risk-taking
Risk-taking is considered as one of the most important activities of managersto encourage innovation throughout the organization. Risk-Taking behavior isan individual’s behavior in risky conditions, which is characterized by using thedegree of risks involved in decision-making (Nkundabanyanga et al., 2015).
Research has shown that managers’ inclination toward risk-taking has consid-erable influence on a company’s capacity for innovation. As noted earlier, man-agerial risk-taking “involves investing significant resources in activities with ahigh possibility of failure, which includes incurring heavy debt or making largeresource commitments in the hope of reaping potentially high benefits” (García-Granero et al., 2015). Hence, if expected values of taking risks for two strategiesare comparable, but one is a considerable uncertain, managers will choose theone with a more specific result.
294
2 Literature Review
2.3 Integrated Risk Management (IRM)
Typically, RM has been about each administrator dealing with specific risks whichmight affect some firms’ goals. In a very meanwhile, regarding risk literature,RMmethods are changing from controlling risk independently and departmentsand in a Silo-based approach to an integrated risk approach (Tommerberg, 2010;Meulbroek, 2001, 2002b). An IRM allows firms to control a wide array of risksholistically (Togok, Isa, and Zainuddin, 2016) and consists of many different facetsof an organization’s activities (Wu and Wu, 2014). Such an integrated risk modelcombines all sorts of risks with an integrative focus (Andersen, 2008) and helpsmanagers to identify, control, evaluate, and monitor all risks on the specificcategories to make a great decision. Thus, IRM offers a steady picture of riskwithin the entire organization.
Accordingly, since the integrated approach to managerial risk-taking includes dif-fering facets of the organization, companies adopting this approach, are capableof dealing with the skills and expertise necessary to face potential risks.
Although integrated risk management differs from Enterprise risk management(ERM), the other concept of holistic risk procedure, both add a wide variety ofstrategic, functional, and financial decisions for handling risk (Oxelheim,Wihlborgand Thorsheim, 2011; (Meulbroek, 2002b). Table 1 provides some recent defini-tions of IRM. Some scholars maintained that the success of IRM is greatly depen-dent on how proficiently it is applied in an organization(Nocco and Stulz, 2006).Meulbroek, (2002a, 2002b), observed that there are three ways of employing riskmanagement aims: modifying the firm’s procedure, altering its capital structureand utilizing targeted financial instruments. IRM identifies a theory thatmanagersmust weigh the advantages and disadvantages of the various approaches, andthey must also consider the aggregation of all risks encountered by the businessfor choosing the perfect solutions (Tommerberg, 2010). To put it simply, IRMimplementation elements depict the critical path that a comprehensive risk con-tainment program should take to ensure proactive well as reactive measures tolessen systematic risk exposures.
Comprehensive risk containment program should take to ensure proactive wellas reactive measures to lessen systematic risk exposures.
295

Impact of Managerial Risk-taking and IRM on Innovation
Table 1: IRM definitions and descriptions
Scholars Definitions
Meulbroek (2002a);Bromiley et al., (2015)
IRM is the identification and evaluation of thecommon risks that affect the significant value andenforcing a company-wide approach to managingthose risks.
Miller and Waller,(2003)
IRM is the consideration of a full variety of uncertaincontingencies that affect enterprise overallperformance.
(Andersen, 2008)Activities into one unified framework and enablesidentification of such interdependencies as aconsequence.
(Wu and Wu, 2014)
IRM entails identity of unique activities or situationsapplicable to product innovation’s risks andpossibilities typically, assessing andmeasuringthem, integrating the risks, and formulating plans torestrict them. The process additionally consists ofexecuting those plans and tracking development.
296
3 Developing Hypotheses
3 Developing Hypotheses
According to the above-stated discussion, a hypothetical model is presented inFigure 1 illustrates the effect of managers’ inclination towards risk-taking andintegrated risk-taking management on innovation.
3.1 Risk-appetite and Innovation
Risk-taking comes with an essential influence on organizations’ long-term devel-opment and innovative activities (Li and Tang, 2010). Consequently, risk-taking ismanifested in themanagers’ willingness to utilize opportunities, aiding their firmsin getting competitive advantages through innovation activities (Faccio, Marchicaand Mura, 2011). Researchers on innovation literature agree that innovationsand creative behaviors are closely associated with risk-taking. In the primary,however, risk-taking should be considered as a relevant attribute of managers toaccomplish innovation. In addition, managers have the authority to improve andshape the organization by their high-risk decisions. Therefore, we put forwardthe following hypothesis:
Hypothesis 1: Managerial risk-taking has a positive impact on innovation.
3.2 IRM and Innovation
Innovation aligns with actions that possess an excessive degree of risk, and tobe successful; managers ought to manipulate this procedure and eliminate therisks into account. Tidd, Bessant, and Pavitt (2005) emphasized that even thoughinnovation has different types, scales, and sectors, it is a process, which needsto be managed. Johnson(2010), believed that not only does risk managementcirculate innovation in advance, but it additionally increases its speed (Bowersand Khorakian, 2014). IRM is set the recognition and assessment of precise eventsor conditions related to products’ risks and possibilities for innovation, integrat-ing risks and plans to reduce risks. Implementation of those packages and theirprogress is likewise part of this procedure. As a result, even though each riskcontrol hobby reduces dangers one after the other (e.g., Technical risks), inte-grated hazard control eliminates a few risks and preserves others by growing risk
297
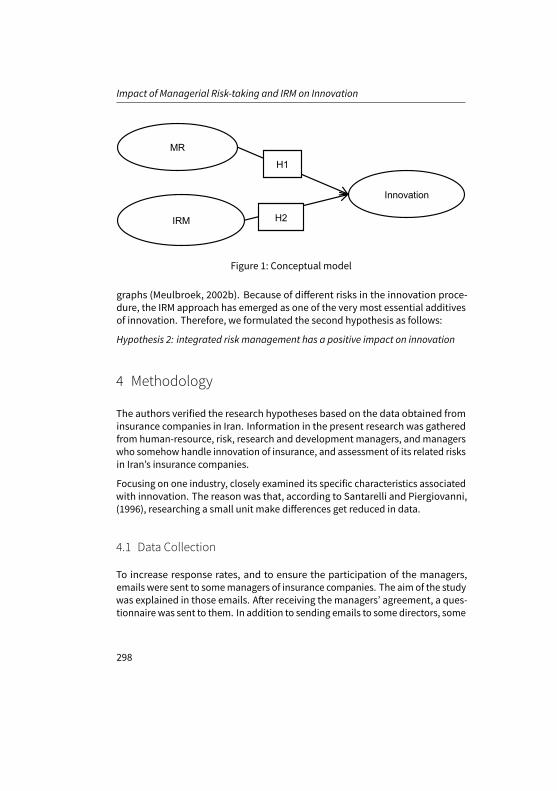
Impact of Managerial Risk-taking and IRM on Innovation
IRM
MR
Innovation
H1
H2
Figure 1: Conceptual model
graphs (Meulbroek, 2002b). Because of different risks in the innovation proce-dure, the IRM approach has emerged as one of the very most essential additivesof innovation. Therefore, we formulated the second hypothesis as follows:
Hypothesis 2: integrated risk management has a positive impact on innovation
4 Methodology
The authors verified the research hypotheses based on the data obtained frominsurance companies in Iran. Information in the present research was gatheredfrom human-resource, risk, research and development managers, andmanagerswho somehow handle innovation of insurance, and assessment of its related risksin Iran’s insurance companies.
Focusing on one industry, closely examined its specific characteristics associatedwith innovation. The reason was that, according to Santarelli and Piergiovanni,(1996), researching a small unit make differences get reduced in data.
4.1 Data Collection
To increase response rates, and to ensure the participation of the managers,emails were sent to somemanagers of insurance companies. The aim of the studywas explained in those emails. After receiving the managers’ agreement, a ques-tionnaire was sent to them. In addition to sending emails to some directors, some
298
4 Methodology
phone calls were made to directors and deputies, and they were asked to partic-ipate in the study. Moreover, some meetings were arranged with respondentsto complete questionnaires. This method ensured sufficient access to the rightaudience, proper use, and understanding of words, and increased the responserate. Finally, 109 valid responses were obtained, equivalent to a response rate of94.78% (out of 115 distributed questionnaires).
4.2 Questionnaire Development
There were three primary variables in this study, including the manager’s risk-taking, integrated risk management (IRM) and Innovation. A seven-point Likert-scale ranging from ”1” (strongly disagree) to ”7” (strongly agree) was used tomeasure the existing variables. Three constructs for innovation, were adaptedfrom Jimenez-Jimenez, Sanz Valle and Hernandez-Espallardo, (2008). Theman-agerial risk-taking and IRM were measured by three and one items, respectively,which were adapted from previous research studies by Covin and Slevin (1986)and García-Granero et al. (2015), whereas IRM was adopted from the study of (WuandWu, 2014). We only control firm age (number of years since the company’screation); Firm age was measured in two separate categories:” lower than 20years= 1 andmore than 20 years activity= 2”.
4.3 Data Analysis and Results
Verifying the adequacy of the data check is essential before performing factoranalysis. The KMO index and Bartlett’s test were both used to look for the appro-priateness of sample adequacy. Thus, KMO in a factorial analysis was 0.896, andthus, the sampling adequacy for this approach is significantly above the thresholdvalue of 0.7(Bilgin and Danis, 2016).The significance level of Bartlett’s test (x2 =873.474; df= 78, p= 0.000) is smaller than 5 percent strengthened its adequacy.Finally, the results verified that the executed dataset in this paper was ideal forexploratory factor evaluation procedures.
299

Impact of Managerial Risk-taking and IRM on Innovation
4.4 Measurement Model
The authors used Smart PLS software V.2.3.7 (Ringle, Wende and Becker, 2015)to analyze the measurement and structural models (Hair et al., 2017, 2016). Weexamined themeasurementmodel, throughConvergent anddiscriminant validity.Assessment of the convergent validity includes factor loadings> 0.7, compositereliability (CR)> 0.7 and average variance extracted (AVE)> 0.5 and Cronbachalpha> 0.7 (Hair et al., 2013).
300
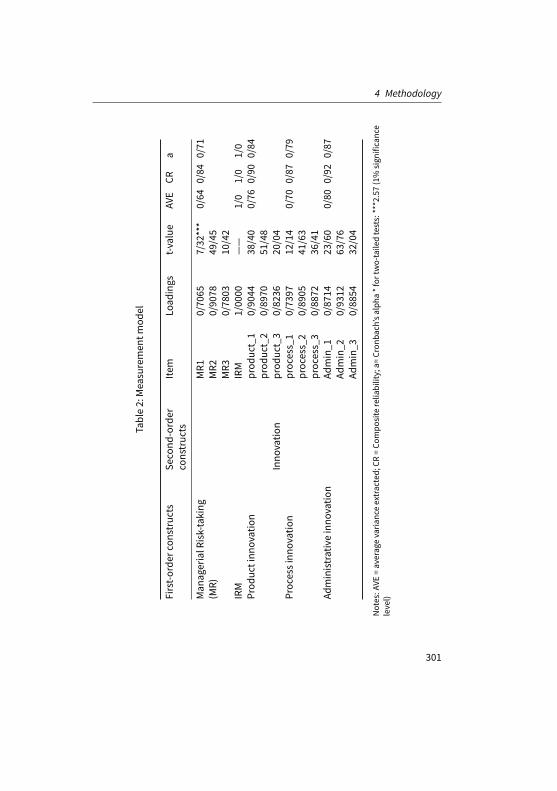
4 Methodology
Table2:Measuremen
tmod
el
First-o
rder
constructs
Second
-order
constructs
Item
Load
ings
t-value
AVE
CRa
Man
agerialR
isk-taking
MR1
0/70
657/32
***
0/64
0/84
0/71
(MR)
MR2
0/90
7849
/45
MR3
0/78
0310
/42
IRM
IRM
1/00
00——
1/0
1/0
1/0
Prod
uctinn
ovation
prod
uct_1
0/90
4438
/40
0/76
0/90
0/84
prod
uct_2
0/89
7051
/48
Inno
vatio
nprod
uct_3
0/82
3620
/04
Processinn
ovation
process_1
0/73
9712
/14
0/70
0/87
0/79
process_2
0/89
0541
/63
process_3
0/88
7236
/41
Administrativeinno
vatio
nAd
min_1
0/87
1423
/60
0/80
0/92
0/87
Admin_2
0/93
1263
/76
Admin_3
0/88
5432
/04
Notes:A
VE=averag
evaria
nceextracted;
CR=Co
mpo
site
relia
bility;a=
Cron
bach’salph
a*for
two-taile
dtests:***2.57(1%
sign
ificance
level)
301

Impact of Managerial Risk-taking and IRM on Innovation
Table 3: Discriminant validity – Fornell- Larcker criterion
Construct IRM MR Administrative Process Product
IRM 1/0000MR 0/4597 0/8025Administrative 0/6369 0/3419 0/8964Process 0/5707 0/5207 0/6464 0/8421Product 0/5982 0/5107 0/6163 0/6921 0/8758
Note: The bold values in the abovematrix are the squared correlations between the latentconstructs, and the diagonal values are AVEs
Table 2 shows that the results of the measurement model exceeded the recom-mended values, thus indicating sufficient convergent validity. In addition toTable 3, Table 4, and Table 5 shows the Discriminant validity. In this regard, thesquare root of the AVE in table 3, is higher than its highest correlation with anyother construct (Fornell and Larcker, 1981; Hair et al., 2017, 2016).
The comparison of cross-loadings in Table 4 indicates that an indicator’s load-ings are higher than other loadings for its construction in the same column andsame row. The Heterotrait- the Monotrait ratio of correlations (HTMT), is anotherDiscriminant validity.
HTMT values shown in Table 5 imply that all values are below the threshold of0.9 (Hair et al., 2017). Thus, the discriminant validity is established between thelatent constructs and, overall, the reflective constructs are reliable and valid.
4.5 Structural Equation Modeling
As mentioned in the previous section SmartPLS 3.2.7 was used to test the struc-tural model and hypotheses (Ringle, Wende and Becker, 2015). The primarycriterion for spiritual model evolution is R2, which represents the amount of ex-plained variance of each endogenous latent variable (Hair et al., 2016). Table 6shows that the R2 for the entire model is 0/5276, which presents a reasonableexplanation of the model. In addition, the effects of control variable (CV) on inno-vation was tested by adding Firm age as a CV to the model. By adding firm ageto the model, the R2 of innovation has change from0/526 to 0/539. Using effect
302
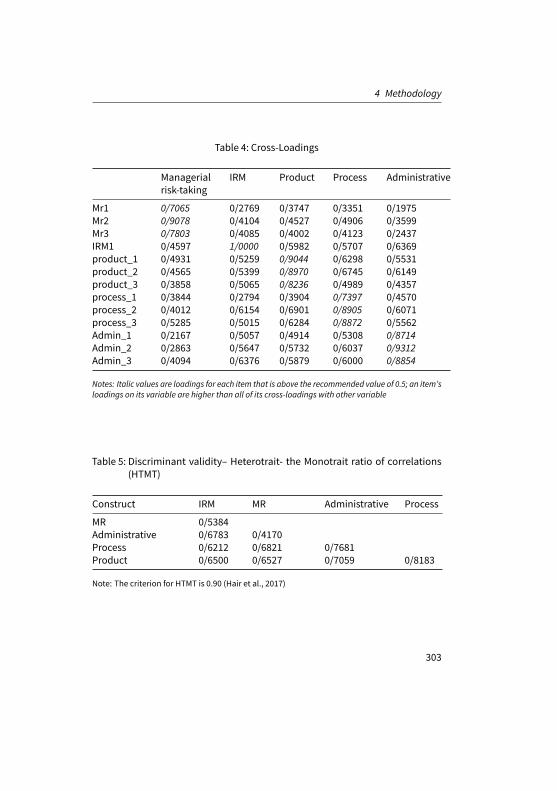
4 Methodology
Table 4: Cross-Loadings
Managerialrisk-taking
IRM Product Process Administrative
Mr1 0/7065 0/2769 0/3747 0/3351 0/1975Mr2 0/9078 0/4104 0/4527 0/4906 0/3599Mr3 0/7803 0/4085 0/4002 0/4123 0/2437IRM1 0/4597 1/0000 0/5982 0/5707 0/6369product_1 0/4931 0/5259 0/9044 0/6298 0/5531product_2 0/4565 0/5399 0/8970 0/6745 0/6149product_3 0/3858 0/5065 0/8236 0/4989 0/4357process_1 0/3844 0/2794 0/3904 0/7397 0/4570process_2 0/4012 0/6154 0/6901 0/8905 0/6071process_3 0/5285 0/5015 0/6284 0/8872 0/5562Admin_1 0/2167 0/5057 0/4914 0/5308 0/8714Admin_2 0/2863 0/5647 0/5732 0/6037 0/9312Admin_3 0/4094 0/6376 0/5879 0/6000 0/8854
Notes: Italic values are loadings for each item that is above the recommended value of 0.5; an item’sloadings on its variable are higher than all of its cross-loadings with other variable
Table 5: Discriminant validity– Heterotrait- the Monotrait ratio of correlations(HTMT)
Construct IRM MR Administrative Process
MR 0/5384Administrative 0/6783 0/4170Process 0/6212 0/6821 0/7681Product 0/6500 0/6527 0/7059 0/8183
Note: The criterion for HTMT is 0.90 (Hair et al., 2017)
303
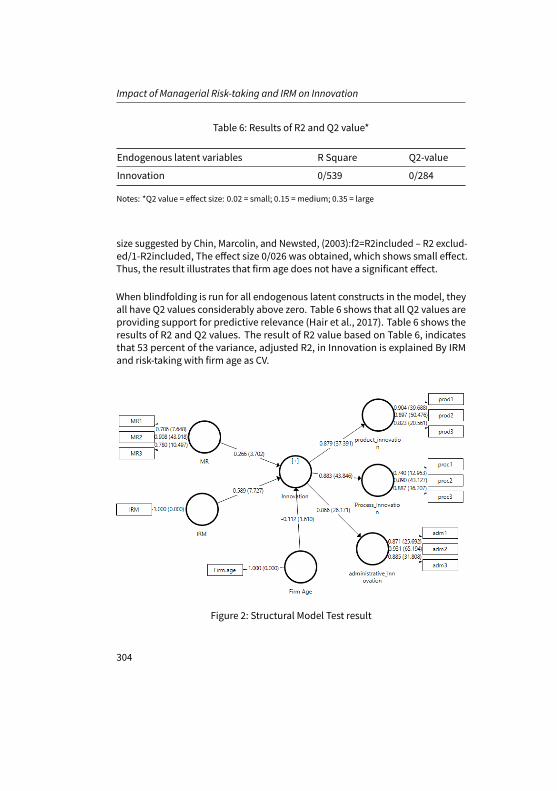
Impact of Managerial Risk-taking and IRM on Innovation
Table 6: Results of R2 and Q2 value*
Endogenous latent variables R Square Q2-value
Innovation 0/539 0/284
Notes: *Q2 value = effect size: 0.02 = small; 0.15 = medium; 0.35 = large
size suggested by Chin, Marcolin, and Newsted, (2003):f2=R2included – R2 exclud-ed/1-R2included, The effect size 0/026 was obtained, which shows small effect.Thus, the result illustrates that firm age does not have a significant effect.
When blindfolding is run for all endogenous latent constructs in the model, theyall have Q2 values considerably above zero. Table 6 shows that all Q2 values areproviding support for predictive relevance (Hair et al., 2017). Table 6 shows theresults of R2 and Q2 values. The result of R2 value based on Table 6, indicatesthat 53 percent of the variance, adjusted R2, in Innovation is explained By IRMand risk-taking with firm age as CV.
Figure 2: Structural Model Test result
304

5 Conclusion
Table 7: Structural results and hypothesis testing
Hypothesis Path direction Path coefficient T-value DecisionWithoutCV
WithCV
WithoutCV
WithCV
H1 MR->Innovation 0/2582 0/266 3/52 3/701 SupportedH2 IRM->Innovation 0/5705 0/589 6/97 7/27 Supported
Table 7 and Figure 2 show the structural model analysis. The results showed thatthe relationships betweenManagerial risk-taking and innovation (Path coefficient= 0/266, t-value = 3/701 with a p-value<0.01). Thus, H1 is supported and predictedthat managerial risk-taking positively affects innovation in the insurance industry.Furthermore, as Table 7 shows, the relationship between IRM and innovation issignificant (Path coefficient = 0/589, t-value = 7/27 and with a p-value<0.01). Thus,the H2 is supported as well.
5 Conclusion
The main aim of our study has been the study of risk management, both inte-grated risk management (IRM) andmanagerial risk-taking (MR). To the best of ourknowledge, it is a new line of study, which is still fragmented and with little em-pirical evidence. Given this gap, our study presents, after a theoretical review ofthe variables, an empirical model which was tested on a sample of 109 managersfrom Iran’s’ insurance companies in different types of positions.
The results of this paper suggest thatboth IRMandManagerial risk-taking (MRT) en-able the Company’s development through innovation in any types. Results showthat the risk arises from a variety of sources and most importantly, innovationhas a high probability of failure at several stages of organizational development;that is, all types of innovation involve risk, and all risk includes the possibility offailure.
This study offers two important implications. First, it confirms previous researchfindings and shows that how insurance company as a business enterprise can, to alarge extent, bring success in innovation through integrated risk management.
305
Impact of Managerial Risk-taking and IRM on Innovation
Hence, a firm which adopts an IRM approachmay gain more and useful insightabout the affection of RM on the firm value and developing innovation activitiesbecause these companies have this opportunity to identify all innovation barriersthrough a systematic IRM framework.
On the other hand, the study predicts that managers who take risks are moreinclined to develop innovative products, services, and processes.
If a manager has a low-tolerance for innovative and creative ideas, then it isunlikely to bring new product/process on a regular basis. Thus, managers withthe risk appetite ability not only have a higher level of tolerance to innovationuncertainty but also have more assurance in completing innovation projects(Simon and Houghton, 2003).
The second implication of the study is that, even though the company’s age didnot have a significant effect on innovation; it seems that the company’s age canstrengthen the effect ofmanagers’ risk-taking and integrated risk on innovation. Inother words, as the years of activity of insurance companies, more opportunitiesto innovate and use Risk Management Experience. Therefore, the nature of riskmanagement can be associated with the company’s age.
Additionally, We found that IRM was positively related to innovation. In addi-tion, both managerial risk-taking and IRM have a significant indirect effect onproduct/process and administrative innovation. Thus, these risk managementprocedures help the companies to improve their organizational performance.This paper contributes to the literature on innovation in the insurance industrythrough the studying the role of IRM and Managerial risk-taking.
This study offers tremendousmanagerial implications. First, the hypothesizedrelationships are supported through the data. This contemporary model hasvalidated to significantly explain both managerial risk-taking and IRM to acquireinnovation within the insurance industry. Innovation risks in the insurance indus-try are among the issues that demand considerable attention. Risk managementin insurance has an undeniable role in the improvement and effectiveness ofinsurance services and economic domains and consequently develops insuranceapproaches at the micro and macro levels. Thus, innovation in the insuranceindustry. Since Iranian insurance companies, as a business enterprise, are subjectto large fluctuations including operational, national, and political fields, dealingwith all risks associated with these areas in the innovation process requires theuse of national leadership. This indicates the high status of IRM in an insurancecompany in Iran.
306
REFERENCES
Consequently, the current study could assist both insurance managers and CEO’sto alter better guidelines and strategies to promote the outstanding risk frame-work throughout the entire company.
Second, our findings provide new insights concerning the role of IRM andman-agers’ risk-taking in facilitating innovation consequences. The results of our studychallenge the existing studies that propose the complementary effects of IRMandmanagerial risk-appetite for innovation. Third, insurance managers ought toconsider the efforts and rewards cautiously, when adopting the IRM framework.More particularly, insurance companies will reap an excessive level of revenueand overall performance and will gain more perception about every risk acrossinnovation procedure. Therefore, insurance companies’ should construct an ef-fective IRM system that oversees many systematic and strategic risks throughorganizational innovation. Fourth, insurancemanagers, need to be conscious thatmanagers’ risk-taking will inspire employees to be creative and could proportiontheir new thoughts freely in their organizational development.
This study has certain limitations regarding the study’s sample and setting. First,data were collected in the insurance sector as one of the leading financial instruc-tions, in Iran; therefore, the generalization of the study’ results to other financialinstitutions or other industries and countries with different risk cultures might berather. Thus, further studies in other areas and sectors to test themodel are highlyrecommended. Second, there is not a specific scale to measure IRM. Therefore,the IRM scale in this study may not be the best measurement scale.
Third, we examined the only effect of managerial risk-taking and IRM on inno-vation. Future research is needed to examine the effect of other variables oninnovation such as innovation culture or adding some control variables such asorganizational risk climate or company’s size.
References
Andersen, T. J. (2008). “The performance relationship of effective risk management: Exploring thefirm-specific investment rationale”. In: Long range planning 41.2, pp. 155–176.
Bilgin, M. H. and H. Danis (2016). Entrepreneurship, Business and Economics-Vol. 2: Proceedings ofthe 15th Eurasia Business and Economics Society Conference. Springer.
Bilgin, N., C. Kuzey, G. Torlak, and A. Uyar (2015). “An investigation of antecedents of organizationalcitizenship behavior in the Turkish hospitality industry: a structural equation approach”. In:International Journal of Culture, Tourism and Hospitality Research 9.2, pp. 200–222.
307

Impact of Managerial Risk-taking and IRM on Innovation
Birkinshaw, J., C. Bouquet, and J.-L. Barsoux (2011). “The 5myths of innovation”. In:MIT SloanManagement Review 52.2, p. 43.
Bowers, J. and A. Khorakian (2014). “Integrating risk management in the innovation project”. In:European Journal of innovation management 17.1, pp. 25–40.
Bromiley, P., M. McShane, A. Nair, and E. Rustambekov (2015). “Enterprise risk management:Review, critique, and research directions”. In: Long range planning 48.4, pp. 265–276.
Chin, W. W., B. L. Marcolin, and P. R. Newsted (2003). “A partial least squares latent variablemodeling approach for measuring interaction effects: Results from a Monte Carlo simulationstudy and an electronic-mail emotion/adoption study”. In: Information systems research 14.2,pp. 189–217.
Covin, J. G. and D. P. Slevin (1986). “The development and testing of an organizational-levelentrepreneurship scale”. In: Frontiers of entrepreneurship research 1.3, pp. 628–639.
Dess, G. G. and G. T. Lumpkin (2005). “The role of entrepreneurial orientation in stimulatingeffective corporate entrepreneurship”. In: The Academy of Management Executive 19.1, pp. 147–156.
Dess, G. G. and J. C. Picken (2000). “Changing roles: Leadership in the 21st century”. In: Organiza-tional dynamics 28.3, pp. 18–34.
Eckles, D. L., R. E. Hoyt, and S. M. Miller (2014). “Reprint of: The impact of enterprise risk manage-ment on the marginal cost of reducing risk: Evidence from the insurance industry”. In: Journalof Banking & Finance 49, pp. 409–423.
Evan, W. M. (1966). “Organizational lag”. In: Human organization 25.1, pp. 51–53.Faccio, M., M.-T. Marchica, and R. Mura (2011). “Large shareholder diversification and corporate
risk-taking”. In: The Review of Financial Studies 24.11, pp. 3601–3641.Fornell, C. and D. F. Larcker (1981). “Evaluating Structural Equation Models with Unobservable
Variables and Measurement Error”. In: Journal of Marketing Research 18.1, pp. 39–50.García-Granero, A., Ó. Llopis, A. Fernández-Mesa, andJ. Alegre (2015). “Unraveling the linkbetween
managerial risk-taking and innovation: The mediating role of a risk-taking climate”. In: Journalof Business Research.
Giannakis, M., S. Croom, and N. Slack (2004). “Supply chain paradigms”. In: Understanding supplychains, pp. 1–22.
Hair, J. F., G. T. M. Hult, C. M. Ringle, M. Sarstedt, and K. O. Thiele (2017). “Mirror, mirror on thewall: a comparative evaluation of composite-based structural equation modeling methods”. In:Journal of the Academy of Marketing Science 45.5, pp. 616–632.
Hair, J., G. T. Hult, C. Ringle, and M. Sarstedt (2016). A primer on partial least squares structuralequation modeling (PLS-SEM). Sage Publications.
Jimenez-Jimenez, D., R. Sanz Valle, and M. Hernandez-Espallardo (2008). “Fostering innovation:the role of market orientation and organizational learning”. In: European Journal of innovationmanagement 11.3, pp. 389–412.
Johnson ?, M. W. (2010). Risk management and innovation? Vol. ?3, p.41PM.Kim, Y., T. Y. Choi, and P. F. Skilton (2015). “Buyer-supplier embeddedness and patterns of inno-
vation”. In: International Journal of Operations and Production Management 35.3, pp. 318–345.
Kwak, D.-W., Y.-J. Seo, and R. Mason (2018). “Investigating the relationship between supply chaininnovation, risk management capabilities and competitive advantage in global supply chains”.In: International Journal of Operations & Production Management 38.1, pp. 2–21.
308

REFERENCES
Latham, S. F. and M. Braun (Feb. 2008). “Managerial Risk, Innovation, and Organizational Decline”.In: Journal of Management 35.2, pp. 258–281.
Li, J. and Y. I. Tang (2010). “CEO hubris and firm risk taking in China: The moderating role ofmanagerial discretion”. In: Academy of Management Journal 53.1, pp. 45–68.
Liu, G., W. W. J. Ko, I. Ngugi, and S. Takeda (2017). “Proactive entrepreneurial behaviour, marketorientation, and innovation outcomes: A study of small-and medium-sized manufacturingfirms in the UK”. In: European Journal of Marketing 51.11/12, pp. 1980–2001.
March, J. G. (1996). “Learning to be risk averse.” In: Psychological review 103.2, p. 309.Medrano, N. and C. Olarte-Pascual (2016). “The effects of the crisis onmarketing innovation: an
application for Spain”. In: Journal of Business & Industrial Marketing 31.3, pp. 404–417.Meulbroek, L. (2001). “A better way to manage risk”. In: Harvard business review 79.2, p. 22.Meulbroek, L. (2002a). “Integrated risk management for the firm: a senior manager’s guide”. In:Meulbroek, L. (2002b). “The promise and challenge of integrated risk management”. In: Risk
Management and Insurance Review 5.1, p. 55.Miller, K. D. and H. G. Waller (2003). “Scenarios, real options and integrated risk management”. In:
Long range planning 36.1, pp. 93–107.Nkundabanyanga, S. K., J. Opiso, W. Balunywa, and I. N. Nkote (2015). “Financial service outreach
correlates: Managerial competence and risk-taking behaviour”. In: International Journal ofSocial Economics 42.4, pp. 404–420.
Nocco, B. W. and R. M. Stulz (2006). “Enterprise riskmanagement: Theory and practice”. In: Journalof applied corporate finance 18.4, pp. 8–20.
Oxelheim, L., C.Wihlborg, andM. Thorsheim (2011). “TheCFO’s InformationChallenge inManagingMacroeconomic Risk”. In: The Strategic CFO. Springer, pp. 189–208.
Pauget, B. and A. Dammak (2018). “Towards a relational innovation”. In: Society and BusinessReview 13.1, pp. 5–14.
Ringle, C. M., S. Wende, and J.-M. Becker (2015). SmartPLS 3. Boenningstedt: SmartPLS GmbH.Ritchie, B. and C. Brindley (2007). “Supply chain risk management and performance: A guid-
ing framework for future development”. In: International Journal of Operations & ProductionManagement 27.3, pp. 303–322.
Salinah, T. (2016). “Factors influencing the effectiveness of enterprise risk management (ERM) inpublic listed companies/Salinah Togok”. PhD thesis.
Santarelli, E. and R. Piergiovanni (1996). “Analyzing literature-based innovation output indicators:the Italian experience”. In: Research Policy 25.5, pp. 689–711.
Santos, D. F. L., L. F. C. Basso, H. Kimura, and E. K. Kayo (2014). “Innovation efforts and perfor-mances of Brazilian firms”. In: Journal of Business Research 67.4, pp. 527–535.
Simon, M. and S. M. Houghton (2003). “The relationship between overconfidence and the intro-duction of risky products: Evidence from a field study”. In: Academy of Management Journal46.2, pp. 139–149.
Stosic, B., M. Mihic, R. Milutinovic, and S. Isljamovic (2017). “Risk identification in product inno-vation projects: new perspectives and lessons learned”. In: Technology Analysis & StrategicManagement 29.2, pp. 133–148.
Tidd, J., J. Bessant, and K. Pavitt (2005).Managing innovation integrating technological, marketand organizational change. John Wiley and Sons Ltd.
Togok, S. H., C. R. Isa, and S. Zainuddin (2016). “Enterprise risk management adoption in Malaysia:A disclosure approach”. In: Asian Journal of Business and Accounting 9.1, pp. 83–104.
Tommerberg, P. (2010). “Risk management models in two Norwegian institutions”. PhD thesis.
309

Impact of Managerial Risk-taking and IRM on Innovation
Tushman, M. L. and C. A. O’Reilly III (1996). “Ambidextrous organizations: Managing evolutionaryand revolutionary change”. In: California management review 38.4, pp. 8–29.
Wu, J. and Z. Wu (2014). “Integrated risk management and product innovation in China: Themoderating role of board of directors”. In: Technovation 34.8, pp. 466–476.
310
Enhanced FMEA for Supply Chain RiskIdentification
Lu Lu1, Zhou Rong1, Robert de Souza1
1 – National University of Singapore
Supply chain risk identification is fundamental for supply chain risk management.Its main purpose is to find critical risk factors for further attention. The failuremode effect analysis (FMEA) is well adopted in supply chain risk identification forits simplicity. It relies on domain experts’ opinions in giving rankings to risk factorsregarding three decision factors, e.g. occurrence frequency, detectability, andseverity equally. However, it may suffer from subjective bias of domain expertsand inaccuracy caused by treating three decision factors as equal. In this study,we propose a methodology to improve the traditional FMEA using fuzzy theoryand grey system theory. Through fuzzy theory, we design semantic items, whichcan cover a range of numerical ranking scores assessed by experts. Thus, differ-ent scores may actually represent the same semantic item in different degreesdetermined bymembership functions. In this way, the bias of expert judgementcan be reduced. Furthermore, in order to build an appropriate membership func-tion, experts are required to think thoroughly to provide three parameters. As theresults, they are enabled to givemore reliable judgement. Finally, we improve theranking accuracy by differentiating the relative importance of decision factors.Grey system theory is proposed to find the appropriate weights for those decisionfactors through identifying the internal relationship among them represented bygrey correlation coefficients. The results of the case study show the improvedFMEAdoes produce different rankings from the traditional FMEA. This is meaningful foridentifying really critical risk factors for further management.
Keywords: supply chain risk identification; FMEA; grey system theory; fuzzy settheory
First recieved: 01.Jul.2018 Revised: 10.Jul.2018 Accepted: 15.Jul.2018
311
Enhanced FMEA for Supply Chain Risk Identification
1 Introduction
Risk identification involving both risk classification and risk ranking canbe seen asa fundamental work for risks assessment. It identifies critical risks that need fur-ther assessment and treatment (Berman and Putu, 2012). Generally, researcherscategorize risks into several groups for systematically risk identification. In ourstudy, risks are classified into three levels—themacro level, the company leveland the industry level. Risks on the macro level may influence the whole supplychain’s operation; risks on the company level are from operation activities of acompany; risks on the industry level are from the development of industry (Zhouet al., 2012).
Subsequently, we still need to identifymost relevant risk factors so that only thoserelevant and important ones are studied further. As a large number of risk factorsthat may be involved, the easiest way is through risk ranking so that a companycan effectively mitigate them (Chopra and Sodhi, 2004). A comparison of nine riskranking techniques is shown in Table 1, where techniques are compared in fiveattributes—complexity of application, risk consequence analysis, risk probabilityanalysis, quantified output, and objectivity.
312
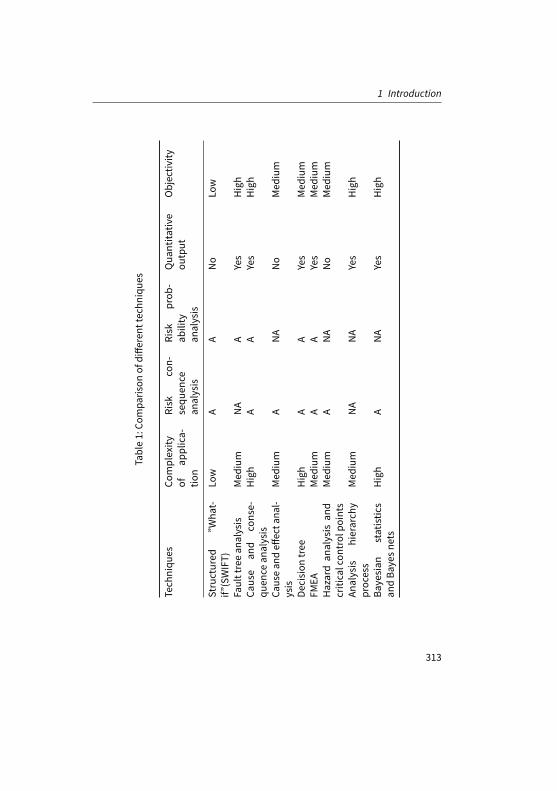
1 Introduction
Table1:Co
mpa
rison
ofdiffe
rent
tech
niqu
es
Tech
niqu
esCo
mplexity
ofap
plica-
tion
Risk
con-
sequ
ence
analysis
Risk
prob
-ab
ility
analysis
Qua
ntita
tive
output
Objectiv
ity
Structured
”Wha
t-if”
(SWIFT)
Low
AA
No
Low
Faulttreean
alysis
Med
ium
NA
AYes
High
Cause
and
conse-
quen
cean
alysis
High
AA
Yes
High
Causean
deff
ecta
nal-
ysis
Med
ium
ANA
No
Med
ium
Decision
tree
High
AA
Yes
Med
ium
FMEA
Med
ium
AA
Yes
Med
ium
Hazardan
alysis
and
criticalcon
trol
points
Med
ium
ANA
No
Med
ium
Analysis
hierarch
yprocess
Med
ium
NA
NA
Yes
High
Bayesian
statistic
san
dBa
yesn
ets
High
ANA
Yes
High
313
Enhanced FMEA for Supply Chain Risk Identification
According to the above table, risk ranking techniques can be classified into fourbig categories. The first category is a supporting method, which can only give ageneral analysis about the risks. For example, SWIFT uses a series of “What if”questions to identify the deviations from normal conditions with the help of apredefined checklist. The second category uses scenario analysis, which is goodatanalyzing the causes of risks. Fault tree analysis, cause and consequence analysis,cause and effect analysis, and decision tree belong to this category (Dakas et al.,2009, Hauptmanns, 2010, HichemandPepijn, 2007). The third category is functionanalysismethod including FMEA, hazard analysis, and critical control points. Theyfocus on analyzing the effects of risks. The final category is the statistical method,which applies the statistical knowledge into the analysis process. AHP and BBNbelong to this category.
FMEA has been adopted widely as it can produce quantitative output, which isdesirable for risk ranking. However, it may be biased as the opinions of domainexperts can be subjective. The target of the current study is to improve FMEA forits objectivity using fuzzy set theory and grey system theory.
The structure of the paper is as follows. The next section describes the traditionalFMEA; section 3 presents the enhanced FMEA. A case study is provided in section 4.Finally, conclusions are made in section 5.
2 The Traditional FMEA
FMEA identifies failure modes andmechanisms as well as their effects. There areseveral types of FMEA, e.g. design FMEA, system FMEA, process FMEA, serviceFMEA, software FMEA, etc. The current study adopts the FMEAmethodology. Inthe study, the systemmeans the supply chain while the failure mode refers to thepotential supply chain risk. For each risk, experts give three scores between oneand ten regarding the risk’s occurrence frequency (OF), detectability and severity.Then the risk priority number (RPN) can be calculated throughmultiplying thesethree score and represents the risk impact of the risk factor. The higher is the RPN,the more critical is the risk.
314

2 The Traditional FMEA
Table 2: Scores marked by experts
Risk Experts OF Detectability Severity
Risk 1 B1 4 5 9B2 5 1 5B3 2 2 8Average 3.7 2.7 7.3
Risk 2 B1 9 3 4B2 6 2 2B3 8 3 5Average 7.7 2.7 3.7
2.1 An Example
We assume that there are three domain experts—B1, B2 and B3, who give ranksregarding the risk impacts of two risk factors: risk 1 and risk 2 in a scale of 1 to 10.The greatest rank, 10, refers to the greatest risk impact. The summary of scoresmarked by experts is shown in Table 2.
Then, using the average numbers of three experts’ rankings, RPNs for risks 1 and2 can be calculated as RPN1=3.7*2.7*7.3=7.3 and RPN2=7.7*2.7*3.7=7.7, respec-tively. Since RPN2 is greater than RPN1, risk 2 is more risky than risk 1 accordingto those three experts.
2.2 Limitations of Traditional FMEA
Through the above example, three limitations of the traditional FMEA can berecognized. Firstly, there may be ranking differences among experts, which canlead to the inaccuracy of outcomes. For example, for the same degree of riskimpact, expert B1 may score 9 while expert B2 scores 7. Secondly, the approachdepends on the experience and knowledge of experts to a large degree and theoutcome can be very subjective. Finally, the RPN formula above does not considerthe relative importance of three decision factors. The severity of a risk factor couldbemore important than OF or detectability while in the current approach, threedecision factors are treated as equal. As a result, the above RPNmay not be ableto give accurate risk rankings.
315
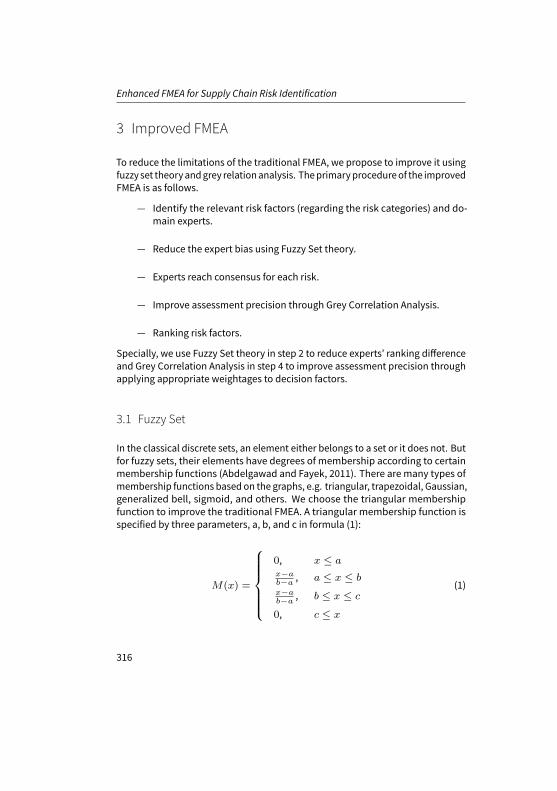
Enhanced FMEA for Supply Chain Risk Identification
3 Improved FMEA
To reduce the limitations of the traditional FMEA, we propose to improve it usingfuzzy set theoryandgrey relationanalysis. Theprimaryprocedureof the improvedFMEA is as follows.
— Identify the relevant risk factors (regarding the risk categories) and do-main experts.
— Reduce the expert bias using Fuzzy Set theory.
— Experts reach consensus for each risk.
— Improve assessment precision through Grey Correlation Analysis.
— Ranking risk factors.
Specially, we use Fuzzy Set theory in step 2 to reduce experts’ ranking differenceand Grey Correlation Analysis in step 4 to improve assessment precision throughapplying appropriate weightages to decision factors.
3.1 Fuzzy Set
In the classical discrete sets, an element either belongs to a set or it does not. Butfor fuzzy sets, their elements have degrees of membership according to certainmembership functions (Abdelgawad and Fayek, 2011). There are many types ofmembership functions based on the graphs, e.g. triangular, trapezoidal, Gaussian,generalized bell, sigmoid, and others. We choose the triangular membershipfunction to improve the traditional FMEA. A triangular membership function isspecified by three parameters, a, b, and c in formula (1):
M(x) =
0, x ≤ ax−ab−a
, a ≤ x ≤ b
x−ab−a
, b ≤ x ≤ c
0, c ≤ x
(1)
316

4 Case Study
whereM refers to themembership of score x. The value of themembership rangesfrom 0 to 1. The value of 1 represents the full membership.
3.2 Grey Relation Analysis
Grey system theory was first developed in 1982 (Deng, 1982). A grey systemgenerally refers to a system lacking certain information, e.g. structure message,operationmechanism, or behavior document. The aims of the grey system theoryare to provide theory, techniques, notions and ideas for resolving latent andintricate systems (Deng, 1982). This study adopts the grey relation analysis, whichdescribes the relationships between one main factor and all the other factors in agiven system. The degree of correlation among different factors is measured bytheir grey correlation coefficient. The greater is the value of coefficient, the closerrelationship is between the two factors.
4 Case Study
In this section, we use a case study to improve the traditional FMEA through theproposedmethodology. Assuming there are three risk factor, e.g. rawmaterialshortage, labour availability, and natural disaster as well as three experts, e.g.B1, B2, B3, the ranking process follows the five steps illustrated in sections 4.1 to4.5.
4.1 Identify the Relevant Risks List and Experts
Table 3 summarizes the risk factors and experts, which are identified for theranking process.
Risks identified are rawmaterial shortage (R1), labor availability (R2), and naturaldisaster (R3) while three experts, B1, B2 and B3 are from supply chain, operation,and R&D departments, respectively.
317

Enhanced FMEA for Supply Chain Risk Identification
Table 3: Risks and experts identified
Potential Risks Experts Department
Rawmaterial shortage (R1) B1 Supply chain department
Labor availability (R2) B2 Operation department
Natural disaster (R3) B3 R&D department
4.2 Reduce Experts Bias Using Fuzzy Set Theory
The process of reducing expert bias (ranking difference) includes 1) setting up thefuzzy semantic assessment set, 2) determiningmembership functions for fuzzysemantic items, and 3) calculating specific numbers for fuzzy semantic itemsthrough defuzzification.
4.2.1 Set up the fuzzy semantic assessment set (Faisal and Sarah, 2015)
In the study, the fuzzy semantic assessment set is designed to include the sematicitems of “very high”, “high”, “medium”, “low”, and “very low”. The implications ofthe five semantic items in terms of three decision factors, occurrence frequency,detectability, and severity are illustrated in Table 4.
The definitions of semantic items can guide experts to score a risk factor. In theabove table, the semantic item “very high” means “occurs in high frequency” foroccurrence frequency, “very hard to detect” for detectability, and “lead to failureof whole supply chain” for severity.
The purpose of the fuzzy sematic assessment set is to provide a few number ofsemantic items like “very high”, “high”, etc. to reflect experts’ numerical rankingsfrom 1-10. For example, given the same level of risk impact, different experts maygive different numerical scores of “7” or “9”. But in terms of semantic items, thesescores can be translated to either “high” or “very high” with certain degrees ofmembership. In this way, the ranking difference, e.g. the bias of experts can bereduced.
318
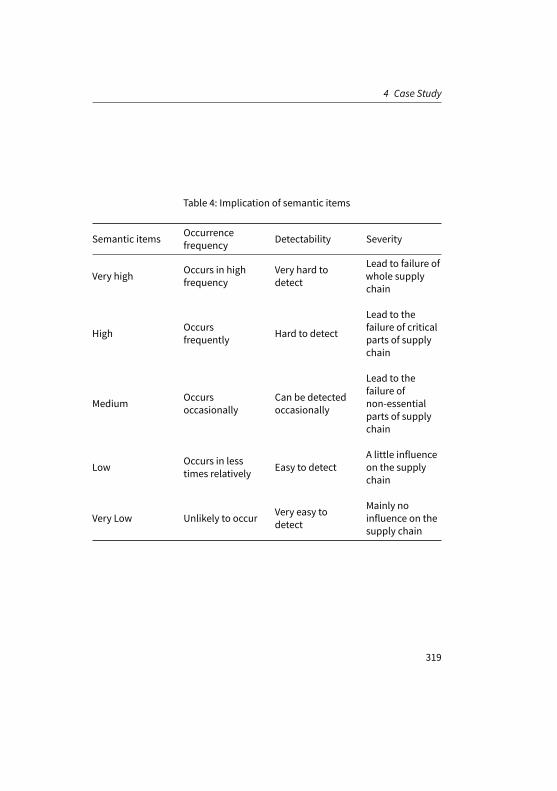
4 Case Study
Table 4: Implication of semantic items
Semantic items Occurrencefrequency Detectability Severity
Very high Occurs in highfrequency
Very hard todetect
Lead to failure ofwhole supplychain
High Occursfrequently Hard to detect
Lead to thefailure of criticalparts of supplychain
Medium Occursoccasionally
Can be detectedoccasionally
Lead to thefailure ofnon-essentialparts of supplychain
Low Occurs in lesstimes relatively Easy to detect
A little influenceon the supplychain
Very Low Unlikely to occur Very easy todetect
Mainly noinfluence on thesupply chain
319

Enhanced FMEA for Supply Chain Risk Identification
4.2.2 Determine membership functions of fuzzy semantic items
Themembership functions for the five semantic items, “very low (VL)”, “low (L)”,“medium (M)”, “high (H)”, and “very high (VH)” are given in Figure 1 regardingequation (1).
M
1.0
Mem
ber
ship
G
rad
es
Figure 1: The structure of membership functions
Each membership function is determined by three parameters describing therange of membership. For example, risk factors with scores from al to cl canbe generally considered as low risk factors. Score bl represents full “low risky”membership. For risk factors with scores close to al become less “low” but more“very low” risky. Similarly, those with scores close to cl become less “low” butmore “medium” risk. Three parameters determining a membership function areimportant and need domain experts’ inputs to find out their values.
Thus, instead of giving only one number representing absolute “low” risk, anexpert should thinkoverandgivea rangeofnumberswhichcanalsobeconsideredas “low” risk but with different degrees. In this way, experts are enabled to thinkthoroughly and give more feasible ranks of risks. Table 5 collects the inputs ofthree parameters for each semantic item from three experts (B1, B2, and B3). Thelast row is the average of three scores.
Subsequently, we have three parameters for eachmembership function throughTable 5:
— For semantic item “very low”: avl = 0, bvl = 0, cvl = 2.6;
320
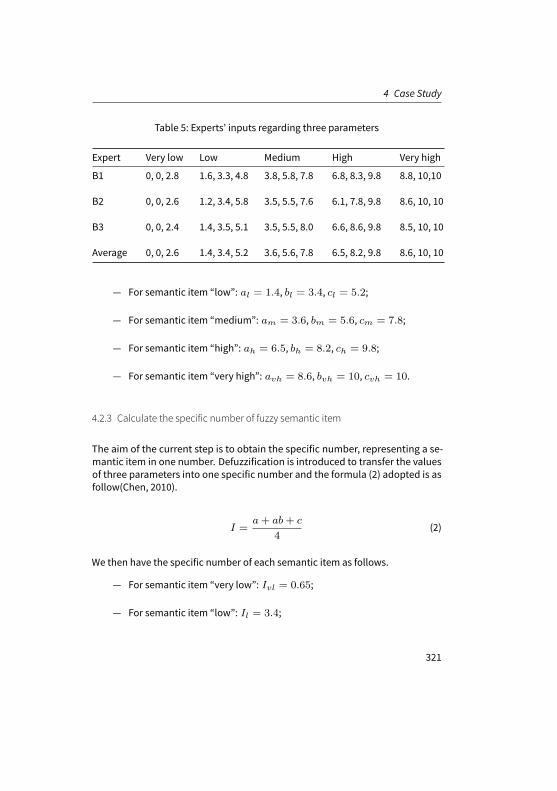
4 Case Study
Table 5: Experts’ inputs regarding three parameters
Expert Very low Low Medium High Very high
B1 0, 0, 2.8 1.6, 3.3, 4.8 3.8, 5.8, 7.8 6.8, 8.3, 9.8 8.8, 10,10
B2 0, 0, 2.6 1.2, 3.4, 5.8 3.5, 5.5, 7.6 6.1, 7.8, 9.8 8.6, 10, 10
B3 0, 0, 2.4 1.4, 3.5, 5.1 3.5, 5.5, 8.0 6.6, 8.6, 9.8 8.5, 10, 10
Average 0, 0, 2.6 1.4, 3.4, 5.2 3.6, 5.6, 7.8 6.5, 8.2, 9.8 8.6, 10, 10
— For semantic item “low”: al = 1.4, bl = 3.4, cl = 5.2;
— For semantic item “medium”: am = 3.6, bm = 5.6, cm = 7.8;
— For semantic item “high”: ah = 6.5, bh = 8.2, ch = 9.8;
— For semantic item “very high”: avh = 8.6, bvh = 10, cvh = 10.
4.2.3 Calculate the specific number of fuzzy semantic item
The aim of the current step is to obtain the specific number, representing a se-mantic item in one number. Defuzzification is introduced to transfer the valuesof three parameters into one specific number and the formula (2) adopted is asfollow(Chen, 2010).
I =a+ ab+ c
4(2)
We then have the specific number of each semantic item as follows.
— For semantic item “very low”: Ivl = 0.65;
— For semantic item “low”: Il = 3.4;
321

Enhanced FMEA for Supply Chain Risk Identification
— For semantic item “medium”: Im = 5.7;
— For semantic item “high”: Ih = 8.2;
— For semantic item “very high”: Ivh = 9.7;
In summary, the target of the current step is to reduce bias from experts in twoaspects. On the one hand, we establish a judgment standard using a fuzzy se-mantic assessment set so that we can have the same semantic item (very low,low, medium, high, and very high) from the ranges of scores given by experts. Onthe other hand, in order to establish membership functions, each expert shouldgive three numbers for each fuzzy semantic item describing the extension ofmembership. This enables them to think thoroughly and subsequently reducessubjectivity of judgment.
4.3 Establish the Judgment Matrix
Now, experts can rank risks R1 to R3 using semantic items (“very low”, “low”,“medium”, “high”, and “very high”) in terms of their occurrence frequency, de-tectability and severity. The outcomes of experts’ rankings are given in Table 6.
x =
xo1 xo2 xo3 xo4 xo5
xd1 xd2 xd3 xd4 xd5
xs1 xs2 xs3 xs4 xs5
(3)
Where “o”, “d”, and “s” represent decision factors “occurrence frequency”, “de-tectability”, and “severity”, respectively. The first row represents an expert’srankings of “occurrence frequency” in terms of five semantic items “very high”,“high”, “medium”, “low”, and “very low”, respectively. Similarly, the second andthird rows are the experts’ rankings of “detectability” and “severity”.
Thus, according to Table 6, we can summarize three experts’ judgements on threerisks regarding three decision factors in tables 8-10. Each entry records the totalcounts/percentage of same judgement from experts. For example, in Table 7,3 out 3 (100%) experts think that the “occurrence frequency” of Risk 1 is “veryhigh”; only 1 out 3 (33%) of them think that the “severity” of Risk 1 is “high”.
322

4 Case Study
Table 6: Judgment of experts
Expert Risk Occurrencefrequency Detectability Severity
B1 R1 M L VH
R2 H L M
R3 L M H
B2 R1 M M VH
R2 M M M
R3 M L VH
B3 R1 M L H
R2 H M M
R3 M L H
Table 7: Three experts’ average judgment for risk 1
VH H M L VL
Occurrencefrequency 0 0 3 (100%) 0 0
Detectability 0 0 1(33%) 2(67%) 0
Severity 2(67%) 1(33%) 0 0 0
323
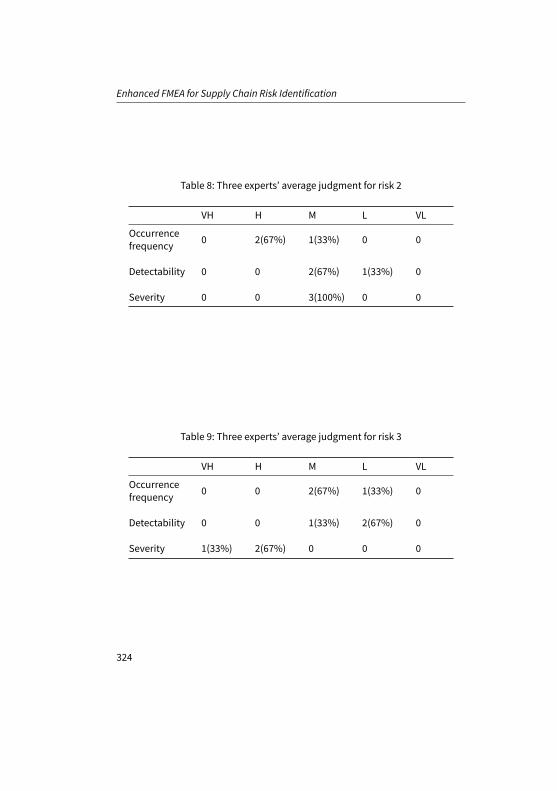
Enhanced FMEA for Supply Chain Risk Identification
Table 8: Three experts’ average judgment for risk 2
VH H M L VL
Occurrencefrequency 0 2(67%) 1(33%) 0 0
Detectability 0 0 2(67%) 1(33%) 0
Severity 0 0 3(100%) 0 0
Table 9: Three experts’ average judgment for risk 3
VH H M L VL
Occurrencefrequency 0 0 2(67%) 1(33%) 0
Detectability 0 0 1(33%) 2(67%) 0
Severity 1(33%) 2(67%) 0 0 0
324
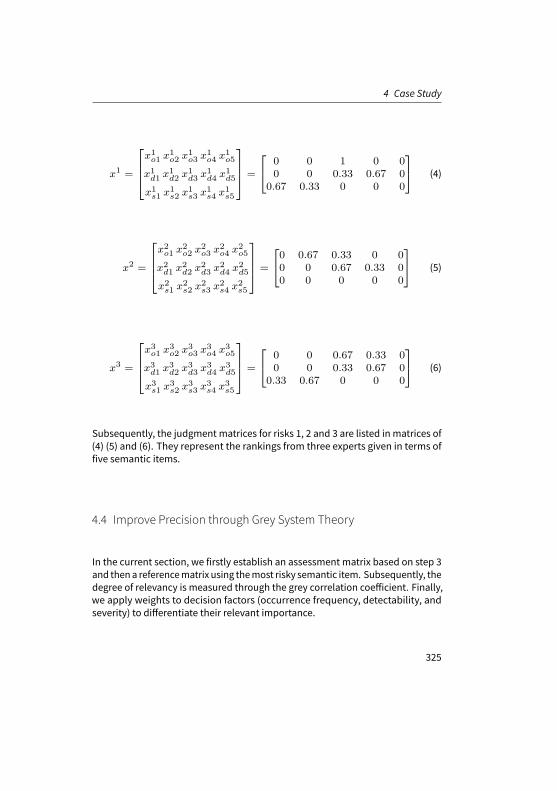
4 Case Study
x1 =
x1o1 x
1o2 x
1o3 x
1o4 x
1o5
x1d1 x
1d2 x
1d3 x
1d4 x
1d5
x1s1 x
1s2 x
1s3 x
1s4 x
1s5
=
0 0 1 0 00 0 0.33 0.67 0
0.67 0.33 0 0 0
(4)
x2 =
x2o1 x
2o2 x
2o3 x
2o4 x
2o5
x2d1 x
2d2 x
2d3 x
2d4 x
2d5
x2s1 x
2s2 x
2s3 x
2s4 x
2s5
=
0 0.67 0.33 0 00 0 0.67 0.33 00 0 0 0 0
(5)
x3 =
x3o1 x
3o2 x
3o3 x
3o4 x
3o5
x3d1 x
3d2 x
3d3 x
3d4 x
3d5
x3s1 x
3s2 x
3s3 x
3s4 x
3s5
=
0 0 0.67 0.33 00 0 0.33 0.67 0
0.33 0.67 0 0 0
(6)
Subsequently, the judgment matrices for risks 1, 2 and 3 are listed in matrices of(4) (5) and (6). They represent the rankings from three experts given in terms offive semantic items.
4.4 Improve Precision through Grey System Theory
In the current section, we firstly establish an assessment matrix based on step 3and thena referencematrix using themost risky semantic item. Subsequently, thedegree of relevancy is measured through the grey correlation coefficient. Finally,we apply weights to decision factors (occurrence frequency, detectability, andseverity) to differentiate their relevant importance.
325

Enhanced FMEA for Supply Chain Risk Identification
4.4.1 Establishment of assessment matrix and reference matrix
The assessment matrix is built based on the judgment matrices of (4) (5) and (6)and specific numbers of sematic items. The assessment matrix for three risks areformed as follow:
R =
r1o r1d r1sr2o r2d r2sr3o r3d r3s
(7)
Where
rio = Ivh × xio1 + Ih × xi
o2 + Im × xio3 + Il × xi
o4 + Ivl × xio5 is the score
of “occurrence frequency” for risk i.
rid = Ivh × xid1 + Ih × xi
d2 + Im × xid3 + Il × xi
d4 + Ivl × xid5 is the score
of “detectability” for risk i.
ris = Ivh × xis1 + Ih × xi
s2 + Im × xis3 + Il × xi
s4 + Ivl × xis5 is the score
of “severity” for risk i.
With specific numbers for five sematic items, e.g. Ivl = 0.65, Il = 3.4, Im = 5.7,Ih = 8.2, and Ivh = 9.7, we have:
— For risk 1, r1o = 5.7, r1d = 4.2, r1s = 8.9;
— For risk 2, r2o = 7.4, r2d = 4.9, r2s = 5.7;
— For risk 3, r3o = 4.9, r3d = 4.2, r3s = 8.7;
Then, we have the assessment matrix in (8).
R =
r1o r1d r1sr2o r2d r2sr3o r3d r3s
=
5.7 4.2 8.97.4 4.9 5.74.9 4.2 8.7
(8)
Furthermore, we use the specific number of semantic item “very high”, e.g. 9.7 toestablish the reference matrix in (9).
Rf =[rfo rfd rfs
]=
[9.7 9.7 9.7
](9)
326

4 Case Study
This referencematrix represents a very risky situationof a risk factorwhere the “oc-currence frequency”, “detectability”, and “severity” are all “very high” (Table 4).
4.4.2 Calculating the grey correlation coefficient
Nowwith the assessmentmatrix R in (8) and the referencematrixRf in (9), we cancalculate the grey correlation coefficient between them using the grey correlationcoefficient function (10) (Du et al., 2011):
λ(xfj , xij) =
mini|xfj − xij |+v
maxi
|xfj − xij |
|xfj − xij |+vmaxi
|xfj − xij |(10)
Where
i refers to risk i;
j refers to decision factor j;
f refers to the reference matrix entry;
λ(xfj , xij) refers to the grey correlation coefficient of entries xfj andxij ;
υ is the distinguishing coefficient; its value is within [0,1] and normallyv = 0.5.
Table 10 presents the results of all |xfj − xij | and the minimal and maximal
values are mini|xf − xi|= 0.8 andmax
i|xf − xi|= 5.5.
Thus, we have
λ1o =
mini|xfj − xij |+
0.5maxi
|xfj − xij |
|xfj − xij |+0.5max
i|xfj − xij |
=0.8 + 0.5× 5.5
4 + 0.5× 5.5= 0.52
(11)
327
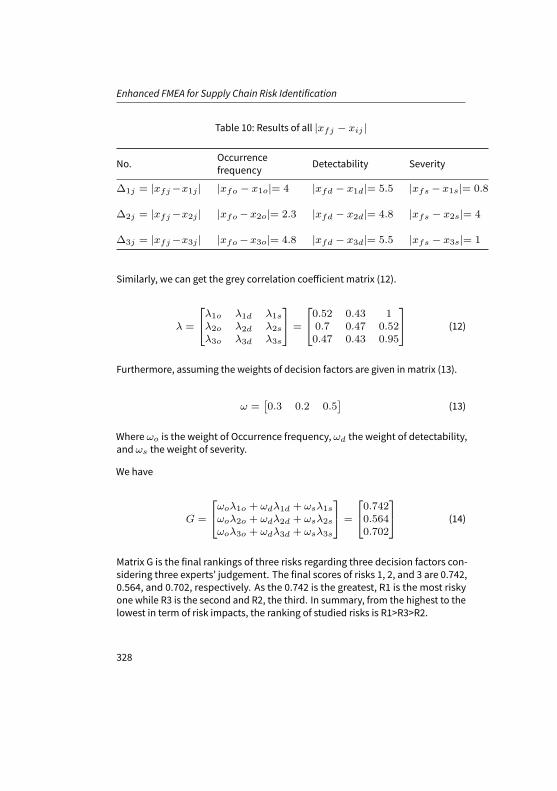
Enhanced FMEA for Supply Chain Risk Identification
Table 10: Results of all |xfj − xij |
No. Occurrencefrequency Detectability Severity
∆1j = |xfj−x1j | |xfo − x1o|= 4 |xfd − x1d|= 5.5 |xfs − x1s|= 0.8
∆2j = |xfj−x2j | |xfo −x2o|= 2.3 |xfd − x2d|= 4.8 |xfs − x2s|= 4
∆3j = |xfj−x3j | |xfo −x3o|= 4.8 |xfd − x3d|= 5.5 |xfs − x3s|= 1
Similarly, we can get the grey correlation coefficient matrix (12).
λ =
λ1o λ1d λ1s
λ2o λ2d λ2s
λ3o λ3d λ3s
=
0.52 0.43 10.7 0.47 0.520.47 0.43 0.95
(12)
Furthermore, assuming the weights of decision factors are given in matrix (13).
ω =[0.3 0.2 0.5
](13)
Where ωo is the weight of Occurrence frequency, ωd the weight of detectability,and ωs the weight of severity.
We have
G =
ωoλ1o + ωdλ1d + ωsλ1s
ωoλ2o + ωdλ2d + ωsλ2s
ωoλ3o + ωdλ3d + ωsλ3s
=
0.7420.5640.702
(14)
Matrix G is the final rankings of three risks regarding three decision factors con-sidering three experts’ judgement. The final scores of risks 1, 2, and 3 are 0.742,0.564, and 0.702, respectively. As the 0.742 is the greatest, R1 is the most riskyone while R3 is the second and R2, the third. In summary, from the highest to thelowest in term of risk impacts, the ranking of studied risks is R1>R3>R2.
328
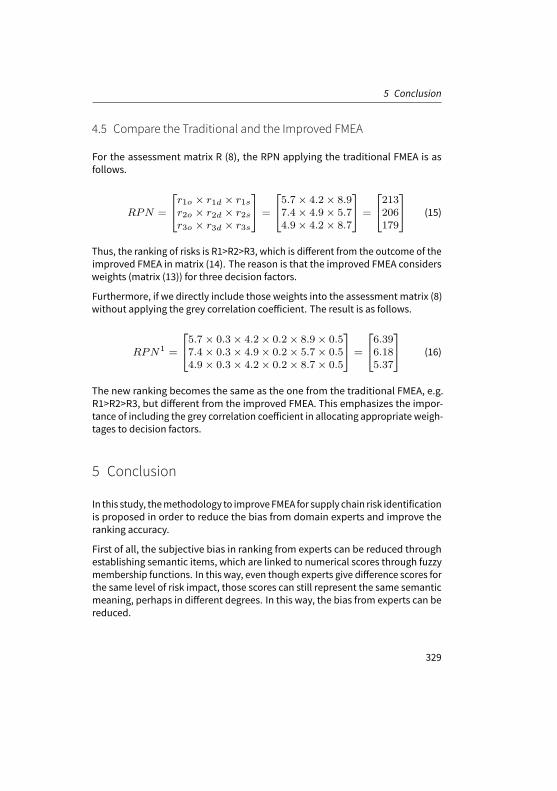
5 Conclusion
4.5 Compare the Traditional and the Improved FMEA
For the assessment matrix R (8), the RPN applying the traditional FMEA is asfollows.
RPN =
r1o × r1d × r1sr2o × r2d × r2sr3o × r3d × r3s
=
5.7× 4.2× 8.97.4× 4.9× 5.74.9× 4.2× 8.7
=
213206179
(15)
Thus, the ranking of risks is R1>R2>R3, which is different from the outcome of theimproved FMEA in matrix (14). The reason is that the improved FMEA considersweights (matrix (13)) for three decision factors.
Furthermore, if we directly include those weights into the assessment matrix (8)without applying the grey correlation coefficient. The result is as follows.
RPN1 =
5.7× 0.3× 4.2× 0.2× 8.9× 0.57.4× 0.3× 4.9× 0.2× 5.7× 0.54.9× 0.3× 4.2× 0.2× 8.7× 0.5
=
6.396.185.37
(16)
The new ranking becomes the same as the one from the traditional FMEA, e.g.R1>R2>R3, but different from the improved FMEA. This emphasizes the impor-tance of including the grey correlation coefficient in allocating appropriate weigh-tages to decision factors.
5 Conclusion
In this study, themethodology to improve FMEA for supply chain risk identificationis proposed in order to reduce the bias from domain experts and improve theranking accuracy.
First of all, the subjective bias in ranking from experts can be reduced throughestablishing semantic items, which are linked to numerical scores through fuzzymembership functions. In this way, even though experts give difference scores forthe same level of risk impact, those scores can still represent the same semanticmeaning, perhaps in different degrees. In this way, the bias from experts can bereduced.
329
Enhanced FMEA for Supply Chain Risk Identification
Furthermore, in order to build a membership function, three parameters are re-quested to represent the coverage of a semantic item in terms of numerical scores.This enables experts to think thoroughly and further improves the reliability oftheir judgement.
Finally, in the traditional FMEA, decision factors are treated equally in their rolesto determine the impact of a risk. This may not rational. In the improved FMEA,we differentiate the importance of decision factors in ranking risk impacts. Thegrey correlation coefficient is adopted to extract appropriate weights for decisionfactors. This further improves the accuracy of the ranking.
References
Abdelgawad, M. and A. Fayek (2011). “Fuzzy reliable analyzer:quantitative assessment of riskevents in the construction industry using fuzzy fault-tree analysis”. In: Journal of ConstructionEngineering and Management 137.4, pp. 294–302.
Berman, K. and D. K. Putu (2011). “SCRIS: a knowledge-based system tool for assisting manufac-turing organizations in identifying supply chain risks”. In: Journal of Manufacturing TechnologyManagement 23.7, pp. 834–852.
Chen, M. S. (2010). “Evaluating the rate of aggregative risk in software development using fuzzyset theory”. In: Cybernetics and Systems: An International Journal 30.1, pp. 57–75.
Chopra, S. andM. S. Sodhi (2004). “Managing risk to avoid supply chain breakdown”. In:MIT SloganManagement Review 46.1, pp. 53–62.
Dakas, I. M., D. A. Karras, and D. C. Panagiotakopoulos (2009). “Fault tree analysis and fuzzy expertsystems: early warning and emergency response of landfill operations”. In: EnvironmentalModeling & Software 24.1, pp. 8–25.
Deng, J. (1982). “Control problems of grey systems”. In: Systems and Control Letter 5, pp. 288–294.Du, D. L., J. Qiu, and H. Y. Zhao (2011). “Risk assessment study of manufacturing green supply
chain based on grey theory”. In: 2011 China located International Conference on InformationSystems for Crisis Response and Management.
Faisal, A. and L. S. Sarah (2015). “A fuzzy-based integrated framework for supply chain risk assess-ment”. In: International journal of production economics 161, pp. 54–63.
Hauptmanns, U. (2010). “A decision-making framework for protecting process plants from floodingbased on fault tree analysis”. In: Reliability Engineering & Sytem Safety 95.9, pp. 970–980.
Hichem,B. andC.Pepijn (2007). “Dynamic fault treeanalysis using input/output interactivemarkovchains. dependable systems and networks”. In: Internal Conference on 37th Annual IEEE/IFIP,pp. 708–717.
Zhou, R., R. De Souza, and M. Goh (2013). “Risk management of complex supply chains part 1:Supply chain risk and complex systems”. In: Vol. 12-Nov-SCI-09.
330