
The Research Repository - Gitarattan International Business ...
117
The Research Repository Volume 3, Number 1 August 2015 - July 2016
-
Upload
khangminh22 -
Category
Documents
-
view
4 -
download
0
Transcript of The Research Repository - Gitarattan International Business ...
The Research Repository
Volume 3, Number 1 August 2015 - July 2016
Yearly Journal of Gitarattan International Business School, Rohini, DelhiVolume 3, Number 1, August 2015 - July 2016
EDITORIAL ADVISORY BOARD
Prof. R. K. MittalProfessorGGSIP University, Delhi
Prof. K.C. SethiProf. Emeritus and Former Director, IMT, Ghaziabad
Prof. S. ChandrasekharFormer Professor FORE School of Management, Delhi
Prof. N. R. BhusnurmathManagement Development Institute (MDI), Gurgaon
vuqla/kku (Anusandhan) - The Research Repository: Published by Gitarattan International Business School,
Delhi. The views expressed in this Journal are those of the authors. No part of the publication may be reproduced in any form without the written consent of the Publisher. All rights reserved © Gitarattan International Business School (giBS).
EDITORIAL BOARD
Anirudh Jindal
Editor-in-ChiefProf. S. ChaturvediDirector
EditorsProf. A.S. PandeyProfessor
Dr. Neeru ChaudharyAssociate Professor
Dr. Uma GulatiAssociate Professor
Dr. SheetalAssociate Professor
Chief PatronShri R.N. JindalChairman, Gitarattan International Business School
PatronShri Vice Chairman, Gitarattan International Business School
- The Research Repository
Printed at: Accurate Printers, A-12A/1, Nanda Road, Adarsh Nagar, Delhi-110033

S.No. Title of the Paper Page No.
MARKETING
1 Factors Influencing Consumers' Socially Responsible Behaviour: A Study with
special reference to Delhi-NCR 1
Chirag Malik and Kriti Sharma
2 Factors Affecting Consumer Perception towards Online Shopping 9
Satish Chandra Gaur and Shreyansh Jain
3 Emotional Brand Relationship in Hospitality Industry: A Study on Hospitality
Branding in Delhi/NCR 14
Uma Gulati and Anirudh Kumaria
4 Consumers' Attitude Towards Eco-Friendly Products and Their Purchase Intention in
the Fast Moving Consumer Goods (FMCG) Sector 21
Gayatri Chopra and Nikhil Rajpal
5 Impact of Corporate Social Marketing on Consumer Attitude 26
Jyotsana Vaid and Ayush Gupta
6 Factors Affecting Compulsive Behaviour of Credit Card Users 30
Prerna Garg and Satyendra Kumar
7 Impact of Colour on Consumer Brand Perception 36
D. K. Choudhury and Shidharth Batra
FINANCE & INTERNATIONAL BUSINESS
8 Impact of Asset Quality on Profitability of Selected Public Sector Banks in India 42
Aisha Kakkar and Abhishek Sharma
9 Impact of Merger and Acquisition on Stock Return of Indian Firms with Special
Reference to Bank 48
Vikas Gupta and Surbhi Katal
10 Comparison of The Performance of Equity Mutual Funds: An Analysis Based on
Benchmark Tools 56
Pooja Chaturvedi Sharma and Ishant Goel
11 Correlation of BSE Sensex with BSE Bankex 63
Richa Joshi and Ayushi Jain
ANUSANDHAN - THE RESEARCH REPOSITORY 2015 -2016
CONTENTS
12 Relationship Between BSE Index Returns and Financial Services Returns 69
Swati Jain and Lokesh
13 Consumer Ethnocentrism of Consumer Perception in India with special reference to Cosmetic
Industry 74
Shuchi Singhania and Neha Aggarwal
HUMAN RESOURCE MANAGEMENT
14 Impact of Maternity Benefits on Job Satisfaction in Private Health Care Sector in Delhi 81
Anup Kumar Ghosh and Mona Chanchal
15 Impact of Emotional Labour and Emotional Intelligence on the Perception of
Effective Leadership 89
Sheetal and Anu Gautam
16 Impact of Organisational Culture on Employee Commitment 94
Shweta Malhotra and Kanishka Chauhan
17 Employee Engagement in BPO Sector 99
Kanupriya Malhotra and Akshat Bhardwaj
18 Role of Organisational Culture in Formation of Organisational Citizenship Behavior
in Public and Private Banks 103
Mitu Mandal and Himanshi Bhadouria
19 Role of Appraisal Techniques on Employee Satisfaction with Emphasis on E-Commerce
Firms 108
Meetali Bahl and Rajni Yadav

Anusandhan - The Research Repository, Volume 3, Number 1 1
FACTORS INFLUENCING CONSUMERS' SOCIALLY RESPONSIBLE BEHAVIOUR :
A STUDY WITH SPECIAL REFERENCE TO DELHI-NCR
Chirag Malik1
Kriti Sharma2
ABSTRACT
The consumption pattern of consumers is rapidly changing and now consumer has several options before buying any service or
the product. There are multiple number of factors which influence a consumer before buying a product. One of the major factors
which consumers tend to ignore is the social factor. That is the impact of the consumption on the society as a whole. Being
responsible towards the society is the buzz word in the present time. Consumers must be inclined towards the society and must
think about the impact of his consumption behaviour on the society at large. This paper aims at identifying the factors which
contribute in formation of socially responsible behaviour with special reference to socio-psychological dimensions. Descriptive
research along with factor analysis was used to identify the factors influencing consumers' socially responsible behaviour
(SRB). Four factors, namely, 'individual effectiveness', 'social security', 'social inclination', and 'social savings', were identified
affecting socially responsible behaviour.
Keywords: Ecological Concern, Socio-psychological factors, Socially Responsible Behaviour, Social Security.
1 Assistant Professor, Gitarattan International Business School, Rohini, New Delhi2 Student, Gitarattan International Business School, Rohini, New Delhi
INTRODUCTION
Socially responsible behaviour is an ethical framework that
has an obligation to act for the benefit of society, as a whole. It
involves certain duties that every individual should perform in
order to maintain a balance between economy and economic/
ecosystem. Social responsibility focuses mainly on the welfare
of the society and the environment and it should not be limited
to the organization but also the individuals of the society.
If an individual doesn’t smoke a cigarette, he is directly
performing his social responsibility by taking a protective
measure for himself as well as the environment and
surrounding. Similarly, if an individual is engaged with an
institution or activities which promote anti-smoking, he/she is
taking a protective measure which is affecting indirectly the
environment and surrounding. Furthermore, individual’s
socially responsible behaviour is an act that morally binds and
suggests that each person should act in such a way that
minimizes the adverse effect to those immediately around them.
It is a commitment everyone should have towards society by
contributing towards social, cultural and ecological causes. It
is based on individual’s ethics and supports issues for
philanthropic reasons. Consumers’ socially responsible
behaviour is majorly affected by his/her culture, attitude and
personality, values and belief system.
Culture is a set of values, norms and attitudes that are the
essence of human behaviour. The behavior that results from
culture is usually passed from one generation to the next.
Several years ago, certain actions were taken by government
to ban the use of plastic bags as plastic is not recyclable and
liters the environment but individuals did not realize their social
responsibility and turned a deaf ear to the ban.
Values are principles, standards or qualities that an individual
or group of people hold in high regard. These values guide the
way we live our lives and the decision we make. Beliefs come
from real experiences but often individuals forget that the
original experience is not the same as what is happening in life
now. Our values and beliefs affect the quality of our work and
relationships. Attitude can be referred to as lasting group of
feelings, beliefs and behavior tendencies directed towards
specific people, group, ideas or objects.
Urgency: Individual behaviour is such that it tends to fluctuate
when urgency is created in its surrounding or if worse situation
comes up. As the environment is getting polluted day by day,
the organizations came up with the idea of green products.
These products are non-toxic, energy and water-efficient and
harmless to the environment are called green products. These
are also recyclable and biodegradable. Products are certified
as green only if they satisfy the norms of government
environmentally preferable products (EPP) program, Fair
Trade, Energy star. Oil Gone Easy Home-This is an eco-friendly
product that is used to clean oil stains. It is called a green
product because it makes use of bioremediation technology,
which cleans oil and fuel spills without harming the
environment.
Awareness: The green products developed are to be promoted
in such a manner that individuals as consumers are aware about
these products. It’s important and urgent to inform consumers
the adverse effects of the current products in comparison to
green products. Green products are natural products such as
wooden cabinets, tables and chairs, plastics are not green
products, silk and cotton is natural, nylon and rayon are not.
Anything made from bamboo is a green product.
Anusandhan - The Research Repository, Volume 3, Number 12
Interest: Individuals behaviour is affected when he/she has
own interest in something. As a consumer, person tries to
minimize the cost and maximize his benefit. Such an example
can be an individual purchasing a CNG or Solar vehicle in
order to save the cost of petrol or diesel. This indirectly leads
to fulfillment of social responsibility as CNG is environment
friendly.
Although forms of ethical consumption have been around for
a long time, this phenomenon has only risen to prominence in
the last decade (Carrigan, Szmigin and Wright, 2004). Today,
ethical consumerism addresses the social and environmental
consequences of globalization, where the “consumer considers
not only individual but also social goals, ideals and ideologies”
(Uusitalo and Oksanen, 2004). This has fueled a debate on the
importance of ethical consumerism to the marketing of products
and the day-to-day strategic management of business (Auger,
Burke, Devinney and Louviere, 2003). It is apparent from the
arguments above that for the consumer who cares about
corporate social responsibility (CSR), the level of social
responsibility observed by companies bolsters or diminishes
the value of the product or service that they provide (Mohr
and Webb, 2005). What makes for a socially responsible and
ethical consumer? Are all consumers socially responsible? A
number of researchers have investigated the characteristic of
this ethical and socially responsible consumer (Antil, 1984;
Leigh, Murphy and Enis, 1988; Roberts, 1995). Their findings
suggest that a number of personal traits would affect ‘if’ or
‘how’ strongly consumers respond to a company’s level of
social responsibility. They termed one such attribute socially
responsible consumer behavior (SRCB), which is an enduring
trait that involves the consumer’s concept of self.
Socially responsible consumer behaviour involves the concept
of Ethical consumerism (alternatively called ethical
consumption, ethical purchasing, moral purchasing, ethical
sourcing, ethical shopping or green consumerism) is a type of
consumer activism that is based on the concept of dollar voting.
It is practiced through ‘positive buying’ in that ethical products
are favored, or ‘moral boycott’, that is negative purchasing
and company-based purchasing.
OBJECTIVE OF THE STUDY
To identify demographic and socio-psychological factors which
influence the socially responsible behaviour of consumers.
RESEARCH METHODOLOGY
Data Collection
The data has been collected from primary sources. Descriptive
research design is adopted in this paper. Data collection
instrument is questionnaire which is designed using
standardized scale having 30 questions in all. Convenience
and judgmental sampling is used. Total sample size was 150
respondents.
To identify the relevant factors influencing socially responsible
behaviour, factor analysis is used. T-test and Anova are used
to test the influence of demographic attributes on socially
responsible behavior.
LITERATURE REVIEW
Today’s consumers are fully informed and committed ethical
consumers who seek out environmentally friendly product and
boycott those firms perceived as unethical as the information
guides the ethical purchasing behaviour, Sproles et al., (1978).
According to Roberts (1996) an attitude-behaviour gap was
identified where the consumers expressed willingness to make
ethical purchases linked to good reputation. The discussion
was taken to some respondents where they stated that if the
consumers were made aware of any unethical corporate
behaviour through media exposure it would affect their
purchase decision. Like everyone knows about McDonald’s
cutting down trees and promoting unhealthy food but still
everyone eats at McDonalds. At the end all respondents thought
that the firm’s social behaviour doesn’t influence the purchase
behaviour of consumers and it depends on every consumer
what attitude he/she has while purchasing the product.
Mohr, Webb, and Harris (2004) defined consumers with the
SRCB trait as ‘‘a person basing his or her acquisition, usage,
and disposition of products on a desire to minimize or eliminate
any harmful effects and maximize the long-run beneficial
impact on society.’’ Consumers who are high on this attribute
would alter their consumption pattern in a wide variety of ways
in order to endeavor toward the ideal of improving society.
They would avoid buying products that might harm society or
the environment and actively seek out products and services
from companies that practice social responsibility (Mohr and
Webb, 2005). Schrum, McCarthy and Lowry (1995) further
classified this segment of consumers as more likely to be
opinion leaders, knowledgeable information seekers and careful
shoppers. They found that only consumers that were active
information seekers would switch from their current brand to
a less effective but environmentally friendly brand. However,
some limitations of the SRCB approach may be that existing
concepts of SRCB imposed on consumers represent the first
and foremost limitation of the study. Respondents had to rate
the importance of different responsibilities and actions that
had been defined and classified in advance. Therefore, the
findings report on their evaluations of certain pre-defined
concepts of socially responsible behavior, but do not describe
consumers’ own definition of these responsibilities.
Haesun and Stoel (2005) explained a model of socially
responsible buying decision making process. It has become a
complicated issue in the society and for which the purpose of
the study was to build an exploratory model by adopting ethics
and attitude theories. The Socially Responsible Behaviour
(SRB) scale created for this study is focused on the apparel/
shoe buying context, which may limit its applicability to other
industries. Also, SRB was measured through subjective
Anusandhan - The Research Repository, Volume 3, Number 1 3
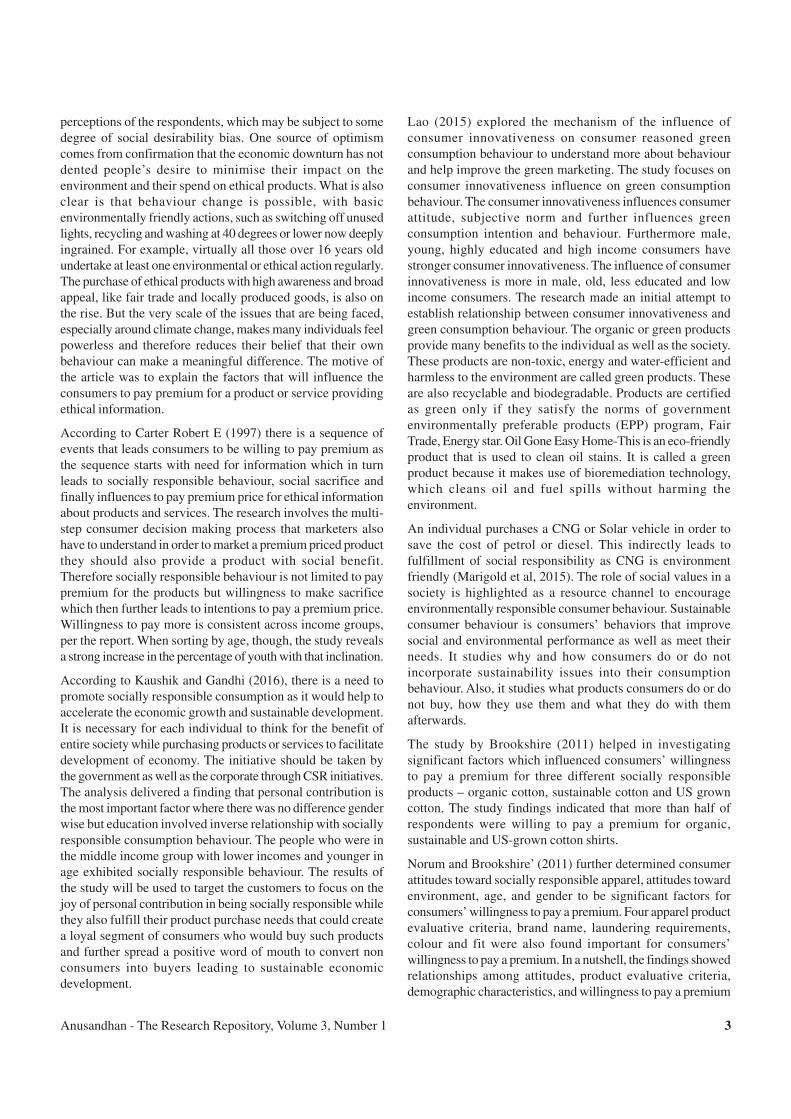
perceptions of the respondents, which may be subject to some
degree of social desirability bias. One source of optimism
comes from confirmation that the economic downturn has not
dented people’s desire to minimise their impact on the
environment and their spend on ethical products. What is also
clear is that behaviour change is possible, with basic
environmentally friendly actions, such as switching off unused
lights, recycling and washing at 40 degrees or lower now deeply
ingrained. For example, virtually all those over 16 years old
undertake at least one environmental or ethical action regularly.
The purchase of ethical products with high awareness and broad
appeal, like fair trade and locally produced goods, is also on
the rise. But the very scale of the issues that are being faced,
especially around climate change, makes many individuals feel
powerless and therefore reduces their belief that their own
behaviour can make a meaningful difference. The motive of
the article was to explain the factors that will influence the
consumers to pay premium for a product or service providing
ethical information.
According to Carter Robert E (1997) there is a sequence of
events that leads consumers to be willing to pay premium as
the sequence starts with need for information which in turn
leads to socially responsible behaviour, social sacrifice and
finally influences to pay premium price for ethical information
about products and services. The research involves the multi-
step consumer decision making process that marketers also
have to understand in order to market a premium priced product
they should also provide a product with social benefit.
Therefore socially responsible behaviour is not limited to pay
premium for the products but willingness to make sacrifice
which then further leads to intentions to pay a premium price.
Willingness to pay more is consistent across income groups,
per the report. When sorting by age, though, the study reveals
a strong increase in the percentage of youth with that inclination.
According to Kaushik and Gandhi (2016), there is a need to
promote socially responsible consumption as it would help to
accelerate the economic growth and sustainable development.
It is necessary for each individual to think for the benefit of
entire society while purchasing products or services to facilitate
development of economy. The initiative should be taken by
the government as well as the corporate through CSR initiatives.
The analysis delivered a finding that personal contribution is
the most important factor where there was no difference gender
wise but education involved inverse relationship with socially
responsible consumption behaviour. The people who were in
the middle income group with lower incomes and younger in
age exhibited socially responsible behaviour. The results of
the study will be used to target the customers to focus on the
joy of personal contribution in being socially responsible while
they also fulfill their product purchase needs that could create
a loyal segment of consumers who would buy such products
and further spread a positive word of mouth to convert non
consumers into buyers leading to sustainable economic
development.
Lao (2015) explored the mechanism of the influence of
consumer innovativeness on consumer reasoned green
consumption behaviour to understand more about behaviour
and help improve the green marketing. The study focuses on
consumer innovativeness influence on green consumption
behaviour. The consumer innovativeness influences consumer
attitude, subjective norm and further influences green
consumption intention and behaviour. Furthermore male,
young, highly educated and high income consumers have
stronger consumer innovativeness. The influence of consumer
innovativeness is more in male, old, less educated and low
income consumers. The research made an initial attempt to
establish relationship between consumer innovativeness and
green consumption behaviour. The organic or green products
provide many benefits to the individual as well as the society.
These products are non-toxic, energy and water-efficient and
harmless to the environment are called green products. These
are also recyclable and biodegradable. Products are certified
as green only if they satisfy the norms of government
environmentally preferable products (EPP) program, Fair
Trade, Energy star. Oil Gone Easy Home-This is an eco-friendly
product that is used to clean oil stains. It is called a green
product because it makes use of bioremediation technology,
which cleans oil and fuel spills without harming the
environment.
An individual purchases a CNG or Solar vehicle in order to
save the cost of petrol or diesel. This indirectly leads to
fulfillment of social responsibility as CNG is environment
friendly (Marigold et al, 2015). The role of social values in a
society is highlighted as a resource channel to encourage
environmentally responsible consumer behaviour. Sustainable
consumer behaviour is consumers’ behaviors that improve
social and environmental performance as well as meet their
needs. It studies why and how consumers do or do not
incorporate sustainability issues into their consumption
behaviour. Also, it studies what products consumers do or do
not buy, how they use them and what they do with them
afterwards.
The study by Brookshire (2011) helped in investigating
significant factors which influenced consumers’ willingness
to pay a premium for three different socially responsible
products – organic cotton, sustainable cotton and US grown
cotton. The study findings indicated that more than half of
respondents were willing to pay a premium for organic,
sustainable and US-grown cotton shirts.
Norum and Brookshire’ (2011) further determined consumer
attitudes toward socially responsible apparel, attitudes toward
environment, age, and gender to be significant factors for
consumers’ willingness to pay a premium. Four apparel product
evaluative criteria, brand name, laundering requirements,
colour and fit were also found important for consumers’
willingness to pay a premium. In a nutshell, the findings showed
relationships among attitudes, product evaluative criteria,
demographic characteristics, and willingness to pay a premium

Anusandhan - The Research Repository, Volume 3, Number 14
for three different options of socially responsible cotton apparel,
in order to help close the gap between attitudes and behaviour
in consumer research.
An exploratory study conducted by ‘Simona Romani’ and
‘Silvia Grappi’ (2014), tested the role of moral elevation as a
mediator that facilitates the effects of company CSR activities
in social domains on two specific types of pro-social behaviour
displayed by consumers: ‘donating money’ and ‘volunteering
time’ for the same cause sponsored by the company. The authors
conducted two quantitative studies to test their hypothesis. By
using experimental and control conditions, they were able to
manipulate corporate actions in social contexts, and a
meditational analysis was conducted. Further, the results
showed that moral elevation mediates the positive relationship
between CSR activity and consumer intention to donate to
social causes and the CSR activity and volunteering intention.
Singh (2009) used a slightly modified SRCB scale in the study
among two equal groups representing urban and rural
consumers. The study further determined that urban
respondents scored high in all demographic categories in
comparison with rural consumers. The behaviour was quite
symmetrical in both the groups (gender-wise). There was an
inverse relationship between socially responsible consumer
behaviour-mean values and educational level. In respect of age
group, young females demonstrate high scoring on the socially
responsible consumer behaviour scale. According to income
level, significant difference was revealed in urban area where
the lower income category scored high because they had just
begun earning.
Kozar and Connell (2013) developed an online questionnaire
to assess knowledge of and attitude towards, issues of social
responsibility, including social and environmental aspects
related to production and distribution of apparel and textile
goods. Participants were students. Later, it was found that
participants were knowledgeable and attitudes of social and
environmental issues were significant predictors of socially
and environmentally responsible purchasing behaviour. This
study found that consumers have the ability to effect change in
the marketplace through their purchasing behaviour. Socially
and environmentally responsible operation is essential for
development which only reaches its full significance if practiced
on a sustainable basis. Consumers with the socially responsible
consumer behaviour trait act as a person basing his or her
acquisition, usage, and disposition of products on a desire to
minimize or eliminate any harmful effects and maximize the
long-run beneficial impact on society. Consumers who are high
on this attribute would alter their consumption pattern in a wide
variety of ways in order to endeavor toward the ideal of
improving society. They would avoid buying products that
might harm society or the environment and actively seek out
products and services from companies that practice social
responsibility.
Culture can be seen as a system of meanings shared by members
of a specific society. Different cultures may give prominence
to different values and these values can affect the roles that
companies play in society, Burton, Farh and Hegarty, (2000).
Culture represents an evolving and on-going set of norms and
values, where acculturation is characterized by conflict,
creativity, democratization, disagreement, innovation, internal
or external industrialization and modernization (Oyserman
1993; Rohner 1984). Research on cultural values (Hofstede,
1980) suggests that the value systems differ from country to
country. Fischer et al. (2010) argue that in the context of
marketing, this can be relevant since the meaning of brands
may vary between individuals from different countries.
The collection of information for the estimation of the model
was done through surveys and the main findings suggested
that Portuguese consumers are guided by personal cultural
values as Consumer Innovativeness, Tradition and Consumer
Ethnocentrism which influences consumer perceptions about
the social responsibility practices. Schneider Susan et al 2005,
further determined these factors or elements as – cognition,
values and emotions. According to the findings, cognition refers
to ascription of responsibility to oneself that determines whether
people act in accordance of their moral obligation (Eisenberg,
1996). It is a personal feeling that motivates voluntary
responsible behavior and if a consumer has a high score on its
integrity and morality, he will be highly socially responsible.
The purpose of this research paper was to highlight the role
and importance of consumer education and awareness in
enhancing or developing socially responsible behavior. Alvin
and Ben (2000) observed and concluded in their findings that
consumer education programs can provide significant benefits,
including identification of market information, complaint and
consumer redress procedures and understanding a more
advanced, updated and technology–based consumer
environment.
All purchase behaviour is in some sense ethical involves moral
judgment. The paper is more focused on ethical decision
making involving purchase decisions where those ethical
concerns are tied to business practices. Sandra J. Burke
developed hypothesis which had different results as each had
different concerns.
ANALYSIS AND DISCUSSION
Reliability Test
Table 1: Reliability Measurement
Reliability Statistics
Cronbach's Alpha N of Items
0.921 29
By using SPSS software, reliability test was The Th The
consistency of the questionnaire was evaluated using
Cronebach’s Alpha value which was calculated as 0.921. Since
the value of Cronbach’s Alpha is more than the acceptable value
of 0.6, it implies that the scale used is reliable.
Anusandhan - The Research Repository, Volume 3, Number 1 5
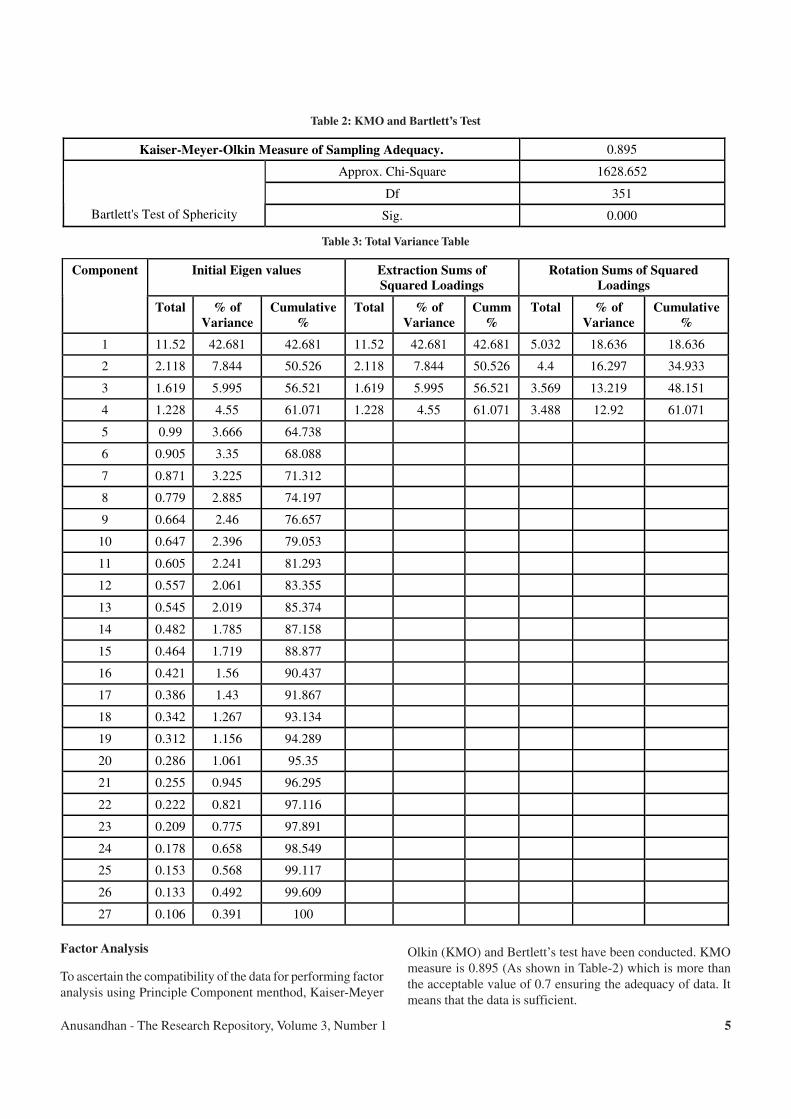
Table 2: KMO and Bartlett’s Test
Kaiser-Meyer-Olkin Measure of Sampling Adequacy. 0.895
Approx. Chi-Square 1628.652
Df 351
Bartlett's Test of Sphericity Sig. 0.000
Table 3: Total Variance Table
Initial Eigen values Extraction Sums of
Squared Loadings
Rotation Sums of Squared
Loadings
Component
Total % of
Variance
Cumulative
%
Total % of
Variance
Cumm
%
Total % of
Variance
Cumulative
%
1 11.52 42.681 42.681 11.52 42.681 42.681 5.032 18.636 18.636
2 2.118 7.844 50.526 2.118 7.844 50.526 4.4 16.297 34.933
3 1.619 5.995 56.521 1.619 5.995 56.521 3.569 13.219 48.151
4 1.228 4.55 61.071 1.228 4.55 61.071 3.488 12.92 61.071
5 0.99 3.666 64.738
6 0.905 3.35 68.088
7 0.871 3.225 71.312
8 0.779 2.885 74.197
9 0.664 2.46 76.657
10 0.647 2.396 79.053
11 0.605 2.241 81.293
12 0.557 2.061 83.355
13 0.545 2.019 85.374
14 0.482 1.785 87.158
15 0.464 1.719 88.877
16 0.421 1.56 90.437
17 0.386 1.43 91.867
18 0.342 1.267 93.134
19 0.312 1.156 94.289
20 0.286 1.061 95.35
21 0.255 0.945 96.295
22 0.222 0.821 97.116
23 0.209 0.775 97.891
24 0.178 0.658 98.549
25 0.153 0.568 99.117
26 0.133 0.492 99.609
27 0.106 0.391 100
Factor Analysis
To ascertain the compatibility of the data for performing factor
analysis using Principle Component menthod, Kaiser-Meyer
Olkin (KMO) and Bertlett’s test have been conducted. KMO
measure is 0.895 (As shown in Table-2) which is more than
the acceptable value of 0.7 ensuring the adequacy of data. It
means that the data is sufficient.
Anusandhan - The Research Repository, Volume 3, Number 16
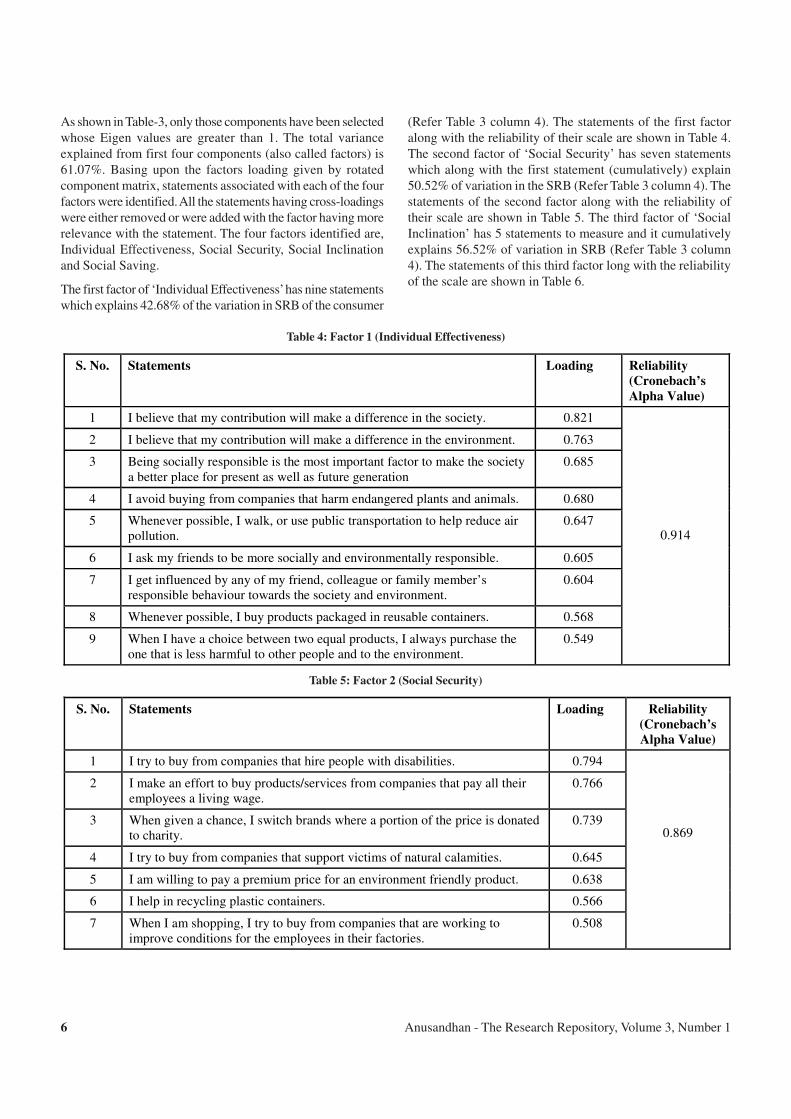
As shown in Table-3, only those components have been selected
whose Eigen values are greater than 1. The total variance
explained from first four components (also called factors) is
61.07%. Basing upon the factors loading given by rotated
component matrix, statements associated with each of the four
factors were identified. All the statements having cross-loadings
were either removed or were added with the factor having more
relevance with the statement. The four factors identified are,
Individual Effectiveness, Social Security, Social Inclination
and Social Saving.
The first factor of ‘Individual Effectiveness’ has nine statements
which explains 42.68% of the variation in SRB of the consumer
(Refer Table 3 column 4). The statements of the first factor
along with the reliability of their scale are shown in Table 4.
The second factor of ‘Social Security’ has seven statements
which along with the first statement (cumulatively) explain
50.52% of variation in the SRB (Refer Table 3 column 4). The
statements of the second factor along with the reliability of
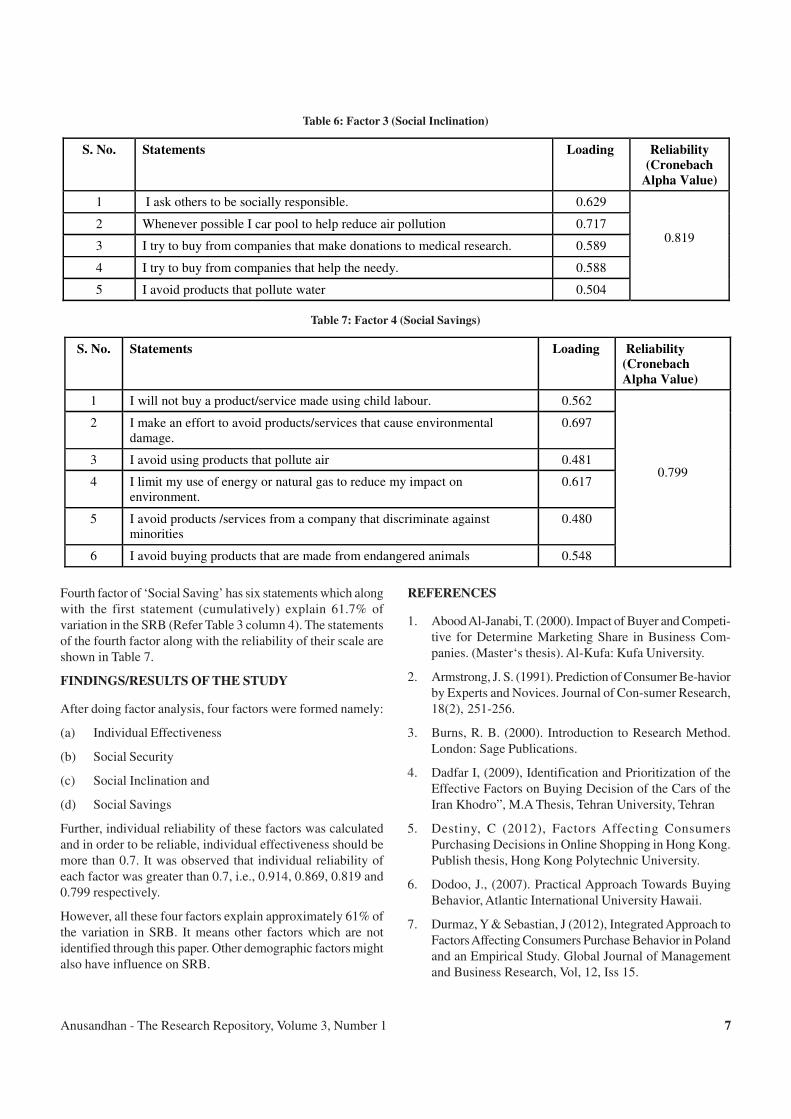
their scale are shown in Table 5. The third factor of ‘Social
Inclination’ has 5 statements to measure and it cumulatively
explains 56.52% of variation in SRB (Refer Table 3 column
4). The statements of this third factor long with the reliability
of the scale are shown in Table 6.
Table 4: Factor 1 (Individual Effectiveness)
S. No. Statements Loading Reliability
(Cronebach’s
Alpha Value)
1 I believe that my contribution will make a difference in the society. 0.821
2 I believe that my contribution will make a difference in the environment. 0.763
3 Being socially responsible is the most important factor to make the society a better place for present as well as future generation
0.685
4 I avoid buying from companies that harm endangered plants and animals. 0.680
5 Whenever possible, I walk, or use public transportation to help reduce air pollution.
0.647
6 I ask my friends to be more socially and environmentally responsible. 0.605
7 I get influenced by any of my friend, colleague or family member’s responsible behaviour towards the society and environment.
0.604
8 Whenever possible, I buy products packaged in reusable containers. 0.568
9 When I have a choice between two equal products, I always purchase the one that is less harmful to other people and to the environment.
0.549
0.914
Table 5: Factor 2 (Social Security)
S. No. Statements Loading Reliability
(Cronebach’s
Alpha Value)
1 I try to buy from companies that hire people with disabilities. 0.794
2 I make an effort to buy products/services from companies that pay all their employees a living wage.
0.766
3 When given a chance, I switch brands where a portion of the price is donated to charity.
0.739
4 I try to buy from companies that support victims of natural calamities. 0.645
5 I am willing to pay a premium price for an environment friendly product. 0.638
6 I help in recycling plastic containers. 0.566
7 When I am shopping, I try to buy from companies that are working to improve conditions for the employees in their factories.
0.508
0.869
Anusandhan - The Research Repository, Volume 3, Number 1 7
Table 6: Factor 3 (Social Inclination)
S. No. Statements Loading Reliability
(Cronebach
Alpha Value)
1 I ask others to be socially responsible. 0.629
2 Whenever possible I car pool to help reduce air pollution 0.717
3 I try to buy from companies that make donations to medical research. 0.589
4 I try to buy from companies that help the needy. 0.588
5 I avoid products that pollute water 0.504
0.819
Table 7: Factor 4 (Social Savings)
S. No. Statements Loading Reliability
(Cronebach
Alpha Value)
1 I will not buy a product/service made using child labour. 0.562
2 I make an effort to avoid products/services that cause environmental damage.
0.697
3 I avoid using products that pollute air 0.481
4 I limit my use of energy or natural gas to reduce my impact on environment.
0.617
5 I avoid products /services from a company that discriminate against minorities
0.480
6 I avoid buying products that are made from endangered animals 0.548
0.799
Fourth factor of ‘Social Saving’ has six statements which along
with the first statement (cumulatively) explain 61.7% of
variation in the SRB (Refer Table 3 column 4). The statements
of the fourth factor along with the reliability of their scale are
shown in Table 7.
FINDINGS/RESULTS OF THE STUDY
After doing factor analysis, four factors were formed namely:
(a) Individual Effectiveness
(b) Social Security
(c) Social Inclination and
(d) Social Savings
Further, individual reliability of these factors was calculated
and in order to be reliable, individual effectiveness should be
more than 0.7. It was observed that individual reliability of
each factor was greater than 0.7, i.e., 0.914, 0.869, 0.819 and
0.799 respectively.
However, all these four factors explain approximately 61% of
the variation in SRB. It means other factors which are not
identified through this paper. Other demographic factors might
also have influence on SRB.
REFERENCES
1. Abood Al-Janabi, T. (2000). Impact of Buyer and Competi-
tive for Determine Marketing Share in Business Com-
panies. (Master‘s thesis). Al-Kufa: Kufa University.
2. Armstrong, J. S. (1991). Prediction of Consumer Be-havior
by Experts and Novices. Journal of Con-sumer Research,
18(2), 251-256.
3. Burns, R. B. (2000). Introduction to Research Method.
London: Sage Publications.
4. Dadfar I, (2009), Identification and Prioritization of the
Effective Factors on Buying Decision of the Cars of the
Iran Khodro”, M.A Thesis, Tehran University, Tehran
5. Destiny, C (2012), Factors Affecting Consumers
Purchasing Decisions in Online Shopping in Hong Kong.
Publish thesis, Hong Kong Polytechnic University.
6. Dodoo, J., (2007). Practical Approach Towards Buying
Behavior, Atlantic International University Hawaii.
7. Durmaz, Y & Sebastian, J (2012), Integrated Approach to
Factors Affecting Consumers Purchase Behavior in Poland
and an Empirical Study. Global Journal of Management
and Business Research, Vol, 12, Iss 15.

Anusandhan - The Research Repository, Volume 3, Number 18
8. Epperson, Jerry. (2005). Furniture Retailing Action Is
Everywhere, Furniture Today Magazine, May 9.
9. Eva, B, & Judit, K, (2010), Consumer Behaviour Model
on the Furniture Market. Vol. 6 (2010) 75–89.
10. Farah, N (2013), Multifunctional furniture for
underprivileged communities: milestone in sustainable
development, publish thesis, Purdue University.
11. Garland, R. (1991). The mid-point on rating scale: is it
desirable? Marketing Bulletin, 2, 66-70.
12. Goldsmith, R., Kim, D., Flynn, L., & Kim, W. (2005).
Price sensitivity and innovativeness for fashion among
Korean consumers. Journal of Social Psychology, 145(5),
501-508.
13. Impulse buying (2012). In Business Dictionary. Re-trieved
from http://www.businessdictionary.com/ definition/
impulse-buying.html
14. Kotler, P, (2009), Marketing management: analysis,
planning, implementation and control, Translated by
Bahman Frozandeh, Atropat Publication,1st Publication.
15. Kotler, P, Armstrong, G, 2006, Marketing principles,
Translated by Bahman Frozandeh, Amokhteh Publication,
5th Ed.
16. Kuester, Sabine (2012): MKT 301: Strategic Marketing
& Marketing in Specific Industry Contexts, University of
Mannheim, p. 110.
17. Nachmias, C. F., & Nachmias, D. (1996). Research
methods in the social sciences. London: Arnold.
Anusandhan - The Research Repository, Volume 3, Number 1 9
FACTORS AFFECTING CONSUMER PERCEPTION TOWARDS ONLINE SHOPPING
Satish Chandra Gaur1
Shreyansh Jain2
ABSTRACT
Online trend for shopping in India has grown in the last few years. When we compare our country to other countries leading in
online shopping, we find our self at the beginning stage. In this current scenario internet touches everyone's life directly or
indirectly. In this era of innovation in management social and digital platforms becomes a powerful and cost free approach for
businesses to attract consumer. Internet plays a vital role in the life of youth globally so, India is no exception. There was a time
for window shopping but now youth want to spend more time on online shopping websites like Amazon, Myntra, Flipkart,
Snapdeal, Olx, Jabong etc. With the growth of Internet, Industries have chosen different ways of marketing and distribution. The
purpose of this study is to examine the different factors that influence consumer perception towards e-shopping. Mainly primary
data were collected through questionnaire for the study. The study is also helpful for researchers who want to know the different
factors play a vital role to understand online shopping.
Keywords: Consumer Perception, Demographic factors, Online Shopping and Purchase Decision.
1 Associate Professor, Gitarattan International B-School, Rohini, Delhi,Email: [email protected] Student (2014-15), Gitarattan International B-School, Delhi, Email: [email protected]
INTRODUCTION
Internet is not only a networking medium, but also a means of
transaction for customers at global market. Internet changed
the way customers shop and buy goods and services.
Customer is no longer bound to opening times or specific
location to purchase the products or services. For instance,
consumers recognize the need for buying some product, they
refer to the Internet to buy online. They start search for the
information and look for all the alternatives and finally make a
purchase which best fits to their needs. Before making final
purchase consumers are bombarded by several factors which
limit or influence consumers for the final decision. Many
companies now operate on the Internet. Some of companies
only have a web presence, called as click-only dot-coms, such
as Amazon.com and Expedia.com. These companies sell
products and services directly to consumers via the Internet.
On the other hand traditional companies also enhance their
marketing strategies to adopt today’s requirements and create
their own online sales channels and become click-and-mortar
companies. Nowadays it is hard to find an organization that
doesn’t have a web presence. E-commerce is divided into four
categories considering the characteristics of the buying and
selling parties.
These categories are: business to business (B2B), business to
consumer (B2C) or consumer to consumer (C2C) or consumer
to business (C2B). B2B e-commerce is the electronic support
of business transactions between companies and covers a broad
spectrum of applications that enable an enterprise or business
to form electronic relationships with their distributors, resellers,
suppliers, and other partners. E-commerce help businesses to
enhance their organizational coordination and decrease
transaction costs for the buyer teams. Furthermore, Wise and
Morrison state that e-commerce helps organisations to access
too many buyers and sellers.
Business to consumer (B2C) e-commerce activities also known
as e-retailing, take place between organizations and the
customers. E-commerce is just another tool for retail companies
selling products by using web-based technologies.
www.gap.com is an example for this kind of companies which
use a web site to reach their customers and also providing
shipping services. To overcome apprehensions such as products
cannot be seen or touched by consumers or customers do not
have a previous experience, companies have to reassure
customers on theses aspects. The trust is an important element
for commercial activities more so for electronic transactions.
Moreover, organisations should be customer-centric.
C2C e-commerce, The third type is consumer to consumer e-
commerce action which provides to consumers to put their
goods on the market for other consumers ‘in auction format’.
eBay is the first and most popular C2C type of e-commerce
company. If an individual wishes to sell its product, can simply
register to a web-site and put the product on the market. After
that a buyer can browse and search the product they interested
in. Later, if the buyer is willing to buy the product they can buy
it directly from the seller. In this way, the organization (eBay)
acts as an interface between two players and generates revenue
from this action. Organizations usually charge fees from seller
side, not from the buyer. The final online marketing domain is
consumer to business online marketing. With today’s Internet
environment consumers can reach companies easily. Using the
web, consumers can carry out transactions with businesses,
rather than the other way around.
Anusandhan - The Research Repository, Volume 3, Number 110
Global Internet Shopping Scenario
The rapidly increasing popularity of online shopping is a truly
global phenomenon. Online shoppers can be found scattered
across the globe, but the world’s most avid Internet shoppers
hail from South Korea - 99 percent of Internet users in South
Korea have shopped online. German, British and Japanese
consumers come in a close second. US consumers are slightly
more recalcitrant, clocking in at number eight. At the other
end of the spectrum, the world’s slowest adopters come from
Egypt, where 67 percent of the online population have never
made a purchase over the Internet, followed by Pakistan (60%)
and Philippines (55%).
LITERATURE REVIEW
Jadhav and Khanna (2016) concluded that the main influencing
factors for online shopping were identified as availability, low
price, promotions, comparison, convenience, customer service,
perceived ease of use, attitude, time consciousness, trust and
variety seeking. Gupta and Bansal (2016) concluded from the
study that online shopping via such social media platforms
was effective way for marketers to promote their products in
the market and for building a brand image among consumers.
Shanthi and Kannaiah (2015) in their study on suggested that
the majority of the people who shop online buys books online
as it were cheaper compared to the market price with various
discounts and offers. The second most influencing factor was
security, the third most influencing factor on online purchase
was Guarantees and Warrantees followed by delivery time.
Puranik and Bansal (2014) conducted a research and as a result
of study seven factors emerged, they were: Relevant
Information, Trustworthiness, Prior Experience, Instant
Review, Product Delivery, Transparency and Image of Seller.
The study helps in understanding the drivers of consumer
perception and their intention to shop on the Internet.
Jain, Goswami and Bhutani (2014) conducted a research on
Consumer Behavior towards Online Shopping. The research
findings revealed that perceived risk negatively impact
consumers attitude towards online shopping while perceived
usefulness, perceived ease of use and perceived enjoyment has
no impact on consumers’ attitude towards online shopping.
Kumar and Rawat (2013) gave three factors that describe the
consumer perceptions on online promotions were:
Effectiveness, Credibility and Impulsiveness.
Xiaoying, Ling, Kwek, Liu and Min (2012) findings revealed
that website design, security, information quality, payment
method, e-service quality, product quality, product variety and
delivery service were positively related to consumer satisfaction
towards online shopping in China.
Salehi (2012) study was focused on nine independent variables
namely appearance, quick loading, security, sitemap, validity,
promotion, attractiveness, believability, and originality. The
findings of the study indicated that the first five factors influence
consumers towards online shopping and security is the factor
that contributes most towards online shopping.
Delafrooz and Ali (2010) research indicated that utilitarian
orientation, convenience, price, and a wider selection
influenced consumers’ attitudes towards online shopping.
Chuleeporn (2006) in his findings three factors (past
experience, perceived benefits, and perceived ease of online
shopping) were rated higher by the online group. Such results
indicate that those consumers who perceived a higher risk and
higher uncertainty with online shopping prefer shopping at a
physical store.
Shergill (2005) conducted a study where seventeen variables
were divided in to four major factors namely Website Design,
Website Reliability/Fulfillment, Website Customer Service and
Website Privacy/Security. The findings were: Website reliability
and fulfillment had the highest rating score, followed by website
customer service. Website design ranked third, and the lowest
was website security/privacy. One of the findings also indicated
that different types of online purchasers (i.e., trial, occasional,
frequent and regular online buyers) have different evaluations
of website design and website reliability/fulfillment. They have
a similar evaluation of website security/privacy and website
customer service.
OBJECTIVES OF STUDY
To identify the factors affecting consumer perception towards
online shopping.
RESEARCH METHODOLOGY
The primary data was collected from customers located in
Delhi/NCR with the help of a self-constructed and pre-tested
questionnaire. For valid and reliable results, convenience and
judgment sampling method has been undertaken including
customers segments in a sample size of 100. Reliability and
validity of the questionnaire was established during the pre-
testing phase. The study is descriptive in nature. The cross-
sectional study design was used. Techniques used for data
analysis is Factor Analysis. A Questionnaire including 19
statements was used as the major tool for collecting primary
data while journals, Internet and magazines and other relevant
publications have been used as secondary sources of data.
RESULTS AND DISCUSSIONS
The value of Cronbach’s Alpha was found to be 0.893(Table
1), which indicates that the questionnaire was found to be
reliable to be used for the study.

Anusandhan - The Research Repository, Volume 3, Number 1 11
Table 1: Reliability Statistics
Cronbach's Alpha No. of Items
0.893 19
Kaiser-Meyer-Olkin Test
Since the value of Kaiser-Meyer-Olkin Measure of Sampling
Adequacy is more than 0.7, we can say that data is adequate.
We can proceed with the factor analysis.
Table 2: KMO and Bartlett’s Test
Kaiser-Meyer-Olkin
Measure of Sampling
Adequacy
.803
Approx. Chi-Square
979.448
df 171
Bartlett's Test of Sphericity
Sig. .000
Factor Analysis
As shown in Table 3, four factors have been extracted having
Eigen value more than 1. The cumulative variance explained
by these four factors is 62.64%, which means that these four
factors cumulatively explain 62.64% variation in consumer
perception towards online shopping.
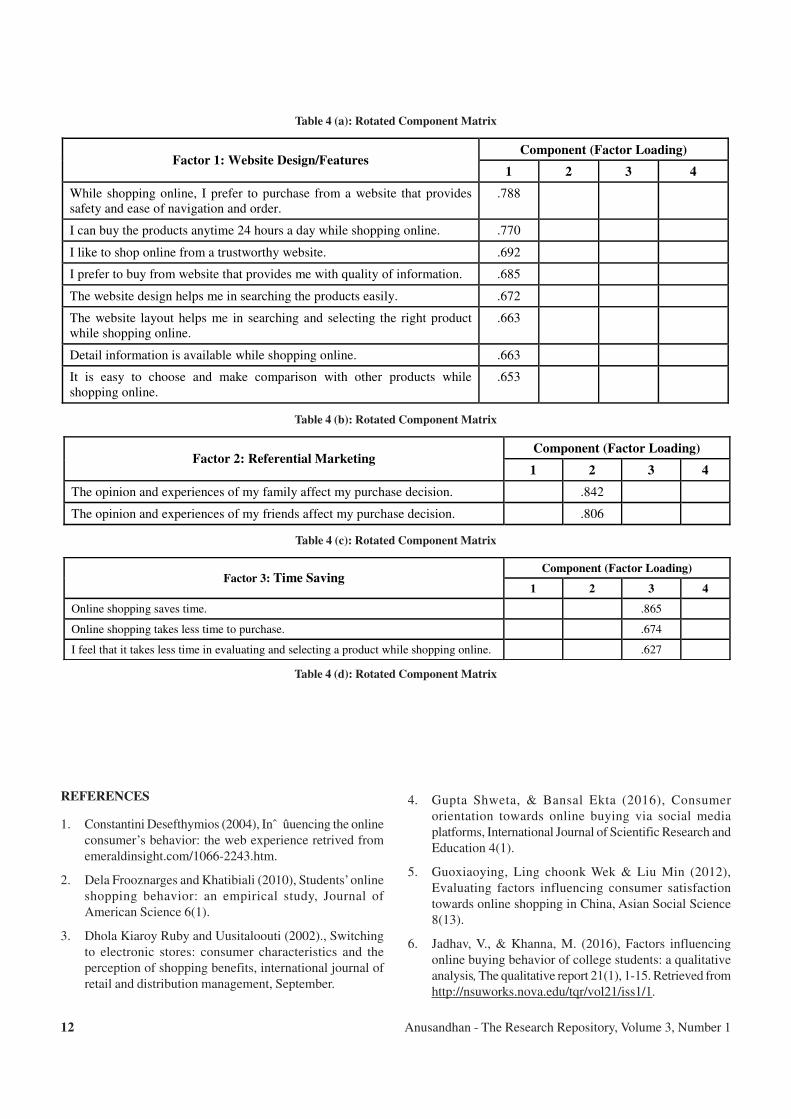
By using Factor Analysis four factors were identified as shown
in Table 4 (a) to (d). Factor Loading of each statement is also
shown in Table 4. These factors are Website design/features,
Referential Marketing, Time Saving, Convenience and Security
that affect the consumers’ perception towards online shopping
CONCLUSION
Online shopping is becoming more popular day by day with
the increase in the usage of World Wide Web. This study
focused on factors that influence consumers to shop online.
From the results we have concluded that the most influencing
factor is website design/features followed by referential
marketing.
Table 3: Eigen Values and Variance
Total Variance Explained
Initial Eigen Values Extraction Sums of Squared
Loadings
Rotation Sums of Squared
Loadings
Comp
onent
Total % of
Variance
Cumulative
%
Total % of
Variance
Cumulative % Total % of
Variance
Cumulative
%
1 6.952 36.590 36.590 6.952 36.590 36.590 4.861 25.583 25.583
2 2.250 11.843 48.433 2.250 11.843 48.433 2.788 14.672 40.255
3 1.625 8.551 56.984 1.625 8.551 56.984 2.237 11.773 52.028
4 1.075 5.657 62.641 1.075 5.657 62.641 2.017 10.613 62.641
5 .992 5.223 67.864
6 .882 4.641 72.504
7 .788 4.146 76.651
8 .760 4.000 80.651
9 .615 3.239 83.890
10 .536 2.820 86.710
11 .435 2.290 89.000
12 .416 2.188 91.188
13 .361 1.901 93.089
14 .312 1.643 94.733
15 .289 1.521 96.254
16 .266 1.400 97.654
17 .178 .938 98.591
18 .148 .780 99.372
19 .119 .628 100.000
Extraction Method: Principal Component Analysis.
Anusandhan - The Research Repository, Volume 3, Number 112
Table 4 (a): Rotated Component Matrix
Component (Factor Loading) Factor 1: Website Design/Features
1 2 3 4
While shopping online, I prefer to purchase from a website that provides safety and ease of navigation and order.
.788
I can buy the products anytime 24 hours a day while shopping online. .770
I like to shop online from a trustworthy website. .692
I prefer to buy from website that provides me with quality of information. .685
The website design helps me in searching the products easily. .672
The website layout helps me in searching and selecting the right product while shopping online.
.663
Detail information is available while shopping online. .663
It is easy to choose and make comparison with other products while shopping online.
.653
Table 4 (b): Rotated Component Matrix
Component (Factor Loading) Factor 2: Referential Marketing
1 2 3 4
The opinion and experiences of my family affect my purchase decision. .842
The opinion and experiences of my friends affect my purchase decision. .806
Table 4 (c): Rotated Component Matrix
Component (Factor Loading) Factor 3: Time Saving
1 2 3 4
Online shopping saves time. .865
Online shopping takes less time to purchase. .674
I feel that it takes less time in evaluating and selecting a product while shopping online. .627
Table 4 (d): Rotated Component Matrix
REFERENCES
1. Constantini Desefthymios (2004), Inˆ ûuencing the online
consumer’s behavior: the web experience retrived from
emeraldinsight.com/1066-2243.htm.
2. Dela Frooznarges and Khatibiali (2010), Students’ online
shopping behavior: an empirical study, Journal of
American Science 6(1).
3. Dhola Kiaroy Ruby and Uusitaloouti (2002)., Switching
to electronic stores: consumer characteristics and the
perception of shopping benefits, international journal of
retail and distribution management, September.
4. Gupta Shweta, & Bansal Ekta (2016), Consumer
orientation towards online buying via social media
platforms, International Journal of Scientific Research and
Education 4(1).
5. Guoxiaoying, Ling choonk Wek & Liu Min (2012),
Evaluating factors influencing consumer satisfaction
towards online shopping in China, Asian Social Science
8(13).
6. Jadhav, V., & Khanna, M. (2016), Factors influencing
online buying behavior of college students: a qualitative
analysis, The qualitative report 21(1), 1-15. Retrieved from
http://nsuworks.nova.edu/tqr/vol21/iss1/1.
Anusandhan - The Research Repository, Volume 3, Number 1 13
7. Jain Dipti, Goswami Sonia and Bhutani Shipra (2014),
Consumer behavior towards online shopping: an empirical
study from Delhi, Journal of Business and Management
16(9).
8. Kumar Prerna and Rawat S. Mahendra (2013), A study on
customer perceptions towards online promotions,
International Journal of Multidisciplinary Research in
social & management sciences 1(3).
9. Li, Na and Zhang, Ping, (2002), Consumer online shopping
attitudes and behavior: an assessment of research” amcis
2002 proceedings.
10. Puranik Rakshita and Bansal Alok (2014), A study of
internet users’ perception towards e-shopping, pacific
business review international 6(9).
11. Shanthi R. & Kannaiahdesti (2015), Consumers’
perception on online shopping, Journal of Marketing and
Consumer Research, An international peer-reviewed
journal 13.
12. Shergill, Gurvinder S. And Chenzhaobin (2005), We b -
based shopping: consumers’ attitudes towards online
shopping in new zealand, Journal of Electronic Commerce
Research, 6 (2).
Anusandhan - The Research Repository, Volume 3, Number 114
EMOTIONAL BRAND RELATIONSHIP IN HOSPITALITY INDUSTRY:
A STUDY ON HOSPITALITY BRANDING IN DELHI/NCR
Uma Gulati1
Anirudh Kumaria2
ABSTRACT
The Hospitality industry is defined as "hosts offering services to guests", which includes reception, entertainment, and other
services for travelers and tourists. Hospitality is a long running folklore in India. India holds a special place in the international
world of hospitality. In the highly competitive hotel industry, where products and services have reached "commodity" status,
hoteliers are required to find ways to set their products and services apart from other. Every time the consumer takes the direct
path to hotel, marketers save on marketing and sales spend required to capture new customers and induce them to select their
services over competition. In hospitality industry, there are few differences between the offerings made by one player and
another, brand differentiation are vital for regular customers. This need has given rise to the use of emotional brand relationship
strategies as a source of differentiation. This study makes an attempt to give broad overview of emotional brand relationship
growing in the industry. The purpose of this study is to investigate emotional brand relationship in hospitality industry among
different demographic groups. Data collected has been analyzed using descriptive statistics, independent sample t test and
ANOVA. The study finds that there is no difference in perception of gender group and married and single group towards
emotional brand relationship in hospitality Industry. The study also finds that there is significant difference in perception of
different age and occupation group towards emotional brand relationship but there is no significant difference in perception of
different income group towards Emotional brand relationship. Marketers would gain much by continuously monitoring customers'
perceptions towards emotional brand relationship in Hospitality Industry.
Keywords: Brand differentiation, Brand relationship strategies, Emotional brand relationship, Hospitality, Perception.
1 Associate Professor, Gitarattan International Business School, Delhi. [email protected] Student, MBA (2014-16), Gitarattan International Business School, Delhi
INTRODUCTION
The Indian hospitality industry has emerged as one of the key
industries driving growth of the services sector in India. The
fortunes of the hospitality industry have always been linked to
the prospects of the tourism industry and tourism is the foremost
demand driver of the industry. The Indian hospitality industry
has recorded healthy growth fuelled by robust inflow of foreign
tourists as well as increased tourist movement within the
country. It has become one of the leading players in the global
industry with innovations taking place at different levels
providing signal for future growth and prosperity at all levels.
The hospitality industry is a broad category of fields within
the service industry that includes lodging, event planning, theme
parks, transportation, cruise line, and additional fields within
the tourism industry. The hospitality industry is a multibillion-
dollar industry that depends on the availability of leisure time
and disposable income. A hospitality unit such as a restaurant,
hotel, or an amusement park consists of multiple groups such
as facility maintenance and direct operations (servers,
housekeepers, porters, kitchen workers, bartenders,
management, marketing, and human resources etc.) Innovations
in the Indian hospitality sector can be analyzed on many
different levels. This analysis makes an attempt to give a broad
overview on innovations taking place in the industry according
to various categories of hotels as well as relevant functions,
concluding with a brief outlook on future directions these
innovations might take. India holds a special place in the
international world of hospitality.
Culturally, the country might very well be the most diverse
place in the world. It is a vivid kaleidoscope of landscapes,
magnificent historical sites and royal cities, misty mountain
retreats, colorful people, rich cultures, and festivities. Luxurious
and destitute, hot and cold, chaotic and tranquil, ancient and
modern - India’s extremes rarely fail to leave a lasting
impression. The hospitality industry is defined as “hosts
offering services to guests”, which includes reception,
entertainment, and other services for travellers and tourists.
Hospitality is a long running tradition in India. From the
majestic Himalayas and the stark deserts of Rajasthan, over
beautiful beaches and lush tropical forests, to idyllic villages
and bustling cities, India offers unique opportunities for every
individual preference. However, until fairly recently this was
hardly evident when looking at India’s hospitality industry. By
now, accommodation options throughout India have become
extremely diverse; from cozy home stay sand tribal huts to
stunning heritage mansions and maharaja palaces.
From Kashmir to Kanyakumari, from Gujarat to Assam, there
are different cultures, languages, life styles, and cuisines. This

Anusandhan - The Research Repository, Volume 3, Number 1 15
variety is increasingly reflected by many forms of
accommodation available in India, ranging from the simplicity
of local guest houses and government bungalows to the opulent
luxury of royal palaces and five star deluxe hotel suites. People
spend a lot on stay to whichever place they go. Selection of
hotel is one important activity which brings brand relationship
into picture. Good experience with a hotel will fetch the same
customer again and again. Similarly is the case with dining
services.
Restaurants play a vital role in today’s society. They provide a
convenience for busy two-career families and a means of
entertainment for those who enjoy going out and having others
prepare and serve food to them. Restaurants were originally
established as a necessary option for people who had to be
away from home and couldn’t use their own kitchens. The
aesthetics, staff, services, food all add up to create emotional
brand relationship with the restaurant. Service recovery is
difficult in hospitality industry; therefore, marketers have to
be cautious for everything they provide. The study tries to make
an attempt to find out as to how brand relationship is built in
hospitality industry and how emotional brand relationship is
created in this Industry.
LITERATURE REVIEW
Blackston (1992) is among the first to identify an overt
connection between feelings and brand relationships. He sees
brand relationships as analogous to relationships between
people: “The concept of a relationship with a brand is neither
novel nor outrageous. It is readily understandable as an
analogue between brand and consumer of that complex of
cognitive, affective, and behavioral processes which constitute
a relationship between two people”. This suggests that feelings
operate equally alongside performance and usage in defining
relationships, but most people now believe that feelings tend
to exert the greater influence. As Gordon puts it, “There is no
such thing as ‘rational’ versus ‘emotional’—the two are
intertwined. Sometimes ‘rational ‘appears to take the high
ground, but ‘emotional’ is the underlying force” Gordon (2006).
And although experimental work has been done on the nature
and properties of different types of person-brand relationships
Aaker and Fournier (1995); Aggarwal (2004), and also on the
potential causes of breakup of person-brand relationships
Aaker, Fournier, and Brasel (2004) Fajer and Schouten (1995),
little has been done to examine exactly how emotions in
advertising contributes toward and strengthens brand
relationships.
Early discussions about the way people feel about brands
centered mainly on the concept of brand personality. Plummer
(1985) describes brand personality as “an articulation of what
we would like consumers out there in the world to feel about
our brand over time.”And although he did not use the term
relationship, he clearly envisaged a relationship situation when
he imagined those who use and favor brands saying that they
see themselves in that brand. Common usage of the term brand
relationships grew in the late ’90s, alongside the drive to
develop improved customer satisfaction. This has led some to
assume that brand relationships have little to do with advertising
and come into existence only when a product or service is being
used.
Relationship marketing has been expended in the consumer
setting, with Fournier (1998) conceptualization of Brand
Relationship Quality (BRQ) framework. The superiority of
brand relationship metaphor is explained in its ability to provide
insight into roles of brands in consumers’ lives and understand
consumers’ needs Breivik & Thorbjornsen, (2008); Fournier
(1998); Monga, (2002). To date, brand relationship has reached
a new phase, becoming one of the principal foci of research on
consumers and brands, Aaker, Fournier, & Brasel, (2004);
Breivik & Thorbjornsen (2008); Chang & Chieng (2006); Haas
(2007); He (2006); Huber, Vollhardt, Matthes, & Vogel (2009);
Ji(2002); Kaltcheva & Weitz (1999); Kates (2000). However,
the suitability of metaphoric transfer of the human metaphor
to the consumer-brand context for all the brands is still unclear
and whether brand relationship quality could influence
consumers’ intentions and behavior in hotel industry is limited.
Mattila (2006) in his study stated that in highly competitive
hotel industry, hoteliers are required to find ways to set their
products and services apart from others. Choi and Chu (2001)
in his study “customer satisfaction and retention in the Hotel
industry” stated that positive relationship can create customer’s
higher commitment and increase their return rate. Hotels are
increasing their investments to improve service quality and
the perceived value for guests so as to achieve better customer
satisfaction and loyalty, thus resulting in better relationships
with each customer, Hederick, Beverland & Minahan (2007).
Relationship quality has a remarkable positive effect on hotel
guests’ behavior: it creates positive word of mouth (WOM)
and increments repeated guest rates (Kim et al., 2001). This
need has given rise to the use of branding strategies as a source
of differentiation.
Building strong hotel brands creates value for both the firm
and the customer. This is the reason that Marketers want to
build emotional brand relationship with their customers. To
gain new insights in this important area, the purpose of this
study is to examine the applicability in hotel industry and
especially investigates the effects of brand relationship quality
on hotel consumer’s behaviors under the circumstance of
service failures. In the business arena, every manager hopes to
prolong their business lifespan through customer loyalty.
Therefore, it is important to understand the predictor and
influence of customer trust in order to strengthen the customer-
brand relationship. Customer trust is formed from rational and
emotional perspective. However, the latter trust is less studied
despite being argued to be more stable as compared to rational-
based trust.
OBJECTIVES OF THE STUDY
(a) To examine the emotional brand relationship of the
customer in Hospitality industry.
Anusandhan - The Research Repository, Volume 3, Number 116
(b) To study the significant difference in perception among
different demographic groups towards emotional brand
relationship in hospitality industry .
HYPOTHESES OF THE STUDY
H1: There is significant difference in perception of male and
female towards the emotional brand relationship in hospitality
industry.
H2: There is significant difference in perception of married &
single people towards the emotional brand relationship in
hospitality industry.
H3: There is significant difference in perception of different
age groups towards the emotional brand relationship in
hospitality industry.
H4: There is significant difference in perception of different
occupation groups towards the emotional brand relationship
in hospitality industry.
H5: There is significant difference in perception of different
income groups towards the emotional brand relationship in
hospitality industry.
RESEARCH METHODOLGY
Research Framework
The purpose of the current research was to study the perception
of different demographic groups towards the emotional brand
relationship in hospitality industry. According to the objective
of the research, the study proposes emotional brand relationship
as dependent variable and based on the purpose of the study,
perception towards emotional brand relationship has been
measured among different demographic factors like gender,
age marital status, occupation and income. These factors are
independent variables and each of them has been measured on
categorical scale.
Methodology for Data Collection
Perception towards emotional brand relationship among
different demographic factors has been measured using 18
statements on five point Likert scale. Pilot study was carried
out to check reliability test. The Cronbach Alpha was 0.847
which suggested that the instrument used for the study is
appropriate. Both primary and secondary sources were used
for data collection. A structured questionnaire was major tool
for collecting data while journals, magazines, Internet and other
relevant manuals and publications were used for secondary
sources of data.
Sampling Technique
Convenience and judgment sampling were used for data
collection. The reason for using convenience and judgment
sampling was ease of access and to ensure that sample selected
is true representative of the population. Convenience and
judgment sampling were done among the respondents in Delhi/
NCR.
Sample Size
For valid and reliable results, a random selection method was
undertaken including customers of various segments in a
sample size of 108 out of which 8 were rejected. A total of 100
completed questionnaires were considered for final analysis.
Only those respondents who have been regular availing dining
services were eligible for participating in the study.
Methodology used for Data Analysis
Data collected was analyzed using descriptive statistics,
independent sample t test and ANOVA to investigate whether
the group means differ from one another. Each group was
measured on same dependent variable i.e. emotional brand
relationship. T-test was used to test differences in means
between gender (male & female group) and marital status
(married & unmarried group) where as ANOVA was used for
occupation, age and income group. As far as statistical tool is
concerned, SPSS was applied to analyze data.
RESULTS AND DISCUSSIONS
Perception of Male and Female towards Emotional
Brand Relationship
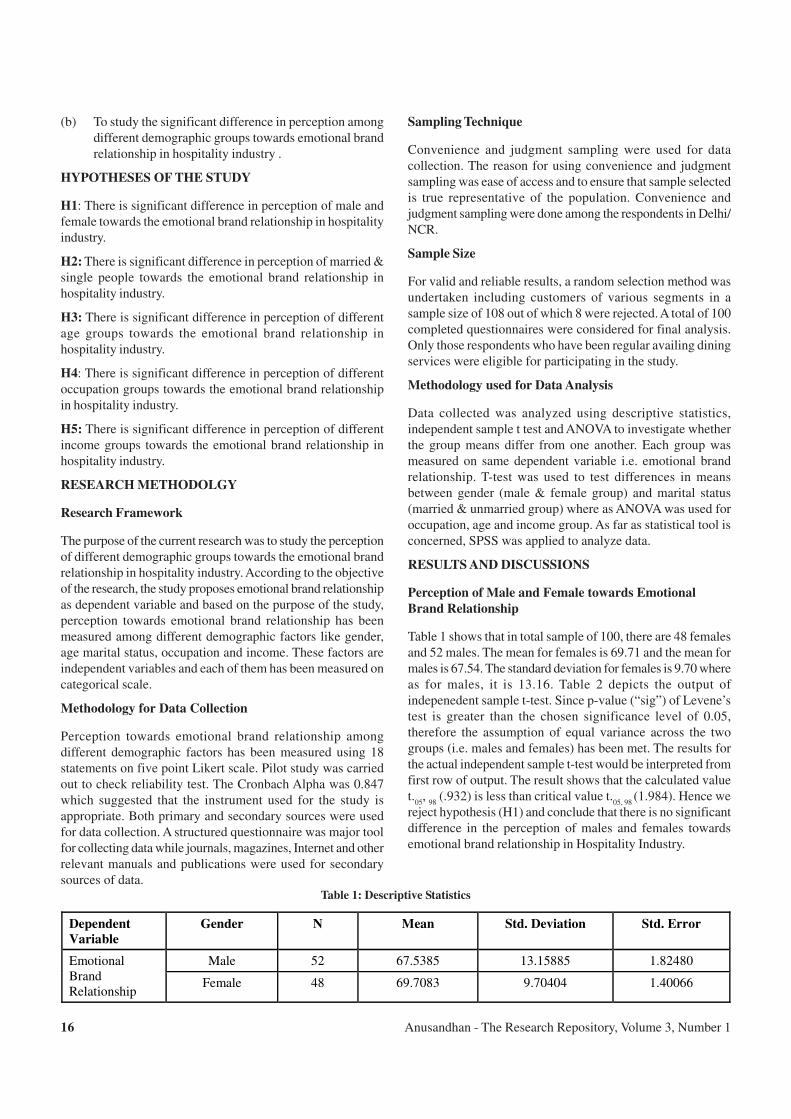
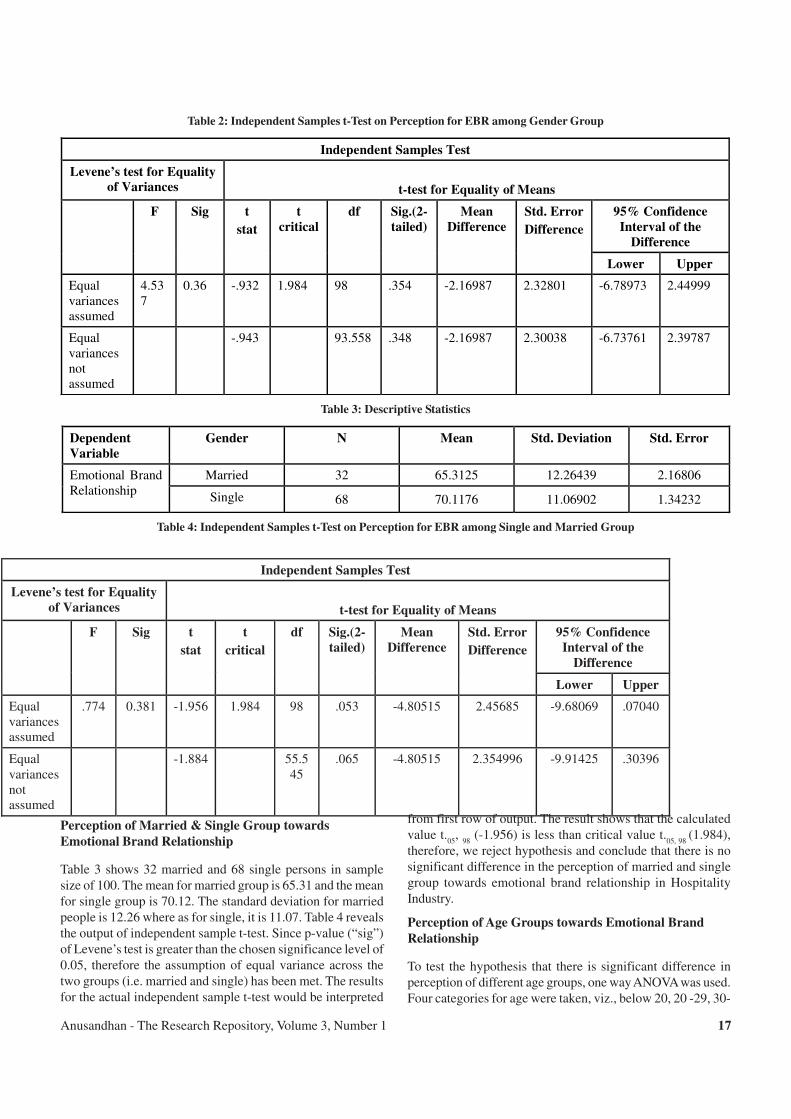
Table 1 shows that in total sample of 100, there are 48 females
and 52 males. The mean for females is 69.71 and the mean for
males is 67.54. The standard deviation for females is 9.70 where
as for males, it is 13.16. Table 2 depicts the output of
indepenedent sample t-test. Since p-value (“sig”) of Levene’s
test is greater than the chosen significance level of 0.05,
therefore the assumption of equal variance across the two
groups (i.e. males and females) has been met. The results for
the actual independent sample t-test would be interpreted from
first row of output. The result shows that the calculated value
t.05
, 98
(.932) is less than critical value t.05, 98
(1.984). Hence we
reject hypothesis (H1) and conclude that there is no significant
difference in the perception of males and females towards
emotional brand relationship in Hospitality Industry.
Table 1: Descriptive Statistics
Dependent
Variable
Gender N Mean Std. Deviation Std. Error
Male 52 67.5385 13.15885 1.82480 Emotional Brand Relationship
Female 48 69.7083 9.70404 1.40066
Anusandhan - The Research Repository, Volume 3, Number 1 17
Table 2: Independent Samples t-Test on Perception for EBR among Gender Group
Independent Samples Test
Levene’s test for Equality
of Variances
t-test for Equality of Means
95% Confidence
Interval of the
Difference
F Sig t
stat
t
critical
df Sig.(2-
tailed)
Mean
Difference
Std. Error
Difference
Lower Upper
Equal variances assumed
4.537
0.36 -.932 1.984 98 .354 -2.16987 2.32801 -6.78973 2.44999
Equal variances not assumed
-.943 93.558 .348 -2.16987 2.30038 -6.73761 2.39787
Table 3: Descriptive Statistics
Dependent
Variable
Gender N Mean Std. Deviation Std. Error
Married 32 65.3125 12.26439 2.16806 Emotional Brand Relationship
Single 68 70.1176 11.06902 1.34232
Table 4: Independent Samples t-Test on Perception for EBR among Single and Married Group
Independent Samples Test
Levene’s test for Equality
of Variances
t-test for Equality of Means
95% Confidence
Interval of the
Difference
F Sig t
stat
t
critical
df Sig.(2-
tailed)
Mean
Difference
Std. Error
Difference
Lower Upper
Equal variances assumed
.774 0.381 -1.956 1.984 98 .053 -4.80515 2.45685 -9.68069 .07040
Equal variances not assumed
-1.884 55.545
.065 -4.80515 2.354996 -9.91425 .30396
Perception of Married & Single Group towards
Emotional Brand Relationship
Table 3 shows 32 married and 68 single persons in sample
size of 100. The mean for married group is 65.31 and the mean
for single group is 70.12. The standard deviation for married
people is 12.26 where as for single, it is 11.07. Table 4 reveals
the output of independent sample t-test. Since p-value (“sig”)
of Levene’s test is greater than the chosen significance level of
0.05, therefore the assumption of equal variance across the
two groups (i.e. married and single) has been met. The results
for the actual independent sample t-test would be interpreted
from first row of output. The result shows that the calculated
value t.05
, 98
(-1.956) is less than critical value t.05, 98
(1.984),
therefore, we reject hypothesis and conclude that there is no
significant difference in the perception of married and single
group towards emotional brand relationship in Hospitality
Industry.
Perception of Age Groups towards Emotional Brand
Relationship
To test the hypothesis that there is significant difference in
perception of different age groups, one way ANOVA was used.
Four categories for age were taken, viz., below 20, 20 -29, 30-

Anusandhan - The Research Repository, Volume 3, Number 118
39 and above 40 years. Table 6 highlights F ratio which is
proportion of variation between groups and within groups. The
mean square of between groups is 711.532 and mean square
of within groups is 117.081. This indicates that variation is
more between groups as compared to within groups. Table 6
shows that calculated value of F .05(3, 96)
is 6.077 where as critical
value of F.05 (3, 96)
is 2.68. Table also shows that p value of
ANOVA (.001) is less than chosen significance level of 0.05.
Since F calculated is larger than F critical, we accept hypothesis
and conclude that there is significant difference in perception
of different age group towards the emotional brand relationship
in hospitality industry.
Table 5: Descriptive Statistics
Age group N Mean Std.
Deviation
Std.
Error
95% Confidence
Interval for Mean
Minimum
Minimum Maximu
m
Below 20 14 65.64 6.368 1.70199 61.9659 69.3198 55.00 80.00
20-29 42 73.74 10.81 1.66785 70.3698 77.1064 50.00 94.00
30-39 21 62.38 9.55 2.08335 58.0352 66.7268 46.00 74.00
40& above 23 66.61 13.65 2.84635 60.7057 72.5117 43.00 91.00
Total 100 68.58 11.62 1.16230 66.2737 70.8863 43.00 94.00
Table 6: One Way ANOVA by Age Groups towards EBR
Table 7: Descriptive Statistics
Occupati
on Group
N Mean Std.
Deviation
Std.
Error
95% Confidence
Interval for Mean
Minimum
Minimum Maximum
Student 32 66.03 10.87 1.92316 62.1089 69.9536 46.00 91.00
Service 22 65.81 14.52 3.09701 59.3776 72.2588 43.00 94.00
Business 46 71.67 9.95 1.46754 68.7181 74.6297 50.00 90.00
Total 100 68.58 11.62 1.16230 66.2737 70.8863 43.00 94.00
Table 8: One Way ANOVA by Occupation towards EBR
Occupation group Sum of Squares df Mean Square F stat F critical Sig.
Between Groups 816.010 2 4028.005 3.151 3.071 .047
Within Groups 12558.350 97 129.468
Total 13374.360 99
Table 9: Descriptive Statistics
Income Group N Mean Std.
Deviation
Std.
Error
95% Confidence
Interval for Mean
Minimu
m
Maxi
mum
Below 2,00,000 35 67.71 10.76 1.81986 64.0159 71.4127 44.00
2,00,000- 299999 21 67.95 11.68 2.54902 62.6352 73.2695 43.00
3,00,000-399999 22 72.18 11.44 2.43943 67.1088 77.2549 49.00
4,00,000 & above 22 66.95 13.05 2.78250 61.1680 72.7411 46.00
Total 100 68.58 11.62 1.16230 66.2737 70.8863 43.00

Anusandhan - The Research Repository, Volume 3, Number 1 19
Table 10: One Way ANOVA by Income towards EBR
Income Group Sum of Squares df Mean
Square
F
stat
F
critical
Sig.
Between Groups 378.037 3 126.012 .931 2.680 .429
Within Groups 12996.323 96 135.378
Total 13374.360 99
To study the perception of occupation groups, three categories
were taken, students, service and business group. Table 8
depicts the results of one way ANOVA where F ratio indicates
that variation is more between different occupation groups as
compared to within groups. ANOVA table shows that calculated
value of F .05(2, 97)
is 3.151 where as critical value of F.05 (2, 97)
is
3.071. We can also see in table that p value of ANOVA (.047)
is less than chosen significance level of 0.05. Since F calculated
is larger than F critical, we accept hypothesis and conclude
that there is significant difference in perception of different
occupation groups towards the emotional brand relationship
in hospitality industry.
Perception of different Income Groups towards Emotional
Brand Relationship
Table 10 affirms the results of one way ANOVA by income
group for testing the significant difference in perception of
income group towards emotional brand relationship. Four
categories of income were considered for studying the
difference in their perception. F ratio in Table 10 indicates
that variation is more within groups as compared to between
groups. Calculated value of F .05(3, 96)
is .931 where as critical
value of F.05 (3, 96)
is 2.680. We can also see in table that p value
of ANOVA (.429) is more than chosen significance level of
0.05. Since F calculated is less than F critical, we reject
hypothesis and conclude that there is no significant difference
in perception of different income groups towards the emotional
brand relationship in hospitality industry.
CONCLUSION
This research focuses on investigating the perception of
consumers towards emotional brand relationship in hospitality
industry. Building strong hotel brands creates value for both
the firm and the customer. This is the reason that marketers
want to build emotional brand relationship with their customers.
The results obtained from the analysis of data throw a
significant amount of light on various parameters which play
an important role in deciding customer brand relationship. It
is evident from the result that male and female consumers carry
same perception towards emotional brand relationship where
as consumers belonging to different age groups carry different
perception towards emotional brand relationship in hospitality
industry.
The perception of consumers belonging to different
occupational groups also carries different perception towards
emotional brand relationship in hospitality industry whereas
consumers of different income group do not differ in their
perception. Hence it would be appropriate to conclude that
emotional brand relationship is an important predictor and
influences customer trust in order to strengthen customer brand
relationship
MANAGERIAL IMPLICATIONS
In a highly competitive hotel industry, marketers have to
understand the emotional brand relationship concept to retain
customers. Services are easily copied, so is the case with
restaurants/ dining services. Every time the consumer turns
towards his hotel/ restaurant, he carries the perception that he
will be treated differently being the regular customer. This
perception has given rise to the use of emotional brand
relationship strategies as a source of differentiation. The
marketer must study customers’ emotions as it plays dominant
role in explaining satisfaction and brand loyalty. Marketers
must understand that the brands are created by building brand
relationship with customers. This study would be a contribution
to enrich marketers’ knowledge of EBR application in service
context and the role of EBR in consumer marketing research.
Moreover, it would be helpful to understand further
complexities in consumer’s perception and to improve the
measurement and tracking of brand loyalties in the marketplace.
With the findings, managers may consider brand relationship
as a strategic tool in building brand loyalty. This study could
be a reference for the hotel organizations to whether the quality
of the consumer-brand relationship should be one of the firm’s
priority lines of action.
REFERENCES
1. Aaker, J., Fournier, S., & Brasel, S. A. (2004). When Good
Brands Do Bad. Journal of Consumer Research, 31(1), 1-
16.
2. Anderson, J. C., & Gerbing, D. G. (1988). Structural
Equation Modeling in Practice: A Review and
Recommended. Psychological Bulletin, 103(5), 411-423.
3. Babin, B. J., & Darden, W. R. (1996). Good and bad
shopping vibes: Spending and patronage satisfaction.
Journal of Business Research, 35(3), 201-206
4. Blackston,M.”Observations: Building Brand Equity by
Managing the Brand’s Relation-ships.”Journal of
Advertising Research, 323 (1992):79-83.
5. Brasel, C., & Cole, C. (2004). Affective Responses to
Service Failure: Anger, Regret, and Retaliatory Versus

Anusandhan - The Research Repository, Volume 3, Number 120
Conciliatory Responses. Marketing Letters, 18(1-2), 85-
99.
6. Breivik, E., & Thorbjornsen, H. (2008). Consumer Brand
Relationships: An Investigation of Two Alternative
Models. Journal of the Academy of Marketing Science,
36(4), 443-472.
7. Chang, P. L., & Chieng, M. H. (2006). Building Consumer-
Brand Relationship: A Cross-Cultural Experiential View.
Psychology & Marketing, 23(11), 927-959.
8. Chiang, C., Jang, S., 2006. The effects of perceived price
and brand image on value and purchase intention: leisure
travelers’ attitudes toward online hotel booking. Journal
of Hospitality & Leisure Marketing 15 (3), 49–69.
9. Choi, T.Y., Chu, R., 2001. Determinants of hotel guests’
satisfaction and repeat patronage in the Hong Kong hotel
industry. International Journal of Hospitality Management
20, 277- 297.
10. Fournier, S. (1998). Consumers and Their Brands:
Developing Relationship Theory in Consumer Research.
Journal of Consumer Research, 24(4), 343-373.
11. Gilbert, G. R., & Veloutsou, C. (2006). A cross-industry
comparison of customer satisfaction. Journal of Services
Marketing, 20(5), 298-308.
12. Gordon, W, (2006)”What Do Consumer Do Emotionally
with Advertising?”Journal of Advertising Research 46(1),
210.
13. Haas, S. M. (2007). Evaluating Brand Relationships in
the Context of Brand Communities. School of Saint Louis
University in Partial.
14. He, J. X. (2006). Brand Relationship Quality: The
Establishment and Validation of an Indigenous Model in
China. Journal of East China Normal University, 38(3).
15. Hedrick, N., Beverland, M., & Minahan, S. (2007). A
Exploration of Relational Customers’ Response to Service
Failure. Journal of Services Marketing, 21(1), 64-72.
16. Huber, F., Vollhardt, K., Matthes, I., & Vogel, J. (2009).
Brand Misconduct: Consequences on Consumerbrand
Relationship. Journal of Business Research. 11
17. Ji, M. F. (2002). Children’s Relationships with Brands:
“True Love” or “One-night” Stand? Psychology and
Marketing, 19(4), 369-387.
18. Kaltcheva, V., & Weitz, B. (1999). The Effects of Brand-
Consumer Relationships Upon Consumers’ Attributions
and Reactions. Advances in Consumer Research, 26, 455-
462.
19. Kates, S. M. (2000). Out of the Closet and Out on the
Street: Gay Men and Their Brand Relationships.
Psychology and Marketing, 17(6), 493-513.
20. Kim W. G., Han J. S., & Lee E. (2001). Effects of
relationship marketing on repeat purchase and word of
mouth. Journal of Hospitality & Tourism Research, 25
(3): 272-288
21. Lau, G. T., & Lee, S. H. (1999). Consumers’ trust in a
band and the link to brand loyalty. Journal of Market
Focused Management, 4(4), 341-370.
22. Mattila, A.S., (2006). How affective commitment boosts
guest loyalty (and promotes frequent guest programs).
Cornell Hotel and Restaurant Administration Quarterly
47, 174-181.
23. Monga, A. B. (2002). Brand as a Relationship Partner:
Gender Differences in Perspective. Advances in Consumer
Research, 36-41.
24. Plummer, J. T. “How Personality Make a
Difference.”Journal of Advertising Research24,
6(1985):27-31.
Anusandhan - The Research Repository, Volume 3, Number 1 21
CONSUMERS' ATTITUDE TOWARDS ECO-FRIENDLY PRODUCTS AND THEIR
PURCHASE INTENTION IN THE FAST MOVING CONSUMER GOODS (FMCG) SECTOR
Gayatri Chopra1
Nikhil Rajpal2
ABSTRACT
This research was conducted with the major aim to identify the relationship between consumers' attitude towards eco-friendly
products and their purchase intention in the Fast Moving Consumer Goods (FMCG) sector. Convenience sampling technique
was employed with the sample size of 133 respondents. The primary data for the study was collected using a self-designed
questionnaire. Correlation and Regression analysis was used to identify the relationship between consumers' attitudes towards
eco-friendly products and their purchase intention in the Fast Moving Consumer Goods (FMCG) sector. The study revealed that
there is a significant relationship between consumers' attitudes towards eco-friendly products and their purchase intention. The
key recommendation of the research is about adopting innovative techniques for generating awareness regarding eco-friendly
FMCG products amongst the consumers.
Keywords: Advertising, Attitude, Consumer Behaviour, Eco Friendly, Purchase Intention.
1 Assistant Professor, Gitarattan International Business School, Delhi.2 Student, MBA (2014-16), Gitarattan International Business School, Delhi
INTRODUCTION
Fast-moving consumer goods (FMCG) or consumer packaged
goods (CPG) are products that are sold quickly and at relatively
low cost. Examples include non-durable goods such as soft
drinks, toiletries, over-the-counter drugs, processed foods and
many other consumables. In contrast, durable goods or major
appliances such as kitchen appliances are generally replaced
over a period of several years. The term was coined by Neil H.
Borden in “The Concept of the Marketing Mix” in 1965.
The Indian FMCG sector is the fourth largest sector in the
economy with an estimated size of Rs.1300 billion. The sector
has shown an average annual growth of about 11% per annum
over the last decade. Unlike the developed markets, which are
prominently dominated by few large players, India’s FMCG
market is highly fragmented and a considerable part of the
market comprises of unorganized players selling unbranded
and unpackaged products. There are approximately 12-13
million retail stores in India, out of which 9 million are FMCG
kirana stores.
FMCG have a short shelf life, either as a result of high consumer
demand or because the product deteriorates rapidly. Some
FMCGs, such as meat, fruits and vegetables, dairy products,
and baked goods, are highly perishable. Other goods, such as
alcohol, toiletries, pre-packaged foods, soft drinks, chocolate,
candies, and cleaning products, have high turnover rates. The
sales are sometimes influenced by some holidays and season.
Though the profit margin made on FMCG products is relatively
small (more so for retailers than the producers/suppliers), they
are generally sold in large quantities; thus, the cumulative profit
on such products can be substantial. FMCG is probably the
most classic case of low margin and high volume business.
Products which have a swift turnover and relatively low cost
are known as Fast Moving Consumer Goods (FMCG).
Green FMCG Products and their characteristics
The products manufactured using green technology and that
cause no environmental hazards are called green products.
Promotion of green technology and green FMCG products is
necessary for conservation of natural resources and sustainable
development. We can define green FMCG products by
following measures:
(a) Products those are naturally grown,
(b) Products those are recyclable, reusable and
biodegradable,
(c) Products with natural ingredients,
(d) Products containing recycled contents, non-toxic
chemical,
(e) Products contain approved chemicals,
(f) Products that do not harm or pollute the environment,
(g) Products that are not be tested on animals, and
(h) Products that have eco-friendly packaging i.e. reusable,
refillable containers etc.
Evolution of Green Marketing
The green marketing has evolved over a period of time.
According to Peattie (2001), the evolution of green marketing
has three phases. First phase was termed as “Ecological” green
marketing and during this period all marketing activities were
concerned to help and provide remedies for environmental

Anusandhan - The Research Repository, Volume 3, Number 122
problems. Second phase was “Environmental” green marketing
and the focus shifted on clean technology that involved
designing of innovative new products, which take care of
pollution and waste issues. Third phase was “Sustainable” green
marketing. It came into prominence in the late 1990s and early
2000.
Consumer Buying Behaviour
Consumer buying behaviour is the sum total of a consumer’s
attitudes, preferences, intentions and decisions regarding the
consumer’s behaviour in the marketplace when purchasing a
product or service. The study of consumer behaviour draws
upon social science disciplines of anthropology, psychology,
sociology and economics.
In a psychological sense attitude is defined as a “Tendency
that is expressed by evaluating a particular entity with some
degree of favour or disfavor” (Eagly and Chaiken, 1993). In a
consumer behaviour approach, Solomon et al. (2010) defined
the attitude as “A lasting, general evaluation of people
(including oneself) objects or issues.” The AMA defines it also
as “A cognitive process involving positive or negative valences,
feelings, or emotions”. Attitude is an important part in the study
of consumer behaviour. Many theories have been constructed
on the attitudes. As the consumption of green product is a
current and relevant subject, many studies have been conducted
about the attitudes towards green products.
Consumer intentions play an important role in marketing
strategies (to implement four P strategies) because they permit
companies to evaluate how many products could be produced
according to the demand.
In a study conducted by Blackwell et al. (2006), to predict the
purchase intention, companies can interview consumers about
their past behaviours in order to forecast their future behaviours
but the products that people bought in the past can be different
of those they will buy. Thus another method is to ask consumers
what they intend to do However, “Measuring what people
intend to do may sometimes be less predictive of their future
behaviour than measuring what they expect to do”. So
companies also use behavioural expectations which represent
“The likelihood of performing a behaviour”; thus to forecast
relevant purchase intentions, a time indication can be included.
Indeed it is easiest for a consumer to predict his/her purchase
intention of a product tomorrow or in one month than in five
years because behaviours change with time.
LITERATURE REVIEW
It has been the global concern to preserve the environment
from pollution and degradation. Many studies have been done
on the green marketing exploring the importance of the topic
and relationship to the attitude and purchasing behaviour of
the consumers of eco-friendly products. Through the vital
information provided by the competent and experience
researchers, companies have understood the importance of
green marketing in order to produce eco-friendly products.
According to Reddy (2015), the objective of the research was
to look into and explore the influencing of the four traditional
marketing-mix elements, satisfaction and word of mouth
(WOM) on attitude and purchasing intentions of consumers
on eco-friendly products specifically fasting moving consumer
goods (FMCG) or non-durable ones. The purpose of the study
was to obtain information from consumers’ point of view.
Furthermore, one perspective of the study was to look into the
comparison of the customer attitudes towards eco-friendly
products and how they are influenced by the marketing-mix
elements (4P), satisfaction and WOM concerning green
attitude.
Nowadays, Green marketing has to confront a lot of challenges
because of the lack of a universally accepted definition of the
concept “green”. The impact of human action on the
environment’s quality is visible, so in order to prevent the
negative influence on the environment green marketing has to
become a norm (Sandu, 2014).
According to Sheikh et. al. (2014) customers will likely to buy
such products if they are of good quality or equal to the non-
green products in quality and the price is compatible with the
quality. Some of the customers are willing to pay more prices
for green products and some prefer quality and functions of
green products over non-green products. Most of the people
prefer to have green products over non-green products at a
reasonable price.
According to Nagaraju (2014) identifying the eco-friendly
FMCG products through the eco-label and therefore it can be
considered as a major tool for environmental marketing. The
government, the organization and the customers have to move
in creating awareness of eco-friendly products.
The negative consequences on the environment due to
companies’ and human activities have led companies to develop
eco-friendly products. Remind that “Sustainable development
is development that meets the needs of the present without
compromising the ability of future generations to meet their
own needs.” This definition appeared for the first time in 1987,
in the Brundtland report also called: Our Common Future.
Grant (2007) defines sustainability as “The idea that
environmental (and ethical) objectives are not incompatible
with ongoing economic prosperity.”
The consumption of eco-friendly products and consumers’
attitudes towards these products has led to the development of
the green marketing mix (Datta and Ishaswini, 2011).
Green marketing term appeared at the end of the 1980’s. This
concept has been defined by many researchers such as Stanton
and Futrell (1987), Mintu and Lozanda (1993) and Polonsky
(1994), in a broad sense it is the marketing activities which
facilitate exchanges to satisfy consumer needs and wants by
minimizing the impact of these activities on the physical
environment.

Anusandhan - The Research Repository, Volume 3, Number 1 23
According to Chen and Chai (2010) green marketing is defined
as the activities taken by firms concerned about environmental
problems or green problems, by delivering the environmental
sound goods or services to create customers’ and society’s
satisfaction. Welford (2000) defined green marketing as “The
management process responsible for identifying, anticipating
and satisfying the requirements of customers and society in a
profitable and sustainable way”.
In a research by Kumar (2011), green marketing has been
developing because even if the human wants are unlimited the
natural and artificial resources are limited.
According to Chitra (2007), green marketing-mix elements and
eco-friendly products are designed and developed as having
less harmful for the environment.
Marly et al (2011) emphasised that environmental issues
became world known issues when much debate cropped up in
the 1960s in which Rachel Carson’s Silent Spring published
and examined critical concern on the sustainable and healthy
environment. This publication has 8 significant importance on
the recently concern of the today’s issues since the environment
has become a challenge for the worldwide leaders and have
realized the danger of the environmental degradation and
pollution.
Rahbar and Wahid (2011) defined the green marketing tools
as including eco-label, eco brand and environmental
advertisements. First two elements have importance in the
consumers’ behaviour towards green products.
OBJECTIVE OF THE STUDY
To establish relationship between consumers’ attitudes towards
eco-friendly products and their purchase intention in the Fast
Moving Consumer Goods (FMCG) sector.
HYPOTHESIS OF THE STUDY
H1: There is a significant relationship between consumers’
attitudes towards eco-friendly products and purchase intention
in the Fast Moving Consumer Goods (FMCG) sector.
RESEARCH METHODOLOGY
The data was collected from primary sources. For valid and
reliable results, a random sampling method was undertaken in
a sample size of 133 respondents. A self-designed questionnaire
was used as the tool for collecting primary data. The 5 point
Likert Scale questionnaire comprised ten statements measuring
respondents’ attitude and seven statements measuring their
purchase intention. The collected data was analysed using
Correlation and Regression Analysis.
Reliability of Questionnaire
The questionnaire was found to be reliable to be used for the
study as the Cronbach’s Alpha value was 0.846, refer Table 1.
Table 1: Reliability Statistics
Cronbach's Alpha No. of Items
0.846 28
RESULTS AND DISCUSSION
Demographic Profile
The respondents to the questionnaire were 75 males and 58
females in number. The respondents belonged to diverse age,
occupation, and income groups. 69 respondents belonged to
the age group of 18-24 years. 40 respondents were from 25-34
years. 21 respondents in the age group of 35-44 years and 3
respondents were from the age group of 45-54 years. 69 out of
133 respondents belonged to income generating group and the
remaining 64 were either students or housewives who did not
have an income. 59 of the total respondents for the study were
employed and 19 were unemployed, 55 were students and none
of the respondents were retired (Table 2, 3, 4 and 5).
Table 2: Gender of Respondents
Gender No. of Persons
Male 75
Female 58
Total 133
Table 3: Age of Respondents
Age No. of Persons
18-24 69
25-34 40
35-44 21
45-54 3
Total 133
Table 4: Income Group
Income Group No. of Persons
Income Generating 69
Non- Income Generating 64
Total 133
Table 5: Status
Type No. of Persons
Employed 59
Unemployed 19
Student 55
Retired 0
Total 133
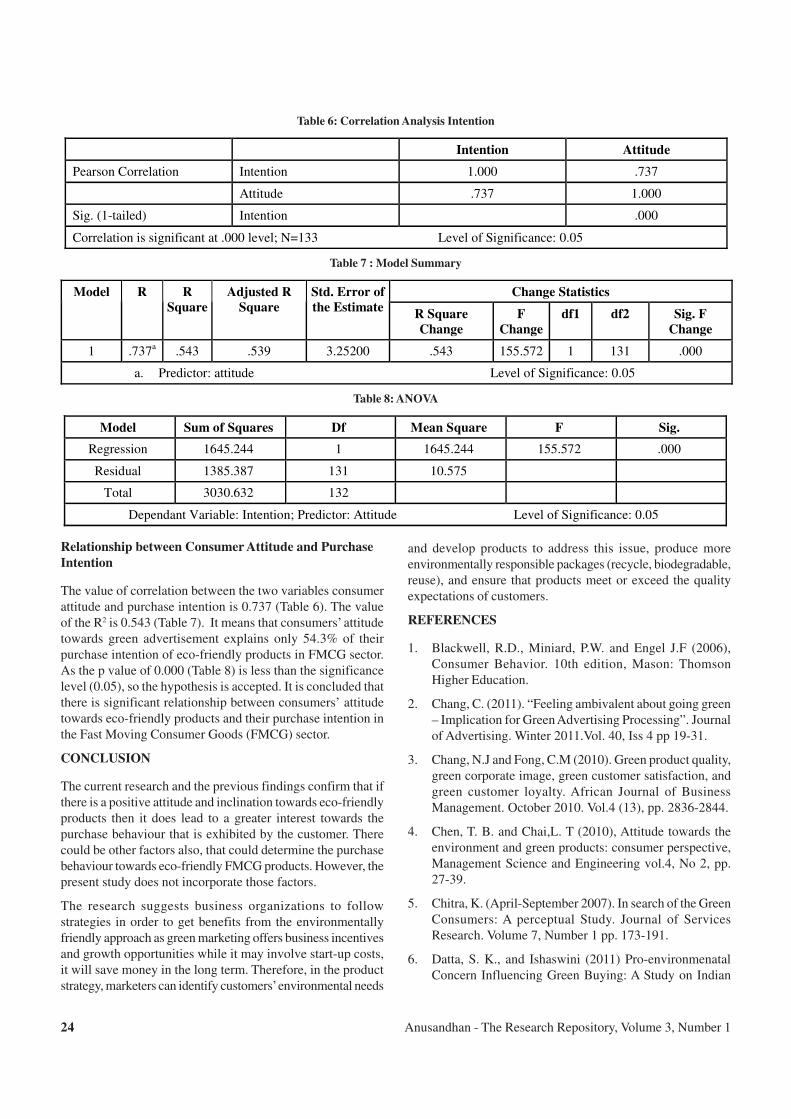
Anusandhan - The Research Repository, Volume 3, Number 124
Table 6: Correlation Analysis Intention
Intention Attitude
Pearson Correlation Intention 1.000 .737
Attitude .737 1.000
Sig. (1-tailed) Intention .000
Correlation is significant at .000 level; N=133 Level of Significance: 0.05
Table 7 : Model Summary
Change Statistics Model R R
Square
Adjusted R
Square
Std. Error of
the Estimate R Square
Change
F
Change
df1 df2 Sig. F
Change
1 .737a .543 .539 3.25200 .543 155.572 1 131 .000
a. Predictor: attitude Level of Significance: 0.05
Table 8: ANOVA
Model Sum of Squares Df Mean Square F Sig.
Regression 1645.244 1 1645.244 155.572 .000
Residual 1385.387 131 10.575
Total 3030.632 132
Dependant Variable: Intention; Predictor: Attitude Level of Significance: 0.05
Relationship between Consumer Attitude and Purchase
Intention
The value of correlation between the two variables consumer
attitude and purchase intention is 0.737 (Table 6). The value
of the R2 is 0.543 (Table 7). It means that consumers’ attitude
towards green advertisement explains only 54.3% of their
purchase intention of eco-friendly products in FMCG sector.
As the p value of 0.000 (Table 8) is less than the significance
level (0.05), so the hypothesis is accepted. It is concluded that
there is significant relationship between consumers’ attitude
towards eco-friendly products and their purchase intention in
the Fast Moving Consumer Goods (FMCG) sector.
CONCLUSION
The current research and the previous findings confirm that if
there is a positive attitude and inclination towards eco-friendly
products then it does lead to a greater interest towards the
purchase behaviour that is exhibited by the customer. There
could be other factors also, that could determine the purchase
behaviour towards eco-friendly FMCG products. However, the
present study does not incorporate those factors.
The research suggests business organizations to follow
strategies in order to get benefits from the environmentally
friendly approach as green marketing offers business incentives
and growth opportunities while it may involve start-up costs,
it will save money in the long term. Therefore, in the product
strategy, marketers can identify customers’ environmental needs
and develop products to address this issue, produce more
environmentally responsible packages (recycle, biodegradable,
reuse), and ensure that products meet or exceed the quality
expectations of customers.
REFERENCES
1. Blackwell, R.D., Miniard, P.W. and Engel J.F (2006),
Consumer Behavior. 10th edition, Mason: Thomson
Higher Education.
2. Chang, C. (2011). “Feeling ambivalent about going green
– Implication for Green Advertising Processing”. Journal
of Advertising. Winter 2011.Vol. 40, Iss 4 pp 19-31.
3. Chang, N.J and Fong, C.M (2010). Green product quality,
green corporate image, green customer satisfaction, and
green customer loyalty. African Journal of Business
Management. October 2010. Vol.4 (13), pp. 2836-2844.
4. Chen, T. B. and Chai,L. T (2010), Attitude towards the
environment and green products: consumer perspective,
Management Science and Engineering vol.4, No 2, pp.
27-39.
5. Chitra, K. (April-September 2007). In search of the Green
Consumers: A perceptual Study. Journal of Services
Research. Volume 7, Number 1 pp. 173-191.
6. Datta, S. K., and Ishaswini (2011) Pro-environmenatal
Concern Influencing Green Buying: A Study on Indian
Anusandhan - The Research Repository, Volume 3, Number 1 25
Consumers, International Journal of Business and
management Vol.6 No.6 pp. 124-133.
7. Finisterra do Paço, A.M, Lino BarataRaposo, M. & Leal
Filho, W. (2009). Identify the green consumer: a
segmentation study. Journal of Targeting, Measurement
and Analysis for Marketing. 17, pp. 17-25.
8. Florenthal, B. and Arling, P. A (2011), Do green lifestyle
consumers appreciate low involvement green products?
Marketing Management Journal, Vol.21, Issue 2. Pp 35-
45.
9. Kotler, P. & Keller, K.L (2009). Marketing Management.
13th edition. New Jersey: Pearson/Prentice-Hall.
10. Kumar, P. D. (December 2010) Green Marketing: A Start
to Environmental Safety. Advances in Management, Vol.
4, no. 12 pp. 59-61.
11. Marly, B. R., Levy, M. and Martinex J. (2011). The public
Health Implications of consumers’ Environmental Concern
and Their Willingness to pay for an Eco-Friendly product.
Journal of Consumer Affairs. Vol.45, No2, pp. 329-343.
12. Picket-Baker, J. and Ozaki R. (2008)., Pro-environmental
products: Marketing influence on consumer purchase
decision”. Journal of Consumer Marketing, Vol. 25 Iss: 5,
pp.281-293.
13. Polonsky, M. J. (November 1994). An Introduction to
Green Marketing. Electronic Green Journal, Vol. No. 2,
pp.44-53.
14. Rahbar E. and Wahid N. A., (2011) Investigation of green
marketing tools’ effect on consumers’ purchase behavior.
Business Strategy Series, Vol. 12 Iss: 2, pp.73 – 83.
15. Solomon, M. R., G. Bamossy, S. Askegaard, and M. K.
Hogg (2010). Consumer Behaviour: European
Perspective. 4th edition. New York: Prentice Hall.
16. Thogersen, J. (2011), Green Shopping: For Selfish
Reasons or the Common Good? American Behavioral
Scientist. 55 (8) pp.1052-1076.
17. Van Waterschoot, W. & Van den Bulte, C. (October 1992).
The 4P Classification of the Marketing Mix Revisited.
Journal of Marketing Vol. 56. pp. 83-93.
18. Vernekar, S.S, and Wadhwa, P. (2011). Green Consumption
an Empirical Study of Consumers Attitudes and Perception
regarding Eco-Friendly FMCG Products, with special
reference to Delhi and NCR Region. Opinion. Vol 1, N0
1, December 2011. Pp.64-74.

Anusandhan - The Research Repository, Volume 3, Number 126
IMPACT OF CORPORATE SOCIAL MARKETING ON CONSUMER ATTITUDE
Jyotsana Vaid1
Ayush Gupta2
ABSTRACT
Cause-related marketing as part of corporate social responsibility has become an increasingly used tool by companies operating
in the market. Increased consumer pressure on companies to behave more responsibly combined with the competitive challenge
of brand differentiation has stimulated interest in activities such as cause-related marketing (CRM). The purpose of this study
was to investigate the impact of corporate social marketing on consumer attitude. The study was carried out on 100 respondents
who were selected using Convenient Sampling from East Delhi region. For the purpose of data analysis, SPSS and regression
analysis were used to support the hypothesis testing. The study reveals that corporate social marketing has an impact on
consumer attitude.
Keywords: Corporate Social Responsibility, Consumer attitude, Cause-related marketing.
1 Assistant Professor, Gittaratan International Business School, Rohini, Delhi, [email protected] Student, Gittaratan International Business School, [email protected]
INTRODUCTION
Corporate social marketing is the systematic transfer of
commercial marketing concepts and tools to programs designed
to influence the voluntary behaviour of target audiences, where
the primary objective is to improve the social welfare of the
target audiences and/or the society of which they are a part.
Business enterprises are no longer expected to play their
traditional role of mere profit making enterprises. The ever-
increasing role of civil society has started to put pressure on
companies to act in an economically, socially and
environmentally sustainable way.
The companies are facing increased pressure for transparency
and accountability, being placed on them by their employees,
customers, shareholders, media and civil society. Business does
not operate in isolation and there is today, an increased
realization that not only can companies affect society at large,
but they are also in a unique position to influence society and
make positive impact.
The emerging concept of CSR goes beyond charity and requires
the company to act beyond its legal obligations and to integrate
social, environmental and ethical concerns into company’s
business process. What is generally understood by CSR is that
the business has a responsibility – towards its stakeholders
and society at large – that extends beyond its legal and
enforceable obligations.
The triple bottom line approach to CSR emphasizes a
company’s commitment to operating in an economically,
socially and environmentally sustainable manner. The emerging
concept of CSR advocates moving away from a ‘shareholder
alone’ focus to a ‘multi-stakeholder’ focus. This would include
investors, employees, business partners, customers, regulators,
supply chain, local communities, the environment and society
at large.Consumer attitude is a composite of three elements:
cognitive information, affective information, and information
concerning a consumer’s past behaviour and future intentions.
Consumer attitudes are both an obstacle and an advantage to a
marketer. Choosing to discount or ignore consumers’ attitudes
of a particular product or service—while developing a
marketing strategy—guarantees limited success of a campaign.
In contrast, perceptive marketers leverage their understanding
of attitudes to predict the behavior of consumers. These savvy
marketers know exactly how to distinguish the differences
between beliefs, attitudes, and behaviors while leveraging all
three in the development of marketing strategies.Decades of
research on attitudes and persuasion have suggested that people
are quick to form attitudes toward a wide variety of products,
persons and issues, and that attitudes are often held and
defended with remarkable tenacity.
Cause related marketing or social marketing is a form of
marketing in which a company and a charity team up together
to tackle a social or environmental problem and create business
value for the company at the same time. Typically, in cause-
related marketing campaigns, a brand is affiliated with a cause
and a portion of the proceeds from the sales of the brand is
donated to the cause. It has a great impact on both consumers’
perception as well as their attitude as if there is something for
a cause then people willingly contribute into that thing and
also show interest to help those who are in need in such a
manner. This is a way to aware and educate people for the
achievement of social good.
LITERATURE REVIEW
Goldsmith (2015) conducted a study on The Influences of
Brand Consumer and Cause Congruence on Cause Related
Marketing stated in this research that Cause Related Marketing
Anusandhan - The Research Repository, Volume 3, Number 1 27
(CRM) was a widely used type of brand alliance in which
companies donate a portion of their sales to social causes with
whom they ally.
Dropulji (2015) conducted a study on Consumers’ Attitudes
Towards Cause-Related Marketing.They saw cause-related
marketing campaigns as a good communication tool; they find
a cause to be relevant for their personal involvement in
campaigns, although the match between the cause and the
product’s characteristics seems to be less important.
Okhli (2014) conducted a study on a survey on the relationship
between consumer perception of Cause-Related Marketing and
Brand Image. It is found that cause-related marketing is one of
novel strategies for marketing in companies in order to create
special value for customers; such marketing defines a direct
relationship between products sale and the help an enterprise
devotes to a charity.
Ladero (2013) conducted a study on Does the Product Type
Influence on Attitudes Toward Cause-Related Marketing? He
found that many variables can influence consumer’s purchase
behaviour in general and attitudes towards Cause Related
Marketing (CRM) in particular.
Qamar (2013) conducted a study on Impact of Cause Related
Marketing on Consumer Purchase Intention: Mediating Role
of Corporate Image, Consumers’ Attitude and Brand
Attractiveness. The results of this study show that Cause Related
Marketing campaigns do contribute in consumers purchase
intention.
Rajput (2011) conducted a study on Social Cause Related
Marketing and its Impact on Customer Brand Preferences
examined that Social Cause Related Marketing (CRM) has
emerged as a top management priority in the last decade due
to the growing realization that it is one of the most valuable
intangible tool that firms have to gain better corporate image
from internal as well as external customers.
Pawlak (2011) conducted a study on Influence of a Company’s
Social Initiatives on Consumers. The results obtained show
that when undertaking a social programme which is not
consistent with thecompany’s actions to date, the attitude
towards it can even become worse.
Anghel (2011) conducted a study on Cause-Related Marketing,
Part of Corporate Social Responsibility and its influence upon
consumers’ attitude. The findings of the study shows that there
is a significant relationship between cause related marketing
and consumer attitude.
Akdogan (2011) conducted a study on Ethical Perceptions of
Social Marketing Campaigns: An Empirical Study on Turkish.
Consumers mostly emphasize that social marketing campaigns
are the intensive advertisement areas for the companies which
focus on increasing the sales and far from marketing social
thoughts.
Sharma (2010) conducted a study on Consumer Perception
and Attitude towards the Visual Elements in Social Campaign
Advertisement. Results indicate that perception towards image
of social advertisements differed quite significantly between
the male and the female respondents.
Lin (2010) conducted a study on The Impact of Social Cause’s
on Consumer Involvement on Brand Personality and Purchase
Intention. Result showed that there is a positive relationship
between cause-related marketing efforts and purchase intention.
Pileliené (2010) conducted a study on Impact of Social
Marketing Tools on Consumer Behaviour. The article analyses
socio-cultural aspects of sustainable development. The socio-
cultural sustainability reflects society’s ability of solving social,
economic, and environmental problems. Government and
socially responsible organizations can encourage and involve
people in the society to contribute to the improvement of the
quality of our lives.
Guchait (2008) conducted a study on Customer Perceptions
of Corporate Social Responsibility of Service Firms: Impact
on Customer Attitudes and Behavioural Intentions. The results
show that customer perceptions of CSR have a positive and
significant influence on customer attitudes and behavioural
intentions.
Farache (2007) conducted a study on Cause Related Marketing:
Consumers’ Perceptions and Benefits for Profit and Non-Profits
Organizations. The research found that consumers have a better
perception of firms that work with charities and good causes
than those that do not.
Westberg (2004) conducted a study on The Impact of Cause-
Related Marketing on Consumer Attitude to the Brand and
Purchase Intention: A Comparison with Sponsorship and Sales
Promotion. He found that Cause-related marketing was an
emerging area within the marketing discipline, originating in
the United States in the 1980s.
Westberg (2004) conducted a study on The Effect of Corporate
Societal Marketing on Consumer Attitudes: A Comparison of
Strategies. The study finds that corporate societal marketing
refers to marketing strategies that encompass at least one social
objective. Increased consumer pressure on companies to
behave more responsibly combined with the competitive
challenge of brand differentiation has stimulated interest in
activities such as cause-related marketing (CRM). The findings
indicate that, when controlling for existing brand attitude and
perception of fit, consumers have a more positive attitude to
CRM and that CRM can elicit a more favorable change in brand
attitude.
Chattananon (2003) conducted a study on The Impact of
Societal Marketing Programs on Customer Attitudes Toward
Corporate Image in Thailand stated in this research paper that
Corporations in the twenty-first century are increasingly
concerned about managing societal issues in marketing to
benefit key stakeholder interests, particularly customer groups.
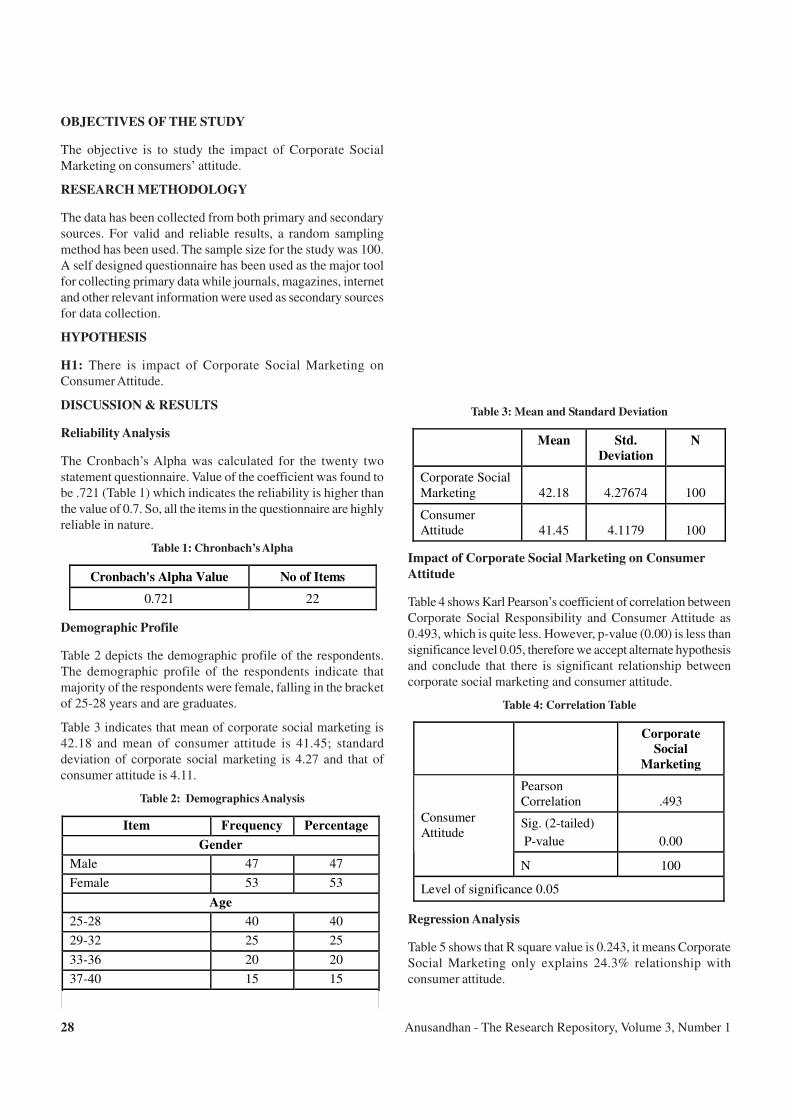
Anusandhan - The Research Repository, Volume 3, Number 128
OBJECTIVES OF THE STUDY
The objective is to study the impact of Corporate Social
Marketing on consumers’ attitude.
RESEARCH METHODOLOGY
The data has been collected from both primary and secondary
sources. For valid and reliable results, a random sampling
method has been used. The sample size for the study was 100.
A self designed questionnaire has been used as the major tool
for collecting primary data while journals, magazines, internet
and other relevant information were used as secondary sources
for data collection.
HYPOTHESIS
H1: There is impact of Corporate Social Marketing on
Consumer Attitude.
DISCUSSION & RESULTS
Reliability Analysis
The Cronbach’s Alpha was calculated for the twenty two
statement questionnaire. Value of the coefficient was found to
be .721 (Table 1) which indicates the reliability is higher than
the value of 0.7. So, all the items in the questionnaire are highly
reliable in nature.
Table 1: Chronbach’s Alpha
Cronbach's Alpha Value No of Items
0.721 22
Demographic Profile
Table 2 depicts the demographic profile of the respondents.
The demographic profile of the respondents indicate that
majority of the respondents were female, falling in the bracket
of 25-28 years and are graduates.
Table 3 indicates that mean of corporate social marketing is
42.18 and mean of consumer attitude is 41.45; standard
deviation of corporate social marketing is 4.27 and that of
consumer attitude is 4.11.
Table 2: Demographics Analysis
Item Frequency Percentage
Gender
Male 47 47
Female 53 53
Age
25-28 40 40
29-32 25 25
33-36 20 20
37-40 15 15
Education Level
Table 3: Mean and Standard Deviation
Mean Std.
Deviation
N
Corporate Social Marketing 42.18 4.27674 100
Consumer Attitude 41.45 4.1179 100
Impact of Corporate Social Marketing on Consumer
Attitude
Table 4 shows Karl Pearson’s coefficient of correlation between
Corporate Social Responsibility and Consumer Attitude as
0.493, which is quite less. However, p-value (0.00) is less than
significance level 0.05, therefore we accept alternate hypothesis
and conclude that there is significant relationship between
corporate social marketing and consumer attitude.
Table 4: Correlation Table
Corporate
Social
Marketing
Pearson Correlation .493
Sig. (2-tailed)
P-value 0.00
Consumer Attitude
N 100
Level of significance 0.05
Regression Analysis
Table 5 shows that R square value is 0.243, it means Corporate
Social Marketing only explains 24.3% relationship with
consumer attitude.
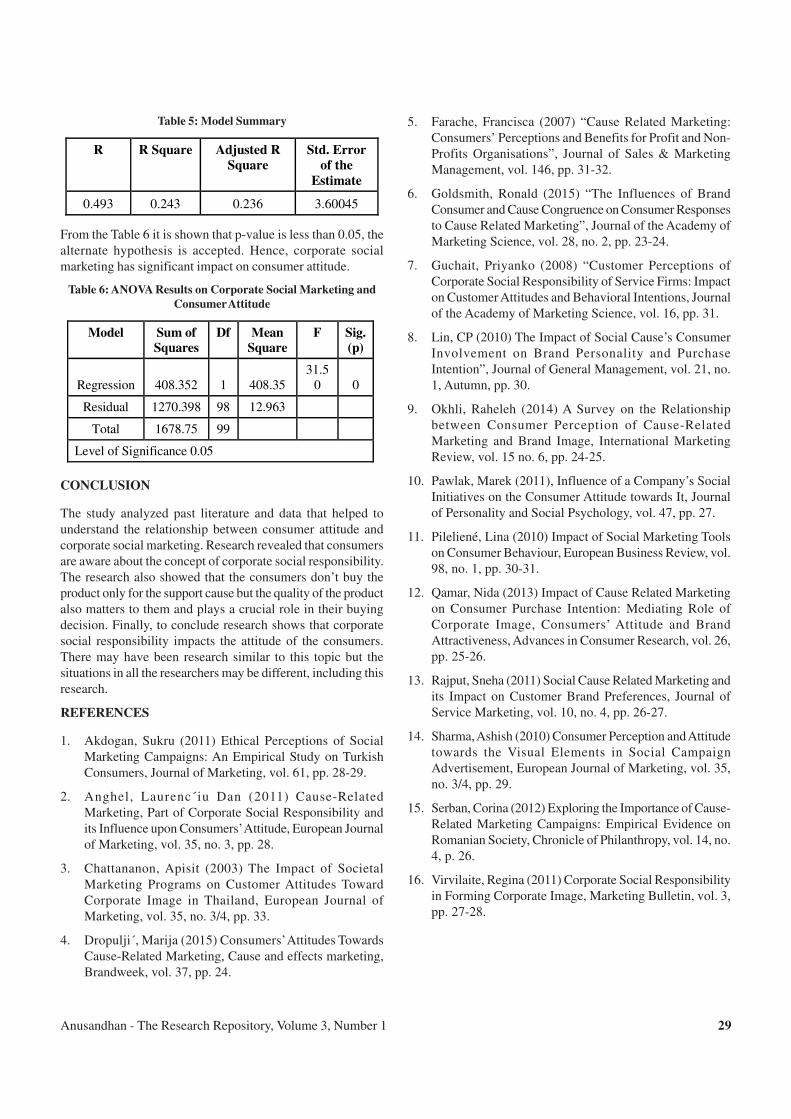
Anusandhan - The Research Repository, Volume 3, Number 1 29
Table 5: Model Summary
R R Square Adjusted R
Square
Std. Error
of the
Estimate
0.493 0.243 0.236 3.60045
From the Table 6 it is shown that p-value is less than 0.05, the
alternate hypothesis is accepted. Hence, corporate social
marketing has significant impact on consumer attitude.
Table 6: ANOVA Results on Corporate Social Marketing and
Consumer Attitude
Model Sum of
Squares
Df Mean
Square
F Sig.
(p)
Regression 408.352 1 408.35 31.5
0 0
Residual 1270.398 98 12.963
Total 1678.75 99
Level of Significance 0.05
CONCLUSION
The study analyzed past literature and data that helped to
understand the relationship between consumer attitude and
corporate social marketing. Research revealed that consumers
are aware about the concept of corporate social responsibility.
The research also showed that the consumers don’t buy the
product only for the support cause but the quality of the product
also matters to them and plays a crucial role in their buying
decision. Finally, to conclude research shows that corporate
social responsibility impacts the attitude of the consumers.
There may have been research similar to this topic but the
situations in all the researchers may be different, including this
research.
REFERENCES
1. Akdogan, Sukru (2011) Ethical Perceptions of Social
Marketing Campaigns: An Empirical Study on Turkish
Consumers, Journal of Marketing, vol. 61, pp. 28-29.
2. Anghel, Laurenc´iu Dan (2011) Cause-Related
Marketing, Part of Corporate Social Responsibility and
its Influence upon Consumers’ Attitude, European Journal
of Marketing, vol. 35, no. 3, pp. 28.
3. Chattananon, Apisit (2003) The Impact of Societal
Marketing Programs on Customer Attitudes Toward
Corporate Image in Thailand, European Journal of
Marketing, vol. 35, no. 3/4, pp. 33.
4. Dropulji´, Marija (2015) Consumers’ Attitudes Towards
Cause-Related Marketing, Cause and effects marketing,
Brandweek, vol. 37, pp. 24.
5. Farache, Francisca (2007) “Cause Related Marketing:
Consumers’ Perceptions and Benefits for Profit and Non-
Profits Organisations”, Journal of Sales & Marketing
Management, vol. 146, pp. 31-32.
6. Goldsmith, Ronald (2015) “The Influences of Brand
Consumer and Cause Congruence on Consumer Responses
to Cause Related Marketing”, Journal of the Academy of
Marketing Science, vol. 28, no. 2, pp. 23-24.
7. Guchait, Priyanko (2008) “Customer Perceptions of
Corporate Social Responsibility of Service Firms: Impact
on Customer Attitudes and Behavioral Intentions, Journal
of the Academy of Marketing Science, vol. 16, pp. 31.
8. Lin, CP (2010) The Impact of Social Cause’s Consumer
Involvement on Brand Personality and Purchase
Intention”, Journal of General Management, vol. 21, no.
1, Autumn, pp. 30.
9. Okhli, Raheleh (2014) A Survey on the Relationship
between Consumer Perception of Cause-Related
Marketing and Brand Image, International Marketing
Review, vol. 15 no. 6, pp. 24-25.
10. Pawlak, Marek (2011), Influence of a Company’s Social
Initiatives on the Consumer Attitude towards It, Journal
of Personality and Social Psychology, vol. 47, pp. 27.
11. Pileliené, Lina (2010) Impact of Social Marketing Tools
on Consumer Behaviour, European Business Review, vol.
98, no. 1, pp. 30-31.
12. Qamar, Nida (2013) Impact of Cause Related Marketing
on Consumer Purchase Intention: Mediating Role of
Corporate Image, Consumers’ Attitude and Brand
Attractiveness, Advances in Consumer Research, vol. 26,
pp. 25-26.
13. Rajput, Sneha (2011) Social Cause Related Marketing and
its Impact on Customer Brand Preferences, Journal of
Service Marketing, vol. 10, no. 4, pp. 26-27.
14. Sharma, Ashish (2010) Consumer Perception and Attitude
towards the Visual Elements in Social Campaign
Advertisement, European Journal of Marketing, vol. 35,
no. 3/4, pp. 29.
15. Serban, Corina (2012) Exploring the Importance of Cause-
Related Marketing Campaigns: Empirical Evidence on
Romanian Society, Chronicle of Philanthropy, vol. 14, no.
4, p. 26.
16. Virvilaite, Regina (2011) Corporate Social Responsibility
in Forming Corporate Image, Marketing Bulletin, vol. 3,
pp. 27-28.

Anusandhan - The Research Repository, Volume 3, Number 130
FACTORS AFFECTING COMPULSIVE BEHAVIOUR OF CREDIT CARD USERS
Prerna Garg1
Satyendra Kumar2
ABSTRACT
The study focuses to identify the most significant factors which affect the compulsive behaviour of credit card users. Literature
Review was carried out to understand the underlying factors affecting credit card usage and form a rough framework to design
the instrument to serve the objectives. The study was conducted on a sample size of 120 respondents from Delhi, selected using
convenience sampling. Factor Analysis was conducted to identify factors. Total nine significant factors were identified, viz.,
Convenience to use, Necessity, Status, Impulsive, Self-Prestige, Complexity in use, Benefits associated, Cash less and Over
expenditure. There is lack of trust regarding credit card usage among people. The credit card industry should make certain
policies by which credit card users can rely on using of credit cards to a greater extent.
Keywords: Behaviour, Cashless, Compulsive, Credit card, Impulsive.
1 Assistant Professor, Gitarattan International Business School, [email protected] Student, Gitarattan International Business School, [email protected]
INTRODUCTION
Debt is a major problem for many people. The financial choices
a person makes when they begin adulthood will affect whether
they become one of the many. Spending habits as well as the
use of credit cards can affect a person’s financial stability
throughout their lifetime; therefore, it is important for
individuals to learn good spending choices before they become
adults and enter into the realm of credit.
Credit card is a mode of payment that is widely used by
consumers to purchase goods and services on credit. The
growth in credit card usage is parallel with the growth in other
types of consumer credits such as bank overdrafts, personal
loans, hire purchase and others. Credit card use represents a
customer lifestyle and increase in the standard of living.
There are many factors that may influence credit card debt
and a significant amount of research that has looked for and
examined these factors. Financial knowledge is “one of the
strongest predictors of debt,” according to Norvilitis et al.
(2006).
LITERATURE REVIEW
There is a great amount of research that states that financial
knowledge has a strong relationship with credit card use.
Financial planning practices correlated with positive credit
usage (Moore & Carpenter, 2009). Lai (2010) found that taking
a course in financial planning decreased the likelihood of
impulse buying.
Robb (2011) also found that students who engaged in more
responsible credit card use were more likely to have higher
scores on a measure of personal financial knowledge.
Compulsive behaviour is defined as performing an act
persistently and repetitively without it necessarily leading to
an actual reward or pleasure. Compulsive behaviour could be
an attempt to make obsessions go away. Compulsive behaviours
are a need to reduce apprehension caused by internal feelings
a person wants to abstain or control. It is a negative form of
behaviour that leads to overspending. Compulsive buyers are
likely to relate money to power, success, and status. Compulsive
buyers perceive their purchases as a way of overcoming
negative self esteem and anxiety.
Compulsive buying is chronic, repetitive purchasing that
becomes a primary response to negative events of feelings
(O’Quinn and Faber, 1989). Moreover everyone regardless
their gender, age or social status may be the victim of
compulsive buying. Compulsive behaviours are a need to
reduce apprehension caused by internal feelings a person wants
to abstain or control.
D’Astous (1990) describes it as a generalised urge to buy while
Brougham et al. (2011) speak more strongly of the inability to
control purchasing behaviour. More comprehensively, McElroy
et al. (1994) describe it as a maladaptive preoccupation with
shopping which leads to irresistible impulses to buy items that
are not needed and cannot be afforded, often frequently, causing
distress and financial problems which interfere with social and
occupational life. A mild form of such behaviour would be a
‘shopping spree’, while the other end of the scale is
characterised by serious patterns of overspending (Wansink,
1994).
Arabzadeh & Aghaeian (2015) revealed that usage of credit
card can influence lifestyles and purchasing behaviour of the
cardholders as well as its impact on attitude toward debt.
However, there is no proof of connection between management
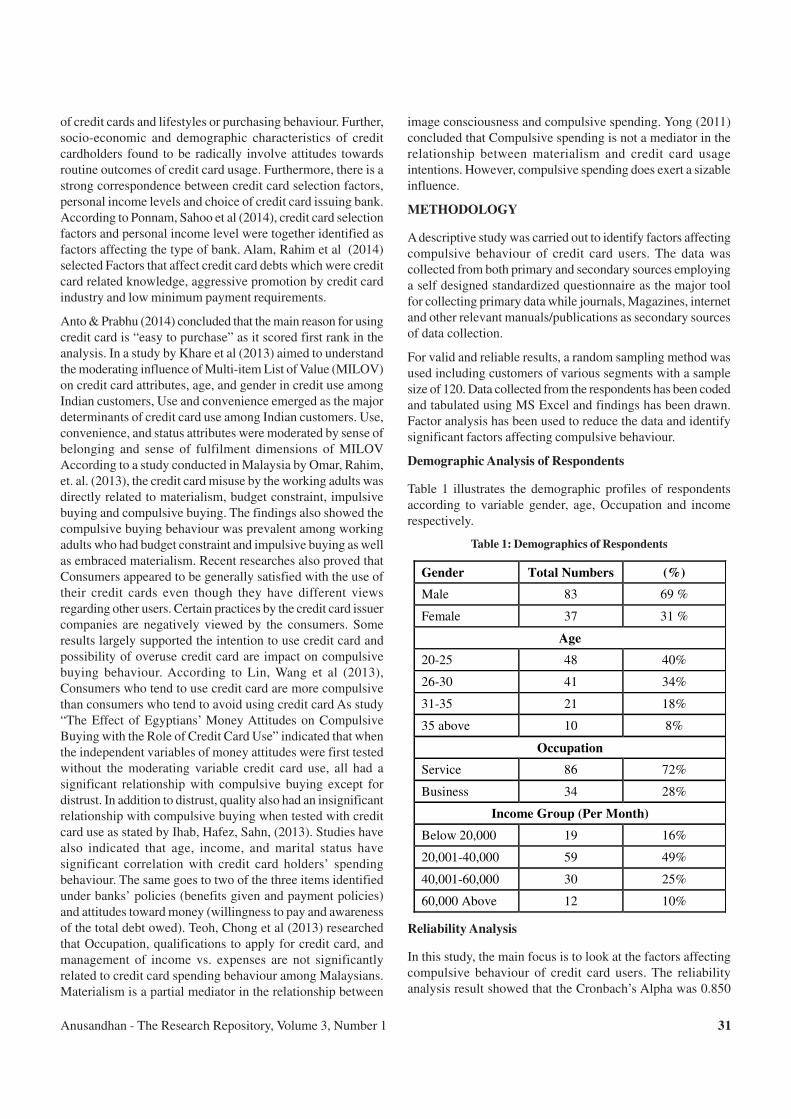
Anusandhan - The Research Repository, Volume 3, Number 1 31
of credit cards and lifestyles or purchasing behaviour. Further,
socio-economic and demographic characteristics of credit
cardholders found to be radically involve attitudes towards
routine outcomes of credit card usage. Furthermore, there is a
strong correspondence between credit card selection factors,
personal income levels and choice of credit card issuing bank.
According to Ponnam, Sahoo et al (2014), credit card selection
factors and personal income level were together identified as
factors affecting the type of bank. Alam, Rahim et al (2014)
selected Factors that affect credit card debts which were credit
card related knowledge, aggressive promotion by credit card
industry and low minimum payment requirements.
Anto & Prabhu (2014) concluded that the main reason for using
credit card is “easy to purchase” as it scored first rank in the
analysis. In a study by Khare et al (2013) aimed to understand
the moderating influence of Multi-item List of Value (MILOV)
on credit card attributes, age, and gender in credit use among
Indian customers, Use and convenience emerged as the major
determinants of credit card use among Indian customers. Use,
convenience, and status attributes were moderated by sense of
belonging and sense of fulfilment dimensions of MILOV
According to a study conducted in Malaysia by Omar, Rahim,
et. al. (2013), the credit card misuse by the working adults was
directly related to materialism, budget constraint, impulsive
buying and compulsive buying. The findings also showed the
compulsive buying behaviour was prevalent among working
adults who had budget constraint and impulsive buying as well
as embraced materialism. Recent researches also proved that
Consumers appeared to be generally satisfied with the use of
their credit cards even though they have different views
regarding other users. Certain practices by the credit card issuer
companies are negatively viewed by the consumers. Some
results largely supported the intention to use credit card and
possibility of overuse credit card are impact on compulsive
buying behaviour. According to Lin, Wang et al (2013),
Consumers who tend to use credit card are more compulsive
than consumers who tend to avoid using credit card As study
“The Effect of Egyptians’ Money Attitudes on Compulsive
Buying with the Role of Credit Card Use” indicated that when
the independent variables of money attitudes were first tested
without the moderating variable credit card use, all had a
significant relationship with compulsive buying except for
distrust. In addition to distrust, quality also had an insignificant
relationship with compulsive buying when tested with credit
card use as stated by Ihab, Hafez, Sahn, (2013). Studies have
also indicated that age, income, and marital status have
significant correlation with credit card holders’ spending
behaviour. The same goes to two of the three items identified
under banks’ policies (benefits given and payment policies)
and attitudes toward money (willingness to pay and awareness
of the total debt owed). Teoh, Chong et al (2013) researched
that Occupation, qualifications to apply for credit card, and
management of income vs. expenses are not significantly
related to credit card spending behaviour among Malaysians.
Materialism is a partial mediator in the relationship between
image consciousness and compulsive spending. Yong (2011)
concluded that Compulsive spending is not a mediator in the
relationship between materialism and credit card usage
intentions. However, compulsive spending does exert a sizable
influence.
METHODOLOGY
A descriptive study was carried out to identify factors affecting
compulsive behaviour of credit card users. The data was
collected from both primary and secondary sources employing
a self designed standardized questionnaire as the major tool
for collecting primary data while journals, Magazines, internet
and other relevant manuals/publications as secondary sources
of data collection.
For valid and reliable results, a random sampling method was
used including customers of various segments with a sample
size of 120. Data collected from the respondents has been coded
and tabulated using MS Excel and findings has been drawn.
Factor analysis has been used to reduce the data and identify
significant factors affecting compulsive behaviour.
Demographic Analysis of Respondents
Table 1 illustrates the demographic profiles of respondents
according to variable gender, age, Occupation and income
respectively.
Table 1: Demographics of Respondents
Gender Total Numbers (%)
Male 83 69 %
Female 37 31 %
Age
20-25 48 40%
26-30 41 34%
31-35 21 18%
35 above 10 8%
Occupation
Service 86 72%
Business 34 28%
Income Group (Per Month)
Below 20,000 19 16%
20,001-40,000 59 49%
40,001-60,000 30 25%
60,000 Above 12 10%
Reliability Analysis
In this study, the main focus is to look at the factors affecting
compulsive behaviour of credit card users. The reliability
analysis result showed that the Cronbach’s Alpha was 0.850
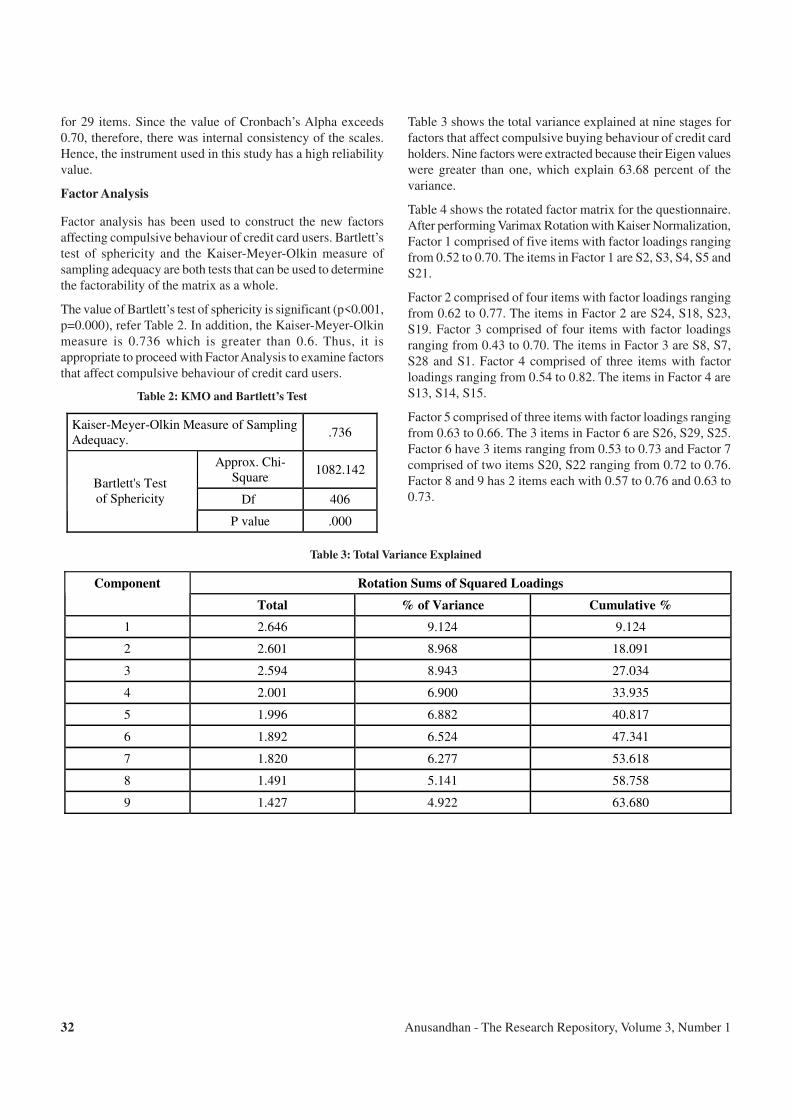
Anusandhan - The Research Repository, Volume 3, Number 132
for 29 items. Since the value of Cronbach’s Alpha exceeds
0.70, therefore, there was internal consistency of the scales.
Hence, the instrument used in this study has a high reliability
value.
Factor Analysis
Factor analysis has been used to construct the new factors
affecting compulsive behaviour of credit card users. Bartlett’s
test of sphericity and the Kaiser-Meyer-Olkin measure of
sampling adequacy are both tests that can be used to determine
the factorability of the matrix as a whole.
The value of Bartlett’s test of sphericity is significant (p<0.001,
p=0.000), refer Table 2. In addition, the Kaiser-Meyer-Olkin
measure is 0.736 which is greater than 0.6. Thus, it is
appropriate to proceed with Factor Analysis to examine factors
that affect compulsive behaviour of credit card users.
Table 2: KMO and Bartlett’s Test
Kaiser-Meyer-Olkin Measure of Sampling Adequacy.
.736
Approx. Chi-Square
1082.142
Df 406
Bartlett's Test of Sphericity
P value .000
Table 3 shows the total variance explained at nine stages for
factors that affect compulsive buying behaviour of credit card
holders. Nine factors were extracted because their Eigen values
were greater than one, which explain 63.68 percent of the
variance.
Table 4 shows the rotated factor matrix for the questionnaire.
After performing Varimax Rotation with Kaiser Normalization,
Factor 1 comprised of five items with factor loadings ranging
from 0.52 to 0.70. The items in Factor 1 are S2, S3, S4, S5 and
S21.
Factor 2 comprised of four items with factor loadings ranging
from 0.62 to 0.77. The items in Factor 2 are S24, S18, S23,
S19. Factor 3 comprised of four items with factor loadings
ranging from 0.43 to 0.70. The items in Factor 3 are S8, S7,
S28 and S1. Factor 4 comprised of three items with factor
loadings ranging from 0.54 to 0.82. The items in Factor 4 are
S13, S14, S15.
Factor 5 comprised of three items with factor loadings ranging
from 0.63 to 0.66. The 3 items in Factor 6 are S26, S29, S25.
Factor 6 have 3 items ranging from 0.53 to 0.73 and Factor 7
comprised of two items S20, S22 ranging from 0.72 to 0.76.
Factor 8 and 9 has 2 items each with 0.57 to 0.76 and 0.63 to
0.73.
Table 3: Total Variance Explained
Rotation Sums of Squared Loadings Component
Total % of Variance Cumulative %
1 2.646 9.124 9.124
2 2.601 8.968 18.091
3 2.594 8.943 27.034
4 2.001 6.900 33.935
5 1.996 6.882 40.817
6 1.892 6.524 47.341
7 1.820 6.277 53.618
8 1.491 5.141 58.758
9 1.427 4.922 63.680
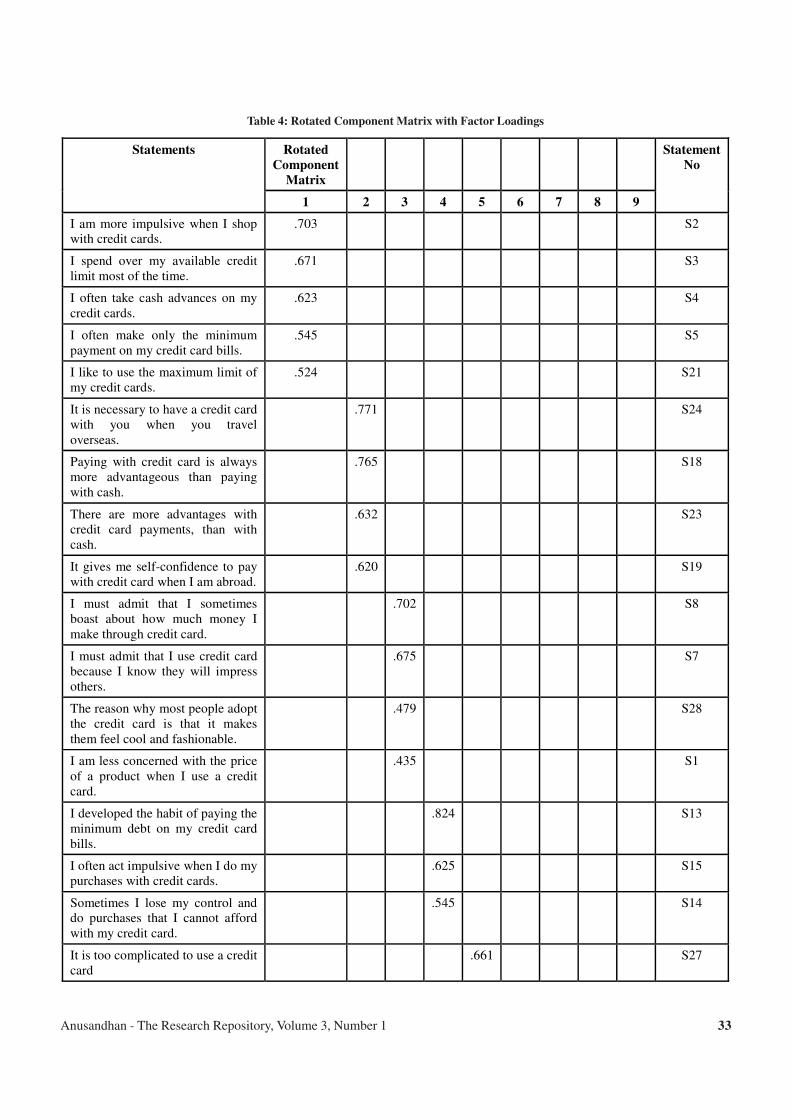
Anusandhan - The Research Repository, Volume 3, Number 1 33
Table 4: Rotated Component Matrix with Factor Loadings
Rotated
Component
Matrix
Statements
1 2 3 4 5 6 7 8 9
Statement
No
I am more impulsive when I shop with credit cards.
.703 S2
I spend over my available credit limit most of the time.
.671 S3�
I often take cash advances on my credit cards.
.623 S4�
I often make only the minimum payment on my credit card bills.
.545 S5�
I like to use the maximum limit of my credit cards.
.524 S21�
It is necessary to have a credit card with you when you travel overseas.
.771 S24�
Paying with credit card is always more advantageous than paying with cash.
.765 S18�
There are more advantages with credit card payments, than with cash.
.632 S23�
It gives me self-confidence to pay with credit card when I am abroad.
.620 S19�
I must admit that I sometimes boast about how much money I make through credit card.
.702 S8�
I must admit that I use credit card because I know they will impress others.
.675 S7�
The reason why most people adopt the credit card is that it makes them feel cool and fashionable.
.479 S28�
I am less concerned with the price of a product when I use a credit card.
.435 S1�
I developed the habit of paying the minimum debt on my credit card bills.
.824 S13�
I often act impulsive when I do my purchases with credit cards.
.625 S15�
Sometimes I lose my control and do purchases that I cannot afford with my credit card.
.545 S14�
It is too complicated to use a credit card
.661 S27�
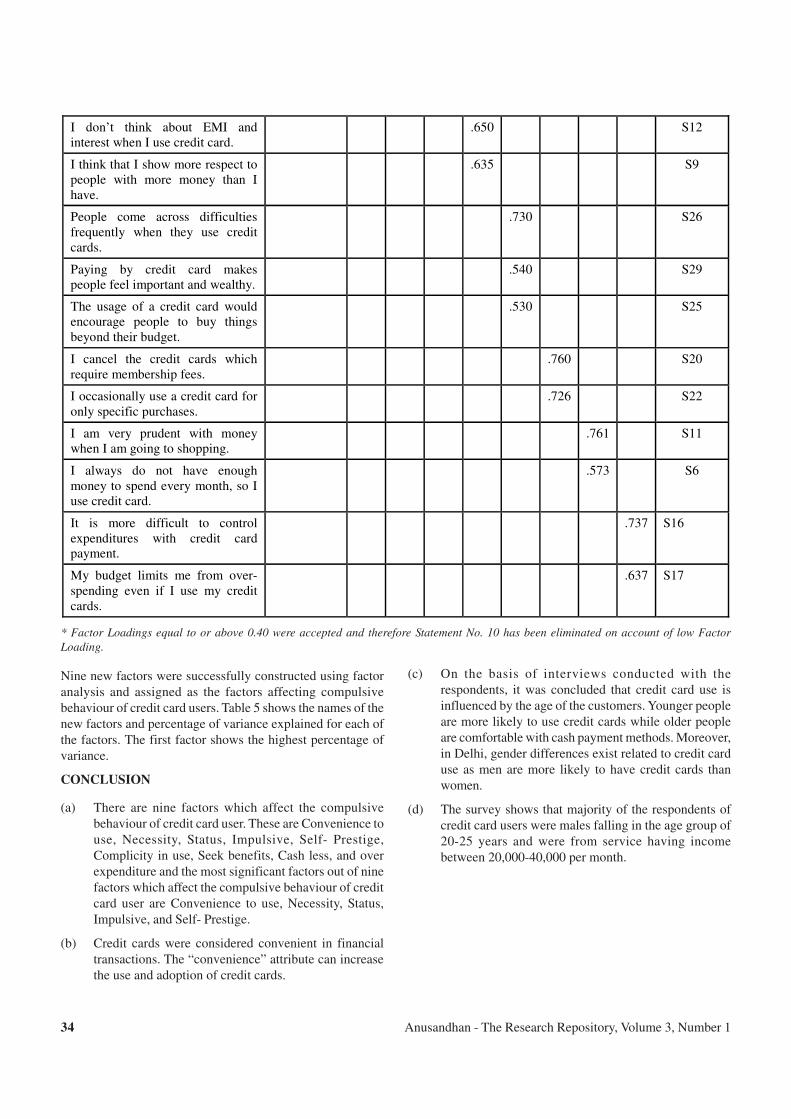
Anusandhan - The Research Repository, Volume 3, Number 134
I don’t think about EMI and interest when I use credit card.
.650 S12�
I think that I show more respect to people with more money than I have.
.635 S9�
People come across difficulties frequently when they use credit cards.
.730 S26�
Paying by credit card makes people feel important and wealthy.
.540 S29�
The usage of a credit card would encourage people to buy things beyond their budget.
.530 S25�
I cancel the credit cards which require membership fees.
.760 S20�
I occasionally use a credit card for only specific purchases.
.726 S22�
I am very prudent with money when I am going to shopping.
.761 S11�
I always do not have enough money to spend every month, so I use credit card.
.573 S6�
It is more difficult to control expenditures with credit card payment.
.737 S16�
My budget limits me from over-spending even if I use my credit cards.
.637 S17�
* Factor Loadings equal to or above 0.40 were accepted and therefore Statement No. 10 has been eliminated on account of low Factor
Loading.
Nine new factors were successfully constructed using factor
analysis and assigned as the factors affecting compulsive
behaviour of credit card users. Table 5 shows the names of the
new factors and percentage of variance explained for each of
the factors. The first factor shows the highest percentage of
variance.
CONCLUSION
(a) There are nine factors which affect the compulsive
behaviour of credit card user. These are Convenience to
use, Necessity, Status, Impulsive, Self- Prestige,
Complicity in use, Seek benefits, Cash less, and over
expenditure and the most significant factors out of nine
factors which affect the compulsive behaviour of credit
card user are Convenience to use, Necessity, Status,
Impulsive, and Self- Prestige.
(b) Credit cards were considered convenient in financial
transactions. The “convenience” attribute can increase
the use and adoption of credit cards.
(c) On the basis of interviews conducted with the
respondents, it was concluded that credit card use is
influenced by the age of the customers. Younger people
are more likely to use credit cards while older people
are comfortable with cash payment methods. Moreover,
in Delhi, gender differences exist related to credit card
use as men are more likely to have credit cards than
women.
(d) The survey shows that majority of the respondents of
credit card users were males falling in the age group of
20-25 years and were from service having income
between 20,000-40,000 per month.

Anusandhan - The Research Repository, Volume 3, Number 1 35
Table 5: Factors affecting Compulsive Buying among Credit
Card Users
Factor Name % of Variance
1 Convenience to use 9.124
2 Necessity 8.968
3 Status 8.943
4 Impulsive 6.900
5 Self -Prestige 6.882
6 Complexity in use 6.524
7 Benefits sought 6.277
8 Cash less 5.141
9 Over expenditure 4.922
REFERENCES
1. Arabzadeh, Esmaeil & Aghaeian, Sara (2015). The
Relationship of Usages and Management of Credit Cards
on Lifestyles and Purchasing Behaviours of Cardholders.
International Journal of Management Research and
Business Strategy, 4(3), 245-256.
2. Hafez, Mahinaz, Sahn,Mohamed & Farrag, Dalia Rahman
(2013) The Effect of Egyptians’ Money Attitudes on
Compulsive Buying with the Role of Credit Card Use,
The Macrotheme Review, 2(6), 73-88.
3. Khare, Arpita & Khare, Anshuman. (2013). Factors
affecting credit card use in India. Asia Pacific Journal of
Marketing and Logistics, 24(2), 236-256.
4. Kumar, Sudhershan (2013) Consumers attitude towards
credit cards: An empirical study. International Journal of
Computing and Business Research, 4(3), 54-59.
5. Nga, Joyce K.H, Yong, Lisa H.L. & Sellappan,
Rathakrishnan (2011). The influence of image
consciousness, materialism and compulsive spending on
credit card usage intentions among youth. International
Journal of Business Administration, 12(3), 243 – 253.
6. Omar, Nor Asiah, Rahim, Ruzita Abdul,Wel, Che Aniza
Che & Alam, Syed Shah. (2013). Compulsive buying and
credit card misuse among credit card holders: The roles
of self-esteem, materialism, impulsive buying and budget
constraint. International Journal of Computing and
Business Research, 10(1), 52-74.
7. Ponnam, Abhilash, Sahoo, Debajani, Sarkar, Abhigyan,
& Narayan Mohapatra, Surya. (2014). An exploratory
study of factors affecting credit card brand and category
selection in India. Journal of Financial Services Marketing,
19(3), 221 –233.
8. Rahim, Ruzita Abdul, Alam, Syed Shah, Haq, Ridhwanul
& Khan, Atiqur Rahman. (2014). What influence credit
card debts in young consumers in Malaysia. Journal of
Public Administration, Finance and Law, (6), 106-116.
9. Themba, Godfrey & Tumedi, Clara. B. (2012). Credit Card
Ownership and Usage Behaviour in Botswana.
International Journal of Business Administration, 3(6), 60-
71.
10. Veludo-de-Oliveira, Tania Modesto, Falciano, Marcelo
Augusto & Perito, Renato Villas Boas. (2013) Effects of
credit card usage on young Brazilians’ compulsive buying.
Asia Pacific Journal of Marketing and Logistics, 15(2),
111-124.
Anusandhan - The Research Repository, Volume 3, Number 136
IMPACT OF COLOUR ON CONSUMER BRAND PERCEPTION
D.K.Choudhury1
Shidharth Batra2
ABSTRACT
Colour is ubiquitous and is a source of information. The earlier researchers argued that the prudent use of colours can contribute
not only to differentiating products from competitors, but also to influencing moods and feelings and therefore, to attitude
towards certain products. The interactive effects of colours show that the relationship between brands and colour hinges on the
perceived appropriateness of the colour being used for the particular brand. There have been numerous attempts to classify
consumer responses to different individual colours, but the truth of the matter is that colour is much dependent on personal
experiences to be universally translated to specific feelings. The previous works of researchers have revealed that our brains
prefer recognizable brands, which makes colour incredibly important when creating a brand identity. It has suggested researchers
that it is paramount importance for new brands to specifically target logo colours that ensure differentiation from entrenched
competitors. So, it is important that the managers understand the importance of colours in marketing and use it appropriately
in advertising, packaging, and designing company's logo. With this backdrop, this research work was designed to find out the
impact of colour on consumer brand perception. The outcome of this study reveals that the white, red, black and brown colour
has impact on sincerity, excitement, sophistication, and ruggedness respectivelyof the brand.
Keywords: Colour, Brand, Perception, Hue, Psychology, Sincerity, Excitement, Competence, Sophistication, Ruggedness.
1 Professor, Gitarattan International Business School, Delhi2 Student, Gitarattan International Business School, Delhi
INTRODUCTION
Creating a brand is the ultimate aim of marketing endeavor
(Harsh et al. 2008). According to the American Marketing
Association, a brand is a name, term, sign, symbol or design,
or a combination of them, intended to identify the goods or
services of one seller or group of sellers and to differentiate
them from those of competitors while a brand image is the set
of human characteristics linked to the brand that consumers
hold in memory (Keller 1991).
The perception is the process by which an individual selects,
organizes and interprets stimuli into a meaningful and coherent
picture of the world (Batra et al. 2013). Marketers are using
colour in innovative ways as colour attracts consumers and
can shape their perceptions. Through colour, a brand can
establish an effective visual identity and position itself among
competitors in the market place. In the real life situation, Pepsi
moved away from red and embraced the colour blue, which is
painting a Concorde jet in its signature blue colour to
distinguish itself from its main competitors (Cooper 1996).
Colour sells products. It is a powerful marketing tool that
significantly influences consumer purchases, so much so that
it develops huge impact on our mind to purchase a product.
Colour is the visual perceptual property of humans having
categories called red, blue, yellow, etc.
According to the science, colour is derived from the spectrum
of light. It interacts in the eye with the spectral sensitivities of
the light receptors. The fundamentals of colour are based on
Albert H.Munsell’s theory of colour.
The way we visually match colour today is the result of Albert
H. Munsell’s work nearly a century ago. In fact, modern day
colour theory and mathematical colour system is based on
Munsell’s theory of colour. For years,scientists had studied
the mechanics of colour going as far back as Newton’s early
colourwheel. But A.H. Munsell had combined the art and
science of colour into a single colour theory. His ground
breaking work laid the foundation for today’s computerized
colour matching systems and enabled a greater understanding
of colour principles for generation to come.
According to Munsell34colour system, each colour has three
attributes: Hue, value (brightness), and chroma (saturation).
Hue is the wavelength of a colour and determines its label.
Red, yellow, green, blue and purple are identified as the five
principal hues in the Munsell colour system. Value (brightness)
refers to the degree of darkness or lightness of the colour,
extending from white to black. The Chroma (saturation) of
colour describes the degree of purity of colour; it is the amount
of pigment in a colour and it can be explained as the mixing of
white with a colour, which reduces the saturation of colour
(Lauren et al. 2012).
The resultant effect of three attributes, as mentioned above,
determine how people perceive colour. Like a carefully chosen
brand name, colour carries intrinsic meaning that becomes
central to the brand’s identity, contributes to brand recognition
(Abril et al. 2009) and communicates the desired image
(Bottomley and Doyle 2006). Colour psychology is the study

Anusandhan - The Research Repository, Volume 3, Number 1 37
of hues as a determinant of human behavior. Colour psychology
is widely used in marketing and branding. Many marketers see
colours as an important part of marketing because colour can
be used to influence consumers’ emotions and perceptions of
goods and services. Companies also use colour when deciding
on brand logos.
Brand perception refers to the process by which a customer
selects, organizes, and interprets information/stimuli inputs to
create a meaningful picture of the brand or the product. It is
three stage processes that translate raw stimuli into meaningful
information. Each individual interprets the meaning of stimulus
ina manner consistent with his/her own unique biases, needs
and expectations. Three stages of perception are exposure,
attention and interpretation. The brand personality refers to
the set of human characteristics associated with a brand. It
provides an emotional identity for a brand and encourages
consumers to respond with feelings and emotions towards a
brand. A brand personality is something to which the consumer
can relate, and an effective brand will increase its brand equity
by having a consistent set of traits. This is the added-value that
a brand gains, aside from its functional benefits. Basically brand
personality reflects how people feel about a brand, rather than
what they think the brand is or does.
Aaker (1997) suggested that the brand personality dimensions
might operate in different ways or influence consumer
preference for different reasons where sincerity, excitement,
competence represents an innate part of human personality and
sophistication, ruggedness tap dimensions that individuals
desire but do not necessarily have.
LITERATURE RIEVIEW
The literature review was conducted covering in details the
concept of brand personality, colour and views of researchers
about colour on consumer brand perception.
Concept of Brand Personality
The brand personality has been expressed by researchers in
different ways. The symbolic nature of brands examined
through early research eventually gave rise to the concept of
brand personality (Aaker 1997, Aaker et al. 2001, and Plummer
1984). In developing this construct, researchers have
established reliable scales(Aaker 1997). It was revealed by
researchers (Belk 1988, Kleine et al. 1993 and Malhotra 1981)
how brand personality encourages self-expression and
association and it was tested for the benefits and consequences
of brand personality (Batraet al. 1993, Freling and Forbes 2005
and Freling et al. 2010).
Brand personality can influence consumer preferences and
usage (Biel 1993), transform user experiences (Aaker and
Stayman 1992), and serve as a building block for relationship
building, trust, and loyalty (Fourier 1998). The brand
personality metaphor compares the unique traits of brands with
people (Stern 2006). The brand dimensions of Aaker (1997) is
a framework to describe the profile and traits of a brand in five
core dimensions, each divided into set of facets. It is easy to
understand the model to describe the profile of a brand using
an analogy with a human being. The five core dimensions and
their facets are:
(a) Sincerity (down-to-earth, honest, wholesome, cheerful)
(b) Excitement (daring, spirited, imaginative, up-to-date)
(c) Competence (reliable, intelligent, successful)
(d) Sophistication (upper class, charming)
(e) Ruggedness (outdoorsy, tough)
Each facet in turn is measured by a set of traits. Examples of
traits for the different types of brand personalitiesare:
(a) Sincerity: Genuine, kind, family oriented, thoughtful.
(b) Excitement: Carefree, spirited, and youthful.
(c) Competence: Successful, accomplished, influential, a
leader.
(d) Sophistication: Elegant, prestigious, and pretentious.
(e) Ruggedness: Rough, tough,outdoors,athletic.
Marketing scholars have largely embraced this scale and
validated it across a variety of contexts and cultures (Aaker et
al. 2001). The scale is not immune to criticism, especially
regarding its conceptual validity (Azoulay and Kapferer 2003).
Recent empirical work shows that the brand personality alters
consumer attitudes and increase purchase intention (Batra et
al. 2004; Freling et al. 2010).
Concept of Colour
Colour is an integral element of corporate and marketing
communications. It includes moods and emotions, and
influences consumer’s perceptions and behavior and helps
companies position or differentiate from the competition
(Hynes 2009). Colour carries intrinsic meaning that becomes
central to the brand’s identity and contributes to brand
recognition (Abril et al. 2009). According to Bottomley and
Doyle (2006), colour communicates the desired image. Brand
loyalists thus become attached to a brand’s visual identity and
may complain in response to changes in brand’s colour scheme
(Kahney 2003). Existing discussion on the use of colour
generally are based on anecdotal evidence and offer scant
insight into the process by which colours affect perception
(Gorn et al. 1997). It has been observed that in general, for
making colour choices, brand managers often rely on trial and
error or the recommendationof consultants. In interview with
12 creative directors, Gorn et al. (1997) informed that 11
confessed they were not familiar with colour theory and simply
trusted their preferences or gut feelings to make colour
decisions. Colour has been established as an important variable
in the marketing literature and has been observed to affect
consumer perceptions of advertising (Gorn et al. 1997).
However, academic research has not yet investigated the ways
Anusandhan - The Research Repository, Volume 3, Number 138
in which colour can shape consumer brand perceptions such
as brand personality.
Aesthetic Stimuli
Aesthetic stimuli have the potential to stimulate and shape
people’s perception through both embodied and referential
meaning. According to aesthetic philosophy, embodied
meaning is intrinsic to the stimulus, while referential meaning
depends on the network of association activated from exposure
to the stimulus. Research in marketing has supported this
framework in terms of understanding how another stimulus,
music, can communicate meaningful messages and association
(Zhu and Meyers Levy 2005). Support for a two dimensional
framework in terms of colour has been established (Crowley
1993), where one dimension is purported to stimulate arousal,
producing physiological responses such as increased brain
activity and heart rate, while the other stimulates evaluative
responses, which induce attitude change. This study is
concerned with how colour alters consumer perceptions and
attitudes and accordingly it has been focused on the referential
meaning of colour.
Effect of Colour and its Association
The effect of colour remains relatively consistent across several
studies conducted by researchers. The work of Eliot and Niesta
(2008) supports the notion that the formation and activation of
colour associations can be understood through models of
semantic memory such as associative network theory. Levy
(1984) stated that the effect of colour provides some empirical
evidence of a systematic relationship between colour and
emotions while functioning. For example, people tend to choose
consistent colour-emotion pairings e.g. yellow and cheerful
(Collier 1996), and such associations appeared to be consistent
(D’Andrade and Egan 1974). According to memory models,
people store semantic information in a complex network
comprised of conceptual nodes and links; the nodes represent
concepts, which take on activation values based on a weighted
sum of their inputs from the environment and linked nodes
(McClelland 1988). The links represent the pathways between
the nodes and are the medium by which the units interact. Links
are weighted and may be both positive and negative, so that a
node can either excite or inhibit related nodes based on the
strength and valence of their links and the resulting outcome is
determined by the pattern of activation.
Associations are triggered in memory through colour’s
referential meaning. The colour that is hue, saturation, and value
of a brand logo usually activates related colour association
(e.g. reliable, intelligent) which contributes to the perception
of a brand’s personality (e.g. competent). Other non-colour
aesthetic stimuli, such as logo shape, can activate other brand
associations which together with colour inform consumers
about brand’s personality. Therefore, when a consumer receives
a branding message through a brand logo which has no relevant
brand associations existing in memory then the resulting brand
personality perception is triggered by the referential meaning
of the colour.
As brands pair with colours, brand association and colours
become linked in memory, thus semantic meanings of colour
are created through a dynamic and reflexive process.
Importantly, the activation of colour associations as well as
their influence on affect, cognition, and behavior, may occur
without a person’s conscious awareness or intention (Elliot et
al. 2007). In order to demonstrate how colour influences
consumer brand perceptions through referential meaning, the
findings from previous work on colour associations have been
mapped to items in brand personality scale (Aaker 1997) and
hypotheses have been developed for the five dimensions
mentioned and explained earlier under concept of brand
personality.
The theoretical argument for subsequent studies is that when a
consumer sees a logo or package, the referential meaning of
the colour activates relevant associations, which influence the
perception of the brand, specifically the brand person.
OBJECTIVES OF THE STUDY
(a) To develop a framework based on aesthetic s and colour
psychology to map hues onto brand personality
dimensions.
(b) To find out the different aspects of colour psychology
and the impact of colour on consumer brand perception.
RESEARCH METHODOLOGY
Methodology Used for Data Collection
Primary data was collected by questionnaire survey along with
the display of logos of single colour. Sample size was 100 and
sampling technique used was non-probability convenience
sampling because of their convenient accessibility and
proximity.
Methodology Used for Data Analysis
The technique used for data analysis is Regression. The
regression technique was applied to demonstrate a relationship
between colour (independent variable) and brand personality
dimensions (dependent variables).
HYPOTHESES FORMULATION
First Hypothesis
Fraser and Banks (2004) argued that white, being the total
reflection of all colours, can be linked to sincerity as it is
associated with purity, cleanness, simplicity, hygiene, clarity
and peace while Clarke and Costall (2007) went on to add that
white is also associated with happiness. We, therefore,
hypothesize:
H1: There is impact of white hue on the perceived sincerity of
a brand.
Anusandhan - The Research Repository, Volume 3, Number 1 39
Second Hypothesis
Researchers have expressed that longer wavelength hue such
as red induces states of arousal and excitement (Walters et al.
1982). The colour red can be linked to excitement as it is
considered as an arousing, exciting and stimulating colour
(Bellizzi et al. 1983, Clarke and Costall 2007, Crowley 1993,
Gorn et al. 1997, and Walters et al. 1982). Moreover, according
to Fraser and Banks (2004), the colour red is generally
associated with the characteristics of activity, strength and
stimulation and is considered up-to-date (Bellizzi et al. 1983).
It has, therefore, been hypothesized:
H2: The presence of red hue has impact on the perceived
excitement of a brand.
Third Hypothesis
Black stands for sophistication and glamour (Fraser and Banks
2004, Mahnke 1996). It is a very powerful colour that signals
power, stateliness and dignity (Wexner 1954). In the fashion
world, black expresses status, elegance, richness and dignity
(e.g. black limousines, black tie events, tuxedos, suits). It has,
therefore, been hypothesized:
H3: The presence of black hue has impact on the perceived
sophistication of a brand.
Fourth Hypothesis
Clarke and Costal (2007) linked brown to ruggedness through
associations of seriousness, nature and earthiness. Fraser et al.
(2004) and Mahnke (1996) linked brown to reliability and
support while Wexner (1994) linked brown to protection. The
above statements provided the logic to hypothesize:
H4: The presence of brown hue has impact on the perceived
ruggedness of a brand.
DISCUSSION AND RESULTS
For testing all four hypotheses, the data were collected based
on the questionnaires. The reliability of questionnaires was
found out and the value of Cronbach alpha in all the four cases
was found to be more than 0.70 which indicated that the
questionnaires used for the survey were reliable.
For testing the hypotheses, the data collected through
questionnaire survey were processed using SPSS and the
outputs obtained are presented in Table 1, 2, 3 and 4.
Table 1: Coefficients - Perceived Sincerity of a Brand
Unstandardized
coefficients
Standardized
coefficients
B Std.
Error
Beta
Calculated t Significance Critical value
of t
(Constant)
White
19.625
.798
2.366
.200
.396
8.296
3.994
.000
.000
1.645
Table 2: Coefficients – Perceived Excitement of a Brand
Unstandardized
coefficients
Standardized
coefficients
B Std.
Error
Beta
Calculated t Significance Critical
value of t
(Constant)
Red
17.977
1.301
1.219
.141
.706
14.753
9.254
.000
.000
1.645
Table 3: Coefficients –Perceived Sophistication of a Brand
Unstandardized
coefficients Standardized
coefficients
B Std.
Error
Beta
Calculated t
Significance
Critical value
of t
(Constant) Black
16.861 1.373
1.145 .127
.760
14.727 10.838
.000
.000
1.645
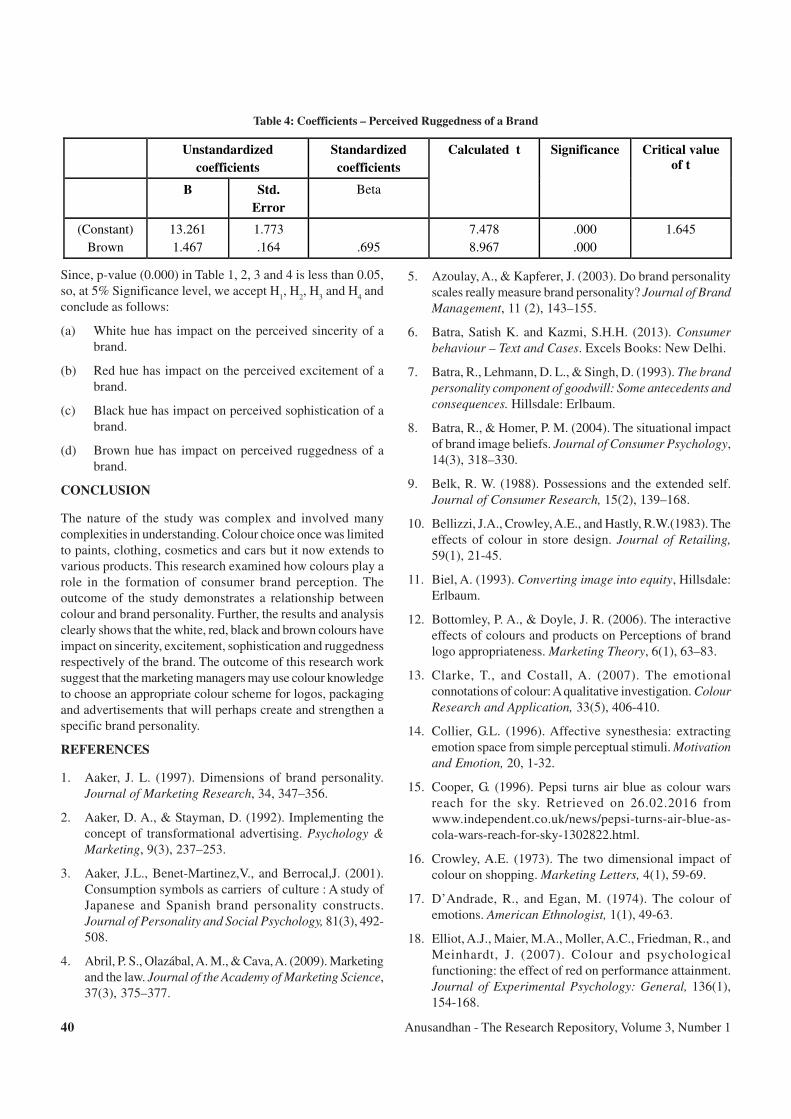
Anusandhan - The Research Repository, Volume 3, Number 140
Table 4: Coefficients – Perceived Ruggedness of a Brand
Unstandardized
coefficients
Standardized
coefficients
B Std.
Error
Beta
Calculated t Significance Critical value
of t
(Constant)
Brown
13.261
1.467
1.773
.164
.695
7.478
8.967
.000
.000
1.645
Since, p-value (0.000) in Table 1, 2, 3 and 4 is less than 0.05,
so, at 5% Significance level, we accept H1, H
2, H
3 and H
4 and
conclude as follows:
(a) White hue has impact on the perceived sincerity of a
brand.
(b) Red hue has impact on the perceived excitement of a
brand.
(c) Black hue has impact on perceived sophistication of a
brand.
(d) Brown hue has impact on perceived ruggedness of a
brand.
CONCLUSION
The nature of the study was complex and involved many
complexities in understanding. Colour choice once was limited
to paints, clothing, cosmetics and cars but it now extends to
various products. This research examined how colours play a
role in the formation of consumer brand perception. The
outcome of the study demonstrates a relationship between
colour and brand personality. Further, the results and analysis
clearly shows that the white, red, black and brown colours have
impact on sincerity, excitement, sophistication and ruggedness
respectively of the brand. The outcome of this research work
suggest that the marketing managers may use colour knowledge
to choose an appropriate colour scheme for logos, packaging
and advertisements that will perhaps create and strengthen a
specific brand personality.
REFERENCES
1. Aaker, J. L. (1997). Dimensions of brand personality.
Journal of Marketing Research, 34, 347–356.
2. Aaker, D. A., & Stayman, D. (1992). Implementing the
concept of transformational advertising. Psychology &
Marketing, 9(3), 237–253.
3. Aaker, J.L., Benet-Martinez,V., and Berrocal,J. (2001).
Consumption symbols as carriers of culture : A study of
Japanese and Spanish brand personality constructs.
Journal of Personality and Social Psychology, 81(3), 492-
508.
4. Abril, P. S., Olazábal, A. M., & Cava, A. (2009). Marketing
and the law. Journal of the Academy of Marketing Science,
37(3), 375–377.
5. Azoulay, A., & Kapferer, J. (2003). Do brand personality
scales really measure brand personality? Journal of Brand
Management, 11 (2), 143–155.
6. Batra, Satish K. and Kazmi, S.H.H. (2013). Consumer
behaviour – Text and Cases. Excels Books: New Delhi.
7. Batra, R., Lehmann, D. L., & Singh, D. (1993). The brand
personality component of goodwill: Some antecedents and
consequences. Hillsdale: Erlbaum.
8. Batra, R., & Homer, P. M. (2004). The situational impact
of brand image beliefs. Journal of Consumer Psychology,
14(3), 318–330.
9. Belk, R. W. (1988). Possessions and the extended self.
Journal of Consumer Research, 15(2), 139–168.
10. Bellizzi, J.A., Crowley, A.E., and Hastly, R.W.(1983). The
effects of colour in store design. Journal of Retailing,
59(1), 21-45.
11. Biel, A. (1993). Converting image into equity, Hillsdale:
Erlbaum.
12. Bottomley, P. A., & Doyle, J. R. (2006). The interactive
effects of colours and products on Perceptions of brand
logo appropriateness. Marketing Theory, 6(1), 63–83.
13. Clarke, T., and Costall, A. (2007). The emotional
connotations of colour: A qualitative investigation. Colour
Research and Application, 33(5), 406-410.
14. Collier, G.L. (1996). Affective synesthesia: extracting
emotion space from simple perceptual stimuli. Motivation
and Emotion, 20, 1-32.
15. Cooper, G. (1996). Pepsi turns air blue as colour wars
reach for the sky. Retrieved on 26.02.2016 from
www.independent.co.uk/news/pepsi-turns-air-blue-as-
cola-wars-reach-for-sky-1302822.html.
16. Crowley, A.E. (1973). The two dimensional impact of
colour on shopping. Marketing Letters, 4(1), 59-69.
17. D’Andrade, R., and Egan, M. (1974). The colour of
emotions. American Ethnologist, 1(1), 49-63.
18. Elliot, A.J., Maier, M.A., Moller, A.C., Friedman, R., and
Meinhardt, J. (2007). Colour and psychological
functioning: the effect of red on performance attainment.
Journal of Experimental Psychology: General, 136(1),
154-168.

Anusandhan - The Research Repository, Volume 3, Number 1 41
19. Elliot, A.J., and Niesta, D. (2008). Romantic red: red
enhances men’s attraction to women. Journal of
Personality and Social Psychology, 95(5), 1150-1164.
20. Fournier, S. (1998). Consumers and their brands:
developing relationship theory in consumer research.
Journal of Consumer Research, 24(4), 343–353.
21. Fraser, T. and Banks, A. (2004). Designer’s Colour
Manual: The Complete Guide to Colour Theory and
Applications. San Francisco: Chronicle Books.
22. Freling, T. H., & Forbes, L. P. (2005). An empirical analysis
of the brand personality effect. Journal of Product and
Brand Management, 14 (7), 404–413.
23. Freling, T. H., Crosno, J. L., & Henard, D. H. (2010).
Brand personality appeal: conceptualization and empirical
validation. Journal of the Academy of Marketing Science
(Published Online January 1, 2010).
24. Gorn, G. J., Chattopadhyay, A., Yi, T., & Dahl, D. W.
(1997). Effects of colour as an executional cue in
advertising: they’re in the shade. Management Science,
43(10), 1387–1400.
25. Harsh, V.Verma (2008). Brand management – Text and
Cases, Excels Book:New Delhi.
26. Hynes, N. (2009). Colour and meaning in corporate logos:
An empirical study. Brand Management, 16(8), 545-555.
27. Kahney, L. Apple doin’ the logo-motion. Retrieved on
03.03.2016 from www.wired.com/gadgets/mac/news/
2003/09/60597
28. Keller, Kevin Lane (1991). Memory and evaluation effects
in competitive advertising environments. Journal of
Consumer Research,17, 34-43.
29. Kleine, R.E.III, Klein, S.S., and Kerman, J.B. (1993).
Mundane consumption and the self: A social identity
perspective. Journal of Consumer Psychology, 2(3), 209-
235.
30. Lauren, I. Labrecque and George, R. Milne (2012).
Exciting red and competent blue: the importance of colour
in marketing. Journal of Academy of Marketing Science,
40, 711-727.
31. Levy, B.I. (1984). Research into the psychological
meaning of colour. American Journal of Art Therapy, 23,
58-62.
32. Mahnke, F.H. (1996). Colour Environment and Human
Response. New York: Reinhold.
33. Malhotra, N.K. (1981). A scale to measure self-concepts,
person concepts. Journal of Marketing Research, 18(4),
456-464.
34. Munsell Colour. Retrieved from http://munsell.com/about-
munsell-color/ on 18.05.2016
35. McClelland, J.L. (1988). Connectionist models and
psychological evidence. Journal of Memory and
Language, 27, 107-123.
36. Plummer, J. T. (1984). How personality makes a
difference. Journal of Advertising Research, 24(6), 27–
31.
37. Stern, B. B. (2006). What does brand mean? Historical-
analysis method and construct definition. Journal of the
Academy of Marketing Science, 34(2), 216–223.
38. Walters, J., Apter, M.J., and Svebak, S. (1982). Colour
preference, arousal, and theory of psychological reversals.
Motivation and Emotion, 6(3), 193-215.
39. Wexner, L.B. (1954). The degree to which colours(hues)
are associated with mood-tones. Journal of Applied
Psychology, 38(6), 432-435.
40. Zhu, R., and Meyers-Levy, J. (2005). Distinguishing
between the meanings of music: when background music
affects product perceptions. Journal of Marketing
Research, 42(3), 333-345.
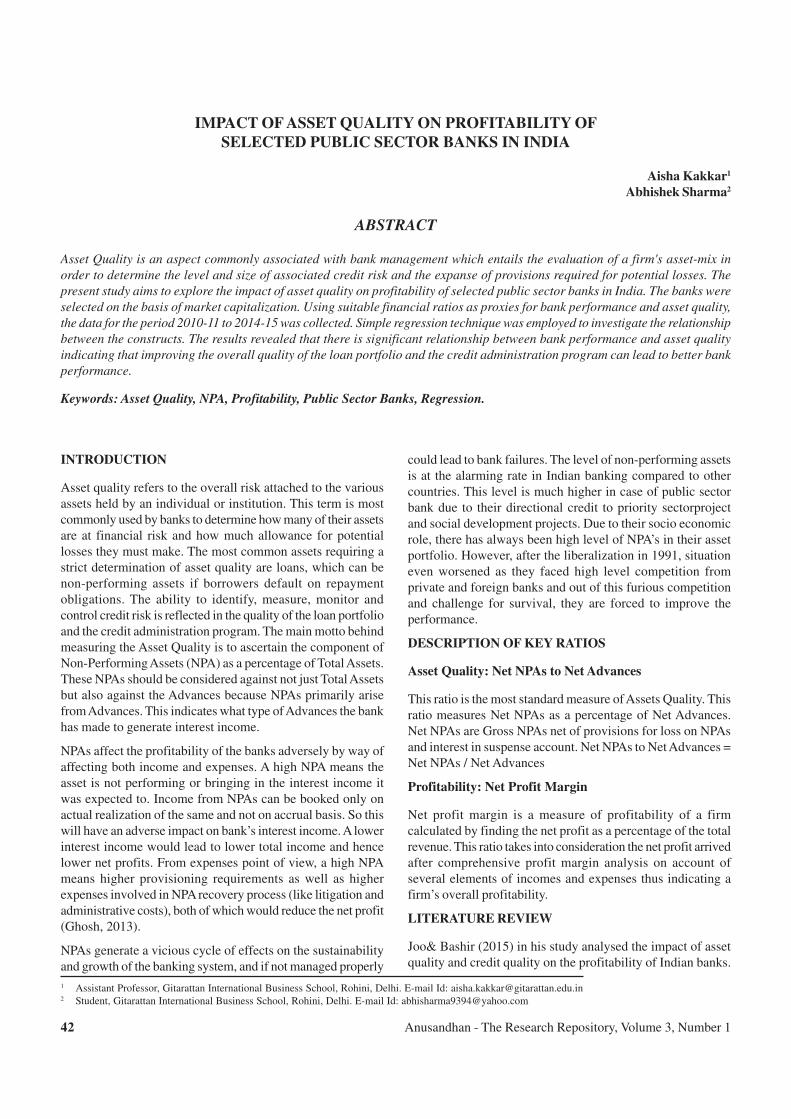
Anusandhan - The Research Repository, Volume 3, Number 142
IMPACT OF ASSET QUALITY ON PROFITABILITY OF
SELECTED PUBLIC SECTOR BANKS IN INDIA
Aisha Kakkar1
Abhishek Sharma2
ABSTRACT
Asset Quality is an aspect commonly associated with bank management which entails the evaluation of a firm's asset-mix in
order to determine the level and size of associated credit risk and the expanse of provisions required for potential losses. The
present study aims to explore the impact of asset quality on profitability of selected public sector banks in India. The banks were
selected on the basis of market capitalization. Using suitable financial ratios as proxies for bank performance and asset quality,
the data for the period 2010-11 to 2014-15 was collected. Simple regression technique was employed to investigate the relationship
between the constructs. The results revealed that there is significant relationship between bank performance and asset quality
indicating that improving the overall quality of the loan portfolio and the credit administration program can lead to better bank
performance.
Keywords: Asset Quality, NPA, Profitability, Public Sector Banks, Regression.
1 Assistant Professor, Gitarattan International Business School, Rohini, Delhi. E-mail Id: [email protected] Student, Gitarattan International Business School, Rohini, Delhi. E-mail Id: [email protected]
INTRODUCTION
Asset quality refers to the overall risk attached to the various
assets held by an individual or institution. This term is most
commonly used by banks to determine how many of their assets
are at financial risk and how much allowance for potential
losses they must make. The most common assets requiring a
strict determination of asset quality are loans, which can be
non-performing assets if borrowers default on repayment
obligations. The ability to identify, measure, monitor and
control credit risk is reflected in the quality of the loan portfolio
and the credit administration program. The main motto behind
measuring the Asset Quality is to ascertain the component of
Non-Performing Assets (NPA) as a percentage of Total Assets.
These NPAs should be considered against not just Total Assets
but also against the Advances because NPAs primarily arise
from Advances. This indicates what type of Advances the bank
has made to generate interest income.
NPAs affect the profitability of the banks adversely by way of
affecting both income and expenses. A high NPA means the
asset is not performing or bringing in the interest income it
was expected to. Income from NPAs can be booked only on
actual realization of the same and not on accrual basis. So this
will have an adverse impact on bank’s interest income. A lower
interest income would lead to lower total income and hence
lower net profits. From expenses point of view, a high NPA
means higher provisioning requirements as well as higher
expenses involved in NPA recovery process (like litigation and
administrative costs), both of which would reduce the net profit
(Ghosh, 2013).
NPAs generate a vicious cycle of effects on the sustainability
and growth of the banking system, and if not managed properly
could lead to bank failures. The level of non-performing assets
is at the alarming rate in Indian banking compared to other
countries. This level is much higher in case of public sector
bank due to their directional credit to priority sectorproject
and social development projects. Due to their socio economic
role, there has always been high level of NPA’s in their asset
portfolio. However, after the liberalization in 1991, situation
even worsened as they faced high level competition from
private and foreign banks and out of this furious competition
and challenge for survival, they are forced to improve the
performance.
DESCRIPTION OF KEY RATIOS
Asset Quality: Net NPAs to Net Advances
This ratio is the most standard measure of Assets Quality. This
ratio measures Net NPAs as a percentage of Net Advances.
Net NPAs are Gross NPAs net of provisions for loss on NPAs
and interest in suspense account. Net NPAs to Net Advances =
Net NPAs / Net Advances
Profitability: Net Profit Margin
Net profit margin is a measure of profitability of a firm
calculated by finding the net profit as a percentage of the total
revenue. This ratio takes into consideration the net profit arrived
after comprehensive profit margin analysis on account of
several elements of incomes and expenses thus indicating a
firm’s overall profitability.
LITERATURE REVIEW
Joo& Bashir (2015) in his study analysed the impact of asset
quality and credit quality on the profitability of Indian banks.

Anusandhan - The Research Repository, Volume 3, Number 1 43
The aim of the study was to evaluate the credit quality of Indian
Banks, and to gauge impact of credit quality on the profitability
of banks. The study was conducted with the panel data of 35
observations from the public and private sector banks for period
of ten years from 2003-04 to 2012-13.The effect of identified
variables on the bank profitability was computed through
regression analysis. It was concluded that the credit quality is
an important parameter to gauge the soundness of a bank. A
non-performing asset not only declines bank profitability by
requiring high loan loss provisions charged to the profit and
loss account, but carrying cost of NPAs also swell-up due to
avoidable management attention.
Sharma (2015) conducted an exploratory study with a sample
of ten nationalised banks in order to analyse their asset quality
over a period of ten years (2004-05 to 2013-14). Techniques
like coefficient of variance (CV) and coefficient of correlation
(r) were used and the researcher found that there is a
significance relationship in assets quality of among nationalised
banks which reflect their varied efficiency in the management
of assets quality. Also it was accounted that Bank of Baroda
and Andhra Bank are top two nationalised banks in term of
assets quality. Indian banking system can now claim that their
level of NPAs have registered a declining trend over a period
of time. But effective cost management, recovery management,
technological intensity of banking, governance and risk
management, financial inclusion are the areas, which can be
used as key bearing and ability of Indian banks to remain
competitive and enhance soundness.
Pandya & Bhargav (2015) studied the impact of priority sector
advances of scheduled commercial banks operating in India
on their profitability. The study examined the causal
relationship between priority sector advances and five measures
of bank profitability viz. Return on Assets (ROA), Return on
Investments (ROI), Ratio of Operating Profit to Total Assets
(OPTA), Ratio of Interest Income to Total Assets (INTTA)
and Return on Equity (ROE) encompassing the sample of all
scheduled commercial banks including nationalized banks,
private sector banks and foreign banks operating in India. The
basic objective of the study was to further an existing literature
by providing empirical evidence regarding the priority sector
advances and impact thereof on bank profitability. Primarily
using secondary data pertaining to all scheduled commercial
banks operating in India covering the period ranging from 2005
to 2014, the study revealed that priority sector advances affect
all the parameters of profitability except ROE which implies
that banks should exercise caution while advancing loans to
priority sector else it would be adversely affecting the
profitability of the banks.
Andrew et. al. (2015) in their paper investigated the relationship
between CAMELS criteria for asset quality and the profitability
performance of fifteen (15) quoted Nigerian commercial banks
from 1980 – 2013. Return on Investment (ROI) was modeled
as the function of percentage of non-performing loans to Total
Loans (NPL/TL), percentage of Nonperforming Loans to Total
Customers’ Deposit (NPL//TCD), percentage of Loan Loss
Provision to Total Loans (LLP/TL) and percentage of Loan
Loss Provision to Total Asset (LLP/TA). Multiple regressions
with econometric view statistical package were used as data
analysis method. Findings from the regression result proved
that percentage of non-performing loans to Total Loans and
percentage of nonperforming Loans to Total Customers’
Deposit have positive relationship with Return on Investment.
While percentage of Loan Loss Provision to Total Loans and
percentage of Loan Loss Provision to Total Asset have negative
relationship with Return on Investment of the commercial
banks. The study concludes that there is significant relationship
between asset quality and the profitability of the commercial
banks. It recommends that bank lending environment should
be well examined before and after credit and the regulatory
authorities should ensure sound bank lending environment to
avoid the incidence of non-performing loans to enhance the
profitability of commercial banks in Nigeria.
Mistry et. al. (2015) examined the financial data of twenty
one Indian private sector banks for the financial period 2010-
11 to 2012-13 with a view to examine the relationships among
measures such as bank’s size, operational efficiency, asset
management, return on assets and interest income and thereby
to discuss their impact on performance of the banks. Relying
on the secondary sources of data, financial results were analysed
using techniques of ratio analysis, correlations and regression.
The study revealed that there exist an impact of operational
efficiency, asset management and bank size on financial
performance of the Indian Private Sector Banks.
ICRA (2015) analysed the performance of 26 public sector
banks (PSBs) and 15 banks in the private sector (private banks)
for the period ended September 30, 2015. These 41 banks
collectively account for around 90% of the total credit portfolio
and deposits of all scheduled commercial banks in India. The
study revealed that Gross NPAs of PSBs increased to 5.6% as
on September 2015 (vs. 5.0% as on March 2015), private banks’
Gross NPAs were 2.2% (vs. 2.0% as on March 2015). Within
PSBs, SBI Group fares much better on asset quality with Gross
NPAs of 4.3% as on September 2015 while nationalized banks
reported Gross NPAs of 6.3% as on same date. Further, it was
emphasized that higher credit costs dilute PSBs’ profitability
and Q3 FY16 could be more challenging as most PSBs lowered
base rates by around 25 bps. PSB’s PAT was very low at around
0.3% in Q2 FY16 vs. 1.6% of private banks during the same
period. As was the case with asset quality, within PSBs, SBI
group fares better (PAT/ATA of 0.72%) vs. nationalised banks
(PAT/ATA 0.18% of ATA) during Q2 FY16.
Modi (2014) conducted the research “Impact of NPA on
Profitability of Public & Private Sector Banks” with an aim of
studying the impact of non-performing assets on profitability
of these banks. For the purpose of study, it was hypothesized
that there is no significant relationship between non-performing
assets and return on equity. The study relied on secondary
sources for collecting data of 74 banks covered under the study

Anusandhan - The Research Repository, Volume 3, Number 144
and regression analysis was used for the purpose of analysis.
The finding of the study attributed a positive relation between
total advances, net profits and NPA of bank to the
mismanagement and wrong choice of clients resulting in an
adverse effect on the liquidity of bank. Also it was observed
that the extent of NPAs has comparatively higher in public
sectors banks.
Swamy (2015) in his study examined the impact of asset quality
on the profitability of both public and private sector banks of
India. For the purpose of study, secondary sources were tapped
to collect the panel data consisting of different groups of banks
in the Indian banking industry (such as State Bank Group,
nationalized banks, old private banks, new private banks and
foreign banks) across a period from March 1997 to March
2009. The study findings reveal some interesting results that
run contrary to established perceptions. Priority sector credit
has been found to be not significant in affecting NPAs. Bad
debts are dependent more on the performance of industry than
on other sectors of the economy. This study establishes that
private and foreign banks have advantages in terms of
efficiencies in better credit management in containing NPAs,
which indicates that bank privatization can lead to better
management of default risk. The State Bank group and
nationalized banks appear to lag behind their private
counterparts in NPA management. It can be summarized that
the NPA management practices of state-owned banks need
sharpening.
Chisti et. al. (2012) in his paper investigated the effects of
loan quality on performance of selected private sector banks
in India, for the period 2006-07 to 2010-11. Using suitable
financial ratios as proxies for variables under the study, multiple
regression model was employed to test the relationship. The
results indicated that that asset quality and profitability are
negatively correlated in the banking industry. It was further
supported that the higher the quality of the loan processing
activities before loan approval, the lower the non-value-added
activities that is required to process problematic loans, and
thus the higher the banking operating performance will be.
OBJECTIVES OF THE STUDY
(a) To study the relationship between Asset Quality and
Profitability in selected Public sector Banks in India.
(b) To access the impact of Asset Quality on the Profitability
of selected Public sector Banks.
SCOPE OF THE STUDY
The scope of the study is confined to 4 Public Sector banks
viz. State Bank of India, Punjab National Bank, Bank of Baroda
and IDBI Banks selected on the basis of market capitalization,
covering a period of 5 years from 2010-11 to 2014-15. Further,
to study the impact of asset quality on profitability of these
banks, Net NPAs to Net Advances and Net Profit Margin have
been respectively taken as proxy financial ratios.
HYPOTHESIS
H1: There is a significant relationship between bank asset
quality and profitability of public sector banks in India.
H2: There is a significant impact of asset quality on profitability
of public sector commercial banks in India.
RESEARCH METHODOLOGY
Methodology for Data Collection
The study relied on secondary sources for the purpose of data
collection. Financial data was extracted from bank’s balance
sheet, annual reports, and other relevant manuals and
publications using Internet.
Methodology for Data Analysis
The data collected has been analysed using correlation and
regression analysis with the help of SPSS. Correlation is the
statistical tool used to describe the degree to which one variable
is linearly related to another and regression attempts to
determine the strength of the relationship between one
dependent variable and a series of other changing variables
known as independent variables. A simple linear regression
equation is modeled as Y= a+ b(x), where ‘a’ is the intercept
and b is the slope of the line, x is the independent variable and
y is the dependent variable. In the study, Profitability is taken
as dependent variable and asset quality as independent variable.
RESULTS AND DISCUSSION
State Bank of India
Table 1 depicts that the value of Pearson correlation coefficient
(r) is -0.385, signifying a moderate degree (for a range = -0.5
to -0.3) of negative correlation between the asset quality and
profitability. Also it shows that P value is .523 is greater than
0.05, there is no statistically significant relationship bank asset
quality and profitability of public sector banks in India.
Bank of Baroda
The results of Table 2 shows that Pearson Correlation
coefficient in case of Bank of Baroda is -0.990, which is
significant at the 0.01 level conferring that there is statistically
significant relationship between profitability and asset quality.
The direction of relationship is negative which means that both
the variables tend to move in the opposite direction. Also the
strength of the relationship is very high as coefficient is closer
to 1.0.
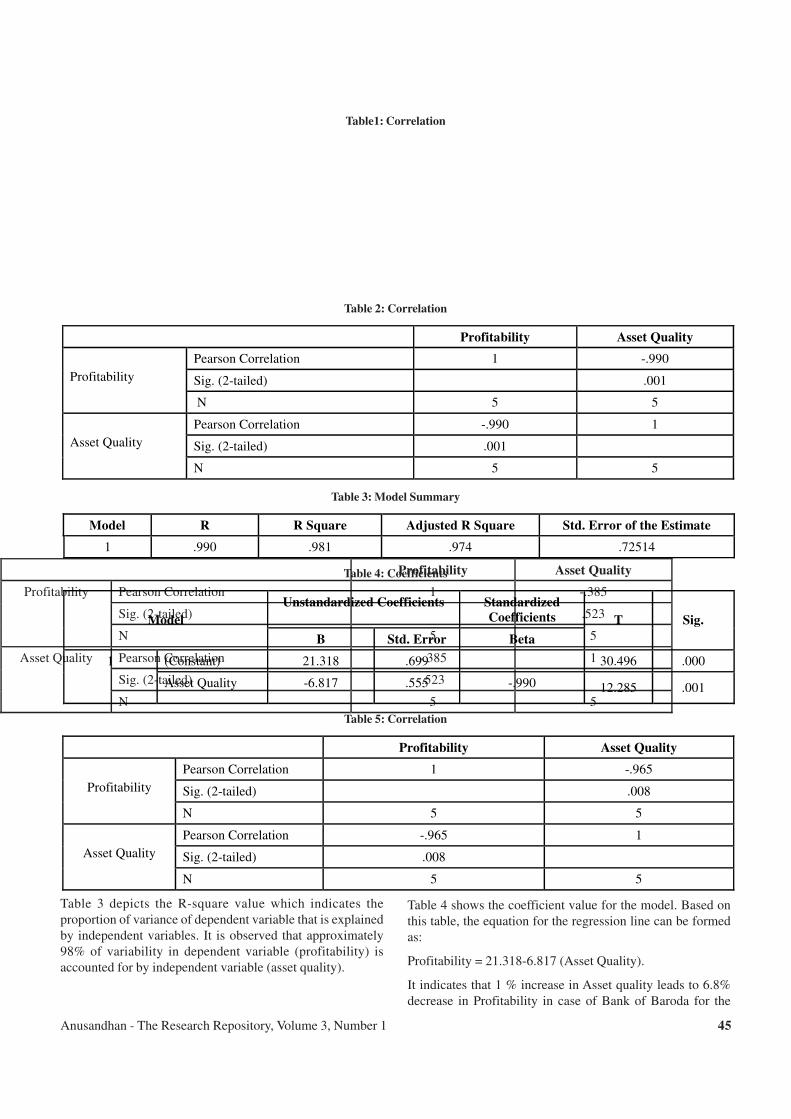
Anusandhan - The Research Repository, Volume 3, Number 1 45
Table1: Correlation
Profitability Asset Quality
Pearson Correlation 1 -.385
Sig. (2-tailed) .523
Profitability
N 5 5
Pearson Correlation -.385 1
Sig. (2-tailed) .523
Asset Quality
N 5 5
Table 2: Correlation
Profitability Asset Quality
Pearson Correlation 1 -.990
Sig. (2-tailed) .001
Profitability
N 5 5
Pearson Correlation -.990 1
Sig. (2-tailed) .001
Asset Quality
N 5 5
Table 3: Model Summary
Model R R Square Adjusted R Square Std. Error of the Estimate
1 .990 .981 .974 .72514
Table 4: Coefficients
Unstandardized Coefficients Standardized
Coefficients
Model
B Std. Error Beta
T
Sig.
(Constant) 21.318 .699 30.496 .000 1
Asset Quality -6.817 .555 -.990 12.285 .001
Table 5: Correlation
Profitability Asset Quality
Pearson Correlation 1 -.965
Sig. (2-tailed) .008
Profitability
N 5 5
Pearson Correlation -.965 1
Sig. (2-tailed) .008
Asset Quality
N 5 5
Table 3 depicts the R-square value which indicates the
proportion of variance of dependent variable that is explained
by independent variables. It is observed that approximately
98% of variability in dependent variable (profitability) is
accounted for by independent variable (asset quality).
Table 4 shows the coefficient value for the model. Based on
this table, the equation for the regression line can be formed
as:
Profitability = 21.318-6.817 (Asset Quality).
It indicates that 1 % increase in Asset quality leads to 6.8%
decrease in Profitability in case of Bank of Baroda for the

Anusandhan - The Research Repository, Volume 3, Number 146
concerned period. Also, here the significance value tells the
individual significance of Independent variable. It can be noted
from table 5 that the p value (=.008) for asset quality is < 0.05.
Hence asset quality has significant impact on profitability.
Punjab National Bank
Table 5 explains that Pearson’s coefficient of Correlation for
profitability and asset quality in case of Punjab National Bank
is -0.965, which shows high degree of negative correlation
between the variables and the P value is less than 0.05, so we
fail to reject the alternate hypothesis meaning there is significant
relationship between profitability and asset quality.
In the Table 6, the value of the R-square is .931 which means
that 93% of variability in profitability is accounted by asset
quality. The Table 7 shows the coefficient value for the model.
Based on this table, the equation for the regression line can be
formed as:
Profitability =18.427 –3.151 (Asset Quality).
The equation depicts that 1 % increase in Asset quality will
bring 3.151 % decrease in Profitability of Punjab National
Bank.
Also, here the significance value or p value tells the individual
significance of Independent variable. It can be noted that the p
value for asset quality is 0.008 which is less than 0.05.
Further, the null hypothesis for t statistics is that coefficient
=0, which can be rejected when p < 0.05. It is clear from the
table that p value is less than 0.05 and thus we fail to reject the
alternate hypothesis meaning that asset quality has statistically
significant impact on profitability.
Industrial Development Bank of India (IDBI)
Based on the results of Table 8, it can be observed that the
value of Pearson correlation of profitability and asset quality
for IDBI bank is -0.958 indicating a high degree of negative
correlation between the two variables which is statistically
significant at the 0.05 level as the p value is less than 0.05.
Additionally, it can be inferred that the alternate hypothesis is
not rejected meaning there is significant relationship between
the variables under study.
Table 9 indicates that the R Square value for the model is .919
which means that 91% of variation in profitability is explained
by asset quality. There are very few other variables on which
dependent variable depends.
Table 6: Model Summary
�
Model R R Square Adjusted R Square Std. Error of the Estimate
1 .965 .931 .908 1.22494
Table 7: Coefficients
Unstandardized
Coefficients
Standardized
Coefficients
Model
B Std. Error Beta
T
Sig.
(Constant) 18.427 1.276 14.439 .001 1
Asset Quality -3.151 .496 -.965 -6.358 .008
Table 8: Correlation
Profitability Asset Quality
Pearson Correlation 1 -.958
Sig. (2-tailed) .010
Profitability
N 5 5
Pearson Correlation -.958 1
Sig. (2-tailed) .010
Asset Quality
N 5 5
Table 9: Model Summary
Model R R Square Adjusted R Square Std. Error of the Estimate
1 .958 .919 .892 .87696
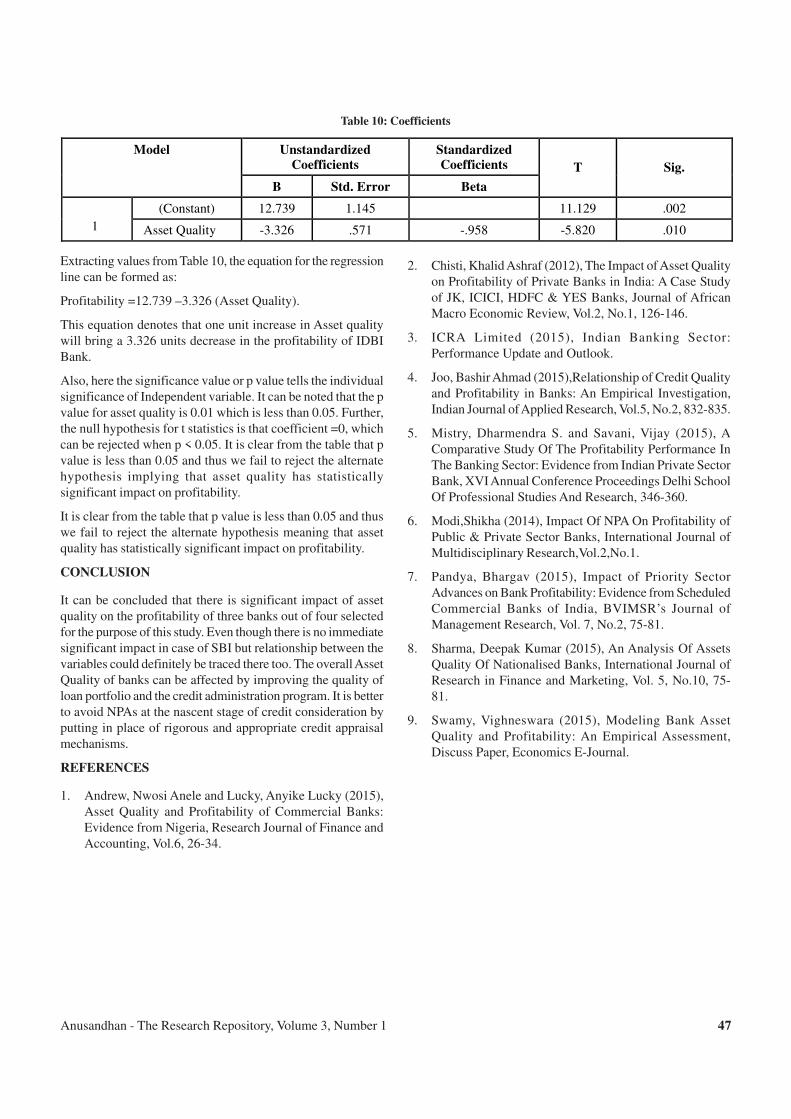
Anusandhan - The Research Repository, Volume 3, Number 1 47
Table 10: Coefficients
Unstandardized
Coefficients
Standardized
Coefficients
Model
B Std. Error Beta
T
Sig.
(Constant) 12.739 1.145 11.129 .002
1 Asset Quality -3.326 .571 -.958 -5.820 .010
Extracting values from Table 10, the equation for the regression
line can be formed as:
Profitability =12.739 –3.326 (Asset Quality).
This equation denotes that one unit increase in Asset quality
will bring a 3.326 units decrease in the profitability of IDBI
Bank.
Also, here the significance value or p value tells the individual
significance of Independent variable. It can be noted that the p
value for asset quality is 0.01 which is less than 0.05. Further,
the null hypothesis for t statistics is that coefficient =0, which
can be rejected when p < 0.05. It is clear from the table that p
value is less than 0.05 and thus we fail to reject the alternate
hypothesis implying that asset quality has statistically
significant impact on profitability.
It is clear from the table that p value is less than 0.05 and thus
we fail to reject the alternate hypothesis meaning that asset
quality has statistically significant impact on profitability.
CONCLUSION
It can be concluded that there is significant impact of asset
quality on the profitability of three banks out of four selected
for the purpose of this study. Even though there is no immediate
significant impact in case of SBI but relationship between the
variables could definitely be traced there too. The overall Asset
Quality of banks can be affected by improving the quality of
loan portfolio and the credit administration program. It is better
to avoid NPAs at the nascent stage of credit consideration by
putting in place of rigorous and appropriate credit appraisal
mechanisms.
REFERENCES
1. Andrew, Nwosi Anele and Lucky, Anyike Lucky (2015),
Asset Quality and Profitability of Commercial Banks:
Evidence from Nigeria, Research Journal of Finance and
Accounting, Vol.6, 26-34.
2. Chisti, Khalid Ashraf (2012), The Impact of Asset Quality
on Profitability of Private Banks in India: A Case Study
of JK, ICICI, HDFC & YES Banks, Journal of African
Macro Economic Review, Vol.2, No.1, 126-146.
3. ICRA Limited (2015), Indian Banking Sector:
Performance Update and Outlook.
4. Joo, Bashir Ahmad (2015),Relationship of Credit Quality
and Profitability in Banks: An Empirical Investigation,
Indian Journal of Applied Research, Vol.5, No.2, 832-835.
5. Mistry, Dharmendra S. and Savani, Vijay (2015), A
Comparative Study Of The Profitability Performance In
The Banking Sector: Evidence from Indian Private Sector
Bank, XVI Annual Conference Proceedings Delhi School
Of Professional Studies And Research, 346-360.
6. Modi,Shikha (2014), Impact Of NPA On Profitability of
Public & Private Sector Banks, International Journal of
Multidisciplinary Research,Vol.2,No.1.
7. Pandya, Bhargav (2015), Impact of Priority Sector
Advances on Bank Profitability: Evidence from Scheduled
Commercial Banks of India, BVIMSR’s Journal of
Management Research, Vol. 7, No.2, 75-81.
8. Sharma, Deepak Kumar (2015), An Analysis Of Assets
Quality Of Nationalised Banks, International Journal of
Research in Finance and Marketing, Vol. 5, No.10, 75-
81.
9. Swamy, Vighneswara (2015), Modeling Bank Asset
Quality and Profitability: An Empirical Assessment,
Discuss Paper, Economics E-Journal.
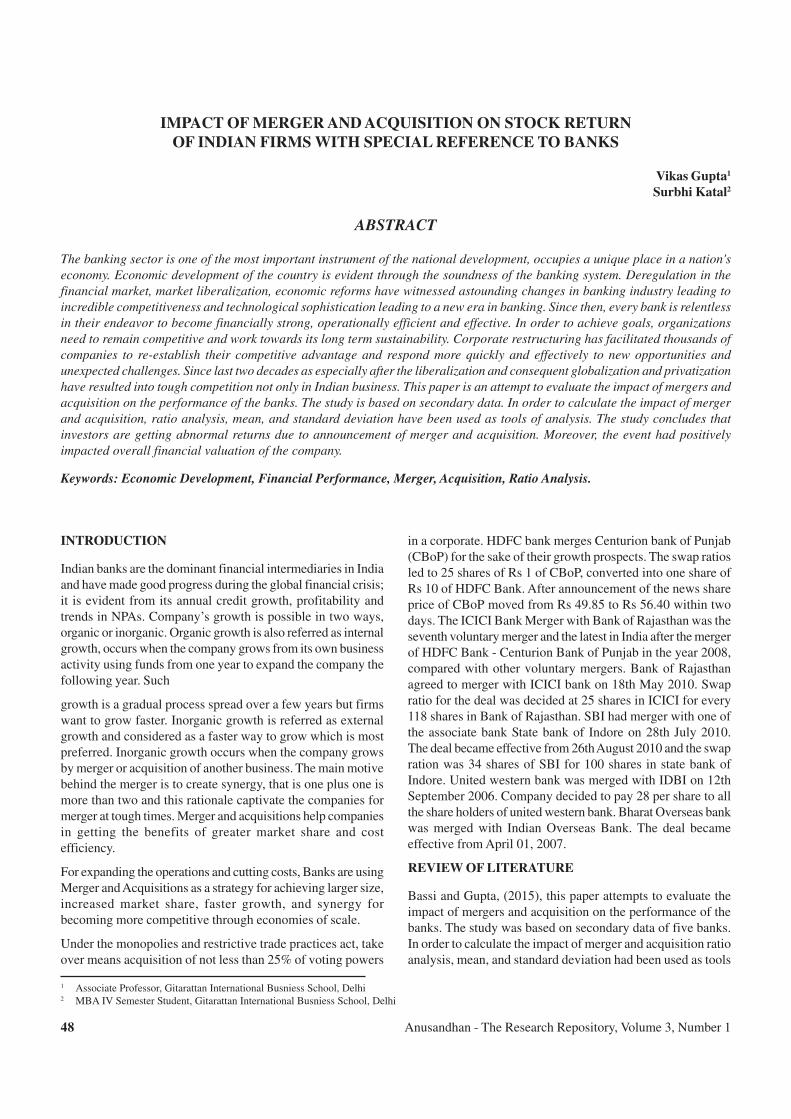
Anusandhan - The Research Repository, Volume 3, Number 148
IMPACT OF MERGER AND ACQUISITION ON STOCK RETURN
OF INDIAN FIRMS WITH SPECIAL REFERENCE TO BANKS
Vikas Gupta1
Surbhi Katal2
ABSTRACT
The banking sector is one of the most important instrument of the national development, occupies a unique place in a nation's
economy. Economic development of the country is evident through the soundness of the banking system. Deregulation in the
financial market, market liberalization, economic reforms have witnessed astounding changes in banking industry leading to
incredible competitiveness and technological sophistication leading to a new era in banking. Since then, every bank is relentless
in their endeavor to become financially strong, operationally efficient and effective. In order to achieve goals, organizations
need to remain competitive and work towards its long term sustainability. Corporate restructuring has facilitated thousands of
companies to re-establish their competitive advantage and respond more quickly and effectively to new opportunities and
unexpected challenges. Since last two decades as especially after the liberalization and consequent globalization and privatization
have resulted into tough competition not only in Indian business. This paper is an attempt to evaluate the impact of mergers and
acquisition on the performance of the banks. The study is based on secondary data. In order to calculate the impact of merger
and acquisition, ratio analysis, mean, and standard deviation have been used as tools of analysis. The study concludes that
investors are getting abnormal returns due to announcement of merger and acquisition. Moreover, the event had positively
impacted overall financial valuation of the company.
Keywords: Economic Development, Financial Performance, Merger, Acquisition, Ratio Analysis.
1 Associate Professor, Gitarattan International Busniess School, Delhi2 MBA IV Semester Student, Gitarattan International Busniess School, Delhi
INTRODUCTION
Indian banks are the dominant financial intermediaries in India
and have made good progress during the global financial crisis;
it is evident from its annual credit growth, profitability and
trends in NPAs. Company’s growth is possible in two ways,
organic or inorganic. Organic growth is also referred as internal
growth, occurs when the company grows from its own business
activity using funds from one year to expand the company the
following year. Such
growth is a gradual process spread over a few years but firms
want to grow faster. Inorganic growth is referred as external
growth and considered as a faster way to grow which is most
preferred. Inorganic growth occurs when the company grows
by merger or acquisition of another business. The main motive
behind the merger is to create synergy, that is one plus one is
more than two and this rationale captivate the companies for
merger at tough times. Merger and acquisitions help companies
in getting the benefits of greater market share and cost
efficiency.
For expanding the operations and cutting costs, Banks are using
Merger and Acquisitions as a strategy for achieving larger size,
increased market share, faster growth, and synergy for
becoming more competitive through economies of scale.
Under the monopolies and restrictive trade practices act, take
over means acquisition of not less than 25% of voting powers
in a corporate. HDFC bank merges Centurion bank of Punjab
(CBoP) for the sake of their growth prospects. The swap ratios
led to 25 shares of Rs 1 of CBoP, converted into one share of
Rs 10 of HDFC Bank. After announcement of the news share
price of CBoP moved from Rs 49.85 to Rs 56.40 within two
days. The ICICI Bank Merger with Bank of Rajasthan was the
seventh voluntary merger and the latest in India after the merger
of HDFC Bank - Centurion Bank of Punjab in the year 2008,
compared with other voluntary mergers. Bank of Rajasthan
agreed to merger with ICICI bank on 18th May 2010. Swap
ratio for the deal was decided at 25 shares in ICICI for every
118 shares in Bank of Rajasthan. SBI had merger with one of
the associate bank State bank of Indore on 28th July 2010.
The deal became effective from 26th August 2010 and the swap
ration was 34 shares of SBI for 100 shares in state bank of
Indore. United western bank was merged with IDBI on 12th
September 2006. Company decided to pay 28 per share to all
the share holders of united western bank. Bharat Overseas bank
was merged with Indian Overseas Bank. The deal became
effective from April 01, 2007.
REVIEW OF LITERATURE
Bassi and Gupta, (2015), this paper attempts to evaluate the
impact of mergers and acquisition on the performance of the
banks. The study was based on secondary data of five banks.
In order to calculate the impact of merger and acquisition ratio
analysis, mean, and standard deviation had been used as tools

Anusandhan - The Research Repository, Volume 3, Number 1 49
of analysis. The study concludes that investors were getting
abnormal returns due to announcement of merger and
acquisition. Moreover the event had positively impacted overall
financial valuation of the company.
Duggal, Neha (2015) this paper aims at analyzing the change
in the financial performance post merger activity in Indian
banking sector. For this purpose a set of 5 financial ratios have
been analyzed of the sample banks listed in Bombay Stock
Exchange for pre 3 years and post 5 years period and tested
with paired sample t-test. The present research focuses on
examining the impact of mergers on the performance of Indian
banks with the objectives to study the impact of merger
announcement on the financial performance of the banks in
the merger periods.
Verma, Neha and Sharma, Rahul (2014) this paper attempts to
study the impact of mergers and acquisitions on the
Performance of Indian Telecom industry, by examining some
pre and post-merger financial and operating variables. For the
purpose of the study, companies which had been merged or
acquired during the period 2001-02 to 2007-08 had been
selected. The objectives of the paper were to analyze the impact
of select financial and operating performance variables on
Return on Shareholder’s Fund (ROSF) in the Indian Telecom
Sector companies which were merged or acquired during the
period 2001-02 to 2007-08 and to identify M&A induced
changes in financial and operating performance of the
companies In data collection three years data from Pre-M&A
period and three years data from post-M&A period of the
companies which were involved in the M&A.
Bhardwaj, Mamta (2014) this paper attempts to find out
whether the merger and acquisition deal between the two banks
i.e. (Centurion Bank and Bank of Punjab) was successful or
not. In the research methodology the research problem given
was investigated on the basis of Secondary data collection.
Information was gathered from magazines, journals and books
from the different sources and several information was also
gathered from internet, internal files, and in house journals
and from the records .The research methodology applied in
the study is descriptive in nature. The sampling period was
considered as year from 2004-2007 (Centurion Bank of
Punjab). In the tools and technique formulae use was Capital
Adequacy Ratio, EPS, Net Worth, Gross Profit Margin, and
Current Ratio. All the ratios profitability, solvency, liquidity
and other were use for the analysis purpose.
Patel, Ritesh (2014) this paper studies the Pre-Merger and Post-
Merger Financial & Stock Return Analysis with reference to
selected Indian Banks. This paper was prepared to check
whether any improvement was in financial & stock return in
banks in post-merger period. The objective of the study was to
analyze the financial strength of the selected Indian Banks on
the basis of key financial ratios and to examine the effects of
merger on equity shareholder’s wealth. The research design in
this study was descriptive research design as this study will
assist the decision maker in determining, evaluating, and
selecting the best course of action to take in a given situation.
OBJECTIVES OF THE STUDY
(a) To analyze the impact of merger on the financial
performance of Indian Overseas Bank and Bharat
Overseas Bank.
(b) To examine the effects of merger on equity shareholders
of Indian Overseas Bank using EPS and Return on
Equity.
(c) To evaluate the performance of Indian Overseas Bank
in terms of Net Profitability.
(d) To find out the impact of merger on Indian Overseas
Bank in terms of financial coverage.
RESEARCH HYPOTHESES
H1: There is significant difference between the pre and post
merger Net Worth.
H2: There is significant difference between the pre and post
merger Net Profit Margin.
H3: There is significant difference between the pre and post
merger Debt Equity.
H4: There is significant difference between the pre and post
merger Earning Per Share.
H5: There is significant difference between the pre and post
merger Return on Equity.
RESEARCH METHODOLOGY DATA COLLECTION
Methodology used for Data Collection
The study is based on secondary data. The financial and
accounting data of banks collected from the annual report of
the Indian overseas Bank and Bharat Overseas Bank to examine
the impact of mergers and acquisitions on the performance of
the Bank. Data are also collected from the Research Paper and
Websites.
Technique
T test technique is used for data analysis. A two-sample t-test
examines whether two samples are different and is commonly
used when the variances of two normal distributions are
unknown and when an experiment uses a small sample size.
PERIOD OF THE STUDY
The present study is mainly intended to examine the financial
performance of merged company three years before merger
and eight years after merger starting from 2004 to 2015.
DATA ANALYSIS
Return on equity is the amount of net income returned as a
percentage of shareholders equity. Return on equity measures
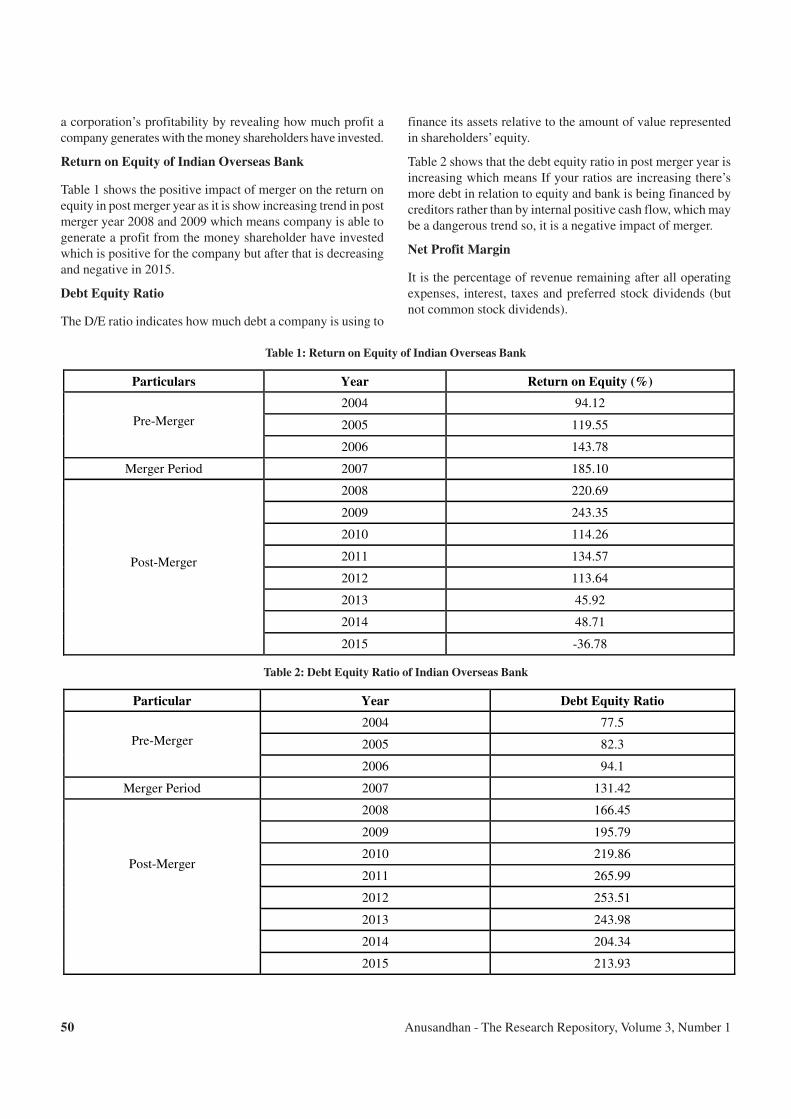
Anusandhan - The Research Repository, Volume 3, Number 150
a corporation’s profitability by revealing how much profit a
company generates with the money shareholders have invested.
Return on Equity of Indian Overseas Bank
Table 1 shows the positive impact of merger on the return on
equity in post merger year as it is show increasing trend in post
merger year 2008 and 2009 which means company is able to
generate a profit from the money shareholder have invested
which is positive for the company but after that is decreasing
and negative in 2015.
Debt Equity Ratio
The D/E ratio indicates how much debt a company is using to
finance its assets relative to the amount of value represented
in shareholders’ equity.
Table 2 shows that the debt equity ratio in post merger year is
increasing which means If your ratios are increasing there’s
more debt in relation to equity and bank is being financed by
creditors rather than by internal positive cash flow, which may
be a dangerous trend so, it is a negative impact of merger.
Net Profit Margin
It is the percentage of revenue remaining after all operating
expenses, interest, taxes and preferred stock dividends (but
not common stock dividends).
Table 1: Return on Equity of Indian Overseas Bank
Particulars Year Return on Equity (%)
2004 94.12
2005 119.55
Pre-Merger
2006 143.78
Merger Period 2007 185.10
2008 220.69
2009 243.35
2010 114.26
2011 134.57
2012 113.64
2013 45.92
2014 48.71
Post-Merger
2015 -36.78
Table 2: Debt Equity Ratio of Indian Overseas Bank
Particular Year Debt Equity Ratio
2004 77.5
2005 82.3
Pre-Merger
2006 94.1
Merger Period 2007 131.42
2008 166.45
2009 195.79
2010 219.86
2011 265.99
2012 253.51
2013 243.98
2014 204.34
Post-Merger
2015 213.93

Anusandhan - The Research Repository, Volume 3, Number 1 51
Table 3 shows that negative impact of merger on the net profit
margin in post merger year which means bank not able to
generate percentage of revenue remaining after all operating
expenses, interest, taxes and preferred stock dividends (but
not common stock dividends) have been deducted from a
company’s total revenue, which is continuously decreasing after
a merger.
Net Worth
Net worth is the amount by which assets exceed liabilities. Net
worth is a concept applicable to individuals and businesses as
a key measure of how much an entity is worth. A consistent
increase in net worth indicates good financial health;
conversely, net worth may be depleted by annual losses or a
substantial decrease in asset values relative to liabilities. In
the business context, net worth is also known as book value or
shareholders’ equity.
Table 3: Net Profit Margin of Indian Overseas Bank
Particulars Year Net Profit Margin (%)
2004 13.65
2005 16.48
Post-Merger
2006 17.77
Merger Period 2007 16.18
2008 15.08
2009 13.75
2010 6.9
2011 8.86
2012 5.87
2013 2.74
2014 2.65
Post-Merger
2015 -1.89
Table 4: Net Worth of Indian Overseas Bank
Particulars Year Net Worth Rs (000)
2004 1,930.37
2005 2,433.37
Pre-Merger
2006 3,054.97
Merger period 2007 3,872.39
2008 4,742.70
2009 5,941.39
2010 6,348.98
2011 8,164.94
2012 -102,198.17
2013 -101,336.30
2014 14,356.27
Post-Merger
2015 13,934.49
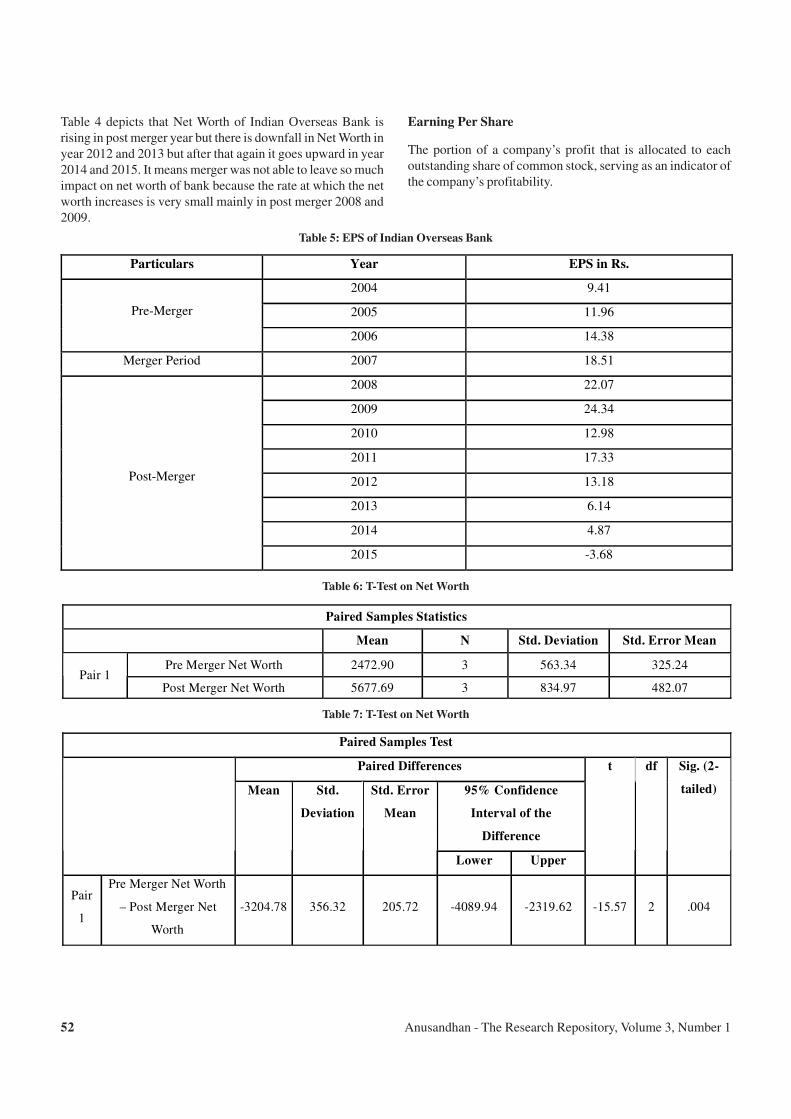
Anusandhan - The Research Repository, Volume 3, Number 152
Table 4 depicts that Net Worth of Indian Overseas Bank is
rising in post merger year but there is downfall in Net Worth in
year 2012 and 2013 but after that again it goes upward in year
2014 and 2015. It means merger was not able to leave so much
impact on net worth of bank because the rate at which the net
worth increases is very small mainly in post merger 2008 and
2009.
Earning Per Share
The portion of a company’s profit that is allocated to each
outstanding share of common stock, serving as an indicator of
the company’s profitability.
Table 5: EPS of Indian Overseas Bank
Particulars Year EPS in Rs.
2004 9.41
2005 11.96
Pre-Merger
2006 14.38
Merger Period 2007 18.51
2008 22.07
2009 24.34
2010 12.98
2011 17.33
2012 13.18
2013 6.14
2014 4.87
Post-Merger
2015 -3.68
Table 6: T-Test on Net Worth
Paired Samples Statistics
Mean N Std. Deviation Std. Error Mean
Pre Merger Net Worth 2472.90 3 563.34 325.24 Pair 1
Post Merger Net Worth 5677.69 3 834.97 482.07
Table 7: T-Test on Net Worth
Paired Samples Test
Paired Differences
95% Confidence
Interval of the
Difference
Mean Std.
Deviation
Std. Error
Mean
Lower Upper
t df Sig. (2-
tailed)
Pair
1
Pre Merger Net Worth
– Post Merger Net
Worth
-3204.78 356.32 205.72 -4089.94 -2319.62 -15.57 2 .004
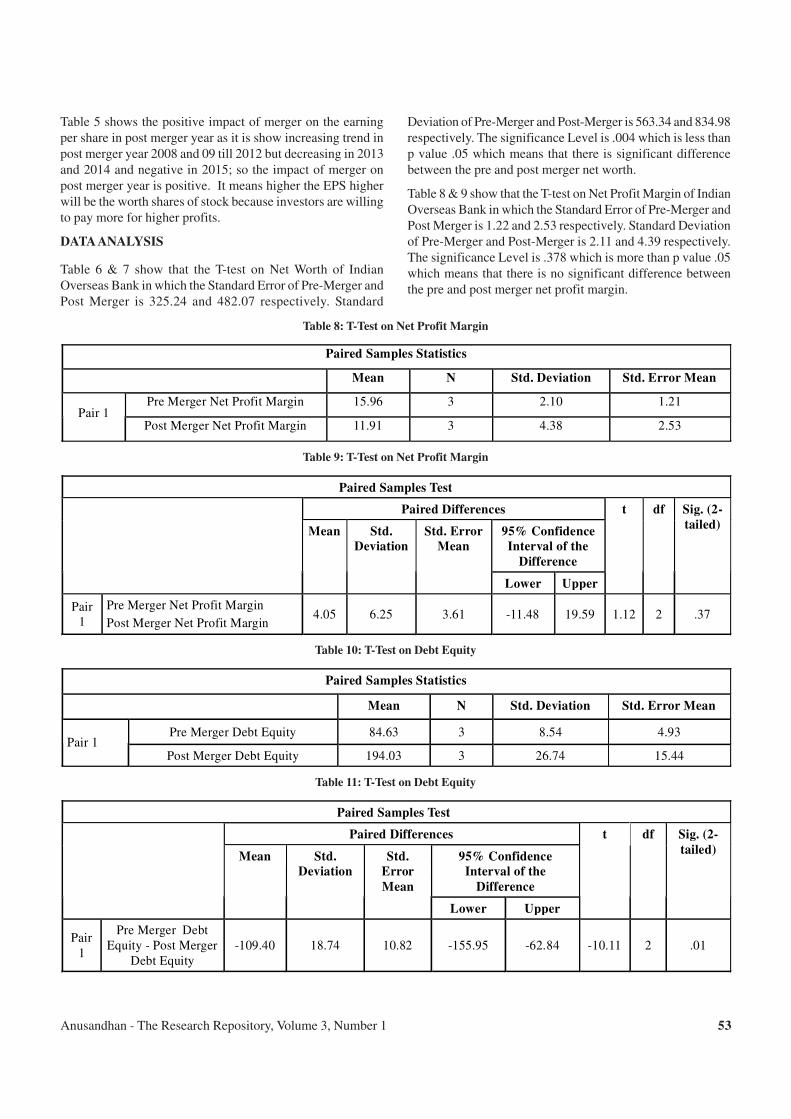
Anusandhan - The Research Repository, Volume 3, Number 1 53
Table 5 shows the positive impact of merger on the earning
per share in post merger year as it is show increasing trend in
post merger year 2008 and 09 till 2012 but decreasing in 2013
and 2014 and negative in 2015; so the impact of merger on
post merger year is positive. It means higher the EPS higher
will be the worth shares of stock because investors are willing
to pay more for higher profits.
DATA ANALYSIS
Table 6 & 7 show that the T-test on Net Worth of Indian
Overseas Bank in which the Standard Error of Pre-Merger and
Post Merger is 325.24 and 482.07 respectively. Standard
Deviation of Pre-Merger and Post-Merger is 563.34 and 834.98
respectively. The significance Level is .004 which is less than
p value .05 which means that there is significant difference
between the pre and post merger net worth.
Table 8 & 9 show that the T-test on Net Profit Margin of Indian
Overseas Bank in which the Standard Error of Pre-Merger and
Post Merger is 1.22 and 2.53 respectively. Standard Deviation
of Pre-Merger and Post-Merger is 2.11 and 4.39 respectively.
The significance Level is .378 which is more than p value .05
which means that there is no significant difference between
the pre and post merger net profit margin.
Table 8: T-Test on Net Profit Margin
Paired Samples Statistics
Mean N Std. Deviation Std. Error Mean
Pre Merger Net Profit Margin 15.96 3 2.10 1.21 Pair 1
Post Merger Net Profit Margin 11.91 3 4.38 2.53
Table 9: T-Test on Net Profit Margin
Paired Samples Test
Paired Differences
95% Confidence
Interval of the
Difference
Mean Std.
Deviation
Std. Error
Mean
Lower Upper
t df Sig. (2-
tailed)
Pair 1
Pre Merger Net Profit Margin
Post Merger Net Profit Margin 4.05 6.25 3.61 -11.48 19.59 1.12 2 .37
Table 10: T-Test on Debt Equity
Paired Samples Statistics
Mean N Std. Deviation Std. Error Mean
Pre Merger Debt Equity 84.63 3 8.54 4.93 Pair 1
Post Merger Debt Equity 194.03 3 26.74 15.44
Table 11: T-Test on Debt Equity
Paired Samples Test
Paired Differences
95% Confidence
Interval of the
Difference
Mean Std.
Deviation
Std.
Error
Mean
Lower Upper
t df Sig. (2-
tailed)
Pair 1
Pre Merger Debt Equity - Post Merger
Debt Equity -109.40 18.74 10.82 -155.95 -62.84 -10.11 2 .01
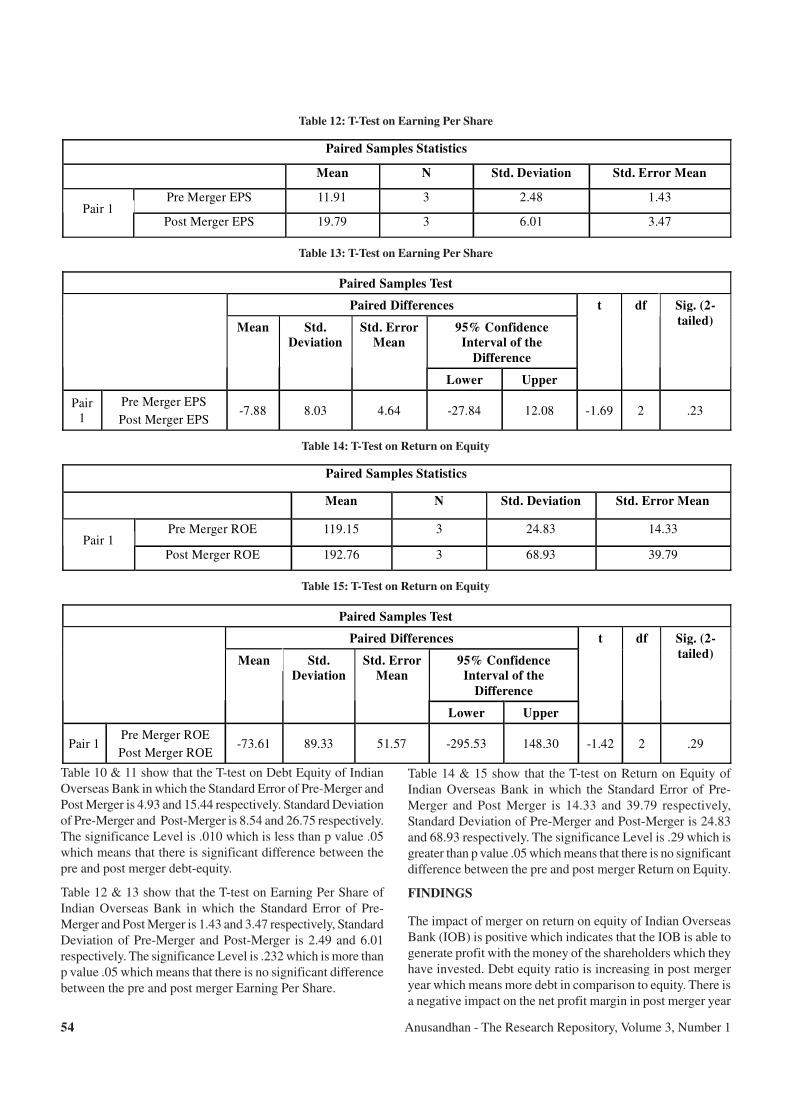
Anusandhan - The Research Repository, Volume 3, Number 154
Table 12: T-Test on Earning Per Share
Paired Samples Statistics
Mean N Std. Deviation Std. Error Mean
Pre Merger EPS 11.91 3 2.48 1.43 Pair 1
Post Merger EPS 19.79 3 6.01 3.47
Table 13: T-Test on Earning Per Share
Paired Samples Test
Paired Differences
95% Confidence
Interval of the
Difference
Mean Std.
Deviation
Std. Error
Mean
Lower Upper
t df Sig. (2-
tailed)
Pair 1
Pre Merger EPS
Post Merger EPS -7.88 8.03 4.64 -27.84 12.08 -1.69 2 .23
Table 14: T-Test on Return on Equity
Paired Samples Statistics
Mean N Std. Deviation Std. Error Mean
Pre Merger ROE 119.15 3 24.83 14.33 Pair 1
Post Merger ROE 192.76 3 68.93 39.79
Table 15: T-Test on Return on Equity
Paired Samples Test
Paired Differences
95% Confidence
Interval of the
Difference
Mean Std.
Deviation
Std. Error
Mean
Lower Upper
t df Sig. (2-
tailed)
Pair 1 Pre Merger ROE
Post Merger ROE -73.61 89.33 51.57 -295.53 148.30 -1.42 2 .29
Table 10 & 11 show that the T-test on Debt Equity of Indian
Overseas Bank in which the Standard Error of Pre-Merger and
Post Merger is 4.93 and 15.44 respectively. Standard Deviation
of Pre-Merger and Post-Merger is 8.54 and 26.75 respectively.
The significance Level is .010 which is less than p value .05
which means that there is significant difference between the
pre and post merger debt-equity.
Table 12 & 13 show that the T-test on Earning Per Share of
Indian Overseas Bank in which the Standard Error of Pre-
Merger and Post Merger is 1.43 and 3.47 respectively, Standard
Deviation of Pre-Merger and Post-Merger is 2.49 and 6.01
respectively. The significance Level is .232 which is more than
p value .05 which means that there is no significant difference
between the pre and post merger Earning Per Share.
Table 14 & 15 show that the T-test on Return on Equity of
Indian Overseas Bank in which the Standard Error of Pre-
Merger and Post Merger is 14.33 and 39.79 respectively,
Standard Deviation of Pre-Merger and Post-Merger is 24.83
and 68.93 respectively. The significance Level is .29 which is
greater than p value .05 which means that there is no significant
difference between the pre and post merger Return on Equity.
FINDINGS
The impact of merger on return on equity of Indian Overseas
Bank (IOB) is positive which indicates that the IOB is able to
generate profit with the money of the shareholders which they
have invested. Debt equity ratio is increasing in post merger
year which means more debt in comparison to equity. There is
a negative impact on the net profit margin in post merger year
Anusandhan - The Research Repository, Volume 3, Number 1 55
which indicates that bank is not able to generate sufficient
revenue for the disbursement of operating expenses, interest,
taxes and preferred stock dividends (but not common stock
dividends). It is continuously decreasing after the merger. Net
Worth of the company is increased after merger but with very
small amount so the impact of merger on net worth is not very
attractive or positive. A consistent increase in net worth
indicates good financial health. Earning per Share of the bank
is increased in post merger year which is positive for the
shareholders.
CONCLUSION
Generally, the news like Merger and acquisition is perceived
as positive. Moreover, these events also affect the fundamental
value of Acquirer Company but considering their stock market
movement. No doubt market provides an opportunity to
investor to gain some profits but not for all the stock equally.
Based on the analysis of pre and post merger financial ratios
of Indian Overseas bank, it can be concluded that the
significance value of Net profit margin ratio and Return on
equity is greater than .05 which means that there is no significant
difference between their pre and post merger values. The
significant value of Net Worth, Debt-Equity ratio is less than
.05 which means that there is significant difference between
pre and post merger values.
REFERENCES
1. Bassi, Poonam and Gupta, Varsha (2015), “A Study On
Impact of Announcement of Merger and Acquisition on
the valuation of the companies (With Special Reference
To Banks)”, Asia Pacific Journal of Research, 2320-5504",
Vol XXI.
2. Bhardwaj, Mamta (2014), “A study of Merger and
acquisition between Centurion Bank with Bank of Punjab:
Analysing Premerger and Postmerger Financial
Performance”, International Journal of Innovation and
Scientific Research, 2351-8014 Vol. 8 No.
3. Duggal, Neha (2015), “Mergers and acquisitions in India:
A case Study on Indian Banking Sector”, International
Journal of Research and Development, 2319–5479,
Volume-4.
4. Patel, Ritesh (2014), “Pre-Merger and Post-Merger
Financial & Stock Return Analysis: A Study with reference
to selected Indian Banks”, Asian Journal of Research in
Banking and Finance, Asian Journal of Research in
Banking and Finance, 2249-7323,Vol.4
5. Verma, Neha and Sharma, Rahul (2014), “Impact of
Mergers & Acquisitions on Firms Long Term Performance:
A Pre & Post Analysis of the Indian Telecom Industry”,
International Journal of Research in Management &
Technology, 2249-9563, Vol. 4, No.1.
Anusandhan - The Research Repository, Volume 3, Number 156
COMPARISON OF THE PERFORMANCE OF EQUITY MUTUAL FUNDS:
AN ANALYSIS BASED ON BENCHMARK TOOLS
Pooja Chaturvedi Sharma1
Ishant Goel2
ABSTRACT
The Indian mutual fund industry has evolved from a single player in 1964 to a fast growing, competitive market on the back of
a strong regulatory framework. This study aims to carry out the comparative analysis of top ranked equity mutual funds in India
in terms of risk and return. The horizon of this study is multifarious as it includes different mutual fund schemes and discusses
about the growth of the schemes, growth of Indian and global mutual fund industry, provides suggestions for investors as well
as for fund managers about the betterment of the industry and concludes with the idea of investing in the right schemes according
to the risk taking abilities, time horizon and investment objectives of an investor. On the basis of time, scope of the study has been
kept limited to five years from January 2011 to December 2015.
Keywords: Jenson Ratio, Mutual Funds, NAV, Sharpe Ratio, Treynor Ratio.
1 Assistant Professor, Gitarattan International Business School, Rohini, Delhi, E-Mail id: [email protected] Student, Gitarattan International Business School, Rohini, Delhi.
INTRODUCTION
One of the most promising Asian country which is indisputably
emerging as the next gigantic investment destination riding on
a high savings and investment rate, as compared to other Asian
economies is “India”. It is in the milieu of some of these
encouraging facts and figures that the Indian mutual fund
industry has fostered itself. Since 1990, when the mutual fund
industry opened up to the private sector, the industry has
traversed a long path, adapting itself continuously, to the
changes that have come across. Various fresh dimensions have
also struck the right chord in context of mutual funds in Indian
market. A major case in point here is India’s Prime Minister,
Mr. Narendra Modi’s “Make in India” policy. As a result
numbers of fund houses are coming with schemes that will
invest in Indian manufacturing sector. Apart from
manufacturing sector, several other sectors like auto, auto
ancillaries, defense, consumer goods etc. are also expected to
get a push from this policy.
Mutual funds really captured the public’s attention in the 1980s
and ’90s when mutual fund investment hit record highs and
investors saw incredible returns. However, the idea of pooling
assets for investment purposes has been around for a long time.
Section below looks at the evolution of this investment vehicle,
from its beginning in the Netherlands in the 18th century to its
present status as a growing, international industry.
Origination
Some historians cite that closed-ended investment companies
launched in the Netherlands in 1822 by King William I as the
first mutual funds, while others point to a Dutch merchant
named Adrian van Ketwich whose investment trust created in
1774 may have given the king the idea. Ketwich probably
theorized that diversification would increase the appeal of
investments to smaller investors with minimal capital. In the
same context, Saini (2011) mentioned that next wave of near-
mutual funds included an investment trust launched in
Switzerland in 1849, followed by similar vehicles created in
Scotland in the 1880s. The idea of pooling resources and
spreading risk using closed-ended investments soon took root
in Great Britain and France, making its way to the United States
in the 1890s.
Mutual Funds
“The basis of mutual fund is the pooling concept. Alternatively,
mutual funds pool money from a cross-section of investors by
issuing units, constructs a diversified portfolio of stocks, bonds
and other investment instruments, and invests the same in the
capital market” (Sadhak, 2008).
Professional fund managers, who use their investment
management skills to invest in various financial instruments,
manage this money. It is a set up in the form of a trust. A unit
holder is the investor, who owns the units based on the amount
invested by him. The increase in value of the investments along
with other incomes earned from it is then passed on to the
investors.
A mutual fund should be compulsorily registered with SEBI,
which regulates the securities market, before it can collect funds
from the public. The plethoras of schemes provide a variety of
options to suit the individual objectives, whatever their age,
financial position, risk tolerance, and return expectations are.
Mutual funds came as a respite to the investors who had neither
the expertise nor the time to conduct a careful analysis before
investing their hard-earned money. Mutual funds provide them
professional portfolio management services at a low cost. Most
Anusandhan - The Research Repository, Volume 3, Number 1 57
mutual funds are administered through a parent management
company, which may hire or fire fund managers and they are
liable to a special set of regulatory, accounting, and taxation
rules (Singh, 2012).
Mutual Funds were introduced in India by UTI in 1960. In the
late 80s, Indian Mutual Fund market witnessed entry of a
number of public sector players and in 1993 private sector
was allowed to enter into the market. After the entry of private
as well as other public sector units in this industry, legal
framework has undergone a number of changes. Because of
which, the incubator of the industry (UTI) slipped down to
fifth position after having enjoyed monopoly status for a quarter
of a century. Nevertheless, it remains a strong brand with more
than 10 million unit holders, evidencing the huge scope for
this industry (Sinha, 2015). Table1 displays a synopsis of the
evolution phases of Indian mutual fund industry.
By the close of the 90s, market share of household financial
assets in mutual funds was over 8% in the US, 8% in Germany,
and about 2% in India (Sadhak, 2008). A glimpse on the present
Indian mutual industry will throw some light on it’s pace of
growth. AUM of Indian mutual fund industry has increased
from Rs.12.65 trillion in June 2015 to Rs. 14.90 trillion in
June 2016, which shows a growth of 18% in assets. Individual
investors presently hold a lower share of industry’s assets, i.e.
45.6% in June 2016 but on the contrary, value of assets held
by individual investors in mutual funds increased from Rs. 5.72
lakh Cr in June 2015 to Rs. 6.80 lakh Cr in June 2016, an
absolute increase of 18.95%. Institutional investors have
occupied greater pie in the market share with 54.4% of the
assets. Out of 45.6% share of individual investors, 85% of
funds have gone into equity oriented schemes whereas liquid
and money markets have been dominantly ruled by institutional
investors with 92% share (Amfi, 2016).
LITERATURE REVIEW
Solitary fact about stock market is its “Volatility”. Indian
financial market has been a bystander of numerous peaks and
lows in the period of January 2011 to December 2015 and
same track is still present in the market. This precariousness
has impinged on almost all the sectors in various proportions.
Mutual funds have given binary benefits to its investors as on
one hand it lessens the tax burden and on the other side, it
offers a substantial yield with the comfort of diversification of
risk. As an outcome of its multifarious advantages as an
investment alternative, it attracts attention and crafts interest
in researchers and academicians to perform research on it. But
at the same time, it also has its own flaws and challenges.
Furthermore, in context of mutual funds comparative
performance evaluation of various mutual fund policies and
AMCs has always pondered an incredible debate.
Table 1: Phases of Evolution of Indian Mutual Fund Industry
First phase-1964-87 Second Phase- 1987-1993
Third Phase-1993-2003
Fourth Phase-since
February 2003
Started in 1963 with UTI, Govt. Of India & RBI.
In 1987, public sector banks and LIC & GIC got the entry in MF Industry.
In 1993, first MF regulation came into being under which all MF, except UTI were to be registered and governed.
In February 2003, following the repeal of UTI Act 1963, UTI was bifurcated into two separate entities.
In 1978, UTI was de-linked from RBI and functioned under the regulatory and administrative control of RBI
SBI was the first non-UTI fund establishment in June 1987.
Kothari Pioneer (now merged with Franklin Templeton) was the first private sector MF registered in July 1993.
One is the Specified Undertaking of UTI (SUUTI). This undertaking is functioning under the rules framed by the Government of India and does not come under the purview of the Mutual Fund Regulations.
First scheme launched by UTI was Unit Scheme 1964.
LIC established its MF in June 1989 while GIC in Dec 1990.
1993 SEBI Regulations were substituted by a more comprehensive and revised regulations in 1996- SEBI (Mutual Fund) Regulations 1996
Second is the UTI Mutual Fund, sponsored by SBI, PNB, and LIC. It is registered with SEBI and functions under the Mutual Fund Regulations.
Source: Sharma & Pandey (2014).

Anusandhan - The Research Repository, Volume 3, Number 158
Sharma (2013) have worked to evaluate the return earned by
some selected mutual fund schemes & compared them with
the standard market returns & found that large number of mutual
funds have given higher returns. In nutshell, Indian AMCs are
competent enough to beat their benchmarks on an average.
Same conclusions were supported by Hemadivya (2012) and
further, categorically, it was also found that liquid funds and
balanced funds generated higher returns and proper evaluation
measures occupy extremely vital position as they work as the
correct guiding barometer in the process of decision making
especially for retail investors.
Zafar (2010), Dhanda & Anjum (2012) and Sapar & Narayan
(2003) extended this phenomenon by providing sufficient
information on risk and return association and the role played
by fund’s ranking to boost their performance and found that
majority of the sample funds were able to provide reward for
associated variability and volatility.
Along with these mutual funds possess a very alluring feature,
for all categories of investors, which is tax saving.
Performance evaluation of mutual funds is a major dilemma
for most of the investors. As a wide variety of calculative
mechanisms exist in the concerned area and comparisons can
also be made on the basis of industry to which a particular
fund belongs.
As Alekhya (2012), Bawa (2011) and Sivakumar (2010)
evaluated the performance of mutual funds in public and private
sector in India on the basis of returns earned by them and
concluded that due to higher risk factor involvement, private
sector offers higher returns to investors and plays a greater
role in resource mobilization.
Mutual funds offer an improved investment avenue primarily
to retail investors. Several studies have been conducted to find
out the intentions of investors while investing and the most
preferred saving instrument and factors affecting them. It was
found that investors invest their funds with the intention of
acquiring various resources and bank deposits are the most
popular and relied saving instrument. Choice of investment
avenues could be affected by investment objective, time span,
performance facet of the asset class. Saha (2011), Choudhary
and Chawla (2014) analysed the performance of the growth
oriented equity diversified schemes on the basis of return and
risk evaluation. The analysis was achieved by assessing various
financial tests. The analysis depicts that majority of funds
selected for study have outperformed under Sharpe Ratio as
well as Treynor Ratio.
Bantwa and Bhuva (2012) carried out research to evaluate the
performance of selected 20 equity diversified schemes. An
attempt has been made to evaluate the fund’s performance,
level of diversification and manager’s ability to pick the
undervalued stocks. The study revealed that except one all the
sampled schemes have performed better than market. Risk
adjusted performance in terms of Sharpe and Treynor ratio
showed that 55% of the fund schemes bear positive values.
The findings also revealed that majority of the schemes were
adequately diversified, fund managers remained successful in
reducing unique risk through better diversification. The study
also revealed that about 60% of the schemes were able to beat
the market with help of better stock selection skill of fund
managers. Bhatt and Vyas (2014) aimed at evaluating
performance of mutual funds and also to inspecting the role of
asset management companies in reference to public and private
sector. The main objective of this study is to study financial
performance of selected mutual fund schemes through the
statistical parameter. The findings of the study revealed that as
private sector securities have higher risk content so they offer
higher returns as well.
Karrupasamy and Vanaja (2013) in their study evaluated the
performance of different mutual fund schemes on the basis of
returns and comparison with their bench marks and also to
appraise the performance of different category of funds using
risk adjusted measures as suggested by Sharpe, Treynor and
Jensen. The study revealed the investors for investment below
2 years can choose large cap schemes and investment beyond
3 years can be made in Small & mid cap schemes.
Mutual funds are expanding their market share with each
passing day as a large number of mutual funds have surpassed
the market benchmark indexes Sharma (2013) but Pandey
(2011) found that no single fund has surpassed the standards
in all the categories, different funds perform best in different
categories. Along with this, researcher also suggested that
investors should diversify the investments between a few funds
and have warned investors not to judge a fund merely by its
NAV (Net Asset Value).
Research work of Nimalathasan and Gandhi (2012) also
focused on the financial performance analysis of mutual fund
schemes of selected banks. The objective of this research was
to analyse financial performance of selected mutual fund
schemes with the help of various statistical parameters and
ratios. This study has also revealed the same results.
Poornima and Sudhamathi (2013) analyzed about the
performance of the growth oriented equity diversified schemes
by using Sortino ratio. 102 growth oriented equity diversified
schemes were selected for the study. The analysis using Sortino
ratio depicts that out of 102 funds, 97 funds were able to
produce return more than minimum acceptable rate of return.
Whereas 5 funds were found to produce return less than
minimum acceptable rate of return. This research paper clearly
reveals the fact that careful evaluation using appropriate
performance measure will guide the investor in selecting the
best funds. Considering the same, apart from considering NAV,
various data analysis tools have been used in this study.
Vasantha et.al. (2013) have also analyzed the fund based on
various criteria such as risk prevailing in the market, variations
on the return and deviations occur in the returns etc. Risk
appetite of an investor plays an important role in the selection
of mutual fund.
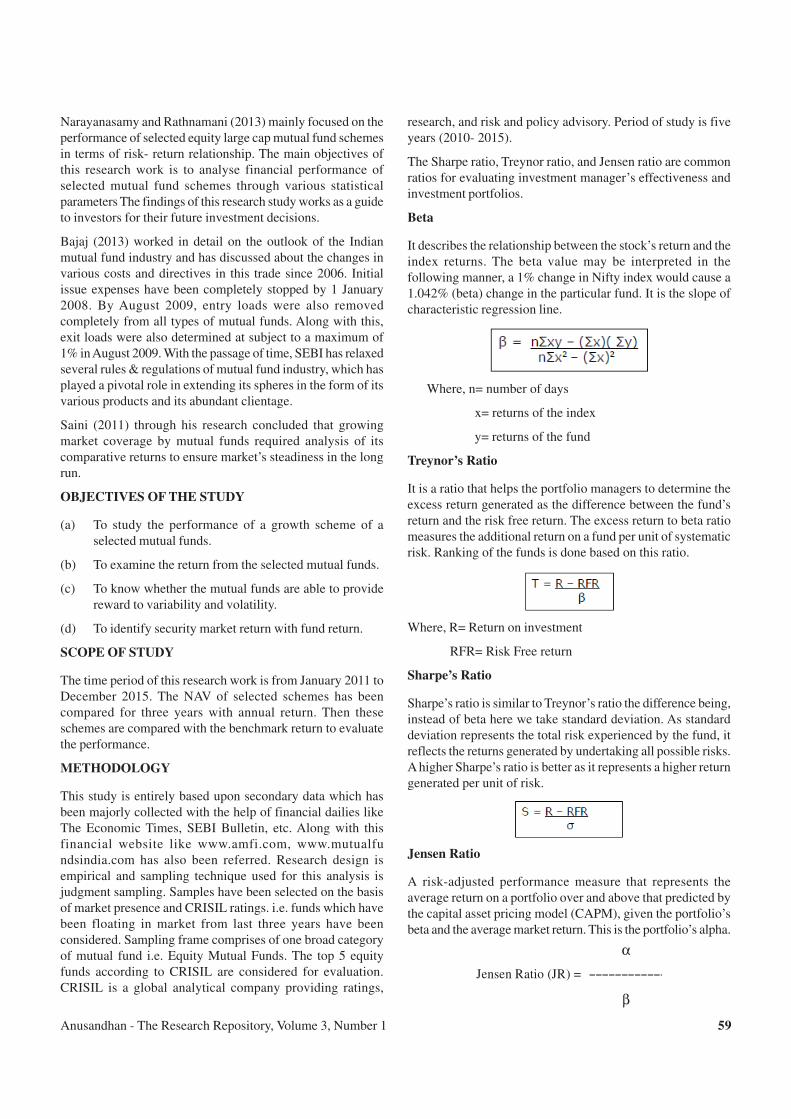
Anusandhan - The Research Repository, Volume 3, Number 1 59
Narayanasamy and Rathnamani (2013) mainly focused on the
performance of selected equity large cap mutual fund schemes
in terms of risk- return relationship. The main objectives of
this research work is to analyse financial performance of
selected mutual fund schemes through various statistical
parameters The findings of this research study works as a guide
to investors for their future investment decisions.
Bajaj (2013) worked in detail on the outlook of the Indian
mutual fund industry and has discussed about the changes in
various costs and directives in this trade since 2006. Initial
issue expenses have been completely stopped by 1 January
2008. By August 2009, entry loads were also removed
completely from all types of mutual funds. Along with this,
exit loads were also determined at subject to a maximum of
1% in August 2009. With the passage of time, SEBI has relaxed
several rules & regulations of mutual fund industry, which has
played a pivotal role in extending its spheres in the form of its
various products and its abundant clientage.
Saini (2011) through his research concluded that growing
market coverage by mutual funds required analysis of its
comparative returns to ensure market’s steadiness in the long
run.
OBJECTIVES OF THE STUDY
(a) To study the performance of a growth scheme of a
selected mutual funds.
(b) To examine the return from the selected mutual funds.
(c) To know whether the mutual funds are able to provide
reward to variability and volatility.
(d) To identify security market return with fund return.
SCOPE OF STUDY
The time period of this research work is from January 2011 to
December 2015. The NAV of selected schemes has been
compared for three years with annual return. Then these
schemes are compared with the benchmark return to evaluate
the performance.
METHODOLOGY
This study is entirely based upon secondary data which has
been majorly collected with the help of financial dailies like
The Economic Times, SEBI Bulletin, etc. Along with this
financial website like www.amfi.com, www.mutualfu
ndsindia.com has also been referred. Research design is
empirical and sampling technique used for this analysis is
judgment sampling. Samples have been selected on the basis
of market presence and CRISIL ratings. i.e. funds which have
been floating in market from last three years have been
considered. Sampling frame comprises of one broad category
of mutual fund i.e. Equity Mutual Funds. The top 5 equity
funds according to CRISIL are considered for evaluation.
CRISIL is a global analytical company providing ratings,
research, and risk and policy advisory. Period of study is five
years (2010- 2015).
The Sharpe ratio, Treynor ratio, and Jensen ratio are common
ratios for evaluating investment manager’s effectiveness and
investment portfolios.
Beta
It describes the relationship between the stock’s return and the
index returns. The beta value may be interpreted in the
following manner, a 1% change in Nifty index would cause a
1.042% (beta) change in the particular fund. It is the slope of
characteristic regression line.
Where, n= number of days
x= returns of the index
y= returns of the fund
Treynor’s Ratio
It is a ratio that helps the portfolio managers to determine the
excess return generated as the difference between the fund’s
return and the risk free return. The excess return to beta ratio
measures the additional return on a fund per unit of systematic
risk. Ranking of the funds is done based on this ratio.
Where, R= Return on investment
RFR= Risk Free return
Sharpe’s Ratio
Sharpe’s ratio is similar to Treynor’s ratio the difference being,
instead of beta here we take standard deviation. As standard
deviation represents the total risk experienced by the fund, it
reflects the returns generated by undertaking all possible risks.
A higher Sharpe’s ratio is better as it represents a higher return
generated per unit of risk.
Jensen Ratio
A risk-adjusted performance measure that represents the
average return on a portfolio over and above that predicted by
the capital asset pricing model (CAPM), given the portfolio’s
beta and the average market return. This is the portfolio’s alpha.
Jensen Ratio (JR) =
α
β
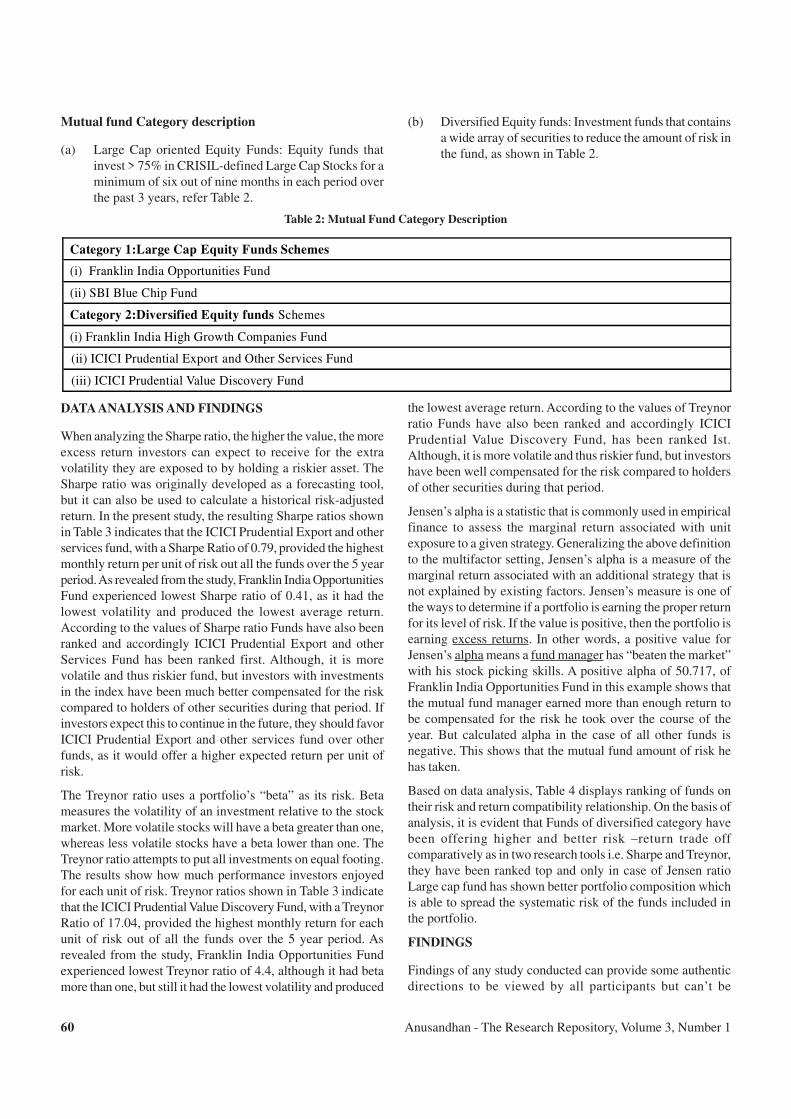
Anusandhan - The Research Repository, Volume 3, Number 160
Mutual fund Category description
(a) Large Cap oriented Equity Funds: Equity funds that
invest > 75% in CRISIL-defined Large Cap Stocks for a
minimum of six out of nine months in each period over
the past 3 years, refer Table 2.
(b) Diversified Equity funds: Investment funds that contains
a wide array of securities to reduce the amount of risk in
the fund, as shown in Table 2.
Table 2: Mutual Fund Category Description
Category 1:Large Cap Equity Funds Schemes
(i) Franklin India Opportunities Fund
(ii) SBI Blue Chip Fund
Category 2:Diversified Equity funds Schemes
(i) Franklin India High Growth Companies Fund
(ii) ICICI Prudential Export and Other Services Fund
(iii) ICICI Prudential Value Discovery Fund
DATA ANALYSIS AND FINDINGS
When analyzing the Sharpe ratio, the higher the value, the more
excess return investors can expect to receive for the extra
volatility they are exposed to by holding a riskier asset. The
Sharpe ratio was originally developed as a forecasting tool,
but it can also be used to calculate a historical risk-adjusted
return. In the present study, the resulting Sharpe ratios shown
in Table 3 indicates that the ICICI Prudential Export and other
services fund, with a Sharpe Ratio of 0.79, provided the highest
monthly return per unit of risk out all the funds over the 5 year
period. As revealed from the study, Franklin India Opportunities
Fund experienced lowest Sharpe ratio of 0.41, as it had the
lowest volatility and produced the lowest average return.
According to the values of Sharpe ratio Funds have also been
ranked and accordingly ICICI Prudential Export and other
Services Fund has been ranked first. Although, it is more
volatile and thus riskier fund, but investors with investments
in the index have been much better compensated for the risk
compared to holders of other securities during that period. If
investors expect this to continue in the future, they should favor
ICICI Prudential Export and other services fund over other
funds, as it would offer a higher expected return per unit of
risk.
The Treynor ratio uses a portfolio’s “beta” as its risk. Beta
measures the volatility of an investment relative to the stock
market. More volatile stocks will have a beta greater than one,
whereas less volatile stocks have a beta lower than one. The
Treynor ratio attempts to put all investments on equal footing.
The results show how much performance investors enjoyed
for each unit of risk. Treynor ratios shown in Table 3 indicate
that the ICICI Prudential Value Discovery Fund, with a Treynor
Ratio of 17.04, provided the highest monthly return for each
unit of risk out of all the funds over the 5 year period. As
revealed from the study, Franklin India Opportunities Fund
experienced lowest Treynor ratio of 4.4, although it had beta
more than one, but still it had the lowest volatility and produced
the lowest average return. According to the values of Treynor
ratio Funds have also been ranked and accordingly ICICI
Prudential Value Discovery Fund, has been ranked Ist.
Although, it is more volatile and thus riskier fund, but investors
have been well compensated for the risk compared to holders
of other securities during that period.
Jensen’s alpha is a statistic that is commonly used in empirical
finance to assess the marginal return associated with unit
exposure to a given strategy. Generalizing the above definition
to the multifactor setting, Jensen’s alpha is a measure of the
marginal return associated with an additional strategy that is
not explained by existing factors. Jensen’s measure is one of
the ways to determine if a portfolio is earning the proper return
for its level of risk. If the value is positive, then the portfolio is
earning excess returns. In other words, a positive value for
Jensen’s alpha means a fund manager has “beaten the market”
with his stock picking skills. A positive alpha of 50.717, of
Franklin India Opportunities Fund in this example shows that
the mutual fund manager earned more than enough return to
be compensated for the risk he took over the course of the
year. But calculated alpha in the case of all other funds is
negative. This shows that the mutual fund amount of risk he
has taken.
Based on data analysis, Table 4 displays ranking of funds on
their risk and return compatibility relationship. On the basis of
analysis, it is evident that Funds of diversified category have
been offering higher and better risk –return trade off
comparatively as in two research tools i.e. Sharpe and Treynor,
they have been ranked top and only in case of Jensen ratio
Large cap fund has shown better portfolio composition which
is able to spread the systematic risk of the funds included in
the portfolio.
FINDINGS
Findings of any study conducted can provide some authentic
directions to be viewed by all participants but can’t be
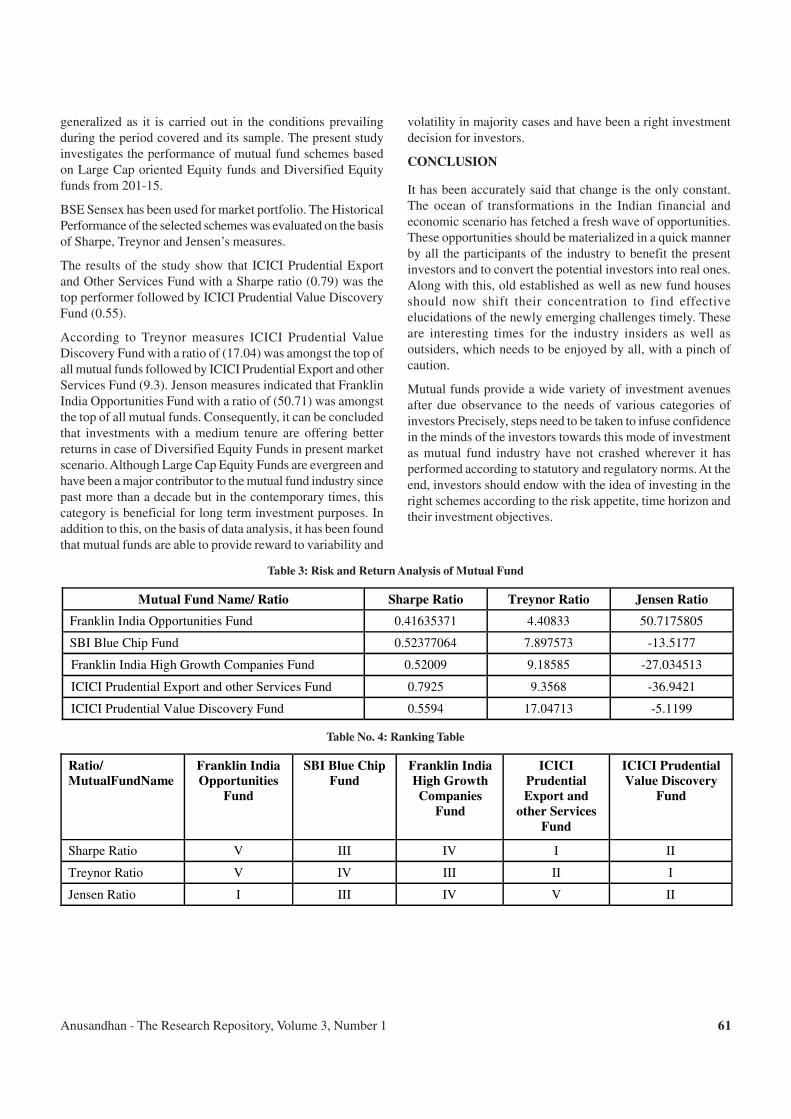
Anusandhan - The Research Repository, Volume 3, Number 1 61
volatility in majority cases and have been a right investment
decision for investors.
CONCLUSION
It has been accurately said that change is the only constant.
The ocean of transformations in the Indian financial and
economic scenario has fetched a fresh wave of opportunities.
These opportunities should be materialized in a quick manner
by all the participants of the industry to benefit the present
investors and to convert the potential investors into real ones.
Along with this, old established as well as new fund houses
should now shift their concentration to find effective
elucidations of the newly emerging challenges timely. These
are interesting times for the industry insiders as well as
outsiders, which needs to be enjoyed by all, with a pinch of
caution.
Mutual funds provide a wide variety of investment avenues
after due observance to the needs of various categories of
investors Precisely, steps need to be taken to infuse confidence
in the minds of the investors towards this mode of investment
as mutual fund industry have not crashed wherever it has
performed according to statutory and regulatory norms. At the
end, investors should endow with the idea of investing in the
right schemes according to the risk appetite, time horizon and
their investment objectives.
generalized as it is carried out in the conditions prevailing
during the period covered and its sample. The present study
investigates the performance of mutual fund schemes based
on Large Cap oriented Equity funds and Diversified Equity
funds from 201-15.
BSE Sensex has been used for market portfolio. The Historical
Performance of the selected schemes was evaluated on the basis
of Sharpe, Treynor and Jensen’s measures.
The results of the study show that ICICI Prudential Export
and Other Services Fund with a Sharpe ratio (0.79) was the
top performer followed by ICICI Prudential Value Discovery
Fund (0.55).
According to Treynor measures ICICI Prudential Value
Discovery Fund with a ratio of (17.04) was amongst the top of
all mutual funds followed by ICICI Prudential Export and other
Services Fund (9.3). Jenson measures indicated that Franklin
India Opportunities Fund with a ratio of (50.71) was amongst
the top of all mutual funds. Consequently, it can be concluded
that investments with a medium tenure are offering better
returns in case of Diversified Equity Funds in present market
scenario. Although Large Cap Equity Funds are evergreen and
have been a major contributor to the mutual fund industry since
past more than a decade but in the contemporary times, this
category is beneficial for long term investment purposes. In
addition to this, on the basis of data analysis, it has been found
that mutual funds are able to provide reward to variability and
Table 3: Risk and Return Analysis of Mutual Fund
Mutual Fund Name/ Ratio Sharpe Ratio Treynor Ratio Jensen Ratio
Franklin India Opportunities Fund 0.41635371 4.40833 50.7175805
SBI Blue Chip Fund 0.52377064 7.897573 -13.5177
Franklin India High Growth Companies Fund 0.52009 9.18585 -27.034513
ICICI Prudential Export and other Services Fund 0.7925 9.3568 -36.9421
ICICI Prudential Value Discovery Fund 0.5594 17.04713 -5.1199
Table No. 4: Ranking Table
Ratio/
MutualFundName
Franklin India
Opportunities
Fund
SBI Blue Chip
Fund
Franklin India
High Growth
Companies
Fund
ICICI
Prudential
Export and
other Services
Fund
ICICI Prudential
Value Discovery
Fund
Sharpe Ratio V III IV I II
Treynor Ratio V IV III II I
Jensen Ratio I III IV V II

Anusandhan - The Research Repository, Volume 3, Number 162
REFERNCES
1. Alekhya, M. P. (2012). A study on performance evaluation
of public & private sector mutual funds in India. IRJC,
Asia Pacific Journal of Marketing & Management Review,
Vol.1 (2).
2. Bajaj, U (2013) Mutual Funds in India-A comprehensive
growth analysis, Indian Journal of Applied Research. Vol.3
(9).
3. Bantwa A, Bhuva K.(2012), Performance Evaluation Of
Selected Indian Equity Diversified Mutual Fund Schemes:
An Empirical Study, Gjrim Vol. 2 (2).
4. Bhatt P, Vyas V. (2014), A Study on Performance
Evaluation of Selected Equity Mutual Funds in India,
IJRMP Vol. 3(6).
5. Bawa Sumninder Kaur (2011), Performance evaluation
of Income Schemes of Mutual Funds in India-A Public
Private Comparison. IJRFM , Vol.1 (8).
6. Choudhary V, Chawla P. (2014), Performance Evaluation
of Mutual Funds: A Study of Selected Diversified Equity
Mutual Funds in India, International Conference on
Business, Law and Corporate Social Responsibility.
7. Dhanda S, Anjum G. (2012). Performance evaluation of
selected open ended mutual funds in India. International
Journal of Marketing, Financial Services and Management
research,Vol. 1 (1).
8. Hemadivya, K. (2012). A comparative study on evaluation
of selected mutual funds in India. International Journal of
Marketing and Technology, Vol.2 (4).
9. Karrupasamy R, Vanaja V. (2013), A Study on the
Performance of Selected Large Cap and Small & Mid Cap
Mutual Fund Schemes in India, The International Journal
of Management, Vol. 2 (3).
10. Narayanasamy R, Rathnamani V. (2013), Performance
Evaluation of Equity Mutual Funds, International Journal
of Business and Management Invention ISSN (Online):
2319 – 8028, ISSN (Print): 2319 – 801X www.ijbmi.org
Vol. 2 (4).
11. Nimalathasan B, Gandhi R. (2012), Mutual Fund Financial
Performance Analysis- A Comparative Study on Equity
Diversified Schemes and Equity Mid-Cap Schemes,
International Journal of Multidisciplinary Management
Studies Vol.2 (3).
12. Pandey, A. (2011), Investor’s Behavior: Mutual Funds.
CMS Journal of Indian Management, Vol. 2, (2).
13. Poornima S, Sudhamathi R., (2013), Performance Analysis
of Growth Oriented Equity Diversified Mutual Fund
Schemes Using Sortino Ratio, Asia Pacific Journal of
Research, Vol. 1(8).
14. Sadhak H.(2008).Mutual Funds in India: Marketing
Strategies and Investment Practices.
15. Saha Soumya, D. M. (2011). Analysis of factors affecting
Investors perception of Mutual Fund Investment. The IUP
Journal of Management Research, Vol.10(2).
16. Saini S, A.B. (2011, May) Investors perception and
awareness about Mutual Funds. International Journal of
Multidisciplinary Research. Vol. 1 (1).
17. Sapar & Narayan Rao (2003), Measuring Performance of
Indian Mutual Funds, Prabandhan, Vol. 14, (2), PP-179-
185.
18. Sharma, D. (2013). Performance evaluation of Indian
Equity Mutual Funds. The Indian Journal Of Commerce ,
66 (2).
19. Sharma, P. and Pandey, A. (2014), Indian Mutual Fund
Market: Retail Investor’s Investment Insight, ‘International
Journal of Research & Development in Technology and
Management- Kailash’, Vol.21, (1).
20. Singh, B. (2012, March), A study on Investor’s attitude
towards Mutual Funds as an Investment option.’.
International Journal of Research in Management., Vol.
2(2).
21. Sinha, K. (2015), A study on Mutual Fund in India,
Business India, September, page no.76.
22. Sivakumar, S.V. (2010), Performance evaluation of
mutual fund industry in India, Vidwat, Indian Journal of
Management, Vol.3 (1).
23. Zafar, S. (2010), An empirical study on Indian Mutual
funds equity diversified growth schemes and their
performance evaluation, International Journal of Research
in IT, Management, and Engineering , Vol.2 (2).

Anusandhan - The Research Repository, Volume 3, Number 1 63
CORRELATION OF BSE SENSEX WITH BSE BANKEX
Richa Joshi1
Ayushi Jain2
ABSTRACT
Investing in equity market is always a complicated process and it requires some amount of intelligence and information base.
Equity market return represents the total return of the market index (SENSEX). Stock Market Indices act as barometer to
measure the performance of shares from various sectors. Banks are generally considered as safe investment areas. Their share
prices are considered less volatile than other industries. Hence, an attempt is made in this study to know the nature and extent
of influence of banking sector (Bankex) on BSE SENSEX. For this purpose, last five years data of SENSEX and Bankex were
analysed and it was found that there is very positive correlation between them. Thus, the share prices of banks are also as
volatile as SENSEX so enough caution has to be made while investing in banks.
Keywords: BSE Bankex, BSE SENSEX, Correlation coefficient, Regression.
1 Assistant Professor, Gitarattan International Business School, Rohini, Delhi. Email: [email protected] Student, Gitarattan International Business School, Rohini, Delhi. Email: [email protected]
INTRODUCTION
Established in 1875, BSE (formerly known as Bombay Stock
Exchange Ltd.), is Asia’s first & the Fastest Stock Exchange in
world. The BSE Index, S&P BSE Sensex (S&P Bombay Stock
Exchange Sensitive Index), also called the BSE 30 or simply
the SENSEX, is a free-float market-weighted stock market
index of 30 well-established and financially sound companies
listed on Bombay Stock Exchange (BSE). The S&P BSE
Bankex index comprises constituents of the S&P BSE 500 that
are classified as members of the banks sector as defined by the
BSE industry classification system. Bankex tracks the
performance of the leading banking sector stocks listed on the
BSE. In this background, this paper is an attempt towards the
understanding of the returns of Sensex in relation with the
Bankex returns.
LITERATURE REVIEW
Jain (2016) examined that Banks were generally considered
as safe investment areas. Their share prices were considered
less volatile than other industries. To study the truth in this
phenomenon a critical study relating to BSE Sensex and its
relationship with Bankex was made. For this purpose last three
years monthly opening data of Sensex and Bankex were
analyzed and it was found that there is very positive correlation
between Sensex and Bankex. The share prices of banks are
also as volatile as Sensex so enough caution has to be made
while investing in banks.
Rao (2014) investigated the short run and long run relationship
between Indian stock market (Sensex) and stock indices of
major countries in the Asia-Pacific region. Monthly closing
stock market indices of India (Sensex) and that of Australia
[All Ordinaries (AORD)], Hong Kong [Hang Seng Index
(HIS)], Indonesia [Composite Index (JKSE)], JAPAN [Nikkei
225(N225)], Malaysia [Composite Index (KLSE)], Korea
[KOSPI Composite Index (KS11), Singapore [Straits Times
Index (STI)] and Taiwan [TSEC Weighted Index(TWII)] for
the period of April, 2004 to March, 2014 are taken as sample.
The study was tested with cross correlation, Unit root test,
Granger causality test and Johansen co-integration test to seek
the relationship, stationarity, directional causality and either
short or long run equilibrium between the Sensex and the
selected indices of various stock markets. The result obtained
by the econometric tools shows that the correlation between
the Sensex and the other selected indices is high and significant.
The data are stationary in the first difference, both
unidirectional and bidirectional causality occurs and the long
term relationship is found between Sensex and other selected
indices.
Nagendra and Ravi (2014) studied the correlation between NSE
Nifty and industry sectors in India. They analyzed that some
of the Index stock weightages were more in NSE Nifty, but
influence was less than other index stocks. It means that the
weightage was only not the factor to influence the correlations
between indexes. It was concluded that Nifty influence the
performance of sectoral indices performance and FMCG and
Pharma indices less influenced by other sectoral indices.
Shankar and Ramulu (2014) examined that concept of risk and
return plays a vital role in the investment process, business
organization, economic, political, and technological issues/
problems. In their study, three levels had been taken to measure
the performance of the Stock Indices. In the first level, the
Return (Log Mean), Risk (Standard Deviation), Skewness,
Kurtosis and Value at Risk (VaR) had been calculated. In the
second level, ranks had been allotted to the Stock Indices based
on their return and risk performance using the performance
Measures (Sharpe, Treynor, and Jensen). The correlation among

Anusandhan - The Research Repository, Volume 3, Number 164
the Indices performance had been calculated in the third level.
Based on the analysis of results all the indices had been
observed to be highly volatile in the year 2008-09, the indices
VaR was also high in the year 2008-09. Based on the
performance measure results FMCG, Consumer Durables and
Auto industry have been placed in the top position compared
to all other indices. The indices of Metal, IT and Oil & Gas
Industries were placed among the last positions on the basis of
performance measure ratios. The Correlation results show that
the IT industry and Tech industry have a high Positive
correlation and Auto and Metal, Bank and Oil & Gas, Bank
and Tech, Oil & Gas and Tech industries have a positive
correlation on the basis of last seven years daily returns.
Anbukarasi and Nithya (2014) in their study had attempted to
provide an empirical support to identify the volatility in sectoral
indices and CNX Nifty index. The indices selected for the study
are CNX Nifty index, CNX Auto index, CNX Bank index,
CNX Energy index, CNX Finance index, CNX FMCG index,
CNX IT index, CNX Media index, CNX Metal index, CNX
Pharma index, CNX PSU Bank index, and CNX Realty index
for the period from January 2013 to June 2014. The study found
that the correlation is significant for most of the indices except
the CNX Metal index, CNX Pharma index, CNX PSU Bank
index, and CNX Realty index and further found that the indices
CNX Pharma index and CNX PSU Bank index have more
impact on Nifty.
Rajamohan and Muthukamu (2014) made an attempt in their
study to know the nature and extent of influence by banking
sector with other sectors during the bull and bear market phase.
Pearson correlation coefficient technique was applied to find
the nature and extent of influence by banking sector with other
sectors and it was found that there is a positive correlation
between banking stock index and most of the other sectoral
stock indices.
Lakshmi and Swarna (2013) used the ARCH model to measure
the volatility in NIFTY and various sectoral indices in India.
Global meltdown started all over the world around the year
2007. But in India the year 2008 seems to be highly volatile.
Hence they had taken period of study from 2008 to study the
crucial impact till 2013. As NSE witness higher turnover, the
11 sectoral indices of NSE were taken for study and the
volatility of the sectors such as NSE CNX Auto, NSE CNX
Bank, NSE CNX Energy, NSE CNX Finance, NSECNX
FMCG, NSE CNX IT, NSE CNX Media, NSE CNX Metal,
NSECNX Pharma, NSE CNX PSU Bank, NSE CNX Realty
were measured. The sectors that have higher and lower volatility
than the NIFTY have been discussed and also it had been found
out that the realty sector has witnessed higher volatility than
any other sector and the reasons for that have been discussed.
Nateson, et. al. (2013) in their study had found that the quick
diffusion of information had led to increasing free flow of
capital from one market to another or within markets that had
led to market integration. This market integration had led to
volatility transmission or spillover which had grabbed attention
of many researches. Not much attention had been given on
volatility transmission to the sectoral indices from the major
indices that had contributed to find the spillover effect of
volatility in Sensex on BSE sectoral indices. All the sectoral
indices of BSE had been selected and Spillover GARCH model
had been employed for the current study. There was volatility
transmission from the BSE. Sensex to BSE Auto, BSE Bankex,
BSE Consumer Durables, BSE Capital Goods, BSE FMCG,
BSE Healthcare, BSE IT, BSE Metal, BSE Oil & Gas, BSE
Realty and BSE PSU. On the other hand shocks to the BSE
Sensex do not transmit to the BSE Power and BSE TECk
indices.
Shanmugasundram and Benedict (2013) in their study
attempted to provide an empirical support to identify the risk
factors in sectoral indices and CNX Nifty index and also to
see the risk relationship in different time intervals. The indices
selected for the study were CNX Nifty index, CNX Auto index,
CNX Bank index, CNXFMCG index, CNX Infrastructure
index and CNX Information Technology index for the period
from 01/01/2004 to 30/04/2012. The data had been taken from
the official website of National Stock Exchange. The results
show that there is no difference in the Standard deviation among
various sectoral indices. The One-way ANOVA within groups
had been used to identify, if there is any difference in the risk
across time intervals. The results show that there is a significant
difference in the mean scores of various time intervals. The
results exhibit important implications to individual investors
and portfolio managers in terms of reducing portfolio risk and
enhancing their returns.
Saluja et. al. (2013) studied empirically explored market
efficiency and dynamics of relationship of the BSE SENSEX
and Sectoral Indices of the Bombay Stock Exchange for the
period April 2006 to March 2013. The study states that the
variables under consideration are not Weak Form Efficient i.e.,
do not follow Random Walk and are dependent on each other.
The dependency also reflects that the price mechanism is able
to determine prices on historical basis and publically available
information is readily available to all. Also significant
correlation among different sectoral indices was found;
Regression Model was significantly found to be fit; Johansen
Co-integration Test confirmed long term relationship in most
of the Sectoral Indices.
Sinha (2012) studied emphasizes on the impact of
macroeconomic variables on the stock market performance of
a developing economy and also, investigated the performance
of real estate stocks under both the phases to take decisions of
investing in the real sector. She had given suggestion for
investing in stock market in Real Sector.
Kumar and Singh (2011) in their study found that the variance
in all sectoral indices and the market Index (BSE) return and
illustrates the significance of the individual sector performance
and their impact upon the market index returns. Their study
had also explained the liquidity of the sectoral indices and
market index on the basis of price returns by calculating market
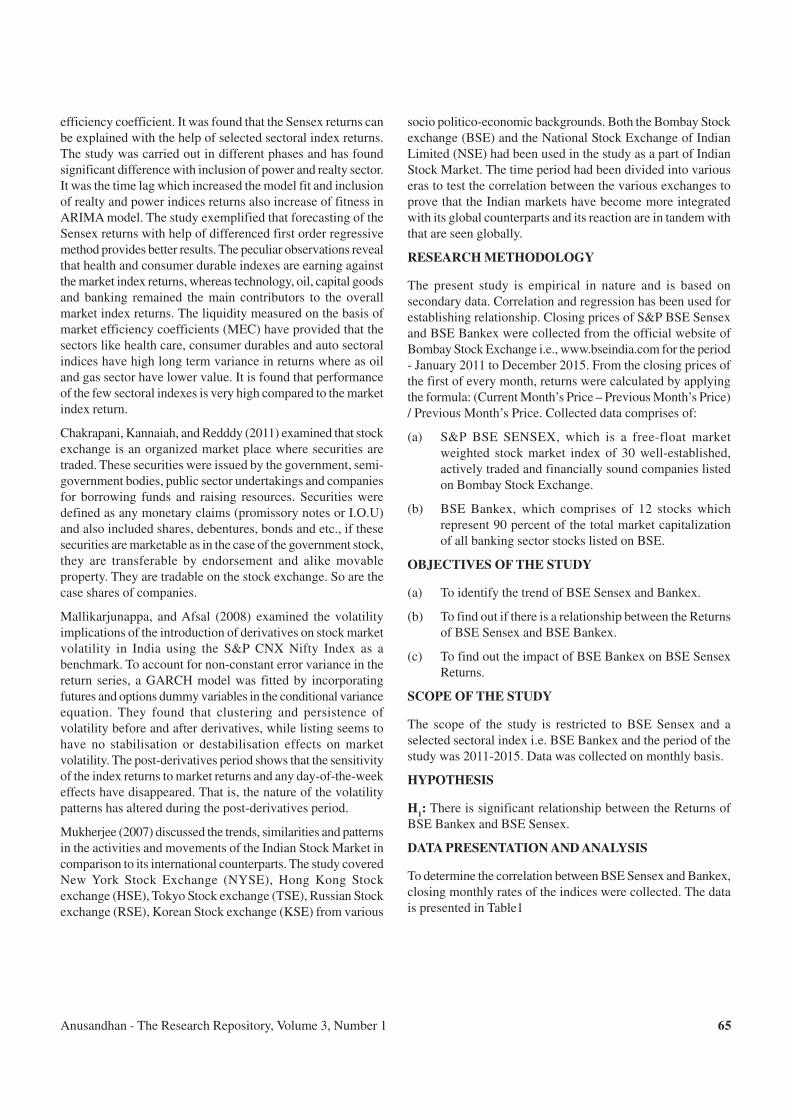
Anusandhan - The Research Repository, Volume 3, Number 1 65
efficiency coefficient. It was found that the Sensex returns can
be explained with the help of selected sectoral index returns.
The study was carried out in different phases and has found
significant difference with inclusion of power and realty sector.
It was the time lag which increased the model fit and inclusion
of realty and power indices returns also increase of fitness in
ARIMA model. The study exemplified that forecasting of the
Sensex returns with help of differenced first order regressive
method provides better results. The peculiar observations reveal
that health and consumer durable indexes are earning against
the market index returns, whereas technology, oil, capital goods
and banking remained the main contributors to the overall
market index returns. The liquidity measured on the basis of
market efficiency coefficients (MEC) have provided that the
sectors like health care, consumer durables and auto sectoral
indices have high long term variance in returns where as oil
and gas sector have lower value. It is found that performance
of the few sectoral indexes is very high compared to the market
index return.
Chakrapani, Kannaiah, and Redddy (2011) examined that stock
exchange is an organized market place where securities are
traded. These securities were issued by the government, semi-
government bodies, public sector undertakings and companies
for borrowing funds and raising resources. Securities were
defined as any monetary claims (promissory notes or I.O.U)
and also included shares, debentures, bonds and etc., if these
securities are marketable as in the case of the government stock,
they are transferable by endorsement and alike movable
property. They are tradable on the stock exchange. So are the
case shares of companies.
Mallikarjunappa, and Afsal (2008) examined the volatility
implications of the introduction of derivatives on stock market
volatility in India using the S&P CNX Nifty Index as a
benchmark. To account for non-constant error variance in the
return series, a GARCH model was fitted by incorporating
futures and options dummy variables in the conditional variance
equation. They found that clustering and persistence of
volatility before and after derivatives, while listing seems to
have no stabilisation or destabilisation effects on market
volatility. The post-derivatives period shows that the sensitivity
of the index returns to market returns and any day-of-the-week
effects have disappeared. That is, the nature of the volatility
patterns has altered during the post-derivatives period.
Mukherjee (2007) discussed the trends, similarities and patterns
in the activities and movements of the Indian Stock Market in
comparison to its international counterparts. The study covered
New York Stock Exchange (NYSE), Hong Kong Stock
exchange (HSE), Tokyo Stock exchange (TSE), Russian Stock
exchange (RSE), Korean Stock exchange (KSE) from various
socio politico-economic backgrounds. Both the Bombay Stock
exchange (BSE) and the National Stock Exchange of Indian
Limited (NSE) had been used in the study as a part of Indian
Stock Market. The time period had been divided into various
eras to test the correlation between the various exchanges to
prove that the Indian markets have become more integrated
with its global counterparts and its reaction are in tandem with
that are seen globally.
RESEARCH METHODOLOGY
The present study is empirical in nature and is based on
secondary data. Correlation and regression has been used for
establishing relationship. Closing prices of S&P BSE Sensex
and BSE Bankex were collected from the official website of
Bombay Stock Exchange i.e., www.bseindia.com for the period
- January 2011 to December 2015. From the closing prices of
the first of every month, returns were calculated by applying
the formula: (Current Month’s Price – Previous Month’s Price)
/ Previous Month’s Price. Collected data comprises of:
(a) S&P BSE SENSEX, which is a free-float market
weighted stock market index of 30 well-established,
actively traded and financially sound companies listed
on Bombay Stock Exchange.
(b) BSE Bankex, which comprises of 12 stocks which
represent 90 percent of the total market capitalization
of all banking sector stocks listed on BSE.
OBJECTIVES OF THE STUDY
(a) To identify the trend of BSE Sensex and Bankex.
(b) To find out if there is a relationship between the Returns
of BSE Sensex and BSE Bankex.
(c) To find out the impact of BSE Bankex on BSE Sensex
Returns.
SCOPE OF THE STUDY
The scope of the study is restricted to BSE Sensex and a
selected sectoral index i.e. BSE Bankex and the period of the
study was 2011-2015. Data was collected on monthly basis.
HYPOTHESIS
H1: There is significant relationship between the Returns of
BSE Bankex and BSE Sensex.
DATA PRESENTATION AND ANALYSIS
To determine the correlation between BSE Sensex and Bankex,
closing monthly rates of the indices were collected. The data
is presented in Table1
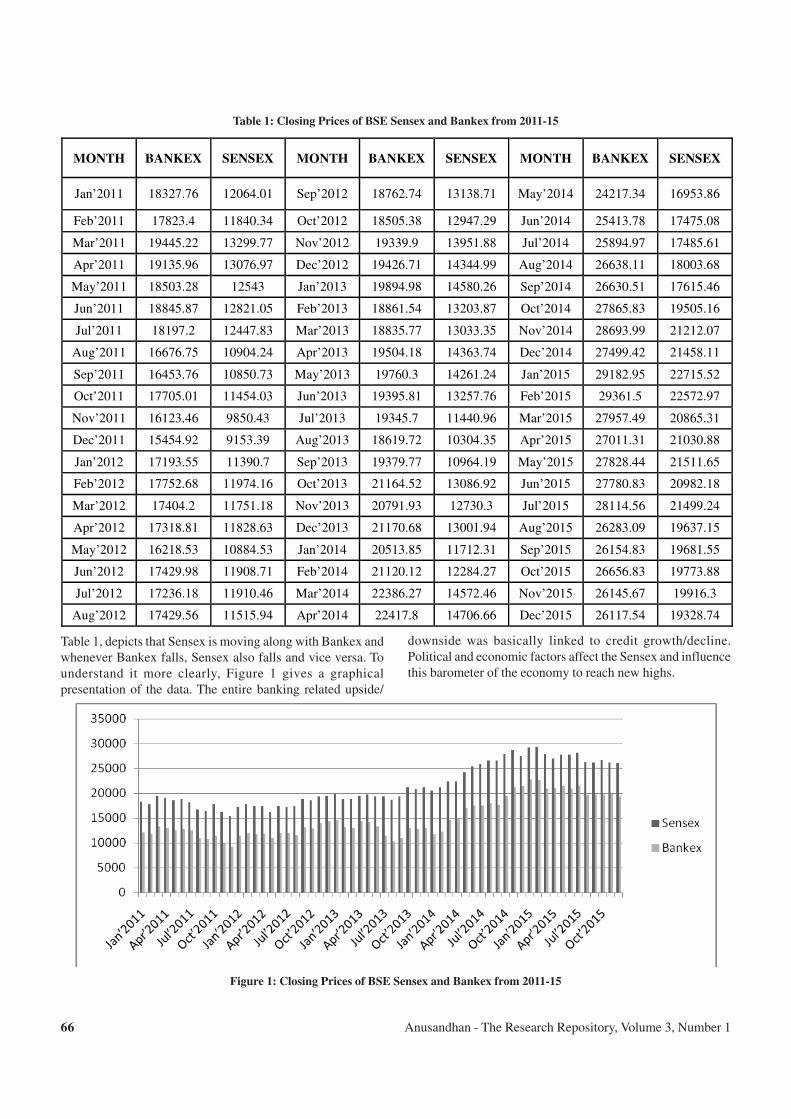
Anusandhan - The Research Repository, Volume 3, Number 166
Table 1: Closing Prices of BSE Sensex and Bankex from 2011-15
MONTH BANKEX SENSEX MONTH BANKEX SENSEX MONTH BANKEX SENSEX
Jan’2011 18327.76 12064.01 Sep’2012 18762.74 13138.71 May’2014 24217.34 16953.86
Feb’2011 17823.4 11840.34 Oct’2012 18505.38 12947.29 Jun’2014 25413.78 17475.08
Mar’2011 19445.22 13299.77 Nov’2012 19339.9 13951.88 Jul’2014 25894.97 17485.61
Apr’2011 19135.96 13076.97 Dec’2012 19426.71 14344.99 Aug’2014 26638.11 18003.68
May’2011 18503.28 12543 Jan’2013 19894.98 14580.26 Sep’2014 26630.51 17615.46
Jun’2011 18845.87 12821.05 Feb’2013 18861.54 13203.87 Oct’2014 27865.83 19505.16
Jul’2011 18197.2 12447.83 Mar’2013 18835.77 13033.35 Nov’2014 28693.99 21212.07
Aug’2011 16676.75 10904.24 Apr’2013 19504.18 14363.74 Dec’2014 27499.42 21458.11
Sep’2011 16453.76 10850.73 May’2013 19760.3 14261.24 Jan’2015 29182.95 22715.52
Oct’2011 17705.01 11454.03 Jun’2013 19395.81 13257.76 Feb’2015 29361.5 22572.97
Nov’2011 16123.46 9850.43 Jul’2013 19345.7 11440.96 Mar’2015 27957.49 20865.31
Dec’2011 15454.92 9153.39 Aug’2013 18619.72 10304.35 Apr’2015 27011.31 21030.88
Jan’2012 17193.55 11390.7 Sep’2013 19379.77 10964.19 May’2015 27828.44 21511.65
Feb’2012 17752.68 11974.16 Oct’2013 21164.52 13086.92 Jun’2015 27780.83 20982.18
Mar’2012 17404.2 11751.18 Nov’2013 20791.93 12730.3 Jul’2015 28114.56 21499.24
Apr’2012 17318.81 11828.63 Dec’2013 21170.68 13001.94 Aug’2015 26283.09 19637.15
May’2012 16218.53 10884.53 Jan’2014 20513.85 11712.31 Sep’2015 26154.83 19681.55
Jun’2012 17429.98 11908.71 Feb’2014 21120.12 12284.27 Oct’2015 26656.83 19773.88
Jul’2012 17236.18 11910.46 Mar’2014 22386.27 14572.46 Nov’2015 26145.67 19916.3
Aug’2012 17429.56 11515.94 Apr’2014 22417.8 14706.66 Dec’2015 26117.54 19328.74
Table 1, depicts that Sensex is moving along with Bankex and
whenever Bankex falls, Sensex also falls and vice versa. To
understand it more clearly, Figure 1 gives a graphical
presentation of the data. The entire banking related upside/
downside was basically linked to credit growth/decline.
Political and economic factors affect the Sensex and influence
this barometer of the economy to reach new highs.
Figure 1: Closing Prices of BSE Sensex and Bankex from 2011-15

Anusandhan - The Research Repository, Volume 3, Number 1 67
Table 2: Correlation
Sensex Bankex
Pearson Correlation 1 .967
Sig. (2-tailed) .000
N 63 63
Pearson Correlation .967 1
Sig. (2-tailed) .000
N 63 63
Note: Correlation of 0.967 is significant at 0.01 level (2-tailed)
Table 3: Model Summary
Model R R Square Adjusted R Square Std. Error of the Estimate
1 .967 .934 .933 1081.13383
Table 4: Coefficients
Unstandardized Coefficients Standardized Coefficients Model
B Std. Error Beta
t Sig.
(Constant) 5785.354 555.653 10.412 .000 1
Bankex 1.057 .036 .967 29.448 .000
Table 2 clearly indicates that the calculated value of correlation
coefficient (r) between BSE Sensex and Bankex is positive;
indicating a strong and direct relationship of Bankex returns
with Sensex returns (calculated value r is 0.967). As the p value
(0.000) obtained from table is less than 0.01, the hypothesis
(H1) is accepted and it is proved that there is a significant
positive relationship between the returns of Bankex and Sensex.
Regression is established taking Bankex as independent
variable and Sensex as dependent variable. As per Table 3, R-
Square of 93.4% indicates the fit of the model is good.
Regression equation:
BSE_return = a + b * (Bankex_return)
Where, a is constant and b is coefficient of variable.
From Table 4, the values of a= 5785.354 and b=1.057, the
regression equation between the two variables thus becomes:
Sensex_return = 5785.354 + 1.057 (Bankex_return)
CONCLUSION
This study has attempted to understand the movement of
Bankex returns and its contribution towards the Sensex returns.
In view of the emergence of the banking stocks as a major
segment in the equity market, BSE considered it desirable to
design an index exclusively for bank stocks namely, BSE
Bankex. After analyzing the nature of BSE Sensex and Bankex,
it is found that there exists a strong and positive correlation
between both the indices. Any change in the volatility of the
Bankex has a significant impact on the BSE Sensex.
REFERENCES
1. Ambukarasi, M and Nithya, B. (2014) Return and Volatility
Analysis of the Indian Sectoral Indices-With Special
Reference to NSE. EPRA International Journal of
Economic & Business Review. Vol. 2.
2. Chakrapani, R. and Kannaiah, P. and Reddy, G. Malla.
(2011) A Study on Indices at NSE. International Journal
of Management & Business Studies. Vol. 1, pg. 136-145.
3. Jain, Krati. (2016) A critical study on relationship of BSE
Sensex and Bankex. Journal for Advanced Research in
Commerce and management studies. Vol.3, pg. 7-12.
4. Kumar, Pasupuleti Venkata Vijay and Singh, Piyush
Kumar. (2011) A study of return, liquidity of sectoral
indices, market index return of Indian financial market
(BSE). International Journal of Research in Commerce &
Management. Vol. 2, pg. 1-8.
5. Lakshmi P, Swarna. (2013) Volatility Patterns in Various
Sectoral Indices in Indian Stock Market. Global Journal
of Management and Business Studies. Vol. 3, pp. 879-
886.
6. Mallikarjunappa, T. and E.M., Afsal. (2008) The impact
of derivatives on stock market volatility: a study of the
nifty index. Asian Academy of Management Journal of
Accounting and Finance. Vol. 4.
7. Mukherjee, Debjiban. (2007) Comparative analysis of
Indian Stock Market with International Markets. Great
lakes Herald.Vol.
Anusandhan - The Research Repository, Volume 3, Number 168
8. Nagendra, M. and Haritha, M. and Ravi, V. (2014) NSE
Nifty & its correlation with sectorial indexes. International
Journal of Conceptions on Management and Social
Sciences. Vol. 2, pg. 9-13.
9. Nateson, C. and Palanisamy, R. and Renukadevi, P. and
Suganya, D. (2013) Spillover Effect of Volatility in BSE
Sensex on BSE Sectoral Indices. IJMBS. Vol. 3, pg. 92-
95.
10. Rao, K. Mallikarjuna. (2014) Interrelationship among
Indian Stock Market and Selected Stock Price Indices of
the Asia-Pacific Region. The Indian Journal of Commerce.
Vol. 67, No. 3, Pg. 13-20.
11. Rajamohan, S. and Muthukamu, M. (2014) Bank Nifty
Index and Other Sectoral Indices of NSE- A Comparative
Study. Indian Journal of Research. Vol. 3, pg. 147-149.
12. Saluja, H.S. and Totala, N. K. and Bapna, Ira and Sood,
Vishal. (2013) Efficiency and Co-integration of SENSEX
and Sectoral Indices of Bombay Stock Exchange: A Shift
to Dynamic Business Environment. Altius Shodh Journal
of Management & Commerce.
13. Shankar, CH. & Ramulu, K. (2014) Volatility and
Correlation of Stock Indices on Indian Stock Market.
International Journal of Research in Business
Management. Vol. 2, pg. 17-26.
14. Shanmugasundram, G. and Benedict, John. (2013)
Volatility of the Indian sectoral indices - A study with
reference to national stock exchange. International Journal
of Marketing, Financial Services & Management
Research. Vol.2.
15. Sinha, Ratna (2012) An analytical study of performance
of reality sector in sensex. Journal of Research in
Commerce & Management. Vol.1.
Anusandhan - The Research Repository, Volume 3, Number 1 69
RELATIONSHIP BETWEEN BSE INDEX RETURNS
AND FINANCIAL SERVICES RETURNS
Swati Jain1
Lokesh2
ABSTRACT
BSE is the first stock exchange in the country which obtained permanent recognition (in 1956) from the Government of India
under the Securities Contracts (Regulation) Act 1956. Financial Sector of India is intrinsically strong and exhibits competence
and flexibility besides being sensitive to India's economic aims of developing a market oriented, industrious and viable economy.
The present study aims to identify the relationship between BSE Index and Financial Services Returns and the impact of Financial
Services' return on BSE Index return. Historical data of years 2006 - 2015 was taken from the official website of BSE. Pearson
Correlation and regression was used for analysis of the data. Results revealed that there is a direct positive relationship between
BSE index returns and Financial Services' returns. The study further revealed that Financial Services' return have an impact on
BSE Index return. The study has managerial implication as it suggests investors should not believe in some fundamental aspects
only because capital markets are driven by number of factors.
Keywords: BSE SENSEX, Closing Price, Financial Services, Opening price, Returns, Stock Price.
1 Assistant Professor, Gitarattan International Business School, Rohini, New Delhi. Email id: [email protected] Student, Gitarattan International Business School, Rohini, New Delhi
INTRODUCTION
Bombay Stock Exchange is the oldest stock exchange in Asia
with a rich heritage, now spanning three centuries in its 133
years of existence. What is now popularly known as BSE was
established as “The Native Share & Stock Brokers’
Association” in 1875.
BSE is the first stock exchange in the country which obtained
permanent recognition (in 1956) from the Government of India
under the Securities Contracts (Regulation) Act 1956. BSE’s
pivotal and pre-eminent role in the development of the Indian
capital market is widely recognized. It migrated from the open
outcry system to an online screen-based order driven trading
system in 1995. Earlier an Association of Persons (AOP), BSE
is now a corporatized and demutualised entity incorporated
under the provisions of the Companies Act, 1956, pursuant to
the BSE (Corporatisation and Demutualisation) Scheme, 2005
notified by the Securities and Exchange Board of India (SEBI).
With demutualization, BSE has two of world’s best exchanges,
Deutsche Bores and Singapore Exchange, as its strategic
partners.
Over the past 133 years, BSE has facilitated the growth of the
Indian corporate sector by providing it with an efficient access
to resources. There is perhaps no major corporate in India which
has not sourced BSE’s services in raising resources from the
capital market.
Financial Sector of India is intrinsically strong, operationally
sundry and exhibits competence and flexibility besides being
sensitive to India’s economic aims of developing a market
oriented, industrious and viable economy.
LITERATURE REVIEW
Venkataramanaiah (2015) conducted study on the relationship
between number of listed companies and SENSEX and market
capitalization as a whole, market capitalization to gross national
product, sector –wise market capitalization, security group-
wise capitalization and company-wise capitalisation were
examined. It was found that there was a positive relationship
between market capitalisation and SENSEX while there was
no positive relationship between market capitalisation and
listed companies and listed companies and SENSEX. Further,
it marked that there was positive relation between market
capitalisation and gross national product. Furthermore, it was
evident that there was a gradual increase in sector-wise market
capitalisation, security group-wise capitalisation and company-
wise capitalisation during the study
Sahu (2015) conducted study on relationship Between NSE &
BSE. The researcher has attempted to find out the effect of
changes in NYSE due to changes in Indian stock market. In
the study the researcher has chosen Bombay Stock Exchange
(BSE) as its SENSEX is the oldest as well as being more
popular stock exchange in India. The NYSE is the largest stock
exchange in the world & its movements affect the world’s
economy. The paper deals with the relationship between BSE
& NYSE The researcher has tried to find out whether movement
in the stocks in BSE has an effect on NYSE & vice versa. It
also takes into account the fluctuations in the returns obtained
from the stock exchanges. In the paper he has also attempted
to show the effect of changes in the returns of the stock
exchange over the GDP of the country. The data of 11 years
were taken into account for doing the research.
Anusandhan - The Research Repository, Volume 3, Number 170
Saxena & Rana (2014) conducted study on the impact of
announcement of new banking license policy on the share prices
of selected NBFCS” Stock markets in the world individually
and collectively play a critical role in the economies. The
performance of the stock market is influenced by a number of
factors the main ones among them being the activities of
governments and the general performance of the economy. The
Reserve Bank of India (RBI) on 22nd February 2013 released
the final guidelines for licensing of banks in the private sector.
The study analyses the performance of Non-Banking Financial
Corporations before and after the announcement of final
guidelines of New Banking License with the help of event study
methodology. The results of the study shows that announcement
of New Banking License does not have a significant impact on
value of NBFCs.
Radhika (2005) conducted comparative study on BSE and
sectorial indices. The global economic meltdown has
influenced all the sectors of the Indian economy. Its impact is
more visible on the capital market and the indices. The indices
are falling down and the markets are following the same trend.
The BSE SENSEX has been the worst hit among the Indian
stock market indices. The other sectoral indices are also
following the SENSEX until a revival in the last quarter. In
this backdrop, an attempt was made to study the performance
of the sectoral indices in comparison with SENSEX. The author
has taken the data of the last financial year and studied the
correlation coefficients to establish the relationship between
the selected sectoral indices and BSE. Six leading sectoral
indices were taken for the analysis, which have a significant
impact on the total economic situation of the country.
Luthra and Mahajan (2014) conducted study on “Impact of
Macro factors on BSE Bankex” The purpose of the paper is to
study the impact of macroeconomic factors on BSE Bankex.
Macro economic climate here is comprised of GDP growth
rate, Inflation, Gold Prices and Exchange rate. A multiple
regression model is developed which shows the regression co-
efficient between the share prices and various factors affecting
the same. Regression results indicate that Exchange rate,
Inflation, GDP growth rate affect banking index positively
whereas Gold prices have negative impact on BSE Bankex
but none of them have significant impact on Bankex.
Kumar and Mishra (2013) conducted study on “Impact of
financial Indicators on BSE SENSEX”. The study makes an
attempt to examine the relationship between the market price
and selected four variables namely EPS, price earnings ratio,
price to book ratio, and dividend yield in BSE SENSEX. The
tenure considered in study is twelve years i.e. 2000-2012. The
scope of the study is confined only to selected explanatory
variables in BSE SENSEX. Correlation, regression, and
ANOVA are used for analyzing the relationship between the
market price and selected independent. The finding suggests
that Earning per Share (EPS) and Price to book Value (P/B)
are behaving as a significant factor at 0.05 level of significance.
Moreover, other independent variables such as Price Earnings
ratio (P/E) and Dividend Yield (Yield) seems to be statistically
insignificant in explaining the market price index.
Nateson et. al. (2013) conducted study on “Spillover Effect of
Volatility in BSE SENSEX on BSE Sectoral Indices” found
that the quick diffusion of information has led to increasing
free flow of capital from one market to another or within
markets that has led to market integration. Not much attention
has been given on volatility transmission to the sectoral indices
from the major indices that has contributed to find the spillover
effect of volatility in SENSEX on BSE sectoral indices. All
the sectoral indices of BSE have been selected and Spillover
GARCH (1, 1) model has been employed for the current study.
There is volatility transmission from the BSE SENSEX to BSE
Auto, BSE Banker, BSE Consumer Durables, BSE Capital
Goods, BSE FMCG, BSE Healthcare, BSE IT, BSE Metal,
BSE Oil & Gas, BSE Realty and BSE PSU. On the other hand
shocks to the BSE SENSEX do not transmit to the BSE Power
and BSE indices.
Ganatra and Shettigar (2013) conducted study on “Performance
analysis of BSE Power with major Sectors, Index, USD: INR
and Crude Oil”. Bombay Stock Exchange (BSE) and National
Stock Exchange (NSE) are the two nationalized Stock
exchanges of India. Both the stock exchanges of India are in
cut throat competition with each other. The stock market index
is the most important index of all as it measures overall market
sentiment through a set of stocks that are representative of the
market and provides investors information regarding the
average share price in the market. The indices of BSE and
NSE reflect the overall market sentiments that are both
SENSEX and NIFTY have shown up pattern when economy
was good, both slowed down when there was a depression.
Therefore, both the indices can be referred as benchmark
indices of the Indian Economy.
Aggarwal and Manoj (2012) conducted study on “effect of
economic variables of India and USA on the movement of
Indian capital market”. Economic variables like FII, exchange
rate, gold price, fiscal deficit, IIP and inflation are the important
factors which affect the Indian capital market. In addition to
the Indian economic variables, the US economic variables like
interest rate, inflation and GDP also affect the Indian capital
market. There is also a linkage between US capital market
movement and its affect on the Indian capital market. The
monthly data between 1994 to 2011 has been taken to find that
the Nifty 50 index is significantly affected US GDP, S&P index,
gold prices, Indian WPI, its fiscal deficit, IPI and exchange
rate.
Sinha (2012) conducted study on “An Analytical Study of
Performance of Reality Sector in SENSEX”. Objective of the
study was to analyze the performance of the real estate stocks
with the benchmark index SENSEX and also to analyze the
impact of economic indicator on real stock. The Real Estate
sector is a large, huge diversified sector, one with many verticals
such as land, design, construction, development, investment,
lending etc. The study emphasizes on the impact of
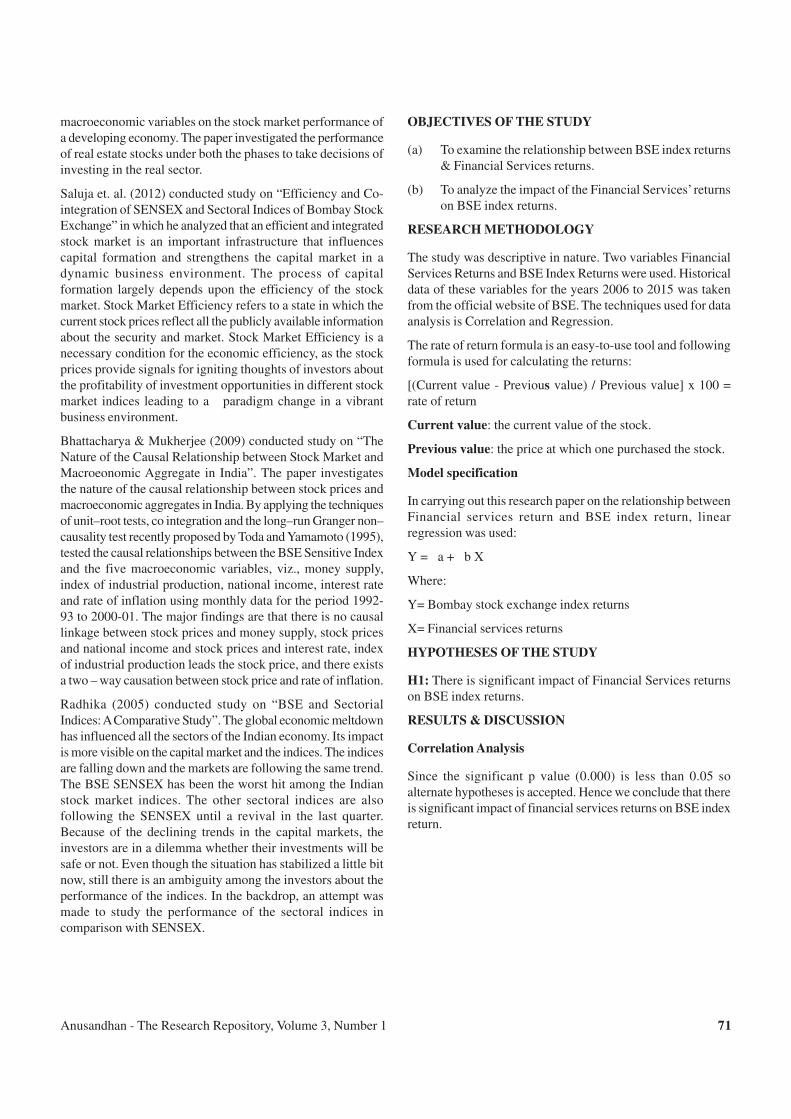
Anusandhan - The Research Repository, Volume 3, Number 1 71
macroeconomic variables on the stock market performance of
a developing economy. The paper investigated the performance
of real estate stocks under both the phases to take decisions of
investing in the real sector.
Saluja et. al. (2012) conducted study on “Efficiency and Co-
integration of SENSEX and Sectoral Indices of Bombay Stock
Exchange” in which he analyzed that an efficient and integrated
stock market is an important infrastructure that influences
capital formation and strengthens the capital market in a
dynamic business environment. The process of capital
formation largely depends upon the efficiency of the stock
market. Stock Market Efficiency refers to a state in which the
current stock prices reflect all the publicly available information
about the security and market. Stock Market Efficiency is a
necessary condition for the economic efficiency, as the stock
prices provide signals for igniting thoughts of investors about
the profitability of investment opportunities in different stock
market indices leading to a paradigm change in a vibrant
business environment.
Bhattacharya & Mukherjee (2009) conducted study on “The
Nature of the Causal Relationship between Stock Market and
Macroeonomic Aggregate in India”. The paper investigates
the nature of the causal relationship between stock prices and
macroeconomic aggregates in India. By applying the techniques
of unit–root tests, co integration and the long–run Granger non–
causality test recently proposed by Toda and Yamamoto (1995),
tested the causal relationships between the BSE Sensitive Index
and the five macroeconomic variables, viz., money supply,
index of industrial production, national income, interest rate
and rate of inflation using monthly data for the period 1992-
93 to 2000-01. The major findings are that there is no causal
linkage between stock prices and money supply, stock prices
and national income and stock prices and interest rate, index
of industrial production leads the stock price, and there exists
a two – way causation between stock price and rate of inflation.
Radhika (2005) conducted study on “BSE and Sectorial
Indices: A Comparative Study”. The global economic meltdown
has influenced all the sectors of the Indian economy. Its impact
is more visible on the capital market and the indices. The indices
are falling down and the markets are following the same trend.
The BSE SENSEX has been the worst hit among the Indian
stock market indices. The other sectoral indices are also
following the SENSEX until a revival in the last quarter.
Because of the declining trends in the capital markets, the
investors are in a dilemma whether their investments will be
safe or not. Even though the situation has stabilized a little bit
now, still there is an ambiguity among the investors about the
performance of the indices. In the backdrop, an attempt was
made to study the performance of the sectoral indices in
comparison with SENSEX.
OBJECTIVES OF THE STUDY
(a) To examine the relationship between BSE index returns
& Financial Services returns.
(b) To analyze the impact of the Financial Services’ returns
on BSE index returns.
RESEARCH METHODOLOGY
The study was descriptive in nature. Two variables Financial
Services Returns and BSE Index Returns were used. Historical
data of these variables for the years 2006 to 2015 was taken
from the official website of BSE. The techniques used for data
analysis is Correlation and Regression.
The rate of return formula is an easy-to-use tool and following
formula is used for calculating the returns:
[(Current value - Previous value) / Previous value] x 100 =
rate of return
Current value: the current value of the stock.
Previous value: the price at which one purchased the stock.
Model specification
In carrying out this research paper on the relationship between
Financial services return and BSE index return, linear
regression was used:
Y = a + b X
Where:
Y= Bombay stock exchange index returns
X= Financial services returns
HYPOTHESES OF THE STUDY
H1: There is significant impact of Financial Services returns
on BSE index returns.
RESULTS & DISCUSSION
Correlation Analysis
Since the significant p value (0.000) is less than 0.05 so
alternate hypotheses is accepted. Hence we conclude that there
is significant impact of financial services returns on BSE index
return.
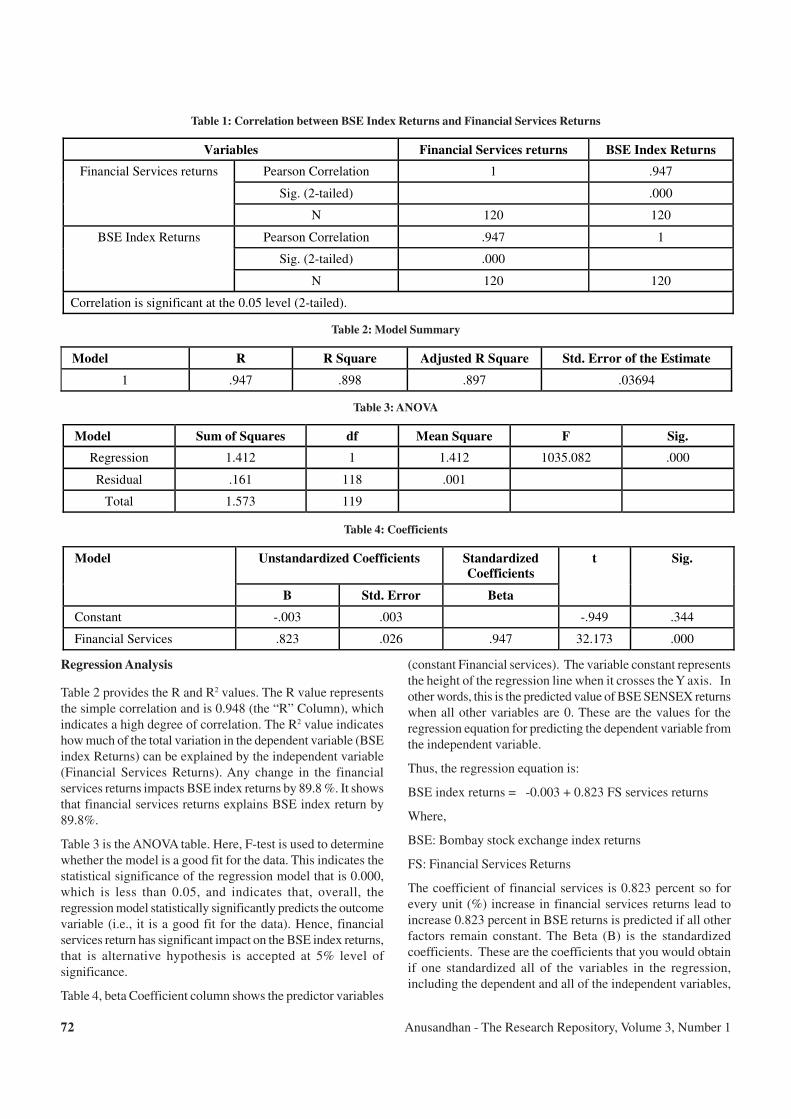
Anusandhan - The Research Repository, Volume 3, Number 172
Table 1: Correlation between BSE Index Returns and Financial Services Returns
Variables Financial Services returns BSE Index Returns
Pearson Correlation 1 .947
Sig. (2-tailed) .000
Financial Services returns
N 120 120
Pearson Correlation .947 1
Sig. (2-tailed) .000
BSE Index Returns
N 120 120
Correlation is significant at the 0.05 level (2-tailed).
Table 2: Model Summary
Model R R Square Adjusted R Square Std. Error of the Estimate
1 .947 .898 .897 .03694
Table 3: ANOVA
Model Sum of Squares df Mean Square F Sig.
Regression 1.412 1 1.412 1035.082 .000
Residual .161 118 .001
Total 1.573 119
Table 4: Coefficients
Unstandardized Coefficients Standardized
Coefficients
Model
B Std. Error Beta
t Sig.
Constant -.003 .003 -.949 .344
Financial Services .823 .026 .947 32.173 .000
Regression Analysis
Table 2 provides the R and R2 values. The R value represents
the simple correlation and is 0.948 (the “R” Column), which
indicates a high degree of correlation. The R2 value indicates
how much of the total variation in the dependent variable (BSE
index Returns) can be explained by the independent variable
(Financial Services Returns). Any change in the financial
services returns impacts BSE index returns by 89.8 %. It shows
that financial services returns explains BSE index return by
89.8%.
Table 3 is the ANOVA table. Here, F-test is used to determine
whether the model is a good fit for the data. This indicates the
statistical significance of the regression model that is 0.000,
which is less than 0.05, and indicates that, overall, the
regression model statistically significantly predicts the outcome
variable (i.e., it is a good fit for the data). Hence, financial
services return has significant impact on the BSE index returns,
that is alternative hypothesis is accepted at 5% level of
significance.
Table 4, beta Coefficient column shows the predictor variables
(constant Financial services). The variable constant represents
the height of the regression line when it crosses the Y axis. In
other words, this is the predicted value of BSE SENSEX returns
when all other variables are 0. These are the values for the
regression equation for predicting the dependent variable from
the independent variable.
Thus, the regression equation is:
BSE index returns = -0.003 + 0.823 FS services returns
Where,
BSE: Bombay stock exchange index returns
FS: Financial Services Returns
The coefficient of financial services is 0.823 percent so for
every unit (%) increase in financial services returns lead to
increase 0.823 percent in BSE returns is predicted if all other
factors remain constant. The Beta (B) is the standardized
coefficients. These are the coefficients that you would obtain
if one standardized all of the variables in the regression,
including the dependent and all of the independent variables,

Anusandhan - The Research Repository, Volume 3, Number 1 73
and ran the regression. By standardizing the variables before
running the regression, one has to put all the variables on the
same scale, and then compare the magnitude of the coefficients
to see which one has higher effect. The larger betas are
associated with the larger t-values and lower p-values. There
are t-statistics and their associated 2-tailed p-values used in
testing to check whether a given coefficient is significantly
different from zero. The coefficient for Financial services
returns (0.823) is significant because its p-value is 0.000 which
is smaller than 0.05.
Since p value indicates the statistical significance of the
regression model of 0.000, which is less than 0.05, and indicates
that, overall, the regression model statistically significantly
predicts the outcome variable. Therefore, there is a significant
impact of financial services return on BSE index return.
CONCLUSION
Following conclusion can be drawn from the study:
(a) There is a direct positive relationship between BSE index
returns and financial services returns as the value of R
and R Square is respectively 0.947 and 0.898.
(b) Any changes in the financial services returns impacts
BSE index returns by 89.8 %.
(c) There exists a significant impact of financial services
return on BSE index return. Any change in the financial
services returns, results change in BSE index return.
RECOMMENDATIONS
(a) Prediction of capital markets can be made by analyzing
the prices of stocks which would be helpful for the
investors in decision- making.
(b) Since there is strong correlation between financial
services and BSE returns, so the investors should closely
monitor the BSE in order to gain in the long run.
REFERENCES
1. Aggarwal Priyanka & Kumar Manish (2012) Effect of
Economic Variables of India and USA on the Movement
of Indian Capital Market, Journal of Money, Investment
and Banking, 6, 54-65.
2. Bhattacharya Basabi & Mukherjee Jaydeep (2009) The
Nature Of The Causal Relationship Between Stock Market
And Macroeonomic Aggregate In India, Journal of
Finance, Vol. No. 44 pp.1115-1153.
3. Luthra Manisha and Mahajan Shikha (2014), Impact of
Macro factors on BSE Bankex, Journal of Management
& Commerce, Vol. No. 2(2), pp. 179-186.
4. Nateson, C., Palanisamy, R., Renukadevi, P., Suganya, D.
(2013) Spillover Effect of Volatility in BSE SENSEX on
BSE Servicesal Indices, Pacific Business Review
International Journal, Vol. 3, Issue 1, Jan - March 2013.
5. Saluja,H.S., Totala, N. K., Bapna Ira, Sood Vishal (2013),
Efficiency and Co-integration of SENSEX and Sectoral
Indices of Bombay Stock Exchange, Journal of
Management & Commerce Vol. No. 2(2), pp. 120-135.
6. Vashistha, D.S., Singh Umed, Kumar Rajesh (2013) A
Study Of Relationship between S&P BSE-SENSEX And
Economic Growth Rates, Journal of Marketing, Financial
Services & Management Research, Vol.2, No. 7, July
(2013).
7. Venkataramanaiah M.(2015), Market Performance of the
BSE with Reference to Market Capitalization, Pacific
Business Review International Journal, Vol. 5 Issue 2.

Anusandhan - The Research Repository, Volume 3, Number 174
CONSUMER ETHNOCENTRISM OF CONSUMER PERCEPTION IN INDIA
WITH SPECIAL REFERENCE TO COSMETIC INDUSTRY
Shuchi Singhania1
Neha Aggarwal2
ABSTRACT
The purpose of this paper is to analyse the influence of consumer ethnocentrism and its antecedents-patriotism on domestic and
foreign buying behaviour in the emerging economy of India. All the consumers are not equally ethnocentric. Consumers differ
in their ethnocentrism due to a variety of socio-psychological and demographic factors. This study presented demographic
factors and described the relationship between the sample and population in terms of characteristics. The study also explains
the relationship between consumer ethnocentric tendency and preference for foreign products in India and the impact of
demographic variables (age, occupation, education level, Income level) on consumer ethnocentric tendency. The study concludes
that there is a negative relationship between consumer ethnocentric tendency and preference for foreign products in India and
no impact of age, occupation, educational level and Income level on consumer ethnocentric tendency.
Keywords: Antecedents, Consumer Ethnocentrism, Demographic Factors, Patriotism, Socio-psychological Factors.
1 Assistant Professor, Gitarattan International Business School, Email: [email protected] Student, Gitarattan International Business School, Email: [email protected]
INTRODUCTION
Global cosmetics market is expected to garner $429.8 billion
by 2022, registering a CAGR of 4.3% during the forecast period
2016 - 2022. Cosmetics Market (makeup or beauty products)
are mixture of chemical generally used to enhance the
appearance or odour of the human body. Sun care, skin care,
hair care, deodorants, makeup and colour cosmetics, and
fragrances are some of the cosmetics products that are
predominantly available and used by individuals. Retail stores
including supermarkets, exclusive brand outlets, and specialty
stores amongst others are the major distribution channels, with
online channels gaining popularity among consumers.
There is a considerable rise in disposable incomes over the
past decade. The growth in global economies, changing
lifestyles, rising demands of skin and sun care products due to
varying climatic conditions encourages the growth of the
market for cosmetics.
Rising demand for natural, herbal and organic beauty products
creates potential opportunities for manufacturers to innovate
and develop new products in accordance to consumer
preferences.
Global cosmetics market is segmented based on category of
cosmetics, mode of sale, gender and geography.
The category segment includes skin & sun care products, hair
care products, deodorants, makeup & colour cosmetics and
fragrances.
Improvement in the current lifestyles of the individuals is
majorly affecting the cosmetics market. Consumers have now
become more conscious regarding the usage of cosmetics in
their daily life in an effort to step up their style quotient and
overall personality.
During recession 2007-2009, there was an overall global rise
in GDP and economies across various regions. Presently,
increasing GDPs of various countries is positively affecting
the global cosmetics market.
Presently, manufacturers are focusing on developing new
products and innovating on the use of different ingredients in
cosmetic products. In order to sustain and maintain their market
position, manufacturers are adopting various strategies.
The cosmetic industry in India is growing at a break-neck pace,
almost twice as fast as that of the markets in the United States
and Europe. According to recent research, the overall Indian
beauty and cosmetic market is currently pegged at INR 60
billion and is expected to reach INR 170 billion by 2020;
growing at the rate of 15-20% per annum.
The prospects of the Indian beauty industry look bright, with
the colour cosmetics segment predicted to continue its
dominance over the market landscape. Valued at INR 3.8
billion, the colour cosmetics market accounts for 90% of the
cosmetics market share.Especially with the advent of low and
medium priced cosmetic goods that are high on quality, the
colour cosmetics market is expected to bring in substantial
revenue in the coming years.
Because of patriotic and sympathetic feelings towards their
fellow men and artefacts, consumers with ethnocentrism tend
to emphasise positive aspects of their own country’s products
and discount virtues of foreign products. Less ethnocentric

Anusandhan - The Research Repository, Volume 3, Number 1 75
consumers, on the other hand, tend to rely more on objective
product attributes and, hence, do not tend to be inherently
biased against imported products.
A number of socio-psychological factors (such as patriotism,
conservatism, collectivism, cultural openness, animosity and
world-mindedness) and demographic factors (such as gender,
age, education and income) act as antecedents to consumer
ethnocentrism. Knowledge of ethnocentric tendency present
among consumers and variations therein across different types
of consumers can be helpful to the international marketers in
identifying market segments relevant to their products and
evolving marketing strategies as appropriate for the selected
segments.
LITERATURE REVIEW
Torres & Gutiérrez (2007) explained that in times of
globalization, when products are designed in one country,
manufactured in another and assembled in another one,
consumers are confused and often struggle to identify or
recognize domestic products.
Lee & Simon (2006) suggested that the attitudes of consumers
towards country of origin and corporate image exert a great
deal of influence on their perceptions of product quality and
purchase behaviour moderated by socio-economic and national
cultural characteristics.
Kyanak & Kara (2002) found that Turkish consumers had
significantly different perceptions of products attributes for
the products coming from countries of different levels of socio
economic and technological development. Also results of the
study revealed that there were several lifestyle dimensions
apparent among the Turkish consumers, which were closely
correlated to ethnocentric biases.
Bamber, Phadke and Jyothishi (2012) explored four
components with reference to an average consumer group in
the under-researched market of India. The concept of consumer
ethnocentrism may improve our understanding of consumer
behaviour and this indicates why certain segments of consumers
prefer domestic goods, whereas others do not discriminate
between domestic and imported products.
Shimp and Sharma (1987) explained more ethnocentric
consumer tends to prefer home made products, based on
morality they attach to the purchase of foreign made ones.
Consumers may prefer foreign brands because of association
of higher prestige.
Khairul Anuar Mohammad Shah and Hazril Izwar Ibrahim
(2012) attempts to explore and examine the effects of several
demographic variables, i.e., gender, age, education level,
income level and geographical region on the ethnocentric
tendencies among Malaysian consumers.
Akshay Pai R, Anupama Sundar (2014) investigated the impact
of Consumer Animosity and Consumer Ethnocentrism on
Repurchase Intent and identified a significant and positive
relation between Consumer Ethnocentrism and Consumer
Animosity
Wanninayake W.M.C.Bandara noted that consumer
characteristics such as quality consciousness, brand
consciousness, and confused by over choice do not have
material impact on the ethnocentric feelings and local brand
preferences of Czech customers.
John E. Spillan and Talha Harcar (2013) tested the validity of
ethnocentrism subscales model in Vietnam and India. Their
goal was to collaborate and the current literature by testing
there liability and validity of the CETSCALE in both India
and Vietnam.
Silili, E.P., Karunarathna, A.C. (2014) identified the impact of
consumer ethnocentrism on Sri Lankan youngsters’ purchase
intention of domestic products.
Sproles & Kendall (1986) observed that brands that supply
stylish packages of features can attract loyal consumers who
are fashion conscious. Fashion leaders or followers usually
purchase or continue repeatedly to purchase their products in
stores that are highly fashionable. They gain satisfaction from
using the latest brands and designs which also satisfies the
consumer’s ego.
Duff (2007) argued that design or visual appearance is the
important part of the product, which includes line, shape and
details affecting consumer perception towards a brand. Also,
results of the study revealed that there were several lifestyle
dimensions apparent among the Turkish consumers, which were
closely correlated with their ethnocentric biases.
Lee J. K. & Lee (2009) explained that consumers evaluate
goods from developing countries unfairly because of the
previous beliefs of people; therefore, developing countries have
a problem with this issue and face unjust evaluation. Studies
have also shown that this effect differs among people similar
to brand, guarantee and price, which contrasts to other tangible
characteristics. In addition, buyers use country of origin as an
indicator of a product’s quality.
OBJECTIVES OF THE STUDY
(a) To examine the relationship between consumer
ethnocentric tendency and preference for foreign
products in India.
(b) To identify the impact of demographic variable (age,
occupation, education level, Income level) on consumer
ethnocentric tendency and preference for foreign product
in India.
REASEARCH METHODOLOGY
(a) Primary Data: The primary data was collected with the
help of a structured questionnaire consisting of 19
statements on a five point likert scale. The questionnaire
was filled by 105 respondents and reliability was checked
with Cronbach Alpha. Composition of the sample
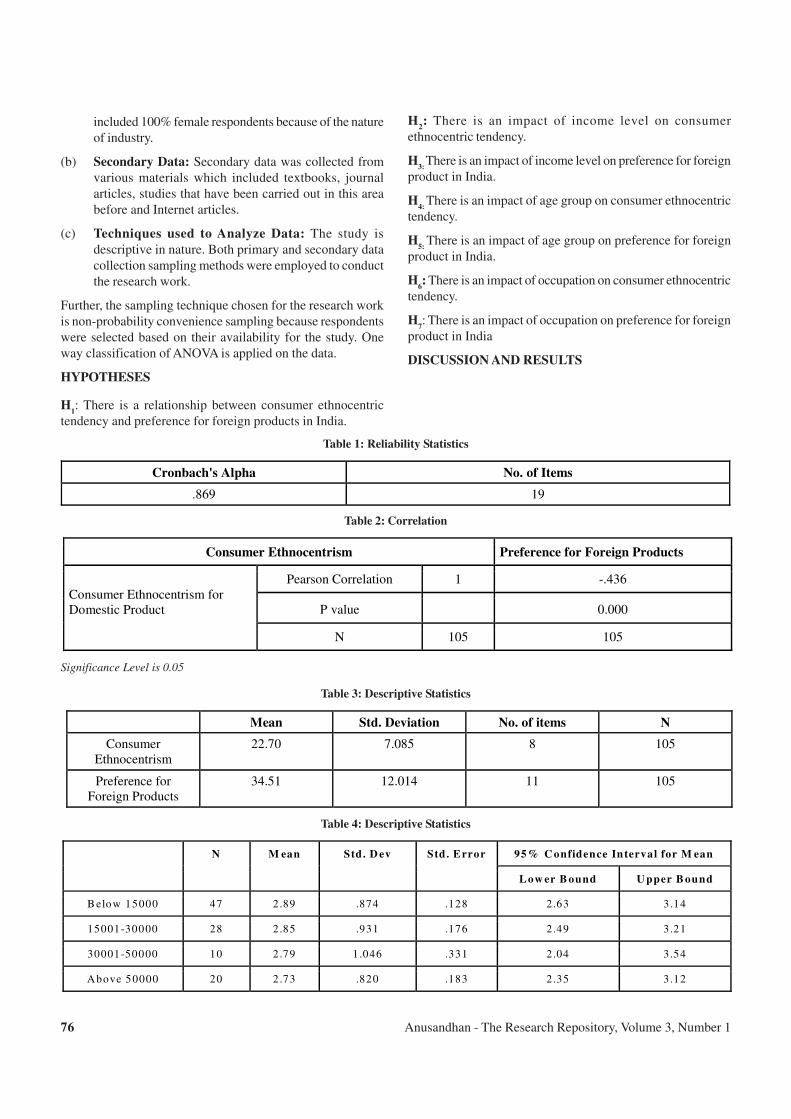
Anusandhan - The Research Repository, Volume 3, Number 176
included 100% female respondents because of the nature
of industry.
(b) Secondary Data: Secondary data was collected from
various materials which included textbooks, journal
articles, studies that have been carried out in this area
before and Internet articles.
(c) Techniques used to Analyze Data: The study is
descriptive in nature. Both primary and secondary data
collection sampling methods were employed to conduct
the research work.
Further, the sampling technique chosen for the research work
is non-probability convenience sampling because respondents
were selected based on their availability for the study. One
way classification of ANOVA is applied on the data.
HYPOTHESES
H1: There is a relationship between consumer ethnocentric
tendency and preference for foreign products in India.
H2: There is an impact of income level on consumer
ethnocentric tendency.
H3:
There is an impact of income level on preference for foreign
product in India.
H4:
There is an impact of age group on consumer ethnocentric
tendency.
H5:
There is an impact of age group on preference for foreign
product in India.
H6: There is an impact of occupation on consumer ethnocentric
tendency.
H7: There is an impact of occupation on preference for foreign
product in India
DISCUSSION AND RESULTS
Table 1: Reliability Statistics
Cronbach's Alpha No. of Items
.869 19
Table 2: Correlation
Consumer Ethnocentrism Preference for Foreign Products
Pearson Correlation 1 -.436
P value 0.000
Consumer Ethnocentrism for Domestic Product�
N 105 105
Significance Level is 0.05
Table 3: Descriptive Statistics
Mean Std. Deviation No. of items N
Consumer Ethnocentrism
22.70 7.085 8 105
Preference for Foreign Products
34.51 12.014 11 105
Table 4: Descriptive Statistics
95% C onfidence In terval for M ean � N M ean Std. D ev Std. Error
Low er B ound U pper B ound
B elow 15000 47 2 .89 .874 .128 2 .63 3 .14
15001-30000 28 2 .85 .931 .176 2 .49 3 .21
30001-50000 10 2 .79 1 .046 .331 2 .04 3 .54
A bove 50000 20 2 .73 .820 .183 2 .35 3 .12
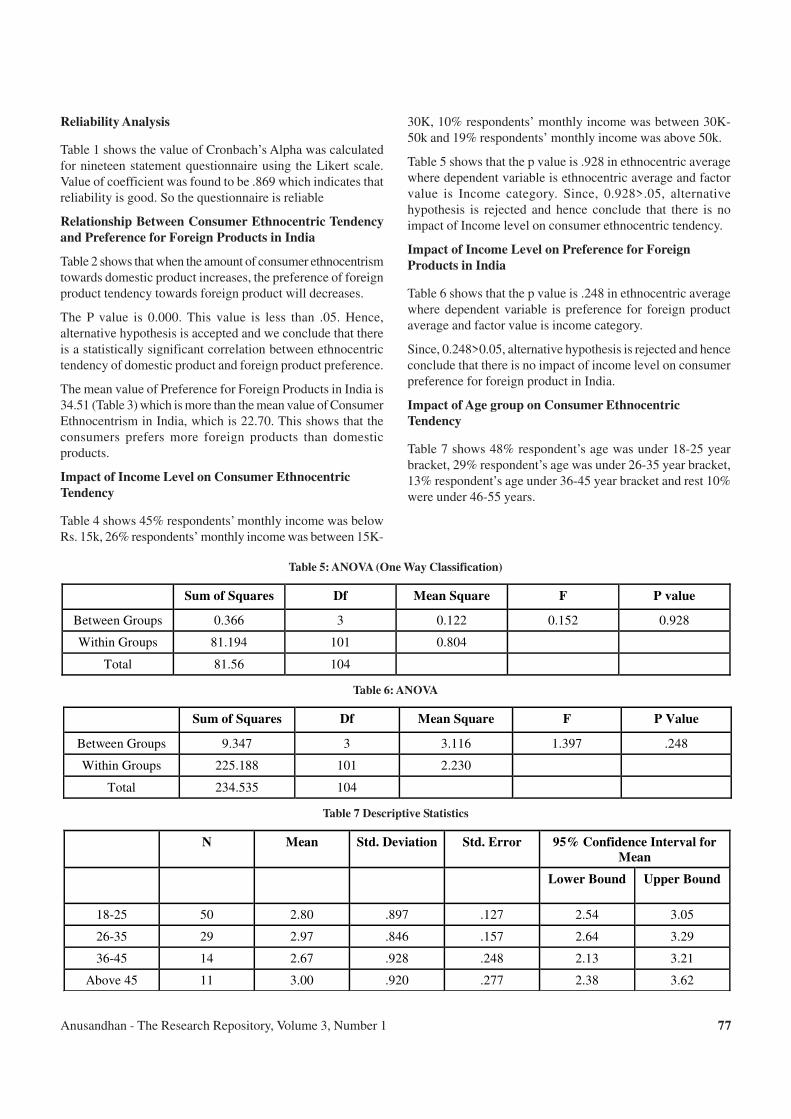
Anusandhan - The Research Repository, Volume 3, Number 1 77
Reliability Analysis
Table 1 shows the value of Cronbach’s Alpha was calculated
for nineteen statement questionnaire using the Likert scale.
Value of coefficient was found to be .869 which indicates that
reliability is good. So the questionnaire is reliable
Relationship Between Consumer Ethnocentric Tendency
and Preference for Foreign Products in India
Table 2 shows that when the amount of consumer ethnocentrism
towards domestic product increases, the preference of foreign
product tendency towards foreign product will decreases.
The P value is 0.000. This value is less than .05. Hence,
alternative hypothesis is accepted and we conclude that there
is a statistically significant correlation between ethnocentric
tendency of domestic product and foreign product preference.
The mean value of Preference for Foreign Products in India is
34.51 (Table 3) which is more than the mean value of Consumer
Ethnocentrism in India, which is 22.70. This shows that the
consumers prefers more foreign products than domestic
products.
Impact of Income Level on Consumer Ethnocentric
Tendency
Table 4 shows 45% respondents’ monthly income was below
Rs. 15k, 26% respondents’ monthly income was between 15K-
30K, 10% respondents’ monthly income was between 30K-
50k and 19% respondents’ monthly income was above 50k.
Table 5 shows that the p value is .928 in ethnocentric average
where dependent variable is ethnocentric average and factor
value is Income category. Since, 0.928>.05, alternative
hypothesis is rejected and hence conclude that there is no
impact of Income level on consumer ethnocentric tendency.
Impact of Income Level on Preference for Foreign
Products in India
Table 6 shows that the p value is .248 in ethnocentric average
where dependent variable is preference for foreign product
average and factor value is income category.
Since, 0.248>0.05, alternative hypothesis is rejected and hence
conclude that there is no impact of income level on consumer
preference for foreign product in India.
Impact of Age group on Consumer Ethnocentric
Tendency
Table 7 shows 48% respondent’s age was under 18-25 year
bracket, 29% respondent’s age was under 26-35 year bracket,
13% respondent’s age under 36-45 year bracket and rest 10%
were under 46-55 years.
Table 5: ANOVA (One Way Classification)
Sum of Squares Df Mean Square F P value
Between Groups 0.366 3 0.122 0.152 0.928
Within Groups 81.194 101 0.804
Total 81.56 104
Table 6: ANOVA
Sum of Squares Df Mean Square F P Value
Between Groups 9.347 3 3.116 1.397 .248
Within Groups 225.188 101 2.230
Total 234.535 104
Table 7 Descriptive Statistics
N Mean Std. Deviation Std. Error 95% Confidence Interval for
Mean
� Lower Bound Upper Bound
18-25 50 2.80 .897 .127 2.54 3.05
26-35 29 2.97 .846 .157 2.64 3.29
36-45 14 2.67 .928 .248 2.13 3.21
Above 45 11 3.00 .920 .277 2.38 3.62

Anusandhan - The Research Repository, Volume 3, Number 178
Table 8: ANOVA
Table 9: ANOVA
Sum of Squares Df Mean Square F P value
Between Groups 2.238 3 .746 .322 .809
Within Groups 231.406 100 2.314
Total 233.644 103
Table 10: Descriptive Statistics
N Mean Std.
Deviation
Std.
Error
95% Confidence Interval for Mean
� Lower Bound Upper Bound
Businesswomen 15 2.83 .764 .197 2.40 3.25
Teacher 17 2.84 .943 .229 2.35 3.32
Doctor 14 2.68 .843 .225 2.19 3.17
Student 18 2.60 .641 .151 2.28 2.92
Housewives 16 3.29 .987 .247 2.76 3.82
Table 11: ANOVA
Sum of Squares df Mean Square F P Value
Between Groups 4.665 5 .933 1.201 .314
Within Groups 76.895 99 .777
Total 81.560 104
Table 8 shows that the p value is .672 ethnocentric average
(dependent variable) Since, 0.672>0.05, alternative hypothesis
is rejected and hence conclude that there is no impact of age
group on consumer ethnocentric tendency.
Impact of Age Group on Preference for Foreign Product
in India
Table 9 shows that the p value is .809 in ethnocentric average
where dependent variable is Preference of foreign brand
average and factor value is age group.
Since, .809 >0.05, alternative hypothesis is rejected and hence
conclude that there is no impact of age group on consumer
preference for foreign product in India.
Impact of Occupation on Consumer Ethnocentric Tendency
Table 10 shows 14% respondents’ were businesswomen, 15%
respondents’ were teachers, 14% respondents’ were doctors,
13% respondents’ were students and 15% respondents’ were
housewives.
Table 11 shows that the p value is .314 in ethnocentric average
(dependent variable) and factor value is occupation.
Since, 0.314>0.05, alternative hypothesis is rejected and hence
conclude that there is no impact of occupation on Consumer
ethnocentric tendency.
Impact of Occupation on Consumer Preference for Foreign
Product in India
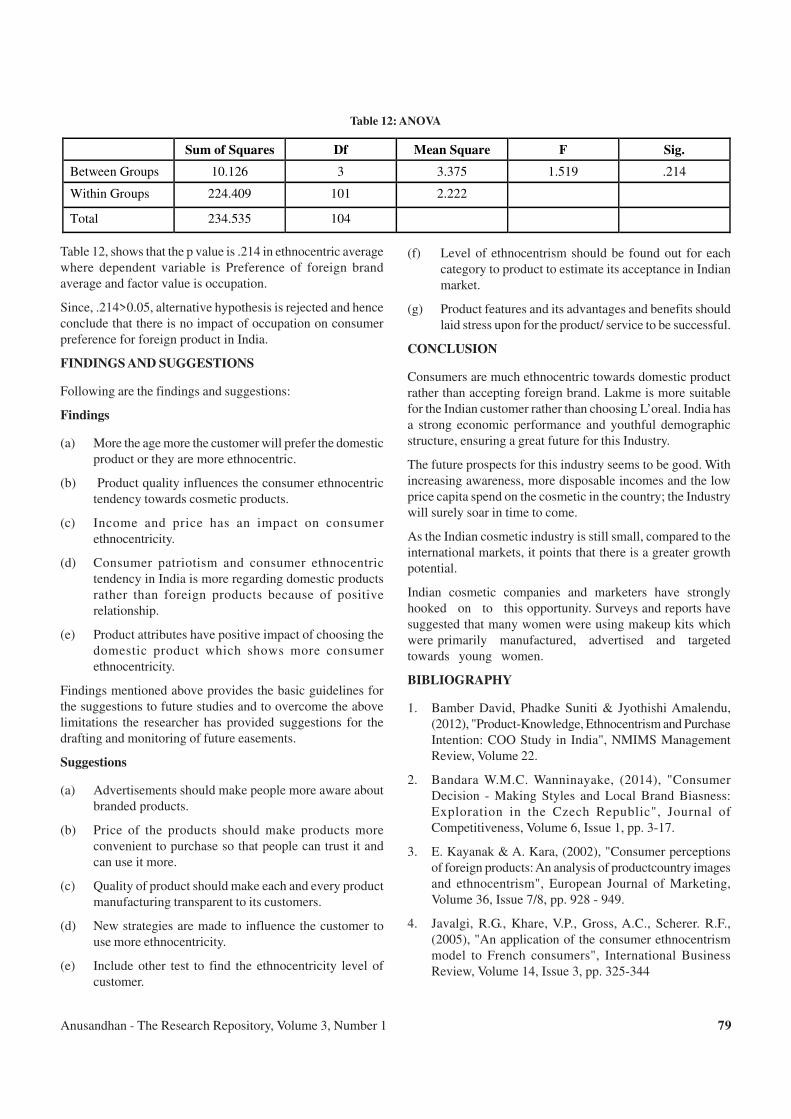
Anusandhan - The Research Repository, Volume 3, Number 1 79
Table 12: ANOVA
Sum of Squares Df Mean Square F Sig.
Between Groups 10.126 3 3.375 1.519 .214
Within Groups 224.409 101 2.222
Total 234.535 104
Table 12, shows that the p value is .214 in ethnocentric average
where dependent variable is Preference of foreign brand
average and factor value is occupation.
Since, .214>0.05, alternative hypothesis is rejected and hence
conclude that there is no impact of occupation on consumer
preference for foreign product in India.
FINDINGS AND SUGGESTIONS
Following are the findings and suggestions:
Findings
(a) More the age more the customer will prefer the domestic
product or they are more ethnocentric.
(b) Product quality influences the consumer ethnocentric
tendency towards cosmetic products.
(c) Income and price has an impact on consumer
ethnocentricity.
(d) Consumer patriotism and consumer ethnocentric
tendency in India is more regarding domestic products
rather than foreign products because of positive
relationship.
(e) Product attributes have positive impact of choosing the
domestic product which shows more consumer
ethnocentricity.
Findings mentioned above provides the basic guidelines for
the suggestions to future studies and to overcome the above
limitations the researcher has provided suggestions for the
drafting and monitoring of future easements.
Suggestions
(a) Advertisements should make people more aware about
branded products.
(b) Price of the products should make products more
convenient to purchase so that people can trust it and
can use it more.
(c) Quality of product should make each and every product
manufacturing transparent to its customers.
(d) New strategies are made to influence the customer to
use more ethnocentricity.
(e) Include other test to find the ethnocentricity level of
customer.
(f) Level of ethnocentrism should be found out for each
category to product to estimate its acceptance in Indian
market.
(g) Product features and its advantages and benefits should
laid stress upon for the product/ service to be successful.
CONCLUSION
Consumers are much ethnocentric towards domestic product
rather than accepting foreign brand. Lakme is more suitable
for the Indian customer rather than choosing L’oreal. India has
a strong economic performance and youthful demographic
structure, ensuring a great future for this Industry.
The future prospects for this industry seems to be good. With
increasing awareness, more disposable incomes and the low
price capita spend on the cosmetic in the country; the Industry
will surely soar in time to come.
As the Indian cosmetic industry is still small, compared to the
international markets, it points that there is a greater growth
potential.
Indian cosmetic companies and marketers have strongly
hooked on to this opportunity. Surveys and reports have
suggested that many women were using makeup kits which
were primarily manufactured, advertised and targeted
towards young women.
BIBLIOGRAPHY
1. Bamber David, Phadke Suniti & Jyothishi Amalendu,
(2012), "Product-Knowledge, Ethnocentrism and Purchase
Intention: COO Study in India", NMIMS Management
Review, Volume 22.
2. Bandara W.M.C. Wanninayake, (2014), "Consumer
Decision - Making Styles and Local Brand Biasness:
Exploration in the Czech Republic", Journal of
Competitiveness, Volume 6, Issue 1, pp. 3-17.
3. E. Kayanak & A. Kara, (2002), "Consumer perceptions
of foreign products: An analysis of productcountry images
and ethnocentrism", European Journal of Marketing,
Volume 36, Issue 7/8, pp. 928 - 949.
4. Javalgi, R.G., Khare, V.P., Gross, A.C., Scherer. R.F.,
(2005), "An application of the consumer ethnocentrism
model to French consumers", International Business
Review, Volume 14, Issue 3, pp. 325-344

Anusandhan - The Research Repository, Volume 3, Number 180
5. Jiménez Torres & San Martín Gutiérrez, (2007), "The
purchase of foreign products: the role of firm's country-
of-origin reputation, consumer ethnocentrism, animosity
and trust", Research Gate Journal.
6. Jin, Z., Chansarkar, B., Kondap, N.M., (2006), "Brand
origin in an emerging market: perceptions of Indian
consumers", Asia Pacific Journal of Marketing and
Logistics, Volume 18, Issue 4, pp. 283-302.
7. JungWan Lee, Simon Tai, (2006) "Consumers' perceptions
on quality of products influenced by multinational firms
and by country of origin effects", International Journal of
Emerging Markets, Volume 1, Issue 3, pp. 212 - 22.
8. Kinra, N., (2006), "The effect of country of origin on
foreign brand names in the Indian market", Marketing
Intelligence and Planning, Volume 24, Issue 1, pp.15-30.
9. Klein, J.G. and Ettenson R, (1999), "Consumer animosity
and consumer ethnocentrism: An analysis of unique
antecedent", Journal of International Consumer Marketing,
Volume 11, Issue 4, pp. 5-24.
10. Pai R Akshay & Sundar Anupama, (2014), "Effects of
Consumer Ethnocentrism and Consumer Animosity on the
Re-Purchase Intent", International Journal of Management
& Business Studies, Volume 4, Issue 4.
11. Shah Mohammad K. A. & Ibrahim Izwar, (2012),
"Consumer Ethnocentrism: Does it really matter for
Malaysian Consumers", West East Journal of Social
Sciences, Volume 1.
12. Shimp Terence & Sharma Subhash, (1987), "Consumer
Ethnocentrism: Construction and Validation of the
CETSCALE", Journal of Marketing Research, Volume 24.
13. Sililli, E.P., Karunarthna, A.C., (2014) "Consumer
Ethnocentrism: Tendency of Sri Lankan Youngsters",
Global Journal of Emerging Trends in e Business,
Marketing and Consumer Psychology, Volume 1, Issue 1
14. Spillan E. John & Harcar Talha, (2013), "A Comparative
Study of Patriotism, Protectionism, Social, Economic
Conservatism between Indian and Vietnamese Consumers:
The Effects of these Constructs on Buying Inclinations",
Eurasian Journal of Business and Economics, Volume 6,
Issue 12, Pp. 1-26.

Anusandhan - The Research Repository, Volume 3, Number 1 81
IMPACT OF MATERNITY BENEFITS ON JOB SATISFACTION IN
PRIVATE HEALTH CARE SECTOR IN DELHI
Anup Kumar Ghosh1
Ms. Mona Chanchal2
ABSTRACT
The population of working mothers is increasing gradually in different industries. A female worker requires differential working
conditions and benefits after becoming a mother. The Maternity Benefit Act was enacted in 1961 and in these 55 years India has
observed a vast change in its industrial scenario where private players showed their efficiency towards economic development
of the country. Demographic profile of the industrial workforce has also changed a lot with women workers presence in almost
all sectors. But still there is a high rate of attrition of women employees during and after childbirth. This study has been
conducted to assess the impact of working conditions and benefits available to the mothers working in healthcare industry at
Delhi-NCR and thereby on their job satisfaction. The outcome shows that most of the working mothers are not receiving the
benefits as per the Maternity Benefit Act 1961 which creates a high level of Job Dissatisfaction. The maternity benefit has
emerged as one of the prime contributor for job satisfaction of the respondents along with other variables.
Keywords: Healthcare Industry, Job Satisfaction, Maternity Benefit Act 1961, Maternity Leave, Working Mother.
1 Professor, Gitarattan International Business School, Rohini, Delhi2 Student, Gitarattan International Business School, Rohini, Delhi
INTRODUCTION
The republic of India, at its twelfth year, enacted an act to
regulate the employment of women in certain establishments
before and after child-birth and to provide for maternity &
other benefits (Maternity Benefit Act 1961). It was observed
by the law makers that the female employees need a different
employment condition during their period of pregnancy and
without having any specific rules to this regard, they may suffer
from bodily distress to carry out the works which is of arduous
in nature or which involves long hours of standing or which in
any way is likely to interfere with her pregnancy or the normal
development of the fetus, or is likely to cause her miscarriage
or otherwise to adversely affect her health. This point was
considered not only from the individual mother’s health point
of view but from the whole country’s next generation’s health
point of view. It was further identified that after birth, first few
weeks of exclusive breastfeeding is very much important for a
baby to combat malnutrition, diarrhea and other diseases
observed in infants and, thereby, to lower infant mortality rate.
From this viewpoint, Union Govt. of India, through the
enactment of Maternity Benefit Act 1961, made the provision
of 12 weeks paid maternity leave to all the female employees
who have completed their one year service in any type of
organization, whether factory, mines, shops or establishment,
or otherwise, and for all the public, government and private
organizations. The act is very clear at its objective and
modalities. Other than this paid leave, the act also provide
certain provisions for the benefit of the mother and the new-
born like some medical allowance for proper treatment, crèches
with governess, breast feeding free time etc.
After 1961, the industrial demographic scenario has changed
a lot and the country has emerged as one of the fastest growing
developing country. Many multinational companies are now
functioning in the country and the presence of women in
different sectors has increased. After 1991 functioning of
private players in Indian market has galloped. But what are
the present working conditions for the working mothers in the
67th anniversary of the republic or after 55 years of enactment
of Maternity Benefit Act? Are the working mothers satisfied
with their workplace conditions during their period of
pregnancy? Are they treated differently during this period of
pregnancy? Are their employers careful about their sufferings
from bodily distress which may adversely affect their health?
With these research questions, this particular study has been
conducted on the working mothers of private health care sector
in Delhi- NCR to see their job-satisfaction level and how that
job-satisfaction is impacted by maternity benefits alongwith
other related factors.
LITERATURE REVIEW
In India, women are mainly engaged as unskilled labourers in
almost all sectors since British period and they face different
problems at workplace which are serious in nature. The
problems include wage discrimination, gender biasness and
sexual harassment, unhealthy job relationship, lower wages
etc. (Kalpana & Kiran, 2013). These unskilled labourers never
felt any urge to upgrade their skills and their employers are
also equally careless about this issue . In the new millennium,

Anusandhan - The Research Repository, Volume 3, Number 182
this trend has changed and female workers are gradually joined
in skilled and semi-skilled works. But after a certain years of
work, women usually left their job and in few cases they
returned to the workplace after some years. So this question is
obvious that why most of the female employees left their job
place after a considerable period of work? The researchers got
the answer that female employees are leaving organisations
because the industries could not keep up the need of the
changing workforce (Mainiero and Sullivan, 2006). Today’s
workers are very different from the traditional ideal worker:
usually a man who is able to dedicate himself completely to
his job because he has a wife at home taking care of the children
and the household. In 1950, 63 percent of the households were
made up of a male breadwinner who worked outside the home
and a female caregiver who stayed home with the children.
Today only 17 percent of households follow this traditional
model (Benko and Weisberg, 2007). The social system of early
marriage for the women has also been modified a lot and instead
of enjoying marital life women used to go for education
followed by joining the workforce. After a few years of work,
women now-a-days, go for marital life and thereafter due to
improper balance quit the job to continue her post-marital social
life. There is a group of women, who again join the workforce
after several years of their marital life. Obviously there would
be certain reason behind this human resource leakage
(Cabera,2009).
Job satisfaction is the prime decision maker behind any such
decision and has been studied widely by different scholars at
different fields. These studies have found relations between
job satisfaction and different parameters. Although, there are
variety of studies in connection to job satisfaction, this study
confined to review only those researches which are related to
health care sector and on Indian context to frame a theoretical
framework.
Price (1997) defined job satisfaction as the way employees
feel about their jobs and different aspects of their jobs. In other
words, job satisfaction was defined as the degree to which
employees have a positive affective orientation towards
employment by the organization. Job satisfaction is one of the
important variables in work & organizational psychology and
is regarded as an indicator of working-life quality. It is a crucial
variable used to determine the quality of health-care systems.
In healthcare units, workers’ job satisfaction is one of the most
important indicator for determining their performance. Every
healthcare professional is an integral to healthcare service
delivery system. Healthcare organizations require a skilled and
competent workforce today as a result of advancement in
medical technology and the demand for more sophisticated
patient care. The study results showed that job satisfaction
among healthcare professionals is increasingly being
recognized as a measure that should be included in quality
improvement programs. Low job satisfaction resulted in
increased staff turnover and absenteeism, which affects the
efficiency of health services. Every individual has unique needs
and desires to be satisfied, which are related to the behaviour
they exhibit, and these play a significant role in their preferences
in different areas such as their workplace, house etc. Social,
cultural and job factors all influence employees’ behaviour.
Satisfied employees tend to be more productive and committed
to their jobs. Factors contributing to high levels of employee
satisfaction have been identified as: supportive colleagues,
supportive working conditions, mentally challenging work and
equitable rewards. Job satisfaction is important in predicting
systems stability, reduced turnover and worker motivation.
In their study, Cranny, Smith & Stone (1992) observed that the
healthcare sector offer services for primary, secondary and
tertiary care and hence it is very much tough to implement
without the contributions of both the employers and the
employees. They also identified that the healthcare sector is
female worker intensive process as personal caring is a natural
quality of women. Hence the question of workers’ satisfaction
particularly women worker satisfaction largely signifies the
organisation’s success. Their research, measured the
satisfaction level of women employees in workplace and its
impact. The study concluded that to sustain in a competitive
market it is very important to retain good employees that
contribute towards the attainment of organizational goal and
customer satisfaction as well. Without having a highly satisfied
workforce, an organization could not sustain sophisticated
patient care system.
Jain and Kaur (2014) studied the impact of work environment
on job satisfaction of the employees at Jaipur city and observed
that the subjects under study are satisfied with good working
condition, refreshment & recreation facility, health & safety
facility, fun at workplace work environment etc. whereas not
satisfied with workload, overtime, fatigue, stress, boredom,
attitude of supervisor. In the same way, Singh & Verma (2014)
got a positive impact of training & development over employee
satisfaction in their study. Pyngavil & Khatwani (2015) had
seen the impact of HRD climate over Job Satisfaction and also
got a positive co-relation. Senboun and Rashid (2013) got
correlation between health-care workers’ overall job
satisfaction and conflict resolution at work, support from one’s
supervisor & relationship with co-workers. Where as, Mandal
& Anand (2015) received a significant correlation between job
satisfaction and motivational factors of the employees working
in pharmaceutical sector in Delhi but the variation was also
observed in the job satisfaction level for the employees working
at different organisational hierarchy.
Cragg (2004) had done a research study based on the pregnancy
at workplace where the employers experiences of handling
maternity situations had been analysed. The employers face
very real challenges in handling maternity situation in small
and medium sized enterprises. In the study, the employer’s
response was negative towards maternity. All most all the
respondents saw these maternity benefits guiltily and
regretfully.
Chaulagain and Khadka (2005) had done research to measure
the factors influencing job satisfaction among healthcare
Anusandhan - The Research Repository, Volume 3, Number 1 83
professionals at Tilganga Eye Centre. The study has been
framed with a back drop that ‘every individual has unique needs
& desires and those needs to be satisfied, which are related to
the behaviour they exhibit, and these play a significant role in
their preferences in different areas such as their workplace’.
Results from the study demonstrate the job dissatisfaction is
related with hygiene factors which include salaries, quality of
supervision and working conditions. Survey findings indicate
that more than two-third of the respondents were significantly
satisfied with their current responsibility on job.
Fitzenberger et. al. (2013) conducted a research study on return-
to-job of female employees after maternity leave. After giving
birth to a child, return-to-job is a major challenge for the female
employees. Observing extended & prolonged maternity leaves
or never returning to their job after baby’s birth as the most
common features for female employees, the researchers argued
that they should have the right to work part-time during
maternity leaves. The study also discussed work-life balance
of a mother between workplace job and baby care as to whether
these two roles are enriching or depleting each other. And finally
the research concluded that the employment pattern of female
employees after child birth is affected both by the employee
herself and by the employer. The employee used to choose not
to return to her job because of family related reasons or because
of a perceived work-family conflict.
Satpathy and Patnaik (2014) made a comparative study on work
life balance dilemmas faced by nurses working in private and
government hospitals. The analysis is carried out on the basis
of socio economic profile and general perception towards the
personal and professional life. Most of the respondents feel
that they are not able to balance work and personal obligations.
In this direction there is a need for creating conducive
atmosphere by the hospital authorities in such a way that this
problem can be solved. Pietersen (2005), examined the job
satisfaction of nursing staff at a government hospital. The
nursing staff at the hospital was, in general, not clearly satisfied
or dissatisfied. As such, the study could not find any relationship
between their general level of job satisfaction and turnover
rate.
Dustmann and Schönberg (2008) demonstrated the effect of
expansions in maternity leave coverage on children’s long-term
outcomes. An important goal of the expansions in leave
coverage around the world was the welfare of children, and
the expansions were explicitly aimed at increasing the time
mothers spend with their infants after childbirth. This is
motivated by the agreement among psychologists that the first
few months and years in a child’s life are crucial for its future
cognitive and emotional development. And finally there is no
evidence that the expansions improved children’s outcomes,
although they had a strong impact on mother’s labor supply
after childbirth.
Lucas (2012), had done a research to identify common themes
arising from South African female employees’ experience of
returning to work following maternity. There is an increasing
need for organizations that employ and wish to retain highly
qualified women to better understand and accommodate the
way in which professional women integrate motherhood and
career breaks with their working lives. Women who have
become mothers can still bring experience and a variety of
invaluable skills to the organization, and companies that value
these women and are willing to accommodate them will reap
the rewards. The results of that study revealed that, despite
viewing work positively, the participants found that returning
to work after childbirth was difficult.
Benjamin’s (2010) research study was based on the impact of
fringe benefits on job satisfaction. First, fringe benefits stand
as an important component of worker compensation. The
theoretical impact of fringe benefits on job satisfaction is not
immediately clear. Second, fringe benefits can act as substitutes
for wages. The impact of a particular fringe benefit on job
satisfaction can be misleading if the worker has unmeasured
individual specific determinants of job satisfaction. Finally,
the estimated coefficients on fringe benefits in job satisfaction
estimations exhibit interesting differences between that of
married and single workers. Overall, fringe benefits play a
significant role in determining employee job satisfaction.
Ho et. Al. (2012), investigated the relationship between work
values, job involvement and organizational commitment of
nurses from Taiwan. This study focused on three specific
determinants of work commitment: work values, job
involvement and organizational commitment. Work values are
a particularly important work commitment construct, as they
play a key role in influencing an employee’s affective responses
in the workplace. Subsequent analyses in that study revealed
that job involvement could play an important role in mediation,
and that establishing a higher level of job involvement may be
more important than focusing only on organizational
commitment. The degree of organizational commitment has
not been shown to be related to the actual amount of nursing
work or labor intensity required in any nursing care
environment.
Lambrou and Kontodimopoulos (2010), studied to investigate
how medical and nursing staff of the Nicosia General Hospital
is affected by specific motivation factors, and the association
between job satisfaction and motivation. Study showed that
motivation was influenced by both financial and non-financial
incentives. The main motivating factors for the health workers
in this public hospital sample were appreciation by managers
and colleagues, a stable job/income and training. The main
discouraging factors were related to low salaries and difficult
working conditions.
Eswari and Palanivelu (2001) studied job satisfaction among
hospital nurses in Coimbatore. Study aimed to find out the job
satisfaction of the women nurses and the relationship between
the socio economic conditions and job satisfaction of women
nurses in Coimbatore city. Result of this study showed that
there are many factors that contribute to dissatisfaction in the
work place. Particular variable within each factor which are

Anusandhan - The Research Repository, Volume 3, Number 184
generating satisfaction in an individual is difficult task.
Recognition of frustrations, such as turnover, lack of internal
empowerment, burnout, and elimination of external sources
of stress can decrease satisfaction in the nursing care setting.
Rossins (2010) studied the effects of maternity leave on
children’s birth and infant health outcomes in the United States.
This paper evaluated the impacts of unpaid maternity leave
provisions of the 1993 Family and Medical Leave Act (FMLA)
on children’s birth and infant health outcomes in the United
States. The study found that maternity leave led to small
increases in birth weight, decreases in the likelihood of a
premature birth, and substantial decreases in infant mortality
for children of college-educated and married mothers, who
were most able to take advantage of unpaid leave.
The research study on employee satisfaction by Sinha (2013)
identified five factors namely Empowerment & Work
Environment, Working Relation, Salary & Future prospects,
Training & work Involvement and Job Rotation. But the study
could not find any strong relationship amongst these factors.
On the other hand, the quantity and quality of time a mother
spends with her child in his first year of life matter for the
child’s well-being (Al-Hussami, 2008).
From these research studies it has been observed that the quality
of healthcare service depends on the level of workers’ job
satisfaction. And job satisfaction depends upon different
psychological factors of the workers. Different researchers have
done their surveys with different organizations from different
angles. But in this study the researchers found that no such
attempt has been carried out to relate job satisfaction of the
mothers working in private healthcare sector with maternity
benefits. Therefore, the aim of this study to assess job
satisfaction levels of the mothers working at health-care
industry at Delhi-NCR in relation to maternity benefits is very
much relevant and time perfect.
OBJECTIVE OF THE STUDY
From the literature it is clear that job-satisfaction of the workers
is one of the most decisive factors for the health-care industry
to perform in the competitive edge. Different researches
identified different factors which have impact over job
satisfaction. This research was planned to study the impact of
maternity benefits on job satisfaction of the working mothers
along with other variables like working condition, work life
balance, job involvement etc. Further, the study also tries to
verify the extent to which maternity benefits are available to
the women workers to fulfil their need and desire during
pregnancy in the light of Maternity Benefit Act, 1961.
HYPOTHESES
On the basis of the above objective, following hypotheses have
been developed:
H1: There is significant relationship between Job Satisfaction
and Working Condition.
H2: There is significant relationship between Job Satisfaction
and Maternity Benefit.
H3: There is significant relationship between Job Satisfaction
and Work Life Balance.
H4: There is significant relationship between Job Satisfaction
and Job Involvement.
H5: There is significant relationship between Job Satisfaction
and Facilities.
RESEARCH METHODOLOGY
Sampling: For this study 130 working mothers, who are entitled
for maternity benefits as per the act, have been chosen from
different private healthcare organizations to collect data through
purposive sampling technique. Only those employees were
taken who are directly on the roll of the healthcare
organisations, not in the roll of any manpower supplying
agency. It is true that a good number of female employees are
engaged in the job of scavenging, peon, helper, attendant or
security through manpower supplying agency. But their nature
of job is not unique for healthcare industry and hence they
have been kept out of this study. The information has been
collected through structured questionnaire based interviews.
During data screening, 29 respondents have been rejected due
to data insufficiency and ultimately the study confined to 101
respondents. Health care industry has been chosen for the
reason that large number female is associated with this industry
and the number of private players in this industry is pretty high.
Further Indian healthcare industry is growing very rapidly with
a compound annual growth rate of 21% and by 2020 it will
reach a market size of 280 Billion USD (Source: KPMG,
Deloitte).
Questionnaire: The questionnaire developed for this study has
several parts. Michigan Organizational Assessment
Questionnaire has been used for the psychological part. This
questionnaire contains 22 questions and has been developed
by Cammann, Fichman, Henkins & Klesh. On the other hand,
the maternity benefit questionnaire has been taken from the
study of Rossins which contains 6 opinion based questions.
Both of these questionnaires have statements and five different
options from ‘highly disagree’ to ‘highly agree’. The
demographic part contains 16 open ended questions. The fourth
part contains questions about different types of leaves available
and their type.
DISCUSSION & RESULTS
Demographic Analysis
The demographic profile of the sample having a size of 101 is
shown in Table 1, 2 and 3 in respect of different parameters.
The Table 1 shows maximum number of employees are working
as para-medical staff and age-wise maximum number of
employees are in age group of 30-40 years.
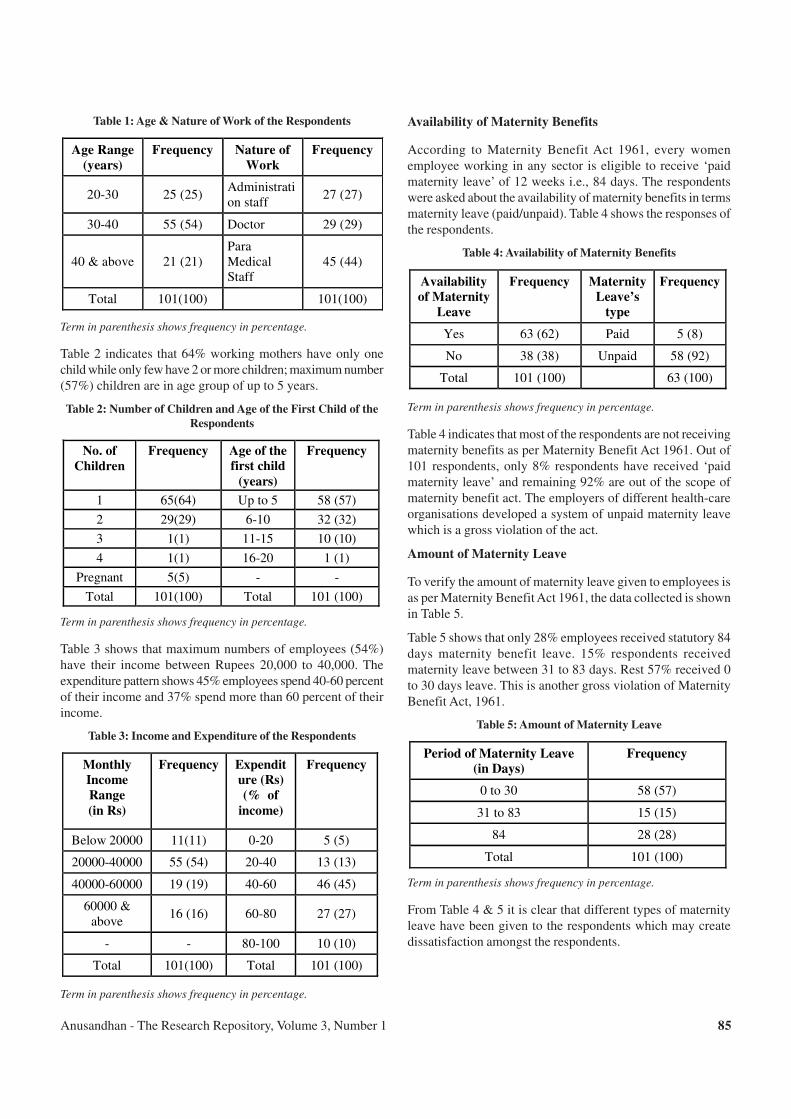
Anusandhan - The Research Repository, Volume 3, Number 1 85
Table 1: Age & Nature of Work of the Respondents
Age Range
(years)
Frequency Nature of
Work
Frequency
20-30 25 (25) Administration staff
27 (27)
30-40 55 (54) Doctor 29 (29)
40 & above 21 (21) Para Medical Staff
45 (44)
Total 101(100) 101(100)
Term in parenthesis shows frequency in percentage.
Table 2 indicates that 64% working mothers have only one
child while only few have 2 or more children; maximum number
(57%) children are in age group of up to 5 years.
Table 2: Number of Children and Age of the First Child of the
Respondents
No. of
Children
Frequency Age of the
first child
(years)
Frequency
1 65(64) Up to 5 58 (57)
2 29(29) 6-10 32 (32)
3 1(1) 11-15 10 (10)
4 1(1) 16-20 1 (1)
Pregnant 5(5) - -
Total 101(100) Total 101 (100)
Term in parenthesis shows frequency in percentage.
Table 3 shows that maximum numbers of employees (54%)
have their income between Rupees 20,000 to 40,000. The
expenditure pattern shows 45% employees spend 40-60 percent
of their income and 37% spend more than 60 percent of their
income.
Table 3: Income and Expenditure of the Respondents
Monthly
Income
Range
(in Rs)
Frequency
Expendit
ure (Rs)
(% of
income)
Frequency
Below 20000 11(11) 0-20 5 (5)
20000-40000 55 (54) 20-40 13 (13)
40000-60000 19 (19) 40-60 46 (45)
60000 & above
16 (16) 60-80 27 (27)
- - 80-100 10 (10)
Total 101(100) Total 101 (100)
Term in parenthesis shows frequency in percentage.
Availability of Maternity Benefits
According to Maternity Benefit Act 1961, every women
employee working in any sector is eligible to receive ‘paid
maternity leave’ of 12 weeks i.e., 84 days. The respondents
were asked about the availability of maternity benefits in terms
maternity leave (paid/unpaid). Table 4 shows the responses of
the respondents.
Table 4: Availability of Maternity Benefits
Availability
of Maternity
Leave
Frequency Maternity
Leave’s
type
Frequency
Yes 63 (62) Paid 5 (8)
No 38 (38) Unpaid 58 (92)
Total 101 (100) 63 (100)
Term in parenthesis shows frequency in percentage.
Table 4 indicates that most of the respondents are not receiving
maternity benefits as per Maternity Benefit Act 1961. Out of
101 respondents, only 8% respondents have received ‘paid
maternity leave’ and remaining 92% are out of the scope of
maternity benefit act. The employers of different health-care
organisations developed a system of unpaid maternity leave
which is a gross violation of the act.
Amount of Maternity Leave
To verify the amount of maternity leave given to employees is
as per Maternity Benefit Act 1961, the data collected is shown
in Table 5.
Table 5 shows that only 28% employees received statutory 84
days maternity benefit leave. 15% respondents received
maternity leave between 31 to 83 days. Rest 57% received 0
to 30 days leave. This is another gross violation of Maternity
Benefit Act, 1961.
Table 5: Amount of Maternity Leave
Period of Maternity Leave
(in Days)
Frequency
0 to 30 58 (57)
31 to 83 15 (15)
84 28 (28)
Total 101 (100)
Term in parenthesis shows frequency in percentage.
From Table 4 & 5 it is clear that different types of maternity
leave have been given to the respondents which may create
dissatisfaction amongst the respondents.

Anusandhan - The Research Repository, Volume 3, Number 186
Relationship between Job Satisfaction and other Factors
To study the relationship of job satisfaction (JS) with maternity
benefits (MB), facilities, working conditions (WC), job
involvement (JI) and work life balance (WLB), correlation
analysis were conducted. The correlation matrix is given in
Table 6.
Table 6: Correlation between Job-Satisfaction and Facilities,
Maternity Benefits, Job-Involvement, Working Conditions &
Work-life Balance
Variables Output Items Job
Satisfaction
Pearson Correlation 0.541
Facilities Level of Significance
(2-tailed): p-value 0.000
Pearson Correlation 0.608 Maternity Benefits Level of Significance
(2-tailed) : p-value 0.000
Pearson Correlation -0.154 Job-
Involvement Level of Significance
(2-tailed) : p-value 0.124
Pearson Correlation 0.399 Working
Conditions Level of Significance
(2-tailed) : p-value 0.000
Pearson Correlation 0.476
Level of Significance
(2-tailed) : p-value .000
Work-life Balance
N 101
Source: IBM SPSS 20 Output File,Level of Significance 0.05
The results in Table 6 show that Correlation Coefficient
between job satisfaction and (a) facility is 0.541; (b) maternity
benefits is 0.608; (c) job involvement is -0.154; (d) working
conditions is 0.399; and (e) work life balance is 0.476.
Table 6 also shows the p vale for Facilities, Maternity Benefits,
Working Conditions and Work-life Balance is 0.000 and is
less than the significance level (0.05). But for Job Involvement,
the p value (0.124) is greater than the significance level.
Therefore, we accept the Hypotheses H1,
H2, H
3 and H
5 and
reject the hypothesis H4. We conclude that the facilities,
maternity benefits (MB), working conditions (WC) and work
life balance (WLB) are significantly related with job
satisfaction. On the other hand, Job Involvement is not
significantly related with Job Satisfaction.
Impact of Facilities, Work life Balance, Working
Conditions & Maternity Benefits on Job Satisfaction
To find the impact of ‘Facilities’, ‘Work life Balance’, ‘Working
Conditions’ and ‘Maternity benefits’ on Job-satisfaction’
regression analysis was conducted. The results of regression
analysis are shown in Table 7 to 9.
Table 7 shows that the value of R² is 0.494. This indicates that
only 49.4% variation in Job Satisfaction is being explained by
the selected independent variables and 51.6% variation remains
unexplained.
Table 8 indicates that the calculated value of F is 23.451 and
the critical F value as 2.523 for numerator degree of freedom
4, denominator degree of freedom 96 and level of significance
(a) 0.05. Since the calculated value of F is greater than critical
F value, we conclude that ‘Facilities’, ‘Work life Balance’,
‘Working Conditions’ and ‘Maternity benefits’ significantly
impact the job satisfaction.
Table 7: Regression Model Summary
R R Square Adjusted R Square Std. Error of the Estimate
0.703 0.494 0.473 4.872
Source: IBM SPSS 20 Output File
Table 8: ‘F’ value for Predictor Constant, Facilities, WC, WLB, MB and JS
Anova for Sum of Squares Degree of
Freedom (df)
Mean Square F (Calculated) F
(Critical at 0.05%
significance level)
Regression 2226.692 4 556.673
Residual 2278.793 96
Total 4505.485 100 23.737
23.451 2.523
Source: IBM SPSS 20 Output File
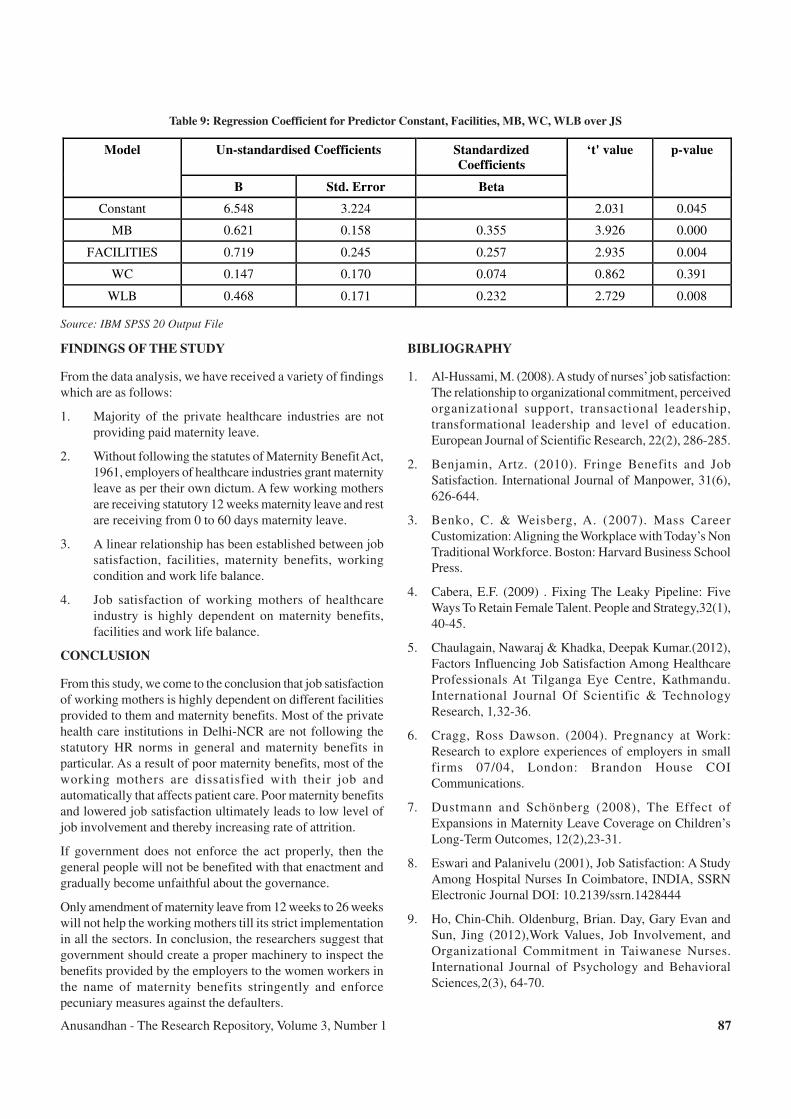
Anusandhan - The Research Repository, Volume 3, Number 1 87
Table 9: Regression Coefficient for Predictor Constant, Facilities, MB, WC, WLB over JS
Un-standardised Coefficients Standardized
Coefficients Model
B Std. Error Beta
‘t' value p-value
Constant 6.548 3.224 2.031 0.045
MB 0.621 0.158 0.355 3.926 0.000
FACILITIES 0.719 0.245 0.257 2.935 0.004
WC 0.147 0.170 0.074 0.862 0.391
WLB 0.468 0.171 0.232 2.729 0.008
Source: IBM SPSS 20 Output File
FINDINGS OF THE STUDY
From the data analysis, we have received a variety of findings
which are as follows:
1. Majority of the private healthcare industries are not
providing paid maternity leave.
2. Without following the statutes of Maternity Benefit Act,
1961, employers of healthcare industries grant maternity
leave as per their own dictum. A few working mothers
are receiving statutory 12 weeks maternity leave and rest
are receiving from 0 to 60 days maternity leave.
3. A linear relationship has been established between job
satisfaction, facilities, maternity benefits, working
condition and work life balance.
4. Job satisfaction of working mothers of healthcare
industry is highly dependent on maternity benefits,
facilities and work life balance.
CONCLUSION
From this study, we come to the conclusion that job satisfaction
of working mothers is highly dependent on different facilities
provided to them and maternity benefits. Most of the private
health care institutions in Delhi-NCR are not following the
statutory HR norms in general and maternity benefits in
particular. As a result of poor maternity benefits, most of the
working mothers are dissatisfied with their job and
automatically that affects patient care. Poor maternity benefits
and lowered job satisfaction ultimately leads to low level of
job involvement and thereby increasing rate of attrition.
If government does not enforce the act properly, then the
general people will not be benefited with that enactment and
gradually become unfaithful about the governance.
Only amendment of maternity leave from 12 weeks to 26 weeks
will not help the working mothers till its strict implementation
in all the sectors. In conclusion, the researchers suggest that
government should create a proper machinery to inspect the
benefits provided by the employers to the women workers in
the name of maternity benefits stringently and enforce
pecuniary measures against the defaulters.
BIBLIOGRAPHY
1. Al-Hussami, M. (2008). A study of nurses’ job satisfaction:
The relationship to organizational commitment, perceived
organizational support, transactional leadership,
transformational leadership and level of education.
European Journal of Scientific Research, 22(2), 286-285.
2. Benjamin, Artz. (2010). Fringe Benefits and Job
Satisfaction. International Journal of Manpower, 31(6),
626-644.
3. Benko, C. & Weisberg, A. (2007). Mass Career
Customization: Aligning the Workplace with Today’s Non
Traditional Workforce. Boston: Harvard Business School
Press.
4. Cabera, E.F. (2009) . Fixing The Leaky Pipeline: Five
Ways To Retain Female Talent. People and Strategy,32(1),
40-45.
5. Chaulagain, Nawaraj & Khadka, Deepak Kumar.(2012),
Factors Influencing Job Satisfaction Among Healthcare
Professionals At Tilganga Eye Centre, Kathmandu.
International Journal Of Scientific & Technology
Research, 1,32-36.
6. Cragg, Ross Dawson. (2004). Pregnancy at Work:
Research to explore experiences of employers in small
firms 07/04, London: Brandon House COI
Communications.
7. Dustmann and Schönberg (2008), The Effect of
Expansions in Maternity Leave Coverage on Children’s
Long-Term Outcomes, 12(2),23-31.
8. Eswari and Palanivelu (2001), Job Satisfaction: A Study
Among Hospital Nurses In Coimbatore, INDIA, SSRN
Electronic Journal DOI: 10.2139/ssrn.1428444
9. Ho, Chin-Chih. Oldenburg, Brian. Day, Gary Evan and
Sun, Jing (2012),Work Values, Job Involvement, and
Organizational Commitment in Taiwanese Nurses.
International Journal of Psychology and Behavioral
Sciences,2(3), 64-70.

Anusandhan - The Research Repository, Volume 3, Number 188
10. Jain. K. and Kaur, S. (2014), Impact of work environment
on job satisfaction. International Journal of Scientific and
Research Publications, 4(1), 2599.
11. Kalpana devi and U.V. Kiran (2013), Status of Female
Workers in Construction Industry in India: A Review, IOSR
Journal Of Humanities And Social Science, 14(4), 27-30.
12. Lambrou, P., Kontodimopoulos, N., & Niakas, D. (2010).
Motivation and job satisfaction among medical and nursing
staff in a Cyprus public general hospital. Human Resources
for Health, 8, 26.
13. Lucas, J. (2012), Return-to-work experiences of female
employees following maternity leave, downloaded from
http://repository.up.ac.za/ dspace/bitstream/handle/2263/
28363/dissertation.pdf?sequence=1&isAllowed = y on 29
Jan’16 at 5:40pm.
14. Maiero, L.A. & S.E. Sullivan (2006). The Opt-Out Revolt:
Why People are Leaving Companies to Create
Kaleidoscope Careers. Mountain View, CA: Davies Black
Publishing.
15. Mandal, M. & Anand, N. (2015), Motivational factors and
job satisfaction among managers in pharmaceutical
industry: An analytical study, Anusandhan, 2(1), 109-115.
16. Pietersen (2005), Job Satisfaction of Hospital Nursing
Staff, Journal of Human Resource Management, on 24
Jan’16, at 3:00pm.
17. Pyngavil, R.S. & Khatwani, N. (2015). Impact of HRD
Climate on Job Satisfaction with reference to Indian Public
Sector Banks in Delhi, Anusandhan, 2(1), 101-108.
18. Rossins, (2010), The Effects of Maternity Leave on
Children’s Birth and Infant Health Outcomes in the United
States, Columbia Population Research Center Advancing
Research in Population, downloaded from www.
search.ebscohost.com
19. Satpathy and Patnaik et al (2014), A Comparative Study
on Work-Life Balance of Nursing Staff Working in Private
and Government Hospitals, International Journal of
Innovative Research in Science, Engineering and
Technology, 21, 15-23.
20. Senboun, S. and Rashid, A. (2013). Job Satisfaction Of
Health-Care Workers At Health Centers In Vientiane
Capital And Bolikhamsai Province, Lao Pdr. Nagoya
Journal of Medical Science,75, 233- 241.
21. Singh, P. & Verma, S. (2014), Effectiveness of Training
and Development practices : A study of Rites Limited,
Anusandhan, 1, 68-71.
22. Sinha (2013), A research work on Employee Satisfaction
measurement with special reference to KRIBHCO,
International Journal of Modern Engineering Research,
23(3), 23-38.

Anusandhan - The Research Repository, Volume 3, Number 1 89
IMPACT OF EMOTIONAL LABOUR AND EMOTIONAL
INTELLIGENCE ON THE PERCEPTION OF EFFECTIVE LEADERSHIP
Sheetal1
Anu Gautam2
ABSTRACT
Emotional intelligence is a crucial skill for both leaders and employees. This paper examined the impact of emotional intelligence
on emotional labour and the impact of emotional intelligence on the perception of effective leadership. The data was collected
from 101 respondents employed in banks located in Delhi/NCR using convenience sampling technique. The data collected was
subjected to the descriptive and inferential analysis to understand the relationship between variables under study. The results
suggest that there is a significant positive relationship between emotional intelligence and the perception of effective leadership.
However the present study did not find any significant relationship between emotional labour and emotional intelligence. The
findings stress on the importance of the development of emotional intelligence skills among the employees for effectiveness in
their performance.
Keywords: Emotional Labour, Emotional Intelligence, Leadership.
1 Associate Professor, Gitarattan International Business School, New Delhi, [email protected] Student, Gitarattan International Business School, New Delhi
INTRODUCTION
Emotional intelligence (EI) is the ability to understand and
manage your own emotions, and those of the people around
you. People with a high degree of emotional intelligence know
what they are feeling and what does their emotions mean, and
how these emotions can affect other people. According to
Daniel Goleman, an American psychologist who helped to
popularize EI, there are five main elements of emotional
intelligence namely, Self-awareness, Self regulation,
Motivation, Empathy, Social skills.
Self-awareness: If one is self aware one always knows what
one feels and how one's actions can affect people around him.
Motivation: Self-motivated leaders work consistently toward
their goals, and they have extremely high standards for the
quality of their work.
Empathy: Leaders with empathy have the ability to put
themselves in someone else's situation.
Social skills: Leaders are expert at getting their team to support
them and be excited about a new mission or projects.
Emotional labour is defined as the way of managing publicly
visible emotional displays, those mediated by physiognomies
and body language. Hochschild’s (2003) conceptualization of
emotional labour involves impression management of service
employees. These employees put effort to express emotions
acceptable by customers. Mumby and Putnam (1992)
conceptualized emotional labor as the way individuals change
or manage emotions to make them appropriate or consistent
with a situation, a role, or an expected organizational behaviour.
Ashforth and Humphrey (1993) defined emotional labour as
the act of displaying appropriate emotions, with the goal to
engage in a form of impression management to foster social
perceptions of her/himself as well as to foster an interpersonal
climate. Morris and Feldman (1996) conceptualized emotional
labour as the effort, planning and control needed to express
organizationally desired emotion during interpersonal
transactions. This definition of emotional labour includes the
organizational expectations for employees in their interactions
with the customers, as well as the internal state of tension that
occurs when a person displays emotions that are discrepant
from her/his true feelings. They proposed that emotional labour
consists of four dimensions: (a) frequency of interactions, (b)
attentiveness (intensity of emotions, duration of interaction),
(c) variety of emotions required, and (d) emotional dissonance.
According to this perspective emotional labor is a characteristic
of the job.
Leadership is both a research area and a practical skill,
regarding the ability of an individual or organization to “lead”
or guide other individuals, teams, or entire organizations.
Leadership has been conceived as the focus of group process,
as a matter of personality, as a matter of inducing compliance,
as a form of persuasion, as a power relation, as an instrument
to achieve goals, as effect of interaction, as differentiated role,
as initiation of structure and as many combinations of these
definitions (Bass & Stodgill, 1990). “Leadership may be
considered as the process (act) of influencing the activities of
an organized group in its effort towards goal setting and goal
achievement” (Stodgill, 1950).
Indian Banking Industry
Indian banking industry is expected to witness better growth
prospects as a sense of optimism stems from the Government’s
Anusandhan - The Research Repository, Volume 3, Number 190
measures towards revitalizing the industrial growth in the
country. In addition, RBI’s new measures may go a long way
in helping the restructuring of the domestic banking industry.
The Indian banking system consists of 26 public sector banks,
25 private sector banks, 43 foreign banks, 56 regional rural
banks, 1,589 urban cooperative banks and 93,550 rural
cooperative banks, in addition to cooperative credit institutions.
Public sector banks control nearly 80 percent of the market,
there by leaving comparatively much smaller shares for its
private peers. Undoubtedly, banking sector is highly relevant
for the growth of a country like India. Keeping in mind its due
importance, banking sector has been chosen for the present
study.
LITERATURE REVIEW
Hochschild (2003) used the term ‘emotion work’ to refer to
any attempt to modify the experience or expression of a
consciously felt emotion. Callahan and McCollum (2002)
interprets that the term emotional work is appropriate for
situations in which individuals are personally choosing to
manage their emotions for their own non compensated benefits.
The term emotional labour is appropriate only when emotion
work is exchanged for something such as a wage or some other
type of valued compensation. In her definition of emotional
labour, Wharton (Callahan & McCollum, 2002) remarks that
not only such actions are performed for a wage; they are also
under the control of others. Thus, in organizational settings,
emotional labour is under the control of organizations.
Various scholars have conceptualized emotional labor in
various ways. Hochschild’s (2003) conceptualization of
emotional labour involves impression management of service
employees. These employees put effort to express emotions
acceptable by customers. According to this perspective, the
discrepancy between felt and expressed emotion is related to
job stress and burnout.
Mumby and Putnam (1992) conceptualized emotional labour
as the way individuals change or manage emotions to make
them appropriate or consistent with a situation, a role, or an
expected organizational behaviour. According to this view,
expression of wider range of emotions at work is desirable,
not to enhance productivity but to foster subjective well-being
of the organizational members and their families. Morris and
Feldman (1996) conceptualized emotional labor as the effort,
planning, and control needed to express organizationally
desired emotion during interpersonal transactions. This
definition of emotional labor includes the organizational
expectations for employees in their interactions with the
customers, as well as the internal state of tension that occurs
when a person displays emotions that are discrepant from her/
his true feelings. They proposed that emotional labour consists
of four dimensions: (a) frequency of interactions, (b)
attentiveness (intensity of emotions, duration of interaction),
(c) variety of emotions required and, (d) emotional dissonance.
Liu, Perrewe, Hochwarter, & Kachmar, (2004) interpreted
emotional labour as the attempt by individual to reduce the
discrepancy between felt and displayed emotions. From the
perspective of the individual service employee, emotional
labour involves individual differences as well as individual’s
(re)interpretations of their emotional experiences when
examining the causes and consequences of emotional labour.
Individual differences may predispose individuals to feel and
perceive stimuli in certain ways. Individuals do not always
express their real feelings in social settings. Hochschild (1979)
argued that individuals may learn to feel according to the
situation cues, and strategically use their emotional expressions
to achieve certain goals. Emotional display is demanded by
society even in the absence of a corresponding emotional
experience (Hochschild, 1979).
Diefendorff, Croyle, & Gosserand, (2005) argued that it is not
the display rule but the type of display rule that affects
emotional labour. They found that positive display rules
correlate positively with deep acting and negative display rules
correlate positively with surface acting. This pattern of findings
suggest that when individuals perceive requirements to display
positive emotions at work they focus more on trying to
experience a positive emotional state and when individuals
perceive requirements to hide negative emotions, they are more
likely to fake necessary emotions. Consistent with this argument
Grandey (2003) show that awareness of display rules is
positively related to deep acting but not related to surface
acting. This supports the idea that deep acting is a response to
work demands (Rafaeli & Sutton, 1987) and surface acting
occurs in response to work events rather than general rules.
Diefendorff and Gosserand (2003) suggested that the
relationship between awareness of display rules and emotional
displays may be mediated by surface acting and deep acting.
Liu et al. (2004) argued that emotional labour will vary as
individuals perceive and interpret the interaction cues with the
customer differently. Tan et al. (2003) found that the relative
effect of personality over the situation is almost as strong as
that of the situation over personality. Thus, the study of
emotional labour warrants the role of individual differences to
surface.
Several researchers have attempted to accurately describe and
assess the concept of EI. Mayer and Salovey model of EI is
known as the Ability Model. By looking at the definition and
construct of EI by Mayer and Salovey (Salovey& Mayer, 1990;
Mayer & Salovey, 1993; Mayer & Salovey, 1997) it can be
seen that EI is conceived as ability rather than a personality
dimension by narrowly defining the construct in order to
differentiate it from other phenomena. The domain of Mayer
and Salovey Model of EI describes a number of distinct
emotional abilities or dimensions, which are mainly divided
into four competencies i.e. emotional perception, emotion
integration, understanding emotions, and managing emotions.
Leadership is a complex, multi-level and socially-constructed
process (Stentz et al. 2012). Its complexity makes it interesting
Anusandhan - The Research Repository, Volume 3, Number 1 91
and challenging area for study however at the same time
complexity also act as a deterrent in attracting scholars to the
study of leadership. There are almost as many definitions of
leadership as there are persons who have attempted to define
the concept (Bass, 1990). Leadership has always been an
important area of study in organizations but in the wake of
changing business paradigms like increasing importance of
services sectors and other related developments in India, the
study of leadership is becoming even more important given
the fact the status ‘Leadership’ construct has enjoyed over the
years. Leadership is the elephant and there are a lot of blind
people identifying different parts (Khurana, 2010) suggests
on the mammoth amount of leadership research which has been
conducted and explaining only certain aspects of it. One of the
popular construct of leadership given by Kouzes and Posner
in 1987 is ‘exemplary leadership’. The construct is based on
five exemplary practices which a leader may undertake for
becoming effective. They are “Model the Way”, “Inspire a
Shared Vision”, “Challenge the Process”, “Enable Others to
Act” and “Encourage the Heart”. For the present study this
construct of effective leadership is applied.
OBJECTIVES OF THE STUDY
(a) The impact of emotional intelligence on the perception
of effective leadership.
(b) The impact of emotional intelligence on emotional
labour.
RESEARCH METHODOLOGY
The data was collected using three standardized questionnaires.
For emotional intelligence Wong and Law (2002) scale was
used with 1 to 5 scale, with 1 representing ‘Not at all’ and 5
representing ‘always’. The questionnaire contained 12 items.
For the assessment of the construct of emotional labour;
emotional labour scale (ELS) was used. It was an eight item
self-report questionnaire that measures the facets of surface
and deep acting. The responses were measured on 5 point scale.
For assessment of effective leadership perception, Kouzes and
Posner’s (2007) Leadership Practices Inventory (LPI)
questionnaire was used. The questionnaire assesses effective
leadership by summing up the responses on the five dimensions
as described in the paper earlier. The responses were measured
on five point scale ranging from strongly agree to strongly
disagree.
The sample for the present study was taken from banks located
in Delhi, NCR. The sample was taken using convenience
sampling; the data was collected in three months time through
self-administered questionnaire. The reliability of the
instrument was measured using Cronbach’s Alpha. The data
was analysed using correlation, regression analysis and t-test.
Reliability
The reliability of all three instruments was checked using
Cronbach’s Alpha. The Cronbach’s Alpha was highest for
leadership scale i.e. 0.83 (refer Table 1); emotional intelligence
scale it was 0.63 and for emotional labour scale it was 0.53.
Sample Characteristics
The sample consisted of 101 respondents selected from various
banks located in Delhi-NCR. 75 respondents were from private
sector banks and rest from PSU banks. 80 respondents were
male and largely having experience less than 5 years. Table 2
shows mean score on leadership questionnaire was 89 with
standard deviation of 6.4 and mean score on emotional
intelligence was 58 with standard deviation of 4.3. The mean
score of emotional labour was 24 and standard deviation was
3.4.
HYPOTHESES
H1: There is a significant relationship between Emotional
Intelligence and the perception of effective leadership.
H2: There is a significant relationship between Emotional
Labour and Emotional Intelligence.
ANALYSIS AND DISCUSSION
Relationship between Emotional Intelligence and the
Perception of Effective Leadership
Correlation and regression techniques were applied to
investigate the influence of emotional intelligence on the
perception of leadership among employees of banks; the results
of analysis are shown in Table 3.
The Pearson correlation coefficient between emotional
intelligence and the perception of leadership is 0.512. The p
value (0.000) is less than significance level chosen i.e. 0.01,
therefore we accept alternate hypothesis and which indicates
that correlation between emotional intelligence and effective
leadership is significant.
Table 4 shows that emotional intelligence significantly affects
the perception of effective leadership as p-value (0.000) is less
than the significance level 0.01. Emotional intelligence is
therefore significant predictor of the perception of effective
leadership among the employees of the banking sector.
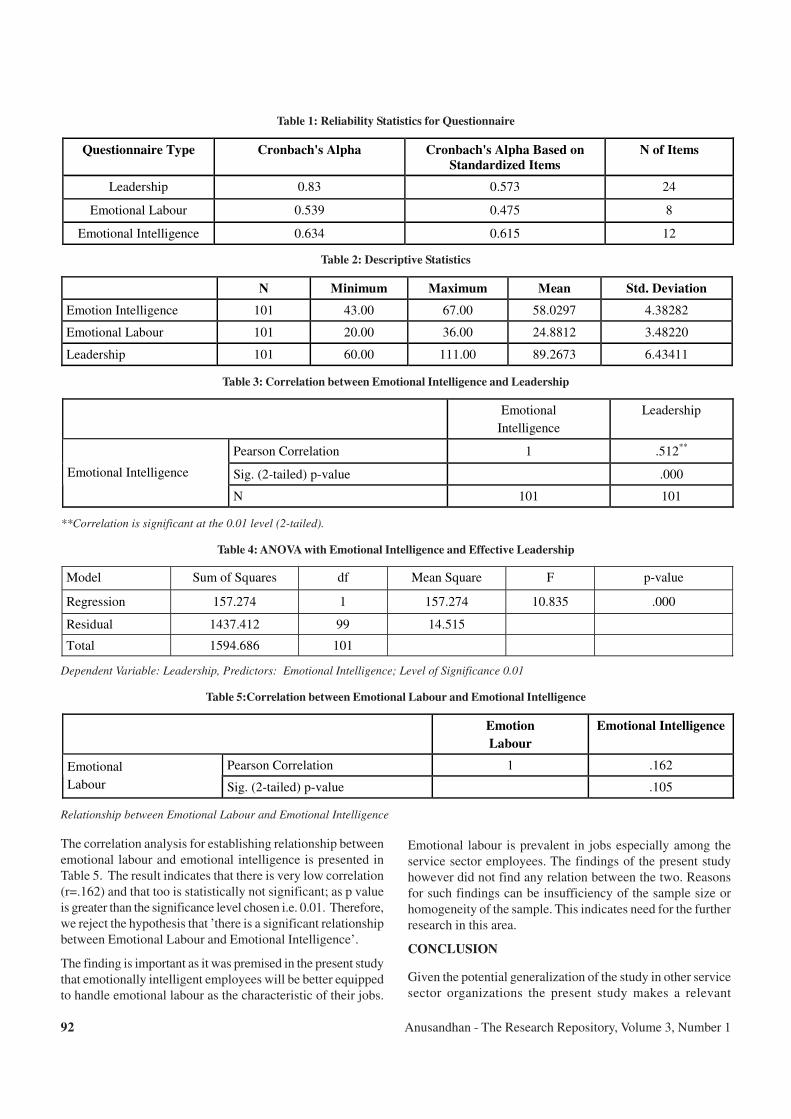
Anusandhan - The Research Repository, Volume 3, Number 192
Table 1: Reliability Statistics for Questionnaire
Questionnaire Type Cronbach's Alpha Cronbach's Alpha Based on
Standardized Items
N of Items
Leadership 0.83 0.573 24
Emotional Labour 0.539 0.475 8
Emotional Intelligence 0.634 0.615 12
Table 2: Descriptive Statistics
N Minimum Maximum Mean Std. Deviation
Emotion Intelligence 101 43.00 67.00 58.0297 4.38282
Emotional Labour 101 20.00 36.00 24.8812 3.48220
Leadership 101 60.00 111.00 89.2673 6.43411
Table 3: Correlation between Emotional Intelligence and Leadership
Emotional
Intelligence
Leadership
Pearson Correlation 1 .512**
Sig. (2-tailed) p-value .000 Emotional Intelligence
N 101 101
**Correlation is significant at the 0.01 level (2-tailed).
Table 4: ANOVA with Emotional Intelligence and Effective Leadership
Model Sum of Squares df Mean Square F p-value
Regression 157.274 1 157.274 10.835 .000
Residual 1437.412 99 14.515
Total 1594.686 101
Dependent Variable: Leadership, Predictors: Emotional Intelligence; Level of Significance 0.01
Table 5:Correlation between Emotional Labour and Emotional Intelligence
Emotion
Labour
Emotional Intelligence
Pearson Correlation 1 .162 Emotional
Labour Sig. (2-tailed) p-value .105
Relationship between Emotional Labour and Emotional Intelligence
The correlation analysis for establishing relationship between
emotional labour and emotional intelligence is presented in
Table 5. The result indicates that there is very low correlation
(r=.162) and that too is statistically not significant; as p value
is greater than the significance level chosen i.e. 0.01. Therefore,
we reject the hypothesis that ’there is a significant relationship
between Emotional Labour and Emotional Intelligence’.
The finding is important as it was premised in the present study
that emotionally intelligent employees will be better equipped
to handle emotional labour as the characteristic of their jobs.
Emotional labour is prevalent in jobs especially among the
service sector employees. The findings of the present study
however did not find any relation between the two. Reasons
for such findings can be insufficiency of the sample size or
homogeneity of the sample. This indicates need for the further
research in this area.
CONCLUSION
Given the potential generalization of the study in other service
sector organizations the present study makes a relevant

Anusandhan - The Research Repository, Volume 3, Number 1 93
contribution. The banks should create awareness about the
importance of emotional intelligence skill which can improve
the effectiveness of functioning in organizations. Such skills
will better prepare employees to understand the directions from
the leaders and will be able to relate to it.
REFERENCES
1. Ashforth, B. E., & Humphrey, R. H. (1993). Emotional
labor in service roles: The influence of identity. Academy
of management review, 18(1), 88-115.
2. Bass, B.M. &Stodgill. (1990). Handbook of Leadership;
Theory, research and managerial Applications, (3rd
edition), The free Press, New York.
3. Boyatzis, R. E., Goleman, D., & Rhee, K. (2000).
Clustering competence in emotional intelligence: Insights
from the Emotional Competence Inventory (ECI).
Handbook of emotional intelligence, 343-362.
4. Callahan, J. L., & McCollum, E. E. (2002).
Conceptualizations of emotion research in organizational
contexts. Advances in Developing Human Resources, 4(1),
4-21.
5. George, J.M. (2000). Emotions and leadership: The role
of EI. Human Relations, 53(12),1027–1041. http://
dx.doi.org/10.1177/0018726700538001.
6. Grandey, A. A. (2003). When “the show must go on”:
Surface acting and deep acting as determinants of
emotional exhaustion and peer-rated service delivery.
Academy of management Journal, 46(1), 86-96.
7. Hochschild, A. R. (1979). Emotion work, feeling rules,
and social structure. American journal of sociology, 551-
575.
8. Hochschild, A. R. (2003). The managed heart:
Commercialization of human feeling. Univ of California
Press.
9. Kouzes, J.M., & Posner, B.Z. (2007).The Leadership
Challenge (4th ed.), John Wiley & Sons, Inc. San
Francisco.
10. Liu, Y., Perrewé, P. L., Hochwarter, W. A., & Kacmar, C.
J. (2004). Dispositional antecedents and consequences of
emotional labor at work. Journal of Leadership &
Organizational Studies, 10(4), 12-25.
11. Mayer, J. D., & Salovey, P. (1993). The intelligence of
emotional intelligence. Intelligence, 17(4), 433-442.
12. Mayer, J. D., Salovey, P., Caruso, D. R., & Sitarenios, G.
(2001). Emotional intelligence as a standard intelligence.
13. Mayer, J. D., Salovey, P., & Caruso, D. R. (2004).
TARGET ARTICLES:” Emotional Intelligence: Theory,
Findings, and Implications”. Psychological inquiry, 15(3),
197-215.
14. Morris, J. A., & Feldman, D. C. (1996). The dimensions,
antecedents, and consequences of emotional labor.
Academy of management review, 21(4), 986-1010.
15. Mumby, D. K., & Putnam, L. L. (1992). The politics of
emotion: A feminist reading of bounded rationality.
Academy of management review, 17(3), 465-486.
16. Nohria, Nitin, and Rakesh Khurana, (2010). Handbook
of Leadership Theory and Practice. Harvard Business
Press.
17. Rafaeli, A., & Sutton, R. I. (1987). Expression of emotion
as part of the work role. Academy of management review,
12(1), 23-37.
18. Stogdill, Ralph M. (1950). Leadership, membership and
organization Psychological Bulletin, Vol. 47(1), 1-14.
19. Stentz, J.E., et al. (2012), Applying mixed methods to
leadership research: A review of current practices, The
Leadership Quarterly http://dx.doi.org/10.1016/
j.leaqua.2012.10.001

Anusandhan - The Research Repository, Volume 3, Number 194
IMPACT OF ORGANISATIONAL CULTURE ON EMPLOYEE COMMITMENT
Shweta Malhotra1
Kanishka Chauhan2
ABSTRACT
Orgnaisational Culture refers to the beliefs and behaviours that determine how a company's employees and management interact
and handle business transactions. Often, corporate culture is implied, not expressly defined, and develops organically over time
from the cumulative traits of the people the company hires. There are many dimensions which it influences. Employee's Commitment
is one of the important dimensions among those. The present study is an attempt to understand the impact of organisational
culture on the commitment of employee. Further it also aims to understand if the commitment level of employees varies with
respect to gender. Correlation, regression analysis and t test were used to test the hypotheses. The results revealed that there was
an impact of organisational culture on the commitment of employees and employee commitmentdid not differ significantly with
respect to gender.
Keywords: Beliefs, Employee Commitment, Gender, Orgnaisational Culture, Values.
1 Assistant Professor, Gitarattan International Business School, Rohini, Delhi, e-mail id: [email protected] Student, Gitarattan International Business School, Rohini, Delhi, e-mail id: [email protected]
INTRODUCTION
Organisational culture is the shared understanding of the beliefs,
values, norms and philosophies of how things work.Another
way to analyze culture is by dividing culture into three
categories namely: (a) bureaucratic cultures a very organized
and systematic culture based on power and control with clearly
defined responsibilities and authority. Organisations with this
culture are mature, stable, structured, procedural, hierarchical,
regulated and power-oriented; (b)innovative culture has a
creative, result oriented, challenging work environment and is
portrayed as being entrepreneurial ambitious, stimulating,
driven and risk-taking; (c) supportive culture displays
teamwork and is a people-oriented, encouraging, and has a
trusting work environment. This culture is open harmonious,
trusting, safe, equitable, sociable, humanistic and collaborative.
Employee commitment is defined as a strong desire to remain
as member of a particular Organisation; definite belief in and
acceptance of the values and goals of the Organisation. The
three dimensions of employee commitment are as follow: (a)
affective commitment involves the employee’s emotional
attachment to, identification with, and involvement in the
organisation; (b) continuance commitment involves
commitment based on the costs that the employee associates
with leaving the organisation; and (c) normative commitment
involves the employee’s feelings of obligation to stay within
the organisation.
REVIEW OF LITERATURE
Momeni et al. (2012) investigated the relationship between
organisational culture and organisational commitment in staff
department of General Prosecutors of Tehran. The results
revealed that organisational culture helps employees to behave
in the organisation and companies with participative culture
reap a return on investment. Hence culture of theOrganisation
was linked to both short-term performance and long-term
survival. The results showed that there was a significant
relationship between all components of organisational culture
including adaptability, involvement, adjustment, mission and
organisational commitment.
Manetje and Martins (2009) investigated therelationship
between organisational culture and organisational commitment.
The objective of the study was to examine the relationship
between organisational culture and organisational commitment.
The focus of the study was an investigation of the relationship
between organisational culture and organisational commitment
in a South African motor manufacturing organisation. The study
involved the use of organisational commitment scale and the
organisational culture questionnaire. The results suggested that
organizational culture has an effect on organisational
commitment.
Agwu (2013) investigated the relationship between
organisational culture and employee commitment in Bayelsa
State Civil Service in Nigeria. The objective was also to find
difference in commitment of employees of different Age,
Gender, and Length of service. The study found that a
significant relationship existed between organisational culture
and employee commitment while significant difference was
observed in commitment of employees with respect to age and
gender.

Anusandhan - The Research Repository, Volume 3, Number 1 95
Alvi et al. (2014)investigated the three Types of organisational
culture and its impact on job satisfaction and employee
commitment in chemical sector of Karachi. The study aimed
at identifying the impact of organisational culture on job
satisfaction and employee commitment.Regression analysis
was done to determine the relationship between supportive
organisational culture, innovative organisational culture and
bureaucratic organisational culture with job satisfaction and
employee commitment. The results showed that when employee
is highly satisfied with his/her job, he/she is less committed to
the organisation, because the only concern of the employee is
his/her job satisfaction more than being loyal to the
organization.
Messner (2013) investigated the effect of organisational culture
on employee commitment in the Indian IT services sourcing
industry. The objective of the study was to examine the linkages
between organisational culture and employee commitment. The
researcher collected data in the first half of 2012 through the
ICCA appraisal framework from 291 Indian IT executives and
managers working for two IT services sourcing provider
organisations in Pune and Bangalore, India. The study found a
stronger correlation between affective and normative
commitment in the Indian context as compared to other North
American studies. The implications for the Indian IT services
sourcing industry were to start thinking about employee
commitment from an organisational culture point of view.
Shoaib Ch. et. al. (2013)investigated the impact of
organisational culture on organisational Commitment in the
Public and Private organisations. The study aimed at finding
out how employees perceived commitment in Pakistani context
and employees commitment levels by the public and private
sector organisations and effect of different culture on
commitment in the organisation. The results showed that clan
culture had the most significant relationship with all the three
commitment dimensions as compared to other types of culture.
Sabir et. al. (2010) investigated the impact of organisational
culture on the employees’ commitmentwith respect to levels
in the organisation. Its focussed on three levels of organisational
culture namely surface level, espoused values and assumptions
values, and their relationship with commitment of employees.
The results revealed there was a positive relationship between
the surface level of organisational culture and organisational
commitment and positive organisational culture leads the
organisational commitment.
Nongo and Ikyanyon(2012) investigated the influence of
corporate culture on employee commitment with reference to
medium small enterprises (SMEs). Corporate culture was
viewed as the independent variable while organisational
commitment was viewed as the dependent variable. The study
examined the impact of four corporate cultural variables
namely, involvement, consistency, adaptability, and mission
on employee commitment to the organisation. Standardized
questionnaires were used for measuring corporate culture and
organisational commitment. The study found that involvement
and adaptability significantly correlated with commitment,
while consistency and mission did not correlate with
commitment. They recommended that managers of SMEs in
Nigeria should encourage employee involvement in decision
making and innovation and teamwork and flexibility in the
performance of tasks, define & communicate mission of
organisation.
Sola et al. (2012) investigated the relationship between
organizational culture and employee commitment in Public
Tertiary Institutions in Lagos State, Nigeria.The researchers
used an instrument tagged “Organisational Culture and
Employees Commitment Questionnaire” was used to collect
data for the study. The results from the data analysis indicated
that significant relationship existed between organisational
culture and employees’ commitment but significant difference
existed in the commitment of employees of different sex, ages
and length of service to their institutions in Lagos State. They
suggested that management should improve on the current
rewards system in their institutions to enhance employees’
commitment levels as well as output among others.
Ghorbanhosseini (2013) investigated the effect of
organisational culture, teamwork and organisational
development on organisational commitment and the mediating
role of human capital. The objective of the study was to examine
the relationship between human capital and organisational
commitment to recognize the conditions vital for managers to
increase employee commitment in the organisations. He found
that organisational culture, teamwork and organisational
development have direct and significant effect on organisational
commitment. Lastly results showed that human capital has
mediating role between organisational culture, teamwork,
organisational development and organisational commitment.
He suggested some guidelines (like job security, team work,
organisational development and to develop human capital)
which will help managers to comprehend how to increase
employee’s organisational commitment.
Van Muijen et al. (1999) investigated the organisational culture
through the Focus Questionnaire. The objective of the study
was the development of an internationally useful questionnaire
for measuring organisational culture and the other one was to
examine influence of country and sector on organisational
culture. The aim of the research group was to construct an
internationally useful instrument for measuring organisational
culture in European companies. The researchers used
ethnography qualitative research methods for study of culture
and quantitative method (questionnaire) for organisational
climate. A group of researchers mainly from Europe, the so-
called FOCUS group, initiated the development of such an
instrument to measure organisational culture and some of the
psychometric qualities of the FOCUS questionnaire. The
members of the FOCUS group formulated 250 items after
discussing the validity of the concepts of the competing values
model in the participating countries. All 128 items were
evaluated by using structured Q-sort technique and were tested

Anusandhan - The Research Repository, Volume 3, Number 196
in a pilot study. The researchers used Mokken analyses to select
items that form a one-dimensional scale in each country. They
used partial correlation analyses to test the idea of circumplexity
and explorative research design. The results showed that
country influence both practices and values which is larger on
the aggregate level than on individual level.
Mehta et al. (2014) investigated the study on employee
retention and commitment. The objective of the study was to
identify the best practices and methods adopted by various
organisations across industries to help enhance commitment
and employee retention. The purpose of the study was to review
the findings of research papers of various authors to derive the
factors that impact employee commitment and retention in a
work environment. The researchers examined the following
factors in the study: career development opportunities, effective
talent management strategies, work life balance, culture of the
organisation, leadership, communication, image of the
company, autonomy and empowerment, Gallup audits, personal
causes, role of HR head &supervisors, work related policies
& flexi time, performance appraisals &career growth and
development opportunities. There were no fixed practices
which showed the importance and significance of the influence
of all these above broad points because different organisations
lay different emphasis on these pointers depending upon their
suitability impacting retention. Some suggestions drawn by
researchers were like organisation shouldencourage
communication process, should conduct contests to keep
employees motivated, must do smart hiring, manager should
conduct “stay” and “exit” interviews for better understanding
of employees, should treats everyone the same way without
any bias, and to encourage employee participation which gave
a holistic view on the various practices that organisations should
adopt to keep the level of employee retention and commitment
high.
OBJECTIVES OF THE STUDY
(a) To examine the impact of organisational culture on
employees’ commitment in Bharat Foils Limited.
(b) To understand whether there is any difference in
Employee commitment with respect to Gender.
SCOPE OF THE STUDY
The study is limited to Bharat Foils Limited and does not
necessary reflect the findings of industry as a whole. The
population of the study comprised of employees from various
departments of the organization under study which include HR,
Marketing, Finance, Production & Operation and they were
selected based on random sampling.Purpose of the study is to
analyse the relationship between organizational culture and
employee commitment at Bharat Foils Limited. The study is
confined to Bharat Foils Ltd in Haryana region.
METHODOLOGY
The present study is descriptive in nature. Data was collected
from both primary and secondary sources. Primary data was
collected through the questionnaire by Joilta Rizwan for
organisational culture and from Balakrishnan & Masthan
questionnaire for employee Commitment. Convenience
sampling was used for the same. The sample size for the study
is 100. Secondary data was collected from the company website
and other Internet sources.
HYPOTHESES
H1: There is a significant impact of organisational culture on
Employee commitment.
H2: There is a significant difference in the level of employee
commitment with respect to gender of employees.
DATA ANALYSIS
Reliability of Questionaire
For assessing the reliability of questionaire, Cronbach’s Alpha
was calculated to examine the stability of each factor separately
as shown in Table 1. Reliability coefficients for each factor
was considered acceptable if their value was greater than or
equal to 0.70. Values of Cronbach’s Alpha show that the
questionnaires are reliable.
Table1:Reliability Test- Output
Items Cronbach’s Alpha based on
Standardized items
N of Items
Organisational Culture 0.767 11
Employee Commitment 0.870 18
Table 2: Model Summary of Regression Values
Change Statistics R R Square Adjusted R
Square
Std. Error of
the Estimate R Square
Change
F Change df1 df2 Sig. F Change
.292 .086 .076 3.751 .086 9.163 1 98 .003
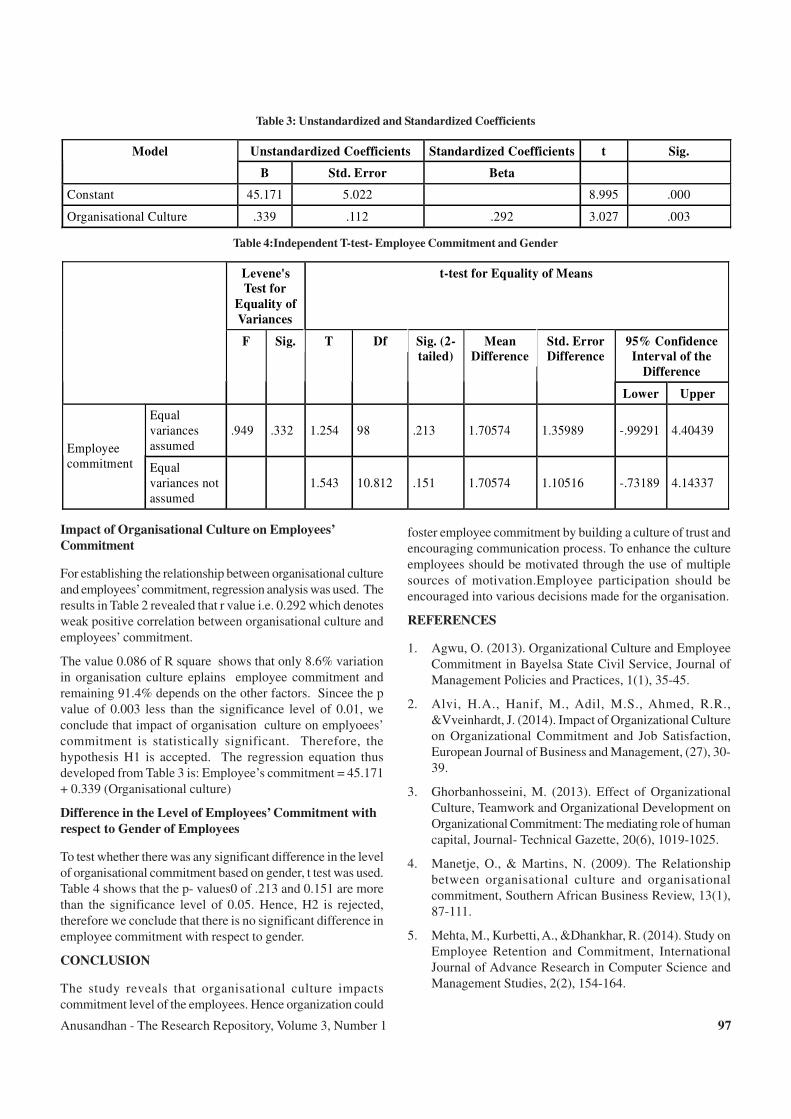
Anusandhan - The Research Repository, Volume 3, Number 1 97
Table 3: Unstandardized and Standardized Coefficients
Unstandardized Coefficients Standardized Coefficients t Sig. Model
B Std. Error Beta
Constant 45.171 5.022 8.995 .000
Organisational Culture .339 .112 .292 3.027 .003
Table 4:Independent T-test- Employee Commitment and Gender
Levene's
Test for
Equality of
Variances
t-test for Equality of Means
95% Confidence
Interval of the
Difference
F Sig. T Df Sig. (2-
tailed)
Mean
Difference
Std. Error
Difference
Lower Upper
Equal variances assumed
.949 .332 1.254 98 .213 1.70574 1.35989 -.99291 4.40439
Employee commitment Equal
variances not assumed
1.543 10.812 .151 1.70574 1.10516 -.73189 4.14337
Impact of Organisational Culture on Employees’
Commitment
For establishing the relationship between organisational culture
and employees’ commitment, regression analysis was used. The
results in Table 2 revealed that r value i.e. 0.292 which denotes
weak positive correlation between organisational culture and
employees’ commitment.
The value 0.086 of R square shows that only 8.6% variation
in organisation culture eplains employee commitment and
remaining 91.4% depends on the other factors. Sincee the p
value of 0.003 less than the significance level of 0.01, we
conclude that impact of organisation culture on emplyoees’
commitment is statistically significant. Therefore, the
hypothesis H1 is accepted. The regression equation thus
developed from Table 3 is: Employee’s commitment = 45.171
+ 0.339 (Organisational culture)
Difference in the Level of Employees’ Commitment with
respect to Gender of Employees
To test whether there was any significant difference in the level
of organisational commitment based on gender, t test was used.
Table 4 shows that the p- values0 of .213 and 0.151 are more
than the significance level of 0.05. Hence, H2 is rejected,
therefore we conclude that there is no significant difference in
employee commitment with respect to gender.
CONCLUSION
The study reveals that organisational culture impacts
commitment level of the employees. Hence organization could
foster employee commitment by building a culture of trust and
encouraging communication process. To enhance the culture
employees should be motivated through the use of multiple
sources of motivation.Employee participation should be
encouraged into various decisions made for the organisation.
REFERENCES
1. Agwu, O. (2013). Organizational Culture and Employee
Commitment in Bayelsa State Civil Service, Journal of
Management Policies and Practices, 1(1), 35-45.
2. Alvi, H.A., Hanif, M., Adil, M.S., Ahmed, R.R.,
&Vveinhardt, J. (2014). Impact of Organizational Culture
on Organizational Commitment and Job Satisfaction,
European Journal of Business and Management, (27), 30-
39.
3. Ghorbanhosseini, M. (2013). Effect of Organizational
Culture, Teamwork and Organizational Development on
Organizational Commitment: The mediating role of human
capital, Journal- Technical Gazette, 20(6), 1019-1025.
4. Manetje, O., & Martins, N. (2009). The Relationship
between organisational culture and organisational
commitment, Southern African Business Review, 13(1),
87-111.
5. Mehta, M., Kurbetti, A., &Dhankhar, R. (2014). Study on
Employee Retention and Commitment, International
Journal of Advance Research in Computer Science and
Management Studies, 2(2), 154-164.
Anusandhan - The Research Repository, Volume 3, Number 198
6. Messener, W. (2013). Effect of organizational culture on
employee commitment in the Indian IT services sourcing
industry, Journal of Indian Business Research, 5(2), 76-
100.
7. Momeni, M., Marjani, A.B., &Saadat, V. (2012). The
Relationship between Organizational Culture and
Organizational Commitment in Staff Department of
General Prosecutors of Tehran, International Journal of
Business Social Science, 3(13), 217-221.
8. Nongo, E.S., &Ikyanyon, D.N. (2012). Influence of
Corporate Culture on Employee Commitment to the
Organization with reference to medium small enterprises
(SMEs), International Journal of Business and
Management, 7(22), 1-8.
9. Sabir, M.S., Razzaq, A.,&Yameen, M. (2010). Impact of
Organizational Culture on the Employees’ Commitment:
Relationship between Levels of Organizational Culture
with Commitment, KASBIT Business Journal, 3(1), 8895.
10. Shoaib Ch., A., Zainab, N., Maqsood, H. & Sana, R.
(2013). Impact of Organizational Culture on
Organizational Commitment: A Comparative Study of
Public and Private Organizations, Research Journal of
Recent Sciences,2(5), 15-20.
11. Sola, A.S., Femi, A., &Kolapo, I. (2012). Organisational
Culture and Employees Commitment in Public Tertiary
Institutions in Lagos State, Nigeria, European Journal of
Globalization and Development Research, 3(1), 128-142.
12. Van Muijen, J.J., Koopman, P., Witte, K.D., Cock, G.D.,
Susanj, Z., Lemoine, C., Bourantas, D., Papalexandris,
N., Branyicski, I., Spaltro, E., Jesuino, J., Neves, J.G.D.,
Pitariu, H., Konrad, E., Peiró, J., González-Romá, V.,
&Turnipseed, D. (1999). Organizational Culture: The
Focus Questionnaire, European Journal of Work and
Organizational Psychology, 8(4), 551-568.

Anusandhan - The Research Repository, Volume 3, Number 1 99
EMPLOYEE ENGAGEMENT IN BPO SECTOR
Kanupriya Malhotra1
Akshat Bhardwaj2
ABSTRACT
"Survival of the Fittest" is the rule of the game. In today's competitive environment, organizations' need to be the best to survive,
thrive and excel. Two organizations may possess same amount of capital, resources, technology, infrastructure etc, but what
differentiates them is their human resource. Human resource is a unique combination of knowledge, skills and abilities. It is very
important to utilize these talents in the best way, which is possible only when their efforts are successfully converted into
commitment. This calls for the need of Employee Engagement in today's era. In BPO sector, the links between employee engagement
and organizational productivity are recognized but are at a very fundamental stage. There is a gap in the survey with regard to
the relationship of Job Satisfaction, Referral and Loyalty with Employee Engagement. Accenture and iEnergizer, being a BPO
is not an exception to this. This paper concludes that, in the aforesaid organizations, extrinsic factors like good working
environment, salary, job security etc are not enough to make any employee engaged at work. It can be done by increasing their
level of satisfaction, referral and loyalty.
Keywords: BPO, Employee Engagement, Job Satisfaction, Loyalty, Referral.
1 Assistant Professor, Gitarattan International Business School, Rohini, Delhi. Email: [email protected] Student, Gitarattan International Business School, Rohini, Delhi.
INTRODUCTION
An organization to have a workforce which is completely
satisfied witah their jobs is the most desirable and optimum
level that it wishes to achieve. But in today’s competitive world,
it has become crystal clear that only job satisfaction is not
adequate to create the connection between employee’s
contribution and organizational productivity. Previously the
organizations emphasized on concepts like customer
satisfaction and profit maximization. But now there is a shift
in the focus, from customer satisfaction to employee
satisfaction. Employers have changed drastically from creating
employees who are purely satisfied with salary and other
benefits, to the employees who are engaged to the organization.
Today organizations like HCL have come with a strategy of
‘Employee First Customer Second (EFCS)’ to make their
employees feel engaged and consider them as a part of the
organization. For employers, employee engagement has
become like a search for ‘Devine Being’.
The challenge today is not just retaining talented people, but
fully engaging them, capturing their minds and hearts at each
stage of their work lives. Employee engagement has emerged
as a critical driver of business success in today’s competitive
market place. Further, employee engagement can be a deciding
factor in organizational success. Not only does engagement
have the potential to significantly affect employee retention,
productivity and loyalty, it is also a key link to customer
satisfaction, company reputation and overall stakeholder value.
Thus, to gain a competitive edge, organizations are turning to
HR to set the agenda for employee engagement and
commitment.
Employee engagement is defined as “the extent to which
employees commit to something or someone in their
organization, how hard they work and how long they stay as a
result of that commitment.”
Engagement is an emotional connection an employee feels
towards his or her employment organization, which tends to
influence his or her behavior and level of effort in work related
activities. The more engagement an employee has with his or
her company, the more effort he/she puts. Employee
engagement also involves the nature of the job itself - if the
employee feels mentally stimulated; the trust and
communication between employees and management; ability
of an employee to see how their own work contributes to the
overall company performance; the opportunity of growth within
the organization and the level of pride an employee has about
working or being associated with the company.
Research shows that the connection between an employees’
job and organizational strategy including understanding how
important the job is to the firms’ success, is the most important
driver of employee engagement. In fact, employees with the
highest levels of commitment perform 20% better and are 87%
less likely to leave the organization, which indicates that
engagement is linked to organizational performance. In
contrast, job satisfaction — a term sometimes used inter-
changeably with employee engagement — is defined as how
an employee feels about his or her job, work environment,
pay, benefits, etc. The happier people are with their job, the
more satisfied they are said to be. Job satisfaction is not the
same as motivation or attitude although it is clearly linked.

Anusandhan - The Research Repository, Volume 3, Number 1100
Employee engagement is a complex concept, with many issues
influencing engagement levels. Consequently, there are many
pathways to foster engagement, with no one, kit, that fits all
organizations. While each company may define employee
engagement differently, ultimately, the key to effective
engagement will be rooted in the flexibility of approach most
appropriate for each individual firm.
LITERATURE REVIEW
Thiagarajan & Renugadevi (2011) conducted the research with
the purpose to introduce employee engagement and key
research on engagement related factors in BPO Industries in
India. It was found that career development, performance
appraisal and motivation factors were connected to employee
engagement. The implications were that the leaders should be
educated on engagement, career development opportunities
which are particularly important and that performance
improvement should champion work life balance, these
practices are useful to increase engagement.
Safdar & Ajmal (2011) conducted the study with the aim to
test link between job satisfaction, job retention and job
performance. This study correlation between job performance
and job satisfaction (r = 0.52).
Sharma and. Baldev (2011) presented an assessment of the
level of employee engagement among managers of a public
sector undertaking in India. Besides highlighting the level of
engagement, the study has identified the predictors of
organizational commitment, which was used as an important
manifestation of employee engagement. The study is based on
primary data collected from 84 managerial employees on a
number of parameters relating to employee engagement and
its potential predictors. The study has revealed that the level
of employee engagement in this organization is quite modest.
Three factors, namely, pay, job content and objectivity are found
to be the predictors of employee engagement.
Chung and Angeline (2010) examined the extent to which the
engagement of employees in their work mediates the
relationship between their performance and the job resources
that organizations provide. This study revealed that employee
engagement mediates the relationship between job resources
and job performance of employees.
Sharma et al. (2010), conducted research on “Determinants of
Employee Engagement in a Private Sector Organization: An
Exploratory Study” aimed to ascertain the level of employee
engagement and the determinants thereof among the sales
executives of a private sector organization. The results revealed
the two main factors that determine employee engagement of
sales executives are compensation & job security.
Rettab et al. (2009) examines the link between CSR activities
and organizational performance. The results show that CSR
has a positive relationship with all three measures of
organizational performance: financial performance, employee
commitment, and corporate reputation. These results reinforce
the accumulating body of empirical support for the positive
impact of CSR on performance and challenge the dominant
assumption that, given the weak institutional framework in
emerging economies, CSR activities drain resources and
compromise firms’ competitiveness.
Certain interesting findings emerged from the survey conducted
by Blessingwhite and Alexi (2008). The survey defines
‘employee engagement’ as an alignment of maximum job
satisfaction with maximum job contribution. By plotting the
population against these two axes, the employees were
classified into following five segments:
(a) The Engaged
(b) Almost Engaged
(c) Honeymooners and Hamsters
(d) Crash and Burn
(e) The Disengaged
Brownrigg et al. (2008) examined the links between employee
engagement and organizational performance in the public
sector. Five theoretical models linking employee engagement
and organizational performance were presented and concrete
organizational outcomes of employee engagement were
provided.
Sharma (2007) conducted the study which indicated that a good
level of engagement may lead to high retention, but only for a
limited time in the ITES sector. The need for a more rigorous
employee engagement construct is indicated by the study.
Practical implications for retention in the BPO/ITES sector
are referred to employee engagement.
Saks (2006) conducted the study with the aim to test a model
of the antecedents and consequences of job and organization
engagements based on social exchange theory. Results indicate
that there is a meaningful difference between job and
organization engagements and that perceived organizational
support predicts both job and organization engagement; job
characteristics predicts job engagement; and procedural justice
predicts organization engagement. In addition, job and
organization engagement mediated the relationships between
the antecedents and job satisfaction, organizational
commitment, intentions to quit, and organizational citizenship
behavior.
Vazirani (2005) conducted a study on how employee
engagement is an antecedent of job involvement and what
company should do to make the employees engaged. It
concluded that raising and maintaining employee engagement
lies in the hands of an organization and requires a perfect blend
of time, effort, commitment and investment to craft a successful
endeavor.
OBJECTIVES OF THE STUDY
(a) To measure employee engagement in BPO sector

Anusandhan - The Research Repository, Volume 3, Number 1 101
(b) To examine the impact on employee engagement.on job
satisfaction, loyalty and referral.
(c) To study the difference between Accenture and
iEnergizer in terms of employee engagement.
SCOPE OF THE STUDY
The study is conducted in order to measure employee
engagement and its impact on job satisfaction, loyalty and
referral. It includes employees of Accenture and iEnergizer.
The outcome from this study will give managers the information
to improve management interventions in order to increase
employee engagement. By increasing the overall level of
employee engagement, the effect will be two fold; employees
will have an improved engagement experience and as a result
their performance will be better. Primary data was collected
through questionnaire.
REASEARCH METHODOLOGY
(a) Primary Data: The primary data was collected with the
help of a structured questionnaire consisting of 15
statements on a five point Likert scale in which 1 denotes
strongly disagree and 5 denotes strongly agree. The
sampling technique used for research was convenience
sampling.
(b) Secondary Data: Secondary data was collected from
textbooks, journal articles, studies that have been carried
out in this area before and Internet.
(c) Techniques used to Analyze Data: The statistical tool
used was simple linear regression and t-tests. SPSS
software was used for the analysis of data.
HYPOTHESES
The following hypotheses were formulated to achieve the
research objectives:
H1: There is significant impact of employee engagement on
job satisfaction.
H2: There is significant impact of employee engagement on
loyalty.
H3: There is significant impact of employee engagement on
referral.
H4: There is significant difference between Accenture and
iEnergizer in terms of employee engagement.
DATA ANALYSIS AND INTERPRETATION
Table 1 depicts the demographic profile of the respondents on
the basis of gender and age. 70% of the respondents are males
and 76% of respondents are between 30-50 years.
Table 1: Demographic Profile of the Respondents
Gender Distribution (in %)
Male 70
Female 30
Age Distribution (in %)
20-30 10
30-40 39
40-50 37
Above 50 14
Reliability Analysis
The Cronbach’s Alpha was calculated for the fifteen statement
questionnaire. The value of coefficient, as shown in Table 2, is
0.92 which indicates that questionnaire is reliable as the
coefficient value is higher than the standard value of 0.7.
Table 2: Reliability Statistics
Cronbach's Alpha No. of Items
0.92 15
Relationship between Employee Engagement & Job
Satisfaction
Table 3 indicates that the p-value (0.000) is less than the level
of significance of 0.05; therefore, we accept the hypothesis
and conclude that employee engagement significantly impacts
job satisfaction.
Table 3: ANOVA Results for Employee Engagement and Job
Satisfaction
Model Sum of
Squares
df Mean
Square
F Sig./
p
Regression 37.868 1 37.868� 50.81� 0.000�
Residual 73.042 98 0.745
Total 110.910 99
Level of Significance 0.05
Relationship between Employee Engagement & Loyalty
In this case also, since the p-value (0.000) is less than the level
of significance 0.05 (Table 4), we accept the hypothesis and
infer that there is a significant impact of employee engagement
on loyalty.

Anusandhan - The Research Repository, Volume 3, Number 1102
Table 4: ANOVA Results for Employee Engagement and
Loyalty
Model Sum of
Squares
Df Mean
Square
F p
value
Regression 52.450 1 52.450 60.97 0.000
Residual 84.300 98 0.086
Total 136.750 99
Level of Significance 0.05
Relationship between Employee Engagement & Referral
Table 5 shows the results of analysis in respect of employee
engagement and referral. The results bring out that the p-value
of 0.000 is less than the significance level of 0.05. Therefore,
we infer that the employee engagement significantly impacts
referral.
Table 5: ANOVA Results for Employee Engagement and
Referral
Model Sum of
Squares
df Mean
Square
F Sig.
Regression 45.036 1 45.036 94.06 0.000
Residual 46.924 98 0.479
Total 91.960 99
Level of Significance 0.05
Difference between Accenture & iEnergizer in terms of
Employee Engagement
Table 6 indicates that the p value (0.048) is less than the level
of significance (0.05). We accept alternate hypothesis meaning
that there is a significant difference between Accenture and
iEnergizzer in terms of employee engagement.
Table 6: Two-sample T for Accenture vs. iEnergizer
Mean St Dev
SE Mean p Value
Accenture 49.36 9.59 1.4
iEnergizer 48.18 6.89 0.97 0.048
N (Accenture) = 50, N (iEnergizer) = 50
Level of Significance 0.05
FINDINGS
The study shows that there exist a relationship between
employee engagement and job satisfaction, loyalty & referral.
Hence researcher would recommend the organizations to take
steps to improve the overall satisfaction of their employees by
clarifying authority and responsibility relationships, setting
clear goals, encouraging employee participation, etc and the
supervisor should provide timely feedback to its subordinates.
The researcher would like to recommend on the basis of
interaction with the respondents that there should be two way
feedback mechanism i.e. the subordinates should also actively
provide their feedback on how engaged they are towards their
work and are they happy with their supervisor’s role in their
development.
REFERENCES
1. Blessingwhite and HR Anexi (2008), “The Employee
Engagement Equation in India”, URL: http://
w w w. h r a n e x i . c o m / E m p l o y e e _ E n g a g e m e n t
_Report_2008.pdf.
2. Brownrigg M.C , Evans Jason, Poilievre Tricia and
Slonowsky Dean (2008), “Employee Engagement and
Organizational Performance: Exploring the Links”, URL:
h t tp : / /www.c io .gov.bc . ca / loca l / c io /k i s /pdf s /
mpa_employee_engagement.pdf.
3. Chung Ng Ging and Angeline Tay (2010), “Does Work
Engagement Mediate the Relationship between Job
Resources and Job Performance of Employees?”, African
Journal of Business Management, Vol. 4(9), pp. 1837-
1843.
4. Kumari Jyotsna (2007); “Talent man-agement strategy of
employee engagement in Indian ITES employees: Key to
Retention” Jounal of Managment, Vol. 2 (3), pp. 27-40.
5. Mamta, Sharma R. Baldev(2011); “Study of Employee
Engagement and its Predictors in an Indian Public Sector
Undertaking”, Journal of Business Management, Vol.
4(10).
6. Muhammad Safdar Rehman and Ajmal Waheed, (2011).
An empirical study of impact of job satisfaction on job
performance in the public sector organizations. Journal
of Contemporary Research in Business, Vol 2, No 9.
7. Saks Alan M.,(2006)”Antecedents and consequences of
employee engagement”, Journal of Managerial
Psychology, 21(7), 600–619.
8. Sakari Taipale, Kirsikka Selander, Timo Anttila, Jouko
Nätti (2011); “Work en-gagement in eight European
countries: The role of job demands, autonomy, and social
support”, Jo0urnal of Contemporary Research in Business,
Vol 2, pp. 14-22.
9. Sharma Baldev Retal (2010); “Determinants of Employee
Engagement in a Private Sector Organization: An
Exploratory Study” Journal of Managerial Psychology,
21(7), p-24-37.
10. Thiagarajan B & Renugadevi V (2011) ; “An empirical
investigation on Employee Engagement Practices in Indian
BPO.
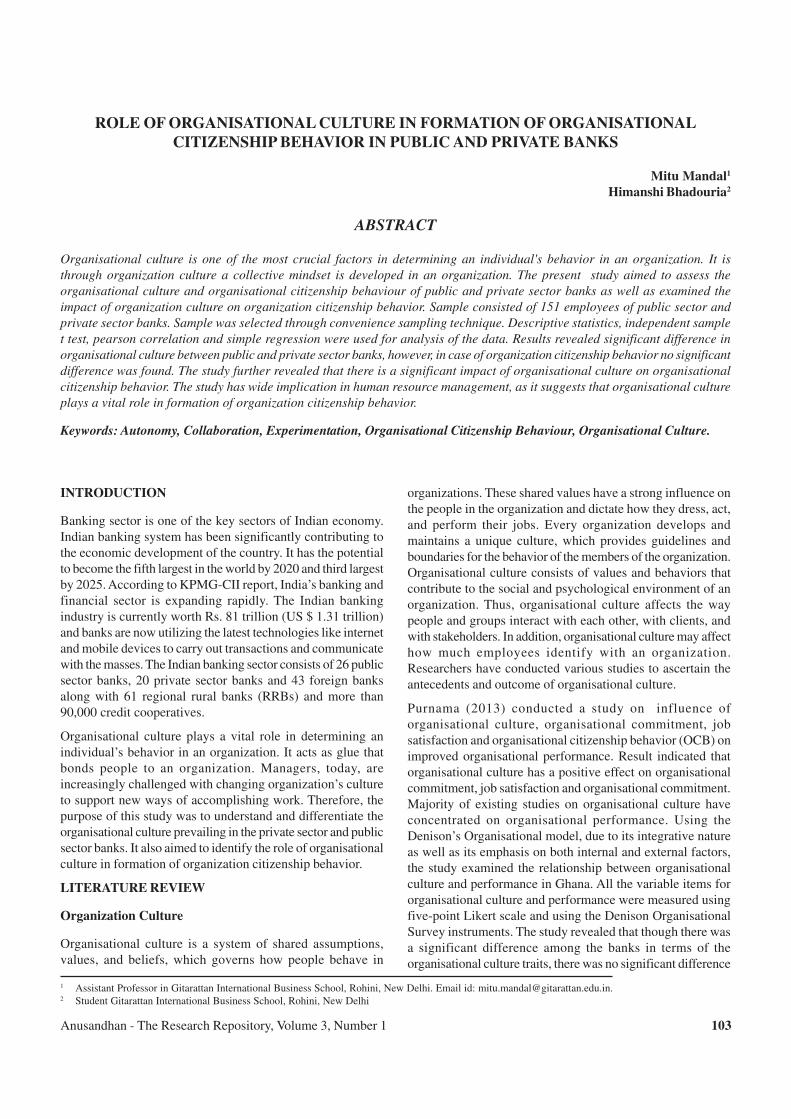
Anusandhan - The Research Repository, Volume 3, Number 1 103
ROLE OF ORGANISATIONAL CULTURE IN FORMATION OF ORGANISATIONAL
CITIZENSHIP BEHAVIOR IN PUBLIC AND PRIVATE BANKS
Mitu Mandal1
Himanshi Bhadouria2
ABSTRACT
Organisational culture is one of the most crucial factors in determining an individual's behavior in an organization. It is
through organization culture a collective mindset is developed in an organization. The present study aimed to assess the
organisational culture and organisational citizenship behaviour of public and private sector banks as well as examined the
impact of organization culture on organization citizenship behavior. Sample consisted of 151 employees of public sector and
private sector banks. Sample was selected through convenience sampling technique. Descriptive statistics, independent sample
t test, pearson correlation and simple regression were used for analysis of the data. Results revealed significant difference in
organisational culture between public and private sector banks, however, in case of organization citizenship behavior no significant
difference was found. The study further revealed that there is a significant impact of organisational culture on organisational
citizenship behavior. The study has wide implication in human resource management, as it suggests that organisational culture
plays a vital role in formation of organization citizenship behavior.
Keywords: Autonomy, Collaboration, Experimentation, Organisational Citizenship Behaviour, Organisational Culture.
1 Assistant Professor in Gitarattan International Business School, Rohini, New Delhi. Email id: [email protected] Student Gitarattan International Business School, Rohini, New Delhi
INTRODUCTION
Banking sector is one of the key sectors of Indian economy.
Indian banking system has been significantly contributing to
the economic development of the country. It has the potential
to become the fifth largest in the world by 2020 and third largest
by 2025. According to KPMG-CII report, India’s banking and
financial sector is expanding rapidly. The Indian banking
industry is currently worth Rs. 81 trillion (US $ 1.31 trillion)
and banks are now utilizing the latest technologies like internet
and mobile devices to carry out transactions and communicate
with the masses. The Indian banking sector consists of 26 public
sector banks, 20 private sector banks and 43 foreign banks
along with 61 regional rural banks (RRBs) and more than
90,000 credit cooperatives.
Organisational culture plays a vital role in determining an
individual’s behavior in an organization. It acts as glue that
bonds people to an organization. Managers, today, are
increasingly challenged with changing organization’s culture
to support new ways of accomplishing work. Therefore, the
purpose of this study was to understand and differentiate the
organisational culture prevailing in the private sector and public
sector banks. It also aimed to identify the role of organisational
culture in formation of organization citizenship behavior.
LITERATURE REVIEW
Organization Culture
Organisational culture is a system of shared assumptions,
values, and beliefs, which governs how people behave in
organizations. These shared values have a strong influence on
the people in the organization and dictate how they dress, act,
and perform their jobs. Every organization develops and
maintains a unique culture, which provides guidelines and
boundaries for the behavior of the members of the organization.
Organisational culture consists of values and behaviors that
contribute to the social and psychological environment of an
organization. Thus, organisational culture affects the way
people and groups interact with each other, with clients, and
with stakeholders. In addition, organisational culture may affect
how much employees identify with an organization.
Researchers have conducted various studies to ascertain the
antecedents and outcome of organisational culture.
Purnama (2013) conducted a study on influence of
organisational culture, organisational commitment, job
satisfaction and organisational citizenship behavior (OCB) on
improved organisational performance. Result indicated that
organisational culture has a positive effect on organisational
commitment, job satisfaction and organisational commitment.
Majority of existing studies on organisational culture have
concentrated on organisational performance. Using the
Denison’s Organisational model, due to its integrative nature
as well as its emphasis on both internal and external factors,
the study examined the relationship between organisational
culture and performance in Ghana. All the variable items for
organisational culture and performance were measured using
five-point Likert scale and using the Denison Organisational
Survey instruments. The study revealed that though there was
a significant difference among the banks in terms of the
organisational culture traits, there was no significant difference
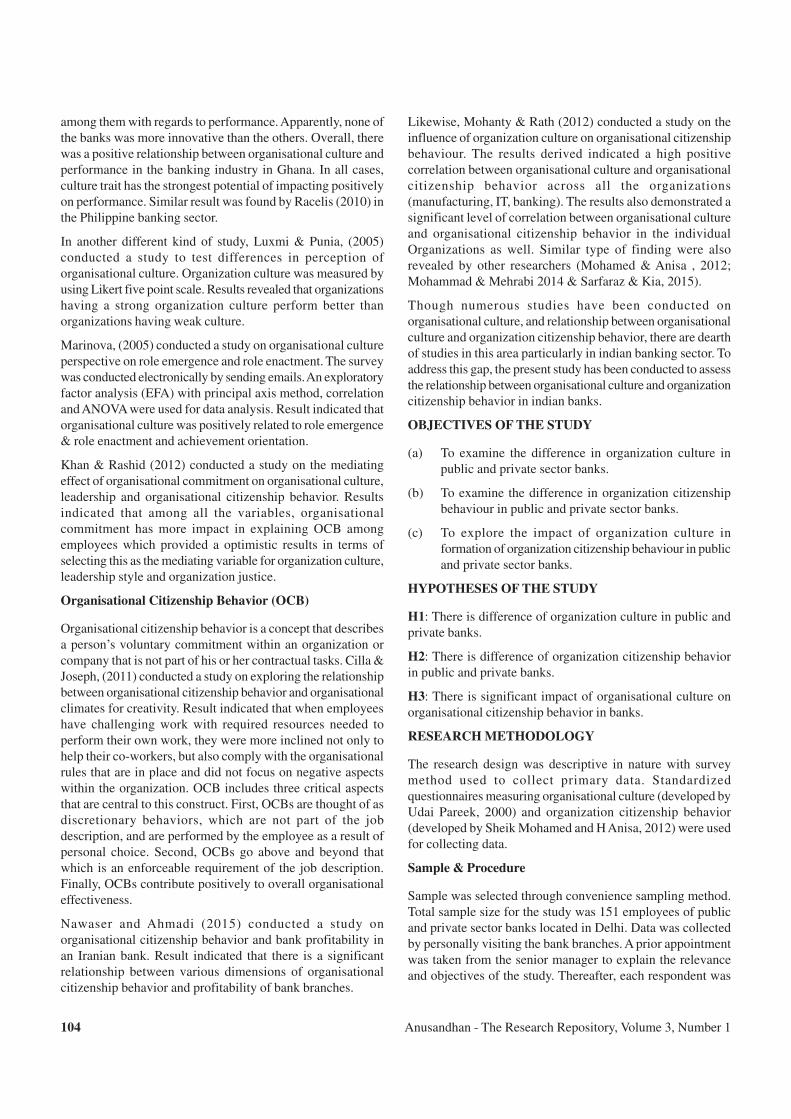
Anusandhan - The Research Repository, Volume 3, Number 1104
among them with regards to performance. Apparently, none of
the banks was more innovative than the others. Overall, there
was a positive relationship between organisational culture and
performance in the banking industry in Ghana. In all cases,
culture trait has the strongest potential of impacting positively
on performance. Similar result was found by Racelis (2010) in
the Philippine banking sector.
In another different kind of study, Luxmi & Punia, (2005)
conducted a study to test differences in perception of
organisational culture. Organization culture was measured by
using Likert five point scale. Results revealed that organizations
having a strong organization culture perform better than
organizations having weak culture.
Marinova, (2005) conducted a study on organisational culture
perspective on role emergence and role enactment. The survey
was conducted electronically by sending emails. An exploratory
factor analysis (EFA) with principal axis method, correlation
and ANOVA were used for data analysis. Result indicated that
organisational culture was positively related to role emergence
& role enactment and achievement orientation.
Khan & Rashid (2012) conducted a study on the mediating
effect of organisational commitment on organisational culture,
leadership and organisational citizenship behavior. Results
indicated that among all the variables, organisational
commitment has more impact in explaining OCB among
employees which provided a optimistic results in terms of
selecting this as the mediating variable for organization culture,
leadership style and organization justice.
Organisational Citizenship Behavior (OCB)
Organisational citizenship behavior is a concept that describes
a person’s voluntary commitment within an organization or
company that is not part of his or her contractual tasks. Cilla &
Joseph, (2011) conducted a study on exploring the relationship
between organisational citizenship behavior and organisational
climates for creativity. Result indicated that when employees
have challenging work with required resources needed to
perform their own work, they were more inclined not only to
help their co-workers, but also comply with the organisational
rules that are in place and did not focus on negative aspects
within the organization. OCB includes three critical aspects
that are central to this construct. First, OCBs are thought of as
discretionary behaviors, which are not part of the job
description, and are performed by the employee as a result of
personal choice. Second, OCBs go above and beyond that
which is an enforceable requirement of the job description.
Finally, OCBs contribute positively to overall organisational
effectiveness.
Nawaser and Ahmadi (2015) conducted a study on
organisational citizenship behavior and bank profitability in
an Iranian bank. Result indicated that there is a significant
relationship between various dimensions of organisational
citizenship behavior and profitability of bank branches.
Likewise, Mohanty & Rath (2012) conducted a study on the
influence of organization culture on organisational citizenship
behaviour. The results derived indicated a high positive
correlation between organisational culture and organisational
citizenship behavior across all the organizations
(manufacturing, IT, banking). The results also demonstrated a
significant level of correlation between organisational culture
and organisational citizenship behavior in the individual
Organizations as well. Similar type of finding were also
revealed by other researchers (Mohamed & Anisa , 2012;
Mohammad & Mehrabi 2014 & Sarfaraz & Kia, 2015).
Though numerous studies have been conducted on
organisational culture, and relationship between organisational
culture and organization citizenship behavior, there are dearth
of studies in this area particularly in indian banking sector. To
address this gap, the present study has been conducted to assess
the relationship between organisational culture and organization
citizenship behavior in indian banks.
OBJECTIVES OF THE STUDY
(a) To examine the difference in organization culture in
public and private sector banks.
(b) To examine the difference in organization citizenship
behaviour in public and private sector banks.
(c) To explore the impact of organization culture in
formation of organization citizenship behaviour in public
and private sector banks.
HYPOTHESES OF THE STUDY
H1: There is difference of organization culture in public and
private banks.
H2: There is difference of organization citizenship behavior
in public and private banks.
H3: There is significant impact of organisational culture on
organisational citizenship behavior in banks.
RESEARCH METHODOLOGY
The research design was descriptive in nature with survey
method used to collect primary data. Standardized
questionnaires measuring organisational culture (developed by
Udai Pareek, 2000) and organization citizenship behavior
(developed by Sheik Mohamed and H Anisa, 2012) were used
for collecting data.
Sample & Procedure
Sample was selected through convenience sampling method.
Total sample size for the study was 151 employees of public
and private sector banks located in Delhi. Data was collected
by personally visiting the bank branches. A prior appointment
was taken from the senior manager to explain the relevance
and objectives of the study. Thereafter, each respondent was

Anusandhan - The Research Repository, Volume 3, Number 1 105
personally approached and responses were obtained through
the standardized questionnaires.
Measures
The organizational culture questionnaire measures
organisational culture in terms of eight values which deals with
the extent to which openness, confrontation, trust, autonomy,
pro-activity, authenticity, collaboration & experimentation are
valued and promoted in the organizations. It was developed
by Udai Pareek. Respondents rate their organizations on these
eight values, using a four-point scale ranging from 1- 4, where
1 implied that the value is rarely shared among the employees
and 4 implied the value is widely shared among the employees.
The questionnaire consisted of 22 statements encompassing
all the eight values.
Following is the detailed description of eight values:
(a) Openness: Freedom to communicate, share and interact
without hesitation,
(b) Confrontation: Facing the problems and challenges
boldly and not shying away,
(c) Trust: Maintaining the confidentiality of information
shared by others and company,
(d) Autonomy: Using and giving freedom to plan and act in
one’s own sphere,
(e) Pro-activity: Taking initiative, preplanning and taking
preventive action,
(f) Authenticity: Congruence between what one feels and
says,
(g) Collaboration: Giving help to and accepting help from
others in team, and
(h) Experimentation: Using and encouraging innovative
approaches to solve problems
Organisational citizenship behavior was measured by using
standardized questionnaire developed by Sheik Mohamed and
H Anisa (2012). The questionnaire consisted of eight (8)
statements and responses were recorded through a five point
likert scale, where 1 implied strongly disagree and 5 implied
strongly agree. The respondents rated their agreement on each
statement measuring organisational citizenship behaviour.
Data Processing & Analysis
Collected data were analyzed by computing mean, SD,
independent t and pearson product moment correlation and
simple regression techniques. Mean was calculated to assess
the average score of organisational culture and organisational
citizenship behavior of employees of both private sector and
public sector banks. Independent t test was computed to
ascertain the significant difference in organisational culture
and organisational citizenship behavior between public and
private sector banks. Correlation was computed to examine
the relationship between organisational culture and
organisational citizenship behavior. Simple regression was
calculated to assess the impact of organisational culture on
organisational citizenship behavior.
RESULTS & DISCUSSION
Reliability Analysis of the Questionnaires
The questionnaires used for measuring organisational culture
and organisational citizenship behaviour were tested for
reliability. Table 1 depicts Cronbach’s Alpha value of the
questionnaires. Both the questionnaires were found to be
reliable as the cronbach’s value were 0.84 and 0.87 for
organizational culture and organizational citizenship behavior
respectively.
Demographic Analysis
After the collection of data, demographic analysis was
conducted to examine the percentage of respondents in each
category such as age, gender, educational qualification and type
of organization. Table 2 depicts the total respondents
participated in the study. Respondents were of different age
groups with varying education levels. According to the age,
the respondents were divided into three categories: below 21-
35, 36-50 and above 50. Table 2 shows, 44% comprised of
males and 56% comprised of females; 79 respondents were
graduate with a percentage of 52% and 72 were postgraduate
with a percentage of 48%; 74 employees belong to private
sector bank and 77 employees belong to public sector bank;
36 % belong to 36-50 age group, maximum (52%) are
graduates.
Table 1: Reliability Analysis
S. No. Variables No. of items Cronbach’s Alpha
1.
2.
Organization Culture
Organization Citizenship Behaviour
25
8
0.84
0.87
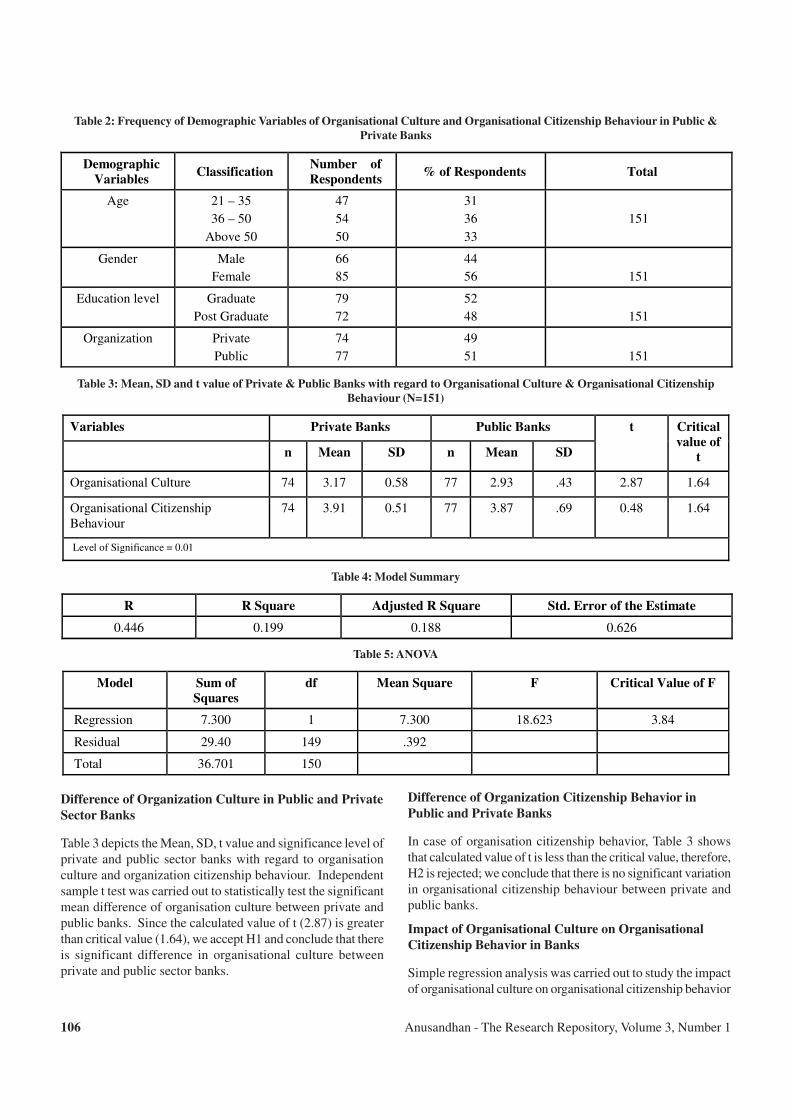
Anusandhan - The Research Repository, Volume 3, Number 1106
Table 2: Frequency of Demographic Variables of Organisational Culture and Organisational Citizenship Behaviour in Public &
Private Banks
Demographic
Variables Classification
Number of
Respondents % of Respondents Total
Age 21 – 35
36 – 50
Above 50
47
54
50
31
36
33
151
Gender Male
Female
66
85
44
56
151
Education level Graduate
Post Graduate
79
72
52
48
151
Organization Private
Public
74
77
49
51
151
Table 3: Mean, SD and t value of Private & Public Banks with regard to Organisational Culture & Organisational Citizenship
Behaviour (N=151)
Variables Private Banks Public Banks
n Mean SD n Mean SD
t Critical
value of
t
Organisational Culture 74 3.17 0.58 77 2.93 .43 2.87 1.64
Organisational Citizenship Behaviour
74 3.91 0.51 77 3.87 .69 0.48 1.64
Level of Significance = 0.01
Table 4: Model Summary
R R Square Adjusted R Square Std. Error of the Estimate
0.446 0.199 0.188 0.626
Table 5: ANOVA
Model Sum of
Squares
df Mean Square F Critical Value of F
Regression 7.300 1 7.300 18.623 3.84
Residual 29.40 149 .392
Total 36.701 150
Difference of Organization Culture in Public and Private
Sector Banks
Table 3 depicts the Mean, SD, t value and significance level of
private and public sector banks with regard to organisation
culture and organization citizenship behaviour. Independent
sample t test was carried out to statistically test the significant
mean difference of organisation culture between private and
public banks. Since the calculated value of t (2.87) is greater
than critical value (1.64), we accept H1 and conclude that there
is significant difference in organisational culture between
private and public sector banks.
Difference of Organization Citizenship Behavior in
Public and Private Banks
In case of organisation citizenship behavior, Table 3 shows
that calculated value of t is less than the critical value, therefore,
H2 is rejected; we conclude that there is no significant variation
in organisational citizenship behaviour between private and
public banks.
Impact of Organisational Culture on Organisational
Citizenship Behavior in Banks
Simple regression analysis was carried out to study the impact
of organisational culture on organisational citizenship behavior
Anusandhan - The Research Repository, Volume 3, Number 1 107
in banks. Table 4, 5 and 6 depicts the results of regression
analysis.
The R square value of 0.199 in Table 4 implies that
organisational culture only explains 19.9% of variation in
organisational citizenship behaviour. This means organisational
citizenship behaviour is determined by many other variables
which are not included in the study.
Table 5 shows corresponding ANOVA values from the
regression model. Since calculated F value (18.623) is greater
than critical value (3.84) with (1,149) degrees of freedom,
therefore, H3 is accepted. We, thus, conclude that
organisational culture has significant impact on organisational
citizenship behavior.
CONCLUSION
The present study was conducted to assess role of organisational
culture in formation of organisational citizenship behavior in
banks. Following conclusion can be drawn from the study:
(a) There is a significant difference in organisational culture
between private and public sector bank.
(b) There is no significant difference in organisational
citizenship behavior between private and public sector
bank.
(c) Organisational culture has come out to be predictor of
organisational citizenship behavior in banks.
Hence, it is concluded that organisational culture has a vital
role in formation of organizational citizenship behavior.
REFERENCES
1. Cilla, Joseph, M. (2011). Exploring the relationship
between organizational citizenship behavior and
organizational climates for creativity (Master’s Thesis,
University of Maryland, United States). Retrieved from
http://drum.lib.umd.edu/bitstream/handle.
2. Khan, S.K. & Rashid, M.Z.A. (2012). The Mediating
Effect of Organizational Commitment in the
Organizational Culture, Leadership and Organizational
Justice Relationship with Organizational Citizenship
Behavior: A Study of Academicians in Private Higher
Learning Institutions in Malaysia. International Journal
of Business and Social Science, 3, 8, pp. 83-91.
3. Luxmi & Punia, B.K (2005). Organizational culture in
service sector an exploration, Delhi Business Review Vol.
6, 13,2, pp. 45-51.
4. Mohamed, S. & Anisa, H (2012). Relationship between
Organisational commitment and Organisational
Citizenship Behaviour, IUP Journal of Organizational
Behavior, 11(3), pp. 7-22.
5. Marinova, S. (2005). An organizational culture perspective
on role emergence and role enactment. Retrieved from
www.drum.lib.umd.edu.
6. Mohammad, J, & Mehrabi F, (2014). The Investigating of
Relationship between Organisational Culture and
Organisational Citizenship Behavior, 5(2014), The IUP
Journal of organisational Behavior 4, pp.106-108.
7. Mohanty J & Rath B.P (2012). Influence of Organization
culture on Organisational Citizenship Behaviour. Global
Journal of Business Research, 6,1, pp. 65-76.
8. Nawaser, K, Ahmadi M, (2015). Organisational
Citizenship Behavior and Bank Profitability: Examining
Relationships in an Iranian Bank, Asian Social Science,11
(12), pp. 11-24.
9. Purnama, C. (2013). Influence Analysis of Organisational
Culture, Organisational Commitment, Job Satisfaction and
Organisational Citizenship Behavior (OCB) Toward
Improved Organisational Performance, International
Journal of Business, Humanities and Technology, 3(5),
pp. 86-100.
10. Racelis, A.D. (2010).The relationship between
organisational culture and organisational performance in
the Philippine banks, Social Science Diliman ,vol.6 (2),
pp. 29-49.
11. Sarafraz, S.A. & Kia, A.R. (2015). Examining the
Relationship between Organisational Culture and
Organisational Citizenship Behavior in the Social Security
Branches of Khorramabad”, MAGNT Research Reports,
3(1), pp. 368-376.
12. Sofiah K. K. & Rashid, M.Z. (2012),The Mediating Effect
of Organisational Commitment in the Organisational
Culture, Leadership and Organisational Justice
Relationship with Organisational Citizenship Behavior,
International Journal of Business and Social Science, 3(8),
pp. 83-91.
Anusandhan - The Research Repository, Volume 3, Number 1108
ROLE OF APPRAISAL TECHNIQUES ON EMPLOYEE SATISFACTION
WITH EMPHASIS ON E-COMMERCE FIRMS
Meetali Bahl1
Rajni Yadav2
ABSTRACT
Performance appraisal is among the most critical Human Resource function that brings global success for the organization.
The current study aims to examine the relationship of employee performance appraisal system and employee satisfaction. The
research consisted of a sample of 100 employees working in e-commerce companies in Delhi-NCR. The data was collected by
convenient sampling technique with the help of adopted questionnaire. The reliability of the instruments used is reaffirmed
which is accordance with the required standards. After applying Pearson's correlation and linear regression the results show
that there is a positive relationship between employee performance appraisal system and employee satisfaction.
Keywords: Appraisal Systems, Correlation, Job Satisfaction, Performance Evaluation, Regression.
1 Assistant Professor, Gitarattan International Business School, Rohini, New Delhi. Email: [email protected] Student, Gitarattan International Business School, Rohini, New Delhi
INTRODUCTION
Electronic commerce, commonly written as e-commerce, is
the trading or facilitation of trading in products or services
using computer networks, such as the Internet. Electronic
commerce draws on technologies such as mobile commerce,
electronic funds transfer, supply chain management, Internet
marketing, online transaction processing, electronic data
interchange (EDI), inventory management systems, and
automated data collection systems. Modern electronic
commerce typically uses the World Wide Web for at least one
part of the transaction’s life cycle, although it may also use
other technologies such as e-mail.
The benefits of e-commerce include its round-the-clock
availability, the speed of access, a wider selection of goods
and services, accessibility and international reach. It’s perceived
downsides include sometimes-limited customer service, not
being able to see or touch a product prior to purchase, and the
necessitated wait time for product shipping.
LITERATURE REVIEW
Karimi, Malik and Hussain (2011) conducted a study on
examining the relationship of performance appraisal system
and employee satisfaction. Based on the responses of 53 male
& 48 female respondents the results revealed that there is a
positive and significant relationship between performance
appraisal system and their satisfaction.
Poornima and Manohar (2015) attempted to study the impact
of performance appraisal in one way or other and the same has
some impact on the satisfaction level of the employees over a
period of time. IT companies were selected based on their
revenue released by the third quarter for the year 2014. A
multiple regression analysis was used to test the hypothesis
and it was found that hypothesis being considered by the
researcher is partially accepted and partially rejected.
Abdelhadi et al (2015) conducted the study and identified that
the appraisers and appraise don’t respond favorably to
performance appraisal system unless they find it equitable. The
goal of performance appraisal (PA) is to improve employees’
contribution to organizational goals & work performance.
Employee satisfaction with the PA plays an essential role in
their long-term efficiency. A negative reaction toward the PA
can ruin the entire PA system even if it was built meticulously.
Akinbowale, Jinabhai and Lourens (2013) carried out a study
in which the investigation was focused on performance
appraisal policy & its impact on employee performance in
Guaranty Trust Bank in Nigeria. The result revealed that the
employee participation in the performance appraisal was
generally high and this increased job satisfaction & enhanced
employee performance.
Khan (2013) conducted a research to study the role of
Performance Appraisal system on employee motivation. In this
study a model had been developed in stability to assess
employee. The manager gives an employee a performance
appraisal with a view of affecting the employee’s self-
perception, and the employee’s perception of the manager’s
ability to assess performance and also helped to do the
examination that how performance appraisals affect the
employee’s future performance. The predictions of this model
were consistent with various empirical findings. These were
comprised of (a) the observation that managers tend to give
positive appraisals, (b) the finding that on average positive
appraisals motivate more than negative appraisals, and (c) the
observation that the effects of appraisals depend on the
employee’s perception of the manager’s ability to assess
performance accurately.

Anusandhan - The Research Repository, Volume 3, Number 1 109
Moulik and Mazumdar (2012) conducted empirical study on
exploring the relationship between perceived uses of appraisals
and performance appraisal satisfaction in the Indian IT sector.
Performance appraisals provide a vehicle for managing and
developing human resources by virtue of linkages to sub
functions such as training, compensation, internal mobility
decisions and so on. Performance appraisals have been cited
to be of developmental and administrative uses.
Chandio (2014) conducted a study to investigate the employees’
job satisfaction by length of service and employment status.
The study concluded that employees have same level of job
satisfaction amongst both the groups of employee’s i.e,
permanent and casual employees by status; therefore,
employee’s status does not have any impact on the job
satisfaction of the employees of the organization. Similarly,
employee’s job satisfaction by service length groups has been
also analyzed. It was concluded from the result that service
length does not have any impact on the job satisfaction of the
employees in the organization.
Mahajan and Raheja (2014) conducted a study among
educational institutes of Jalandhar to examine the relationship
between Employees Satisfaction on Performance Appraisal
System with Fairness of the System. The findings showed that
maximum numbers of respondents (faculty members) were
satisfied with their Performance Appraisal System. The findings
also revealed that there was a positive relationship between
employees’ satisfaction on performance appraisal system with
fairness of the system.
Virani (2012) conducted an analytical study on Performance
appraisal system of ITES companies. The research reveals that
majority of respondents of the selected ITES companies are in
the agreement with their existing performance appraisal system.
Daoanis (2012) undertook a study to examine the status of
performance appraisal system of Nass Construction Company
in terms of reliability and validity, quality and effectiveness.
The result of the study showed that the performance appraisal
system of the company is in place, aligned with the vision and
mission of the company and is accurate in terms of content
and purpose. On the other hand, the results reflected that the
performance appraisal system has brought about both positive
and negative impact on the employees performance which arose
the need to revisit and redesign the appraisal system that is
aligned to its vision and mission towards the attainment of its
organizational goals.
RESEARCH METHODOLOGY
The present study is empirical in nature and is based on primary
data of 100 respondents from e-commerce firms in Gurgaon.
A self structured questionnaire was used as the major tool for
collecting primary data. Data is analyzed through correlation
and regression for studying the relationship between
performance appraisal and employee satisfaction. Where,
performance appraisal is independent variable and employee
satisfaction is dependent variable. As far as significance of
gender on employee satisfaction is concerned, t-test is used
and for studying the significance of different age groups on
employee satisfaction, One Way Anova is used.
OBJECTIVES OF THE STUDY
(a) To study the relationship between performance appraisal
and employee satisfaction in e-commerce firm.
(b) To study the difference in employee satisfaction with
respect to the gender of an employee.
(c) To study the difference in employee satisfaction among
different age groups of employees.
HYPOTHESIS
H1: There is significant impact of performance appraisal on
employee satisfaction in e-commerce firm.
H2: There is significant difference in employee satisfaction
with respect to Gender of employees.
H3: There is significant difference in employee satisfaction
with respect to Age of employees.
ANALYSIS & RESULTS
Relationship between performance appraisal and
employee satisfaction in e-commerce firm
To determine the impact of performance appraisal on the
employee satisfaction in e-commerce firms, correlation and
regression analysis was performed. Table 1 shows that
correlation coefficient between performance appraisal and
employees’ satisfaction is only 0.484. However, p value (0.00)
is less than 0.01 level of significance. Hence we conclude that
relationship between performance appraisal and employee
satisfaction is correlated significantly; though the strength of
relationship is weak as shown by R-square value of 0.235 in
Table 2.
Table 3 indicates the regression equation is:
Employee Satisfaction = 25.552 + .617 (performance
appraisal).
Since p value (0.000) of the regression model of is less than
level of significance (0.01), we conclude that impact of
performance appraisal on employee satisfaction in e-commerce
firms is statistically significant.
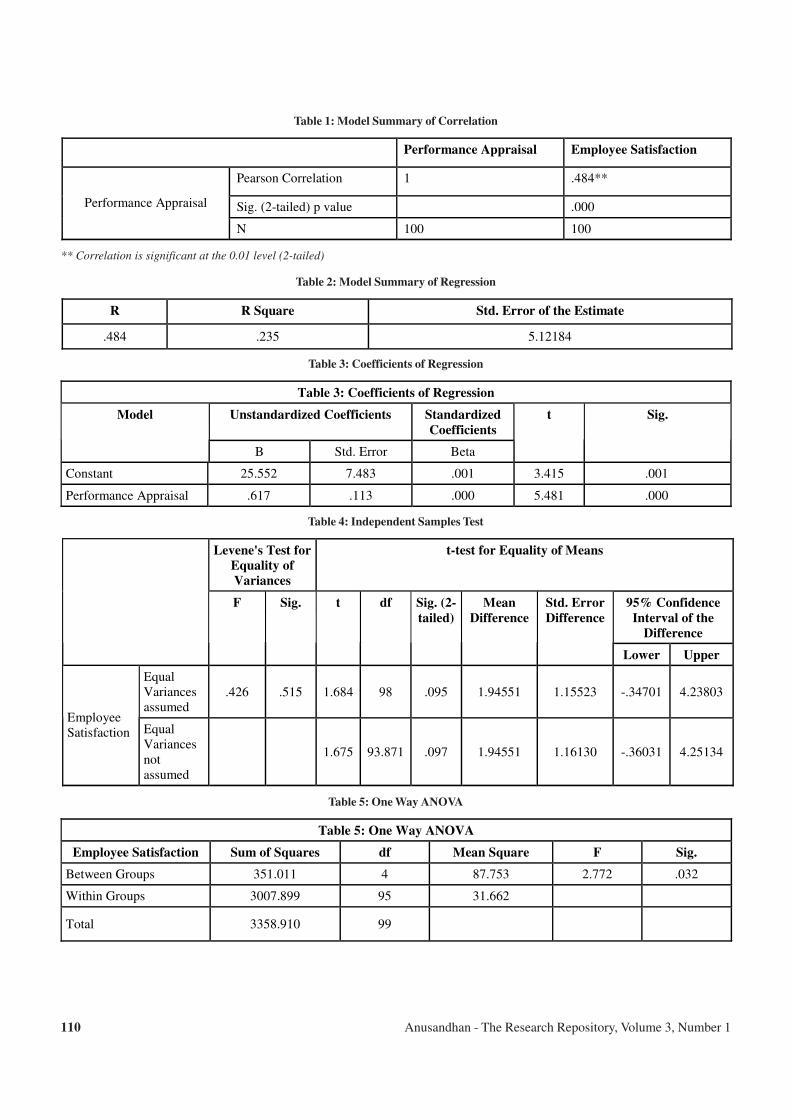
Anusandhan - The Research Repository, Volume 3, Number 1110
Table 1: Model Summary of Correlation
Performance Appraisal Employee Satisfaction
Pearson Correlation 1 .484**
Sig. (2-tailed) p value .000 Performance Appraisal
N 100 100
** Correlation is significant at the 0.01 level (2-tailed)
Table 2: Model Summary of Regression
R R Square Std. Error of the Estimate
.484 .235 5.12184
Table 3: Coefficients of Regression
Table 3: Coefficients of Regression
Unstandardized Coefficients Standardized
Coefficients
Model
B Std. Error Beta
t Sig.
Constant 25.552 7.483 .001 3.415 .001
Performance Appraisal .617 .113 .000 5.481 .000
Table 4: Independent Samples Test
Levene's Test for
Equality of
Variances
t-test for Equality of Means
95% Confidence
Interval of the
Difference
F Sig. t df Sig. (2-
tailed)
Mean
Difference
Std. Error
Difference
Lower Upper
Equal Variances assumed
.426 .515 1.684 98 .095 1.94551 1.15523 -.34701 4.23803
Employee Satisfaction Equal
Variances not assumed
1.675 93.871 .097 1.94551 1.16130 -.36031 4.25134
Table 5: One Way ANOVA
Table 5: One Way ANOVA
Employee Satisfaction Sum of Squares df Mean Square F Sig.
Between Groups 351.011 4 87.753 2.772 .032
Within Groups 3007.899 95 31.662
Total 3358.910 99

Anusandhan - The Research Repository, Volume 3, Number 1 111
Difference in Employee Satisfaction with respect to
Gender of Employees
In Table 4, the corresponding two-tailed p-values come out to
be 0.095 and 0.097 which are more than the significance level
of 0.05. Hence, it is concluded that there is no significant
relationship in Employee Satisfaction with respect to Gender.
Difference in Employee Satisfaction with respect to Age
of Employees
Table 5 shows employees’ satisfaction within different age
groups. Since the p value of 0.032 is less than the significance
level of 0.05; therefore, it is concluded that there is a difference
in employees’ satisfaction among different age groups of
employees.
CONCLUSION
There is a significant impact of the role of performance
appraisal on employee satisfaction in e-commerce firms. It is
also evident that there is no significant relationship in employee
satisfaction with respect to gender; but, there is a significant
relationship in employees’ satisfaction with respect to age.
REFERENCES
1. Akinbowale, Michael A, Jinabhai, Dinesh C. and Lourens,
Melanie E. (2013), “The Impact of Performance Appraisal
Policy on Employee Performance”, Mediterranean Journal
of Social Sciences, Vol. 4 No. 14.
2. Daoanis, Liza, Estino (2012), “Performance Appraisal
System: It’s Implication To Employee Performance”,
International Journal of Economics and Management
Sciences, Vol. 2, No. 3, pp. 55-62.
3. Haq, Sirajul and Chandio, Javed, Ahmed (2014),
“Employees Job Satisfaction: Analyzing the satisfaction
by length of Service and Employment status”, International
Journal of Management Sciences and Business Research,
Vol. 3, Issue 2.
4. Karimi, Rabia; Malik, Muhamad, Imran and Hussain,
Saddam (2011), “Examining the Relationship of
Performance Appraisal System and Employee
Satisfaction”, International Journal of Business and Social
Science, Vol. 2, No. 22.
5. Khan, Muhammad, Faseehullah (2013), “Role of
Performance Appraisal System on Employees
Motivation”, IOSR Journal of Business and Management,
Vol., Issue 4. pp 66-83.
6. Mahajan, Supriya and Raheja, Saloni (2014), “Examine
Relationship between Employees Satisfaction on
Performance Appraisal System with Fairness of the
System”, Asian J. Management 5(1), pp. 49-54.
7. Moulik, Sujoya, Ray and Mazumdar, Sitanath (2012),
“Exploring the relationship between perceived uses of
appraisals and performance appraisal satisfaction in the
Indian IT sector: an empirical study”, International Journal
of Business and Social Research (IJBSR), Vol. 2, No. 5.
8. Naji, Abdelhadi; Jamal; Mansour, Ben & Leclerc, André.
(2015), “Performance Appraisal System and Employee
Satisfaction: The role of trust towards supervisors”, Journal
of Human Resources Management and Labor Studies, Vol.
3, No. 1, pp. 40-53.
9. V. Poornima and Manohar, S. John (2015), “Performance
Appraisal System and Employee Satisfaction among its
Employees in Bangalore”, International Journal of Science
and Research (IJSR), Vol., 4 Issue 3.
10. Virani, Shreya, Rustum (2012), “An Analytical Study of
Performance Appraisal System of the Selected Information
Technology Enabled Services (ITES) Companies”,
International Journal of Multidisciplinary Research, Vol.2,
Issue 5.

Gitarattan International Business School was established in the year 2004. The Institute is affiliated to Guru Gobind Singh Indraprastha (GGSIP) University, Delhi and is approved by All India Council for Technical Education (AICTE), Ministry of HRD, Government of India. It is accredited by National Assessment & Accreditation Council (NAAC) and is ISO 9001: 2008 certified. The Institute has been awarded category 'A' by Quality Audit Cell of GGSIP University and Joint Assessment Committee of Government National Capital Territory of Delhi & GGSIP University. The Institute is conducting MBA, MBA (IB), MCA & MCA (Dual Degree) courses. The Institute aims to develop future corporate leaders in the field of management & computer science to effectively guide business enterprises and be entrepreneurs.
GITARATTAN INTERNATIONAL BUSINESS SCHOOL(Affiliated to GGSIP University, Delhi & Approved by AICTE, MHRD, GOI)
(NAAC Accredited & ISO 9001:2008 Certified Institution)PSP 2A & 2B - Complex II, Madhuban Chowk, Rohini, Delhi – 110 085
Phone: 011 – 2755 5607 / 08; Fax: 011 – 2755 5609Web: www.gitarattan.edu.in