The relative importance of deforestation, precipitation change, and temperature sensitivity in...
12
The relative importance of deforestation, precipitation change, and temperature sensitivity in determining the future distributions and diversity of Amazonian plant species KENNETH J. FEELEY* † , YADVINDER MALHI ‡ , PRZEMYSLAW ZELAZOWSKI ‡ andMILES R. SILMAN §¶ *Department of Biological Sciences, Florida International University, Miami, FL USA, †Center for Tropical Plant Conservation, Fairchild Tropical Botanic Garden, Miami, FL USA, ‡Environmental Change Institute, School of Geography and the Environment, University of Oxford, Oxford, Oxon UK, §Department of Biology, Wake Forest University, Winston-Salem, NC USA, ¶Biodiversity and Ecosystem Services Group, Center for Energy, Environment, and Sustainability, Wake Forest University, Winston-Salem, NC USA Abstract Tropical forests are threatened by many human disturbances – two of the most important of which are deforestation and climate change. To mitigate the impacts of these disturbances, it is important to understand their potential effects on the distributions of species. In the tropics, such understanding has been hindered by poor knowledge of the cur- rent distributions and range limits of most species. Here, we use herbarium collection records to model the current and future distributions of ca. 3000 Amazonian plant species. We project these distributions into the future under a range of different scenarios related to the magnitude of climate change and extent of deforestation as well as the response of species to changes in temperature, precipitation, and atmospheric concentrations of CO 2 . We find that the future of Amazonian diversity will be dependant primarily on the ability of species to tolerate or adapt to rising tem- peratures. If the thermal niches of tropical plant species are fixed and incapable of expanding under rapid warming, then the negative effects of climate change will overshadow the effects of deforestation, greatly reducing the area of suitable habitat available to most species and potentially leading to massive losses of biodiversity throughout the Amazon. If tropical species are generally capable of tolerating warmer temperatures, rates of habitat loss will be greatly reduced but many parts of Amazonia may still experience rapid losses of diversity, with the effects of enhanced seasonal water stress being similar in magnitude to the effects of deforestation. Keywords: biodiversity informatics, extinction, global warming, natural history collections, species distribution models, species migrations Received 2 January 2012 and accepted 7 March 2012 Introduction The distributions of species are predicted to shift, or ‘migrate’, under climate change (Thuiller, 2007; Walther et al., 2002). This prediction is supported by paleo- ecological studies showing shifts in species’ historical ranges concurrent with past climate changes (Bush et al., 2004; Petit et al., 2008) as well as a growing num- ber of recent studies showing shifts in modern species distributions (e.g., Bertrand et al., 2011; Chen et al., 2011; Crimmins et al., 2011; Feeley, 2012; Feeley et al., 2011; Forero-Medina et al., 2011; Parmesan, 2006). Distributional shifts will be especially important for tropical species due to greater spatial distances between current temperatures and their future analogs in the tropics than in temperate zones (Beaumont et al., 2011; Wright et al., 2009) and generally narrower climatic niches due to a higher degree of climatic stability (on daily, seasonal, interannual and longer-term timescales) and higher niche specialization (Deutsch et al., 2008; Janzen, 1967; McCain, 2009; Sheldon et al., 2011; Sunday et al., 2011; Terborgh, 1973). As a result, tropical species are predicted to lose climatically suitable habitat faster and will have to migrate greater distances to keep within their suitable climates than will temperate spe- cies (Loarie et al., 2009; Malcolm et al., 2002; Wright et al., 2009). Furthermore, for much of the moist low- land tropics, future climates will have no nearby analog (Williams et al., 2007; Wright et al., 2009), meaning that rate of local extinction may exceed colonization, Correspondence: Kenneth J. Feeley, tel. + 1 305 348 7316, fax + 1 305 348 1986, e-mail: [email protected] 2636 © 2012 Blackwell Publishing Ltd Global Change Biology (2012) 18, 2636–2647, doi: 10.1111/j.1365-2486.2012.02719.x
-
Upload
independent -
Category
Documents
-
view
0 -
download
0
Transcript of The relative importance of deforestation, precipitation change, and temperature sensitivity in...

The relative importance of deforestation, precipitationchange, and temperature sensitivity in determining thefuture distributions and diversity of Amazonian plantspeciesKENNETH J . F EELEY * † , YADV INDER MALH I ‡ , P RZEMYSLAW ZELAZOWSK I ‡ and MILES
R. SILMAN§¶
*Department of Biological Sciences, Florida International University, Miami, FL USA, †Center for Tropical Plant Conservation,
Fairchild Tropical Botanic Garden, Miami, FL USA, ‡Environmental Change Institute, School of Geography and the Environment,
University of Oxford, Oxford, Oxon UK, §Department of Biology, Wake Forest University, Winston-Salem, NC USA,
¶Biodiversity and Ecosystem Services Group, Center for Energy, Environment, and Sustainability, Wake Forest University,
Winston-Salem, NC USA
Abstract
Tropical forests are threatened by many human disturbances – two of the most important of which are deforestation
and climate change. To mitigate the impacts of these disturbances, it is important to understand their potential effects
on the distributions of species. In the tropics, such understanding has been hindered by poor knowledge of the cur-
rent distributions and range limits of most species. Here, we use herbarium collection records to model the current
and future distributions of ca. 3000 Amazonian plant species. We project these distributions into the future under a
range of different scenarios related to the magnitude of climate change and extent of deforestation as well as the
response of species to changes in temperature, precipitation, and atmospheric concentrations of CO2. We find that the
future of Amazonian diversity will be dependant primarily on the ability of species to tolerate or adapt to rising tem-
peratures. If the thermal niches of tropical plant species are fixed and incapable of expanding under rapid warming,
then the negative effects of climate change will overshadow the effects of deforestation, greatly reducing the area of
suitable habitat available to most species and potentially leading to massive losses of biodiversity throughout the
Amazon. If tropical species are generally capable of tolerating warmer temperatures, rates of habitat loss will be
greatly reduced but many parts of Amazonia may still experience rapid losses of diversity, with the effects of
enhanced seasonal water stress being similar in magnitude to the effects of deforestation.
Keywords: biodiversity informatics, extinction, global warming, natural history collections, species distribution models, species
migrations
Received 2 January 2012 and accepted 7 March 2012
Introduction
The distributions of species are predicted to shift, or
‘migrate’, under climate change (Thuiller, 2007; Walther
et al., 2002). This prediction is supported by paleo-
ecological studies showing shifts in species’ historical
ranges concurrent with past climate changes (Bush
et al., 2004; Petit et al., 2008) as well as a growing num-
ber of recent studies showing shifts in modern species
distributions (e.g., Bertrand et al., 2011; Chen et al.,
2011; Crimmins et al., 2011; Feeley, 2012; Feeley et al.,
2011; Forero-Medina et al., 2011; Parmesan, 2006).
Distributional shifts will be especially important for
tropical species due to greater spatial distances between
current temperatures and their future analogs in the
tropics than in temperate zones (Beaumont et al., 2011;
Wright et al., 2009) and generally narrower climatic
niches due to a higher degree of climatic stability (on
daily, seasonal, interannual and longer-term timescales)
and higher niche specialization (Deutsch et al., 2008;
Janzen, 1967; McCain, 2009; Sheldon et al., 2011; Sunday
et al., 2011; Terborgh, 1973). As a result, tropical species
are predicted to lose climatically suitable habitat faster
and will have to migrate greater distances to keep
within their suitable climates than will temperate spe-
cies (Loarie et al., 2009; Malcolm et al., 2002; Wright
et al., 2009). Furthermore, for much of the moist low-
land tropics, future climates will have no nearby analog
(Williams et al., 2007; Wright et al., 2009), meaning that
rate of local extinction may exceed colonization,Correspondence: Kenneth J. Feeley, tel. + 1 305 348 7316,
fax + 1 305 348 1986, e-mail: [email protected]
2636 © 2012 Blackwell Publishing Ltd
Global Change Biology (2012) 18, 2636–2647, doi: 10.1111/j.1365-2486.2012.02719.x
resulting in net species loss (i.e., ‘biotic attrition’; Col-
well et al., 2008; Feeley & Silman, 2010a).
Assuming that tropical species are able to track
changes in the location of climatically suitable habitat,
the shallow latitudinal temperature gradient found in
the tropics (Sunday et al., 2011; Terborgh, 1973) means
that they are more likely to shift their ranges upslope
rather than pole-ward. As land area tends to decrease
at higher elevations, elevational range shifts may poten-
tially result in reduced habitat areas and population
sizes (Feeley & Silman, 2010b). Another factor which
will decrease future habitat areas and population sizes
is deforestation (Feeley & Silman, 2010b). In the case of
Amazonia, which comprises approximately half of the
total global tropical forest area, deforestation had
already resulted in approximately 15% loss of forest
cover by 2002, with most forest loss concentrated in the
southern ‘arc of deforestation’ (Soares-Filho et al.,
2006). By 2050, the loss of habitat area is predicted to
increase to 26% or 47% under simulated progressions
of increased governance (GOV) or business-as-usual
(BAU) deforestation, respectively (Soares-Filho et al.,
2006).
While climate change and deforestation are widely
recognized as major threats to tropical diversity
(Asner et al., 2010; Brodie et al., 2012; Corlett, 2011;
Laurance & Wright, 2009; Malhi et al., 2008; Peres
et al., 2010), few studies have made explicit predic-
tions of their potential effects on tropical plants, and
no study has quantitatively compared these effects. A
major limitation has been the lack of information on
current distributions because of the high number of
species combined with the paucity of data available
for most species (Feeley & Silman, 2011). For exam-
ple, despite the high risk of climate-driven extinctions
in the tropics, one widely publicized analysis of
extinction risk due to climate change included only
nine neotropical plant species (Thomas et al., 2004),
representing just 0.01% of estimated plant diversity
for this region (Raven, 1988). Likewise, most predic-
tions of species extinctions due to deforestation have
used simulated species ranges or assumed panmictic
distributions (Hubbell et al., 2008; Pimm & Raven,
2000) and therefore have failed to account for spatial
patterns or gradients in species distributions and dis-
turbance (Feeley & Silman, 2008, 2009; Ter Steege
et al., 2003). Even for the few species for which spa-
tially explicit range estimates have been used, predic-
tions of future ranges may be confounded by the fact
that current distributions are assumed to accurately
reflect true climatic tolerances and no allowances
have been made for changes in these tolerances
through acclimation or adaptation and/or for trun-
cated niches (Feeley & Silman, 2010a).
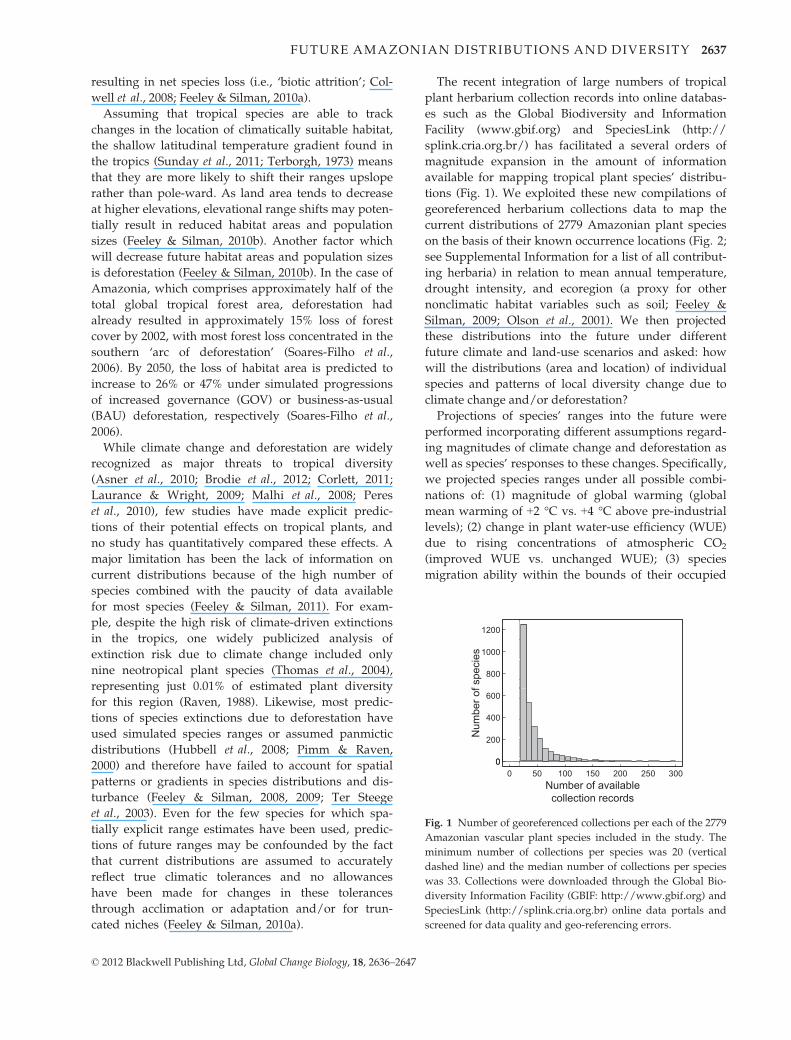
The recent integration of large numbers of tropical
plant herbarium collection records into online databas-
es such as the Global Biodiversity and Information
Facility (www.gbif.org) and SpeciesLink (http://
splink.cria.org.br/) has facilitated a several orders of
magnitude expansion in the amount of information
available for mapping tropical plant species’ distribu-
tions (Fig. 1). We exploited these new compilations of
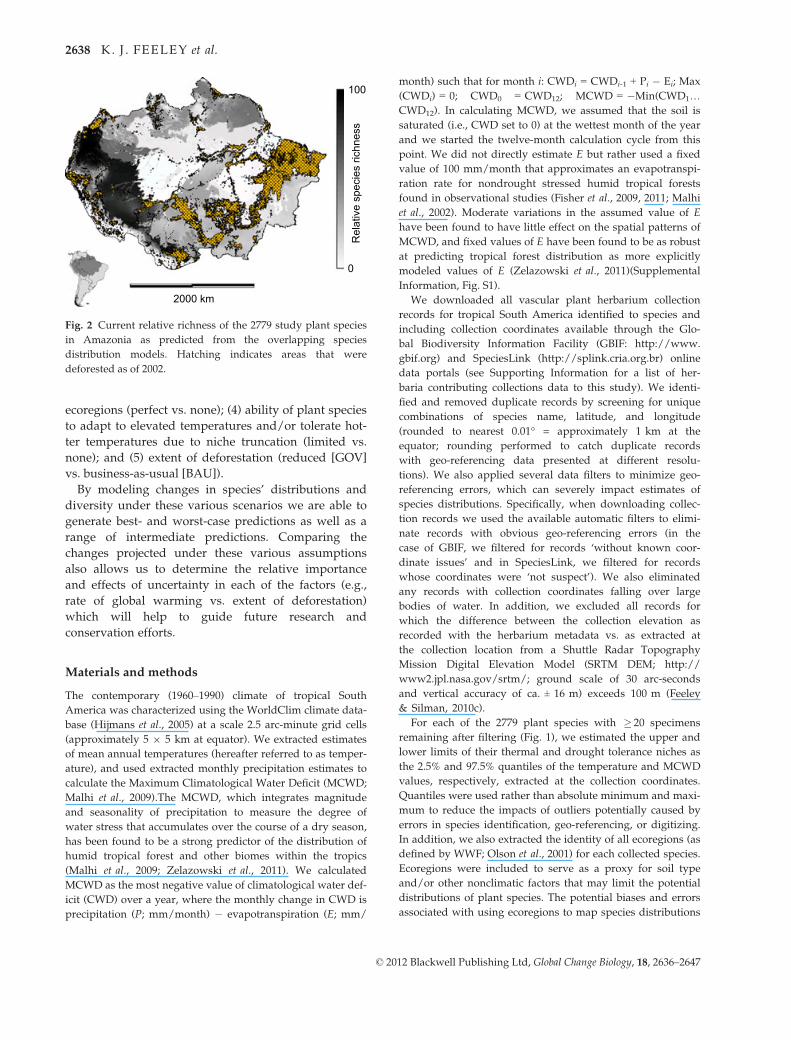
georeferenced herbarium collections data to map the
current distributions of 2779 Amazonian plant species
on the basis of their known occurrence locations (Fig. 2;
see Supplemental Information for a list of all contribut-
ing herbaria) in relation to mean annual temperature,
drought intensity, and ecoregion (a proxy for other
nonclimatic habitat variables such as soil; Feeley &
Silman, 2009; Olson et al., 2001). We then projected
these distributions into the future under different
future climate and land-use scenarios and asked: how
will the distributions (area and location) of individual
species and patterns of local diversity change due to
climate change and/or deforestation?
Projections of species’ ranges into the future were
performed incorporating different assumptions regard-
ing magnitudes of climate change and deforestation as
well as species’ responses to these changes. Specifically,
we projected species ranges under all possible combi-
nations of: (1) magnitude of global warming (global
mean warming of +2 °C vs. +4 °C above pre-industrial
levels); (2) change in plant water-use efficiency (WUE)
due to rising concentrations of atmospheric CO2
(improved WUE vs. unchanged WUE); (3) species
migration ability within the bounds of their occupied
800
1000
1200
Num
ber o
f spe
cies
0
200
400
600
Number of availablecollection records
00 50 100 150 200 250 300
Fig. 1 Number of georeferenced collections per each of the 2779
Amazonian vascular plant species included in the study. The
minimum number of collections per species was 20 (vertical
dashed line) and the median number of collections per species
was 33. Collections were downloaded through the Global Bio-
diversity Information Facility (GBIF: http://www.gbif.org) and
SpeciesLink (http://splink.cria.org.br) online data portals and
screened for data quality and geo-referencing errors.
© 2012 Blackwell Publishing Ltd, Global Change Biology, 18, 2636–2647
FUTURE AMAZONIAN DISTRIBUTIONS AND DIVERSITY 2637
ecoregions (perfect vs. none); (4) ability of plant species
to adapt to elevated temperatures and/or tolerate hot-
ter temperatures due to niche truncation (limited vs.
none); and (5) extent of deforestation (reduced [GOV]
vs. business-as-usual [BAU]).
By modeling changes in species’ distributions and
diversity under these various scenarios we are able to
generate best- and worst-case predictions as well as a
range of intermediate predictions. Comparing the
changes projected under these various assumptions
also allows us to determine the relative importance
and effects of uncertainty in each of the factors (e.g.,
rate of global warming vs. extent of deforestation)
which will help to guide future research and
conservation efforts.
Materials and methods
The contemporary (1960–1990) climate of tropical South
America was characterized using the WorldClim climate data-
base (Hijmans et al., 2005) at a scale 2.5 arc-minute grid cells
(approximately 5 9 5 km at equator). We extracted estimates
of mean annual temperatures (hereafter referred to as temper-
ature), and used extracted monthly precipitation estimates to
calculate the Maximum Climatological Water Deficit (MCWD;
Malhi et al., 2009).The MCWD, which integrates magnitude
and seasonality of precipitation to measure the degree of
water stress that accumulates over the course of a dry season,
has been found to be a strong predictor of the distribution of
humid tropical forest and other biomes within the tropics
(Malhi et al., 2009; Zelazowski et al., 2011). We calculated
MCWD as the most negative value of climatological water def-
icit (CWD) over a year, where the monthly change in CWD is
precipitation (P; mm/month) � evapotranspiration (E; mm/
month) such that for month i: CWDi = CWDi-1 + Pi � Ei; Max
(CWDi) = 0; CWD0 = CWD12; MCWD = �Min(CWD1…
CWD12). In calculating MCWD, we assumed that the soil is
saturated (i.e., CWD set to 0) at the wettest month of the year
and we started the twelve-month calculation cycle from this
point. We did not directly estimate E but rather used a fixed
value of 100 mm/month that approximates an evapotranspi-
ration rate for nondrought stressed humid tropical forests
found in observational studies (Fisher et al., 2009, 2011; Malhi
et al., 2002). Moderate variations in the assumed value of E
have been found to have little effect on the spatial patterns of
MCWD, and fixed values of E have been found to be as robust
at predicting tropical forest distribution as more explicitly
modeled values of E (Zelazowski et al., 2011)(Supplemental
Information, Fig. S1).
We downloaded all vascular plant herbarium collection
records for tropical South America identified to species and
including collection coordinates available through the Glo-
bal Biodiversity Information Facility (GBIF: http://www.
gbif.org) and SpeciesLink (http://splink.cria.org.br) online
data portals (see Supporting Information for a list of her-
baria contributing collections data to this study). We identi-
fied and removed duplicate records by screening for unique
combinations of species name, latitude, and longitude
(rounded to nearest 0.01° = approximately 1 km at the
equator; rounding performed to catch duplicate records
with geo-referencing data presented at different resolu-
tions). We also applied several data filters to minimize geo-
referencing errors, which can severely impact estimates of
species distributions. Specifically, when downloading collec-
tion records we used the available automatic filters to elimi-
nate records with obvious geo-referencing errors (in the
case of GBIF, we filtered for records ‘without known coor-
dinate issues’ and in SpeciesLink, we filtered for records
whose coordinates were ‘not suspect’). We also eliminated
any records with collection coordinates falling over large
bodies of water. In addition, we excluded all records for
which the difference between the collection elevation as
recorded with the herbarium metadata vs. as extracted at
the collection location from a Shuttle Radar Topography
Mission Digital Elevation Model (SRTM DEM; http://
www2.jpl.nasa.gov/srtm/; ground scale of 30 arc-seconds
and vertical accuracy of ca. ± 16 m) exceeds 100 m (Feeley
& Silman, 2010c).
For each of the 2779 plant species with � 20 specimens
remaining after filtering (Fig. 1), we estimated the upper and
lower limits of their thermal and drought tolerance niches as
the 2.5% and 97.5% quantiles of the temperature and MCWD
values, respectively, extracted at the collection coordinates.
Quantiles were used rather than absolute minimum and maxi-
mum to reduce the impacts of outliers potentially caused by
errors in species identification, geo-referencing, or digitizing.
In addition, we also extracted the identity of all ecoregions (as
defined by WWF; Olson et al., 2001) for each collected species.
Ecoregions were included to serve as a proxy for soil type
and/or other nonclimatic factors that may limit the potential
distributions of plant species. The potential biases and errors
associated with using ecoregions to map species distributions
Rel
ativ
e sp
ecie
s ric
hnes
s
2000 km
0
100
Fig. 2 Current relative richness of the 2779 study plant species
in Amazonia as predicted from the overlapping species
distribution models. Hatching indicates areas that were
deforested as of 2002.
© 2012 Blackwell Publishing Ltd, Global Change Biology, 18, 2636–2647
2638 K. J . FEELEY et al.
are discussed in Feeley & Silman (2009). We elected to use this
relatively simple species distribution model (SDM), which is a
modification of the popular BIOCLIM model based on rectilin-
ear climate envelopes, rather than more sophisticated SDMs
such as those based on machine learning or ensemble methods
(Arajo & New, 2007; Phillips et al., 2006; Thuiller, 2003),
because of its greater flexibility which allows us to model the
current and future distributions of large numbers of species
under a variety of conditions and assumptions. In addition,
the SDM of choice has low omission error and high commis-
sion error rates and tends to overestimate species ranges com-
pared with other models since it considers the environmental
variables independently and of equal weight. For example, in
an analysis of 500 of our study species (randomly selected),
we found that our estimates of current ranges were a median
of 81% larger (95% CI = 68–102%) than range estimates cre-
ated using the machine learning-based SDM, MAXENT (Phil-
lips et al., 2006), with comparable inputs and settings
(Supplemental Information, Fig. S6). As the threat of climate
change-induced extinction is generally elevated for small-ran-
ged species (especially when species have no or limited migra-
tion ability as assumed in our model), our results are likely to
be conservative.
We next quantified the area of suitable habitat currently
available to each species as the number of pixels within the
currently occupied ecoregions having temperature and
MCWD values falling within the species’ estimated thermal
and drought tolerances. To limit the focus of our study to just
the areas for which spatially explicit information on current
and future deforestation rates is available, we only tallied
suitable areas within Amazonia (note that species require-
ments were based on the climatic and ecoregion distributions
of all available herbarium collection records including those
from outside the Amazon). In estimating species’ ranges and
patterns of species diversity, we accounted for deforestation
by overlaying a map of current (2002) deforestation (Soares-
Filho et al., 2006) and assuming a complete loss of natural
plant species diversity in all of the deforested areas.
As a first-order approximation of future climate regime we
modified the high-resolution contemporary climate data
according to climate anomaly patterns (local and seasonal
change in climate variable per degree of warming over land)
at a spatial resolution of 2.5 9 3.75 arc-degree (Zelazowski
et al., 2011). The patterns were derived from the ensemble pre-
dictions of 17 Atmosphere-Ocean Global Climate Models
(AOGCMs; data available at the WCRP CMIP3 portal;
https://esg.llnl.gov:8443). To circumvent the problem of
known biases in the description of the current climate by some
AOGCMs, which is especially important in the case of tropical
rainfall, each precipitation pattern was multiplied by the ratio
of observed to modeled value. Subsequently, the patterns
were scaled according to investigated climate scenarios (see
below), re-sampled to higher resolution, smoothed with aver-
age filter, and added to the high-resolution climatology. This
approach assumes that the sub-grid patterns and relative
magnitudes of rainfall and temperature are preserved under a
climate change pattern. The main advantage of this approach
is in highlighting of the existence of localized vulnerable or
resilient regions in greater detail, something impossible from
a low-resolution analysis alone.
To estimate the effects of future climate and land-use
change on suitable habitat areas and patterns of Amazonian
diversity, we tallied the amount of land area (i.e., number of
pixels) estimated to be suitable to each species under future
conditions (i.e., areas within the species’ currently occupied
Amazonian ecoregions and with future climates estimated to
fall within the species’ thermal and drought tolerance niches).
In tallying the amount of suitable land area that will be
available to species under future conditions, we used all possi-
ble combinations of several different assumptions regarding
how tropical plant species will respond to rising temperatures
and increasing concentrations of atmospheric CO2, as well as
different assumptions regarding future rates of Amazonian
deforestation (Supplemental Information, Figs S4 & S5).
Specifically:
1) Mean global warming reaches 4 °C vs. mean global warming
only reaches 2 °C: Climate patterns (both in temperature and
precipitation) were scaled to reflect the regime at either 2 or
4 °C mean global warming (above pre-industrial levels),
according to the climate sensitivity of each AOGCM, and then
averaged. This rescaling to degree global warming rather than
a particular reference year is advantageous because it
bypasses discussion of the merits or probability of particular
emissions scenarios, it allows the depiction of extreme regimes
(e.g., 4 degrees increase in global temperature) even if they
were not reached in some of the original AOGCM simulations,
and is more policy relevant in terms of international negotia-
tion targets such as limiting global warming to <2 °C (Supple-
mental Information, Fig. S1). We elected to focus our analyses
on just the mean ensemble climate predictions as analyzing
results from all 17 climate models, which cover all possible
moisture states (from large-scale dieback to models that make
the whole Amazon wetter) would obscure patterns. For clar-
ity, we emphasize that the 2 °C and 4 °C global warming sce-
narios used in the analyses incorporate changes in
precipitation and MCWD patterns as well as changes in
temperature.
2) Rising concentrations of atmospheric CO2 will not affect plant
water-use efficiency (WUE): We tallied future suitable land area
as above.
vs. Rising [CO2] will result in improved WUE: We recalculated
the maps depicting future MCWD accounting for increased
plant WUE by decreasing mean evapotranspiration by 12.5 or
25 mmmonth�1 when calculating MCWD under 2 °C and 4 °Cglobal warming scenarios, respectively, (based on approxi-
mate estimates derived using the Met Office Surface Exchange
Scheme; Cox et al., 1998; Zelazowski et al., 2011).
3) Species are incapable of migrating or extending their ranges to
include areas outside their current distributions: We tallied only
those areas that are deemed suitable under both current and
predicted future conditions.
vs. Species are capable of perfect migration and can track the
projected changes in suitable habitat area within occupied ecore-
gions: We tallied all areas within the currently occupied eco-
regions that are deemed suitable under future climatic
conditions regardless of overlap with the species’ current
© 2012 Blackwell Publishing Ltd, Global Change Biology, 18, 2636–2647
FUTURE AMAZONIAN DISTRIBUTIONS AND DIVERSITY 2639

range. Species were not permitted to migrate from one eco-
region to another as this delineation was used as a proxy for
soil type and other variables that will not necessarily change
in concert with climate (Feeley & Silman, 2009). The use of
ecoregions also prevents large jumps in distributions or dis-
continuities between current and future distributions. For
example, by restricting migration to within ecoregions we
prevent plant species specialized for infertile soils in eastern
Amazonia from migrating onto fertile soils in western
Amazonia or species currently growing exclusively in the
Guyana highlands from migrating to the Andes. Such an
assumption, although not perfect, is more realistic than
assuming free migration regardless of distance across all soil
and landform types.
4) Species are incapable of adapting to increasing temperature:
We tallied the amount of land area (number of pixels) within
the species’ currently occupied ecoregions that are estimated
to have temperature and MCWD values within the species’
thermal and drought tolerance niches, respectively.
vs. Species have a limited ability to tolerate and/or adapt to
elevated temperatures: We tallied areas within all occupied
Amazonian ecoregions that will 1) have future climates falling
within the species’ current climatic niches plus 2) any areas
that are currently occupied but that would otherwise be
deemed too hot in the future if that area is predicted to have
suitable MCWD values and will not be more than 10 °C hotter
than the species’ lower thermal niche limit. This effectively
allows species to tolerate or adapt to future warming by
expanding their thermal niches to include warmer tempera-
tures but only up to a maximum niche breadth of 10 °C. 10 °Cis the approximate mean thermal niche breadth previously
estimated for Amazonian plant species in the absence of ther-
mal niche truncation; i.e., for species whose thermal niche lim-
its do not include the maximum or minimum temperatures
for tropical South America (Feeley & Silman, 2010a)(Supple-
mental Information, Fig. S2). If a species’ current thermal
niche breadth is � 10 °C, we used the current niche breadth
but did not allow for expansion (Supplemental Information,
Fig. S3). The issue of truncated niches does not arise for other
environmental variables, such as MCWD, as the full possible
environmental range of those variables is realized under
current climate conditions.
5) Extent of future deforestation is reduced due to increased gov-
ernance vs. Future deforestation continues BAU: We tallied all
Amazonian areas deemed suitable and not estimated to be
deforested under a map of future deforestation as predicted
for 2050 under Soares-Filho et al.’s (2006) model assuming
increased GOV or assuming deforestation continuing BAU.
As the climate projections are time-independent, using defor-
estation projections for 2050 effectively assumes either that the
changes in climate have occurred by 2050 or that the extent of
deforestation does not increase beyond what is predicted for
2050.
In addition to estimating the amount and location of land
area suitable to each species under future conditions, we also
estimated future patterns of diversity, as well as changes in
relative species richness across Amazonia by tallying the num-
ber of overlapping species ranges predicted for each pixel
under current conditions and under each of the possible
future scenarios.
Results
Under our best-case scenarios (deforestation rates are
decreased due to increased GOV, there is a positive
effect of increasing [CO2] on plant WUE, species
migrate perfectly within currently occupied ecoregions,
and species can adapt to rising temperatures; scenarios
nos. 2 and 10 in Table 1), we predict that the amount of
climatically suitable habitat available to many species
will increase, thereby offsetting some of the areas that
will be lost to these species due to deforestation. Specif-
ically, with 2 °C mean global warming we predict that
the study species will lose a median of just 8.2% (95%
CI = 7.7 - 8.6%) of their current habitat area (accounting
for areas already lost due to current deforestation;
Table 1; Fig. 3a). If global warming increases to 4 °C(Fig. 3d), we predict a median habitat loss of 11.6%
(10.4–12.7%). In both cases, the amount of habitat lost
per species through the combined effects of climate
change and deforestation is significantly less than the
projected losses due to deforestation alone (the median
habitat loss due to deforestation alone with increased
GOV is 13.5%; Table 1) as species expand their ranges
and/or shift their ranges to less disturbed areas. The
median value of local diversity change predicted under
this best-case scenario is a decrease of 4.1% (4.0–4.2%)
in species richness with 2 °C global warming or a
decrease of 25.0% (25.0–25.0%) in richness with 4 °Cglobal warming (excluding areas already deforested as
of 2002; Table 1; Fig. 4).
Under our worst-case scenarios (Scenarios nos. 26
and 34 in Table 1) in which we assume that deforesta-
tion follows a BAU trajectory, there is no effect of
increasing [CO2] on WUE, species are incapable of
migrating, and that species are incapable of acclimating
and/or adapting to rising temperatures, we predict that
there will be massive decreases in the ranges of almost
all species and associated losses of local diversity
throughout Amazonia, with most areas experiencing a
total or near total loss of diversity. Specifically, we pre-
dict that our study species will lose a median of 81.5%
(80.6–82.7%) of their current habitat area under 2 °Cglobal warming and 98.7% (98.5–98.9%) of their current
habitat area with 4 °C global warming (Table 1; Fig. 3).
Under this worst-case combination of assumptions, the
median change in richness of the study species will be
an 89.8% (89.1–90.5%) decrease with 2 °C warming.
With 4 °C mean global warming, we predict that the
median loss of local diversity of study species will
increase to 100% (Table 1; Fig. 4).
© 2012 Blackwell Publishing Ltd, Global Change Biology, 18, 2636–2647
2640 K. J . FEELEY et al.
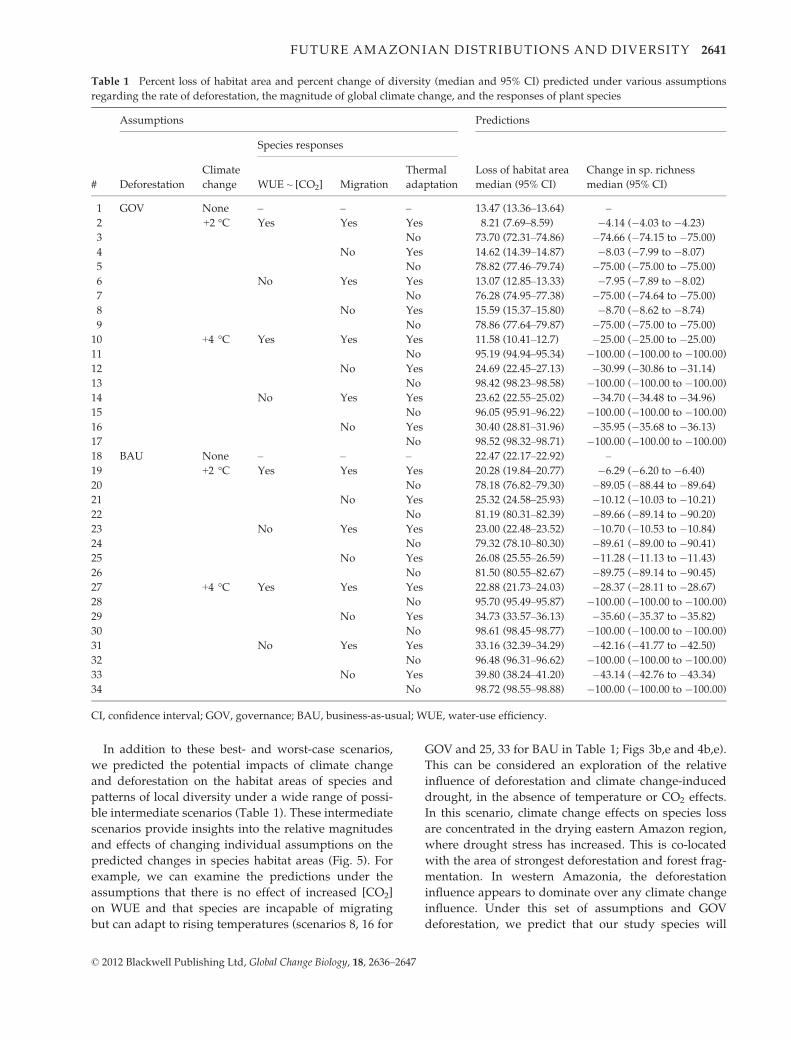
In addition to these best- and worst-case scenarios,
we predicted the potential impacts of climate change
and deforestation on the habitat areas of species and
patterns of local diversity under a wide range of possi-
ble intermediate scenarios (Table 1). These intermediate
scenarios provide insights into the relative magnitudes
and effects of changing individual assumptions on the
predicted changes in species habitat areas (Fig. 5). For
example, we can examine the predictions under the
assumptions that there is no effect of increased [CO2]
on WUE and that species are incapable of migrating
but can adapt to rising temperatures (scenarios 8, 16 for
GOV and 25, 33 for BAU in Table 1; Figs 3b,e and 4b,e).
This can be considered an exploration of the relative
influence of deforestation and climate change-induced
drought, in the absence of temperature or CO2 effects.
In this scenario, climate change effects on species loss
are concentrated in the drying eastern Amazon region,
where drought stress has increased. This is co-located
with the area of strongest deforestation and forest frag-
mentation. In western Amazonia, the deforestation
influence appears to dominate over any climate change
influence. Under this set of assumptions and GOV
deforestation, we predict that our study species will
Table 1 Percent loss of habitat area and percent change of diversity (median and 95% CI) predicted under various assumptions
regarding the rate of deforestation, the magnitude of global climate change, and the responses of plant species
#
Assumptions Predictions
Deforestation
Climate
change
Species responses
Loss of habitat area
median (95% CI)
Change in sp. richness
median (95% CI)WUE ~ [CO2] Migration
Thermal
adaptation
1 GOV None – – – 13.47 (13.36–13.64) –
2 +2 °C Yes Yes Yes 8.21 (7.69–8.59) �4.14 (�4.03 to �4.23)
3 No 73.70 (72.31–74.86) �74.66 (�74.15 to �75.00)
4 No Yes 14.62 (14.39–14.87) �8.03 (�7.99 to �8.07)
5 No 78.82 (77.46–79.74) �75.00 (�75.00 to �75.00)
6 No Yes Yes 13.07 (12.85–13.33) �7.95 (�7.89 to �8.02)
7 No 76.28 (74.95–77.38) �75.00 (�74.64 to �75.00)
8 No Yes 15.59 (15.37–15.80) �8.70 (�8.62 to �8.74)
9 No 78.86 (77.64–79.87) �75.00 (�75.00 to �75.00)
10 +4 °C Yes Yes Yes 11.58 (10.41–12.7) �25.00 (�25.00 to �25.00)
11 No 95.19 (94.94–95.34) �100.00 (�100.00 to �100.00)
12 No Yes 24.69 (22.45–27.13) �30.99 (�30.86 to �31.14)
13 No 98.42 (98.23–98.58) �100.00 (�100.00 to �100.00)
14 No Yes Yes 23.62 (22.55–25.02) �34.70 (�34.48 to �34.96)
15 No 96.05 (95.91–96.22) �100.00 (�100.00 to �100.00)
16 No Yes 30.40 (28.81–31.96) �35.95 (�35.68 to �36.13)
17 No 98.52 (98.32–98.71) �100.00 (�100.00 to �100.00)
18 BAU None – – – 22.47 (22.17–22.92) –
19 +2 °C Yes Yes Yes 20.28 (19.84–20.77) �6.29 (�6.20 to �6.40)
20 No 78.18 (76.82–79.30) �89.05 (�88.44 to �89.64)
21 No Yes 25.32 (24.58–25.93) �10.12 (�10.03 to �10.21)
22 No 81.19 (80.31–82.39) �89.66 (�89.14 to �90.20)
23 No Yes Yes 23.00 (22.48–23.52) �10.70 (�10.53 to �10.84)
24 No 79.32 (78.10–80.30) �89.61 (�89.00 to �90.41)
25 No Yes 26.08 (25.55–26.59) �11.28 (�11.13 to �11.43)
26 No 81.50 (80.55–82.67) �89.75 (�89.14 to �90.45)
27 +4 °C Yes Yes Yes 22.88 (21.73–24.03) �28.37 (�28.11 to �28.67)
28 No 95.70 (95.49–95.87) �100.00 (�100.00 to �100.00)
29 No Yes 34.73 (33.57–36.13) �35.60 (�35.37 to �35.82)
30 No 98.61 (98.45–98.77) �100.00 (�100.00 to �100.00)
31 No Yes Yes 33.16 (32.39–34.29) �42.16 (�41.77 to �42.50)
32 No 96.48 (96.31–96.62) �100.00 (�100.00 to �100.00)
33 No Yes 39.80 (38.24–41.20) �43.14 (�42.76 to �43.34)
34 No 98.72 (98.55–98.88) �100.00 (�100.00 to �100.00)
CI, confidence interval; GOV, governance; BAU, business-as-usual; WUE, water-use efficiency.
© 2012 Blackwell Publishing Ltd, Global Change Biology, 18, 2636–2647
FUTURE AMAZONIAN DISTRIBUTIONS AND DIVERSITY 2641

10002oC mean global warming 4oC mean global warming
200
300
400
500
600
400
600
800
(A)
(B)
(C)
(D)
(E)
(F)
0
100
0
200
–100 –50 0 50 100 –100 –50 0 50 100
–100 –50 0 50 100 –100 –50 0 50 100
–100 –50 0 50 100 –100 –50 0 50 100
500
1000
1500
200
400
600
Num
ber o
f spe
cies
2000
800
0 0
500
1000
1500
200
400
600
00
Percent habitat loss
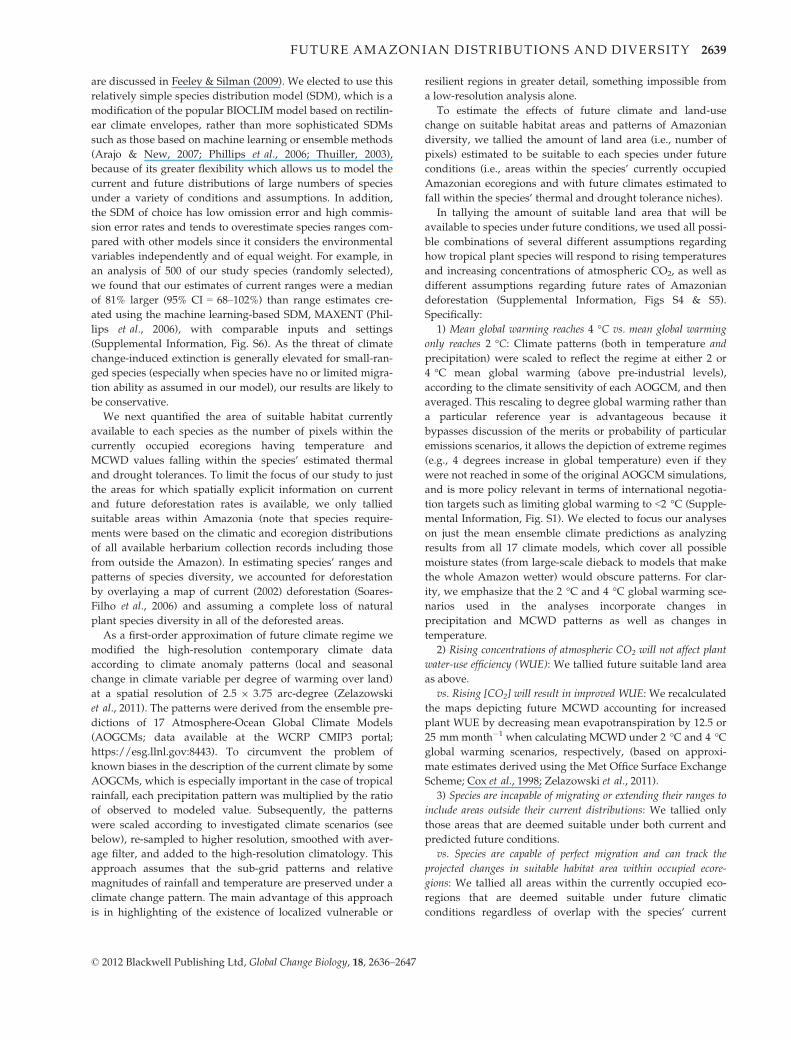
Fig. 3 Percent habitat loss relative to current habitat area (i.e., incorporating deforestation as of 2002; positive values indicate decrease
in habitat area) predicted for each of 2779 Amazonian plant species under selected disturbance and species response scenarios. The top
row of panels (A & D) shows predictions assuming increased water-use efficiency (WUE) under elevated CO2, species are capable of
limited migration, and species are able to adapt to increased temperatures (i.e., the best-case scenario); the middle row (B & E) shows
predictions assuming no increased WUE, no migration, but with thermal adaptation; the bottom row (D & F) shows predictions assum-
ing no increased WUE, no migration, and no thermal adaptation (i.e., the worst-case scenario). The left column (A, B, & C) shows pre-
dictions under 2 °C mean global warming and the right column (D, E, & F) shows predictions under 4 °C mean global warming. Light
gray histograms show predictions under the increased governance (GOV) deforestation scenario and the dark gray histograms show
predictions under the business-as-usual (BAU) deforestation scenario. The vertical lines indicate the median percent habitat loss
(dashed = GOV deforestation, solid = BAU deforestation).
© 2012 Blackwell Publishing Ltd, Global Change Biology, 18, 2636–2647
2642 K. J . FEELEY et al.

lose a median of 15.6% (15.4–15.78%) of their current
habitat area under 2 °C global warming and 26.1%
(25.6–26.6%) of their current habitat area with 4 °C glo-
bal warming; these values increase to 30.4% (28.8–32.0%) and 39.8% (38.2–41.2%), respectively, under
BAU deforestation (Table 1; Fig. 3). The corresponding
changes in the richness of the study species will be
8.7% (8.1–8.7%) and 11.3% (11.1–11.4%) decreases
under GOV deforestation and 2 °C and 4 °C mean glo-
bal warming, respectively; and 35.6% (35.7–36.1%) and
43.1% (42.8–43.3%) decreases with BAU deforestation
and 2 °C and 4 °C mean global warming, respectively
(Table 1; Fig. 4). The results of other possible interme-
diate scenarios are presented in Table 1 and Fig. 5.
Discussion
In this study, we use a collated database of natural his-
tory collections combined with an ensemble GCM
(rescaled to explore impacts under 2 °C and 4 °C glo-
bal warming – a more policy-relevant approach than
simulating to a fixed date when climate models differ
in their climate sensitivity) to predict the effects
of deforestation and/or climate change on the
(A) (D)
(B) (E)
(C) (F)
2oC mean global warming 4oC mean global warming
Fig. 4 Percent change in local plant species richness relative to current species richness as predicted from the species distribution mod-
els of the 2779 Amazonian study species under selected disturbance and species response scenarios (negative values indicate a decrease
in species richness). The top row of panels (A & D) shows predictions assuming increased water-use efficiency (WUE) under elevated
CO2, species are capable of limited migration, and species are able to adapt to increased temperatures (i.e., the best-case scenario); the
middle row (B & E) shows predictions assuming no increased WUE, no migration, but with thermal adaptation; the bottom row (D &
F) shows predictions assuming no increased WUE, no migration, and no thermal adaptation (i.e., the worst-case scenario). The left col-
umn (A, B, & C) shows predictions under 2 °C mean global warming and the right column (D, E, & F) shows predictions under 4 °C
mean global warming. Yellow filled and outlined areas show areas predicted to be deforested by 2050 under increased governance
deforestation and business-as-usual deforestation scenarios, respectively.
© 2012 Blackwell Publishing Ltd, Global Change Biology, 18, 2636–2647
FUTURE AMAZONIAN DISTRIBUTIONS AND DIVERSITY 2643

60
80
100(A)
100
0
20
40
20
40
60
80P
erce
nt h
abita
t los
sn(B)
0
Fig. 5 The percent habitat loss predicted under various scenarios with (A) 2 °C mean global warming, and with (B) 4 °C mean global
warming. Dark gray bars indicate predictions assuming increased governance and reduced deforestation; light gray bars indicate pre-
dictions assuming business-as-usual deforestation. Vertical lines indicate 95% confidence intervals. By incorporating a large number of
assumptions into our analyses we are able to predict the potential impacts of climate change and deforestation on the habitat areas of
species and patterns of local diversity under a wide range of possible scenarios (Table 1). In the main text we describe the predictions
under our best and worst-case scenarios but we also explored various intermediate scenarios which provide insights into the relative
magnitudes and effects of changing individual assumptions on the predicted changes in species' habitat areas. As an example, the fig-
ure shows the predicted effects that increased governance/reduced deforestation will have on changes in species habitat areas relative
to the business-as-usual deforestation scenario in the absence of any climate change effects (scenarios 1 and 18 in Table 1), the addi-
tional effects of climate change-induced droughts (i.e., no water-use efficiency (WUE) effect, no migration, and limited thermal adapta-
tion, scenarios 8, 16, 25, and 33 in Table 1), the relative importance of incorporating species migration (i.e., no WUE effect, limited
migration, and limited thermal adaptation: scenarios 6, 14, 23, and 31 in Table 1), the relative importance of incorporating increased
water-use efficiency due to elevated atmospheric concentrations of CO2 (i.e., increased WUE, limited migration, and limited thermal
adaptation: scenarios 2, 10, 19, and 27 in Table 1), and finally the effects of thermal adaptation (i.e., increased WUE, limited migration,
and no thermal adaptation: scenarios 3, 11, 20, 28 in Table 1). Focusing on these sets of scenarios, we see that with increased governance
and 2 °C mean global warming, climate change-induced changes in precipitation and water availability will have a relatively minor
additional effect on species habitat areas beyond the losses already caused by deforestation (13.1 vs.13.5% loss; Panel A). This is true
even if species are unable to migrate and if there is no increase in water-use efficiency due to elevated CO2 (15.6%). Indeed, the ability
vs. inability of species to migrate has little predicted effects on the predicted changes of species habitat areas with 2 °C global warming.
In contrast, incorporating increased WUE does have a significant effect such that the predicted degree of habitat loss when incorporat-
ing increased WUE (8.2%) is less than predicted due to deforestation alone. With 4 °C mean global warming (Panel B), the effects of
changes in water availability are more pronounced, causing a near doubling (23.6 vs. 13.5 loss) in the magnitude of habitat loss when
compared with the governance deforestation scenario alone. Likewise, allowing species migrations and incorporating increased WUE
has magnified effects such that even with 4 °C warming, we predict that the loss of habitat area due to climate change and deforesta-
tion may still be less or equal to habitat losses due to deforestation alone (11.6% vs. 13.5 and 22.9 vs. 22.5 under governance and busi-
ness-as-usual deforestation scenario, respectively; assuming thermal adaptation, see below). Overshadowing the effects of all other
assumptions included in our analyses is the effect of thermal adaptation. If species are generally incapable of adapting to elevated tem-
peratures, we predict a vastly elevated degree of habitat loss under both 2 °C and 4 °C global warming regardless of migration capabil-
ity, changes in WUE, or rate of deforestation. In summary, in this single storyline an approximate ranking of the importance of factors
with 4 °C mean global warming is (in declining importance): (1) ability of species to adapt to/tolerate rising temperatures, (2) changes
in water availability, (3) changes in water-use efficiency, (4) rate of deforestation, and (5) ability of species to migrate. Also of note is
that along this storyline the difference between the 2 °C and 4 °C global warming scenarios (Panel A vs. Panel B) is generally of similar
magnitude to the difference between business-as-usual and governance scenarios of deforestation, which suggests that limiting the
degree of global warming may be as important as slowing rates of deforestation in determining the future of Amazonian plant species.
© 2012 Blackwell Publishing Ltd, Global Change Biology, 18, 2636–2647
2644 K. J . FEELEY et al.
distributions of several thousand Amazonian plant
species and the consequent impacts on patterns of
local biodiversity. We use a multi-factorial approach to
explicitly and separately evaluate the relative impor-
tance of drought, temperature, CO2-related changes in
WUE, deforestation, and migration on species distribu-
tions under different climate and land-use change sce-
narios. In our worse-case scenarios, we predict that
most species will face near-certain extinction due to
extreme range contractions. On the other hand, more
optimistic scenarios do exist in which we predict that
changes in species’ ranges will be greatly reduced and
that many species may actually be able to expand their
ranges (in some cases offsetting habitat loss due to
deforestation). It is notable that the large differences
between these best- and worst-case scenarios are due
almost entirely to changing our assumptions about the
ability of species to adapt to rising temperatures and/
or tolerate a wider range of temperatures than pre-
dicted by their current distributions (Feeley & Silman,
2010a). In comparison, effects of [CO2] on WUE,
changes in species migration capability, and GOV vs.
BAU deforestation, all had relatively little effect on
habitat loss rates (Fig. 5; Supplemental Information,
Figs S4 & S5).
These results help to highlight some of the key uncer-
tainties in predicting the future of tropical biodiversity.
If the thermal niches of many tropical species are
approximated by current distributions (i.e., niches are
not truncated) and remain fixed under warming rates
on the order of 0.4 °C decade�1 (Christensen et al.,
2007), there is a risk of substantial extinction and attri-
tion of tropical lowland diversity over the next century.
It should be emphasized here that the thermal niche
reflects not just the physiological limits of the plant spe-
cies, but the range of temperatures over which the plant
species remains viable and competitive in the context of
pollination, dispersion, herbivory, pathogen-load, and
other ecosystem interactions. The potential effects of
rising temperatures overshadow any effects of
decreased water availability or even deforestation.
Hence, the ability of tropical organisms to tolerate and/
or adapt to warming is clearly one of the biggest
sources of uncertainty governing the fate of tropical
(and hence global) biodiversity. Tropical biodiversity
appears to have remained high through previous warm
periods (Jaramillo et al., 2006), but the rates of tropical
warming in previous rapid warming periods were
about 100 times slower (e.g. ~5 °C over ~10 000–20 000 years; Zachos et al., 2003) than those projected
for the 21st century. It is unknown if the thermal niches
of tropical species are broad enough or plastic enough
to adapt to the much more rapid warming now
underway.
Under all considered scenarios, except those assum-
ing no migration, we predict that the Andes Mountains
and Guyana highlands will increase in diversity and
become important refugia as lowland species shift their
distributions upslope to higher/colder areas in
response to rising temperatures (Fig. 4). This result
highlights the critical need for the conservation of
forested landscapes in the Andes and other upland
regions, as well as the migration routes connecting
centers of lowland diversity to the future highland
refugia (Brodie et al., 2012; Killeen & Solorzano,
2008).
The presented predictions describe a range of possi-
ble outcomes of climate change and deforestation.
Despite the range of permutations we have consid-
ered, our analysis still does not span the full range of
potential outcomes. For clarity, we have focused only
on the ensemble mean climate prediction across 17
climate models. The more ‘pessimistic’ individual
climate models suggest strong drying and warming
across Amazonia and thus a major influence of
climate on species ranges, while in contrast the more
‘optimistic’ models suggest regional wetting and thus
a negligible or even benign influence of climate
change on species ranges (Malhi et al., 2009). For
deforestation, the recent remarkable reduction in habi-
tat conversion rates in the Brazilian Amazon at least
raises the prospect that total deforestation by 2050
could be even lower than predicted under the GOV
scenario (Nepstad et al., 2009). There are also other
large-scale human disturbances which were not incor-
porated in our predictions, such as fire, logging and
grazing (Feeley & Silman, 2010b; Nepstad et al., 1999;
Peres et al., 2010), habitat fragmentation (Laurance
et al., 2002), or disruptions of biological interactions
(Sheldon et al., 2011) – all of which will greatly influ-
ence species distributions and patterns of future
diversity (Brodie et al., 2012). These disturbances will
affect not only the amount of available habitat but
also the responses of species to climate change and
deforestation. Finally, we emphasize that the actual
impacts of anthropogenic disturbances will be highly
species-dependent as different Amazonian plant spe-
cies exhibit different abilities to capitalize on changes
in [CO2] to improve WUE or photosynthetic rates,
shift their distributions in response to changes in hab-
itat suitability, tolerate or respond favorably to defor-
estation or other human land uses, and especially
their ability to tolerate and/or adapt to rising temper-
atures. Thus while our results provide a general
framework for predicting the possible effects of
climate change and deforestation on Amazonian plant
species distributions and patterns of diversity, a great
deal of uncertainty remains to be resolved.
© 2012 Blackwell Publishing Ltd, Global Change Biology, 18, 2636–2647
FUTURE AMAZONIAN DISTRIBUTIONS AND DIVERSITY 2645
Acknowledgments
We thank the Global Biodiversity Information Facility, Specie-sLink and all contributing herbaria for making their data pub-licly available and facilitating studies of ecology andbiogeography. This paper is a product of the Andes Biodiversityand Ecosystems Research Group consortium (ABERG; http://www.andesconservation.org) and was supported by the Gor-don and Betty Moore Foundation’s Andes to Amazon initiative,and the Fairchild Tropical Botanic Garden’s Center for TropicalPlant Conservation. This is contribution 229 of the Program inTropical Biology at Florida International University.
References
Arajo MB, New M (2007) Ensemble forecasting of species distributions. Trends in Ecol-
ogy and Evolution, 22, 42–47.
Asner GP, Loarie SR, Heyder U (2010) Combined effects of climate and land-use
change on the future of humid tropical forests. Conservation Letters, 3, 395–403.
Beaumont LJ, Pitman A, Perkins S, Zimmermann NE, Yoccoz NG, Thuiller W (2011)
Impacts of climate change on the world’s most exceptional ecoregions. Proceedings
of the National Academy of Sciences, 108, 2306–2311.
Bertrand R, Lenoir J, Piedallu C et al. (2011) Changes in plant community composi-
tion lag behind climate warming in lowland forests. Nature, 479, 517–520.
Brodie J, Post E, Laurance WF (2012) Climate change and tropical biodiversity: a new
focus. Trends in Ecology & Evolution, 27, 145–150.
Bush MB, Silman MR, Urrego DH (2004) 48,000 years of climate and forest change in
a biodiversity hot spot. Science, 303, 827–829.
Chen IC, Hill JK, Ohlemuller R, Roy DB, Thomas CD (2011) Rapid range shifts of spe-
cies associated with high levels of climate warming. Science, 333, 1024–1026.
Christensen JH, Hewitson B, Busuioc A et al. (2007) Regional climate projections. In:
Climate Change 2007: The Physical Science Basis. Contribution of Working Group I to the
Fourth Assessment Report of the Intergovernmental Panel on Climate Change (eds Solo-
mon S, Qin D, Manning M, Chen Z, Marquis M, Averyt K, Tignor M, Miller H),
pp. 847–940. Cambridge University Press, Cambridge, UK and New York, NY,
USA.
Colwell RK, Brehm G, Cardelus CL, Gilman AC, Longino JT (2008) Global warming,
elevational range shifts, and lowland biotic attrition in the wet tropics. Science, 322,
258–261.
Corlett RT (2011) Impacts of warming on tropical lowland rainforests. Trends in Ecol-
ogy & Evolution, 27, 145–150.
Cox PM, Huntingford C, Harding RJ (1998) A canopy conductance and photosynthe-
sis model for use in a GCM land surface scheme. Journal of Hydrology, 213, 79–94.
Crimmins SM, Dobrowski SZ, Greenberg JA, Abatzoglou JT, Mynsberge AR (2011)
Changes in climatic water balance drive downhill shifts in plant species’ optimum
elevations. Science, 331, 324–327.
Deutsch CA, Tewksbury JJ, Huey RB, Sheldon KS, Ghalambor CK, Haak DC, Martin
PR (2008) Impacts of climate warming on terrestrial ectotherms across latitude.
Proceedings of the National Academy of Sciences, 105, 6668–6672.
Feeley KJ (2012) Distributional migrations, expansions, and contractions of tropical
plant species as revealed in dated herbarium records. Global Change Biology, 18,
1335–1341.
Feeley KJ, Silman MR (2008) Unrealistic assumptions invalidate extinction estimates.
Proceedings of the National Academy of Science, 105, e121.
Feeley KJ, Silman MR (2009) Extinction risks of Amazonian plant species. Proceedings
of the National Academy of Sciences, 106, 12382–12387.
Feeley KJ, Silman MR (2010a) Biotic attrition from tropical forests correcting for trun-
cated temperature niches. Global Change Biology, 16, 1830–1836.
Feeley KJ, Silman MR (2010b) Land-use and climate change effects on population size
and extinction risk of Andean plants. Global Change Biology, 16, 3215–3222.
Feeley KJ, Silman MR (2010c) Modelling Andean and Amazonian plant species
responses to climate change: the effects of geo-referencing errors and the impor-
tance of data filtering. Journal of Biogeography, 37, 733–740.
Feeley KJ, Silman MR (2011) The data void in modeling current and future distribu-
tions of tropical species. Global Change Biology, 17, 626–630.
Feeley KJ, Silman MR, Bush MB et al. (2011) Upslope migration of Andean trees. Jour-
nal of Biogeography, 38, 783–791.
Fisher JB, Malhi Y, Bonal D et al. (2009) The land–atmosphere water flux in the tro-
pics. Global Change Biology, 15, 2694–2714.
Fisher JB, Whittaker RJ, Malhi Y (2011) ET come home: potential evapotranspiration
in geographical ecology. Global Ecology and Biogeography, 20, 1–18.
Forero-Medina G, Terborgh J, Socolar SJ, Pimm SL (2011) Elevational ranges of birds
on a tropical montane gradient lag behind warming temperatures. PLoS ONE, 6,
e28535.
Hijmans RJ, Cameron SE, Parra JL, Jones PG, Jarvis A (2005) Very high resolution
interpolated climate surfaces for global land areas. International Journal of Climatol-
ogy, 25, 1965–1978.
Hubbell SP, He F, Condit R, Borda-de-Agua L, Kellner J, Ter Steege H (2008) How
many tree species are there in the Amazon and how many of them will go extinct?
Proceedings of the National Academy of Sciences, 105, 11498–11504.
Janzen DH (1967) Why mountain passes are higher in the tropics. American Naturalist,
101, 233–249.
Jaramillo C, Rueda MJ, Mora G (2006) Cenozoic plant diversity in the neotropics. Sci-
ence, 311, 1893–1896.
Killeen TJ, Solorzano LA (2008) Conservation strategies to mitigate impacts from cli-
mate change in Amazonia. Philosophical Transactions of the Royal Society B: Biological
Sciences, 363, 1881–1888.
Laurance WF, Wright SJ (2009) Introduction: new insights into the tropical biodiver-
sity crisis. Conservation Biology, 23, 1382–1385.
Laurance WF, Lovejoy TE, Vasconcelos HL et al. (2002) Ecosystem decay of Amazo-
nian forest fragments: a 22-year investigation. Conservation Biology, 16, 605–618.
Loarie SR, Duffy PB, Hamilton H, Asner GP, Field CB, Ackerly DD (2009) The veloc-
ity of climate change. Nature, 462, 1052–1056.
Malcolm JR, Markham A, Neilson RP, Garaci M (2002) Estimated migration rates
under scenarios of global climate change. Journal of Biogeography, 29, 835–849.
Malhi Y, Pegoraro E, Nobre AD, Pereira MGP, Grace J, Culf AD, Clement R (2002)
Energy and water dynamics of a central Amazonian rain forest. Journal of Geophysi-
cal Research-Atmospheres, 107, 8061.
Malhi Y, Roberts JT, Betts RA, Killeen TJ, Li W, Nobre CA (2008) Climate change,
deforestation, and the fate of the Amazon. Science, 319, 169–172.
Malhi Y, Aragao LEOC, Galbraith D et al. (2009) Exploring the likelihood and mecha-
nism of a climate-change-induced dieback of the Amazon rainforest. Proceedings of
the National Academy of Sciences, 106, 20610–20615.
McCain CM (2009) Vertebrate range sizes indicate that mountains may be ‘higher’ in
the tropics. Ecology Letters, 12, 550–560.
Nepstad DC, Verssimo A, Alencar A et al. (1999) Large-scale impoverishment of
Amazonian forests by logging and fire. Nature, 398, 505–508.
Nepstad D, Soares-Filho BS, Merry F et al. (2009) The end of deforestation in the Bra-
zilian Amazon. Science, 326, 1350–1351.
Olson DM, Dinerstein E, Wikramanayake ED et al. (2001) Terrestrial ecoregions of the
world: a new map of life on Earth. BioScience, 51, 933–938.
Parmesan C (2006) Ecological and evolutionary responses to recent climate change.
Annual Review of Ecology, Evolution, and Systematics, 37, 637–669.
Peres CA, Gardner TA, Barlow J et al. (2010) Biodiversity conservation in human-
modified Amazonian forest landscapes. Biological Conservation, 143, 2314–2327.
Petit RJ, Hu FS, Dick CW (2008) Forests of the past: a window to future changes. Sci-
ence, 320, 1450–1452.
Phillips SJ, Anderson RP, Schapire RE (2006) Maximum entropy modeling of species
geographic distributions. Ecological Modelling, 190, 231–259.
Pimm SL, Raven P (2000) Biodiversity: extinction by numbers. Nature, 403, 843–845.
Raven P (1988) Our diminishing tropical forests. In: Biodiversity (ed. Wilson EO),
pp. 119–122. Published by National Academies Press, Washington, D.C.
Sheldon KS, Yang S, Tewksbury JJ (2011) Climate change and community disassem-
bly: impacts of warming on tropical and temperate montane community structure.
Ecology Letters, 14, 1191–1200.
Soares-Filho BS, Nepstad DC, Curran LM et al. (2006) Modelling conservation in the
Amazon basin. Nature, 440, 520–523.
Ter Steege H, Pitman N, Sabatier D et al. (2003) A spatial model of tree a-diversity
and tree density for the Amazon. Biodiversity and Conservation, 12, 2255–2277.
Sunday JM, Bates AE, Dulvy NK (2011) Global analysis of thermal tolerance and lati-
tude in ectotherms. Proceedings of the Royal Society B: Biological Sciences, 278, 1823–
1830.
Terborgh J (1973) On the notion of favorableness in plant ecology. The American Natu-
ralist, 107, 481–501.
Thomas CD, Cameron A, Green RE et al. (2004) Extinction risk from climate change.
Nature, 427, 145–148.
Thuiller W (2003) BIOMOD–optimizing predictions of species distributions and pro-
jecting potential future shifts under global change. Global Change Biology, 9, 1353–
1362.
Thuiller W (2007) Biodiversity: climate change and the ecologist. Nature, 448, 550–552.
© 2012 Blackwell Publishing Ltd, Global Change Biology, 18, 2636–2647
2646 K. J . FEELEY et al.
Walther G-R, Post E, Convey P et al. (2002) Ecological responses to recent climate
change. Nature, 416, 389–395.
Williams JW, Jackson ST, Kutzbac JE (2007) Projected distributions of novel and dis-
appearing climates by 2100 AD. Proceedings of the National Academy of Sciences, 104,
5738.
Wright SJ, Muller-Landau HC, Schipper J (2009) The future of tropical species on a
warmer planet. Conservation Biology, 23, 1418–1426.
Zachos JC, Wara MW, Bohaty S et al. (2003) A transient rise in tropical sea surface
temperature during the paleocene-eocene thermal maximum. Science, 302, 1551–
1554.
Zelazowski P, Malhi Y, Huntingford C, Sitch S, Fisher JB (2011) Changes in the poten-
tial distribution of humid tropical forests on a warmer planet. Philosophical Trans-
actions of the Royal Society A: Mathematical, Physical and Engineering Sciences, 369,
137–160.
Supporting Information
Additional Supporting Information may be found in the online version of this article:
Table S1. List of herbaria contributing tropical plant collection records accessed through the Global Biodiversity Information Facil-ity and SpeciesLink.Figure S1. Maximum Climatological Water Deficit (MCWD; first row), and mean annual temperature (second row) coverages usedin this study.Figure S2. The observed thermal range, or niche breadth, of the 2779 study species vs. the upper (hot) limit to the estimated thermalniche.Figure S3. Vertical bars indicating the thermal niches of each of the 2779 study species.Figure S4. Percent habitat loss relative to current habitat area (i.e., incorporating deforestation as of 2002; positive values indicatedecrease in habitat area) observed for each of 2779 Amazonian plant species under various combinations of assumptions.Figure S5. Percent habitat loss relative to current habitat area (i.e., incorporating deforestation as of 2002; positive values indicatedecrease in habitat area) observed for each of 2779 Amazonian plant species under the assumption that extant of future deforesta-tion is based on business-as-usual rates (deforestation = 2050BAU) vs. extant of future deforestation is based on reduced rates dueto increased governance (deforestation = 2050GOV).Figure S6. Percent accordance (Kappa) vs. ratio of range areas for 500 randomly selected study species as predicted using the modi-fied . BIOCLIM species distribution model as used in the analyses vs. the range areas as predicted from the machine learning basedMAXENT species distribution model.
Please note: Wiley-Blackwell are not responsible for the content or functionality of any supporting materials supplied by theauthors. Any queries (other than missing material) should be directed to the corresponding author for the article.
© 2012 Blackwell Publishing Ltd, Global Change Biology, 18, 2636–2647
FUTURE AMAZONIAN DISTRIBUTIONS AND DIVERSITY 2647