the relationship of aida model in term ofwebsite design and
13
G.J. C.M.P., Vol. 2(2) 2013:1-13 ISSN 2319 – 7285 1 THE RELATIONSHIP OF AIDA MODEL IN TERM OFWEBSITE DESIGN AND STRUCTURE TOWARDS PURCHASING DECISIONON ZALORA INDONESIA (A CASE STUDY OF PRESIDENT UNIVERSITY STUDENT) Hafid Pradipta 1 & Purwanto 2 1 Faculty of Economics, President University, Bekasi, Indonesia 2 Faculty of Economics, President University, Bekasi, Indonesia Abstract Growth of internet in Asia specifically in Indonesia is contributed to the growth of electronic commerce. Ranked number 9 in term of internet user worldwide, Indonesia electronic commerce shopper is also growth to 6.5% from Indonesian population. Fashion is the most desired category to be bought online followed by games and video. This growth in fashion also has impact worldwide especially to physical store online shop. However, in Indonesia, customer still look for information of desired goods in internet before purchasing it in physical store. This problem of not buying in the website directly is what researcher wants to analyzed. This research aims to identify the relationship of website design and structure toward purchasing decision among Zalora Indonesia’s customer in President University. Researcher is using theory of AIDA model (Attention, Interest, Desire, Action) in term of website design and structure to figure out the relationship between those variables toward purchasing decision. Variable in website design and structure based on AIDA models are: visual appeal, ease of use, interactivity, trustworthiness and convenience. The research is using quantitative analysis. Data were gathered from 100 respondents of President University student who already purchase goods online via Zalora Indonesia at least once. The study indicated Visual Appeal, Ease of Use, and Trustworthiness and Convenience partially and collectively have significant impact. Keyword: Website, design, structure, electronic commerce, AIDA Model 1. Introduction 1.1 Background of the Study The internet and especially the service known as the World Wide Web or (WWW or “Web”) has become the communication interface to an exponentially growing network of computer (Daniel, Thomas. 2000). The internet is a new architecture, an immense utility structure for information, communication, and media service. By June 30th 2012 Internet users have reached 2,405,518,376 Internet users (Miniwats, 2012). Arise with the internet users, Internet shopping was introduced as an electronic commerce (EC) application in the early 1990s (Turban et al., 2002) and it has become alternative channel to TV shopping, telephone shopping and traditional stores for customers to purchase products and services. E-commerce has been defined as a process of buying and selling of goods over the internet. E-commerce should be considered as all electronically mediated transactions between an organization and any third party it deals with (Chaffey,2000). Indonesia ranked number 9 largest internet user with 55 million users. The rate of internet penetration in Indonesia is 23% compared with 236 million promotion population in Indonesia. Since 2006, internet users grow among middle class is driven by younger age groups (10-19 years old) which increasing 22% in last 5 years. Latest survey in 2011 from Daily Social stated that 6.5 % on Indonesian internet users are using e-commerce with 0.9 billion$ spending. Compared to the total retail sales that is 134 billion$, e-commerce only acquired the proportion of 0.7%. The most popular goods that are bought in e-commerce are Fashion for 37% followed with travel booking and music/video games for 20% respectively. (Miniwats, 2012). Asosiasi Penyelenggara Jasa Internet Indonesia (ASPJII) shows the chart about Indonesian Indonesian’s growth of Internet user. It is likely with the exponential growth. Figure 1.1 Indonesia internet user Source: APJII website statistic
-
Upload
khangminh22 -
Category
Documents
-
view
4 -
download
0
Transcript of the relationship of aida model in term ofwebsite design and

G.J. C.M.P., Vol. 2(2) 2013:1-13 ISSN 2319 – 7285
1
THE RELATIONSHIP OF AIDA MODEL IN TERM OFWEBSITE DESIGN AND STRUCTURE TOWARDS PURCHASING DECISIONON ZALORA INDONESIA (A
CASE STUDY OF PRESIDENT UNIVERSITY STUDENT)
Hafid Pradipta1& Purwanto2
1Faculty of Economics, President University, Bekasi, Indonesia
2Faculty of Economics, President University, Bekasi, Indonesia
Abstract Growth of internet in Asia specifically in Indonesia is contributed to the growth of electronic commerce. Ranked
number 9 in term of internet user worldwide, Indonesia electronic commerce shopper is also growth to 6.5% from
Indonesian population. Fashion is the most desired category to be bought online followed by games and video. This
growth in fashion also has impact worldwide especially to physical store online shop. However, in Indonesia, customer
still look for information of desired goods in internet before purchasing it in physical store. This problem of not buying in
the website directly is what researcher wants to analyzed. This research aims to identify the relationship of website
design and structure toward purchasing decision among Zalora Indonesia’s customer in President University. Researcher
is using theory of AIDA model (Attention, Interest, Desire, Action) in term of website design and structure to figure out
the relationship between those variables toward purchasing decision. Variable in website design and structure based on
AIDA models are: visual appeal, ease of use, interactivity, trustworthiness and convenience. The research is using
quantitative analysis. Data were gathered from 100 respondents of President University student who already purchase
goods online via Zalora Indonesia at least once. The study indicated Visual Appeal, Ease of Use, and Trustworthiness and Convenience partially and collectively have significant impact.
Keyword: Website, design, structure, electronic commerce, AIDA Model
1. Introduction 1.1 Background of the Study The internet and especially the service known as the World Wide Web or (WWW or “Web”) has become the communication interface to an exponentially growing network of computer (Daniel, Thomas. 2000). The internet is a
new architecture, an immense utility structure for information, communication, and media service. By June 30th 2012
Internet users have reached 2,405,518,376 Internet users (Miniwats, 2012). Arise with the internet users, Internet
shopping was introduced as an electronic commerce (EC) application in the early 1990s (Turban et al., 2002) and it has
become alternative channel to TV shopping, telephone shopping and traditional stores for customers to purchase products
and services. E-commerce has been defined as a process of buying and selling of goods over the internet. E-commerce
should be considered as all electronically mediated transactions between an organization and any third party it deals with
(Chaffey,2000).
Indonesia ranked number 9 largest internet user with 55 million users. The rate of internet penetration in Indonesia
is 23% compared with 236 million promotion population in Indonesia. Since 2006, internet users grow among middle
class is driven by younger age groups (10-19 years old) which increasing 22% in last 5 years. Latest survey in 2011 from
Daily Social stated that 6.5 % on Indonesian internet users are using e-commerce with 0.9 billion$ spending. Compared
to the total retail sales that is 134 billion$, e-commerce only acquired the proportion of 0.7%. The most popular goods
that are bought in e-commerce are Fashion for 37% followed with travel booking and music/video games for 20%
respectively. (Miniwats, 2012).
Asosiasi Penyelenggara Jasa Internet Indonesia (ASPJII) shows the chart about Indonesian Indonesian’s growth of
Internet user. It is likely with the exponential growth.
Figure 1.1 Indonesia internet user
Source: APJII website statistic

G.J. C.M.P., Vol. 2(2) 2013:1-13 ISSN 2319 – 7285
2
The steadily increasing growth is seen from 1998. Within only 14 years the growth yielded almost 126 times. This
is indicated that related internet business in Indonesia will keep expanding. Further survey according also show the
demographic distribution of Indonesian Internet user. Based on the research released by Aquarius, consultant of
communication strategy for digital media, internet user in Indonesia is dominated by youngsters. 40% out of 55 million
internet users in Indonesia are 15-24 years old. 33% of them are 25-34 years old and 35-44 is 17%.
Mobile internet penetration in Indonesia recently has reached 57%. In terms of population, MarkPlus Insight
(MarkPlus Insight Netizen Research 2011) data shows that Indonesia recently reached 29 million mobile internet users,
increasing from 16 million users in the previous year. Similar with MarkPlus Insight, Aquarius showed that more than
half of internet users in Indonesia are using mobile devices or gadget as their access to the internet. With a huge
population, Indonesia becomes 4th biggest country in terms of mobile phone users in the world (Finsterlin, 2012)
Within this new internet user behavior, it will shape also other aspect in human related activities. One of the is on how do they shop. A survey also show that the average annual spend on e-commerce is increasing within 2011 followed with the
internet e-commerce population. It is shown that the average Indonesia in 2011 spend 256$ annually on electronic
commerce and the population of e-commerce shopper is 6.5%.
On March 2012, Ipsos launch the press release about result of survey characteristic on internet user in 84 countries
globally including Indonesia. Within more than 1000 respondents’ age 16-64 years old in Indonesia, It showed that 69%
of Indonesian people visit sites for info on products before buying, and only 44% that is using electronic commerce to
buy product/ service online. There is a gap of 25% between people who visit the website only for the information and
with someone who buys it.
Within the given data above, there are so many player in Indonesian electronic commerce. There are: Facebook,
Kaskus, Lazzada, Zalora, Bhineka, and other online online shop in Indonesia that fill the electronic commerce. The goods
that is sold also varies. It can be seen on the graph that fashion goods are the most popular things bought in electronic
commerce. However despite the growth of apparel online shop, another unfortunate news start to creeping for brick and
mortar of apparel shop globally. Physical apparel shop start to closing down. Several of those stores are (Ripe, 2013).
All of the stores are shut down due to inability to sustain the business. However in contrast the growth of apparel
online shop is growing rapidly. Big brand stores start to shift their business to “click and collect” service in 900 stores.
Next’s internet directory division also reported an 11.8% growth per quarter start from first quarter in 2012”.
Report by mintel showed that 4.3 billion$ worth of clothes were bought over the internet last year. Growth of 152
per cent in the last five year. More than 35% of shoppers bought their clothes online in the last 12 monts, increasing 26%
in previous year worldwide. Report from IMRG, the consultant for Capgemini said that sales had jumped by 23%
compare to previous year before launching division of online shop.
Mintel also said the online marketing clothing market had been helped by more sophisticated websites, showing
close-up picture of clothes as well as number of other players such as Zara, H&M, Gap and Top Shop start the
“transactional” websites (Harry, 2012). This shifting behavior from brick and mortar shop to online shop trigger the
curiosity the researcher of the customer’s online shop. Researcher want to examine why the customer prefer to buy online
rather than go the store.
1.2 Problem Identification From recent Ipsos report it can be seen that people tend to look the information before purchasing the goods that
they desire and from 69% Indonesian people who visits the sites, only 44 % that purchase the goods in the website itself.
When a customer able to shop online after they visit but they prefer not to buy online is a problem for researcher.
Researcher want to find out the purchasing behavior of electronic commerce customer.
In the book of Internet Marketing, the author describe website is illustrated as the front desk on an office and the
customer will have the first impression of the office that later become their anchor on other perspective that will
influence them on the final result of purchasing decision. (D. Chaffey,2000). It is also supported by psychologist that
human brain tend to jump into the conclusion about particular information even it is only served with least amount.
(Kanhenman, 2011). The information that is provided (color, shape, font, space, contrast, brightness) in the website both
consciously an unconsciously trigger the human brain to create a conclusion of what should the customer do regarding
the website. Therefore researcher wants to find out what kind of website that triggers the customer to purchase in online
environment by analyzing the relationship between website design and structure toward purchasing decision.
1.3 Statement of Problem To sharpen the guidelines of this research, researcher constructs a statement of problem as follow:
Does the website design partially and collectively has the relationship with the purchasing decision on electronic commerce?
What is the most significant variable in term of website design and structure to determine purchasing decision?
1.4 Objective Based on the statement of problem, here are the researcher aim to achieve after conducting this research:
To know whether of website design and structure partially and collectively has relationship towards purchasing decision
in electronic commerce
To analyze the most significant variable in term of website design and structure to determine purchasing decision
G.J. C.M.P., Vol. 2(2) 2013:1-13 ISSN 2319 – 7285
3
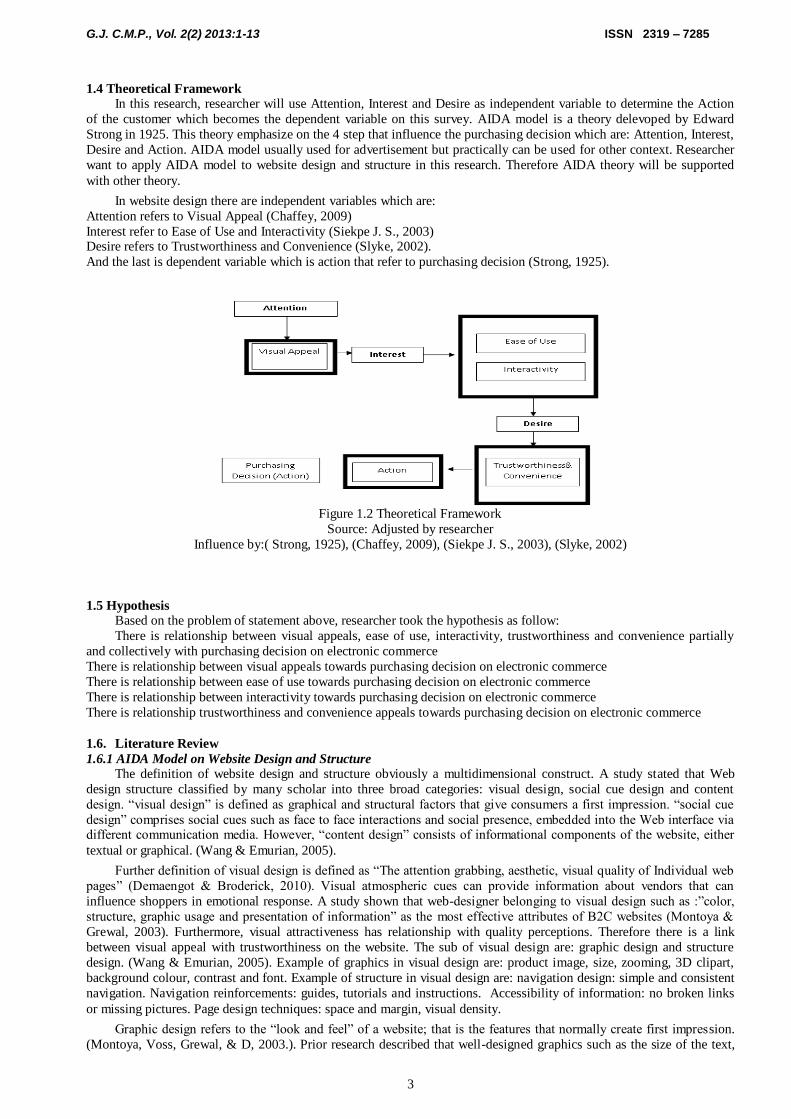
1.4 Theoretical Framework In this research, researcher will use Attention, Interest and Desire as independent variable to determine the Action
of the customer which becomes the dependent variable on this survey. AIDA model is a theory delevoped by Edward
Strong in 1925. This theory emphasize on the 4 step that influence the purchasing decision which are: Attention, Interest,
Desire and Action. AIDA model usually used for advertisement but practically can be used for other context. Researcher
want to apply AIDA model to website design and structure in this research. Therefore AIDA theory will be supported
with other theory.
In website design there are independent variables which are:
Attention refers to Visual Appeal (Chaffey, 2009)
Interest refer to Ease of Use and Interactivity (Siekpe J. S., 2003) Desire refers to Trustworthiness and Convenience (Slyke, 2002).
And the last is dependent variable which is action that refer to purchasing decision (Strong, 1925).
Figure 1.2 Theoretical Framework
Source: Adjusted by researcher
Influence by:( Strong, 1925), (Chaffey, 2009), (Siekpe J. S., 2003), (Slyke, 2002)
1.5 Hypothesis Based on the problem of statement above, researcher took the hypothesis as follow:
There is relationship between visual appeals, ease of use, interactivity, trustworthiness and convenience partially
and collectively with purchasing decision on electronic commerce
There is relationship between visual appeals towards purchasing decision on electronic commerce
There is relationship between ease of use towards purchasing decision on electronic commerce
There is relationship between interactivity towards purchasing decision on electronic commerce
There is relationship trustworthiness and convenience appeals towards purchasing decision on electronic commerce
1.6. Literature Review
1.6.1 AIDA Model on Website Design and Structure The definition of website design and structure obviously a multidimensional construct. A study stated that Web
design structure classified by many scholar into three broad categories: visual design, social cue design and content
design. “visual design” is defined as graphical and structural factors that give consumers a first impression. “social cue
design” comprises social cues such as face to face interactions and social presence, embedded into the Web interface via different communication media. However, “content design” consists of informational components of the website, either
textual or graphical. (Wang & Emurian, 2005).
Further definition of visual design is defined as “The attention grabbing, aesthetic, visual quality of Individual web
pages” (Demaengot & Broderick, 2010). Visual atmospheric cues can provide information about vendors that can
influence shoppers in emotional response. A study shown that web-designer belonging to visual design such as :”color,
structure, graphic usage and presentation of information” as the most effective attributes of B2C websites (Montoya &
Grewal, 2003). Furthermore, visual attractiveness has relationship with quality perceptions. Therefore there is a link
between visual appeal with trustworthiness on the website. The sub of visual design are: graphic design and structure
design. (Wang & Emurian, 2005). Example of graphics in visual design are: product image, size, zooming, 3D clipart,
background colour, contrast and font. Example of structure in visual design are: navigation design: simple and consistent
navigation. Navigation reinforcements: guides, tutorials and instructions. Accessibility of information: no broken links
or missing pictures. Page design techniques: space and margin, visual density.
Graphic design refers to the “look and feel” of a website; that is the features that normally create first impression.
(Montoya, Voss, Grewal, & D, 2003.). Prior research described that well-designed graphics such as the size of the text,

G.J. C.M.P., Vol. 2(2) 2013:1-13 ISSN 2319 – 7285
4
the display of the text and how appealing users find the interface in general will improve consumers’ online shopping
experience and create the positive effect on their purchasing behavior(Rosen & Purinton, 2004.). On the other hand bad
graphic design has possibility to create confusion and negative emotional response that will contradict with consumers’
willingness to continue browsing or purchase from the website. (Montoya, Voss, Grewal, & D, 2003.)
Structure design is another dimension of visual design and refers to the overall organization and accessibility of displayed
information on the website. (Wang & Emurian, 2005). The definition of “structure design” is “the organization of the
different pages as understand whole”(Demangeot & Broderick, 2010.). The scope of structure design are: navigation aids,
layout of information, speed of page loading, validity of links, search facilities, site-maps, site availability, and ease of
accessing the site. A surprising study shown that when a website is easier to navigate, customer tend to less sensitive
toward the price and have high possibility to purchase more expensive product (Lynch & Ariely, 2000).
Social cue design relates with the social media features. Social media embedded social cues to provide the impression of social presence and face-to face interaction in the web via other communication devices such as photos,
video streams or mailing list. (Karimov & Brengman, 2011). Content design refers to the component of information of a
website both textual and graphical (Wang & Emurian, 2005). The components may be varying such as: company related
information (FAQ, company profile, contacts, policy), product information (description, price, promo), service
information (method of payment, return policies, privacy policies. The components of contents provide customer with
information regarding the trustworthiness of an e-retailer. (Chang & Chen, 2008). Information quality also found to be an
importance contribution of online trust, customer satisfaction and loyalty (Cyr, 2008). Due to inability of the physical
inspection of the product, many consumers prefer to shop in online shopping environment that contain comprehensive
information compare to those who don’t have.
1.6.2 Theories of AIDA Model on Website Design and Structure In the early 1920s, psychology and marketer start to identify purchasing behavior from buyer perspectives. Early
result showed by (Strong, 1925) that there are 4 stages that influence purchasing decision. Those are:
a. Attention
b. Interest
c. Desire
d. Action
This model recently is known as the AIDA model. (Kotler, Wong, Saunders, & Armstrong, 2005) The model is used
to develop an effective message. The message has to get attention, hold interest, arouse desire and obtain actions. Usually the model is used as a means to help shaping well structured advertisement, but could be practical in other context as
well. A study that emphasis on customer point of view, stated that there are 4 factors that become the factor influence
purchasing decision. Those factors are: web content and design about product / service, ease of using, response of web
and credibility (Nuseir, Arora, & Al-Masri, 2010). Therefore researcher using the theory as guidelines to create this
research.
1.6.3 Attention The first step of AIDA theory is grabbing attention of the customer (Strong, 1925). In the website design, grabbing
the attention of the customer is happened in the first homepage of the website. Customer will determine whether they are
attracted or not to find deeper information about the website or just leave the website because customers find it not
interesting. The attraction itself occurred only when the website find appealing for them.(Chaffey, 2009) Therefore in this
research, visual appeal is put into the “attention” section in the AIDA model for website design and structure.
Visual Appeal defined as atmospherics which is the effort of buying environment to produce specific emotional
effect. In the electronic commerce the atmospherics or the environment are solely in visual dimensions. Those are consist
of : color, brightness, size and shapes (Kotler P. , Atmospherics as a marketing tool, 1973). The emotional effect can be
vary depend on the given impression that want to be given by the website. The impact of the visual appeal on purchasing
behavior is by becoming attention-creating medium. The dimensions (color, brightness, size and shape) are used to make
the website stand out among other.
Visual appeal of the website gives the first impression before the customer move into further perceived information
that the vendor’s provided. First impression when enter the website is really correlated with the website colors, brightness
and complexity of the website. Furthermore it is explained that the level of complexity in the website front-page has relationship with pleasure and arousal of the purchasing (Tuch, 2009). This is also supported that the importance of first
impression of a website on Business to Consumer website (Wakefield, 2004). Once the customer is interested on the first
impression, it is far easier to maintain their interest and make them create purchasing decision. On the other hand, once
the customer is not interested at the first time, chance that they will leave the website immediately. Therefore the first
impression is very important when the customer and the vendor’s has no relationship before .(Wakefield, 2004).
Visual appeal can grab attention with 2 methods. Those are: attention through strong imagery and attention through
strong typography. Both of them are used in the website to expose the particular information to costumer with anchoring
information that is not necessary. (Friedman, 2010). This will create hints to the customer indirectly to the desired goods
that want to be sold by vendor by emphasizing the presence and color contrast in the website.
Color schemes have wide ranging effect on human. The spectrum that is warm end found very appealing the
children while maturity is more modest by enjoying soft color. (Geboy, 1996). Colors get into the subconscious human

G.J. C.M.P., Vol. 2(2) 2013:1-13 ISSN 2319 – 7285
5
brain that help to translate complex information by arousing the emotional response. A study from 36 fashion industry
show that color and font is the most important factor in term of the attractive design of website (Nathan, 2010).
Complexity of a website also affecting the purchase decision on a website. A study from shown that complexity in
the website layout design is correlated with interest but has negative effect on the pleasantness (Stevenson J. B., 2000). In
his conclusion, he stated that simpler website design have significantly more positive impacts on purchase intention and
attitude toward the website.
1.6.4 Interest Interest is divided into 2 variables which are “Ease of Use” and “Interactivity”. Reason researcher use this “Ease of
Use” and “Interactivity” is because a study stated that the importance of not getting irritated when entering a website.
Website has to create positive attitude to customers. Website also has to provide the simplicity of navigating it (ease of use) and interest has to be maintained in 2 way communication (interactivity) in order a customer decide not to buy in the
given online shop (Siekpe J. S., 2003)
1.6.4.1 Ease of use Ease of use is described as one of the term of usability, user friendliness and ease of learning that create the users
with system that require the least cognitive and physical effort to accomplish their task. (Karat, 2003).
In Microsoft Usability Guidelines,( MUG) ease of use comprises three sub categories. Those are (Agarwal, 2002):
a. Goals, relating to clear and understandable objectives;
b. Structure, focusing on the organization of the site;
c. Feedback, capturing the extent to which the Web site provides information regarding progress to the user.
The first point stated about goals, relating to clear and understandable objectives. A customer that visit the website,
will visit with the objectives. There can be 2 possibility whether the objectives is met or the objective is not met. The
investigation of online consumer behavior show that the customer is looking for desired good in the online shop. They
will look for type of the product that they desire if the website provide only one brand at the website. However if the
website is a shop with various kind of brand, customer will also consider to find the desired brand (Ahuja, Gupta, &
Pushkala, 2003).
Second point in Microsoft Usability Guidelines stated about the structure or organization of the website. It indicates
that the importance of structure of the website to give the pleasant feeling to the customer. However a study in airlines
show that the customer is pleasant when they can find each of every different section easily. It found that subheading
such as ticket price, country destination, timetable and news that easy to find relate with the more pleasant customer.
(Abedin & Sohrabi, 2009). Regardless of the sub heading the study also shown that the importance of the speed in connectivity of a website towards customers. If the website transition is too low, it will make the customer lose their
interest and searching for other website (Abedin & Sohrabi, 2009).
A study that measuring ease of use that is using Total Acceptance Model shows that ease of use mean that to which a
person believes that using a technology will be free of effort. In his study, he also found that individual’s general
familiarity of the website has effect on the pleasantness (Venkatesh, 2000). Another study state that individuals attempt
to minimize effort in their behaviors, thus supporting a relationship between perceived ease of use and purchase behavior
(Todd & Bensabat, 1991).
1.6.4.2 Interactivity Interaction defined as an expression of the extent that in a given series of communication ex- changes, any third (or
later) transmission (or message) is related to the degree to which previous exchanges referred to even earlier
transmissions (Hoffman, 1996).In electronic commerce, the interactivity that is occurred is Machine Interactivity.
Machine interactivity is "the extent to which users can participate in modifying the form and content of a mediated
environment in real time" (Steuer, 1992). When interacting with computer, consumer perceives two environments:
Physical and the environment defined by the computer. It shown that a person also feels the same feeling in computer
environment as well as the immediate physical environment.
1.6.5 Desire A study stated that website design has to provoke the desire of the customer to shop. In this case, it also found that
the relation of trust and intention to purchase. However, even though the customer has already strong desire to purchase
goods in electronic commerce, customer start to doubt about giving personal information both credit card or bank
account information related and lead to refusal of the purchasing decision (Slyke, 2002).. Therefore, due to the reason,
researcher put “Trustworthiness and Convenience” in the section of Desire.
1.6.5.1 Trustworthiness and Convenience A survey of 1500 Singaporeans shows that the main concern of those who had not bought anything on Internet was
related to the risk of not being able to examine the products and the reliability of the sellers customer are afraid that the
vendor won’t deliver the desired goods that they are order. Therefore the returning item policy in electronic commerce
show the significant impact to the trust in the customer (Sim and Koi 2002). Online shopping is not only providing
convenience but also it has no sales pressure on customer when they are willing to purchase goods online (Lim 2003).
The convenience of online shop obviously show by the shipment of the goods. In this study show that customer are prefer
G.J. C.M.P., Vol. 2(2) 2013:1-13 ISSN 2319 – 7285
6
to choose the price that already include the shipping cost. It appear that another price addition for shipping cost give
irritating response on customer. (Chiang and Dholakia 2003).
Trustworthiness and convenience with security in electronic commerce cannot be separated. Security has been
dominant factors that affect purchasing decision on electronic commerce. Many internet users avoid online shopping
because of the credit card fraud, and private information. Safety and security in transaction both for hard cash and credit
card increase the trust in electronic commerce (Wells, Valacich, & Parboteeah, 2011). Another study claims that the clear
information of payment provided by the vendor is increasing the trust in electronic commerce. (Slyke, 2002) A study
claims trust in the internet shopping with advanced technology, and frequent online shopping to the internet being
secured as a trustworthy shopping channel. (Cuneyt and Gautam 2004)
1.6.6 Action Action describes the moment when the customer create their decision and make actual purchase (Strong, 1925).
Therefore in this research, the “action” section will refers to purchasing decision.
1.6.6.1 Purchasing Decision There are several behavior from customer point of view regarding with the purchasing decision on electronic
commerce. There are several behavior such as: searching behaviour, purchasing behaviour and the pleasure aspects are
important factor to analyze how consumer behave when they shop online. Consumer gather the necessary information
while they browsing and make comparison to obtain conclusion that will lead to decision making of purchasing or not.
Internet however provides massive information and yet it’s easy to browse so the customer can decide based on actual
information. Consumer can reach many important aspects when browsing such as: price, size, color, type etc. The
process of searching information is connected with purchasing behavior. (Forsythe, Liu, Shannon, & Gardner, 2006).
Attention to the detail of the website has to be main concern in the electronic commerce. A study shown that
annoying broken links and buttons create a negative feeling to the e-store and it is the most common reason for consumer
to leave the website. 90% customer leaves due to unsatisfied system availability (Peter, 2006). Even though the website is
pretty satisfying, it doesn’t merely create a guarantee a customer will directly shop. A study from shown that 85%
customer are reluctant to in online store. Customer simply abandons what they have chosen in the cart due to two main
risks that they faced. They are faced with product risk which they afraid the product that will be shipped will different
from their expectation and the financial risk where their credit card will be hacked and losing financial resources.
However in his study, it’s shown that online apparel shop that is growing provide convenience and wide range of product
variety and good prices (Beck, 2012).
A research investigates the impact perceived usefulness (PU) on e-commerce. They report that while PU affects intended use when a Web site is used for a purchasing task (Gefen & Straub, 2000). Similar finding also found that
design factors affecting consumer loyalty stated by (Lee, Park, & Moon, 2001).. An attempt was tempted to evaluate
website design and feature quality from user satisfaction and dissatisfaction perspective. Their studies show that website
design features can be regarded as hygiene and motivator factors that contribute to user dissatisfaction and satisfaction
with a website (Zhang & Von Dran, 2000). Hygiene factors are those whose present make a website functional and
serviceable, and whose absence causes user dissatisfaction. In their continued effort, they further discover that the most
important website quality factors ranked by e-commerce consumers are hygiene.
1.6.6.2 Buying Decision Process There are Need for recognition, information search, evaluation of alternatives, purchase decision, postpurchase
behavior. Here are the explanation of the process.
a. Need recognition: It refers to consumer that feels a need or a lack of something. The need can be triggered by
internal stimuli when one of the person’s normal needs or external stimuli such as advertisement or a discussion with
a friend about purchasing particular product
b. Information search: Consumer wants information and details about the desired product. These details can be
provided by personal selling or labels in shop stores.
c. Evaluation of alternatives: once the information is gathered customer faced with the several choices of the product. With provided information he can choose the best alternative that meet his needs.
d. Purchase decision: Customer chooses which brand he desire. However there are two factors involve between the
purchase intention and the purchase decision: attitude of others and unexpected situational factors. Attitude of others
refers to somebody closed to the customers recommends to buy this product rather than this one. Unexpected
situational factors are the contrary of expected factors such as expected price or expected product benefit. However,
events may change the purchase decision such as sales promotion this is called unexpected situational factors (Kotler
and Armstrong, 2010).
e. Post purchase behavior: After its purchase customer can be satisfy or not. Customer delight is one of the most
important things in marketing because it allows customer loyalty. It means that the consumer feeling after the
purchase is as important as the consumer behavior during the purchase. A cognitive dissonance refers to a buyer
discomfort caused by post purchase conflict (Kotler and Armstrong, 2010). Post purchase satisfaction or
dissatisfaction is linked with the perception of product performance and quality including brand name, price, features
and so on. Consumer engages a constant process to evaluate its purchases by integrating the products into their daily
consumption activities (Solomon, Bamossy, Askegaard & Hogg, 2010).

G.J. C.M.P., Vol. 2(2) 2013:1-13 ISSN 2319 – 7285
7
2. Research Design and Methodology
2.1 Descriptive
This research, researcher used descriptive statistics in order to give description of each variable that is used in this
research. Those variables will be related with collecting and summarizing data and with the presentation of data.
2.2 Classical Assumption Analysis a. Normality Test
Normality test is a test to determine whether data that is used to test the observation is normally distributed or not. The
normal distribution data has the curve pattern just like bell. This kind of curve has 2 main characteristic (Sarwono, 2012):
i. The curve concentrated in the middle and declined in both side
ii. This curve is symmetrical
There are several way for normality test, one of them is by using normality plot. Normality plot specifically is a plot or
pattern in observation data that is arranged based on a sample toward several percentage dots that is connected in a
standard normal distribution.
b. Multi Colinearity Test
Multicollinearity refers to situations in which two or more of the independent variables are highly correlated with each
other (Berenson, Levine, & Timothy, 2012). Multicollinearity refers to A state of high inter correlations among
independent variables (Malhotra & Birks, 1999).
One method of measuring collinearity is to determine the Varian Inflationary Factor (VIF) for each independent variable.
Here are equations that defines VIF
VIF = 1/(1- R_j^2 )
Where R_j^2 is the coefficient of multiple determinations for a regression model using variable X_j as the dependent
variable and all other X variables as independent variables.
If a set of independent variables in uncorrelated, each VIFj is equal to 1. If the set is highly greater than 10, there is too
much correlation between variable X_j and other independent variable. So VIF should be below 10 and any variable that
above it should be removed from the analysis.
c. Heteroskedaticity test
Heterosedaticity test is a test to see the pattern of residual variance from one observation to another observation (Field,
2012)
In this research to determine heteroscedasticity problem, researcher use scatter plot where according to Santoso (2012),
the model of scatter plot can be categorized does not has any heteroscedasticity if the plot on scatter plot are spread
randomly upper and lower 0 point at Y axis without any specific pattern.
2.3 Hypotheses Test To analyze a linear relationship between independent variable with dependent variable, a statistical test has been
taken. The null hypothesis will state that there is no linear relationship between the two variables (β = 0) and the alternate hypothesis is that there is a linear relationship (β ≠ 0). If the null hypothesis can be rejected, then the linear relationship
does not exist.
In this research, the hypothesis is as follows:
Ho1: There is relationship between visual appeal in the website design and feature towards purchasing decision in
Zalora Indonesia Website
Ha1: There is no relationship between visual appeal in the website design and feature towards purchasing decision in
Zalora Indonesia Website
Ho2: There is relationship between ease of use in the website design and feature towards purchasing decision in Zalora
Indonesia Website
Ha2: There is no relationship between ease of use in the website design and feature towards purchasing decision in
Zalora Indonesia Website
Ha 3: There is relationship between interactivity in the website design and feature towards purchasing decision in Zalora
Indonesia Website
Ho3: There is no relationship between interactivity in the website design and feature towards purchasing decision in Zalora Indonesia Website
Ha 4: There is relationship between trustworthiness and convenience in the website design and feature towards
purchasing decision in Zalora Indonesia Website
Ho 4: There is no relationship between trustworthiness and convenience in the website design and feature towards
purchasing decision in Zalora Indonesia Website

G.J. C.M.P., Vol. 2(2) 2013:1-13 ISSN 2319 – 7285
8
Ho5: There is relationship between visual appeal, ease of use, interactivity, and trustworthiness and convenience
collectively. Toward purchasing decision
Ha5: There is no relationship between visual appeal, ease of use, interactivity, and trustworthiness and convenience
collectively. toward purchasing decision collectively.
2.4 Multiple Linear regression coefficient test
2.4.1 F-Test The F-Test will analyze whether or not there is a relationship between set of independent variables and dependent
variable collectively (Supranto, 2004). This test is used to statistically test the null hypothesis which stated that there is no linear relationship between independent and dependent variable ( supranto 2004, p.64) This test is used
statistically test the null hypothesis which stated that there is no linear relationship between independent and
dependent variable (Beta = 0 ) If the significance level for the F-Test is low (significance level alpha used is =
0.05). Means rejecting H0 and conclude that linear relationship does not exist and vice versa.
H0=β1= β2= β3= β4=0 or significant F > α, accept H0
Ha: at least there is one β1 ≠ 0, if significant F< α, reject H0
2.4.2. T-Test The T-test will analyze the partial relationship between each of independent variables (coefficient) and the dependent
variable (Supranto 2004). The null hypothesis is that the coefficient of independent variable (the slope of the line is 0. If
the significance level for the T-test is low (significance level alpha used is 0.05), means rejecting H0 and conclude that
the linear relationship does not exist and vice versa.
a. H0:β1 ≠ 0 or if significant < α, accept H0
(Visual appeal has relationship toward purchasing decision)
Ha: β1 = 0 or if significant > α, reject H0 (Visual appeal has no relationship toward purchasing decision)
b. H0:β1 ≠ 0 or if significant < α, accept H0
(Ease of Use has relationship toward purchasing decision)
Ha: β1 = 0 or if significant > α, reject H0
(Ease of Use has relationship toward purchasing decision)
c. H0:β1 ≠ 0 or if significant < α, accept H0
(Interactivity has relationship toward purchasing decision)
Ha: β1 = 0 or if significant > α, reject H0
(Interactivity has relationship toward purchasing decision)
d. H0:β1 ≠ 0 or if significant < α, accept H0
(Trustworthiness and Convenience has relationship toward purchasing decision)
Ha: β1 = 0 or if significant > α, reject H0
(Trustworthiness and Convenience has relationship toward purchasing decision)
2.5. Multiple Linear Regression In any regression model, there is an implicit assumption (which can be tested) that a relationship exist between the
variables. There is also some random error that cannot be predicted. In this research will analyze and examine the variables that affect the purchasing decision. Since the research will analyze and examine more than 2 independent
variables on the dependent variable, hypothesis testing is using multiple regressions. The model is as the Following
Y = β0 + X1β1 + X2β2 + X3β3 + X4β4 + €
Where:
Y = Purchasing Decision
X1 = Visual Appeal
X2 =Ease of Use
X3 =Interactivity
X4 = Trustworthiness and Convenience
β0 = Intercept / constant (value of Y when X = 0)
βi = Regression coefficient of the ith Independent variable
€ = error
2.6. Coefficient Determination The coefficient of determination written as R
2 is the percent of the variation explained by the regression. It will
measure how strong the correlations among independent variables (X) towards dependent variable (Y) and also goodness
of the fit test. The R2 value can range from a lo 0 to a high 1 (0 < R
2 < 1). If R
2 = 0, it indicates that X as independent
variables explains 0& of the variability in Y, or in other words X has weark correlations with Y. If R2 = 1, it indicates
that every point in the sample were on the regression line and have all errors are 0, Moreover, it stated that X has strong
correlation and cand explain the variablitiy of Y by using the regression.

G.J. C.M.P., Vol. 2(2) 2013:1-13 ISSN 2319 – 7285
9
3. Result and Discussion
3.1 Regression Model Result This research has explained about the model using to analyze this research. In this research, regression model
was used to analyze the significant effect from independent variables toward dependent variable. Regression model
was model to explain the causes and affect from independent variable by look the value of standardized coefficient
beta from each independent variable to dependent variable.
Unstandardized Coefficients Standardized Coefficients t Sig. Collinearity Statistics
Model B Std. Error Beta Tolerance VIF
1(Constant) .132 .185 .715 .476
X1 .232 .080 .233 2.894 .005 .373 2.682
X2 .243 .090 .244 2.688 .008 .294 3.406
X3 .123 .076 .123 1.625 .107 .420 2.378 X4 .376 .087 .376 4.341 .000 .321 3.119
a. Dependent Variable: Purchasing Decision
Based on the table above, the regression equation can be constructed as follow
Regression Equation
Purchasing Decision = 0.233 X1 + 0.244 X2 + 0.376 X4
Researcher is using Standardized Coefficients because all of the questionnaire is in the same likert scale.
The regression direction coefficient of visual appeal is + 0.233. The symbol + means the direction between
purchasing decision and visual appeal is positive. It means that the regression direction of X1 is in line with
purchasing decision. If the point of purchasing decision is increase 1 point, the visual appeal will increase for 0.233
The regression direction coefficient of ease of use is + 0.244. The symbol + means the direction between purchasing
decision and ease of use is positive. It means that the regression direction of X2 is in line with purchasing decision. If
the point of purchasing decision is increase 1 point, the ease of use will increase for 0.244
The regression direction coefficient of trustworthiness and convenience + 0.376. The symbol + means the direction
between purchasing decision and trustworthiness and convenience is positive. It means that the regression direction of X1 is in line with purchasing decision. If the point of purchasing decision is increase 1 point, the trustworthiness and
convenience will increase for 0.376
3.2. Coefficient Determination The coefficient determination is equal to the regression sum of squares divided by the total sum of squares. The
coefficient of determination measures the proportion of variation in purchasing decision that is explained by
independent variable (visual appeal, ease of use, interactivity, trustworthiness and convenience) in the regression
model.
Model R R Square Adjusted R Square Std. Error of the Estimate
1 .878a .771 .761 .48496
a. Predictors: (Constant), Visual appeal, ease of use, interactivity, trustworthiness and convenience
b. Dependent Variable: Purchasing decision
Based on the table above, the coefficient correlation is 0.878 means that all of the independent variables has strong positive correlation toward dependent variable. Based on the table also it indicates that adjusted R square, the
number is 0.761.It means that 76% determination can be explained by this same dependent variable with
consideration of changing from each independent variable meanwhile 23.9% can be explained with other variables.
This proportion can be used for random sample data. The table shows that the possibility this research can be error is
0.48496
After examining R square as the coefficient of determination, the value of significance of F should be looked. The
significance of F-Test should be less than 0.005. The F test will analyze whether or not there is a relationship between
all of independent variables toward dependent variable that can be looked in ANOVA (Analysis of Variance)
3.3 Interpretation of the Result According to the result of multiple regressions statistical above, the coefficient of determination purchasing
decision is 0.878 in Zalora Indonesia. It means that 87% percent variability of purchasing decision is explained by
visual appeal, interactivity, trustworthiness and convenience. The rest 13 percent are explained by other variable.

G.J. C.M.P., Vol. 2(2) 2013:1-13 ISSN 2319 – 7285
10
If it is looked from customer point of view, there are other variables that also influence the purchasing decision
on electronic commerce. A study shown that the factors are: Price, Product characteristic and Inspections. The first
factor that is not explained in this research is Price. A study shown that customer expect lower price in online shop
compare to traditional environment. (Broekhuizen & Huizingh, 2009). Apparently AIDA model that is tested in
Zalora Indonesia already arouse the desire for the customer to shop and they also already trust the vendor as a credible
vendors, however if the price is not suitable for the customer, customer might terminated the purchasing and seek for
substitution.
Second factor that have relationship is the product characteristic. In apparel online shop, the product characteristic
is has high sensitivity toward the customer (Kiang & T, 2001). Product characteristic is a condition that a customer
had decided to buy a particular product but he or she doesn’t like the color and seeking for alternative. If the customer
doesn’t find it, it will turn to termination of purchase on Zalora Indonesia.
The last factors that have relationships are Inspections (Brown, Pope, & Voges, 2001). Search product can be
examined externally by seeking for information but apparently personal inspection is quite necessary. The study show that a product that has the credibility tend to be bought online compare to those who don’t have credibility. Lack of
physical contact on the internet is a factors influence the suitability of shopping. Part of customer is need to feel,
touch, smell or try the product which is not possible in online shop.
From this research, the F- test of purchasing decision is 0.000 which is lower than significance α (0.05). It can be
concluded that variable visual appeal, ease of use, interactivity, trustworthiness and convenience altogether has
correlation with purchasing decision. All of the variable have different relationship partially. Here are the explanation
of each independent toward purchasing decision partially:
a. Visual Appeal
According to the partial test statistics (t-Test) result, variable visual appeal has significant relationship to
purchasing decision. Visual appeal has positive relationship to purchasing decision. If visual appeal is increasing,
the purchasing decision is increasing too. It is in line with the theory that main visual atmosphere of a website
produce emotional effects in the buyer that enhance his purchase probability (Kotler & Keller, Marketing
Management, 2012). In this research, it is proofed that first impression, colors and the layout design in Zalora
Indonesia has significant relationship toward its customer.
This finding also support previous research from (Liqiong & Poole, 2010) that initial responses evoked by visual
complexity and order design features. Furthermore, it is also support that website quality influences perceptions
of products quality that affect online purchase intention (Wells, Valacich, & Parboteeah, 2011)
b. Ease of use
Ease of use has significant relationship to purchasing decision. Ease of use has positive relationship. If ease of
use is increasing, the purchasing decision is increasing too. Ease of use helps the customer to have a clear and understandable objectives which is in this case is the purchasing decision. Ease of use in the website also help the
customer to structures and focusing to only the important information that only necessary for them as explained
by Microsoft Usability Guideline.
Goals, structure and feedback are 3 things that is desired from the customer based on Microsoft Usability
Guidelines. Easiness to find the brand and category is what customer desire to look.This finding also support that
website usability, design and performance determine the success of the website (Palmer, 2002)
c. Interactivity
Interactivity has no significant relationship to purchasing decision. The significant value of interactivity is 0.264
which is higher than 0.05. The explanation of not significance of this variable is that the difference culture
between Western culture and Eastern Culture. Researcher look for theory based on the study of interactivity in
Europe,US and New Zealand, however a study conducted in Thailand show that customers tend not to contact the
vendor if the desired goods that customers’ want don’t exist or whether customers is having the problem
navigating the website. They merely leave the website (Thananuraksakul).
d. Trustworthiness and convenience
Trustworthiness and convenience has significant relationship toward purchasing decision. Trustworthiness and convenience has positive relationship to purchasing decision. It’s in line with the theory that the advantages of
online shop is not have to go out and can still shop at home. The trust of the customer to the website itself also
create the more purchasing decision on Zalora Indonesia.
Trustworthiness and convenience is the most significant variable among all of the variables. This is support the
statement that the main reason not to buy online is the risk of credit card privacy and fraud in electronic
commerce (Sim and Koi 2002)
All of the independent variable have been tested by normality distribution test, testing coefficient and
determination. All of the variable and data has no serious problem; it can be used as the components of research. In
the multiple regression result, there are several variables that can be proved and matched with the theory of the
variable compared with the calculation or research analysis. visual appeal, ease of use, interactivity, and
trustworthiness and convenience overall has relationship to purchasing decision, but one of the variable which is

G.J. C.M.P., Vol. 2(2) 2013:1-13 ISSN 2319 – 7285
11
interactivity has no significant relationship. It can be concluded that those variables still can give relationship to
purchasing decision.
4. Conclusion The purpose of this research is to analyze the relationship of AIDA model in term of website design and structure
towards purchasing decision of Zalora Indonesia . The researcher emphasize on AIDA model that is breakdown into:
visual appeal, ease of use, interactivity, trustworthiness and convenience. In order to answer statement of problem,
researcher can conclude:
a. Visual appeal presented the respondent about the first impression towards the website, appeal of the look and the
feel of the website. In this research, it is found that visual appeal has significance relationship towards purchasing
decision.
b. Ease of use presented the respondent about the easiness to navigate the website and easiness to find the desired
goods. In this research, it is found that ease of use has significance relationship towards purchasing decision.
c. Interactivity presented the respondent about the availability of interaction for customers. It is divided by
interaction with the firm, interaction with other customers and to see other’s customers interaction. In this
research, it is found that ease of use has no significance relationship towards purchasing decision. d. Trustworthiness and convenience presented the respondent about the level of trust that is provided by the firm in
order to: customer to take action by purchasing the goods in the website, level of safety and security regarding
privacy account and the level of trust that the desired goods will be delivered on time In this research, it is found
that trustworthiness and convenience is the highest variables that has relationship to purchasing decision.
e. Based on the result of chapter IV, visual appeal, ease of use, interactivity and trustworthiness and convenience
collectively have significant relationship toward purchasing decision.
Refferences Books
Ash, T. (2008). Landing Page Optimization. Indianapolis: John Wiley & Sons.
Berenson, M. L., Levine, D. M., & Timothy, k. C. (2012). Basic Business Statistics Concepts and Applications 12th Edition. New
Jersey: Prentice Hall. Bryman, A., & Bell, E. (2003). Business Research Methods. Oxford: Oxford unversity Press.
Chaffey, D. (2009). E-Business and E-Commerce Management. Edinburgh: Pearson Educated.
Cooper, D. R., & Schindler, P. S. (2006). Marketing Research. New York: McGraw-Hill.
Doyle, P. &. (2006). Marketing Management and Strategy (4th ed.). New Jersey: Prentice Hall Financial Times. Field, A. (2012). Discovering Statistics Using SOSS. California: Sage Publications.
Frey, A. W. (1947.). Advertising. New York, NY: The Ronald Press Company,.
Kanhenman, D. (2011). Thinking Fast and Slow. New Jersey: Farrar, Straus and Giroux.
Kotler, P. (1994). Marketing Management: Analysis, Planning, Implementation and Control, 8th ed. . Englewood Cliffs, NJ: Prentice-Hall.
Kotler, P., & Keller, L. K. (2012). Marketing Management. New Jersey: Prentice Hall.
Malhotra, N. K., & Birks, D. F. (1999). Marketing Research An Applied Approach. Harlow: Pearson Education.
Rahayu. (2005). SPSS 12.0 dalam Riset Pemasaran. Jakarta: Alfabeta. Sarwono, J. (2012). Metode Riset Skripsi Pendekatan Kuantitatif Menggunakan Prosedur SPSS. Jakarta: Elex Computindo.
Saunders, M., & Lewis, P. (2007). Research Methods for Business Students. Fourth Harlow England: FT Prentice Hall Pearson
Education.
Strong, E. K. (1925). The Psychology of selling and advertising. New York: McGraw-Hill Book Company.
Journal
Abedin, B., & Sohrabi, B. (2009). Graph theory application and web page ranking for website link structure improvement. Behaviour
& Information Technology ,Vol. 28, No. 1, January–February , 63–72. Agarwal, R. &. (2002). Assessing a firm’s web presence: a heuristic evaluation procedure for the measurement of usability.
Information Systems Research, 13, , 168–186.
Ahuja, M., Gupta, B., & Pushkala, R. (2003). An Empirical Investigation of Online Consumer Purchasing Behaviour. Communications
of the acm December 2003 vol 46 No 12.ve , 145-151. Ash, T. (2008). Landing Page Optimization. Indianapolis: John Wiley & Sons.
Beck, B. (2012). Key strategic issues in online apparel retailing: the need for an online fitting solution. www.techexchange.com .
Berenson, M. L., Levine, D. M., & Timothy, k. C. (2012). Basic Business Statistics Concepts and Applications 12th Edition. New
Jersey: Prentice Hall. Broekhuizen, T., & Huizingh. (2009). Online Purchase Determinants. Is . Management Research News, vol. 32, no. 5 , pp. 440-450.
Brown, M., Pope, N., & Voges. (2001). uying or Browsing? An exploration of shopping orientations and online purchase intention.
European Journal of Marketing, Vol. 37, no. 11/112 , 1666-1675.
Chang, H., & Chen, S. (2008). “The Impact of Online Store Environment Cues on Purchase Intention: Trust and Perceived Risk as a Mediator. Online Information Review, Vol. 32, No. 6 , 818-841.
Christian, L. (2012). Factors Affecting Men in Terms of a Website's Design and Structure. Swedish Journal .
Cooper, D. R., & Schindler, P. S. (2006). Marketing Research. New York: McGraw-Hill.
Corbitt, B. T. (2003). Trust and e-commerce: a study of consumer perceptions. . Electronic Commerce Research and Applications (Vol 2), , 203-215.
Corritore, C., Kracher, B., & and Wiedenbeck, S. (2003). On-line trust: Concepts, evolving themes, a model. International Journal of
Human–Computer Studies, 58, 6 , 737–758.
Cyr, D. (2008). Modeling Web Site Design Across Cultures: Relationships to Trust, Satisfaction, and E-Loyalty . Journal of Management Information Systems, Vol. 24, No. 4: , 47-72.

G.J. C.M.P., Vol. 2(2) 2013:1-13 ISSN 2319 – 7285
12
Demaengot, C., & Broderick, A. (2010). Consumer Perceptions of Online Shopping Envitonments: A Gestalt Approach. Psychology
and Marketing vol 27 , 117-140. Demangeot, C., & Broderick, A. (2010.). Consumer Perceptions of Online Shopping Environments: A Gestalt Approach. Psychology
and Marketing, Vol. 27, No. 2: , 117-140, .
Dillon, T. w. (2004). Factors influencing consumers' E-commerce commodity purchase. Organizational System Research Organization
. Doyle, P. &. (2006). Marketing Management and Strategy (4th ed.). New Jersey: Prentice Hall Financial Times.
Ducoffee, R. H. (1996). How Consumers Assess the Value of Advertising. Journal of Current Issues and Research in Advertising , 1-
18.
Field, A. (2012). Discovering Statistics Using SOSS. California: Sage Publications. Forsythe, S., Liu, C., Shannon, D., & Gardner. (2006). Development of a scale to measure the perceived benefits and risks of online
shopping. Journal of Interacting Marketing, 20 (2). , 55-75.
Friedman, V. (2010, 2 20). The AIDA Marketing Model in Web Design. Retrieved 2 15, 2013, from Noupe:
http://www.noupe.com/design/the-aida-marketing-model-in-web-design.html Geboy, L. D. (1996). Color makes a better message. Journal of Health Care Marketing, 16(2) , 52-54.
Gefen, D., & Straub, D. (2000). The Relative Importance of Perceived Ease of use in IS adoption: a study of e-commerce adoption.
Journal of the Association for Information Systems , 1-28.
George, L. N., Tom, T. A., & Whitwo, C. (2006). E-CONSUMERS’ ATTITUDE AND BEHAVIOUR. Innovative Marketing, Volume 2, Issue 3, .
Harry, W. (2012, April 15). fashion telegraph. Retrieved February 2013, 2013, from Fashion Telegraph:
http://fashion.telegraph.co.uk/news-features/TMG8451109/Online-clothing-sales-double.html
Haubl, G., & Trifts, V. (2000). “Consumer decision making in online shopping environments: the effects of interactive decision aids,”. Marketing Science , 1-21.
Ho, C., & Wu, W. (1999). Antecedents of consumer satisfaction on the Internet: an empirical study of online shopping. Proceedings .
Hoffman, D. L. (1996). Marketing in hypermedia computer-mediated environments: Conceptual foundations,. Journal of Marketing,
60, , 50-68. Jaggi, S., & Batra P, K. (2013). I.A.S.R.I. Retrieved February 04, 2013, from SPSS AN OVERVIEW:
http://www.iasri.res.in/iasriwebsite/DESIGNOFEXPAPPLICATION/Electronic-Book/Module%201/6SPSS-overview.pdf
Jarvenpaa, S. L. (1996). Consumer reactions to electronic shopping on the Wordl Wide Web. . International Journal of Electronic
Commerce , 59-88. Jiang, Z., Chan, J., & Tan, B. (2009). Effects of Interactivity on Website Involvement and Purchase Intention. Journal of the
Association for Information Systems .
Kanhenman, D. (2011). Thinking Fast and Slow. New Jersey: Farrar, Straus and Giroux.
Karat. (2003). The Evolution of User-Centered Focus in the Human Computer Interaction Field. IBM Systems Journal, Vol. 42, No. 4,pp. , 532-541.
Karat, J., & Karat, M. C. (2003). The Evolution of User-Centered Focus in the Human Computer Interaction Field. IBM Systems
Journal, Vol 42, No 4 , 532-541.
Karimov, F., & Brengman, M. (2011). “Adoption of Social Media by Online Retailers: Assessment of Current Practices and Future Directions,” International . Journal of E-Entrepreneurship and Innovation, Vol. 2, No. 1 , 26-45, .
Kiang, M. Y., & T, C. R. (2001). A Framework for Analyzing the potential benefits of internet marketing. Journal of electronic
commerce research,vol.2, no.4 , 157-163.
Kotler, P. (1994). Marketing Management: Analysis, Planning, Implementation and Control, 8th ed. . Englewood Cliffs, NJ: Prentice-Hall.
Kotler, P. (1973). Atmospherics as a marketing tool. Journal of Retailing, 49(4) , 48-64 .
Kotler, P., & Keller, L. K. (2012). Marketing Management. New Jersey: Prentice Hall.
Kotler, P., Wong, V., Saunders, V., & Armstrong, J. (2005). Principles of Marketing4th ed. England: Pearson Education. Lee, D., Park, J., & Moon, J. Y. (2001). “On the explanation of factors affecting e-commerce adoption,. Proceedings of the 22nd
International , 109-120.
Lee, J., Podlaseck, M., Schonberg, E., & Hoch, R. (2001). Visualization and Analysis of Click-stream Data of Online Stores for
Understanding Web Merchandising. Data Mining and Knowledge Discov-ery, 5, , 59-84 58. Liang, T., & Lai, H. (2000). Electronic store design and consumer choice: an empirical study,. Proceedings of the 33rd Hawaii .
Liqiong, D., & Poole, M. S. (2010)Affect in Web Interfaces A Study of the Impacts of Web Page Visual Complexity and Order. MIS
Quarterly Vol.34 no 4 , 711-730.
Lohse, G. L., & Spiller, P. (1998). Quantifying the effect of user interface design features on cyberstore traffic and sales: chapter in J. CHI’98 Conference Proceedings, Los Angeles, CA. Los Alamitos, CA: ACM Press. April 18-23, .
Lynch, J., & Ariely, D. (2000). Wine Online: Search Costs Affect Competition on Price, Quality and Distribution. Marketing Sc ience,
Vol. 19, No. 1 , 83-103, .
Malhotra, N. K., & Birks, D. F. (1999). Marketing Research An Applied Approach. Harlow: Pearson Education. McKinney, V. &. (2002). The Measurement of Web-Customer Satisfaction: and Expectation and Disconfirmation Approach .
Information System Research, 13 (3), , 296-315.
McKnight, D., Choudhury, V., & and Kacmar, C. (2002). Developing and Validating Trust Measures for E-commerce: an Integrative
Typology. Information Systems Research, 13, 3 , 334–359. Miniwats. (2012, 6 30). Internet worlds stats. Retrieved 2 17, 2013, from Internet world stats:
http://www.internetworldstats.com/stats.htm
Moe, W. &. (2004). Dynamic Conversion Behavior at E-Commerce Sites. . Management Sci-ence, Vol. 50, , 326-335.
Moe, W., & Fader, P. (2000). Which Visits Lead to Purchases? Dynamic Conversion Behavior at e-Commerce Sites. Management Science .
Montoya, M., & Grewal, D. (2003). Determinants of Online Channel Use and Overall Satisfaction with a Relational, Multichanel
Service Provider. Journal of the Academy of Marketing Science Vol 31 , 448-458.
Montoya, W., Voss, M. G., Grewal, & D. (2003.). Determinants of Online Channel Use and Overall Satisfaction with a Relational, Multichannel Service Provider. Journal of the Academy of Marketing Science, Vol. 31, No. 4: , 448-458,.

G.J. C.M.P., Vol. 2(2) 2013:1-13 ISSN 2319 – 7285
13
Nathan, J. N. (2010). Crucial web usability factors of 36 industries for students: a large-scale empirical study, . Electron Commer Res,
11, , 151-180 . Nichols, C. (2010, August 19). Top 10 Converting Websites: The Similarities and Differences. Retrieved January 20, 2012, from
Practical Commerce Insight for online merchant: http://www.practicalecommerce.com/articles/2181-Top-10-Converting-Websites-
The-Similarities- and-Differences-
Nuseir, T. M., Arora, N., & Al-Masri, M. M. (2010). Evidence of Online Shopping: A Consumer Perspective. International Review of Business Research Papers Volume 6. Number 5 , 90 - 106.
Palmer, W. J. (2002). Website usability, design and performance metrics. Information system research 2002 informs vol 13 no 2 , 151-
167.
Parboteeah, D., Valacich, J., & Wells, J. (2009). The Influence of Website Characteristics on a Consumer’s Urge to Buy Impuls ively. Information Systems Research, 20, , 60-78.
Peter, K. (2006, December 7). Good site performance trumps brand loyalty and savings. Retrieved 1 21, 2013, from Internet Retailer:
http://www.internetretailer.com/2006/12/07/good-site-performance-trumps-brand-loyalty-and-savings-survey-s
Phau, I., & Chang Chin, L. (2004). Profiling fashion innovators: A study of self-concept, impulse buying and internet purcase intent. Journal of Fashion Marketing and Management (serial Online) , 399-411.
Piron, F. (1991). "Defining Impulse Purchasing. Advances in Consumer Research (18) 1, , pp. 509-514.
Ripe, T. V. (2013, January 10). Forbes. Retrieved February 28, 2013, from Yahoo: http://shopping.yahoo.com/news/where-you-might-
not-shop-in-2013-193123651.html?page=all Rosen, D., & Purinton, E. ( 2004.). Website Design: Viewing the Web as a Cognitive Landscape. Journal of Business Research, Vol.
57, No. 7: , 787-794,.
Saleh, K. &. (2010). Conversion Optimization – The Art and Science of Converting Prospects to Cus-tomers.. Sebastopol, California,
USA: O´Really Media, Inc. Sen, R. (2005). Optimal Search Engine Marketing Strategy. International Journal of Electronic Commerce, 10(1). , 9-25.
Siekpe, J. S. (2003). intentions., The Effect of Web Interface Features on Consumer Online Shopping. Proquest Dissertation .
Siekpe, J. S. (2003). The effect of web interface features on consumer online shopping intentions. Pro Quest .
Sindhuja, P. N., & Surajith, G. D. (2009). Impact of the Factors influencing website uability on user satisfaction. The IUP Journal of Management Research, Vol. 5 6 VIII, No. 12, .
Sismiero, C. &. (2004). Modeling Purchase Behavior at and E-Commerce Web Site: A Task-Completion Approach. . Journal of
Marketing Research, XLI, , 306-323.
Slyke, C. V. (2002). Factors Influencing the Adoption of Web-Based Shopping: The Impact of Trust. Database for Advances in Information Systems, 35(2) .
Song, J., & Zahedi, F. M. (2001). Web design in e-commerce: a theory and empirical analysis,”. Proceeding of 22nd International ,
219.
Steuer, J. (1992). "Defining Virtual Reality: Dimensions Determining Telepresence," . Journal of Communication, 42 (4), , 73-93. Stevenson, J. B. (2000). Webpage background and viewer attitudes, . Journal of Advertising Research, 40(1), , 29–34.
Stevenson, J., Bruner, G. C., & Kumar, A. (2000). Webpage Background and. Journal of Advertising Research , 29-34.
Steward, S. C. (1999). The ecommerce revolution. Bt Technology Journal (Vol 17, No 3).
Strong, E. K. (1925). The Psychology of selling and advertising. New York: McGraw-Hill Book Company. Thananuraksakul, S. (n.d.). Factors Influencing Online Shopping Behaviour Intention: A Study of Thai Commerce. International of
Business , 43-46.
Todd, P., & Bensabat, I. (1991). An experimental investigation of the impact of computer based decision aids on the decision making
process. Inform System Res , 87-115. Tuch, A. J.-A. (2009). Visual complexity of websites: Effects on users’ experience, physiology, performance, and memory, Int.
Journal Human-Computer Studies, 67, , 703-715.
Venkatesh, V. ,. (2000). Determinants of Perceived Ease of Use: Integrating Perceived Behavioral Control, Computer Anxiety and
Enjoyment Into the Technology Acceptance Model. 5. Inform. Systems Res. 11 , 342-36. Wakefield, R. L. (2004). The Role of Web Site Characteristics in Initial Trust Formation, . Journal of Computer Information Systems, ,
94-103.
Wang, Y., & Emurian, H. (2005). An Overview of Online Trust: Concepts, Elements and Implications". Computer in Human
Behaviour Vol.21, No. 1 , 105-125. Wells, J. D., Valacich, J., & Parboteeah, V. (2011). Online Impules Buying: Understanding the Interplay Between Consumer
Impulsiveness and Website Quality. Journal of the Association for Information Systems 12 (1) , 32-56.
Zhang, P., & Von Dran, G. M. (2000). “Satisfactor and dissatisfactorers: A Two-Factor Model for Website Design and Evaluation.
Journal , 1253-1268.