the relationship between poor mathematical skills and
104
i THE RELATIONSHIP BETWEEN POOR MATHEMATICAL SKILLS AND GRADE 10 LEARNERS’ PERFORMANCE IN CERTAIN CONCEPTS IN LIFE SCIENCES – A CASE STUDY OF MICROSCOPE USAGE AND GRAPHING SKILLS IN LEJWELEPUTSWA DISTRICT IN THE FREE STATE PROVINCE By MANDY DE VRIES Submitted in accordance with the requirements for the degree of MASTER OF SCIENCE in LIFE SCIENCE EDUCATION at the University of South Africa Supervisor: Prof. Harrison I. Atagana 28 October 2020
-
Upload
khangminh22 -
Category
Documents
-
view
0 -
download
0
Transcript of the relationship between poor mathematical skills and
i
THE RELATIONSHIP BETWEEN POOR MATHEMATICAL SKILLS AND
GRADE 10 LEARNERS’ PERFORMANCE IN CERTAIN CONCEPTS IN LIFE
SCIENCES – A CASE STUDY OF MICROSCOPE USAGE AND GRAPHING
SKILLS IN LEJWELEPUTSWA DISTRICT IN THE FREE STATE PROVINCE
By
MANDY DE VRIES
Submitted in accordance with the requirements for
the degree of
MASTER OF SCIENCE
in
LIFE SCIENCE EDUCATION
at the
University of South Africa
Supervisor: Prof. Harrison I. Atagana
28 October 2020
ii
Contents
Abstract .............................................................................................................................................. v
Operational description of key terms and abbreviations ............................................................. vi
ACKNOWLEDGEMENTS ..................................................................................................................... ix
CHAPTER 1 – INTRODUCTION ............................................................................................................ 1
1.1. Background of the study ......................................................................................................... 1
1.2. Statement of the Problem ....................................................................................................... 2
1.3. Purpose of the study ............................................................................................................... 3
1.4. Research Questions ................................................................................................................. 4
1.5. Statement of Hypothesis ......................................................................................................... 5
1.6. Research Objective .................................................................................................................. 5
1.6.1 Assumptions ............................................................................................................... 7
1.7. Significance of the study ......................................................................................................... 7
1.8. Scope of the Study .................................................................................................................. 8
1.8.1. Boundaries ................................................................................................................. 8
1.9. Conclusion .......................................................................................................................... 9
CHAPTER 2: LITERATURE REVIEW .................................................................................................... 10
2.1. Introduction .......................................................................................................................... 10
2.2. Literature review ................................................................................................................... 10
2.2.1. The identification of mathematical skills acquired by the end of Grade 9 .................... 10
2.2.1.1 Record information or data .......................................................................................... 11
2.2.1.2 Measure........................................................................................................................ 11
2.2.1.3 Interpret ....................................................................................................................... 11
2.2.2. Grade 9 learners’ actual mathematical performance as an indication of
mathematical skills ................................................................................................................... 12
2.2.3. Mathematical skills required by Grade 10 learners in Life Sciences .............................. 12
2.2.3.1. Record information or data ......................................................................................... 13
2.2.3.2. Measure ...................................................................................................................... 13
2.2.3.3. Interpret ...................................................................................................................... 13
2.2.4. The effect of mathematical skills in other science learning areas, especially Life
Sciences 13
2.3. Empirical literature ................................................................................................................ 16
2.4. Theoretical framework .......................................................................................................... 22
CHAPTER 3: RESEARCH DESIGN AND METHODOLOGY .................................................................... 24
3.1. Introduction to Research Design and Methodology methodology ...................................... 24
iii
3.2. Research design and procedure ............................................................................................ 24
3.2.1. Research design .............................................................................................................. 24
3.2.2. Procedure ....................................................................................................................... 25
3.3.Research Process ........................................................................................................................ 26
3.3.1. Time dimension .................................................................................................................. 26
3.3.2. Population .......................................................................................................................... 27
3.3.2.1. Profile of the participants ........................................................................................... 27
3.3.3. Sampling and sampling technique ..................................................................................... 28
3.3.3.1. Design .......................................................................................................................... 28
3.3.3.2. Units of analysis for the case study group .................................................................. 28
3.3.3.3. Demographics ............................................................................................................. 28
3.4. Measuring instrument ........................................................................................................... 29
3.4.1. Test development .......................................................................................................... 29
3.4.2. Artefacts ......................................................................................................................... 30
3.5. Validity and reliability ............................................................................................................ 32
3.5.1. Validity ............................................................................................................................ 32
3.5.2. Reliability ........................................................................................................................ 33
3.6. Synopsis of Test Tasks (Appendix A) ..................................................................................... 35
3.6.1. Question 1 ...................................................................................................................... 35
3.6.1.1. Question 1: Section A .................................................................................................. 35
3.6.1.2. Question 1: Section B .................................................................................................. 35
3.6.2. Question 2 ...................................................................................................................... 35
3.6.2.1. Question 2: Section A .................................................................................................. 35
3.6.2.2. Question 2: Section B .................................................................................................. 35
3.6.3. Question 3 ...................................................................................................................... 36
3.6.3.1. Question 3: Section A .................................................................................................. 36
3.6.3.2. Question 3: Section B .................................................................................................. 36
3.6.4. Question 4 ...................................................................................................................... 36
3.6.4.1. Question 4: Section A .................................................................................................. 36
3.6.4.2. Question 4: Section B .................................................................................................. 36
3.7. Data collection procedures ................................................................................................... 37
3.7.1. Test and retest ............................................................................................................... 37
3.7.2. Artefacts: Grade 9 marks and benchmarking marks ...................................................... 38
3.8. Methods of data analysis ...................................................................................................... 38
iv
3.8.1. Descriptive statistics ....................................................................................................... 38
3.8.2. Analytical statistics ......................................................................................................... 39
3.9. Limitations or flaws of the study ........................................................................................... 39
3.10. Research Ethics.................................................................................................................... 41
CHAPTER 4: DATA ANALYSIS, RESULTS AND DISCUSSION ................................................................ 43
4.1. Introduction .......................................................................................................................... 43
4.2 Profile of the Participants................................................................................................. 43
4.3. Results ................................................................................................................................... 44
4.3.1. Distribution of variables ..................................................................................................... 44
4.3.2. Means and standard deviation of data .......................................................................... 45
4.3.3. Comparison of section A and section B scores for Test 1, and Test 2 ............................ 46
4.3.4. Comparison of the scores in sections A and sections B between Test 1 (test) and Test 2
(retest) ...................................................................................................................................... 47
4.3.5. Comparison of scores of Grade 9 learners in mathematics at the end of Grade 9 and
scores in Section A and B of the Test 1 and Test 2 ................................................................... 49
4.4.1. Discussion of results: distribution of variables............................................................. 53
4.4.2. Data related to the research based on scholar evaluation test questions ........................ 58
CHAPTER 5: CONCLUSIONS, IMPLICATIONS AND FUTURE RESEARCH ............................................. 60
5.1. Introduction .......................................................................................................................... 60
5.2. Realising the research objectives .......................................................................................... 60
5.3. Overview of the study ........................................................................................................... 60
5.4. Recommendations ................................................................................................................ 61
5.5. Contributions to knowledge .................................................................................................. 64
5.6. Conclusion ............................................................................................................................. 64
REFERENCES CITED AND CONSULTED FOR THIS RESEARCH ............................................................ 66
APPENDIX A ...................................................................................................................................... 70
APPENDIX B2 .................................................................................................................................... 87
APPENDIX C ...................................................................................................................................... 92
APPENDIX C2 .................................................................................................................................... 93
APPENDIX D ...................................................................................................................................... 94
v
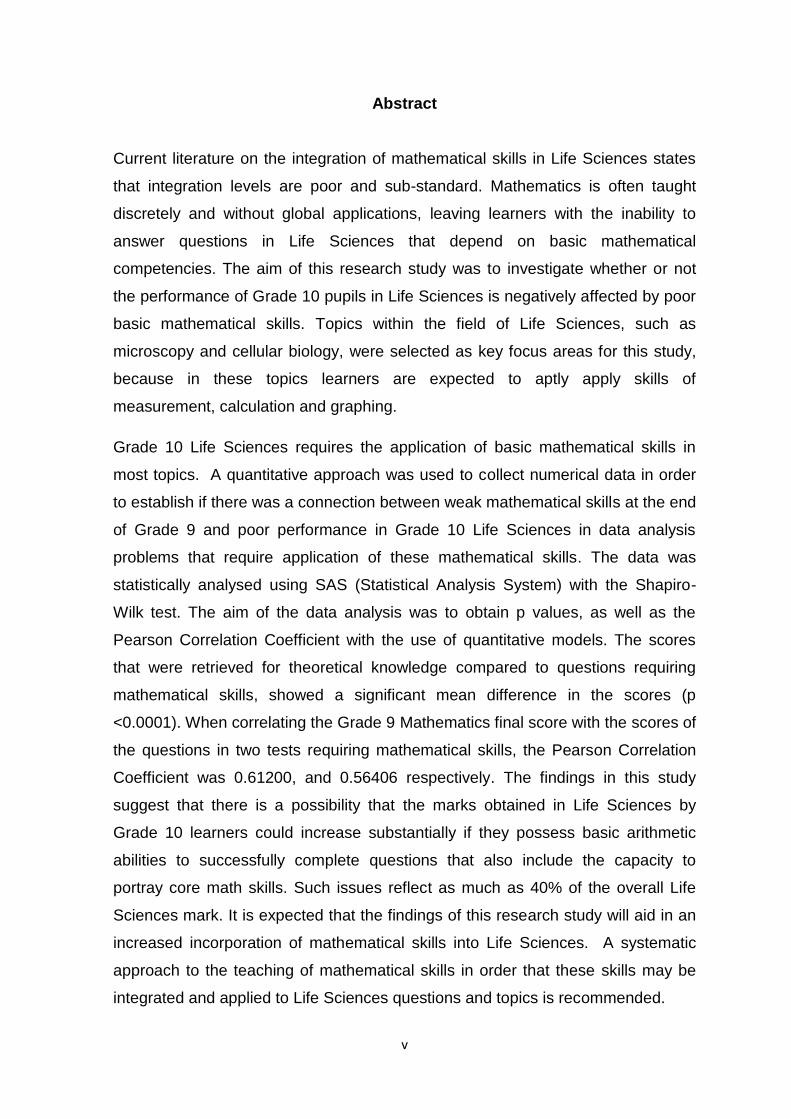
Abstract
Current literature on the integration of mathematical skills in Life Sciences states
that integration levels are poor and sub-standard. Mathematics is often taught
discretely and without global applications, leaving learners with the inability to
answer questions in Life Sciences that depend on basic mathematical
competencies. The aim of this research study was to investigate whether or not
the performance of Grade 10 pupils in Life Sciences is negatively affected by poor
basic mathematical skills. Topics within the field of Life Sciences, such as
microscopy and cellular biology, were selected as key focus areas for this study,
because in these topics learners are expected to aptly apply skills of
measurement, calculation and graphing.
Grade 10 Life Sciences requires the application of basic mathematical skills in
most topics. A quantitative approach was used to collect numerical data in order
to establish if there was a connection between weak mathematical skills at the end
of Grade 9 and poor performance in Grade 10 Life Sciences in data analysis
problems that require application of these mathematical skills. The data was
statistically analysed using SAS (Statistical Analysis System) with the Shapiro-
Wilk test. The aim of the data analysis was to obtain p values, as well as the
Pearson Correlation Coefficient with the use of quantitative models. The scores
that were retrieved for theoretical knowledge compared to questions requiring
mathematical skills, showed a significant mean difference in the scores (p
<0.0001). When correlating the Grade 9 Mathematics final score with the scores of
the questions in two tests requiring mathematical skills, the Pearson Correlation
Coefficient was 0.61200, and 0.56406 respectively. The findings in this study
suggest that there is a possibility that the marks obtained in Life Sciences by
Grade 10 learners could increase substantially if they possess basic arithmetic
abilities to successfully complete questions that also include the capacity to
portray core math skills. Such issues reflect as much as 40% of the overall Life
Sciences mark. It is expected that the findings of this research study will aid in an
increased incorporation of mathematical skills into Life Sciences. A systematic
approach to the teaching of mathematical skills in order that these skills may be
integrated and applied to Life Sciences questions and topics is recommended.
vi
Operational description of key terms and abbreviations
Below are the terminologies and concepts used in this research study.
ACER
This is a recognised international developer of educational assessment and
reporting tools for schools and systems (ACER, 2019).
ANA
This acronym stands for the Annual National Assessment and it is carried out by
the Department of Basic Education as a benchmarking tool for assessing basic
academic levels.
CAPS
Curriculum and Assessment Policy Statement document as issued by the
Department of Basic Education in South Africa.
This document represents a policy statement for learning and teaching in South
Africa and comprises the Curriculum and Assessment Policy Statements for each
approved school subject, policy relating to promotion requirements and protocol
for assessment. The document ensures that education is standardised across
grades and subjects.
Benchmarking
Benchmarking refers to evaluation by comparison with a standard. This standard
is determined by various assessment bodies according to the CAPS.
FET
This acronym stands for the Further Education and Training Phase (Grades 10 –
12) as described by the Department of Basic Education in South Africa
(Education, National Curriculum Statement (NCS) Further Education and Training
(FET) phase Grade 10 - 12 Life Sciences, 2011).

vii
Graphing skills
This skill-set involves the use of written information or a given set of data to create
graphs such as bar graphs, line graphs, pie charts, and scatter plots. This skill
also enables a learner to choose between different scales, adjust graphs to fit the
data and to use graphs to determine relationships between variables.
IEB
Independent Examinations Board of South Africa
Mathematical skills
These are the skills that are required in order to use the science of mathematics to
successfully manage scales, averages, percentages, conversions and translate
tabulated data to a graphic form or vice versa.
Microscope usage
Microscopic usage involves the concepts of magnification, scale, conversion and
relative size when using microscopes, and in the application of cellular biology.
Performance
The ability to competently manage, apply and understand microscope usage, and
graphing skills in a Grade 10 Life Sciences context. In addition, performance also
includes successfully answering questions that are related to these skills.
Senior Phase
The senior phase of a learner’s education refers to the phase that includes Grades
7 to 9.
SAS
This stands for the Statistical Analysis System and it is a computer package that is
used in order to analyse data statistically.

viii
SPSS
The Statistical Package for the Social Sciences is a computer package
programme that allows researchers to analyse data statistically.
Umalusi
This is the Council for Quality Assurance in General and Further Education and
Training, and advanced education; in addition to the training curriculum of the
National Qualifications Framework (NQF) (South African Government, 2013).
ix
ACKNOWLEDGEMENTS
I will like to acknowledge the assistance and goodwill of the following people in
this endeavour, which includes my family for their patience and support over the
last few years, and St Dominic’s College Welkom staff and pupils for their
support, as well as their permission to conduct this research study.
Furthermore, I would also like to thank Dr Rodney Jacobs for his guidance and
advice, and lastly, to Professor H.I. Atagana from UNISA for his
professionalism, guidance and encouragement during the course of this
research study.
1
CHAPTER 1 – INTRODUCTION
This research study is based on the researcher determining if there is a
relationship between poor mathematical skills at the end of Grade 9 and poor
academic performance in Grade 10 Life Sciences in topics where mathematical
skills are required. The focus of this study is specifically in the Life Sciences
topics of microscopy and areas where graphing skills are required.
1.1. Background of the study
Life Sciences pupils in Grade 10 are expected to apply mathematical skills in the
interpretation of experimental data or findings that are obtained during practical
investigations. The researcher noted that Grade 10 learners struggle to apply
basic mathematical skills and concepts into the four basic knowledge strands as
set out in the National Curriculum Statement (NCS) for Advanced Education and
Training (FET) process of the Department of Basic Education (Education D. o.,
2011). The researcher noted that weak mathematical skills prevented learners
from achieving the clear objectives of the Life Sciences curriculum as defined in
the NCS document (Education, National Curriculum Statement (NCS) Further
Education and Training (FET) phase Grade 10 - 12 Life Sciences, 2011) which
therefore effectively results in poor performances in Life Sciences assessments.
Mathematical skills are needed in several aspects of Grade 10 Life Sciences and
particularly in the areas of microscope use and graphing of information, which
formed the basis for this case study. Hence, in light of the information discussed,
this research study seeks to show that poor mathematical skills among Grade 10
Life Sciences pupils may have a negative impact on academic performance in the
fields of microscopic and graphics skills; as these skills involve the direct use of
some basic mathematical skills.
In addition, this study hopes to identify and propose strategies to develop the
mathematical skills needed by Grade 10 Life Sciences learners in order to improve
their academic performance in Life Sciences. In a study conducted by Tariq (2004)
on the decline of mathematical competencies in Life Sciences students, it was
2
found that undergraduate students are less competent in basic mathematical skills
than they had been in previous years. Hester (2014: 54) conducted a similar study
and found that the application of mathematical skills is necessary for students, in
order for them to skilfully apply quantitative knowledge to biological problems.
Continuing in the same vein, Dornette (2018) stated that Mathematics is an
important part of Science, and many students do not possess the necessary basic
mathematical skills that are required in the field of science.
1.2. Statement of the Problem
Within the academic and teaching sphere, there is much concern for learners who
do not have the prerequisite Mathematics abilities or knowledge required at the
end of a Grade 9 academic year. The CAPS document states that pupils should
be able to record information, measure and interpret as follows : “Record
information or data: This should include recording observations or information as
drawings, descriptions, in simple table format, as simple graphs, etc. The skill of
‘recording’ is transferable across a range of different scientific activities. Measure
: Learners should know what to measure, how to measure it and have a sense of
the degree of accuracy that is required. A variety of things could be measured
including (but not limited to) length, volume, temperature, weight or mass and
numbers (counting). Measuring is a way of quantifying observations and in this
process learners should learn to make estimations. Interpret: Learners should be
able to convert information from one form, in which it was recorded, into another,
for instance converting a table into an appropriate graph. Learners should be able
to perform appropriate simple calculations, to analyse and extract information from
tables and graphs, apply knowledge of theory to practical situations, recognise
patterns and/or trends, appreciate the limitations of experimental procedures as
well as make deductions based on evidence.” (Education D. o., 2011).
This concern exists, because the Grade 10 Life Sciences curriculum requires that
this prerequisite be necessary in order for learners to critically deal with data and
problems which require basic mathematical skills as quoted from the CAPS
document. The researcher suggests that an instructional approach to integrate
learning in Mathematics and Life Sciences could possibly improve the academic
3
performance of learners in Life Sciences, since the Grade 10 Life Sciences
learners involved in this study struggle with the application of quantitative graphing
skills, estimating the relative size of objects, and scaling with specific reference to
biology. The data available from the final Grade 9 end of year school mathematics
learner achievement tests were used to indicate mathematical skills of the Grade
10 Life Sciences learners by subjecting the data to correlational analysis. The
scores that were retrieved for theoretical knowledge were compared to questions
requiring mathematical skills.
1.3. Purpose of the study
The purpose of this research study is to determine the mathematical skills,
specifically in the areas of microscope use and graphing, of Grade 10 Life
Sciences learners using their Grade 9 end-of-year mathematical results as a
reference. In addition, this study aims to determine whether or not this has an
impact on poor learner performance in Grade 10 Life Sciences in the areas of
microscope use and graphing skills. By adopting a constructivist research
approach that considers the connection between the acquisition of knowledge
related to situated learning and instruction, the skills and knowledge of Grade 10
pupils in the field of microscopy and graphing skills, with reference to Life
Sciences, will also be examined. The study further aims to identify that
performance in Life Sciences amongst Grade 10 learners can be improved by
improved learners’ competencies in basic Mathematics and also by integrating
Mathematics into the Life Sciences curriculum. Indeed, it is important for the
purposes of this study, to recognise that the performance in Life Sciences among
Grade 10 learners may be improved by implementing integration methods
between Mathematics and Life Sciences.
Therefore, with regards to the case study in this research, it will be used as a point
of reference and is intended to demonstrate that Grade 10 Life Sciences learners
at the Welkom co-educational school in the Free State Province of South Africa,
have weak mathematical skills that hinder their performance in certain aspects of
Life Sciences; more particularly in problems relating to the use of microscopes and
relative size as well as graphing techniques.
4
Measuring tools for testing learning outcomes in the use of microscopes and
relative size as well as graphing skills were used to collect quantitative data.
Microscopy skills were tested using basic scale and magnification measurements.
The skills in graphing were assessed by means of questions which required
learners to plot graphs from provided data tables and the use the correct scales
on the axes as well as questions which related to the interpretation of graphs that
had relation to aspects of the grade 10 Life Sciences curriculum.
1.4. Research Questions
In order to adequately address the problem stated in this study, the following
research questions and their respective sub-questions will aid in this regard.
Question 1: What are the consequences of poor mathematical skills on the
performance of Grade 10 Life Sciences learners at a co-educational school in
Welkom, Free State Province, with specific emphasis on problems related to the
use of microscopes and determining relative size, and graphing skills?
Question 2: Are learners able to utilise mathematical skills taught in Grade 9, such
as size, relation, proportions and mapping, and the reading of graphs and apply
the skills in Grade 10 Life Sciences in the fields of microscope use to determine
relative sizes and graphing?
Question 3: What is the relationship between the mathematical knowledge of
Grade 10 students in matters of scale, ratio, percentage and graphing, and their
success in answering Life Sciences questions based on the application of their
skills, in microscope use and graphing problems?
In addition to the main research questions, the following sub-questions are
presented below to further aid in the investigation.
Sub-question 1.1 : How does the application of Mathematics skills influence the
performance of Grade 10 Life Sciences learners in the field of problems related to
microscope use regarding relative size and in graphing skills?
Sub-question 2.1.: To what degree did Grade 10 Life Sciences learners acquire
the cognitive abilities of understanding magnitude, proportion, ratio and projecting,
5
interpreting of graphs, and the necessary magnification use, and graphing skills
that were taught in Grade 9?
Sub-question 2.2.: With regards to microscope and graphing, how well can
learners incorporate their Mathematics abilities into problems that involve size,
measuring, ratio, and the mapping, and analysis of graphs into Grade 10 Life
Sciences problems?
1.5. Statement of Hypothesis
Poor academic performance in mathematical skills among Grade 10 Life Sciences
learners throughout the selected study group, has a negative effect on the
academic achievement in Life Sciences with particular reference to areas
concerning microscope use in order to determine relative size as well as in
graphing skills.
1.6. Research Objective
It must be noted that the focus of this research study is not to identify the possible
reasons behind the poor mathematical skills that Grade 10 pupils possess, but
rather its intention is to highlight that the Grade 10 Life Sciences performance in
assessments which contain mathematical based questions, may be negatively
affected by poor mathematical skills, specifically in the fields of microscope usage
and determining relative size as well as graphing. Therefore, one of the goals of
this study is to establish if the theory is correct and to recommend strategies to
improve the mathematical skills of grade 9 learners at the particular school where
the case study is undertaken. Furthermore, with further research being possibly
conducted in many other high schools in the country, another goal would be to
discuss the application of Mathematics skills in Life Sciences in order to maximise
the performance results of Life Sciences learners.
6
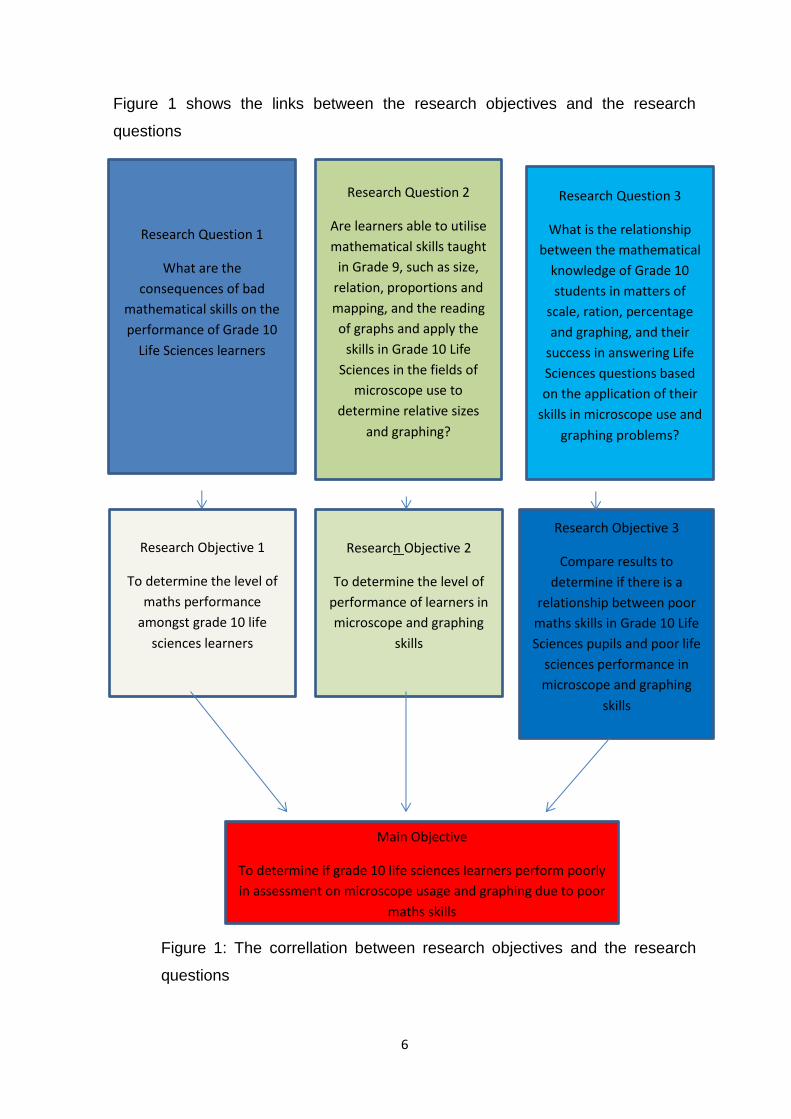
Figure 1 shows the links between the research objectives and the research
questions
Figure 1: The correllation between research objectives and the research
questions
Research Objective 2
To determine the level of
performance of learners in
microscope and graphing
skills
Research Objective 1
To determine the level of
maths performance
amongst grade 10 life
sciences learners
Research Objective 3
Compare results to
determine if there is a
relationship between poor
maths skills in Grade 10 Life
Sciences pupils and poor life
sciences performance in
microscope and graphing
skills
Main Objective
To determine if grade 10 life sciences learners perform poorly
in assessment on microscope usage and graphing due to poor
maths skills
Research Question 3
What is the relationship
between the mathematical
knowledge of Grade 10
students in matters of
scale, ration, percentage
and graphing, and their
success in answering Life
Sciences questions based
on the application of their
skills in microscope use and
graphing problems?
Research Question 2
Are learners able to utilise
mathematical skills taught
in Grade 9, such as size,
relation, proportions and
mapping, and the reading
of graphs and apply the
skills in Grade 10 Life
Sciences in the fields of
microscope use to
determine relative sizes
and graphing?
Research Question 1
What are the
consequences of bad
mathematical skills on the
performance of Grade 10
Life Sciences learners
7
1.6.1 Assumptions
The following assumptions that are made in this study include:
- All Grade 10 Life Sciences learners were given equal opportunities to
exercise the skills needed in the field of Life Sciences concerning the use of
microscopes or graphics skills.
- All Grade 10 Life Sciences learners have been subjected to the same
teaching methods, lessons and exercises.
- The Life Sciences segment of the Grade 7 to Grade 9 General Education
and Training (GET) phase, which serves as a fundamental basis for the
FET phase of Life Sciences, was completed and passed by all Grade 10
Life Sciences learners.
The mathematical section of the Grade 7 to 9 General Education and Training
(GET) stage, which is the actual basis for the FET stage in other subjects, was
completed by all Grade 10 Life Sciences learners. Regarding English
instruction, the Grade 10 Life Sciences learners were articulate and fluent, and
there were no apparent linguistic obstacles to learning the material in Life
Sciences or Mathematics.
1.7. Significance of the study
The significant details that will be produced by this study may be able to determine
if mathematical skills are integral in the FET phase of the Life Sciences curriculum
(Education D. o., 2011). This research study also desires to foster a convergence
between the learning fields of Mathematics and Life Sciences in order to enable
learners to obtain better results in the FET process of Life Sciences evaluations. It
is expected that if Life Sciences learners have the required mathematical skills
needed to meet the clear objectives of the FET phase curriculum (Education,
National Curriculum Statement (NCS) Further Education and Training (FET)
phase Grade 10 - 12 Life Sciences, 2011), then their test scores in Life Sciences
may improve. If the research model is proved to be correct, this research hopes to
create an independent aspect of Mathematics that can be incorporated into the
curriculum of Grade 10 Life Sciences, that could ensure that learners are fully
8
equipped with the necessary mathematical skills required to achieve the goals of
the Life Sciences curriculum's FET phase.
1.8. Scope of the Study
1.8.1. Boundaries
The delimitations for this study will be highlighted and discussed in this sub-
section. One of the delimitations for this study includes the skills in microscope
use relating to relative size, and graphing as the fields of Life Sciences to be
studied. The criteria of the FET document defines certain goals in Life Sciences to
be met in Grade 10. As discussed in the review of the literature in Chapter Two,
the document highlights the following areas: record details or information,
measurement of, and the interpretation of data. (Education, National Curriculum
Statement (NCS) Further Education and Training (FET) phase Grade 10 - 12 Life
Sciences, 2011).
With regards to the second delimitation, it is noted that regardless of
understanding the critical components of Life Sciences that are associated with
microscope work and graphing, Grade 10 learners mathematical skills are low in
important aspects of measurement, conversion and graphing. Moreover, they are
often unable to satisfy the above goals, therefore microscope work and graphing
were chosen to be two key areas on which to concentrate. According to van
Staden (2017) and MacMillan (2018), a deficiency in one field of mathematics
typically creates additional problems of learning, and that a proper knowledge of
numbers is essential to any part of education as it is important to incorporate all
components.
The third delimitation involves the relevant case study that was chosen due to the
amiable interaction between the researcher and the community. In relation to the
achievement of learners in Life Sciences regarding areas in microscope use and
graphing, numerical skills and knowledge was considered. These variables will be
used to investigate the relationship between mathematical skills and successful
application in these fields. The group of learners in this case study was chosen
9
with the expectation that if poor mathematical skills of Grade 10 Life Sciences
learners was remediated and gradually integrated into Life Sciences teaching and
assessments, then their results in Life Sciences would improve. The case analysis
was conducted using a constructivist epistemology and also positivism, in order to
utilise the quantitative data and grades to illustrate whether or not there is a
correlation between weak mathematical abilities and the ability to fulfill the goals of
the Life Sciences course in the fields of microscope use, and graphing abilities. In
order to decide whether there is a relationship between both mathematical output
and Life Science skills, and knowledge in microscope skills, and graphing which
involve maths abilities, numerical values have been used to evaluate the Pearson
Correlation coefficient.
1.9. Conclusion
This research study involves a small group case study to determine if a
relationship exists between poor mathematical skills at the end of Grade 9 and
poor academic performance in Life Sciences in Grade 10. The focus of this study
are the areas of microscopy and graphing skills, both of which require basic
mathematical skills in order to compute relative sizes and in order to construct a
range of graphs using data provided in tables or case study information. The
researcher has identified that the Grade 10 learners struggle to integrate
mathematical knowledge into the field of Life Sciences.

10
CHAPTER 2: LITERATURE REVIEW
2.1. Introduction
The research problem of determining the relationship between poor mathematical
skills amongst learners of Grade 10 Life Sciences and the impact that this has on
the successful application of skills in Life Sciences, especially in the fields of
microscope usage and graphs, was highlighted at the beginning of this research
study. This literature review will analyse and discuss which mathematical skills
and knowledge are needed in Life Sciences at Grade 10 level, as well as which
capabilities should be obtained in Mathematics at Grade 9 level for application in
Life Sciences. Literature, as well as the findings on further research that links
Mathematics and Life Sciences, and other sciences, will also be explored to inform
the relationship between mathematical skills and Life Sciences performance. Any
discussions that may shed light on possible solutions to the lack of integration of
Mathematics skills into Life Sciences will be reviewed, including which possible
strategies may be required to improve integration. In addition, certain problems
associated with implementing an integrated curriculum approach will be discussed
in this chapter.
2.2. Literature review
2.2.1. The identification of mathematical skills acquired by the end of Grade
9
Research has been done on mathematical achievements amongst Grade 9
learners in South Africa (Makhubele, 2019). This research highlighted factors
associated with the problems of learners’ poor performance in Grade 9
mathematics particularly in the Annual National Assessments (ANA). The findings
of this research are important for this study, as they are based on mathematical
skills that should be acquired in Grade 9 in accordance with the Curriculum and
Assessment Policy Statement (CAPS) for the senior phase (Grades 7 – 9)
(Education, Curriculum Assessment Policy statement (CAPS) Grade 7 - 9
11
Mathematics, 2011). The mathematical skills mentioned thus far that should be
acquired by the end of Grade 9, are listed in the CAPS document as follows:
2.2.1.1 Record information or data
This should include recording observations or information as drawings,
descriptions, in simple table format, as simple graphs, etc. The skill of ‘recording’
is transferable across a range of different scientific activities.
2.2.1.2 Measure
Learners should know what to measure, how to measure it and have a sense of
the degree of accuracy that is required. A variety of things could be measured
including (but not limited to) length, volume, temperature, weight or mass and
numbers (counting). Measuring is a way of quantifying observations and in this
process learners should learn to make estimations.
2.2.1.3 Interpret
Learners should be able to convert information from one form, in which it was
recorded, into another, for instance converting a table into an appropriate graph.
Learners should be able to perform appropriate simple calculations, to analyse
and extract information from tables and graphs, apply knowledge of theory to
practical situations, recognise patterns and/or trends, appreciate the limitations of
experimental procedures as well as make deductions based on evidence.”
(Education, National Curriculum Statement (NCS) Further Education and Training
(FET) phase Grade 10 - 12 Life Sciences, 2011).
The skills listed above as being required in Grade 10 Life Sciences indicate that
mathematical knowledge and competence are required in order to be able to
achieve the outcomes required in Grade 10 Life Sciences. These skills are also
seen as important in the research done by Cohen (Cohen, 2004) and Bowman
(Bowman & Husbands, 2011) where the essential links between basic
Mathematics and Life Sciences were highlighted.
12
2.2.2. Grade 9 learners’ actual mathematical performance as an indication of
mathematical skills
Recent studies have shown that South African learners perform poorly in
Mathematics when compared to their global counterparts (van Staden, 2017). In
2012, national assessments such as the Annual National Assessment (ANA)
results for Grade 9 Mathematics showed that the national average mark was 13%,
and in 2013 they were 14%. Furthermore, in 2014 they were 11% and no further
results were released since then (MacMillan, 2018). The Minister for Basic
Education, Angie Motshekga, announced in May 2017 that the ANA would be
replaced by the National Integrated Assessment Framework (NIAF) and the
implementation of the NIAF would commence in 2018 (Gerber, 2017). However,
with no results yet available for Grade 9 performances from the framework’s latest
diagnostic tests, this study will refer to the results of the previous ANA tests.
Bansilal (2017) studied the results of Grade 9 Mathematics in the ANA tests and
compared them to the results that were achieved in the learners’ final exam. She
found that the results of the school Mathematics assessments were significantly
higher than those of the ANA results in Mathematics, but that there was a strong
correlation between the learners’ scores in both tests that were assessed
(Bansilal, 2017). This suggests that both the ANAs and the school tests had
assessed similar skills, but school assessments had indicated higher
competencies in Mathematics skill areas (Bansilal, 2017). This fact can be
problematic when Mathematics skills are required in other learning areas such as
Life Sciences, and therefore learners may not be sufficiently equipped to cope
with the skills required by the Life Science curriculum; despite having obtained
satisfactory results in school based Mathematics assessments.
2.2.3. Mathematical skills required by Grade 10 learners in Life Sciences
Mathematical skills that are required in Grade 10 Life Sciences are coherently
explained in the CAPS document for the FET phase of Life Sciences (Education
D.o., 2011). The essential skills that are referred to in this study are listed in the
CAPS document as follows:
13
2.2.3.1. Record information or data
Observations or details should be documented as sketches, explanations, in
simple table format, as simple graphs, etc. The 'recording' capacity can be
transferred through a variety of different research activities.
2.2.3.2. Measure
Learners should understand what to calculate, how to quantify it, and also have a
grasp of the requisite level of accuracy. It is possible to calculate a variety of
objects, including (and not restricted to) size, volume , temperature, mass or
weight, and figures (counting). Measuring is a method to quantify findings and
learners can figure out how to make projections in this process.
2.2.3.3. Interpret
Learners should be able to translate material, such as converting a table into a
suitable graph, from one form in which it was documented to another. Students
should be able to perform suitable simple calculations, interpret and extract
information from tables and graphs, apply theoretical expertise to realistic
conditions, identify patterns and/or trends, understand the weaknesses of
experimental methods, and make evidence-based deductions. The ability to carry
out these abilities is dependent on mathematical competence in the fields of graph
estimation, quantification, measurement and interpretation.” (Education D.o.,
2011).
2.2.4. The effect of mathematical skills in other science learning areas,
especially Life Sciences
van Staden (2017) argues that weaknesses in the smallest area of Mathematics
usually causes difficulties in other learning areas. MacMillan (2018) corroborates
and explains that a sound understanding of numbers is crucial to every part of the
curriculum, as all parts should be integrated. In the Life Sciences FET phase, 30%
of the marks in summative assessments are allocated to skills relating to the aims
specified in the CAPS as “2.5.2.4 Record Information or Data. This should include
14
recording observations or information as drawings, descriptions, in simple table
format, as simple graphs, etc. The skill of ‘recording’ is transferable across a range
of different scientific activities.
2.5.2.5 Measure.Learners should know what to measure, how to measure it and
have a sense of the degree of accuracy that is required. A variety of things could
be measured including (but not limited to) length, volume, temperature, weight or
mass and numbers (counting). Measuring is a way of quantifying observations and
in this process learners should learn to make estimations.
2.5.2.6 Interpret. Learners should be able to convert information from one form, in
which it was recorded, into another, for instance converting a table into an
appropriate graph. Learners should be able to perform appropriate simple
calculations, to analyse and extract information from tables and graphs, apply
knowledge of theory to practical situations, recognise patterns and/or trends,
appreciate the limitations of experimental procedures as well as make deductions
based on evidence.” (Education, National Curriculum Statement (NCS) Further
Education and Training (FET) phase Grade 10 - 12 Life Sciences, 2011).
The above aims are directly related to mathematical skills. Karsai (2010), and
Karsai and Kampis (2010) state that Mathematics enters at every stage of
Science, and that the interdisciplinary approach is at the heart of many research
areas including Life Sciences. This collaboration is more common in research, but
it is a challenge at school levels where teachers must be trained to do
collaborative work (Karsai & Kampis, 2010). The idea of integrating the teaching
of mathematical skills into Life Sciences has relevance to this research since Life
Sciences in the senior phase has many topics that depend on mathematical
knowledge and skills.
Karsai (2010), and Karsai and Kampis (2010) point out that the field of Biology/Life
Sciences is changing and becoming more quantitative; and that there are
challenges which need to be addressed in education. Karsai and Kampis (2010)
suggest that new educational initiatives should focus on combining laboratory
procedures with mathematical skills that could underpin the integration of
Mathematics and Biology at various levels. Quinnel (2012) and Quinnel,
15
Thompson and Le Bard (2012) identified that educators could not make sense of
the fact that learners battled to perform simple operations, such as multiplication
and division in a science environment. It was found that a lack of confidence in
Mathematics was an obstacle to learning that prevented learners from engaging in
the science disciplines. It was found that students transfer their maths anxiety
rather than their maths skills to other disciplines, and that this has important
implications for how sciences are taught (Quinnel, Thompson, & LeBard, 2012).
This in turn makes it challenging for teachers as they expect learners to be able to
transfer their mathematical skills to their science studies (Quinnel et. al., 2012).
Quinnel (2010) highlights the fact that Mathematics can be a learning obstacle in
life sciences, and that this issue can be addressed by re-focussing teaching
practices (Quinnel et. al., 2012).
The research by Tariq can be seen as seminal work that has provided the
framework for further research in the field of mathematical skills and Life Sciences.
Tariq’s first research on electronmicroscopy appeared in 1984 and she has written
or co-written 81 articles which outline her research into mathematical skills and
performance in Life Sciences and other areas (Tariq V. , 2021). Tariq (2005)
states that for many who teach in the field of Life Sciences, it remains a
challenging task to ensure that learners are able to harness and maintain the
necessary skills required in mathematical knowledge It was found that in Life
Sciences, a wide range of disciplines require mathematical skills and that many
learners lack confidence in their ability to deal with basic mathematical concepts;
thereby being unable to calculate accurately, and efficiently even with a calculator
(Tariq 2005). Learners were unable to manipulate or appreciate numbers and
equations, to use scientific notation, or to explain and make predictions from data
presented in graphs, charts and tables (Tariq 2005). Tariq’s (2005) studies aimed
at producing a learning resource which can support learners in their acquisition of
Mathematics skills. The following key areas of Life Sciences and their link to
Mathematics was identified, and are presented directly from the text (Tariq et. al.,
2005).
16
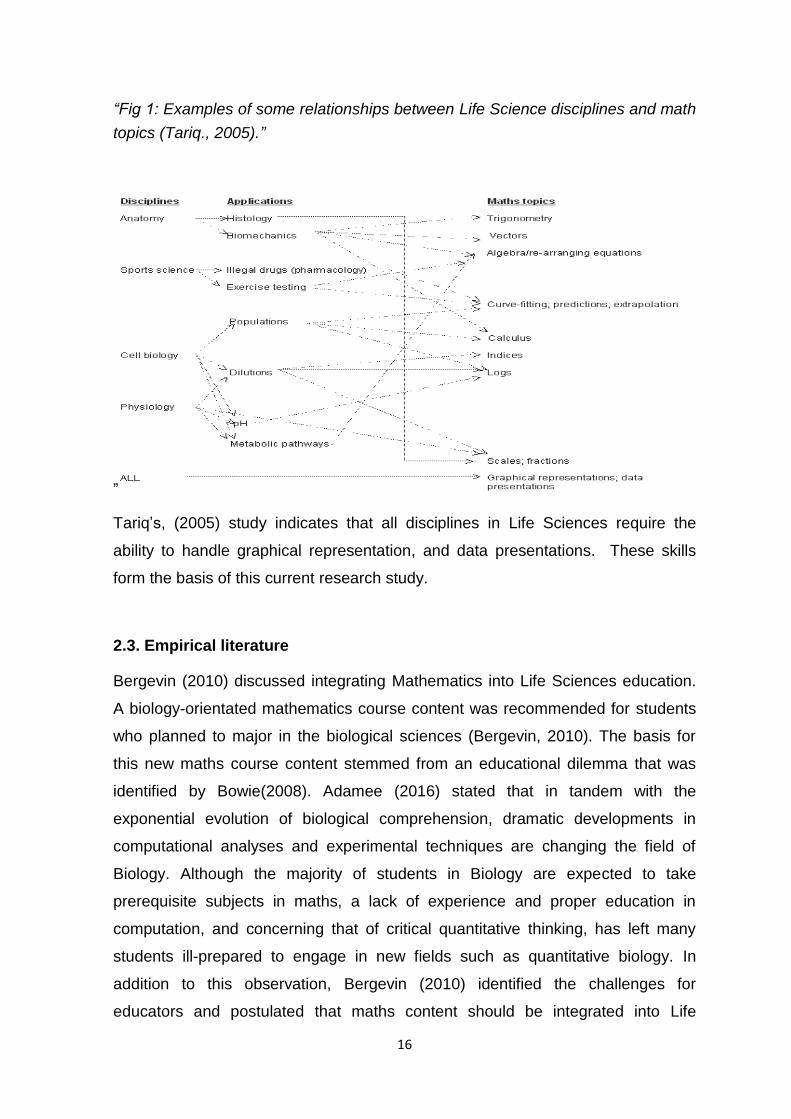
“Fig 1: Examples of some relationships between Life Science disciplines and math
topics (Tariq., 2005).”
”
Tariq’s, (2005) study indicates that all disciplines in Life Sciences require the
ability to handle graphical representation, and data presentations. These skills
form the basis of this current research study.
2.3. Empirical literature
Bergevin (2010) discussed integrating Mathematics into Life Sciences education.
A biology-orientated mathematics course content was recommended for students
who planned to major in the biological sciences (Bergevin, 2010). The basis for
this new maths course content stemmed from an educational dilemma that was
identified by Bowie(2008). Adamee (2016) stated that in tandem with the
exponential evolution of biological comprehension, dramatic developments in
computational analyses and experimental techniques are changing the field of
Biology. Although the majority of students in Biology are expected to take
prerequisite subjects in maths, a lack of experience and proper education in
computation, and concerning that of critical quantitative thinking, has left many
students ill-prepared to engage in new fields such as quantitative biology. In
addition to this observation, Bergevin (2010) identified the challenges for
educators and postulated that maths content should be integrated into Life
17
Sciences courses. Furthermore, the challenge for students, was to use
mathematics courses to develop critical thinking skills (Bergevin, 2010).
Strategies that educators could adopt included incorporating biological content
into maths courses, developing effective mathematics refresher sessions in the
maths faculties, and considering how mathematical content could be integrated
into Life Sciences (Bergevin, 2010). Bergevin (2010) further mentions that there
are significant differences in views across departments. The perception of the
Facutly of Mathematics regarding maths, was that it was a field of science that
drew important conclusions; whereas the Faculty of Life Sciences saw maths as
being a part of “quantitative literacy”. That is, a tool or language (Bergevin, 2010).
The perception of the Faculty of Mathematics regarding Biology was that it was
“science fiction”, while the Faculty of Life Sciences viewed Biology as being an
”evolutionary science that first asks how, then why” (Bergevin, 2010). Student
expectations indicated that students in a mathematics course prefer to learn or do
maths and be ‘taught to the test’, as opposed to developing analytical and
quantitative reasoning skills that will enable critical thinking (Bergevin, 2010).
While integration is desirable, it can have negative repercussions, as found by
Mwakapenda (2010). In a pilot study by Mwakapenda (2010), an investigation
regarding the extent to which teachers make connections between mathematical
concepts and concepts from other disciplines, was conducted. The findings reveal
that although it may be desirable for teachers to make connections with disciplines
that are not within their areas of specialisation, it may not be feasible due to the
extent of demands placed on teachers. Integration requires that teachers have,
and are aware of a broad range of knowledges within, and outside the curriculum
(Mwakapenda, W; Dhlamini, J, 2010). Mwakapenda and Dhlamini (2010)
identified that the mathematical aspects that need to be taught in another
discipline be available to teachers other than those teaching maths. He further
argued that integration may not succeed in cases where the teacher is socialised
to believe that their teaching roles are restricted to those subjects in which they
have been trained (Mwakapenda, W; Dhlamini, J, 2010). Additionally, learners
may face tension in classes where opportunities for making connections between
18
mathematics and other learning areas are available, but are neglected or
inappropriately used by teachers (Mwakapenda & Dhlamini, 2010).
Gross, Brent and Hay (2004) discussed findings that based on the realisation that
modern biology research requires a breadth of skills that go beyond the limited set
of expectations to which students are exposed. The capacity of students to be
critical thinkers and problem solvers has necessitated that quantitative principles
useful to Biology students be included in various curriculums (Gross et al., 2004).
Botha (2008) pointed out the fact that due to new insights that are continually
being made in Biology, some of which include 20th century computer programming
and rapid developments in the field, it is important for biologists to educate
themselves about concepts from other disciplines (Gross et al., 2004). Acer
(2019) states that maths and computer sciences should be incorporated into Life
Sciences education in order to better facilitate insights, and developments in the
discipline. Adamee (2016) stipulated that maths is still largely taught as a
‘discrete’ course and students do not seem to be capable of transferring their
maths skills to their biology courses. He specified that a system of computational
maths workshops that target biology faculty students should be conducted in order
to improve mathematical skills in Biology; and that ultimately, there should be full-
fledged curriculum reform to encourage interdisciplinary expertise (Gross, L;
Brent, R; Hoy, R, 2004).
Cohen (2004) maintains that a synergy between Biology and mathematics can
extend, and enrich both fields. Cohen (2004) placed the interactions between
Biology and Mathematics according to their historical perspectives, and discussed
how the two disciplines influenced each other. His most significant findings that
are relative to this study, pay attention to addressing the synergy between Biology
and Mathematics in the future. Cohen (2004) stressed that early emphasis should
be placed on quantitative skills in primary and secondary schools, and that there
should be more opportunities for training in both Biology and Mathematics.
Furthermore, Cohen (2004) maintains that the future of sciences lies in the
exciting opportunities for the collaboration of athematics and Biology. Mathematics
can help biologists grasp extensive problems, and Biology can help
19
mathematicians by providing challenges that could stimulate major innovations in
Mathematics (Cohen, 2004).
Madlung, Bermer, Limelbau, Tullis (2011) explored the potential negative effects
of interdisciplinary math-biology instruction. The study highlighted the fact that
quantitative work is increasingly being integrated into Biology, but that little is
known about the adverse effects of this integration. Such effects may include the
development of broader, but shallower skills or the possibility of math anxiety that
can cause some students to disengage in the classroom (Madlung et al., 2011).
Madlung et al (2011) showed that integrating more Mathematics into Biology
courses did not have a negative effect on the performance of students. This
observation assisted more advanced students to better understand underlying
biological principles and concepts by offering additional insights into problems
(Madlung et al., 2011).
Scholars such as Adamec (2016) state that many students interested in Biology
find the use of mathematics skills a barrier to their studies. She suggests that
mathematics be fused with Biology and that the subjects should not be kept
separate. She quotes Dr Karen Nelson saying that, “There is a lot of power even
in very simple math. However, that doesn’t make the very simple math easy to
integrate” (Adamec, 2016). Therefore, it is clear that students should develop
mathematical literacy in order to be able to approach their biological studies
successfully. Jungck (2012) concurs and highlights the importance of
mathematical skills in microbiology in various areas including designing
experiments, and the visualisation of relationships. Some of the mathematical
skills used in biological microscope work range from engaging students in
counting, measuring and calculating, to graphing (Jungck, 2012). These maths
skills are needed in all areas of microscope work, and are crucial for Grade 10 Life
Sciences pupils when studying the sections of the curriculum regarding the
microscope.
Marder (2017) considered the integration of Science Technology Engineering and
Maths (STEM), along with the risks that are attached to integrating these areas in
secondary schools. Marder (2017) points out that many Science students do not
like to be pressed to make use of mathematics, and many Mathematics students
20
dislike being pressed to use tools outside their discipline (Marder, 2017). Marder
(2017) further explains that scientists and mathematicians will be asked to
implement new standards, however, they themselves may not possess the skills
that STEM education will ask of students. He further suggests that although
teachers will struggle to prepare their students, current and future secondary
school teachers need to understand a broader curriculum than is known, it is a
struggle that is worth undertaking (Marder, 2017).
Osborne (2007) argues that education in the sciences should aim to develop
scientific literacy that is necessary in contemporary society. He states that current
practices in education create tension between training and educating future
scientists. Hence, it is vital that pupils not only have knowledge, but become
critical consumers of scientific knowledge. Osborne (2007) states that any
particular body of knowledge within the spheres of science that prioritises the
cognitive excellence of one’s labour, that is the evidence of science, has lacked in
offering certain requirements. In essence, the importance of being able to use
knowledge in practical applications is stressed (Osborne, 2007).
Ozgun-Koca (2001) mentions that the effective use of representations in maths
and science has gained importance in the 21st century, with graphical
representations playing a special role (Ozgun-Koca, 2001). He maintains that
graphs can summarise complex information or relationships effectively, and that
they are increasingly being used in science to represent, and interpret
relationships; moreover, that it is crucial for every student to be able to interpret
and construct graphs (Ozgun-Koca, 2001). He reports that studies done by Brasell
and Rowe (1993) on high school physics students revealed that the students did
not understand the fundamental properties, and functions of graphs in
representing relationships among variables. Ozgun-Koca (2001) also refers to
research done by Janvier (1981) in which it was shown that mathematics classes
emphasise the need to read data, and construct certain points on graphs, while
the global meanings, and interpretation of graphs is omitted.
In the article “Understanding the world through math”, AsiaSociety (2018) states
that mathematics is often studied as a pure science, however, it needs to be
applied to other disciplines. The importance of pupils being able to make global
21
connections using mathematics is stressed on account of the world being
interconnected. There are a range of opinions that state that everyday
mathematics shows these connections and possibilities, and it is a powerful tool
for making sense of the world, as well as solving real problems (AsiaSociety,
2018). In addition, teachers should teach rigorous and appropriate mathematical
content with the use of global examples, and that if students are given the right
content and context in a globally infused mathematics curriculum, they will be able
to make connections using mathematicss; and therefore be able to apply
mathematic strategies to solve problems (AsiaSociety, 2018). In essence,
mathematics should assist students to make sense of the world (AsiaSociety,
2018).
Academics such as Fellabaum (2011), initiated the Mathematics in Life Sciences
(MLS) programme at the University of Missouri as a means to integrate
Mathematics into Life Sciences. Research at the university reported that it was
critical for the success of students and for the success of STEM as a whole; and
furthermore, to stimulate the integration between Mathematics and Life Sciences
in order to prevent academic failure amongst students (Fellabaum, 2011). Best
practices for the integration of Mathematics and Life Sciences was put forward by
Fellabaum (2011) and this strategy includes the development of a curriculum that
involves interdisciplinarity through interactions with the Mathematics and Life
Sciences faculties. The MSL programme was well received by students who
experienced success in their studies and research as a result of the programme,
and it is serving as model for other similar programmes at the university
(Fellabaum, 2011).
Staying in line with the discussion on math curriculums, Suurtaam (2011) studied
how an inquiry-orientated mathematics curriculum could assist learners in solving
problems, as well as being able to develop a deeper understanding of
mathematical concepts. The evidence suggested that such a curriculum posed
many challenges for teachers as it required major pedagogical changes, and a
reorientation of teachers’ basic beliefs (Suurtaam, 2011). Teacher changes to
bring about a shift in practice required vital administrative support, teacher
collaboration and programme coherence in order for new pedagogical practices to
be developed (Suurtaam, 2011). From the current discussion, it seems as though
22
this idea of integrating Mathematics and Life Sciences may be problematic within
the current South African school system.
Sorgo (2010) proposes a model of pedagogical mathematical-biological content
knowledge, stating that developing the connection between Biology and
Mathematics is one of the most important ways to shift the paradigms of both
science disciplines. He emphasises that the two disciplines need to be developed
and connected in order for students to be able to combine their knowledge, thus
enabling them to make connections by themselves (Sorgo, 2010). Many biological
processes can be described and explained with the use of mathematical models,
and on the most basic level, Biology requires fundamental skills of graphing,
percentages and simple calculations (Sorgo, 2010). Sorgo (2010) further mentions
that teachers should be trained in pedagogical mathematical-biological content
knowledge, in order to develop a successful connection between these disciplines.
Therefore, this training could help prepare minds that will be able to combine both
disciplines at elementary and higher levels of study (Sorgo, 2010).
This literature review highlights the fundamental link between mathematics and
Life Sciences. Mathematical knowledge and skills are important for pupils to be
able to perform calculations and interpret the information that is presented in Life
Sciences. The notion of adjusting the teaching curriculum to allow for mathematics
and Life Sciences to be more closely integrated provides a possible solution to the
problem of the seeming “disconnect” between mathematical skills and the
performance in Life Sciences where these skills are required. Knowledge and
skills in both these subjects should be integrated during teaching and learning in
order for pupils to be able to interpret information and attribute meaning to the
data that is presented in Life Sciences. The literature review indicates that Life
Sciences performance is closely reliant on basic mathematical skills and that there
is a need to integrate the two subjects in order to improve the academic
performance in Life Sciences.
2.4. Theoretical framework
The research hypothesis that was discussed in chapter one, was approached
using the following theoretical framework. Vygotsky’s theory of constructivism
23
(1978) emphasises the role of integrating various skills and competencies for
learning to be accomplished effectively (Hwang, 1996) (Peschl, 2001), and this
study hopes to be able to suggest a more integrated approach to the teaching of
mathematics and Life Sciences at school level.
The Zone of Proximal Development (ZPD) is described by Vygotsky as the gap
between what the pupil knows and what the pupil can achieve when given
appropriate guidance and support (Hudson, 2012). Mathematics is an area where
learning can occur within Vygotsky’s constructivism framework, since unlearned
material is connected to that which is familiar through scaffolding. The scaffolds
assist a student to make sense of new situations, build on prior knowledge, and
transfer learning (Hudson, 2012). The integration of Mathematics and Life
Sciences can be linked to Vygotsky’s view that the child does not spontaneously
develop concepts independent of their meaning in the social world (Berger,
2005). Vygotsky’s theory of concept formation explains how the divide between
mathematical knowledge and Life Sciences concepts can be bridged and
integrated (Berger, 2005) if both knowledge fields are advanced systematically
and in an integrated manner.
The mathematical skills that learners will be expected to apply will be those that
are laid down in the CAPS document for the senior phase, Mathematics Grade 7 –
9 (Education D.o., 2011). The skills required by Grade 10 learners in microscope
usage and graphing will be those laid down in the CAPS document for the FET
phase, Life Sciences Grade 10 – 12 (Education D.o., 2011). Therefore, Vygotsky’s
constructivism theory (1978) forms the basis for explaining how meaningful
learning takes place and is therefore a fundamental framework for this study.
A case study approach will be used for the duration of this study, as it will provide
an in depth understanding of the situation. In addition, the case study will narrow
the scope of a very broad field of research in order to gather quality quantitative
data. This data will be analysed to indicate and determine if there is an effect on
Grade 10 learners’ skills in microscope usage and graphing, and whether or not
their mathematical performance is poor.
24
CHAPTER 3: RESEARCH DESIGN AND METHODOLOGY
3.1. Introduction to Research Design and Methodology methodology
In order for the objectives of this research study to be realised, a quantitative
methodological approach was used. This approach was used in conjunction with a
case study that was based in a Welkom co-educational school in the Free State
province. Multi data gathering methodology techniques were used in this study;
that is, prepared test questioning and artifact analysis from past Mathematics
testing at the end of the Grade 9 year. The textual Life Sciences test is attached
(Appendix A) and descriptions of the material of each question is provided in
section 3.6. (Synopsis of Test Tasks). Correlational analysis was undertaken with
the statistical data to assess if low mathematical performance would have an
effect on the performance of learners in areas of microscopy, and graphing
abilities. The study group chosen for the case study were 26 Grade 10 Life
Sciences students from an independent high school in Welkom, Free State
Province. The students are both females and males but are between 15 and 17
years of age.
3.2. Research design and procedure
3.2.1. Research design
Employing a quantitative approach in this study may indicate that Life Sciences
marks of learners are negatively affected by poor mathematical skills rather than
poor Life Sciences knowledge or competencies. The pre-existing marks from the
end of Grade 9 were used since all learners did basic Mathematics, and the
expectation is that the skills as required in the CAPS document for Mathematics
for the senior phase should have been mastered (Education D.o., 2011). The
testing instrument was set using questions from a range of Grade 10 Life Sciences
text books to ensure that the questions are of the appropriate standard. Fifty
percent of the test was based on Grade 10 Life Sciences content from the
25
curriculum that could be studied, and another 50% of the test involved questions
in microscopy and graphing using the basic mathematical skills that should have
been mastered by learners by the end of Grade 9.
The research purpose was to assess whether Grade 10 Life Sciences students
under perform in the assessment of microscopy and graphing skills as a result of
poor mathematical skills in these areas. This was done using a quantitative
methodology and a written assessment / testing approach.
The research determined the level of mathematical performance among Grade 10
Life Sciences learners in the case study group in the areas of microscope skills
and graphing skills using quantitative test data and then compared the quantitative
results in each learning area to determine whether there was a correlation
between poor mathematical skills and performance in Grade 10 Life Sciences
questions .
3.2.2. Procedure
In order to determine whether or not pupils grasped and studied the basic Life
Sciences content (Section A of Appendix A), theoretical knowledge in the fields of
microscope work and graphing was examined, and afterwards the relevance of
mathematical ability and application to this material was assessed (Section B of
Appendix A). The marks that were earned by students in their final exams at the
end of Grade 9 were used and derived from the actual report cards of Grade 9.
The obtained results for the IEB performance analysis tests conducted in
Mathematics at the end of Grade 9 were derived utilising an academic central
database.
Microscopy skills were tested using basic scale and magnification measurements,
and the skills in graphing were assessed by means of questions which required
learners to plot graphs from provided data tables. In addition, the use of the
correct scales on the axes as well as questions which related to the interpretation
of graphs that had relation to aspects of the Grade 10 Life Sciences curriculum,
was also tested. To improve the credibility and structural validity of this study, as
well as to guarantee that the results achieved during the first sitting were
26
representative and stable over time, a re-retest of the instrument (Appendix A)
was performed
3.3.Research Process
As stated, a quantitative research approach was employed and a case study was
used in order to investigate the research issue. Using a non-exploratory approach
that was predictive-correlational, data for this study was collected from previous
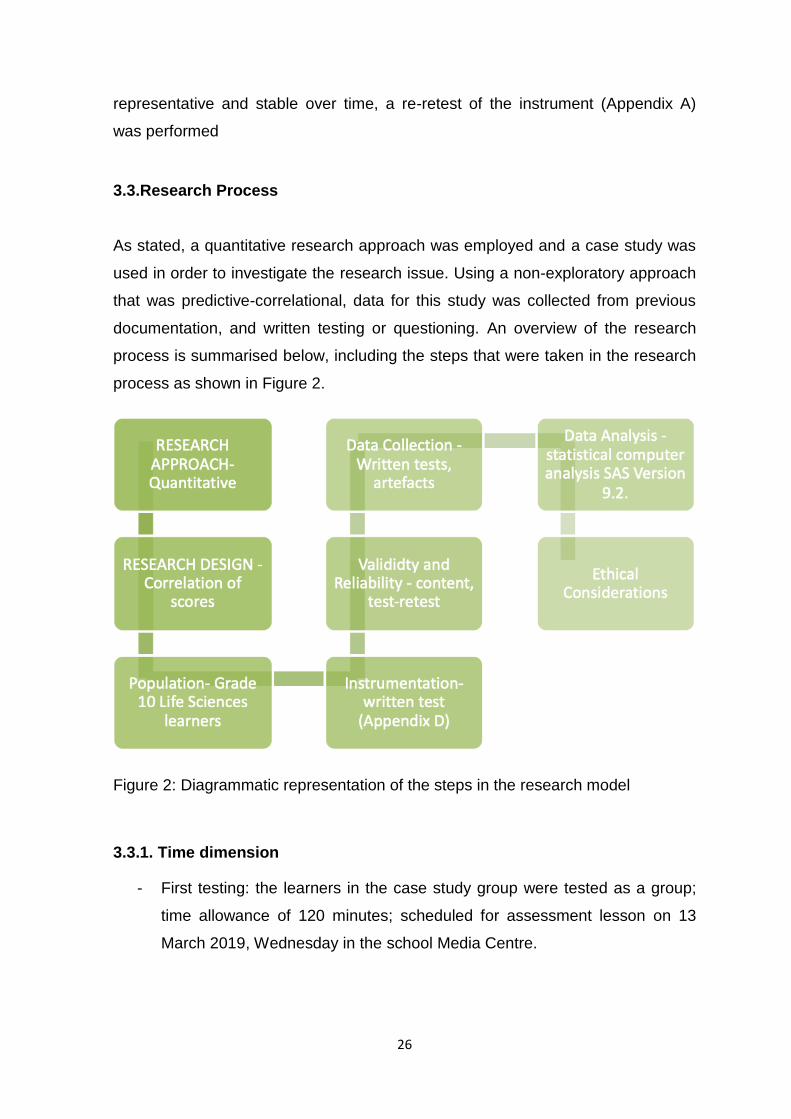
documentation, and written testing or questioning. An overview of the research
process is summarised below, including the steps that were taken in the research
process as shown in Figure 2.
Figure 2: Diagrammatic representation of the steps in the research model
3.3.1. Time dimension
- First testing: the learners in the case study group were tested as a group;
time allowance of 120 minutes; scheduled for assessment lesson on 13
March 2019, Wednesday in the school Media Centre.
27
- Retest: all the learners were tested as a group; time allowance of 120
minutes, scheduled for assessment lesson on 27 March 2019, Wednesday
in the school Media Centre.
- Artefact 1: final Grade 9 Mathematics marks for the year ending 2018, and
exams written in November 2018.
- Artefact 2: IEB benchmarking test results in Grade 9 Mathematics done
during October 2018.
3.3.2. Population
All Grade 10 Life Sciences pupils which included both girls and boys, from
Welkom, Free State, were research participants and formed part of the population
of this study. Overall, 26 participants were present. The participants are aged
between 14 and 17 years of age, and can communicate in English. The language
medium of communication at the school is English, and all learning, teaching and
testing is done in this language. The participants were selected according to the
criteria that were set out for the scope of this study, whereby the researcher
hypothesised that Grade 10 learners may have difficulty in answering questions
on microscopy, and graphing that are based on fundamental mathematical skills.
All participants had received reports at the end of Grade 9 indicating that they
were competent in Mathematics at Grade 9 exit level.
3.3.2.1. Profile of the participants
All the participants live in Welkom, either permanently or in boarding. Some
participants in boarding originated either from other provinces in South Africa, or
from Lesotho. The participants represented a range of socio-economic
backgrounds and came from both rural, and urban backgrounds; and they also
represented a range of home languages. To note, all the participants were
physically and emotionally healthy.

28
3.3.3. Sampling and sampling technique
The sample included all Grade 10 Life Sciences learners who attend contact
classes. The researcher decided on this approach due to the fact that the school
only has 280 learners, and the classes in Life Sciences normally range between
20 and 35 learners per grade. Therefore, all learners needed to be included to
ensure that the population was not too small. Life Sciences learners from other
grades, and other high schools were excluded from this study to minimise the
broadness of the scope. In essence, a case study approach was decided upon in
order to reduce the number of variables that may affect the results of the data.
3.3.3.1. Design
To reiterate, the population of this study consisted of the entire Grade 10 Life
Sciences class that is registered at the study group school in Welkom, Free State.
Therefore, in terms of design, this can be called a fixed, generalised category.
3.3.3.2. Units of analysis for the case study group
- Test 1: an intact, complete class of pupils (26 in total) that exhibited a range
of abilities.
- Retest: an intact, complete class of pupils (26 in total) that exhibited a
range of abilities.
- Artefact 1: all pupils (26 in total) that exhibited a range of abilities.
- Artefact 2: pupils who attended the school in 2018 and who had written the
IEB benchmarking test in Mathematics (23 in total) that exhibited a range of
abilities.
3.3.3.3. Demographics
The demographics of the test sample are summarised below in Table 1. This
data was not analysed further due to the fact that the research questions were
aimed at Grade 10 Life Sciences learners as a whole. However, the data is
included for completeness.
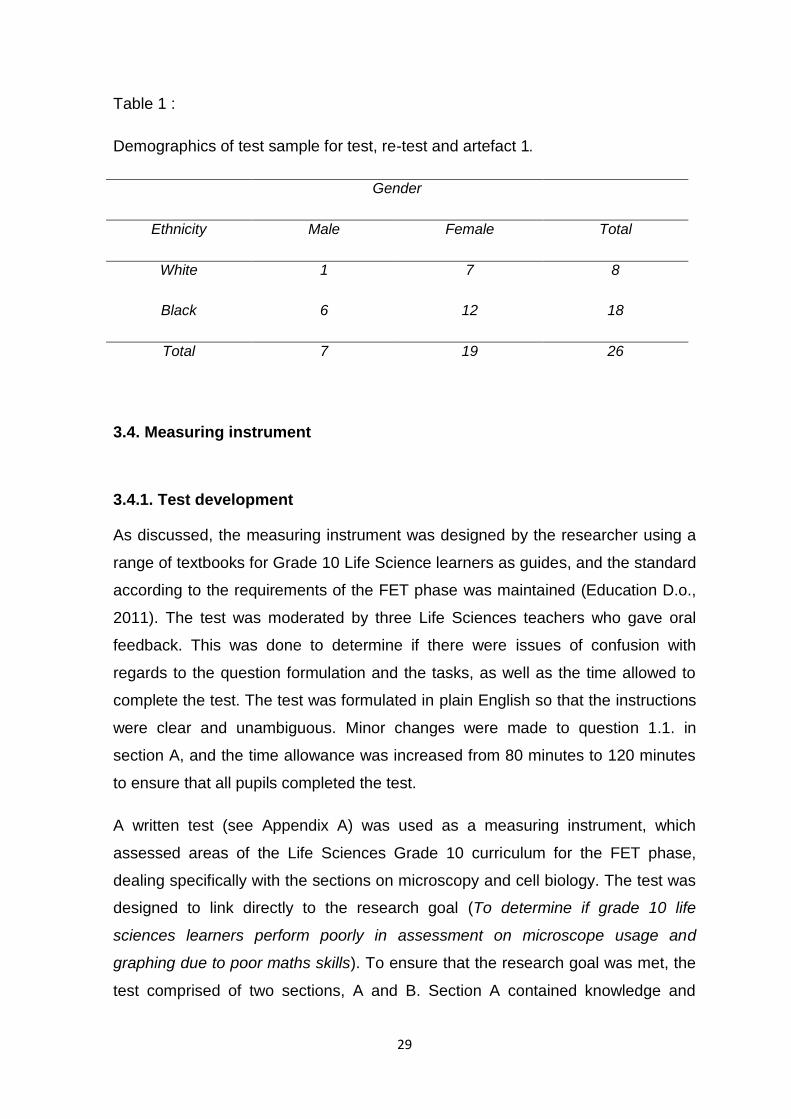
29
Table 1 :
Demographics of test sample for test, re-test and artefact 1.
Gender
Ethnicity Male Female Total
White 1 7 8
Black 6 12 18
Total 7 19 26
3.4. Measuring instrument
3.4.1. Test development
As discussed, the measuring instrument was designed by the researcher using a
range of textbooks for Grade 10 Life Science learners as guides, and the standard
according to the requirements of the FET phase was maintained (Education D.o.,
2011). The test was moderated by three Life Sciences teachers who gave oral
feedback. This was done to determine if there were issues of confusion with
regards to the question formulation and the tasks, as well as the time allowed to
complete the test. The test was formulated in plain English so that the instructions
were clear and unambiguous. Minor changes were made to question 1.1. in
section A, and the time allowance was increased from 80 minutes to 120 minutes
to ensure that all pupils completed the test.
A written test (see Appendix A) was used as a measuring instrument, which
assessed areas of the Life Sciences Grade 10 curriculum for the FET phase,
dealing specifically with the sections on microscopy and cell biology. The test was
designed to link directly to the research goal (To determine if grade 10 life
sciences learners perform poorly in assessment on microscope usage and
graphing due to poor maths skills). To ensure that the research goal was met, the
test comprised of two sections, A and B. Section A contained knowledge and
30
insight based questions that were related to microscopy, and cellular biology, and
the total mark for this section was 50. This mark reflected the knowledge and
ability to understand Life Sciences content and knowledge without the
incorporation of mathematical skills. Section B contained questions that were
directly related to mathematical skills, and the ability to perform basic
mathematical skills in graphing, and calculation with regards to microscope work,
and cellular biology. The total mark for section B was also 50. This mark reflected
the ability to apply basic mathematical skills in a Life Sciences context. The marks
for Section A and Section B of the test were added to give a percentage for the
total test.
3.4.2. Artefacts
The learners’ final marks (as a percentage) in Mathematics for Grade 9, for the
year 2018, as well as the marks from an independent benchmarking test,
implemented by the IEB in October 2018, towards the end of the Grade 9 year,
was used as a reference point for Mathematics performance and competency.
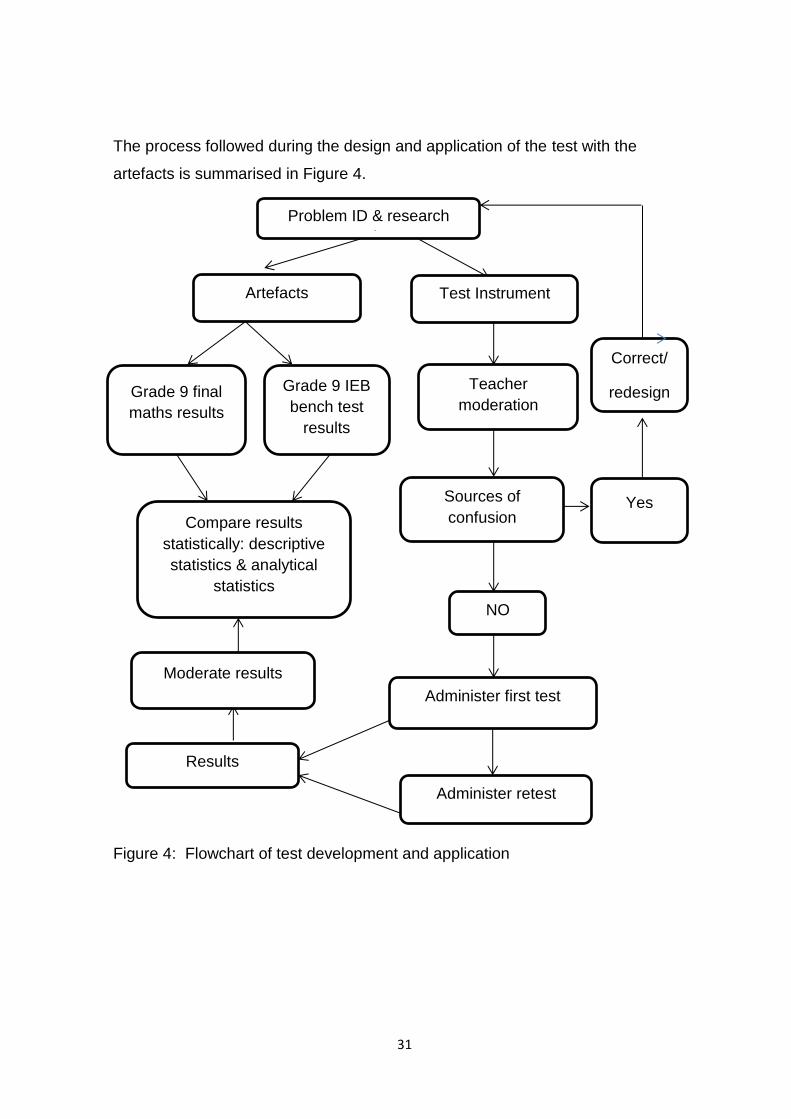
31
The process followed during the design and application of the test with the
artefacts is summarised in Figure 4.
Figure 4: Flowchart of test development and application
Problem ID & research
questions
Test Instrument Artefacts
Teacher
moderation
Sources of
confusion Yes
Correct/
redesign Grade 9 IEB
bench test
results
Grade 9 final
maths results
NO
Administer first test
Administer retest
Results
Compare results
statistically: descriptive
statistics & analytical
statistics
Moderate results
32
3.5. Validity and reliability
3.5.1. Validity
The validity of the test (Appendix A) was based on set out criteria. The first of such
involved content validity, whereby the item validity was ensured as a result of the
selected items for the test, that were directly related to the areas of the curriculum
being considered in the research hypothesis. These areas were based in a cellular
biology context. The sampling validity of the test was ensured by the questions on
microscope usage, and cellular biology that were selected to represent a sample
over a range of possible content areas within these sections. The items selected
were of the appropriate standard for Grade 10 learners, as they were adapted
from Grade 10 learner textbooks.
The second criteria involved the marks that were allocated for items in the test,
and they were aligned with the amount of time that the learners were given to
complete the test. The test was structured into two sections, and the questions in
these sections mirrored one another with regards to content, and mark allocation.
This ensured that a valid comparison could be drawn between the knowledge and
understanding of Life Sciences (section A), and the ability to apply mathematical
skills in a Life Sciences context (section B). The test was compiled and marked
with clear instructions and vocabulary that was appropriate for the learners. This
compilation also included a consistent mark allocation and equal mark allocations
in each section. The test was completed independently, by the learners without
assistance in a controlled environment. Furthermore, the test was user friendly as
it was a ‘write on’ test with answers to be written below each question.
Other criteria that support the validity of this study, include the fact that learners
were permitted to use scientific calculators to assist with calculations in order to
get accurate results. Furthermore, the instrument was moderated internally by
three experienced teachers in Mathematics and Life Sciences, and the marked
tests were moderated by experienced Life Sciences and Maths teachers to ensure
that the marking was in accordance with the memorandum. The marking of the
tests was evaluated as being fair, and consistent.
33
3.5.2. Reliability
The reliability of the test (Appendix A) was based on criteria, which included a test-
retest reliability or stability that was conducted. The test was administered to the
learners and after a two week period had lapsed, the same test was administered
to the learners. The two sets of scores were correlated and the results were
evaluated to determine the reliability of the test. The test-retest reliability was used
to ensure that the scores obtained were representative, and stable.
Referring to the validity and reliability of the first artefact (Mathematics results at
the end of Grade 9, for the 2018 academic year), reliability was based on the
following information which highlights that the results were based on summative
tests, that assessed the mathematics skill areas as described in the CAPS
document for the senior phase (Education D.o., 2011). There was emphasis on
areas that are important for mathematical competence in higher Mathematics
grades. The summative tests were moderated internally and externally by
experienced mathematics teachers to ensure that they conformed to Bloom’s
taxonomy, and that they addressed all the skill areas in the CAPS document. In
addition, the tests were written in controlled examination conditions and reflect
each learner’s individual work.
The tests were marked and the marking was moderated, both internally and
externally, to ensure that marking was accurate according to the memorandum,
and that marking was fair and consistent.
The reliability of the second artefact (IEB benchmarking test in Grade 9
Mathematics, for the 2018 academic year) is based on the fact that the IEB is an
autonomous institution of assessment for schooling, as well as adult evaluations;
and it is approved by Umalusi. Between Grade 3 and Grade 10, the IEB provides
the ACER global benchmarking assessments. ACER develops scientifically
developed evaluation methods which can provide analytical information that is
useful for understanding the academic progress of students. The subjects
discussed in this research study were a part of the Grade 9 ACER International
Benchmarking Exam.
34
The reliability of the results was ensured by applying the research method
consistently, and the test-retest method was also applied. Only one researcher
was involved in this research study and the steps that were used for each
measurement of the test were the same. The conditions of the research were
standardised as far as possible, and data was collected in the same consistent
circumstances to reduce the influence of external factors. The same testing
conditions were also applied to the test and retest. The analysis of the results was
done consistently and accurately, and the results were computed electronically
using the verified SAS Version 9.2 for statistical analysis. The analysis of the
mean scores and deviations for the test-retest showed a p value of 0.4554 for the
difference in the mean scores between Test 1, and Test 2. The p values indicated
that there was not a significant mean difference of the scores in the different
sections in Test 1 and Test 2. This therefore supports the reliability of the test
instrument, as learners achieved similar scores in Test 1 and Test 2 in each
section.
The validity of the results was further ensured by choosing an appropriate method
of measurement. All scores were expressed as percentages. Use was also made
of the IEB benchmarking test marks in mathematics, as the benchmarking test is
based on the ACER testing system which is internationally recognised, and
applied. This study considered the correlations and relationships between the
results to show the impact that Mathematics performance has on the scores of
questions based on mathematical skills, with regards to graphing and microscope
work. It is suggested that a larger sample could increase the external validity of
the research findings.
35
3.6. Synopsis of Test Tasks (Appendix A)
3.6.1. Question 1
3.6.1.1. Question 1: Section A
The question included theoretical knowledge of the microscope, its care and use,
as well as the interpretation of drawings that depicted microscopic views of cells.
The marks allocated for this question were 20.
3.6.1.2. Question 1: Section B
The question involved calculating the magnification of objects when viewed under
the microscope, determining the actual size of organelles when microscopic views
were provided, and determining the size, and magnification if scale lines are
provided. The marks allocated for this question were 20.
3.6.2. Question 2
3.6.2.1. Question 2: Section A
In this question, learners were required to identify cells and organelles, as well as
their functions from drawings. The marks allocated for this question were 10.
3.6.2.2. Question 2: Section B
A table with information was provided and learners were expected to draw a pie
graph by using the data from a table, to illustrate the relative amounts of the
various elements that are present in a cell. Calculations were required for this
question, and the marks allocated were 10.
36
3.6.3. Question 3
3.6.3.1. Question 3: Section A
This question was source based and the information provided was about cancer
and cell division. The questions also tested the knowledge of cell division and
cancer. The mark allocation for this question was 10.
3.6.3.2. Question 3: Section B
In this question, a table showing the percentage number of cancer cells that were
found in various parts of the body of a patient who underwent cancer testing, was
presented. Learners were expected to draw a suitable graph using the data that
was provided. The marks allocated were 10.
3.6.4. Question 4
3.6.4.1. Question 4: Section A
Question 4 presented a diagram of a microscopic view of a blood smear that
showed the composition of blood. Questions in this section were based on the
identification of cells and their functions. The number of marks allocated for this
question were 10.
3.6.4.2. Question 4: Section B
For this question, a graph to show the number of red blood cells per 1mm³ at
various heights above sea level was presented. Questions included reading
information from the graph, describing the relationship shown by the graph, and
calculating the amount of blood cells at a given altitude. The mark allocation for
this question was 10.
37
3.7. Data collection procedures
Data collection was done using written test documentation and artefacts of
previous mathematical test results from Grade 9 final examinations, for the 2018
academic year. These results were obtained from the computer data base with the
permission of the school.
After a period of two weeks, the Grade 10 Life Sciences learners were given a
retest of the test (Appendix A). The same test was administered under the same
conditions. The completed tests were marked by the researcher and moderated
as for the initial testing.
3.7.1. Test and retest
To note once again, a written test served as the instrument to collect data that was
linked to the learners’ Life Sciences knowledge in the areas of the microscope and
cellular biology (Section A), and for testing their mathematical competencies in
answering questions related to the microscope, or graphing related to cellular
biology (Section B). The test was administered to all the learners after they were
taught the work on the microscope, and cells. Learners were informed of the test
date three weeks in advance and had adequate time to study the relevant sections
of work, and to prepare for the written test. The test was conducted during school
hours in a designated assessment period, and learners were given two hours to
complete it. The learners were seated as is required for all school tests, and
normal test conditions were applied to ensure that the learners worked
independently. Each learner had their own calculator and maths set. The tests
were administered by an independent invigilator with many years of experience as
a Grade 12 external examination invigilator.
The invigilator is not associated with the Science, Life Sciences or Maths
departments, and this detail was important so as to ensure that the pupils did not
receive any assistance during the test. Learner anxiety regarding the test was
minimised, as learners completed the test under normal school circumstances that
were familiar to them. The completed tests were returned and marked by the
researcher. A randomly selected sample consisting of six tests was moderated by
38
three experienced Maths and Life Sciences teachers to ensure that the marking
was impartial, and accurate. Furthermore, no discussions regarding the test took
place with the learners. After two weeks had lasped, the learners were given a
retest of the test and it was administered under the same conditions. The
completed tests were then marked and moderated as per the regulations of the
initial test.
3.7.2. Artefacts: Grade 9 marks and benchmarking marks
As stated in the beginning of this section, the marks that were achieved by Grade
9 pupils in Mathematics at the end of Grade 9, for the 2018 academic year, were
obtained from the school’s database. Also, the marks that were achieved by
Grade 9 pupils who attended the school in 2018 and who had written the IEB
benchmarking test in Mathematics, were also retrieved from the school’s
database. Therefore, in light of the information thus far, it is hoped that should the
data support the research hypothesis, then future research studies may be
conducted on a larger scale.
3.8. Methods of data analysis
3.8.1. Descriptive statistics
Test scores in this study were captured and recorded electronically by the
researcher using the Microsoft Excel programme. The scores for section A of the
test constituted a total of 50 marks, and they were converted into percentages.
The scores for section B of the test were made up of a total of 50 marks and were
also converted into percentages. Therefore, all scores used were presented as
percentages. Further analysis was performed by a statistician using SAS
(Statistical Analysis System) Version 9.2., and in order to examine the distribution
of the data, the Shapiro-Wilk test was used. For numerical results, statistical
techniques such as standard deviations, were measured. The statistical difference
with in-score and 95% confidence ranges for the standard deviations in the
grades, were computed for the variable information in order to correlate the grades
for the two parts of each test, as well as between the tests.

39
3.8.2. Analytical statistics
Concerning analytical statistics, including the paired t-test, they were utilised to
investigate whether or not the mean variations were important within the learners'
scores. Correlation analysis was performed by a statistician and were interpreted
by the researcher, to examine whether the Mathematics grades of the participants
at the end of Grade 9, were associated with the grades of the research study test
in sections A and B. The Pearson correlation coefficient (r) and the coefficient of
determination (r²) were both calculated, and regression analysis was used to
investigate if the math scores of the learners at the end of Grade 9 (Y) had a
significant effect on the scores in sections A, and B of the test. For the purposes of
the analysis, a significance level (α) of 0.05 was used.
3.9. Limitations or flaws of the study
The limitations or areas of weakness/flaws in this study that could be addressed
and improved upon in future research included limitations in the case study group
and the areas of skills assessed. Some of the limitations of the study design and
sample entail caution when interpreting the data. These limitations are briefly
summarised below.
The first limitation to the results of this study is with regards to the sample
population that was selected. The case study group was one class of Grade 10
Life Sciences learners at one independent school following the same curriculum in
life sciences. The case study group was not a random sample, and therefore the
results cannot be generally applied to a larger population without further,
extensive research (Simon, 2011). Some learners in the case study group were
studying mathematical literacy as a subject and others were studying pure
mathematics; and it is possible that the exposure to different curriculums may
have an effect on mathematical skills. The choice of mathematics and
mathematical literacy was not initially identified as a limitation, since the
mathematical skills required for Grade 10 Life Sciences are those that are
expected to have been acquired during the Grade 9 year of mathematics teaching.
Moreover, the research did not take into consideration the demographics of the
group. The gender profile of the sample was skewed towards females who
40
comprised 73% of the sample. The mathematical ability of female learners
compared to male learners could be a factor that should be taken into account as
there is a possibility that males and females have different mathematical abilities,
and this could have influenced the results. However this was not the focus of this
research. Three learners in Grade 10 were new to the school and had not
completed the IEB benchmarking test in mathematics in the 2018 academic year;
and therefore the data was not available for those learners. With reference to the
issue of language, not all learners spoke English as a home language. There is a
possibility that language barriers may hinder learning and understanding in both
Life Sciences, and Mathematics. Future research could possibly consider a
similar research study involving participants whose mother tongue and language
of instruction were the same in order to minimise the effect of language barriers.
There is a limitation to the overall results of this research concerning the scope of
this research study’s hypothesis -(Poor academic performance in mathematical
skills among Grade 10 Life Sciences learners throughout the selected study
group, has a negative effect on the academic achievement in Life Sciences with
particular reference to areas concerning microscope use in order to determine
relative size as well as in graphing skill). The main focus of this research was
microscope and graphing skills in Grade 10 that required basic mathematical skills
to complete. Other areas of Life Sciences were not considered in this study.
Future research could extend to other topics in Life Sciences that involve
mathematical skills in order to get a broader range of data.
The results of the achievement tests were dependent on the quality of the test
itself in order to get valid results (Simon, 2011). When compiling the test
instrument, it was challenging to match the questions in Section A with those in
Section B according to Bloom’s taxonomy, and the levels of each question in each
section may not always match. The test instrument was moderated by three other
senior Life Sciences educators in order to minimise the possible discrepancy in
the Bloom’s levels of questions in each section. Lastly, learners were aware that
the study involved a test-retest approach, and because of this, it is possible that
some learners may have memorised certain questions from the first test in order to
study some aspects, and thereby improve their scores in the retest. In order to
41
minimise this limitation, there was a two week time period between the test and
the retest.
With regards to time, this study was conducted over a limited period of time, and it
considered the results of only one group of Grade 10 learners, and not several
groups over a number of years. Future research could track the progress of
several Grade 10 groups for a number of years to determine if there is any
improvement in their ability to apply mathematical skills to Life Sciences as they
become more familiar with the types of questions that require mathematical skills
and have scaffolding and integration with the mathematical skills and their
application to relevant areas in Life Sciences. This would align with Vygotsky’s
constuctivism theory as pupils move increasing through the Zone of Proximal
Development.
The limitations that were highlighted and discussed in this section were taken into
consideration when analysing the results of the study. Future studies may
consider using a larger group of learners from different schools, or different
regions in order to determine if there is a general link between mathematical
performance and Life Sciences skills in microscope usage, and graphing. Such
research endeavours may also investigate other areas or topics in Life Sciences
where mathematical skills are involved in order to determine if there is a
correlation with the results.
3.10. Research Ethics
This research was conducted according to the UNISA Policy for Research Ethics
(2016), and ethical clearance was granted through UNISA as prescribed by
UNISA’s guidelines for post-graduate students (ERC reference:
2018_CGS/ISTE+008).
In accordance with the policies on ethics in research studies, the participants were
notified that their identities would be protected and that individual test marks will
not be revealed. Therefore, in order to assure them anonymity, participants were
assigned numbers. Participants were informed of the purpose of the testing and
signed participation forms in agreement to be part of the research population. All
42
the participants in this study participated voluntarily and were informed of the
research study’s purpose. No remuneration or compensation was given to any
pupil or parent in exchange for participation.
In addition, written permission was obtained from the school (also referred to as
the gatekeeper) to conduct the research. The parents/guardians of the learners
were informed of the research study and written permission was received to allow
their children to participate in the study. This research study is a low-risk ethical
research project since the learners were in a normal school environment, and
were not exposed to external threatening or harmful factors; such as individuals,
testing methods, questioning, or physical environment. The school is an
independent institution and thus permission from the Department of Education’s
district manager was not required. However, regardless of that, written permission
from the Executive Head of the school was granted in order to move forward with
the research study. (Gatekeeper). The application was based on the template
provided by UNISA. (See Appendix D)
43
CHAPTER 4: DATA ANALYSIS, RESULTS AND DISCUSSION
4.1. Introduction
In order to realise the objectives of this study, the analysis of the data was done
using SAS Version 9.2. Further analysis was done statistically using SAS Version
9.2., and the Shapiro-Wilk test was also used to investigate the distribution of the
variables. Descriptive statistics of means and standard deviations was calculated
for numerical data; and in addition to this, analytical statistics namely the paired t-
test, was used to investigate if the mean differences in the scores of the learners
was significant. Furthermore, correlation analysis was used to investigate if the
mathematics scores of the learners correlated with the scores of the learners in
the written tests. The Pearson correlation coefficient (r) and the coefficient of
determination (r²) was calculated, and regression analysis was employed to
determine whether students' mathematics scores had a major impact on the
scores provided in the testing phase in the handwritten Life Sciences tests. The
statistics were interpreted by the researcher.
4.2 Profile of the Participants
The participants in the research were the whole class of grade 10 Life Sciences
learners (26) at an independent, English medium, school in Welkom, in the Free
State Province. The participants were both male and female and of different
ethnicity (Table 1) Participants were aged between 14 and 17 years. All the
participants lived in Welkom, either permanently or in boarding. Some participants
in boarding originated from other provinces in South Africa or from Lesotho.
The participants represented a range of socioeconomic backgrounds and came
from both rural and urban backgrounds. All participants were physically and
emotionally healthy. The participants represent a range of home languages,
although the language of secondary education and of testing of all the learners
was English.
All participants had received reports at the end of Grade 9 (2018) indicating that
they were competent in Mathematics at Grade 9 exit level.
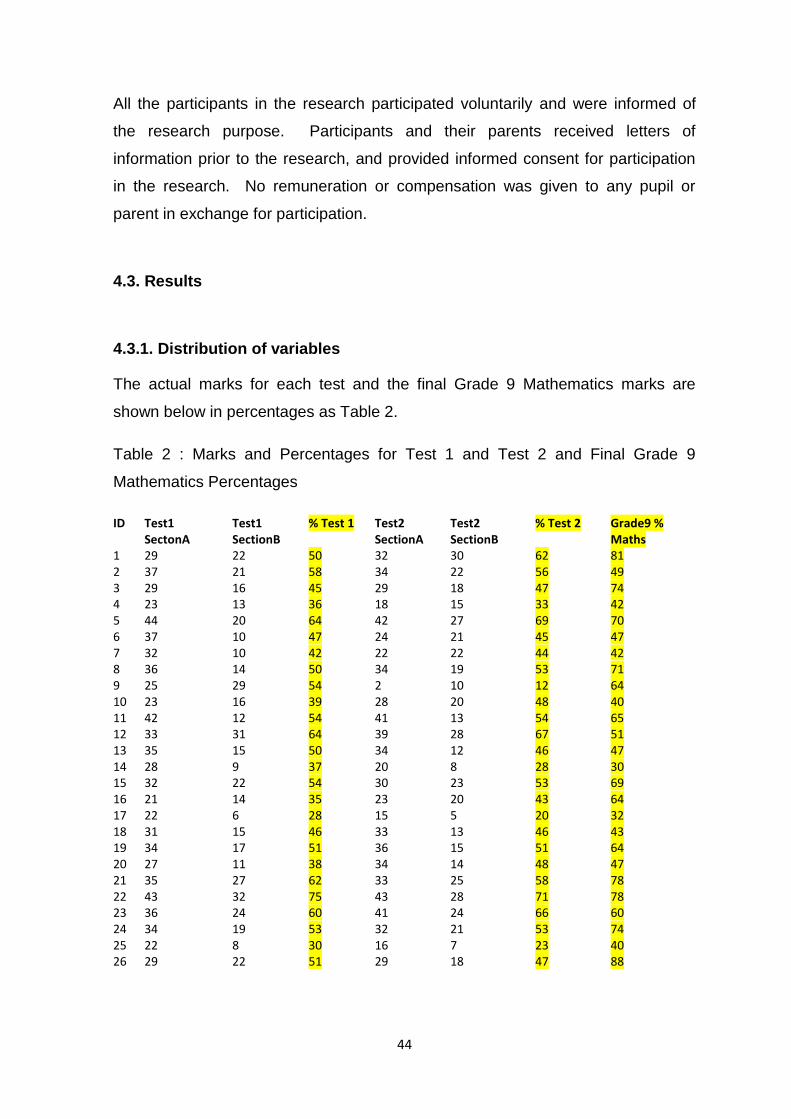
44
All the participants in the research participated voluntarily and were informed of
the research purpose. Participants and their parents received letters of
information prior to the research, and provided informed consent for participation
in the research. No remuneration or compensation was given to any pupil or
parent in exchange for participation.
4.3. Results
4.3.1. Distribution of variables
The actual marks for each test and the final Grade 9 Mathematics marks are
shown below in percentages as Table 2.
Table 2 : Marks and Percentages for Test 1 and Test 2 and Final Grade 9
Mathematics Percentages
ID Test1 SectonA
Test1 SectionB
% Test 1 Test2 SectionA
Test2 SectionB
% Test 2 Grade9 % Maths
1 29 22 50 32 30 62 81 2 37 21 58 34 22 56 49 3 29 16 45 29 18 47 74 4 23 13 36 18 15 33 42 5 44 20 64 42 27 69 70 6 37 10 47 24 21 45 47 7 32 10 42 22 22 44 42 8 36 14 50 34 19 53 71 9 25 29 54 2 10 12 64 10 23 16 39 28 20 48 40 11 42 12 54 41 13 54 65 12 33 31 64 39 28 67 51 13 35 15 50 34 12 46 47 14 28 9 37 20 8 28 30 15 32 22 54 30 23 53 69 16 21 14 35 23 20 43 64 17 22 6 28 15 5 20 32 18 31 15 46 33 13 46 43 19 34 17 51 36 15 51 64 20 27 11 38 34 14 48 47 21 35 27 62 33 25 58 78 22 43 32 75 43 28 71 78 23 36 24 60 41 24 66 60 24 34 19 53 32 21 53 74 25 22 8 30 16 7 23 40 26 29 22 51 29 18 47 88
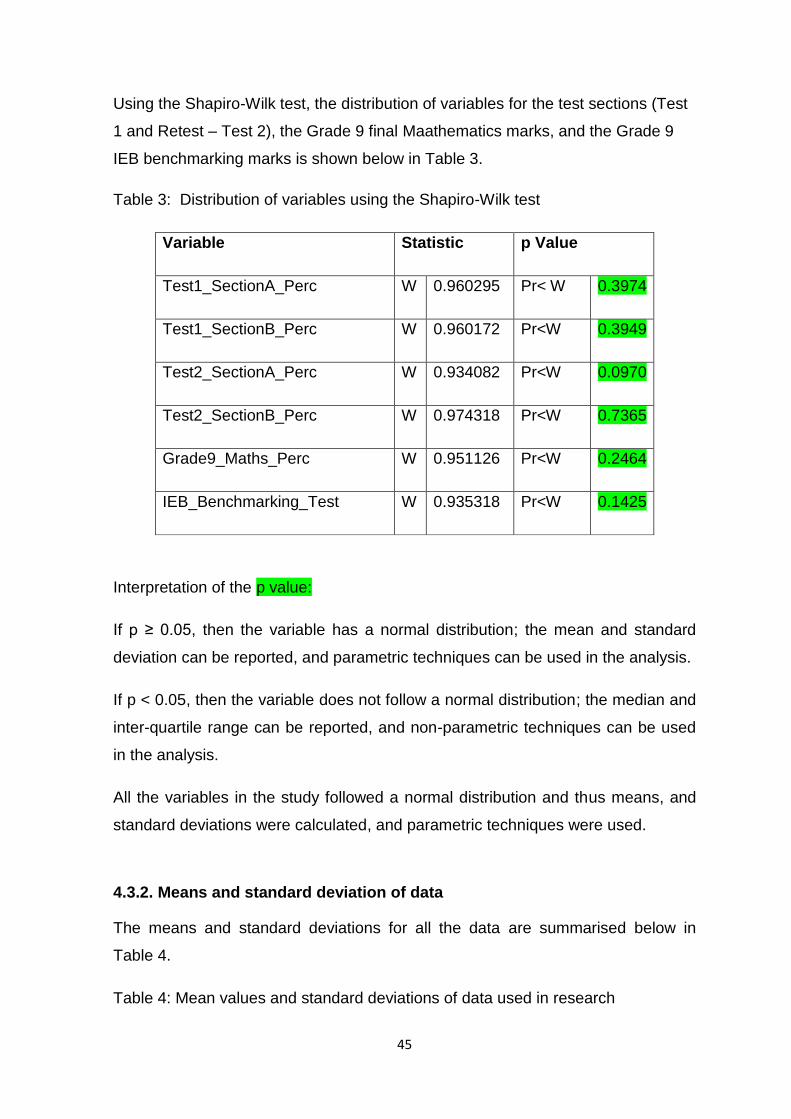
45
Using the Shapiro-Wilk test, the distribution of variables for the test sections (Test
1 and Retest – Test 2), the Grade 9 final Maathematics marks, and the Grade 9
IEB benchmarking marks is shown below in Table 3.
Table 3: Distribution of variables using the Shapiro-Wilk test
Variable Statistic p Value
Test1_SectionA_Perc W 0.960295 Pr< W 0.3974
Test1_SectionB_Perc W 0.960172 Pr<W 0.3949
Test2_SectionA_Perc W 0.934082 Pr<W 0.0970
Test2_SectionB_Perc W 0.974318 Pr<W 0.7365
Grade9_Maths_Perc W 0.951126 Pr<W 0.2464
IEB_Benchmarking_Test W 0.935318 Pr<W 0.1425
Interpretation of the p value:
If p ≥ 0.05, then the variable has a normal distribution; the mean and standard
deviation can be reported, and parametric techniques can be used in the analysis.
If p < 0.05, then the variable does not follow a normal distribution; the median and
inter-quartile range can be reported, and non-parametric techniques can be used
in the analysis.
All the variables in the study followed a normal distribution and thus means, and
standard deviations were calculated, and parametric techniques were used.
4.3.2. Means and standard deviation of data
The means and standard deviations for all the data are summarised below in
Table 4.
Table 4: Mean values and standard deviations of data used in research
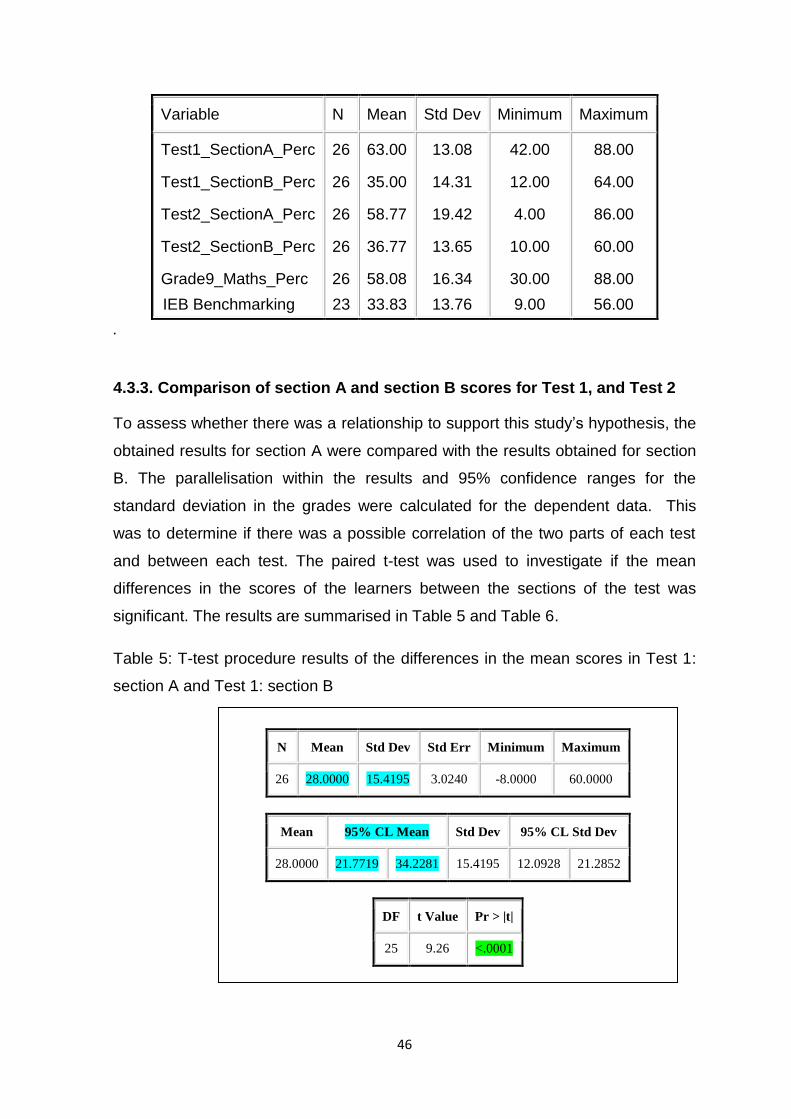
46
Variable N Mean Std Dev Minimum Maximum
Test1_SectionA_Perc
Test1_SectionB_Perc
Test2_SectionA_Perc
Test2_SectionB_Perc
Grade9_Maths_Perc
IEB Benchmarking
26
26
26
26
26
23
63.00
35.00
58.77
36.77
58.08
33.83
13.08
14.31
19.42
13.65
16.34
13.76
42.00
12.00
4.00
10.00
30.00
9.00
88.00
64.00
86.00
60.00
88.00
56.00
.
4.3.3. Comparison of section A and section B scores for Test 1, and Test 2
To assess whether there was a relationship to support this study’s hypothesis, the
obtained results for section A were compared with the results obtained for section
B. The parallelisation within the results and 95% confidence ranges for the
standard deviation in the grades were calculated for the dependent data. This
was to determine if there was a possible correlation of the two parts of each test
and between each test. The paired t-test was used to investigate if the mean
differences in the scores of the learners between the sections of the test was
significant. The results are summarised in Table 5 and Table 6.
Table 5: T-test procedure results of the differences in the mean scores in Test 1:
section A and Test 1: section B
N Mean Std Dev Std Err Minimum Maximum
26 28.0000 15.4195 3.0240 -8.0000 60.0000
Mean 95% CL Mean Std Dev 95% CL Std Dev
28.0000 21.7719 34.2281 15.4195 12.0928 21.2852
DF t Value Pr > |t|
25 9.26 <.0001
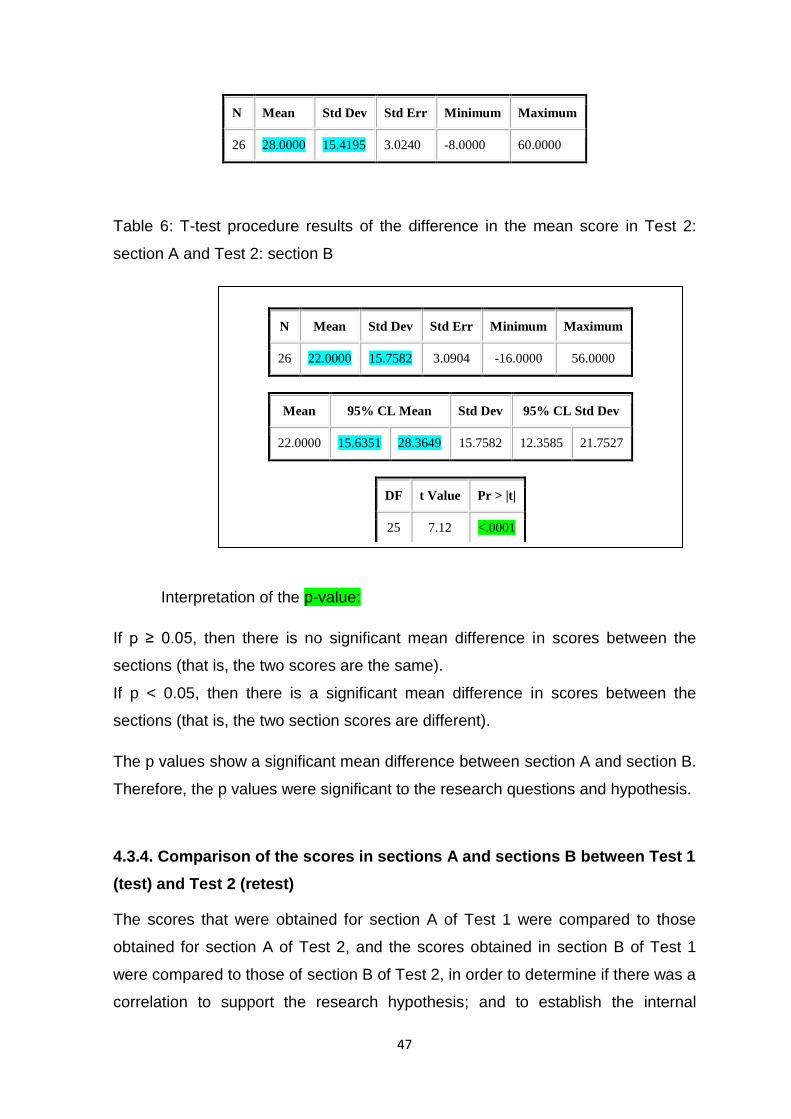
47
N Mean Std Dev Std Err Minimum Maximum
26 28.0000 15.4195 3.0240 -8.0000 60.0000
Table 6: T-test procedure results of the difference in the mean score in Test 2:
section A and Test 2: section B
N Mean Std Dev Std Err Minimum Maximum
26 22.0000 15.7582 3.0904 -16.0000 56.0000
Mean 95% CL Mean Std Dev 95% CL Std Dev
22.0000 15.6351 28.3649 15.7582 12.3585 21.7527
DF t Value Pr > |t|
25 7.12 <.0001
Interpretation of the p-value:
If p ≥ 0.05, then there is no significant mean difference in scores between the
sections (that is, the two scores are the same).
If p < 0.05, then there is a significant mean difference in scores between the
sections (that is, the two section scores are different).
The p values show a significant mean difference between section A and section B.
Therefore, the p values were significant to the research questions and hypothesis.
4.3.4. Comparison of the scores in sections A and sections B between Test 1
(test) and Test 2 (retest)
The scores that were obtained for section A of Test 1 were compared to those
obtained for section A of Test 2, and the scores obtained in section B of Test 1
were compared to those of section B of Test 2, in order to determine if there was a
correlation to support the research hypothesis; and to establish the internal
N Mean Std Dev Std Err Minimum Maximum
26 22.0000 15.7582 3.0904 -16.0000 56.0000
Mean 95% CL Mean Std Dev 95% CL Std Dev
22.0000 15.6351 28.3649 15.7582 12.3585 21.7527
DF t Value Pr > |t|
25 7.12 <.0001
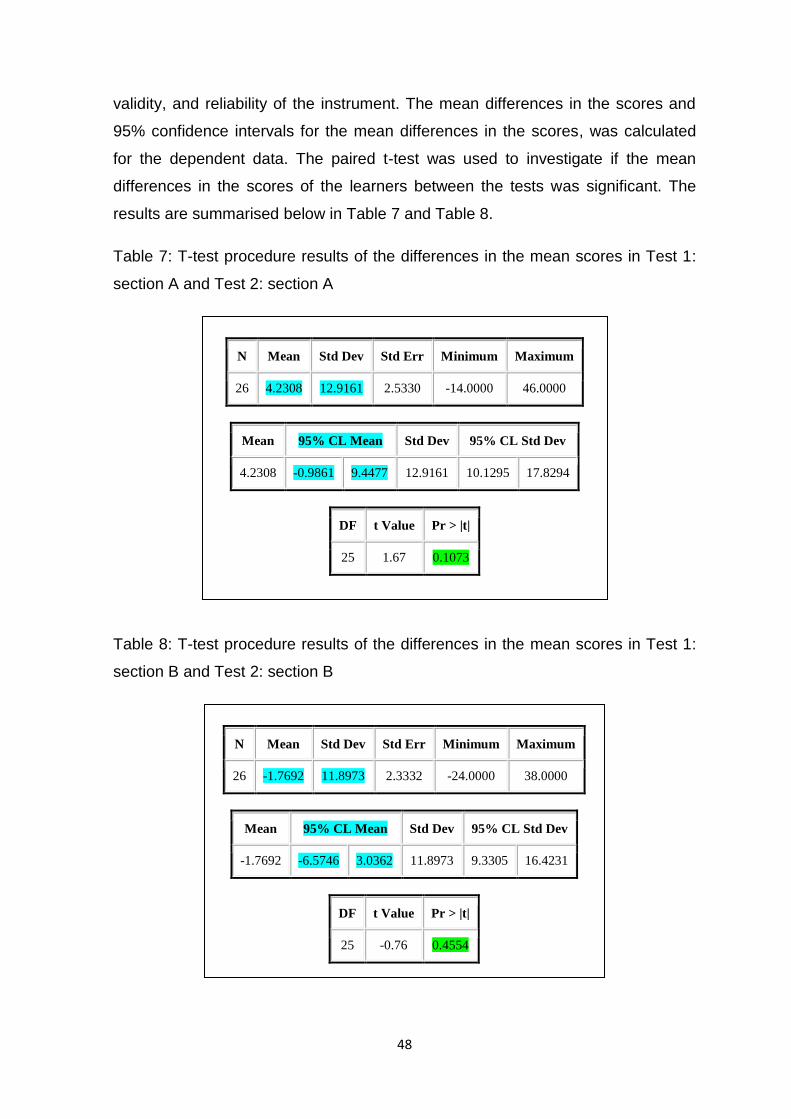
48
validity, and reliability of the instrument. The mean differences in the scores and
95% confidence intervals for the mean differences in the scores, was calculated
for the dependent data. The paired t-test was used to investigate if the mean
differences in the scores of the learners between the tests was significant. The
results are summarised below in Table 7 and Table 8.
Table 7: T-test procedure results of the differences in the mean scores in Test 1:
section A and Test 2: section A
Table 8: T-test procedure results of the differences in the mean scores in Test 1:
section B and Test 2: section B
N Mean Std Dev Std Err Minimum Maximum
26 4.2308 12.9161 2.5330 -14.0000 46.0000
Mean 95% CL Mean Std Dev 95% CL Std Dev
4.2308 -0.9861 9.4477 12.9161 10.1295 17.8294
DF t Value Pr > |t|
25 1.67 0.1073
N Mean Std Dev Std Err Minimum Maximum
26 -1.7692 11.8973 2.3332 -24.0000 38.0000
Mean 95% CL Mean Std Dev 95% CL Std Dev
-1.7692 -6.5746 3.0362 11.8973 9.3305 16.4231
DF t Value Pr > |t|
25 -0.76 0.4554
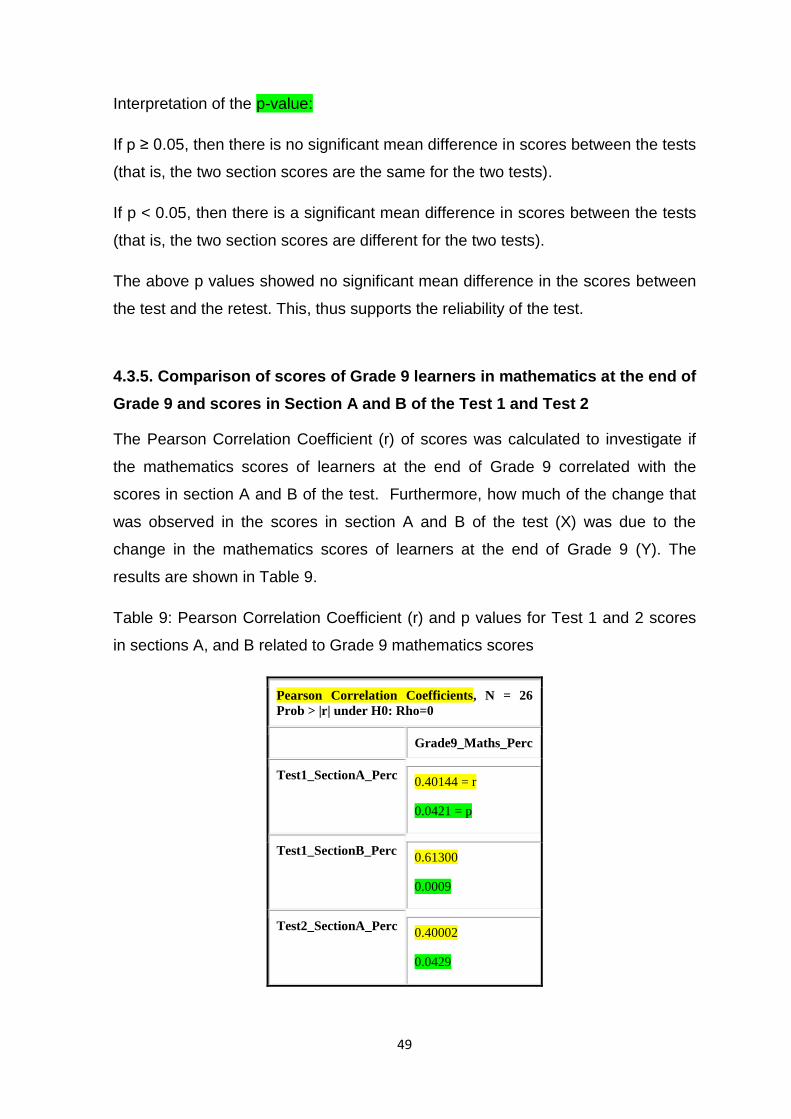
49
Interpretation of the p-value:
If p ≥ 0.05, then there is no significant mean difference in scores between the tests
(that is, the two section scores are the same for the two tests).
If p < 0.05, then there is a significant mean difference in scores between the tests
(that is, the two section scores are different for the two tests).
The above p values showed no significant mean difference in the scores between
the test and the retest. This, thus supports the reliability of the test.
4.3.5. Comparison of scores of Grade 9 learners in mathematics at the end of
Grade 9 and scores in Section A and B of the Test 1 and Test 2
The Pearson Correlation Coefficient (r) of scores was calculated to investigate if
the mathematics scores of learners at the end of Grade 9 correlated with the
scores in section A and B of the test. Furthermore, how much of the change that
was observed in the scores in section A and B of the test (X) was due to the
change in the mathematics scores of learners at the end of Grade 9 (Y). The
results are shown in Table 9.
Table 9: Pearson Correlation Coefficient (r) and p values for Test 1 and 2 scores
in sections A, and B related to Grade 9 mathematics scores
Pearson Correlation Coefficients, N = 26
Prob > |r| under H0: Rho=0
Grade9_Maths_Perc
Test1_SectionA_Perc 0.40144 = r
0.0421 = p
Test1_SectionB_Perc 0.61300
0.0009
Test2_SectionA_Perc 0.40002
0.0429

50
Pearson Correlation Coefficients, N = 26
Prob > |r| under H0: Rho=0
Grade9_Maths_Perc
Test2_SectionB_Perc 0.56406
0.0027
Interpretation of the p-value:
If p ≥ 0.05, then there is no significant correlation between the two scores.
If p < 0.05, then there is a significant correlation between the two scores.
Interpretation of (r) value strength:
r = 0.0 – 0.4 weak correlation
r = 0.5 – 0.6 moderate correlation
r = 0.7 – 0.99 strong correlation
Therefore, the p values show a significant correlation between the scores.
Therefore, the r values show a strong positive correlation between the scores.
4.3.6. Comparison of scores of Grade 9 learners in IEB benchmarking tests
with the scores in mathematics at the end of Grade 9, and scores in
section B of Test 1, and Test 2
The Pearson Correlation Coefficient (r) of scores was calculated to investigate if
the mathematics scores of learners in the IEB benchmarking test in mathematics
at the end of Grade 9 correlated with the scores of Grade 9 learners in
Mathematics at the end of Grade 9, including the scores in section B of the tests.
The results are presented below in Table 10.
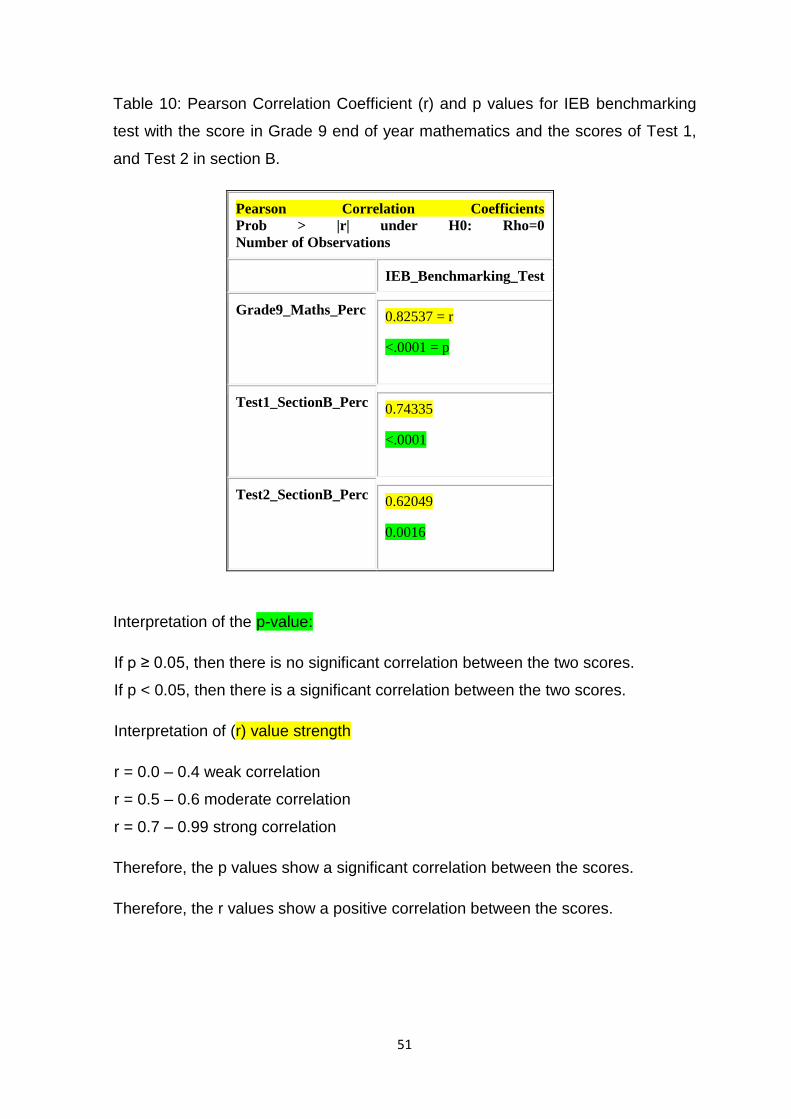
51
Table 10: Pearson Correlation Coefficient (r) and p values for IEB benchmarking
test with the score in Grade 9 end of year mathematics and the scores of Test 1,
and Test 2 in section B.
Pearson Correlation Coefficients
Prob > |r| under H0: Rho=0
Number of Observations
IEB_Benchmarking_Test
Grade9_Maths_Perc 0.82537 = r
<.0001 = p
Test1_SectionB_Perc 0.74335
<.0001
Test2_SectionB_Perc 0.62049
0.0016
Interpretation of the p-value:
If p ≥ 0.05, then there is no significant correlation between the two scores.
If p < 0.05, then there is a significant correlation between the two scores.
Interpretation of (r) value strength
r = 0.0 – 0.4 weak correlation
r = 0.5 – 0.6 moderate correlation
r = 0.7 – 0.99 strong correlation
Therefore, the p values show a significant correlation between the scores.
Therefore, the r values show a positive correlation between the scores.
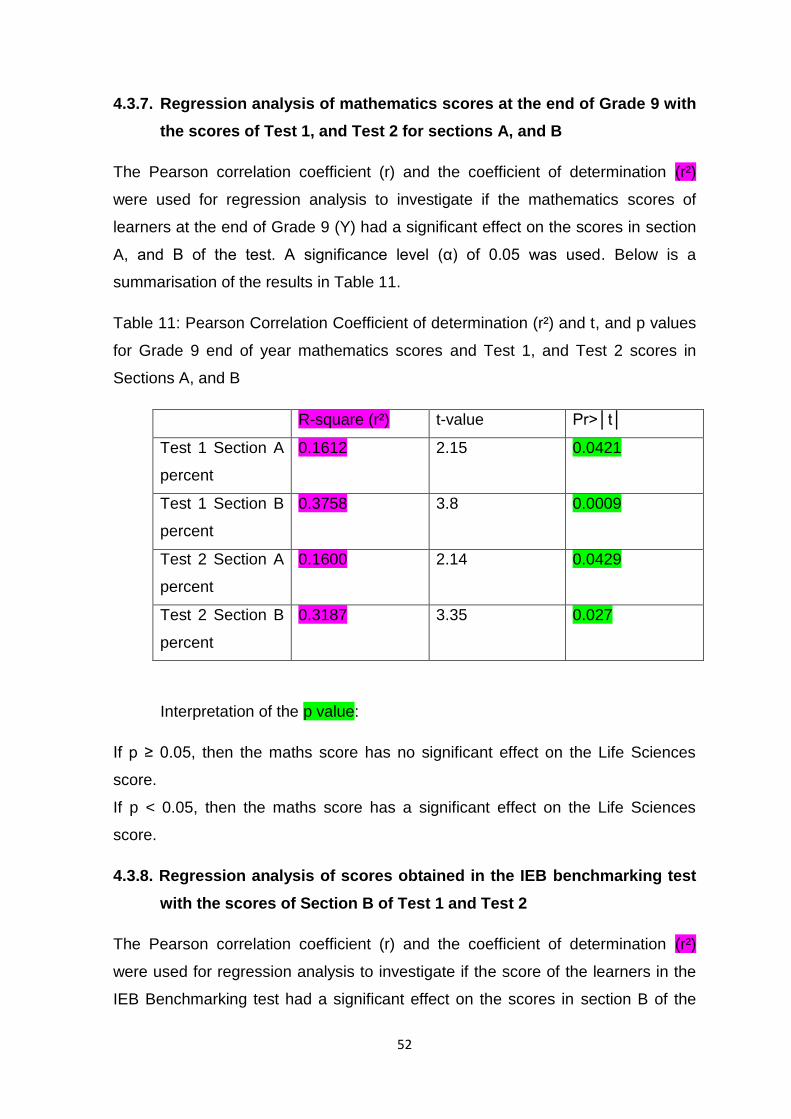
52
4.3.7. Regression analysis of mathematics scores at the end of Grade 9 with
the scores of Test 1, and Test 2 for sections A, and B
The Pearson correlation coefficient (r) and the coefficient of determination (r²)
were used for regression analysis to investigate if the mathematics scores of
learners at the end of Grade 9 (Y) had a significant effect on the scores in section
A, and B of the test. A significance level (α) of 0.05 was used. Below is a
summarisation of the results in Table 11.
Table 11: Pearson Correlation Coefficient of determination (r²) and t, and p values
for Grade 9 end of year mathematics scores and Test 1, and Test 2 scores in
Sections A, and B
R-square (r²) t-value Pr˃│t│
Test 1 Section A
percent
0.1612 2.15 0.0421
Test 1 Section B
percent
0.3758 3.8 0.0009
Test 2 Section A
percent
0.1600 2.14 0.0429
Test 2 Section B
percent
0.3187 3.35 0.027
Interpretation of the p value:
If p ≥ 0.05, then the maths score has no significant effect on the Life Sciences
score.
If p < 0.05, then the maths score has a significant effect on the Life Sciences
score.
4.3.8. Regression analysis of scores obtained in the IEB benchmarking test
with the scores of Section B of Test 1 and Test 2
The Pearson correlation coefficient (r) and the coefficient of determination (r²)
were used for regression analysis to investigate if the score of the learners in the
IEB Benchmarking test had a significant effect on the scores in section B of the
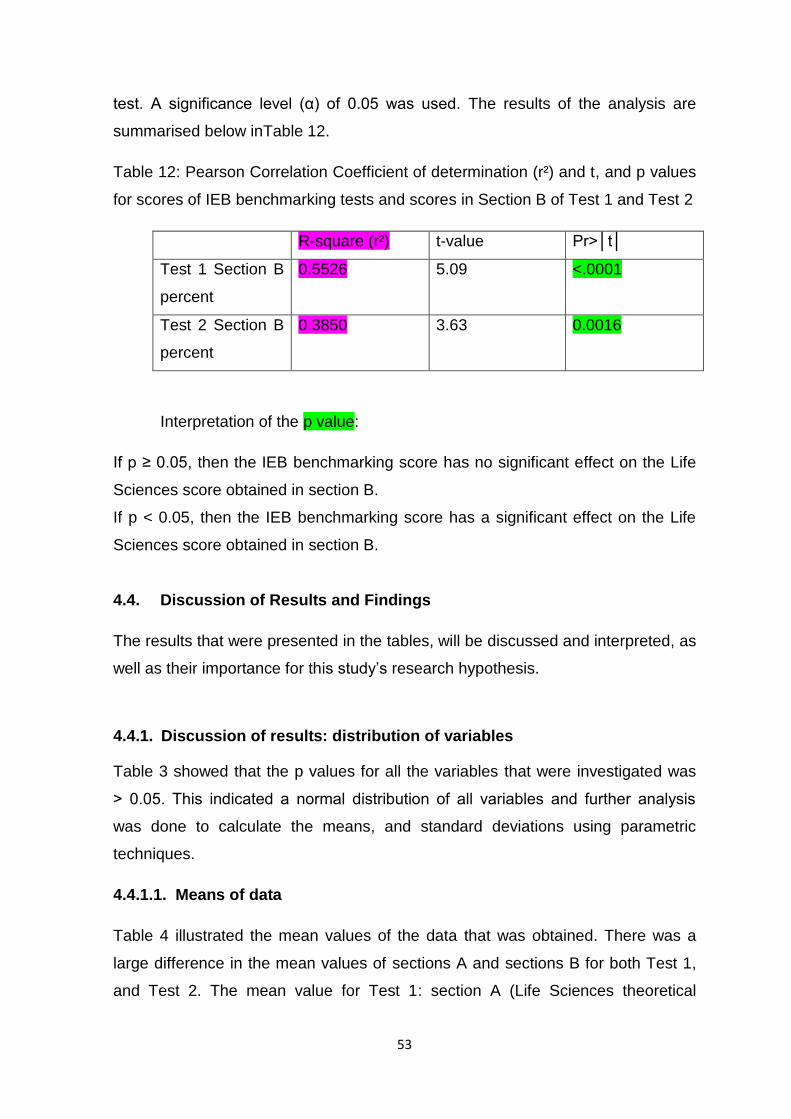
53
test. A significance level (α) of 0.05 was used. The results of the analysis are
summarised below inTable 12.
Table 12: Pearson Correlation Coefficient of determination (r²) and t, and p values
for scores of IEB benchmarking tests and scores in Section B of Test 1 and Test 2
R-square (r²) t-value Pr˃│t│
Test 1 Section B
percent
0.5526 5.09 <.0001
Test 2 Section B
percent
0.3850 3.63 0.0016
Interpretation of the p value:
If p ≥ 0.05, then the IEB benchmarking score has no significant effect on the Life
Sciences score obtained in section B.
If p < 0.05, then the IEB benchmarking score has a significant effect on the Life
Sciences score obtained in section B.
4.4. Discussion of Results and Findings
The results that were presented in the tables, will be discussed and interpreted, as
well as their importance for this study’s research hypothesis.
4.4.1. Discussion of results: distribution of variables
Table 3 showed that the p values for all the variables that were investigated was
˃ 0.05. This indicated a normal distribution of all variables and further analysis
was done to calculate the means, and standard deviations using parametric
techniques.
4.4.1.1. Means of data
Table 4 illustrated the mean values of the data that was obtained. There was a
large difference in the mean values of sections A and sections B for both Test 1,
and Test 2. The mean value for Test 1: section A (Life Sciences theoretical
54
content) was 63 and the mean value for Test 2: section A was 58.77. The mean
value for Test 1: section B (Life Sciences questions based on mathematical skills)
was 35 and the mean value for Test 2: section B was 36.77. There was also a
large difference in the mean values of the Grade 9 mathematics scores (mean
58.08) and the IEB benchmarking mathematics scores (mean 33.83). The
difference in mean of 24.25, places the IEB benchmarking mean more in line with
the mean scores that were obtained in Test 1 and Test 2: Section B. Analysing the
mean values showed little difference in the mean values for section A of Test 1
and Test 2, and the mean value of the Grade 9 mathematics scores. There was
also little difference in the mean values for section B and of Test 1, Test 2, and the
IEB benchmarking test scores. However, mean values between Section A and
Section B are notable.
The evidence presented indicates that the noticeable difference between the
means of Section A and B, as well as the Grade 9 Mathematics scores and the
IEB benchmarking scores could suggest that learners studied only certain aspects
for testing. However, when presented with the application of mathematical skills,
they had difficulty in applying their mathematical knowledge. This would support
the hypothesis that mathematical skills are poor and not integrated successfully
into Life Sciences questions that are based on mathematical skills.
4.4.1.2 Comparison of section A and section B scores for Test 1, and Test 2
The t-test procedure results for the differences in the mean scores between
section A and section B for Test 1 were shown in Table 5, and for Test 2 in Table
6. The p values of <.0001 showed a significant mean difference between the
scores in section A and section B in Test 1, and Test 2. Therefore, the p value
results support the hypothesis that poor mathematical skills can have an effect on
Life Sciences performance and scores, and that mathematical skills are not well
integrated into Life Sciences questions.
4.4.1.3. Comparison of the scores in sections A and sections B between Test
1 (test) and Test 2 (retest)
The t-test procedure for the differences in the mean scores in section A of Test 1
and section A of Test 2 were highlighted in Table 7. The p value was 0.1073. The
55
t-test procedure for the differences in the mean scores in section B of Test 1 and
section B of Test 2 were highlighted in Table 8. The p value was 0.4554. The p
values revealed that there was not a significant mean difference of the scores in
the different sections in Test 1 and Test 2. Learners achieved similar scores in
Test 1 and Test 2 in each section. This evidence thus supports the reliability of the
test instrument.
4.4.1.4. Comparison of scores of Grade 9 learners in mathematics at the end
of Grade 9 and scores in Section A and B of Test 1 and Test 2.
The Pearson Correlation Coefficient (r) of the scores was illustrated in Table 9.
The results highlighted that for Test 1 section A, and the Grade 9 Mathematics
scores, there was a weak positive correlation with r = 0.40. This correlation was
significant (p=0.421). For Test 1 section B, and the Grade 9 Mathematics scores,
there was a moderately positive correlation with r = 0.61. The correlation between
Grade 9 mathematics scores and section B, which was based on application of
mathematical skills in Life Sciences, was significant (p = 0.0009). This result
supports the hypothesis that poor mathematical skills can affect the performance
in Life Sciences questions that are based on mathematical skills.
The results demonstrate that for Test 2: Section A, and the Grade 9 Mathematics
scores, there was a weak positive correlation with r = 0.40. This correlation was
significant (p=0.429). For Test 2: Section B, and the Grade 9 Mathematics scores,
there was a moderate positive correlation with r = 0.564. The correlation between
Grade 9 Mathematics scores and Section B, which was based on the application
of mathematical skills in Life Sciences, was significant (p=0.0027). Therefore, this
result supports the hypothesis that poor mathematical skills can affect the
performance in Life Sciences questions that are based on mathematical skills.
4.4.1.5. Comparison of scores of Grade 9 learners in IEB benchmarking tests
with the scores in mathematics at the end of Grade 9 and scores in
section B of Test 1, and Test 2
The Pearson Correlation Coefficient (r) and p values for the IEB benchmarking
test and the scores in Grade 9 end-of-year mathematics, and the scores of Test 1
and Test 2: Section B, were shown in Table 10. The results showed that for Grade
56
9 mathematics scores and IEB benchmarking test scores, there was a strong
positive correlation with r = 0.825. This correlation was significant (p < 0.0001).
For Test 1: Section B and the IEB benchmarking test scores, there was a strong
positive correlation with r = 0.743. This correlation was also significant (p <
0.0001). For Test 2: Section B and the IEB benchmarking test scores, there was a
moderately strong positive correlation with r = 0.620 and this correlation was
significant (p = 0.0016).
The findings indicate that the slight difference in correlation between both Test 1
and Test 2: Section B, and the IEB benchmarking could be attributed to some
learners having practised the mathematical skills required in section B, before
writing Test 2. Therefore, in light of this data, the positive correlation of the scores
supports the hypothesis that poor mathematical skills can affect the performance
in Life Sciences questions that are based on mathematical skills.
4.4.1.6. Regression analysis of mathematics scores at the end of Grade 9
with the scores of Test 1 and Test 2 for sections A, and sections B
The Pearson Correlation Coefficient of determination (r²) and the p values for
Grade 9 end-of-year Mathematics scores, and Test 1 and Test 2 scores in
sections A, and B were presented in Table 11. The results for Test 1: Section A
correlated to Grade 9 mathematics scores illustrated that r² = 0.1612. Only
16.12% of the change in score in section A of Test 1 was as a result of the change
in mathematics scores at the end of Grade 9, where 83.88% of the change in
score of section A of Test 1 was due to other factors. The p value was 0.04 and
showed that the mathematics score has a significant effect on the Life Sciences
score. The results for Test 1: section B correlated to Grade 9 Mathematics scores
showed r² = 0.3758. This reflects that 37.58% of the change in score in Section B
of Test 1 was due to the change in mathematics score at the end of Grade 9,
whereas 62.42% was due to other factors. The p value was 0.0009, which
indicates that the Mathematics score has a significant effect on the Life Sciences
score.
In Test 2: Section A correlated to Grade 9 mathematics scores highlighted r² =
0.16. Only 16% of the change in score in Section A of Test 2 was, because of the
change in mathematics score at the end of Grade 9, and 84% of the change in
57
score of Section A of Test 2 was due to other factors. The p value of 0.0429
demonstrated that the Mathematics score has a significant effect on the Life
Sciences score. The results for Test 2: Section B correlated to Grade 9
mathematics marks showed r² = 0.3187. This reflects that 31.87% of the change in
score in section B of Test 2 was as a result of the change in Mathematics score at
the end of Grade 9, whereas 68.13% was due to other factors. The p value was
0.027 which suggests that the Mathematics score has a significant effect on the
Life Sciences score. Hence, these results indicate support for the hypothesis,
since the Mathematics score has a significant effect on the Life Sciences score.
Furthermore, poor Mathematics scores can be reflected as poor scores in Life
Sciences questions, where mathematical skills are required.
4.4.1.7. Regression analysis of scores obtained in the IEB Benchmarking
test with the scores of section B of Test 1 and Test 2
The Pearson Correlation Coefficient of determination (r²) and the p values of the
scores of the IEB benchmarking tests, and scores in section B of Test 1, and Test
2 were presented in Table 12. The results for Test 1: Section B correlated to IEB
benchmarking scores showed r² = 0.5526. This reflects that 55.26% of the change
in score in Section B of Test 1 was due to a change in IEB benchmarking score,
and 44.74% was due to other factors. The p-value < 0.0001 indicates that the IEB
benchmarking score has a significant effect on the Life Sciences scores that were
obtained in section B.
The results for Test 2: Section B correlated to IEB benchmarking scores showed
r² = 0.3850. This reflects that 38.50% of the change in score in section B of Test 2
was due to a change in IEB benchmarking score, and that 61.50% was due to
other factors. The p-value was 0.0016 suggests that the IEB benchmarking score
has a significant effect on the Life Sciences score that was obtained in section B.
Therefore, due to the evidence provided, these results support the hypothesis as
the IEB benchmarking score in Mathematics has a significant effect on the Life
Sciences score. Moreover, poor scores in Mathematics can be reflected as poor
scores in Life Sciences questions that are based on mathematical skills.

58
4.4.2. Data related to the research based on scholar evaluation test
questions
4.4.2.1. Fundamental research questions related to scholar evaluation tests
In order to address the first research question (What are the consequences of bad
mathematical skills on the performance of Grade 10 Life Sciences learners at a
co-educational school in Welkom, Free State Province, with specific emphasis on
problems related to the use of microscopes and determining relative size, and
graphing skills?), the aim of the data analysis was to obtain p values, as well as
the Pearson Correlation Coefficient with the use of quantitative models. The
scores that were retrieved for Section A (Life Sciences theoretical knowledge) of
the test and Section B (Life Sciences questions with mathematical skills required),
showed a significant mean difference in the scores (p <0.0001). When correlating
the Grade 9 Mathematics final score with the score of Section B of Test 1 and Test
2, the Pearson Correlation Coefficient was 0.61200, and 0.56406 respectively.
The positive correlation between the scores was also reflected in the p value of
0.0009 which indicated that the correlation was significant. This implies that a low
score in Mathematics is a fairly justifiable indicator of low academic performance
in Life Sciences questions that are based on mathematical skills, but this evidence
does not imply causality.
The scores obtained in the IEB benchmarking test in Mathematics were also
correlated to the Grade 9 final Mathematics score, and the scores in section B of
Test 1, and Test 2. The Pearson Correlation Coefficients recorded were r =
0.82537, r = 0.74335, and r = 0.62049 respectively, thus indicating a strong
positive correlation between the scores. The p values for the analysis showed p
<0.0001 which indicated that the correlation between the scores was significant.
This means that a lower academic grade is a reasonably good predictor of weak
academic achievement in mathematical skills-based Life Sciences problems
however, it does not imply causation. Regression analysis using the Pearson
Correlation Coefficient of determination (r²) was also applied to the Grade 9
Mathematics scores and the scores obtained in Section B of Test 1, and Test 2.
The r2 values of 0.3758 and r2 = 0.3187, illustrate a strong association between
0.0009 and 0.027 grades, and p values, suggesting that the Life Sciences score is

59
substantially influenced by the Mathematics score. Although the scores show that
poor educational achievement in Mathematics is a reasonably good predictor of
academic achievement based on the mathematical abilities in Life Sciences
problems, it does not indicate causation.
60
CHAPTER 5: CONCLUSIONS, IMPLICATIONS AND FUTURE RESEARCH
5.1. Introduction
In order to test the hypothesis of this research study (Poor academic performance
in mathematical skills among Grade 10 Life Sciences learners throughout the
selected study group, has a negative effect on the academic achievement in Life
Sciences with particular reference to areas concerning microscope use in order to
determine relative size as well as in graphing skill), a quantitative methodological
approach was adopted. Results of the written test scores were analysed
statistically to determine whether or not there was a correlation between
Mathematical skills and the performance of Grade 10 Life Sciences learners
concerning microscope usage and graphing skills.
5.2. Realising the research objectives
The objective of this study was to investigate the relationship between poor
mathematical skills and Grade 10 learners’ performance in certain concepts in the
field of Life Sciences, with specific focus on microscope usage and graphing skills.
5.3. Overview of the study
Aligning with the aims of this study (To determine if grade 10 life sciences
learners perform poorly in assessment on microscope usage and graphing due to
poor maths skills), a test-retest, and previous mathematics test scores were used
in order to quantify the levels of performance amongst Grade 10 Life Sciences
learners in Mathematics, and Life Sciences test questions based on mathematical
skills. Overall, the Life Sciences learners displayed notably poor mathematical
skills.
The learners struggled to answer elementary, mathematically based, Grade 10
level Life Sciences questions. A low score in Mathematics is a relatively good
indicator of poor academic performance in Grade 10 Life Sciences questions, with
reference to microscope work and graphing that are based on basic mathematical
61
skills. The confirmation of the ‘idea’ regarding a lack of successful fundamental
mathematical skills and the application of these skills to Life Sciences was
confirmed by this study. The inability of learners to construct basic graphs,
calculate measurements according to scale and to manipulate simple equations to
determine the size of objects, was evident from the poor results that were
presented in this study. Since a well-developed mathematical foundation is
essential for success in the FET phase of the Life Sciences curriculum, where up
to 40% of the marks in Life Sciences tests are based on the ability to integrate
mathematical concepts in real life scenarios, the findings were alarming. This
evidence suggests that the implications for the future of Life Sciences in general in
South Africa, may be dire.
Finally, the extent to which the fundamental mathematical skills of measuring and
graphing are mastered in Grade 7 to Grade 9 is concerning, and there may be
value in researching this aspect further. The positive correlation between Grade 9
mathematics scores and the Life Sciences questions based on mathematical
skills, confirmed that fundamental mathematical skills did play a role in the
performance of learners in Life Sciences.
5.4. Recommendations
Simply identifying the fact that Life Sciences learners perform poorly in questions
that are based on fundamental mathematical skills is insufficient. The results of
this study highlighted problem areas that may have implications for the teaching of
Mathematics and Natural Sciences at secondary level, including Life Sciences at
the FET level. Therefore, with the results of this study in mind, the following
recommendations are made for future research, and for the possible improvement
of learners’ skills in the application of mathematical knowledge in Life Sciences.
The first recommendation concerns the awareness of teachers regarding the
mathematical skill level of learners. Teachers in Life Sciences must become aware
of the problem that exists with regard to the fundamental mathematical skills of
learners in Grade 10. Being knowledgeable of learners’ inability to use graphs and
measuring skills at the required level, means that thorough instruction can be
given on these aspects during Life Sciences. Concerning measuring, calculating
62
and graphing skills, it is recommended that learners of Grade 7 to Grade 9
Mathematics should spend more time learning how to work with simple scale
diagrams, learn how to calculate simple equations, and construct, and interpret
various types of graphs. This will enable them to better understand various
concepts and apply them to questions in other subjects. In addition to this,
learners who choose Life Sciences as a Grade 10 subject for the FET phase
should be made aware of the fact that 40% of the testing is based on fundamental
mathematical skills. It is recommended that a basic Grade 9 mathematics score
should be set as a minimum entry requirement for Life Sciences in Grade 10.
Teachers in Life Sciences and Mathematics should compile a curriculum or
learning programme that is based on the content from both Life Sciences and
Mathematics. This could prevent subjects from becoming isolated, because of a
lack of integration of fundamental skills across subject boundaries. In essence,
there should be more extensive teaching collaboration between Mathematics and
Life Sciences teachers in the lower grades. This should take the form of
scaffolding in Mathematical learning as well as in the application of Mathematics in
Life Sciences.
The professional development of teachers should take place in order to connect
the disciplines of Life Sciences and Mathematics across school levels. Life
Science learners in Grade 10 should be encouraged to view Mathematics as a
foundation and fundamental requirement for Life Sciences. Such learners should
know that Mathematics forms the foundation for a large proportion of the Life
Sciences testing and questioning curriculum. In light of this, it is recommended
that basic Mathematics tutorials should be given to learners who have poor
mathematical skills, in order for them to achieve satisfactory scores in the subject
of Life Sciences. Moreover, the gap between the skills that are required in Grade
10 and the fundamental mathematical skills that have been acquired at the end of
Grad 9 should be bridged, so that learners are able to master the necessary skills
by the end of Grade 9. Remaining with the same vein, learners in Grades 7 to 9
should be given more tasks in Natural Science that require the application of
mathematics skills, regardless of the potentially challenging nature of the tasks.
Additionally, a programme should be developed that prepares learners in Natural
by rote, to the understanding of concepts that can be applied in many disciplines.
63
The above recommendations were made, because it may be possible that Grade
9 learners are educated in more difficult facets of Mathematics in order to pass the
grade, and that fundamental mathematical skills that are applied across many
subjects, are neglected. It is regrettably assumed that learners were taught these
concepts, or are able to perform tasks that require these skills, because they are
seen as being elementary. Likewise there is a possibility that Life Sciences
teachers presume that the fundamental mathematical skills required in Grades 7
to 9 mathematics have been mastered by learners. It is furthermore recommended
that more time should be allocated to explaining and possibly re-teaching these
skills to Grade 10 learners.
5.4.1. Suggestions for further studies
Apart from the recommendations that were discussed in the previous section, the
following suggestions for future studies may shed more light on the nature of the
problem. Future research studies can focus on the effects of mathematical
performance in Life Sciences by Grade 10 learners on a general scale, and
broaden the scope of the study so it does not only include topics such as
microscopy and graphing skills. Additionally, the effect of mathematical
performance in Life Sciences learners in Grades 11 and 12 will also be interesting
areas to explore. Another suggestion for future research endeavours, would be to
explore the extent in which mathematics is taught in Grade 7 and Grade 9,
concentrating on the application of skills in other disciplines such as Life Sciences.
Moreover, researchers may also focus on the amount of attention that is given to
the fundamental skills of measurement, scale and graphing on primary, and
secondary school level. These skills form the crux of the teaching of mathematics
and can be applied in any subject. The focus of future research could explore how
learners understand the aforementioned concepts and apply them to Life
Sciences, and other fields of study. Other suggestions for future research studies
include an exploration into teacher development regarding the integration of
Mathematics and Life Sciences curriculums, which could assist the development
of the skills of learners in these two subjects. In essence, the development of a
curriculum that integrates the teaching of Mathematics and Life Sciences mutually.
Lastly, the influence of gender in explaining mathematical skills and their
64
application in Life Sciences questions which require mathematical skills, may be a
field of research that could be studied.
5.5. Contributions to knowledge
Although research has been conducted at tertiary level on the effects of
mathematical skills in the Biological sciences, the researcher suggests that this
factor has been neglected on a school level, due to the fact that subjects are still
traditionally viewed as distinct entities. The evidence that was presented and
discussed in this study, illustrated that Mathematical scores do have an effect on
Life Sciences scores in questions that require mathematical skills.
The results of this research study hope to contribute to the body of knowledge that
currently exists in the field of Life Sciences, and Mathematics with regards to
teaching practices at school level; and this contribution may stimulate more
integration between the subjects. In addition, it is hoped that learners can improve
their Life Sciences scores considerably by developing the essential mathematical
skills that are required in Life Sciences; and thereby further improving these skills
from Grade 10 to Grade 12. To summarise, Life Sciences learners in Grade 10
need assistance to develop adequate skills in basic Mathematics in order to
interpret, and complete Life Sciences questions that are based on mathematical
skills.
5.6. Conclusion
In conclusion, it has been observed historically that Grade 10 learners struggled
with applying mathematical skills when answering questions in Life Sciences.
Furthermore, learners who study this field of science in Grades 11 and 12 perform
poorly in questions that require them to answer using basic mathematical skills.
The hypothesis of this study stated that if the mathematical skills of Life Sciences
learners could be significantly improved in certain areas in the field of Life
Sciences, then the overall scores of learners across the FET phase would also
improve significantly. Lastly, this study hoped to act as a starting point to show
that poor mathematical skills has an effect on the performance of learners in Life
Sciences. It is hoped that further research can be undertaken in order to address

65
the problem of poor mathematical skills in Grade 10 learners, as well as in higher
grades.
66
REFERENCES CITED AND CONSULTED FOR THIS RESEARCH
ACER. (2019, June 20). ACER. Retrieved from ACER Corporation Web Site:
https://www.acer.org/au/assessment/school-assessments
Adamec, B. (2016). Infusing More Math into the Biology Classroom. Teaching
Microbiology
AsiaSociety. (2018, July). Understanding the World Through Math. Retrieved from
Asia Society.Org. Centre for Global Education:
http://asiasociety.org/education
Bansilal, S. (2017). The Difficulty level of a national assessment of Grade 9
mathematics: The case of five schools. South African Journal of Childhood
Education
Bergevin, C. (2010). Integrating Mathematics into Life Science Education. Arizona:
ASMCUE.
Botha, T. (2008). Senior Secondary Life Sciences Grade 10 Learner's Book .
Cape Town: Kagiso Education.
Bowie, M. (2008). Life Sciences for Grade 10 Learners' Book OBE for FET. Cape
Town: Nasou.
Bowman, K., & Husbands, J. (2011). Dual Use Issues in the Life Sciences,
Challenges and Opportunities for Education in an Emerging Area of
Scientifc Responsibility. CBE Life Sciences Education, 3-7.
Cohen, J. (2004). Mathematics is Biology's next microscope, only better: Biology
is Mathematics' next physics, only better. Public Library of Science :
Biology, 80-94.
Dawson, C. (2008). Spot On Life Sciences Learners' book Grade 10. Sandton:
Heinemann.
de Wet, P. (2017, July 14). Why do learners struggle with maths in grades 10 - 12.
Retrieved from MacMillan Education South Africa:
https://www.macmillan.co.za/news/macmillan-news/1/why-do-learners-
struggle-with-maths-in-grades-1012/93
Dornette, P. (2018, March 15). Improving Students' Maths Skills for Science
Class. Retrieved from Carolina: http://www.carolina.com
Education, D. o. (2011). Curriculum Assessment Policy statement (CAPS) Grade
7 - 9 Mathematics. Pretoria: Government Printing Works.
67
Education, D. o. (2011, April). National Curriculum Statement (NCS) Further
Education and Training (FET) phase Grade 10 - 12 Life Sciences. Pretoria:
Government Printing works. Retrieved from Further Education and Training
(FET) Phase: http://www.education.gov
Essays, U. (2017, June 12). Education in South Africa : Mathematics and
Scientific Performance. Retrieved from UK Essays:
www.ukessays.com/essays/education/poor-performance-in-maths-and-
science-education-education-essay.php?vref=1
Fellabaum, J. (2011). Mathematics in Life Sciences: Developing a Best Practice.
ASQ Advancing the STEM Agenda in Education, the Workplace and
Society, 19-23.
Furner, J., & Kumar, D. (2007). The Mathematics and Science Integration
Argument : A stand for Teacher Education. Eurasia Journal of Mathematics,
Science & Technology Eduation, 185-189.
Galloway, C. (2010). Vygotsky's Constructivism. In M. Orey, Emerging
Perspective on Learning, Teaching and Technology (pp. 48-49). Georgia:
University of Georgia, USA.
Gerber, J. N. (2017). National Assessments to be replaced - Motshekga. Cape
Town: News24.
Gross, L., Brent, R., & Hoy, R. (2004, July 01). The Interface of mathematics and
biology. Cell Biology Education, pp. 85-92.
Hester, S. (2014). Integrating Quantitative Thinking into an Introductory Biology
Course Improves Students' Mathematical Reasoning in Biological Contexts.
CBE - Life Sciences Education, 54-64.
Hwang, A.-S. (1996). Positivist and Constructivist persuasions in instructional
development. Instructional Science, 343-356.
Jungck, J. (2012). Mathematics make Microbes Beautiful, Beneficial, Bountiful.
Advances in Applied Microbiology, 37-80.
Karsai, I., & Kampis, G. (2010, September 01). The Crossroads between Biology
and Mathatics : The Scientific Method as the Basics of Scientifc Literacy.
BioScience, pp. 632-638.
Leonard, B. (2007). Integrative Learning as a Developmental Process: A grounded
theory of College Students Experiences in Integrative studies. DRUM -
University of Maryland, 24-25.
Leonard, J. B. (2012). Integrative learning - A Grounded Theory. Issues in
Integrative Studies, 48-74.
68
MacMillan. (2018). Why do Learners struggle with maths in grade 10 - 12?
Midrand: MacMillan.
Madlung, A., Bermer, M., Himelbau, E., & Tullis, A. (2011). A study asssessing the
Potential of Negative Effects in Interdisciplinary Math - Biology Instruction.
CBE - Life Sciences Education, 43-54.
Marder, M. (2017). A Problem with STEM. CBE - Life Sciences Education, 2 - 9.
McLeod, S. (2018). Lev Vygotsky- Developmental Psychology. Retrieved from
Simply Psychology: https://www.simplypsychology.org/vygotsky.html
Mwakapenda, W., & Dhlamini, J. (2010, July 30). Integrating Mathematics and
Other learning Areas : Emerging Tensions from a Study involving Four
Classroom teachers. Pythagorus, pp. 22-29.
Osborne, J. (2007). Science Education for the Twenty First Century. Eurasia
Journal of Mathematics, Science & Technology Education, 173-184.
Ozgun-Koca, S. (2001). The Graphing Skills of Students in Mathematics and
Science Education. ERIC Digest for Science Mathematics and
Environmental Education Columbus, 16-20.
Padayachee, K. (2016). Guidelines for writing a Research Proposal. Pretoria:
UNISA.
Peschl, M. (2001). Constructivism, Cognition, and Science - An investigation of its
Links and Possible Shortcomings. Foundations of Science, 125-161.
Preethlall, P. (2010). Study & Master Study Guide 10 Life Sciences 2nd Ed. Cape
Town: Cambridge University Press.
Quinnel, R., Thompson, R., & LeBard, R. (2012). Academic numeracy in Life
Science learning : Challenging perceptions. The Higher Education
Academy - STEM, 22-30.
Ross, K. (2017, February 27). Maths Skills in GCSE Biology. Retrieved from My
GCSE Science: https://www.my-gcsescience.com/maths-skills-gcse-
biology/
Simon, M. (2011). Assumptions, Limitations and Delimitations. Retrieved from
Dissertation success: http://www.dissertationrecipes.com
Skaalvik, S. (2006). Self-concept and self-efficacy in mathematics: relation with
mathematics motivation and achievement. ICLS '06 Proceedings in the 7th
international conference on Learning sciences (pp. 709-715). Indiana:
Bloomington.
69
Sorgo, A. (2010). Connecting Biology and Mathematics : First prepare the
Teachers. CBE Life Sciences Education, 196-200.
South African Government. (2013, October 29). Parliamentary Monitoring Group.
Retrieved from Government Quality Assurance:
https://pmg.org.za/committee-meeting/16677/
Suurtaam, C. (2011). Developing Mathematics Classroom Practices: The role of
coherence and collaboration. Journal of Education Research, 335 - 359.
Suurtamm, C. (2011). Developing Mathematics classroom practices : The role of
coherence and collaboration. Journal of Education Research, Vol., 335-
359.
Tariq, V. (2004). Numeracy, mathematical literacy and the life sciences. MSOR
Conections, 25-29.
Tariq, V., Stevenson, J., & Roper, T. (2005). Maths for Biosciences:towards
developing an innovative e-learning resorce for post GCSE students.
University of Central Lancashire Connections, 39-43.
Tikhonov, M. (2016). Opinion: Mircobiology Needs More Math. The Scientist
Magazine, 50-53.
Tiwari, M. (2012). A Mathematical applications into the cells. Journal of Natural
Science, Biology and Medicine, 19-23.
UNISA. (2016). Policy for Reseach Ethics. Pretoria: UNISA.
van Staden, S. &. (2017, July 14). Differences in the quality of school-based
assessment: Evidence in Grade 9 mathematics achievement. Pythagorus,
38(1), pp. 67-77.
Van Tonder, A. (2010, October). Unisa archives. Retrieved from UNISA.
Van Wylen, D., Abdella, R., Dickinson, S., Engelbrecht, J., & Vandiver, R. (2017).
Interdisciplinarty: The Right people, A supportive place, and a Program
emerges. CBE - Life Sciences Education, 13-21.
70
APPENDIX A
LIFE SCIENCES ASSESSMENT – GRADE 10
DATE : …………………………………………………
TIME : 2 HOURS
MARKS : 100
NAME :
…………………………………………………………………………………………
Instructions :
1. Answer all the questions in the spaces provided on this question paper.
2. This assessment consists of two sections, section A and section B. Answer
both sections to the best of your ability.
3. Show all calculations.
4. Use of a scientific calculator is permitted.
5. Write neatly and legibly, and use a ruler for straight lines.
MARKS SECTION A /50
MARKS SECTION B/50
TOTAL MARKS /100
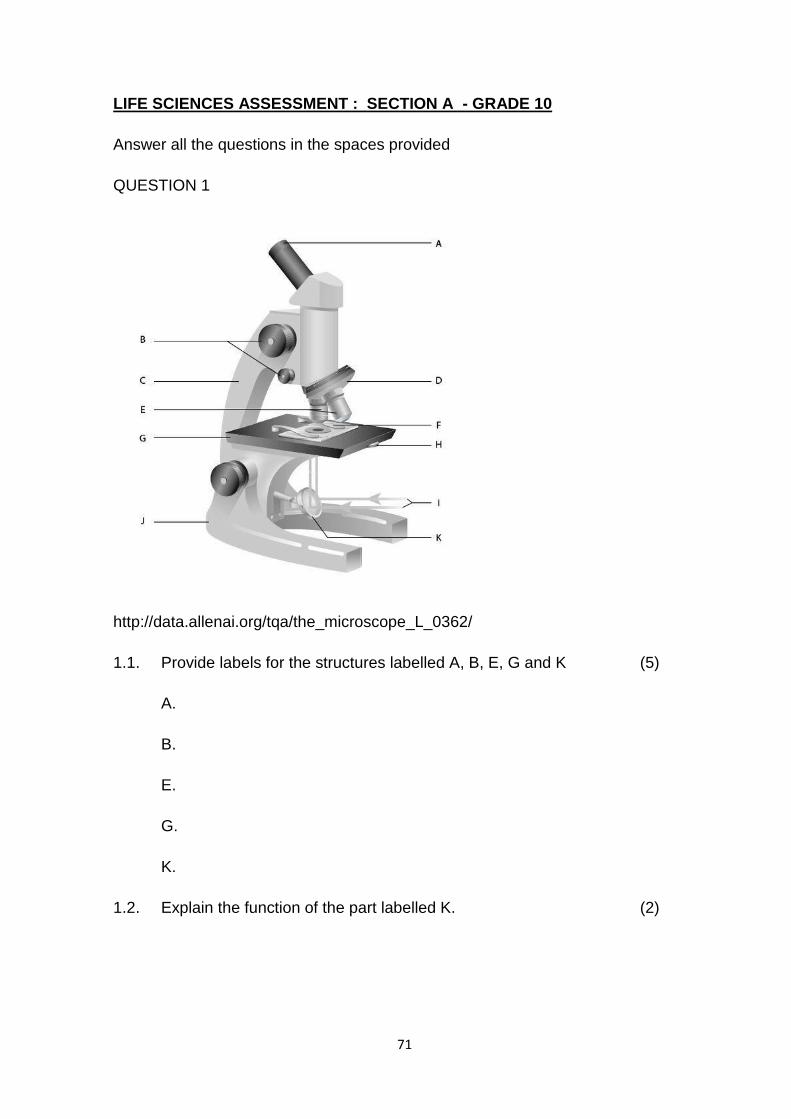
71
LIFE SCIENCES ASSESSMENT : SECTION A - GRADE 10
Answer all the questions in the spaces provided
QUESTION 1
http://data.allenai.org/tqa/the_microscope_L_0362/
1.1. Provide labels for the structures labelled A, B, E, G and K (5)
A.
B.
E.
G.
K.
1.2. Explain the function of the part labelled K. (2)
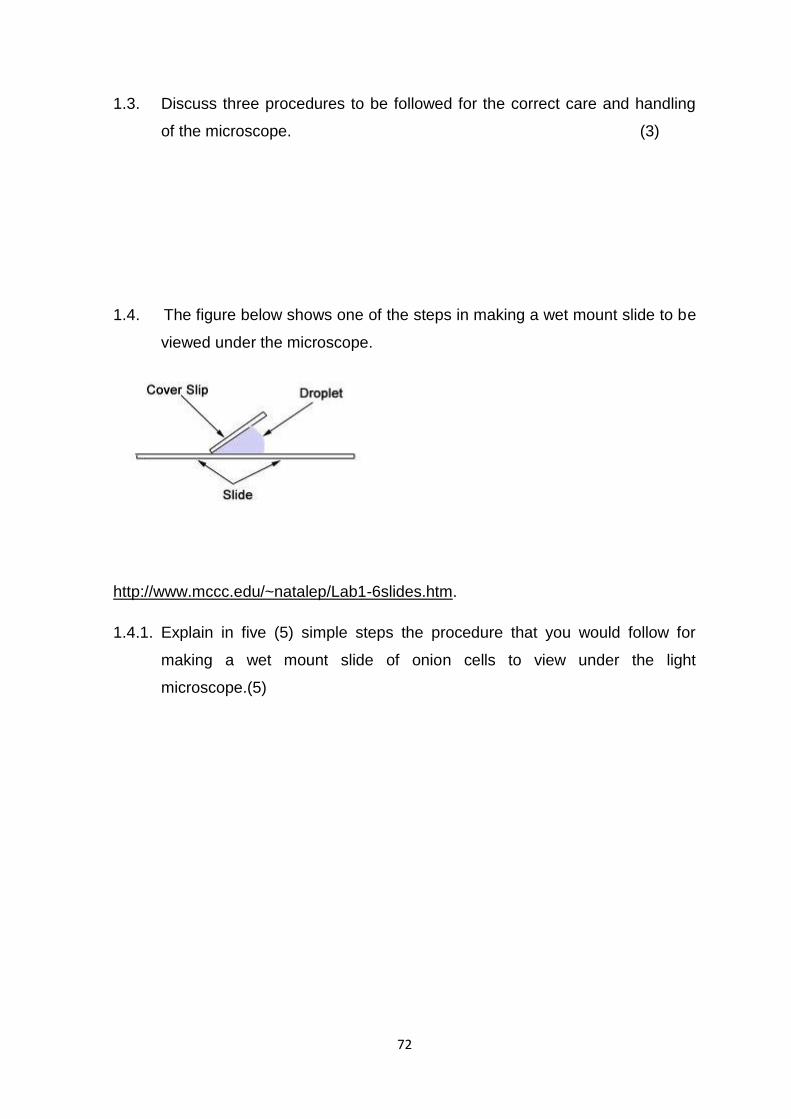
72
1.3. Discuss three procedures to be followed for the correct care and handling
of the microscope. (3)
1.4. The figure below shows one of the steps in making a wet mount slide to be
viewed under the microscope.
http://www.mccc.edu/~natalep/Lab1-6slides.htm.
1.4.1. Explain in five (5) simple steps the procedure that you would follow for
making a wet mount slide of onion cells to view under the light
microscope.(5)
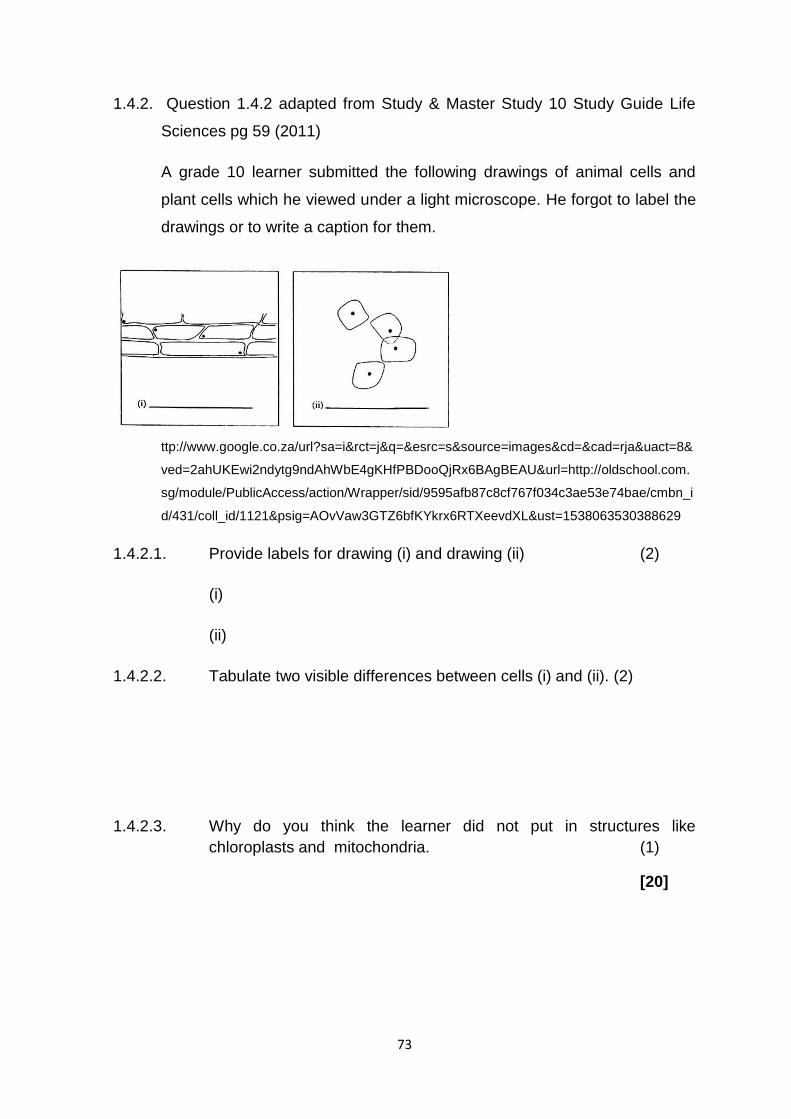
73
1.4.2. Question 1.4.2 adapted from Study & Master Study 10 Study Guide Life
Sciences pg 59 (2011)
A grade 10 learner submitted the following drawings of animal cells and
plant cells which he viewed under a light microscope. He forgot to label the
drawings or to write a caption for them.
ttp://www.google.co.za/url?sa=i&rct=j&q=&esrc=s&source=images&cd=&cad=rja&uact=8&
ved=2ahUKEwi2ndytg9ndAhWbE4gKHfPBDooQjRx6BAgBEAU&url=http://oldschool.com.
sg/module/PublicAccess/action/Wrapper/sid/9595afb87c8cf767f034c3ae53e74bae/cmbn_i
d/431/coll_id/1121&psig=AOvVaw3GTZ6bfKYkrx6RTXeevdXL&ust=1538063530388629
1.4.2.1. Provide labels for drawing (i) and drawing (ii) (2)
(i)
(ii)
1.4.2.2. Tabulate two visible differences between cells (i) and (ii). (2)
1.4.2.3. Why do you think the learner did not put in structures like
chloroplasts and mitochondria. (1)
[20]
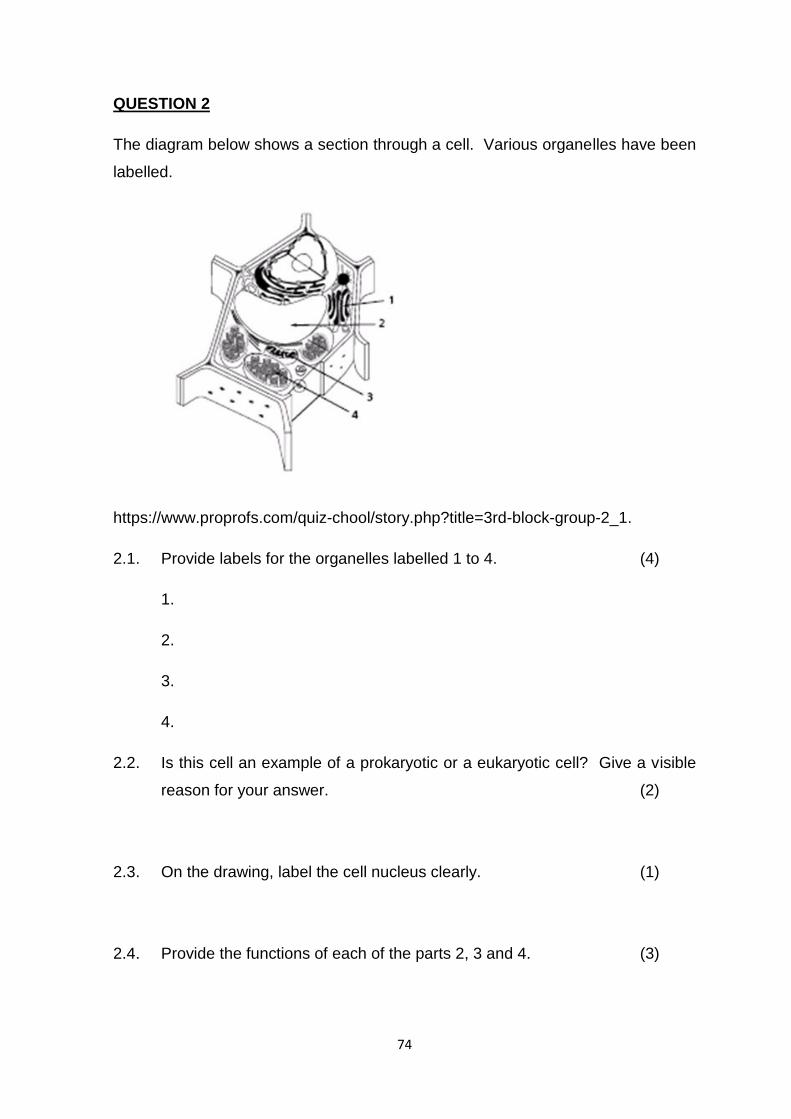
74
QUESTION 2
The diagram below shows a section through a cell. Various organelles have been
labelled.
https://www.proprofs.com/quiz-chool/story.php?title=3rd-block-group-2_1.
2.1. Provide labels for the organelles labelled 1 to 4. (4)
1.
2.
3.
4.
2.2. Is this cell an example of a prokaryotic or a eukaryotic cell? Give a visible
reason for your answer. (2)
2.3. On the drawing, label the cell nucleus clearly. (1)
2.4. Provide the functions of each of the parts 2, 3 and 4. (3)
75
2.
3.
4. [10]
QUESTION 3
Question 3 adapted from Senior Secondary Life Sciences Grade 10 Learner’s
Book pg 150 (2008)
Read the extract below and answer the questions which follow:
“CANCER : WHEN CELL DIVISION GOES WRONG
In humans and animals there is a control system to stop cells from dividing too
often. Cell division takes one or two hours, and then cells normally grow for
many hours. When they reach a certain size, the cells start to divide.
If this control system breaks down in a part of the body, the cells will divide over
and over again in an uncontrolled way. This results in the formation of a
mass of cells that have no function. This mass of cells is called a tumour.
A tumour can be either benign or malignant. A benign tumour is enclosed
in a capsule, and it stays in one place without harming the surrounding
organs. In a malignant tumour the cells are spread around the body by the
circulating blood, forming new tumours in other parts of the body. A tumour
that spreads through the body is called a carcinoma (cancer).
Cancer cells tend to affect normal cells depriving them of food. There are many
kinds of cancers that can form in different parts of the body. For example,
cancers can grow in the brain, mouth, throat, pancreas, liver, lungs, colon,
breasts and prostate gland.
There may be various reasons why cells become cancerous. Carcinogens are
substances that can trigger cells to start dividing in an uncontrolled way.
Contact with carcinogens should be avoided.
The best treatment for cancer is early diagnosis, followed by surgical removal of
the tumour. Tumours can also be successfully treated with anti-cancer
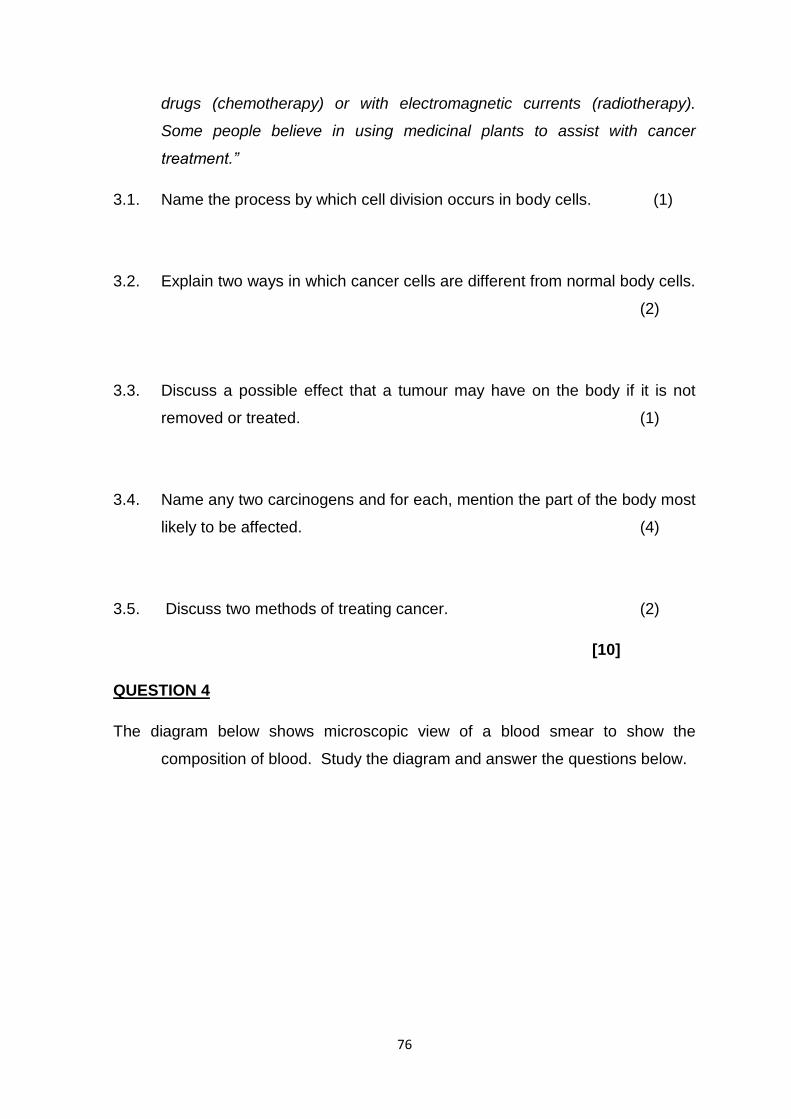
76
drugs (chemotherapy) or with electromagnetic currents (radiotherapy).
Some people believe in using medicinal plants to assist with cancer
treatment.”
3.1. Name the process by which cell division occurs in body cells. (1)
3.2. Explain two ways in which cancer cells are different from normal body cells.
(2)
3.3. Discuss a possible effect that a tumour may have on the body if it is not
removed or treated. (1)
3.4. Name any two carcinogens and for each, mention the part of the body most
likely to be affected. (4)
3.5. Discuss two methods of treating cancer. (2)
[10]
QUESTION 4
The diagram below shows microscopic view of a blood smear to show the
composition of blood. Study the diagram and answer the questions below.
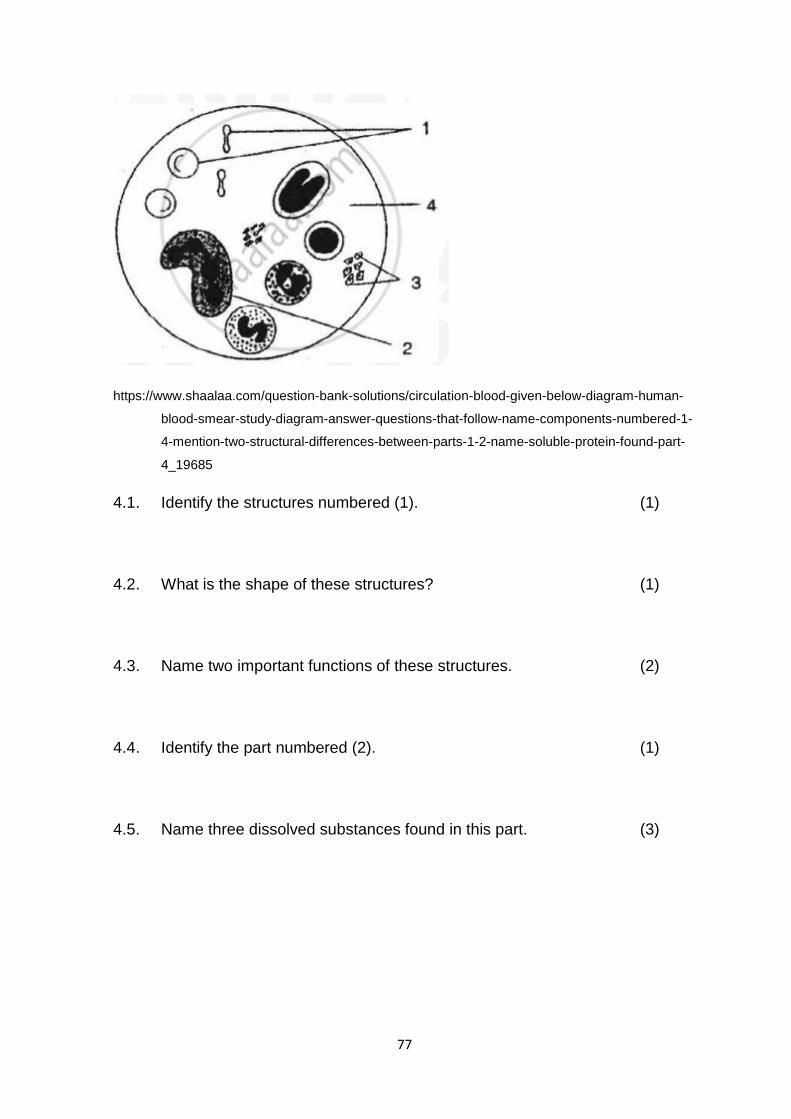
77
https://www.shaalaa.com/question-bank-solutions/circulation-blood-given-below-diagram-human-
blood-smear-study-diagram-answer-questions-that-follow-name-components-numbered-1-
4-mention-two-structural-differences-between-parts-1-2-name-soluble-protein-found-part-
4_19685
4.1. Identify the structures numbered (1). (1)
4.2. What is the shape of these structures? (1)
4.3. Name two important functions of these structures. (2)
4.4. Identify the part numbered (2). (1)
4.5. Name three dissolved substances found in this part. (3)
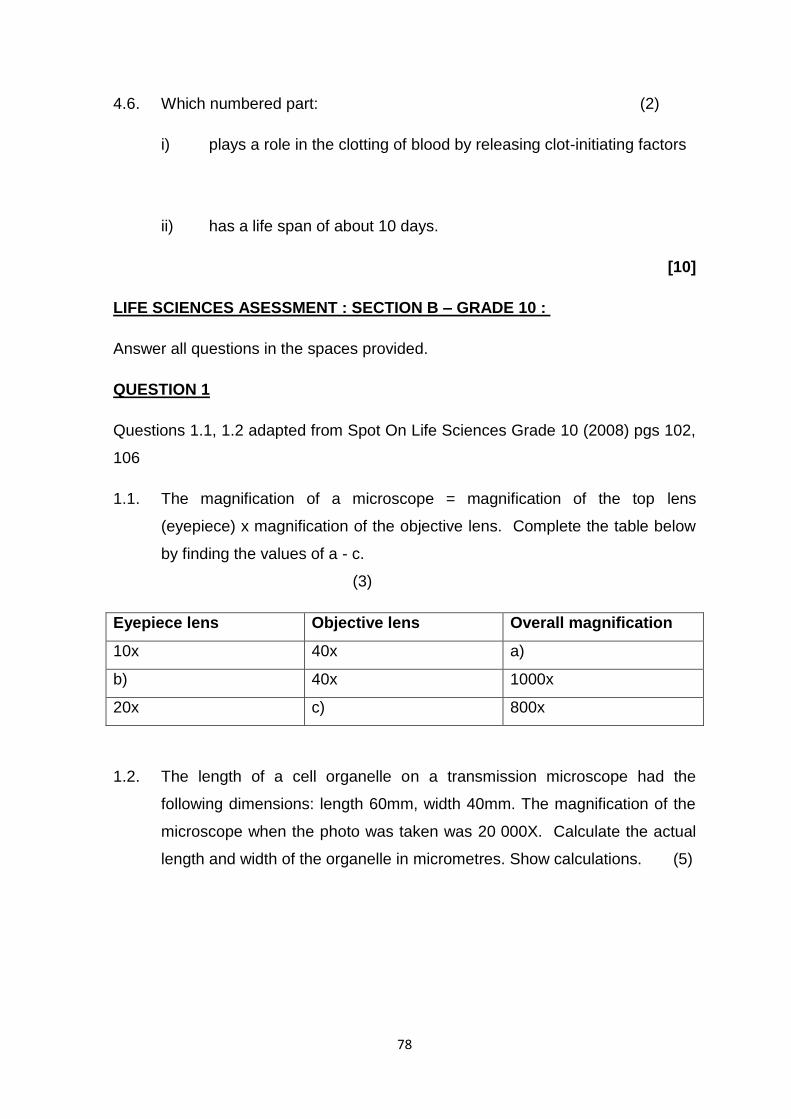
78
4.6. Which numbered part: (2)
i) plays a role in the clotting of blood by releasing clot-initiating factors
ii) has a life span of about 10 days.
[10]
LIFE SCIENCES ASESSMENT : SECTION B – GRADE 10 :
Answer all questions in the spaces provided.
QUESTION 1
Questions 1.1, 1.2 adapted from Spot On Life Sciences Grade 10 (2008) pgs 102,
106
1.1. The magnification of a microscope = magnification of the top lens
(eyepiece) x magnification of the objective lens. Complete the table below
by finding the values of a - c.
(3)
Eyepiece lens Objective lens Overall magnification
10x 40x a)
b) 40x 1000x
20x c) 800x
1.2. The length of a cell organelle on a transmission microscope had the
following dimensions: length 60mm, width 40mm. The magnification of the
microscope when the photo was taken was 20 000X. Calculate the actual
length and width of the organelle in micrometres. Show calculations. (5)
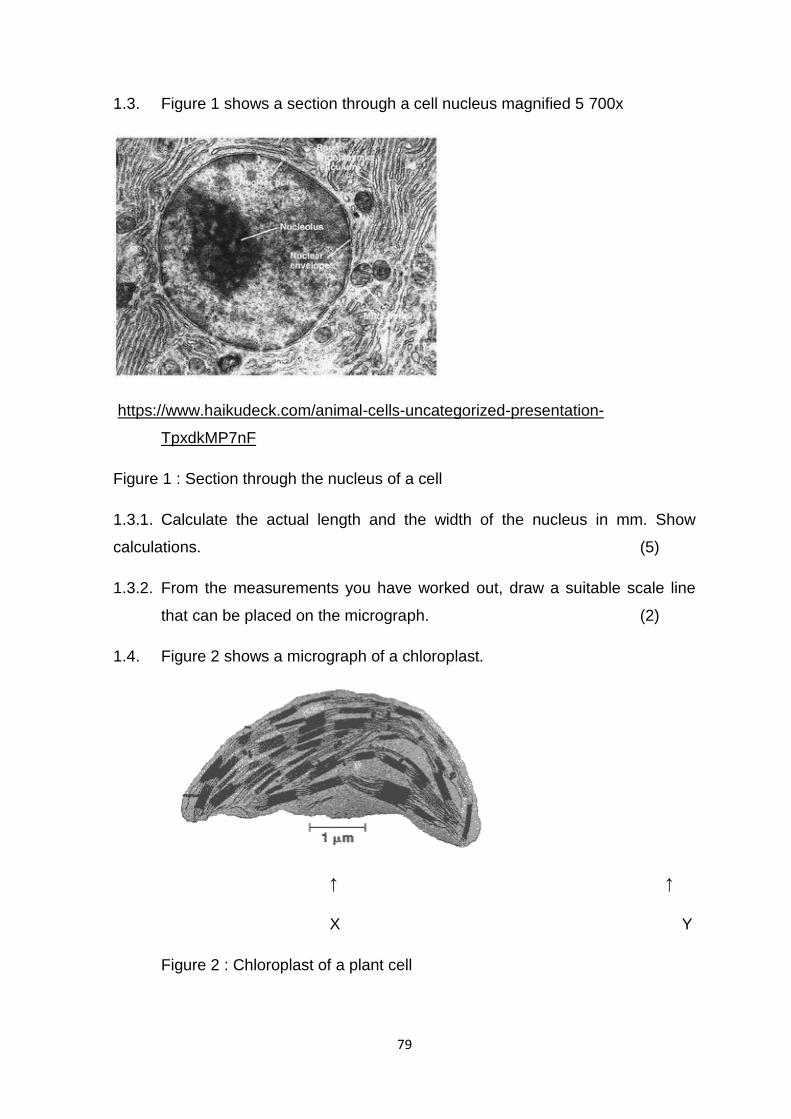
79
1.3. Figure 1 shows a section through a cell nucleus magnified 5 700x
https://www.haikudeck.com/animal-cells-uncategorized-presentation-
TpxdkMP7nF
Figure 1 : Section through the nucleus of a cell
1.3.1. Calculate the actual length and the width of the nucleus in mm. Show
calculations. (5)
1.3.2. From the measurements you have worked out, draw a suitable scale line
that can be placed on the micrograph. (2)
1.4. Figure 2 shows a micrograph of a chloroplast.
↑ ↑
X Y
Figure 2 : Chloroplast of a plant cell
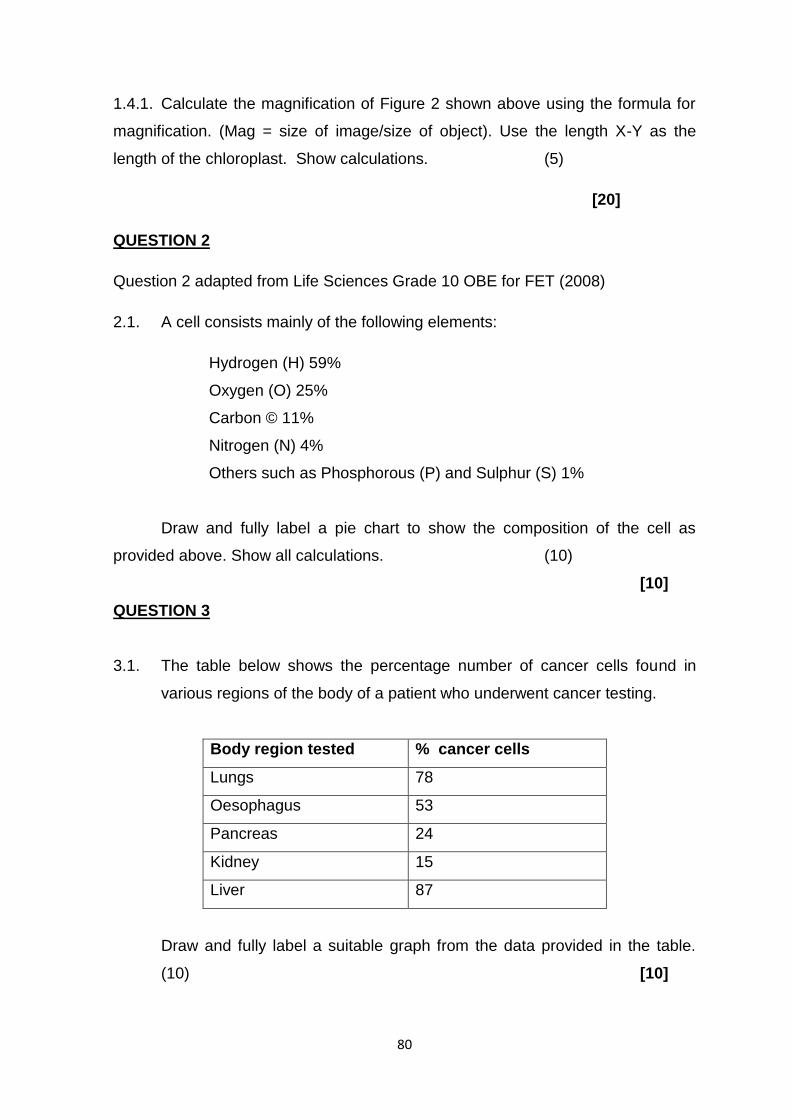
80
1.4.1. Calculate the magnification of Figure 2 shown above using the formula for
magnification. (Mag = size of image/size of object). Use the length X-Y as the
length of the chloroplast. Show calculations. (5)
[20]
QUESTION 2
Question 2 adapted from Life Sciences Grade 10 OBE for FET (2008)
2.1. A cell consists mainly of the following elements:
Hydrogen (H) 59%
Oxygen (O) 25%
Carbon © 11%
Nitrogen (N) 4%
Others such as Phosphorous (P) and Sulphur (S) 1%
Draw and fully label a pie chart to show the composition of the cell as
provided above. Show all calculations. (10)
[10]
QUESTION 3
3.1. The table below shows the percentage number of cancer cells found in
various regions of the body of a patient who underwent cancer testing.
Body region tested % cancer cells
Lungs 78
Oesophagus 53
Pancreas 24
Kidney 15
Liver 87
Draw and fully label a suitable graph from the data provided in the table.
(10) [10]
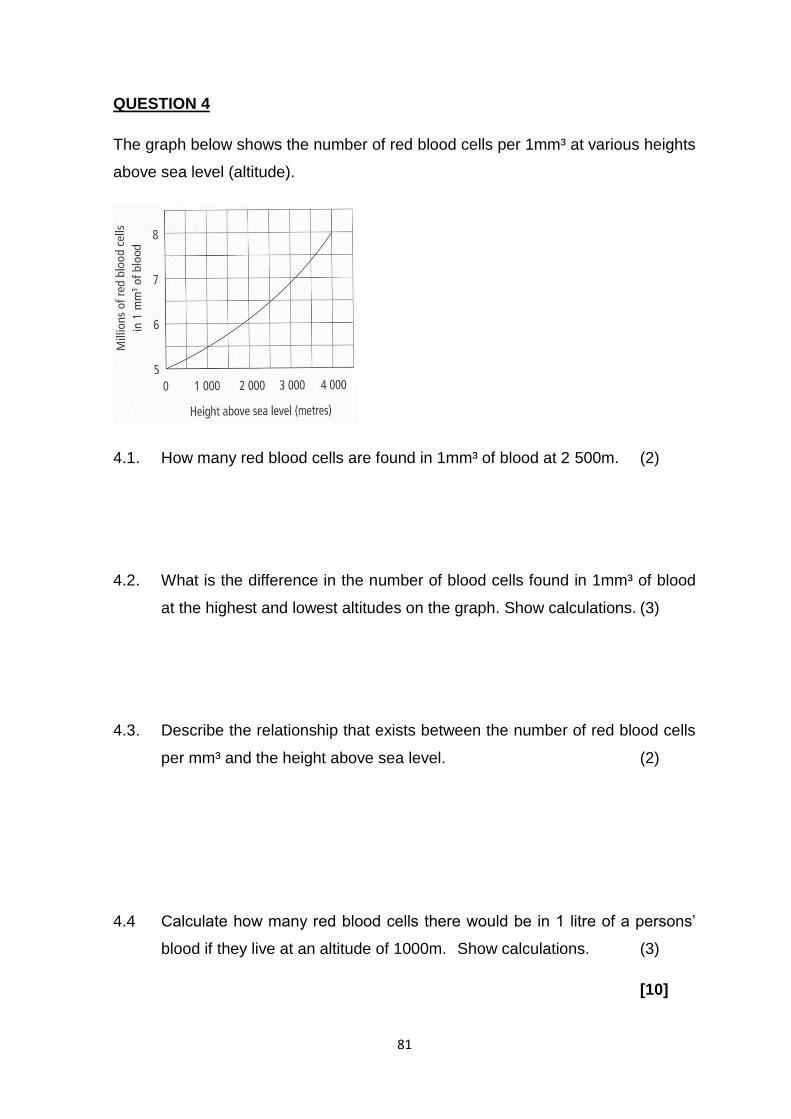
81
QUESTION 4
The graph below shows the number of red blood cells per 1mm³ at various heights
above sea level (altitude).
4.1. How many red blood cells are found in 1mm³ of blood at 2 500m. (2)
4.2. What is the difference in the number of blood cells found in 1mm³ of blood
at the highest and lowest altitudes on the graph. Show calculations. (3)
4.3. Describe the relationship that exists between the number of red blood cells
per mm³ and the height above sea level. (2)
4.4 Calculate how many red blood cells there would be in 1 litre of a persons’
blood if they live at an altitude of 1000m. Show calculations. (3)
[10]
82
APPENDIX B
PARTICIPANT INFORMATION SHEET
Ethics clearance reference number: 2018_CGS/ISTE+008
Research permission reference number (if applicable): N/S
12 March 2019
Title : THE EFFECTS OF POOR MATHEMATICAL SKILLS ON GRADE 10
LEARNERS’ PERFORMANCE IN CERTAIN CONCEPTS IN LIFE SCIENCES – A
CASE STUDY FOCUSSING SPECIFICALLY ON MICROSCOPE USAGE AND
GRAPHING SKILLS
Dear Prospective Participant
My name is Mandy de Vries and I am conducting research with Prof. H.I Atagana,
a professor in the Department of Mathematics, Science and Technology in
Education towards an MSc in Life Sciences Education at the University of South
Africa. We are inviting you to participate in a study entitled THE EFFECTS OF
POOR MATHEMATICAL SKILLS ON GRADE 10 LEARNERS’ PERFORMANCE
IN CERTAIN CONCEPTS IN LIFE SCIENCES – A CASE STUDY FOCUSSING
SPECIFICALLY ON MICROSCOPE USAGE AND GRAPHING SKILLS.
WHAT IS THE PURPOSE OF THE STUDY?
I am conducting this research to identify if performance in life sciences amongst
grade 10 learners in the areas of microscope usage and graphing, can be
improved with better integration and improved competencies in basic
mathematical skills. It is hoped that the results of the study will be able to make a
significant contribution to life sciences education, not only within the school where
this study is to be carried out, but also nationally. The study hopes to suggest
strategies amongst life sciences teachers and math teachers at school level in
83
order to integrate subject content so that learners may be able to have improved
performance in life sciences.
WHY AM I BEING INVITED TO PARTICIPATE?
This study will be conducted as a case study. There will be 30 – 40 participants.
The participants for this research will be all the grade 10 life sciences learners,
both boys and girls, in an independent secondary school in the town of Welkom in
the Free State province. The participants will be aged between 14 and 17 years
and will be English speaking. The language of learning, teaching and testing is
English. No sampling will take place as all the grade 10 life sciences learners in
the school will form the population of the study. These participants have been
selected as the researcher has identified, through situated experience, that grade
10 learners have difficulty in answering questions on microscope usage and
graphing that are based on mathematical skills.
WHAT IS THE NATURE OF MY PARTICIPATION IN THIS STUDY?
Participants will not be required to perform any activities outside of what is
required in the normal life sciences curriculum and school situation. The study
involves a written, two hour test that will be completed during the normal school
day under test conditions. The test date and any content that must be studied in
order to answer the test, will be given at least two weeks prior to the testing. A
retest will be done two weeks after the first test under the same conditions.
The test will comprise two sections. The first section will contain questions based
on the theoretical knowledge of the microscope and the skills pertaining to the use
of the microscope. The second section will contain questions relating to the
application of simple mathematical skills that are required when using the
microscope, as well as the skills of graphically presenting data in a life sciences
context. The questions in the test will be in accordance with the knowledge and
skills required by pupils at a grade 10 level according to the Curriculum and
Assessment Policy (CAPS) for the Further Education and Training Phase (FET)
for grade 10 life sciences.
84
CAN I WITHDRAW FROM THIS STUDY EVEN AFTER HAVING AGREED TO
PARTICIPATE?
Participating in this study is voluntary and you are under no obligation to consent
to participation. If you do decide to take part, you will be given this information
sheet to keep and be asked to sign a written consent form. You are free to
withdraw at any time and without giving a reason.
WHAT ARE THE POTENTIAL BENEFITS OF TAKING PART IN THIS STUDY?
This study is seen to be of significant benefit to the grade 10 life sciences learners,
as it has the potential to focus on improving the mathematical skills of grade 10 life
sciences learners in a focused way, which will have a directly positive impact on
their life sciences results.
ARE THEIR ANY NEGATIVE CONSEQUENCES FOR ME IF I PARTICIPATE IN
THE RESEARCH PROJECT?
This research is classified as a low risk research. The potential for harm is low.
There is the potential for minor inconvenience and discomfort. This is not in
excess of what would normally be experienced in the school testing situation.
WILL THE INFORMATION THAT I CONVEY TO THE RESEARCHER AND MY
IDENTITY BE KEPT CONFIDENTIAL?
You have the right to insist that your name will not be recorded anywhere and that
no one, apart from the researcher and identified members of the research team,
will know about your involvement in this research. Your answers scripts will be
given a code number or a pseudonym and you will be referred to in this way in the
data, any publications, or other research reporting methods such as conference
proceedings.
Records that identify you will be available only to people working on the study,
unless you give permission for other people to see the records.
85
A report of the study may be submitted for publication, but individual participants
will not be identifiable in such a report.
While every effort will be made by the researcher to ensure that you will not be
connected to the information that you share during the case study, I cannot
guarantee that other participants in the case study group will treat information
confidentially. I shall, however, encourage all participants to do so. For this reason
I advise you not to disclose personally sensitive information in the case study.
HOW WILL THE RESEARCHER(S) PROTECT THE SECURITY OF DATA?
Hard copies of your answers will be stored by the researcher for a minimum period
of five years in a locked cupboard at St Dominic’s College High School, Welkom.
Electronic information will be stored on a password protected computer. Future
use of the stored data will be subject to further Research Ethics Review and
approval if applicable. After the minimum period of time, hard copies will be
shredded and/or electronic copies will be permanently deleted from the hard drive
of the computer through the use of a relevant software programme.
WILL I RECEIVE PAYMENT OR ANY INCENTIVES FOR PARTICIPATING IN
THIS STUDY?
No payment or compensation will be given to participants.
HAS THE STUDY RECEIVED ETHICS APPROVAL
This study has received written approval from the Research Ethics Review
Committee of the Institute of Science and Technology Education and the
Research Permission Sub-committee of the Senate Research and Innovation and
Higher Degrees Committee (RPSC), UNISA. A copy of the approval letter can be
obtained from the researcher if you so wish.
86
HOW WILL I BE INFORMED OF THE FINDINGS/RESULTS OF THE
RESEARCH?
If you would like to be informed of the final research findings, please contact
Mandy de Vries on 057 352 3905 or [email protected] . The findings are
accessible for 12 months.
Should you require any further information or want to contact the researcher about
any aspect of this study, please contact Mandy de Vries on 057 352 3905 or
Should you have concerns about the way in which the research has been
conducted, you may contact Prof H.I. Harrison on 012-337-6129 or
[email protected]. The Ethics Review Committees (ERCs) within the Unisa
context are constituted by the Senate Research and Innovation and Higher
Degrees Committee of the University, and has been authorized to carry out ethical
review of research. You may contact Prof Padayachee at [email protected] if
you have any ethical concerns.
Thank you for taking time to read this information sheet and for participating in this
study.
Thank you.
Mandy de Vries
87
APPENDIX B2
PARENT INFORMATION SHEET
Ethics clearance reference number: 2018_CGS/ISTE+008
Research permission reference number (if applicable):
12 March 2019
Title : THE EFFECTS OF POOR MATHEMATICAL SKILLS ON GRADE 10
LEARNERS’ PERFORMANCE IN CERTAIN CONCEPTS IN LIFE SCIENCES – A
CASE STUDY FOCUSSING SPECIFICALLY ON MICROSCOPE USAGE AND
GRAPHING SKILLS
Dear Parent/Guardian of Prospective Participant
My name is Mandy de Vries and I am conducting research with Prof. H.I Atagana,
a professor in the Department of Mathematics, Science and Technology in
Education towards an MSc in Life Sciences Education at the University of South
Africa. We are inviting your child/ward to participate in a study entitled THE
EFFECTS OF POOR MATHEMATICAL SKILLS ON GRADE 10 LEARNERS’
PERFORMANCE IN CERTAIN CONCEPTS IN LIFE SCIENCES – A CASE
STUDY FOCUSSING SPECIFICALLY ON MICROSCOPE USAGE AND
GRAPHING SKILLS.
WHAT IS THE PURPOSE OF THE STUDY?
I am conducting this research to identify if performance in life sciences amongst
grade 10 learners in the areas of microscope usage and graphing, can be
improved with better integration and improved competencies in basic
mathematical skills. It is hoped that the results of the study will be able to make a
significant contribution to life sciences education, not only within the school where
88
this study is to be carried out, but also nationally. The study hopes to suggest
strategies amongst life sciences teachers and math teachers at school level in
order to integrate subject content so that learners may be able to have improved
performance in life sciences.
WHY IS MY CHILD BEING INVITED TO PARTICIPATE?
This study will be conducted as a case study. There will be 30 – 40 participants.
The participants for this research will be all the grade 10 life sciences learners,
both boys and girls, in a private independent secondary school in the town of
Welkom in the Free State province. The participants will be aged between 14 and
17 years and will be English speaking. The language of learning, teaching and
testing is English. No sampling will take place as all the grade 10 life sciences
learners in the school will form the population of the study. These participants
have been selected as the researcher has identified, through situated experience,
that grade 10 learners have difficulty in answering questions on microscope usage
and graphing that are based on mathematical skills.
WHAT IS THE NATURE OF MY CHILD/WARD’S PARTICIPATION IN THIS
STUDY?
Participants will not be required to perform any activities outside of what is
required in the normal life sciences curriculum and school situation. The study
involves a written, two hour test that will be completed during the normal school
day under test conditions. The test date and any content that must be studied in
order to answer the test, will be given at least two weeks prior to the testing. A
retest will be done two weeks after the first test under the same conditions.
The test will comprise two sections. The first section will contain questions based
on the theoretical knowledge of the microscope and the skills pertaining to the use
of the microscope. The second section will contain questions relating to the
application of simple mathematical skills that are required when using the
microscope, as well as the skills of graphically presenting data in a life sciences
context. The questions in the test will be in accordance with the knowledge and
89
skills required by pupils at a grade 10 level according to the Curriculum and
Assessment Policy (CAPS) for the Further Education and Training Phase (FET)
for grade 10 life sciences.
CAN MY CHILD/WARD WITHDRAW FROM THIS STUDY EVEN AFTER
HAVING AGREED TO PARTICIPATE?
Participating in this study is voluntary and your child/ward is under no obligation to
consent to participation. If he/she does decide to take part, you will be given this
information sheet to keep and be asked to sign a written consent form. Your
child/ward is free to withdraw at any time and without giving a reason.
WHAT ARE THE POTENTIAL BENEFITS OF TAKING PART IN THIS STUDY?
This study is seen to be of significant benefit to the grade 10 life sciences learners,
as it has the potential to focus on improving the mathematical skills of grade 10 life
sciences learners in a focused way, which will have a directly positive impact on
their life sciences results.
ARE THEIR ANY NEGATIVE CONSEQUENCES FOR MY CHILD/WARD IF
HE/SHE PARTICIPATES IN THE RESEARCH PROJECT?
This research is classified as a low risk research. The potential for harm is low.
There is the potential for minor inconvenience and discomfort. This is not in
excess of what would normally be experienced in the school testing situation.
WILL THE INFORMATION THAT MY CHILD/WARD CONVEYS TO THE
RESEARCHER AND HIS/HER IDENTITY BE KEPT CONFIDENTIAL?
Your child/ward has the right to insist that his/her name will not be recorded
anywhere and that no one, apart from the researcher and identified members of
the research team, will know about their involvement in this research. Your
child/ward’s answer scripts will be given a code number or a pseudonym and
90
he/she will be referred to in this way in the data, any publications, or other
research reporting methods such as conference proceedings.
Records that identify participants will be available only to people working on the
study, unless you give permission for other people to see the records.
A report of the study may be submitted for publication, but individual participants
will not be identifiable in such a report.
While every effort will be made by the researcher to ensure that participants will
not be connected to the information that is shared during the case study, I cannot
guarantee that other participants in the case study group will treat information
confidentially. I shall, however, encourage all participants to do so. For this reason
I advise all participants not to disclose personally sensitive information in the case
study.
HOW WILL THE RESEARCHER(S) PROTECT THE SECURITY OF DATA?
Hard copies of your child/ward’s answers will be stored by the researcher for a
minimum period of five years in a locked cupboard at St Dominic’s College High
School, Welkom. Electronic information will be stored on a password protected
computer. Future use of the stored data will be subject to further Research Ethics
Review and approval if applicable. After the minimum period of time, hard copies
will be shredded and/or electronic copies will be permanently deleted from the
hard drive of the computer through the use of a relevant software programme.
WILL PARTICIPANTS RECEIVE PAYMENT OR ANY INCENTIVES FOR
PARTICIPATING IN THIS STUDY?
No payment or compensation will be given to participants.
HAS THE STUDY RECEIVED ETHICS APPROVAL
91
This study has received written approval from the Research Ethics Review
Committee of the Institute of Science and Technology Education and the
Research Permission Sub-committee of the Senate Research and Innovation and
Higher Degrees Committee (RPSC), UNISA. A copy of the approval letter can be
obtained from the researcher if you so wish.
HOW WILL I BE INFORMED OF THE FINDINGS/RESULTS OF THE
RESEARCH?
If you would like to be informed of the final research findings, please contact
Mandy de Vries on 057 352 3905 or [email protected] . The findings are
accessible for 12 months.
Should you require any further information or want to contact the researcher about
any aspect of this study, please contact Mandy de Vries on 057 352 3905 or
Should you have concerns about the way in which the research has been
conducted, you may contact Prof H.I. Harrison on 012-337-6129 or
[email protected]. The Ethics Review Committees (ERCs) within the Unisa
context are constituted by the Senate Research and Innovation and Higher
Degrees Committee of the University, and has been authorized to carry out ethical
review of research. You may contact Prof Padayachee at [email protected] if
you have any ethical concerns.
Thank you for taking time to read this information sheet and for participating in this
study.
Thank you.
Mandy de Vries
92
APPENDIX C
CONSENT TO PARTICIPATE IN THIS STUDY
2018_CGS/ISTE+008
I, __________________ (participant name), confirm that the person asking my
consent to take part in this research has told me about the nature, procedure,
potential benefits and anticipated inconvenience of participation.
I have read (or had explained to me) and understood the study as explained in the
information sheet.
I have had sufficient opportunity to ask questions and am prepared to participate
in the study.
I understand that my participation is voluntary and that I am free to withdraw at
any time without penalty.
I am aware that the findings of this study will be processed into a research report,
journal publications and/or conference proceedings, but that my participation will
be kept confidential unless otherwise specified.
I agree to the recording of the quantitative scores of the written test based on
microscope work and graphing.
I have received a signed copy of the informed consent agreement.
Participant Name & Surname………………………………………… (please print)
Participant Signature……………………………………………..Date…………………
Researcher’s Name & Surname: Mandy Joy de Vries………………(please print)
Researcher’s signature… .Date…12 March 2019
93
APPENDIX C2
PARENT/GUARDIAN CONSENT TO ALLOW A MINOR TO PARTICIPATE IN
THIS STUDY
2018_CGS/ISTE+008
I, __________________ (Parent/guardian), of _____________________ (print full
name) confirm that the person asking my consent to allow
________________________ to take part in this research has told me about the
nature, procedure, potential benefits and anticipated inconvenience of
participation.
I have read (or had explained to me) and understood the study as explained in the
information sheet.
I have had sufficient opportunity to ask questions and agree that
__________________________________ can participate in the study.
I understand that his/her participation is voluntary and that he/she is free to
withdraw at any time without penalty.
I am aware that the findings of this study will be processed into a research report,
journal publications and/or conference proceedings, but that
___________________ participation will be kept confidential unless otherwise
specified.
I agree to the recording of the quantitative scores of the written test based on
microscope work and graphing.
I have received a signed copy of the informed consent agreement.
Parent/Guardian Name & Surname………………………………………… (please
print)
Parent/Guardian
Signature……………………………………………..Date…………………
Researcher’s Name & Surname: Mandy Joy de Vries……………
Researcher’s signature… Date…12 March 2019
94
APPENDIX D
Request for permission to conduct research at St Dominic’s College High School, Welkom
THE EFFECTS OF POOR MATHEMATICAL SKILLS ON GRADE 10 LEARNERS’ PERFORMANCE IN
CERTAIN CONCEPTS IN LIFE SCIENCES – A CASE STUDY FOCUSSING SPECIFICALLY ON MICROSCOPE
USAGE AND GRAPHING SKILLS
2 October 2018
Mr S. Gaffney
St Dominic’s College High School, Welkom
057-352-3905: [email protected]
Dear Mr Gaffney
I, Mandy Joy de Vries, am doing research with Prof. Harrison Atagana, a professor in the
Department of Mathematics, Science and Technology Education, towards an MSc in Life Sciences
Education at the University of South Africa. We are inviting you to participate in a study entitled
“THE EFFECTS OF POOR MATHEMATICAL SKILLS ON GRADE 10 LEARNERS’ PERFORMANCE IN
CERTAIN CONCEPTS IN LIFE SCIENCES – A CASE STUDY FOCUSSING SPECIFICALLY ON MICROSCOPE
USAGE AND GRAPHING SKILLS”.
The aim of the study is to indicate that poor mathematical skills amongst Grade 10 Life Sciences
learners have a negative impact on their academic performance in areas of microscope skills and
graphing which require the direct application of certain basic maths skills. It further hopes to
identify and suggest strategies to improve the mathematical skills required by Grade 10 Life
Sciences learners in order for them to achieve better academic performance in Life Sciences.
Your school has been selected because the researcher is familiar with the teaching and learning
environment and your school actively promotes 21st Century teaching skills which are envisaged
to be implemented to a greater degree if the hypothesis is shown to be valid.
The study will entail the Grade 10 Life Sciences learners of 2019 undertaking a written test which
will assess both biological knowledge and mathematical skills in the field of microscope work and
graphing. There will be a re-test to ensure the validity and reliability of the instrument used. The
results of these tests will be compared to the maths marks achieved by learners at the end of
grade 9 (2018). A correlation of results will be done using statistical analysis.
Due consideration will be given to ensure that the ethics involved in the research are maintained.
Participants will be informed of all aspects of the research, they will voluntarily sign an agreement
to participate in the research, and letters of parental consent will be obtained. The personal
identity of the learners and individual learner scores will not be disclosed.
The benefits of this study are that the Life Sciences and Mathematics departments can develop
teaching strategies to better integrate content in order for the Life Sciences learners to achieve
better results in the areas of microscope work and graphing. It is hoped that with an
improvement of maths skills, which account for 30% of the senior Life Sciences exam papers, that
there will be a significant improvement on the life sciences marks in Grade 10 and subsequently,
Grades 11 and 12.
95
The potential risks of harm in this study are very low. There is the potential for minor emotional
discomfort or inconvenience, but this will not be in excess of that which is required on a normal
daily basis in the school situation and these effects can be easily negated by the researcher.
The feedback procedure will entail the school being informed of the statistical analysis results
which may indicate that the hypothesis is valid.
Yours sincerely
M.J. de Vries
Life Sciences Educator and Researcher