The Relationship between Direct-to-Consumer Prescription Drug Advertising and Prescription Rates
114
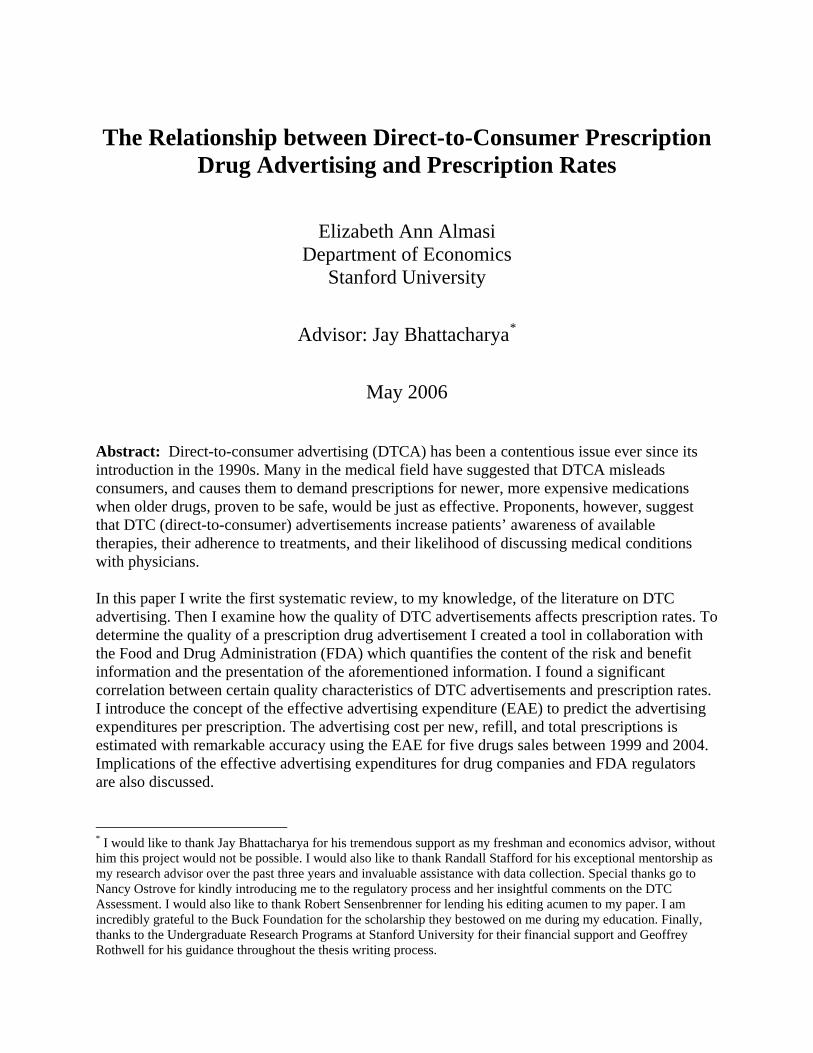
The Relationship between Direct-to-Consumer Prescription Drug Advertising and Prescription Rates Elizabeth Ann Almasi Department of Economics Stanford University Advisor: Jay Bhattacharya * May 2006 Abstract: Direct-to-consumer advertising (DTCA) has been a contentious issue ever since its introduction in the 1990s. Many in the medical field have suggested that DTCA misleads consumers, and causes them to demand prescriptions for newer, more expensive medications when older drugs, proven to be safe, would be just as effective. Proponents, however, suggest that DTC (direct-to-consumer) advertisements increase patients’ awareness of available therapies, their adherence to treatments, and their likelihood of discussing medical conditions with physicians. In this paper I write the first systematic review, to my knowledge, of the literature on DTC advertising. Then I examine how the quality of DTC advertisements affects prescription rates. To determine the quality of a prescription drug advertisement I created a tool in collaboration with the Food and Drug Administration (FDA) which quantifies the content of the risk and benefit information and the presentation of the aforementioned information. I found a significant correlation between certain quality characteristics of DTC advertisements and prescription rates. I introduce the concept of the effective advertising expenditure (EAE) to predict the advertising expenditures per prescription. The advertising cost per new, refill, and total prescriptions is estimated with remarkable accuracy using the EAE for five drugs sales between 1999 and 2004. Implications of the effective advertising expenditures for drug companies and FDA regulators are also discussed. * I would like to thank Jay Bhattacharya for his tremendous support as my freshman and economics advisor, without him this project would not be possible. I would also like to thank Randall Stafford for his exceptional mentorship as my research advisor over the past three years and invaluable assistance with data collection. Special thanks go to Nancy Ostrove for kindly introducing me to the regulatory process and her insightful comments on the DTC Assessment. I would also like to thank Robert Sensenbrenner for lending his editing acumen to my paper. I am incredibly grateful to the Buck Foundation for the scholarship they bestowed on me during my education. Finally, thanks to the Undergraduate Research Programs at Stanford University for their financial support and Geoffrey Rothwell for his guidance throughout the thesis writing process.
-
Upload
independent -
Category
Documents
-
view
1 -
download
0
Transcript of The Relationship between Direct-to-Consumer Prescription Drug Advertising and Prescription Rates
The Relationship between Direct-to-Consumer Prescription
Drug Advertising and Prescription Rates
Elizabeth Ann Almasi Department of Economics
Stanford University
Advisor: Jay Bhattacharya*
May 2006
Abstract: Direct-to-consumer advertising (DTCA) has been a contentious issue ever since its introduction in the 1990s. Many in the medical field have suggested that DTCA misleads consumers, and causes them to demand prescriptions for newer, more expensive medications when older drugs, proven to be safe, would be just as effective. Proponents, however, suggest that DTC (direct-to-consumer) advertisements increase patients’ awareness of available therapies, their adherence to treatments, and their likelihood of discussing medical conditions with physicians. In this paper I write the first systematic review, to my knowledge, of the literature on DTC advertising. Then I examine how the quality of DTC advertisements affects prescription rates. To determine the quality of a prescription drug advertisement I created a tool in collaboration with the Food and Drug Administration (FDA) which quantifies the content of the risk and benefit information and the presentation of the aforementioned information. I found a significant correlation between certain quality characteristics of DTC advertisements and prescription rates. I introduce the concept of the effective advertising expenditure (EAE) to predict the advertising expenditures per prescription. The advertising cost per new, refill, and total prescriptions is estimated with remarkable accuracy using the EAE for five drugs sales between 1999 and 2004. Implications of the effective advertising expenditures for drug companies and FDA regulators are also discussed. * I would like to thank Jay Bhattacharya for his tremendous support as my freshman and economics advisor, without him this project would not be possible. I would also like to thank Randall Stafford for his exceptional mentorship as my research advisor over the past three years and invaluable assistance with data collection. Special thanks go to Nancy Ostrove for kindly introducing me to the regulatory process and her insightful comments on the DTC Assessment. I would also like to thank Robert Sensenbrenner for lending his editing acumen to my paper. I am incredibly grateful to the Buck Foundation for the scholarship they bestowed on me during my education. Finally, thanks to the Undergraduate Research Programs at Stanford University for their financial support and Geoffrey Rothwell for his guidance throughout the thesis writing process.

2
Table of Contents 1. Introduction 2. History of the Regulation of Prescription Drug Advertising and the Role of the Food and Drug Administration (FDA) 3. The Debate Over DTCA
3.1 Impact of DTCA on Prescriptions 3.2 DTC Advertising Mediums 3.3 Characteristics of Drugs that Employ DTCA 3.4 Characteristics of Prescription Drug Advertisements 3.5 Factors that Influence Consumer’s Awareness of Prescription Drug Ads 3.6 Viewers’ Recall of Prescription Drug Advertisements 3.7 Consumers’ Opinion of DTCA 3.8 Misconceptions Surrounding the Regulation of DTCA 3.9 Doctors Response to Patient Expectation
3.10 Physician-Patient Relationship and Patient Satisfaction 3.11 Increased Efficacy of Medication through DTCA Mediated Placebo Effects 3.12 Compliance 3.13 Medicalizing 3.14 Costs of DTCA 4. Study Design
4.1 Methodology for Rating Quality of Advertisements: The DTC Assessment
4.2 Presentation Assessment 4.3 Content Assessment 4.4 Data 4.5 Data Analysis 5. Results
5.1 DTCA Expenditures 5.2 Prescription Rates 5.3 Relationship Between DTCA Expenditures and Prescriptions 5.4 Advertisement Quality Scores 5.5 Factor Analysis
5.6 Advertising Quality and Prescription Rates 5.7 Effective Advertising Expenditures 5.8 Advertising Quality and DTCA Expenditures
6. Discussion 7. Appendix

3
1. Introduction
“Advertisements contain the only truth to be relied on in a newspaper.” – Thomas Jefferson
“Advertising is a racket….its constructive contribution to humanity is exactly minus zero.”
– F. Scott Fitzgerald Since the Food and Drug Administration relaxed its guidelines for DTCA in 1997, the
rate of expenditures for U.S. DTC promotion of prescription medication has risen more than
500% from US$791 million in 1996, to more than US$4.0 billion in 2004. According to Pinto
(1998), DTC advertising has become a popular means of disseminating information for several
reasons: physicians operating in managed care organizations no longer have the time or
opportunity to interact directly with pharmaceutical representatives driving a need for a new
form of advertising. Growth in the number of drugs available has also made it difficult for
physicians to stay up-to-date with current alternatives, increasing the need for informational
advertising. Finally, the baby boomers seek information from advertising as they take a more
active role in their health care. Over the past few years, DTC advertising has been very effective
at increasing the number of prescriptions for advertised drugs. According to the U.S.
Government Accounting Office, prescriptions for drugs heavily advertised to consumers
increased six times more rapidly than prescriptions for other drugs.
Studies by Rosenthal et al (2003) suggest that the marketing elasticity of demand for
DTCA ranges from 0.096 to 0.114, meaning a 10% increase in DTCA leads to a 1% increase in
sales when all else is equal. In the proton pump inhibitor class, which contains medications for
heartburn, sales increased 36% from $4.2 billion in 1998 to $5.7 billion in 1999. This
corresponded with a 60% increase in spending on DTCA from $49.7 million to $80.1 million,
which led to a 6 percentage point growth in the market when a 0.10 elasticity of demand is

4
applied. This 17% increase in sales resulting from advertising, which equates to $252 million,
gives a return of 8.3 times the investment on DTC spending ($30.4 million). According to Berndt
(2005), “industry officials have suggested…that their target changes in sales are in the range of
four to five times the change in DTCA spending at the brand level.” These results have been
achieved for marketing efforts in 1999 and 2000. In this time period, 12% of the growth in total
prescription drug spending, or $2.6 billion, can be attributed to DTCA, yielding $4.20 for every
dollar spent on DTC advertising (Rosenthal et al, 2003).
Few studies have been conducted on the marketing elasticity of DTC advertising in
particular, but work by Hurwitz and Caves (1988), Rizzo (1999), Coscelli (2000), and Vogt and
Bhattacharya (2003) all suggest that advertising to physicians has caused the pharmaceutical
market to be “sticky” and reduce the competition between medications within a drug class.
However, many authors have begun to note, as did Leffler in the 1980s, that:
“economic analysis generally treats advertising as a homogeneous activity that is evaluated independently of why it might increase demand. Yet advertising’s effects need not be the same in different markets or in different setting within a market….Both positive and normative analysis should therefore be prefaced by the particulars of the products advertised, the message delivered, and the buyers addressed.”
Rizzo (1999) also suggests that the “effects of advertising hinge on the nature of the advertising
and information conditions in the market.” The following study aims to build upon the empirical
work conducted within submarkets where advertising was considered homogenous, by
measuring the quality of the advertisement and correlating it to the number of prescriptions for
on advertised drugs.
It is important to understand how the quality of the advertisements impact new
prescriptions from both an economic and a health policy perspective. Economically,
prescriptions for new medications are one of the leading causes of the rise in health care costs.

5
From a policy perspective, it is essential that patients are given the most pertinent information
when making health care decisions so the best health outcomes are achieved. Berger et al (2001)
suggest that patient expectation and physician perception of patient expectation for a prescription
medication correlate with the issuance of a prescription. Since physicians at least partially
acceded to 69% of inappropriate DTC requests, or 19% of all DTCA requests, it is critical to
appreciate the expectations patients develop through DTC advertisements (Murray et al, 2004).
Heightened expectations may lead to inappropriate and costly demands for medications when
evidence would dictate other medications or non-pharmacological interventions should be used.
Determining the information and presentation formats patients are most receptive to could help
regulators write the most socially beneficial guidelines.
This purpose of this study is to:
a) Develop a tool to quantify the quality of prescription drug advertisements using
different content and presentation criteria
b) Determine which characteristics are most significant in increasing prescription rates
c) Develop a model to explain the fluctuation in prescription rates (new, refill, and
total) as a function of the quality and quantity of DTC advertising
By understanding how certain advertisement characteristics affect prescription rates, drug
companies may create better advertisements to achieve the maximum impact of their advertising
expenditures, while FDA regulators may place greater emphasis on certain information or
presentation characteristics as they revise the current guidelines regarding DTC advertising to
achieve the maximum social benefit from DTCA.

6
2. History of the Regulation of Prescription Drug Advertising and the Role of the Food and Drug Administration (FDA)
Though medicines were one of the first products to be advertised in print form,
regulations of these messages has changed drastically in recent years. A German news book from
1591 contained the first print advertisement: a promotion of “first puff”, a mysterious and
wonderful curative herb (Leffler, 1981). Regulation of medical advertising began in 1736 in the
colony of Virginia, which required that the label of a medicine specify its ingredients.
Through the 1800s, pharmacists mixed ingredients together from standard ingredients
which allowed them not only to advise patients, but also ensure the quality of their products. By
1880, advances in technology allowed large-scale mixing, forming, and bottling of tablets, which
transformed the pharmaceutical industry. The manufactures, who could ensure homogenous,
high quality products, began to advertise to capitalize on their brand name. This led to an over
exaggeration of product claims, forcing the government to pass the first Food, Drug, and
Cosmetic Act in 1906, which allowed the Bureau of Chemistry in the Department of Agriculture
to monitor compliance with labeling standards.
The Bureau attempted to take action against false therapeutic claims, but, in 1911, the
Supreme Court ruled in the case United States v. Johnson that labeling provisions could not be
extended to efficacy. In response, the government passed the Federal Trade Commission Act in
1914, however, the Supreme Court ruled that this act could only be used against false claims that
injured present or potential competitors, not to prevent injuries to consumers from false claims.
The loopholes in the FTC and Food, Drug, and Cosmetic Act regulations were eventually
closed in 1938 under the Wheeler-Lea amendment to the FTC act, which prohibited false
advertising that resulted in the sale of products harmful to the health consumers. The FTC
continued to monitor false advertising, while the newly created FDA was responsible for

7
reviewing warnings on drug labels. The FDA interpreted this legislation to mean that all labeling
written in consumer friendly language was to be prohibited. This interpretation by the FDA
placed many over-the-counter (OTC) medications in violation of labeling requirements, forcing
many of the OTC drugs to revert to prescription only use. This move effectively usurped the
FTC’s jurisdiction over medical advertising, as the FDA expanded its monitoring to all labeling
and promotional materials to physicians, and essentially prohibited advertising to consumers.
In 1958, the Senate began to investigate promotion of pharmaceuticals to physicians
through detailing (a form advertising in which drug company representatives visit doctors’
offices). Many claimed detailing was misleading, uninformative, and responsible for the high
price of drugs. This led to the Food, Drug, and Cosmetic Act of 1962, also known as the
Kefauver amendments, which required all drug promotion materials to include a prominent
display of the chemical name, quantities of composition, side effects, contraindications, and
effectiveness. Thus, detailing to physicians became officially regulated by the FDA.
Between the 1960s and 1980s, the FDA created requirements for pharmaceutical
advertising directed towards physicians. All “product claim” advertisements (advertisements that
recommend a drug for a particular disease or condition) must:
1) present a “fair balance” of risk and benefit information
2) contain a “brief summary” which must include the indication of the drug, warnings,
adverse reactions, contraindications, and overdose information
Advertising toward physicians has increased steadily ever since 1960. In 1981, Eli Lilly
surprised the health care community by launching a campaign for its new anti-arthritic drug,
Oraflex, to both physicians and consumers. The advertisements suggested that the Oraflex could
stop the progression of arthritis. This message influenced the public, as the number of

8
prescriptions for Oraflex rose from 2,000 to 55,000 in the course of five months. However, after
the course of five months Eli Lilly removed Orafelx from the market as reports emerged
concerning severe side effects, including death. In response, the FDA commissioner, Arthur
Hayes, requested that pharmaceutical companies institute a moratorium on DTC advertising
while the agency examined the effects of pharmaceutical advertising directly to consumers.
After several studies, the FDA lifted the moratorium on advertising through a Federal
Register notice in 1985 that states guidelines in place for physician-direct marketing serve as
“sufficient safeguards to protect consumers.” Shortly after, print advertisements for
pharmaceuticals began to appear in magazines and newspapers. However, the “brief summary,”
which described all the risk information, was often quite long and difficult for consumers to read.
Furthermore, the length of the brief summary was far too long to present within a 30-second TV
spot. Therefore, pharmaceutical companies resorted to using the two other forms of
advertisements approved by the FDA towards physicians: “reminder ads”, which mention a
drugs name without the indication (a medical term that refers to the disease that the drug treats);
or “help-seeking” ads, which describe the disease the drug treats without mentioning the name of
the product. The “reminder ads” were pertinent to physicians who were familiar with the drug,
however consumers with no prior knowledge were often confused.
In 1997, the FDA issued new guidelines to rectify this problem, allowing DTC
advertisements to mention the brand name and condition that a drug treats without revealing all
the risk information. Instead, the product claims must include a “major statement,” which
consists of the most severe side effects, the most common side effects, contraindications (a
medical term that refers to the drug combinations that would which would lead to drug-drug
interactions), and warnings. The advertisement must also include an “adequate provision” for

9
consumers to obtain more information about a drug. Specifically, the advertisement must include
the following:
1) toll-free telephone number to receive additional drug information via mail, fax, or phone
2) website address 3) reference to a print advertisement concurrently running in print publication 4) referral to a health care provider (i.e. physician or pharmacist)
Many question the efficacy of this regulatory structure for direct-to-consumer pharmaceutical
advertising. The FDA is still actively refining the guidelines surrounding DTC advertising. In
January 2004, the FDA issued a draft guidance to further refine the “brief summary” that must be
included with all print advertisements. To fulfill this requirement, pharmaceutical companies
often included the complete risk-related sections of the FDA- approved labeling directed towards
physicians. According to the Draft Guidance, “This information is often presented verbatim, in
small type. Because this labeling is written for an audience of health care practitioners, it uses
highly technical medical terminology. In addition….[labeling] includes all possible adverse
events, including those that are unlikely to be drug related.” According to the FDA, this
abundance of highly technical information can make it difficult for consumers to comprehend the
risk information. Therefore, they propose that the brief summary be written in a “highlight”
format, which includes the following information in consumer-friendly language:
1) All contraindications,
2) All warnings,
3) Most serious side effects and precautions,
4) 3-5 most common side effects.

10
Many DTC advertisements have begun to include this “highlights” section, making the risk
information much more accessible to consumers.
Since the modification of FDA requirements in 1997, the sudden surge in DTC
advertising has caused a large controversy in the medical community. Many claim that the
regulations are not stringent enough to protect consumers, while others suggest that the
regulations make the advertisements cumbersome. The FDA continues to research the effect of
DTC advertising, as well as the potential brief summary formats that may increase the overall
effectiveness of DTCA. Given the personal nature of healthcare and the rising costs of
pharmaceuticals, DTC advertising will continue to be a contentious issue among physicians and
policymakers.

11
3. The Debate Over DTC Advertising
“I think I was wrong…On the whole I think there is a lot of educational benefit [to direct-to-consumer drug advertising].” – David K. Kessler, former FDA Commissioner
“[DTC Advertising] is supposed to get patients who need the medication to know about the drug
so they can ask their physician about it…Direct-to-consumer advertising correctly done is a great public health tool… We now have ads on television that show people walking through
meadows as the name is subliminally flashed, and there are birds singing and bees copulating…We’ve got to cut that out, because that is not what direct-to-consumer advertising is
supposed to be.” – Lester Crawford, former FDA Commissioner
Besides former FDA commissioners, many disagree about the beneficial and harmful
consequences of DTC advertisements. Proponents of DTCA claim that advertisements increase
patients’ awareness of available therapies, reduce the stigma of talking to their physician about
certain conditions, increases patient confidence, and increase patients adherence to therapies.
Overall, they believe the educational content of these messages helps target conditions that are
under-treated, such as depression and high cholesterol (hyperlipedimia), while also increasing
compliance of patients who have already received a prescription.
Opponents of DTCA generally recognize these useful properties of advertising, but
question “whether the advertisements contain and communicate drug information in a manner
that is best suited for consumers” (Roth, 1996). They object to the motives of advertising, which
they claim place a higher value on increased sales revenue rather than optimal health care.
Opponents often complain that DTC advertisements strain the physician-patient relationship and
cause physicians to spend extra time persuading patients that certain DTCA drugs are
inappropriate for them. Moreover, the advertisements may increase demand for more expensive
or unnecessary drugs, and even lead to the prescription of inappropriate medications.
The emotional appeals in DTCA make vivid impressions on viewers. These impressions
may cause patients to form expectations about the condition and the medication advertised.

12
Heightened expectations of the drug may encourage people to visit their doctor and treat
conditions that had gone unnoticed. It may also improve compliance with recommended
therapies and hasten the uptake of revolutionary new drugs. Almasi et al (2006) purposed that
heightened expectations may actually lead to an increase in the efficacy of advertised
medications through the placebo effect. Heightened expectations created by prescription drug
advertisements may have many beneficial effects on the initiation and delivery of health care.
Heightened expectations, however, may also lead patients to demand inappropriate drugs,
which could cause a strain in the physician-patient relationship as doctors break down the
generated expectancy. Studies show new prescriptions are correlated with patient expectation
and the physician’s perception of patient expectation (Berger et al, 2001). Therefore, opponents
of DTCA are well founded in their belief that the incorrect expectations created by these
advertisements leads to inappropriate prescribing practices.
This effect may be exacerbated by the lack of benefit and risk information available in
most advertisements to create well-informed expectations. Persuasive advertisements lead to a
large increase in demand for relatively unproven drugs that have only recently become available.
The Vioxx and Phen-Fen debacles have shown us that many side-effects do not emerge within
the first few years the product is on the market. Some argue that by expanding the number of
patients taking the drug during this uncertain period, a larger patient population is at risk to
unknown side effects. Furthermore, some have argued that DTCA encourages people to seek
medical solutions to normal human experiences, and thus driving the cost of health care. These
are serious concerns, and governments must weigh this harm against the potential benefits of
DTC advertising.

13
DTCA is a contentious issue throughout the world. The United States and New Zealand
are the only two nations which allow DTC advertising. In 2002, the European Parliament
rejected the latest proposal to allow DTC advertising for drugs used to treat asthma, AIDS, and
diabetes. Similarly, in 2004, the Canadian parliament recommended against DTC advertising
because “Drug advertisements could endanger rather than empower consumers by minimizing
risk information and exaggerating benefits [and] could contribute to increased or inappropriate
drug consumptions” (Mansfield et al, 2005). In 2002, New Zealand was also considering a ban
on DTCA: “New Zealand’s health minister, Anette King, has taken the advice of New Zealand’s
health professional and consumer groups and has decided that the potential benefits of DTCA do
not justify the harms and so plans to ban it” (Mansfield et al, 2005). However, the changing
political climate in New Zealand makes any prohibition of DTCA seem unlikely in the near
future. This issue remains at the forefront of the debate about pharmaceuticals around the world.
The Food and Drug Administration maintains that there is a beneficial role for this type
of promotion when it is done appropriately. Studies by the FDA and others support this position;
however, there are also many negative externalities which could be reduced through better
regulation.
3.1 Impact of DTCA on Prescriptions
Consumers have become more aware of DTC advertising in recent years. A study by the
Kaiser Family Foundation (2005) showed that 90% of adults have seen or heard advertisements
for prescription medications in 2005, up from 79% in 2000. Many of these advertisements have
been well targeted: 20% of consumers have seen an advertisement that was relevant to their
health in the past twelve months. Not surprisingly, patients who are taking a prescription

14
medication are more likely to recall advertisements, because the information in the
advertisements is more pertinent to these patients than the average consumer (Murray et al,
2004). Advertisements are recalled at the highest rate by patients suffering from allergies,
osteoporosis, hypertension, or arthritis, which have therapies that are highly advertised through
DTCA. Despite the fact that consumers ages 53 to 89 are most likely to take a medication for one
of these conditions, this age groups is the least likely to recall a prescription drug advertisement
(Thompson, 1998).
Many patients have acted as a result of these prescription drug advertisements. 23% of ad
viewers talked to their doctor about a medication as a result of seeing an ad. (Kaiser HealthPoll,
2005). A study by Bell et al (1999) suggests that 35% of people who have seen DTC
advertisements asked their physician for more information, and 19% of ad viewers actually asked
for a prescription as a result of DTCA. According to Thompson (1998), 33% of those who saw
advertisements asked their doctor about the medication, 28% asked for a prescription, which was
honored by doctors in 80% of the cases. This amounted to 163 million people recalling the
advertisements and 54 million people asking their doctor about advertised products in 1998.
Since then, these numbers have risen sharply as advertising has become even more pervasive.
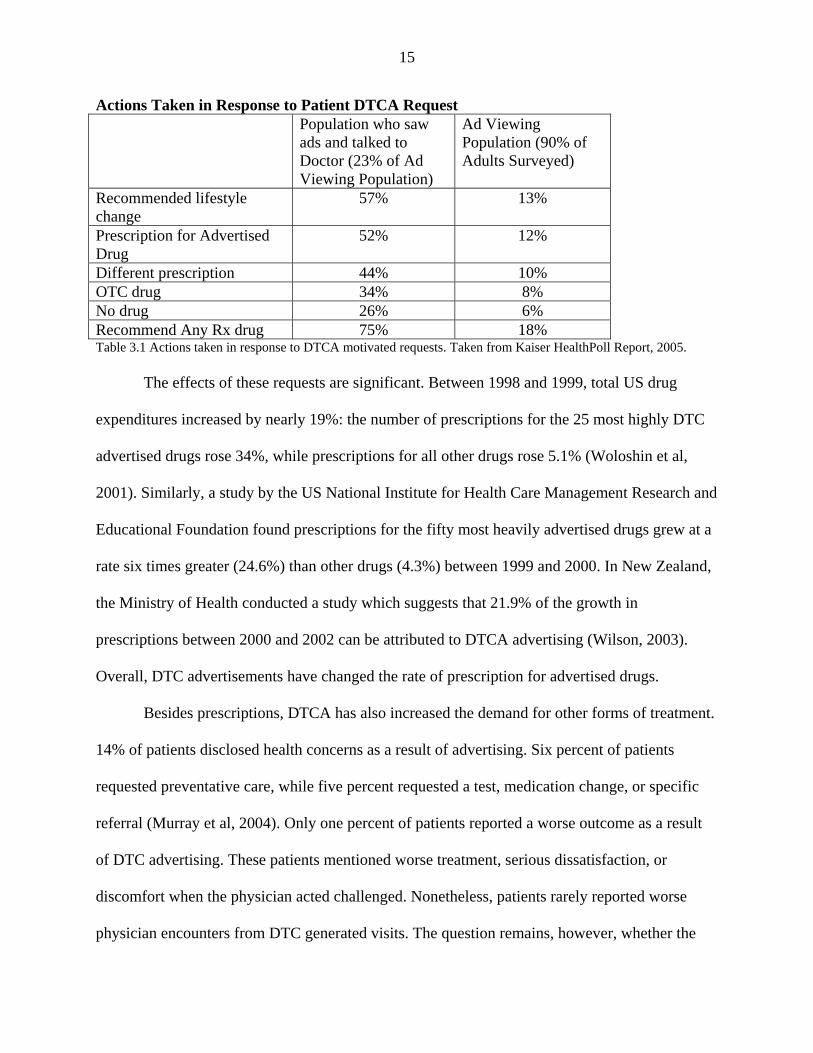
The outcomes of these advertising generated requests are summarized from the Kaiser
HealthPoll Report (2005):
15
Actions Taken in Response to Patient DTCA Request Population who saw
ads and talked to Doctor (23% of Ad Viewing Population)
Ad Viewing Population (90% of Adults Surveyed)
Recommended lifestyle change
57% 13%
Prescription for Advertised Drug
52% 12%
Different prescription 44% 10% OTC drug 34% 8% No drug 26% 6% Recommend Any Rx drug 75% 18% Table 3.1 Actions taken in response to DTCA motivated requests. Taken from Kaiser HealthPoll Report, 2005.
The effects of these requests are significant. Between 1998 and 1999, total US drug
expenditures increased by nearly 19%: the number of prescriptions for the 25 most highly DTC
advertised drugs rose 34%, while prescriptions for all other drugs rose 5.1% (Woloshin et al,
2001). Similarly, a study by the US National Institute for Health Care Management Research and
Educational Foundation found prescriptions for the fifty most heavily advertised drugs grew at a
rate six times greater (24.6%) than other drugs (4.3%) between 1999 and 2000. In New Zealand,
the Ministry of Health conducted a study which suggests that 21.9% of the growth in
prescriptions between 2000 and 2002 can be attributed to DTCA advertising (Wilson, 2003).
Overall, DTC advertisements have changed the rate of prescription for advertised drugs.
Besides prescriptions, DTCA has also increased the demand for other forms of treatment.
14% of patients disclosed health concerns as a result of advertising. Six percent of patients
requested preventative care, while five percent requested a test, medication change, or specific
referral (Murray et al, 2004). Only one percent of patients reported a worse outcome as a result
of DTC advertising. These patients mentioned worse treatment, serious dissatisfaction, or
discomfort when the physician acted challenged. Nonetheless, patients rarely reported worse
physician encounters from DTC generated visits. The question remains, however, whether the

16
increase in prescriptions and health care use as a result of DTCA has led to better health
outcomes.
DTC advertisements may have the largest impact on people of low socioeconomic status,
a group that is difficult encourage to visit their physician and to request treatment for many under
diagnosed conditions. A study by Murray (2004) found that 24% of all people scheduled a visit
with their physician specifically to talk about a prescription drug advertisement. Importantly,
these individuals were generally from populations that are hard to target – patients with low
education. (78% of patients did not graduate high school, and 58% had no high school education
whatsoever.) 13% of the all patients who discussed an advertisement with a physician either had
the condition or were at risk for it. Furthermore, doctors believed the advertised medication
which they prescribed would be helpful in 30% of cases they prescribed an advertised drug in
response to a patient’s request. This was most prevalent for patients with low incomes, low
education levels, and people who are not proactive about their health. Unfortunately physicians
also granted 12% of ad generated prescription drug requests in which they did not believe the
therapy would be helpful. Patients aged 18-24 were most likely to receive prescriptions in which
the physician did not have full confidence.
Overall, the data show that DTCA encourages approximately 20% of patients to visit
their doctors. There is great debate whether these increased visits are by underserved populations
leading to discussions about under-diagnosed conditions, or whether this increased traffic simply
taxes physician’s time as they explain why certain medications are not appropriate. The data
suggests that the visits are not a complete misuse of physicians’ time, since doctors respond by
issuing a prescription in 75% of these visits, actually prescribing the requested advertised drug in
approximately 57% of visits (Murray et al, 2004). Again, many question whether prescriptions

17
for these new drugs led to better health outcomes, or whether these prescriptions are
unnecessary, and even inappropriate at times, leading to the large increase in health care costs.
3.2 DTC Advertising Mediums
Of the patients who recalled seeing a DTC advertisement, 94% remember television
promotions, 62% recall newspaper and journal advertisements, and 22% recall radio spots
(Kaiser HealthPoll, 2005). As seen from the breakdown of DTCA expenditures in the Table 3.2,
the recall from television advertising is much higher than the proportion of DTCA dedicated to
television (~60%). This could be caused by two factors: first, according to FDA regulations, all
television campaigns must run concurrently with a print campaign where consumers can get
more information. Though companies may wish to dedicate more of their DTCA budgets to
television advertising, the regulations require a high level of print advertising. Second, television
advertising is only effective if advertisements are shown repeatedly on several different
television programs. The high cost of television advertising may lead to the disproportionate use
of this media by prescription drugs with high DTCA budgets. Prescription drugs with lower
DTCA budgets may only use print media, which lowers ad costs and can be more easily targeted
to specific magazine readerships (and thus demographics).
From 1999 to 2004, 41% of DTCA was spent on television advertising each month and
50% on print advertising. However, companies generally spent 80% of its DTCA advertising
budget on one form of media or the other in a particular month. This supports our hypothesis that
only prescription drugs with high advertising budgets employ television advertising. Other
prescription drugs with smaller budgets, highly targeted patient populations, or more
complicated risk information mainly rely on print media. Rosenthal et al (2002) showed that the

18
variance among DTCA advertising budgets is quite significant: “The ratio of DTC expenditures
to sales for the class with the highest expenditures was 23 times as high as the ratio for the class
with the lowest expenditures. By contrast, spending on promotion to professionals as a percent of
sales varied by a factor of three.” The disparity in advertising budgets causes a bifurcation. High
budget advertising campaigns focus on television advertising, which seems to be recalled at a
much higher rate, while lower-budget campaigns rely primarily on print media.
DTCA Expenditures By Medium Year TV Print Radio Other Total 1999 910,601.0
(56.98%) 675,615.2 (42.28%)
9,192.6 (0.58%)
2,571.3 (0.16%)
1,597,980.1 (100%)
2000 1,427,912.0 (63.23%)
795,290.8 (35.21%)
33,005.4 (1.46%)
2,234.1 (0.10%)
2,258,442.3 (100%)
2001 1593343.3 (64.26%)
861,352.6 (34.74%)
22,958.3 (0.93%)
1,957.1 (0.08%)
2,479,611.3 (100%)
2002 1,552,666.1 (61.80%)
929,329.3 (36.99%)
12,819.9 (0.51%)
17,389.3 (0.69%)
2,512,204.6 (100%)
2003 1833131.72 (59.36%)
1210811.93 (39.21%)
39507.95 (1.28%)
4450.34 (0.14%)
3087901.94 (100%)
2004 2539269.48 (66.15%)
1259109.11 (32.80%)
36058.78 (0.94%)
4024.74 (0.10%)
3838462.11 (100%)
Table 3.2. DTCA Expenditures by media type in thousands of US dollars and percentage of DTCA expenditures spent on a given type of media each year. TNS Media Intelligence, 1999-2004. 3.3 Characteristics of Drugs that Employ DTCA
Spending on DTC is highly concentrated on products which generally treat chronic
conditions and have a low incidence of side effects (Rosenthal et al, 2002). Patients are most
likely to benefit from information about drugs that they take repeatedly for chronic conditions,
while they rely on their physicians to recommend the best treatments for acute, short-term
problems. This information and perhaps repeated experience may cause patients to form a brand
preference, increasing the returns to advertising for firms. Companies often take the following

19
criteria denoted by Roth (1996) into account when determining whether to use DTCA for a
particular drug: market size, drug usage, side effects, and state of the product life cycle.
Since DTCA is difficult to target to specific patient populations, DTCA campaigns
generally feature treatments that are “widely prescribed to diverse heterogeneous markets.”
Advertised drugs also treat conditions that have considerably less complex symptoms, and less
complex treatments, so advertisements appear for products that “should be the easiest for
[consumers] to understand and that run the lowest risk of providing new and complex
information that could lead to customer confusion” (Roth, 1996).
Generally DTCA increases the size of a particular drug market, but does not alter the
market share for a particular brand name medication. Therefore, market leaders receive the
greatest returns on advertising investments that stimulate the demand for a particular drug class.
Firms are also more likely to advertise products early in the product’s life cycle, while the
manufacturer can charge monopoly prices under patent protection, repeating the maximum return
on advertising investments. Products early in their life cycle are also more likely to have
differentiating characteristics, and thus a greater potential to capitalize on their brand
differentiation.
As theory suggest, advertisements are most likely to appear for market leaders that target
a broad customer base for chronic conditions which are easily understood and have a low
incidence of side effects.
3.4 Characteristics of Prescription Drug Advertisements
Increasingly, prescription medications are advertised in the same manner as cars and
cereal, through a “process that meets the psychological and social needs of the consumer”

20
(David, 2001). This method is likely chosen because advertisements with transformational
appeals (i.e. positive or rewarding stimulation) have higher ad awareness, or advertisement
recall. According to Cline (2004), transformational messages such as images of health, happy,
socially engaged product users, offer rewards that are associated with the observed behavior, in
this case a prescription for the medication. Social cognitive theory suggests that these rewards
become the motivator for the observed behavior. According to her, DTCA likely provides
models with whom the consumers identify, and are presented as having personal features and
engaged in activities that the viewer desires. These rewards function as the motivation for
consumers to follow the “directions” in the advertisement to speak to their doctor about a
particular drug.
An analysis by Woloshin et al (2001) showed that 67% of DTC advertisements used
emotional appeals. The most common appeal was the desire to get back to normal, which was
seen in 60% of the advertisements using emotional appeals. According to Cline (2004), being ill
constitutes a threat to identity: “People with chronic illnesses risk permanent loss of features of
their identities…controlling one’s illness means controlling one’s identity.” Therefore, most
DTC advertisements reflect at least one identity reward. Ads also depict social rewards as well,
such as family (31.1%), romance (29.8%), and work (5.4%).
Two marketing research theories lie behind the methodologies of advertising: classical
conditioning and the expectancy-value theory. In advertising, classical conditioning refers to the
use of images, music, and verbal cues to elicit certain emotions, which become associated with
the promoted product. A common example is the use of sexually attractive models that form a
connection between the arousal created by the model and the product. DTC advertisements use
classical conditioning to associate drugs with a range of emotional experiences. For example,
21
DTC advertisements associate the joy of playing in beautiful fields for allergy sufferers’ with
Claratin, the love conveyed by an elderly patient with arthritis hugging a child to Celebrex, and
the happiness of a smiling, bouncing cartoon character for depressed patients with Zoloft. The
majority of advertisements depict exclusively healthy appearing people (92%) participating in
physical activities (43%) or social activities (17%). 72% of prescription drug advertisements
depict at least one person smiling (Cline, 2004). Through classical conditioning, the positive
images, along with verbal messages that reinforce the efficacy of the advertised medication,
associate the drug with the relief from pain, anxiety, and uncertainty associated with these
conditions.
Similarly, the expectancy value theory in advertising suggests that commercials can teach
viewers what to expect by demonstrating the rewards of following advice or the punishments for
failing to do so. Based on this theory, many pharmaceutical advertisements first highlight the
pain and suffering of medical conditions as a context for presenting benefits of relief associated
with medication use (Cline, 2004). This ‘teaches’ the viewer to expect relief. Of the strategies
used to increase expectancy of a drug, a cycle of anxiety is commonly employed. 42% of
magazine drug advertisements appeal to fear, or focus on the cycle of anxiety, as a marketing
strategy (Pinto, 2000). Commercials for conditions such as high cholesterol, acid reflux disease,
and osteoporosis first assert that minor symptoms or unassessed biological parameters can have
grave implications, often while emphasizing the prevalence of these conditions (Morris, 1997).
The commercials then introduce the promoted drug as the solution, alleviating the anxiety
created by the commercial, which not only amplifies the consumer’s perception of the drug’s
value, but also increases the perceived value of the identity and relational rewards offered in the
advertisement.

22
Figure 3.1. Image from the “Falling Starlet” advertisement for Lipitor that appeared in 2002.
Conditioning through this cycle of anxiety is aptly displayed in the “Falling Starlet”
atorvastatin calcium commercial that aired and appeared in print during 2002 (Figure 3.1). As an
attractive woman gracefully glides down a paparazzi-lined red carpet, boxes appear on the screen
detailing her height (5 foot, nine inches), weight (125 pounds), and dress size (size 6). When her
cholesterol level appears on the screen (273 mg/dL, [7.1 mmol/L]) she suddenly trips, as if from
a heart attack, suggesting that a seemingly healthy woman can be suffering from high cholesterol
that may lead to major health problems. Next, the already anxious audience is warned, “High
cholesterol does not care who you are.” The commercial informs the audience that one fifth of
Americans have high cholesterol, suggesting the need for all viewers to be concerned about
hyperlipidemia’s serious implications. After creating this anxiety, the advertisement numerically
23
displays Lipitor’s effectiveness and depicts the women being helped to her feet by an attractive
man, who stays by her side as she continues down the carpet to receive an award. The
advertisement offers numerous identity awards through the glamour and appearance of the
beautiful women. The large adoring crowd and handsome gentleman also offer relational
rewards. The relief at the end of the commercial completes the cycle of anxiety and produces the
expectancy of benefit.
The message in this and other advertisements is obvious: Patients with a given condition
can be attractive, healthy, and successful if they use the prescription drug that is advertised.
These associations may be credible for conditions such as allergies or irritable bowl syndrome,
but may not be appropriate for people certain forms of cancer or severe arthritis. In fact,
psychiatrists thought that “certain adverts were potentially offensive to both patients and care
[takers]. Unrealistic and stereotyped images were considered inappropriate and demoralizing to
those directly and indirectly affected by Alzheimer’s Disease” (Sauer et al, 2002). Advertising
slogans have actually been altered because they promote ideals that were so unrealistic. The
marketing slogan used by Aricept, “Mum has Alzheimer’s disease but she knew I was calling
today,” was changed to “Real lives –realistic expectations.” The unachievable results portrayed
in the first slogan can not only be demoralizing to families with someone who suffers from
Alzheimer’s disease, but may make DTCA very harmful. Unrealistic expectations may cause
patients to demand drugs that are inappropriate, strain the physician patient relationship, and
increase health care costs through higher prescription rates and the extra time physicians must
use to explain why the drugs are not as effective as the advertisements suggest.
Emotional appeals using identity and relational rewards may be very effective in
generating advertisement awareness and motivating patients to see their physicians. As Wolfe

24
suggests, “customers often choose a product on the basis of emotional appeals” (Wolfe, 2002).
When one is choosing a dishwashing detergent or soda, unrealistic exceptions formed by these
appeals may lead to temporary disappointment, but no real long term health effects or
inefficiency in the market. Since pharmaceuticals have a much greater impact on health and face
the principle agent problem, the consequence of unrealistic expectations is much higher. They
may lead to inappropriate prescriptions, frustration with doctors, and unnecessary waste in the
health care system.
Emotional appeals in DTCA clearly have an important role in promoting the awareness.
Regulation of these appeals, though very difficult to create, is vital to ensuring the social benefits
of DTCA and minimizing its harm. Realistic expectations can partially be created through
incorporating concrete evidence about the drug to help consumers determine whether a drug is
potentially appropriate for them. Unfortunately, prescription drug advertisements provide little
concrete information to affirm the emotional experiences depicted in the advertisements. Few
advertisements indicate the symptoms of the disease, the success rate of the drug, alternative
treatments that could improve health, or make the side-effects of the drug easily understandable
to the consumer.
According to Roth (2003), only 42.7% of advertisements conveyed information about the
disease. 40% of advertisements fail to describe any symptom for the condition being treated by
the advertised drug or fail to explicitly state that the condition could be a “silent disease” (Bell et
al, 2000). Half of these advertisements were either targeted to people who already have been
diagnosed with the condition and therefore are aware of its symptoms, while the other half were
for conditions with well known symptoms, such as pregnancy, impotence and tobacco addiction.
Nonetheless, it is surprising that so few advertisements discuss symptoms or the course of the

25
disease. Only 27% of advertisements discussed the precursors to the condition (such as causes or
risk factors) and only 12% of advertisements discussed the prevalence of the disease (Bell et al,
2000). This suggests overall prescription drug advertisements contain little disease related
educational content.
Information on the benefits of a drug is sparse within advertisements as well. Benefits
derived from the drug are mostly described in qualitative terms, such as “clinically proven,
proven relief, or proven effective.” Of the ads that discussed the benefits of the drug explicitly,
only 13% provided any evidence to support their claims. Rather, advertisements relied on
personal testimonials (12%) or appealed to the widespread use of the drug (i.e. “more than
1,000,000 have used Rezulin to help manage their diabetes”), (Woloshin et al, 2001). The lack of
quantitative evidence may allow the impressions created by the emotional appeals to replace
information on the actual effectiveness of the medication. According to Woloshin et al (2004),
“the absence of benefit data may lead some patients to assume that the drug always works.”
To determine whether the lack of benefit information makes patients have a higher
expectation of the drugs, Woloshin et al (2004) created drug advertisements that incorporated a
standardized “benefit box” which listed the effectiveness of the advertised drug, a competitor,
and placebo. Most patients rated drugs as “extremely effective” or “very effective” when they
were shown the standard advertisement. After being shown the advertisement with the benefit
box, the proportion of people who rated the drugs very highly fell from 51% to 26% for Lipitor,
and from 65% to 28% for Celebrex. The benefits box also caused more respondents to recognize
that Celebrex has approximately the same efficacy as ibuprofen. The authors of the study
conclude that “perceptions of drug effectiveness were much lower for ads that incorporated the
benefit box than for ads that did not.” This suggests that the emotional appeals used within the

26
advertisement take the place of comparative data on efficacy within the minds of consumers. The
heightened expectations formed from these emotional appeals may decrease the benefits of
DTCA by causing waste of physician time, inappropriate prescriptions, and increased costs.
Most of the advertisements (98%) explicitly stated the necessary risk information because
this information is mandated by the FDA, and “51% went beyond the FDA requirements and
named side-effects and provided quantitative data about their frequency” (Woloshin, 2001).
Nonetheless, pharmacists still believed that one-third of the advertisements failed to achieve a
“fair balance” in the presentation of the risks and benefits. Pharmacists cited an absence (15% of
ads) or shortage (10% of ads) of risk and/or side effect information as the main reasons
advertisements failed to achieve balance (Roth, 1996).
Though there appears to be minimal educational content contained in the advertisements,
pharmacists found the accuracy of the information available to be very high (Roth, 1996).
Furthermore, information contained within the advertisements is not relegated to the text. Cline
(2004) suggests that information such as the patient population can be taken from the images
used within the advertisement. Over half the advertisements depicted adults only (58%),
although advertisements for cardiovascular (58%) disease and diabetes (50%) showed a mixture
of age groups, generally older adults with children. 88% of the advertisements depicted only one
ethnic group, with approximately 75% of ads depicting whites, 14% depicting African
Americans, 2% depicting Hispanics, and only 0.5% depicting Asians.
According to Cline (2004), DTCA also tends to reinforce social stereotypes. Females
dominated advertisements for psychiatric products, while men dominated advertisements (66%)
for cardiovascular disease, despite the fact that cardiovascular disease is the number one killer of
both men and women. Similar trends can be seen in the depiction of different ethnicities.

27
According to Cline (2004), “The principle of homophily suggest that consumers are more
likely to attend to and be persuaded by sources perceived as similar to themselves.” The under-
representation of certain patient populations may prevent theses groups from gaining the full
educational value from DTCA. Cline suggests, “these visual cues reinforce already existing
disparities in access to health information and, to the extent that advertisements promote visits to
physicians, disparities in access to health care.”
Since many proponents of DTCA suggest that advertisements give patients the
confidence and motivation to talk about certain conditions that have been socially taboo, it is
disappointing that the patient populations depicted do not defy sterotypes in order to target
patients at risk. Instead, patient populations tend to correlate with marketing ideals. Many
advertisements for erectile dysfunction depict fit, healthy men in their forties. Though erectile
dysfunction drugs are approved by the FDA for men over age 18, the average patient is
significantly older. Many question whether the advertisements cause middle-aged to
inappropriately demand Viagra, or whether these advertisements have removed the social stigma
for middle-aged men to discuss erectile dysfunction drugs with their doctors. Though the case of
erectile dysfunction is troublesome, DTC advertisements should strive to break down social
stereotypes when other patient populations are clearly at risk.
DTC advertisements employ effective emotional marketing strategies, such as classical
conditioning and the expectancy-value theory to associate drugs with identity and relational
rewards, while teaching the viewer what to expect from the treatment. The visual content of the
advertisements may also teach the viewers about the expected patient population. Unfortunately,
the advertisements do not contain a lot of quantitative evidence about the benefits of the therapy.
This omission may allow consumers to perceive the drugs as more effective because they replace

28
the efficacy measured in randomized trials with the efficacy depicted in the emotional appeal.
These heightened expectations may cause an increased in demand for inappropriate
prescriptions, strain the physician-patient relationship, and lead to waste in the health care
system.
3.5 Factors that Influence Consumer’s Awareness of Prescription Drug Ads
The dearth of quantitative information in DTC advertisements may not only increase
perceived efficacy, but also increase ad awareness. According to Roth (2003),
“[advertising awareness] was greater when disease symptoms were not conveyed…advertisements that convey symptom information, which is typically negative, risk not being recalled by consumers…[because] people can be overly optimistic in assessing their susceptibility to health risks and therefore alienated by advertisements that present threat or severity information.”
Similarly, ad awareness was higher for drug advertisements that did not make any direct
comparisons between treatments (32.35% of patients aware of drug ad) than advertisements that
compared treatments directly (22.59% awareness) or only made indirect comparisons (29.59%
awareness). Above all, messages that relied on transformational appeals, such as sensory
gratification, intellectual stimulation, or social approval, had higher advertisement awareness
than strictly informational appeals (Roth, 2003).
Overall, awareness of prescription drug advertisements is correlated with people who had
a high exposure to magazines, frequent television viewership, used prescription drugs, evaluated
their health less positively, and believed their health plan would cover the cost of the drugs (Bell
et al, 1999). Interestingly, individuals tend to be fairly selective in attending to advertisements.
People were considerably more likely to recall advertisements that address their medical
condition. According to Bell (1999), “attention to DTC advertisements is driven by the basic

29
principle of subjective utility; that is, we process information that is perceived to have personal
value.” This may partially explain why advertisements with disease and symptom information
may be less memorable. Presumably people who have been diagnosed with the condition
perceive the symptom and disease information to be less useful because it does not offer new
information, and therefore these patients may not give the advertisement much attention (Roth,
2003).
This raises difficult questions about the aim of prescription drug advertising. If the
ultimate goal of DTCA, as Pfizer suggests, is to motivate consumers to act by consulting their
doctors and engaging in better dialogue with them about their individual health situations, then
the transformational appeals employed may be appropriate. However, these appeals must be
constructed very carefully so that people do not incorrectly believe they are fully informed about
the drug, causing them to make inappropriate demands of their physician. As Pfizer states,
“consumers cannot be expected (or induced) to believe that they are sufficiently informed to
make judgments about relative benefit and risk without assistance of their physicians” (Federal
Register Comment, 2003). However, this should apply not only to the informational content of
the advertisement, but also the perception created through various emotional appeals.
Informational content may reduce ad awareness for prescription drugs, but it may improve the
overall social benefit of advertising by allowing people to select the advertisements that are truly
relevant to their health needs, rather than advertisements that satisfy their transformational
desires.

30
3.6 Viewers’ Recall of Prescription Drug Advertisements
DTCA increases consumers’ awareness about prescription drugs; however, the rate at
which prescription drug advertisements are recalled vary quite a bit. In a study by the Kaiser
Family Foundation, which placed special TV boxes in households that aired prescription drug
commercials in place of other ads, commercials for Lipitor were recalled by 82% of viewers,
while only 54% of viewers recalled the Singulair ads and only 48% recalled the Nexium ads.
Viewers learned about the indications, side effects, and alternative therapies of drugs from the
advertisements. However, consumers also aggregated incorrect knowledge. “Up to 6% of
[viewers] drew incorrect conclusions about the product that were not explicitly stated in the ad
and up to 14% indicated mistaken impressions as the main point of the ad” (Zachry, 2003). The
Kaiser study (2005) showed that people replaced their uncertainty with incorrect information.
Awareness of Content in DTC Advertisements No
DTCA DTCA Viewer
Change
Awareness of Disease Progression (Acid Reflux)
68%
79%
+11
Awareness of Indication (Lipitor) (Nexium) (Singulair)
34% 8% 14%
88% 84% 87%
+54 +76 +73
Awareness of Usage (Singulair – Don’t take during asthma attack) (Singulair – Incorrect usage information)
12% 13%
19% 25%
+5 +12
Awareness of Alternative Therapies (Exercise for high cholesterol)
57%
70%
+13
Table 3.3. Awareness of information contained in DTC advertisements. Taken from “Understanding the Effects of DTC Prescription Drug Advertising,” Kaiser Family Foundation, 2001.
The advertisements significantly increase the population’s awareness of the condition that
the advertised drug is used to treat. They also help to educate people about disease progression,
lifestyle changes, and how drugs should be used. Unfortunately, the advertisements also increase
the misconceptions about drugs. For instance, twice as many people “learned” the incorrect use

31
of Singulair from drug advertisements as the number of people who learned the correct usage.
This trend translates to the risks and side effects of the medication as well, although it is not as
pronounced. When asked about particular side effects, there was a 45% increase in the number of
people who correctly identified the side effects for a given drugs; however, there was a 15%
increase for all the incorrect side effects as well. Similarly, the advertisements increased the
number of people who correctly identified the contraindications by 50-60%, yet 30-40%
identified numerous additional incorrect contraindications. This suggests that the advertisements
make consumers feel empowered with knowledge about advertised prescription drugs. Many
consumers gained valuable information, yet a smaller, but still significant proportion acquired
incorrect information, which may lead them to demand inappropriate drugs or shy away from
treatments that they incorrectly view as dangerous. According to Roth (1996), this incorrect
information is propagated through DTCA by misunderstanding or indirectly by reinforcing prior
erroneous knowledge.
The advertisements can also serve as a useful reference to make people feel more
empowered. 29% of people believe they gain “a lot” or “somewhat more” about the disease after
seeing a prescription drug ad (Kaiser Family Foundation, 2001). Many people seem to use the
print advertisements as a source of information. 56% of people who saw a prescription drug ad
claim to have read it “from beginning to end, ” with 17% of people clipping the ad for future
reference, and 9% calling the toll free number indicated in the ad for more information (Bell et
al, 1999).
The advertisements are an effective source of information for patients, especially
increasing the number of people who believe they are informed about the medication. Even if
incorrect information is obtained, the increased motivation to speak to a physician as a result of

32
learning may be beneficial. However, regulations should be carefully written so that expectations
created by incorrect information do not strain the physician-patient relationship or cause
inappropriate prescribing practices. DTC advertisements should be written in a very accessible
language and format to reduce the misunderstandings from these advertisements. Firms may
already be achieving this goal. According to Bell et all (1999), “education was not strongly
related to awareness (or to any outcome measure), suggesting that DTC advertisements, like
promotions for most consumer products, are designed to be accessible to mass audiences.” The
advertisements should also strive to correct any misconceptions about a disease that are widely
held by the public, because DTC advertisements may otherwise inadvertently spread this
incorrect information.
3.7 Consumers’ Opinion of DTCA
Consumers’ opinions of DTC advertisements vary quite a bit, although people are
generally neutral towards DTCA. In a survey, only 19% of people thought that the
advertisements were “bad” or “very bad;” 47% thought the ads were “good” or “very good,” and
34% were neutral (Murray et al, 2004). 64% of people who have seen the advertisements believe
that they provide useful information “at least some of the time” (Kaiser HealthPoll, 2005).
However, only 18% of ad viewers trust the information that is provided in these advertisements
“most of the time.” Trust in these advertisements has declined since they were introduced in
1997, when over a third of viewers believed the information was trustworthy (Kaiser HealthPoll,
1999). Nearly 60% of patients believe that “advertisements for prescription drugs make the drugs
seem better than they really are” (Berndt, 2005).

33
Consumers turn to prescription drug advertisements for many different reasons. The
advertisements are generally successful at fulfilling what consumers believe are the primary
purpose of their advertisements. 29% believe the primary purpose of the advertisements is to
increase awareness about illnesses and the medications that can be used to treat them. In fact,
opinion surveys show 72% believe advertisements improve people’s understanding of medical
conditions and treatments (Murray et al, 2004). Another 18% of people believe that the primary
purpose of drug advertisements is to determine whether a medicine is “right for me or someone
in my family” (Federal Register Comment, Eli Lilly, 2004). Drug companies are fairly successful
at making patients aware of treatments and helping patients become involved in the prescription
decision. 69% of patients agree that the advertisements help them get treatments they would not
otherwise receive (Murray et al, 2004). The majority of consumers believe that the main purpose
of the prescription drug advertisements is to “encourage me to talk to my doctor” (Federal
Register Comment, Eli Lilly, 2004). As discussed in section 3.1, approximately one-fifth of ad
viewers talk to their doctor about a condition or drug that they saw advertised. Moreover, 88% of
patients believe that the advertisements give them the confidence to talk to their physicians about
their concerns (Murray et al, 2004). In consumers’ opinions, drug advertisements successfully
increase awareness about different conditions and the treatments available, help patients
determine whether these treatments are appropriate for themselves or someone in their family,
and make them more confident in discussions with their physician.
Drug advertisements are less successful at informing patients of the benefits and side
effects associated with their medication, which 16% of people believe is the primary purpose of
the advertisements (Federal Register Comment, Eli Lilly, 2004). Nearly 60% of patients agree
that “advertisements for prescription drugs do not give enough information about the possible

34
risks and negative effects of using the drug” (Berndt, 2005). Consumers would like more
information about both benefits and side effects. 92% of patients said they would require data on
both benefits and side effects in drug advertisements, with 76.2% of patients indicating that they
would like to be informed of all possible side effects (Woloshin et al, 2004). Unfortunately, there
seems to be a divergence between what consumers want to know and what they can practically
assimilate.
A study by Eli Lilly (2004) showed that patients were able to recall information about
side effects more accurately if only four side effects were mentioned in the ad, rather than eight
or twelve. The four most common side effects were recalled at decreasing rates as the number of
side effects included were increased, suggesting that the inclusion of additional side effects
effectively diluted “the respondent’s ability to recall, arguably, the most important items in the
list of side effects” (Federal Register Comment, Eli Lilly, 2004). Overall, patients generally
recalled only one side effect. This data suggests that the “less is more” approach to the
communication of risk information may increase retention and comprehension.
In consumers’ opinions, drug advertisements do not provide information about benefits
and risks associated with a medicine in a useful manner. (Although studies question whether
patients would be able to assimilate this information even if it was provided in a clear fashion.)
Consumers believe, however, that the advertisements empower them to speak to their physician
and help decide which medications are appropriate for themselves and their family members.
3.8 Misconceptions Surrounding the Regulation of DTCA
There are many misconceptions surrounding DTCA. Although consumers have become
more skeptical of these advertisements, it is still important that consumers do not develop

35
misplaced expectations for advertised drugs based on an unwarranted sense of safety from
government regulations. Many consumers believe that only the safest drugs can be promoted
directly to consumers. Furthermore, 50% of ad viewers believed that the advertisements had to
be submitted to the government for approval before the advertisements are released (Bell et al,
1999).
Misconceptions Surrounding DTCA Thought ads had to be submitted to government for approval 50% Thought that only “completely safe” drugs could be advertised 43% Thought only “extremely effective” drugs could be advertised 21% Thought ads for drugs with major side effects were banned 22% Table 3.4. Common consumer misconceptions surrounding the regulation of DTCA. Taken from Bell et al, 1999.
The FDA requests that drug companies submit all their direct-to-consumer promotional
materials to the Division of Drug Marketing and Communication. However, many of the
materials are reviewed once the ad campaigns have already begun. Often times, the ad campaign
will have fully aired before the FDA takes any disciplinary action on advertisements that violate
regulations. Once violations occur, the FDA usually requests that the advertisements be
terminated immediately. The FDA may also request that pharmaceutical companies send letters
to physicians clarifying anything that violated the regulations. If the violations are egregious, the
FDA may also request that the pharmaceutical company air remedial advertisements correct the
information in the original advertisement. Since 1997, the number of DTC advertisements in
violation has decreased; though many attribute this to a growing number of advertisements with
few FDA resources to police the advertisements, not the improvement of DTCA compliance with
regulations.
Clearly FDA regulations surrounding DTC advertising do not provide the safety-net that
many consumers believe exits. Once the regulations were explained to consumers, 51% believed
that there should be more regulation, while 39% of consumers believed there is “just the right

36
amount of regulation” (Kaiser HealthPoll, 2005). Regardless of whether the regulations are
changed, consumers may benefit from knowing that any drug, regardless of its safety profile, can
be advertised.
False assumptions about the regulations can lead to an increase in the negative effects of
DTCA. Bell found that “individuals who held erroneous beliefs tended to be more aware of such
advertisements and were somewhat more likely to act on them” (Bell et al, 1999). Given the
highly contentious nature of DTCA, educating the public about the informational content and
monitoring of these advertisements may help to limit the negative impacts of DTCA.
3.9 Doctors Response to Patient Expectation
Studies thus far suggest that consumers are most aware of drug advertisements that
employ transformational messages, and contain little quantitative evidence about the benefits of
the drug. As Roth (2003) states,
“relating product benefits to positive motivations, primarily happiness and to a lesser extent social approval, appears to be effective in creating memorable messages, yet it is not often possible to associate product risks with transformational (desirable) motives – or do so in a manner that creates a fairly balanced advertisement. The results make a compelling inferential cast that benefit as opposed to risk information tends to be more highly associated with brand-level advertising awareness.”
This may explain why pharmacists believe over one-third of advertisements do not achieve “fair
balance” between risks and benefits, even through 98% of advertisements incorporate the
necessary risk information. Add to this that over half the population unjustifiably believes the
government provides protection from harmful DTC advertisements, and physicians are
confronted by patients who have vastly heightened expectations about advertised medications.
The law assumes that the physician is the agent who determines whether a prescription is

37
appropriate solely based on the scientific evidence and mediates the expectations the patient may
have, thereby protecting patients and the public from inappropriate prescriptions and unnecessary
rising prescription drug costs.
Unfortunately, studies indicate that physicians do not fully assume the role that the law
suggests. In general, physicians accede to patient requests because “[m]eeting patients’
expectations produces greater satisfaction with care, which in turn is related to greater adherence
to medical advice, less “doctor shopping” and a lower propensity to sue for malpractice”
(Kravitz, 2001). Physicians accede to both DTCA (78%) and non-DTCA generated requests
(72%) at a high rate (Mintzes et al, 2003). This is largely a factor of expectation. Bereger et al
(2001) determined that the issuance of a prescription is highly correlated with patient expectation
and physician perception of patient expectation. Mintzes et al (2003) showed that physicians
believed patients who requested a drug were knowledgeable about the therapy. This perception
of knowledge may be translated to the perception of patient expectation for a prescription,
potentially leading to inappropriate prescribing: evidence shows that many patients who request
drugs based solely on DTC advertisements have not been informed about the true efficacy of the
drug, and may have misunderstood the side effects of the medication. Therefore, physicians may
be mistaken in their perception that the patient is well informed, leading to questionable
prescriptions as both the patient and physician believe that the other is more informed. In fact,
“physicians were more likely to express ambivalence about drugs patients had requested,
particularly advertised drugs” (Mintzes et al, 2003). Meanwhile, physicians cite patient demand
as the number one reason for inappropriate prescribing (Rosenthal et al, 2002).
An innovative study by Kravitz et al. (2005) was devised to determine whether DTCA
requests led to an increase in appropriate prescriptions or for treatments that are only marginally

38
beneficial. They hired standardized patients, or actors, to visit physicians across the country
complaining about symptoms of depression or adjustment disorder. The actors would present
their symptoms and ask the doctor one of the following:
a) whether Paxil, an antidepressant they had seen advertised on TV was appropriate
b) for a treatment for depression after claiming to have learned about the disease
from an educational television program
c) make no request.
Physicians recorded depression as a possible diagnosis in 80% of the patients presenting with
depression and in 39% of the actors who displayed adjustment disorder with depressed mood.
The diagnosis of depression was much greater in patients who made a request for medication
(88%) than actors who made no request (65%). Similarly, actors presenting with adjustment
disorder were diagnosed with the condition in 50% of the cases when a drug request was made,
but in only 18% of the cases with no requests. The minimally acceptable care for those
diagnosed with major depression consists of a combination of a prescription for an
antidepressant, mental health referral, and follow-up within two weeks. The actors in this study
portraying adjustment disorder presented with mild symptoms, making “the prescription of an
antidepressant…at the margin of clinical appropriateness” (Kravitz et al, 2005).
The study clearly shows that general or brand specific drug requests increased the
probability that a patient receives the minimally acceptable care:
Table 3.5. Minimally Acceptable Care According to Patient Requests Actors with Major Depression Percentage Receiving Minimally
Acceptable Care Made Brand Name Request Based on DTCA 90% Made General Request Based on TV Program 98% No Request 56% Table 3.5. Number of patients receiving minimally acceptable care according to different patient requests. Taken from Kravitz, et al, 2005.
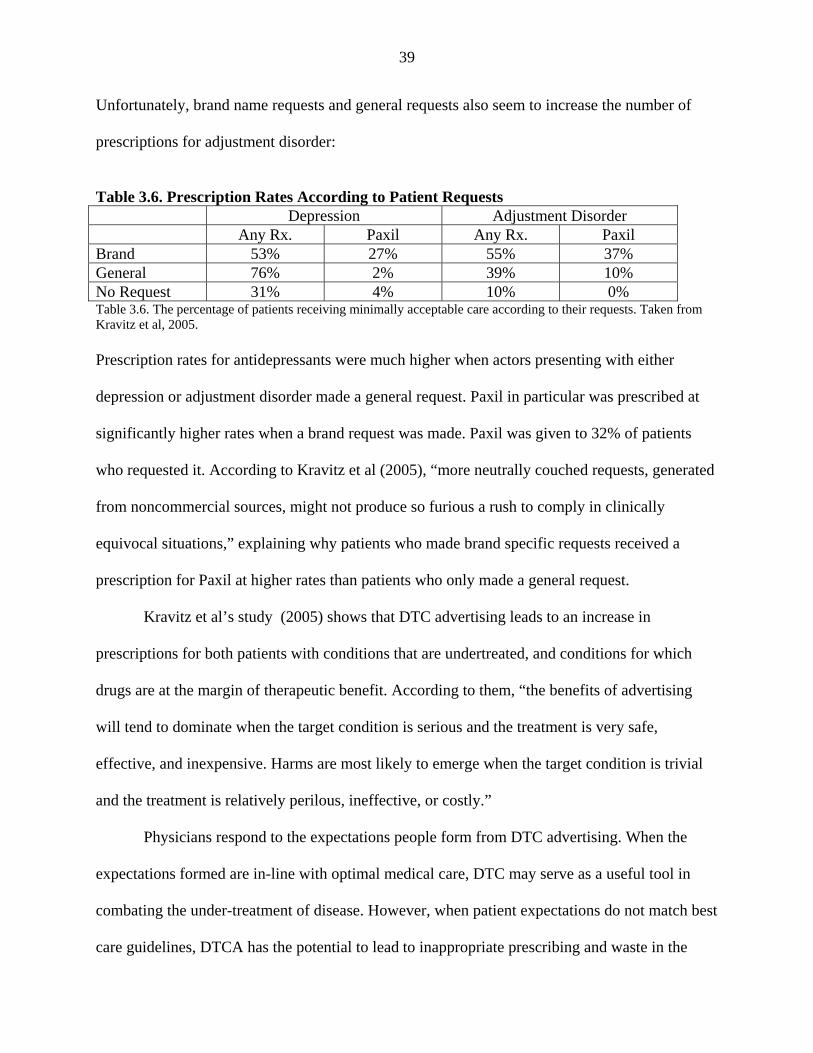
39
Unfortunately, brand name requests and general requests also seem to increase the number of
prescriptions for adjustment disorder:
Table 3.6. Prescription Rates According to Patient Requests
Depression Adjustment Disorder Any Rx. Paxil Any Rx. Paxil Brand 53% 27% 55% 37% General 76% 2% 39% 10% No Request 31% 4% 10% 0% Table 3.6. The percentage of patients receiving minimally acceptable care according to their requests. Taken from Kravitz et al, 2005. Prescription rates for antidepressants were much higher when actors presenting with either
depression or adjustment disorder made a general request. Paxil in particular was prescribed at
significantly higher rates when a brand request was made. Paxil was given to 32% of patients
who requested it. According to Kravitz et al (2005), “more neutrally couched requests, generated
from noncommercial sources, might not produce so furious a rush to comply in clinically
equivocal situations,” explaining why patients who made brand specific requests received a
prescription for Paxil at higher rates than patients who only made a general request.
Kravitz et al’s study (2005) shows that DTC advertising leads to an increase in
prescriptions for both patients with conditions that are undertreated, and conditions for which
drugs are at the margin of therapeutic benefit. According to them, “the benefits of advertising
will tend to dominate when the target condition is serious and the treatment is very safe,
effective, and inexpensive. Harms are most likely to emerge when the target condition is trivial
and the treatment is relatively perilous, ineffective, or costly.”
Physicians respond to the expectations people form from DTC advertising. When the
expectations formed are in-line with optimal medical care, DTC may serve as a useful tool in
combating the under-treatment of disease. However, when patient expectations do not match best
care guidelines, DTCA has the potential to lead to inappropriate prescribing and waste in the

40
health care system. This study by Kravitz et al (2005) and other studies clearly show that
“patients can sway physicians to prescribe drugs that they would otherwise not consider.” This
suggests that physicians may not solely determine the appropriateness of prescriptions based on
their medical knowledge as the law expects, and that patient expectations significantly alter this
judgment. Therefore, regulators cannot rely on physician judgment alone to prevent patients
from receiving inappropriate or unnecessary prescriptions. Instead, regulations should be written
that strive to place the expectations created from the emotional and informational appeals within
advertisements in-line with the currently accepted best care practices.
Besides increasing the number of prescriptions for advertised drug classes, DTC also
impacts other elements of health care, such as the physician-patient relationship, patient
satisfaction with their health care, patients’ adherence to physician recommendations,
medicalizing, and the cost of health care.
3.10 Physician-Patient Relationship and Patient Satisfaction
Though physicians have objections to DTC advertising, they also acknowledge its
benefits and believe they can handle the burden of inappropriate patient expectations. 41% of
physicians believe DTC advertising has beneficial effects on their interaction with patients, while
59% disagree. However, when asked about the last encounter in which a patient discussed a DTC
advertisement, 83% stated that the ad had no adverse effect on their interaction (Federal Register
Comment, Bureau of Consumer Protection et al, 2003). In fact, 53% of doctors thought they had
a better discussion with their patients as a result of DTCA (Mitka, 2003).
Physicians did complain however, about the extra time needed to correct misconceptions
generated by DTC advertisements. According to physicians, 26% of patients requested drugs
inappropriate for their medical condition or for conditions they did not have. 9% of patients

41
wanted a prescription rather than another more appropriate form of treatment. This leads 41% of
physicians to spend extra time correcting misconceptions (Mitka, 2003). Patients are aware of
the increased demand on physicians time: a survey by Murray et al (2003) found that 48% of
patients believe DTCA promotes unnecessary visits to doctors offices and 38% believe the ads
cause patients to “take up more of the doctors time.” It is difficult to determine whether this
increase in time is beneficial for the patient to convey new concerns to their physician, or
whether physicians are merely correcting the false expectations created by the emotional appeals
in the advertisements. Most likely, the increased time is beneficial for advertisements that
discuss widely under-diagnosed conditions, and harmful for conditions that are at the margin of
clinical benefit, as Kravitz et al suggest.
Though the advertisements place an extra burden on physicians to break down
inappropriate patient expectations, 53% of doctors claim they are not pressured to prescribe
(Mitka, 2003). However, 30% of patients feel the advertisements interfere with the physician-
patient relationship (Murray et al, 2004). This may reflect the fact that clinicians are more likely
to become frustrated with at DTCA generated request than requests from a “drug reference
book.” According to Zachry et al (2003),
“clinicians who received the DTCA patient scenarios were more likely to become annoyed with a patient who asked for more information about medications; less likely to answer the patients questions or provide additional written information; more likely to become frustrated or annoyed with the patient trying to ask a specific medication and less likely to provide samples or a prescription for the given medication.”
Patients may change physicians or health plans when a physician acts challenged or
denies a prescription for a DTCA drug. Patients who requested a medication but did not receive a
prescription were more likely to report a strained physician-patient relationship (Murray et al,
2004). In fact, 24% of patients were very likely to visit other physicians to get the prescription

42
they denied by their original physician (Bell et al, 1999). Overall, dissatisfaction with health
plans is twice as high among patients who were denied a prescription by their physicians (15%
vs. 7%) 18% of patients who asked for a prescription and did not receive it claimed they would
change health plans, while only 9% of patients who received requested prescriptions claimed
they would switch health plans (Thompson, 1998).
Though 92.5% of physicians claim they will not prescribe a medication in order to avoid
repeated requests, it is difficult to believe the physicians do not change their behavior in order to
appease patients (Zachry et al, 2003). As Kravitz et al’s study (2005) shows, physicians change
their prescribing behavior in order to meet patient’s expectations. This can have negative effects
when the prescription is inappropriate. When physicians do not accede to requests, patients often
feel that the physician-patient relationship is strained, and may actually change physicians or
health care plans.
There can be many beneficial effects to heightened expectations, such as an increased
efficacy of medication through the placebo effect or increased compliance. However, these
expectations by patients must be created to closely align with best care practices in order to avoid
the negative impacts associated with the denial of a request for a prescription.
3.11 Increased Efficacy of Medication through DTCA Mediated Placebo Effects
According to Almasi et al (2006), the psychological expectancies and health effects
created by the increasing volume of direct-to-consumer (DTC) advertisements may facilitate and
strengthen the placebo effect associated with receiving medical care. The pill, doctor, and device
are stimuli that trigger a placebo effect: “the nonspecific psychological or psychophysiological
therapeutic effect produced by a therapy that is used for its nonspecific therapeutic effect … but

43
is without specific activity for the condition being treated” (Shapiro, 1997). Identical
mechanisms apply to non-specific effects that augment therapies with known specific activity.
The magnitude of the effect produced can be highly influenced by information or suggestion
(Thomas, 1987; Lene et al, 2003; and Pollo et al, 2001). For example, 50% of the beneficial
outcomes associated antidepressant medications may result from the expectancy of relief, while
the active ingredients account for only 27% (Kirsch et al, 1999). Similarly, one third of patients
report relief from postoperative pain, cough, headache, and other conditions when given a
placebo (Beecher, 1955).
The emotional appeals in advertising not only function to create consumer demand for
the advertised products, but also create the expectancies that are key to enhancing a placebo
effect that occurs when the medication is taken. Through both emotionally conditioned responses
and observational learning of expectancies, patients learn about the rewards that will follow
when they take the advertised medicine. This initial expectation of benefit from the advertised
medicine is the foundation of the placebo effect.
The advertisements further seek to tailor the placebo effect with additional cues
associating a particular form of relief with a visually distinct product. For example, large tablets
engender a greater placebo effect then average-sized tablets, while extraordinarily small tablets
also have an enhanced effect (Morris, 1997). Advertising for Nexium modifies the cultural
placebo through color. The field of lilacs at the end of the commercial matches the color of the
capsule, reminding the viewer about the healing power of the “purple pill.” The emphasis on the
color of the pill throughout the commercial, and the name of its consumer website
(www.thepurplepill.com) create a conditioned stimuli that works to enhance the placebo effect of
taking the medication.

44
Through previous encounters with medical care, patients are already conditioned to
associate medications with relief. DTC advertisements reinforce and amplify this association,
and tailor it to the specific products they describe. In this way, DTC advertising facilitates a
placebo effect of larger magnitude than would otherwise be expected from a prescription
medication.
A second implication is that patients’ positive expectations from DTC advertisements
may potentially reduce the amount of treatment requested or required (Walach et al, 1999). An
enhanced placebo response could also improve patient adherence and outcomes (CDER, 2002).
To the extent that advertisements “reward” patients for the same actions that physicians
recommend, patients may be more likely to follow treatment instructions and may enhance the
physician-patient relationship (Murray et al, 2003). Physicians may facilitate a placebo response
to the medications they prescribe by successfully borrowing strategies from DTC advertising. In
fact, improved communication might result from personalizing the need for treatment, placing
treatment benefits in perspective relative to drug side effects, and providing testimonial examples
of past treatment successes.
Optimal use of DTC advertising may require stricter guidelines on DTC advertisements
or more aggressive enforcement of current guidelines so that patients do not form unreasonable
expectations. Diminishing the demand for inappropriate prescriptions would lessen the negative
impacts of DTC advertising. Meanwhile, exposure to DTC advertisements might, nonetheless,
continue to improve health practices and outcomes through its ability to induce a placebo effect.

45
3.12 Compliance.
The failure of patients to comply with their physicians recommendations is a critical
problem in health care. According to Woshinka (2005),
“Poor compliance occurs no matter how severe the potential consequences – even among patients with kidney transplants and frequent seizures. It is attributed to causes 125,000 premature deaths each year in the United States and increase rates of hospitalization….The annual cost of non-compliance to the United States economy has been estimated at a staggering $100 billion in added health care expenses and lost productivity.”
Many patients and physicians believe that DTCA has helped to combat this problem.
22% of patients said the advertisements made it more likely that they would take their
prescription medications regularly (Holmer, 2002). A study by the FDA showed that 33% of
physicians believe advertisements increase adherence (CDER, 2002). In fact, the probability that
a patient who received a prescription would remain with the regimen for more than six months
was much greater if the patient asked for the drug after seeing a direct-to-consumer
advertisement, according to Pfizer (Holmer, 2002). This claim has also been supported by work
from Donohue.
Woshinka (2005) used prescription data to examine compliance by measuring the number
of days between renewing a prescription. She states:
“Patients who started on paid therapy during months of higher advertising activity…are, on average, more compliant. Notably, only category advertisements matters, which gives further evidence of informational spillovers in DTC advertising. This translates to a very low missed days eleacticity of -0.05.”
Wosihinka suggests that patients who begin therapy following high advertising for the given
drug class appear to be more compliant because they were the ones to initiate the process, as a

46
result of the motivating advertisements. Again, expectations of the drugs may lead to better
outcomes through improved diagnosis and improved adherence to the therapy.
3.13 Medicalizing
Medicalizing is a term used to describe the process in which medical problems are
redefined to expand the number of patients who may benefit from pharmaceuticals. This may
include “turning ordinary ailments into medical problems, seeing risks as diseases, and framing
prevalence estimates to maximize potential markets” (Moynihan et al, 2002). DTC
advertisements may be medicalizing certain disease: 39% of advertisements encouraged people
to consider a medical cause for their experiences (Woloshin et al, 2001). These messages may be
socially beneficial when they target hyperlipedimia or hypertension, but may be inappropriate
when discussing the emotional trauma of everyday experiences. According to Moynihan et al
(2002),
“inappropriate medicalizing carries the dangers of unnecessary labeling, poor treatment decisions, iatrogenic illness, and economic waste, as well as the opportunity costs that result when resources are diverted away from treating or preventing more serious disease….The costs of new drugs targeted at essentially healthy people are threatening the viability of…insurance systems” and increasing costs for private health plans.”
The rise in unnecessary prescriptions, both from medicalizing and inappropriate prescribing, are
one of the many costs associated with DTC advertising.
3.14 Costs of DTCA.
There are several costs that should be considered when examining the effects of DTCA:
first the cost of the advertising, which may influence the price of medications. Then one must
examine how advertising affects the efficiency of prescribing: do advertisements help to

47
facilitate the spread of information such that patients receive appropriate medications that
prevent hospitalization and other costly care; or, do pharmaceutical markets expand to patients
through medicalization?
Advertising accounts for a little under one fifth of pharmaceutical companies operating
expenses each year. Of this budget, only about 16% is directed toward consumers, with the
majority of advertising directed to physicians through office detailing and free samples (Federal
Register Comment, Bureau of Consumer Protection et al, 2003). Several studies have shown that
this advertising does not lead to an increase in the price of advertised pharmaceuticals.
According to Pfizer, “sellers typically engage in advertising in order to increase sales – and when
that occurs, the cost of advertising is spread over a larger pool of sales units, thereby reducing
the per-unit overhead costs accordingly. Moreover, increased sales can both recover advertising
costs and increase the total return to the manufacturer of the advertised drug.” (Federal Register
Comment, Pfizer, 2003) Rosenthal et al (2002) confirmed that relative to sales, total spending on
promotion has remained fairly constant at 14 to 15 percent. This implies that the major costs and
benefits associated with advertising focus on its ability to disseminate information to patients and
physicians.
Several studies have shown that advertising can engender or exaggerate product
differentiation, which creates barriers to entry in the market. Advertising for product’s whose
quality and impact can be discerned prior to purchase through search qualities (visual, tactile, or
analytical inspection) are usually subject to informational appeals. Products whose qualities can
only be observed through consumption have experience qualities, and are usually advertised
through persuasive appeals. The brand loyalty that is generated through both types of advertising
may reduce price elasticity of demand, and also reduce consumers’ and physicians’ search costs.

48
The advertisements may also serve to create brand loyalty such that it becomes a barrier to entry
for generics. The pharmaceutical market is particularly vulnerable to such rent-seeking outlays
due to the regulations surrounding the prescription of medications.
Though demand for pharmaceuticals is conventionally considered an inelastic good,
Hurwitz et al (1988) showed that demand is elastic in the absence of promotion. This partially
can be explained by studies that show physicians beliefs about specific drugs are closely aligned
with their advertising claims, rather than drug performance measures. Rizzo (1999) tested this
hypothesis that advertising decreases the price elasticity of demand, which may cause consumers
to pay a higher price for advertised pharmaceuticals, by analyzing the prices of brand name
antihypertensive drugs marketed in the United States between 1988 and 1993. In the absence of
any detailing, price elasticity ranges from -1.82 to -2.67, indicating that sales respond to changes
in price. When products are advertised, price elasticity falls to -1.26 to -2.11. Through this is still
within the elastic range, detailing stock reduces the price elasticity of demand. Price elasticity
becomes inelastic with short-term changes in detailing flows.
Furthermore, advertising while the drug is still under patent has lasting effects once the
drug faces generic competition: an additional year of advertising under patent leads to an
additional 1.6% of market share for the leader after the patent has expired This goodwill is
generally used to substitute for promotional activities post patent, rather than enhancing market
share (Hurwitz et al, 1988).
Vogt and Bhattacharya (2003) created a model which indicates that drug prices are kept
low and advertising expenditures are initially high to build public exposure and experience with
the drug. As this knowledge base grows, prices rise and advertising expenditures fall. Their
model confirms Hurwitz et al (1988) report that doctors often form prescribing “habits,”

49
implying that pharmaceutical companies should invest in building knowledge base and
accessibility in early stages, and then raise prices as demand for the drug increases to exploit the
“knowledge stock.”
According to Coscelli (2000), the brand loyalty and habit persistence of doctors are
responsible for the stickiness of the pharmaceutical market, which causes consumers to pay a
premium for the pioneering brand instead of switching to a generic once the patent expires. This
first-mover advantage implies that consecutive entrants have to advertise at an increasing rate to
gain market share, which is consistent with the empirical data for drugs in many classes. The
decreasing return on advertising for consecutive firms re-enforces Hurwitz et al notion that firms
can build-up a "good will" asset through advertising that helps to maintain its market share.
Overall, marketing elasticity of demand for DTCA ranges from 0.096 to 0.114, meaning
10% increase in DTCA leads to a 1% increase in sales when all else is equal. Between 1999 and
2000, the 12% of the growth in total prescription drug spending, or $2.6 billion, can be attributed
to DTCA, yielding $4.20 for every dollar spent on DTC advertising (Rosenthal et al, 2003). A
study by Zachry et al (2002) showed that advertising increased both the rate of diagnosis and
prescription for advertised drugs and the condition they treat. Though the authors do not imply a
causal relationship, they found that every $1000 increase in advertising of antilipemics resulted
in the diagnosis of 32 to patients and 41 patients receiving a prescription for hyperlipidemia.
Zocor specific advertising also raised the prescription for Zocor specifically.
Clearly the informational content and persuasive appeals in the advertisements lead to
prescriptions and stickiness within the pharmaceutical market. Kravitz et al (2005) suggest that
the increase in advertisements is for both under diagnosed conditions and for therapies at the
margin of clinical benefit. In New Zealand the government noted that prescription drug

50
advertisements tend to shift demand from older therapies, to newer more expensive medications.
“For example, there was a significant shift in the mix of Metered Dose Inhalers from
beclomethansone to flucticasone (Flixotide) following Glaxo Welcome’s Fluxotide DTCA
campaign” (Wilson, 2003). This is just one example of the significant costs associated with
DTCA.

51
4. Study Design
Advertising in general, but specifically within the pharmaceutical sector, is not a
homogenous good. Therefore, it is not possible to study the effects of advertising by a particular
brand or drug class without measuring the quality of the prescription drug advertisements. In this
study, we examine “quality” from a public health perspective: measuring the content of the
information provided in the advertisement as well as the accessibility of that information by the
consumer.
Print advertisements were examined for osteoarthritis and hyperlipidemia that were
published between January 1999 and September 2004. These two drug classes were chosen
because they represent the two most heavily advertised prescription drug classes during the study
period. They also characterize vastly different types of conditions: osteoarthritis is a disease that
may cause patients a significant amount of pain, and represents a drug class that is likely highly
influenced by the emotional expectation of pain relief; hyperlipidemia is a condition with no
symptoms which is widely under diagnosed throughout the population, and represents a class
that is likely to be influenced by educating the public about the condition.
COX-2 drugs, a common treatment for osteoarthritis, have been under great scrutiny
since December 2004, when Merck voluntarily removed Vioxx from the market after it was
publicly shown to increase the risk of heart attack. Though this has the potential to introduce bias
into the study, we felt the specific nature of the rating categories would prevent the negative
connotations subjects may have garnered about Vioxx to influence the results significantly.
Furthermore, studying the COX-2 drug class is particularly interesting, because it may shed light
on the role of DTC advertising in extending the use of these drugs to patients who should have
taken non-steroidal anti-inflammatory (NSAIDs, such as ibuprofen).

52
Print advertisements for medications in these two drug classes were collected from
several popular magazines which print many DTC advertisements. These magazines generally
have readership that are inclined to be more aware of DTC advertisements (women and people
over 65), but represent a wide variety of interests. The magazines that were used to collect the
print advertisements include:
People US News and World Report Redbook Time Reader’s Digest Newsweek
64 DTC advertisements were collected, which were part of 32 distinct ad campaigns.
Often a particular advertisement will have several different versions, in which only the picture
and tagline have been changed. This is likely done to attract different audiences to the same
information. For instance, advertisements will tailor one image to males and another image to
females. In our study ad campaigns constitute advertisements that are identical except for the
image and tagline. The timing of each ad campaign was recorded, generating a list of the
advertisements that appeared for drugs within these two drug classes between January 1999 and
September 2004.
The advertisements were photocopied from the magazines, and then placed into a binder.
Only the body of the ad, and not the accompanying brief summary were given to raters because
“it is commonly believed that consumers pay little attention to such fine print, and previous
research indicates that risk information presented in full disclosure format similar to typical brief
summaries has little effect on recall” (Roth, 1996). The portion of each advertisement containing
risk information was bracketed on each advertisement so that raters could judge the quality of
benefit and risk information separately. An ad ID was also generated for each advertisement.

53
Each ad was assigned an individual number, and also a letter that corresponded to the ad
campaign associated with it. This binder, along with a set of instructions, and 40 copies of the
assessment tool was given to study participants to rate the presentation of the information in the
drug advertisements.
15 participants were recruited through a campus e-mail flyer to rate the prescription drug
advertisements. In exchange for rating the ads, which took approximately four hours, participants
were compensated with a $100 American Express Giftcard. Each participant was asked to rate
all 64 advertisements. A complete assessment was used for each ad campaign, and a shortened
assessment was completed for the other advertisements that belonged to the same ad campaign.
(The shortened assessment was created to minimize the fatigue on raters in judging identical
characteristics, such as font size, for ads within the same ad campaign.) The advertisements were
selected to appear in a different random order for each study participant. A computer program
was written that first randomized the order of the distinct ad campaigns, and then randomly
ordered the advertisements within each ad campaign. The response rate for each category and
each ad was nearly 100%.
4.1 Methodology for Rating Quality of Advertisements: The DTC Assessment
A content analysis was used to quantify the advertisement quality. With the help of the
Department of Drug, Marketing and Communication at the FDA, a DTC assessment was created,
which consists of two parts:
Presentation Assessment: This survey is administered to consumers to measure the ease
of accessibility of information within the advertisement. Categories include font size,
headings, and spacing.

54
Content Assessment: This portion of the survey is administered by an individual
familiar with the advertisements. It compares the informational content in the
advertisement to the drug’s Patient Package Insert (an informational pamphlet
accompanying a prescription when it is given to patients) as well as information about the
disease taken from WebMD. Categories include side effects, efficacy, and symptoms.
The two assessments emphasize the importance of both the content and presentation of
information in the advertisement. From a public health perspective, it is important for patients to
create proper expectations from the advertisement. Therefore, we rate the amount of information
pertaining to the disease the drug is indicated to treat, the benefits of the drug, and the risks
associated with the drug. Beyond the informational content, it is necessary to rate the
presentation of the information as well, because DTC often advertisements emphasize the benefit
information and minimize the risks. For instance, pharmaceutical companies may print the risk
information that is mandated by the FDA (warnings, contraindications, and side effects) in
smaller font at an obscure placement within the ad to make it relatively less accessible to the
reader. (Figure A4.1. An ad for Levitra provides a good example.) Drastic differences in these
qualities may constitute a breach of the “fair balance” requirement by the FDA. Even when “fair
balance” was not violated, “benefit information was better recalled than risk information”
(Wogalter et al, 2002). This suggests that it is crucial for advertisements to make the risk
information at least as accessible as the benefit information in order to achieve true balance.
A study by the FDA on the format of the brief summary (the page accompanying the drug
ad that describes in more detail and the risk information) revealed consumers have specific
preferences in DTC advertisements. These criteria can be found in Table A4.1.

55
Wogalter et al (2002) showed that consumer preference relate closely with the ability to
recall information. “The concurrence of the preference/performance measures is consistent with
theory concerning learning styles and schemas, that individuals prefer presentation formats that
are consistent with their learning styles…advertising research indicates that preference reflects
likeability, which in turn positively influences recall.” In fact, previous studies have shown that
“patients are more likely to comply with recommendations for use when the information is
communicated directly and in an understandable manner” (Wogalter, 2003). Therefore, we
incorporate many of the consumers’ preferred categories into the DTC assessment, because
preference seems to be a good proxy for the effectiveness of informational transfer from the
advertisement.
4.2 Presentation Assessment
The Presentation Assessment contains 24 categories, and asks for both objective and
subjective responses to the advertisements. Initially, raters are asked to judge the overall quality
and balance of the ad as well as the pertinence of the image and tagline. Afterwards, they are
asked to objectively rate the benefit and risk information separately on 15 different criteria,
which ask questions about the use of headings, font, color, and text blocks. The assessment asks
for raters to judge the benefit and risk information separately to determine whether both types of
information meet a basic presentation threshold for accessibility. This format also allows
comparison of the relative accessibility of the benefit and risk information. Finally, the survey
incorporates a section in which the raters are asked to give their subjective opinion on the
accessibility of the risk and benefit information. This subjective comparison gives raters the

56
opportunity to convey any preferences that may not have been made explicit by the rating criteria
that were objectively delineated.
The presentation assessment begins by asking the rater to judge the overall ad design.
This prompts the rater to examine the ad and provide a first impression. Next, the rater is
prompted to read the advertisement in order to compare the language used to frame the risks and
the benefits. The risks and benefits should be framed such that they are both easy to read and
equally captivating. For example, if the active pronoun “you” is used to described the benefits,
then the risk information should also use the personal pronoun. Afterwards, the rater is asked to
judge whether the location of the risk and benefit information makes them equally prominent. If
the risk information is not located in a place with equal emphasis, consumers may glean past the
information completely. Studies have shown many older adults do not recall any risk information
incorporated into an advertisement.
Finally, the rater is asked to evaluate the pertinence of the image and tagline to the
product that is being advertised. Since images offer more stimulation than text, it is important to
determine whether this component of the advertisement is relevant to either the disease or
therapeutic benefit of the drug. Images that just depict “happy people” may create the
expectation that a particular prescription drug will enhance a patient’s quality of life in general,
not the quality of life in regard to a particular condition. Similarly, the taglines of advertisements
are often quite memorable, and should also be tailored to the disease or benefit of the drug, not
just general happiness. Simply depicting happiness may increase a patient’s expectation of a drug
without regard to the therapeutic benefit that the drug actually provides. Though these images
cannot be directly regulated by the FDA due to a variety of complex legal issues, it is important
to measure the impact of the expectations created by these depictions. To simplify the rating of

57
images, raters were simply asked to determine whether the image and tagline referred to
happiness in general, or whether they were specific to either the disease or therapeutic benefit
one would expect to receive from the drug.
The objective categories in the DTC assessment align closely with both the preferences
revealed by the FDA survey and work done by various researchers to determine the format
characteristics that enhance information recall. The first part of this section measures the use of
headings both to highlight important information and to segment text into smaller text blocks.
According to Wogalter et al (2002), “the presence of physical features (eg, color) that distinguish
the risk information from other text facilitated knowledge acquisition.” Likewise, Marrow et. al
(1995) showed that information contained in lists were more effective than when formatted in
paragraphs. The “headings” ratings combined with the use of bullets measures the use of lists
within the advertisements.
The next broad category within the assessment addresses the quality of the font used to
convey information. Raters are asked to first examine how easy it is to read the font itself, and
whether the letters are dark enough. Next they rate the size of the font, which has a significant
effect on recall according to Wogalter et al (2003). “Performance was significantly better in the
medium and large print conditions than in the small print conditions – with the latter not
differing from [no information at all].” Besides the size of the text, raters are also asked to
determine whether the spacing between the lines and between letters is adequate. Young et al
determined that the width of the characters in printed warnings affects the perceived legibility
and reading speed, while Hartley showed that increasing the vertical spacing between text
facilitated reading comprehension. Together these five characteristics of font are instrumental in
making the text inviting, and thereby accessible to readers (Wogalter, 2003).
58
The raters are also asked to rate several categories that probe how different ad elements
distract the reader from the text. First, the rater determines whether the color scheme and contrast
between the text and the background facilitates reading. Next, the rater determines whether the
image distracts readers from focusing on the text. Finally, raters are asked whether there is
enough space between the text and other features, and if the width of the paragraph is pleasing.
(This probes the idea that there should not be “one giant text block”.) Taken with the measures of
font and headings, these categories quantify many elements that affect a reader’s initiative to
read a text and their ability to recall information.
The categories in the presentation assessment incorporate nine of the eleven categories
mentioned by the FDA focus groups. (Table A4.1) The presentation assessment does not rate
whether the drug name is clearly visible at the top of the page, because this was deemed to be a
content criterion. (FDA regulations require the name of the drug be prominently displayed along
with the chemical name.) The presentation assessment also does not ask raters to quantify the use
of bullets. This quantification can easily be determined by a single individual, and therefore was
incorporated into the content assessment in order to reduce the length of the survey that was
administered multiple times to survey participants. (Several other “presentation” categories were
shifted into the content assessment for the same reason. These include whether the text was
justified, use of both upper and lower case letters, and a measure of the reading level of the text.)
The majority of the categories are scored out of either one or two points. The use of a one
point measure makes it easier for raters to determine whether an ad meets the specific criteria.
Though the assessment tries to make many criteria as objective as possible, personal taste may
still effect the perceived appearance of the advertisement. Compressing the grading scale forces
people to make simpler decisions about rating each criteria, which increases the inter-rater

59
reliability and the validity of the study overall. Several categories were listed out of two points
with 2 corresponding to the most sufficient advertisement, 1 corresponding to a somewhat
sufficient advertisement, and 0 corresponding to an advertisement that does not meet the criteria
at all. Two categories, font size and contrast have a larger scale range to represent the much
larger variance within these two categories. Since the absolute scores are not designed to form a
total “presentation” score, the absolute value of the ratings of each category have no bearing on
the relative importance of each category. Instead, percentages from each category should be
summed in order to obtain an overall score.
The Presentation Assessment aims to measure the overall impact of the advertisement as
well as the accessibility of the information within the advertisement. Ideally, advertisements
would have an appealing design with images and taglines pertinent to the treatment of disease,
while making the informational content of the advertisement easily accessible.

60
Thank you for participating in my study. You will be asked to rate prescription drug advertisements on objective and subjective criteria. The following binder contains 33 different “ad campaigns” with some ads having multiple versions (i.e. they are several versions of a particular ad campaign with different pictures.) For each ad please fill out the DTC Assessment, which has two parts: the first part asks you to rate particular criteria, and the second part asks your subjective opinion of the advertisement. If there are several ads within the same ad campaign, please fill-out the remaining questions on page 2 corresponding to how the different images effects the quality of the ad within the campaign. (There is a separate page with just this portion of the questionnaire if there are more than three ads within a given campaign.) Here are some suggestions for the DTC Assessment:
1. Begin by turning to the back of the ad and locating the AD ID, which is written on a blue or red sheet of paper. The AD ID is a number, followed by a code. Here is an example: #10000 ZZ1. Please write this in the box on the upper left hand corner of the survey.
2. The advertisements have been divided into two categories: benefit and risk. The risk
information has been marked by lines and labeled on each ad. The benefit information consists of the remainder of the advertisement. Please rate some basic feature of the ad, such as the “Ad Design”, “Framing” and “Location” of the information.
3. Please rate the image and the tagline: circle SPECIFIC if the image relates directly to the condition or the benefit of the drug (i.e. a healed wound for a bandaid advertisement); otherwise the image is considered GENERAL. Similarly, if the “tagline” or the “slogan” of the ad relates specifically to the condition or the benefit, please circle SPECIFIC, otherwise circle GENERAL.
4. Next please rate the benefit information and the risk information separately based on the
following categories: Headings
1 pt: Use of bold letters, large font or different colors to make the headings stand out. 1 pt: Headlines provide information that is useful 1 pt: The headline directly relates to the text that follows 1 pt: Good ratio of headlines to text
Font 5 pt: Size of the font (Please see scale on survey – the scale is a crude outline to scoring – please score the size of your font at your discretion, taking the scale only as a suggestion.)
Directions to the Presentation Assessment

61
Again, these are just rough guidelines – please rate the color and contrast at your discretion, taking these only as suggestions. Color:
1 pt: Contrast “Dark Colored” text against “Light Color” Background Dark Colors Light Colors Blue Orange Violet Yellow Purple Green Red Blue-green
Contrast: 3 pts: There is enough contrast between the text and the background. (Please see examples.)
EXAMPLES: 4 pts 4 pts 4 pts
1 pt 2 pts 3 pts

62
5. Please turn to page 2 of the survey, and give your opinion on the various broad categories
within the advertisement. Specifically, within these broad categories does the presentation of the information make the Benefit section (B) or Risk section (R) easier to read. If they are the Same, please circle (S).
6. You have completed rating one ad. Please turn to the next ad, and check the AD ID. If the
AD ID has the same letter as the previous ad (ZZ 2 in our example) please proceed to the lower half of page two and only fill out certain categories for ads within the same “campaign.” If you need more of these “brief versions” there is an extra page with just these categories.
I have included a sample “grading” of a Levitra ad for your reference. Thank you very much for your help. Please let me know if you have any questions or suggestions at (xxx) xxx -xxxx or at [email protected].

63
DTC Assessment (Print)
Benefit RiskHeadings Stand apart from text (i.e bold/different color)
Headlines provide good information Headlines relate to the text that follows Good ratio of headlines to text
/1 /1 /1 /1
/1/1/1/1
Font Font is easy to read Letters are dark and wide enough 0 pt: Size of Font or smaller
Size of Font 2 pt: Size of font 3-4 pts: Size of font 5 pt: This size of font or larger Adequate space between letters Adequate space between text lines
/1 /1
/5
/1 /1
/1/1
/5
/1/1
Color and Contrast
Between color of text and background 0-1pt: Color Scheme 0-3 pts: Contrast
/1 /3
/1/3
Image
Does the image distract your from focusing on the text? 0 pts: Very distracting- difficult to focus 1 pt: Somewhat difficult to focus 2 pts: Not distracting - easy to focus
/2
/2Text Block Enough space between text and other features.
Pleasing width of paragraphs. /2 /1
/2/1
Content Order of Information /1 /1
Ad Design Is the overall layout of the ad easy to read?(0 pts: No; 1 pt: Somewhat; 2 pts: yes)
/2Framing Are the risks and benefits framed in
language that is equally accessible to you? (0 pts: No; 1 pt: Somewhat; 2 pts: yes)
/2
Location Are the risks and benefits located such that they receive comparable emphasis? (0 pts: No; 1 pt: Somewhat; 2 pts: yes)
/2
Image
Depicts Benefit of drug or Condition
GENERAL
SPECIFIC
Tagline
Describes Benefit of drug or Condition
GENERAL
SPECIFIC
AD #: ________________________
Ad Rater ID: _________________________

64
Subjective Impressions: Please circle whether you thought the following made it easier to read the information in the Benefits section (B), the Risks section (R), or if they were the same (S).
____________________________________________________________________ For ads in the same ad campaign (i.e. AD ID starts with the same letter.) In these ads, all the information provided is the same, the only difference is some of the promotional text and the image. AD ID____________________________________________
AD ID____________________________________________
Headings: Segment the text into easily understandable parts. R B S Font: The text features make the ad easy to read. R B S Color and Contrast: The color and contrast make the text easy to read. R B S Image: The image does not distract you from focusing on the text. R B S Text Block: Shape and location of text block makes text easy to read. R B S Content: The order of the information provided. R B S Accessibility: The information is easily accessible. R B S
Image depicts Benefit of drug or Condition
GENERAL
SPECIFIC
Tagline describes Benefit of drug or Condition
GENERAL
SPECIFIC
Color and Contrast
Between color of text and background 0-1pt: Color Scheme 0-3 pts: Contrast
/1/3
/1/3
Image
Does the image distract your from focusing on the text? 0 pts: Very distracting- difficult to focus 1 pt: Somewhat difficult to focus 2 pts: Not distracting - easy to focus
/2
/2

65
4.3 Content Assessment
The content assessment measures the quantity of information presented within the advertisement.
This incorporates both the information that must be included in all advertisements according to FDA
regulations, as well as information that should be included in advertisements from a public health
perspective. The content assessment includes five distinct categories: regulated benefit information,
regulated risk information, other benefit information, disease information, and objective presentation
details. Regulated Benefit information includes:
• Indication (name of condition that the drug treats)
• Approved patient population (the patients for which the FDA has approved the drug)
• Required supportive behaviors (behaviors that the FDA indicates must be practiced while taking
the drug, such as diet for cholesterol lowering medications)
• Contaminant therapies (other drugs that should be taken with the advertised medication)
• Intended use of the drug (for example, whether the drug is used to prevent asthma attacks or at
the time of an asthma attack)
• Onset of effectiveness (the time it takes for the drug to being working)
• Length of effectiveness
• Duration of treatment
Other categories may fall into the regulatory domain if they are included within “indication” of the
patient package insert, or when regulators believe the advertisement would be misleading if the
information was omitted. For example, Muse, a medication used to treat erectile dysfunction, was
required to include the drug delivery method, because regulators felt patients would be surprised to learn
that it was delivered by injection. Other categories that may fall under the regulatory domain include

66
symptom information, and other benefit information (a category that includes the discussion of positive
side effects, such as a decrease in acne for patients who use oral contraceptives.)
The benefits section includes categories for the success rate of the drug, “other benefit information”,
long term benefits, the mechanism of action, drug delivery method, time to onset of action, and
supportive behaviors. Together these categories describe the basic information a patient should know
about the effectiveness of a medication. Studies by Woloshin et al (2004) show that patients are much
better able to determine the effectiveness of the advertised medication from advertisements that contain
a benefit box, which compares the effectiveness of the advertised drug to either other therapies or
placebo. By providing the concrete benefit information described by the seven benefit categories,
readers may become informed consumers who have better tools to judge the effectiveness and
appropriateness of a medication.
Similarly, by including disease information readers may be better able to determine whether they or
someone they know is afflicted by a certain condition. The disease information section includes
categories on the symptoms and risk factors. Incorporating this information into advertisements is
essential for advertisements to achieve their ability to motivate patients with under-diagnosed conditions
to visit their physicians.
Finally, the risk section incorporates categories that are mandated by the FDA: warnings,
contraindications, and the most common side effects. The rater also determines the strength of the
headline used to attract the reader to the risk information (please see the directions for the content
assessment) and whether the advertisement compares the prevalence of these side effects to placebo.
The content analysis also includes a few presentation categories that would be unnecessarily tedious
for survey participants to rate. These include whether the text is justified, if it uses bullet points to
segment the text, and whether the text is written in both upper and lower case letters. The text of both

67
the benefit and risk information is also entered into a computer to determine the Flesch-Kincaid Reading
Level. Kaphingst showed that materials for the general public should be written at or below an eighth-
grade reading level (Kaphingst et al, 2004).
Lastly, the content analysis includes a measure of the informational and educational value of the
image and tagline. The image and tagline should not contradict any information within the
advertisement or exaggerate the benefits one would expect to receive from the medication.
The content assessment may be rated by just one individual, by making direct comparisons
between the information contained within the advertisement, the Patient Package Insert, and disease
information from WebMD. The Patient Package Insert is patient information approved by the FDA and
provided to patients with every prescription. It contains information on both the benefits and risks
associated with the medication. WebMD is a popular and reliable source for basic disease information.
By making direct comparisons between these two sources and the advertisement, one may deduce the
degree to which the advertisement parallels the information available about both the disease and the
advertised drug without introducing any bias. As with the presentation assessment, the relative
weightings of each category are insignificant, as the percentage of information within each category is
summed to form the total content score. However, an advertisement may have a high content score and
still be in violation of FDA regulations if it is missing key information within the regulated categories.
The benefit, risk, and disease categories within the content assessment describe the basic
information patients should have before making decisions about prescription medications. By providing
this information, the risk of inappropriate prescribing as a result of heightened patient expectation or
misinformation is minimized.

68
The following descriptions should help you rate the content of advertisements using the DTC Assessment survey. If you have any questions, please contact Elizabeth Almasi at [email protected] or by phone at (xxx) xxx-xxxx. Not all categories are relevant to each medication. If the category does not pertain, please write N/A in place of the score. In these instances, the category will be removed from the total, and the content will only be measured by the categories that pertain to the medication. Risk Information The FDA approves the warnings, contraindications, and most common side effects that should appear in the Patient Package Insert. Please use your best judgment to determine whether the information regarding risk information is presented within the advertisement.
Benefit Information The benefit information has been broken into two categories: information that must be included in the advertisement according to FDA guidelines (which are included in the Indication section); and other information that would ideally appear within the body of the advertisement. Indication 3 pts: Names the condition that the drug treats. Indication 3 pts: Describes the appropriate patient population. Deduct 1
pt. for each error or omission. Indication 3 pts: Lists the required supportive behaviors (ex. Diet and
exercise for statins) Deduct 1 pt. for each behavior omitted. Indication 3 pts: Lists the therapies that should be taken in conjunction
with the advertised medication. Indication 2 pts: Indicates whether this is a second line therapy.
(Ex. Asthma medications such as Singulair versus inhalers.) Indication 2 pts: Indicates the onset of the effectiveness of the drug. Indication 2 pts: Indicates the length of effectiveness of the medication. Indication 2 pts: Indicates the duration of the treatment time.
Warnings Deduct 2 pts. For every relevant warning that is omitted. (ex. No need to include warnings that some people may be allergic to ingredients.)
Contraindications Deduct 2 pts. for every relevant contraindication that is omitted.
Most Common Side Effects
Deduct 2 pts. for every relevant common side effect that is omitted.
Most Severe Side Effects
Deduct 2 pts. for every severe side effect that is omitted in the advertisement.
Directions to Content Assessment.

69
*Other Benefit Information
Includes other benefit information for taking this particular medication within the drug class, such as mentioning fewer side effects or less frequent dosing requirements. Information should not be vague or misleading.
*Drug Delivery Information
Must be included if the deliver method varies from the expected form. (ex. Muse is only injectable.)
Success Rate Gives indication of benefit. 2 pts: Vague terms 4 pts: Explicitly states absolute risk reduction (i.e. Reduce risk of disease by 40%) 5 pts: Explicitly states number needed to treat (ex. need to treat 100 people before averting 1 case), or absolute risk reduction in conjunction with the actual prevalence of disease with and without the use of the medication. (ex. A 2% reduction in risk from 5% to 3%.)
Long Term 3 pts: Mentions the disease may have long term effects 5 pts: Explains specific benefits of early treatment
Supportive Behaviors
Describes behaviors that aid treatment or reduce complications. Points can only be awarded for information that is not required by the FDA. 2 pts for each piece of additional information. If information is stated in a confusing way, only award 1 pt. If information is presented in a misleading fashion do not award any points.
Mechanism of Action
Describes how the drug works in the body.
Time to Onset of Action
Estimates time before effects may take effect. (Extra point awarded for most precise information.)
*Symptoms Describes noticeable symptoms or states that symptoms are invisible. Deduct 2 pts for any major symptoms omitted.
*Risk Factors 5 pts: Describes behaviors that may cause the condition (i.e. smoking) 5 pts: Describes other risk factors (demographic groups, genetic) Deduct 2 pts. For every major behavior or risk factor that is not included within each category.
*These categories may fall within FDA regulation. For example, symptoms are considered regulatory if the indication is for a condition not well known to the public. Risk factors are considered regulatory if they are described within the indication section of the Patient Package Insert. Drug Delivery Information becomes regulatory in cases where omission may mislead the patient.

70
Image and Banner: Image: Patients Depicts the proper patient population. Deduct 3 pts. for every
image that contradicts the patient population listed in the indication. Deduct 1-2 pts. for images that appear to be misleading (patients appear to young, patients participating in activities that would not be possible given their condition).
Image: Benefit or Condition
If image depicts condition: Image in no way contradicts information about the indication or side effects, or other information in the ad. (ex. In birth control advertisements, woman should not wear all white because spotting is often a common side effect. In statin advertisements, it should not depict patient consuming fatty foods and using the medication.) 0 pts: Image contradicts information 2 pts: Minor contradictions between ad and information (ex. Person appears just a bit too young)
4 pts: No contradiction, but not relevant to disease 5 pts: No contradiction and relevant to disease If image depicts Benefit: Benefits depicted are obtainable by majority of people who suffer from the condition. 0 pts: Benefits are exaggerated 2 pts: Benefits are only expected for a small fragment of users (i.e. upper quartile) 5 pts: Benefits can be obtained by majority
Banner: Stating Benefits
Benefits stated are obtainable by majority of people who suffer from the condition OR the pain described is a typical experience within this population who suffer from the condition. 0 pts: Benefits exaggerated OR pain is described vaguely to include a greater patient population 2 pts: Benefits are only expected for a small fragment of the users (i.e. upper quartile) OR pain described is typical but also is not specific to the given disease 5 pts: Not relevant to condition, simply uplifting statement 5 pts: Benefits can be obtained by majority OR pain accurately describes symptoms drug treats

71
Content Assessment.
Names condition drug treats /3 Patient Population /3Required Supportive Behaviors /3Concomitant Therapies /3Severity: Second Line Therapy /2Onset of effectiveness /2Length of effectiveness /2
Indication
Duration of Treatment /2* Other Benefit Information
Makes superiority claim of fewer side effects or benefits of side effects without being too vague or misleading (ex. less frequent dosing requirements)
/5
*Drug Delivery Information
If the delivery method varies from expected, this information must be disclosed. (i.e. Muse in inject able form)
/2
Success Rate Gives indication of benefit: either rate over population, or average benefit per person (2 pts: vague terms,5 pts: value)
/5
Long Term 3 pts: Mentions long term effects 5 pts: Explains benefits of early treatment (more specific)
/5
Supportive Behaviors
Describes behaviors that aid treatment or reduce complications beyond those required
/5Mechanisms of Action
Describes how drug works in the body
/1
Time to Onset of Action
Estimates time before effects may be
/2*Symptoms
Describes noticeable symptoms or states that symptoms are invisible (Deduct 2 pts for any major symptom omitted)
/5(Deduct 2 pt. for every major missing behavior or risk factor) Describes behaviors that may cause the condition /5
*Risk Factors
Describes other risk factors (genetic, demographic groups) /5
Justification Text is not justified /1
/1
Bullets Use of bullets to segment text
/2
/2
Case Use of both upper and lower case letters
/1
/1
Reading Level
Flesch-Kincaid Reading Level
/12 /12Active Voice
Percentage Use of Active Voice /100 /100
Warnings Deduct 2 pts for every relevant warning omitted
/7Contra-indications
Deduct 2 pts for every relevant contraindication omitted
/6
Most Common Side Effects
Deduct 2 pts for every relevant common side effect omitted
/7
Risk Headline Headline offers appropriate signals about risk information
/2Placebo Compares rate of side effects
to placebo /2
Benefit
Risk

72
The following content information should have been included in advertisements for drugs in the COX-2 drug class to receive a perfect score:
Indication: Osteoarthritis Pain /3 Patient Population: -- /3Required Supportive Behaviors: -- /3Concomitant Therapies: -- /3Severity: Second Line Therapy: -- /2Onset of effectiveness: -- /2Length of effectiveness: 24 hours /2
Indication
Duration of Treatment: 18 months /2* Other Benefit Information
24 hour pain relief from 1 tablet
/5
*Drug Delivery Information
--
/2Success Rate
/5
Long Term There is no cure for osteoarthritis, but this may prevent symptoms from effecting quality of life.
/5
Supportive Behaviors
Exercise to maintain the strength of muscles supporting joints and diet to maintain ideal weight.
/5Mechanisms of Action
Targets the COX-2 enzyme. /1
Time to Onset of Action
--
/2*Symptoms
Joint pain, swelling, inflammation
/5(Deduct 2 pt. for every major missing behavior or risk factor) Obesity, injury, joint overuse
/5
*Risk Factors
Hereditary /5
Warnings Pregnancy, Liver Problems, Kidney Problems
/7Contra-indications
Allergic reactions to sulfanomides, or asthmatic reaction to aspirin or other NSAIDs
/6
Most Common Side Effects
Indigestion, diarrhea, abdominal pain
/7

73
The following content information should have been included in advertisements for drugs in the statin drug class to receive a perfect score:
Indication: High Cholesterol, Heart Disease
/3
Patient Population: -- /3Required Supportive Behaviors: Diet
/3
Concomitant Therapies: -- /3Severity: Second Line Therapy: -- /2Onset of effectiveness: -- /2Length of effectiveness: -- /2
Indication
Duration of Treatment: Indefinite /2* Other Benefit Information
--
/5
*Drug Delivery Information
--
/2Success Rate Percentage decrease in LDL, total
cholesterol, triglycerides
/5
Long Term Statement that lowering cholesterol has been shown to reduce the risk of heart attack and stroke
/5
Supportive Behaviors
Exercise (and diet, mentioned above)
/5Mechanisms of Action
Targets cholesterol intake, or internal cholesterol
/1
Time to Onset of Action
--
/2*Symptoms
Should state there are no symptoms
/5(Deduct 2 pt. for every major missing behavior or risk factor) Obesity, sedentary lifestyle, smoking /5
*Risk Factors
Hereditary /5
Warnings Liver dysfunction, skeletal muscle pain
/7Contra-indications
Pregnancy and Nursing /6
Most Common Side Effects
Pravachol: rash, headache, diarrhea Lipitor: gas, constipation, stomach pain Zocor: rash, constipation, diarrhea, nausea Crestor: constipation, asthenia, abdominal pain, nausea
/7

74
4.4 Data
Data on monthly direct-to-consumer advertising expenditures by brand for all pharmaceuticals
was purchased from TNS Media Intelligence, a marketing company which collects over 190 million ad
occurrences a year and tracks 2.1 million brands each year (TNS Media Intelligence). They provided
monthly reports of DTCA expenditures in the following categories:
• Network TV • Cable TV • Syndicated TV • Spot TV • Outdoor • Network Radio • National Spot Radio • National Newspapers • Newspapers • Sunday Magazines • Magazines
Unfortunately the expenditure data do not differentiate between the different types of DTCA
pharmaceutical advertising (product claim, reminder ads, and help seeking ads.) However, the
expenditure data still represents a good estimate of consumer’s advertising exposure to a particular
brandname drug because product claim advertisements make up the majority of DTCA. Data provided
by TNS Media Intelligence does not include information on internet advertising or advertising claims
made in the media. However, Rosenthal et al (2002) suggests that this is a small portion of total DTCA.
Promotional expenditures to health care professionals account for the majority of marketing by
pharmaceutical companies. Promotion expenditures to healthcare professionals generally fall into four
categories: detailing to office based physicians (drug representative meeting with an office based
physician to provide information); detailing to hospital based physicians; free samples left with
physicians; and medical journal advertising. Data on these advertising efforts are collected by IMS
Health, which estimates promotional expenditures by surveying a stratified random sample of office

75
physicians (~6500) and hospital directors who track their contacts with pharmaceutical sales
representatives in the United States. A subset of the front office personnel of the physicians selected to
participate in this survey (~1250) also track the quantity of free samples provided by pharmaceutical
companies. Additionally, IMS also monitors the number of advertisements placed in roughly 400
medical journals. The publisher’s ad buys were used to obtain an estimate of the total spending on this
category.
Data on the number of prescriptions filled monthly for each brand was obtained from the
National Prescription Audit (NPA), which consists of a national random sample of
approximately 20,000 retail pharmacies, independent pharmacies, mail order pharmacies, and
mass merchandise and discount houses. These stores are sampled from the company’s pharmacy
database of more than 29,000 stores, which accounts for more than half of all retail pharmacies
in the United States. This sample accurately measures the number of new prescriptions and
refilled prescriptions for prescription medications each month.
4.5 Data Analysis
The quality ratings, both the presentation and content ratings, were entered into the statistical
software package STATA version 9 to analyze the data. Quality ratings were averaged for
advertisements that appeared simultaneously for the same drug. Expenditures on DTCA, advertising to
physicians, medical journals advertisements, and prescription rates by month were also entered. A factor
analysis using the principal factors method was performed to determine the key characteristics that
described the quality of prescription drug advertisements. Using these characteristics, the price, DTC
expenditures and prescription rates were regressed on the quality indicators.

76
5. Analysis and Results
This section examines the relationship between monthly prescription rates and DTCA
advertising. Our analysis demonstrates the correlation between monthly DTCA expenditures and the
number of prescriptions dispensed is quite poor; however, the correlation becomes remarkably good
when we adjust the DTCA expenditures according to the quality of the advertisement.
5.1 DTCA Expenditures
Between 1999 and 2004, three of the eleven drugs used to treat high cholesterol
employed DTCA persistently: Lipitor, Zocor, and Pravachol. Similarly, Celebrex and Vioxx, two
of the drugs in the COX-2 inhibitor drug class (used to treat arthritis), also relied on DTCA
continuously. These five drugs each provide many points to analyze the relationship between the
number of prescriptions, advertising expenditures, and advertisement quality.
Drug companies spent a monthly average of $6.6 million dollars on DTCA for each drug
in this sample, although there seems to be a large variation between the two drug classes, and
even among brands. (Figure 5.1 & 5.2) Average monthly DTCA expenditures were $6 million
for high cholesterol medications and $8 million for arthritic drugs. Vioxx spent the most on
DTCA, nearly $9 million each month, and even reached $29 million in one month. Within the
drugs for high cholesterol, Zocor spent the most on DTCA (an average of $6.6 million monthly),
reaching a maximum of $24 million in one month. In general, DTCA expenditures grow in the
first few months after a drug begins to employ DTC advertising, and later expenditures level off
over time. This may imply the public becomes saturated with a particular brand or message after
several months, and drug companies only use a constant level of advertising to maintain this
saturation.

77
020
0040
0060
0080
0010
000
Expe
nditu
res
(In T
hous
ands
)
01jan1999 01jul2000 01jan2002 01jul2003 01jan2005Date
Lipitor ZocorPravachol
Monthly DTCA Expenditures
Figure 5.1. Lowess smoothing of monthly DTCA expenditures for the cholesterol lowering medications from January 1999 to September 2004. Data taken from TNS Media Intelligence.
050
0010
000
1500
0E
xpen
ditu
res
(In T
hous
ands
)
01jan1999 01jul2000 01jan2002 01jul2003 01jan2005Date
Celebrex Vioxx
Monthly DTCA Expenditures
Figure 5.2. Lowess smoothing of monthly DTCA expenditures for the arthritic medications from January 1999 to September 2004. Data taken from TNS Media Intelligence.

78
5.2 Prescription Rates
Medications for arthritis and high cholesterol constitute two of the largest DTC
advertised drug classes. Between 1999 and 2004, an average1.5 million prescriptions were
dispensed each month for arthritis drugs and 2.4 million prescriptions were dispensed each
month for cholesterol lowering medications. (Figure 5.3) The number of new prescriptions for
high cholesterol drugs, especially Lipitor and Zocor, grew over time. (Figure 5.4) The number of
new prescriptions for the arthritic drugs increased precipitately between January 1999 and July
2002. This describes the response of doctors to the introduction of Celebrex and Vioxx, which
were approved by the FDA in December 1998 and May 1999 respectively. Following the initial
growth in the arthritic drug class, new prescription rates declined, especially after rumors
emerged in 2003 about the potential for these drugs to increase the risk of heart attack. The
number of prescriptions dispensed for Celebrex, Vioxx, and Pravachol has remained fairly
constant since 2002, meaning that the number of people who get a new prescription for a given
drug is approximately equal to the number of people who do not refill their prescription. (Figure
5.5) The number of prescription for Lipitor and Zocor has been growing over time, which is
beneficial from a public health perspective, since high cholesterol is one of the most under-
treated conditions.

79
010
0020
0030
0040
0050
00Pr
escr
iptio
ns D
ispe
nsed
(In
Thou
sand
s)
01jan1999 01jul2000 01jan2002 01jul2003 01jan2005Date
Lipitor ClebrexZocor VioxxPravachol
Prescriptions Dispensed By Month
Figure 5.3. Number of prescriptions dispensed for each drug by month from January 1999 to September 2004. Data taken from the National Prescription Audit.
050
010
0015
00N
ew P
resc
riptio
ns D
ispe
nsed
(In
Thou
sand
s)
01jan1999 01jul2000 01jan2002 01jul2003 01jan2005Date
Lipitor ClebrexZocor VioxxPravachol
New Prescriptions Dispensed By Month
Figure 5.4. Number of new prescriptions dispensed for each drug by month from January 1999 to September 2004. Data taken from the National Prescription Audit.

80
010
0020
0030
0040
00R
efill
Pre
scrip
tions
Dis
pens
ed (I
n Th
ousa
nds)
01jan1999 01jul2000 01jan2002 01jul2003 01jan2005Date
Lipitor ClebrexZocor VioxxPravachol
Refill Prescriptions Dispensed By Month
Figure 5.5. Number of prescription refills dispensed for each drug by month from January 1999 to September 2004. Data taken from the National Prescription Audit.
5.3 Relationship Between DTCA Expenditures and Prescriptions
Numerous studies have examined the effect of advertising dollars on prescription rates.
Figure 5.6 shows the relationship between the number of prescriptions dispensed each month and
the cumulative DTC advertising expenditure for a drug (i.e. the running sum of all DTCA
expenditures for a drug over time). This is similar to the “advertising stock” introduced by Vogt
and Bhattacharya (Vogt et al, 2003). However, a simple regression of total prescriptions
dispensed on advertising expenditures for medical journals, office detailing, and DTCA shows
that advertising dollars in each month explain very little (R-squared = 0.15) of the fluctuation in
prescription rates. (Figure 5.7) Advertising expenditures correlate somewhat better with the
fluctuation in new prescriptions (R-squared = 0.31), but still cannot fully account for the changes

81
in monthly prescription rates. This suggests the need for a measure of advertising quality to
explain short term fluctuations in prescription rates.
010
0020
0030
0040
0050
00M
onth
ly P
resc
riptio
ns D
ispe
nsed
(In
Thou
sand
s)
0 100000 200000 300000 400000 500000Cumulative DTCA Expendiutre (In Thousands of US Dollars)
Lipitor ZocorVioxx Celebrex
Total Monthly Prescriptions vs. Cumulative DTCA Expendiutres
Figure 5.6. The number of prescriptions dispensed each month according to cumulative DTCA expenditures for the given drug, from January 1999 to September 2004. Data taken from TNS Media Intelligence and the National Prescription Audit.
010
0020
0030
0040
0050
00M
onth
ly P
resc
riptio
ns D
ispe
nsed
(In
Thou
sand
s)
0 10000 20000 30000Monthly DTCA Expenditure (In Thousands of US Dollars)
Lipitor CelebrexZocor VioxxPravachol
Monthly Prescriptions vs. Monthly DTCA Expenditures
Figure 5.7. The number of prescriptions dispensed each month according to the corresponding DTCA expenditures that month, from January 1999 to September 2004. Data taken from TNS Media Intelligence and the National Prescription Audit.

82
5.4 Advertisement Quality Scores
Fifteen people were recruited to rate the presentation of the information in the
advertisements appearing for the drugs examined in this study using the DTC Assessment, which
was created in collaboration with the FDA. The content of the advertisements was rated by the
author. (A discussion of the DTC assessment can be found in section 4.)
Raters generally graded the advertisements positively, giving them approximately a 70%
score for each benefit presentation category and many of the risk presentation categories as well.
Scores within certain categories, such as image, range from 7% to 100% for different
advertisements. There appears to be significant differences between the ads among each of the
categories, although most ad scores range between 50% and 80%.
Overall inter-rater agreeability was fairly high. The agreement for any particular category
for any ad ranged from 50% to 100%, with an average agreement of 82% overall all categories.
(See Table A5.1 for the agreeability statistics.) The agreeability seemed to be higher for the
benefit portion of the advertisements, with 85% of the scores in agreement. Both the benefit
portion and risk portion (with an average of 78% agreement) surpass the 70% mark which is
used as a cutoff for data reliability. In general agreement was high for categories pertaining to
font and ad design. Raters disagreed most over the use of headlines in both the benefit and risk
portions of the advertisements. Nonetheless, even these categories met the 70% threshold.
The scores for the presentation of the risk and the benefit information are fairly equal for the
various font and color scheme categories, although on average benefit categories always scored
higher. The major difference between the presentation of the benefit and risk information occurs
in the location of the text (38% rate the location as unequal), the width of the text block (16%
score difference), and the order of the information (19% score difference). Presentation scores

83
are also significantly lower for risk headlines than benefit headlines (11-19% lower for the
various categories). In fact, not a single advertisement used bullets or lists to describe the risk
information. Furthermore, the reading level of the text that described the risk information
(average Flesch-Kincaid Reading Grade: 11.75) was significantly higher than the reading level
of the text that described the benefit information (average Flesch-Kincaid Reading Grade: 8.7).
All of the advertisements contained the information mandated by the FDA, however very
few advertisements contained other information that would benefit patients. Only 11 of the 30
advertisements made any mention of the symptoms associated with the disease. More
advertisements mentioned the success rate of the drug (13 ads) and long term benefits (15 ads),
but this is still a relatively low rate. Twenty-one of the advertisements mentioned the most
common side effects, and 13 of the advertisements compared the rate of these side effects to that
of placebo.
Overall, more advertisements include risk information than quantitative benefit information,
suggesting that advertisements rely on the image and tagline to communicate the benefits of the
drug. This may be an implicit or emotionally derived message, because on average raters
believed only 36% of the images related to either the disease or the benefit one would expect
from the advertised drug. Furthermore, only 18 of the 30 images depicted situations that do not
exceed the expectation of the drug or do not contradict any of the other information contained
within the advertisement. The taglines in the advertisements seem to be much more relevant:
raters indicated 67% of the taglines related to either the disease or the benefit one would expect
from the drug. Similarly, 28 of the 30 taglines did not contradict any information within the ad or
convey unrealistic expectations.

84
The DTC assessment revealed that there is a large variance in the quality of prescription
drug advertisements. In general, advertisements use an appealing font to convey both risk and
benefit information. However, the advertisements use more accessible language and better
headlines and text block design to share the benefit information contained in the advertisement.
The prominent tagline and image convey some information about the condition or disease,
however the advertisement have limited content on the symptoms of disease or the benefit of the
advertised drug. Most advertisements contain all the necessary risk information, but in less
accessible language and at a less accessible location within the advertisement. Overall, the DTC
assessment revealed people rate the presentation of the information within the advertisement as
adequate.
5.5 Factor Analysis
The criteria within the DTC assessment were grouped into several key categories. A
factor analysis was performed on each of these categories, which revealed 24 characteristics that
are important in measuring the quality of advertisement. These contain broad categories such as
comparative presentation as well as specific categories, such as headlines, font, and color scheme
for both the sections of the ad that present benefit and risk information. Information about the
risk, benefit, and disease are also found to be important characteristics. Table 5.2 contains a
description of each characteristic factor determined to be important by the factor analysis and
Table A5.3 describes the contribution of each rater category to the characteristic factors
generated from this analysis.

85
Table 5.2. Description of the quality factors determined by the factor analysis that are used to characterize the quality of prescription drug advertisements and predict prescription rates.
Quality Factors that Characterize the Quality of DTCA
Medical Journal Expenditure (In Thousands) Office Detailing Expenditure (In Thousands) DTCA Expenditure (In Thousands) Benefit and Risk: Text Block Design
Characterizes the justification and width of the text block, as well as the spacing between it other ad features
Benefit and Risk: Headlines:
Characterizes the affect of headlines in capturing attention, segmenting text, and providing good information
Benefit and Risk: Font Style
Characterizes the font style, size, and darkness
Benefit and Risk: Font Spacing
Characterizes the spacing between letters and between lines
Benefit and Risk: Color Scheme
Characterizes the contrast between the colors of the text and the background, as well as the distractive nature of the image in attending to the text
Benefit and Risk: Reading Level
Characterizes the Flesch-Kincaid reading level and the percentage of passive voice used in the text
Tagline Characterizes whether raters believe the tagline relates to the ad content and whether the message is not misleading
Benefit Relates Characterizes whether the image and the tagline relate to the advertised medication and whether these are misleading
Rater Benefit Info Characterizes whether the image pertains to the advertised medication and the raters preference for the order of information
Compare Presentation
Characterizes the degree to which the location and framing of the benefit and risk information is similar
Indication Characterizes the effective length and supportive behaviors that are required by the FDA
Success Rate Characterizes whether ad mentions the success rate Scientific Characterizes the mechanism of action and other beneficial
effects of the advertised medication Risk Factors Characterizes the genetic and behavioral risk factors for the
condition mentioned in the ad, as well as the symptoms Behaviors Characterizes the behavioral risk factors and supportive behaviors
one should practice when taking the advertised drug Common Side Effects
Characterizes whether the ad mentions the drug’s common side effects
Placebo Characterizes whether the ad compares the rate of side effects for the drug to that of placebo
Risk Headline Characterizes the language in the risk headline (Please see discussion in content grading guidelines.)

86
5.6. Advertising Quality and Prescription Rates
An ordinary least squares regression for total prescriptions was performed on all the
quality factors determined by the factor analysis. The quality factors alone seem to explain a lot
of the fluctuation in prescriptions (R-squared = 0.98). The regression was repeated for new
prescriptions(R-squared = 0.96), which fluctuate the most, and re-fill prescriptions (R-squared =
0.98). Table A5.4 contains the coefficients for the quality factors in each of these regressions.
Another set of tests was performed regressing the different types of prescription rates
(new, refill, total) on total advertising expenditures (DTCA +office detailing + medical journals).
Figures 5.8, A5.9-A5.10 depict the observed new, refill, and total prescription rates, as well as
those predicted by the regression on ad quality and the regression on ad expenditures, for Lipitor.
Total prescriptions and corresponding predicted prescription rates for the other drugs are also
shown in figures A5.11-A5.14. The flat lines indicate the predicted number of prescriptions
according to quality factors alone. Since the same ad campaigns generally run for 10 to 12
months, the number of prescriptions predicted remains constant during each campaign. The
actual and predicted values match well for new prescriptions and refill prescriptions of all the
other drugs, but are not depicted for sake of space and redundancy.

87
2000
3000
4000
5000
6000
Pre
scrip
tions
Dis
pens
ed (I
n Th
ousa
nds)
01jan1999 01jul2000 01jan2002 01jul2003 01jan2005Date
Prescriptions Dispensed Predicted By Ad QualityPredicted By Ad Expenditures
Prescriptions Dispensed for Lipitor, Jan 1999 - Sept 2004
Figure 5.8. Prescriptions dispensed each month for Lipitor, along with the number of prescriptions predicted by DTCA quality factors and predicted by all advertising expenditures.
In general the coefficients from the regression on advertising quality suggest that an ad
must be visually appealing in order for it to affect prescriptions positively. Advertisements that
earned higher ratings for font spacing corresponded to higher prescription rates for the advertised
drug. In fact, advertisements at the 75th percentile in the risk font spacing category corresponded
to 1010 thousand more new prescriptions of the drug than advertisements with scores at the 25th
percentile. Similarly, the difference in prescriptions for advertisements at the 75th percentile
versus the 25th percentile in benefit font spacing corresponded to 454 thousand more new
prescriptions. Henceforth, we will call the change in prescriptions that corresponds to the
difference in advertisements at the 75th percentile and 25 percentile for a given quality factor the
prescription percentile difference. (Table A5.5) In no way does this relationship suggest that a

88
change in the quality factor causes the change in prescriptions, we merely show that a correlation
appears to exist between prescriptions and quality factors.
Besides the font spacing, several other categories contribute to the visual appeal of the
advertisement. These include the text block design, font, and comparative presentation.
Prescription rates rise with a more highly regarded text block design for the risk information.
Surprisingly, new prescriptions fall for more highly rated benefit text block design (-567
thousand prescription percentile difference). This may occur because a more highly rated benefit
text block may require more space, using larger portion of the advertisement and perhaps
replacing appealing images. In this vain, new prescription rates fall with increasing scores for the
benefit and risk font (-541 and -469 thousand prescription percentile difference, respectively).
Again, more highly regarded fonts are generally larger in size, which may minimize the
appearance of an appealing image. Overall, it seems the visual appeal and spacing of the various
elements within the advertisements corresponds to higher new prescription rates. Advertisements
with similar location of risk and benefit information (196 thousand prescription percentile
difference for Compare Presentation), highly rated font spacing, and well designed risk text
blocks correspond to higher new prescriptions.
Beyond the visual appeal of the advertisement, the quality of the tagline and image seem
to correspond to new prescriptions. Advertisements with highly rated taglines correspond to an
increase in new prescriptions (96 thousand prescription percentile difference). Similarly,
advertisements with highly regarded benefit information from the rater’s perspective correspond
to an increase in new prescriptions (86 thousand prescription percentile difference).
Not surprisingly, increased scores for categories that highlight risk information
correspond to fewer new prescriptions. Advertisements that received high scores for its risk

89
headline corresponded to fewer new prescriptions (-553 thousand prescription percentile
difference). A similar trend can be seen for the risk color category, especially for refill
prescriptions. Interestingly, a lower risk reading level corresponded to an increase in new
prescriptions. This may suggest that patients do not pursue drugs if they cannot understand the
risk information because of complicated language (-737 thousand prescription percentile
difference).
The content of an advertisement appears to have little correlation with new prescription
rates. There appears to be a correspondence, however, with refill prescription rates. Refill
prescription rates correspond to an increase in the information on indication and the scientific
nature of the drug (7215 and 492 thousand prescription percentile difference, respectively). This
suggests a correlation between prescription rates and information about the effective length of
the medication and mechanism of action for patients who already have some experience with the
advertised drug. Prescription rates for these experienced patients decline with a corresponding
increase in the information about risk factors and behaviors contained in the advertisement (-93
and -1836 thousand prescription percentile difference, respectively). This result reflects Roth’s
hypothesis that patients do not want DTC advertisements to remind them about their symptoms
and the behaviors that may have caused their condition. Patients, may, however, be interested in
the most common side effects associated with the advertised medication. Refill prescription rates
rose with a corresponding increase in the inclusion of information about common side effects
(1267 thousand prescription percentile difference). Likely those who are taking a drug are most
concerned about the side effects they are experiencing. Not surprisingly, there is a corresponding
negative relationship between side effect information and new prescriptions, although this is not
statistically significant.

90
In general, visually attractive advertisements correspond to higher new and refill
prescription rates. The content of the tagline also seems to correspond with an increase in both
types of prescriptions. Surprisingly, the informational content of an advertisement only
corresponds to changes in refill prescriptions. This could possibly suggest a model for how
readers process DTC advertisements. If the ad is visually appealing, readers may dedicate more
time to reading the tagline. If the reader believes the tagline or image indicate that the drug may
relate to them personally, they may read more about the drug. The increasing involvement with
the advertisement may correspond to higher prescription rates.
5.7 Effective Advertising Expenditure
Figures 5.8, A5.9-A5.14 depict a significant correlation between the quality of a
prescription drug advertisement and prescription rates, with little correlation between
prescription rates and advertising expenditures alone. This result is somewhat difficult to
understand, because one would expect prescription rates to increase proportionally with the
number of people who saw the high quality advertisement. Therefore, we introduce the concept
of the effective advertising expenditure (EAE) to explain how DTCA expenditures affect
prescription rates, despite the low direct correlation:
Effective Advertising Expenditure = DTCA Expenditure / QF
where the QF refers to the predicted number of prescriptions based on the coefficients of the
regression on quality factors. (QF corresponds to either equation (1), (2), or (3) in table A5.4,
depending on the type of advertising per prescription cost one wishes to generate.) This
relationship suggests that the impact of advertising on prescriptions depends on both the quality
of the advertisement and the pervasiveness of the advertising. According to this theory, a low

91
budget campaign for “high quality” ads and a high budget campaign for “low quality” ads would
have the same impact on prescription rates. (In this section we assume quality to be a property
that corresponds to higher prescription rates, not necessarily the most beneficial advertisements
from a public health perspective.) To test this theory, we graphed effective advertising
expenditure over time versus the advertising cost per prescription (ad expenditures/ prescription).
(Figure 5.15, A5.16 – A5.21)
1020
3040
Ad
Exp
endi
ture
Per
Tho
usan
d P
resc
riptio
ns
01jan1999 01jul2000 01jan2002 01jul2003 01jan2005Date
DTCA Expenditure Per Prescription Effective Advertising ExpenditureDTCA Expenditure Per Average Lipitor QF
Effective Advertising Expenditures and DTCA Expenditures Per Prescription for Lipitor
Figure 5.15. Advertising cost per new prescription for Lipitor and effective advertising expenditures (advertising expenditure per quality factors) for new prescriptions. A log scale is used to show the wide range of data.
The effective advertising spending has a remarkable ability to predict the advertising cost
per expenditure for every drug we studied. Again, we show this relationship for new, refill, and
total prescription for Lipitor, but only total prescriptions for all the other drugs.

92
The effective advertising expenditure explains the discrepancies between the prescription
rates and the prescription rates predicted solely by advertising outlays. Figure A5.12 shows that
the observed prescription rates for Pravachol are much lower than predicted by the advertising
outlays, while figure 5.8 demonstrates that observed prescriptions for Lipitor are much higher
than expected by their advertising outlays alone. This should not be surprising, however, given
that the QF for the Pravachol advertisements ranged from 300 to 340, while the QF for the
Lipitor advertisements ranged from 920 to 1345. Prescription rates for Lipitor were much higher
than expected solely by their advertising outlays, because they showed “higher quality”
advertisements. The “low quality” ratings for the Pravachol ads correspond to the unexpectedly
low prescription rates compared to their advertising outlay. The effective advertising expenditure
model accurately explains these discrepancies.
5.8 Advertising Quality and DTC Expenditures
DTCA expenditures were regressed on all the ad quality characteristics to determine
whether companies spend more to promote “high quality” advertisements. There appears to be
no significant correlation between ad quality and DTCA outlays, suggesting that companies
produce and promote DTC advertisements with a wide range in quality. Our analysis suggests
that companies could achieve the same number of prescriptions using less advertising or generate
more prescriptions for advertised medications by investing and promoting higher quality
advertisements.

93
6. Discussion
The DTC Assessment created to measure the quality of prescription drug advertisements
serves as a powerful tool to measure the public’s perception of DTC advertising. From the
content and presentation criteria the raters used to judge the DTC advertisements, a factor
analysis revealed many instrumental quality factors that can be used to characterize the quality of
a prescription drug advertisement.
Several of these quality factors highly correlate with prescription rates. In general, a
positive correlation exists between prescription rates and advertisements that are visually
appealing and contain pertinent taglines. Refill prescriptions also positively correlate with
information about the indication and side effects of the drug, but refill prescription rates fall with
information about the risk factors and behaviors associated with the disease. The inclusion of
quantitative benefit information did not significantly correlate with either new or refill
prescriptions. Overall the presentation of the advertisement and perception of benefit information
best explain the correlation between advertising quality and prescription rates.
Together the advertising quality factors and DTCA expenditures explain the fluctuation
in prescription rates. The effective advertising expenditure, or the expenditure per advertisement
quality, accurately predicts the advertising cost per prescription.
There were limitations to our study. First, the advertisements were viewed in a binder,
not in the context of a magazine. We were only able to rate the quality of magazine
advertisements and assumed that the quality of television and radio advertisements are equal to
the quality of the print advertisement. We also were not able to measure the effects of the news
media or internet exposure on consumers or the quality of advertisement to physicians. Finally,

94
the age of all the raters in this study varied from 18-22. Given that many of the consumers of
these drugs are older, this study should be repeated with raters from representative groups.
Despite all these limitations, the effective advertising expenditure (EAE) can accurately
predict the advertising cost per prescription. Further work should be done to extend this analysis
to other drug classes. We expect that the EAE with a scale factor for the size of the drug class
will predict the advertising cost per prescription for other drugs with similar accuracy.
The results of this study can be very useful to drug companies in creating higher quality
advertisements, but may also be somewhat troubling to proponents of DTCA. They suggest that
DTCA is useful in motivating patients who learn about the symptoms and risk factors for under-
diagnosed conditions to seek medical attention. However, our analysis reveals that the
informational content of DTC advertisements is only significant for patients who have already
been treated. According to our analysis, new prescriptions correlate with the tagline and
perception of benefit information according to our analysis, but none of the information content
factors. This confirms Roth’s claim (1996) that consumers have a high awareness for ads that
contain transformational messages, but contain little concrete evidence about the true benefits of
the drug. Since several studies have shown that physicians tend to accede to many DTC requests,
both those that are appropriate and those at the margin of clinical benefit, it is important for the
advertisements to generate realistic expectations about the drug. More realistic expectations may
be generated by requiring advertisements to contain quantitative benefit information. However,
our study shows that including more benefit information may produce a tradeoff between
managing expectations and the power of the advertisement to correlate with higher prescription
rates. Advertisements that contained highly rated benefit text blocks correlated with fewer
prescriptions, which we believe occurs because the benefit information takes the place of the

95
visually appealing images. Therefore, regulators must weigh the cost of the harm caused by
patients with unrealistic expectations requesting and receiving inappropriate advertised drugs
against the benefits of motivating people with under-diagnosed conditions to seek medical
attention.
The FDA may also use these quality factors to create regulations that generate the most
socially optimal forms of DTC advertising. Likewise, drug companies can earn a higher rate of
return on their advertising expenditures by creating advertisements that emphasize the quality
factors described, which may increase profits and help to target diseases that are under-
diagnosed.

96
7. Appendix Table A4.1. Consumers’ Preferred Characteristics for DTC Advertisements
Table A4.1. Consumers’ preferences in DTC advertisements. Taken from “Focus Groups on Prescription Drug Printed Ads,” a study sponsored by the FDA and carried out by ORC Macro.
Format: Based on the respondents’ comments and reactions to current magazine ads, proposed prototypes, and participants’ proposals for an “ideal ad” the desirable format could be depicted by the following characteristics:
1) Legible text 2) Decent font size 3) Important information highlighted so it is not difficult to find different topics 4) Distinct headings standing out from the rests of the text 5) Visible name of a drug standing out at the top of a page 6) Bolded text for headings or other most important information 7) Text broken into paragraphs 8) White space between paragraphs 9) Bullet points for listings, such as list of ingredients or side effects 10) Text broken in columns 11) Objects such as text placed in frames or tables to break up a lengthy block of text
Content: Respondents’ opinions about a content of the brief summary of a prescription ad focused on the following topics that they believe should be included in such an ad:
1) Clear statement of what medical condition the advertised drug will treat and who is the drug for (adults/children/both; men/women/both)
2) Both positive and negative information about the drug 3) The performance of a drug and desired positive effects/benefits 4) Information on side effects 5) Information on drug interactions with other medications or substances 6) Information on health condition(s) that would not allow for taking a drug 7) List of ingredients (active and inactive ingredients necessary) 8) 800 number and website 9) Date of last update of information in ad

97
Figure A4.1. A print advertisement for Levitra. Notice all the risk information is located to the left of the advertisement and actually separated by a line. The paragraph width and smaller font makes it difficult to read this information.

98
DTC Assessment: Average Scores and Agreeability Between Raters Benefit Risk Difference
Category Average
Score AgreeabilityAverage
Score Agreeability Benefit –
Risk Score Overall AdDesign 0.66 0.87 N/A N/A N/A Overall Framing 0.72 0.85 N/A N/A N/A Overall Location 0.62 0.83 N/A N/A N/A Image Image 0.36 0.81 N/A N/A N/A Tagline Tagline 0.67 0.80 N/A N/A N/A
Headings Stand Apart 0.80 0.82 0.69 0.81 0.11
Headings Good Info 0.65 0.76 0.46 0.62 0.19
Headings Relate to Text 0.73 0.78 0.61 0.71 0.12
Headings Good Ratio 0.65 0.76 0.47 0.66 0.18
Font Font 0.84 0.85 0.80 0.81 0.04 Font Dark 0.87 0.87 0.84 0.84 0.03 Font
Letter Space 0.93 0.93 0.85 0.85 0.08
Font Line Space 0.90 0.90 0.76 0.79 0.14
Font Size 0.67 0.87 0.63 0.87 0.04 Color Color 0.89 0.85 0.83 0.86 0.06 Color Contrast 0.78 N/A 0.77 N/A 0.01 Color Distraction 0.76 N/A 0.72 N/A 0.04 Text Block Spacing 0.81 0.94 0.75 0.90 0.07 Text Block Width 0.84 0.85 0.68 0.72 0.16 Text Block Justified 0.67 0.91 0.40 0.73 0.27 Content Order 0.91 N/A 0.72 N/A 0.19 Headings Bullets 0.33 N/A 0.00 N/A 0.33 Reading Level 8.70 N/A 11.80 N/A -3.10 Voice Passive 0.04 N/A 0.18 N/A -0.14
Table A5.1. Average scores for the presentation categories in the DTC Assessment for all 34 advertisements rated and the agreeability between raters for each category.

99
Factor Analysis: Benefit Quality Factors that Determine the Quality of a DTC Advertisement
Compare
Presentation Headline Font
Spacing Font Text
Block
Colors Reading
Level Benefit Relate Tagline
Rater Info
Eigen Value 1.49 3.56 2.17 0.34 0.491 0.46 1.185 0.3203 0.3203 Framing 0.8235 Location 0.8235 Stand Apart 0.9199 Good Info 0.9204 Relate to Text 0.974 Good Ratio 0.9128 Bullets 0.2928 Font 0.567 0.5447 Font Dark 0.3078 0.6785 Letter Spacing 0.6626 0.2157 Line Spacing 0.6418 0.2526 Font Size 0.1578 0.6418 Spacing 0.6382 Text Block Width 0.7999 Justification 0.5334 Color 0.3301 Contrast 0.04297 Distract 0.4442 Reading Level 0.8636 Passive Voice 0.8636 Image: Misleading 0.0994 -0.1276 -0.1276 Banner: Misleading 0.6163 0.2994 0.2994 Image -0.5193 -0.0398 -0.0398 Banner 0.2542 0.5861 0.5861 Order -0.1056 -0.2529 -0.2529
Table A5.3. Weightings of DTC Assessment criteria that characterize the benefit information within a DTC advertisement. Values obtained from a factor analysis using the principal factors method.

100
Table A5.3. Weightings of DTC Assessment criteria that characterize the risk information within a DTC advertisement. Values obtained from a factor analysis using the principal factors method.
Factor Analysis: Content Quality Factors that Determine the Quality of a DTC Advertisement Indication Success Rate Scientific RiskFactors Behavior Eigen Value 1.207 - 0.87698 1.549 0.706 Required Behaviors 1.207 Effective Length -0.21711 Success Rate 1 Other Good Effects 0.3688 Long Term -0.441 mechanism 0.5713 Symptoms 0.0537 -0.4243 Risk Factors - Behavior 0.7147 0.5593 Risk Factors - Genetic 0.8158 -0.0482 Supportive Behaviors 0.1044 0.7554
Table A5.3. Weightings of DTC Assessment criteria that characterize the content within a DTC advertisement. Values obtained from a factor analysis using the principal factors method.
Factor Analysis: Risk Quality Factors that Determine the Quality of a DTC Advertisement
Headline Font Font
Spacing Text Block Colors Reading
Level Eigen Value 2.96 2.91 0.33 0.66474 1.769 0.826 Headlines: Stand Apart 0.8151 Headlines: Good Info 0.9171 Headlines: Relate to Text 0.9104 Headlines: Good Ratio 0.7938 Headlines: Bullets N/A Font 0.6738 0.417 Font Dark 0.7748 0.3538 Letter Spacing 0.363 0.7626 Line Spacing 0.3231 0.7524 Font Size 0.6243 0.3399 Spacing 0.581 Text Block Width 0.5531 Justification -0.1461 Color 0.8953 Contrast 0.9421 Distract 0.283 Reading Level -0.6428 Passive Voice 0.6428

101
Predicted Difference in Prescription Rates: Results from an OLS Regression Quality Factors
New Prescriptions (1)
Refill Prescriptions (2)
Total Prescriptions (3)
Benefit Headlines
55.18894 (87.12295)
621.5983** (182.0906)
723.6093** (235.7019)
Benefit Font
-834.012** (218.5619)
-2032.403** (456.8035)
-2983.42** (591.2961)
Benefit Font Spacing
519.8475** (146.5092)
1809.5** (306.2102)
2432.381** (396.3649)
Benefit Text Block Design
-431.405** (135.308)
-1375.384** (282.7994)
-1902.8** (366.0615)
Benefit Reading Level
130.0693 (112.9318)
468.847* (236.032)
610.048* (305.5249)
Risk Headlines
-693.145** (207.3879)
-2571.266** (433.4493)
-3412.87** (561.066)
Risk Font
-588.556** (175.0656)
-1962.726** (365.8943)
-2692.98** (473.6213)
Risk Font Spacing
727.2739** (131.0172)
1912.122** (273.8313)
2698.683** (354.453)
Risk Text Block Design
242.6519 (195.4179)
1794.777** (408.4316)
2196.277** (528.6825)
Risk Colors
-18.3486 (220.6546)
-1623.516** (461.1773)
-1779.23** (596.9577)
Risk Reading Level
-706.019* (308.1584)
-2652.259** (644.0637)
-3549.66** (833.6897)
Compare Presentation
181.2273** (40.198)
998.4006** (84.01548)
1241.16** (108.7514)
Tagline
200.1108* (79.74066)
1485.976** (166.6613)
1743.925** (215.7299)
Benefit Relate
255.7893** (60.42264)
-737.7326** (126.2858)
-531.949** (163.467)
Success Rate
-275.276 (204.4642)
-334.9262 (427.3386)
-694.286 (553.1561)
Indication
570.397 (361.35)
3489.481** (755.2364)
4265.227** (977.5939)
Scientific
77.35209 (100.9388)
608.336** (210.9662)
731.5486** (273.0791)
Risk Factors
48.6334 (43.90657)
-235.2158* (91.76654)
-237.355* (118.7846)
Behavior
-399.852 (206.574)
-1043.408* (431.7481)
-1487.18** (558.8639)
Common Side Effects
-312.415 (248.3162)
1631.083** (518.991)
1512.057* (671.793)
R-squared 0.9554 0.9753 0.9757 Table A5.4. Predicted changes in prescription rates based on an OLS regression on DTCA quality factors. Note predictions are made for new prescriptions in (1), refill prescriptions in (2), and total prescriptions in (3). Standard Errors are reported in parentheses. * indicates the change is significant at the 5% level, and ** indicates the changes is significant at the 1% level.

102
Prescription Percentile Difference for Quality Factors Quality Factors
Change in New Prescriptions
Change in Refill Prescriptions
Change in Total Prescriptions
Benefit Headlines 112.51 1267.18 1475.14 Benefit Font -540.90 -1318.11 -1934.89 Benefit Font Spacing 454.42 1581.74 2126.22 Benefit Text Block Design -567.28 -1808.58 -2502.11 Benefit Reading Level 80.99 291.95 379.87 Risk Headlines -553.14 -2051.89 -2723.49 Risk Font -469.34 -1565.15 -2147.48 Risk Font Spacing 1009.73 2654.75 3746.79 Risk Text Block Design 281.29 2080.59 2546.03 Risk Colors -31.77 -2811.01 -3080.62 Risk Reading Level -737.32 -2769.84 -3707.03 Compare Presentation 194.89 1073.67 1334.72 Tagline 95.93 712.33 835.98 Benefit Relate 86.42 -249.25 -179.72 Success Rate -275.28 -334.93 -694.29 Indication 1179.45 7215.43 8819.49 Scientific 62.62 492.48 592.22 Risk Factors 19.26 -93.13 -93.97 Behavior -703.40 -1835.51 -2616.16 Common Side Effects -156.21 815.54 756.03 Table A5.5. Expected difference in prescriptions between an advertisement that is rated at the 75th percentile and an advertisement at the 25th percentile for a given category, holding all other category scores equal.

103
500
1000
1500
2000
New
Pre
scrip
tions
Dis
pens
ed (I
n Th
ousa
nds)
01jan1999 01jul2000 01jan2002 01jul2003 01jan2005Date
New Prescriptions Dispensed Predicted By Ad QualityPredicted By Ad Expenditures
New Prescriptions Dispensed for Lipitor, Jan 1999 - Sept 2004
Figure A5.9. New prescriptions dispensed each month for Lipitor, along with the number of new prescriptions predicted by DTCA quality factors and predicted by all advertising expenditures.
1000
2000
3000
4000
Ref
ill P
resc
riptio
ns D
ispe
nsed
(In
Thou
sand
s)
01jan1999 01jul2000 01jan2002 01jul2003 01jan2005Date
Refill Prescriptions Dispensed Predicted By Ad QualityPredicted By Ad Expenditures
Refill Prescriptions Dispensed for Lipitor, Jan 1999 - Sept 2004
Figure A5.10. Refill prescriptions dispensed each month for Lipitor, along with the number of prescriptions refills predicted by DTCA quality factors and predicted by all advertising expenditures.

104
1000
1500
2000
2500
Pre
scrip
tions
Dis
pens
ed (I
n Th
ousa
nds)
01jan1999 01jul2000 01jan2002 01jul2003 01jan2005Date
Prescriptions Dispensed Predicted By Ad QualityPredicted By Ad Expenditures
Prescriptions Dispensed for Zocor, Jan 1999 - Sept 2004
Figure A5.11. Prescriptions dispensed each month for Zocor, along with the number of prescriptions predicted by DTCA quality factors and predicted by all advertising expenditures.
800
1000
1200
1400
1600
1800
Pre
scrip
tions
Dis
pens
ed (I
n Th
ousa
nds)
01jan1999 01jul2000 01jan2002 01jul2003 01jan2005Date
Prescriptions Dispensed Predicted By Ad QualityPredicted By Ad Expenditures
Prescriptions Dispensed for Pravachol, Jan 1999 - Sept 2004
Figure A5.12. Prescriptions dispensed each month for Pravachol, along with the number of prescriptions predicted by DTCA quality factors and predicted by all advertising expenditures.

105
010
0020
0030
0040
00P
resc
riptio
ns D
ispe
nsed
(In
Thou
sand
s)
01jan1999 01jul2000 01jan2002 01jul2003 01jan2005Date
Prescriptions Dispensed Predicted By Ad QualityPredicted By Ad Expenditures
Prescriptions Dispensed for Vioxx, Jan 1999 - Sept 2004
Figure A5.13. Prescriptions dispensed each month for Vioxx, along with the number of prescriptions predicted by DTCA quality factors and predicted by all advertising expenditures.
050
010
0015
0020
0025
00P
resc
riptio
ns D
ispe
nsed
(In
Thou
sand
s)
01jan1999 01jul2000 01jan2002 01jul2003 01jan2005Date
Prescriptions Dispensed Predicted By Ad QualityPredicted By Ad Expenditures
Prescriptions Dispensed for Celebrex, Jan 1999 - Sept 2004
Figure A5.14. Prescriptions dispensed each month for Celebrex, along with the number of prescriptions predicted by DTCA quality factors and predicted by all advertising expenditures

106
510
Ad E
xpen
ditu
re P
er T
hous
and
Pres
crip
tions
01jan1999 01jul2000 01jan2002 01jul2003 01jan2005Date
DTCA Expenditure Per New Prescription Effective Advertising Expenditure
Effective Advertising Expenditures and DTCA Expenditures Per New Prescription for Lipitor
Figure A5.16. Advertising cost per new prescription for Lipitor and effective advertising expenditures (advertising expenditure per quality factors) for new prescriptions.
1020
30Ad
Exp
endi
ture
Per
Tho
usan
d Pr
escr
iptio
ns
01jan1999 01jul2000 01jan2002 01jul2003 01jan2005Date
DTCA Expenditure Per Refill Prescription Effective Advertising Expenditure
Effective Advertising Expenditures and DTCA Expenditures Per Refill Prescription for Lipitor
Figure A5.17. Advertising cost per refill prescription for Lipitor and effective advertising expenditures (advertising expenditure per quality factors) for refill prescriptions.

107
2000
40006
00080
00Ad
Exp
endi
ture
Per
Tho
usan
d Pr
escr
iptio
ns
01jan1999 01jul2000 01jan2002 01jul2003 01jan2005Date
DTCA Expenditure Per Prescription Effective Advertising Expenditure
Effective Advertising Expenditures and DTCA Expenditures Per Prescription for Zocor
Figure A5.18. Advertising cost per prescription for Zocor and effective advertising expenditures (advertising expenditure per quality factors) for total prescriptions.
100
200
300
Ad E
xpen
ditu
re P
er T
hous
and
Pres
crip
tions
01jan1999 01jul2000 01jan2002 01jul2003 01jan2005Date
DTCA Expenditure Per Prescription Effective Advertising Expenditure
Effective Advertising Expenditures and DTCA Expenditures Per Prescription for Pravachol
Figure A5.19. Advertising cost per prescription for Pravachol and effective advertising expenditures (advertising expenditure per quality factors) for total prescriptions.

108
.51
1.5
2Ad
Exp
endi
ture
Per
Tho
usan
d Pr
escr
iptio
ns
01jan1999 01jul2000 01jan2002 01jul2003 01jan2005Date
DTCA Expenditure Per Prescription Effective Advertising Expenditure
Effective Advertising Expenditures and DTCA Expenditures Per Prescription for Vioxx
Figure A5.20. Advertising cost per prescription for Vioxx and effective advertising expenditures (advertising expenditure per quality factors) for total prescriptions.
2000
40006
00080
00Ad
Exp
endi
ture
Per
Tho
usan
d Pr
escr
iptio
ns
01jan1999 01jul2000 01jan2002 01jul2003 01jan2005Date
DTCA Expenditure Per Prescription Effective Advertising Expenditure
Effective Advertising Expenditures and DTCA Expenditures Per Prescription for Celebrex
Figure A5.21. Advertising cost per prescription for Celebrex and effective advertising expenditures (advertising
expenditure per quality factors) for total prescriptions.

109
References Almasi, Elizabeth A., Randall S. Stafford, Richard L. Kravitz, and Peter R. Mansfield. "What are the Public Health Effects of Direct-to-Consumer Drug Advertising?" PLoS Medicine 3 (2006). Beecher, HK. The Powerful Placebo. JAMA 159 (1955): 1602-1606. Bell, Robert A., Michael S. Wilkes, and Richard L. Kravitz. "The Educational Value of Consumer-Targeted Prescription Drug Print Advertising." Journal of Family Practice 49 (2000): 1092-1098. Bell, Robert A., Richard L. Kravitz, and Michael S. Wilkes. "Direct-to-Consumer Prescription Drug Advertising and the Public." Journal of General Internal Medicine 14 (1999): 651-657. Berger, J et al. Direct-to-Consumer Drug Marketing: Public Service or Disservice? Mt Sinai J Med (2001); 68(3): 197-202. Berndt, Ernst R. "To Inform or Persuade? Direct-to-Consumer Advertising of Prescription Drugs." The New England Journal of Medicine 352 (2005): 325-326. Center for Drug Evaluation and Research (CDER). Direct-to-Consumer Advertising of Prescription Drugs: Physician Survey. www.fda.gov/cder/ddmac/globalsummit2003. Accessed August 20, 2004. Cline R, Young, H. Marketing Drugs, Marketing Health Care Relationships: A Content Analysis of Visual Cues in Direct-to-Consumer Prescription Drug Advertising. Health Comm 16 (2004): 131-157. Coscelli, A. "The Importance of Doctors' and Patients' Preferences in the Prescription Decision." Journal of Industrial Economics 48 (2000): 1085-1104. David S, Greer DS. Social Marketing: Application to Medical Education. Ann Int Med 134 (2001): 125-127. Gardner, David M., Barbara Mintzes, and Aleck Ostry. "Direct-to-Consumer Prescription Drug Advertising in Canada: Premission by Default?" Canadian Medical Association Journal 169 (2003): 425-427. General Accounting Office. Prescription Drugs: FDA Oversight of Direct-to-Consumer Advertising Has Limitations. www.gao.gov/new.items/d03177.pdf Accessed on August 20, 2004. Holmer, Alan F. "Direct-to-Consumer Advertising - Strengthening Our Health Care System." The New England Journal of Medicine 346 (2002): 526-528.
110
Hurwitz, M., and R. Caves. "Persuasion or Information? Promotion and the Shares of Brand Name and Generic Pharmaceuticals." Journal of Law and Economics 31 (1988): 299-320. Kaphingst A, Rudd RE, and L Daltroy. “Literacy demands of product information intended to supplement television direct-to-consumer prescription drug advertisements.” Patient Education and Counseling 55 (2004): 293-300. Kravitz, Richard L. "Measuring Patients' Expectations and Requests." Annals of Internal Medicine 134 (2001): 881-888. Kravitz, Richard L., Ronald M. Epstein, Mitchell D. Feldman, Carol E. Franz, Rahman Azari, Michael S. Wilkes, Ladson Hinton, and Peter Franks. "Influence of Patients' Requests for Direct-to-Consumer Advertised Antidepressants." Journal of the American Medical Association 293 (2005): 1995-2002. Kirsch I, Sapirstein G. Listening to Prozac but Hearing Placebo: A Meta-Analysis of Antidepressant Medications. In: How Expectancies Shape Experience. Ed. Irving Kirsch. Washington, D.C.: American Psychological Association, 1999. pp.303-320. Leffler, K. "Persuasion or Information? the Economics of Prescription Drug Advertising." Journal of Law and Economics 24 (1981): 45-74. Lene V, Robinson ME, Verne GN, Price DD. The contributions of suggestion, desire, and expectation to placebo effects in irritable bowl syndrome patients. Pain 105 (2003): 17-25. Lipton, Shira. "Comparison of Direct-to-Consumer Prescription Drug Advertising on Hispanic Versus Mainstream Broadcast Media." Diss. Stanford Univ., 2001. Majumdar, S R., Elizabeth A. Almasi, and Randall S. Stafford. "Promotion and Prescribing of Hormone Therapy After Report of Harm by the Women's Health Initiative." Journal of the American Medical Association 292 (2004): 1983-1988. Mansfield, Peter R., Barbara Mintzes, Dee Richards, and Les Toop. "Direct to Consumer Advertising." British Medical Journal 330 (2005): 5-6. Mintzes, Barbara, Barer L. Morris, Richard L. Kravitz, Ken Bassett, Joel Lexchin, Arminee Kazanjian, Robert G. Evans, Richard Pan, and Stephen A. Marion. "How Does Direct-to-Consumer Advertising (DTCA) Affect Prescribing? a Survey in Primary Care Environments with and Without Legal DTC." Canadian Medical Association Journal 169 (2003): 405-412. Mitka, Mike. "Survey Suggesting That Prescription Drug Ads Help Public is Met with Skepticism." Journal of the American Medical Association 289 (2003): 827-828. Morris, D. Placebo, Pain, and Belief: A Biocultural Model. In: The Placebo Effect. Ed. Anne Harrington. Cambridge, MA: Harvard University Press, 1997. pp.187-202.

111
Morrow D, Leirer V, and Altieri P. “List Formats Improve Medication Instructions for Older Adults.” Educational Gerontology 21 (1995): 151-166. Moynihan, Ray, Iona Heath, and David Henry. "Selling Sickness: the Pharmaceutical Industry and Disease Mongering." British Medical Journal 324 (2002): 886-891. Murray, Elizabeth, Bernard Lo, Lance Pollack, Karen Donelan, and Ken Lee. "Direct-to-Consumer Advertising: Public Perceptions of Its Effects on Health Behaviors, Health Care, and Doctor-Pateint Relationship." Journal of the American Board of Family Practice 17 (2004): 6-18. Murray E, Lo B, Pollack L, Donelan K, Lee K. Direct-to-consumer advertising: physicians’ views on its effects on quality of care and the doctor-patient relationship. J Am Board Fam Pract 16 (2003): 513-524. Pinto, M, J Pinto, and J Barber. "The Impact of Pharmaceutical Direct Advertising: Opportunities and Obstructions." Health Marketing Quarterly 154 (1998): 89-101. Pinto, M B. On the Nature and Properties of Appeals Used in Direct-to-Consumer Advertising of Prescription Drugs. Psy Rep 86 (2000): 597-607. Pollo A, Amanzio M, Arslanian A, Casadio C, Maggi G, Benedetti F. Response expectancies in placebo analgesia and their clinical relevance. Pain 93 (2001): 77-84. Rizzo, J. "Advertising and Competition in the Ethical Pharmaceutical Industry: the Case of Antihypertensive Drugs." Journal of Law and Economics 42 (1999): 89-116. Rosenthal, M., B. Ernst, J. Donohue, A. Epstein, and R. Frank. "Demand Effects of Recent Changes in Prescription Drug Promotion." Kaiser Family Foundation (2003). Rosenthal, Meredith B., Ernst R. Berndt, Julie M. Donohue, Richard G. Frank, and Arnold M. Epstein. "Promotion of Prescription Drugs to Consumers." The New England Journal of Medicine 346 (2002): 489-505. Roth, Martin S. "Media and Message Effects on DTC Prescription Drug Advertising Awareness." Journal of Advertising Research 43 (2003): 180-193. Roth, Martin S. "Patterns in Direct-to-Consumer Prescription Drug Print Advertising and Their Public Policy Implications." Journal of Public Policy and Marketing 15 (1996): 63-75. Sauer, Justin, and Robert Howard. "The Impact of Journal Advertisements on Prescribers of Cholinesterase Inhibitors." International Journal of Geriatric Psychiatry 17 (2002): 976-978. Scott Morton, Fiona M. "Barriers to Entry, Brand Advertising, and Generic Entry in the U.S. Pharmaceutical Industry." International Journal of Industrial Organization 18 (1988): 349-369.

112
Shapiro, A, Shapiro E. The Powerful Placebo. Baltimore: The Johns Hopkins University Press, 1997. Thomas, K.B. General Practice Consultations: Is There Any Point To Being Positive? BMJ 294(1987): 1200-1202. Thompson, CA. "Consumer Ads Build Awareness But Not Understand of Advertised Medications, Survey Reveal." American Journal of Health System Pharmacy 55 (1998): 2344-2347. TNS Media Intelligence. Ad$pender Reports. http://www.tns-mi.com/prodAdSpender.htm Accessed May 9, 2006. "Understanding the Effects of DTC Prescription Drug Advertising." Kaiser Family Foundation. 15 Jan. 2005 <www.kff.org>. United States of America. Center for Drug Evaluation and Research (CDER) and Center for Biologics Evaluation and Research (CBER). Food and Drug Administration. Brief Summary: Disclosing Risk Information in Consumer-Directed Print Advertisements. The Registrar, 2004. United States of America. Center for Drug Evaluation and Research (CDER), Center for Biologics Evaluation and Research (CBER), and Center for Devices and Radiological Health (CDRH). Food and Drug Administration. Guidance for Industry: "Help-Seeking" and Other Disease Awareness Communications by or on Behalf of Drug and Device Firms. Federal Register, 2004. United States of America. Center for Drug Evaluation and Research (CDER), Center for Biologics Evaluation and Research (CBER), and Center for Veterinary Medicine. Food and Drug Administration. Guidance for Industry: Consumer-Directed Broadcast Advertisements. Federal Register, 1999. United States of America. Food and Drug Administration. Before the Department of Health and Human Services Food and Drug Administration in the Matter of Request for Comments on Consumer-Directed Promotion, Docket No. 2003N-0344. Federal Register, 2003. United States of America. Food and Drug Administration. FDA Draft Guidance Summary: Disclosing Risk Information in Consumer-Directed Print Advertisements, Docket No. 2004D-0042. Federal Register, 2004. United States of America. Food and Drug Administration. Focus Groups on Prescription Drug Printed Ads. United States of America. Food and Drug Administration. In the Matter of Consumer-Directed Promotion, Docket No. 2003N-0344. 2003.

113
United States of America. Food and Drug Administration. In the Matter of Consumer-Directed Promotion, Docket No. 2003N-0344. 2003. "Views on Prescription Drugs and the Pharmaceutical Industry." Jan.-Feb. 2005. Kaiser Family Foundation. 15 Jan. 2005 <www.kff.org/healthpollreport>. Vogt, W., and J. Bhattacharya. "A Simple Model of Pharmaceutical Price Dynamics." Journal of Law and Economics 46 (2003): 599-626. Walach H, Maidhof C. Is the Placebo Effect Dependent on Time? A Meta-Analysis. In: How Expectancies Shape Experience. Ed. Irving Kirsch. , D.C.: American Psychological Association, 1999. pp.321-332. Welch Cline, Rebecca J., and Henry N. Young. "Marketing Drugss, Marketing Health Care Relationships: a Content Analysis of Visual Cues in Direct-to-Consumer Prescription Drug Advertising." Health Communication 16 (2004): 131-157. Wilson, Rachel. New Zealand. PHARMAC. Fiscal Impact of Direct to Consumer Advertising (DTCA). 2003. Wolfe, Sidney M. "Direct-to-Consumer Advertising: Education or Emotion Promotion." The New England Journal of Medicine 346 (2002): 524-526. Wogalter M, Smith-Jackson T, Mills B, and Paine C. “The Effects of Print Format in Direct-to-Consumer Prescription Drug Advertisements on Risk Knowledge and Preference.” Drug Information Journal 36 (2002): 693-705. Wogalter M and Vigilante W. “Effects of label format on knowledge acquisition and perceived readability by younger and older adults.” Ergonomics 46 (2003): 327-344. Woloshin, Steven, Lisa M. Schwartz, and H G. Welch. "The Value of Benefit Data in Direct-to-Consumer Drug Ads." Health Affairs 19 (2004): 110-120. Woloshin, Steven, Lisa M. Schwartz, Jennifer Tremmel, and H G. Welch. "Direct-to-Consumer Advertisements for Prescription Drugs: What are Americans Being Sold?" The Lancet 358 (2001): 1141-1145. Woshinka, Marta. "Direct-to-Consumer Advertising and Drug Therapy Compliance." Journal of Marketing Research 42 (2005). Zachary, Woodie M., James E. Dalen, and Terrence R. Jackson. "Clinicians' Responses to Direct-to-Consumer Advertising of Prescription Medications." Archives of Internal Medicine 163 (2003): 1808-1812.

114
Zachary, Woodie M., Marvin D. Shepard, Melvin J. Hinich, James P. Wilson, Carolyn M. Brown, and Kenneth A. Lawson. "Relationship Between Direct-to-Consumer Advertising and Physician Diagnosing and Prescribing." American Journal of Health System Pharmacy 59 (2002): 42-49. Ziegler, Dewey K., Michael C. Mosier, Buenaver, Bs Maritza, and Kola Okuyemi. "How Much Information About Adverse Effects of Medication Do Patients Want From Physicians." Archives of Internal Medicine 161 (2001): 706-713.