The relations among school status variables, teacher ... - CORE
181
e University of San Francisco USF Scholarship: a digital repository @ Gleeson Library | Geschke Center Doctoral Dissertations eses, Dissertations, Capstones and Projects 2013 e relations among school status variables, teacher academic and arts curricular emphases, and student academic achievement in grades 1, 3, and 5 Browning Michael Neddeau University of San Francisco, [email protected] Follow this and additional works at: hps://repository.usfca.edu/diss Part of the Elementary Education and Teaching Commons is Dissertation is brought to you for free and open access by the eses, Dissertations, Capstones and Projects at USF Scholarship: a digital repository @ Gleeson Library | Geschke Center. It has been accepted for inclusion in Doctoral Dissertations by an authorized administrator of USF Scholarship: a digital repository @ Gleeson Library | Geschke Center. For more information, please contact [email protected]. Recommended Citation Neddeau, Browning Michael, "e relations among school status variables, teacher academic and arts curricular emphases, and student academic achievement in grades 1, 3, and 5" (2013). Doctoral Dissertations. 91. hps://repository.usfca.edu/diss/91 brought to you by CORE View metadata, citation and similar papers at core.ac.uk provided by University of San Francisco
-
Upload
khangminh22 -
Category
Documents
-
view
0 -
download
0
Transcript of The relations among school status variables, teacher ... - CORE
The University of San FranciscoUSF Scholarship: a digital repository @ Gleeson Library |Geschke Center
Doctoral Dissertations Theses, Dissertations, Capstones and Projects
2013
The relations among school status variables, teacheracademic and arts curricular emphases, and studentacademic achievement in grades 1, 3, and 5Browning Michael NeddeauUniversity of San Francisco, [email protected]
Follow this and additional works at: https://repository.usfca.edu/diss
Part of the Elementary Education and Teaching Commons
This Dissertation is brought to you for free and open access by the Theses, Dissertations, Capstones and Projects at USF Scholarship: a digitalrepository @ Gleeson Library | Geschke Center. It has been accepted for inclusion in Doctoral Dissertations by an authorized administrator of USFScholarship: a digital repository @ Gleeson Library | Geschke Center. For more information, please contact [email protected].
Recommended CitationNeddeau, Browning Michael, "The relations among school status variables, teacher academic and arts curricular emphases, and studentacademic achievement in grades 1, 3, and 5" (2013). Doctoral Dissertations. 91.https://repository.usfca.edu/diss/91
brought to you by COREView metadata, citation and similar papers at core.ac.uk
provided by University of San Francisco

The University of San Francisco
THE RELATIONS AMONG SCHOOL STATUS VARIABLES, TEACHER ACADEMIC AND ARTS CURRICULAR EMPHASES, AND STUDENT
ACADEMIC ACHIEVEMENT IN GRADES 1, 3, AND 5
A Dissertation Presented to
the Faculty of the School of Education Learning & Instruction Department
In Partial Fulfillment of the Requirements for the Degree
Doctor of Education
by Browning Neddeau
San Francisco December 2013
ii
THE UNIVERSITY OF SAN FRANCISCO Dissertation Abstract
The Relations Among School Status Variables, Teacher Academic and Arts Curricular Emphases, and Student
Academic Achievement in Grades 1, 3, and 5
The National Center of Education Statistics’ Early Childhood
Longitudinal Study, Kindergarten Class of 1998-1999 (ECLS-K) data were used
to explore the curricular emphasis in schools of varying socioeconomic status in
both public and private schools. Data collected between 1998 and 2003 were
used in the secondary analyses of curricular emphasis in nine curriculum areas
identified in the Teacher Questionnaire were grouped into academic, arts, or
physical education.
The results from descriptive statistics, correlations, and multiple
regressions at each grade indicated differences in academic, arts, and physical
education emphases based on public or private schools and school socioeconomic
status (SES). Although lower-SES schools had greater academic emphasis in
grade 1, this was not found in grades 3 and 5. Low-SES schools in grade 5 had
greater academic emphasis in both public and private schools than higher-SES
schools. For grades 1 and 3, public schools with high SES, on average, had
greater arts emphasis than low-SES schools. For private schools in grade 1, low-
SES schools, on average, had greater arts emphasis than high-SES schools. In
grade 5, public and private schools had greater arts emphasis, on average, in

iii
schools with high SES compared to schools with lower SES. In general, low-SES
schools had a physical education emphasis with little difference between low-,
middle-, and high-SES in grades 1, 3, and 5. In general, both the academic and
arts emphasis variables were related to reading and mathematics achievement, and
the relations were statistically significant, but the regression coefficients were
small. Academic emphasis only predicted reading and mathematics achievement
in grade 1 and in grade 5 reading. Arts emphasis only predicted reading
achievement in grade 5. Physical education emphasis predicted reading
achievement at grade 3 and mathematics achievement at grade 1. In conclusion,
school status variables such as public or private school and school SES indicated
differences in academic, arts, and physical education emphases in grades 1, 3, and
5. None of the three curricular emphasis variables predicted both reading and
mathematics achievement in grades 1, 3, or 5.
iv
This dissertation, written under the direction of the candidate’s dissertation committee
and approved by the members of the committee, has been presented to and accepted by
the Faculty of the School of Education in partial fulfillment of the requirements for the
degree of Doctor of Education. The content and research methodologies presented in this
work represent the work of the candidate alone.
Browning Michael Neddeau December 5, 2013 Candidate Date Dissertation Committee Robert Burns December 5, 2013 Chairperson Patricia Busk December 5, 2013 Caryl Hodges December 5, 2013

v
Acknowledgements
For those that have helped me reach this educational milestone, migwetch. I am
lifted by your love and grateful for the special bond we share. Thank you to the
University of San Francisco’s faculty and staff that have helped me through the doctoral
journey. I would like to thank my parents, Donald and Madeleine Neddeau, for instilling
in me the importance of integrity and persistency as these words guide me each day. I
would like to thank my sister, Donielle Neddeau, for her steadfast love and support in
everything I do. In a childhood poem she said that “we are like two shining stars; we
always have each other no matter where we are.” She has stayed true to this statement
tenfold and for that I am forever grateful. I would like to thank my spouse, Mark
Alabanza, for loving me unconditionally and for always telling me that I make him
proud. His many hours of listening to me speak about educational statistics and
willingness to proofread the dissertation are testament to his unshakable love and support
throughout this journey. Lastly, I would like to thank my tribe, the Citizen Potawatomi
Nation, for its continued support of tribal members in reaching new academic heights
through scholarships and other generous programs that promote our tribe’s prosperous
future as a nation. Migwetch and Jagenaganon.

vi
TABLE OF CONTENTS
Page Abstract ............................................................................................................................... ii Acknowledgements ..............................................................................................................v Table of Contents ............................................................................................................... vi List of Tables ..................................................................................................................... ix List of Figures ................................................................................................................... xii CHAPTER
I. STATEMENT OF THE PROBLEM .......................................................................1 Purpose of the Study ..........................................................................................5
Significance of the Study ...................................................................................6 Theoretical Framework ......................................................................................7 Background and Need ......................................................................................13 Research Questions ..........................................................................................22 Definition of Terms..........................................................................................22 Summary ..........................................................................................................26
II. REVIEW OF LITERATURE ................................................................................27
Accountability ..................................................................................................27 Standards-Based Instruction ............................................................................31 State Standards ...........................................................................................33 Arts in Standards-Based Education ...........................................................34 What is Arts Education? ..................................................................................38 The Arts .....................................................................................................39 Curriculum Integration ...............................................................................40 Content Integrity ........................................................................................40 Research on Arts Education .............................................................................42 Academic Outcomes ..................................................................................46 Engagement in the Arts ..............................................................................49 Factors that Moderate Arts Education .............................................................52 Socioeconomic Status ................................................................................53 Public versus Private School Arts Education .............................................53 Summary ..........................................................................................................55
III. METHODOLOGY ................................................................................................57 Research Design ...............................................................................................58 Sample..............................................................................................................62 Preparation of the Data Set ..............................................................................63
vii
TABLE OF CONTENTS Continued
CHAPTER Page
Instrumentation ................................................................................................67 Student Level Variables .............................................................................68 Teacher Level Variables ............................................................................70 Justification for Curricular Emphasis Variable Creation .....................74
School Level Variables ..............................................................................78 Data Analysis ...................................................................................................79 Missing Data ..............................................................................................79
Data Analysis Strategy ...............................................................................81 Summary ..........................................................................................................82
IV. RESULTS ..............................................................................................................85 Results for Research Question 1 ......................................................................85
Grade 1: Academic Emphasis ...................................................................85 Grade 1: Arts Emphasis ............................................................................86 Grade 1: Physical Education Emphasis ....................................................88 Grade 3: Academic Emphasis ...................................................................88 Grade 3: Arts Emphasis ............................................................................90 Grade 3: Physical Education Emphasis ....................................................91 Grade 5 Reading Teacher: Academic Emphasis .......................................92 Grade 5 Reading Teacher: Arts Emphasis ................................................94 Grade 5 Reading Teacher: Physical Education Emphasis ........................95 Grade 5 Mathematics or Science Teacher: Academic Emphasis ..............96 Grade 5 Mathematics or Science Teacher: Arts Emphasis .......................97 Grade 5 Mathematics or Science Teacher: Physical Education Emphasis
................................................................................................................................98 Summary of Research Question 1 Results .................................................99
Results for Research Question 2 ....................................................................104 Grade 1 .....................................................................................................104 Grade 3 .....................................................................................................107 Grade 5: Reading Teacher ......................................................................110 Grade 5: Mathematics or Science Teacher .............................................112 Grade 1, 3, and 5: Comparisons ..............................................................114 Summary of Research Question 2 Results ...............................................116 Summary of Results .......................................................................................118
V. SUMMARY, LIMITATIONS, DISCUSSION, AND IMPLICATIONS ............120 Summary of Study .........................................................................................120
Summary of Findings .....................................................................................125 Limitations .....................................................................................................127 Discussion of Findings ...................................................................................129 Implications for Research ..............................................................................136
Implications for Practice ................................................................................141
viii
TABLE OF CONTENTS Continued CHAPTER Page
Common Core State Standards in the 21st Century Classroom ...............141 The Arts and the Common Core State Standards ..............................142
REFERENCES ....................................................................................................144 APPENDICES .....................................................................................................152
Appendix A ....................................................................................................153 Appendix B ....................................................................................................156
Appendix C ....................................................................................................170
ix
LIST OF TABLES CHAPTER
Page
1. Grade Level and School Year of Data Collection .................................................61
2. Frequency and Percent of Sample Based on Gender .............................................62
3. Frequency and Percent of Sample Based on Race .................................................62
4. Sample Sizes at the Student, Teacher, and School levels for Grades 1, 3, and 5 ..63
5. Steps and Description for Data Set Creation .........................................................65
6. Descriptive Statistics for Ability and Each of the Three Reading Achievement IRT Scores Broken Down by Grade Level ............................................................70
7. How Often and How Much Time Curricular Emphasis Variables in Academics and the Arts ............................................................................................................71
8. How Many Times Each Week and How Much Time Each Day Students Participate in Physical Education...........................................................................73
9. Principal Component Analysis for the Nine Academic and Arts Emphasis Variables and Communalities of Grade 1 ..............................................................76
10. Principal Component Analysis for the Nine Academic and Arts Emphasis Variables and Communalities of Grade 3 ..............................................................76
11. Principal Component Analysis for the Eight Academic and Arts Emphasis Variables and Communalities of Grade 5 Reading Teacher ..................................77
12. Principal Component Analysis for the Eight Academic and Arts Emphasis Variables and Communalities of Grade 5 Mathematics or Science Teacher .........77
13. First Principal Component Loadings and Eigenvalues for Socioeconomic Status (SES), Reflected Percent Minority, and Reflected Percent Free Lunch for Grades 1, 3, and 5 ...............................................................................................................78
14. Low and High Cut Points for Categorical Socioeconomic Status (SES) for Grades 1, 3, and 5 ...............................................................................................................79
15. Means, Standard Deviations (SD), and Sample Sizes (n) for Academic Emphasis in Instructional Minutes in Public and Private Schools and Three Levels of Socioeconomic Status (SES) at Grade 1 ................................................................86

x
16. Means, Standard Deviations (SD), and Sample Sizes (n) for Arts Emphasis in Instructional Minutes in Public and Private Schools and Three Levels of Socioeconomic Status (SES) at Grade 1 ................................................................87
17. Means, Standard Deviations (SD), and Sample Sizes (n) for Physical Education Emphasis in Instructional Minutes in Public and Private Schools and Three Levels of Socioeconomic Status (SES) at Grade 1 ............................................................88
18. Means, Standard Deviations (SD), and Sample Sizes (n) for Academic Emphasis in Instructional Minutes in Public and Private Schools and Three Levels of Socioeconomic Status (SES) at Grade 3 ................................................................89
19. Means, Standard Deviations (SD), and Sample Sizes (n) for Arts Emphasis in Instructional Minutes in Public and Private Schools and Three Levels of Socioeconomic Status (SES) at Grade 3 ................................................................91
20. Means, Standard Deviations (SD), and Sample Sizes (n) for Physical Education Emphasis in Instructional Minutes in Public and Private Schools and Three Levels of Socioeconomic Status (SES) at Grade 3 ............................................................92
21. Means, Standard Deviations (SD), and Sample Sizes (n) for Academic Emphasis in Instructional Minutes in Public and Private Schools and Three Levels of Socioeconomic Status (SES) at Grade 5 Reading Teacher ....................................94
22. Means, Standard Deviations (SD), and Sample Sizes (n) for Arts Emphasis in Instructional Minutes in Public and Private Schools and Three Levels of Socioeconomic Status (SES) at Grade 5 Reading Teacher ....................................95
23. Means, Standard Deviations (SD), and Sample Sizes (n) for Physical Education Emphasis in Instructional Minutes in Public and Private Schools and Three Levels of Socioeconomic Status (SES) at Grade 5 Reading Teacher ...............................96
24. Means, Standard Deviations (SD), and Sample Sizes (n) for Academic Emphasis in Instructional Minutes in Public and Private Schools and Three Levels of Socioeconomic Status (SES) at Grade 5 Mathematics or Science Teacher ...........97
25. Means, Standard Deviations (SD), and Sample Sizes (n) for Arts Emphasis in Instructional Minutes in Public and Private Schools and Three Levels of Socioeconomic Status (SES) at Grade 5 Mathematics or Science Teacher ...........98
26. Means, Standard Deviations (SD), and Sample Sizes (n) for Physical Education Emphasis in Instructional Minutes in Public and Private Schools and Three Levels of Socioeconomic Status (SES) at Grade 5 Mathematics or Science Teacher ......99
xi
27. Mean Totals for Academic, Arts, and Physical Education Emphasis in Public and Private Schools at Grades 1, 3, 5 .........................................................................100
28. Mean Totals for Low-, Middle, and High-Socioeconomic Status (SES) Schools for Academic, Arts, and Physical Education Emphases at Grades 1, 3, and 5 ....102
29. Summary of Research Question 1 Results Including Means, Standard Deviations (SD), and Sample Sizes (n) of Instructional Minutes in Academic, Arts, and Physical Education Curricular Emphases in Public and Private Schools and Three Levels of Socioeconomic Status (SES) at Each Grade ........................................103
30. Intercorrelation Matrix of 8 Variables and Reading and Mathematics Achievement at Grade 1 (N=2,967) .....................................................................105
31. Regression Coefficients (B), Standard Errors (SE), and Beta Weights ( for Reading and Mathematics in Grade 1 ..................................................................106
32. Intercorrelation Matrix of 8 Variables and Reading and Mathematics Achievement at Grade 3 (N=3,371) .....................................................................108
33. Regression Coefficients (B), Standard Errors (SE), and Beta Weights ( for Reading and Mathematics in Grade 3 ..................................................................109
34. Intercorrelation Matrix of 8 Variables and Reading and Achievement at Grade 5 (N=3,340) .............................................................................................................111
35. Regression Coefficients (B), Standard Errors (SE), and Beta Weights ( for Reading and Mathematics Regressions in Grade 5 Reading and Mathematics or Science Teachers ..................................................................................................112
36. Intercorrelation Matrix of 8 Variables and Mathematics Achievement at Grade 5 for the Mathematics or Science Teacher (N=3,280) ............................................113
37. Beta Weights Predicting Reading Achievement at Grades 1, 3, and 5 ................115
38. Beta Weights Predicting Mathematics Achievement at Grades 1, 3, and 5 ........116
39. Summary of Research Question 2 Results for Reading Achievement ................117
40. Summary of Research Question 2 Results for Mathematics Achievement .........117
41. The How Often and How Much Time Teacher Questionnaire Item ...................171
xii
LIST OF FIGURES
FIGURE Page
1. The Five Accountability Features in Relation to Schools, Teaching, and Students................................................................................................................................12
2. Data Analysis Plan Separated by Public and Private Schools, Socioeconomic Status (SES), Curricular Emphasis, and Student Achievement .............................83
3. The How Much Time Each Week and How Much Time Each Day Children Spend in Physical Education as Found in the Teacher Questionnaire .................172
1
CHAPTER I
STATEMENT OF THE PROBLEM
Many agree with the President's Committee on the Arts and the Humanities
(2011) that the arts are not taken as a serious part of the elementary-school curriculum
(Della Pietra, Bidner, & Devaney, 2010; Hull, 1993; Purnell & Gray, 2004; Spohn,
2008). The arts, broadly defined as music, fine art or visual arts, dance, and theater, are
viewed as handmaidens or “frill” to other content areas such as English Language Arts
(ELA) and mathematics (Brewer & Brown, 2009). This viewpoint has not always been
the case for the arts.
Prior to 1983, many recognized the arts as essential to living (Purnell & Gray,
2004). In the 1920s, people valued art as a means of being able to make their own
furniture and jewelry. The arts met self-sufficient needs in a time of great
industrialization. There was also the creative expression movement in the 1920s and the
discipline-oriented movement in the 1960s (Carpenter & Tavin, 2010). Each of these
movements brought forth their own purposes for art-making and appreciation. In the
1980s, however, the landscape for arts education and the role of the arts in schools
changed dramatically. During this time, the perspective on arts education shifted from
valuing art as its own content area worthy of separate study to primarily integrating arts
into content areas that were used for accountability purposes on state assessments
(Brewer & Brown, 2009; Purnell & Gray, 2004).
In 1983, A Nation at Risk: The Imperative for Educational Reform reported on the
quality of education in America. It was viewed as an open letter that was “free of
political partisanship” (p. iii), outlining the strengths and weaknesses of American
2
education. It was in this open letter that “New Basics” for curriculum were
recommended to help build a foundation for kindergarten to 12th-grade (K-12) students’
future successes in life (National Commission on Excellence in Education, 1983). The
New Basics focused on English Language Arts (ELA), mathematics, science, and social
studies. The fine and performing arts were noted as areas that could complement the
New Basics. Such a framework for educational reform hailed higher levels of
accountability for teachers and students and marked the beginning of the standards-based
era in education.
The New Basics placed a heavy emphasis on measures of accountability in
schools. The Nation at Risk report viewed education prior to 1983 as having committed
an act of “unthinking, unilateral educational disarmament” (National Commission on
Excellence in Education, 1983, p. 5). It was time to emphasize accountability for student
achievement. The New Basics were meant to bring student achievement in the United
States back to a globally competitive level. A Nation at Risk (1983) claimed that
“international comparisons of student achievement, completed a decade ago, revealed on
19 tests American students were never first or second and, in comparison with other
industrialized nations, were last seven times” (p. 8). The educational system was at risk.
There were at least two interrelated outcomes of A Nation at Risk. First, there
was greater accountability in schools for language arts and mathematics achievement
outcomes, forcing schools to spend more instructional time in those subjects (Darling-
Hammond, 2007; Diamond, 2012; Dorner, Spillane, & Pustejovsky, 2011). Second,
because of the more time spent on language arts and mathematics, the curriculum was

3
narrowed and instructional time for the arts was reduced (Darling-Hammond, 2007;
Spohn, 2008).
A Nation at Risk underscored greater accountability in schools. The National
Commission on Excellence in Education (1983) suggested using standardized
achievement tests as benchmarks to assess student progress. These tests were to be
administered during major transitional times in academia, such as from elementary school
to middle school. Standardized achievement tests were envisioned as a way to inform
both the teacher and student of progress and to target specific content areas that might
need remediation (National Commission on Excellence in Education, 1983). Stickney
(2009) called this act of aligning assessment to a set of learning outcomes “system
alignment” (p. 199). President Obama’s Race to the Top of 2009 and Former President
Bush’s No Child Left Behind Act of 2001 are two exemplars of heightened focus on
accountability through assessment. Such federal initiatives encouraged what have
become known as “high-stakes” tests and system alignment to state-adopted standards
including, most recently, the Common Core State Standards (Stickney, 2009). Schools
are mostly concerned with quantitative assessments that are used for accountability
purposes (Spohn, 2008).
Greater accountability in the schools has led to a narrowed curriculum, with a
consequence of less instructional time for the arts. Students spend the majority of their
school day on reading and mathematics curricula because those are the content areas that
appear on standardized tests (Spohn, 2008). Although researchers have found a link
between student achievement and engagement in the arts (Catterall, Dumais, &
Hampden-Thompson, 2012; Catterall, Chapleau, & Iwanaga, 1999; Ingram & Meath,
4
2007; Vaughn, 2000), there is a decrease emphasis on arts education (Hull, 1993; Purnell
& Gray, 2004) in the narrowed curriculum. Brewer and Brown (2009) found that schools
do not devote enough instructional time in school for the arts. Instead, instruction time in
the arts is designed for students to learn another content area instead of valuing the
creation of art as a unique content and process (Brewer & Brown, 2009; Hetland, Winner,
Veenema, & Sheridan, 2007; President's Committee on the Arts and the Humanities,
2011). Grallert (2009) stated “We learn to segregate and categorize who we are and what
we can do by what we learn in school, becoming disengaged in doing art because of an
inability to make the outcome look like what we intended” (p. 140).
A Nation at Risk was the impetus for greater accountability, with a concomitant
narrowing of the curriculum and less curricular emphasis on the arts. There is, however,
research that suggests that not all schools are equally affected by accountability (Darling-
Hammond, 2007; Diamond, 2012; Lee & Reeves, 2012). Schools with higher
socioeconomic status (SES) and private schools may be affected by accountability
differently than schools with lower SES and public schools.
Darling-Hammond (2007) reported that schools with higher SES spent 10 times
more money per student than schools with lower SES. Likewise, schools with greater
resources are not found in poorer neighborhoods (Darling-Hammond, 2007). Schmidt,
Leland, Houang, and McKnight (2011) also indicated that SES may affect the learning
opportunities of the students served. Higher SES schools emphasize participatory
learning experiences (Diamond, 2012) while students in lower SES schools receive
instruction that is much more traditional (i.e., seatwork and lecture).
5
There is also evidence (Dorner et al., 2011; Gershberg, González, & Meade,
2011) that suggests differences in accountability and teachers’ curricular emphasis in
public versus private schools. Darling-Hammond (2007) noted that the pressures from
testing and school ranking may be a part of curricular decision-making and, ultimately,
curricular emphasis within a school. Dorner et al. (2011) suggested that it is the
accountability system of the school setting (i.e., public or private) that defines the
curricular emphasis. For instance, public schools have defined standards and curriculum,
whereas private schools may have less defined standards and more flexibility in terms of
curricular emphasis (Dorner et al., 2011).
There is not much research, however, in whether curricular narrowing is the same
across all schools or whether SES or type of school play a role. Consequently, the
purpose of this study was to examine SES and public versus private schools as factors
that moderate arts education in a standards-based education.
Purpose of the Study
The purpose of this study was to examine if there are differences in curricular
emphasis in grades 1, 3, and 5 between higher, middle, and low SES schools and public
versus private schools in light of the available research on arts education and
accountability in schools. More specifically, the study examined curricular emphasis in
academics, arts, and physical education in the elementary grades. Because dance is part
of the physical education curriculum, physical education was included in the study. If
there were differences in the curricular emphasis, then student academic achievement in
English language arts and mathematics were investigated.
6
To this end, descriptive data from the Early Childhood Longitudinal Study,
Kindergarten Class of 1998-1999 (ECLS-K) data file were used to explore the curricular
emphasis in schools of varying SES and in public and private schools. The ECLS-K
teacher questionnaires were used to examine teacher-reported curricular emphasis in first,
third, and fifth grades. This study used data collected between the years 1998-2003.
Significance of the Study
This study is important for three reasons. First, many researchers (Catterall,
2009; Catterall et al., 2012; Deasy, 2002; Ingram & Meath, 2007; Ingram & Reidell,
2003; McMahon, Rose, & Parks, 2003) claim that arts education and student achievement
are connected. Some researchers (Vaughn & Winner, 2000; Winner & Cooper, 2000;
Winner & Hetland, 2000), however, have argued that there is insufficient evidence to
make a link between arts education and student achievement. Much of the latest research
in arts education has focused on engagement in the arts (An, Ma, & Capraro, 2011;
Belliveau, 2006; Catterall et al., 2012; Rosenfeld, 2011; Smithrim & Upitis, 2005) and
not curricular emphasis in the arts. Engagement in the arts has been noted primarily
through teacher observations that find students make advances in academic achievement
under these engaged times in the arts.
Second, previous studies in arts education and elementary schools used small
sample sizes (Brouillette, 2010; Montgomerie & Ferguson, 1999). This study used a
national, large-scale probability sample. The data were collected longitudinally and
permits researchers to compare public versus private schools, student academic
achievement scores, and curricular emphasis in the elementary grades with a large
sample.
7
Third, much of the available research on arts education focused on secondary-
school and university environments (Catterall et al., 2012; The College Board, 2011;
Vaughn & Winner, 2000). This study focused on the elementary grades. Because
educational policy reform efforts include the elementary grades, this study provides
insight to the effect of arts education during these early school experiences.
Theoretical Framework
The theoretical framework of this study was grounded in standards-based
education and accountability. The World Development Report 2004 (World Bank Staff,
2003) presented a framework that outlined five features in accountability in a variety of
institutions, including educational systems: delegating, financing, performing, informing,
and enforcing. The framework is intended for use in service-oriented environments
(World Bank Staff, 2003) such as banks, schools, and government. There are both actors
and accountable actors in the framework. Actors are the state and federal government,
and the accountable actors are the teachers and students within schools. This study used
all five features to explore accountability because each feature is germane to standards-
based education.
Delegating refers to those actors who direct the accountable actors. For instance,
the state and federal governments require that schools hire highly qualified teachers.
Strunk and McEachin (2011) indicated that issues of accountability in schools may result
in the replacement of teaching staff to meet Adequate Yearly Progress (AYP). Districts
and schools that are either labeled as “failing” or do not meet AYP receive increased
levels of state oversight (Strunk & McEachin, 2011). Diamond (2012) argued that SES
plays a role in the curricular emphasis that is delegated to the districts and schools.
8
Schools that serve lower SES populations are directed to focus on recitation and seatwork
whereas higher SES populations are encouraged to provide active participation (Darling-
Hammond, 2007, 2010). A focus on recitation and seatwork, in turn, leads to a narrowed
curriculum that may be based on the type of school and the SES of the students served
(Darling-Hammond, 2007; Diamond, 2012). In this study, delegating is illustrated in the
framework where the government dictates what credentials a teacher must hold for a
school district to hire them as qualified to teach. Darling-Hammond (2010) defined
“qualified” teachers as those that both hold full certification and have shown competence
in the subject matter they teach. Research (Darling-Hammond, 2007, 2010) indicates that
teachers in low-performing schools are frequently either not qualified or less qualified to
teach. Delegating, therefore, connects to the study because lower SES schools may have
teachers that are either not qualified or less qualified to teach.
Financing refers to the money that is allotted from the actors to the accountable
actors. An example of this relationship is seen in state government mandates to
individual school districts to use funding a certain way. For this study, the argument is
made that in the era of accountability, state and federal funds are directed toward English
language arts and mathematics because these are the tested content areas on standardized
assessments (Spohn, 2008). Chiang (2009) suggested that districts and schools have a
“threat-induced” (p. 1054) strategy when it comes to curricular emphasis and educational
reform because schools must spend money on areas that can lead to further funds. For
instance, if schools can receive additional money for higher student achievement scores
in mathematics, then schools will spend more money in this area to gain more funds in
the future. As Darling-Hammond (2007, 2010) suggested, schools with students from

9
lower-SES families have teachers that are either not qualified or less qualified to teach.
Thus, there is a link between not qualified or less qualified teachers, low-SES schools,
and funding. SES, therefore, is part of the funding problem. Although The World
Development Report 2004 is set in a context outside of education, its accountability
framework aligns with the standards-based education system in regard to system
alignment (Stickney, 2009) where there is an alignment of the assessment to the learning
outcomes. Financing connects to this study because it takes into account possible
differences in curricular emphasis based on SES and type of school. There is a growing
amount of research (Chiang, 2009; Darling-Hammond, 2010; Spohn, 2008) that financing
plays an important role in accountability. This study builds upon the evidence in schools
that SES is a factor that moderates the curricular decisions.
Enforcing is the third accountability feature that is underpinned in this study.
Enforcing refers to the actors ensuring the accountable actors meet the state standards.
Enforcing is commonly seen through state standardized tests and accreditation. If
districts or schools do not meet the state’s standards on tests and accreditation, then
government oversight of curricular decision-making becomes more stringent and a
narrowed curriculum emerges (Darling-Hammond, 2007). In short, low-SES populated
schools may be under greater scrutiny compared with schools that are higher in SES
(Darling-Hammond, 2007) because the standardized test scores do not meet expected
growth per academic year in the low-SES schools. Enforcing directly connects to the
study because differences in curricular emphasis may be tied to both SES and the type of
school based on schools meeting standards. In this study, therefore, schools that have a
certain curricular emphasis may show a relationship to SES and type of school.
10
Unlike the three accountability features of the framework described above, the
other two features of the framework, performing and informing, act differently.
Performing is the feature that measures whether more accountability is needed.
Performing and informing are the only two features of the framework that direct
accountability from the accountable actors to the actors. The other three features direct
accountability from actors to the accountable actors. In terms of education, these two
features relate to the accountability from schools to government. The most important of
this concept remains in student test scores. These test scores are the performance of
students and inform the government as to the current status of student achievement in
schools. Performing and informing are at the center of many scholarly works (Almarode,
2011; Catterall et al., 2012; Chiang, 2009; Crane, 2010; Crocco & Costigan, 2007;
Darling-Hammond, 2007, 2010; Huang, 2008; Ingram & Meath, 2007; Ingram & Reidell,
2003; Walker, Tabone, & Weltsek, 2011; Wilkins et al., 2003; Winner & Cooper, 2000).
According to Darling-Hammond (2007), the schools that receive lower scores on
standardized tests are the ones that service students from lower SES populations. This
study adds to the available research with a specific focus on SES and type of school
(public or private). Research that investigated the type of school within a similar context
of this study is very limited (Crane, 2010).
There is a growing body of research (Chiang, 2009; Crocco & Costigan, 2007;
Darling-Hammond, 2007; Donahue & Stuart, 2008; President’s Committee on the Arts
and the Humanities, 2011) that show the consequences of a narrowed curriculum in
schools. Schools that receive higher scores on standardized tests have less oversight from
the state and federal government (Darling-Hammond, 2007). The low SES populations

11
are less likely to have the arts in their schools because they are under strict scrutiny of the
government to show improvement in the tested content areas of English language arts and
mathematics.
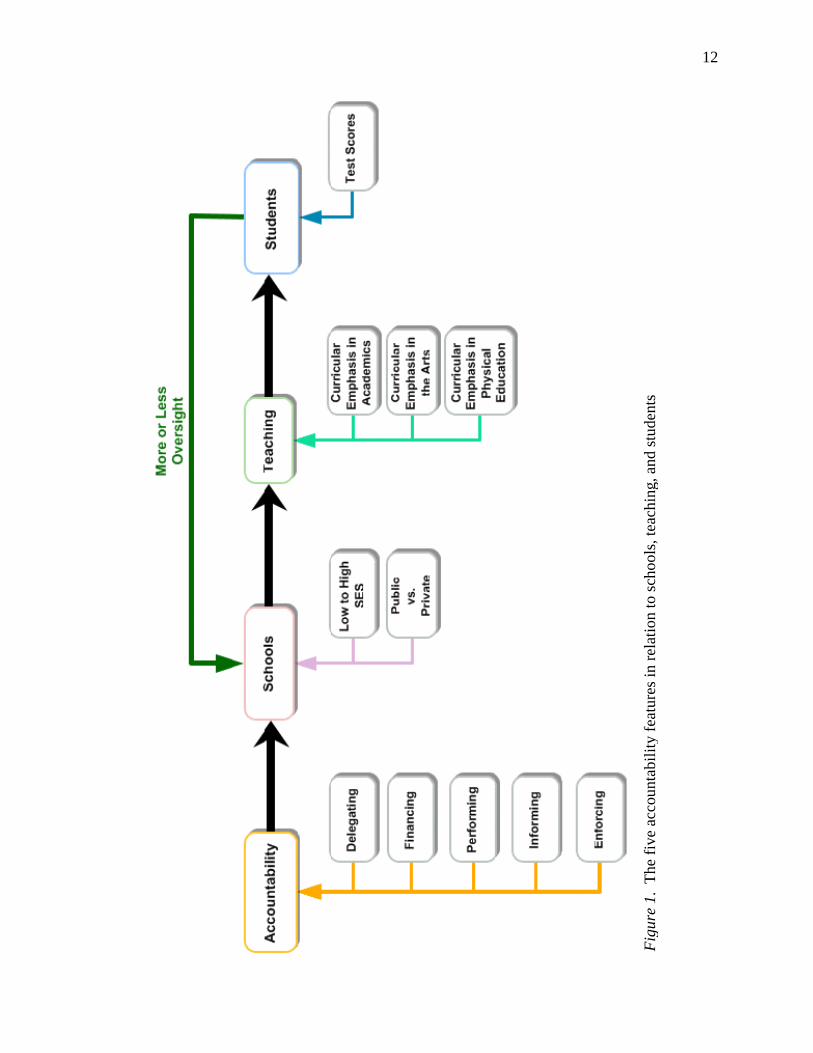
Figure 1 illustrates the five features in accountability as it pertains to
accountability in schools. The amount of government oversight that a school district
receives depends on the student test scores. As previously described, government
oversight relates to the performing and informing features in the accountability
framework. Figure 1 highlights the main variables explored in this study for each part of
the accountability system (i.e., schools, teaching, and students).
The framework in Figure 1 outlines accountability in schools and how this study
examined curricular emphasis in regard to SES and type of school (public or private). In
the accountability framework, there are five features: delegating, financing, performing,
informing, and enforcing. As previously described, each feature in the accountability
framework has a specific connection to the study. The possible differences in teacher
quality based on SES and the subsequent curricular emphasis of such teachers connects to
the delegating feature in the framework. Financing examines SES and type of school as
factors that may affect a teachers reported curricular emphasis. Student performance (i.e,
performing feature) on standardized tests (as noted in the IRT score) may possibly relate
to the teachers curricular emphasis. The informing feature, student test scores, informs
the government as to how much oversight is necessary of a particular district or school.
The enforcing feature is related to the possible narrowed curriculum that may emerge
depending on SES and the type of school. According to Darling-Hammond (2007) and
Diamond (2012), SES and school type play a noticeable role in curricular emphasis.
12
.
Fig
ure
1. T
he f
ive
acco
unta
bili
ty f
eatu
res
in r
elat
ion
to s
choo
ls, t
each
ing,
and
stu
dent
s
13
Even though there is an emerging amount of interest in regard to SES and school
type, little quantitative research (Catterall et al., 2012; Parsad & Spiegelman, 2012) has
examined a teachers reported curricular emphasis on the academics, the arts, and physical
education. As previously noted, dance is part of the physical education curriculum and
was, therefore, included in the study. No quantitative research has focused on all three
areas of curricular emphasis as in this study. The framework in Figure 1 is grounded in
research (Darling-Hammod, 2007; Diamond, 2012; Dorner, Spillane, & Pustejovsky,
2011; World Bank Staff, 2003) and indicates SES, school type, curricular emphasis, and
test scores for the purposes of this study.
Background and Need
Parsad and Spiegelman’s (2012) study reported instructional shifts in public
elementary and secondary schools between the 1999-2000 and 2009-2010 school years.
They found that availability of arts education in public schools declined in all areas of
arts education except for music education where 94% of schools reported music
instruction. In the visual arts, instruction dropped from 87% to 83% of schools that
reported specific visual arts instruction. Theater instruction decreased from 20% to 4%.
Dance instruction fell from 20% to 3% in the same time period (Parsad & Spiegelman,
2012).
During the same 10-year span, two federal educational policy reforms were
introduced that promoted accountability in schools: Former President Bush’s No Child
Left Behind Act of 2001 and President Obama’s Race to the Top of 2009. States view
accountability through standardized-test results. English language arts and mathematics
are the two content areas used for accountability measures. As states strive to comply
14
with the federal educational policies, content areas in schools that are not part of
accountability measures may be limited (Spohn, 2008). As Eisner (2002) stated, the arts
are innately qualitative in nature. Yet, the content areas that are the focus in schools are
those that can be measured quantitatively (Massell, 2001).
The need for quantitative data to support an investment in the arts is at an all-time
high (President's Committee on the Arts and the Humanities, 2011; Winner & Cooper,
2000). Arts education has been based largely on qualitative research (Eisner, 2002).
There is an emerging need for scholarly research that is data-driven and builds on the
qualitative arts education research that is available (Spohn, 2008; van der Veen, 2012).
Data-driven curricular decision-making (Baker & Welner, 2012; Carpenter & Tavin,
2010; Catterall, 2009; Catterall et al., 2012; Fiske, 1999) and standards-based instruction
(Donahue & Stuart, 2008; National Commission on Excellence in Education, 1983)
remain at the center of both research and practice.
The U.S. Department of Education’s Arts in Education program that funds
projects in arts education was eliminated in 2011 but was reinstated after budget
negotiations. The 2013 budget proposal suggests consolidation of the program into a new
fund for well-rounded education (Americans for the Arts, 2012). There is a need for
additional research that directly supports the benefits of the arts in education so the
government does not eliminate necessary funds. Parsad and Spiegelman (2012) found
that all areas of the arts are on a decline in schools with instruction in dance and theater at
decreases of 17% and 16%, respectively. According to Rabkin and Hedberg (2011),
access to arts education varies among racial groups. Rabkin and Hedberg (2011) cited
three specific groups with the percentage of arts education in childhood numbers reported
15
from 1982 and 2008, respectively: European Americans (59.2% to 57.9%), African
Americans (50.9% to 28.1%), and Hispanic Americans (47.2% to 26.2%). Those who
may benefit from arts the most have the least access to it (Rabkin & Hedberg, 2011).
Additionally, research on students who are labeled as at-risk youth (Catterall, 2009;
Catterall et al., 2012) are included as those with the least amount of access to and
engagement in the arts.
The majority of arts education has focused on students in secondary schools and
above (Catterall et al., 2012; The College Board, 2011; Vaughn & Winner, 2000). Yet,
the educational policy reform efforts also apply to students in elementary schools. This
dissertation aims to fill the gap in scholarly work as it pertains to research and practice at
the elementary-school level. Research at the elementary-school level could provide
evidence in regard to the effect of arts in schools during the elementary grades. Recent
arts education research indicated that student involvement in the arts increases academic
achievement (Catterall et al., 2012; Catterall, Chapleau, & Iwanaga, 1999; Ingram &
Meath, 2007; Vaughn, 2000). Socioeconomic status emeged in the research as a societal
divide in regard to access to arts education (Catterall et al., 1999, 2012; Ingram &
Reidell, 2003; Keiper, Sandene, Persky, & Kuang , 2009).
Although there is a need for further research in arts education in this era of
accountability, there remains a lack of scholarly research that is grounded in quantitative
data. To help fill this emerging need, Catterall et al. (2012), Parsad and Spiegelman
(2012), and Hetland, Winner, Veenema, and Sheridan (2007) are three studies that are
germane to this study of accountability and the arts.
16
Catterall et al.’s (2012) study recognized that current research examines findings
through the lens of the student instead of teacher variables and noted the implications
such deficits have in school reform efforts. They acknowledged that their work is a
“partial attempt” (p. 8) to fill the knowledge gap regarding student academic and social
achievements and involvement in the arts in the high-school years. Their research
focused on engagement in the arts both in and out of high school. Catterall et al. (2012)
provided a foundation for future research regarding the arts and socioeconomic status but
admitted the methodological bias of conceptualizing “high-arts” and “low-arts” students
for the data analysis. Catterall et al. (2012) defined high-arts and low-arts based on how
involved students were in the arts. Moreover, the Catterall et al. (2012) research used
variables that embraced both in- and out-of-school experiences in the arts. This
dissertation sought to fill a different gap in the literature as it pertains to a teacher’s
curricular emphasis and student achievement in the elementary grades.
Catterall et al. (2012) focused on four large-scale datasets but only concentrated
on at-risk high-school students. More research is needed that highlights academic
achievement in the elementary-school years. Moreover, the available research at the
elementary and secondary levels of schooling focused on student information, such as
socioeconomic status, parent education levels, gender differences, years of studies in the
arts, and involvement in the arts in and out of school. There remains a gap in the research
regarding a teacher’s curricular emphasis in terms of the arts. This type of research is
necessary to provide further insight on how teachers’ instructional choices affect student
academic achievement scores. According to the available scholarly literature (Catterall et
al., 2012; Parsad & Spiegelman, 2012), current research notes the amount of arts in
17
schools and students’ involvement in the arts in and out of school, but there remains a
gap in research that examines a teacher’s curricular emphasis on the arts in the
elementary grades. This dissertation attempted to fill this gap.
Parsad and Spiegelman (2012) was germane to this dissertation because it
examined arts instruction in schools. Congress requested the U.S. Department of
Education’s Office of Innovation and Improvement and the National Center for
Education Statistics (NCES) to conduct this study to investigate to what extent students
receive instruction in the arts. Using the Fast Response Survey System (FRSS), NCES
conducted this large-scale study that included a sampling frame of 85,962 regular public
schools. Of this number, about 1,800 public elementary schools were sampled. FRSS
was designed to collect small amounts of data from a nationally representative sample
that was based on a focused issue like arts education. Data collection was designed to
occur over a short period of time and to take minimal effort from respondents. Because
of the quick response and minimized burden on respondents, data were collected in the
Fall of 2009, and schools could either use data from the previous or current school year.
As of the 2009-2010 school year, dance instruction was only available in 3% of
schools nationwide. Theater decreased from 20% of instruction in public schools in
1999-2000 to only 4% of instruction in public schools in 2009-2010 (Parsad &
Spiegelman, 2012). Because dance and theater scored so low in terms of schools offering
instruction specifically designed in dance or theater, the researchers explored if dance and
theater integration changed the outlook on the schools’ involvement in the curriculum.
They found that incorporating dance into the curriculum also showed a decrease from
66% in 1999-2000 to 61% in 2009-2010. These higher percentages in incorporating
18
dance in the curriculum also encompassed requirements of schools to teach dance as part
of a physical education program or music curriculum. A slight increase in theater being
incorporated in the curriculum was reported from 50% in 1999-2000 to 53% in 2009-
2010. This change, however, as the researchers speculated, could be due to theater being
taught as part of the ELA curriculum.
A particularly relevant finding that emerged from the study was the percentage of
school districts with curriculum guides that teachers were expected to follow in the arts.
Of the school districts surveyed, 86% had music curriculum guides, 83% had art
curriculum guides, 49% had dance curriculum guides, and 46% had theater curriculum
guides (Parsad & Spiegelman, 2012). Not all school districts reported curriculum guides
in the arts. Research that explores a teacher’s curricular emphasis in the arts, therefore,
may contribute greatly to the field of arts education and student academic achievement if
teachers are self-selecting to have a heightened or lessened focus on the arts throughout
the school day outside of the required curriculum guides.
Hetland et al. (2007) was important for this study because they argued that the art-
making process affects one’s understanding of content through experience and it provides
a framework in which to view the argument that relates accountability to arts education.
Through their eight Studio Habits of Mind (SHM) framework, student learning was
assessed in the following areas: develop craft, observe, envision, express, engage and
persist, stretch and explore, reflect, and understand professional world. The SHM
describes the art-making process and how it relates to curricular emphasis. Hetland et
al.’s (2007) work provides a foundation to explore connectedness of the arts to a
19
standards-based education, such as the Common Core State Standards (Common Core
State Standards Initiative, 2012).
In addition to the three main studies (Catterall et al., 2012; Hetland et al., 2007;
Parsad & Spiegelman, 2012), there is a growing interest in curricular emphasis
(President's Committee on the Arts and the Humanities, 2011) in schools. In particular,
there is an interest in the narrowing of the curriculum (Crocco & Costigan, 2007;
Darling-Hammond, 2007; President's Committee on the Arts and the Humanities, 2011).
Some researchers, like Diamond (2012) and Dorner, Spillane, and Pustejovsky (2011),
addressed the narrowed curriculum through the lens of organization of instruction. This
study built upon the research on curricular emphasis and the narrowed curriculum in a
standards-based education, with a specific focus on the arts in schools. Many of the past
studies on the arts have focused on arts integration (An et al., 2011; Belliveau, 2006;
Bintz, 2010; Brewer & Brown, 2009; Brouillette, 2010; Brown & Brown, 1997; Butzlaff,
2000; Cecil & Lauritzen, 1994; Cuero & Crim, 2008; Della Pietra et al., 2010; Donahue
& Stuart, 2008; Grant, Hutchinson, Hornsby, & Brooke, 2008; Hash, 2010; Hull, 1993;
Koning, 2010; Lucey & Laney, 2009; Paquette & Rieg, 2008; Peebles, 2007; Rodesiler,
2009; Rosenfeld, 2011; Smigel & McDonald, 2011; Smith, 2000; Taylor, 2008; van der
Veen, 2012; Walker et al., 2011). In the accountability era, data-based decision-making
is essential (Baker & Welner, 2012; Massell, 2001). Much of the available quantiative
studies in the arts and student achievement (Brown, Martinez, & Parsons, 2006; Fiske,
1999; Ingram & Meath, 2007; Ingram & Reidell, 2003; Vaughn, 2000; Vaughn &
Winner, 2000; Walker, 2011) use small sample sizes that cannot be generalizable for
policy issues that affect larger populations. There are few exceptions (Catterall et al.,

20
2012; Parsad & Spiegelman, 2012) that used larger samples. These studies, however, did
not focus on curricular emphasis and student achievement in the elementary grades.
To fill the gap in the current research in curricular emphasis in terms of sample
size, this study used the Early Childhood Longitudinal Study, Kindergarten Class of
1998-1999 data file (ECLS-K). This data file contains over 20,000 cases of longitudinal
student-level data. Other studies (Almarode, 2011; Catterall et al., 2012; Crane, 2010;
Huang, 2008; Kienzl, Boachie-Ansah, Lanahan, Holt, & the National Center for
Education Statistics, 2006) have used the same data file to study curricular emphasis
because of its large sample size. Each of these studies, however, used the data file in
various ways to serve different purposes.
For instance, Crane (2010) and Huang (2008) did not use the how often and how
much time variables to explore curricular emphasis. Crane (2010) created composite
variables from related variables in the data file to examine mathematics achievement.
Huang (2008) used items from the teacher questionnaires that related to how often the
teacher used specific reading activities with their students. From these items, Huang
(2008) analyzed the effectiveness of phonics and whole language in terms of reading
instruction.
Almarode (2011) and Catterall et al. (2012) used the data file to explore curricular
emphasis and achievement in two additional ways. Almarode (2011) used the how often
and how much time variables to explore a relationship between curricular emphasis in
science and student achievement in science. Catterall et al. (2012) investigated student
engagement in the arts and, therefore, focused the research on variables that may be

21
outside of the classroom (i.e., extracurricular activities). Likewise, Catterall et al. (2012)
focused on the effect of arts engagement on secondary- and university-aged students.
Kienzl et al. (2006) used the ECLS-K dataset to explore arts instruction received
in the first and third grades. Much like Parsad and Spiegelman (2012), this study (Kienzl
et al., 2006) did not link arts instruction received to student academic achievement scores.
They used the how often arts variables to report changes in arts instruction between the
first and third grades. In their study, Kienzl et al. (2006) did not examine the how much
time variables in regard to arts instruction.
Of the five studies that used the ECLS-K data file, Kienzl et al. (2006) was the
most similar to this study. There remain, however, at least four key differences between
Kienzl et al. and the study reported here. First, Kienzl et al. (2006) only used the how
often arts variables in regard to curricular emphasis. This study used the how often and
how much time variables. Second, Kienzl et al. (2006) explored first and third grades on
the how often variables. This study included fifth grade in the analysis. Third, Kienzl et
al. (2006) reported findings that pertained to public school students. This study examined
possible differences in public and private schools. Fourth, Kienzl et al. (2006) explored
the role of socioeconomic status and arts instruction in the first and third grades in public
schools, but this study addressed socioeconomic status as it pertains to both public and
private schools in grades 1, 3, and 5.
In this study, curricular emphasis is characterized by the ECLS-K teacher
questionnaire items. The teacher questionnaire items surveyed teachers about how much
time and how often teachers’ emphasized academics, arts, and physical education in their
classrooms. Although foreign language and English as a Second Language were

22
included in the teacher questionnaire, these items were not included in this study because
the items did not relate to academics, arts, or physical education. Physical education
items were included in this study because schools with physical education specialists or
programs may teach a unit on dance. This study provides greater depth and
understanding to the research and role of the arts in an era of accountability and
standards-based education.
Research Questions
The dissertation sought to deepen the understanding and to what extent factors
moderate arts education in a standards-based education. To this end, there were two
research questions that embraced this thinking.
1. Are there differences in teacher emphasis in academics versus the arts between
public and private schools and between low, middle, and high SES schools in
grades 1, 3, and 5?
2. Does teacher emphasis in academics and in the arts predict student achievement in
reading and mathematics in public and private schools and in low, middle, and
high SES schools in grades 1, 3, and 5?
Definition of Terms
The below definitions of terms should be used when reading this dissertation.
Although there may be alternative definitions of these terms or similar terms in other
scholarly research, the terms have been defined as they are used in this dissertation.
Accountability. The World Development Report 2004 (World Bank Staff, 2003)
used a framework of five features in accountability: delegating, financing, performing,
informing, and enforcing. For this study, this framework will be used as it relates to
23
standards-based education. The original framework explained relationships between
policymakers and providers. In the original framework, the policymakers were known as
“actors” and the providers were known as “accountable actors.” This framework will be
adapted to explain the relationship between both state and federal government and
schools. In this way, accountability refers to the amount of oversight government has on
a particular school (World Bank Staff, 2003).
Delegating. The World Development Report 2004 defined delegating as
actors who direct the accountable actors. For this dissertation, the relationship of actors
to accountable actors is the government (actors) to schools and teachers (accountable
actors).
Enforcing. The World Development Report 2004 defined enforcing as the
relationship of actors ensuring the accountable actors meet standards. In this dissertation,
enforcing is defined through student test scores.
Informing. The World Development Report 2004 (World Bank Staff,
2003) stated that informing is when performance is evaluated against a set of norms. For
this study, informing is discussed in regard to standardized tests.
Financing. The World Development Report 2004 Financing refers to the
money that is allotted from the actors to the accountable actors. An example of this
relationship is seen in state government mandates to individual school districts to use
funding a certain way.
Performing. Performing is the accountability feature in the World
Development Report 2004 (World Bank Staff, 2003) that measures whether more
24
accountability is needed. If students, for example, perform poorly on standardized tests,
then the government may increase oversight on the students’ school district.
Curricular emphasis. In addition to student Item Response Theory (IRT) scores,
the ECLS-K includes questionnaires for parents, teachers, school administrators, and
research surveyors. Curricular emphasis is defined by teachers’ responses to the teacher
questionnaires in grades 1, 3, and 5.
Academic emphasis. The academic variables are reading and language
arts, mathematics, social studies, and science. These variables are in the ECLS-K data
file and are part of the how often and how much time teacher questionnaire item.
Arts emphasis. The arts variables are music, art, dance or creative
movement, and theater or creative dramatics. These variables are in the ECLS-K data file
and are in the how often and how much time teacher questionnaire item.
Physical Education emphasis. The ECLS-K variable for times per week
the teacher had physical education with their students is noted with variable TXPE.
Teachers had the following response options with the respective values: never 1, less than
once a week 2, once or twice a week 3, three or four times a week 4, and daily 5. Higher
scores indicate more time with physical education per week, whereas lower scores
indicate less time with physical education per week.
The ECLS-K variables for how much time per day the teacher had physical
education with their students is noted with variables TXPEN, TXSPE, and TXSPEN.
Teachers had the following response options with the respective values: do not
participate in physical education 1, 1-15 minutes/day 2, 16-30 minutes/day 3, 31-60
minutes/day 4, and more than 60 minutes/day 5. Higher scores indicate more time with
25
physical education per day, whereas lower scores indicate less time with physical
education per day.
Narrowing the curriculum. The President's Committee on the Arts and the
Humanities (2011) used this phrase to describe schools that place emphasis on basic
skills that are found on standardized tests as a means of holding schools accountable for
student learning. Darling-Hammond (2007) stated that a narrowed curriculum is one
where schools feel pressure in increasing test scores and school ranking.
Public versus private schools. ECLS-K defined public and private schools. It
divided public schools into six subcategories and private schools into six subcategories.
For this dissertation, data were not divided by subcategories. Thus, all public schools
were one category and all private schools were one category.
Socioeconomic status (SES). ECLS-K defined the socioeconomic status of each
student in the parent interviews. Five separate interview prompts were combined to
create the categorical SES variable for each grade level. The five interview prompts were
father or male guardian’s education, mother or female guardian’s education, father or
male guardian’s occupation, mother or female guardian’s occupation, and household
income. For this dissertation, SES was divided into three groups: low, middle, and high.
SES ranged from one to five where one was the lowest SES and five was the highest
SES. Due to the complex method ECLS-K used to establish the five SES levels (i.e. low
to high SES), the specific ranges for each measure was defined by a combination of the
five separate interview prompts as described above. The overall range for the combined
five measures was -4.75 to 2.75. Each measure was standardized to have a mean of zero
and a standard deviation of one, thus there are negative values in the range.

26
Test scores. ECLS-K used Item Response Theory (IRT) scores in reading,
mathematics, and general knowledge to define test scores at each grade level. Each
student in the data file is linked to test scores. This study focused on the reading and
mathematics IRT scores.
Summary
The dissertation chapters examine two research questions. The following
chapters of the dissertation include: review of the literature, methodology, results, and
discussion. The review of literature chapter will be divided into five main sections:
accountability, standards-based instruction, arts education, factors that moderate arts
education, and a summary of the chapter. Chapter three will be about the research study
design, study variables, and the statistical analysis model used. The methodology chapter
will also explain the Early Childhood Longitudinal Study, Kindergarten Class of 1998-
1999 data file (ECLS-K) and how the data set was created from this data file, including a
discussion on how missing data were handled and weights. Specific variables and the
data analysis plan are also included in the third chapter. The fourth chapter will be where
the results are reported. The fifth chapter will be a summary for the study along with
sections for study limitations, discussion, and implications.
27
CHAPTER II
REVIEW OF LITERATURE
The purpose of this study was to examine differences in curricular emphasis in
grades 1, 3, and 5 between low-, middle-, and high-SES schools and public versus private
schools. Curricular emphasis in academics, arts, and physical education in the
elementary grades were explored. Because dance is part of the physical education
curriculum, physical education was included in the study. Teacher curricular emphasis
was investigated in terms of predicting student academic achievement in reading and
mathematics.
The intent of this literature review is to explore in what ways and to what extent
the arts are being fostered in standards-based elementary education. The literature review
is divided into five sections. The first section explores accountability. The second
section is about standards-based instruction and the narrowing of curriculum. The third
section reviews the research on arts education at the elementary- and secondary-school
levels. The fourth section examines socioeconomic status and public and private
schooling as factors that moderate arts education. The fifth section is a summary of the
chapter.
Accountability
Accountability is discussed on many levels in society (World Bank Staff, 2003).
One such level is accountability in education. Many researchers have studied the
growing field of accountability in schools especially in light of the educational policy
changes at both state and national levels (Chiang, 2009; Darling-Hammond, 2007, 2010;
Diamond, 2012, Dorner, Spillane, Pustejovsky, 2011; Gershberg, González, & Meade,
28
2012; Lee & Reeves, 2012; Strunk & McEachin, 2011). Stemming from A Nation at
Risk, educational policy initiatives such as the Clinton’s administration’s Goal’s 2000
program, No Child Left Behind Act (NCLB) of 2001, Race to the Top of 2009, and the
Common Core State Standards (CCSS) have precipitated into test-based accountability in
schools (Ravitch, 2010).
Chiang (2009) noted that accountability in schools means “sanction(ed) threats”.
Schools that do not meet certain levels of student achievement, in other words, are
threatened to an increased amount of government oversight on their school functions.
Chiang (2009) argued that schools are forced to make decisions based on the desire for
less government oversight. Schools for instance, may replace their school principals if
student achievement seems to be slipping in an effort to show the government that the
schools have attempted school reform efforts (Chiang, 2009). Other researchers
(Darling-Hammond, 2007, 2010; Lee & Reeves, 2012; Strunk & McEachin, 2011) agreed
with Chiang’s (2009) findings.
Darling-Hammond (2007, 2010) noted that schools that serve lower
socioeconomic status (SES) families are given fewer opportunities in curricular choices
compared to higher SES families because of sanctioned threats and low student
achievement. Schools that serve higher SES families spend more per student on school
resources by about a three to one ratio to schools that serve lower SES families (Darling-
Hammond, 2007). Lee and Reeves (2012) argued that an increase in school resources
and subsequent spending per student is due to growth in standardized test scores as a
means of accountability in schools. Schools are rewarded for student achievement in
various ways (Lee & Reeves, 2012). One way schools may be rewarded for student

29
achievement is through an increase in teachers’ salary. Lee and Reeves (2012) found that
raising a teacher’s salary also increased student achievement scores. More specifically, if
a school raised a teacher’s salary by $7,000, then there was an associated 1.4-point gain,
on average, of student reading scale scores in the fourth-grade. Schools with more
money, therefore, can pay their teachers more and may possibly raise student
achievement scores. Darling-Hammond (2007) noted that lower-performing schools
frequently have teachers with less training and offer a lower salary than higher-
performing schools.
Dorner et al. (2011) did not disagree with the aforementioned findings, but they
suggested that the type of school is a moderating factor for accountability in schools that
needed to be considered in the research on accountability. Instead of being focused on
the amount of money received for instruction, Dorner et al. (2011) focused on the type of
school setting (i.e., public, Roman Catholic, and charter). Their study participants
included 6 district-run Chicago Public Schools, 2 charter schools, and 3 Roman Catholic
schools. The public schools included elementary- and middle-school grades while the
charter schools and Roman Catholic schools offered preschool through middle-school
grades. They found that the school setting dictated the type of curriculum that is fostered
and that the school is accountable for its commitment to the school’s curriculum. In
Roman Catholic schools, for example, schools had a curriculum that underscored family
and included fewer formally-defined positions in the school compared to the public
schools. The public schools maintained formally-defined positions within the school
with a focus on standards-based instruction as a means for instruction and improvement
in student achievement. The charter schools used a blended approach to accountability
30
that highlighted the family structure of the Roman Catholic schools but the teachers
reported being constrained by standards-based instruction.
Strunk and McEachin’s (2011) study furthered the available research on types of
schooling (Dorner et al., 2011) and sanctioned threats (Chiang, 2009; Darling-Hammond,
2007, 2010; Lee & Reeves, 2012) but focused on the role of collective bargaining
between teachers unions and school districts as a constraint in accountability in schools.
Stunk and McEachin’s (2011) study included 465 California school districts in the 2005
through 2006 school year. Their sample represented 82% of California school districts
with at least four schools in each district. They found that restrictions in teaching
contracts, as a result of collective bargaining, resulted in a 7.67 percent increase in the
chance that a school district becomes designated as a program improvement school due to
shortfalls in student academic achievement (Strunk & McEachin, 2011). Similarly, there
was a 4.48 percent increase in the likelihood that student academic achievement of a
school would fall even greater after a school is designated as program improvement
(Strunk & McEachin, 2011). Accountability in schools, therefore, may be further
constrained by collective bargaining that is done within individual school districts.
Accountability in schools is an area that warrants additional research in terms of
student achievement and its effect on socioeconomic status (Darling-Hammond, 2007,
2010; Ravitch, 2010) and types of school (Dorner et al., 2011). This study built upon the
emerging research and understanding of accountability in schools with a specific focus on
SES and the type of school as possible moderating factors in a standards-based education.
31
Standards-Based Instruction
In 1983, the documentary film “A Nation at Risk: The Imperative for Educational
Reform” highlighted school reform efforts that excluded the arts from the core curricula
(Purnell & Gray, 2004). Only two states included art as a graduation requirement at that
time. In 1989, President Bush’s national goals did not include the arts (Purnell & Gray,
2004). It was during that time that a national platform for standards-based instruction
came to fruition in United States’ educational systems. It was not until 1992, that 28
states required some sort of study in art as a graduation requirement (Purnell & Gray,
2004).
In this era of standards-based instruction and high-stakes testing where schools
receive funding based on test scores, experiencing the arts in schools is seen as a “frill”
(Brewer & Brown, 2009). Preservice teachers come to teacher credential programs
challenged with high- stakes testing in an era of standards-based instruction (Donahue &
Stuart, 2008). Preservice teachers expect to learn the best strategies and practices to
teach content areas such as English Language Arts (ELA) and mathematics because those
are the areas tested on high-stakes tests. The expectation is to provide their future
students with a meaningful learning experience that is marked with great success on
standardized achievement tests. The arts are not tested on standardized achievement
tests. Thus, the arts may become lost in the content areas that are included on state
assessments instead of being counted for their own value (Brewer & Brown, 2009). The
United States Secretary of Education, Arne Duncan, acknowledged the current state of
the arts in schools saying that it was an “unfortunate truth” that “today’s curriculum fails
to spark student curiosity or stimulate a love of learning” (President’s Committee on the

32
Arts and the Humanities, 2011, p. 3). This research explores the question of what ways
and to what extent the arts are being fostered in K-5 education while also showing how
experiencing the arts in schools is seen as a “frill” in a standards-based curriculum.
The recent development of the Common Core State Standards focuses on English
Language Arts (ELA) and mathematics because they are seen as skills that repeatedly are
used for accountability purposes on state assessments (Brewer & Brown, 2009). The
development suggests that both at the state and national level the arts are being pushed
aside as extra content areas of little value instead of content areas of greater value for the
community of learners. Ongoing scrutiny of state and national legislation regarding
standards-based instruction is paramount to ensure what people have called a “well-
rounded curriculum and complete education” (President’s Committee on the Arts and the
Humanities, 2011, p. 2).
States adopt standards set learning outcomes that define what students are
expected to learning in a variety of disciplines (ELA, mathematics, social studies,
science, physical education and the arts) for grades K-12 (California Department of
Education, 2013). Each state designs and implements its own set of standards that are
commonly referred to as “state standards.” Standards-based instruction was built on the
ideas that learning is focused and measured while in school.
Funding is a part of the marriage between standards-based instruction and
standardized achievement test scores (Spohn, 2008). Schools may receive funding based
on success on standardized achievement tests. In times of economic duress, schools are
focusing their academic support toward programs and services that encourage success on
tested content areas such as ELA and mathematics. Thus, areas, such as the arts, are not
33
receiving equal support in curriculum and scheduling needs. In essence, such content
areas are seen as extras or frills (Brewer & Brown, 2009) to the tested content areas
(Spohn, 2008) that are viewed as foundational skills.
Teachers in the arts are approached about scheduling their classes after school if
they would like more participants and being highly encouraged from school
administrators to write their own grants for additional funding (Spohn, 2008).
Meanwhile, teachers of ELA and mathematics receive funding from their schools without
even asking or writing grants because some districts have grant writers for these content
areas (Spohn, 2008). Funding, standards-based instruction, and standardized
achievement test scores are in a long-term relationship that is inequitable and limiting to
learners of all ages and does not provide the well-rounded education that the students
deserve (President's Committee on the Arts and the Humanities, 2011).
State Standards
There are state standards for every content area: ELA, Mathematics, Career
Technical Education, English Language Development, Health Education, History-Social
Science, Model School Library, Physical Education, Science, Visual and Performing
Arts, and World Language (California Department of Education, 2013; Spohn, 2008).
Although there are state standards for all of these content areas, not all content areas are
allotted the same amount of instructional minutes during the typical school day. In
California, the state government outlines required and recommended instructional time
for each content area. For example, California requires 2 hours of ELA instruction per
school day but recommends up to 3 hours of ELA instruction per school day. The state
requires 50 to 60 minutes of Mathematics instruction per school day. History-Social
34
Science and Science both require one hour of instructional minutes per school day. The
Visual and Performing Arts support daily instruction in the arts but do not require a
certain amount of instructional minutes. If a typical school day is 6 hours long (which
includes a recess and lunch break), then at least half of the day is spent on ELA
instruction. If at least half of the typical school day is spent on ELA instruction, then the
Visual and Performing Arts instruction may not be a part of the school day because it is
only supported or encouraged and not required like the other content areas (California
Department of Education, 2013). In this study, how often and how much time a teacher
focused on the arts was explored to investigate whether teachers did include arts
instruction in the school in light of the required instructional minutes.
Arts in Standards-Based Education
As of December of 2004, California required arts coursework in teacher credential
programs (California Alliance for Arts Education, 2011). There was a 34-year gap in
including the arts in teacher credential programs.
Although California teacher credential programs currently are required to meet a
certain standard for preparing teachers in all curriculum areas including art, credential
programs focus on what its graduates need to teach the most with the maximum amount
of instructional time used in those areas. This leaves room for growth and equity among
the content areas. This is especially true because the arts coursework may be met in
nontraditional ways (Donahue & Stuart, 2008). Other curriculum and instruction
pedagogical courses with content areas, such as science and mathematics, are given a
semester-long study (Brewer & Brown, 2009).
35
There is a growing body of research on the effect of arts on learning (Deasy,
2002; Dewey et al., 1947; Eisner, 2002; "Music play: Bah bah be bop Beethoven," N.D.).
Brown, Martinez, and Parsons (2006), Leong (2010), and Spohn (2008) all explored
different avenues of the effect the arts have on learning. Brown et al. (2006) used neural
images of five female and five male amateur dancers to provide the world with a visual
representation of the effect of dance on neural functioning. Their research had three
goals: localize the area of the brain that was in charge of synchronizing leg movement to
the rhythm of an auditory stimulus, to identify the areas of the brain that were concerned
with voluntary controls of metric movements, and to isolate the neural basis of spatial
patterning (Brown et al., 2006). Using positron emission tomography (PET) scans,
dancers performed small-scale, bipedal dance routines while positioned on an inclined
and laminated surface. PET scans are a form of imaging technology that uses
radioisotopes to create images of the human body. Although a small scale study, the
results suggested that different parts of the brain were used for dance and that these same
areas were involved in sensorimotor activities (Brown et al., 2006). The current study
built on the previous studies in the arts but used a large scale study to explore the arts on
learning.
Leong (2010) provided further insight into the role of arts in schools with a
specific focus on the evolving Hong Kong educational system. As the United States
strives to remain a global competitor, it is essential to be cognizant of other countries
under similar shifts in academia. This article was helpful in better understanding
educational systems with a wider lens as scholarly interest remains in comparing
educational systems in the United States to those in Asian countries.

36
In 1998-2000, Hong Kong focused their educational system on valuing creativity.
It was not until 2006 that their school reform efforts placed explicit concern on the arts in
schools. Leong (2010) acknowledged past disconnects in creativity and assessment in the
arts from the primary- and secondary-school contexts and planned to examine the current
trend. Using music and visual-arts students and teachers as his source for data collection,
several important findings were uncovered that help shine light on arts in schools.
In Hong Kong, music student respondents did not view group learning as
beneficial for cultivating creative thinking. Thus, they did not include creative activities
as an important activity. The visual-arts student respondents were the exact opposite.
They thought group learning was beneficial for cultivating creative thinking.
Additionally, they viewed creative activities as the most important aspect of arts
education (Leong, 2010). The research findings provide further reasons as to why the
arts (not just the visual arts) in schools are a critical aspect in reaching and teaching
diverse learners, especially in the standards-based classrooms of today.
Leong’s (2010) study reported three major conclusions. First, there remains little,
if any, connection between arts education and the development of creativity and
imagination. He attributed this finding to the fact that Asian societies challenge
creativity. For instance, creativity was found to be unimportant in music classrooms.
Second, music teachers need to design more creativity-oriented curriculum and
assessment. Further teacher professional development was necessary to promote teacher
confidence in providing creative activities. Third, many teachers were still under the
mentality and training of high stakes testing and they find it challenging to step away
37
from teaching to the test. Teachers need proper training to bring creative ideas into the
classroom that move away from teaching to the test (Leong, 2010).
Spohn’s (2008) study may be the antithesis to Leong’s (2010) study. Spohn
(2008) used qualitative and quantitative information to present a case regarding the effect
of the Elementary and Secondary Education Act, which is most commonly known as No
Child Left Behind (NCLB), on the arts in schools. Leong (2010) found that schools were
focusing on valuing and including creativity (i.e., the arts) in their educational system.
He also showed how teachers were accustomed to high-stakes testing and how teacher
familiarity may effect school reform from focusing on teaching to the test to centering
resources and curriculum on students’ creativity.
Spohn (2008) showed a continued shift in funding and focus on the arts since
NCLB. Teachers of the arts were encouraged to provide their programs after school so
tested content areas could have more time during the school day (Spohn, 2008). Specific
funding for the arts was handled differently from funding for tested content areas such as
mathematics and ELA. For example, the school district in her study had a grant writer
specifically to write and receive grants for mathematics education. Meanwhile, teachers
in the arts were encouraged to find and apply for their own grants, as they deemed
necessary (Spohn, 2008). Schools viewed the arts as “frill” (Brewer & Brown, 2009)
instead of as necessary and meaningful content areas that provided skills for lifelong
learning and future successes in the workforce (Spohn, 2008).
Changes in instructional practices are a very personal matter for teachers. As
high-stakes testing and standards-based instruction move forward, the need to educate
teachers on how to include the arts in schools becomes important because the arts are not
38
used on standardized achievement tests for accountability purposes. Standards-based
instruction leads to teachers finding ways to teach to the test (Leong, 2010; Spohn, 2008)
instead of creating learning environments that are meaningful, connected to different
areas of brain development (Brown et al., 2006) and that provide a “well-rounded
curriculum and complete education” (President’s Committee on the Arts and the
Humanities, 2011, p. 2). Preservice teachers, and veteran teachers for that matter, need to
be exposed to the arts across the curriculum. The possibility of integrating the arts in the
curriculum is greater if teachers experience integrating the arts and have the professional
support to guide their early implementation of the arts (Donahue & Stuart, 2008). Proper
arts integration respects content integrity (Brewer & Brown, 2009) and reaching and
teaching all learners. Last, if teachers are given the opportunity to experience the arts,
then they may be more inclined to use the arts in their teaching and learning experiences
(Dewey, 1934; Dewey et al., 1947; Donahue & Stuart, 2008). Thus, changes in teachers’
instructional practices become a welcomed reality.
“The creators of such works of art are entitled, when successful, to the gratitude
that we give to inventors of microscopes and microphones; in the end, they open new
objects to be observed and enjoyed” (Dewey et al., 1947, p. 31). Experiencing the arts in
schools is seen as a “frill” in standards-based curriculum (Brewer & Brown, 2009). The
curriculum is narrowed to tested subject areas. Because the arts are not tested in schools,
the arts are given less priority compared with tested subject areas (Spohn, 2008).
What is Arts Education?
Carpenter and Tavin (2010) underscored the evolution of arts education through
an historical perspective. Carpenter and Tavin (2010) stated that arts education may be

39
viewed differently based on the current political climate in education (i.e., self-expression
arts, discipline-based arts).
Contemporary theories of art generally suffer from inconsistency. They are only in part interpretations of art and of experience as these are to be observed today; in part, they represent a survival of opinions and assumptions inherited from the Greeks. According to Greek theory, art is a form of practice, and so incurs the reproach of being concerned with a merely subjective, changing and imperfect world. This was true of all arts, of those now classified as “fine” as well as of the useful crafts practised by the artisan. (Dewey et al., 1947, p. 22) Just as Dewey (1947) attempted to define “fine arts,” scholarly research provides
a variety of possible definitions of the key words for the dissertation. When reading the
dissertation, the following definitions apply for arts education:
The Arts
Mary Mullen (Dewey et al., 1947) suggested that “art is not imitation but
creation” (p. 259). It is with this general definition of art that one may begin to
appreciate the varied nature of art and the challenging task of defining art. This
dissertation aims to not only define the arts as a body of multiple art forms but also
embrace the process and power of the creation of art and its effect on learning. It is with
this overarching idea that one must define the arts as an embodiment of multiple forms of
creation. Hull (1993) defined the arts as a working relationship between statutory (music
and art) and nonstatutory (dance and theater) elements. Other research (Dewey et al.,
1947; Kienzl et al., 2006; Spolin, 1986) defined the arts as music, dance or creative
movement, theater, and fine art. These ideas of art are brought together here. For the
purpose of reading this dissertation, the arts are defined as music, dance or creative
movement, theater, and fine arts or visual arts. Like Hull (1993), the definition of the arts
acknowledges statutory and nonstatutory elements; however, in this dissertation does the

40
definition is not restricted to a working relationship of the two elements. The arts,
henceforth, represent these multiple forms of creation without prejudices from the
different forms of creation.
Curriculum Integration
Brewer and Brown’s (2009) definition of curriculum integration is used. They
defined curriculum integration as “a unit of study with a conceptual or thematic focus that
promotes content validity by connecting to national or state standards for the separate
disciplines while using appropriate content-related vocabulary” (p. 137). This definition
acknowledges the current concept of standards-based instruction and takes the vantage
point of curriculum and instruction as disclosed at the beginning of the literature review.
The definition also underscores the importance of content integrity, which is a growing
concern with standards-based instruction and the wide range of content areas that are
expected to be included in the K-5 classroom.
Content Integrity
In K-5 teacher preparation programs, preservice teachers take courses designed
for specific content areas, such as ELA, science, mathematics, social studies, and
physical education. Courses in the arts also may be included, especially for preservice
teachers hoping to teach in middle school (i.e., 6th through 8th grades) or in secondary
schools (i.e., 9th through 12th grades) where schools may be departmentalized instead of
students staying with one teacher who teaches all content areas. At the middle-school or
secondary-school levels, teachers may become specialized in an area such as the arts or
mathematics. Content integrity becomes a concern when teachers strive to integrate the
41
curriculum outside of their specialty area or when they do not value both content areas
equally within a lesson, regardless of the targeted grade level.
Content integrity is not only using content-related vocabulary. It is far deeper and
much more involved than acknowledging both content areas as respective areas of study.
Brewer and Brown (2009) determined that content integrity concerns acknowledging and
placing equal value on each content area; truly embracing the uniqueness of each content
area. If a class studied the Japanese Tea Ceremony, perhaps the teacher would like the
students to experience making their own teacups. The teacher would value the process
and skill of making the teacups in addition to exploring the history of the Japanese Tea
Ceremony (Brewer & Brown, 2009). This example highlights the value placed on
discussing and researching the historical aspects of the Japanese Tea Ceremony and
understanding and participating in the creation of their own teacups using proper artistic
skills. This ensures content integrity because both content areas (history and fine arts)
are valued at an equal level, and one is not simply a vehicle to learn the other area
without regard to the uniqueness of each specialty content area.
Content integrity is connected to the current study in two ways. First, the ECLS-
K data includes a curriculum integration variable which can lead to deeper understanding
of content integrity. More specifically, the study explored content integrity through the
lens of curriculum integration. Second, both content integrity and curriculum integration
play a pivotal role in the era of accountability in schools where content areas may not
receive equal weight in the classroom. Although content integrity is not explicitly stated
in the current study, future studies can build upon this study’s results in the area of
content integrity in a standards-based education.
42
Research on Arts Education
Key research, in specific areas, that provide the underpinnings of the dissertation
can be found in Appendix B. In Appendix B, study authors, sample sizes, description of
method, and results are reported for important studies in arts education research
especially in regard to the aim of this study.
There are nine studies available that provide evidence regarding the relationship
of the arts and student achievement (Catterall, 2009; Catterall et al., 1999, 2012; Catterall
& Waldorf, 1999; Deasy, 2002; Hetland et al., 2007). Deasy (2002) compiled 62 studies
in the arts. Only 9 of the 62 studies focused on the relationship of the arts and student
achievement. A majority of these studies used small sample sizes concerning arts
education and achievement. The nine studies focused on aspects of arts integration and
not on the effect of academic achievement through the arts.
The aforementioned nine studies provide a solid foundation for future research in
arts education and student achievement. Yet, there are at least two gaps in the available
research that warrant further study. First, none of the available research investigated arts-
focused and nonarts-focused classrooms and the subsequent student achievement from
learning in such classrooms. Second, arts education research was primarily qualitative
(Eisner, 2002) even though curricular decisions require quantitative data (Crocco &
Costigan, 2007; Massell, 2001). This study helps fill the two gaps because it used
teachers’ self-reported curricular emphasis to quantify the largely qualitative research
space of arts education in a standards-based education.
Multiple studies indicate the need for research that investigates the arts-focused
and non-arts-focused classrooms in terms of student achievement (Deasy, 2002; Fiske,
43
1999; Parsad & Spiegelman, 2012). Fiske (1999) shared research that examined the
artistic experiences of 2,046 students in fourth, fifth, seventh, and eighth grades. Fiske
(1999) was interested in the creative thinking abilities of students. The study
conceptualized students to be part of either an arts groups or a nonarts group based on
their art experiences. Teacher perceptions of student competencies, however, were used
to report student achievement in the arts and nonarts groups. Deasy (2002) underscored
how such reports on student achievement may be misleading and require research that is
based on student achievement scores and not teacher perceptions of student
competencies. Furthermore, the absence of learning in the arts within such groups as
arts-focused and nonarts focused is currently unavailable (Deasy, 2002). Deasy’s (2002)
study stated that research that groups students in arts or nonarts groups and investigates
the availability of arts education in schools may be bias in that higher-achieving students
may be the ones who are naturally involved in the arts.
More recently, Parsad and Spiegelman’s (2012) study acknowledged the lack of
research pertaining to learning in and through the arts but took a closer look at the
availability of arts education instead of learning in and through the arts. Their research
focused on characterizing arts education in today’s classrooms and the availability of arts
education in public elementary and secondary schools. When comparing data from the
1999-2000 school year with data from the 2009-2010 school year, Parsad and
Spiegelman (2012) found that availability of arts education in public schools had declined
in all areas of arts education except for music education that remained constant at 94% of
schools reporting instruction specifically in music. In the visual arts, instruction dropped
from 87% of schools reporting visual arts instruction to 83% of schools reporting specific
44
visual arts instruction. Instruction in theater dropped from 20% in the 1999-2000 school
year to 4% in the 2009-2010 school year. Dance instruction dropped from 20% to 3% in
the same time period (Parsad & Spiegelman, 2012).
A second gap in the current research is that arts education research is primarily
qualitative (Eisner, 2002). Massell (2001) noted that this is a problem because curricular
decisions require quantitative data. Although a majority of the research agreed that arts
education research is primarily qualitative, only some supported that there is a need for
quantitative research in the arts (Carpenter & Tavin, 2010; Catterall et al., 2012; Deasy,
2002; Vaughn, 2000; Vaughn & Winner, 2000; Winner & Hetland, 2000). Baker and
Welner (2012) furthered the argument for an increase in quantitative data and stated that
policy decisions need to be evidence-based. Stickney’s (2009) research underscored the
importance of policy decisions that are evidence-based where a teacher’s instructional
decisions are based on student learning outcomes. Moreover, instructional decisions
must be aligned to a set of standards (Stickney, 2009). The latest version of the National
Standards of Arts Education begins to lay the foundation for future work in terms of
quantitative evidence in arts education.
There is a growing amount of research (Deasy, 2002; Fiske, 1999) that suggests a
positive relationship between the arts and academic achievement. Additional research is
necessary to strengthen the claim of a relationship between arts learning and academic
achievement. Wilkins et al.’s (2003) study underscored the claims reported in the
literature. Their study analyzed responses from 547 elementary-school principals in
Virginia and obtained school-level standardized-test results for students in core subject
areas. Wilkins et al. (2003), however, found that there was no relationship between
45
instructional time in the arts and student academic achievement on standardized tests.
Like Wilkins et al., Ingram and Riedel’s (2003) study did not have a comparison group to
compare the results of the treatment group and reported similar findings. Further
research is necessary in the area of instructional time in the arts and student academic
achievement scores on a larger scale than previous studies to provide further evidence for
such claims.
Based on Keiper, Sandene, Persky, and Kuang’s (2009) findings, they suggest
that future research should examine why students perform differently on achievement in
the arts based on the location (i.e., city, suburban, town, rural) and type of school (i.e.,
public or private). In their study of 4,000 music and visual arts students, respectively,
Keiper et al. (2009) created a national sample of eighth-grade students via a multistage
design. Sampling weights were used to make appropriate inferences between the student
samples and the populations from which the students were drawn. The study
acknowledged an overestimation in the number of Hispanic-American students and
Roman Catholic school students. There was an underestimation in other types of private
schools outside of Roman Catholic schools. Results from future studies may add to the
current research on relationship of arts learning and academic achievement if there is
greater diversity in the sample (Keiper et al., 2009). Keiper et al. (2009) used a similar
sampling method as to this study but examined eighth-grade students. This study focused
on students in grades 1, 3, and 5 and the possible connection between the arts and
learning.
46
Academic Outcomes
Student academic achievement is a focus of this dissertation, and it is one part of
the available research on the arts and academic outcomes. Brouillette (2010) suggested a
broader scope of arts education research that included quantitative data of student
academic achievement scores but also included qualitative data such as teacher and
student perspectives. For instance, Heath and Wolf’s (2005) study found that students
who worked with visual artists provided improved verbal explanations of works of art
and used expressions such as metaphors and analogies. They also found that students
who studied visual arts, such as drawing, developed a greater amount of visual attention
and concentration. Heath and Wolf (2005) concluded that the increase in concentration
gained from art was transferrable to concentration for standardized tests in other subject
areas.
Several studies stress academic outcome as part of a larger picture of student
achievement (Brouillette, 2010; Brouillette & Jennings, 2010; Heath & Wolf, 2005;
Ingram & Reidell, 2003). Brouillette and Jennings (2010) investigated student
engagement in the arts and language development but others (Heath & Wolf, 2005)
examined patterns in language.
Heath and Wolf (2005) used qualitative methods to collect data. Heath and Wolf
were interested in data that looked at patterns in language. Heath and Wolf (2005) audio-
recorded students’ conversations with one artist at one school site. After analysis of the
audio recordings, the researchers conducted focused interviews with participants with a
particular focus on patterns in vocabulary and syntax. Other areas that were explored in
the focused interviews were students’ use of metaphors, problem solving, and analogical
47
reasoning. Heath and Wolf (2005) found that students developed oral expression skills
and general language skills that paralleled the findings in other reviewed research
(Brouillette & Jennings, 2010; Montgomerie & Ferguson, 1999).
Brouillette’s (2010) study highlighted similar trends in the arts and positive
academic outcomes. Much like the other studies on academic outcomes, this study used
qualitative methods to suggest that the use of teaching artists to deliver instruction in
theater and dance to classroom teachers was beneficial. More specifically, the study
examined the use of dance and theater workshops (i.e., an artist-in-residence program) for
12 first- through fourth-grade teachers. All 12 teachers had participated in an artist-in-
residence program for at least one semester. In the artist-in-residence program, an artist
made an hour-long visit to a teacher’s classroom 15 times. Brouillette (2010) found that
these experiences led to a positive classroom culture and contributed to the social and
emotional development of the students served. Teachers implemented what they learned
in the workshops in their classrooms. For example, students participated in dance as a
way to explore personal boundaries and respect. Through dance, students embodied
these constructs in an environment that allowed them to critique and observe in
appropriate ways. As shown in other studies (Brouillette & Jennings, 2010; Heath &
Wolf, 2005; Montgomerie & Ferguson, 1999), Brouillette’s (2010) study emphasized the
positive relationship arts instruction had on English learners and in students’ appreciation
for multiple perspectives. Teachers also reported that they believed students gained a
deeper meaning of words and better comprehension of content when theater was
integrated across the curriculum in such content areas as social studies and English
language arts (Brouillette, 2010).

48
Ingram and Reidell’s (2003) study furthered the available research on arts
integration and student academic achievement. Their study’s methodology, however, left
results with little generalizability. There were 5,007 students that participated. Student
academic achievement participants were from the Minneapolis Public Schools in grades
third through fifth. A student’s participation in the school’s lunch program indicated the
socioeconomic status of that student’s family. Although the four-year study included 45
schools within the Minneapolis Public Schools, teacher participation within each school
site was voluntary. The number of teachers that participated, therefore, changed from
year-to-year. Their study used three sets of multiple regression models to examine the
effects of arts integration on student achievement as measured on standardized tests in
reading and mathematics. The results from the analysis did not include a comparison
group. Therefore, the results of student achievement scores were only for students in a
treatment group (i.e., students that participated in arts-integrated classrooms). Moreover,
the data were collected through self-report teacher surveys, and the teachers had access to
other arts partnerships outside of the study’s control that may have effected the study’s
results.
Even though there were issues in Ingram and Reidell’s methodology, two key
findings are relevant to this dissertation and to future research in terms of arts education.
Third- and fourth-grade reading gain scores were greater for students where the teacher
integrated the arts into ELA. Arts integration into ELA was related to 3.96 gain score
points in reading. As found in other research (Catterall et al., 2012), Ingram and Reidell
(2003) indicated a strong relationship between arts integration and student achievement
for students who were considered low socioeconomic status and for English Language
49
Learners. A second key finding was that for third- and fifth-grade students, the
relationship between arts integration and mathematics achievement was statistically
significant (Ingram & Reidell, 2003). Arts integration into mathematics was related to a
3.45 scale score point increase in mathematics for third-, fourth-, and fifth-grade students.
Engagement in the Arts
There is a growing amount of research in terms of engagement in the arts (An,
Ma, & Capraro, 2011; Belliveau, 2006; Catterall et al., 2012; Rosenfeld, 2011; Smithrim
& Upitis, 2005). Findings of student engagement in the arts are well documented from
self-report measures (Belliveau, 2006; Catterall et al., 1999, 2012; Parsad & Spiegelman,
2012; Rodesiler, 2009; Smithrim & Upitis, 2005) and it reinforces the literature.
Engagement in the arts, for instance, led to greater participation in service clubs and
student government (Catterall et al., 2012).
Catterall et al.’s (2012) study used four large databases: National Education
Longitudinal Study of 1988 (NELS:88), Early Childhood Longitudinal Study,
Kindergarten Class of 1998-1999 (ECLS-K), Education Longitudinal Study of 2002
(ELS: 2002), and National Longitudinal Survey of Youth 1997 (NLSY97). Catterall et
al.’s (2012) study focused on students that were primarily in secondary-school and from
lower socioeconomic families. Catterall et al. (2012) found that students who were
identified as low socioeconomic status, but had high involvement in the arts, were almost
three times as likely to participate in intramural sports and activities such as the school
yearbook or newspaper. High involvement in the arts was identified based on a point
system that the researchers created. For each arts activity that a student participated in
they were awarded one point. High school transcripts that reflected arts credits were used
50
to establish points in the NLSY97 database. Higher points in the system indicated greater
involvement in the arts. Students who were identified as low socioeconomic status but
had deep art experiences such as participation in an arts program reported academic
achievement levels that were closer to or better than the general population (Catterall et
al., 2012). The grade point average, for example, of high arts involved secondary-school
students, on a four-point scale, was 2.94 compared to the general population score of
2.84. Other studies (Deasy, 2002; Fiske, 1999; Keiper et al., 2009) agreed with Catterall
et al.’s (2012) findings that students that participated in the arts had closer to or higher
grade point averages than the general population.
Engagement in the arts is noted especially in research that involves English
language learners (ELL). For example, Urso Spina’s (2006) study included 63 fifth-
grade ELLs from an urban, Title I school as participants. Urso Spina’s (2006) study
divided participants into a comparison and treatment group to explore the effectiveness of
arts-based curriculum for ELLs. The comparison group received traditional English as a
Second Language (ESL) methods of instruction. The treatment group participated in an
arts-based program two times per week for a total of 5 to 6 hours of instruction. Both the
comparison and treatment group focused on reading and writing skills. The results were
based on pre- and posttest data, observations, and interviews. The results indicated that
students in the treatment group made gains in reading and writing in both English and
their native language. The comparison group made smaller gains (M=28.61) in English
reading and writing and lost an average of 9 points proficiency in their native language
while the treatment group made a larger gain (M=36.32) and gained 3 percentile points in
their native language. Other studies (Brouillette & Jennings, 2010; Montgomerie &

51
Ferguson, 1999) support Urso Spina’s (2006) findings. Montgomerie and Ferguson’s
(1999) study, for instance, found that arts-based pedagogy increased the ability to meet
the learning needs for a variety of levels of language proficiency.
Brouillette and Jennings (2010) found that the arts increased confidence and
language skills for ELLs. They conducted a qualitative case study that researched the
effect of a puppetry program on achievement in kindergarten through second-grade
students. The study participants were students at an arts magnet school along the U.S.
and Mexico border. In addition to classroom observations, researchers interviewed
teachers, teaching artists, and administrators. Bouillette and Jennings (2010) searched for
any themes or patterns that emerged from the interviews and observations related to
student achievement. Overall, Bouillette and Jennings (2010) concluded that sustained
involvement in the arts, over three academic years with 32 hours of arts instruction each
year, has academic and social-emotional benefits for students. Students who were
English language learners (ELL) particularly benefitted from long periods of arts
involvement because it provided time to develop language skills and confidence
(Brouillette & Jennings, 2010). Teachers reported that they noticed improvements in
students’ reading and expression and fewer behavior problems upon participation in the
arts program. Last, the puppetry program afforded students the opportunity to develop
multiple perspectives through dramatic play. Thus, it contributed to development of
students’ critical thinking skills that are part of student achievement assessments,
particularly in light of the Common Core State Standards.
52
Factors that Moderate Arts Education
As the research on arts education continues to evolve, so does the need to identify
factors that moderate arts education. Two factors that have emerged from the research as
possible moderators of arts education are socioeconomic status and the type of school
setting (public or private). The type of school setting, however, is an area with very little
research. The research in this area typically compares schools within one type of school
setting. With the exception of Keiper, Sandene, Persky, and Kuang (2009), none of the
available research compared school settings and arts education. Keiper et al. (2009)
focused their research on access to arts education in city, suburban, town, and rural public
and private schools.
Crane’s (2010) study is an exception to the typical research on factors that relate
to types of schools. Crane (2010) explored differences in public and Roman Catholic
mathematics performance in elementary schools. The study limited sample sizes in
public and Roman Catholic school to students who remained in the same sector of school
(i.e., public or Roman Catholic) from first to third grades. The study kept students in the
sample, however, if they changed schools within the same sector. Crane also created
composite variables when there were related variables. The study examined variables
related to classroom layout, computer access, teaching methods, and calculator use in
regard to mathematics instruction. Crane’s study, however, did not examine factors that
moderate arts education, but it did provide insight on differences between types of
schools.

53
Socioeconomic Status
Keiper et al. (2009) found that students who qualified for either free-or-reduced
lunch received less access to visual arts curriculum compared with students who were not
eligible for free-or-reduced lunch. Similar findings were true for access to music
curriculum. Students that qualified for free-or-reduced lunch had lower scores than
students not eligible for free-or-reduced lunch. For the visual arts and music curriculum,
students from higher socioeconomic status families had greater access to the arts
curriculum than students from lower socioeconomic status families. Darling-Hammond
(2007) found that schools, overall, spent less on resources per student with a ratio of
about three to one when comparing schools with high to low- socioeconomic student
populations. Such spending differences are exacerbated by the neediest schools losing
funding first (Darling-Hammond, 2007).
Public versus Private School Arts Education
There is available research on public versus private schools; however, much of
the available research does not focus on arts education. Keigher (2009) reported some
characteristics of public and private schools from a nationally representative sample of
9,800 public schools and 2,940 private schools. Keigher (2009) found that 52% of public
schools and 19% of private schools enrolled students who received services under Title I.
In addition to socioeconomic status, differences in race and ethnicity of students enrolled
in public versus private schools were reported. In public schools, for instance, there were
a greater percentage of students that identified as Hispanic or Non-Hispanic Black than in
private schools. In private schools, more students that identified as Non-Hispanic White
were reported compared to the public schools. There were little, if any, differences in the
54
percentage of students enrolled in public versus private schools that identified as Asian or
Pacific Islander or as American Indian or Alaska Native.
Much of the available research investigated public schools and arts education
(Catterall et al., 2012; Kienzl et al., 2006; Parsad & Spiegelman, 2012). Outside of
Keiper et al. (2009) who found some differences between public private schools in arts
education, few studies investigated private schools, especially at the elementary school
level. Crane (2010) investigated private schools, but arts education was not part of the
research. Thus, there is a current gap in the literature as it pertains to the comparison of
arts education in public and private schools at the elementary school level.
Parsad and Spiegelman’s (2012) study outlined the state of arts education in
public elementary and secondary schools. Parsad and Spiegelman’s (2012) study
compared arts education during the 1999-2000 school year with the 2009-2010 school
year. They found that the percent of music education remained the same in elementary
schools where 94% of schools received music instruction for both years. Education in
the visual arts, dance, and theater had decreases from the two school years in public
elementary schools. A visual arts education decreased from 87 to 83%. Dance education
decreased from 20 to 3%. Theater education decreased from 20 to 4%. For secondary-
grade levels, 52% of schools required coursework in the arts for graduation in the 1999-
2000 school year. During the 2009-2010 school year, 57% of public secondary-schools
required coursework in the arts for graduation. Of these secondary-schools, however,
70% of the schools required only one arts course credit for graduation (Parsad &
Spiegelman, 2012). Their research, however, did not compare arts education in public
and private schools. Keiper et al. (2009) found that private schools have more access to
55
music and visual arts curriculum than public schools. Although the findings were not
statistically significant, the researchers noted that there was a difference in the scores for
both music and visual arts curriculum in the public and private schools. In the public
school music curriculum, for instance, public schools had less music than private schools.
For the public school visual arts curriculum, public schools had less visual arts than the
private schools. All of the aforementioned studies on public versus private schools and
arts education connect to this study because the research examined relationships and
differences in arts education and type of school.
Summary
The presence of the arts in schools has changed over time (Carpenter & Tavin,
2010; Purnell & Gray, 2004). Standards-based instruction and the subsequent narrowing
of the curriculum (Darling-Hammond, 2007; Darling-Hammond, 2010), research on arts
education, and factors that moderate arts education were explored. Through this
exploration, a better understanding of the shifts in pedagogical practice and the potential
direction and role of arts in K-5 schools emerged. The literature supported the argument
that a standards-based education narrows the curriculum (Darling-Hammond, 2007;
Darling-Hammond, 2010; Spohn, 2008). Schools stress tested content areas instead of a
well-rounded curriculum that includes the arts (Spohn, 2008). The literature also
supported the argument that an arts education engages students in their learning (Catterall
et al., 2012; Deasy, 2002; Fiske, 1999; Ingram & Meath, 2007; Ingram & Reidell, 2003).
Socioeconomic status and whether a student attends a public or private school may be
important factors in regard to access to arts education, but more research is needed in
these areas.

56
Four major findings emerged from the literature. First, English Language Arts
and mathematics are viewed as skills that repeatedly are used for accountability purposes
on state assessments (Spohn, 2008). Second, the adoption of state standards and
Common Core State Standards furthers the challenge in including the arts in schools
(Crocco & Costigan, 2007). Third, curriculum integration and content integrity are
challenged as schools strive to explicitly align instruction to standards and achieve high
scores on state assessments (Brewer & Brown, 2009; President's Committee on the Arts
and the Humanities, 2011; Walker, Tabone, & Weltsek, 2011). Fourth, research that
compares private and public schools is limited in regard to arts education at the
elementary school level. It is the narrowing of the curriculum that underscores the
greatest threat to arts education for all students in K-5 education. In short, this study fills
the need to quantify the possible effects of arts education in grades 1, 3, and 5 in the era
of accountability in schools.
57
CHAPTER III
METHODOLOGY
The purpose of this study was to explore if there are differences in academic, arts,
and physical education emphases in grades 1, 3, and 5. The study examined type of
school, socioeconomic status (SES), and student academic achievement in reading and
mathematics in each grade.
This chapter is divided into seven sections. First, the chapter has the overall
research design. The second section is a description of the National Center for Education
Statistics’ (NCES) procedure that was used to create the Early Childhood Longitudinal
Study, Kindergarten Class of 1998-1999 data file (ECLS-K; National Center for
Education Statistics, 2009). The third section is about the creation of the data set for this
study. The fourth section is a listing of the study’s specific variables. The fifth section
has the data analysis that includes information about missing data and the data analysis
strategy. The sixth section provides the mean and standard deviation for each variable
used in the study. Last, the seventh section is a summary of the chapter. Additional
information in regard to variable name, item question, and range of values for the
dependent and independent variables is found in Appendix A.
This study examined school and teacher factors that might influence arts
education in first, third, and fifth grades. More specifically, the aim of this study was to
address the following two research questions:
1. Are there differences in teacher emphasis in academics versus the arts between
public and private schools and between low, middle, and high SES schools in
grades 1, 3, and 5?

58
2. Does teacher emphasis in academics and in the arts predict student achievement in
reading and mathematics in public and private schools and in low-, middle-, and
high-SES schools in grades 1, 3, and 5?
Research Design
This secondary data analysis study used data from the Early Childhood
Longitudinal Study, Kindergarten Class of 1998-1999 (ECLS-K) conducted by NCES
from 1998 until 2007. ECLS-K is a longitudinal study that followed the same children
from kindergarten through eighth grade. The study started with 21,260 kindergarten
participants from 1,280 schools. It was a multifaceted study that documented students’
cognitive, social, emotional, and physical development. The purpose of the longitudinal
study was to investigate factors that affect a child’s development from kindergarten
through eighth grade.
The ECLS-K used a multistage probability sample design to collect a national,
representative sample of students in kindergarten during the 1998-1999 academic year.
The first stage of the design concerned primary sampling units. Primary sampling units
were created that used different counties and regions across the United States. The
primary sample unit size was dependent on the number of kindergarten students within a
unit. The second stage of the design involved the random selection of public and private
schools from schools that offered kindergarten within the sampling units. The third stage
involved the random selection of students from the pool of public and private schools.
Following the kindergarten year, the grade 1 Fall sampling procedure included a 30%
subsampling of the students to study summer loss. Only student and parent data were
collected during the Fall. The Spring grade 1 sampling included a refreshed sampling
59
where new schools were added to the original sample. In the Spring, data were collected
from students, teachers, parents, administrators, and the facilities checklist. Data
collection for grades 3 followed the same sampling procedure as in the Spring of grade 1.
The sampling procedure was similar in grade 5 with the exception that the teacher level
data included responses from two groups: reading teacher and mathematics or science
teacher. The grade 5 teachers responded to the same curriculum-related items on the
teacher questionnaire regardless of their specific group designation. Specific methods of
each level of data collection are described in greater detail below.
Data were collected via interviews and questionnaires at the kindergarten, first-,
third-, and fifth-grade years of the children. Data were collected twice in the
kindergarten and first-grade school years, once in the Fall and once in the Spring. Data
were then collected during the Spring of the third- and fifth-grade school years.
Five methods were used to collect data. For each wave of the ECLS-K, the same
types of data were collected: direct child assessments, parent interviews, teacher
questionnaires, school questionnaires, and facilities checklists. Child assessment data
were collected using computer-assisted personal interviews (CAPI). Parent interviews
were conducted using computer-assisted telephone or personal interviews (CATI or
CAPI). Teachers and school administrators completed self-administered questionnaires.
The research surveyors used a checklist for their data collection in regard to school
facilities. Members of the ECLS-K’s field staff collected all data from school sites,
conducted all direct child assessments and parent interviews, and completed the school-
facilities checklist.
60
ECLS-K data files, useful for both cross-sectional and longitudinal research, are
available for public use on compact discs that include an electronic codebook (ECB) for
various combinations of years. The ECBs allow researchers to download variables of
interest from among the thousands of variables available for analysis. Data files were
released as they became available during the nine years of data collection, resulting in a
variety of ECBs for various combinations of years. The data collection for the ECLS-K
started in the 1998-1999 school year when the students were in kindergarten. For this
dissertation, data were collected from the 1998-1999 school year to the 2003-2004 school
year because the analysis examined data at grades 1, 3, and 5 and used the kindergarten
general knowledge IRT score as an ability measure. The ECLS-K produced an updated
ECB as the study progressed through the years. The first ECB, for instance, only
included kindergarten data. The second ECB included kindergarten and grade 1 data.
The third ECB included grades K, 1, and 3. The next ECB update included data for
grades K, 1, 3, and 5. Table 1 indicates the breakdown for the grade level and the school
year the data collection took place. At grades K and 1 data were collected once in Fall
and once in Spring. For grades 3 and 5, data were only collected during the Spring. For
this dissertation, the K general knowledge scores from the Fall were used to measure
ability. The Spring K and Fall grade 1 data were not used in this dissertation. These
ECBs generate a student-level data file where student cases are linked to the teacher- and
school-level variables. By aggregating the student variables, variables can be created at
the teacher and at the school levels.
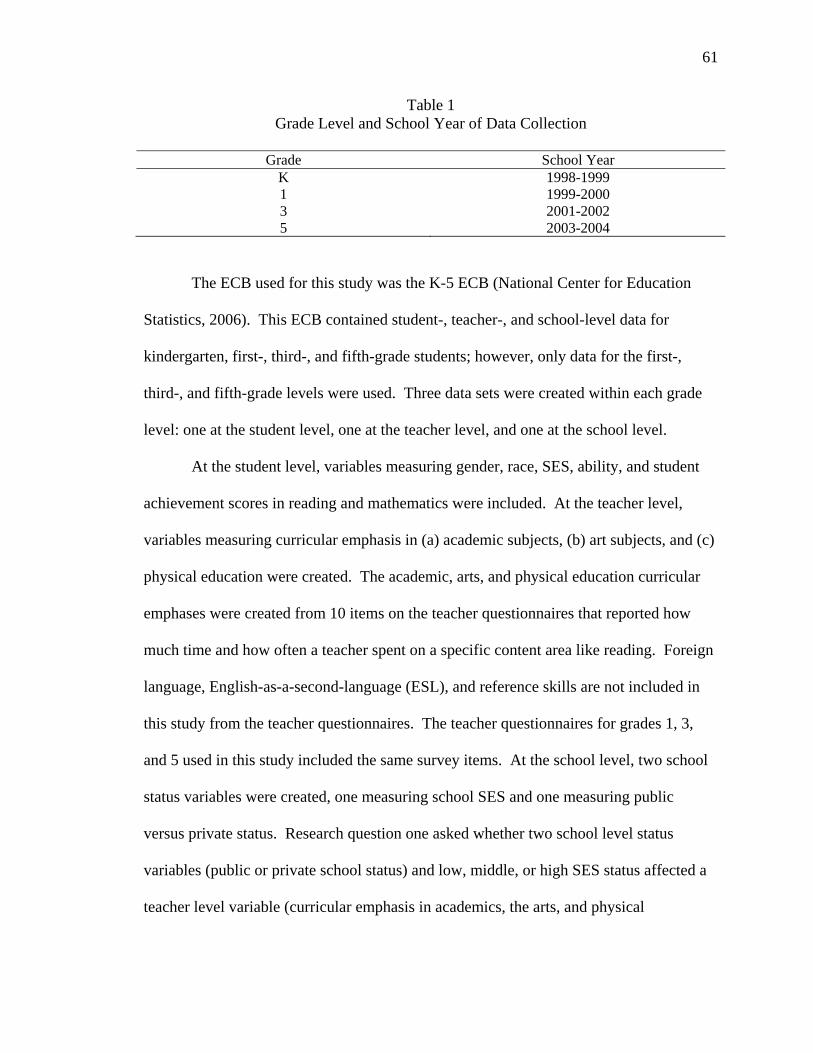
61
Table 1 Grade Level and School Year of Data Collection
Grade School Year
K 1998-1999 1 1999-2000 3 2001-2002 5 2003-2004
The ECB used for this study was the K-5 ECB (National Center for Education
Statistics, 2006). This ECB contained student-, teacher-, and school-level data for
kindergarten, first-, third-, and fifth-grade students; however, only data for the first-,
third-, and fifth-grade levels were used. Three data sets were created within each grade
level: one at the student level, one at the teacher level, and one at the school level.
At the student level, variables measuring gender, race, SES, ability, and student
achievement scores in reading and mathematics were included. At the teacher level,
variables measuring curricular emphasis in (a) academic subjects, (b) art subjects, and (c)
physical education were created. The academic, arts, and physical education curricular
emphases were created from 10 items on the teacher questionnaires that reported how
much time and how often a teacher spent on a specific content area like reading. Foreign
language, English-as-a-second-language (ESL), and reference skills are not included in
this study from the teacher questionnaires. The teacher questionnaires for grades 1, 3,
and 5 used in this study included the same survey items. At the school level, two school
status variables were created, one measuring school SES and one measuring public
versus private status. Research question one asked whether two school level status
variables (public or private school status) and low, middle, or high SES status affected a
teacher level variable (curricular emphasis in academics, the arts, and physical
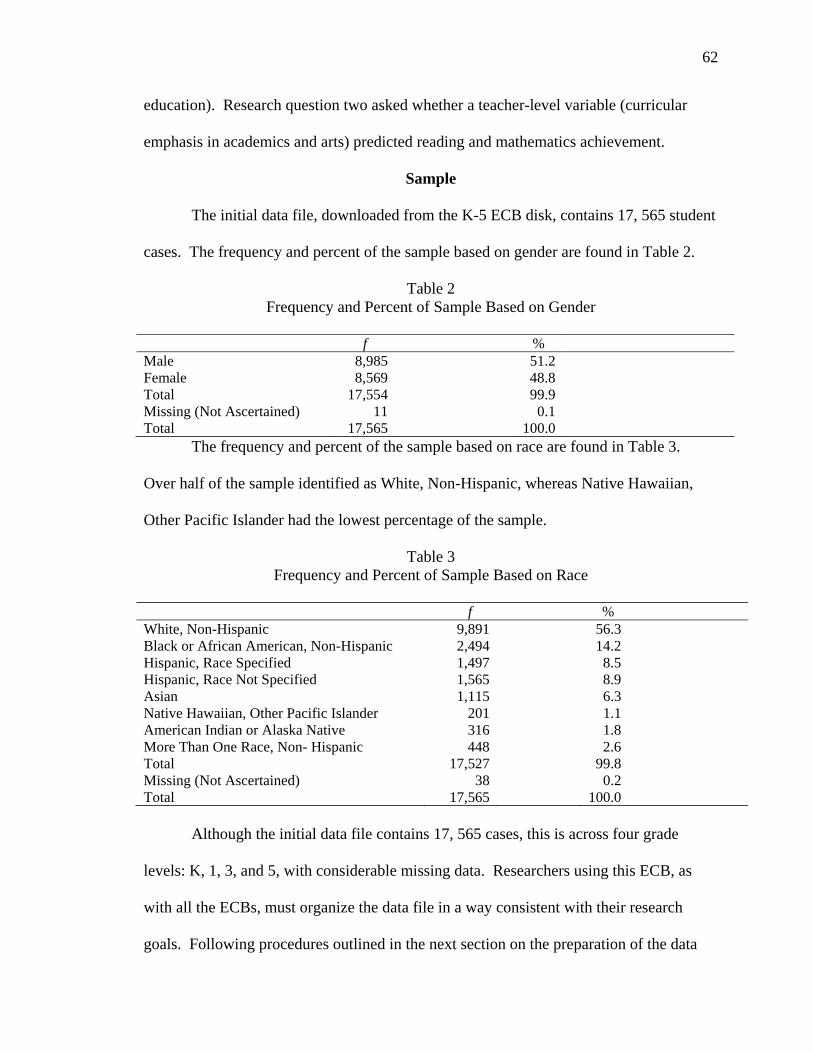
62
education). Research question two asked whether a teacher-level variable (curricular
emphasis in academics and arts) predicted reading and mathematics achievement.
Sample
The initial data file, downloaded from the K-5 ECB disk, contains 17, 565 student
cases. The frequency and percent of the sample based on gender are found in Table 2.
Table 2 Frequency and Percent of Sample Based on Gender
f % Male 8,985 51.2Female 8,569 48.8Total 17,554 99.9Missing (Not Ascertained) 11 0.1Total 17,565 100.0
The frequency and percent of the sample based on race are found in Table 3.
Over half of the sample identified as White, Non-Hispanic, whereas Native Hawaiian,
Other Pacific Islander had the lowest percentage of the sample.
Table 3 Frequency and Percent of Sample Based on Race
f % White, Non-Hispanic 9,891 56.3 Black or African American, Non-Hispanic 2,494 14.2 Hispanic, Race Specified 1,497 8.5 Hispanic, Race Not Specified 1,565 8.9 Asian 1,115 6.3 Native Hawaiian, Other Pacific Islander 201 1.1 American Indian or Alaska Native 316 1.8 More Than One Race, Non- Hispanic 448 2.6 Total 17,527 99.8 Missing (Not Ascertained) 38 0.2 Total 17,565 100.0 Although the initial data file contains 17, 565 cases, this is across four grade
levels: K, 1, 3, and 5, with considerable missing data. Researchers using this ECB, as
with all the ECBs, must organize the data file in a way consistent with their research
goals. Following procedures outlined in the next section on the preparation of the data
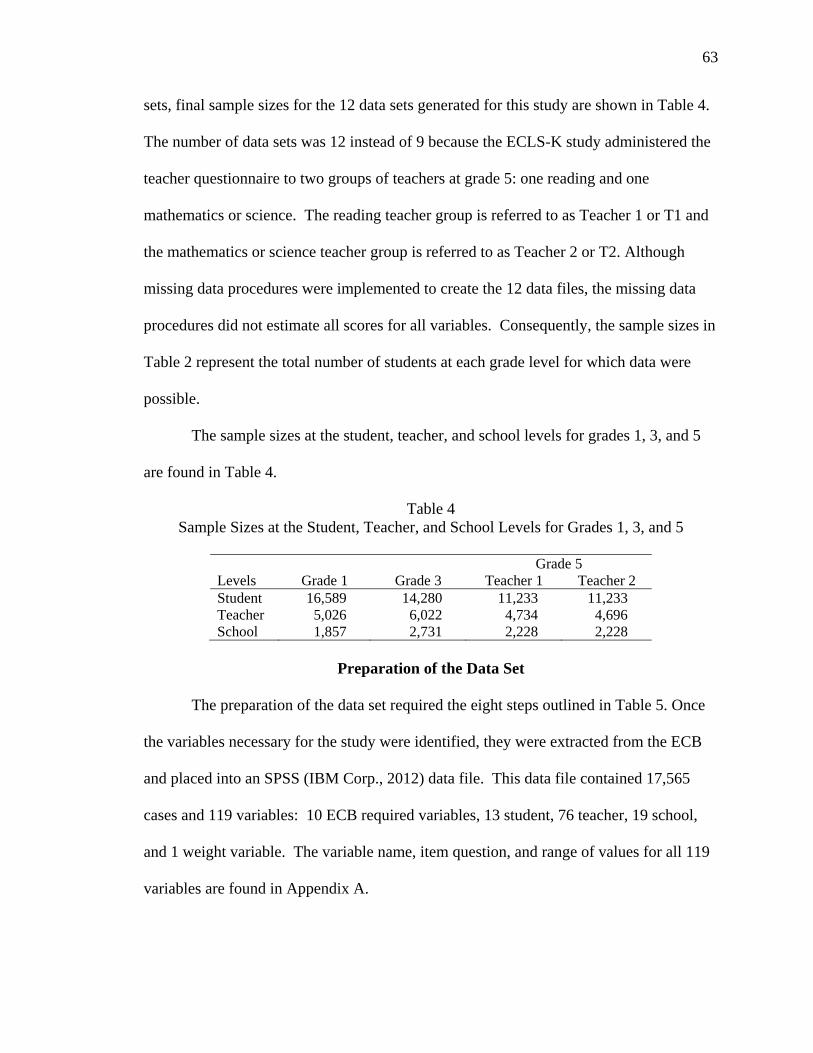
63
sets, final sample sizes for the 12 data sets generated for this study are shown in Table 4.
The number of data sets was 12 instead of 9 because the ECLS-K study administered the
teacher questionnaire to two groups of teachers at grade 5: one reading and one
mathematics or science. The reading teacher group is referred to as Teacher 1 or T1 and
the mathematics or science teacher group is referred to as Teacher 2 or T2. Although
missing data procedures were implemented to create the 12 data files, the missing data
procedures did not estimate all scores for all variables. Consequently, the sample sizes in
Table 2 represent the total number of students at each grade level for which data were
possible.
The sample sizes at the student, teacher, and school levels for grades 1, 3, and 5
are found in Table 4.
Table 4 Sample Sizes at the Student, Teacher, and School Levels for Grades 1, 3, and 5
Grade 5
Levels Grade 1 Grade 3 Teacher 1 Teacher 2 Student 16,589 14,280 11,233 11,233 Teacher 5,026 6,022 4,734 4,696 School 1,857 2,731 2,228 2,228
Preparation of the Data Set
The preparation of the data set required the eight steps outlined in Table 5. Once
the variables necessary for the study were identified, they were extracted from the ECB
and placed into an SPSS (IBM Corp., 2012) data file. This data file contained 17,565
cases and 119 variables: 10 ECB required variables, 13 student, 76 teacher, 19 school,
and 1 weight variable. The variable name, item question, and range of values for all 119
variables are found in Appendix A.
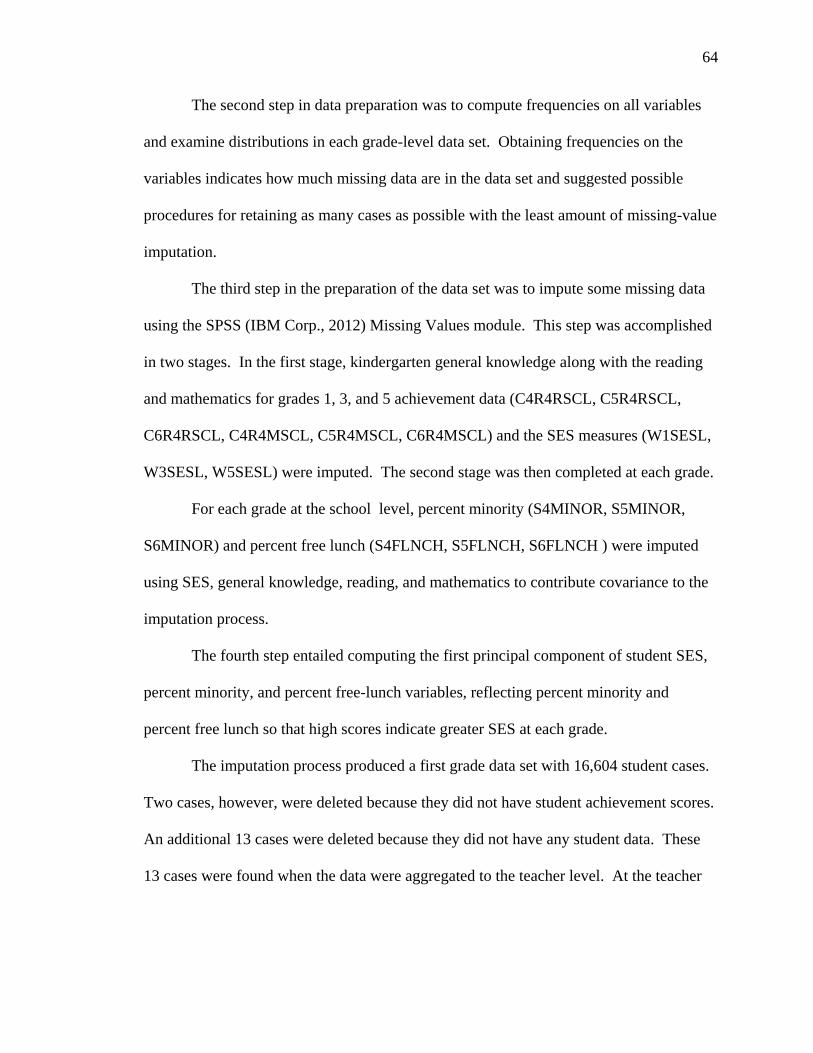
64
The second step in data preparation was to compute frequencies on all variables
and examine distributions in each grade-level data set. Obtaining frequencies on the
variables indicates how much missing data are in the data set and suggested possible
procedures for retaining as many cases as possible with the least amount of missing-value
imputation.
The third step in the preparation of the data set was to impute some missing data
using the SPSS (IBM Corp., 2012) Missing Values module. This step was accomplished
in two stages. In the first stage, kindergarten general knowledge along with the reading
and mathematics for grades 1, 3, and 5 achievement data (C4R4RSCL, C5R4RSCL,
C6R4RSCL, C4R4MSCL, C5R4MSCL, C6R4MSCL) and the SES measures (W1SESL,
W3SESL, W5SESL) were imputed. The second stage was then completed at each grade.
For each grade at the school level, percent minority (S4MINOR, S5MINOR,
S6MINOR) and percent free lunch (S4FLNCH, S5FLNCH, S6FLNCH ) were imputed
using SES, general knowledge, reading, and mathematics to contribute covariance to the
imputation process.
The fourth step entailed computing the first principal component of student SES,
percent minority, and percent free-lunch variables, reflecting percent minority and
percent free lunch so that high scores indicate greater SES at each grade.
The imputation process produced a first grade data set with 16,604 student cases.
Two cases, however, were deleted because they did not have student achievement scores.
An additional 13 cases were deleted because they did not have any student data. These
13 cases were found when the data were aggregated to the teacher level. At the teacher
65
level, three teachers with a combined total of 13 students did not have data for their
students; thus, the cases were deleted.
Table 5 Steps and Description for Creation of Data Sets
Steps Description
1 Create a taglist and extract variables from the Electronic Codebook for grades 1, 3, and 5. The data set contains 17, 565 student cases and 119 student, teacher, and school variables (see Appendix A).
2 Compute frequencies on all variables, and examine variable distributions in each grade
level.
3 Using the SPSS Missing Module (IBM Corp., 2012), impute missing values on achievement, SES, percent minority, and percent free lunch using a two-stage process. First, general knowledge scores at the Fall kindergarten (C1RGSCAL), reading (C4R4RSCL, C5R4RSCL, C6R4RSCL) and mathematics (C4R4MSCL, C5R4MSCL, C6R4MSCL) achievement scores at the first-, third-, and fifth-grade levels, and SES at first-, third-, and fifth-grade levels (W1SESL, W3SESL, W5SESL) scores were imputed. Second, for each grade level, percent minority at the school (S4MINOR, S5MINOR, S6MINOR) and percent free lunch at the school (S4FLNCH, S5FLNCH, S6FLNCH ) were imputed using SES, general knowledge, reading, and mathematics to contribute covariance to the imputation process.
4 Compute the first principal component of student SES, percent minority, and percent free
lunch variables, reflecting percent minority and percent free lunch so that high scores indicate greater SES. Aggregated to the school level, this variable represents the School SES.
5 This imputation procedure created three student-level data sets with the following sample
sizes: Grade 1=16,604; Grade 3= 14,280 ; Grade 5= 11,233. Examination of these student data files, and preliminary aggregations of these data sets to the teacher and school levels, revealed minor anomalous cases that were deleted. This final data-cleaning process generated three student- level data sets with the following sample sizes: Grade 1 N=16,589; Grade 3 N=14,280; Grade 5 N=11,233.
6 To create the teacher-level data set, aggregate student data to teacher level. The
following teacher sample sizes were obtained for each grade at the teacher level: Grade 1 N=5,026; Grade 3 N=6,022; Grade 5 T1 N=4,734; Grade 5 T2 N=4,696
7 To create the school-level data set, aggregate student-level data to the school level
(School SES). The following school sample sizes were obtained for each grade at the school level: Grade 1 N=1,857; Grade 3 N=2,731; Grade 5 T1 N=2,228; Grade 5 T2 N=2,228
8 Using the SPSS visual binning procedure, the continuous School SES measure was
converted to a three-level categorical variable with cut points for grades 1, 3, and 5 chosen to create equal sample sizes.

66
At grade 3, the imputation process created a data set with 14,281 student cases.
One case, however, was deleted because it did not contain any student achievement data.
The remaining data set included 14,280 students.
In grade 5, the imputation process formed a data set with 11,233 student cases.
Unlike in grades 1 and 3, all cases in grade 5 had student achievement data. Grade 5 T1
reported 11,233 students with 4,734 teachers and 2,228 schools. Grade 5 T2 reported
11,233 students with 4,696 teachers and 2,228 schools. The data sets were now ready for
analyses at three grades 1, 3, and 5 at three separate levels: student, teacher, and school.
This final cleaning produced three student-level data sets where the sample size
for grade 1 was 16,589. In grade 3, the sample size was 14,280, and the grade 5 sample
size was 11,233.
For step six, the student data files at each grade level were sorted by teacher ID
and aggregated to the teacher level. This generated a teacher-level data set that would be
used to address research question two that concerned curricular emphasis. The creation
of the curriculum emphasis variables, therefore, took place at the teacher level for each
grade level.
For step seven, a similar aggregation occurred. The student data file was sorted
by school ID and aggregated to the school level. The school-level data sets were used to
address research question one that explored school status variables and curricular
emphasis.
The final step in the creation of the data sets addressed SES. For the analysis of
variance procedures, it was necessary to create a categorical school SES measure. The
SPSS visual binning was done on the continuous school SES measure. This step
67
converted the continuous school SES measure into a categorical variable with cut points
for grades 1, 3, and 5. Detailed information on SES and the cut points is found in the
Instrumentation section of Chapter III.
Instrumentation
This study used data from three types of instruments from the ECLS-K data set:
student achievement tests and background surveys, teacher questionnaires, and
administrator questionnaires. Student background data were obtained through parent
interviews. Student achievement scores were the result of tests administered in the Fall
kindergarten, and Spring for grades 1, 3 and 5. The first-, third-, and fifth-grade teacher
questionnaires included the same questionnaire items. Some of the questionnaire items,
however, have a slightly different number of variables so they were not the same for the
item or were found as a different item number within the grade level. At grade 5, there
were two groups of teachers: reading and mathematics or science teachers. This was
done because it was possible that middle-school students were taught by two different
teachers. The result of the grade 5 subsampling provided that each child was only
accounted for once in the data. The administrator questionnaires were sent to the school-
site principal to complete. All school principals completed the same questionnaires. The
first questionnaire the administrator received included more items than the follow-up
questionnaires in subsequent years. If a new principal entered the data collection at a
later date, then that principal completed the initial administrator questionnaire. All items
on the administrator questionnaire were the same across grades 1, 3, and 5.
There were nine main variables in the study, four at the student level, three at the
teacher level, and two school-level variables, that are detailed in the sections below.
68
Student-Level Variables
Student SES: The socioeconomic status of each student was reported in the parent
interviews. SES is a composite variable that included the parents’ or guardian’s highest
education level, occupation, and household income. The continuous SES measure called
SESL was the ECLS-K measure used for student SES. This variable was used as a
control variable.
Ability: The Fall kindergarten general knowledge item response theory (IRT)
score was used for the ability variable and had a range of values from 0 to 111. The
variable name for the Fall kindergarten general knowledge IRT score is C1RGSCAL.
This score measured competencies in the natural and social sciences and the student’s
ability to draw inferences. The original variable name was the Fall kindergarten general
knowledge IRT, but the variable name was changed to ability for the purpose of this
dissertation. The variable was used across all grade-level analysis for ability because the
study followed the same group of students from kindergarten to grade 5. This variable
was used as a control variable.
Reading achievement: These scores came from the IRT scores in reading. ECLS-
K administered subject area assessments to obtain these scores for each student and had a
range of values from 0 to 212. The IRT scores were based on students’ correct and
incorrect answers on the subject-specific assessments. The assessment measured
students’ proficiency probability scores in phonemic awareness, phonics, and
comprehension of words in context of a sentence. The reading IRT scores are estimates
of the number of reading items the student would have answered correctly if they
completed all 186 reading items on the provided assessment. Students did not receive all
69
reading achievement items, therefore, the IRT scores were estimates based on the number
of items the student would have answered correctly if they were given all reading
achievement items. The same procedure for estimating IRT scores was used for all
measures of achievement.
Mathematics achievement: These scores came from the IRT scores in
mathematics and had a range of values from 0 to 174. The IRT scores were based on
students’ correct and incorrect answers on specific mathematics assessments that mostly
were comprised of multiple-choice item responses. The assessments measured students’
proficiency probability scores in areas related to number sense such as place value,
addition, subtraction, multiplication, division, sequencing of numbers, and fractions.
Relative size, shapes, area, volume, rate, and measurement also were included on the
mathematics assessment. The mathematics IRT scores are estimates of the number of
mathematics problems the student would answer correctly from 153 mathematics
problems on a given assessment.
The descriptive statistics for ability, based on the Fall kindergarten general
knowledge IRT, and the reading and mathematics achievement IRT scores for each grade
level are found in Table 6. The Fall Kindergarten ability measure was used for analysis
in grades 1, 3, and 5 as a control variable.

70
Table 6 Descriptive Statistics for Ability and Each of the Three Reading and Mathematics
Achievement IRT Scores Broken Down by Grade Level
Grade Levels N Minimum Maximum Mean SD Ability Fall Kindergarten 16,589 0.30 48.19 22.09 7.58 Reading Spring First Grade 16,589 6.82 163.12 71.15 22.52 Spring Third Grade 14,280 30.39 178.92 117.46 25.47 Spring Fifth Grade 11,233 58.23 194.92 139.25 23.26 Mathematics Spring First Grade 16,589 6.37 120.50 57.44 16.83 Spring Third Grade 14,280 24.44 146.59 91.86 21.62 Spring Fifth Grade 11,233 46.97 152.72 113.80 21.37
Teacher-Level Variables
The teacher-level variables include the three curricular emphasis variables in
academic, arts, and physical education. A description of each emphasis follows the
explanation of how the emphasis variables were created. The emphasis variables were
created using the same procedure, however, the physical education emphasis used a
different item in the teacher questionnaire and included different response options. The
physical education emphasis procedure is explained in greater detail under the physical
education description.
The emphasis variables were all created in the same way. To estimate the amount
of time devoted to each subject, the following procedure was used. First, the average for
each rating level in Table 41 was calculated. The one through five rating scale for how
often was changed to 0 never, .5 less than once a week, 1.5 1-2 times a week, 3.5 3-4
times a week, and 5 daily. The same procedure was used for the how much time rating
scale. The how much time rating scale was changed to 15 1-30 minutes a day, 45 31-60
minutes a day, 75 61-90 minutes a day, and 105 more than 90 minutes a day. Because
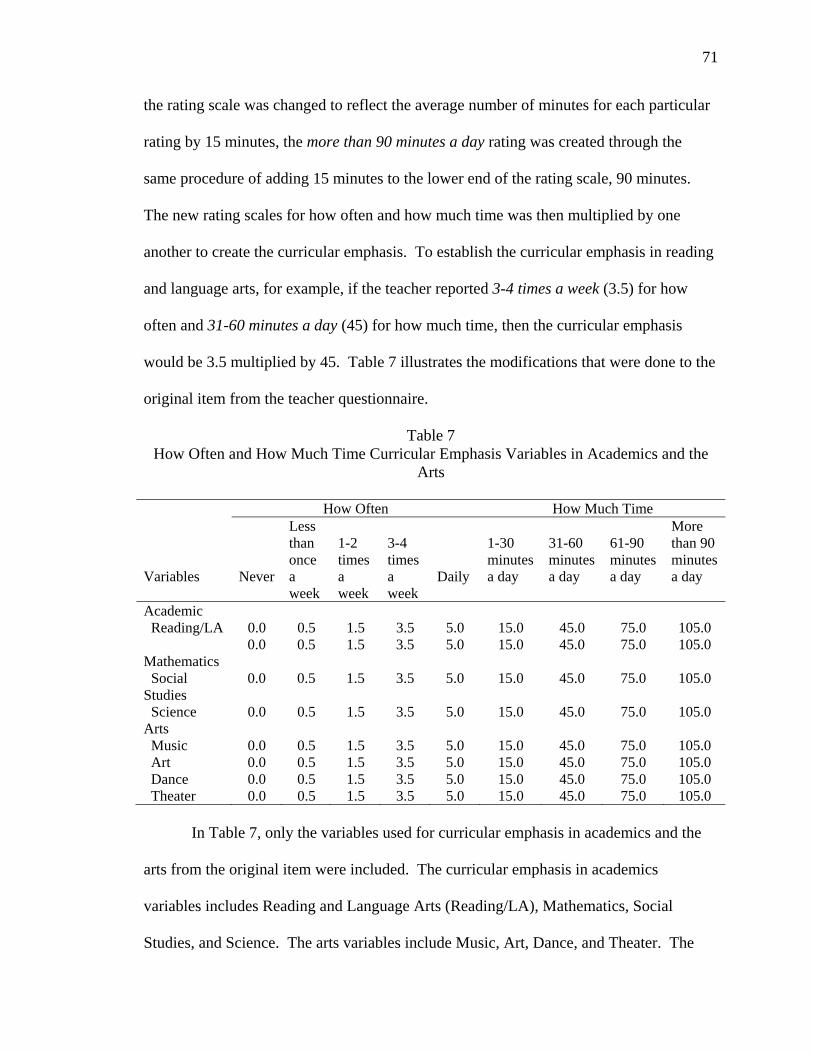
71
the rating scale was changed to reflect the average number of minutes for each particular
rating by 15 minutes, the more than 90 minutes a day rating was created through the
same procedure of adding 15 minutes to the lower end of the rating scale, 90 minutes.
The new rating scales for how often and how much time was then multiplied by one
another to create the curricular emphasis. To establish the curricular emphasis in reading
and language arts, for example, if the teacher reported 3-4 times a week (3.5) for how
often and 31-60 minutes a day (45) for how much time, then the curricular emphasis
would be 3.5 multiplied by 45. Table 7 illustrates the modifications that were done to the
original item from the teacher questionnaire.
Table 7 How Often and How Much Time Curricular Emphasis Variables in Academics and the
Arts
How Often How Much Time Variables
Never
Less than once a week
1-2 times a week
3-4 times a week
Daily
1-30 minutes a day
31-60 minutes a day
61-90 minutes a day
More than 90 minutes a day
Academic Reading/LA 0.0 0.5 1.5 3.5 5.0 15.0 45.0 75.0 105.0 Mathematics
0.0 0.5 1.5 3.5 5.0 15.0 45.0 75.0 105.0
Social Studies
0.0 0.5 1.5 3.5 5.0 15.0 45.0 75.0 105.0
Science 0.0 0.5 1.5 3.5 5.0 15.0 45.0 75.0 105.0 Arts Music 0.0 0.5 1.5 3.5 5.0 15.0 45.0 75.0 105.0 Art 0.0 0.5 1.5 3.5 5.0 15.0 45.0 75.0 105.0 Dance 0.0 0.5 1.5 3.5 5.0 15.0 45.0 75.0 105.0 Theater 0.0 0.5 1.5 3.5 5.0 15.0 45.0 75.0 105.0
In Table 7, only the variables used for curricular emphasis in academics and the
arts from the original item were included. The curricular emphasis in academics
variables includes Reading and Language Arts (Reading/LA), Mathematics, Social
Studies, and Science. The arts variables include Music, Art, Dance, and Theater. The

72
original teacher questionnaire item included Foreign Language, English-as-a-Second-
Language, and Reference Skills as variables. Because these variables were not related
directly in the research to academics, the arts, and physical education, the variables were
excluded from the list of variables. The same procedure described above was used for
most, if not all, of the curricular emphasis measures.
Academic Emphasis: The academic curricular emphasis variable included four
items from the teacher questionnaire: reading and language arts, mathematics, social
studies, and science. These variables, as shown in Appendix C, Table 57, are part of the
how often and how much time teacher questionnaire item. The variables that were
included in the how often and how much time teacher questionnaire item along with the
scale used to rate how often and how much time are found in Appendix C, Table 57.
Arts Emphasis: The arts curricular emphasis included four items from the teacher
questionnaire: music, art, dance or creative movement, and theater or creative dramatics.
These variables are in the how often and how much time teacher questionnaire item in
Table 7 and Table 57. The procedure used to identify curricular emphasis in the arts is
the same procedure described in the curricular emphasis in academics.
Physical Education Emphasis: The physical education emphasis included the same
information found in the one item for academic and arts emphases, but it was separated
into two variables: how many times each week and how much time each day. The
ECLS-K variable for times per week the teacher had physical education with their
students is noted with variable TXPE and is shown Appendix C, Figure 3. Teachers had
the following response options with the respective values: never 1, less than once a week
2, once or twice a week 3, three or four times a week 4, and daily 5. How the responses
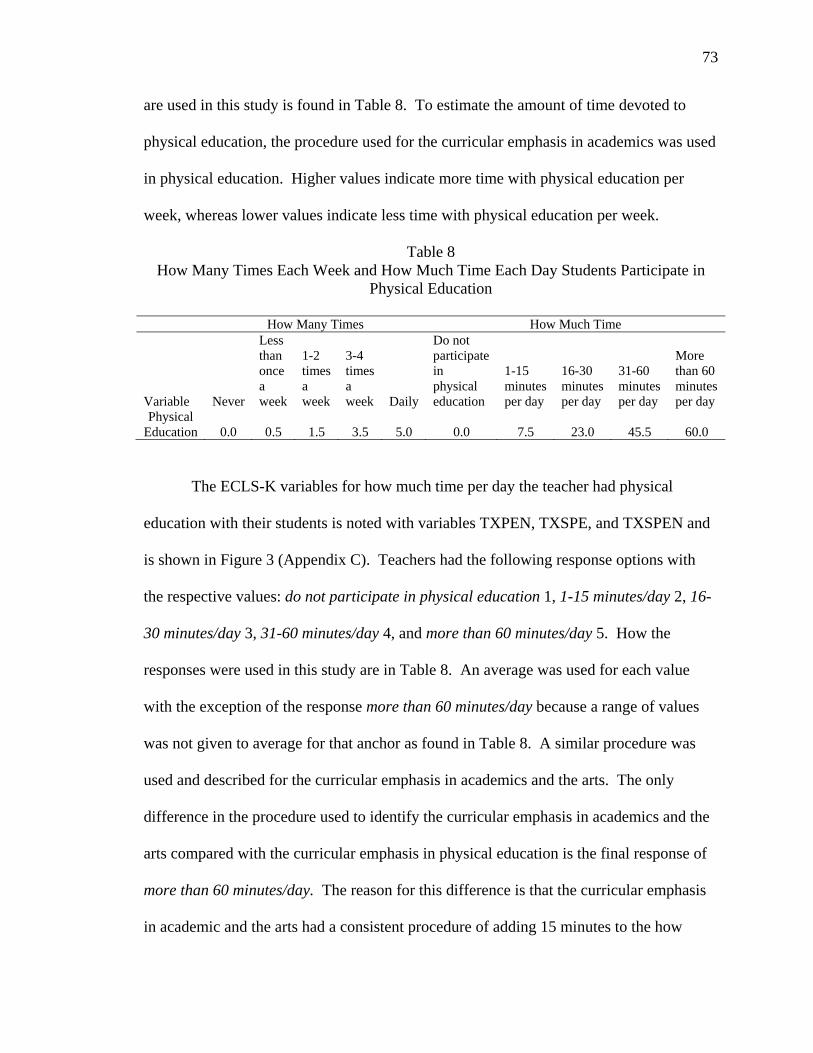
73
are used in this study is found in Table 8. To estimate the amount of time devoted to
physical education, the procedure used for the curricular emphasis in academics was used
in physical education. Higher values indicate more time with physical education per
week, whereas lower values indicate less time with physical education per week.
Table 8 How Many Times Each Week and How Much Time Each Day Students Participate in
Physical Education
How Many Times How Much Time Variable
Never
Less than once a week
1-2 times a week
3-4 times a week
Daily
Do not participate in physical education
1-15 minutes per day
16-30 minutes per day
31-60 minutes per day
More than 60 minutes per day
Physical Education
0.0
0.5
1.5
3.5
5.0
0.0
7.5
23.0
45.5
60.0
The ECLS-K variables for how much time per day the teacher had physical
education with their students is noted with variables TXPEN, TXSPE, and TXSPEN and
is shown in Figure 3 (Appendix C). Teachers had the following response options with
the respective values: do not participate in physical education 1, 1-15 minutes/day 2, 16-
30 minutes/day 3, 31-60 minutes/day 4, and more than 60 minutes/day 5. How the
responses were used in this study are in Table 8. An average was used for each value
with the exception of the response more than 60 minutes/day because a range of values
was not given to average for that anchor as found in Table 8. A similar procedure was
used and described for the curricular emphasis in academics and the arts. The only
difference in the procedure used to identify the curricular emphasis in academics and the
arts compared with the curricular emphasis in physical education is the final response of
more than 60 minutes/day. The reason for this difference is that the curricular emphasis
in academic and the arts had a consistent procedure of adding 15 minutes to the how
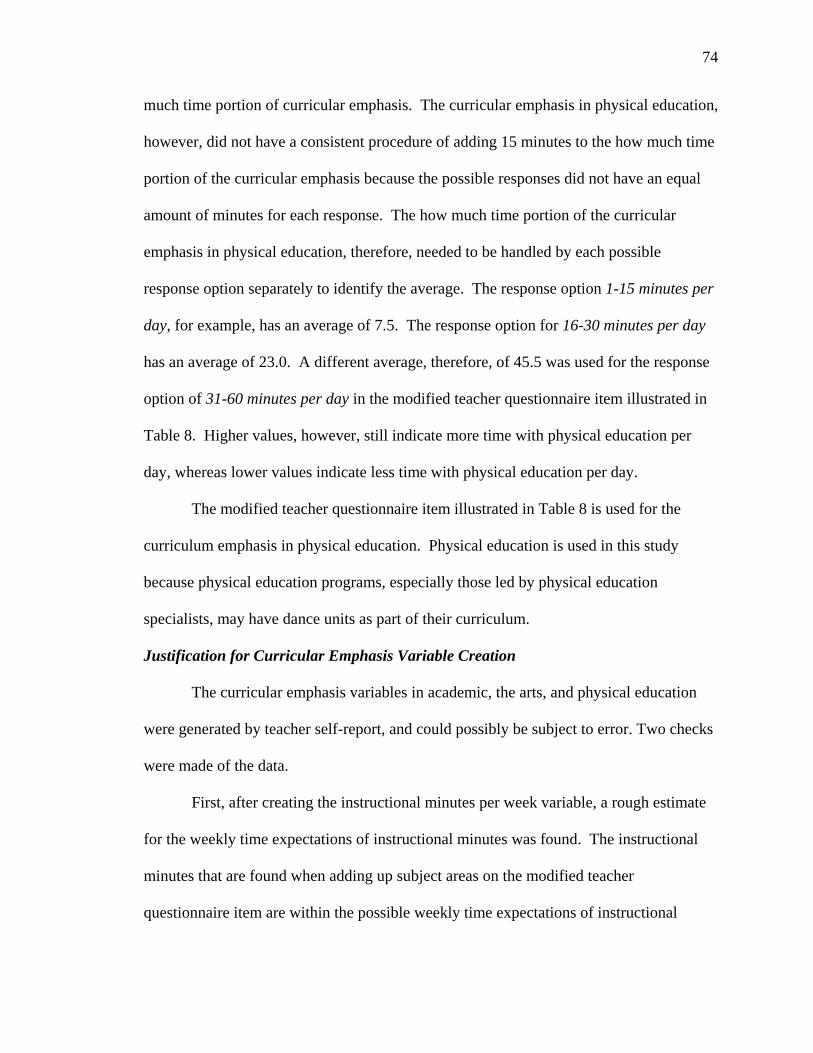
74
much time portion of curricular emphasis. The curricular emphasis in physical education,
however, did not have a consistent procedure of adding 15 minutes to the how much time
portion of the curricular emphasis because the possible responses did not have an equal
amount of minutes for each response. The how much time portion of the curricular
emphasis in physical education, therefore, needed to be handled by each possible
response option separately to identify the average. The response option 1-15 minutes per
day, for example, has an average of 7.5. The response option for 16-30 minutes per day
has an average of 23.0. A different average, therefore, of 45.5 was used for the response
option of 31-60 minutes per day in the modified teacher questionnaire item illustrated in
Table 8. Higher values, however, still indicate more time with physical education per
day, whereas lower values indicate less time with physical education per day.
The modified teacher questionnaire item illustrated in Table 8 is used for the
curriculum emphasis in physical education. Physical education is used in this study
because physical education programs, especially those led by physical education
specialists, may have dance units as part of their curriculum.
Justification for Curricular Emphasis Variable Creation
The curricular emphasis variables in academic, the arts, and physical education
were generated by teacher self-report, and could possibly be subject to error. Two checks
were made of the data.
First, after creating the instructional minutes per week variable, a rough estimate
for the weekly time expectations of instructional minutes was found. The instructional
minutes that are found when adding up subject areas on the modified teacher
questionnaire item are within the possible weekly time expectations of instructional
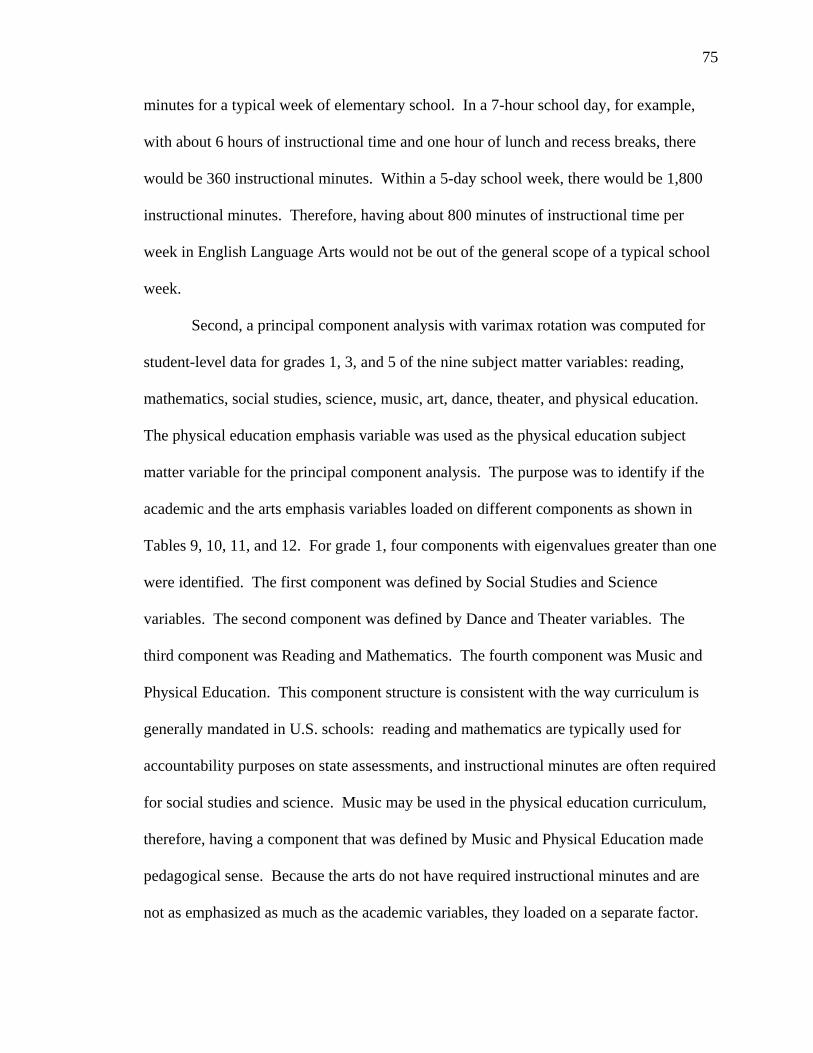
75
minutes for a typical week of elementary school. In a 7-hour school day, for example,
with about 6 hours of instructional time and one hour of lunch and recess breaks, there
would be 360 instructional minutes. Within a 5-day school week, there would be 1,800
instructional minutes. Therefore, having about 800 minutes of instructional time per
week in English Language Arts would not be out of the general scope of a typical school
week.
Second, a principal component analysis with varimax rotation was computed for
student-level data for grades 1, 3, and 5 of the nine subject matter variables: reading,
mathematics, social studies, science, music, art, dance, theater, and physical education.
The physical education emphasis variable was used as the physical education subject
matter variable for the principal component analysis. The purpose was to identify if the
academic and the arts emphasis variables loaded on different components as shown in
Tables 9, 10, 11, and 12. For grade 1, four components with eigenvalues greater than one
were identified. The first component was defined by Social Studies and Science
variables. The second component was defined by Dance and Theater variables. The
third component was Reading and Mathematics. The fourth component was Music and
Physical Education. This component structure is consistent with the way curriculum is
generally mandated in U.S. schools: reading and mathematics are typically used for
accountability purposes on state assessments, and instructional minutes are often required
for social studies and science. Music may be used in the physical education curriculum,
therefore, having a component that was defined by Music and Physical Education made
pedagogical sense. Because the arts do not have required instructional minutes and are
not as emphasized as much as the academic variables, they loaded on a separate factor.
76
Table 9 Principal Component Analysis for the Nine Academic and Arts Emphasis Variables and
Communalities of Grade 1
Component Subject Area 1 2 3 4 h2 Reading -.01 .02 .86 .00 .74 Mathematics .16 .06 .82 .06 .70 Social Studies .93 .08 .05 .08 .88 Science .92 .10 .11 .04 .87 Music -.01 .29 -.02 .72 .60 Art .03 .39 .05 .54 .45 Dance .07 .75 .00 .09 .58 Theater .09 .81 .07 .07 .67 Physical Education .12 -.23 .06 .70 .56
For grade 3, three components with eigenvalues greater than one were identified
(see Table 10). The first component was defined by Social Studies and Science. The
second component was Music, Art, Dance, Theater, and Physical Education. The third
component was defined by Reading and Mathematics.
Table 10 Principal Component Analysis for the Nine Academic and Arts Emphasis Variables and
Communalities of Grade 3
Component Subject Area 1 2 3 h2 Reading .02 .03 .86 .73Mathematics .09 .05 .84 .71Social Studies .91 .07 .09 .85Science .91 .11 .02 .86Music .12 .71 .14 .53Art .17 .61 .11 .42Dance -.02 .64 -.10 .42Theater -.11 .52 -.11 .30Physical Education .08 .25 .07 .07
Table 11 shows the grade 5 reading teacher principal component analysis with
varimax rotation reported three components. In grade 5, Writing was added as a subject
area. The first component was defined by Social Studies and Science. The second
component was Reading, Writing, and Mathematics. The third component was defined
by Music, Art, and Physical Education.
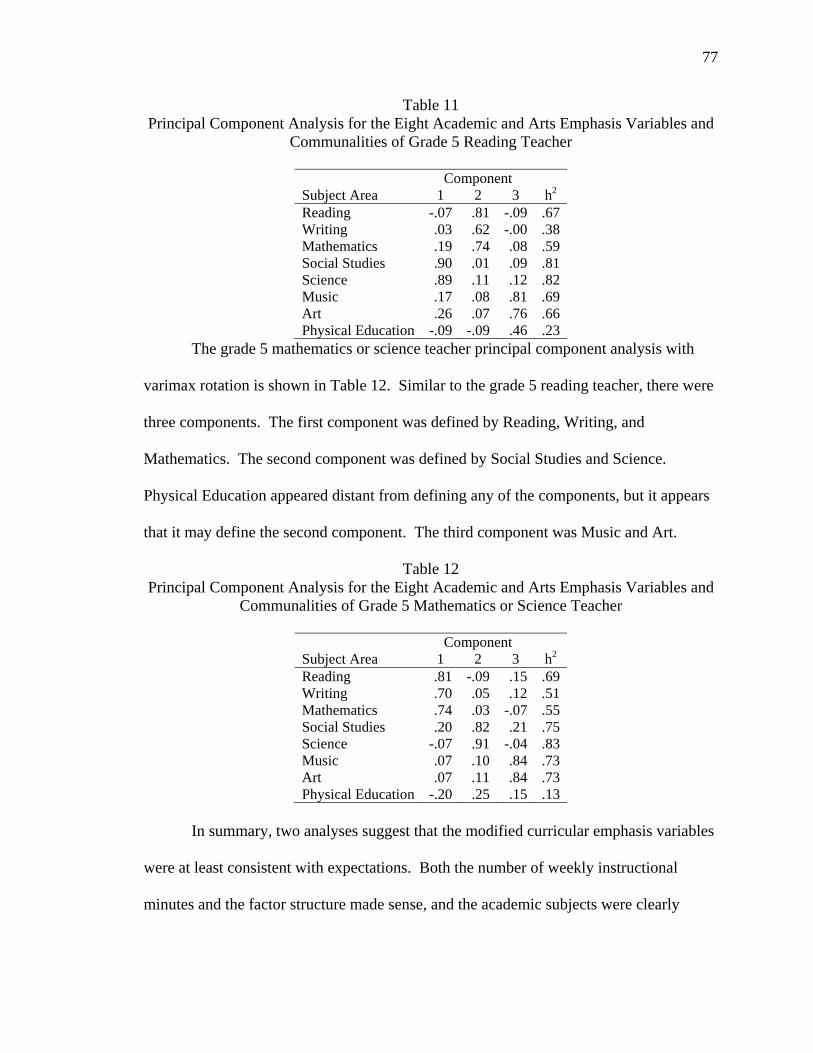
77
Table 11 Principal Component Analysis for the Eight Academic and Arts Emphasis Variables and
Communalities of Grade 5 Reading Teacher
Component Subject Area 1 2 3 h2 Reading -.07 .81 -.09 .67Writing .03 .62 -.00 .38Mathematics .19 .74 .08 .59Social Studies .90 .01 .09 .81Science .89 .11 .12 .82Music .17 .08 .81 .69Art .26 .07 .76 .66Physical Education -.09 -.09 .46 .23
The grade 5 mathematics or science teacher principal component analysis with
varimax rotation is shown in Table 12. Similar to the grade 5 reading teacher, there were
three components. The first component was defined by Reading, Writing, and
Mathematics. The second component was defined by Social Studies and Science.
Physical Education appeared distant from defining any of the components, but it appears
that it may define the second component. The third component was Music and Art.
Table 12 Principal Component Analysis for the Eight Academic and Arts Emphasis Variables and
Communalities of Grade 5 Mathematics or Science Teacher
Component Subject Area 1 2 3 h2 Reading .81 -.09 .15 .69Writing .70 .05 .12 .51Mathematics .74 .03 -.07 .55Social Studies .20 .82 .21 .75Science -.07 .91 -.04 .83Music .07 .10 .84 .73Art .07 .11 .84 .73Physical Education -.20 .25 .15 .13
In summary, two analyses suggest that the modified curricular emphasis variables
were at least consistent with expectations. Both the number of weekly instructional
minutes and the factor structure made sense, and the academic subjects were clearly

78
separated from the arts subjects. The curricular emphasis variables for this dissertation,
therefore, have some positive validity evidence.
School-Level Variables
The school-level data included data from the school administrator questionnaire.
Public- versus private-school and the school-level SES variables were used in the
analyses.
School SES: Continuous SES measure (SESL), percent minority students
(MINOR), and percent free lunch eligible (FLCH) were the three variables used to create
a continuous school-level SES measure. The SESL variable reported student-level SES.
The MINOR variable identified the percent minority students in the school. The FLCH
variable showed how what percent of students in the school were eligible for free lunch.
The MINOR and FLCH variables were reflected to maintain a common direction. Once
the variables were reflected, the student-level data were aggregated to the school-level by
school ID. SESL, MINOR, and FLCH were then factored using principal components,
and scores on the first principal component were created and used as the school-level
SES measure. First principal component loadings and eigenvalues are shown in Table 13
for each grade level.
Table 13 First Principal Component Loadings and Eigenvalues for Socioeconomic
Status (SES), Reflected Percent Minority, and Reflected Percent Free Lunch for Grades 1, 3, and 5
Grade 1 3 5
SES 0.86 0.82 0.79Minority 0.78 0.81 0.80Free Lunch 0.88 0.91 0.89Eigenvalue 2.10 2.20 2.10% Variance 70.50 72.00 68.80

79
To create a categorical SES measure, visual binning was used in SPSS. Visual
binning creates cut points on a continuous measure. For this dissertation, two cut points
were established to create three equally-sized categories of SES: low, middle, and high.
The cut points for the SES categorical variable are indicated in Table 14.
Table 14 Low and High Cut Points for Categorical Socioeconomic Status (SES) for Grades 1, 3,
and 5
Grade Low High 1 -.43 .26 3 -.42 .65 5 -.41 .71
Public or Private School: The variable name for whether a school was public or
private is PUPRI. The variable was marked as 1 if the school was public and 2 if the
school was private in the original data set, and recoded as Public=1 and Private=0. The
public or private school data used in this dissertation were based on responses reported
during the first-grade data collection due to school changes and the refreshening of the
sample in that school year. A higher value indicates a student enrolled in public school
and a lower value indicates a student enrolled in private school.
Data Analysis
The data analysis is divided into two sections. The first section is about how
missing data was handled. The second section has the data analysis strategy.
Missing Data
The SPSS Missing Value Analysis Add-On Module (IBM Corp., 2012) was used
to estimate missing data for the achievement scores and student SES measures. Multiple
imputation is a method that maintains the variability in the population under study with
data sets that have either low sample sizes or high numbers of missing data (Wayman,

80
2003). Multiple imputation takes predictive values, known as imputes, and places them
in the data set where missing data are found. This process is done multiple times to
ensure that the data set maintains variability in the population under study and that
uncertainty caused by missing data still exists (Wayman, 2003).
Researchers use multiple imputation to make valid inferences for a population
when a data set includes missing data. If a researcher mishandles missing data, then
other aspects of the data may be affected (Wayman, 2003). Any method that is used to
handle missing data may affect other data as the other data may be a response to the
missing data. Thus, it is important that missing data are treated in a way that does not
skew the data. There are many methods to address missing data such as the ad-hoc
method of listwise deletion or another method that inserts the mean in cases of missing
data. Ad-hoc methods may leave cases that are not representative of the entire population
under study. The insertion of the mean in cases of missing data reduces the variance of
the variable (Wayman, 2003). Ad-hoc and insertion of the mean are not recommended
strategies to address missing data (Little & Rubin, 1987; Wayman, 2003). Multiple
imputation is recommended as a strategy to address missing data in large-scale studies
(Wayman, 2003), especially if there is a high number of missing data (Little & Rubin,
1987).
Multiple imputation requires that subsequent analyses be done on multiple data
sets. Given the already large number of data sets in this study, such a procedure would
have been difficult to implement. For this study, the missing scores were only imputed
once. Although this is not ideal, and may have introduced some error, it was deemed
better than the alternatives of either not estimating any scores, or using mean imputation.
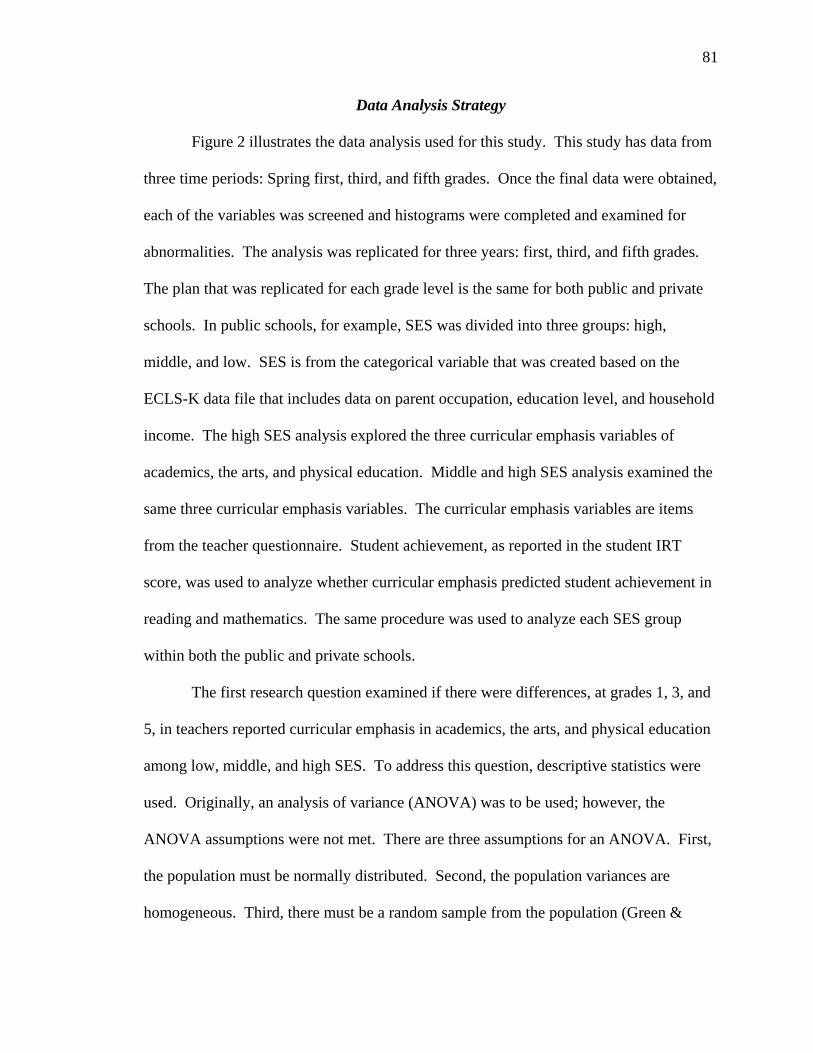
81
Data Analysis Strategy
Figure 2 illustrates the data analysis used for this study. This study has data from
three time periods: Spring first, third, and fifth grades. Once the final data were obtained,
each of the variables was screened and histograms were completed and examined for
abnormalities. The analysis was replicated for three years: first, third, and fifth grades.
The plan that was replicated for each grade level is the same for both public and private
schools. In public schools, for example, SES was divided into three groups: high,
middle, and low. SES is from the categorical variable that was created based on the
ECLS-K data file that includes data on parent occupation, education level, and household
income. The high SES analysis explored the three curricular emphasis variables of
academics, the arts, and physical education. Middle and high SES analysis examined the
same three curricular emphasis variables. The curricular emphasis variables are items
from the teacher questionnaire. Student achievement, as reported in the student IRT
score, was used to analyze whether curricular emphasis predicted student achievement in
reading and mathematics. The same procedure was used to analyze each SES group
within both the public and private schools.
The first research question examined if there were differences, at grades 1, 3, and
5, in teachers reported curricular emphasis in academics, the arts, and physical education
among low, middle, and high SES. To address this question, descriptive statistics were
used. Originally, an analysis of variance (ANOVA) was to be used; however, the
ANOVA assumptions were not met. There are three assumptions for an ANOVA. First,
the population must be normally distributed. Second, the population variances are
homogeneous. Third, there must be a random sample from the population (Green &

82
Salkind, 2011). There were differences in sample sizes between public and private
schools that violated the ANOVA assumptions. In low-SES schools in grade 1, for
instance, public schools had a sample size of 402 schools, whereas private schools only
had a sample size of 10 schools. Similar differences in sample sizes were noticed for
grades 1, 3, and 5. Levene’s test indicated that the variances were statistically
significantly different for the majority of the planned ANOVAs. Descriptive statistics,
therefore, were the only acceptable way to report the findings for research question one.
Through descriptive statistics, the relationship between curricular emphasis and three
levels of SES (low, middle, and high) at two types of schools (public and private) were
explored.
The second research question explored if teachers’ reported curricular emphasis in
academics, the arts, and physical education predicted student achievement in reading and
mathematics in public and private schools and in low-, middle-, and high-SES schools in
grades 1, 3, and 5. To address this question, correlations and regressions were conducted
at grades 1, 3, and 5.The assumptions for a regression are similar to ANOVA. First, the
population must be normally distribution. Second, the population variances are
homogeneous for each level of the independent variable. Third, random sampling from
the population must be present where scores are independent from one another (Green &
Salkind, 2011). Any violations of the regression assumptions will be reported in Chapter
IV.
Summary
This descriptive study used the large-scale ECLS-K data file to examine factors
that moderate arts education in a standards-based education. Through the identified
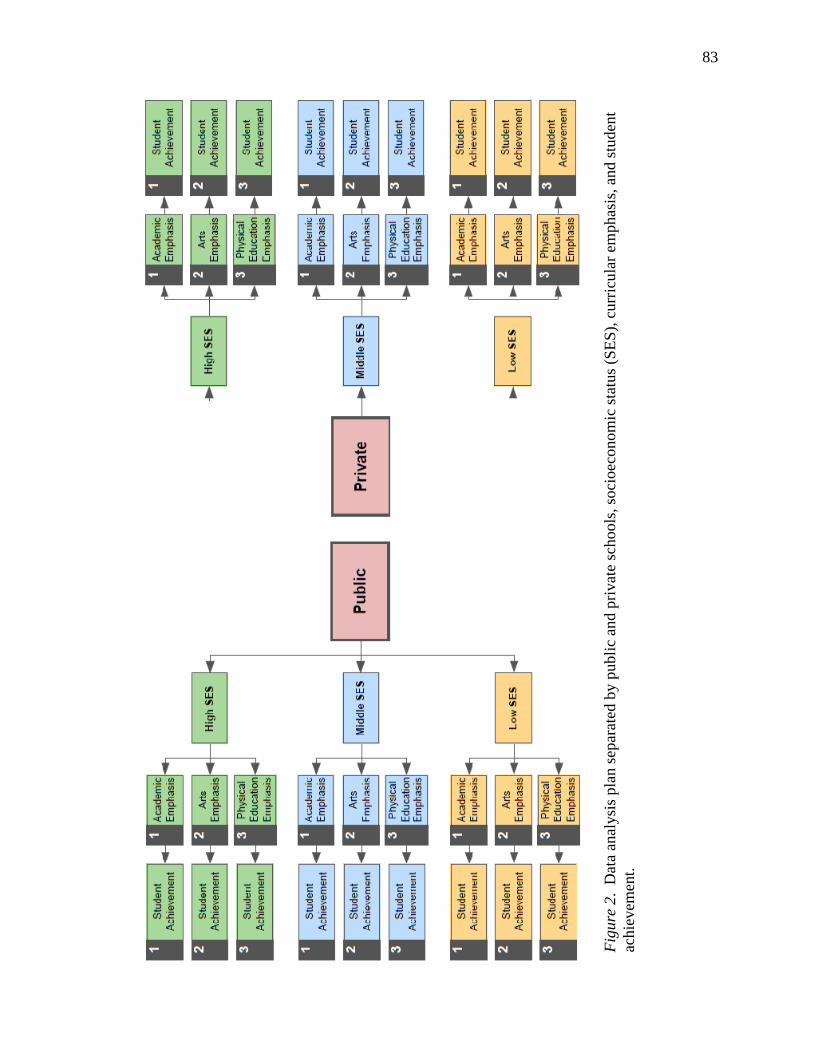
83
Fig
ure
2. D
ata
anal
ysis
pla
n se
para
ted
by p
ubli
c an
d pr
ivat
e sc
hool
s, s
ocio
econ
omic
sta
tus
(SE
S),
cur
ricu
lar
emph
asis
, and
stu
dent
ac
hiev
emen
t.

84
variables in the ECLS-K teacher questionnaires and the student IRT scores in both
reading and mathematics, analysis was done that investigated differences in SES and
public and private schools as factors that moderate arts education in a standards-based
education. The division of SES into categories and the inclusion of public and private
schools will deepen the current available research on arts education and offer new
insights on arts education in a standards-based education.

85
CHAPTER IV
RESULTS
There were two purposes of this study. The first purpose was to explore if there
are differences in academic, arts, and physical education emphases in grades 1, 3, and 5.
Differences in low-, middle-, and high-socioeconomic status (SES) schools and public
versus private schools were at the center of the study. The second purpose was to explore
if teacher emphasis in academic, arts, or physical education predicted student reading or
mathematics achievement in grades 1, 3, and 5.
Chapter IV has three sections. The first two sections are the results for each
research question. For research question one, academic, arts, and physical education
emphases are reported by grade. After the results for each grade are reported, curricular
emphases across grades 1, 3, and 5 are shown. For research question two, the results are
by grade level with intercorrelations and regressions for both reading and mathematics
achievement. At the end of each research question, a summary of results are presented in
a table that are specific to the research question. The third section of the chapter has a
summary of the results for the entire chapter.
Results for Research Question 1
Are there differences in teacher emphasis in academics versus the arts between
public and private schools and between low, middle, and high SES schools in grades 1, 3,
and 5?
Grade 1: Academic Emphasis
Academic emphasis included reading, mathematics, social studies, and science.
At grade 1, public schools had a greater academic emphasis, on average, than private
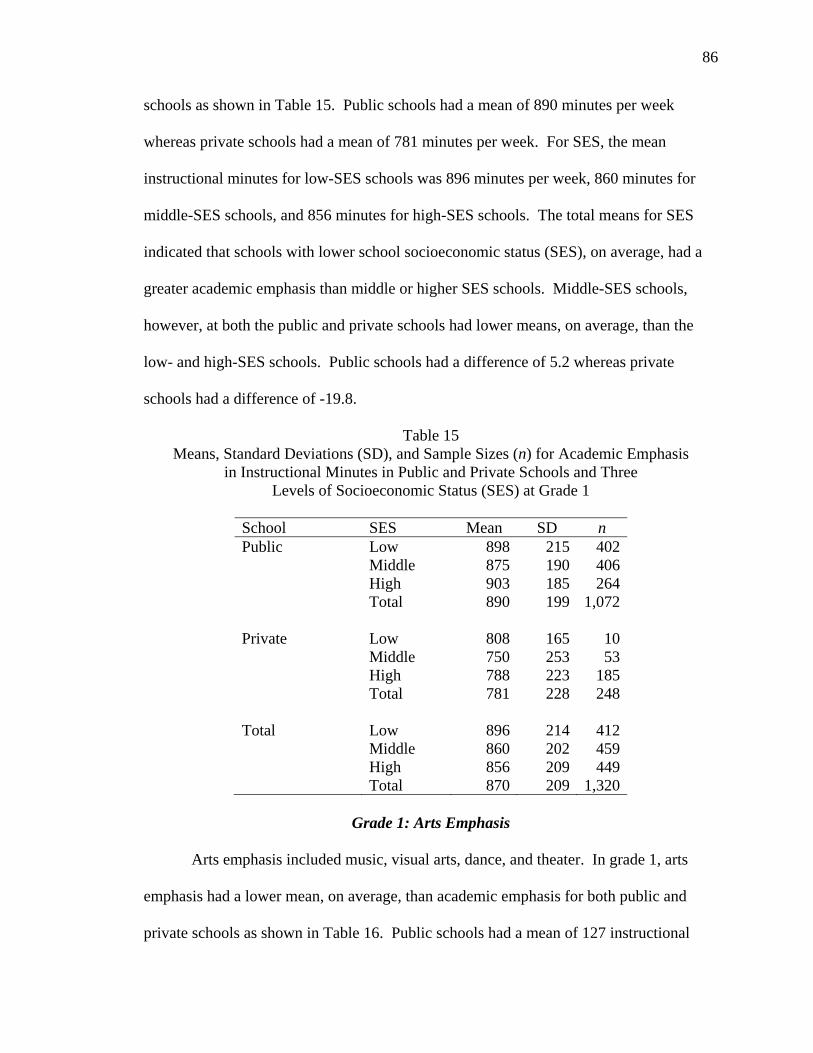
86
schools as shown in Table 15. Public schools had a mean of 890 minutes per week
whereas private schools had a mean of 781 minutes per week. For SES, the mean
instructional minutes for low-SES schools was 896 minutes per week, 860 minutes for
middle-SES schools, and 856 minutes for high-SES schools. The total means for SES
indicated that schools with lower school socioeconomic status (SES), on average, had a
greater academic emphasis than middle or higher SES schools. Middle-SES schools,
however, at both the public and private schools had lower means, on average, than the
low- and high-SES schools. Public schools had a difference of 5.2 whereas private
schools had a difference of -19.8.
Table 15 Means, Standard Deviations (SD), and Sample Sizes (n) for Academic Emphasis
in Instructional Minutes in Public and Private Schools and Three Levels of Socioeconomic Status (SES) at Grade 1
School SES Mean SD n Public Low 898 215 402 Middle 875 190 406 High 903 185 264 Total 890 199 1,072 Private Low 808 165 10 Middle 750 253 53 High 788 223 185 Total 781 228 248 Total Low 896 214 412 Middle 860 202 459 High 856 209 449 Total 870 209 1,320
Grade 1: Arts Emphasis
Arts emphasis included music, visual arts, dance, and theater. In grade 1, arts
emphasis had a lower mean, on average, than academic emphasis for both public and
private schools as shown in Table 16. Public schools had a mean of 127 instructional
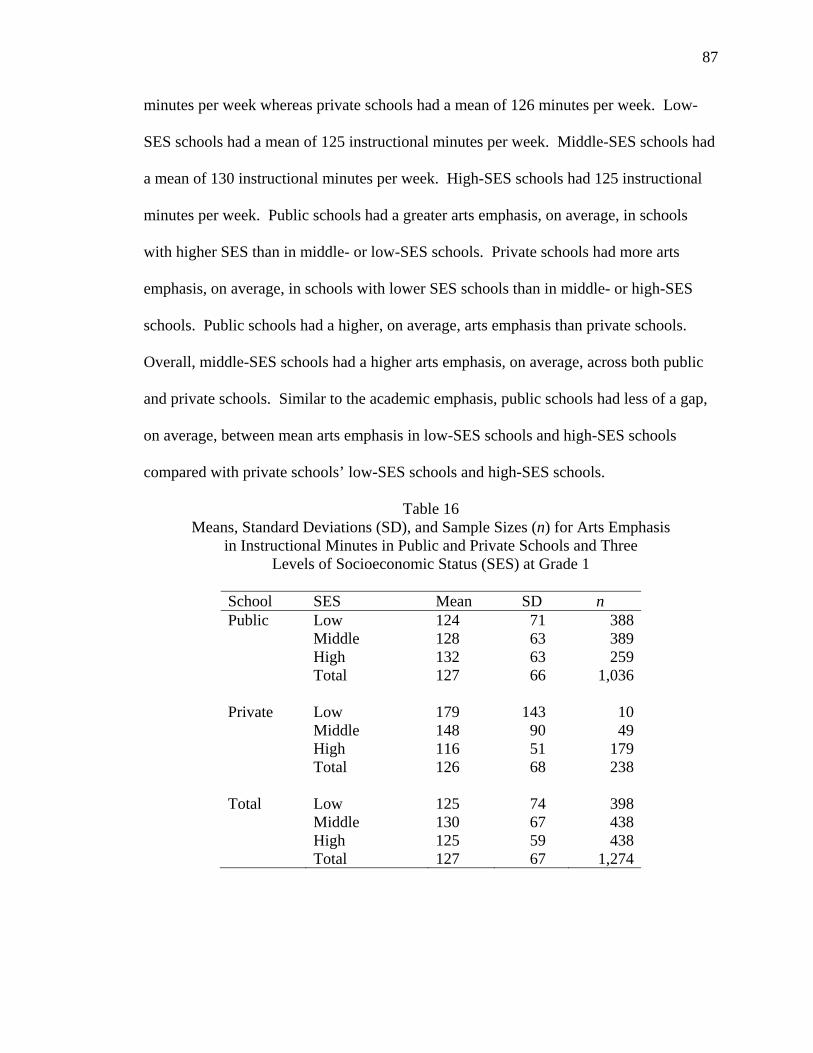
87
minutes per week whereas private schools had a mean of 126 minutes per week. Low-
SES schools had a mean of 125 instructional minutes per week. Middle-SES schools had
a mean of 130 instructional minutes per week. High-SES schools had 125 instructional
minutes per week. Public schools had a greater arts emphasis, on average, in schools
with higher SES than in middle- or low-SES schools. Private schools had more arts
emphasis, on average, in schools with lower SES schools than in middle- or high-SES
schools. Public schools had a higher, on average, arts emphasis than private schools.
Overall, middle-SES schools had a higher arts emphasis, on average, across both public
and private schools. Similar to the academic emphasis, public schools had less of a gap,
on average, between mean arts emphasis in low-SES schools and high-SES schools
compared with private schools’ low-SES schools and high-SES schools.
Table 16 Means, Standard Deviations (SD), and Sample Sizes (n) for Arts Emphasis
in Instructional Minutes in Public and Private Schools and Three Levels of Socioeconomic Status (SES) at Grade 1
School SES Mean SD n Public Low 124 71 388 Middle 128 63 389 High 132 63 259 Total 127 66 1,036
Private Low 179 143 10 Middle 148 90 49 High 116 51 179 Total 126 68 238
Total Low 125 74 398 Middle 130 67 438 High 125 59 438 Total 127 67 1,274

88
Grade 1: Physical Education Emphasis
The physical education emphasis included the time for physical education each
week and the time for physical education each day variables from the ECLS-K data file.
Public schools had a mean of 67 instructional minutes per week and private schools had a
mean of 62 instructional minutes per week as shown in Table 17. Low-SES schools had
a mean of 70 instructional minutes per week. Middle-SES schools had a mean of 66
instructional minutes per week. High-SES schools had a mean of 63 instructional
minutes per week. Lower-SES schools indicated a greater physical education emphasis,
on average, than higher-SES schools in both public and private schools in grade 1.
Table 17 Means, Standard Deviations (SD), and Sample Sizes (n) for Physical Education Emphasis
in Instructional Minutes in Public and Private Schools and Three Levels of Socioeconomic Status (SES) at Grade 1
School SES Mean SD n Public Low 69 50 383 Middle 66 39 388 High 64 32 258 Total 67 42 1,029 Private Low 74 59 10 Middle 63 36 46 High 61 39 178 Total 62 40 234 Total Low 70 50 393 Middle 66 38 434 High 63 35 436 Total 66 42 1,263
Grade 3: Academic Emphasis
Academic emphasis means, standard deviations, and sample sizes for grade 3 are
reported in Table 18. Public schools had a mean of 878 instructional minutes per week
and private schools had a mean of 772 instructional minutes per week. Similar to grade 1
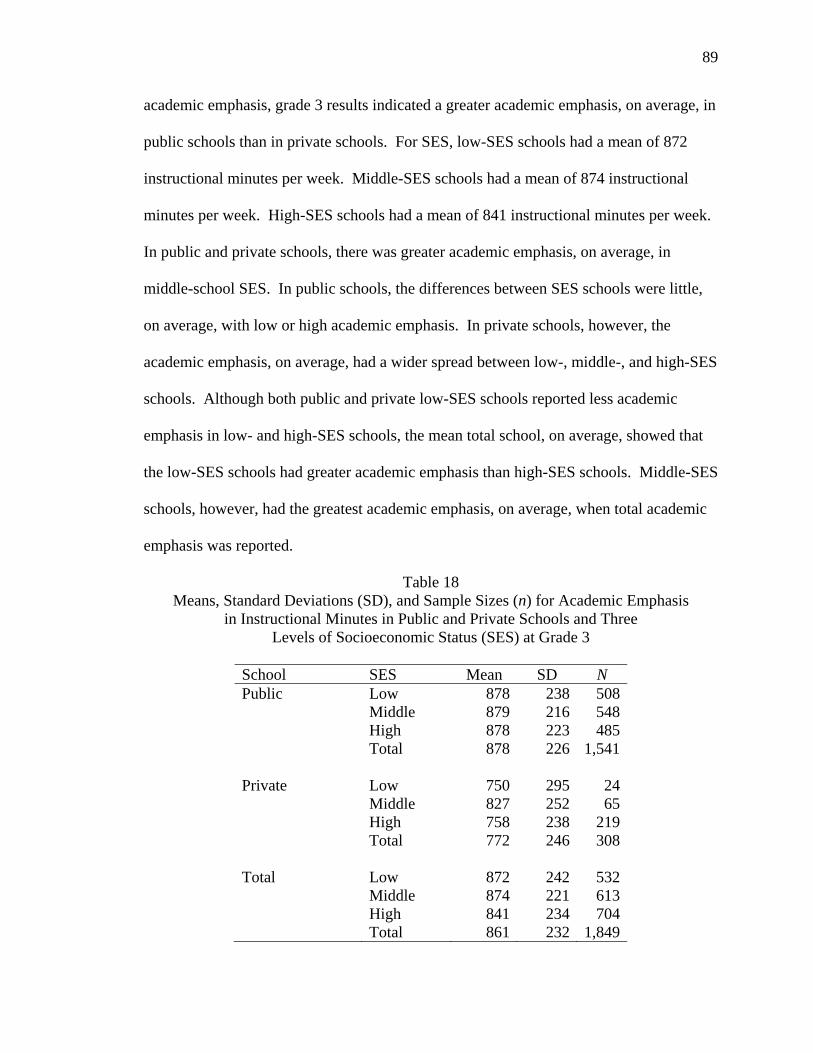
89
academic emphasis, grade 3 results indicated a greater academic emphasis, on average, in
public schools than in private schools. For SES, low-SES schools had a mean of 872
instructional minutes per week. Middle-SES schools had a mean of 874 instructional
minutes per week. High-SES schools had a mean of 841 instructional minutes per week.
In public and private schools, there was greater academic emphasis, on average, in
middle-school SES. In public schools, the differences between SES schools were little,
on average, with low or high academic emphasis. In private schools, however, the
academic emphasis, on average, had a wider spread between low-, middle-, and high-SES
schools. Although both public and private low-SES schools reported less academic
emphasis in low- and high-SES schools, the mean total school, on average, showed that
the low-SES schools had greater academic emphasis than high-SES schools. Middle-SES
schools, however, had the greatest academic emphasis, on average, when total academic
emphasis was reported.
Table 18 Means, Standard Deviations (SD), and Sample Sizes (n) for Academic Emphasis
in Instructional Minutes in Public and Private Schools and Three Levels of Socioeconomic Status (SES) at Grade 3
School SES Mean SD N Public Low 878 238 508 Middle 879 216 548 High 878 223 485 Total 878 226 1,541 Private Low 750 295 24 Middle 827 252 65 High 758 238 219 Total 772 246 308 Total Low 872 242 532 Middle 874 221 613 High 841 234 704 Total 861 232 1,849
90
Grade 3: Arts Emphasis
Similar to grade 1 in arts emphasis, grade 3 arts emphasis had lower, on average,
means for public and private schools across low-, middle-, and high-SES schools than
academic emphasis (see Table 19). Public schools had a mean of 107 instructional
minutes per week. Private schools had a mean of 109 instructional minutes per week.
There was a higher arts emphasis, on average, in private schools compared with public
schools. For SES, low-SES schools had a mean of 98 instructional minutes per week.
Middle-SES schools had a mean of 110 instructional minutes per week. High-SES
schools had a mean of 112 instructional minutes per week. In public schools, higher
levels of SES schools indicated a greater arts emphasis. In private schools, the middle-
SES schools, on average, had the greatest arts emphasis. The low-SES schools in private
schools, however, reported the lowest amount, on average, of arts emphasis. Low-SES
schools in private schools had the lowest arts emphasis, on average, between both public
and private schools. Low-SES schools, overall, had the lowest arts emphasis, on average,
and high-SES schools had the greatest arts emphasis.
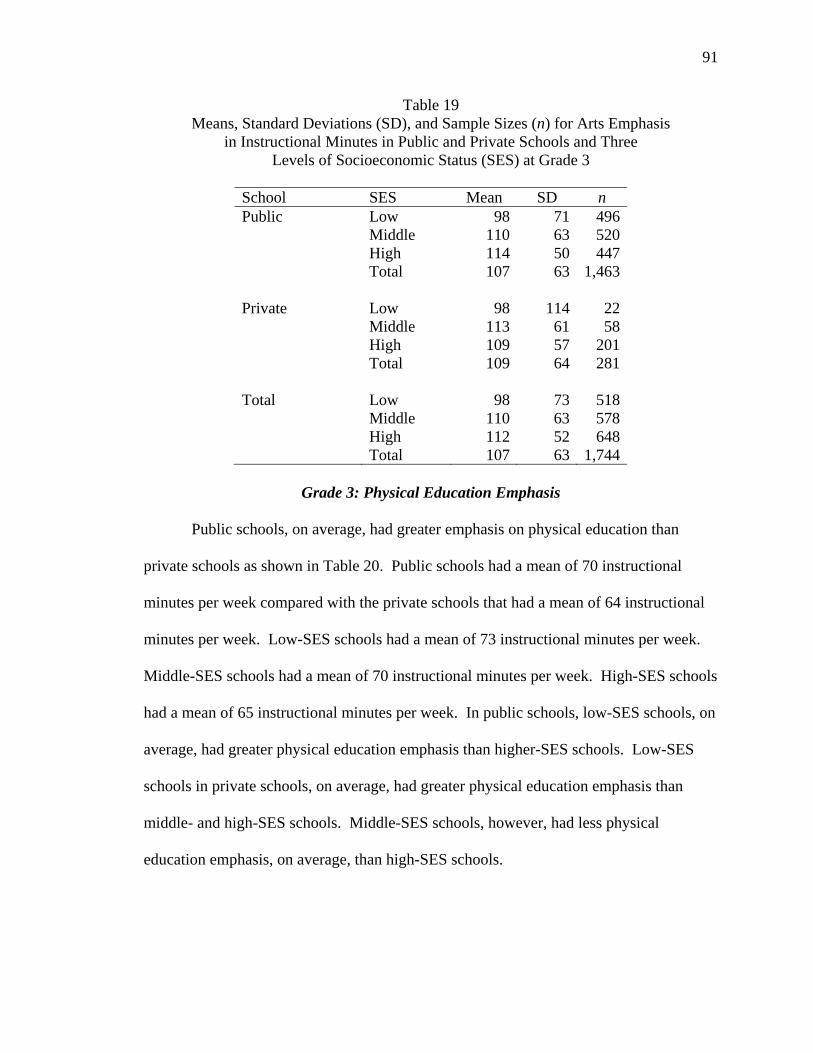
91
Table 19 Means, Standard Deviations (SD), and Sample Sizes (n) for Arts Emphasis
in Instructional Minutes in Public and Private Schools and Three Levels of Socioeconomic Status (SES) at Grade 3
School SES Mean SD n Public Low 98 71 496 Middle 110 63 520 High 114 50 447 Total 107 63 1,463 Private Low 98 114 22 Middle 113 61 58 High 109 57 201 Total 109 64 281 Total Low 98 73 518 Middle 110 63 578 High 112 52 648 Total 107 63 1,744
Grade 3: Physical Education Emphasis
Public schools, on average, had greater emphasis on physical education than
private schools as shown in Table 20. Public schools had a mean of 70 instructional
minutes per week compared with the private schools that had a mean of 64 instructional
minutes per week. Low-SES schools had a mean of 73 instructional minutes per week.
Middle-SES schools had a mean of 70 instructional minutes per week. High-SES schools
had a mean of 65 instructional minutes per week. In public schools, low-SES schools, on
average, had greater physical education emphasis than higher-SES schools. Low-SES
schools in private schools, on average, had greater physical education emphasis than
middle- and high-SES schools. Middle-SES schools, however, had less physical
education emphasis, on average, than high-SES schools.
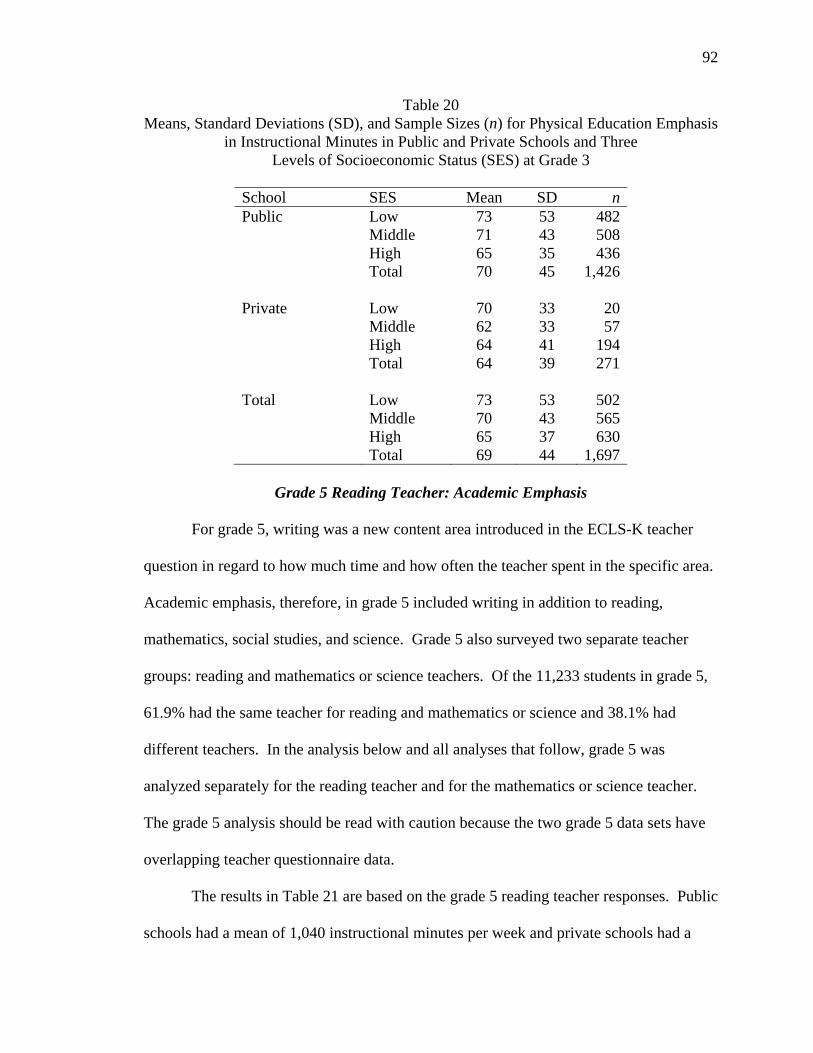
92
Table 20 Means, Standard Deviations (SD), and Sample Sizes (n) for Physical Education Emphasis
in Instructional Minutes in Public and Private Schools and Three Levels of Socioeconomic Status (SES) at Grade 3
School SES Mean SD n Public Low 73 53 482 Middle 71 43 508 High 65 35 436 Total 70 45 1,426 Private Low 70 33 20 Middle 62 33 57 High 64 41 194 Total 64 39 271 Total Low 73 53 502 Middle 70 43 565 High 65 37 630 Total 69 44 1,697
Grade 5 Reading Teacher: Academic Emphasis
For grade 5, writing was a new content area introduced in the ECLS-K teacher
question in regard to how much time and how often the teacher spent in the specific area.
Academic emphasis, therefore, in grade 5 included writing in addition to reading,
mathematics, social studies, and science. Grade 5 also surveyed two separate teacher
groups: reading and mathematics or science teachers. Of the 11,233 students in grade 5,
61.9% had the same teacher for reading and mathematics or science and 38.1% had
different teachers. In the analysis below and all analyses that follow, grade 5 was
analyzed separately for the reading teacher and for the mathematics or science teacher.
The grade 5 analysis should be read with caution because the two grade 5 data sets have
overlapping teacher questionnaire data.
The results in Table 21 are based on the grade 5 reading teacher responses. Public
schools had a mean of 1,040 instructional minutes per week and private schools had a

93
mean of 909 instructional minutes per week. The public schools had the greatest
academic emphasis, on average, than the private schools. For SES, low-SES schools had
a mean of 1,054 instructional minutes per week whereas middle-SES schools had 1,022
and high-SES schools had 989 instructional minutes per week. In the public schools, the
low-SES schools, on average, had the greatest academic emphasis compared with the
middle- and high-SES schools. Low-SES schools in private schools had the highest
academic emphasis, on average, in private schools, but middle-SES schools had a lower,
on average, academic emphasis than high-SES schools. Even though there was a lower
academic emphasis in private middle-SES schools, the overall result for public and
private schools combined was that low-SES schools resulted in higher academic
emphasis, on average, compared with higher-SES schools, on average, with less
academic emphasis.
Table 21 Means, Standard Deviations (SD), and Sample Sizes (n) for Academic Emphasis
in Instructional Minutes in Public and Private Schools and Three Levels of Socioeconomic Status (SES) at Grade
5 Reading Teacher
School SES Mean SD n Public Low 1,055 312 598 Middle 1,037 288 575 High 1,025 270 454 Total 1,040 292 1,627 Private Low 1,019 233 30 Middle 889 304 65 High 898 277 180 Total 909 281 275 Total Low 1,054 309 628 Middle 1,022 293 640 High 989 277 634 Total 1,021 294 1,902
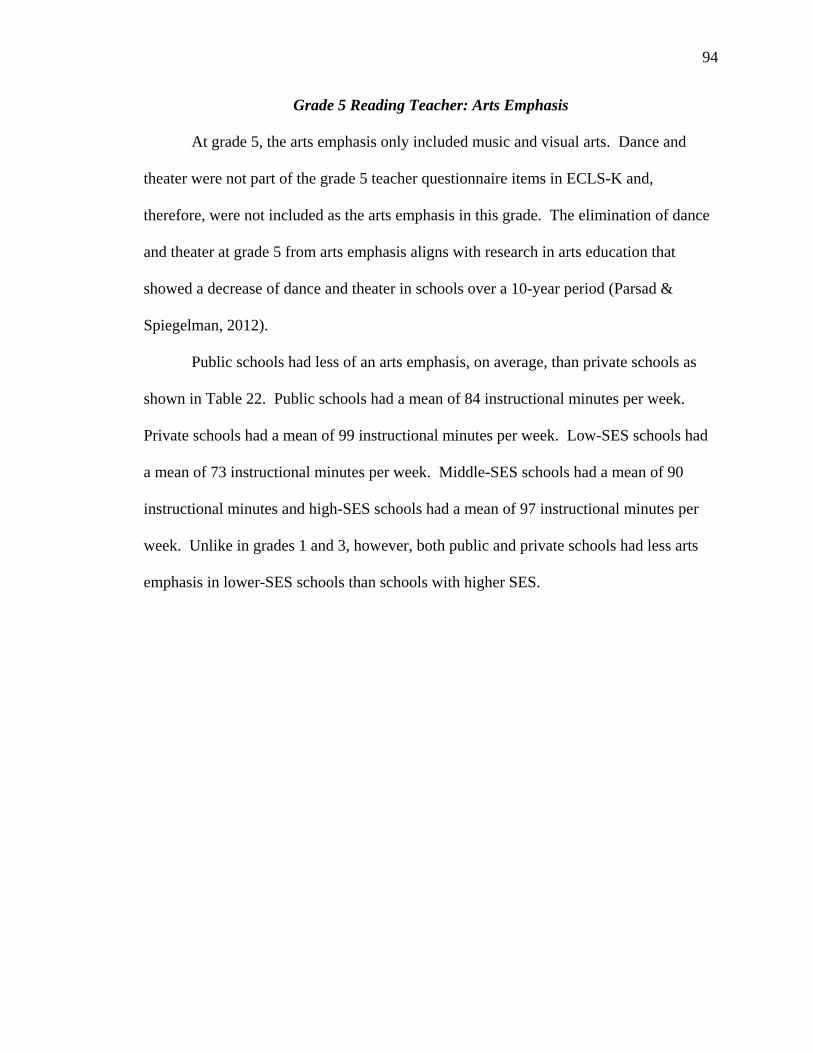
94
Grade 5 Reading Teacher: Arts Emphasis
At grade 5, the arts emphasis only included music and visual arts. Dance and
theater were not part of the grade 5 teacher questionnaire items in ECLS-K and,
therefore, were not included as the arts emphasis in this grade. The elimination of dance
and theater at grade 5 from arts emphasis aligns with research in arts education that
showed a decrease of dance and theater in schools over a 10-year period (Parsad &
Spiegelman, 2012).
Public schools had less of an arts emphasis, on average, than private schools as
shown in Table 22. Public schools had a mean of 84 instructional minutes per week.
Private schools had a mean of 99 instructional minutes per week. Low-SES schools had
a mean of 73 instructional minutes per week. Middle-SES schools had a mean of 90
instructional minutes and high-SES schools had a mean of 97 instructional minutes per
week. Unlike in grades 1 and 3, however, both public and private schools had less arts
emphasis in lower-SES schools than schools with higher SES.
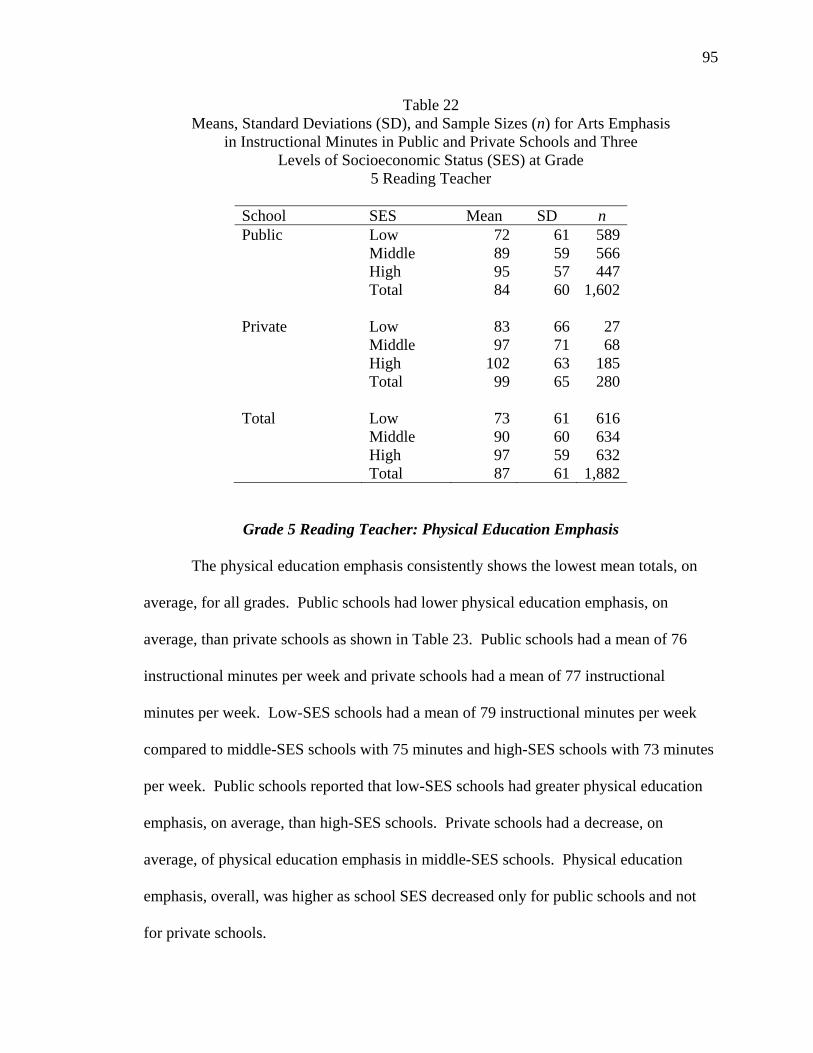
95
Table 22 Means, Standard Deviations (SD), and Sample Sizes (n) for Arts Emphasis
in Instructional Minutes in Public and Private Schools and Three Levels of Socioeconomic Status (SES) at Grade
5 Reading Teacher
School SES Mean SD n Public Low 72 61 589 Middle 89 59 566 High 95 57 447 Total 84 60 1,602 Private Low 83 66 27 Middle 97 71 68 High 102 63 185 Total 99 65 280 Total Low 73 61 616 Middle 90 60 634 High 97 59 632 Total 87 61 1,882
Grade 5 Reading Teacher: Physical Education Emphasis
The physical education emphasis consistently shows the lowest mean totals, on
average, for all grades. Public schools had lower physical education emphasis, on
average, than private schools as shown in Table 23. Public schools had a mean of 76
instructional minutes per week and private schools had a mean of 77 instructional
minutes per week. Low-SES schools had a mean of 79 instructional minutes per week
compared to middle-SES schools with 75 minutes and high-SES schools with 73 minutes
per week. Public schools reported that low-SES schools had greater physical education
emphasis, on average, than high-SES schools. Private schools had a decrease, on
average, of physical education emphasis in middle-SES schools. Physical education
emphasis, overall, was higher as school SES decreased only for public schools and not
for private schools.
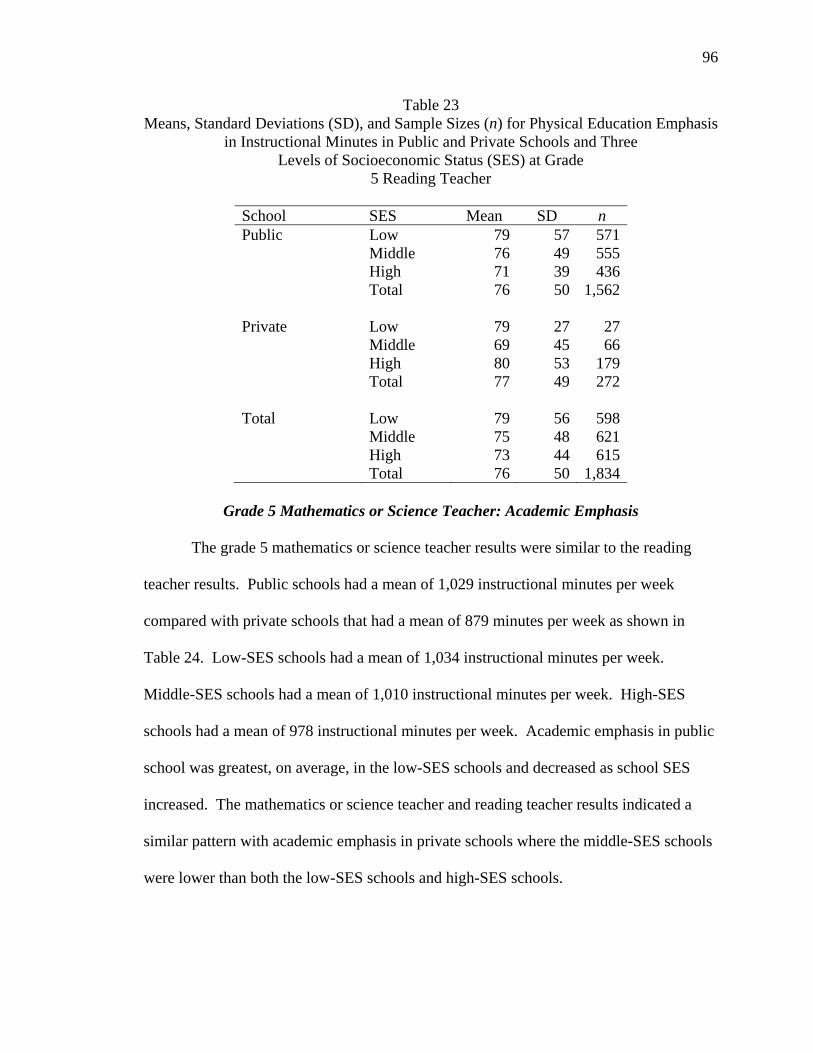
96
Table 23 Means, Standard Deviations (SD), and Sample Sizes (n) for Physical Education Emphasis
in Instructional Minutes in Public and Private Schools and Three Levels of Socioeconomic Status (SES) at Grade
5 Reading Teacher
School SES Mean SD n Public Low 79 57 571 Middle 76 49 555 High 71 39 436 Total 76 50 1,562 Private Low 79 27 27 Middle 69 45 66 High 80 53 179 Total 77 49 272 Total Low 79 56 598 Middle 75 48 621 High 73 44 615 Total 76 50 1,834
Grade 5 Mathematics or Science Teacher: Academic Emphasis
The grade 5 mathematics or science teacher results were similar to the reading
teacher results. Public schools had a mean of 1,029 instructional minutes per week
compared with private schools that had a mean of 879 minutes per week as shown in
Table 24. Low-SES schools had a mean of 1,034 instructional minutes per week.
Middle-SES schools had a mean of 1,010 instructional minutes per week. High-SES
schools had a mean of 978 instructional minutes per week. Academic emphasis in public
school was greatest, on average, in the low-SES schools and decreased as school SES
increased. The mathematics or science teacher and reading teacher results indicated a
similar pattern with academic emphasis in private schools where the middle-SES schools
were lower than both the low-SES schools and high-SES schools.

97
Table 24 Means, Standard Deviations (SD), and Sample Sizes (n) for Academic Emphasis
in Instructional Minutes in Public and Private Schools and Three Levels of Socioeconomic Status (SES) at Grade
5 Mathematics or Science Teacher
School SES Mean SD n Public Low 1,036 320 590 Middle 1,034 295 571 High 1,013 285 467 Total 1,029 302 1,628 Private Low 1,002 232 31 Middle 817 305 72 High 882 313 170 Total 879 306 273 Total Low 1,034 316 621 Middle 1,010 304 643 High 978 298 637 Total 1,007 307 1,901
Grade 5 Mathematics or Science Teacher: Arts Emphasis
The mathematics or science teacher art emphasis results for public schools are
similar to the reading teacher art emphasis results because both results show low-SES
schools with less arts emphasis than high-SES schools. Public schools had a mean of 84
instructional minutes per week compared with private schools with a mean of 87 minutes
per week as shown in Table 25. For SES, low-SES schools had a mean of 71
instructional minutes per week. Middle-SES schools had a mean of 89 instructional
minutes and high-SES schools had a mean of 94 minutes per week. The private schools
mathematics or science teacher results, however, differed from the reading teacher
results. Instead of the private schools mathematics or science teachers showing less arts
emphasis in low-SES schools and more arts emphasis in higher SES school levels as in
the reading teacher results, the middle-SES schools, on average, is lower than the low-
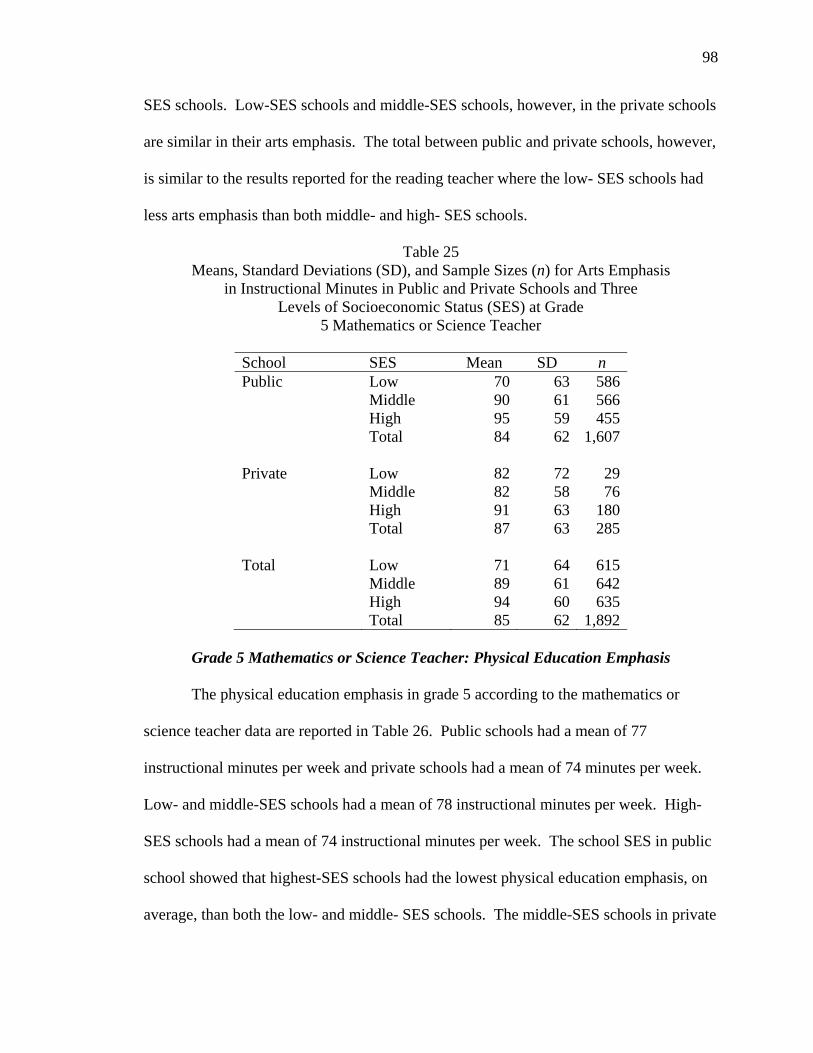
98
SES schools. Low-SES schools and middle-SES schools, however, in the private schools
are similar in their arts emphasis. The total between public and private schools, however,
is similar to the results reported for the reading teacher where the low- SES schools had
less arts emphasis than both middle- and high- SES schools.
Table 25 Means, Standard Deviations (SD), and Sample Sizes (n) for Arts Emphasis
in Instructional Minutes in Public and Private Schools and Three Levels of Socioeconomic Status (SES) at Grade
5 Mathematics or Science Teacher
School SES Mean SD n Public Low 70 63 586 Middle 90 61 566 High 95 59 455 Total 84 62 1,607 Private Low 82 72 29 Middle 82 58 76 High 91 63 180 Total 87 63 285 Total Low 71 64 615 Middle 89 61 642 High 94 60 635 Total 85 62 1,892
Grade 5 Mathematics or Science Teacher: Physical Education Emphasis
The physical education emphasis in grade 5 according to the mathematics or
science teacher data are reported in Table 26. Public schools had a mean of 77
instructional minutes per week and private schools had a mean of 74 minutes per week.
Low- and middle-SES schools had a mean of 78 instructional minutes per week. High-
SES schools had a mean of 74 instructional minutes per week. The school SES in public
school showed that highest-SES schools had the lowest physical education emphasis, on
average, than both the low- and middle- SES schools. The middle-SES schools in private
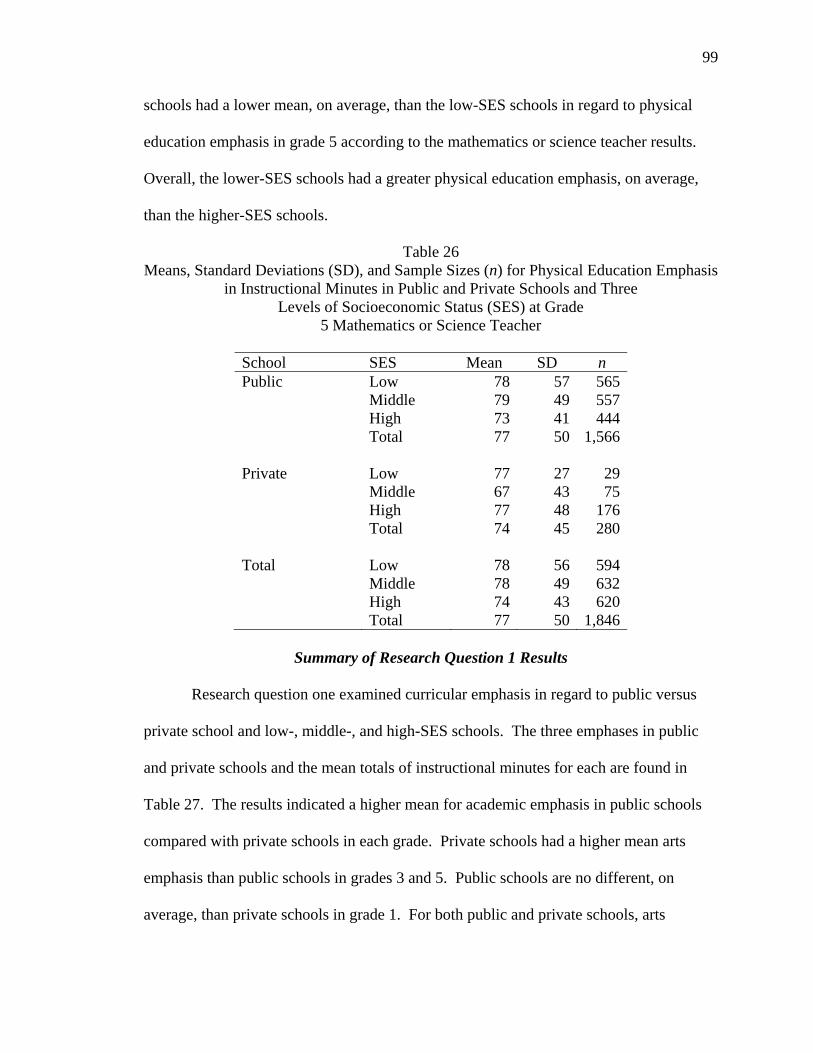
99
schools had a lower mean, on average, than the low-SES schools in regard to physical
education emphasis in grade 5 according to the mathematics or science teacher results.
Overall, the lower-SES schools had a greater physical education emphasis, on average,
than the higher-SES schools.
Table 26 Means, Standard Deviations (SD), and Sample Sizes (n) for Physical Education Emphasis
in Instructional Minutes in Public and Private Schools and Three Levels of Socioeconomic Status (SES) at Grade
5 Mathematics or Science Teacher
School SES Mean SD n Public Low 78 57 565 Middle 79 49 557 High 73 41 444 Total 77 50 1,566 Private Low 77 27 29 Middle 67 43 75 High 77 48 176 Total 74 45 280 Total Low 78 56 594 Middle 78 49 632 High 74 43 620 Total 77 50 1,846
Summary of Research Question 1 Results
Research question one examined curricular emphasis in regard to public versus
private school and low-, middle-, and high-SES schools. The three emphases in public
and private schools and the mean totals of instructional minutes for each are found in
Table 27. The results indicated a higher mean for academic emphasis in public schools
compared with private schools in each grade. Private schools had a higher mean arts
emphasis than public schools in grades 3 and 5. Public schools are no different, on
average, than private schools in grade 1. For both public and private schools, arts

100
emphasis decreased as students entered older grades. The public schools had a higher
mean physical education emphasis than private schools in grades 1 and 3. In grade 5,
there was a discrepancy between the reading teachers’ and the mathematics or science
teachers’ reported physical education emphasis in both the public and private schools.
The reading teachers indicated a higher mean, on average, physical education emphasis in
private schools compared with public schools. Public school mathematics and science
teachers, however, reported a higher mean, on average, physical education emphasis than
private schools. Physical education emphasis, overall, in public and private schools for
grades 1, 3, and 5 reported smaller means than in both academic and arts emphases.
Table 27 Mean Totals for Academic, Arts, and Physical Education Emphases
in Public and Private Schools at Grades 1, 3, and 5
Grade Emphasis School 1 3 5T1 5T2 Academic Public 890 878 1,040 1,029 Private 781 772 909 879 Arts Public 127 107 84 84 Private 126 109 99 87 Physical Education Public 67 71 76 77 Private 62 65 77 74
Note. Grade 5 has two columns where T1 is the Reading Teacher and T2 is the Mathematics or Science Teacher.
A summary of the results for low-, middle-, and high-SES schools is found in
Table 28. The grade 5 results are separated in the table by reading teacher, R, and
mathematics or science teacher, MS. Low-SES schools in grades 1 and 5, on average,
had a greater academic emphasis than middle- and high-SES schools. In grade 3, low-
and middle-SES schools had a greater academic emphasis, on average, than high-SES
schools. An arts emphasis in grade 1 was slightly greater, on average in middle-SES
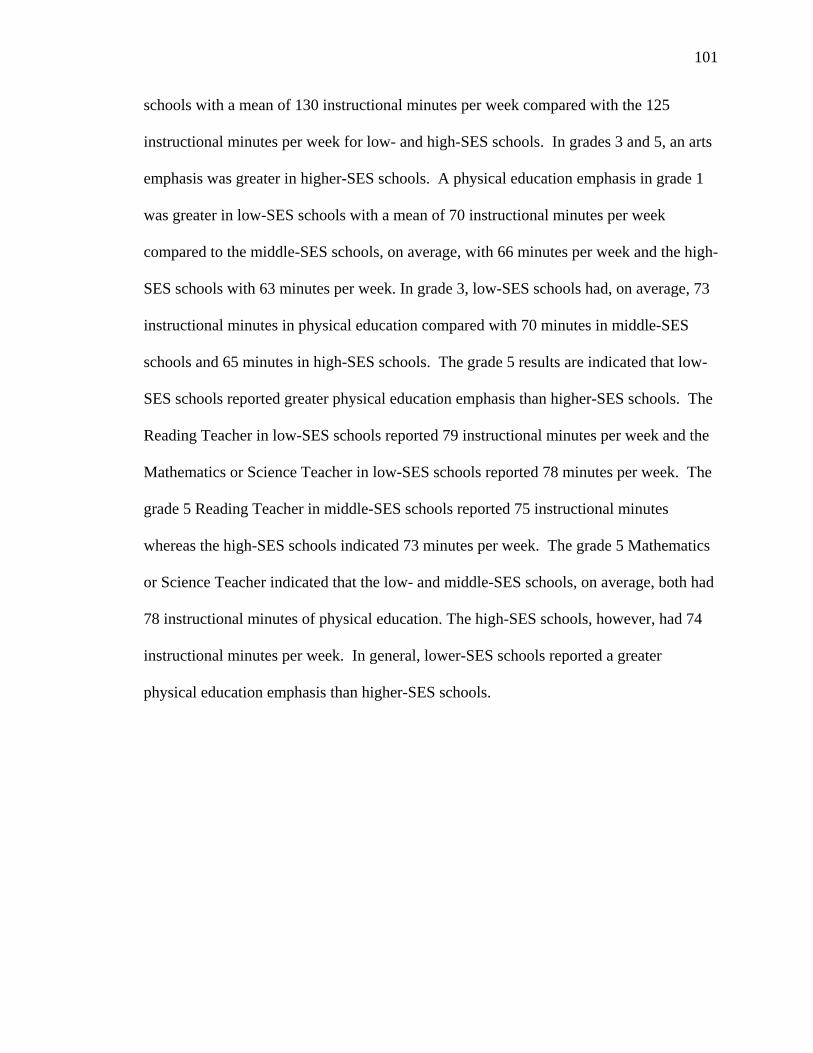
101
schools with a mean of 130 instructional minutes per week compared with the 125
instructional minutes per week for low- and high-SES schools. In grades 3 and 5, an arts
emphasis was greater in higher-SES schools. A physical education emphasis in grade 1
was greater in low-SES schools with a mean of 70 instructional minutes per week
compared to the middle-SES schools, on average, with 66 minutes per week and the high-
SES schools with 63 minutes per week. In grade 3, low-SES schools had, on average, 73
instructional minutes in physical education compared with 70 minutes in middle-SES
schools and 65 minutes in high-SES schools. The grade 5 results are indicated that low-
SES schools reported greater physical education emphasis than higher-SES schools. The
Reading Teacher in low-SES schools reported 79 instructional minutes per week and the
Mathematics or Science Teacher in low-SES schools reported 78 minutes per week. The
grade 5 Reading Teacher in middle-SES schools reported 75 instructional minutes
whereas the high-SES schools indicated 73 minutes per week. The grade 5 Mathematics
or Science Teacher indicated that the low- and middle-SES schools, on average, both had
78 instructional minutes of physical education. The high-SES schools, however, had 74
instructional minutes per week. In general, lower-SES schools reported a greater
physical education emphasis than higher-SES schools.
102
Table 28 Mean Totals for Low-, Middle-, and High-Socioeconomic Status (SES) Schools
for Academic, Arts, and Physical Education Emphases at Grades 1, 3, and 5
Emphasis Grade
SES
Academic
Arts
Physical Education
1 Low 896 125 70 Middle 860 130 66 High 856 125 63 3 Low 872 98 73 Middle 874 110 70 High 841 112 65 5R Low 1,054 73 79 Middle 1,022 90 75 High 989 97 73 5MS Low 1,034 71 78 Middle 1,010 89 78 High 978 94 74
Findings from the three curricular emphasis variables in regard to public versus
private schools and SES are summarized in Table 29. In the table, the means of
instructional minutes for low-, middle-, and high-SES schools are reported for both
public and private schools. In each grade, public schools, overall, had a greater academic
emphasis than private schools across low-, middle-, and high-SES schools. An arts
emphasis, on average, was greater in private schools than in public schools for low-,
middle-, and high-SES schools in grades 1, 3, and 5. A physical education emphasis in
grades 1 and 3 was greater in low-SES public and private schools. In grade 5, the
Reading Teachers reported that low-SES public schools had a greater physical education
emphasis than high-SES public schools. The Reading Teachers in private schools
reported that middle-SES schools had the lowest physical education emphasis compared
with low- and high-SES schools. The Mathematics or Science Teachers in grade 5 public
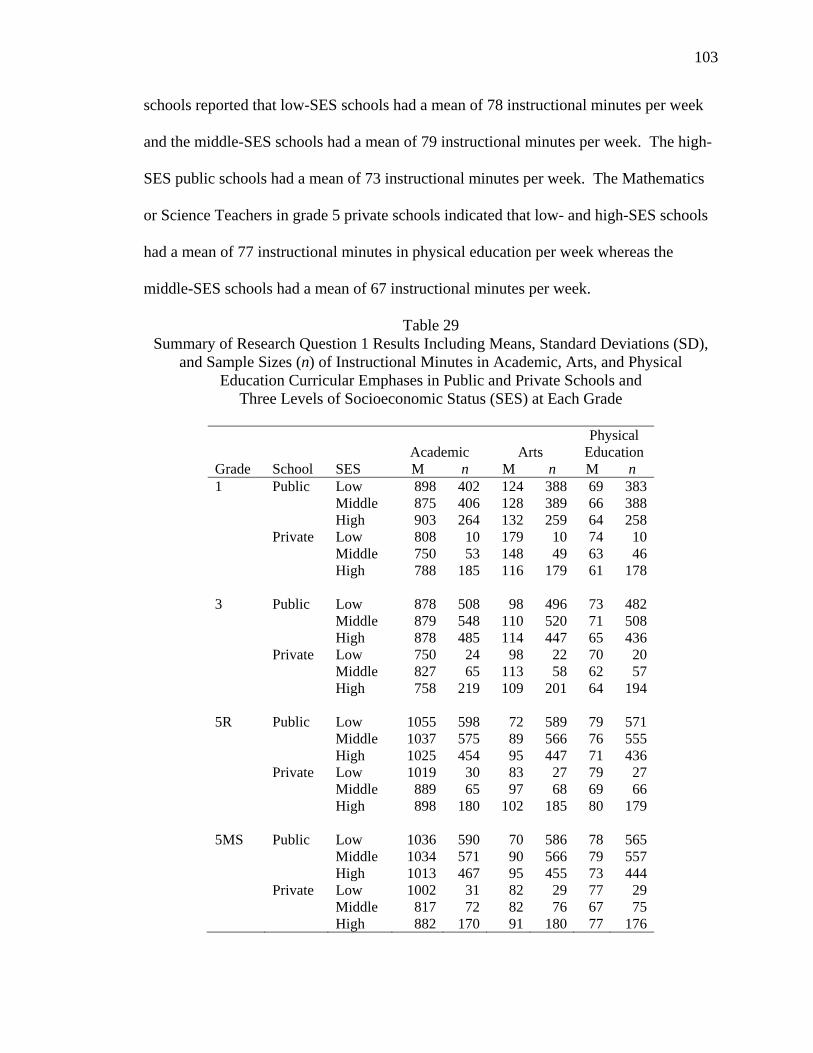
103
schools reported that low-SES schools had a mean of 78 instructional minutes per week
and the middle-SES schools had a mean of 79 instructional minutes per week. The high-
SES public schools had a mean of 73 instructional minutes per week. The Mathematics
or Science Teachers in grade 5 private schools indicated that low- and high-SES schools
had a mean of 77 instructional minutes in physical education per week whereas the
middle-SES schools had a mean of 67 instructional minutes per week.
Table 29 Summary of Research Question 1 Results Including Means, Standard Deviations (SD),
and Sample Sizes (n) of Instructional Minutes in Academic, Arts, and Physical Education Curricular Emphases in Public and Private Schools and
Three Levels of Socioeconomic Status (SES) at Each Grade
Academic
Arts
Physical Education
Grade School SES M n M n M n 1 Public Low 898 402 124 388 69 383 Middle 875 406 128 389 66 388 High 903 264 132 259 64 258 Private Low 808 10 179 10 74 10 Middle 750 53 148 49 63 46 High 788 185 116 179 61 178 3 Public Low 878 508 98 496 73 482 Middle 879 548 110 520 71 508 High 878 485 114 447 65 436 Private Low 750 24 98 22 70 20 Middle 827 65 113 58 62 57 High 758 219 109 201 64 194 5R Public Low 1055 598 72 589 79 571 Middle 1037 575 89 566 76 555 High 1025 454 95 447 71 436 Private Low 1019 30 83 27 79 27 Middle 889 65 97 68 69 66 High 898 180 102 185 80 179 5MS Public Low 1036 590 70 586 78 565 Middle 1034 571 90 566 79 557 High 1013 467 95 455 73 444 Private Low 1002 31 82 29 77 29 Middle 817 72 82 76 67 75 High 882 170 91 180 77 176
104
Results for Research Question 2
Does teacher emphasis in academics and in the arts predict student achievement in
reading and mathematics in public and private schools and in low-, middle-, and high-
SES schools in grades 1, 3, and 5? To address this question, the teacher-level data set
was used. The intercorrelation matrix is reported first, then two multiple regressions at
each grade level were conducted. Reading and mathematics achievement were each
regressed onto the curricular emphasis variables, two control variables (student SES and
ability), and dummy variables for public versus private schools and school SES. The
dummy variables for public or private schools and school SES are, in effect, control
variables as well. These regressions, therefore, examine the relationships of the three
curricular emphasis variables to reading or mathematics achievement controlling for
public or private schools, school SES, student ability, and student SES. The regression
coefficients, the standard errors, and the beta weights are reported for each regression.
Attention in each of the regressions is directed at the three curricular emphasis variables.
Grade 1
Public or private school was statistically significantly correlated to all variables
except arts and physical education emphases as shown in Table 30. SES was statistically
significant and highly correlated to curricular emphases. Correlations greater than .04
were statistically significant at the .05 level.

105
Tab
le 3
0 In
terc
orre
lati
on M
atri
x of
8 V
aria
bles
and
Rea
ding
and
M
athe
mat
ics
Ach
ieve
men
t at G
rade
1 (
N=
2,96
7)

106
The Grade 1 regression results in Table 31 show all variables except arts and
physical education emphases as statistically significant for reading achievement. Student
SES and ability had the largest beta weights. School SES, both middle and high, were
statistically significant. None of the three emphases reported statistically significance
based on the beta weights and standard error.
Table 31 Regression Coefficients (B), Standard Errors (SE), and Beta Weights (
for Reading and Mathematics Regressions in Grade 1
Variable SE Reading
PubPriv -2.18 0.88 -0.04* Student SES 7.10 0.51 0.28* Ability 1.12 0.05 0.38* School SES middle 1.64 0.67 0.05* School SES high 2.00 0.87 0.06* Academic <0.01 <0.01 0.03* Arts -0.01 <0.01 -0.03 Physical Education 0.00 0.01 0.01 R 0.63 R2 0.39
Mathematics PubPriv -0.20 0.63 -0.01 Student SES 3.68 0.37 0.19* Ability 1.11 0.04 0.50* School SES middle 1.00 0.49 0.04* School SES high 1.31 0.62 0.05* Academic <0.01 <0.01 0.04* Arts <-0.01 <0.01 -0.03 Physical Education 0.02 <0.01 0.07* R 0.66 R2 0.44
SES was statistically significant at both the student- and school-levels in regard to
mathematics achievement as shown in Table 31. Academic and physical education
emphases were also statistically significant for mathematics achievement.
107
Grade 3
The results in grade 3 were similar with grade 1 results in that the type of school
was highly correlated to all variables except the arts and physical education emphases as
shown in Table 32. Ability was highly correlated to high-SES schools and student SES.
Ability was also correlated to middle-SES schools, but the correlation was not as high as
with the other SES variables. There was a high correlation with the academic and arts
emphases variables. Correlations greater than .05 were statistically significant at the .05
level.
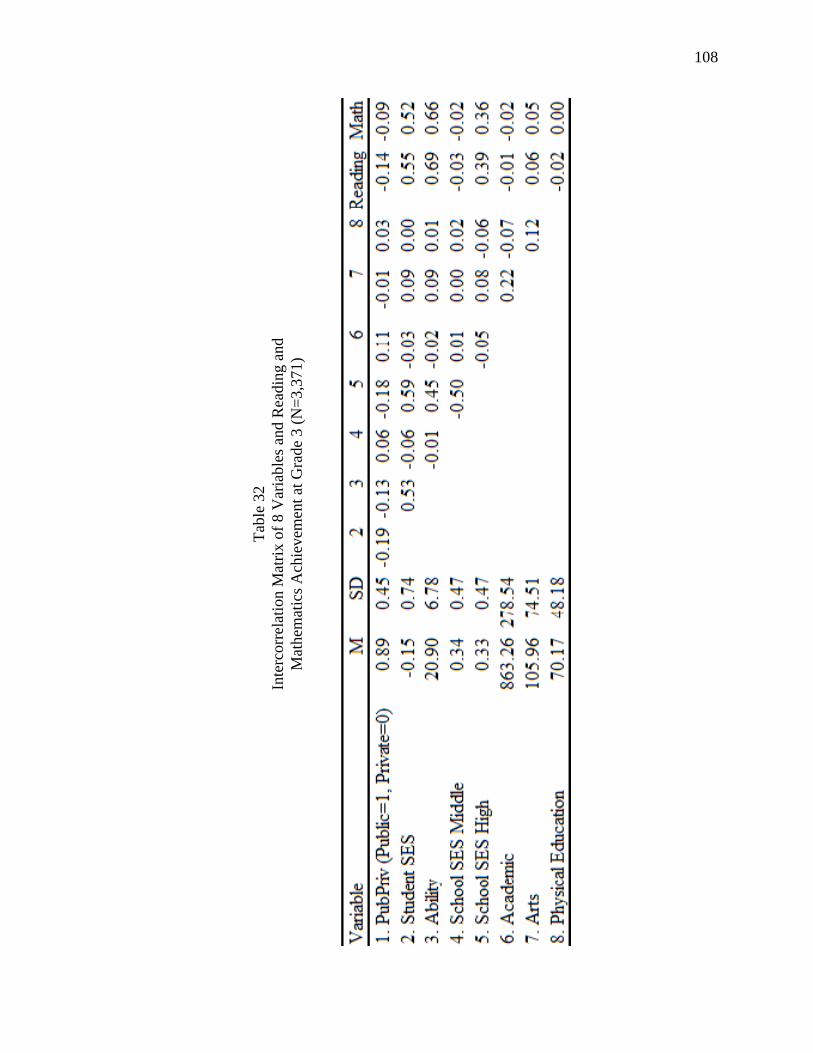
108
Tab
le 3
2 In
terc
orre
lati
on M
atri
x of
8 V
aria
bles
and
Rea
ding
and
M
athe
mat
ics
Ach
ieve
men
t at G
rade
3 (
N=
3,37
1)
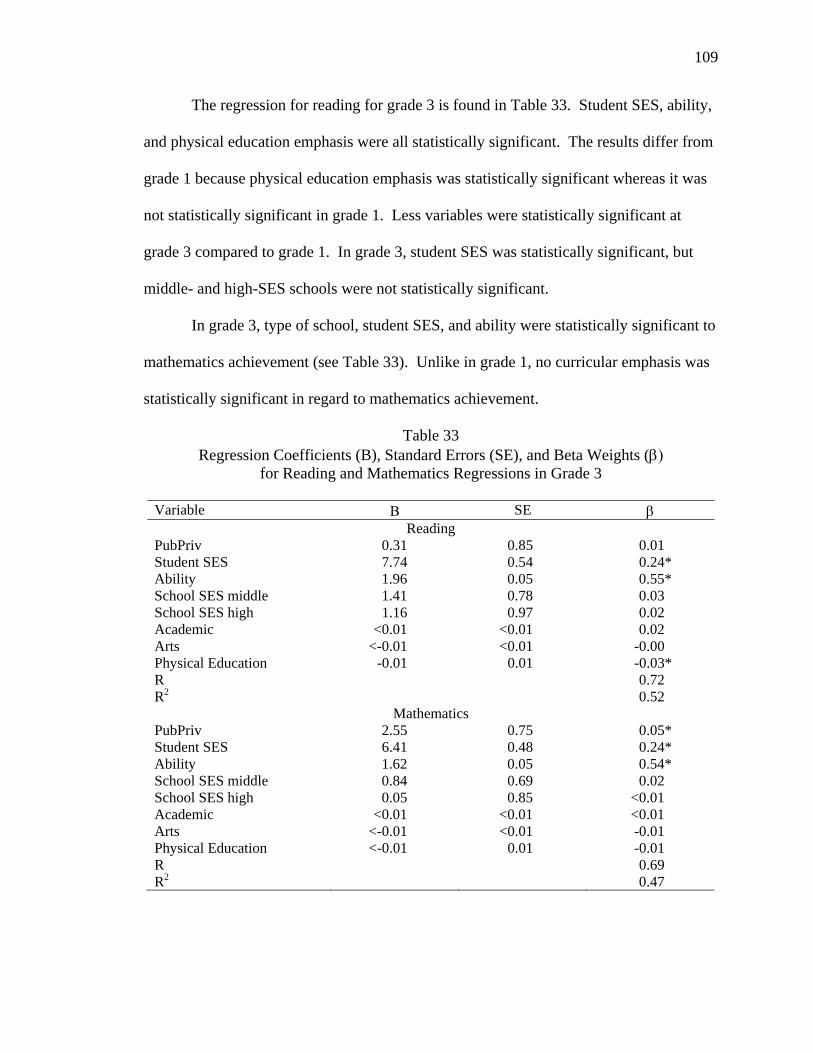
109
The regression for reading for grade 3 is found in Table 33. Student SES, ability,
and physical education emphasis were all statistically significant. The results differ from
grade 1 because physical education emphasis was statistically significant whereas it was
not statistically significant in grade 1. Less variables were statistically significant at
grade 3 compared to grade 1. In grade 3, student SES was statistically significant, but
middle- and high-SES schools were not statistically significant.
In grade 3, type of school, student SES, and ability were statistically significant to
mathematics achievement (see Table 33). Unlike in grade 1, no curricular emphasis was
statistically significant in regard to mathematics achievement.
Table 33 Regression Coefficients (B), Standard Errors (SE), and Beta Weights (
for Reading and Mathematics Regressions in Grade 3
Variable SE Reading
PubPriv 0.31 0.85 0.01 Student SES 7.74 0.54 0.24* Ability 1.96 0.05 0.55* School SES middle 1.41 0.78 0.03 School SES high 1.16 0.97 0.02 Academic <0.01 <0.01 0.02 Arts <-0.01 <0.01 -0.00 Physical Education -0.01 0.01 -0.03* R 0.72 R2 0.52
Mathematics PubPriv 2.55 0.75 0.05* Student SES 6.41 0.48 0.24* Ability 1.62 0.05 0.54* School SES middle 0.84 0.69 0.02 School SES high 0.05 0.85 <0.01 Academic <0.01 <0.01 <0.01 Arts <-0.01 <0.01 -0.01 Physical Education <-0.01 0.01 -0.01 R 0.69 R2 0.47
110
Grade 5: Reading Teacher
The type of school and student SES were correlated with several variables
according the grade 5 reading teacher results in Table 34. The academic and the arts
emphases were correlated higher with each other than with other variables. Correlations
greater than .05 are statistically significant at the .05 level.
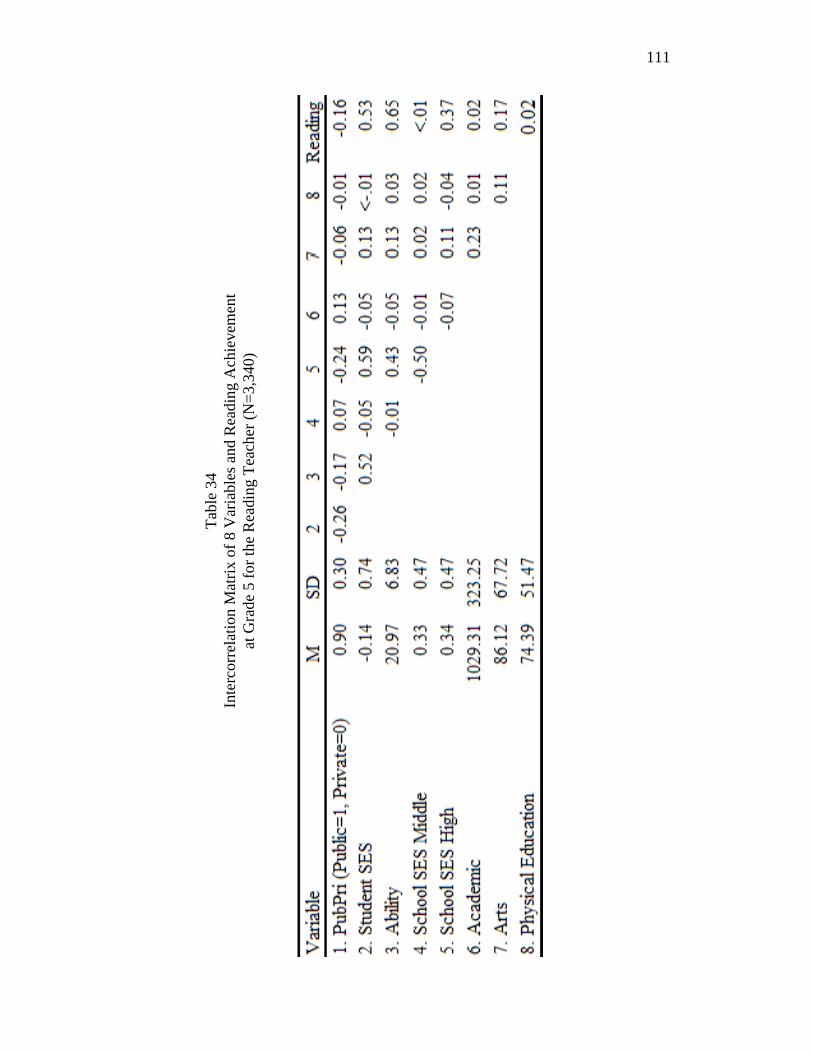
111
Tab
le 3
4 In
terc
orre
lati
on M
atri
x of
8 V
aria
bles
and
Rea
ding
Ach
ieve
men
t at
Gra
de 5
for
the
Rea
ding
Tea
cher
(N
=3,
340)
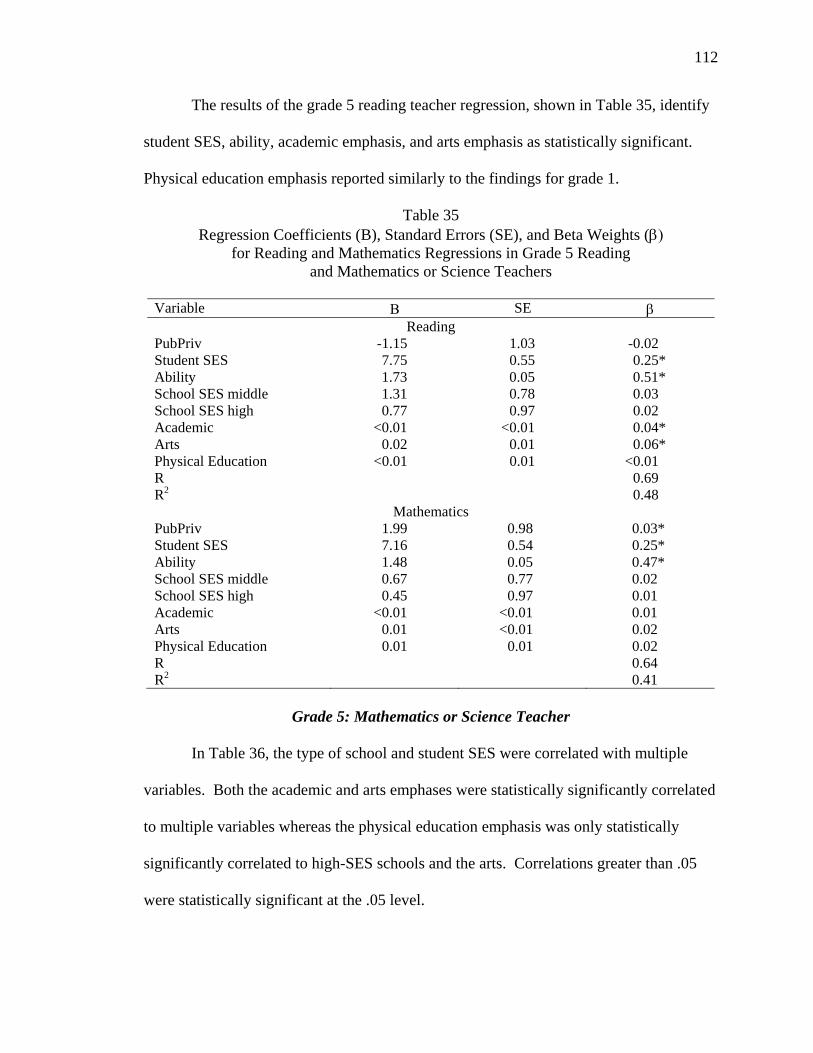
112
The results of the grade 5 reading teacher regression, shown in Table 35, identify
student SES, ability, academic emphasis, and arts emphasis as statistically significant.
Physical education emphasis reported similarly to the findings for grade 1.
Table 35 Regression Coefficients (B), Standard Errors (SE), and Beta Weights (
for Reading and Mathematics Regressions in Grade 5 Reading and Mathematics or Science Teachers
Variable SE
Reading PubPriv -1.15 1.03 -0.02 Student SES 7.75 0.55 0.25* Ability 1.73 0.05 0.51* School SES middle 1.31 0.78 0.03 School SES high 0.77 0.97 0.02 Academic <0.01 <0.01 0.04* Arts 0.02 0.01 0.06* Physical Education <0.01 0.01 <0.01 R 0.69 R2 0.48
Mathematics PubPriv 1.99 0.98 0.03* Student SES 7.16 0.54 0.25* Ability 1.48 0.05 0.47* School SES middle 0.67 0.77 0.02 School SES high 0.45 0.97 0.01 Academic <0.01 <0.01 0.01 Arts 0.01 <0.01 0.02 Physical Education 0.01 0.01 0.02 R 0.64 R2 0.41
Grade 5: Mathematics or Science Teacher
In Table 36, the type of school and student SES were correlated with multiple
variables. Both the academic and arts emphases were statistically significantly correlated
to multiple variables whereas the physical education emphasis was only statistically
significantly correlated to high-SES schools and the arts. Correlations greater than .05
were statistically significant at the .05 level.
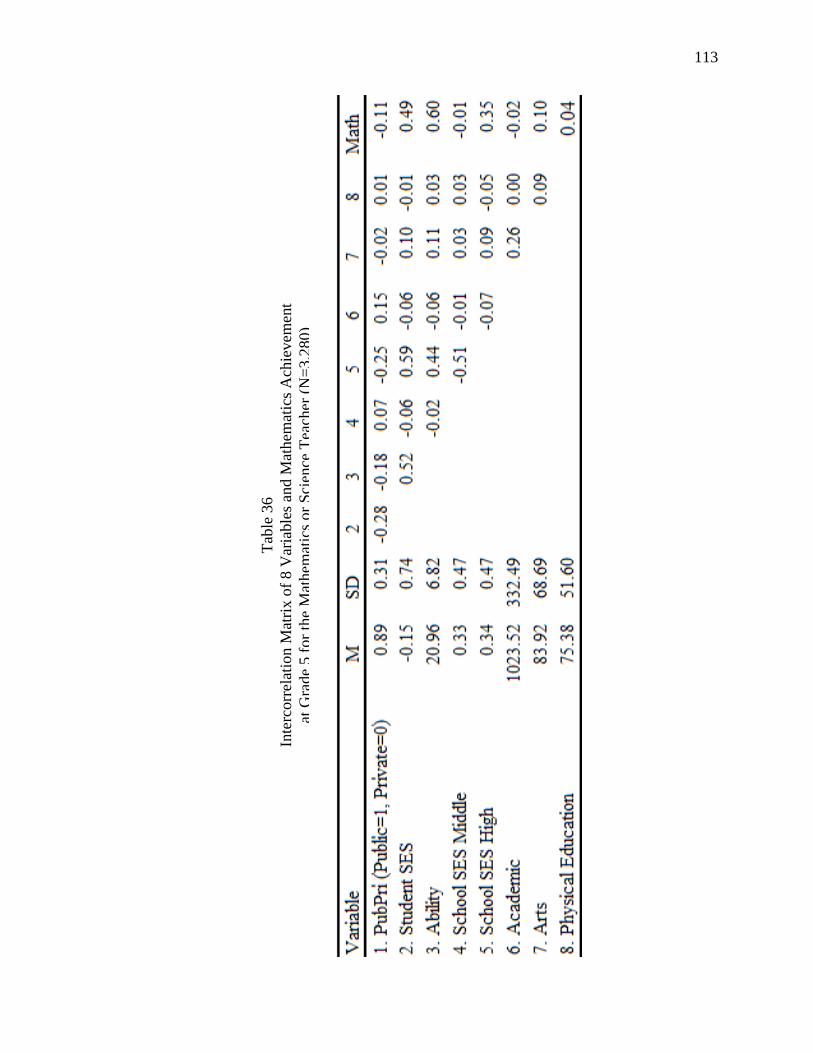
113
Tab
le 3
6 In
terc
orre
lati
on M
atri
x of
8 V
aria
bles
and
Mat
hem
atic
s A
chie
vem
ent
atG
rade
5fo
rth
eM
athe
mat
ics
orS
cien
ceT
each
er(N
=3,
280)

114
The grade 5 mathematics or science teacher regression in Table 36 shows that
student SES and ability are statistically significant. Student SES and ability reported
similarly across grades 1, 3, and 5 in terms of statistical significance. The high-SES
schools dummy variable significance-level was much different from both grades 1 and 3.
Grade 1, 3, and 5: Comparisons
A summary of the multiple regression analyses predicting reading achievement at
grades 1, 3, and 5 is shown in Table 37. Only the beta weights are shown, and attention
is directed to the three curricular emphasis variables. For the overall regressions at
grades 1, 3, and 5, a shared variance of 40% to 52% between reading achievement and
the seven predictors was found. Academic emphasis was statistically significant for
grades 1 and 5, but not for grade 3. Arts emphasis was statistically significant only at
grade 5. Physical education emphasis was statistically significant at grade 3. For
academic, arts, and physical education emphases, there were no relatively equal
relationships found in grades 1, 3, and 5 to reading achievement.
For grades 1, 3, and 5, reading achievement was regressed onto PubPriv, SES,
ability, School SES middle, School SES high, academic emphasis, arts emphasis, and
physical education emphasis. At grade 1, this regression was statistically significant
(F=237.58, .00) with a multiple R= .63 and R Square=.39. For grade 3, the regression
was statistically significant (F=447.74, .00) with a multiple R=.72 and R Square=.52. In
grade 5, the regression was statistically significant (F=383.95, .00) with multiple R=.69
and R Square=.48.
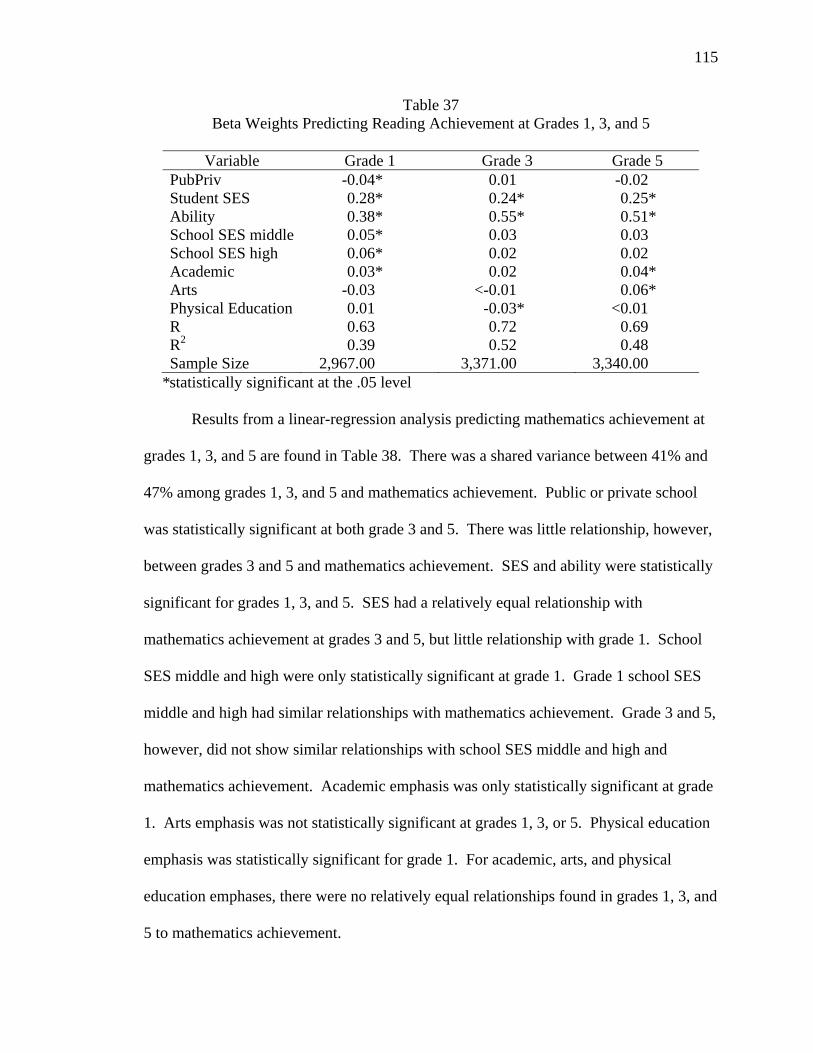
115
Table 37 Beta Weights Predicting Reading Achievement at Grades 1, 3, and 5
Variable Grade 1 Grade 3 Grade 5
PubPriv -0.04* 0.01 -0.02 Student SES 0.28* 0.24* 0.25* Ability 0.38* 0.55* 0.51* School SES middle 0.05* 0.03 0.03 School SES high 0.06* 0.02 0.02 Academic 0.03* 0.02 0.04* Arts -0.03 <-0.01 0.06* Physical Education 0.01 -0.03* <0.01 R 0.63 0.72 0.69 R2 0.39 0.52 0.48 Sample Size 2,967.00 3,371.00 3,340.00
*statistically significant at the .05 level
Results from a linear-regression analysis predicting mathematics achievement at
grades 1, 3, and 5 are found in Table 38. There was a shared variance between 41% and
47% among grades 1, 3, and 5 and mathematics achievement. Public or private school
was statistically significant at both grade 3 and 5. There was little relationship, however,
between grades 3 and 5 and mathematics achievement. SES and ability were statistically
significant for grades 1, 3, and 5. SES had a relatively equal relationship with
mathematics achievement at grades 3 and 5, but little relationship with grade 1. School
SES middle and high were only statistically significant at grade 1. Grade 1 school SES
middle and high had similar relationships with mathematics achievement. Grade 3 and 5,
however, did not show similar relationships with school SES middle and high and
mathematics achievement. Academic emphasis was only statistically significant at grade
1. Arts emphasis was not statistically significant at grades 1, 3, or 5. Physical education
emphasis was statistically significant for grade 1. For academic, arts, and physical
education emphases, there were no relatively equal relationships found in grades 1, 3, and
5 to mathematics achievement.
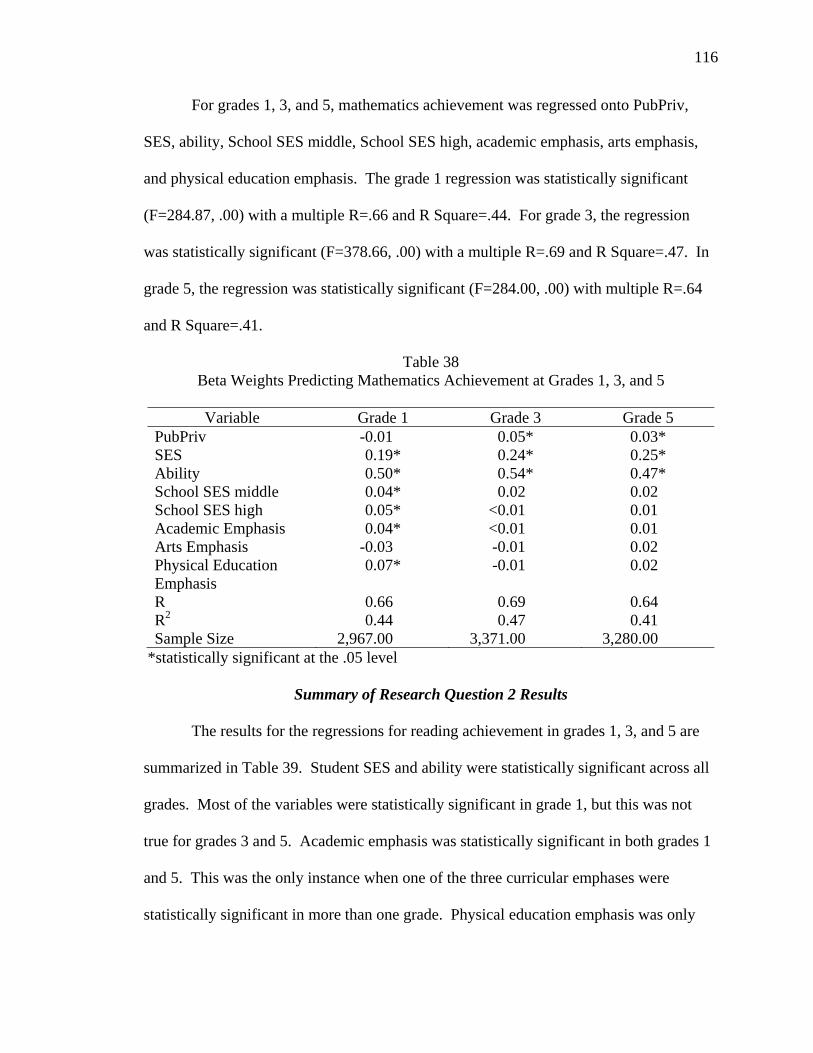
116
For grades 1, 3, and 5, mathematics achievement was regressed onto PubPriv,
SES, ability, School SES middle, School SES high, academic emphasis, arts emphasis,
and physical education emphasis. The grade 1 regression was statistically significant
(F=284.87, .00) with a multiple R=.66 and R Square=.44. For grade 3, the regression
was statistically significant (F=378.66, .00) with a multiple R=.69 and R Square=.47. In
grade 5, the regression was statistically significant (F=284.00, .00) with multiple R=.64
and R Square=.41.
Table 38 Beta Weights Predicting Mathematics Achievement at Grades 1, 3, and 5
Variable Grade 1 Grade 3 Grade 5
PubPriv -0.01 0.05* 0.03* SES 0.19* 0.24* 0.25* Ability 0.50* 0.54* 0.47* School SES middle 0.04* 0.02 0.02 School SES high 0.05* <0.01 0.01 Academic Emphasis 0.04* <0.01 0.01 Arts Emphasis -0.03 -0.01 0.02 Physical Education Emphasis
0.07* -0.01 0.02
R 0.66 0.69 0.64 R2 0.44 0.47 0.41 Sample Size 2,967.00 3,371.00 3,280.00
*statistically significant at the .05 level
Summary of Research Question 2 Results
The results for the regressions for reading achievement in grades 1, 3, and 5 are
summarized in Table 39. Student SES and ability were statistically significant across all
grades. Most of the variables were statistically significant in grade 1, but this was not
true for grades 3 and 5. Academic emphasis was statistically significant in both grades 1
and 5. This was the only instance when one of the three curricular emphases were
statistically significant in more than one grade. Physical education emphasis was only

117
statistically significant in grade 3. The arts emphasis was only statistically significant in
grade 5.
Table 39 Summary of Research Question 2 Results for Reading Achievement
Variable Grade 1 Grade 3 Grade 5 PubPriv -0.04* 0.01 -0.02 Student SES 0.28* 0.24* 0.25* Ability 0.38* 0.55* 0.51* School SES middle 0.05* 0.03 0.03 School SES high 0.06* 0.02 0.02 Academic 0.03* 0.02 0.04* Arts -0.03 <0.01 0.06* Physical Education 0.01 -0.03* <0.01 R 0.63 0.72 0.69 R2 0.39 0.52 0.48
*p<.05 Table 40 summarizes the results for the regressions for mathematics achievement
in grades 1, 3, and 5. Similar to the regressions with reading achievement, grade 1 was
statistically significant with more variables than in grades 1 and 5. The only reports of
statistical significance with the three curricular emphasis variables was found in grade 1
for both academic and physical education emphases.
Table 40 Summary of Research Question 2 Results for Mathematics Achievement
Variable Grade 1 Grade 3 Grade 5 PubPriv -0.01 0.05* 0.03* Student SES 0.19* 0.24* 0.25* Ability 0.50* 0.54* 0.47* School SES middle 0.04* 0.02 0.02 School SES high 0.05* <0.01 0.01 Academic 0.04* <0.01 0.01 Arts -0.03 -0.01 0.02 Physical Education 0.07* -0.01 0.02 R 0.66 0.69 0.64 R2 0.44 0.47 0.41
*p<.05
118
Summary of Results
There were two research questions that were investigated in this dissertation. The
first research question was if there were differences in teacher emphasis in academic
versus the arts between public and private school and between low-, middle-, and high-
SES schools in grades 1, 3, and 5. Descriptive statistics such as means, standard
deviations, sample sizes, were used to address the research question at grades 1, 3, and 5.
The results were presented based on academic, arts, and physical education emphasis for
each grade. Type of school and SES were analyzed for each grade and emphases.
The results for academic emphasis indicated that the type of school, public or
private, showed greater academic emphasis at each grade, on average, in public schools.
SES was not related to academic emphasis at either grades 1 or 3, but it was related to
academic emphasis in grade 5 according to both the reading and mathematics or science
teachers. In grade 5 for both public and privates schools, higher SES resulted in less
academic emphasis.
The arts emphasis results were not consistent across all grades. In grade 1, public
schools, on average, reported greater arts emphasis than private schools. For grades 3
and 5, no relationship between the type of school and arts emphasis was found. SES did
have an effect on arts emphasis for grades 1 and 5, but not for grade 3. SES, however,
did not indicate the same results for grades 1 and 5. In grade 1 public schools, high-SES
schools, on average, had greater arts emphasis. In private schools, however, low-SES
schools had more of an arts emphasis. The reading and mathematics or science teacher
results in grade 5 reported the same results for public schools, but different results than in
119
private schools for grade 1. In grade 5, high-SES had greater arts emphasis, on average,
in private schools.
An emphasis in physical education did not have any relations across all three
grades. As students moved up in the grades, they received more physical education
emphasis, but the emphasis, on average, was still less than an academic or arts emphasis.
The second research question explored if there were relations between teacher
emphasis in academics and in the arts and student achievement in reading and
mathematics in public and private schools and in low-, middle-, and high-SES schools in
grades 1, 3, and 5. To answer this question, correlations and linear-regression analyses
were done to analyze the data at each grade.
The results for research question two reported that none of the three emphases
were statistically significant across grades 1, 3, and 5 for predicting reading or
mathematics achievement or both. Academic emphasis was statistically significant in
grades 1 and 5 for reading achievement, but only in grade 1 for mathematics
achievement. Arts emphasis was only statistically significant in grade 5 for reading
achievement. Physical education emphasis was statistically significant in grade 3 reading
achievement and grade 1 mathematics achievement. Student or school-SES were
statistically significant for reading or mathematics achievement or both in grades 1, 3,
and 5. Type of school was statistically significant for reading achievement in grade 1 and
statistically significant for mathematics achievement in grades 3 and 5.
120
CHAPTER V
SUMMARY, LIMITATIONS, DISCUSSION, AND IMPLICATIONS
The study had two purposes. First, the study investigated if there are differences
in academic, arts, and physical education emphases in grades 1, 3, and 5. Differences in
low-, middle-, and high-socioeconomic status (SES) schools and public versus private
schools were at the center of the study. Second, the study examined if teacher emphasis
in academic, arts, or physical education predicted student reading or mathematics
achievement in grades 1, 3, and 5.
Chapter V includes six sections. The first section is a summary of the study. The
summary section outlines the problem, theoretical rationale, methodology, and research
questions of the study. The second section is a summary of the study’s findings. The
third section of this chapter discusses the study’s limitations. The fourth section is a
discussion of findings. In this section, links are made from this study to other research
that is currently available. Consistencies and inconsistencies that emerged in this study
compared to other available research are also discussed. The fifth section reports
implications for future research. The sixth section includes implications for practice.
Summary of Study
Accountability is at the center of a standards-based education. Ravitch (2010)
argued that there was a shift in 1995 from a standards-based movement to an
accountability movement. In this shift, a focus on the measurement of student
achievement was underscored. Although, perhaps, not its original intention, A Nation at
Risk (1983) highlighted the standards-based movement and guided accountability in
schools as school reform unfolded. A Nation at Risk (1983), therefore, remains the

121
foundation for which accountability in schools was created and emphasized on a national
magnitude. Because of A Nation at Risk, national policy reform efforts, such as the push
for voluntary national standards in 1991 and 1992, the Clinton administration’s Goals
2000 program, No Child Left Behind Act (NCLB) of 2001, Race to the Top of 2009, and
the Common Core State Standards (CCSS) have precipitated into test-based
accountability in schools (Ravitch, 2010). There were at least three main outcomes,
therefore, that transpired from A Nation at Risk that underpinned this study. First, there is
greater accountability in schools (Darling-Hammond, 2007; Diamond, 2012; Dorner,
Spillane, & Pustejovsky, 2011). Second, schools follow a narrowed curriculum (Darling-
Hammond, 2007; Spohn, 2008). Third, there is not enough time in school for the arts
(Darling-Hammond, 2010; Spohn, 2008).
The first main outcome was that as schools become increasingly tied to the
measurement of student achievement, greater accountability in schools becomes
omnipresent (Darling-Hammond, 2010; Ravitch, 2010). California adopted the Common
Core State Standards (CCSS) in August of 2010. The CCSS extends accountability in
schools from a state- to national-level of an accountability system. Today, 46 states have
adopted the CCSS. The District of Columbia, Northern Mariana Islands, and the U.S.
Virgin Islands have also adopted the standards (Common Core State Standards Initiative,
2012).
The second main outcome was that despite possible efforts that some schools
make to include the arts, schools follow a narrowed curriculum (Darling-Hammond,
2007; Spohn, 2008). At the state level, there are Common Core Standards in English
language arts and mathematics as well as state standards for each additional academic

122
content area. Only ELA and mathematics, however, are assessed at the state-level. For
the CCSS, there is a national-level standard and it is tested using a nationally-developed
test. At the current time, the arts are neither part of the CCSS nor are the arts currently
tested at the state level.
The third main outcome of A Nation at Risk is that there is not enough time in
school for the arts (Darling-Hammond, 2010; Spohn, 2008). The instructional time spent
on the tested areas, such as reading and mathematics, which are included in the CCSS for
a national-level comparison, result in no pressure to spend instructional time on areas that
are not tested. Ravitch (2010) argued that individual states craft their own state standards
and devise their own method of accountability and, therefore, the curriculum and amount
of time in specific content areas of the curriculum can vary vastly between states. This
suggests that some states may have more or less arts in their school depending on the
state’s accountability system. The CCSS presents a shift in focus from a state to a
national accountability system. Researchers (President’s Committee on the Arts and the
Humanities, 2011; Ravitch, 2010) note, however, that many states already hold greater
instructional minutes in English language arts and mathematics because the states use
these content areas for their state test-based accountability systems.
Greater accountability in schools, therefore, is the overall outcome from A Nation
at Risk and the root of the problem in educational reform. Research (Darling-Hammond,
2007; Diamond, 2012; Lee & Reeves, 2012) suggests that not all schools are equally
affected by accountability. Two factors that may moderate arts education in this era of
accountability in schools are socioeconomic status (SES) and the type of school (i.e.,
public or private). Schools with higher SES and private schools may be affected by
123
accountability differently than schools with lower SES and public schools. These factors
and subsequent differences in curricular emphasis within schools underscores why the
problem is important and timely in a standard-based education.
The World Development Report 2004 was the theoretical underpinnings of this
study. This report outlined an accountability framework, but fell short of connecting
accountability to the standards-based education aspect that this study addressed as it
focused primarily on accountability in business. The accountability framework,
therefore, was then adapted to address accountability in a standards-based education.
Dorner et al. (2011) stated that it is the role of the policymakers and oversight
teams or members in the school system to drive the curricular emphasis. The government
has oversight in public schools. The amount of oversight a public school has depends on
schools meeting standards via student test scores. In a private school, however, it
depends on the stakeholders involved as to how the curricular decisions are mandated and
enforced. For instance, if the private school is a Roman Catholic school, then the diocese
may direct curricular decisions. If the private school is a parent cooperative, then the
parents may be involved in curricular decisions. The accountability and a teacher’s
curricular emphasis, therefore, may differ in public versus private schools for a host of
reasons. The World Development Report 2004 was used as the theoretical underpinning
to investigate the relationships within curricular decision-making, especially in terms of
curricular emphasis in schools in public and private schools across students from low,
middle, and high socioeconomic status families.
There were two purposes of this study. The first purpose was to examine
differences and similarities in curricular emphasis between public and private schools and

124
socioeconomic status (SES) in grades 1, 3, and 5. The second purpose was to investigate
if curricular emphasis in academic, arts, or physical education could predict student
academic achievement in reading and mathematics.
This secondary data analysis study used data from the Early Childhood
Longitudinal Study, Kindergarten Class of 1998-1999 (ECLS-K) conducted by NCES
from 1998 until 2007. ECLS-K is a longitudinal study that followed the same children
from kindergarten through eighth grade. The ECLS-K data set includes responses from
administrator, teacher, and parent questionnaires. Student academic achievement scores
in reading and mathematics were also included in the ECLS-K data. The ECLS-K data
also includes responses from a facilities checklist. Data that were collected from the
1998-1999 school year to the 2003-2004 school years were used in this dissertation
because the analysis examined data at grades 1, 3, and 5 and used the kindergarten
general knowledge IRT score as an ability measure. From the teacher questionnaires,
curricular emphasis variables were created to examine the total instructional minutes per
week for academic, arts, and physical education. Descriptive statistics were used to
identify similarities and differences in curricular emphasis between public and private
schools and low-, middle-, and high-socioeconomic status (SES). SES was explored at
both the student- and school-levels in regard to curricular emphasis and student
achievement in reading and mathematics. Multiple regressions were used to investigate
if curricular emphasis and SES could predict student academic achievement in reading
and mathematics.
125
Summary of Findings
There were four main findings from this dissertation. First, public and private
schools were statistically significant at each grade, but not statistically significant for
both reading and mathematics achievement at each grade. In grade 1, the type of school
made a statistically significant difference in reading achievement, but not in mathematics
achievement. In grades 3 and 5, however, the results indicated that type of school made a
statistically significant difference in mathematics achievement and not in reading
achievement.
Second, there were differences in SES. Results for low-, middle-, and high-SES
were not consistently at each grade. While lower-SES schools had greater academic
emphasis in grade 1, this was not true in grades 3 and 5. In grade 5, low-SES schools had
greater academic emphasis in both public and private schools than higher-SES schools.
Other differences in SES were indicated in regard to an arts emphasis. In grades 1 and 3,
public schools with high SES, on average, had greater arts emphasis than low-SES
schools. For private schools in grade 1, however, schools with low SES, on average, had
greater arts emphasis than high-SES schools. In grade 5, public and private schools
indicated greater arts emphasis, on average, in schools with high SES compared to
schools with lower SES. In grade 5, however, both public and private low-SES schools,
on average, spent less time on the arts compared to grades 1 and 3. Low-SES schools in
grade 5 public and private schools had less of an arts emphasis than higher-SES schools
in grade 5. Low-SES schools, in general, also had a physical education emphasis in
grades 1, 3, and 5 with little differences between low-, middle-, and high-SES.
126
Third, findings in regard to curricular emphasis and student academic
achievement may provide a foundation for future, large-scale research. Academic, arts,
and physical education emphases did not predict reading and mathematics achievement in
any grade. Cross-sectionally, however, there were some unexpected similarities and
differences between the three emphases. A greater amount of emphasis was reported on
academics, on average, compared to both arts and physical education. It was surprising
to see that even with a greater emphasis in academics that the emphasis on academics did
not translate to higher achievement in reading and mathematics for each grade.
Academic emphasis only predicted reading and mathematics achievement in grade 1 and
in grade 5 reading. An arts emphasis, on average, predicted reading achievement in
grade 5. The descriptive statistics noted a decreased emphasis in the arts as the grade-
level increased, but the finding provided evidence that an arts emphasis in older grades
increased reading achievement. There is no large-scale quantitative evidence of this
finding outside of the current dissertation.
A physical education emphasis and student academic achievement showed
promise in learning and instruction. Despite little difference between low-, middle-, and
high-SES schools, there was more of a physical education emphasis, on average, in
private schools compared to the public schools across grades 1, 3, and 5. There was very
little change in the amount of physical education emphasis from third- to fifth-grade,
physical education emphasis. With the little differences in physical education emphasis
across the grades, it was unexpected that a physical education emphasis would predict
achievement. A physical education emphasis predicted mathematics achievement in
127
grade 1 and reading achievement in grade 3, although the findings should be read with
caution due to small sample sizes in the private schools data.
Fourth, there were patterns in curricular emphasis that emerged in each grade.
Public and private schools indicated the same patterns of instructional emphasis across
grades 1, 3, and 5. Among academic, arts, and physical education emphases, arts
emphasis was the only one to decrease steadily over grades 1, 3, and 5. Academic
emphasis slightly decreased from grade 1 to grade 3, but increased from grade 3 to grade
5. Physical education emphasis, however, increased across the grades.
Limitations
There are four limitations to the study. One limitation to the study was that it
used an available set of questionnaires and subsequent questionnaire responses. The
definition of curricular emphasis, SES, other variables for this study were limited to the
items available in the ECLS-K questionnaires. Because the ECLS-K questionnaires were
not designed with this specific study’s research questions in mind, the questionnaires
were not focused on arts education. Among the many items included in the
questionnaire, items that were considered closely related to the arts were selected for use
in the study. How often a teacher included music in the curriculum, for example, is an
item that was selected because of its direct relationship to the study’s research questions.
The scales used in the selected items, however, were not necessarily conducive to
answering the research questions. The study, therefore, created new scales for the
selected items. Because the questionnaires were not created with the intent to study arts
education, the items were rescaled to best describe the phenomenon that was explored. In
some instances, multiple questionnaire items were combined to study a particular
128
research question as individual questionnaire items did not provide a complete picture.
Curricular emphasis, for example, used multiple questionnaire items because there was
not one item that adequately measured this phenomenon. Future studies that explore arts
education, specifically curricular emphasis and do not use ECLS-K data should remain
aware of how the definitions were created and interpreted in this study.
A second limitation was that the questionnaires relied on self-reported data, with
the exception of the facilities checklist. Respondents answered the questionnaire items
based on their self-perceptions of their teaching. Similarly, respondents may have been
influenced to respond to the questionnaires items in a certain way based on professional
beliefs. Mathematics, for example, may have received higher instructional minutes in the
questionnaire because the respondent’s school district or school site focused on
mathematics and the respondent wanted his or her answers to align with their district or
school’s emphasis; even if this emphasis was not aligned with their particular emphasis in
their classroom.
A third limitation to the study was that teachers’ curricular interest and outside
influences (such as the home environment) for student achievement and engagement in
the arts were not investigated. It is unclear, therefore, if curricular interest has any
connection to a teacher’s response to curricular emphasis or if outside influences effected
student achievement. A teacher or parent with a strong interest in the visual arts may
respond differently engagement in the arts whether at school or at home. Attending
museums, private music lessons, an inherent interest in the arts, or a family who actively
seeks out arts-based experiences may have implications on student achievement that are
outside the scope of this study.
129
A fourth limitation to the study was that the data file used was intended for
longitudinal analysis. The data file included weights for longitudinal analysis and not for
cross-sectional analysis. The results, therefore, were based on unweighted data at each
grade. The data file was used for this study because it provided an opportunity to
examine curricular emphasis with large sample sizes at each grade. Large sample sizes
with quantified data are uncommon in arts education research. The use of the data file,
therefore, for descriptive data analysis and discussion of curricular trends adds to the
available arts education research despite the limitation of using a data file intended for
longitudinal research.
Discussion of Findings
There were four main findings from this dissertation. First, public and private
schools were statistically significant at each grade, but not statistically significant for
both reading and mathematics achievement at each grade. Second, there were differences
in low-, middle-, and high-SES schools at each grade. Third, academic, arts, and physical
education emphases did not predict both reading and mathematics achievement in grade
1, 3, or 5. Fourth, there were patterns in curricular emphasis that emerged in each grade.
An inconsistency that unfolded from the dissertation compared with other
research (Wilkins, Graham, Parker, Westfall, Fraser, & Tembo, 2003) was that an
emphasis in the arts or physical education may influence student achievement scores.
Wilkins et al. (2003) found from a sample of 547 Virginia elementary school principal
reports that a reduction in instructional minutes in the arts and physical education did not
relate to higher student achievement scores. This dissertation used a national probability
sample that showed an emphasis in either the arts or physical education were related to

130
higher student academic achievement at certain grades. An arts emphasis, for instance,
increased student academic achievement in grade 5. Although the physical education
emphasis was not statistically significant at any grade in terms of type of school and SES
in the dissertation, physical education was statistically significant in predicting reading
achievement in grade 3 and mathematics achievement in grade 1.
Other research (Dorner et al., 2011; Keigher, 2009) suggested that the type of
school effects instructional minutes in content areas. Although the type of school may
influence instructional minutes, there were no clear consistencies with the available
research except where academic received the most instructional time (Darling-Hammond,
2010; Lee & Reeves, 2012; Schmidt et al., 2011; Spohn, 2008). More specifically,
reading and mathematics instruction both in the dissertation and other research (Crocco &
Costigan, 2007; Lee & Reeves, 2012; Spohn, 2008) received the most emphasis
compared with the other parts of the curriculum like the arts or physical education. The
dissertation results showed that academic emphasis received the most instructional time,
followed by the arts and physical education.
A finding was that academics, the arts, and physical education had sizeable
differences in instructional minutes at each grade, but all grades reported the greatest
amount of emphasis on academics. The second emphasis with the most instructional
minutes was the arts. An emphasis in physical education reported the least amount of
instructional minutes across all grades. This main finding was not surprising as it is well-
documented in various scholarly works that academics receive the most instructional
minutes in a typical school day (Crocco & Costigan, 2007; Darling-Hammond, 2007;
Darling-Hammond, 2010). Some have referred to the focus on academics as the
131
narrowing of the curriculum (Crocco & Costigan, 2007; Darling-Hammond, 2010;
Diamond, 2012; Dorner et al., 2011; Spohn, 2008). Diamond (2012) and Dorner et al.
(2011) suggested that schools are focused on the academic areas, such as reading and
mathematics, because these are the content areas that are used for accountability purposes
on state assessments.
The results indicated that an arts emphasis receives the second most emphasis
after academics. This finding was a bit surprising even for a national probability sample
because, at least in California (California Department of Education, 2013), there is a
required amount of instructional minutes in physical education whereas instructional
minutes in the arts are not identified. Having the arts receive more emphasis than
physical education provides hope that teachers are independently emphasizing the arts in
their classrooms. As previously noted, the arts emphasis decreased as the grade increased.
Catterall et al. (2012), Darling-Hammond (2007), Diamond (2012), and Schmidt
et al. (2011) all claimed that SES played a role in student learning experiences in schools.
The higher a student was in SES, the greater the opportunity the student had to
experience the arts in their school environment. Similarly, schools with higher SES had
more arts programs available to students. The findings from this dissertation support the
claim that SES plays an important role in access to an arts education. Higher SES
students had more arts in their school learning experiences whereas lower SES students
had fewer arts and a greater emphasis, on average, on academics. The dissertation
findings further the claim with evidence that there are discrepancies in availability of arts
programs not only by SES, but also by type of school. At grade 1, public schools, on
average, had a great arts emphasis than private schools linked to current research on
132
curricular emphasis (Dorner et al., 2011; Keigher, 2009; President’s Committee on the
Arts and the Humanities, 2011). The California Department of Education (2013) shows
how instructional time in the arts, although required, is not specified to a certain amount
of time throughout the school day. Private schools have different stakeholders than
public schools and, therefore, follow a curricular emphasis that aligns with their school’s
particular educational vision (Dorner et al., 2011).
The findings, moreover, indicated that the differences may not solely be based on
SES, but the stakeholders involved in the curricular decision-making process for the type
of school. Public schools, for instance, are required to follow state mandated
instructional minutes. Private schools create their own requirements that may have a
different emphasis based on the type of school (Dorner et al., 2011). The data indicated
these differences in public and private schools because the public schools had
instructional minutes with a smaller standard deviation than the private schools. The
smaller standard deviation suggests that there was less variance among the public school
curriculum. Public schools, on average, reported consistently across the grades in regard
to instructional minutes.
The study’s limitation that it used an available set of questionnaires and
subsequent questionnaire responses from the ECLS-K may not be uncommon in large-
scale research as it related to the findings. Large-scale research requires financial
backing that can be difficult to secure. The definition of curricular emphasis, SES, other
variables, therefore, was limited to the items available in the ECLS-K questionnaires.
Other research (Almarode, 2011; Catterall et al., 2012; Crane, 2010; Huang, 2008) also
used an available set of questionnaires and questionnaire responses, thus, being a

133
limitation in their studies. Similar to the dissertation, the studies that examined frequency
of instruction (Almarode, 2011; Catterall et al., 2012) desired large-sample sizes to
investigate areas that are inundated with small-scale studies. Catterall et al. (2012)
reported that there were differences in SES and engagement in the arts with higher
socioeconomic groups having greater opportunities for engagement. Catterall et al.
(2012) also claimed that there was a link between student engagement in the arts and
student achievement during secondary school. Although the Catterall et al. (2012) used
multiple large-scale data sets to address its research questions, it also stopped short of
using the data to explain and predict student academic achievement during elementary
school. The results of Catterall et al. (2012) and of the dissertation underscore the need
for large-scale research that is specifically designed for arts-based research.
In light of this limitation, the study results indicated that an arts emphasis did not
have a large effect on student academic success regardless of SES at grades 1, 3, and 5.
Differences in public or private schools were also not large. Other research (Keiper et al.,
2009; Kienzl et al., 2006; Parsad & Spiegelman, 2012) used surveys that were designed
specifically for their large-scale research. Unlike the other large-scale research that used
available data, however, these researchers examined broader topics such as the amount of
arts instruction in schools without regard to student academic achievement data. Large-
scale data collection takes financial backing and manpower to conduct the research.
Narrowing the large-scale research to broader topics provided a snapshot of the field, but
lacked details that the other, available data surveyed. Future research that uses large-
scale data may face the same limitation as this study, but funding for the arts at the

134
national level may change as a push for a “well-rounded” education (President’s
Committee on the Arts and the Humanities, 2011) remains present.
A second limitation of the dissertation was that the questionnaires relied on self-
reported data, with the exception of the facilities checklist. The results, therefore, should
be read with caution as teachers may not accurately report information in their responses.
Some respondents, for instance, may have had more or less control over their curricular
emphasis due to school or district guidelines. The teacher, therefore, may self-report data
that aligns with their school or district’s mandates instead of what actually occurred in the
classroom. In arts education, however, the majority of research is qualitative with
teachers using self-reflections and observations (Belliveau, 2006; Grallert, 2009; Hull,
1993; Peebles, 2007). Interviews with administrators, teachers, and students are also
common methods in arts research (Brouillette, 2010; Donahue & Stuart, 2008; Spohn,
2008). Such qualitative measures take greater financial obligations and longer time to
collect and analyze the results. As education evolves into a new era of standards-based
instruction via the Common Core State Standards, policymakers and educators are
looking toward research results that are both timely and relevant to today’s classrooms.
The results of the dissertation provide a springboard for discussions on curricular
emphasis and SES, but stakeholders must interpret the results with caution to bridge its
relevance with their specific context in education.
For this dissertation, self-reported data did provide evidence for some commonly
held beliefs while also indicating other less understood or known possibilities. In this era
of accountability, for instance, schools may find themselves claiming a focus on
academic programs. The dissertation results indicated that academic emphasis was

135
greater than both arts and physical education emphasis. The surprising result from the
self-reported data were that teachers emphasized, on average, the arts more than physical
education. Arts emphasis, however, decreased over time and physical education
emphasis increased over time.
Trends in curricular emphasis changes across grades 1, 3, and 5 possibly relates to
the third limitation to the study. The third limitation was that a teachers’ curricular
interest and outside influences for student achievement and engagement in the arts were
not examined. Teachers’ self-reported data were at the heart of this dissertation. From
the given data, it was not possible to identify whether a teacher showed a preference
toward one curricular area over another area. Future research could examine the parents’
self-reported data to investigate possible connections between student achievement and
engagement in the arts. Other researchers, like Catterall et al. (2012) and Hetland et al.
(2007) centered on engagement in the arts and found that students are engaged in art-
making experiences. Winner and Cooper’s (2000) study was hesitant to claim a link
between studying art and academic achievement. The self-reported data used in this
dissertation may have unintentionally included teacher responses that reflected their
curricular interests. The dissertation results indicated that the arts are a small part of the
school day. Perhaps Winner and Cooper (2000) were correct in claiming that the link
between studying art and academic achievement is not fully possible.
The fourth limitation for this dissertation was that the data file used was intended
for longitudinal analysis and not cross-sectional analysis. In light of this limitation,
descriptive statistics indicated trends in grades 1, 3, and 5 that were mentioned above
about academic emphasis receiving the most instructional minutes compared to both the
136
arts and physical education emphases. Despite the lack of weighted data, the results still
indicated noticeable differences in curricular emphasis and small differences in SES
between public and private schools. Darling-Hammond’s (2007) work suggests that
future research should pay attention to these small differences as they are the key to
educational policy decision-making. As the nation progresses with standards-based
instruction, the ability to hold schools and teachers accountable for student achievement
will remain a central concern and small differences noticed now may have a huge effect
on policy in the future.
Implications for Research
There are many possibilities for future research in regard to the arts in grades 1, 3,
and 5, especially as states continue to adopt the CCSS. As standards-based education
continues to develop, the ways and extent the arts are being fostered in elementary school
may change in the future. The dissertation results indicated that patterns in curricular
emphasis in both public and private schools were similar, thus showing curricular trends
that are not entirely unique to just public or private schools. As research persists in the
area of curriculum integration and content integrity, new directions may emerge in arts
education that are unforeseeable. Advances in technology might also contribute to how
research is conducted and interpreted in the field of arts education. Technology will also
change how the arts are taught and how it is defined. Technology will affect the way we
teach both in the presentation of information and in gaining or practicing new skills. The
advances in digital art, for instance, may change the way that researchers interpret the
implications of the arts on learning and instruction. Digitized music is also a growing
field where possible research may abound and pave new directions for further research.

137
Current knowledge and trends in education and society might be predictors of the
unprecedented directions that future research takes us. The study’s findings can help
guide future research directions. ECLS-K, for example, is currently working on an
updated data file with additional years of collected data. The new data can provide
insights into the implications of the CCSS on areas such as curricular emphasis. The shift
from state standards to a set of national standards may provide future research with data
that is more meaningful to teachers across the nation as it pertains directly to the
standards adopted and implemented in their classrooms.
Future research could use the updated ECLS-K data file to examine curricular
emphasis both cross-sectionally and longitudinally. The addition of the longitudinal
analysis would permit the use of the ECLS-K longitudinal weights with data that are
relatable to the CCSS adoptions that are occurring across the nation.
The study’s findings noted that a greater arts emphasis, on average, did not
translate into higher student academic achievement. The dissertation’s theoretical
underpinning illustrated how greater curricular oversight in schools and classrooms is
based on student academic achievement. High-SES schools with lower student academic
achievement, may receive stricter oversight of curricular decision-making, therefore,
offering less flexibility in curricular emphases. The finding that higher academic
achievement was not tied to a greater arts emphasis means that schools may be less
inclined to allot financial resources to instruction that does not translate to higher
academic achievement. Typically, stakeholders in educational policy invest in strategies
that show promise of increasing student academic achievement. If an arts emphasis does
138
not show promise in furthering student academic achievement, then stakeholders will
invest and promote other avenues where increased academic achievement is evident.
Another finding, however, indicated that an arts emphasis did predict reading
achievement in grade 5, although this finding should be interpreted with caution due to
the small statistical significance. The results indicated, moreover, that as students
progress up in the grades, there was less of an arts emphasis. If the finding, albeit small,
indicated that an arts emphasis predicts reading achievement in grade 5, then increasing
arts as the grades progress may be an avenue worth exploring. For this dissertation, the
results for predicting reading achievement in grade 5 were so small that it would take a
considerable amount of persuasion and resources for a school district or any other
stakeholder to base a financial decision on this finding. The finding does warrant further
research in the upper-elementary grades to identify if an increase in an arts emphasis is a
financially-sound idea for older students.
As states move forward with the CCSS adoptions, schools and teachers will seek
vehicles to make subject-matter more meaningful and engage students in critical analysis.
Despite its lack of statistical significance in boosting student academic achievement and
predicting academic achievement, using the arts could provide for examining academic
content through multiple perspectives and would add a layer of critical analysis that
might be overlooked if the arts are dismissed entirely from the curriculum.
The study results also indicated differences in emphasis based on socioeconomic
status (SES) across grades 1, 3, and 5. Differences based on SES relate directly to the
theoretical underpinning of the dissertation that SES is a factor, whether intentionally or
not, that moderates curricular decisions. As the CCSS are adopted, states strive for a
139
nationally-set of standards that allow schools to be compared to one another regardless of
their state affiliation. An implication of the study results, therefore, is whether or not an
equitable education that allows all students to fully experience the same curriculum is
even possible, despite sharing the same standards.
Another possibility for future research is the implications of arts in elementary
schools for students with learning differences. The power of differentiated instruction in
meeting and teaching diverse learners is growing, especially in the field of e-learning.
The role of the arts in elementary schools in terms of e-learning may be powerful as
schools look for alternative ways of knowing and assessing student achievement. The
arts allow for authentic assessment that is individualized and very personal. This seems
to be a natural fit for future research in special education research.
Future research in the area of frequency of instruction is important. As standards-
based education and online instruction develops, the allotment of required time for such
areas as Visual and Performing Arts needs to not only be supported and encouraged in
schools, but it needs to be required. This term takes time, but future analysis of
frequency of instruction in the arts in schools may help pave the way for additional
educational research and the effect the arts have on learning. Research that examines
frequency of arts instruction and achievement scores in other content areas that are used
for state accountability reporting, such as English language arts (ELA) and Mathematics,
may help make a stronger case for educating the whole learner instead of just those
content areas that require a bubble on an answer sheet.
Future research in arts education would benefit from additional methods of data
collection besides self-reported data, but it may be challenging to find both funding and

140
resources to collect data on a large-scale. The U.S. Department of Education’s Arts in
Education program, for instance, funded projects in the arts. In 2011, the Arts in
Education program was eliminated only to be reinstated after budget negotiations
(Americans for the Arts, 2012). The lack of secured funds to support large-scale efforts
in arts education make future research in the arts dependent upon shorter term and
smaller-scaled research projects. Such shorter term and smaller-scaled research projects
may add to the available understandings of the effect of arts education on learning, but
fall short in adding value to longitudinal evidence in arts education.
It is recommended that future studies explore any connections between curricular
interest and curricular emphasis. Other research (Almarode, 2011; Crane, 2010) focused
on instructional time in areas such as science, mathematics, and student achievement, but
there remains a void in the literature that links teachers’ interest in the curriculum and the
emphasis that is placed using large-scale data to drive the claims in elementary schools.
This dissertation focused on curricular emphases in academic, the arts, and physical
education, but future studies may build upon this work by drawing possible connections
between teachers’ curricular interests in such emphases. As states adopt the CCSS and
the Next Generation Science Standards, teachers may emphasize curriculum that interests
them in light of the adopted national frameworks. Literary analysis, for example, may be
an area that interests a teacher. The teacher may emphasize literary analysis because it
interests them and it is highlighted in the adopted national standards. If this is so, then
the connections between curricular interest and curricular emphasis may provide further
knowledge about opportunities students have to curriculum, such as the arts, if the

141
curricular emphasis is based on a teacher’s curricular interests and the arts are not
currently in the emerging nationally-adopted standards.
Implications for Practice
In the midst of a standards-based education, the 1995 movie titled “Mr. Holland’s
Opus” was a Hollywood success. It highlighted the plight of the arts in an era of
standards-based education.
Vice Principal Wolters: “I care about these kids just as much as you do.
And if I am forced to choose between Mozart and reading and writing and long
division, I choose long division.”
Mr. Holland: “I guess you can cut the arts as much as you want…Sooner
or later, these kids aren’t going to have anything to read or write about.”
Research (Bintz, 2010; Brouillette & Jennings, 2010; Brown & Brown, 1997;
Butzlaff, 2000; Cuero & Crim, 2008; Deasy, 2002; Fiske, 1999; Ingram & Meath, 2007;
Koning, 2010; Lucey & Laney, 2009; Montgomerie & Ferguson, 1999; Paquette, & Rieg,
2008; Smith, 2000; Taylor, 2008) regarding the arts in the elementary grades might
provide a wide array of implications for practice. The discussions centered on
differentiated instruction and reaching and teaching diverse learners could be elevated to
a different level of understanding and appreciation if research is produced that supports
and encourages the arts as a way to differentiate instruction.
Common Core State Standards in the 21st Century Classroom
The Honorable Tom Torlakson, California’s current Superintendent of Public
Instruction, shared his view on the Common Core State Standards. He said that the “new
standards require an integrated approach to delivering content instruction” (Torlakson,
142
personal communication, October 27, 2011), implying that content must be integrated if
it is to be included in the curriculum.
In adopting these standards, states hoped to become global competitors.
According to the Program for International Student Assessment (PISA) (2009), six other
countries (Korea, Finland, Canada, New Zealand, Japan, and Australia) had higher
average scores than the United States students in terms of reading literacy and 17 other
countries (Korea, Finland, Switzerland, Japan, Canada, the Netherlands, New Zealand,
Belgium, Australia, Germany, Estonia, Iceland, Denmark, Slovenia, Norway, France, and
the Slovak Republic) had higher average scores than the United States students in terms
of mathematics literacy performance (Program for International Student Assessment,
2009). Global competitiveness requires schools to focus their instruction. However, the
role of the arts in school reform efforts may seem dim.
The Arts and the Common Core State Standards
The lack of the arts in the Common Core State Standards may further the shortfall
of arts in schools. The arts and other content areas become marginalized parts of the
school curriculum (Brewer & Brown, 2009; President’s Committee on the Arts and the
Humanities, 2011); thus, there is a narrowing of the school curriculum (President's
Committee on the Arts and the Humanities, 2011).
The CCSS openly state support for the arts but the arts are used as an optional
vehicle for learning to meet certain standards in other content areas like reading and
mathematics. Educators may meet the standards by not using the arts because other
options are given to meet the same standards. As students move up in the grade levels,
the arts become even more passively included. The arts are an option in very few of the
143
standards. Grallert (2009) summed up the standards-based movement in education and
its effect on arts education as such: “We learn to segregate and categorize who we are and
what we can do by what we learn in school, becoming disengaged in doing art because of
an inability to make the outcome look like what we intended” (p. 140).
Student academic achievement may continue to inform the instructional choices
of teachers, schools, and stakeholders as standards-based education moves forward to a
national platform. This dissertation provided evidence of the role curricular emphases
and school variables play in such instructional decisions and gave a large-scale, data-
driven look into arts and learning in which future research can be built.
144
REFERENCES
Almarode, J.T. (2011). Frequency, duration, and time devoted to elementary science instruction and the association with science achievement and science interest (Unpublished doctoral dissertation). Charlottesville, VA: University of Virginia.
Americans for the Arts. (2012). Funding the arts in education at the U.S. Department of
Education: Improving access to arts education for all students (Issue brief). Retrieved from http://www.artsusa.org/get_involved/advocacy/aad/handbook/2012.asp
An, S. A., Ma, T., & Capraro, M. M. (2011). Preservice teachers' beliefs and attitude
about teaching and learning mathematics through music: An intervention study. School Science & Mathematics, 111, 236-248. doi: 10.1111/j.1949- 8594.2011.00082.x
ArtsEdSearch. (2013). Retrieved from http://www.artsedsearch.org Baker, B., & Welner, K. G. (2012). Evidence and rigor: Scrutinizing the rhetorical
embrace of evidence-based decision making. Educational Researcher, 41(3), 98- 101. doi: 10.3102/0013189x12440306
Belliveau, G. (2006). Engaging in drama: Using arts-based research to explore a social
justice project in teacher education. International Journal of Education & the Arts, 7(5), 1-17.
Bintz, W. P. (2010). Singing across the curriculum. Reading Teacher, 63, 683-686. Brewer, E. A., & Brown, S. L. (2009). Perspectives on social studies and visual arts
integration. Kappa Delta Pi Record, 45(3), 135-139. Brouillette, L. (2010). How the arts help children to create healthy social scripts:
Exploring the perceptions of elementary teachers. Arts Education Policy Review, 111(1), 16-24. doi: 10.1080/10632910903228116
Brouillette, L., & Jennings, L. (2010). Helping children cross cultural boundaries in the
borderlands: Arts program at freese elementary in San Diego creates cultural bridge. Journal for Learning through the Arts, 6(1), 1-17.
Brown, R., & Brown, N. (1997). Use songs to teach. Reading & Writing Quarterly:
Overcoming Learning Difficulties, 13, 349-354. Brown, S., Martinez, M., & Parsons, L. (2006). The neural basis of human dance.
Cerebral Cortex, 16, 1157-1167. Butzlaff, R. (2000). Can music be used to teach reading? Journal of Aesthetic Education,
145
34(3/4), 167-178. California Alliance for Arts Education. (2011). Retrieved from
http://www.artsed411.org/ California Department of Education. (2013). Retrieved from www.cde.ca.gov/index.asp Carpenter, B. S., II, & Tavin, K. M. (2010). Drawing (past, present, and future) together:
A (graphic) look at the reconceptualization of art education. Studies in Art Education: A Journal of Issues and Research in Art Education, 51, 327-352.
Catterall, J. (2009). Doing well and doing good by doing art: The effects of education in
the visual and performing arts on the achievements and values of young adults. London: Imagination Group.
Catterall, J., Chapleau, R., & Iwanaga, J. (1999). Involvement in the arts and human
development: General involvement and intensive involvement in music and theater arts. Washington, DC: Arts Education Partnership and President's Committee on the Arts and Humanities.
Catterall, J., Dumais, S., & Hampden-Thompson, G. (2012). The arts and achievement in
at-risk youth: Findings from four longitudinal studies (pp. 8-27). Washington, DC: National Endowment for the Arts.
Catterall, J., & Waldorf, L. (1999). The Chicago arts partnership in education: Summary
evaluation (pp. 47-62). Washington, DC: Arts Education Partnership and President's Committee on the Arts and Humanities.
Cecil, N., & Lauritzen, P. (1994). Literacy and the arts for the integrated classroom:
Alternative ways of knowing. White Plains, NY: Longman. Chiang, H. (2009). How accountability pressure on failing schools affects student
achievement. Journal of Public Economics, 93(9–10), 1045-1057. doi: http://dx.doi.org/10.1016/j.jpubeco.2009.06.002
Crane, C. (2010). Mathematics performance in public and Catholic elementary schools:
Explaining the disparity (Unpublished doctoral dissertation). Urbana, IL: University of Illinois.
Common Core State Standards Initiative. (2012). Retrieved from
http://www.corestandards.org Crocco, M. S., & Costigan, A. T. (2007). The narrowing of curriculum and pedagogy in
the age of accountability: Urban educators speak out. Urban Education, 42(6), 512-535.

146
Cuero, K. K., & Crim, C. L. (2008). "You wish it could speak for itself": Examining the use of aesthetic representation in an elementary teacher preparation program. Issues in Teacher Education, 17, 117-140.
Darling-Hammond, L. (2007). Race, inequality and educational accountability: The irony
of 'no child left behind'. Race Ethnicity and Education, 10, 245-260. doi: 10.1080/13613320701503207
Darling-Hammond, L. (2010). The flat world and education: How America’s
commitment to equity will determine our future. New York, NY: Teachers College Press.
Deasy, R. J. (Ed.). (2002). Critical links: Learning in the arts and student academic and
social development. Washington, DC: Arts Education Partnership. Della Pietra, C. J., Bidner, S., & Devaney, T. A. (2010). Preservice elementary classroom
teachers' attitudes toward music in the school curriculum and teaching music. Research and Issues in Music Education, 8(1), 1-15.
Dewey, J. (1934). Art as experience. Oxford England: Minton, Balch. Dewey, J., Barnes, A. C., Buermeyer, L., Mullen, M., & De Mazia, V. (1947). Art and
education (2nd ed.). Merion, PA: The Barnes Foundation Press. Diamond, J. B. (2012). Accountability policy, school organization, and classroom
practice: Partial recoupling and educational opportunity. Education and Urban Society, 44, 151-182. doi: 10.1177/0013124511431569
Donahue, D., & Stuart, J. (2008). Working towards balance: Arts integration in pre-
service teacher education in an era of standardization. Teaching and Teacher Education, 24, 343-355. doi: 10.1016/j.tate.2006.11.016
Dorner, L. M., Spillane, J. P., & Pustejovsky, J. (2011). Organizing for instruction: A
comparative study of public, charter, and catholic schools. Journal of Educational Change, 12, 71-98. doi: 10.1007/s10833-010-9147-5
Eisner, E. (2002). The arts and the creation of mind. New Haven, CT: Yale University. Fiske, E. B. (Ed.). (1999). Champions of change : The impact of the arts on learning.
Washington, DC : Arts Education Partnership and President's Committee on the Arts and the Humanities.
Gershberg, A. I., González, P. A., & Meade, B. (2012). Understanding and improving
accountability in education: A conceptual framework and guideposts from three decentralization reform experiences in latin america. World Development, 40, 1024-1041. doi: http://dx.doi.org/10.1016/j.worlddev.2011.11.014
147
Glass, G. & Hopkins, K. (1996). Statistical methods in education and psychology. (3rd ed.). Needham Heights, MA: Allyn & Bacon.
Grallert, M. (2009). Catching the light: "Doing art" and education. Leonardo, 42(2), 139-
144. Grant, A., Hutchinson, K., Hornsby, D., & Brooke, S. (2008). Creative pedagogies: "Art-
full" reading and writing. English Teaching: Practice and Critique, 7(1), 57-72. Grimm, L. & Yarnold, P. (Eds.). (1995). Reading and understanding multivariate
statistics. Washington, DC: American Psychological Association Hash, P. M. (2010). Preservice classroom teachers’ attitudes toward music in the
elementary curriculum. Journal of Music Teacher Education, 19(2), 6-24. doi: 10.1177/1057083709345632
Heath, S. B., & Wolf, S. (2005). Focus in creative learning: Drawing on art for language
development. Literacy, 39(1), 38-45. doi: 10.1111/j.1741-4350.2005.00396.x
Hetland, L., Winner, E., Veenema, S., & Sheridan, K. (2007). Studio thinking: The real benefits of visual arts education (1st ed.): Teachers College Press.
Huang, S.Y.S. (2008). The influence of kindergarten and first-grade literacy instruction
on the 3rd-and 5th-grade students’ reading achievement: Findings from the early childhood longitudinal study-kindergarten class, 1998-1999 (Unpublished doctoral dissertation). University of San Francisco, San Francisco, CA.
Hull, J. (1993). What price the arts in the curriculum? Support for Learning, 8(4), 163-
168. IBM Corp. (2012). IBM SPSS Statistics for Windows, Version 21.0. Armonk, NY: IBM
Corp. Ingram, D., & Meath, M. (2007). Arts for academic achievement: A compilation of
evaluation findings from 2004-2006. Center for Applied Research and Educational Improvement.
Ingram, D., & Reidell, E. (2003). Arts for academic achievement: What does arts
integration do for students? Minneapolis, MN: Center for Applied Research and Educational Improvement.
Keigher, A. (2009). Characteristics of public, private, and bureau of indian education
elementary and secondary schools in the united states: Results from the 2007-08 schools and staffing survey. First look. Nces 2009-321. Washington, DC: National Center for Education Statistics, Institute of Education Sciences, U.S. Department of Education.
148
Keiper, S., Sandene, B. A., Persky, H. R., & Kuang, M. (2009). The nation's report card: Arts 2008--music & visual arts. National assessment of educational progress at grade 8. Highlights. Nces 2009-494. Washington, DC: National Center for Education Statistics.
Kienzl, G., Boachie-Ansah, G., Lanahan, L., Holt, E. W., & National Center for
Education Statistics, W. D. C. (2006). Arts instruction of public school students in the first and third grades. Issue brief. Nces 2006-099: National Center for Education Statistics.
Koning, S. (2010). Dancing the curriculum. Kappa Delta Pi Record, 46(4), 170-174. Lee, J., & Reeves, T. (2012). Revisiting the impact of NCLB high-stakes school
accountability, capacity, and resources: State NAEP 1990-2009 reading and math achievement gaps and trends. Educational Evaluation and Policy Analysis, 34, 209-231. doi: 10.3102/0162373711431604
Leong, S. (2010). Creativity and assessment in Chinese arts education: Perspectives of
Hong Kong students. Research Studies in Music Education, 32(1), 75-92. doi: 10.1177/1321103x10370086
Little, R. J. A., & Rubin, D. B. (1987). Statistical analysis with missing data. New York,
NY: Wiley.
Lucey, T. A., & Laney, J. D. (2009). This land was made for you and me: Teaching for economic justice in upper elementary and middle school grades. Social Studies, 100(6), 260-272.
Massell, D. (2001). The theory and practice of using data to build capacity: State and local strategies and their effects. Yearbook (National Society for the Study of Education)(2), 148-169.
McMahon, S. D., Rose, D. S., & Parks, M. (2003). Basic reading through dance program:
The impact on first-grade students' basic reading skills. Evaluation Review, 27(1), 104-125.
Montgomerie, D., & Ferguson, J. (1999). Bears don't need phonics: An examination of
the role of drama in laying the foundations for critical thinking in the reading process. Research in Drama Education, 4(1), 11.
Music play: Bah bah be bop Beethoven. (N.D.). [Television series episode], Building
quality child care. South Carolina Educational Television. National Center for Education Statistics. (2009). Early childhood longitudinal study,
kindergarten class of 1998-99. Washington, DC: U.S. Department of Education.

149
National Center for Education Statistics (2006). ECLS-K longitudinal kindergarten-fifth grade public-use data file (Report No. NCES 2006-035). Washington, DC: U.S. Department of Education.
National Commission on Excellence in Education. (1983). A nation at risk: The
imperative for educational reform. A report to the nation and the secretary of education. Washington, DC: Author.
Paquette, K. R., & Rieg, S. A. (2008). Using music to support the literacy development of
young english language learners. Early Childhood Education Journal, 36(3), 227- 232.
Parsad, B., & Spiegelman, M. (2012). Arts education in public elementary and secondary
schools: 1999-2000 and 2009-10. (NCES 2012-014). Washington, DC: National Center for Education Statistics, Institute of Education Sciences, U.S. Department of Education.
Peebles, J. (2007). Incorporating movement with fluency instruction: A motivation for
struggling readers. The Reading Teacher, 60(6), 578-581. President's Committee on the Arts and the Humanities. (2011). Reinvesting in arts
education: Winning America's future through creative schools. Washington, DC: Author.
Program for international student assessment (pisa). (2009). Retrieved from
http://nces.ed.gov/surveys/pisa/ Purnell, P., & Gray, D. (2004). A place for the arts: The past, the present and teacher
perceptions. Teaching Artist Journal, 2(3), 153-161. Rabkin, N., & Hedberg, E. C. (2011). Arts education in America: What the declines mean
for arts participation. Based on the 2008 survey of public participation in the arts. Research report #52. Washington, DC: National Endowment for the Arts.
Raudenbush, S. W., & Bryk, A. S. (2002). Hierarchical linear models : Applications and
data analysis methods (2nd ed.). Thousand Oaks, CA: Sage Publications. Ravitch, D. (2010). The death and life of the great American school system: How testing
and choice are undermining education. New York, NY: Basic Books.
Rodesiler, L. (2009). Turn it on and turn it up: Incorporating music videos in the ela classroom. English Journal, 98(6), 45-48.
Rosenfeld, M. (2011). Jump patterns: Percussive dance and the path to math. Teaching Artist Journal, 9(2), 78-89. doi: 10.1080/15411796.2011.556564
150
Schmidt, W. H., Leland, S. C., Houang, R. T., & McKnight, C. C. (2011). Content coverage differences across districts/states: A persisting challenge for u.s. education policy. American Journal of Education, 117(3), 399-427.
Smigel, E., & McDonald, N. L. (2011). Piecing together the 20th century: An
interdisciplinary unit on principles of collage in modern music, art, and poetry (grades 4-8). General Music Today, 24(3), 10-16.
Smith, J. (2000). Singing and songwriting support early literacy instruction. The Reading
Teacher, 53(8), 646-649. Smithrim, K., & Upitis, R. (2005). Learning through the arts: Lessons of engagement.
Canadian Journal of Education / Revue canadienne de l'education, 28(1), 109- 127.
Spohn, C. (2008). Teacher perspectives on no child left behind and arts education: A case
study. Arts Education Policy Review, 109(4), 3-11. Stickney, J. A. (2009). Wittgenstein's contextualist approach to judging "sound" teaching:
Escaping enthrallment in criteria-based assessments. Educational Theory, 59(2), 197-215.
Strunk, K. O., & McEachin, A. (2011). Accountability under constraint: The relationship
between collective bargaining agreements and California schools' and districts' performance under No Child Left Behind. American Educational Research Journal, 871. doi: 10.2307/27975313
Taylor, J. A. (2008). From the stage to the classroom: The performing arts and social
studies. History Teacher, 41, 235-248. The College Board. (2011). 2011 college-bound seniors: Total group profile report.
New York, NY: Total Group. Urso Spina, S. (2006). Worlds together... Words apart: An assessment of the
effectiveness of arts-based curriculum for second language learners. Journal of Latinos & Education, 5(2), 99-122.
van der Veen, J. (2012). Draw your physics homework? Art as a path to understanding in
physics teaching. American Educational Research Journal, 49(2), 356-407. doi: 10.3102/0002831211435521
Vaughn, K. (2000). Music and mathematics: Modest support for the oft-claimed relationship. Journal of Aesthetic Education, 34(3/4), 149-166.
Vaughn, K., & Winner, E. (2000). Sat scores of students who study the arts: What we can and cannot conclude about the association. Journal of Aesthetic Education,
151
34(3/4), 77-89. Walker, E., Tabone, C., & Weltsek, G. (2011). When achievement data meet drama and
arts integration. Language Arts, 88(5), 365-372. Wayman, J. C. (2003). Multiple imputation for missing data: What is it and how can I use
it? Paper presented at the 2003 Annual Meeting of the American Educational Research Association, Chicago, IL.
Wilkins, J. L. M., Graham, G., Parker, S., Westfall, S., Fraser, R. G., & Tembo, M. (2003). Time in the arts and physical education and school achievement. Journal of Curriculum Studies, 35, 721-734. doi: 10.1080/0022027032000035113
Winner, E., & Cooper, M. (2000). Mute those claims: No evidence (yet) for a causal link
between arts study and academic achievement. Journal of Aesthetic Education, 34(3/4), 11-75.
Winner, E., & Hetland, L. (2000). The arts in education: Evaluating the evidence for a
causal link. Journal of Aesthetic Education, 34(3/4), 3-10. World Bank Staff. (2003). World Development report 2004 [electronic resource]:
Making services work for poor people Washington, DC : World Bank.

152
APPENDICES

153
APPENDIX A
VARIABLE NAME, ITEM QUESTION, AND RANGE OF VALUES FOR THE DEPENDENT AND INDEPENDENT VARIABLES
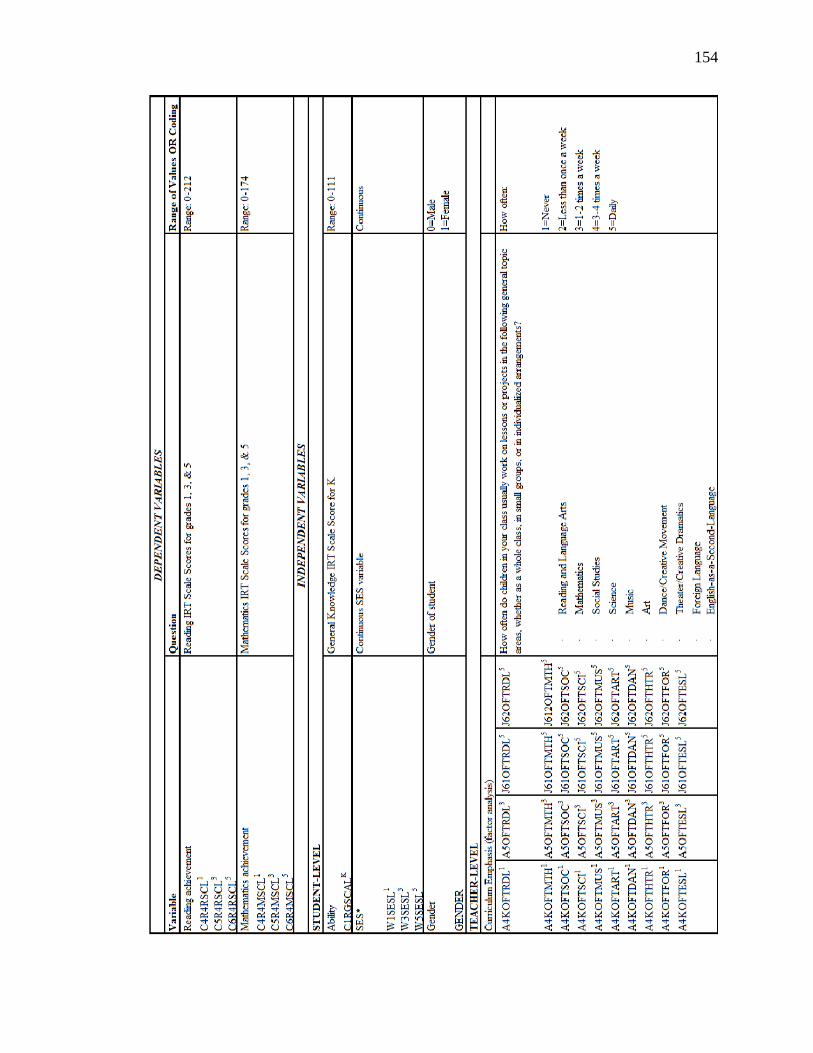
154

155
* E
CL
S-K
impu
ted
SE
S co
mpo
site
s fo
r ea
ch g
rade
-lev
el
* K r
epre
sent
s Fa
ll an
d Sp
ring
kin
derg
arte
n, 1 r
epre
sent
s 1st
gra
de, 3 r
epre
sent
s 3rd
gra
de, 5 r
epre
sent
s 5th
gra
de
156
APPENDIX B
AUTHOR, YEAR, SAMPLE SIZE, DESCRIPTION OF METHOD, AND RESULTS FOR STUDIES IN ARTS EDUCATION
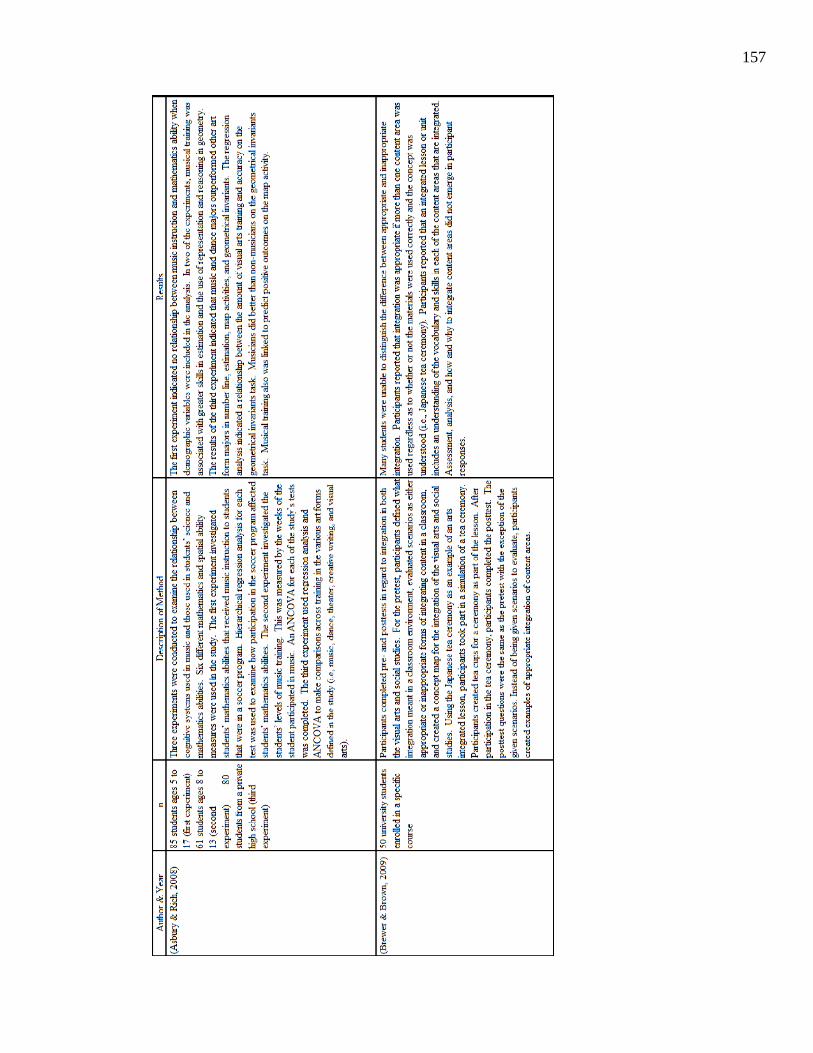
157
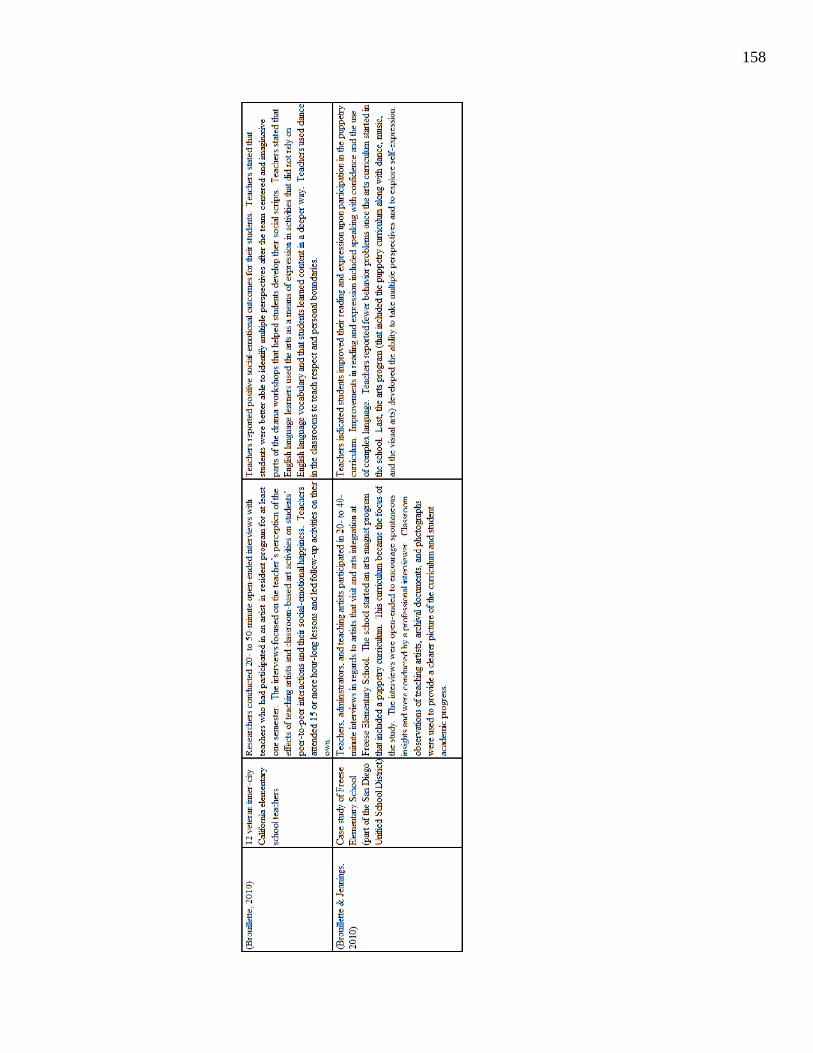
158
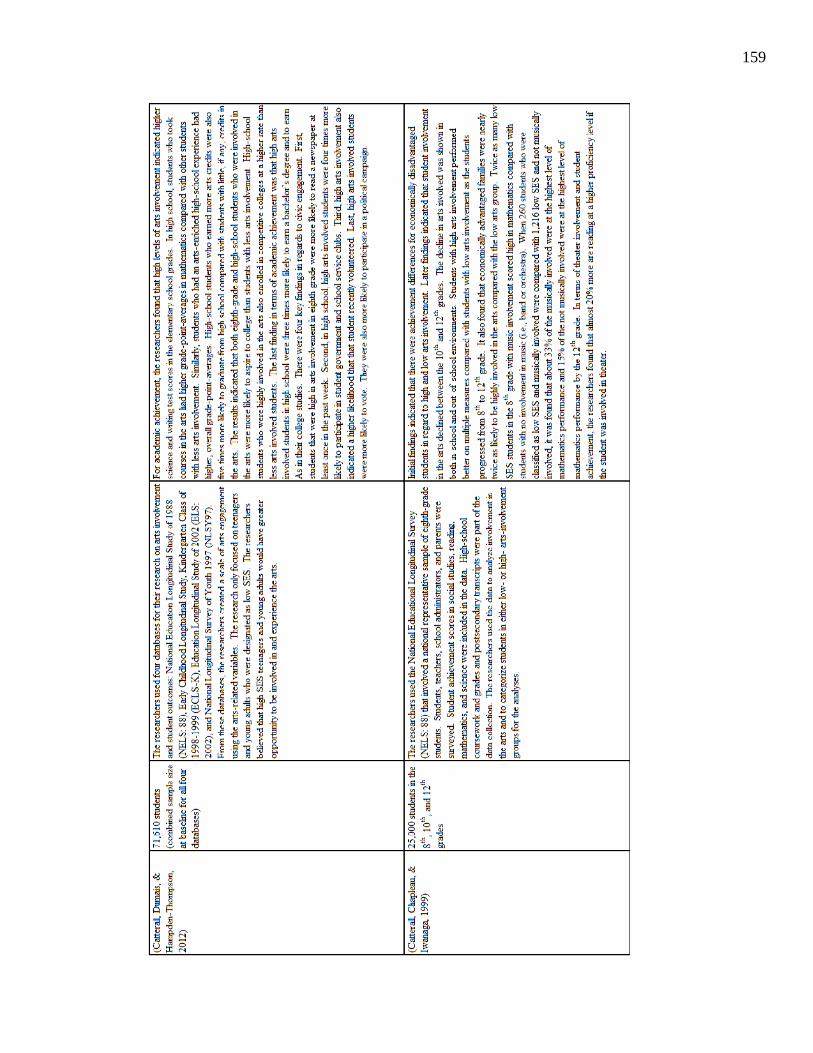
159

160
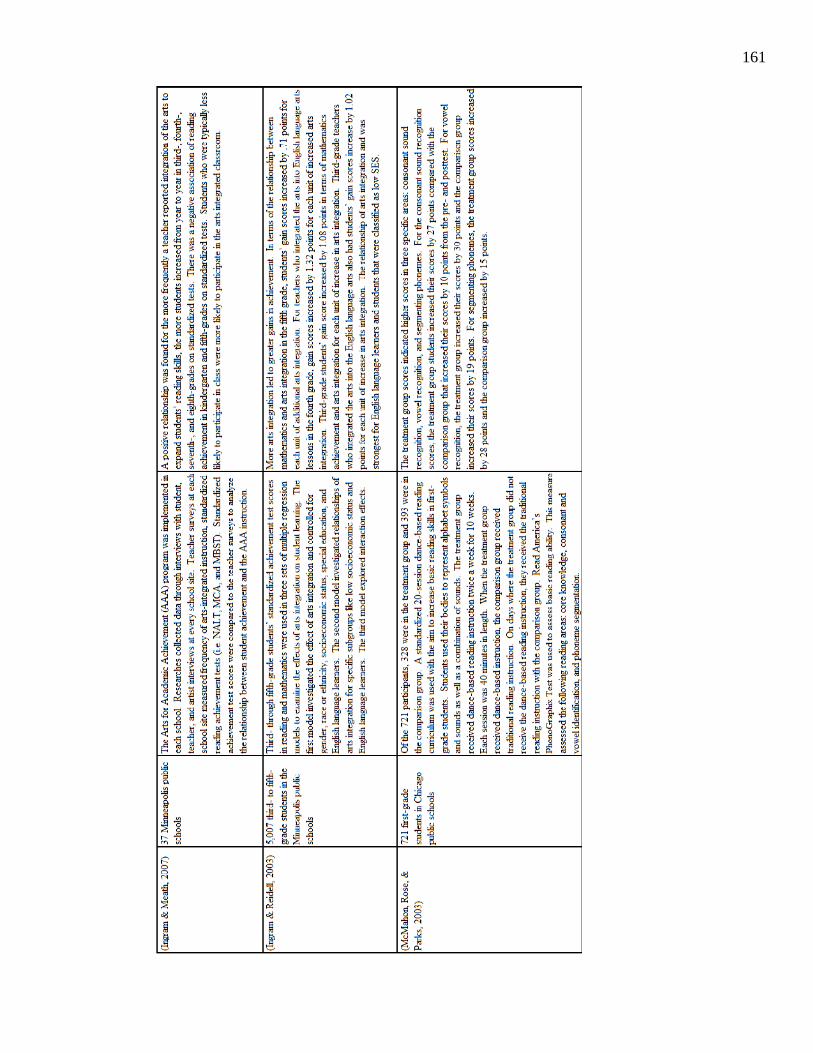
161
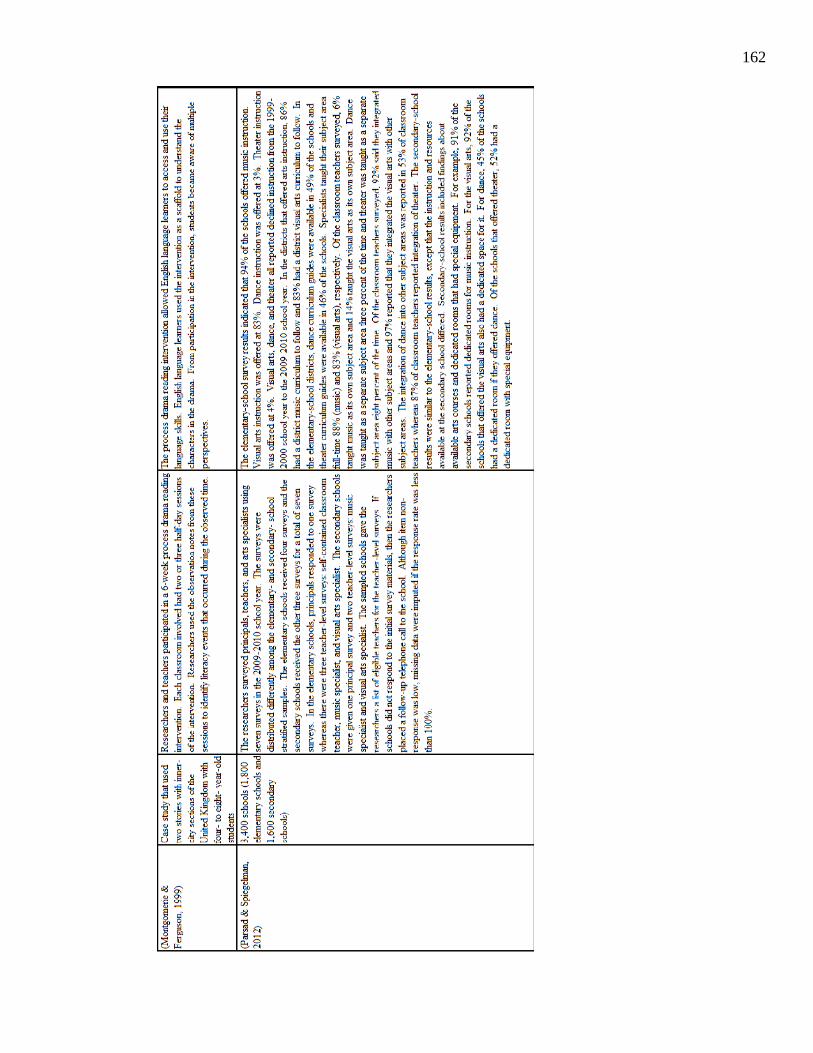
162
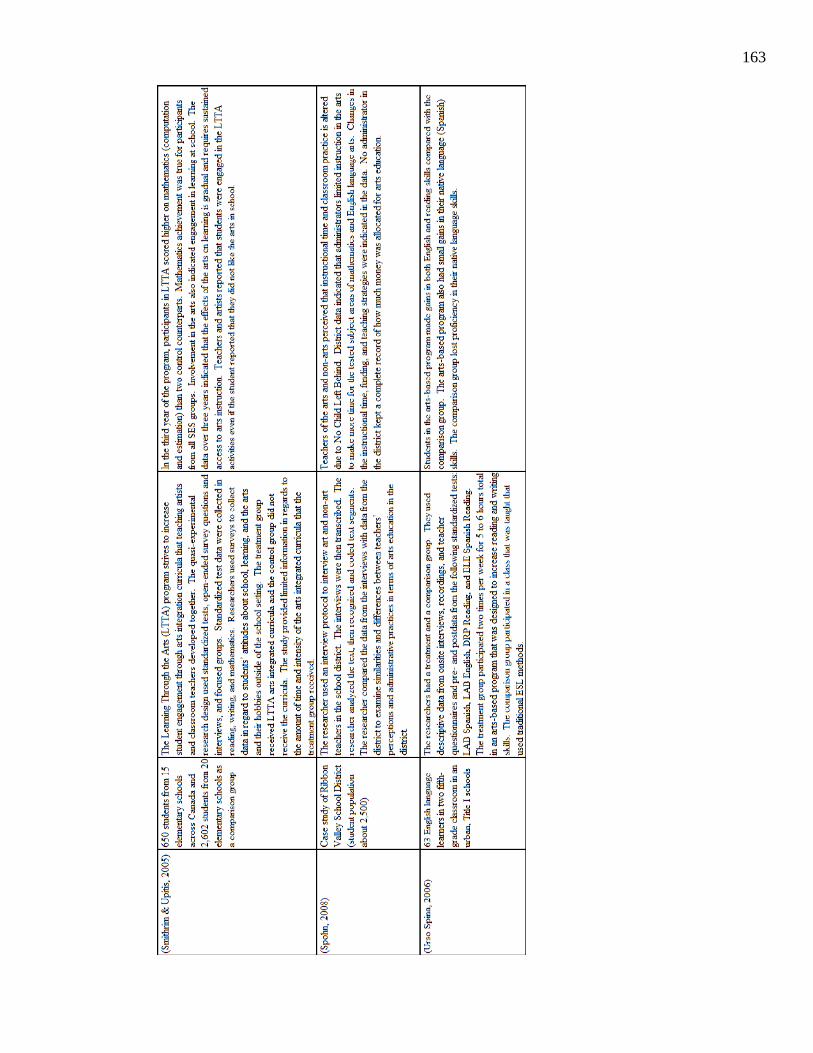
163

164

165
(Art
sEdS
earc
h, 2
013)

166
APPENDIX C
ORIGINAL TEACHER QUESTIONNAIRE ITEMS FROM ECLS-K
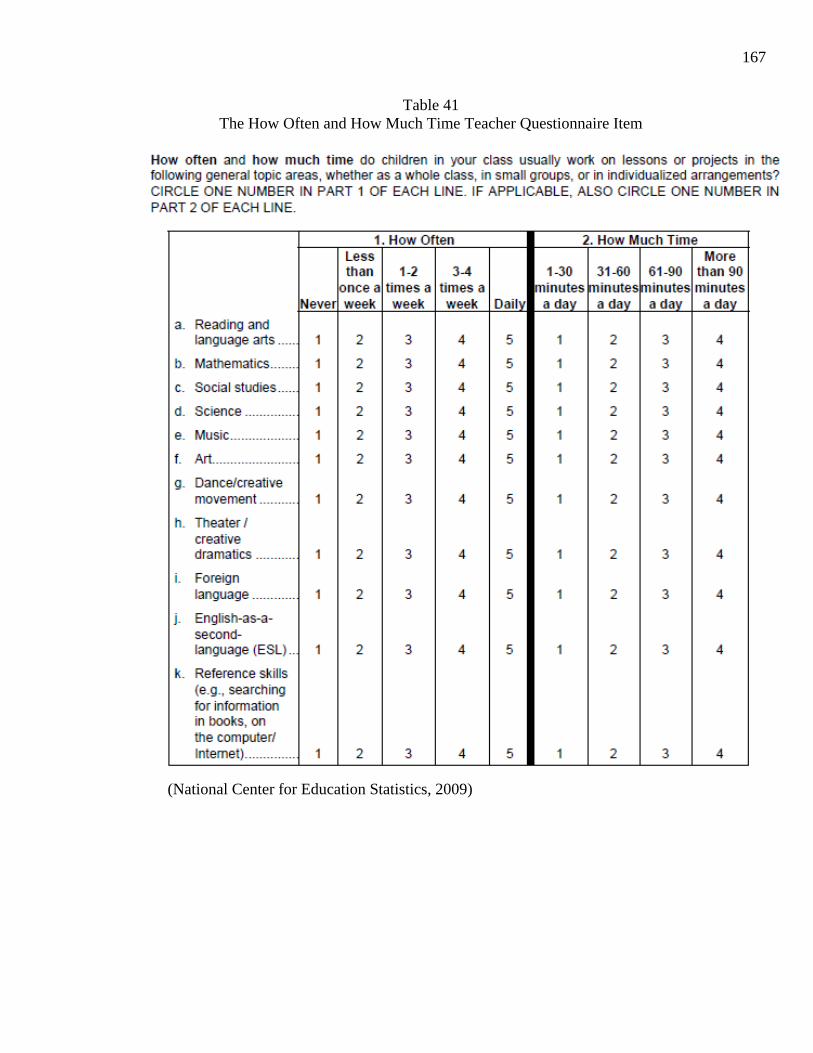
167
Table 41 The How Often and How Much Time Teacher Questionnaire Item
(National Center for Education Statistics, 2009)
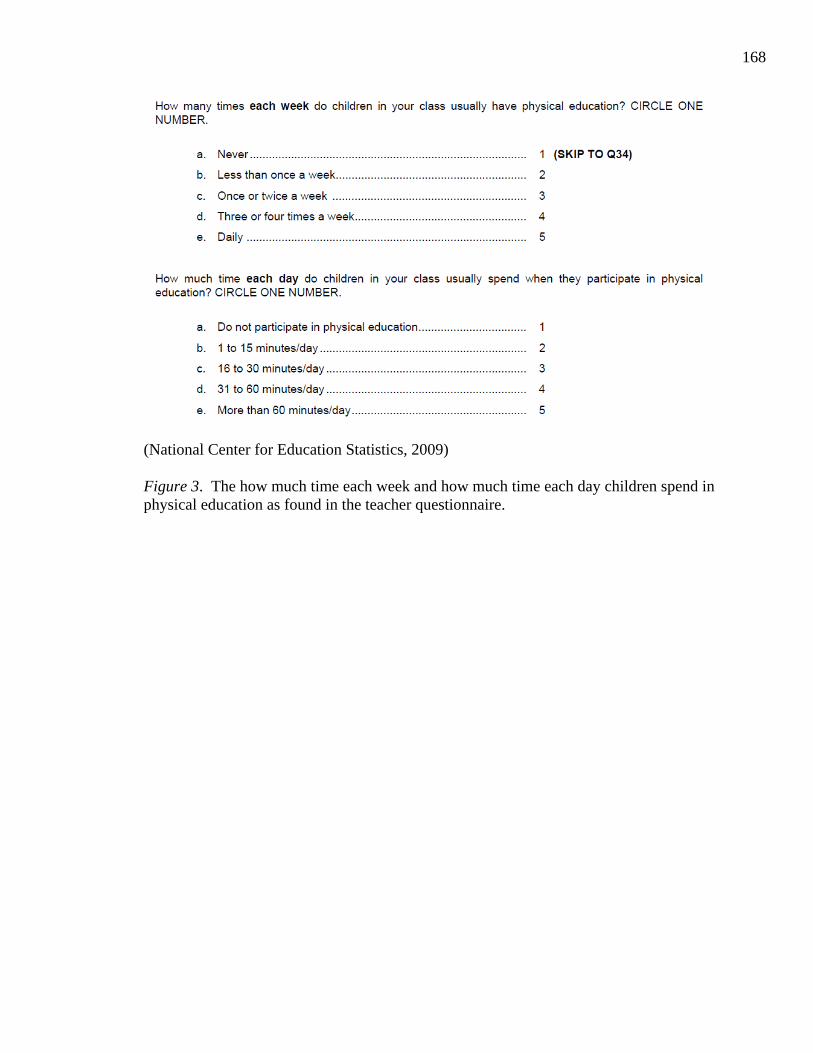
168
(National Center for Education Statistics, 2009)
Figure 3. The how much time each week and how much time each day children spend in physical education as found in the teacher questionnaire.