The Reform of the Portuguese Public Employees’ Pension System: Reasons and Results
43
GPEARI Ministério das Finanças e da Administração Pública The Reform of the Portuguese Public Employees’ Pension System: Reasons and Results Vanda Cunha Ariana Paulo Nuno Sousa Pereira Hélder Reis June 2009 WP-002 Working Papers Series
-
Upload
independent -
Category
Documents
-
view
4 -
download
0
Transcript of The Reform of the Portuguese Public Employees’ Pension System: Reasons and Results

GPEARI Ministério das Finanças e da Administração Pública
The Reform of the Portuguese Public Employees’ Pension System: Reasons and Results
Vanda Cunha Ariana Paulo
Nuno Sousa Pereira Hélder Reis
June 2009 WP-002
Wo
rkin
g P
ape
rs S
eri
es

Direcção/Address Gabinete de Planeamento, Estratégia, Avaliação e Relações Internacionais Office for Strategy, Planning, Economic Policy and International Affairs Ministério das Finanças e da Administração Pública Ministry of Finances and Public Administration Av. Infante D. Henrique, 1-C, 1º 1100 – 278 Lisboa Telefone/Telephone +351218823390 Fax +351218823399 Website www.gpeari.min-financas.pt Email [email protected] As opiniões expressas neste documento não têm que reflectir necessariamente as do Ministério das Finanças e da Administração Pública. The views expressed in this paper do not necessarily reflect those of the Ministry of Finances and Public Administration. Titulo/Title: The reform of the Portuguese public employees’ pension system: reasons and results Autores/Authors: Vanda Cunha, Ariana Paulo, Nuno Sousa Pereira e Hélder Reis Local: MFAP-GPEARI Data/Date: Junho 2009 / June 2009 Colecção/Colection: Working Papers Series Número/Number: WP002 ISSN: 1646-8546

1
THE REFORM OF THE PORTUGUESE PUBLIC EMPLOYEES’ PENSION SYSTEM:
REASONS AND RESULTS
Vanda Cunha, Ariana Paulo, Nuno Sousa Pereira, Hélder Reis GPEARI, Ministry of Finance and Public Administration
Paper presented at the “Workshop on Pension Reform, Fiscal Policy and Economic Performance”, Banca d’Italia 11th Public Finance Workshop held in Perugia, 26-28 March, 2009
June 2009
Abstract
In the context of the ageing population and with the Portuguese public social security system reaching maturity, pension expenditures recorded a marked upwards trend in the last decade, jeopardizing the system’s long-term viability. This paper illustrates how the recent reforms in the social security system, in particular in the case of the public employees pension system, are expected to contribute to its financial sustainability and, hence, to the country’s overall public finance sustainability. In addition, the potential distributive impact of the new rule on pensions indexation is analysed. Key words: pensions, social security reform, public finance sustainability, income distribution JEL Codes: H55, J26, D31
The views expressed in this paper are those of the authors and do not necessarily reflect those of the Ministry of Finance and Public Administration. The authors are grateful to CGA and MTSS, in particular to Cristina Milhano and Manuela Paixão, respectively, for the data and explanations provided and to Inês Drumond, Per Eckerfeldt, José Carlos Pereira, Álvaro Pina and Maximiano Pinheiro for their helpful comments. The usual disclaimer applies.

2
Introduction Ensuring long-term sustainability of public finances has steadily become a main political priority in most developed countries. Both technological progress and lower fertility rates have increased the ratio of dependants to contributor, while tight budgetary constraints and additional pressure to increase spending in areas such as health care, have compelled public authorities in many developed countries to reform their social security systems. In Portugal, the scenario was even more acute given the generosity of the overall pension regime, but in particular of the public employees’ pension system. Until 2005, public employees hired until 1993 were entitled to keep their last wage after they retired as long as they had at least 36 years of contributive payments, and furthermore, pensions were de facto indexed to the evolution of public wages, causing pension levels to also increase over the years. When an increasing number of public employees entitled to full pension started retiring, the pressure on the system became unbearable. Therefore, in 2005, a further convergence of the public employees’ pension scheme with the private sector’s one occurred and, in 2006, a major overhaul of the system was imposed and an agreement was reached based on new rules for the calculation of pensions and for their indexation over time. In particular, a sustainability factor was established such that the calculation of the pension dynamically reflected changes in life expectancy, while the yearly update of pensions became indexed to consumer inflation, depending on the GDP growth and the value of the pension. In this context, the purpose of this paper is two-fold. First, we analyse the impact of this set of changes on the system’s sustainability, focusing most closely on the most significant changes; second, we measure the potential distributive impact of the new indexation rule. The paper proceeds as follows. In the following section, we describe the evolution of the Portuguese social security system since its inception, both in terms of its major institutional changes and its financial commitments; next, we evaluate demographic trends and their implications on pension expenditures; in section 3 we discuss the situation of the pension system before the 2006 reform and in section 4 we analyse the impact on public spending of the reform. We conclude by discussing our main findings. 1. A historical perspective The public employees’ pension scheme was the first far-reaching system of social protection in Portugal. Until the inception of Caixa Geral de Aposentações (CGA), in 1929, only feeble attempts of social protection for few occupational groups had been made, based on the Bismarck’s seminal social protection system, as in most other European countries. In the 30’s, the public employees’ pension scheme was extended to the descendants and spouses (survivors’ pensions) and a general framework of social protection for the private sector workers, financed on a funded basis, was defined. As in other European countries, during the 60’s and 70’s, the Portuguese social security systems progressively became universal and financed on a pay-as-you-go (PAYG) basis. In 1972, the public employees’ retirement regime turned into an integrated legal framework, the so-called Estatuto da
3
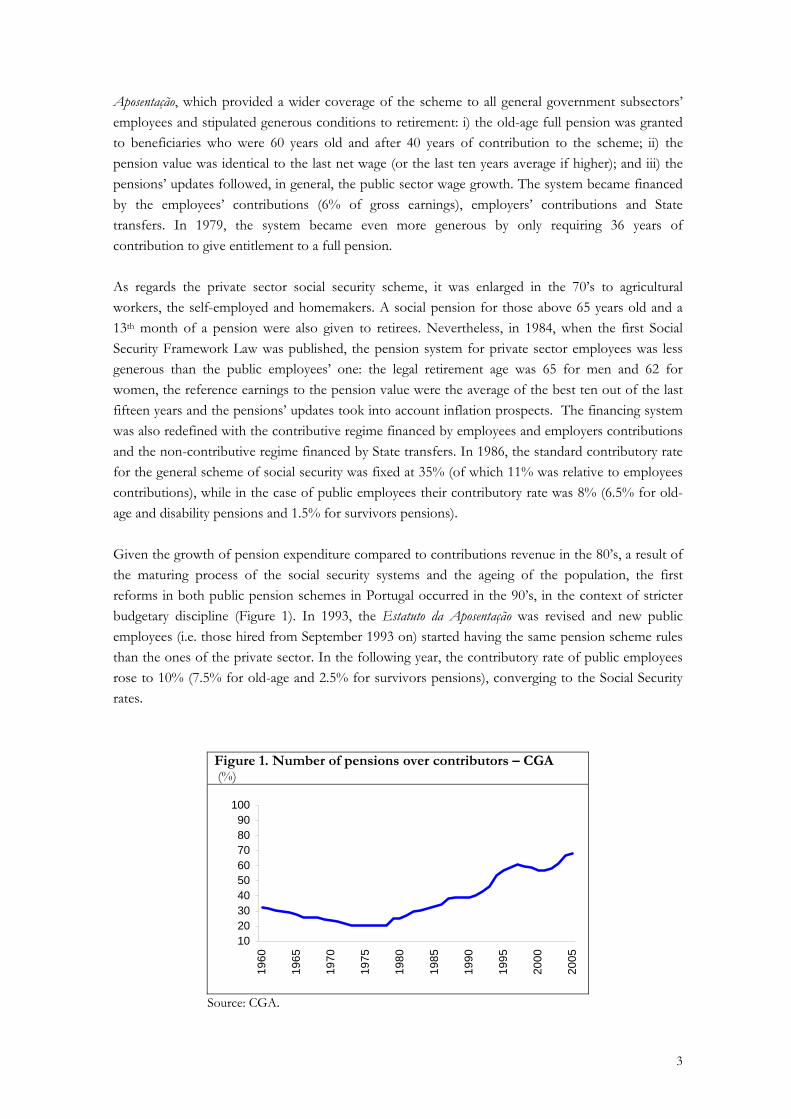
Aposentação, which provided a wider coverage of the scheme to all general government subsectors’ employees and stipulated generous conditions to retirement: i) the old-age full pension was granted to beneficiaries who were 60 years old and after 40 years of contribution to the scheme; ii) the pension value was identical to the last net wage (or the last ten years average if higher); and iii) the pensions’ updates followed, in general, the public sector wage growth. The system became financed by the employees’ contributions (6% of gross earnings), employers’ contributions and State transfers. In 1979, the system became even more generous by only requiring 36 years of contribution to give entitlement to a full pension. As regards the private sector social security scheme, it was enlarged in the 70’s to agricultural workers, the self-employed and homemakers. A social pension for those above 65 years old and a 13th month of a pension were also given to retirees. Nevertheless, in 1984, when the first Social Security Framework Law was published, the pension system for private sector employees was less generous than the public employees’ one: the legal retirement age was 65 for men and 62 for women, the reference earnings to the pension value were the average of the best ten out of the last fifteen years and the pensions’ updates took into account inflation prospects. The financing system was also redefined with the contributive regime financed by employees and employers contributions and the non-contributive regime financed by State transfers. In 1986, the standard contributory rate for the general scheme of social security was fixed at 35% (of which 11% was relative to employees contributions), while in the case of public employees their contributory rate was 8% (6.5% for old-age and disability pensions and 1.5% for survivors pensions). Given the growth of pension expenditure compared to contributions revenue in the 80’s, a result of the maturing process of the social security systems and the ageing of the population, the first reforms in both public pension schemes in Portugal occurred in the 90’s, in the context of stricter budgetary discipline (Figure 1). In 1993, the Estatuto da Aposentação was revised and new public employees (i.e. those hired from September 1993 on) started having the same pension scheme rules than the ones of the private sector. In the following year, the contributory rate of public employees rose to 10% (7.5% for old-age and 2.5% for survivors pensions), converging to the Social Security rates.
Figure 1. Number of pensions over contributors – CGA (%)
102030405060708090
100
1960
1965
1970
1975
1980
1985
1990
1995
2000
2005
Source: CGA.

4
The Social Security general regime was also revised in 1993, by increasing the legal retirement age for women to 65 years (the same as that of men) and rising the minimum entitlement contributory period from ten to fifteen years. The employers’ contributory rate also rose to 24.5%. In 1995, this rate was reduced by 0.75 percentage points but the Social Security benefited from the 1 percentage point increase of the VAT standard rate that was assigned to this system. From 2000 to 2005, further measures were taken to improve the financial sustainability of the public pension systems. In the context of the first waves of retirement of the individuals with full contributive career and, hence, entitled to higher pensions, the public pension expenditures increased significantly in spite of a not so marked growth in the number of Social Security’s pensions (Figures 2 and 3).
Figure 2. Pension expenditures – Social Security (% of GDP)
Source: Ministry of Labour and Social Security (MTSS).
Figure 3. Number of pensions (Social Security and CGA) (10^3)
0
500
1 000
1 500
2 000
2 500
3 000
1960
1970
1980
1990
2000
2005
Soc.Sec. Pensions
CGA Pensions
Sources: CGA and MTSS. As to the CGA system, this trend was strengthened by the retirement of a large number of public employees that were hired after the 1974 Revolution and by the fact that public employees’ scheme
0
2
4
6
8
1960
1965
1970
1975
1980
1985
1990
1995
2000
2005
1993 Reform
2002 Reform
0
2
4
6
8
1960
1965
1970
1975
1980
1985
1990
1995
2000
2005
1993 Reform
2002 Reform

5
was still relatively more generous than the Social Security scheme (Figure 4). The need for reforms to the public pension systems was felt in several European countries, where the pension systems financed on a PAYG basis were reaching maturity when the large number of “baby boomers” was retiring and because of the ageing population.
Figure 4. Pension expenditures – CGA (% of GDP)
Source: CGA.
In this context, a new Framework Law for Social Security was established in 2002, which revised the rules for the pension value. These rules took into account the complete contributive career, but raised the accrual rate from 2 to 2.3%, depending on the reference earnings. However, these rules would apply only from 2017 onwards with a transitory period until 2042, while other measures, like the convergence of earnings-related minimum pensions to national minimum wage until 2006, put immediate pressure on public pension expenditures. In 2005, a second revision of the Estatuto da Aposentação occurred aiming at a further convergence of the CGA and the Social Security pension regimes. From 2006 onwards, new public employees were enrolled in the Social Security system, and it was defined by a progressive increase (at a pace of 6 months per year) in the legal retirement age of all public employees to 65 years old in 2015 and in the complete career length to 40 years in 2013. In addition, the pension formula of public employees enrolled in CGA until August 1993 would also converge to the one of private sector workers. Nevertheless, these reforms proved to be insufficient to ensure the financial sustainability of the Portuguese public pension system and, in October 2006, the government and social partners agreed on a new social security reform. This agreement turned into a new Social Security Framework Law at the beginning of 2007 and the transposition of the reform measures to the CGA system in the second half of 2007 and early 2008 (Table 1). This means that the public employees’ pension system is now under a transitory period (until 2015) of convergence to the (reformed) Social Security system. The main recent measures are: i) the anticipation of the new pension formula established in 2002; ii) the introduction of a sustainability factor that links the pension value to the evolution of life expectancy at 65 years old; iii) the definition of a rule for pension updates; and iv) the promotion of delaying retirement by increasing the financial penalty for early retirement and granting bonuses in case of postponing retirement. The detailed description and the estimated effects of these measures are presented in section 4.
0
1
2
3
4
5
619
60
1965
1970
1975
1980
1985
1990
1995
2000
2005
1993 Reform
2005 Reform

6
Table 1. The evolution of the Portuguese public pension system
1929 Creation of the public employees old-age pension scheme (Decree no. 16669 of
27 March)
1972 Creation of Estatuto da Aposentação (Decree-Law no. 498/72 of 9 December): integrated legal framework of public employees retirement regime
1984
First Social Security Framework Law (Law no. 28/84 of 14 August) System PAYG: contributive regime financed by employees and employers contributions and non-contributive regime financed by State transfers
1993 Revision of Estatuto da Aposentação (Decree-Law no. 277/93 of 10 August and others): from September on, the pension scheme of new public employees became subject to the rules of the private sector system (Social Security General Regime)
1993 Reform of the Social Security general regime (Decree-Law no. 329/93 of 25 September)
2002 New Framework Law for Social Security (Law no. 32/2002 of 20 December)
2005 Revision of Estatuto da Aposentação (Law no. 60-B/2005 of 29 December) - further convergence of CGA and Social Security pension regimes
2007 Reform of the Social Security pension regime (revision of the Framework Law-Law 4/2007 of January 16 and Decree Law 87/2007 of May 10)
2007 Transposition of Social Security reform measures to CGA from 2008 on, with a transitory period until 2015 (Law no. 52/2007 of 31 August)
Sources: CGA and Ministry of Labour and Social Solidarity (MTSS). Note: A more detailed description is presented in Annex A. 2. Implications of demography on pension expenditure
Portugal, like other European countries, has been deeply affected by ageing population. In particular, in the last 30 years, a deteriorating birth rate and gains in life expectancy led to a significant shrink in age cohorts below 30’s and an increase in those between 30’s and 60’s and also in the oldest ones (Figure 5).

7
Figure 5. Population Pyramids for Portugal
1977 2007
100000 50000 0 50000 1000000
10
20
30
40
5060
70
80
90
100
Female
Male
100000 50000 0 50000 1000000
10
20
30
40
50
60
70
80
90
100Female
Male
Sources: EUROSTAT and National Statistics Institute (INE).
Migration flows have also had a role in the demographic structure: Portugal experienced significant net migration flows out of the country in the 50’s and 60’s followed by net migration inflows after the former colonies independence in the 70’s. In the last decade, net inflows intensified, with emigrants belonging to older age cohorts returning to Portugal and with the entrance of immigrants mainly from Eastern European countries, Brazil and former Portuguese colonies in Africa.
The change in the demographic pyramids yields an increasing old-age dependency ratio, which has duplicated between 1960 and 2007, while life expectancy at 65 grew around 4 years in the same period (Figure 6).
Figure 6. Old-age dependency ratio(*) (%)
0
10
20
30
40
50
60
1960
1970
1980
1990
2000
2010
2020
2030
2040
2050
2060
Sources: EUROSTAT and INE. Note: (*) Ratio of individuals aged 65 and older over individuals aged between 15 and 64.
These developments coupled with productivity and economic growth are major factors that influence the dynamics of the Social Security systems financed on a PAYG basis. At the present time, the increase in the old-age dependency ratio poses a big challenge to the financial sustainability

8
of these systems as it puts into risk the intergenerational income distribution from active to inactive population (Figure 6). The projected ageing population according to EUROSTAT’s exercise EUROPOP2008 is visible in the following charts, with the patterns for men and women.
Figure 7. Population Pyramids for Portugal - Projections
2030 2060
100000 50000 0 50000 1000000
10
20
30
40
50
60
70
80
90
100Female
Male
100000 50000 0 50000 1000000
102030405060708090
100 FemaleMale
Source: EUROSTAT (EUROPOP2008). As explained in the previous section, social security schemes have revealed a significant increase in their pension liabilities as a share of GDP, in particular in the last decade. As shown in the chart below, the relationship between pension expenditures as a percentage of GDP and the old-age dependency ratio can be well approximated for by a linear relation1. Pension expenditures until now basically reflect the old-age pension formation rules in force until the beginning of the 1990’s and the annual updates that have taken place. Without policy changes in the social security schemes and taking into account the observed variables till 2007, this linear regression indicates that pension expenditures would increase from 11% of GDP in 2007 to about 30% in 2060, when the forecast for dependency ratio reaches close to 55%.
Source: authors’ calculations. 1 In the linear regression model, both variables are integrated of order one according to the results of Dickey-Fuller tests; the residual of regression are stationary. The sample ranges from 1977 to 2007.
Figure 8. Pension expenditure and old age dependency ratio
PE = - 8.74+0.76*DRR2 = 0.96
0
2
4
6
8
10
12
16 18 20 22 24 26 28
Dependency ratio (DR)
Pens
ion
expe
nditu
re (P
E)

9
These results are compatible with other studies for Portugal, using specific pension modelling. Rodrigues and Pereira (2007) developed a general equilibrium model, and projected an increase in public pension expenditure close to 26% of GDP by 2050 before taking into account the reforms since 1993, and EPC (2006) and Pinheiro and Cunha (2007) projected an increase of about 20% of GDP by 2050 considering the reform measures adopted until 2005 using accounting models (Figure 9).
Figure 9. Projections for pension expenditure 2007-2060 (% of GDP)
0
5
10
15
20
25
30
35
2007 2020 2030 2040 2050 2060
Before 2007 measures Before 1993 measures Depend. ratio projection
Sources: Rodrigues and Pereira (2007), Pinheiro and Cunha (2007) and authors’ calculations. These projections revealed the measures implemented until 2005 insufficient to ensure the financial sustainability of the social security systems and, therefore, justify the need for the additional pension reform measures taken between 2006 and 2008. 3. The need of the public pension system reform
The serious financial imbalance of the Portuguese public pension systems by the mid 2000’s decade was in fact revealed by several studies and the European Commission classified Portugal as a high risk country in terms of the sustainability of public finances (DGECFIN 2006). Pension system reform has been widespread throughout Europe and other OECD countries mainly in the last decade. As referred to in Sapir (2005), “Europe’s labour and social institutions need urgent reform if we are to grasp the opportunities offered by globalization and avoid the threats. (…) Critically, the “Continental” and “Mediterranean” models, which account together for two-thirds of the GDP of the entire EU-25 and 90 per cent of the 12-member euro area, are inefficient and unsustainable. These models must therefore be reformed, probably by adopting features of the two more efficient models [Nordic and Anglo-Saxon]. These reforms may also involve changes towards more or less equity.” The author argued that the European institutions were established in the 1950’s and 1960’s when the economic environment was relatively stable and predictable, but that the institutions are no longer adequate in a world of rapid changes. He classifies the four European

10
Models according to their efficiency (incentives provided to work or employment rates) and equity (probability of escaping poverty) (Table 2) and finds Portugal in the Mediterranean group in terms of equity and in the Anglo-saxons group in terms of efficiency but below the average of these.
Table 2. The four European Models
Equity Efficiency
Low HighHigh Continentals Nordics
Low Mediterraneans Anglo-saxons
Source: Sapir (2005). Models that are not efficient are not sustainable in face of the public finance pressure coming from globalization, technical change and population ageing. The combination of the latter with low employment rates jeopardises the future benefits of the institution. The Mediterranean countries2 concentrate their social spending on old-age pensions and generally have high employment protection but rather low unemployment benefits. They are also less successful in keeping the employment rate for older workers high and the unemployment rate for younger workers low. The degree of equity is generally proportional to the level of taxation, but models that are not equitable may be financially sustainable. Therefore, increasing the incentives to work without raising the poverty risk would be desirable. Previously, for instance, Disney (2000) discussed the reform options in OECD countries for public pension programmes in difficulties. He analysed the strengths and weaknesses of the reform strategies being discussed and implemented in various countries and considered two main strategies: i) retaining a strong unfunded component and ii) involving a strong funded private component. In the first group, two options are possible: a “parametric” reform or an “actuarially fair” programme and in the second group either by “clean break” privatization (i.e. no further contributions are made into the existing unfunded programme) or by a partial privatization (only certain individuals are allowed to join the funded scheme or allowing individuals the choice of joining a funded or unfunded scheme). The strategy of keeping a strong unfunded component was presented as a defensible one, in particular the “parametric” reforms by “raising legal retirement age, or more specifically linking it explicitly to expected longevity is generally a key policy to the problem of financing public pension programmes.” Funded schemes can also be attractive: a funded scheme is transparent “in the sense that benefits are explicitly related to contributions and capital market performance rather than to some formula of the public programme.” The transition issue has to be handled and there is the conflict over who bears the burden of the transition: current taxpayers or pensioners or future generations of taxpayers and pensioners. Another drawback relates to the fact that it “rules out any explicitly redistributional component to the public pension programme and it subject participants to potential investment risk and annuity rates will continue to fall as longevity increases.”
2 Greece, Italy, Portugal and Spain.

11
Recent developments in financial markets turned this discussion more pertinent. PAYG schemes are relatively robust to the financial crisis. In the case of persistent economic downturn and higher public debt it may increase the need for adjustments in the pension schemes in order to ensure their long term sustainability. Private pension funds saw their asset value dropping by 20% on average in the OECD countries between January and October 2008 (OECD 2009). Even if long-term investment performance is rather healthy it highlights the need of looking again to the best way of dealing with funded schemes. Defined benefit (DB) schemes are the main private schemes that are now paying (defined) pensions but the reduction of their assets may imply adjustments to indexation or contributions or even to close them to new members. At the same time, defined contribution (DC) plans are expected to intensify their growing trend. However, in these schemes the beneficiary takes the investment risk and they may not ensure an adequate income at retirement.
Against this background, the reforms of the existing unfunded pension systems reveal to be of utmost importance across European/OECD countries. This is equally true for the Portuguese public pension system.

12
4. Recent Reform Measures 4.1. Description of the reform As previously described, in October 2006 the government and social partners reached an agreement on the reform of the social security pension system and the main measures of this reform were also applied to the CGA scheme since 20083. The most representative measures are:
i) Sustainability factor
To tackle the considerable impact that the increase in life expectancy has on the social security systems, the sustainability factor was introduced. The sustainability factor is the ratio between life expectancy in 2006 and life expectancy in the year prior to retirement. It is applied to all new required pensions since the beginning of 2008:
⎟⎟⎠
⎞⎜⎜⎝
⎛×
−1
2006
tt LE
LEPension
where, LE- Average Life Expectancy at the age of 65, published in an annual basis by the INE. t- year the pension is required.
It should be stressed that contributors can opt for a combination between two extreme alternatives4:
- they can delay their retirement until they completely offset the effect of the sustainability factor; or
- they can retire at the statutory age and accept the financial penalty levied on the pension. In the model developed for CGA, it was assumed that in order to partly offset the financial penalty derived from this factor, CGA contributors tend to postpone the retirement age in line with the evolution of the sustainability factor until the legal age limit for retirement (70 years old).
Taking into account the evolution for the weighted average of (male and female) life expectancy at 65 in the EUROPOP2008 scenario, pointing to an increase of around 5 years by 2060 the projected trend for the sustainability factor is the following5:
Table 3. The sustainability factor evolution
2007 2010 2020 2030 2040 2050 2060
Sustainability factor 1,00 0,97 0,93 0,88 0,84 0,81 0,77
Sources: INE and Eurostat (EUROPOP 2008).
3 Laws no. 52/2007 and no. 11/2008. 4 A third possibility is also available. This involves additional voluntary contributions to public or private capitalization schemes. In its essence, this alternative is already available through pension savings funds (known as PPRs). 5 See Annex B.

13
ii) The new rule for updating pensions
This new rule determines that, from 2008 on, the annual increase of pensions is linked to an effective change rate of the Consumer Price Index (CPI) and also to the effective growth of Gross Domestic Product (GDP), which affects the social security revenue pattern. This means a change from recent years, where there have been pension increases significantly higher than inflation, above all as a result of the rise in the minimum pension level6. The new rule brings pension updates within a regulatory framework, removing the discretionary element. The annual increase of all types of pensions7 should be set according to Table 4. Table 4. Rule for updating pensions
GDP real variation rate
less than 2%
GDP real variation rate
from 2% to 3%
GDP real variation rate
equal or greater than 3%
Pensions under
1.5 IAS
CPI change rate
CPI change rate + 20% GDP real variation rate
(minimum: CPI change rate + 0.5 percentage points)
CPI change rate + 20% GDP real variation rate
Pensions 1.5 to
6 IAS
CPI change rate – 0.5 percentage points
CPI change rate
CPI change rate + 12.5% GDP real variation rate
Pensions
6 to 12 IAS
CPI change rate – 0.75 percentage points
CPI change rate – 0.25 percentage points
CPI change rate
Pensions above
12 IAS no update no update no update
Source: MTSS. Note: IAS stands for the social support index Indexante de Apoios Sociais.
At this point, it should be mentioned that in order to assure that the National Minimum Wage itself constitutes an instrument of Labour Market policy, it was replaced as a reference for the indexation of pensions by a new social support index Indexante de Apoios Sociais (IAS). For 2007, it was defined as the 2006 mandatory minimum wage updated by the consumer inflation of that year (Law 53-B/2006). This Law provides that the rule for IAS updating in the future is to be identical with the rule for updating lower pensions (lower bracket), which is independent from the annual update set for the National Minimum Wage. To determine the reference GDP growth rate it was established that, in the first year of implementation of this new rule (2008), the GDP considered should be the real growth rate of GDP in the previous year and, thereafter, the consideration of average GDP growth rate of the two
6 The main reason for this was the convergence of minimum old age and disability pensions to the mandatory minimum wage until 2006 as set down in the Social Security Framework Law of 2002 (Law 32/2002). 7 Including minimum pensions that range from 44,5% to 89% of IAS and are updated according to the first bracket of the pensions value.

14
previous years8. The relevant CPI corresponds to the effective average growth rate of CPI (without considering housing prices) regarding the last 12 months available on November 30 of the year before the pensions update. In the modelling of CGA pensions it was assumed that this rule corresponds to indexation to the consumer price index growth plus 0.1 percentage points (minus 0.4 percentage points), depending on the economic growth above (below) 2%. These drifts were obtained by using the 2007 distribution for CGA pension amounts and computing a weighted average of the drifts for each bracket of pension value, according to the above mentioned rule. In 2007, 32% of the pensioners belonged to the first interval, 60% to the second and 8% to the highest one. This distribution was held constant throughout the projection horizon. However, the evolution of this distribution is somehow undetermined: on the one hand, as the IAS benchmark is updated according to the lower bracket, higher pensions tend to steadily move to lower brackets; on the other hand, the maturing of the system and incentives to postpone retirement lead new pensions to be higher than those that leave the system. If this second effect prevails, the hypothesis considered tends to be conservative as future updating will be less generous than assumed. According to the CGA legislation, this rule applies from 2008 on only for pensions less than 1.5 IAS, from 2009 on for pensions between 1.5 and 6 IAS and from 2011 on for pensions above 6 IAS. However, in the projection exercise, it was assumed that the rule applied to the whole range from 2008 on for all pensioners. The approved legislation foresees that this rule for updating pension will be re-assessed every five years, in order to check its adequacy in terms of social security system financial sustainability and of the pensions’ real value. However, in the current exercise, under a “no policy change” general rule, it was considered to prevail.
iii) An early transition to a pension benefit formula that considers contributions over the
whole career
The Decree Law 35/2002 set out a formula for calculating the amount of new pensions in the social security general regime9 which differs from the one set out in the Decree Law 329/1993 in two fundamental points: it takes the earnings over the whole contributive career (instead of the best ten out of the last fifteen years) and sets out different accrual rates, depending on the workers compensation (the higher the compensation, the lower the marginal rate, varying between 2.3 and 2 percent) and on career length, as presented in Table 5.
8 This average was firstly used for the 2009 update, taking into account the GDP growth in 2008 and 2007. The annual GDP growth rates to be considered are the ones ended on the third quarter of the year prior to the pension update or the quarter before if there are no official figures regarding the third quarter until December 10. 9 That is the one that applies to CGA (new) subscribers since September 2003.

15
Table 5. Pension accrual rate
Contributive career Reference earnings Accrual rate
less than 21 years - 2.00%21 or more years until 1.1 IAS 2.30%
from 1.1 to 2 IAS 2.25% from 2 to 4 IAS 2.20% from 4 to 8 IAS 2.10% upper 8 IAS 2.00%
Source: MTSS. The 2002 decree also established a transition period, during which the pension to be applied will be whichever is higher, either the new regime one or as calculated as a weighted average of the pension from the last regime and from the new regime, where the weights correspond to the number of years of service before and after 2001. The same decree set down 2017 as the start of the transitional period, but in 2006 the decision was taken to bring forward the transition to the new formula to 2007. As far as the transition to the new pension benefit formula affects the income of new pensioners there are transition clauses to the full application of the new rules:
i. to all contributors registered on Social Security before 2001 and that will retire before 2016, the pension is calculated according to a temporary benefit formula that accounts proportionately for the length of service before and after 2007 through the application of a formula that takes into account both the old and new benefit:
CCPCPPension 2211 ×+×
=
where, Pension is the monthly amount of statutory pension (before the application of the sustainability factor); P1 stands for the pension calculated with the benefit formula that accounts for the best ten out of the last fifteen years of wage history10 (old formula); P2
stands for the pension calculated according to the new formula that considers the whole contributory career; C is the number of years of contributory career with registered wage; C1 stands for the number of years of contributory career with registered wages until the 31st of December 2006; and C2 stands for the number of years of contributory career with registered wages after the 1st of January 2007.
ii. for those registered on Social Security before 2001 but that will retire after 2016, pension will be calculated as a weighted average between the pensions that result from the new benefit formula and the old benefit formula, with reference to the length of service before and after the 31st of December 2001.
In the computation of pensions, the component that takes into account the best ten out of the last fifteen years of declared wages will always be based on the effective last years of contributory career and not on the last fifteen years before the introduction of the mechanism of transition to the new benefit formula.
10 It is set according to the number of calendar years with a contributory density equal to or higher than 120 days (up to the limit of 40).

16
iii. for all individuals first registered on Social Security after 2002, the pension will be calculated with the new rules, accounting the whole contributory career (up to the limit of 40 years).
In the case of CGA scheme, the anticipation of this transitional period is in force after 2008. However, the effects of this change are quite mitigated in this subsystem; for the contributors covered by the Estatuto da Aposentação, the only relevant change is higher accrual rates for the years of contribution from 2008 on instead of 2017 on. For the other public employees (enrolled since September 1993), the new rules also apply what concerns the consideration of the whole contributive career instead of the best ten out of the last fifteen years, but the probability of contributors retiring before 2016 is quite small and, therefore, the impact is negligible. Table 6 synthesizes the evolution of pension calculation rules for CGA contributors. iv) Additional penalty for early retirement
Another of the measures – within the scope of the so-called “promotion of active ageing” – consists in introducing a disincentive to early retirement, with a bigger financial penalty for retirement prior to the legal retirement age, but computed on a monthly basis (0,5% for each month of anticipation) instead of on a yearly basis (4,5% per year). This measure entered into force in 2007 for Social Security but, in the case of CGA, it is to be applied to new pensions from 2015 on. The current projection exercise includes the additional financial penalty and does not consider any changes in the probability of those eligible actually retiring. This assumption is a cautious one in what concerns the effects of this reform measure. Table 7 compares the evolution of entitlement conditions for full old-age pensions and early retirement pensions in the CGA scheme.

17
Table 6. Calculation rules for full old-age pension in the CGA scheme
CGA regime from 1993 on DL 35/2002 from 2006 on from 2007 on from 2008 on
Estatuto da Aposentação (hired until August 1993)
P = 90% last wage (LW) (since 1972)
P = P1 + P2 P1 = LW x C1 x R1 P2 = RE x C2 x R2 RE = all career reference earnings (of 2nd part) C1 = %career until 2005 C2 = %career since 2006 R1 = accrual rate 2.5% (variable with C from 36 to 40) R2 = accrual rate (2% until 2015 and 2 to 2.3% thereafter)
FP = P x SF SF = sustainability factor P = P1 + P2 P1 = LW x C1 x R1 P2 = RE x C2 x R2 R2 = accrual rate (2 to 2.3%)
Hired from September 1993 on
P = BE x 40 x 2% BE = best earnings 10 out of last 15 years
until 2001 Best of A) or B)*
A) P2017 on = P1 + P2 P1 = BE x C1 x 2% P2 = RE x C2 x R2 C1 = %career until 2001 C2 = %career since 2002
P2007-2016 = P1 + P2 P1 = BE x C1 x 2% P2 = RE x C2 x R2 C1 = %career until 2006 C2 = %career since 2007
FP = P x SF
since 2002 B) P2017 on = RE x 40 x R2 FP = P x SF Notes: * In the case of public employees, the best case is B) as they have less then ten contributive years (BE = RE) and the accrual rate is higher in case B.
The shaded cells refer to regimes not applicable any longer.

18
Table 7. Entitlement conditions (transitory period)
A. Full old-age pension
2005
2006
2007 2008 2009 2010 2011 2012
2013
2014 2015
LRA
60
60.5
61 61.5 62 62.5 63 63.5
64
64.5 65
Contr. years
36
36.5
37 37.5 38 38.5 39 39.5
40
40 40
Notes: LRA stands for legal retirement age.Special regimes have longer convergence periods to LRA = 65 and 40 contributive years.
´
B. Early retirement pension
2005
2006
2007 2008 2009 2010 2011 2012
2013
2014 2015
Age
55
55
55 55 55 55 55 55
55
55 55
Contr. years
36
36
36 33 30 25 23 21
19
17 15
Note: For each year before LRA there is a 4.5% penalty in the pension value. From 2015 on it increases to 0.5% per month of anticipation. In case only LRA is attained, the pension value is reduced proportionally to the contributive years missing. Source: CGA. v) Other measures
Promoting active ageing Aside from the reform measures included in the projections there are other measures aimed at promoting active ageing, namely: for long contributory careers, the no-penalty retirement age can be reduced one year for each of the three years of the contributory career above 30 years at the age of 55 (beneficiaries can retire, without penalty, at the age of 64 with 42 years of contributions, at the age of 63 with 44 years of contributions, at the age of 62 with 46 years of contributions and so on). When claimed after 65 years of age (with more than 15 calendar years of earnings registration and, at most, 70 years of age), the pension is increased by applying a monthly rate to the number of months of effective work completed between the month the pensioner reaches 65 years of age and the month of the pension beginning, as presented in Table 8. This means, for instance, that an individual with 65 years old that decides to postpone retirement for one year will get a 3.96% bonus if he has a career of 20 contributive years or 12% in the case of having 40 contributive years.

19
Table 8. Incentives for postponing retirement
Contributive career Monthly bonus rate (%)
From 15 to 24 0.33From 25 to 34 0.50From 35 to 39 0.65
40 or more 1.00 Source: MTSS. Introduction of a ceiling to higher pensions In a context of sustainability strengthening of social security and in order to complement the professional solidarity embedded in the pension benefit formula, but also safeguarding the earning-related principle, it was considered adequate to establish a pension ceiling (at 12 IAS). It must be stressed that pensions that result from a benefit formula that accounts the average of lifetime wages do not have any ceiling. This way this measure has a temporary effect. In terms of the pension ceiling it was decided:
• Introduce a pension ceiling for the new pensions, exclusively for the component that considers the best ten out of the last fifteen years of recorded earnings (P1);
• When the pension component calculated with the new formula (P2) is higher than the pension component calculated with the old formula (P1), no pension ceiling will be applied to P1;
• If P1 and P2 are higher than the pension ceiling and P1 is larger than P2, then only the new formula will be applied (where there is no pension ceiling);
• All existing pensions above the ceiling will not be annually updated. This rule does not apply when the two prior conditions are verified for the new pensions and for those computed under previous legislation (considering that the value of P2 is calculated according to the new formula). This rule, as the new indexing rules, should be re-assessed every five years.
However, this restriction only applies to a few cases (less than 1% of all pensions).
4.2. Effects of the recent reform measures
The reform measures that entered into force in 2007 for the Social Security regime and in 2008 for the CGA scheme are measures that, by their nature, will provide effects essentially in the long run. These effects were estimated through projection exercises carried out by authors for the CGA scheme and by the Ministry of Labour and Social Solidarity for the Social Security system. In the case of the Social Security system, the reform measures and modelling assumptions are similar to those of the CGA scheme, except in the following cases:
i. regarding the introduction of the sustainability factor, it was assumed that Social Security contributors accept the financial penalty retiring at the statutory age, with no changes in the behaviour of the economic agents. This assumption makes the

20
projections “conservative”. In fact, an increase in the retirement age would lead to a higher participation rate for older workers (whose importance is increasing) raising the contributory revenue, which is only partially offset by a marginal increase of the new pensions value for those contributors who retire later11.
ii. in the new updating rule for Social Security pensioners, it was assumed that it corresponds fundamentally to the consumer price indexation plus 0.35 percentage points (minus 0.15 percentage points), depending on the economic growth above (below) 2%. These drifts were obtained from the 2005 distribution for Social Security pension amounts and computing a weighted average of the drifts for each bracket of pension value according to the above mentioned rule. In 2005, 72% of the pensioners belong to the first bracket, 24% to the second and 4% to the highest one.
According to the projection results for both subsystems, those measures will allow for a reduction of less than 1 percentage point of GDP in 2020 but around 4 percentage points by 206012 (Table 9). Another important feature is that the peak year for pension expenditure in now within the projection horizon (2053) while in the scenario before the recent reform, measures show that the pension expenditure trend was continuously increasing. Given the assumptions regarding demography and employment, which foresee a progressively higher employment rate for older workers as a result of the measures designed to promote active ageing, the contributions revenue trend tends to stabilize from 2040 onwards.
Table 9. Projected public pension expenditures and contributions (% of GDP)
2007 2020 2030 2040 2050 2060 2060-2007 Peak year
Public pension spending after reform 11,4 12,4 12,6 12,5 13,3 13,4 2,1 2053
Public pension spending before reform 11,4 13,3 14,7 15,5 16,9 17,5 6,1 2060
Contributions after reform 10,7 10,4 9,6 9,2 9,0 9,0 -1,7 2010 Sources: MTSS and authors’ calculations.
The effects of the reform measures in containing the public pension expenditure growing trend are quite visible when analysing its evolution since 1960 until the horizon of the projections (Figure 10).
11 For further details on this issue, see Pinheiro and Cunha (2007). 12 These projections were made in the context of the Economic Policy Committee Working Group on Ageing Population and Sustainability and, therefore, used the common assumptions on demography and macroeconomic developments (EPC 2008). The main assumptions used in these projections are presented in annex B and the CGA model is described in annex C.

21
Figure 10. Pension expenditures (% of GDP)
0,0
4,0
8,0
12,0
16,0
1960
1970
1980
1990
2000
2010
2020
2030
2040
2050
2060
Sources: CGA, MTSS and authors’ calculations.
In the particular case of CGA, as it is a closed system since 2006, the effect of the more recent reforms is more limited in the long run, representing a 0.3 percentage points of GDP reduction in the public expenditure by 2060 (Table 10). However its impact increases by 2040, while the number of pensioners is still growing. The new rules also anticipate the peak year for CGA pension expenditures to be 2009 while the former maximum was reached in the 2020s, when the cohorts corresponding to peak admissions in the Public Administration retire.
Table 10. Projected CGA pension expenditures and contributions - CGA closed system (% of GDP)
2007 2020 2030 2040 2050 2060 2060-2007 Peak year
CGA pension spending after reform 4,1 4,0 3,9 2,9 1,8 0,9 -3,2 2009
CGA pension spending before reform 4,1 4,3 4,3 3,4 2,2 1,2 -3,0 2025
Contributions after reform 2,1 1,1 0,5 0,1 0,0 0,0 -2,1 2007 Sources: CGA and authors’ calculations.
In order to better assess the effects of the reform measures on the pension system of all public employees, we run the CGA model in the counter factual situation of non-closure of CGA to new registrations, assuming that these would come under the rules pertaining to public employees registered in the Social Security system. As additional assumptions it was considered that: i) no enrolment of non-public employees would take place as has happened in the past, mainly with the employees of public-owned or formerly public-owned enterprises that were traditionally registered in the CGA; and, ii) the number of new public employees would respect the rule “2 out 1 in” until 2011, as defined in the December 2007 update of the Portuguese Stability Programme, and the share of public employees in total employment would remain stable thereafter. It should be recalled that in the context of the Public Administration reform enhanced in 2005, the reduction in the number of admissions in public service cut the public employment share from about 15% in 2005 to 13.5% in 2007 and it is estimated to remain at around 12% after 2011.

22
In this scenario, the recent reform measures allow a declining in the pension expenditure related to public employees of 0.6 percentage points of GDP by 2060, representing a reduction of almost 2 percentage points of GDP from 2007 expenditure (Table 11).
Table 11. Projected public employees pension expenditures and contributions – “CGA open system” (% of GDP)
2007 2020 2030 2040 2050 2060 2060-2007 Peak year
CGA pension spending after reform 4,1 4,0 3,9 3,1 2,4 2,2 -1,9 2009
CGA pension spending before reform 4,1 4,4 4,4 3,7 3,1 2,8 -1,3 2026
CGA pension spending before 1993 reform (1) 4,1 4,9 5,1 4,9 4,4 4,0 -0,1 2029
Contributions after reform 2,1 1,6 1,4 1,3 1,3 1,3 -0,8 2007Note: (1) But starting from actual 2007. Sources: CGA and authors’ calculations.
As a way of evaluating the process of convergence of the CGA to the Social Security regime that started in 1993, the estimated effects of the reforms since then are worth a reduction of 1.8 percentage points of GDP by 2060. It should be noted that this effect is somehow underestimated as the exercise takes as a starting point the 2007 pension expenditure value which is already affected by the measures adopted in the meantime. In the no convergence scenario, the pension expenditure is related only to public employees, and it would rise by 1 percentage points by 2030 and afterwards it would decrease reflecting the evolution of public employment until 1990’s and its reduction in the 2000s. How these reductions in public pension expenditure reflect on the pensioners’ welfare is also a question that should be analysed. Two measures usually used are the replacement rate and the benefit ratio. The first one compares the value of new pensions with the last wages and the second one relates the average pension to the average wage of the economy. Table 12 shows the evolution of the “average” gross replacement rate, where is considered the average of new gross pensions, reflecting a wide range of situations in terms of age of retirement, contributive career length and applicable regimes, namely in the transitory period that goes until 2042 in the case of the Social Security system. Regarding CGA the last new pensions should occur around 2045, as this system was closed at the end of 2005.

23
Table 12. Replacement rate
(in %) 2007 2020 2030 2040 2050 2060
Replacement rate
CGA(1) 81 75 72 72 - -
Social security scheme(2) 58 53 49 53 54 56
Old age(3) 61 55 51 55 55 58
Coverage CGA 14 14 14 13 11 8 Social Security 83 82 82 83 86 88Notes:(1) Ratio between the average pension of new pensioners (earnings-related old-age and disability pensioners) and the average wage of CGA contributors.(2) Ratio between the average pension of new pensioners (earnings-related old-age and disability pensioners) and the average declared wage of general regime of wage earners.(3) Considering only old-age pensions. Sources: CGA, MTSS and authors’ calculations.
It can be observed that, as expected, the replacement rates in the CGA regime are significantly higher than in the Social Security regime. The long-term evolution is similar in both systems with a reduction before 2030 reflecting both the less “generous” rules of pension formation and higher increases in wages in line with the productivity projections. However, from 2030 onwards, the average replacement rate is projected to recover to levels similar to the current ones due, essentially, to longer contributive careers of new pensioners. In the specific case of CGA, before the consideration of the recent reform measures, this “average” replacement rate would range from 81 to 76% between 2007 and 2040, as a result of the changeover to the social security rules in the convergence period initiated in 1993 and strengthened in 2005.
The evolution of the replacement rate along with the pension updating formulas reflects on the benefit ratio13 developments. In the case of CGA, the ratio14 reaches its peak in the late 2020s and decreases thereafter. This scheme is only relevant until the 2040’s. As regards to Social Security, the benefit ratio reduces its value until 2040, recovering afterwards in line with the evolution of the replacement rate.
Table 13. Benefit ratio (in %)
2007 2020 2030 2040 2050 2060
Benefit ratio
CGA 73 74 75 66 - -Social security scheme 46 47 43 39 40 42
Sources: CGA, MTSS and authors’ calculations.
13 Computed as the average old-age pension (including early retirement pensions) over the average wage. 14 In the case of CGA, the average pension includes also disability pensions.

24
The models used in these projections do not allow for the computation of individual replacement rates, as contributors and pensioners are modelled grouped by age and gender strata. However, taking the economy wages evolution and the rules applicable in each year of the projection horizon it is possible to calculate “theoretical” replacement rates for individuals entitled to a full old-age pension at different points of the earnings distribution (Table 14.A).
Table 14.A. “Theoretical” gross replacement rates
CGA (in %)
2007 2020 2030 2040 2050 2060
Individual Reference Earnings 50% average earnings 89 78 75 68 - - 75% average earnings 89 78 75 68 - - 100% average earnings 89 78 75 67 - - 200% average earnings 89 77 74 66 - - 250% average earnings 89 77 73 65 - -
Social Security (in %)
2007 2020 2030 2040 2050 2060
Individual Reference Earnings 50% average earnings 92 75 63 59 58 58 75% average earnings 77 66 63 59 58 58 100% average earnings 77 66 62 59 58 57 200% average earnings 77 65 62 58 57 56 250% average earnings 77 65 62 57 57 56
Sources: CGA, EPC and authors’ calculations.
As expected, these replacement rates computed for complete contributive careers are higher than the average ones and their evolution mainly reflects the effect of two measures: the introduction of the sustainability factor and the new pension formula that differentiates the accrual rate according to the reference earnings. This leads to a slightly smaller reduction in the replacement rates for lower earners than for higher earners. In these estimates, it is assumed that individuals retire as they fulfil the entitlement conditions and do not postpone retirement. If that is the case, i.e. labour market conditions and individual choices match favourably in postponing retirement, the financial penalty induced by the sustainability factor would be (at least partially) offset according to the rules presented in Table 8. Excluding the sustainability factor effect, the replacement rates would present a more stable pattern, in particular in the Social Security case (Table 14.B.). For CGA, the reduction is more marked as a result of the convergence effect of the pension formation rules to the ones of the Social Security.

25
Table 14.B. “Theoretical” gross replacement rates without the sustainability factor
CGA (in %)
2007 2020 2030 2040 2050 2060
Individual Reference Earnings 50% average earnings 89 84 85 81 - - 75% average earnings 89 84 85 81 - - 100% average earnings 89 84 85 80 - - 200% average earnings 89 83 83 78 - - 250% average earnings 89 83 83 77 - -
Social Security (in %)
2007 2020 2030 2040 2050 2060
Individual Reference Earnings 50% average earnings 92 75 71 70 72 75 75% average earnings 77 71 71 70 72 74 100% average earnings 77 71 71 70 72 74 200% average earnings 77 70 70 69 71 73 250% average earnings 77 70 70 68 70 73
Sources: CGA, EPC and authors’ calculations.
4.3. Further analysis on the two main measures
4.3.1. Sustainability factor
Recent reform measures have an estimated effect of reducing public pension expenditure by about 4 percentage points of GDP by 2060. More than 50% of this result is explained by the introduction of the sustainability factor that accounts for 2.4 percentage points of GDP (Table 15).
Table 15. Impact of the sustainability factor in pension expenditure projections
(% of GDP) 2007 2020 2030 2040 2050 2060 Peak year
Projections after reform (1)Public pensions 11,4 12,4 12,6 12,5 13,3 13,4 2053
Projections exclud. sust. factor (2)Public pensions 11,4 12,7 13,4 13,8 15,2 15,9 2060
Difference (1) - (2)Public pensions 0,0 -0,4 -0,8 -1,3 -1,9 -2,4 Sources: CGA, MTSS and authors’ calculations.
These calculations are somewhat prudent by assuming that CGA contributors postpone retirement proportionally to the evolution of the sustainability factor, not accepting the whole financial penalty

26
associated with retirement at age 65 as in the case of the Social Security beneficiaries. However, CGA new retires will not be relevant from 2045 on as it is a closed system since 2006. As discussed in Pinheiro and Cunha (2007), if contributors postpone their retirement beyond the legal retirement age, the “saving effect” due to the higher employment rate and the reduction of the period during which individuals receive pensions is higher than the marginal growth of the pension amount due to the increased career.
Moreover, with this factor, the uncertainty underlying the demography projections, in particular in the expected life expectancy gains, is strongly minimized in the projections of public expenditures on pensions.
4.3.2. Pension updating rule and dynamic progressivity
According to the pensions update rule, presented in Table 4, the annual update rate decreases with the pension value. For example, assuming a 2% inflation rate and a 2% real GDP growth, pensions below 1.5 IAS are updated 2.5% while pensions above 12 IAS remain unchanged. In dynamic terms, this difference reduces the gap between extreme values of pensions and therefore decreases the inequality in income distribution of pensioners15. However, two factors partially offset this effect: on one hand, even the highest pensions will eventually start to be updated in the future and, on the other hand, for the higher pensions, tax system progressivity combined with updating rates lower for pensions than for tax parameters reduces the average tax rate. This turns the net amount of the pension updating higher than before tax in the case of higher pensions.
Figure 11. Pensions evolution as a proportion of IAS [15 years horizon]
0,01,0
2,03,0
4,05,0
6,07,0
8,09,0
10,011,0
12,013,0
14,015,0
16,0
0,5 1,0 1,5 2,0 2,5 3,0 3,5 4,0 4,5 5,0 5,5 6,0 6,5 7,0 7,5 8,0 8,5 9,0 9,5 10,0
10,5
11,0
11,5
12,0
12,5
13,0
13,5
14,0
14,5
15,0
Multiple of IAS (n=0)
Mul
tiple
of I
AS (n
=15)
Pension(t+15)/IAS(t+15)
Pensions and IAS updated atsame rate
Note: assumptions - inflation rate of 2%, GDP growth rate of 2% and fiscal parameters annual update of 2% Source: authors’ calculations.
15 Whitehouse (2009) discusses the effects of “progressive indexation” in four countries, including Portugal, and finds small redistributive effects on the pensioners’ wealth in particular in the cases of Italy and Portugal.

27
The first effect is illustrated in the Figure 11. Taking a pension that in the initial period is equivalent
to 15 IAS (and therefore not updated in the first period), due to IAS annual updating, it ends up
below the 12 IAS threshold after some periods. In that case, for instance, after 15 years it is equal to
approximately to 11.3 IAS.
The second effect may be demonstrated through the example of a pension before tax B
tp in period t. After n periods (years), the pension after tax is given by:
ntn
nBt
Netnt taxpp ++ −+= )1( θ , (1)
where nθ is the average annual indexation rate after n periods and t ntax + is the tax amount.
Annual updating rate, as defined in Table 4, depends on: i) the pension value (p), ii) the real GDP growth rate (ϕ ) and iii) the inflation rate (π ). Therefore,
),,( πϕθ pfn = . (2)
Tax amount ( ttax ) depends, each year, on the pension amount and on the tax parameters. As the tax regime for personal income is progressive, average tax rate grows with the pension value. However, in dynamic terms, as tax parameters are usually indexed to expected inflation rate, for pensions with annual updating rates lower than expected inflation, the average actual tax rate decreases over time. Therefore, the actual rate for pensions update after tax is higher than before tax (Figure 12).
Figure 12. Average update rate for pensions [15 years horizon]
0,0%
0,5%
1,0%
1,5%
2,0%
2,5%
3,0%
0,5
1,5
2,5
3,5
4,5
5,5
6,5
7,5
8,5
9,5
10,5
11,5
12,5
13,5
14,5
Multiple of IAS
Ave
rage
ann
ual u
pdat
e ra
te
Pension before tax Pension after tax
Note: assumptions - inflation rate of 2%, GDP growth rate of 2% and fiscal parameters annual of 2%. Source: authors’ calculations.

28
To evaluate the effect of the indexation rule and taxation in pensioners’ distribution of income, the initial pension distribution is compared with the one several periods later. The comparison is made through the evolution of percentile ratios and by using the Gini index. These were computed by using the Personal Income Tax database for 2007 (latest information available), which includes all pensioners that are legally obliged to declare taxable income and allows for simulation modelling16. This database presents, however, some caveats for the purpose we are using it and so they should be mentioned: i) sample representativeness – as the lowest pensions are tax exempt, the sample is biased to higher pensions; ii) pensions aggregation – pensions are reported in an aggregate way, i.e. it is not possible to disentangle the value of each pension for individuals that receive more than one pension, which is not neutral in terms of the indexation rule effects; iii) income aggregation for tax purposes leads to an average tax rate and not necessarily to a specific tax rate on pensions income. We assumed that pensioners do not receive income from other sources, which is somewhat a strong hypothesis. The parameters updating between 2007 and 2009 took into account the available information on GDP growth, inflation rate, IAS and tax parameters updates. From 2009 onwards, we considered the EPC (2008) assumptions for GDP growth and inflation rate (constant at 2%), assuming tax parameters to be indexed in line with inflation. The results obtained are presented in Table 16. It provides evidence for the pension update rule’s progressivity with both the percentile ratio and the Gini Index decreasing in the time period considered. Before tax, percentile ratios decline 4.3% over a ten year’s horizon and 8.9% over twenty years. Also Gini coefficient decreases 2.4% and 5%, respectively. Tax effect reinforces these results except in the case of the percentile ratio over twenty years due to the tax impact (discussed above) on highest pensions.
Table 16. Pension distribution effects
Unit: average growth rates (in %) Number of Years
10 20 IAS update 2.31 2.36 Pensions update Before tax 1.90 1.97 After tax 1.93 2.00 Distribution of pensions* Before tax Percentile ratio (P75/P25) -4.3 -8.9 Gini coefficient -2.4 -5.0 After tax Percentile ratio (P75/P25) -4.3 -8.7 Gini coefficient -2.6 -5.2
Note: * End-of-period growth rates. Source: authors’ calculations.
16 It covers around 1.5 millions of pensioners, which account to 83% of total public expenditure on pensions.

29
Another important aspect is related to the fact that average pension update before tax is lower than 2%, the value considered for inflation rate. However, the rates denote a small increase when considering after tax pension values, which reflects a lower growth of tax revenue than the one of the average pension.
5. Sensitivity analysis
The results presented above rely strongly on the demography and macroeconomic assumptions considered. In order to assess the robustness of the projections several sensitivity tests were carried out. Each sensitivity scenario was computed in relation to the baseline scenario with the respective parameter change, ceteris paribus.
An increase in the employment rate of 1 percentage point does not change the results significantly, while a higher labour productivity scenario of 0.25 percentage points induces a decrease in total pension expenditure by 0.7 percentage points in 2060, as pension updating is no longer linked to wage increases (and productivity gains).
Figure 13. Pension expenditure under different scenarios (%GDP)
10
11
12
13
14
15
16
17
18
2007 2010 2020 2030 2040 2050 2060
Baseline Zero Migration Higher life expectancy Higher employment rate Higher labour productivity"Permanent shock"
Sources: CGA, MTSS and authors’ calculations
In relation to demography, we tested both the impact of an increase in life expectancy of one year by 2060 and the extreme assumption of zero migration. A one year increase in life expectancy leads to a rise in the pension expenditure ratio of 0.4 percentage points by 2060. This moderate increase reflects the counter effect of the sustainability factor, minimizing the pension expenditure exposure to the uncertainty of the evolution of life expectancy. The assumption of zero migration is by far the most extreme one, leading to an increase of the pension expenditure ratio by almost 3 percentage points in 2060 when compared with the baseline scenario. This assumption is associated to a reduction of employment and economic growth and, therefore, the GDP “denominator effect” exceeds the “numerator effect” of lower pension expenditures in the long-term.

30
Given the more recent economic developments, which were not incorporated in the macroeconomic assumptions underlying the baseline scenario17, additional tests were made in order to evaluate the impact of the current economic downturn in the long term projections. At this juncture, it can be considered that the economic downturn is temporary and there will be a convergence to the baseline trend or, alternatively, that there will be a “permanent shock” in the terms of productivity growth and employment rate.
Even considering the “permanent” effects of the economic downturn, assuming a reduction of 0.25 percentage points in the productivity rate and an increase of 1% in the unemployment rate, the projected expenditure for public pensions would rise by 0.9 percentage points of GDP in 2060 (Table 17). Considering only the public employees pension expenditure, the increase would be of 0.2 percentage points of GDP.
Table 17. Effects of a permanent economic downturn
2007 2020 2030 2040 2050 2060
Public pension spending Baseline scenario 11,4 12,4 12,6 12,5 13,3 13,4 "Permanent shock" effect 0,0 0,3 0,5 0,7 0,8 0,9
Public employees' pension spending Baseline scenario 4,1 4,0 3,9 3,1 2,4 2,2 "Permanent shock" effect 0,0 0,0 0,1 0,1 0,2 0,2 Sources: CGA, MTSS and authors’ calculations.
In case of a temporary shock, the effects on the pension spending projections would be minor, in particular in the long-run. According to the modelling assumptions used, relatively lower productivity (and wages) in the short run would result in relatively lower pensions in the future but due to the “denominator effect”, the pension expenditure as a share of GDP should still be higher than in the baseline scenario.
On the basis of the sensitivity tests’ results, changes in the demography scenario may have larger effects on the pensions’ projections than different macroeconomic assumptions (not considering second-order effects on demography). Pension expenditure revealed particular sensitivity to migration flows assumptions.
6. Public Finance Sustainability
Before the introduction of the most recent pension reform package (2006-2008), the projected increase in the age-related public expenditure was extremely high, reaching 10.1 percentage points of GDP between 2004 and 2050. Out of this, 9.7 percentage points related to pension spending18. In
17 The long-term macroeconomic projections were based on the European Commission Spring 2008 prospects for 2008-2010. 18 DGECFIN(2006).

31
its analysis of the long-term sustainability of public finances in the EU, the European Commission had classified Portugal as a high risk country in 2006. This assessment depends on the initial budgetary position of the Member State (i.e. in the years considered by the annual updates of the national stability or convergence programmes), on the long-term projections on age-related expenditure, and on a wide range of other quantitative and qualitative indicators, as well.
One of these indicators is the sustainability gap S2, which measures the size of a permanent budgetary adjustment that allows fulfilling the inter-temporal budget constraint over an infinite horizon. This indicator may be decomposed into the impact of the initial budgetary position gap to debt stabilizing the primary balance (IBP) and the impact of the long-term change in the primary balance (LTC), which provides the additional adjustment required to finance the increase in public expenditure over an infinite horizon. It is usually computed for two scenarios: the baseline scenario, which takes the programme’s first year structural primary balance into account, and the programme scenario that assumes that the medium-term programme objectives for the structural balances are achieved.
In the October 2006 Report, the sustainability gap S2 in the programme scenario was 5.2 percentage points of GDP, significantly above the EU average (1.6 p.p.), reflecting the high value of the LTC component (Table 18). Considering the effect of the recent reform measures, the value of this component halved, allowing a significant reduction in the sustainability gap S2 to 2.0 percentage points of GDP.
Table 18. Sustainability indicator S2
Programme Scenario
IBP LTC S2(1) (2) (3) = (1) + (2)
October 2006 -1,5 6,7 5,2 (2005-2009)
March 2008 -1,2 3,2 2,0 (2007-2011)
March 2009 -0,9 3,2 2,3 (2008-2011)
Source: European Commission.
The latest sustainability evaluation was based on the January 2009 update of the Portuguese stability programme. It presents a deterioration of the structural balance to be achieved in 2011 vis-à-vis the previous years’ programme, since it was updated due to the economic downturn and the fiscal stimulus package introduced in 2008/2009. However, it still considers the same long-term projections and the LTC component remains basically unchanged and S2 increases slightly to 2.3 p.p. of GDP.
With the consideration of the 2008 demography and macroeconomic assumptions, the projected trend for pension expenditure as a share of GDP is even more contained (+2.1 percentage points of

32
GDP between 2007 and 2060), which should allow a reduction in the sustainability gaps and to improve the sustainability of the Portuguese public finances, ceteris paribus.
7. Conclusion
In 2006, the projected increase of 10.1 percentage points of GDP in the age-related public expenditure between 2004 and 2050 was unsustainable. The need to foster a deep reform of the Social Security system and, in particular, of the CGA system, where the underlying conditions to determine and update pensions were much more generous, became quite stringent. The reform that was implemented relied on a set of structural changes of which we analyze the two most important ones: the implementation of a sustainability factor that links the pension value to the evolution of life expectancy at 65 years old and a new rule for updating pensions.
These reform measures have an estimated effect of reducing public pension expenditure by about 4 percentage points of GDP by 2060. More than 50% of this result is explained by the introduction of the sustainability factor that accounts for 2.4 percentage points of GDP. Equally important is the fact that this sustainability factor significantly reduced the systems vulnerability to changes in the demographic scenario as increases in life expectancy have a minor impact on future pension expenditures.
We also analyze the distributive impact of the new rule for updating pensions and conclude that a significant reduction of the gap between pensions can be forecasted, which may contribute to the system stability but have an undetermined effect on the decision of high wage contributors to postpone their retirement age: either they prefer an initial higher pension or more “generous” future updates.
The importance of this issue and the more demanding macroeconomic environment require further analysis of the impact of the reform measures implemented in 2006. An unexplored dimension of the reform is modelling the agents’ reaction to the new system of financial incentives related to the decision of whether or not to postpone the retirement age. In reality, while the bonus for each year of contributions to the system may lead agents to postpone retirement, the sustainability factor may have the opposite effect. Understanding under which conditions each one of them prevails should be of interest to both academics and policy makers.

33
Annex A. The evolution of the Portuguese public pension system
End XIX cent.
First institutions of social protection for the elderly (State industry employees followed by other public and private corporations employees)
1919 Introduction of mandatory social insurance (first attempt) for employees (some sectors) with low income
1929 Creation of the public employees old-age pension scheme (Decree no. 16669 of 27 March) Maximum retirement age: 70 years old
1934 Introduction of survivors pensions for public employees (Decree-Law no. 24046 of 21 June)
1935 Definition of the general framework of social insurance Old-age and disability pensions financed on a funded basis
1962 Social Security reform (Law no. 2115 of 15 June and others) with enlargement of social protection for industry, trade and services employees and financed on mixed basis (funded and PAYG)
1972 Definition of the pensions scheme for agricultural workers (Decree-Law no. 391/72 of 13 October)
1972 Creation of Estatuto da Aposentação (Decree-Law no. 498/72 of 9 December) - integrated legal framework of public employees retirement regime: i) wider coverage of the scheme, including contributors aged 55 or older ii) pension entitlement with 15 years of contributions to public employees
scheme or private employees iii) contributory rate: 6% employees iv) retirement conditions: aged 60 and contributory career 40 years (full
pension) v) pension amount: last net wage (or average last 10 years if higher) or in
the proportion of the contributive career if less than 40 years vi) more favourable conditions for military personnel vii) pensions update on a discretionary basis but in practice following public sector wages
1973 Minimum entitlement contributory period: 5 years for disability pensions and 10 years for old age pensions
1974 Transition for a unified system of Social Security (D-Law no. 203/74 of 15 May) Introduction of social pension for disabled (above 65) Introduction of 13th month for all pensioners
1975 First regulation of the State participation in the financing of the Social Security pensions system Introduction of survivors pensions for agricultural scheme
1977 New organics of Social Security (Decree-Law no. 549/77) Inclusion of self-employed and housewives (or –men) Introduction of means-tested social pension for all above 65 Reduction in the minimum entitlement contributory period: 3 years for disability pensions and 5 years for old pensions
1979 Reduces the full pension condition to 36 contributive years and minimum period for pension entitlement to 5 years (Decree-Law no. 191-A/79 of 25 June)
1980 Definition of the non-contributory regime of social security (Decree-Law no. 160/80 of 27 May)
1982 Enlargement of the minimum entitlement contributory period: 5 years for disability pensions and 10 years for old age pensions
1984 First Social Security Framework Law (Law no. 28/84 of 14 August) System PAYG: contributive regime financed by employees and employers contributions and non-contributive regime financed by State transfers Pensions updates taking into account consumer prices prospects

34
1985 Increases the contributory rate of public employees to CGA to 6.5% (Decree-Law no. 40-A/85 of 11 February) The rate for survivors pensions is 1.5%
1986 Determines a standard contributory rate for the general regime of Social Security: 24% for employers and 11% for employees (lower rates for special regimes)
1988 Extends the CGA coverage to private schools teachers (Decree-Law no. 321/88 of 22 September)
1990 Introduction of 14th month for all pensioners (Ordinance no. 470/90 of 23 June)
1993 Revision of Estatuto da Aposentação (Decree-Law no. 277/93 of 10 August and others): from September on, the pension scheme of new public employees became subject to the rules of the private sector system (Social Security General Regime)
1993 Reform of the Social Security general regime (Decree-Law no. 329/93 of 25 September): Enlargement of the minimum entitlement contributory period: from 10 to 15 years for old age pensions Gradual increase of legal retirement age of women from 62 to 65 years (the same as men) Revision of the contributory rate of Social Security to 35.5%
1994 Increases the contributory rate of public employees to CGA old-age pensions to 7.5% and to survivors pensions to 2.5%, similar to Social Security contributors (Decree-Law no. 78/94 of 9 March)
1995 Reduction of the standard contributory rate of Social Security by 0.75 p.p. to 34.75 (increase of the VAT standard rate by 1 p.p. earmarked to Social Security)
1999 Decomposition of the contributory rate of Social Security (34.75%) (Decree-Law no. 200/99 of 8 June)
2002 New Framework Law for Social Security (Law no. 32/2002 of 20 December) Convergence of earnings-related minimum pensions to national minimum wage Revision of new pension formula: transitory period for new rules taking into account the whole contributive career from 2017 on (Decree-Law no. 35/2002)
2002 Early retirement (old-age) pension is possible with 36 contributive years and a penalty of 4.5% per year earlier than 60 years old (Law no. 32-B/2002 of 30 December)
2005 Revision of Estatuto da Aposentação (Law no. 60-B/2005 of 29 December) - further convergence of CGA and Social Security pension regimes: i) from 2006 on, new public employees are enrolled in Social Security
System ii) progressive increase in legal retirement age to 65 years old (until 2015) for all public employees and of career length to 40 years (until 2013) iii) convergence of new pensions formula for contributors enrolled in CGA until August 1993
2007 Reform of the Social Security pension regime (revision of the Framework Law-Law 4/2007 of January 16 and Decree Law 87/2007 of May 10)
2007 Transposition of Social Security reform measures to CGA from 2008 on, with a transitory period until 2015 (Law no. 52/2007 of 31 August)
2008 Convergence (until 2015) of the minimum contributive career from 36 to 15 years to be entitled to a early retirement pension (Law no. 11/2008 of 20 February)
Sources: CGA and Ministry of Labour and Social Solidarity. Note: text in bold refers specifically to CGA.

35
Annex B. Main assumptions underlying the long-term projections
Demography
2008 2020 2030 2040 2050 2060Life expectancy at birth 78,7 80,6 82,0 83,4 84,7 85,9 males 75,5 77,6 79,3 80,8 82,3 83,6 females 82,1 83,7 84,9 86,1 87,3 88,3 at 65 years old 18,2 19,6 20,7 21,9 23,1 24,1 males 16,3 17,6 18,7 19,7 20,7 21,6 females 19,9 21,1 22,1 23,0 23,9 24,8Population (10^9) 10,599 11,080 11,299 11,443 11,458 11,289Dependency ratio (DR), % young DR -15/15-64 22,8 22,1 20,9 21,6 22,9 22,7 old-age DR +65/15-64 25,9 30,7 36,6 44,6 53,0 54,8
Source: Eurostat (EUROPOP2008).
Macroeconomic scenario
2008 2020 2030 2040 2050 2060Labour productivity growth(hours worked, %) 1,2 1,8 2,7 2,2 1,7 1,7Labour input growth (15-71) 0,3 0,3 -0,1 -0,4 -0,5 -0,3GDP growth (real) 1,5 2,1 2,5 1,8 1,2 1,4Employment rate (15-64) 68,4 71,4 71,6 71,7 71,8 71,6Unemployment rate (15-64) 8,2 6,2 6,2 6,2 6,2 6,2
Source: EPC(2008)
36
Annex C. CGA Model
The pension model used for the CGA projections is an accounting/actuarial model that allows a detailed parameterization of the system, including the simulation of different demography or macroeconomic assumptions and changes in the reform parameters. However, as it is not a general equilibrium model it does not permit endogenous analysis of the changes in supply and demand and in the consumption and investment decisions of economic agents stemming from their adjustment, for example, to the reforms in social security that were enacted.
Assumptions and methodology
The model has four main modules: the first one relates to input data (including macroeconomic and demography data), the second one comprises the dynamics for contributors and number of pensions, the third one refers to the dynamics of contributions and pensions and the last one provides the outputs. Modules two and three are structured by age and gender strata in order to allow more precise results. Module for contributors and pensioners dynamics Due to the fact of CGA being a closed system, the dynamics of contributors is quite simple: the number of contributors decreases each year due to mortality and to other motives like moving to the private sector or exoneration. The number of CGA contributors at the end of year is given by:
( ) npCC gatgatgatgatgat ,,,,,,,1,1,, 1 −−−×=−− πμ (6 )
where,
C gat ,, - Number of CGA contributors in year t, for age a and gender g
μ gat ,, - Mortality rate in year t, for age a (for those who would complete age a during
year t) and gender g
π gat ,, - Contributors rate of exoneration in year t, for age a and gender g
np gat ,, - Number of new pensioners (includes old-age pensioners and disability
pensioners) in year t, for age a and gender g.
In the “open system” variant, the dynamics of contributors was slightly changed in order to include entrants from each year. The end-2007 stock was adjusted by the new public employees enrolled in 2006 and 2007, and between 2008 and 2011 it was assumed that the number of new public employees was around half of the new retirees in each year. The age and gender distribution was assumed to be the same as the distribution of new public employees in 2005. From 2012 on it was considered that the entries in the public sector were such that allowed to keep the share of public in total employment (around 12%).

37
The dynamics of pensioners19 is calculated for old age and disability pensioners together and for survivors separately. The stock of pensioners increases with new pensioners and decreases according to pensioners’ mortality. In this model, survivor pensioners also depend on a “depreciation rate” that applies mainly to when descendents conclude their studies. Old age and disability pensioners New pensioners (and pensions) are computed according to the legal regime that applies to each type of contributors: regime of Estatuto de Aposentação (that applies to public employees registered in the CGA until August 1993) and the social security regime that applies to public employees registered in the CGA between September 1993 and December 2005. For each legal regime, new pensioners are projected with a breakdown by motive: disability, old age (including early retirement) or age limit (at 70 years old). New pensioners are computed by using “retirement probabilities”. The later are defined as the base year ratios of new pensioners over contributors, for those who are aged less than 70. This means that new pensions are not determined only as a function of the legal criteria. Number of new old-age pensioners:
CCopop
agt
agt
agtgat1,,2
1,,1
1,,1,,−−
−−
−−×= ( 7)
where, )(
,top ag
- Number of new old-age pensioners during year t for age a and gender g
In the case of old age, including early pensioners, the above mentioned ratios move along legal retirement age (LRA)20. It should be recalled that the LRA for CGA contributors is increasing from 60 years old in 2005 to 65 years old in 2015, at a pace of 6 months per year, in order to achieve convergence to the private sector regime. It was assumed that the retirement probabilities for disabled do not change with the above mentioned increase in the LRA. The number of CGA new disability pensioners is given by:
CCdpdp
gat
gat
gatgat,1,2
,1,1
,,1,,−−
−−
−×= (8 )
where,
dp gat ,, - Number of new disability pensioners in year t, for age a and gender g
19 More precisely, available data refer to the number of pensions and not the number of pensioners. 20 For pensioners aged between LRA-10 and 70 (age limit).

38
The dynamics for the number of old-age and disability pensioners at the end of year t is given by:
( ) dpopOpOp gatgatgatgatgat ,,,,,,,1,1,,1 ++−×=
−−μ (9 )
where, Op gat ,,
- Number of old-age and disability pensioners at the end of year t for age a and
gender g
Survivor pensioners New pensioners are a function of old age and disability pensioner’s mortality. In the past, on average, 80 per cent of pensioners who died had a survivor entitled to a pension, but this percentage is expected to decrease (to near 60%), as spouses beneficiaries tend to have their own wage/ pension and would not be eligible to a survivor pension and the number of children tend to decrease as well. Having the estimate for total new survivors’ pensioners, the age and gender distribution is the same of base year. It is also considered that the stock of survivor pensioners depend on a “depreciation rate” that
applies mainly to descendants when conclude their studies. So it is necessary to divide the age strata
into the following:
• 18<a<27
( ) spSpSp gatgatgatgatgat ,,,,,,,1,1,,1 +−−×=
−−χμ (10)
• Other a
( ) spSpSp gatgatgatgat ,,,,,1,1,,1 +−×=
−−μ (11)
where,
Sp gat ,, - Number of survivor pensioners in year t, for age a and gender g
sp gat ,,
- Number of new survivor pensioners in year t, for age a and gender g
χ gat ,, - Depreciation rate of the survivor pensioners stock, unrelated to the death of the
beneficiary in year t, for age a and gender g
Module for contributions and pensions’ dynamics Contributions to CGA are a fixed percentage of employees’ remuneration (10% supported by employees and 13,1% by the employer21). Therefore, the contributions dynamics depends on the 21 In practice, only some general government subsectors employers actually contribute to CGA, while in the case of State it makes an annual transfer to CGA. However, the contributory rate of 13.1% was considered to all employers (as an imputed one, in the case of State) by analogy with the contributory rate to Social Security general regime of new public employees.

39
remunerations evolution. The data available for 2007 contained average values for remunerations of the subscribers by age and gender strata. The actualized and adjusted average remuneration is:
( ) ( )( )γγ tgattgat WWW gat +×+× −−−= 1;1max ,1,1,,1,,(12)
where, γ t is the annual update rate for public sector wage scale.
Contributions in each year are given by:
CWCont gatgatgat t ,,,,,,×= ×τ (13)
where, τ t is the CGA’s contributory rate
The average old-age pension is determined by:
( )[ ]Op
npensopPensopOpPens
gat
gatgattgatgatgatgat
,,
,,,,,1,1,,,,,,
1)( ×++××−=
−− α (14)
where αt represents annual pension update and npenstag is the new old-age pension in year t, for age a and gender g. npenstag is calculated according to the rules presented in Table 6 for the Estatuto da Aposentação contributors and for other public employees (rule B) separately. It is assumed that public employees hired between September 1993 and 2001 will not retire before 2017. Total old-age and disability pensions expenditure is given by:
( )OppensTE gatgatgat ,,,,,, ×= (15)
The dynamics of survivor’s pensions follows the old-age pension’s one:
( )[ ]Sp
nsurvpensspSurvPensspSpSurvPens
gat
gatgattgatgatgatgat
,,
,,,,,1,1,,,,,,
1)( ×++××−=
−− α (16)
where αt represents annual pension update (the same of old age pensions) and nsurvpenstag is the new survivors pension in year t, for age a and gender g.
Each new survivor’s pension, according to the law, is equivalent to 50% of the old age pension that originate it. In the model, it was assumed the average new survivors pensions to be around 40% of the average old age pensions.

40
References Barreto, A. (1996), "A Situação Social em Portugal, 1960/1995", Instituto de Ciências Sociais da Universidade de Lisboa, Lisboa Campos, M. and M. Pereira (2008), “Impact of recent reform of the Portuguese public employees’ pension system”, Banco de Portugal, Economic Bulletin, Summer CES (2006), “Acordo sobre a reforma da Segurança Social”, Comissão Permanente da Concertação Social do Conselho Económico e Social, 10 de Outubro de 2006, available on http://www.governo.gov.pt CGA (2009), “Regimes da Aposentação e das Pensões de Sobrevivência – Guia do Utente”, Janeiro de 2009, available on http://www.cga.pt DGECFIN (2006), “The Long-Term Sustainability of Public Finance in the European Union”, European Economy, no. 4/2006 DGECFIN and EPC (2006), “The impact of ageing on public expenditure: projections for the EU25 Member States on pensions, health-care, long-term care, education and unemployment transfers”, European Economy, Special Report no. 1/2006 DGECFIN and EPC (2008), “The 2009 Ageing Report: underlying assumptions and projection methodologies for the EU-27 Member States”, European Economy no. 7/2008 (Provisional version) Disney, R. (2000), “Crisis in Public Pension Programmes in OECD: what are the reform options?”, Economic Journal, February Gouveia , M. and L.M. Sarmento, (2002), “Financing pensions for public sector workers in Portugal: estimates of the long run impact on public finances”, Banco de Portugal Economic Bulletin, June Ministry of Finance and Public Administration (2008), “Budgetary Policy Steering Report”, May Ministry of Labour and Social Solidarity (2006), “Medidas de Reforma da Segurança Social – Desenvolvimento do Acordo de Linhas Estratégicas”, available on http://www.governo.gov.pt OECD (2009), Private Pensions Outlook 2008 Pinheiro, M. and V. Cunha (2007), “MISS: A model for assessing the sustainability of public social security in Portugal”, Banco de Portugal Occasional Paper Series, no.2, May Rodrigues, P. G. and A. M. Pereira (2007), “A Reforma das Pensões em Portugal”, Fundação Luso-Americana, Julho

41
Sapir, A. (2005), Globalization and the reform of European Social Models, Bruegel Policy Contribution, September Whitehouse, E. (2009), “Pensions, Purchasing-Power Risk, Inflation and Indexation”, OECD Social, Employment and Migration Working Papers No.77