The Rational Locator: Why Travel Times Have Remained Stable
15
PLEASE SCROLL DOWN FOR ARTICLE 7KLV DUWLFOH ZDV GRZQORDGHG E\ >8QLYHUVLW\ RI 0LQQHVRWD /LEUDULHV 7ZLQ &LWLHV@ 2Q 0D\ $FFHVV GHWDLOV $FFHVV 'HWDLOV >VXEVFULSWLRQ QXPEHU @ 3XEOLVKHU 5RXWOHGJH ,QIRUPD /WG 5HJLVWHUHG LQ (QJODQG DQG :DOHV 5HJLVWHUHG 1XPEHU 5HJLVWHUHG RIILFH 0RUWLPHU +RXVH 0RUWLPHU 6WUHHW /RQGRQ :7 -+ 8. -RXUQDO RI WKH $PHULFDQ 3ODQQLQJ $VVRFLDWLRQ 3XEOLFDWLRQ GHWDLOV LQFOXGLQJ LQVWUXFWLRQV IRU DXWKRUV DQG VXEVFULSWLRQ LQIRUPDWLRQ KWWSZZZLQIRUPDZRUOGFRPVPSSWLWOHaFRQWHQWW 7KH 5DWLRQDO /RFDWRU :K\ 7UDYHO 7LPHV +DYH 5HPDLQHG 6WDEOH 'DYLG 0 /HYLQVRQ $MD\ .XPDU 7R FLWH WKLV $UWLFOH /HYLQVRQ 'DYLG 0 DQG.XPDU $MD\ 7KH 5DWLRQDO /RFDWRU :K\ 7UDYHO 7LPHV +DYH 5HPDLQHG 6WDEOH -RXUQDO RI WKH $PHULFDQ 3ODQQLQJ $VVRFLDWLRQ ٢ 7R OLQN WR WKLV $UWLFOH '2, 85/ KWWSG[GRLRUJ Full terms and conditions of use: http://www.informaworld.com/terms-and-conditions-of-access.pdf This article may be used for research, teaching and private study purposes. Any substantial or systematic reproduction, re-distribution, re-selling, loan or sub-licensing, systematic supply or distribution in any form to anyone is expressly forbidden. The publisher does not give any warranty express or implied or make any representation that the contents will be complete or accurate or up to date. The accuracy of any instructions, formulae and drug doses should be independently verified with primary sources. The publisher shall not be liable for any loss, actions, claims, proceedings, demand or costs or damages whatsoever or howsoever caused arising directly or indirectly in connection with or arising out of the use of this material.
-
Upload
independent -
Category
Documents
-
view
1 -
download
0
Transcript of The Rational Locator: Why Travel Times Have Remained Stable
PLEASE SCROLL DOWN FOR ARTICLE
Full terms and conditions of use: http://www.informaworld.com/terms-and-conditions-of-access.pdf
This article may be used for research, teaching and private study purposes. Any substantial orsystematic reproduction, re-distribution, re-selling, loan or sub-licensing, systematic supply ordistribution in any form to anyone is expressly forbidden.
The publisher does not give any warranty express or implied or make any representation that the contentswill be complete or accurate or up to date. The accuracy of any instructions, formulae and drug dosesshould be independently verified with primary sources. The publisher shall not be liable for any loss,actions, claims, proceedings, demand or costs or damages whatsoever or howsoever caused arising directlyor indirectly in connection with or arising out of the use of this material.
This paper evaluates household travel surveys for the Washington metropoli- tan region conducted in 1968 and 1988, and shows that commuting times remain stable or decline over the twenty-year period despite an increase in average commuting distance, after controlling for trip purpose and mode of travel. The average automobile work-to-home time of 32.5 minutes in both 1968 and 1988 is, moreover, very consistent with a 1957 survey showing an average time of 33.5 minutes in metropolitan Washington. Average trip speeds increased by more than 20 percent, countering the effect o f in- creased travel distance. This change was observed during a period of rapid suburban growth in the region. With the changing distributional composi- tion of trip origins and destinations, overall travel times have remained rela- tively constant. The hypothesis that jobs and housing mutually co-locate to optimize travel times is lent further support by these data.
Levinson and Kumar are transporta- tion planners at the Montgomery County Planning Department, where they research and model travel behav- ior and transportation system usage. Both study transportation-land use in- teractions for application in growth management and physical planning. Kumar holds a doctorate in Urban and Regional Planning from the University ofSouthern California. Levinson has a master’s degree in Civil Engineering from the University o f Maryland.
journal ofthe American Planning Association, Vol. 60, No. 3, Summer 1994. OAmerican Planning Association, Chicago, IL.
The Rational Locator Why Trauel Times Haue Remained Stable
I David M. Levinson and Ajay Kumar
ransportation planners throughout the United States face the per- ception and the reality of increased traffic congestion. It is generally T believed that city size is positively related to trip length and dura-
tion. As the size of a city increases, average commuting times are expected to increase as well, because of the greater distance between job and hous- ing opportunities in the suburbs and the central city, as well as rising congestion. When fiscal pressures, among other considerations, keep transportation capacity from increasing proportionately with travel de- mand, that discrepancy further congests the metropolitan commute. The commuter may respond to growing traffic congestion by changing the route, time of departure, mode of travel, or sequence of activities, as well as by relocating the household or changing the place of work. The emer- gence of multiple centers of economic activity has implications for travel behavior in a metropolitan area that have not received sufficient attention in planning literature. Polycentrism gives rise to the alternative hypothe- sis that households and economic activities periodically readjust spatially to accommodate growing travel demand within the constraints imposed by transportation capacity.
Most recently, the research of Newman and Kenworthy (N-K) in their book Cities and Automobile Dependence (1989) has triggered debate in the Journal of the American Planning Association. N-K have collected data from cities across the world to study the relationship between transporta- tion use and urban form. Government policies that facilitate polycen- trism and suburbanization in general, including interstate highway construction, rail transit subsihes, and tax policies favoring dispersed land use, have been criticized as making “the problem” of traffic conges- tion, air pollution, and energy consumption worse.
0 ther researchers have challenged many of the arguments of New- man and Kenworthy (Gomez-Ibanez 1991; Gordon and Richardson 1989; Gordon, Richardson, and Jun 1991); N-K and others have counterchal-
APA JOURNALmSUMMER 1994 /319
Downloaded By: [University of Minnesota Libraries, Twin Cities] At: 17:15 19 May 2010
DAVID M. LEVINSON AND ATAY KUMAR
lenged Gordon and Richardson (Newman and Ken- worthy 1992; Bourne 1992). We do not intend to re- visit those discussions here. This paper contributes to the debate by analyzing travel trends in a single region, that of Washington, D.C., over twenty years. The re- sults of this research lead us to question one of the conclusions reached by N-K: that “travel times are longer in dispersed cities,” countering much earlier re- search (Newman and Kenworthy 1992). In sharp con- trast to the Newman and Kenworthy study, which compares cities throughout the world in an attempt to establish the relationship between density and gas- oline consumption, the focus in this paper is on the Washington metropolitan region, which has changed substantially over the period of this analysis. The availability of travel data collected by the same metro- politan planning organization for twenty years (1968 through 1988) provides the advantage of internal con- sis tency.
This paper explores changes in travel patterns, in- cludmg trip duration, distance, and speed. During this twenty-year study period, significant changes in demo- graphic and economic structure occurred, which had implications for travel demand patterns. This analysis shows that average trip times have remained stable or declined in this period for all trip purposes and all modes of travel, despite increased trip distances. The travel times are consistent with those obtained in a 1957 survey by Fortune Muguzine (Whyte 1957). The consistency suggests that residents could fulfill their daily needs without having to spend more time per trip in 1988 Washington as compared with 1968 (or 1957) Washington. Why? The “locators” of households and workplaces have responded by periodic relocation over time to maintain constant commuting durations in the face of changing commuting requirements. The time economies are more easily realized in suburbs be- cause of multiple employment centers there, which provide opportunities to reside close to workplaces.
That both households and jobs have been moving to the suburbs for decades is not a revelation. Even in the 1950s and 1960s, researchers predicted a relative decline in the importance of central cities, including Washington (Silver 1959; Niedercorn and Kain 1963; Kanwit and Eckartt 1967; Ganz 1968). Analyzing the 1948 and 1955 Washington, D.C. Household Travel Surveys, Heanue and Pyers (1966) observed decentral- ization of many activities over the seven-year period. “Residential, employment, and shopping activities were all relatively less oriented to the central business district in 1955 than in 1948.” It is important to real- ize that this statement refers to a time before the ma- jor federal investment in either the interstate highway
program or Metrorail. Hence the statement by New- man and Kenworthy that “the question of whether market forces are pushing towards dispersed polycen- tric or monocentric cities is difficult to establish” dis- plays some lack of understanding of the emergent urban form in the United States, even in the relatively centralized and transit-oriented national capital, Washington .
The focus in this paper is on reported trip dura- tions, which directly influence travel behavior and are related to congestion. Though the survey does not re- port information on trip distance, an attempt is made to compare euclidean distances where they provide a fresh perspective, while recognizing the limitations of such information. After a description of the data and definitions used in this analysis, we provide an over- view of metropolitan growth trends in the Washing- ton region over the twenty-year period. This is followed by discussion of changing spatial travel pat- terns, average travel duration by mode and purpose, travel distance and speed.
Data The data source for this study consists of detailed
person travel surveys conducted by the Metropolitan Washington Council of Governments (MWCOG) for 1968 and 1987-1988 (MWCOG 1968; MWCOG 1988). The 1968 survey consists of a sample of about 20,000 households making 135,000 trips; the 1987-1988 sam- ple involved 8,000 households and 55,000 trips. Each household was assigned a specific 24-hour “travel day,” and information was collected on all trips made by members of that household on that day. A trip was defined as one-way travel from one address to another. The locations of both ends of the trip were reported along with the times of departure and arrival. Trip du- ration was obtained by subtracting time of departure from time of arrival.’ The surveys also record trip pur- pose at both origin and destination ends, making it possible to identify work trips by accounting for trip chaining (defined as travel to a nonwork location on the way between home and work).
The data was collected for metropolitan Washing- ton. For this study, the same geographical area was used for 1968 and for 1988 (Figure 1) (although the census definition of the metropolitan area has changed, and in 1988 data was collected for a some- what larger area). The jurisdictions included are: Washington, D.C., Montgomery and Prince George’s Counties in Maryland, and Arlington, Fairfax, Lou- doun, and Prince William Counties and the City of Al- exandria in Virginia. For spatial analysis, the data has been divided into concentric rings around the CBD,
320 APA JOURNAL.SUMMER 1994 J
Downloaded By: [University of Minnesota Libraries, Twin Cities] At: 17:15 19 May 2010

THE RATIONAL LOCATOR: WHY TRAVEL TIMES HAVE REMAINED STABLE
2. Inner Suburb
3. Outer Suburb
FIGURE 1. Washington metropolitan region
which have been aggregated into three areas. The “City” ring is defined as the original ten-mile square of the District of Columbia, including Arlington and Alexandria, Virginia. In addition to the CBD, this ring includes the employment centers of Roslyn and the Pentagon. The “Inner Suburb” ring is defined as the area outside the “City” but inside the Capital Beltway perimeter freeway. The “Inner Suburb” ring includes the employment centers of Bethesda and Silver Spring in Maryland. The “Outer Suburb” ring is the area out- side the Capital Beltway, including the employment centers of Rockville and Gaithersburg in Maryland, and Tyson’s Corner, Fairfax City, and Dulles in Vir- ginia.
The 1968 survey was the more extensive of the two in the questions asked, and was conducted as an in- person interview with the head of the household. The 1988 survey was conducted as a mail-out, mail-back
survey with telephone follow-up. Both surveys were weighted by MWCOG to match population estimates.
The two surveys define three primary travel modes: transit, automobile, and walking. Travel by au- tomobile is further divided by number of persons per vehicle: AUTO-1 is a driver with no passengers, AUTO-2 is a trip in a car with a driver and one passen- ger, and AUTO-3 is a trip in a car with a driver and two or more passengers. In 1968, the transit mode was predominantly bus, but in 1988, transit included both rail (Metrorail and commuter rail) and bus. Data on the walk mode were collected in the 1968 shrvey only for home-to-work trips, but in 1988 they were col- lected for all purposes. This discrepancy restricts com- parisons of nonmotorized, nonwork travel, which is therefore excluded from the analysis.
Seven trip purposes are defined for this analysis: home-to-work, work-to-home, home-to-other, other-
APA JOURNAL- SUMMER 1994
Downloaded By: [University of Minnesota Libraries, Twin Cities] At: 17:15 19 May 2010
DAVID M. LEVINSON AND ATAY KUMAR
to-home, other-to-work, work-to-other, and other- to-other. The approach here is different from that in earlier studies, which differentiates only between “home-based and “nonhome-based trips. Seg- menting trips by direction permits better understand- ing of asymmetric travel patterns such as linked trips.
Metropolitan Trends Since 1968, the typical household has become
smaller, female participation in the labor force has in- creased, the population has aged, and per capita in- come has risen. Over the twenty years, population in the Washington region increased from 3.0 million to 3.9 million persons (30 percent growth), while at-place employment (e.g., excluding construction and self- employed workers) increased from 1.5 million to 2.8 million jobs (85 percent growth) (MCPD 1991). These changes were accompanied by an increase in the total number of daily motorized trips per person, from 2.3 to 2.8.
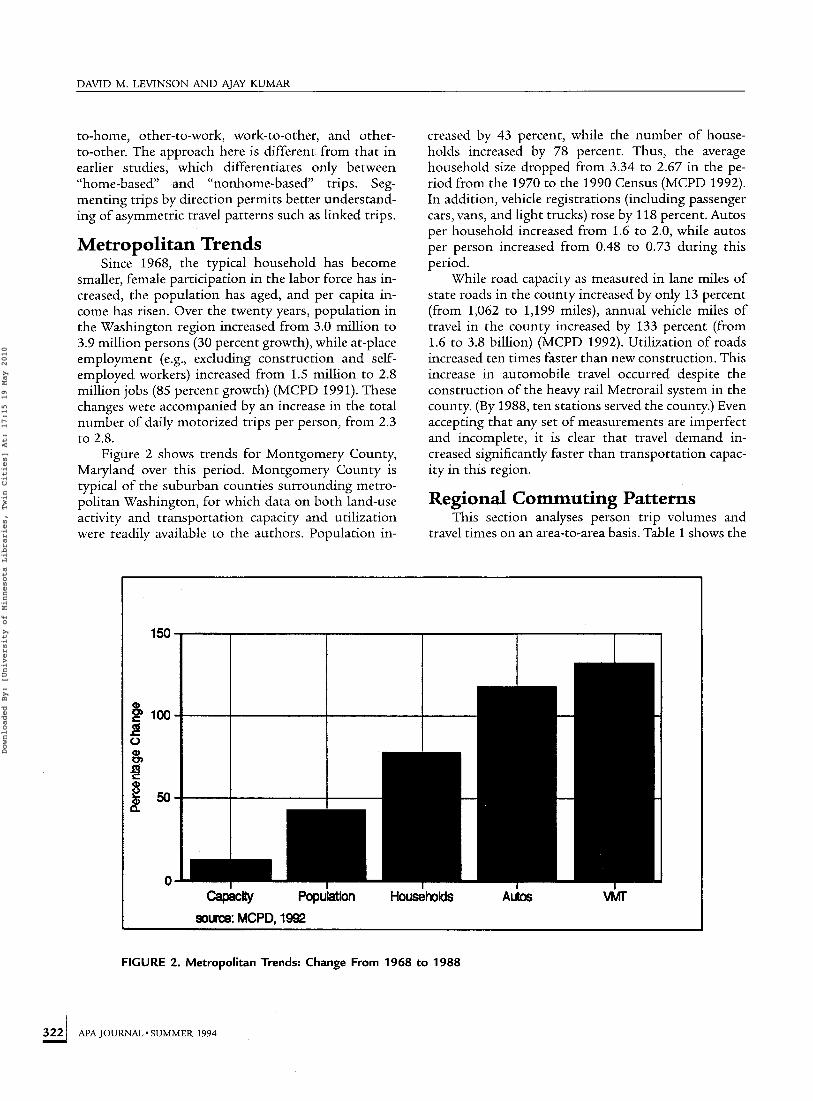
Figure 2 shows trends for Montgomery County, Maryland over this period. Montgomery County is typical of the suburban counties surrounding metro- politan Washington, for which data on both land-use activity and transportation capacity and utilization were readily available to the authors. Population in-
creased by 43 percent, while the number of house- holds increased by 78 percent. Thus, the average household size dropped from 3.34 to 2.67 in the pe- riod from the 1970 to the 1990 Census (MCPD 1992). In addition, vehicle registrations (including passenger cars, vans, and light trucks) rose by 118 percent. Autos per household increased from 1.6 to 2.0, while autos per person increased from 0.48 to 0.73 during this period.
While road capacity as measured in lane miles of state roads in the county increased by only 13 percent (from 1,062 to 1,199 miles), annual vehicle miles of travel in the county increased by 133 percent (from 1.6 to 3.8 billion) (MCPD 1992). Utilization of roads increased ten times faster than new construction. This increase in automobile travel occurred despite the construction of the heavy rail Metrorail system in the county. (By 1988, ten stations served the county.) Even accepting that any set of measurements are imperfect and incomplete, it is clear that travel demand in- creased significantly faster than transportation capac- ity in this region.
Regional Commuting Patterns This section analyses person trip volumes and
travel times on an area-to-area basis. Table 1 shows the
FIGURE 2. Metropolitan Trends: Change From 1968 to 1988
322 APA JOURNALmSUMMER 1994 J
Downloaded By: [University of Minnesota Libraries, Twin Cities] At: 17:15 19 May 2010
T H E RATIONAL LOCATOR: WHY TRAVEL TIMES HAVE REMAINED STABLE
CENTER CITY
1968 1988 Change %
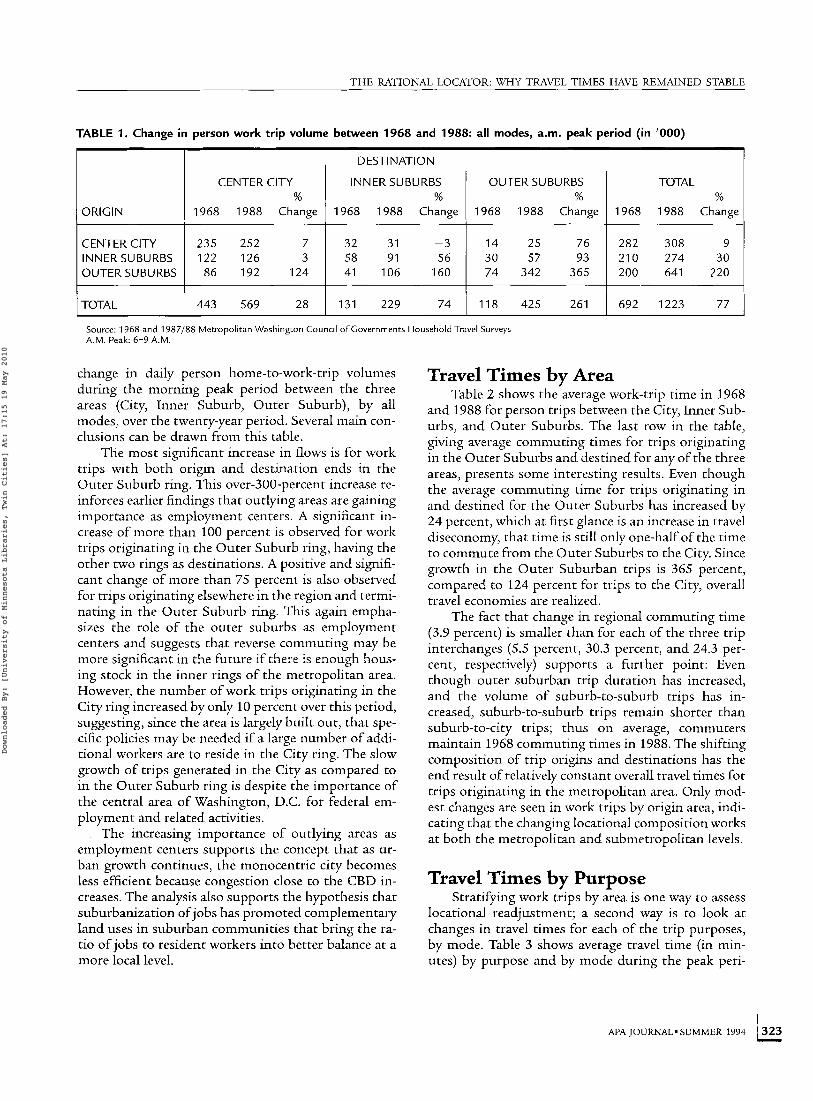
TABLE 1. Change in person work trip volume between 1968 and 1988: all modes, a.m. peak period (in '000)
INNER SUBURBS OUTER SUBURBS TOTAL % % %
1968 1988 Change 1968 1988 Change 1968 1988 Change ORIGIN I , ,
CENTER CITY 235 252 7 32 31 -3 1 4 25 76 INNERSUBURBS 122 126 3 58 91 56 30 57 93 OUTERSUBURBS 86 192 124 41 106 160 74 342 365
282 308 9 210 274 30 200 641 220
I I I I
I TOTAL I 443 569 28 I 131 229 74 I 118 425 261 I 692 1223 77 I Source: 1968 and 1987/88 Metropolitan Washington Council o f Governments Household Travel Surveys A.M. Peak: 6-9 A.M.
change in daily person home-to-work-trip volumes during the morning peak period between the three areas (City, Inner Suburb, Outer Suburb), by all modes, over the twenty-year period. Several main con- clusions can be drawn from this table.
The most significant increase in flows is for work trips with both origin and destination ends in the Outer Suburb ring. This over-300-percent increase re- inforces earlier findings that outlying areas are gaining importance as employment centers. A significant in- crease of more than 100 percent is observed for work trips originating in the Outer Suburb ring, having the other two rings as destinations. A positive and signifi- cant change of more than 75 percent is also observed for trips originating elsewhere in the region and termi- nating in the Outer Suburb ring. This again empha- sizes the role of the outer suburbs as employment centers and suggests that reverse commuting may be more significant in the future if there is enough hous- ing stock in the inner rings of the metropolitan area. However, the number of work trips originating in the City ring increased by only 10 percent over this period, suggesting, since the area is largely built out, that spe- cific policies may be needed if a large number of addi- tional workers are to reside in the City ring. The slow growth of trips generated in the City as compared to in the Outer Suburb ring is despite the importance of the central area of Washington, D.C. for federal em- ployment and related activities.
The increasing importance of outlying areas as employment centers supports the concept that as ur- ban growth continues, the monocentric city becomes less efficient because congestion close to the CBD in- creases. The analysis also supports the hypothesis that suburbanization of jobs has promoted complementary land uses in suburban communities that bring the ra- tio of jobs to resident workers into better balance at a more local level.
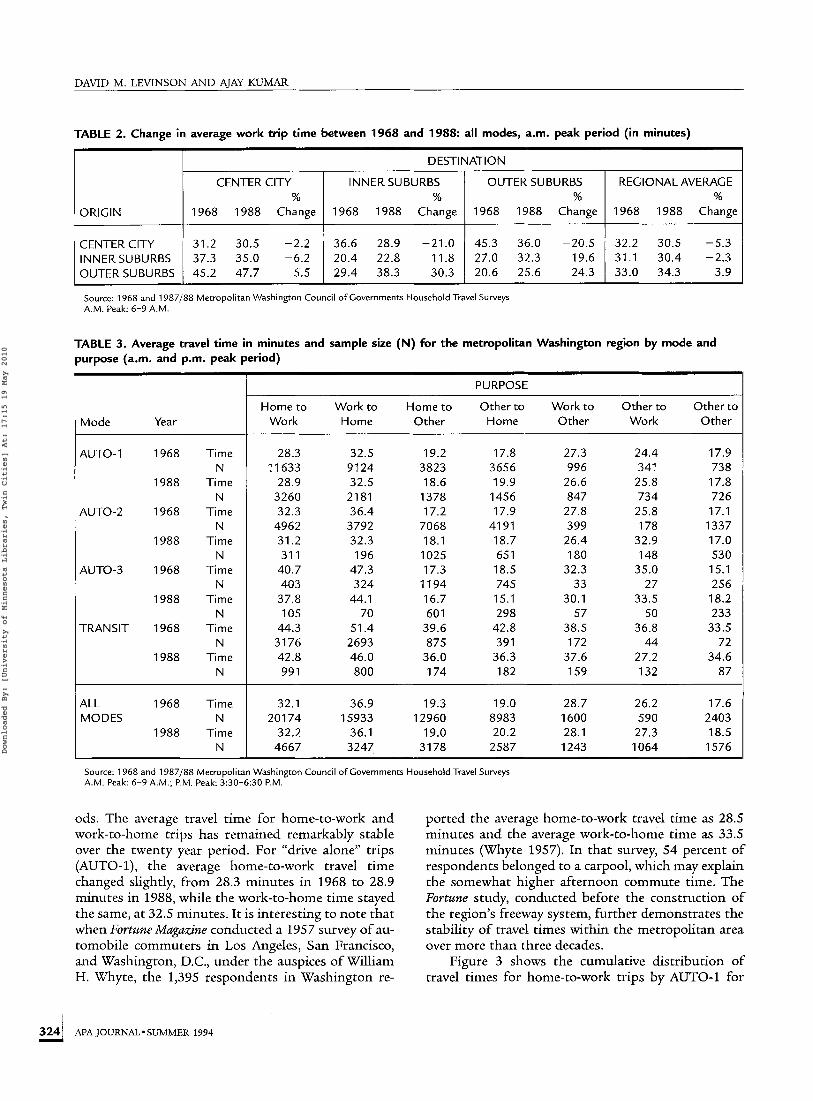
Travel Times by Area Table 2 shows the average work-trip time in 1968
and 1988 for person trips between the City, Inner Sub- urbs, and Outer Suburbs. The last row in the table, giving average commuting times for trips originating in the Outer Suburbs and destined for any of the three areas, presents some interesting results. Even though the average commuting time for trips originating in and destined for the Outer Suburbs has increased by 24 percent, which at first glance is an increase in travel diseconomy, that time is still only one-half of the time to commute from the Outer Suburbs to the City. Since growth in the Outer Suburban trips is 365 percent, compared to 124 percent for trips to the City, overall travel economies are realized.
The fact that change in regional commuting time (3.9 percent) is smaller than for each of the three trip interchanges (5.5 percent, 30.3 percent, and 24.3 per- cent, respectively) supports a further point: Even though outer suburban trip duration has increased, and the volume of suburb-to-suburb trips has in- creased, suburb-to-suburb trips remain shorter than suburb-to-city trips; thus on average, commuters maintain 1968 commuting times in 1988. The shifting composition of trip origins and destinations has the end result of relatively constant overall travel times for trips originating in the metropolitan area. Only mod- est changes are seen in work trips by origin area, indi- cating that the changing locational composition works at both the metropolitan and submetropolitan levels.
Travel Times by Purpose Stratifying work trips by a7ea is one way to assess
locational readjustment; a second way is to look at changes in travel times for each of the trip purposes, by mode. Table 3 shows average travel time (in min- utes) by purpose and by mode during the peak peri-
APA JOURNALmSUMMER 1994
Downloaded By: [University of Minnesota Libraries, Twin Cities] At: 17:15 19 May 2010
DAVID M. LEVINSON AND AJAY KUMAR
CENTER CITY INNERSUBURBS OUTER SUBURBS
TABLE 2. Change in average work trip time between 1968 and 1988: all modes, a.m. peak period (in minutes)
31.2 30.5 -2.2 36.6 28.9 -21.0 45.3 36.0 -20.5 32.2 30.5 -5.3 37.3 35.0 -6.2 20.4 22.8 11.8 27.0 32.3 19.6 31.1 30.4 -2.3 45.2 47.7 5.5 29.4 38.3 30.3 20.6 25.6 24.3 33.0 34.3 3.9
ORIGIN
I D EST1 N AT1 ON I CENTER CITY INNER SUBURBS OUTER SUBURBS REGIONAL AVERAGE
1968 1988 1968 1988 1968 1988 1968 1988 Change I~ I I I I I
TABLE 3. Average travel time in minutes and sample size (N) for the metropolitan Washington region by mode and purpose (a.m. and p.m. peak period)
Mode Year
AUTO-1
AUTO-2
AUTO-3
TRANSIT
1968
1988
1968
1988
1968
1988
1968
1988
Time N
Time N
Time N
Time N
Time N
Time N
Time N
Time N
ALL 1968 Time MODES N
1988 Time N
PURPOSE
Home to Work to Home to Other to Work to Other to Other to Work Home Other Home Other Work Other
28.3 1 1633
28.9 3260 32.3 4962 31.2 31 1
40.7 403 37.8 105
44.3 3176 42.8 991
32.5 91 24 32.5 2181 36.4 3792 32.3 196
47.3 324
44.1 70
51.4 2693 46.0 800
19.2 3823 18.6
1378 17.2
7068 18.1 1025 17.3
1194 16.7 601
39.6 875
36.0 174
17.8 3656 19.9 1456 17.9
41 91 18.7 651 18.5 745 15.1 298
42.8 391
36.3 182
27.3 996
26.6 847
27.8 399 26.4 180
32.3 33
30.1 57
38.5 172
37.6 159
24.4 341 25.8 734
25.8 178
32.9 148
35.0 27
33.5 50
36.8 44
27.2 132
17.9 738 17.8 726 17.1
1337 17.0 530 15.1 256 18.2 233
33.5 72
34.6 87
32.1 36.9 19.3 19.0 28.7 26.2 17.6 201 74 15933 12960 8983 1600 590 2403
32.2 36.1 19.0 20.2 28.1 27.3 18.5 4667 3247 3178 2587 1243 1064 1576
Source: 1968 and 1987/88 Metropolitan Washington Council of Governments Household Travel Surveys A.M. Peak: 6-9 A.M.; P.M. Peak: 3:30-6:30 P.M.
ods. The average travel time for home-to-work and work-to-home trips has remained remarkably stable over the twenty year period. For “drive alone” trips (AUTO-l), the average home-to-work travel time changed slightly, from 28.3 minutes in 1968 to 28.9 minutes in 1988, while the work-to-home time stayed the same, at 32.5 minutes. It is interesting to note that when Fortune Magazine conducted a 1957 survey of au- tomobile commuters in Los Angeles, San Francisco, and Washington, D.C., under the auspices of William H. Whyte, the 1,395 respondents in Washington re-
ported the average home-to-work travel time as 28.5 minutes and the average work-to-home time as 33.5 minutes (Whyte 1957). In that survey, 54 percent of respondents belonged to a carpool, which may explain the somewhat higher afternoon commute time. The Fortune study, conducted before the construction of the region’s freeway system, further demonstrates the stability of travel times within the metropolitan area over more than three decades.
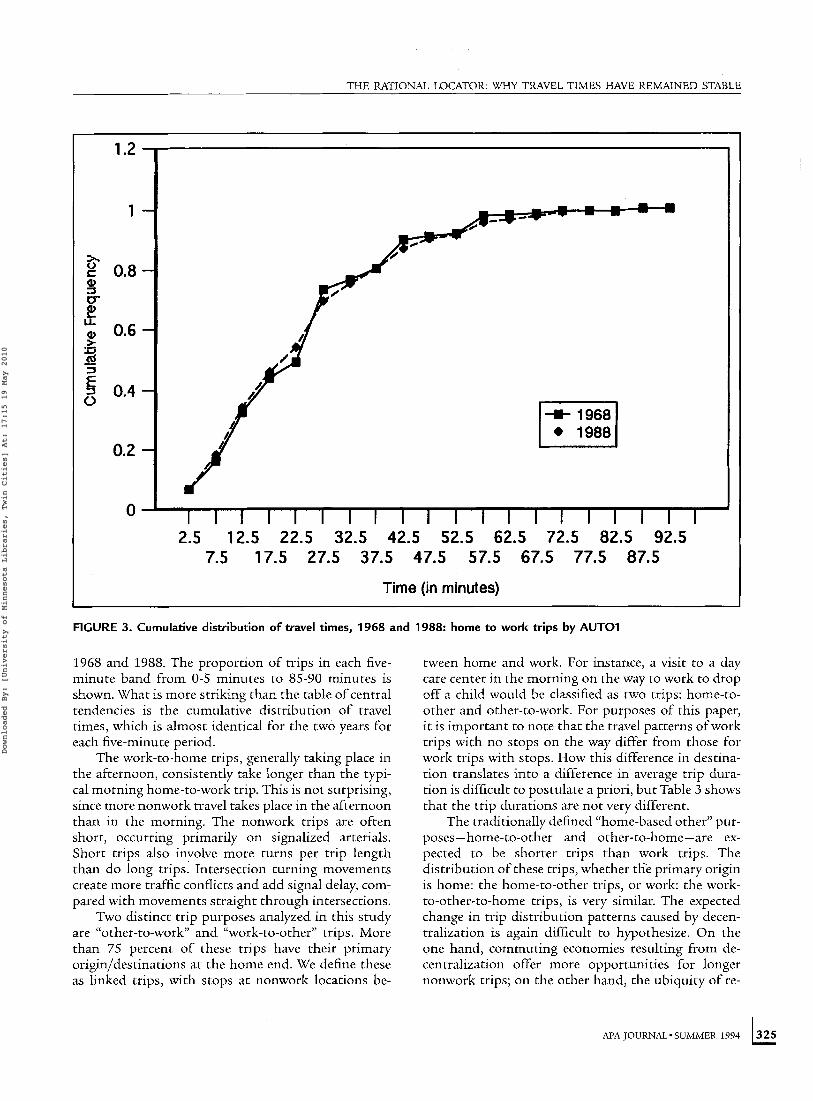
Figure 3 shows the cumulative distribution of travel times for home-to-work trips by AUTO-1 for
324 APA JOURNALmSUMMER 1994 1
Downloaded By: [University of Minnesota Libraries, Twin Cities] At: 17:15 19 May 2010
THE RATIONAL LOCATOR: W H Y TRAVEL TIMES HAVE REMAINED STABLE
1.2 I
1
x 2 0.8 3 L a 0.6
0-
u. > G cd -
0.4 0
0.2
0 1 1 1 1 1 1 1 1 1 1 1 1 1 1 1 1 1 1 1 1 2.5 12.5 22.5 32.5 42.5 52.5 62.5 72.5 82.5 92.5
7.5 17.5 27.5 37.5 47.5 57.5 67.5 77.5 87.5
Time (in minutes)
FIGURE 3. Cumulative distribution of travel times, 1968 and 1988: home to work trips by AUTO1
1968 and 1988. The proportion of trips in each five- minute band from 0-5 minutes to 85-90 minutes is shown. What is more striking than the table of central tendencies is the cumulative distribution of travel times, which is almost identical for the two years for each five-minute period.
The work-to-home trips, generally taking place in the afternoon, consistently take longer than the typi- cal morning home-to-work trip. This is not surprising, since more nonwork travel takes place in the afternoon than in the morning. The nonwork trips are often short, occurring primarily on signalized arterials. Short trips also involve more turns per trip length than do long trips. Intersection turning movements create more traffic conflicts and add signal delay, com- pared with movements straight through intersections.
Two distinct trip purposes analyzed in this study are “other-to-work and “work-to-other’’ trips. More than 75 percent of these trips have their primary origin/destinations at the home end. We define these as linked trips, with stops at nonwork locations be-
tween home and work. For instance, a visit to a day care center in the morning on the way to work to drop off a child would be classified as two trips: home-to- other and other-to-work. For purposes of this paper, it is important to note that the travel patterns of work trips with no stops on the way differ from those for work trips with stops. How this difference in destina- tion translates into a difference in average trip dura- tion is difficult to postulate a priori, but Table 3 shows that the trip durations are not very different.
The traditionally defined “home-based other” pur- poses-home-to-other and other-to-home-are ex- pected to be shorter trips than work trips. The distribution of these trips, whether th‘e primary origin is home: the home-to-other trips, or work: the work- to-other-to-home trips, is very similar. The expected change in trip distribution patterns caused by decen- tralization is again difficult to hypothesize. On the one hand, commuting economies resulting from de- centralization offer more opportunities for longer nonwork trips; on the other hand, the ubiquity of re-
APA JOURNAL-SUMMER 1994
Downloaded By: [University of Minnesota Libraries, Twin Cities] At: 17:15 19 May 2010
DAVID M. LEVINSON AND AJAY KUMAR
tail centers and other nonwork destinations makes them more accessible, resulting in shorter trips.
Travel Times by Mode For travel time by mode, it is not surprising that
Table 3 shows longer travel time by AUTO-2 and AUTO-3 (carpool modes) than by AUTO-1. The time lost in collecting carpool members is a common expe- rience. For modes with no technology changes (such as the provision of HOV-3 + lanes or heavy rail), travel time has not changed significantly over the years. The decline in travel time by transit over this period can be attributed in part to the introduction of the heavy- rail Metrorail system in the region. Rail systems with exclusive rights-of-way are typically faster than bus op- erations on surface streets. One explanation for the sharp change in AUTO-3 time, suggested by a re- viewer, is a rise in household-based carpools. Thus, there may be less pick-up/drop-off delay in 1988. Un- fortunately, it was not possible to test that hypothesis with this data base.
The alternative explanation based on technology is not, however, sufficient. During the study period, High Occupancy Vehicle lanes were constructed in the Virginia portion of the metropolitan region, while the travel time for AUTO-3 declined more sharply than it did for other auto modes. Stratifying this data into areas with and without HOV lanes might provide in- sight. Areas with HOV lanes are seen to have had a 2.8- minute time saving for radial trips of Virginia resi- dents working in the “ten-mile square” of Washington, D.C., Arlington County, Virginia, and the City of Alex- andria, Virginia. No comparabIe HOV lanes existed in Maryland or the District of Columbia, yet an almost identical drop of 2.9 minutes occurred between 1968 and 1988 on AUTO-3 trips from Maryland and Wash- ington, D.C. to the same “ten-mile square.” Thus, since the region as a whole had a 2.9-minute reduction in travel time, technology change is not the key explana- tory variable.
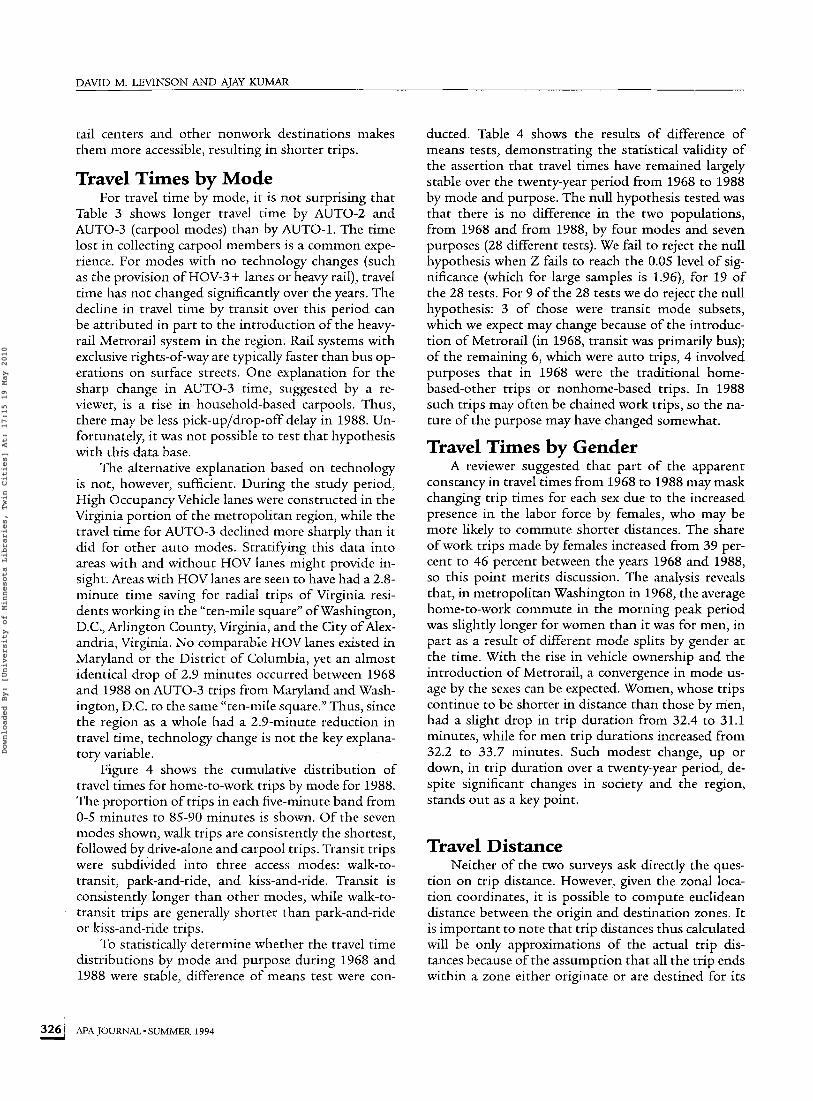
Figure 4 shows the cumulative distribution of travel times for home-to-work trips by mode for 1988. The proportion of trips in each five-minute band from 0-5 minutes to 85-90 minutes is shown. Of the seven modes shown, walk trips are consistently the shortest, followed by drive-alone and carpool trips. Transit trips were subdivided into three access modes: walk-to- transit, park-and-ride, and kiss-and-ride. Transit is consistently longer than other modes, while walk-to- transit trips are generally shorter than park-and-ride or kiss-and-ride trips.
To statistically determine whether the travel time distributions by mode and purpose during 1968 and 1988 were stable, difference of means test were con-
ducted. Table 4 shows the results of difference of means tests, demonstrating the statistical validity of the assertion that travel times have remained largely stable over the twenty-year period from 1968 to 1988 by mode and purpose. The null hypothesis tested was that there is no difference in the two populations, from 1968 and from 1988, by four modes and seven purposes (28 different tests). We fail to reject the null hypothesis when 2 fails to reach the 0.05 level of sig- nificance (which for large samples is 1-96), for 19 of the 28 tests. For 9 of the 28 tests we do reject the null hypothesis: 3 of those were transit mode subsets, which we expect may change because of the introduc- tion of Metrorail (in 1968, transit was primarily bus); of the remaining 6, which were auto trips, 4 involved purposes that in 1968 were the traditional home- based-other trips or nonhome-based trips. In 1988 such trips may often be chained work trips, so the na- ture of the purpose may have changed somewhat.
Travel Times by Gender A reviewer suggested that part of the apparent
constancy in travel times from 1968 to 1988 may mask changing trip times for each sex due to the increased presence in the labor force by females, who may be more likely to commute shorter distances. The share of work trips made by females increased from 39 per- cent to 46 percent between the years 1968 and 1988, so this point merits discussion. The analysis reveals that, in metropolitan Washington in 1968, the average home-to-work commute in the morning peak period was slightly longer for women than it was for men, in part as a result of different mode splits by gender at the time. With the rise in vehicle ownership and the introduction of Metrorail, a convergence in mode us- age by the sexes can be expected. Women, whose trips continue to be shorter in distance than those by men, had a slight drop in trip duration from 32.4 to 31.1 minutes, while for men trip durations increased from 32.2 to 33.7 minutes. Such modest change, up or down, in trip duration over a twenty-year period, de- spite significant changes in society and the region, stands out as a key point.
Travel Distance Neither of the two surveys ask directly the ques-
tion on trip distance. However, given the zonal loca- tion coordinates, it is possible to compute euclidean distance between the origin and destination zones. It is important to note that trip distances thus calculated will be only approximations of the actual trip dis- tances because of the assumption that all the trip ends within a zone either originate or are destined for its
326 APA JOURNAL’SUMMER 1994 i
Downloaded By: [University of Minnesota Libraries, Twin Cities] At: 17:15 19 May 2010
THE RATIONAL LOCATOR: WHY TRAVEL TIMES HAVE REMAINED STABLE
1.2
1
0.8
0.6
0.4
0.2
0
-+ Drive Alone 6 Carpool A Walk 0 Walk to Transii 0 Park & Ride A Kiss & Ride
2.5 12.5 22.5 32.5 42.5 52.5 62.5 72.5 82.5 7.5 17.5 27.5 37.5 47.5 57.5 67.5 77.5 87.5
Time (in minutes)
FIGURE 4. Cumulative distribution of travel times by mode: 1988 home to work trips
TABLE 4. Difference of means test: Null Hypothesis: There is no difference in travel time distributions by mode and purpose from 1968 to 1988
PURPOSE I Home to Work to Home to Other to Work to Other to Other to
MODE 1 Work Home Other Home Other Work Other
AUTO-I AUTO-2 AUTO-3 TRANSIT
0.37 * 0.00 * 4.16 8.81 1.24 * 1.82 * 0.16 * 0.51 * 1.97 2.41 1.14 * 0.61 * 3.67 0.09 * 1.50 * 0.85 * 0.94 * 1.86 * 0.31 * 0.11 * 2.62 0.29 * 8.45 1.91 * 4.22 0.45 * 2.09 0.20 *
Note: * indicates p 5 0.05
APA J0URNAL.SUMMER 1994 1327
Downloaded By: [University of Minnesota Libraries, Twin Cities] At: 17:15 19 May 2010
DAVID M. LEVINSON A N D ATAY KUMAR
Mode Year
AUTO-I 1968 1988
AUTO-2 1968 1988
AUTO-3 1968 '
1988 TRANSIT 1968
1988
center. However, the computed distances are likely to allow meaningful comparison between 1968 and 1988. A better measure of trip distance, accounting for net- work circuity, can be obtained by skimming a trans- portation network. Lack of information in a usable format precluded that approach.
A reviewer has noted that information on trip dis- tance is more likely to be biased for outer areas, with larger traffic zones, than for inner areas, where it is reasonable to expect the errors to be offsetting for small traffic zones. Moreover, this section excludes intra-zonal trips from the analysis. As travel time was reported independently from location, the travel time section included both inter- and intra-zonal trips. The 1968 survey showed approximately 2 percent intra- zonal trips (both work and nonwork), using the most detailed traffic zone system at the time. The 1988 sur- vey showed a similarly small percentage. Excluding these trips, which would have short trip lengths (com- puted distance would be zero miles), is not expected to significantly alter the findings. With those caveats, the authors believe that these findings are worthwhile as a basis for comparison. Moreover, the broad trends discerned from this data set are consistent with na- tional analysis, which reports data on trip distance such as those of the Nationwide Personal Transporta- tion Survey by Pisarslu (1992).
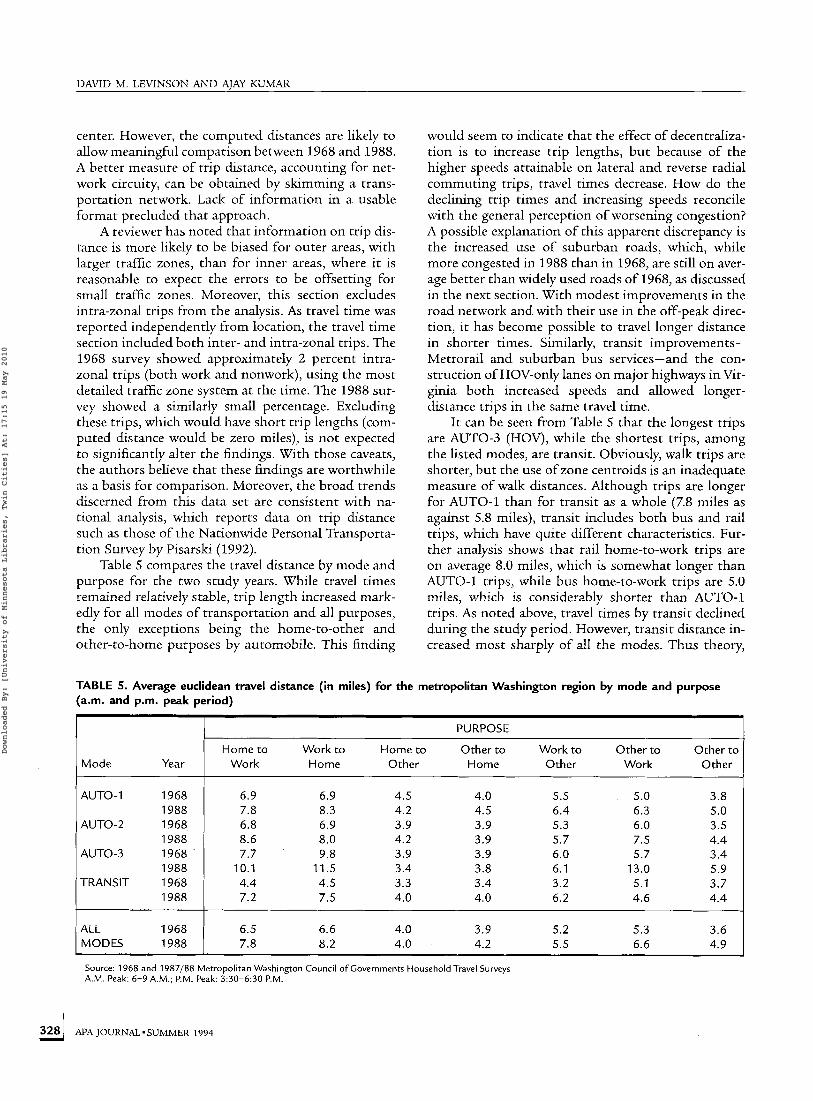
Table 5 compares the travel distance by mode and purpose for the two study years. While travel times remained relatively stable, trip length increased mark- edly for all modes of transportation and all purposes, the only exceptions being the home-to-other and other-to-home purposes by automobile. This finding
PURPOSE
Other t c Home to Work to Home to Other to Work to Other to Work Home Other Home Other Work Other
6.9 6.9 4.5 4.0 5.5 5.0 3.8 7.8 8.3 4.2 4.5 6.4 6.3 5.0 6.8 6.9 3.9 3.9 5.3 6.0 3.5 8.6 8.0 4.2 3.9 5.7 7.5 4.4 7.7 9.8 3.9 3.9 6.0 5.7 3.4
10.1 11.5 3.4 3.8 6.1 13.0 5.9 4.4 4.5 3.3 3.4 3.2 5.1 3.7 7.2 7.5 4.0 4.0 6.2 4.6 4.4
would seem to indicate that the effect of decentraliza- tion is to increase trip lengths, but because of the higher speeds attainable on lateral and reverse radial commuting trips, travel times decrease. How do the declining trip times and increasing speeds reconcile with the general perception of worsening congestion? A possible explanation of this apparent discrepancy is the increased use of suburban roads, which, while more congested in 1988 than in 1968, are still on aver- age better than widely used roads of 1968, as discussed in the next section. With modest improvements in the road network and with their use in the off-peak direc- tion, it has become possible to travel longer distance in shorter times. Similarly, transit improvements- Metrorail and suburban bus services-and the con- struction of HOV-only lanes on major highways in Vir- ginia both increased speeds and allowed longer- distance trips in the same travel time.
It can be seen from Table 5 that the longest trips are AUTO-3 (HOV), while the shortest trips, among the listed modes, are transit. Obviously, walk trips are shorter, but the use of zone centroids is an inadequate measure of walk distances. Although trips are longer for AUTO-1 than for transit as a whole (7.8 miles as against 5.8 miles), transit includes both bus and rail trips, which have quite different characteristics. Fur- ther analysis shows that rail home-to-work trips are on average 8.0 miles, which is somewhat longer than AUTO-1 trips, while bus home-to-work trips are 5.0 miles, which is considerably shorter than AUTO-1 trips. As noted above, travel times by transit declined during the study period. However, transit distance in- creased most sharply of all the modes. Thus theory,
TABLE 5. Average euclidean travel distance (in miles) for the metropolitan Washington region by mode and purpose (am. and p.m. peak period)
1 ALL 1968 1 6.5 6.6 4.0 3.9 5.2 5.3 3.6 MODES 1988 7.8 8.2 4.0 4.2 5.5 6.6 4.9
~ ~~
Source: 1968 and 1987j88 Metropolitan Washington Council o f Governments Household Travel Surveys A.M. Peak: 6-9A.M.; P.M. Peak: 3:30-6:30 P.M.
328 APA J0URNAL.SUMMER 1994 1
Downloaded By: [University of Minnesota Libraries, Twin Cities] At: 17:15 19 May 2010
THE RATIONAL LOCATOR: WHY TRAVEL TIMES HAVE REMAINED STABLE
Mode
AUTO-I AUTO-2 AUTO-3 TRANSIT ALL MODES
TABLE 6. Percent change in speed between 1968 and 1988 for the metropolitan Washington region, by mode and purpose (a.m. and p.m. peak period)
PURPOSE Home to Work to Home to Other to Work to Other to Other to
Work Home Other Home Other Work Other
10.7 20.3 -3.7 0.6 19.4 19.2 32.3 30.9 30.7 2.3 -4.3 13.3 -2.0 26.5 41.2 25.9 -9.7 19.4 9.1 138.3 44.0 69.4 86.2 33.3 38.7 98.4 22.0 15.1 19.1 27.4 1.5 1.6 7.1 18.1 29.9
which predicts that a heavy rail system that makes the central city more accessible from the suburbs would increase trip distance, is borne out.
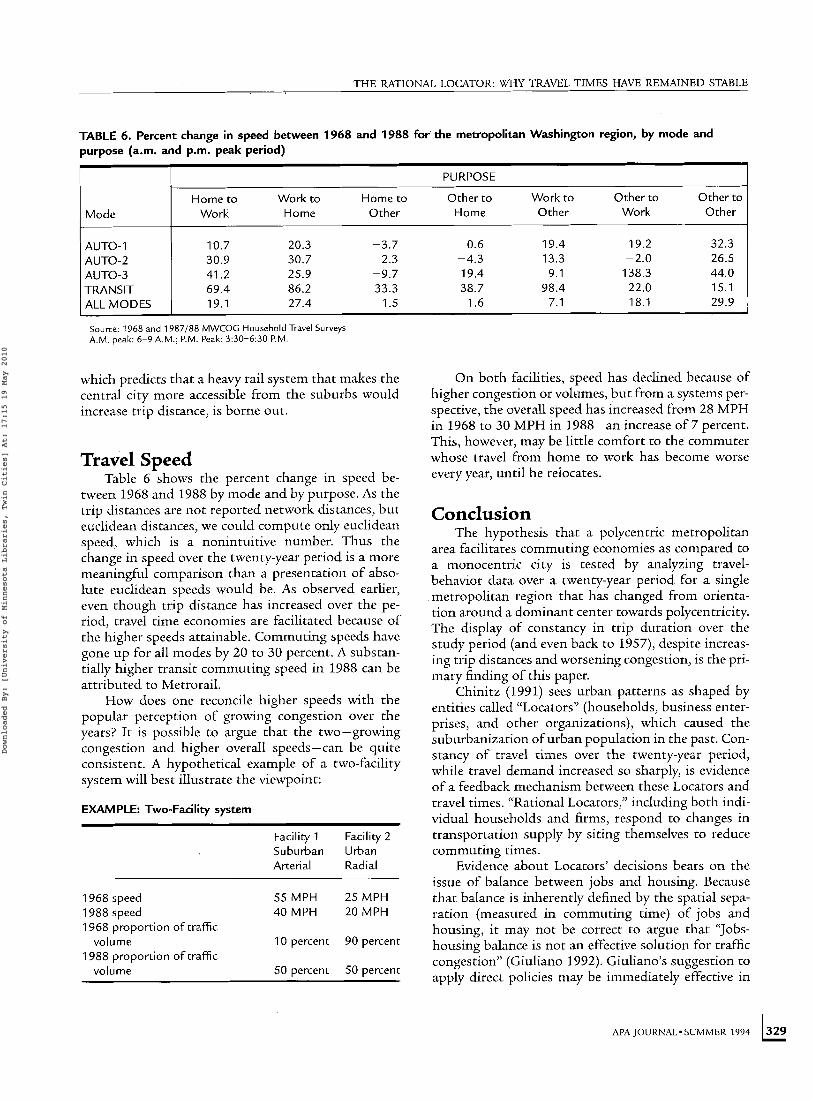
Travel Speed Table 6 shows the percent change in speed be-
tween 1968 and 1988 by mode and by purpose. As the trip distances are not reported network distances, but euclidean distances, we could compute only euclidean speed, which is a nonintuitive number. Thus the change in speed over the twenty-year period is a more meaningful comparison than a presentation of abso- lute euclidean speeds would be. As observed earlier, even though trip distance has increased over the pe- riod, travel time economies are facilitated because of the higher speeds attainable. Commuting speeds have gone up for all modes by 20 to 30 percent. A substan- tially higher transit commuting speed in 1988 can be attributed to Metrorail.
How does one reconcile higher speeds with the popular perception of growing congestion over the years? It is possible to argue that the two-growing congestion and higher overall speeds-can be quite consistent. A hypothetical example of a two-facility system will best illustrate the viewpoint:
EXAMPLE Two-Facility system
Facility 1 Facility 2 Suburban Urban Arterial Radial
~ ~ ~
1968 speed 5 5 M P H 2 5 M P H 1988 speed 4 0 M P H 2 0 M P H 1968 proportion of traffic
1988 proportion o f traffic volume 10 percent 90 percent
volume 50 percent 50 percent
On both facilities, speed has declined because of higher congestion or volumes, but from a systems per- spective, the overall speed has increased from 28 MPH in 1968 to 30 MPH in 1988-an increase of 7 percent. This, however, may be little comfort to the commuter whose travel from home to work has become worse every year, until he relocates.
Conclusion The hypothesis that a polycentric metropolitan
area facilitates commuting economies as compared to a monocentric city is tested by analyzing travel- behavior data over a twenty-year period for a single metropolitan region that has changed from orienta- tion around a dominant center towards polycentricity. The display of constancy in trip duration over the study period (and even back to 1957), despite increas- ing trip distances and worsening congestion, is the pri- mary finding of this paper.
Chinitz (1991) sees urban patterns as shaped by entities called “Locators” (households, business enter- prises, and other organizations), which caused the suburbanization of urban population in the past. Con- stancy of travel times over the twenty-year period, while travel demand increased so sharply, is evidence of a feedback mechanism between these Locators and travel times. “Rational Locators,” including both indi- vidual households and firms, respond to changes in transportation supply by siting themselves to reduce commuting times.
Evidence about Locators’ decisions bears on the issue of balance between jobs and housing. Because that balance is inherently defined by the spatial sepa- ration (measured in commuting time) of jobs and housing, it may not be correct to argue that “Jobs- housing balance is not an effective solution for traffic congestion” (Giuliano 1992). Giuliano’s suggestion to apply direct policies may be immediately effective in
APA J0URNAL.SUMMER 1994 1329
Downloaded By: [University of Minnesota Libraries, Twin Cities] At: 17:15 19 May 2010
DAVID M. LEVINSON AND AJAY KUMAR
reducing congestion, but arguments against a rela- tionship among jobs-housing balance, travel demand, and traffic congestion are not supported by these data. In fact, in the article “Downtown Population Growth and Commuting Trips,” Nowlan and Stewart (1991) validate the impact of jobs-housing balance on travel demand, demonstrating that adding housing to the jobs-oriented center of an area (Toronto) reduced in- bound commuting trips.
In a study of travel in suburban activity centers, Cervero (1989) writes, “Clearly, job and housing growth is out of kilter when workers commute well over an hour each day because housing is neither af- fordable nor in sufficient supply within reasonable proximity of their workplaces.” However, the stability of travel duration reflects on average no regionwide change in the proximity of workers to their jobs. This is neither to deny that local zoning patterns affect the balancing process, nor to state from these data that the total number of opportunities within a certain commuting time has necessarily remained constant. Comparing NPTS data between 1977 and 1983, Gor- don, Kumar, and Richardson (1989) conclude: “The data lend no support to any version of the spatial mis- match hypothesis.” Their principal argument is that decentralization of economic activities, with a near ubiquity of automobile ownership, has facilitated ac- cess by all strata of suburban workers.
While Kenworthy and Newman in JAPA’s “Coun- terpoint” characterize the Gordon, Kumar and Rich- ardson position as “automobile commuting times are the optimizing parameter for cities” and “acquiescence to automobile dependence,” the position could be generalized thus: “Available travel times by mode, weighted by mode preference, are the optimizing pa- rameter for cities, as long as other economic costs re- main small compared to the cost of time.”2 Because in late twentieth-century America, and for the foresee- able future, the automobile is the dominant mode, the net effect is the primacy of automobile travel times. This is not to suggest that one mode is inherently pref- erable to another, a decision we believe to be subjective and not resolvable in objective d i sco~rse .~
The authors recognize that Rational Locators can operate only in cases with free, even if regulated, land markets and adequate supply. Where conditions are otherwise, as in some of the economies of Europe or Asia with more central planning (at least with regards to land), the expression of rational co-locational deci- sions may be inhibited. Some of these cities have funded large heavy-rail systems to maintain their mo- nocentricity, at the cost of higher average travel times. Those American cities with more stringent land regu- lation policies, heavy rail, and additional geographical constraints have higher-than-average travel times
APA JOURNALmSUMMER 1994
(Levinson and Kumar 1993). As to whether the process of suburban relocation has limits, it would appear that metropolitan Washington could continue to add land under development for a very long time. For consis- tency, this study used the same geographical area, al- though the region has expanded and no rigid boundary exists. Recently, the official CMSA defini- tion has expanded north to include Baltimore, Mary- land. The metropolitan area has jumped what had been considered an insurmountable natural barrier, the Chesapeake Bay, at the Bay Bridge. No effective barriers to growth exist south or west of Washington, either.
The key policy implication we see is that over the long term, individual Locators act rationally to bal- ance total costs as measured in dollars and minutes, and total benefits as measured in proximity, space, and other preferences. These individual calculations result in the polycentric, and dispersing, urban form that ex- ists today throughout the United States. According to standard economic literature, a skewed set of input prices produces distortions in the market and leads to inefficient use of resources. The ability of planners to significantly reduce regional commuting times rests on the removal of market distortions such as price subsidies (both auto and transit) and restrictive zon- ing. Aiming squarely at the command and control pol- icies of central planners, the economist and Nobel Prize winner, F.A. Hayek, suggested that the “fatal conceit” is the idea that man can shape the world around him according to his wishes (Hayek 1988).
AUTHORS’ NOTE
The authors would like to thank Peter Gordon, Michael Re- plogle, Robert Winick, Yetta McDaniel and the staffs of the Montgomery County Planning Department and the Metro- politan Washington Council of Governments, as well as three anonymous reviewers. The views expressed herein are those of the authors and do not necessarily represent the views of the Montgomery County Planning Department or the Metropolitan Washington Council of Governments.
NOTES
1. Asking for both departure and arrival times is expected to minimize, though not eliminate, the problem with self-reporting of trip times, arising from the natural in- clination to round times to the nearest five, ten, or fif- teen minutes. It should be noted that data collected this way vary significantly from data collected by asking for departure time and trip duration. See, for instance, the difference in trip duration between U.S. Census Journey to Work Data and the U.S. Department of Transporta- tion Nationwide Personal Travel Survey.
2. A caveat regarding travel time stability: It is also under-
Downloaded By: [University of Minnesota Libraries, Twin Cities] At: 17:15 19 May 2010
T H E RATIONAL LOCATOR: W H Y TRAVEL TIMES HAVE REMAINED STABLE
stood that, broadly, for urban travel, out-of-pocket costs to the traveler have been constant and small over these twenty years compared with cost in time. Radically changing the personal costs of the commuting decisions could very well alter the average travel duration for all purposes and modes. However, the removal of transpor- tation subsidies might not in itself result in higher den- sities or change urban form in the way that N-K favor. Although Mark Hanson recently advocated eliminating auto subsidies to discourage low density sprawl (Han- son 1992), Gomez-Ibanez and Meyer had earlier noted that “if the full congestion and parking costs of urban use of automobiles were assessed, the stage would be set for society to make reasonably rational choices about the extent to which it preferred high-density metropoli- tan development supported by public transit as con- trasted, say, to lower density development supported by automobile commuting” (Gomez-Ibanez and Meyer 1990). Nonetheless: “The likelihood of implementing an areawide pricing scheme on existing metropolitan road network anywhere in the U.S. appears to be extremely remote at this point in time” (Orski 1991).
3. This point briefly focuses on the reply by Herskowitz (1992) to the Gordon, Richardson and Jun (1991) article “The Commuting Paradox.” While fully agreeing with the analysis as “faultless,” Herskowitz nonetheless views urban sprawl as aggravating transportation problems and as a negative phenomenon. He refers to a lack of the potential benefits of urban living due to “inefficient transportation and neglect of public transportation.” The specific position held by Herskowitz, therefore, re- mains unclear. It is not the purpose of this paper to sub- scribe to any particular view about urban living as normatively better; such judgments depend on individ- ual preferences and the available choice set. However, it is important to point out that even in cities such as Washington, D.C., with a heavy investment in public transit in the form of Metrorail, average commuting times have remained stable or declined, and speeds have improved in the face of rapid suburbanization.
4. Since travel time distribution patterns exhibit such con- stancy over a twenty-year period, this information can be used in forecasting travel patterns. In a related study, it is used to develop a model for forecasting travel distri- bution patterns into the future. Incorporating feedback for congestion, as measured by peak travel times, into the transportation planning model is more likely to yield “accurate” results as compared with either linear extrapolation of the past, or holding constant base-year congestion levels. Conventional applications of urban transportation planning models often ignore this feed- back between provision of transportation facilities (sup- ply) and time spent in travel (demand); instead they consider transportation facilities as a purely physical system, such as water, where increased demand necessi- tates increased supply, and not as an economic system where increased costs, as measured in travel time be- tween two points, may result in reduced demand be- tween those locations. Thus, if account is taken of the
ability to respond in the long run to changes in the transportation system, average commuting travel times exhibit much smaller changes than they would in a model that ignores this fundamental relationship.
REFERENCES
Bourne, L. S. 1992. Self-Fulfilling Prophecies? Decentraliza- tion, Inner City Decline, and the Quality of Urban Life. Journal of the American Planning Association 58, 4 509-13.
Cervero, Robert. 1989. Jobs-Housing Balance and Regional Mobility. Journal of the American Planning Association 55, 2: 136-50.
Chinitz, Benjamin. 1991. A Framework for Speculating about Future Urban Growth Patterns in the U.S. Urban Studies 28, 6: 939-59.
Ganz, Alexander. 1968. Emerging Patterns of Growth and Travel. Highway Research Record 229: 21-37.
Giuliano, Genevieve. 1992. Is Jobs-Housing Balance a Trans- portation Issue? Transportation Research Record 1305: 305-12.
Gomez-Ibanez, Jose A. 1991. A Global View of Automobile Dependence. Journal of the American Planning Association 57, 3: 45-56.
Gomez-Ibanez, Jose A., and John Meyer. 1990. Privatizing and Deregulating Local Public Services: Lessons from Britain’s Buses. Journal of the American Planning Association 56, 1: 9-21.
Gordon, Peter, Ajay Kumar, and Harry W. Richardson. 1989. Spatial Mismatch Hypotheses: Some New Evidence. Ur- ban Studies 26: 315-26.
Gordon, Peter, and Harry W. Richardson. 1989. Gasoline Consumption and Cities: A Reply. Journal of the American Planning Association 55, 3: 342-5.
Gordon, Peter, Harry W. Richardson, and Myung-Jin Jun. 1991. The Commuting Paradox: Evidence from the Top Twenty. Journal of the American Planning Association 57, 4 416-20.
Hanson, Mark. 1992. Automobile Subsidies and Land Use: Estimates and Policy Responses. Journal of the American Planning Association 58, 1: 60-71.
Hayek, Friedrich A. 1988. The Fatal Conceit: The Errors of Social- ism. Chicago: The University of Chicago Press.
Heanue, Kevin E., and Pyers, Clyde E. 1966. A Comparative Evaluation of Trip Distribution Procedures. Highway Re- search Record 114 20-50.
Herskowitz, David S. 1992. Letter to the Editor: The Com- muting Paradox: A Reply. Journal of the American Planning Association 58, 2: 244.
Kanwit, E., and A. Eckartt. 1967. Transportation Implica- tions of Employment Trends in Central Cities and Sub- urbs. Highway Research Record 187: 1-14.
Levinson, David, and Ajay Kumar. 1993. Is Residential Den- sity a Transportation Issue? Working paper, Montgomery County Planning Department, Silver Spring, MD.
Metropolitan Washington Council of Governments. 1968. Household Travel Survey.
Metropolitan Washington Council of Governments. 1988. Household Travel Survey.
APA JOURNALmSUMMER 1994 1331
Downloaded By: [University of Minnesota Libraries, Twin Cities] At: 17:15 19 May 2010

DAVID M. LEVINSON AND AJAY KUMAR
Montgomery County Planning Department. 1991. Trends and Forecasts.
Montgomery County Planning Department. 1992. General Plan Refinement Transportation Fact Sheet.
Newman, Peter W.G., and John R. Kenworthy. 1989a. Cities and Automobile Dependence: An International Sourcebook. Al- dershot, UK: Glower.
1989b. Gasoline Consumption and Cities: A Compari- son of U.S. Cities with a Global Survey. Journal of the Amer- ican Planning Association 55, 1: 24-37.
1992. Is There a Role for Physical Planners? Journal of the American Planning Association 58, 3: 353-62.
Niedercorn, John, and John Kain. 1963. Suburbanization of Employment and Population 1948- 1975. Highway Re- search Record 38: 25-39.
Nowlan, David M., and Greg Stewart. 1991. Downtown Pop- ulation Growth and Commuting Trips: Recent Experi- ence in Toronto. Journal of the American Planning Association 57, 2: 165-82.
Orski, Kenneth. 1991. Congestion Pricing: Its Promise and Its Limitations. Transportation Planning 18,2 15-20.
Pisarski, Alan. 1992. New Perspectipes in Commuting. United States Department of Transportation.
Silver, Jonathan. 1959. Trends in Travel to the Central Busi- ness District by Residents of the Washington, D.C. Metro- politan Area, 1948 and 1955. Public Roads 30, 7: 153-76.
Whyte, William H. Jr., ed. 1957. The Exploding Metropolis. Berkeley, CA University of California Press.
332 APA JOURNALmSUMMER 1994 i
Downloaded By: [University of Minnesota Libraries, Twin Cities] At: 17:15 19 May 2010