The Ramco Cements - Moneycontrol
6
25 th May 2022 RESULT UPDATE The Ramco Cements
-
Upload
khangminh22 -
Category
Documents
-
view
4 -
download
0
Transcript of The Ramco Cements - Moneycontrol

25th May 2022RESULT UPDATE
The Ramco Cements

2PageIndia Equity Institutional Research II Result Update – Q4FY22 II 25th May, 2022
KRChoksey Researchis also available on Bloomberg KRCS<GO>
Thomson Reuters, Factset and Capital IQ
Phone: +91-22-6696 5555, Fax: +91-22-6691 9576www.krchoksey.com
The Ramco Cements Ltd.
ANALYSTKushal Shah, [email protected], +91-22-6696 5423
CMP
INR 659 Target
INR 843Potential Upside
28%Market Cap (INR Mn)
INR 1,55,835Recommendation
BUYSector
Cement
Shares outs (Mn) 236.3
Mkt Cap (INR Mn) 1,55,835
52 Wk H/L (INR) 1133/652
Volume Avg (3m K) 374
Face Value (INR) 1
Bloomberg Code TRCL IN
MARKET DATA
SHARE PRICE PERFORMANCE
SENSEX 54,053
NIFTY 16,125
MARKET INFO
KEY FINANCIALS
Source: Company, KRChoksey Research
Result Highlights
• In Q4FY22, Ramco Cement’s revenue grew 4.9% YoY/10.4% QoQ to INR 17,134 mn. Cement sales was mostly flat at 31.92 lac tons forQ4FY22, a decline of 1% YoY from 32.13 lac tons in Q4FY21.
• EBITDA has seen a decline of 34.3% YoY to INR 2,949 mn, though on QoQ basis EBITDA grew by 28.8%. EBITDA margin expandedby 247 bps QoQ to 17.2%, though on YoY basis margin suffered contraction to the tune of 1,027 bps.
• PAT has seen a growth of 56.8% QoQ to INR 1,186 mn, though on YoY basis PAT suffered a decline of 45.1%. PAT margin expandedby 205 bps QoQ to 6.9%. However, on YoY basis, margin suffered a contraction of 631 bps.
SHARE HOLDING PATTERN (%)
Revenue CAGR between FY22 and FY24E
13.6 %Adj. PAT CAGR between FY22
and FY24E
26.0%
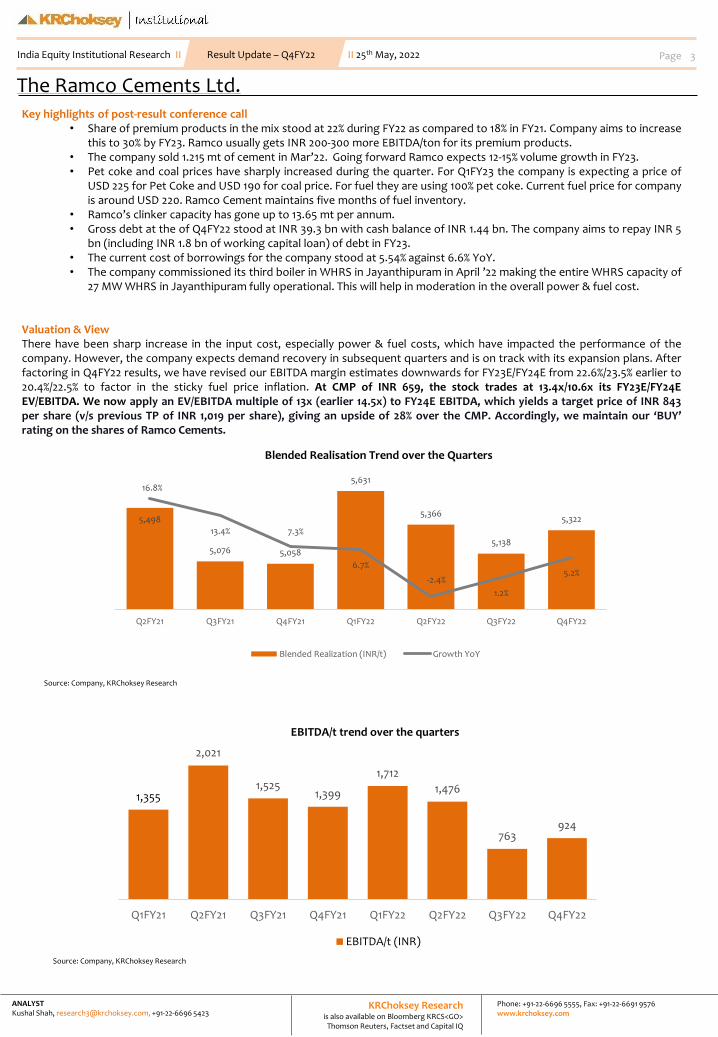
Realisation improved despite flat volume growthIn Q4FY22, Ramco’s cement sales volume was mostly flat at 3.19 mt, a decline of 0.6% YoYfrom 3.21 mt in Q4FY21. For FY22, sales volume was 11.05 mt against 9.98 mt in FY21, a growthof 11% YoY. The share of premium products stood at 22% for FY22 compared to 18% in FY21.Ramco took price hikes (INR 10-15/bag) during Q4FY22 and dispatched very low volumes toEastern Region which is witnessing lower realisation amidst weak demand. Due to judicioussales mix and price hikes, realisation grew 5.2% YoY/3.6% QoQ to INR 5,322/t. Management hasguided for 12-15% volume growth in FY23E, which will be supported by demand recovery inEastern Region and higher utilisation from its Kurnool Plant.
Margin suffered due to steep rise in fuel costsA sharp rise in input prices especially power and fuel costs (88.5% YoY/12.5% QoQ) hadweighed on EBITDA. Ramco saw a decline of 34.3% YoY in Q4FY22 EBITDA to INR 2,949 mn,though on QoQ basis EBITDA grew by 28.8%. EBITDA margin expanded by 247 bps QoQ to17.2%, though on YoY basis margin suffered contraction to the tune of 1,027 bps. On a per tonbasis, Ramco’s EBITDA/t suffered a decline of 33.9% YoY to INR 924, on account of 89.7% YoYrise in Power & Fuel Costs on per ton basis to INR 1,463. Though on QoQ basis EBITDA/t grew21.1% despite 5.8% QoQ rise in Power & Fuel Cost on per ton basis, due to effective cost controlmeasures by the company like use of WHRS (Waste Head Recovery) operations in JPM, whichhas helped the company to manage power cost better.
Status of capacity expansion plansThe company has commenced trial production of clinker in Kurnool in May 2022. Cementgrinding in Kurnool will be commissioned in June 2022. WHRS capacity of 6 MW in Kurnool willbe commissioned in July 2022, while balance 6.15 MW will be commissioned in March 2023.Modernization of RRN Plant will be commissioned in March 2023. For Dry Mortar Plant,expansion of 2 units will be commissioned in FY23 and remaining 2 units will be commissionedin FY24. The company spent INR 4,290 mn in capex for Q4FY22, while total capex spend forFY22 stood at INR 18.2 bn.
Cost pressure continues, expect better performance ahead
Particulars Mar-22 (%) Dec-21 (%) Sept-21 (%)
Promoters 42.3 42.5 42.5
FIIs 7.6 8.1 8.7
DIIs 36.0 35.7 31.7
Others 14.1 13.7 17.1
Total 100 100 100
INR Mn FY20 FY21 FY22 FY23E FY24E Revenue 53,893 52,910 60,037 68,055 77,449EBITDA 11,474 15,573 12,901 13,868 17,456
PAT 6,051 7,843 8,820 6,651 9,120
Adj. PAT 6,051 7,843 5,741 6,651 9,120
Adj. EPS (INR) 25.7 33.2 24.3 28.1 38.6
EBITDA Margin 21.3% 29.4% 21.5% 20.4% 22.5%
Adj. NPM 11.2% 14.8% 9.6% 9.8% 11.8%
30.0
50.0
70.0
90.0
110.0
130.0
150.0
170.0
190.0
210.0
Oct
-18
Jan
-19
Ap
r-19
Jul-1
9O
ct-1
9Ja
n-2
0A
pr-
20Ju
l-20
Oct
-20
Jan
-21
Ap
r-21
Jul-2
1O
ct-2
1Ja
n-2
2A
pr-
22
Ramco Cement Nifty
3PageIndia Equity Institutional Research II Result Update – Q4FY22 II 25th May, 2022
KRChoksey Researchis also available on Bloomberg KRCS<GO>
Thomson Reuters, Factset and Capital IQ
Phone: +91-22-6696 5555, Fax: +91-22-6691 9576www.krchoksey.com
The Ramco Cements Ltd.
ANALYSTKushal Shah, [email protected], +91-22-6696 5423
Source: Company, KRChoksey Research
Key highlights of post-result conference call• Share of premium products in the mix stood at 22% during FY22 as compared to 18% in FY21. Company aims to increase
this to 30% by FY23. Ramco usually gets INR 200-300 more EBITDA/ton for its premium products.• The company sold 1.215 mt of cement in Mar’22. Going forward Ramco expects 12-15% volume growth in FY23.• Pet coke and coal prices have sharply increased during the quarter. For Q1FY23 the company is expecting a price of
USD 225 for Pet Coke and USD 190 for coal price. For fuel they are using 100% pet coke. Current fuel price for companyis around USD 220. Ramco Cement maintains five months of fuel inventory.
• Ramco’s clinker capacity has gone up to 13.65 mt per annum.• Gross debt at the of Q4FY22 stood at INR 39.3 bn with cash balance of INR 1.44 bn. The company aims to repay INR 5
bn (including INR 1.8 bn of working capital loan) of debt in FY23.• The current cost of borrowings for the company stood at 5.54% against 6.6% YoY.• The company commissioned its third boiler in WHRS in Jayanthipuram in April ’22 making the entire WHRS capacity of
27 MW WHRS in Jayanthipuram fully operational. This will help in moderation in the overall power & fuel cost.
Valuation & ViewThere have been sharp increase in the input cost, especially power & fuel costs, which have impacted the performance of thecompany. However, the company expects demand recovery in subsequent quarters and is on track with its expansion plans. Afterfactoring in Q4FY22 results, we have revised our EBITDA margin estimates downwards for FY23E/FY24E from 22.6%/23.5% earlier to20.4%/22.5% to factor in the sticky fuel price inflation. At CMP of INR 659, the stock trades at 13.4x/10.6x its FY23E/FY24EEV/EBITDA. We now apply an EV/EBITDA multiple of 13x (earlier 14.5x) to FY24E EBITDA, which yields a target price of INR 843per share (v/s previous TP of INR 1,019 per share), giving an upside of 28% over the CMP. Accordingly, we maintain our ‘BUY’rating on the shares of Ramco Cements.
Source: Company, KRChoksey Research
5,498
5,076 5,058
5,631
5,366
5,138
5,322
16.8%
13.4% 7.3%
6.7%
-2.4%
1.2%
5.2%
-5.0%
0.0%
5.0%
10.0%
15.0%
20.0%
4,700
4,800
4,900
5,000
5,100
5,200
5,300
5,400
5,500
5,600
5,700
Q2FY21 Q3FY21 Q4FY21 Q1FY22 Q2FY22 Q3FY22 Q4FY22
Blended Realisation Trend over the Quarters
Blended Realization (INR/t) Growth YoY
1,355
2,021
1,5251,399
1,712
1,476
763924
Q1FY21 Q2FY21 Q3FY21 Q4FY21 Q1FY22 Q2FY22 Q3FY22 Q4FY22
EBITDA/t trend over the quarters
EBITDA/t (INR)

4PageIndia Equity Institutional Research II Result Update – Q4FY22 II 25th May, 2022
KRChoksey Researchis also available on Bloomberg KRCS<GO>
Thomson Reuters, Factset and Capital IQ
Phone: +91-22-6696 5555, Fax: +91-22-6691 9576www.krchoksey.com
The Ramco Cements Ltd.
ANALYSTKushal Shah, [email protected], +91-22-6696 5423
Exhibit 1: Profit & Loss Statement
Source: Company, KRChoksey Research *Adjusted for deferred tax reversal
KEY FINANCIALS
Exhibit 2: Cash Flow Statement
Exhibit 3: Key Ratios
Source: Company, KRChoksey Research
Source: Company, KRChoksey Research
INR Mn FY 20 FY 21 FY22 FY23E FY24E
Revenues 53,893 52,910 60,037 68,055 77,449
COGS 8,738 8,654 8,904 10,480 12,392
Gross profit 45,155 44,256 51,133 57,574 65,057
Employee cost 3,806 4,188 4,352 4,779 5,779
Transportation and Handing 11,377 10,260 12,143 13,747 15,877
Power and Fuel 10,509 7,947 13,888 16,333 16,264
Other Expenses 7,989 6,290 7,850 8,847 9,681
EBITDA 11,474 15,573 12,901 13,868 17,456
EBITDA Margin 21.3% 29.4% 21.5% 20.4% 22.5%
Depreciation & amortization 3,165 3,566 4,022 3,901 4,350
EBIT 8,309 12,008 8,878 9,966 13,106
Interest expense 721 876 1,124 1,590 1,500
Other income 335 304 280 454 517
Share of (loss) of associates and JV's 7 208 -109 61 69
Exceptional items loss (profit) 0 0 0 0 0
PBT 7,929 11,643 7,925 8,892 12,192
Income tax expense 1,879 3,799 -894 2,241 3,072
Minority Interest 9.3 6.9 4.7 3.5 4.9
PAT 6,051 7,843 8,820 6,651 9,120
Adj. PAT 6,051 7,843 5,741* 6,651 9,120
EPS (INR) 25.7 33.2 37.3 28.1 38.6
Adj. EPS (INR) 25.7 33.2 24.3 28.1 38.6
INR Mn FY 20 FY 21 FY22 FY23E FY24E
Net Cash Generated From Operations 7,481 18,924 11,349 10,585 15,365
Net Cash Flow from/(used in) Investing Activities (19,209) (17,889) (18,155) (5,730) (9,216)
Net Cash Flow from Financing Activities 11,936 (636) 7,154 (1,657) (7,235)
Net Inc/Dec in cash equivalents 208 398 348 3,198 (1,087)
Opening Balance of cash & cash equivalents 580 639 1,081 1,462 4,659
Closing balance of cash equivalents 639 1,081 1,462 4,659 3,573
Cash and Cash Equivalents (BS) 639 1,081 1,462 4,659 3,573
Key Ratio FY 20 FY 21 FY22 FY23E FY24E
EBITDA Margin (%) 21.3% 29.4% 21.5% 20.4% 22.5%
Net Profit Margin (%) 11.2% 14.8% 14.7% 9.8% 11.8%
RoE (%) 12.7% 14.6% 14.3% 9.7% 12.2%
RoCE (%) 11.9% 14.3% 9.1% 9.4% 11.9%
Current Ratio (x) 0.7x 0.6x 0.6x 0.7x 0.7x

5PageIndia Equity Institutional Research II Result Update – Q4FY22 II 25th May, 2022
KRChoksey Researchis also available on Bloomberg KRCS<GO>
Thomson Reuters, Factset and Capital IQ
Phone: +91-22-6696 5555, Fax: +91-22-6691 9576www.krchoksey.com
The Ramco Cements Ltd.
ANALYSTKushal Shah, [email protected], +91-22-6696 5423
Exhibit 4: Balance Sheet
Source: Company, KRChoksey Research
INR Mn FY 20 FY 21 FY22 FY23E FY24E Current assets
Inventories 6,469 5,993 8,345 9,188 9,846Trade Receivables 5,276 3,759 3,507 4,102 4,244Cash and Cash Equivalents 639 1,081 1,462 4,659 3,573Other bank balances 302 357 323 323 323Loans 298 277 136 154 176Other financial assets 1,041 1,362 1,582 1,793 2,041Current tax assets 28 11 7 7 7Other current assets 1,703 1,748 1,712 1,940 2,208Total current assets 15,757 14,589 17,074 22,168 22,417
Non-current assetsProperty, plant and equipment 58,464 67,761 75,755 76,933 80,906Capital work in process 18,143 23,255 29,922 29,922 29,922Investment property 1,470 1,450 1,304 1,478 1,682Intangible assets 560 573 670 670 670Intangible assets under development 261 297 419 419 419Investments in associates 2,499 2,791 2,693 3,053 3,474Other investments 256 279 278 315 359Loan 281 431 662 751 854Other financial assets 189 214 291 329 375Deferred tax assets 4 4 9 9 9Other non-current assets 3,445 2,907 2,510 2,845 3,237
Total non-current assets 85,571 99,960 1,14,510 1,16,722 1,21,905TOTAL ASSETS 1,01,328 1,14,549 1,31,584 1,38,890 1,44,322
EQUITY AND LIABILITIESCurrent liabilities
Borrowings 8,001 9,392 10,727 11,999 10,499Trade Payables 3,430 3,645 4,907 5,168 6,790Other financial liabilities 10,600 8,909 8,974 10,172 11,576Other current liabilities 1,026 1,909 2,727 3,091 3,517Provisions 293 324 376 426 485Deferred Government Grants 14 14 14 0 0Liabilities for Current tax 0 0 102 0 0
Total current liabilities 23,363 24,194 27,826 30,856 32,867Non-current liabilities
Borrowings 18,404 21,706 28,769 27,997 24,497Provisions 240 321 413 413 413Deferred tax liabilities 9,122 10,835 8,223 8,223 8,223Deferred Government Grants 128 115 101 101 101
Total non-current liabilities 27,895 32,975 37,505 36,733 33,233Equity
Share capital 236 236 236 236 236Other equity 49,778 57,081 65,950 70,994 77,910
Minority interest 56 63 68 71 76Total Equity 50,070 57,380 66,254 71,301 78,222Total liabilities and equity 1,01,328 1,14,549 1,31,584 1,38,890 1,44,322

6PageIndia Equity Institutional Research II Result Update – Q4FY22 II 25th May, 2022
KRChoksey Researchis also available on Bloomberg KRCS<GO>
Thomson Reuters, Factset and Capital IQ
Phone: +91-22-6696 5555, Fax: +91-22-6691 9576www.krchoksey.com
The Ramco Cements Ltd.
ANALYSTKushal Shah, [email protected], +91-22-6696 5423
Rating Legend (Expected over a 12-month period)
Our Rating Upside
Buy More than 15%
Accumulate 5% – 15%
Hold 0 – 5%
Reduce -5% – 0
Sell Less than – 5%
Please send your feedback to [email protected] us at www.krchoksey.com
KRChoksey Shares and Securities Pvt. LtdRegistered Office:
1102, Stock Exchange Tower, Dalal Street, Fort, Mumbai – 400 001.Phone: +91-22-6633 5000; Fax: +91-22-6633 8060.
Corporate Office: ABHISHEK, 5th Floor, Link Road, Andheri (W), Mumbai – 400 053.
Phone: +91-22-6696 5555; Fax: +91-22-6691 9576.
ANALYST CERTIFICATION:
I, Kushal Shah (CFA L1, CFP, M.com), Research Analyst, author and the name subscribed to this report, hereby certify that all of the views expressed in this research report accurately reflectmy views about the subject issuer(s) or securities. I also certify that no part of our compensation was, is, or will be directly or indirectly related to the specific recommendation(s) or view(s)in this report.
Terms & Conditions and other disclosures:
KRChoksey Shares and Securities Pvt. Ltd (hereinafter referred to as KRCSSPL) is a registered member of National Stock Exchange of India Limited and Bombay Stock Exchange Limited.KRCSSPL is a registered Research Entity vides SEBI Registration No. INH000001295 under SEBI (Research Analyst) Regulations, 2014.
We submit that no material disciplinary action has been taken on KRCSSPL and its associates (Group Companies) by any Regulatory Authority impacting Equity Research Analysis activities.
KRCSSPL prohibits its analysts, persons reporting to analysts and their relatives from maintaining a financial interest in the securities or derivatives of any companies that the analyst covers.
The information and opinions in this report have been prepared by KRCSSPL and are subject to change without any notice. The report and information contained herein is strictly confidentialand meant solely for the selected recipient and may not be altered in any way, transmitted to, copied or distributed, in part or in whole, to any other person or to the media or reproduced inany form, without prior written consent of KRCSSPL. While we would endeavor to update the information herein on a reasonable basis, KRCSSPL is not under any obligation to update theinformation. Also, there may be regulatory, compliance or other reasons that may prevent KRCSSPL from doing so. Non-rated securities indicate that rating on a particular security has beensuspended temporarily and such suspension is in compliance with applicable regulations and/or KRCSSPL policies, in circumstances where KRCSSPL might be acting in an advisory capacity tothis company, or in certain other circumstances.
This report is based on information obtained from public sources and sources believed to be reliable, but no independent verification has been made nor is its accuracy or completenessguaranteed. This report and information herein is solely for informational purpose and shall not be used or considered as an offer document or solicitation of offer to buy or sell or subscribefor securities or other financial instruments. Though disseminated to all the customers simultaneously, not all customers may receive this report at the same time. KRCSSPL will not treatrecipients as customers by virtue of their receiving this report. Nothing in this report constitutes investment, legal, accounting and tax advice or a representation that any investment orstrategy is suitable or appropriate to your specific circumstances. The securities discussed and opinions expressed in this report may not be suitable for all investors, who must make theirown investment decisions, based on their own investment objectives, financial positions and needs of specific recipient. This may not be taken in substitution for the exercise of independentjudgment by any recipient. The recipient should independently evaluate the investment risks. The value and return on investment may vary because of changes in interest rates, foreignexchange rates or any other reason. KRCSSPL accepts no liabilities whatsoever for any loss or damage of any kind arising out of the use of this report. Past performance is not necessarily aguide to future performance. Investors are advised to see Risk Disclosure Document to understand the risks associated before investing in the securities markets. Actual results may differmaterially from those set forth in projections. Forward-looking statements are not predictions and may be subject to change without notice. Our employees in sales and marketing team,dealers and other professionals may provide oral or written market commentary or trading strategies that reflect opinions that are contrary to the opinions expressed herein, .In reviewingthese materials, you should be aware that any or all of the foregoing, among other things, may give rise to real or potential conflicts of interest.
Associates (Group Companies) of KRCSSPL might have received any commission/compensation from the companies mentioned in the report during the period preceding twelve monthsfrom the date of this report for services in respect of brokerage services or specific transaction or for products and services other than brokerage services.
KRCSSPL or its Associates (Group Companies) have not managed or co-managed public offering of securities for the subject company in the past twelve months.
KRCSSPL encourages the practice of giving independent opinion in research report preparation by the analyst and thus strives to minimize the conflict in preparation of research report.KRCSSPL or its analysts did not receive any compensation or other benefits from the companies mentioned in the report or third party in connection with preparation of the research report.Accordingly, neither KRCSSPL nor Research Analysts have any material conflict of interest at the time of publication of this report.
It is confirmed that, Kushal Shah (CFA L1, CFP, M.com), Research Analyst of this report have not received any compensation from the companies mentioned in the report in the precedingtwelve months. Compensation of our Research Analysts is not based on any specific brokerage service transactions.
KRCSSPL or its associates (Group Companies) collectively or its research analyst do not hold any financial interest/beneficial ownership of more than 1% (at the end of the month immediatelypreceding the date of publication of the research report) in the company covered by Analyst, and has not been engaged in market making activity of the company covered by researchanalyst.
It is confirmed that, Kushal Shah (CFA L1, CFP, M.com), Research Analyst do not serve as an officer, director or employee of the companies mentioned in the report.
This report is not directed or intended for distribution to, or use by, any person or entity who is a citizen or resident of or located in any locality, state, country or other Jurisdiction, wheresuch distribution, publication, availability or use would be contrary to law, regulation or which would subject KRCSSPL and affiliates to any registration or licensing requirement within suchjurisdiction. The securities described herein may or may not be eligible for sale in all jurisdictions or to certain category of investors. Persons in whose possession this document may comeare required to inform them of and to observe such restriction.
The Ramco Cements Ltd.
DateCMP (INR)
TP (INR)
Recommendation
25-05-22 659 843 BUY
25-01-22 861 1,019 BUY
26-10-21 1,015 1,176 BUY
29-07-21 1,041 1,119 ACCUMULATE
30-06-21 1,036 1,107 ACCUMULATE
26-05-21 946 1,070 ACCUMULATE
17-03-21 999 1021 HOLD
15-12-20 845 868 HOLD
24-09-20 724 751 HOLD
20-08-20 702 751 ACCUMULATE