Assignments for the Benefit of Creditors and Competitive ...
Upload
independentCategory
view
0download
0
ORIGINAL RESEARCH
The r0 structural parameters of equatorial and axialchlorocyclobutane, conformational stability from temperaturedependent infrared spectra of xenon solutions, and vibrationalassignments
James R. Durig Æ Joshua J. Klaassen ÆArindam Ganguly Æ Todor K. Gounev ÆGamil A. Guirgis Æ Wei Lin
Received: 3 August 2008 / Accepted: 26 August 2008 / Published online: 19 September 2008
� Springer Science+Business Media, LLC 2008
Abstract Variable temperature (-55 to -100 �C) studies
of the infrared spectra (4,000–400 cm-1) of chlorocyc-
lobutane, c-C4H7Cl, dissolved in liquid xenon have been
carried out. The infrared spectrum (4,000–100 cm–1) of the
gas has also been recorded. For this puckered ring molecule
the enthalpy difference between the more stable equatorial
conformer and the axial form, has been determined to be
361 ± 17 cm-1 (4.32 ± 0.20 kJ/mol). This stability order
is consistent with that predicted by ab initio calculations
but the DH is much lower than the average energy value of
646 ± 73 cm-1 obtained from the MP2 ab initio calcula-
tions or 611 ± 28 cm-1 from the B3LYP density
functional theory calculations. The percentage of the axial
conformer present at ambient temperature is estimated to
be 15 ± 1%. By utilizing previously reported microwave
rotational constants for both conformers combined with
ab initio MP2(full)/6–311?G(d,p) predicted structural
values, adjusted r0 parameters have been obtained. The
determined heavy atom structural parameters for the
equatorial conformer are: the distances C–Cl = 1.783(5),
C1–C4 = 1.539(3), C4–C6 = 1.558(3) A, and angles
\C6C4C1 = 86.9(5), \C4C1C5 = 89.7(5)�, and for the
axial conformer are: the distances C–Cl = 1.803(5),
C1–C4 = 1.547(3), C4–C6 = 1.557(3) A, and angles
\C6C4C1 = 86.3(5), \C4C1C5 = 88.9(5) and the pucker-
ing angles for the equatorial and axial conformers are
30.7(5)� and 22.3(5)�, respectively. The conformational
stabilities, harmonic force fields, infrared intensities,
Raman activities, depolarization ratios and vibrational
frequencies have been obtained for both conformers from
MP2(full)/6-31G(d) ab initio calculations and compared to
experimental values where available. The results are dis-
cussed and compared to the corresponding properties of
some similar molecules.
Keywords Infrared spectrum � Xenon solutions �Conformational stability � r0 Structural parameters �Ab initio calculations � Chlorocyclobutane
Introduction
Structural studies of monosubstituted derivatives of cyc-
lobutanes in the vapor phase have shown the four-
membered rings usually adopt a non-planar equilibrium
conformation. For most molecules studied to date, the most
stable conformation is the one in which the substituent is in
the equatorial position relative to the puckered ring. For
several of the molecules it was initially proposed that the
axial conformer has only one bound state so no ring-
puckering mode was observed for the axial conformer of
Cl, Br, F, NH2 [1–5]. However, initially the cyclobutyl
silane molecule was shown to have both an equatorial and
axial form with the latter one having more than one energy
level for the ring-puckering mode by microwave studies
[6]. Additionally, cyclobutanol was also initially proposed
Taken in part from the thesis of Arindam Ganguly, which will be
submitted in partial fulfillment of the Ph.D. degree.
J. R. Durig (&) � J. J. Klaassen � A. Ganguly � T. K. Gounev
Department of Chemistry, University of Missouri-Kansas City,
Kansas City, MO 64110, USA
e-mail: [email protected]
G. A. Guirgis
Department of Chemistry and Biochemistry, College of
Charleston, Charleston, SC 29424, USA
W. Lin
Department of Natural Science and Mathematics,
University of Saint Mary, Leavenworth, KS 66048, USA
123
Struct Chem (2008) 19:935–948
DOI 10.1007/s11224-008-9378-8

[7] to have an axial well with more than one energy level
for the ring-puckering mode. Since these initial studies
several microwave investigations [8–10] have been carried
out where the spectra have been assigned for the axial
conformer, i.e., F, CN, and Cl; for these monosubstituted
cyclobutanes. However, for the fluoride only one energy
level for the ring-puckering mode was proposed in the axial
well but for the cyanide and chloride a second energy level
was proposed based on the observation of rotational tran-
sitions from an excited state. Therefore, it should be
possible to observe the ring-puckering mode for the axial
conformer of chlorocyclobutane, and we initiated a vibra-
tional investigation in search of it.
Although there have been extensive microwave studies
of several monosubstituted cyclobutanes only the parame-
ters for chlorocyclobutane were initially proposed [2] from
one isotopomer with 13C rotational constants, 6 isotopo-
mers with various deuterium substitutions and the normal
species with 35Cl and 37Cl. The parameters from this study
were used to predict the rotational constants for the cor-
responding alcohol [11]. Electron diffraction studies [12]
have been used to obtain average values for the C–C and
C–Cl distances for both conformers of chlorocyclobutane
but small differences in bond length between the con-
formers could not be determined but the two different
puckering angles were reported. Therefore, of major
interest is the difference of the structural parameters
between the two conformers which should be obtainable
from the previously reported six rotational constants for
each conformer [10].
Finally we were interested in the enthalpy difference
between the two conformers in the gas for comparison to
the value reported for the liquid which could be signifi-
cantly affected by the condensed state. Also, the earlier
reported value from the temperature dependent Raman
spectrum of the gas was determined from a single pair of
bands. Ab initio predicted energy differences between the
two conformers are much larger than the experimentally
reported enthalpy difference. With these goals we initiated
the vibrational and theoretical study of chlorocyclobutane,
and the results of these investigations are reported therein.
Experimental
The sample of chlorocyclobutane was purchased from
Aldrich Chemical Co., with stated purity of 97%. The
sample was further purified by low-temperature, low-
pressure fractionation column and the purity of the sample
was verified by comparing the infrared spectrum with that
previously reported [3].
The mid-infrared spectra of the gas and solid were
obtained from 4,000 to 220 cm-1 on a Perkin-Elmer model
2000 Fourier transform spectrometer equipped with a Ge/
CsI beamsplitter and a DTGS detector. Atmospheric water
vapor was removed from the spectrometer housing by
purging with dry nitrogen. The theoretical resolution used
to obtain the spectrum of the gas was 0.5 and 2.0 cm-1 for
the spectra of the solid. One hundred twenty eight inter-
ferograms were added and transformed with a boxcar
truncation function. The frequencies for the predicted and
observed fundamentals are listed in Tables 1 and 2.
The mid-infrared spectra (4,000–400 cm-1) of the
sample dissolved in liquefied xenon (Fig. 1a) at ten dif-
ferent temperatures (-55 to -100 �C) were recorded on a
Bruker model IFS-66 Fourier transform spectrometer
equipped with a globar source, a Ge/KBr beamsplitter,
and a DTGS detector. In all cases, 100 interferograms
were collected at 1.0 cm-1 resolution, averaged and
transformed with a boxcar truncation function. For these
studies, a specially designed cryostat cell was used. It
consists of a copper cell with a path length of 4 cm with
wedged silicon windows sealed to the cell with indium
gaskets. The copper cell was enclosed in an evacuated
chamber fitted with KBr windows. The temperature was
maintained with boiling liquid nitrogen and monitored by
two Pt thermo resistors. A very small sample was intro-
duced into the cell after cooling to the designated
temperature. The system was then pressurized with the
noble gases, which condensed in the cell, allowing the
compound to dissolve.
The Raman spectra (Fig. 2) were recorded on a Spex
model 1403 spectrophotometer equipped with a Spectra-
Physics model 2017 argon ion laser operating on the
514.5 nm line. The laser power used was 1.5 W with a
spectral bandpass of 3 cm-1. The spectrum of the liquid
was recorded with the sample sealed in a Pyrex glass
capillary. The measurements of the Raman frequencies are
expected to be accurate to ±2 cm-1. All the observed
bands in the spectrum of the liquid with their proposed
assignments are listed in Tables 1 and 2.
Ab initio calculations
The LCAO-MO-SCF restricted Hartree–Fock calculations
were performed with the Gaussian-03 program [13] using
Gaussian-type basis functions. The energy minima with
respect to nuclear coordinates were obtained by the
simultaneous relaxation of all geometric parameters using
the gradient method of Pulay [14]. A variety of basis sets as
well as the corresponding ones with diffuse functions were
employed with the Møller-Plesset perturbation method [15]
to the second order MP2(full) as well as with the density
functional theory by the B3LYP method. The predicted
conformational energy differences are listed in Table 3.
936 Struct Chem (2008) 19:935–948
123

Ta
ble
1O
bse
rved
aan
dca
lcu
late
db
freq
uen
cies
for
the
equ
ato
ria
lco
nfo
rmer
of
chlo
rocy
clo
bu
tan
e
Fu
nd
amen
tal
Ab
init
ioF
ixed
scal
edc
IRin
t.R
aman
act.
dp
rati
oG
asX
eL
iqu
idS
oli
dP
.E.D
.dB
and
con
tou
r
AB
C
A0
m 1b-
CH
2as
ym
met
ric
stre
tch
3,2
15
3,0
16
33
.84
4.0
0.6
53
,004
3,0
04
3,0
04
f2
,98
76
4S
1,
32
S2
1–
99
m 2c-
CH
2as
ym
met
ric
stre
tch
3,1
98
3,0
00
4.8
79
.00
.45
2,9
97
2,9
95
2,9
88
f2
,92
86
6S
2,
28
S1
92
–8
m 3C
Hsy
mm
etri
cst
retc
h3,1
69
2,9
73
4.7
73.0
0.4
62,9
88
2,9
87
2,9
65
f2
,91
99
2S
36
–9
4
m 4b-
CH
2sy
mm
etri
cst
retc
h3
,140
2,9
46
12
.62
07
.00
.04
2,9
63
2,9
63
2,9
42
f2
,98
36
3S
4,
34
S4
99
–1
m 5c-
CH
2sy
mm
etri
cst
retc
h3
,138
2,9
44
13
.16
1.0
0.7
52
,957
2,9
54
2,9
36
f2
,94
96
4S
5,
36
S6
94
–6
m 6b-
CH
2d
efo
rmat
ion
1,5
76
1,4
95
2.0
7.0
0.6
51
,478
1,4
76
1,4
69
1,4
70
61
S6,
36
S7
45
–5
5
m 7c-
CH
2d
efo
rmat
ion
1,5
51
1,4
72
5.2
18
.00
.75
1,4
47
1,4
45
1,4
46
1,4
44
63
S7,
37
S6
12
–8
8
m 8b-
CH
2w
ag1
,380
1,3
09
48
.51
0.0
0.7
51
,287
1,2
82
1,2
80
1,2
86
73
S8,
16
S9
96
–4
m 9C
Hin
-pla
ne
ben
d1
,313
1,2
46
3.3
2.0
0.5
51
,239
1,2
37
1,2
36
1,2
37
64
S9,
12
S8
37
–6
3
m 10
b-C
H2
twis
t1
,273
1,2
08
1.7
9.0
0.7
41
,206
1,2
02
1,2
01
e1
,20
77
1S
10,
14
S15
56
–4
4
m 11
b-C
H2
rock
1,1
72
1,1
12
0.2
3.0
0.1
71
,106
1,1
02
1,1
02
1,1
02
41
S11,
13
S12,
12
S15,
11
S18
6–
94
m 12
Rin
gb
reat
hin
g1
,086
1,0
30
17
.91
1.0
0.2
01
,024
1,0
20
1,0
19
1,0
20
37
S12,
33
S13,1
0S
11
10
0–
–
m 13
c-C
H2
rock
96
19
12
0.8
3.0
0.3
39
22
91
89
13
91
04
1S
13,
18
S12,
14
S9,1
3S
15
49
–5
1
m 14
Rin
gd
efo
rmat
ion
90
18
55
44
.18
.00
.15
85
18
41
83
18
32
39
S14,
22
S16,
14
S15
99
–1
m 15
Rin
gd
efo
rmat
ion
75
67
17
8.8
4.0
0.2
97
18
71
67
18
71
53
9S
15,
15
S16,
10
S10,
10
S14,
10
S12
72
–2
8
m 16
CC
lst
retc
h553
524
2.5
5.0
0.3
7531
530
528
526
28S
16,
41
S14,
17
S11
98
–2
m 17
CC
lin
-pla
ne
ben
d3
94
37
44
.54
.00
.37
37
1–
36
6f
36
84
4S
17,
25
S16,
18
S18
99
–1
m 18
Rin
gp
uck
erin
g1
90
18
00
.81
.00
.33
15
7f
–1
65
f–
63
S18,
32
S17
37
–6
3
A00
m 19
b-C
H2
asy
mm
etri
cst
retc
h3
,206
3,0
07
16
.85
4.0
0.7
53
,002
2,9
86
–2
,99
79
9S
19
–1
00
–
m 20
b-C
H2
sym
met
ric
stre
tch
3,1
37
2,9
43
30
.01
.00
.75
2,9
69
2,9
67
–2
,95
39
9S
20
–1
00
–
m 21
b-C
H2
def
orm
atio
n1
,541
1,4
62
2.4
7.0
0.7
51
,437
1,4
35
1,4
31
1,4
33
99
S21
–1
00
–
m 22
c-C
H2
wag
1,3
37
1,2
68
1.2
6.0
0.7
51
,256
1,2
58
1,2
59
1,2
60
50
S22,
27
S23
–1
00
–
m 23
b-C
H2
wag
1,2
94
1,2
27
0.5
0.0
0.7
51
,227
1,2
26
–1
,22
23
5S
23,
24
S27,
19
S22,
14
S25
–1
00
–
m 24
CH
ou
t-o
f-p
lan
eb
end
1,2
86
1,2
20
0.0
3.0
0.7
51
,221
1,2
18
1,2
18
1,2
20
49
S24,
22
S25,
16
S23
–1
00
–
m 25
c-C
H2
twis
t1
,227
1,1
64
1.2
10
.00
.75
1,1
65
1,1
63
1,1
65
1,1
66
30
S25,
38
S24,
12
S28
–1
00
–
m 26
b-C
H2
twis
t1
,090
1,0
34
0.9
1.0
0.7
51
,032
1,0
31
1,0
33
1,0
33
60
S26,
28
S27
–1
00
–
m 27
Rin
gd
efo
rmat
ion
98
59
35
2.4
0.0
0.7
59
40
93
8–
94
23
5S
27,
20
S22,
20
S26,
17
S25
–1
00
–
m 28
Rin
gd
efo
rmat
ion
96
09
10
0.6
11
.00
.75
90
69
04
90
39
05
79
S28
–1
00
–
m 29
b-C
H2
rock
82
27
80
1.3
1.0
0.7
57
78
77
97
81
77
87
8S
29,
13
S25
–1
00
–
m 30
CC
lo
ut-
of-
pla
ne
ben
d2
94
29
40
.82
.00
.75
28
6–
28
7f
29
38
9S
30
–1
00
–
aO
bse
rved
spec
tra:
gas
,X
e,an
dso
lid
are
IRw
hil
eli
qu
idis
Ram
anb
MP
2(f
ull
)/6-3
1G
(d)
abin
itio
calc
ula
tio
ns,
scal
edfr
equen
cies
,in
frar
edin
ten
siti
es(k
m/m
ol)
,R
aman
acti
vit
ies
(A4/u
),d
epo
lari
zati
on
rati
os
(dp
)an
dp
ote
nti
alen
erg
yd
istr
ibu
tio
ns
(P.E
.Ds)
cS
cale
dfr
equen
cies
wit
hsc
alin
gfa
cto
rso
f0
.88
for
CH
stre
tch
,an
d0
.90
for
all
oth
erm
od
esd
Sy
mm
etry
coo
rdin
ates
wit
hP
.E.D
.co
ntr
ibuti
on
less
than
10
%ar
eo
mit
ted
eB
and
isco
mp
ose
do
fb
oth
con
form
ers
fV
alu
eta
ken
fro
m[2
6]
Struct Chem (2008) 19:935–948 937
123

Ta
ble
2O
bse
rved
aan
dca
lcu
late
db
freq
uen
cies
for
the
axi
al
con
form
ero
fch
loro
cycl
ob
uta
ne
Fu
nd
amen
tal
Ab
init
ioF
ixed
scal
edc
IRin
t.R
aman
act.
dp
rati
oG
asX
eL
iqu
idP
.E.D
.dB
and
con
tou
r
AB
C
A0
m 1c-
CH
2as
ym
met
ric
stre
tch
3,2
13
3,0
14
28
.14
9.0
0.7
56
9S
1,
30
S2
74
–2
6
m 2b-
CH
2as
ym
met
ric
stre
tch
3,1
97
2,9
99
5.2
74
.00
.67
63
S2,
30
S1
5–
95
m 3C
Hsy
mm
etri
cst
retc
h3,1
84
2,9
87
17.1
103.0
0.1
696S
32
–9
8
m 4c-
CH
2sy
mm
etri
cst
retc
h3
,144
2,9
49
23
.29
5.0
0.1
29
9S
45
3–
47
m 5b
CH
2sy
mm
etri
cst
retc
h3
,129
2,9
35
8.8
15
8.0
0.1
79
2S
53
0–
70
m 6c
CH
2d
efo
rmat
ion
1,5
69
1,4
88
1.5
6.0
0.5
76
0S
6,
38
S7
86
–1
4
m 7b-
CH
2d
efo
rmat
ion
1,5
44
1,4
64
4.1
18
.00
.74
1,4
59
1,4
57
1,4
58
60
S7,
39
S6
16
–8
4
m 8b-
CH
2w
ag1
,357
1,2
87
31
.52
.00
.71
1,2
72
1,2
68
77
S8,
17
S10
85
–1
5
m 9C
Hin
-pla
ne
ben
d1
,334
1,2
65
6.9
1.0
0.6
61
,26
78
0S
9,
10
S12
76
–2
4
m 10
b-C
H2
twis
t1
,265
1,2
00
0.3
15
.00
.74
1,2
01
e5
9S
10,
17
S15,
11
S8
40
–6
0
m 11
b-C
H2
rock
1,1
38
1,0
80
5.1
5.0
0.2
21
,08
11
,07
91
,080
43
S11,
13
S15,1
0S
10,1
0S
8,1
0S
18
76
–2
4
m 12
Rin
gb
reat
hin
g1
,077
1,0
21
6.8
16
.00
.18
1,0
13
1,0
13
1,0
12
50
S12,
39
S13
93
–7
m 13
c-C
H2
rock
96
29
12
2.0
1.0
0.1
59
09
44
S13,
28
S12,
16
S9
11
–8
9
m 14
Rin
gd
efo
rmat
ion
90
98
63
2.4
3.0
0.4
75
2S
14,
23
S15,
13
S11
10
0–
0
m 15
Rin
gd
efo
rmat
ion
71
66
79
22
.27
.00
.38
67
86
79
*6
80
25
S15,
32
S16,
25
S14,
83
–1
7
m 16
CC
lst
retc
h669
635
5.9
6.0
0.2
4631
628
621
46S
16,
21
S11,
16
S14,
11
S15
98
–2
m 17
CC
lin
-pla
ne
ben
d3
66
34
71
.02
.00
.25
35
43
53
f3
54
f4
8S
17,
21
S18,
12
S16,
10
S11
92
–8
m 18
Rin
gp
uck
erin
g1
65
15
60
.50
.00
.63
12
8f
12
8f
65
S18,
31
S17
55
–4
5
A00
m 19
b-C
H2
asy
mm
etri
cst
retc
h3
,203
3,0
05
9.6
60
.00
.75
94
S19
–1
00
–
m 20
b-C
H2
sym
met
ric
stre
tch
3,1
26
2,9
32
24
.78
.00
.75
2,9
36
94
S20
–1
00
–
m 21
b-C
H2
def
orm
atio
n1
,530
1,4
51
4.5
9.0
0.7
51
,46
51
,46
51
,462
98
S21
–1
00
–
m 22
b-C
H2
wag
1,3
29
1,2
60
1.8
0.0
0.7
56
0S
22,
19
S25
–1
00
–
m 23
c-C
H2
twis
t1
,295
1,2
29
0.0
6.0
0.7
53
9S
23,
37
S24
–1
00
–
m 24
CH
ou
t-of-
pla
ne
ben
d1
,292
1,2
26
0.2
3.0
0.7
53
7S
24,
36
S25,
18
S22
–1
00
–
m 25
c-C
H2
wag
1,2
10
1,1
48
0.8
6.0
0.7
51
8S
25,
24
S23,
15
S24,1
4S
26,1
1S
22
–1
00
–
m 26
Rin
gd
efo
rmat
ion
1,1
04
1,0
48
0.3
5.0
0.7
55
8S
26,
13
S29,
11
S23,
11
S28
–1
00
–
m 27
Rin
gd
efo
rmat
ion
98
79
36
0.1
4.0
0.7
59
38
41
S27,
29
S28,
10
S24
–1
00
–
m 28
b-C
H2
twis
t9
61
91
14
.81
3.0
0.7
59
21
20
S28,
36
S27,
10
S25,1
0S
26,
11
S29,1
0S
22
–1
00
–
m 29
b-C
H2
rock
78
67
46
0.1
5.0
0.7
56
4S
29,
14
S28,
11
S23
–1
00
–
m 30
CC
lo
ut-
of-
pla
ne
ben
d3
30
33
00
.50
.00
.75
92
S30
–1
00
–
aO
bse
rved
spec
tra:
gas
,X
e,an
dso
lid
are
IRw
hil
eli
qu
idis
Ram
anb
MP
2(f
ull
)/6
.31
G(d
)ab
init
ioca
lcu
lati
on
s,sc
aled
freq
uen
cies
,in
frar
edin
ten
siti
es(k
m/m
ol)
,R
aman
acti
vit
ies
(A4/u
),d
epo
lari
zati
on
rati
os
(dp
)an
dp
ote
nti
alen
erg
yd
istr
ibu
tio
ns
(P.E
.Ds)
cS
cale
dfr
equen
cies
wit
hsc
alin
gfa
ctors
of
0.8
8fo
rC
Hst
retc
h,
and
0.9
0fo
ral
loth
erm
odes
dS
ym
met
ryco
ord
inat
esw
ith
P.E
.D.
con
trib
uti
on
less
than
10
%ar
eo
mit
ted
eB
and
isco
mp
ose
do
fb
oth
con
form
ers
fF
req
uen
cies
are
tak
enfr
om
[26]
938 Struct Chem (2008) 19:935–948
123

In order to obtain a complete description of the molec-
ular motions involved in the fundamental modes of
chlorocyclobutane, a normal coordinate analysis has been
carried out. The force field in Cartesian coordinates was
obtained with the Gaussian 03 program at the MP2(full)
level with the 6-31G(d) basis set. The internal coordinates
used to calculate the G and B matrices are given in Table 4
with the atomic numbering shown in Fig. 3. By using the B
matrix [16] the force field in Cartesian coordinates was
converted to a force field in internal coordinates. Subse-
quently, scaling factors of 0.88 for CH and 0.90 for all
other coordinates were used, along with the geometric
average of scaling factors for interaction force constants, to
obtain the fixed scaled force field and resultant wave-
numbers. A set of symmetry coordinates was used
(Table 5) to determine the corresponding potential energy
distributions (P.E.Ds). A comparison between the observed
and calculated wavenumbers, along with the calculated
infrared intensities, Raman activities, depolarization ratios
and potential energy distributions for the Eq and Ax con-
formers, which are given in Tables 1 and 2, respectively.
The infrared spectra were predicted from the MP2(full)/
6-31G(d) calculations. The predicted scaled frequencies
Fig. 2 Comparison of experimental and calculated Raman spectra of
chlorocyclobutane: (a) observed Raman spectrum of the gas; (b)
observed Raman spectrum of the liquid; (c) simulated spectrum of the
mixture of equatorial and axial conformer at 25 �C with
DH = 361 cm-1; (d) simulated Raman spectrum of axial (Cs); (e)
simulated Raman spectrum of equatorial (Cs); (f) annealed solid
Fig. 1 Comparison of experimental and calculated infrared spectra of
chlorocyclobutane: (a) infrared spectrum of the Xe solution at
-70 �C; (b) simulated infrared spectrum of mixture of equatorial and
axial at -70 �C with DH = 361 cm-1; (c) simulated spectrum of
axial (Cs); (d) simulated spectrum of equatorial (Cs); (e) annealed
spectrum of solid
Struct Chem (2008) 19:935–948 939
123
were used together with a Lorentzian function to obtain the
calculated spectra. Infrared intensities determined from
MP2(full)/6-31G(d) calculations were obtained based on
the dipole moment derivatives with respect to Cartesian
coordinates. The derivatives were transformed with respect
to normal coordinates by ðolu=oQiÞ ¼P
j
ðolu=oXjÞLij;
where Qi is the ith normal coordinate, Xj is the jth Cartesian
displacement coordinate, and Lij is the transformation
matrix between the Cartesian displacement coordinates
and the normal coordinates. The infrared intensities
were then calculated by [(Np)/(3c2)] [(qlx/qQi)2 ? (qly/
qQi)2 ? (qlz/qQi)
2]. In Fig. 1, a comparison of the exper-
imental and simulated infrared spectra of chlorocyclobutane
is shown. Infrared spectrum of the of chlorocyclobutane in
Xe at -70 �C (Fig. 1a), and the predicted infrared spectra
for the pure equatorial (Fig. 1d) and axial (Fig. 1c) con-
formers, as well as the mixture (Fig. 1b) of the two
conformers with relative concentrations calculated for the
equilibrium mixture at -70 �C by using the experimentally
determined enthalpy difference are presented. The spectrum
of the mixture should be compared to that of the xenon
solution. The predicted spectrum is in relatively good
agreement with the experimental spectrum which indicates
the utility of the scaled predicted frequencies and intensities
for supporting the vibrational assignment.
Also, to further support the vibrational assignments, we
have simulated the Raman spectra from the ab initio
MP2(full)/6-31G(d) results. The evaluation of Raman
activity by using the analytical gradient methods has been
developed [17–20]. The activity Sj can be expressed as:
Sj = gj (45a2j ? 7bj
2), where gj is the degeneracy of the
vibrational mode j, aj is the derivative of the isotropic
polarizability, and bj is that of the anisotropic polarizabil-
ity. To obtain the polarized Raman scattering cross
sections, the polarizabilities are incorporated into Sj by
multiplying Sj with (1 - qj)/(1 ? qj), where qj is the
depolarization ratio of the jth normal mode. The Raman
scattering cross sections and calculated wavenumbers
obtained from the Gaussian 03 program were used together
with a Lorentzian function to obtain the simulated Raman
spectra. Comparison of experimental Raman spectra of the
gas (Fig. 2a), liquid (Fig. 2b), solid (Fig. 2f) and the pre-
dicted Raman spectra for the pure equatorial (Fig. 2e) and
axial (Fig. 2d) conformers as well as the mixture (Fig. 2c)
of the two conformers with relative concentrations calcu-
lated for the equilibrium mixture at 25 �C by using the
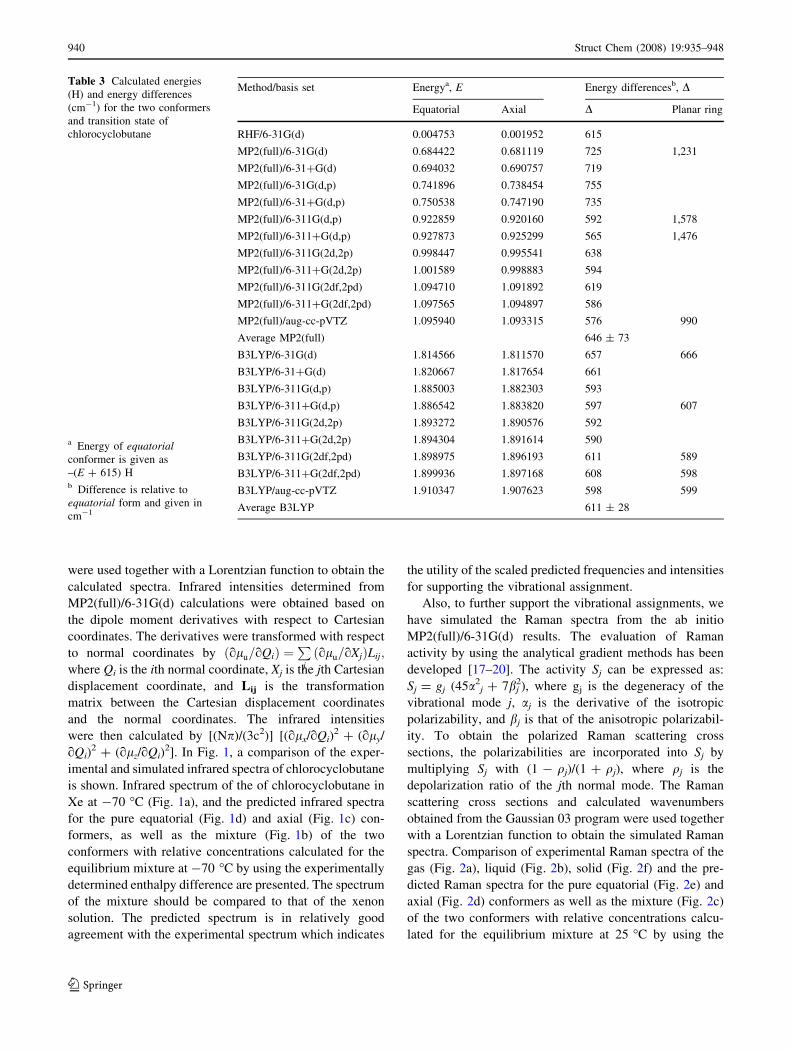
Table 3 Calculated energies
(H) and energy differences
(cm-1) for the two conformers
and transition state of
chlorocyclobutane
a Energy of equatorialconformer is given as
–(E ? 615) Hb Difference is relative to
equatorial form and given in
cm-1
Method/basis set Energya, E Energy differencesb, D
Equatorial Axial D Planar ring
RHF/6-31G(d) 0.004753 0.001952 615
MP2(full)/6-31G(d) 0.684422 0.681119 725 1,231
MP2(full)/6-31?G(d) 0.694032 0.690757 719
MP2(full)/6-31G(d,p) 0.741896 0.738454 755
MP2(full)/6-31?G(d,p) 0.750538 0.747190 735
MP2(full)/6-311G(d,p) 0.922859 0.920160 592 1,578
MP2(full)/6-311?G(d,p) 0.927873 0.925299 565 1,476
MP2(full)/6-311G(2d,2p) 0.998447 0.995541 638
MP2(full)/6-311?G(2d,2p) 1.001589 0.998883 594
MP2(full)/6-311G(2df,2pd) 1.094710 1.091892 619
MP2(full)/6-311?G(2df,2pd) 1.097565 1.094897 586
MP2(full)/aug-cc-pVTZ 1.095940 1.093315 576 990
Average MP2(full) 646 ± 73
B3LYP/6-31G(d) 1.814566 1.811570 657 666
B3LYP/6-31?G(d) 1.820667 1.817654 661
B3LYP/6-311G(d,p) 1.885003 1.882303 593
B3LYP/6-311?G(d,p) 1.886542 1.883820 597 607
B3LYP/6-311G(2d,2p) 1.893272 1.890576 592
B3LYP/6-311?G(2d,2p) 1.894304 1.891614 590
B3LYP/6-311G(2df,2pd) 1.898975 1.896193 611 589
B3LYP/6-311?G(2df,2pd) 1.899936 1.897168 608 598
B3LYP/aug-cc-pVTZ 1.910347 1.907623 598 599
Average B3LYP 611 ± 28
940 Struct Chem (2008) 19:935–948
123

experimentally determined enthalpy difference are shown.
The predicted spectrum of the mixture should be compared
to that of the Raman spectrum of the liquid at room tem-
perature, although there may be some difference between
the predicted and that obtained experimentally due to the
hydrogen bonding in the liquid. Nevertheless, the predicted
spectrum is in good agreement with the experimental
spectrum which again indicates the utility of the scaled
predicted frequencies and intensities of the Raman spectra
for supporting the vibrational assignment.
Table 4 Structural parameters (A and degree), rotational constants (MHz), and dipole moments (Debye) for equatorial and axial
chlorocyclobutane
Structural parameters Int. Co. MP2(full)/6-311?G(d,p) EDa Microwave Adjusted r0
Eq Ax Eq Ax Eqb,c Axd Eq Ax
rC1–Cl R1 1.777 1.785 1.786(4) 1.786(4) 1.775(5) 1.785 1.783(5) 1.803(5)
rC1–C4,C5 R2 1.534 1.541 1.545(2) 1.545(2) 1.525(5) 1.539(3) 1.547(3)
rC6–C4,C5 R3 1.551 1.549 1.560(2) 1.560(2) 1.550(5) 1.558(3) 1.557(3)
rC1–H3 r5 1.092 1.090 1.098(4) 1.098(4) 1.10(1) 1.092(2) 1.090(2)
rC4–H7,C5–H9 r1 1.093 1.091 1.098 (4) 1.098(4) 1.085(1) 1.093(2) 1.091(2)
rC4–H8,C5–H10 r2 1.092 1.095 1.098(4) 1.098(4) 1.085(1) 1.092(2) 1.095(2)
rC6–H11 r3 1.091 1.091 1.098(4) 1.098(4) 1.10(1) 1.091(2) 1.091(2)
rC6–H12 r4 1.093 1.091 1.098(4) 1.098(4) 1.10(1) 1.093(2) 1.091(2)
\Cl2C1C4 /1 118.7 111.4 118.6 111.4 117* 118.1(5) 110.6(5)
\C4C1C5 h2 89.02 88.27 88.9 89.4 90.8(5) 88.62 89.7(5) 88.9(5)
\C6C4C1 h3 86.55 88.02 86.5* 86.9(5) 89.3(5)
\C4C6C5 h4 87.84 87.72 86.8* 88.3(5) 88.1(5)
\H3C1C4 r1 111.3 119.1 106* 111.6(5) 119.5(5)
\H3C1Cl2 r2 107.1 106.9 106.6 106.6 114(2) 107.1(5) 106.9(5)
\H7C4C1 k1 110.1 117.4 114(1) 110.1(5) 117.4(5)
\H7C4C6 k2 110.4 119.1 115* 107.7(5) 122.4(5)
\H8C4C1 k3 118.1 109.6 115(1) 118.1(5) 109.6(5)
\H8C4C6 k4 119.5 111.1 118* 121.7(5) 106.3(5)
\H7C4H8 k5 110.1 109.8 109.8 109.8 112(1) 110.1(5) 109.8(5)
\H11C6C4 p1 117.6 111.1 119* 118.4(5) 108.4(5)
\H12C6C4 p2 111.4 117.9 113* 110.2(5) 120.2(5)
\H11C6H12 p3 109.6 109.6 109.8 109.8 110(1) 109.6(5) 109.6(5)
Puckering anglee 33.9 30.5 30 21 20(1) 28.2 30.7(5) 22.3(5)
A(MHz) 10273.6 7951.6 10095.0 8043(1) 10094.7 8044.9
B(MHz) 2521.2 2931.9 2520.9 2859.0 2521.6 2858.7
C(MHz) 2199.7 2701.2 2196.3 2610.5 2195.9 2611.1
|la| 2.457 2.204 2.11(6) 1.97
|lb| 0.000 0.000 0.00 0.00
|lc| 0.451 0.897 0.57(7) 0.98
|lt| 2.498 2.380 2.20(7) 2.20
a Reference [12]b Structural parameters were taken from [2], while the rotational constants and dipole moments were taken from reference [10]c Parameters indicated with an asterisk are dependent parameters where the values with listed uncertainties are independent parametersd Adjusted parameters using the microwave data from [10] for the given ground statese Puckering angle is defined as the angle between the planes CbCcCb0 and CbCaCb0
Fig. 3 Chlorocyclobutane showing atomic numbering
Struct Chem (2008) 19:935–948 941
123

Structural parameters
We have [21] shown that ab initio MP2(full)/6-
311?G(d,p) calculations predict the r0 structural param-
eters for more than fifty carbon-hydrogen distances better
than 0.002 A compared to the experimentally determined
values from isolated CH stretching frequencies which are
compared [22] to previously determined values from
earlier microwave studies. Thus, all the carbon-hydrogen
parameters can be taken from the MP2(full)/6-311?
G(d,p) predicted values for chlorocyclobutane. Also, we
have found [23] that we can obtain good structural
parameters by adjusting the structural parameters from the
ab initio calculations to fit the rotational constants
obtained from the microwave experimental data. In order
to reduce the number of independent variables, the
structural parameters are separated into sets according to
their types. Bond lengths in the same set keep their rel-
ative ratio which results in only two heavy atoms
distances for chlorocyclobutane. Also, the bond angles
and torsional angles in the same set keep their differences
in degrees. This assumption is based on the fact that the
errors from ab initio calculations are systematic. There-
fore, it should be possible to obtain ‘‘adjusted r0’’
structural parameters for the equatorial and axial con-
former of chlorocyclobutane by utilizing the previously
reported [2, 10] microwave rotational constants.
Two microwave studies have been conducted on the
chlorocyclobutane molecule and in the first investigation
[2] only the equatorial conformer for the normal species
and eight of its isotopomers was assigned. Initially, we [24]
made an attempt to determine the r0 structural parameters
using the rotational constants from this earlier [2] study.
However, we could not achieve a satisfactory fit of the
rotational constants which prompted us to refer to the more
recent microwave study of chlorocyclobutane where the A
rotation constants were much more accurately determined
to obtain the r0 structural parameters.
Table 5 Symmetry
coordinatesa for
chlorocyclobutane
a Not normalized
Species Description Symmetry coordinatea
A0 b-CH2 symmetric stretch S1 = r2 - r1 ? r4 - r3
b-CH2 asymmetric stretch S2 = r1 ? r2 ? r3 ? r4
c-CH2 asymmetric stretch S3 = r5 - r6
c-CH2 symmetric stretch S4 = r5 ? r6
CH symmetric stretch S5 = r7
c-CH2 deformation S6 = 4m6 - m2 - m3 - m4 - m5
b-CH2 deformation S7 = 4a4 ? 4b4 - a2 - a3 - a5 - a6 - b2 - b3 - b5 - b6
c-CH2 rock S8 = m3 - m2 ? m5 - m4
CH in-plane bend S9 = 2h2 - d1 - d2
b-CH2 wag S10 = a2 ? a3 - a5 - a6 ? b2 ? b3 - b5 - b6
b-CH2 rock S11 = a2 - a3 ? a5 - a6 ? b2 - b3 ? b5 - b6
Ring breathing S12 = R3 ? R4
b-CH2 twist S13 = a2 - a3 - a5 ? a6 ? b2 - b3 - b5 ? b6
Ring deformation S14 = a1 ? b1 - m1 - h1
Ring deformation S15 = R1 ? R2
CCl stretch S16 = R5
CCl in-plane-bend S17 = u1 ? u2
Ring puckering S18 = a1 ? b1 ? m1 ? h1
A00 b-CH2 asymmetric stretch S19 = r2 - r1 ? r3 - r4
b-CH2 symmetric stretch S20 = r1 ? r2 - r3 - r4
b-CH2 deformation S21 = 4a4 - a2 - a3 - a5 - a6 - 4b4 ? b2 ? b3 ? b5 ? b6
b-CH2 rock S22 = a3 - a2 - a5 ? a6 ? b2 - b3 ? b5 - b6
CH out-of-plane bend S23 = d1 - d2
c-CH2 twist S24 = m2 - m3 - m4 ? m5
c-CH2 wag S25 = m4 ? m5 - m2 - m3
Ring deformation S26 = R3 - R4
b-CH2 wag S27 = a5 ? a6 - a2 - a3 ? b2 ? b3 - b5 - b6
b-CH2 twist S28 = a3 - a2 ? a5 - a6 ? b2 - b3 - b5 ? b6
Ring deformation S29 = R1 - R2
CCl out-of-plane bend S30 = u1 - u2
942 Struct Chem (2008) 19:935–948
123

In the second study [10], the authors reinvestigated and
reassigned the microwave spectrum of the equatorial con-
former of the normal species and 37Cl isotopomer of
chlorocyclobutane. In the same investigation the authors
were also successful in assigning the spectrum for the axial
conformer of the chlorocyclobutane also for the normal
species and 37Cl isotopomer and some of the excited states
for both the conformers. We utilized these data containing
six rotational constants corresponding to each of the con-
formers to determine the r0 structural parameters. The fit of
these rotational constants is shown in Table 6 where six of
the rotational constants are fit to better than one MHz for
the equatorial conformer. An equivalent fit was obtained
for the axial conformer except for the A rotational constant
of the normal species. The resulting adjusted r0 parameters
obtained for both the conformers are listed in Table 4,
where the C1–C4(C5) and C6–C4(C5) distances should be
accurate to ±0.003 A, the C–H distances should be accu-
rate to ±0.002 A and the angles to within ±0.5�.
The ab initio predicted structural parameters for the
equatorial and the axial conformers are quite distinct. For
example, the C–Cl bond distance for the equatorial form is
0.008 A shorter than the corresponding distance in the
axial form. In addition the Ca–Cb bond distance is pre-
dicted to be 0.007 A shorter than the corresponding
distance in the axial form which is probably due to the
positioning of the Cl atom with respect to the ring. Another
difference is the Ca–H3 bond distance which is as expected
predicted to be longer in the equatorial conformer by
0.002 A again due to the position of the Cl atom with
respect to the ring. Other perceptible differences are the
Cb–H distances where for the hydrogen atoms which are
positioned on top of the ring with chlorine atom, the Cb–H
distances in equatorial form is predicted to be 0.002 A
longer than the axial form. For the Cb–H distance for the
hydrogens which are placed below the ring, the distances
for the equatorial form is predicted to be 0.003 A shorter.
The Cc–H distance for the hydrogens positioned on top of
the ring are equal for both the conformers, whereas for the
other hydrogen atom the distance is 0.002 A longer for the
equatorial form compared to the axial. Further, we observe
that the difference in the ab initio predicted puckering
angles between the two conformers is relatively small. The
ab initio predicted difference is approximately 3.1�, com-
pared to 9 and 8.2�, as obtained from ED and MW,
respectively. The ab initio predicted ClCaCb angles for the
equatorial and axial forms differs considerably at 118.7�and 111.4�, respectively, which agrees with the electron
diffraction value and is only slightly smaller than the dif-
ference obtain in this study.
Vibrational assignment
There have been three extensive vibrational assignments
[3, 25, 26] for chlorocyclobutane where in the earlier one
the a-C-d and b-C2-d4 isotopomers were used to assign
many of the molecular motions. In the most recent study
[26] ab initio calculations with the 3-21G(d) basis set with
two scaling factors of 0.9 for stretches and 0.8 for the bends
were used to predict frequencies for the fundamentals and
potential energy distributions. These new data resulted in
some significant changes in a few of the descriptions of the
motions contributing to some of the bands. In particular the
two ring deformations were assigned to lower frequency
bands which had been assigned as CH2 rocking modes.
There was also a few major changes in the vibrational
assignment where C–H out-of-plane bend was reassigned
as accidently degenerate with the corresponding in-plane
motion of 1,207 cm-1 rather than the *300 cm-1 differ-
ence as originally assigned. Our experimental results
support the higher assignment for these two modes with
Table 6 Comparison of
rotational constants (MHz)
obtained from ab initio
MP2(full)/6-311?G(d,p)
predictions and from microwave
spectra and the adjusted
structural parameters for
chlorocyclobutane
a Reference [10]b Difference between
microwave determined values
and adjusted r0 structural
parameters
Isotopomer Rotational
constant
MP2(full)/
6-311?G(d,p)
Experimentala Adjusted r0 |D|b
eq-C4H735Cl A 10273.6 10094.98 10094.28 0.7
B 2521.2 2520.84 2521.51 0.7
C 2199.7 2196.38 2195.86 0.5
eq-C4H737Cl A 10278.0 10090(2) 10091.80 0.0
B 2453.3 2454.78 2455.31 0.5
C 2147.6 2146.17 2145.60 0.6
ax-C4H735Cl A 7951.6 8043(1) 8044.97 1.0
B 2931.9 2859.02 2858.80 0.2
C 2701.2 2610.55 2611.16 0.6
ax-C4H737Cl A 7941.4 8037(2) 8036.28 0.0
B 2859.6 2787.54 2787.31 0.2
C 2640.7 2551.75 2552.26 0.5
Struct Chem (2008) 19:935–948 943
123

them being separated by only 18 cm-1. The predicted
infrared band contours for the gas along with the predicted
infrared intensities and Raman activities provides consid-
erably more spectral information for making the vibrational
assignment.
The earlier assignments of the two b-CH2 twists with the
A0 mode to a band about 100 cm-1 lower than the pre-
dicted value and the A00 mode to a band about the same
difference except to a higher frequency have been reas-
signed to bands nearly to the predicted values since there
are both infrared and Raman bands that are consistent with
the frequencies predicted. This reassignment required the
band at 1,039 cm-1 in the A0 symmetry block and the
1,123 cm-1 band (A00) to not be assigned as fundamentals
as initially given [3] since neither of these bands were
observed in our spectra. These bands had been later iden-
tified [25] as probably due to impurity bands and our
current assignment of the fundamentals is consistent with
those proposed by these more recent investigators.
Our major contribution for the vibrational assignments
is for the fundamentals for the axial conformer. We have
identified six more fundamentals for the axial conformer
than those assigned earlier [25, 26]. These assignments
were based on band contours, relative intensities, and the
predicted frequencies from the ab initio calculations,
P.E.Ds and the spectra in Xe solution Fig. 4.
Conformational stability
To determine the enthalpy difference between the two
conformers, the mid-infrared spectra of chlorocyclobutane
dissolved in liquefied xenon as a function of temperature
from -55 to -100 �C were recorded. Only small interac-
tions are expected to occur between the dissolved sample
and the surrounding xenon atoms, and consequently, only
small frequency shifts are anticipated when passing from
the gas phase to the liquefied noble gas solutions [27–30].
A significant advantage of this study is that the conformer
bands are better resolved in comparison with those in the
infrared spectrum of the gas. From ab initio calculations,
the dipole moments of the two conformers are predicted to
have similar values and the molecular sizes of the two
rotamers are nearly the same, so the DH value obtained
from the temperature-dependent FT-IR study is expected to
be close to that for the gas [27–31].
A careful comparison between the infrared spectrum of
the xenon solutions at the highest (-55 �C) and the lowest
temperature (-100 �C) indicated two bands that were
clearly due to the axial conformer in the solution with
corresponding bands in the gas. These two bands in the
spectra of the xenon solutions at 1,013 cm-1 [ring
breathing (m12)] (Fig. 5) and 1,268 cm-1 [CH in-plane
bend (m9)] disappear in the spectrum of the solid. Both
bands are sufficiently separated from the equatorial bands
at 938 and 1,258 cm-1 which makes them satisfactory for
DH determinations.
Five equatorial bands, all of them but one well resolved
and well separated, were used for the conformational sta-
bility determination. The intensities of the infrared bands
were measured as a function of temperature and their ratios
were determined. By application of the van’t Hoff equation
-lnK = DH/(RT) - DS/R, DH was determined from a plot
of -lnK versus 1/T, where DH/R is the slope of the line and
K is substituted with the appropriate intensity ratios, i.e.,
Fig. 4 Mid-infrared spectra of chlorocyclobutane (a) gas; (b) Xe
solution at -70 �C
Fig. 5 Infrared spectra of chlorocyclobutane in xenon solution at
different temperatures
944 Struct Chem (2008) 19:935–948
123

Iequatorial/Iaxial. It was assumed that DH is not a function of
temperature in the temperature range studied.
By combining the two axial and the five equatorial con-
former bands, six pairs of bands were utilized for the
determination of the enthalpy difference, and the resulting
values with statistical uncertainties are listed in Table 7. The
statistical average of these six values is 361 ± 17 cm-1
where the error limit is derived from the statistical standard
deviation of one sigma of the measured intensity data where
the data were taken as a single set. The van’t Hoff plot for
each sets are also shown in Fig. 6. These error limits do not
take into account small associations with the liquid xenon or
the interference of overtones and combination bands in near
coincidence with the measured fundamentals. The variations
in the individual values are undoubtedly due to these types of
interferences, but by taking several pairs the effect of such
interferences should cancel. The abundance of the less stable
axial conformer present at ambient temperature is 15 ± 1%.
Ring puckering and barrier to planarity
The fundamental ring-puckering vibration of the equatorial
conformer has been observed [26] at 157.6 cm-1 (Fig. 7a)
as a strong Q-branch as expected for a predicted band
contour of 37% A-type and 63% C-type. The correspond-
ing band is observed in the Raman spectrum of the gas at
158 cm-1 (Fig. 7b). This frequency is much lower than the
value of 190 cm-1 (180 cm-1 with scaling factor 0.9)
predicted from the MP2(full)/6-31G(d) calculations which
raises a question concerning the reasonableness of the
predicted barrier to planarity and the puckering angle.
There are clearly two ‘‘hot bands’’ at 149.3 cm-1
(Raman 150 cm-1) and 139.8 cm-1 (Raman 141 cm-1) in
the far infrared spectrum with the second one possibly split
in both the infrared and Raman spectra. The next observed
lower frequency band is a very weak Q-branch at
130.1 cm-1 with a stronger one at 128.1 cm-1 with the
corresponding Raman line very broad which indicates it is
arising from two transitions. These two infrared bands were
assigned [26] as the third overtone of the ring-puckering
mode at 130.1 cm-1 for the equatorial conformer and the
stronger one to the fundamental of this mode for the axial
conformer. With this assignment there is again a very large
difference between the predicted frequency of 164 cm-1
(156 cm-1 with scaling 0.9) but the difference is consistent
with the difference obtained for the equatorial conformer.
We then checked to see if an improvement of the predicted
frequency could be obtained with the larger basis set of 6-
311?G(d,p) with both the MP2(full) and B3LYP calcula-
tions. With the larger basis set the B3LYP calculations
predict the ring-puckering mode for the equatorial con-
former at 150 cm-1 and for the axial form 98 cm-1. These
values are not significantly lower than values of 155 cm-1
Table 7 Temperature and intensity ratios of the equatorial and axial bands of chlorocyclobutane
T (�C) 1/T(910-3 K-1)
I938/I1013 I1258/
I1268
I1237/I1268 I1226/
I1268
I1202/
I1268
I1163/
I1268
Liquid
xenon
-55.0 4.584 0.954 1.190 0.901 0.165 1.071 0.269
-60.0 4.692 1.016 1.286 0.817 0.135 0.952 0.274
-65.0 4.804 1.048 1.381 0.889 0.144 0.990 0.269
-70.0 4.923 1.000 1.500 1.014 0.154 1.048 0.322
-75.0 5.047 1.223 1.391 1.059 0.167 1.157 0.333
-80.0 5.177 1.282 1.739 1.204 0.184 1.229 0.363
-85.0 5.315 1.365 1.833 1.365 0.183 1.345 0.386
-90.0 4.460 1.437 1.960 1.457 0.218 1.437 0.426
-95.0 5.613 1.480 2.038 1.637 0.226 1.574 0.458
-100.0 5.775 1.569 2.192 1.768 0.242 1.647 0.500
DHa 343 ± 41 368 ± 63 462 ± 30 315 ± 45 324 ± 32 375 ± 32
a Average value DH = 361 ± 17 cm-1 (4.32 ± 0.20 kJ mol-1) with the equatorial conformer the more stable form and the statistical
uncertainty (1r) obtained by utilizing all of the data as a single set
Fig. 6 van’t Hoff plot of -ln(Iequatorial/Iaxial) as a function of 1/T
Struct Chem (2008) 19:935–948 945
123

for the equatorial form and 103 cm-1 for the axial con-
former with the smaller 6-31G(d) basis set by the DFT
calculations. Although these values for the ring-puckering
vibration are in better agreement with the experimental
values the barrier to planarity is clearly predicted too low
compared to the predicted energy difference between the
conformers (Table 3). By using the larger basis set with the
MP2 calculations the ring-puckering mode was predicted
slightly higher at 194 cm-1 for the equatorial conformer,
and for the axial conformer it is predicted higher at
182 cm-1. Thus, these predictions are even poorer when
compared to the experimental values.
By utilizing the four transitions for the equatorial con-
former along with the fundamental transition for the axial
form the potential function governing the ring-puckering
motion of chlorocyclobutane was obtained [26]. The bar-
rier to planarity of 827 cm-1 and an enthalpy difference of
449 cm-1 along with puckering angles of 22� and 17� for
the equatorial and axial forms, respectively, (Fig. 7c). The
uncertainties in the values for the angles are dependent on
the reduced mass assumed for the molecular vibration. This
potential has three bound energy levels for the axial form
which is one more than the proposed potential suggested
from the microwave study [10] where a barrier
*800 cm-1 has been proposed. The ab initio calculations
contribute little to providing reasonable predictions to the
barrier at the planar position between the two wells where
the value of 1,578 cm-1 is predicted from the MP2(full)/6-
311G(d,p) calculation and is lowered to 990 cm-1 with
aug-cc-pVTZ basis set which still seems too high. Of
particular note is the large energy difference between the
two conformers from the B3LYP calculations with the
planar energy of essentially the same value so no bound
energy state would be present for the second conformer.
Therefore, we concluded that the potential function previ-
ously proposed [26] seems to be most consistent with all
the known experimental data.
Discussion
The determined structural parameters obtained in this study
for the equatorial conformer are really significantly dif-
ferent for several of the distances even when the
uncertainties are taken into account. The most obvious one
is the C1–C4(C5) distance which is relatively short at
1.525(5) A compared to the value of 1.539(3) A obtained
in this study. This experimental value is in agreement with
the average value of 1.545(2) A for both conformers for the
C1–C4 distance with C6–C4 average distance of 1.560(2) A.
This latter value is in excellent agreement with the value of
1.558(3) A for the equatorial (1.557(3) A for the axial
form) conformer. Also it should be noted that the C–H
distances reported earlier from the microwave study [2]
have very large uncertainties, i.e., 1.10(1) A, for the two
C6–H distances and the C1–H distance, whereas the values
from this study are 1.093(2) A, C6–H12; 1.091(2) A, C6–
H11; and 1.092(2) A for C1–H3 for the equatorial
Fig. 7 Low frequency spectra of chlorocyclobutane: (a) far-infrared
gas; (b) Raman spectra of gas; (c) potential function for the ring
puckering motion (data taken from [26])
946 Struct Chem (2008) 19:935–948
123
conformer. From the early study the CH distances for the
C4 and C5 carbons the uncertainty is small 1.085(1) A, but
the value differs substantially from the values of 1.093(2)
and 1.092(2) A obtained from this study.
The parameter that makes the largest difference is the
puckering angle which was reported in the earlier micro-
wave study to be 20 ± 1�, but from this study we obtained
a value of 30.7 ± 0.5� for the equatorial conformer which
is essentially the same value of 30� obtained in the electron
diffraction study [12]. Our value of 22.3(5)� for this angle
for the axial form also agrees with the value of 21� from
the electron diffraction study [12]. We found the puckering
angle was very sensitive to the value of the A rotational
constants and the values of A previously reported [2] of
10086.7(5) MHz for 35Cl and 10085(5) MHz for 37Cl but
the more accurate values recently determined [10] have
values of 10094.98(1) and 10090(2) MHz for the 35Cl and37Cl isotopomers, respectively. This difference for 35Cl of
8.2 MHz for A constant which was the most accurately
determined one was surprising but undoubtedly led to the
much smaller puckering angle and the large uncertainty on
the A constants obtained for the other isotopomer (various
deuterated species) makes it very difficult to use for r0
structural parameters [24].
In support of the determined parameters for chlorocyc-
lobutane a comparison with the heavy atom parameters of
cyclobutane which were obtained from a microwave study
[32] with the determined distances of: CC = 1.5555(2),
and CH = 1.0910(6), with equal parameters for the axial
and equatorial conformers and ring-puckering angle of
28.58(9)�. The comparison indicates a reasonable reduction
of the CC distance where the chlorine atom is attached with
a slight elongation of the other CC distance with consistent
CH distances and puckering angle. Therefore, it is believed
that the determined parameters reported herein for chlo-
rocyclobutane are as accurate as can be obtained for the
gas.
The ab initio MP2(full)/6-31G(d) predicted frequencies
with only two scaling factors of 0.88 and 0.9 provided
values for the A0 fundamentals within an average differ-
ence of 10 cm-1, which is an average error of 0.6% and for
the A00 an average difference of 7.6 cm-1, which is a
percentage error of 0.7%. Only a very few scaling factors
are needed to provide frequencies which are sufficient to
support the vibrational assignment rather than several
scaling factors to predict the observed frequencies. At one
time this was important so the force constants could be
transferred but now it is possible to calculate the force
constants for practically any bond of interest.
The P.E.D. distributions for the equatorial conformer
indicate extensive mixing of the ring modes with the CCl
motions for both the A0 and A00 species. For example m16 is
assigned as the CCl stretch with only 28% S16 and 41%S14
but m14 has 39% S14 and 22% S16. Thus, there is significant
contribution from the CCl stretch to m14, m15, and m16 so the
designation of m16 as the CCl stretch is more for book-
keeping then describing the molecular motion. There are
four other vibrations where significant contributions are
indicated by four different symmetry coordinates. Never-
theless, it is believed that these approximate descriptions
are useful for comparison of similar vibrations for corre-
sponding molecular such as other mono-substituted four-
membered rings.
The determined DH value of 361 ± 17 cm-1
(4.32 ± 0.20 kJ/mol) from the xenon solution is in excel-
lent agreement with the value of 325 ± 40 cm-1
(3.89 ± 0.48 kJ/mol) previously reported [26] from the
variable temperature study of the Raman spectrum of the
gas from a single pair of bands. However, the value
obtained from the xenon solution has a significant lower
uncertainty. Previously a value of 334 cm-1 was reported
from the electron diffraction study [12] which utilized a
dynamic model which was obtained by introducing a single
Boltzmann population to determine the potential function
of the puckering motion. This value was preferred to a
static model with two conformers vibrating in separate
wells which gave a value of 500 cm-1 for the enthalpy
difference. It is clear from the determined enthalpy dif-
ference that the preferred model is consistent with the
experimentally determined enthalpy difference.
The ab initio predicted energy difference from the MP2
calculations is 646 ± 73 cm-1 (7.73 ± 0.87 kJ/mol) and
is way too large compared to all the experimental data
which include the determined DH value, the amount of the
axial conformer present at ambient temperature, the iden-
tification of the second conformer in the microwave
spectrum, and the need for a second conformer to analysis
the electron diffraction data. With the energy difference of
646 cm-1 there would be only 4% of the axial conformer
present at ambient temperature which is not consistent with
the intensities of the observed bands in the infrared or
Raman spectra. The MP2 calculations with medium size
basis sets are frequently found to predict large energy
differences for organo-chlorides, and it appears that
B3LYP calculations also give similar results.
Three of the quadratic distortion constants, DJ, DJK, and
dJ, were obtained from the most recently obtained [10]
microwave data for the equatorial 35Cl isotopomer and two
constants, DJ, and DJK, for the 37Cl isotopomer as well as
for both isotopomers for the axial conformer (Table 8). We
have obtained all five distortion constants for both isotop-
omers for both conformers from the force constants
predicted from the MP2(full)/6-31G(d) calculations and
these values are listed in Table 8 for comparison to the
experimentally determined values. For the equatorial 35Cl
isotopomer the values from the force constants agree very
Struct Chem (2008) 19:935–948 947
123
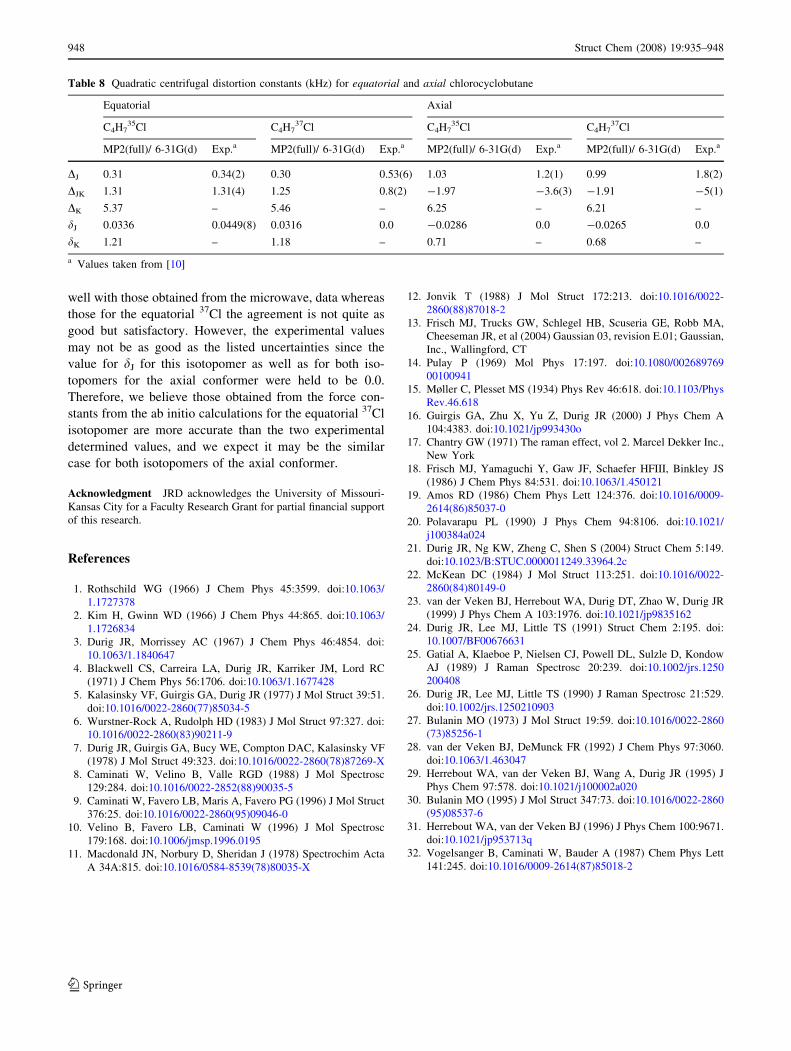
well with those obtained from the microwave, data whereas
those for the equatorial 37Cl the agreement is not quite as
good but satisfactory. However, the experimental values
may not be as good as the listed uncertainties since the
value for dJ for this isotopomer as well as for both iso-
topomers for the axial conformer were held to be 0.0.
Therefore, we believe those obtained from the force con-
stants from the ab initio calculations for the equatorial 37Cl
isotopomer are more accurate than the two experimental
determined values, and we expect it may be the similar
case for both isotopomers of the axial conformer.
Acknowledgment JRD acknowledges the University of Missouri-
Kansas City for a Faculty Research Grant for partial financial support
of this research.
References
1. Rothschild WG (1966) J Chem Phys 45:3599. doi:10.1063/
1.1727378
2. Kim H, Gwinn WD (1966) J Chem Phys 44:865. doi:10.1063/
1.1726834
3. Durig JR, Morrissey AC (1967) J Chem Phys 46:4854. doi:
10.1063/1.1840647
4. Blackwell CS, Carreira LA, Durig JR, Karriker JM, Lord RC
(1971) J Chem Phys 56:1706. doi:10.1063/1.1677428
5. Kalasinsky VF, Guirgis GA, Durig JR (1977) J Mol Struct 39:51.
doi:10.1016/0022-2860(77)85034-5
6. Wurstner-Rock A, Rudolph HD (1983) J Mol Struct 97:327. doi:
10.1016/0022-2860(83)90211-9
7. Durig JR, Guirgis GA, Bucy WE, Compton DAC, Kalasinsky VF
(1978) J Mol Struct 49:323. doi:10.1016/0022-2860(78)87269-X
8. Caminati W, Velino B, Valle RGD (1988) J Mol Spectrosc
129:284. doi:10.1016/0022-2852(88)90035-5
9. Caminati W, Favero LB, Maris A, Favero PG (1996) J Mol Struct
376:25. doi:10.1016/0022-2860(95)09046-0
10. Velino B, Favero LB, Caminati W (1996) J Mol Spectrosc
179:168. doi:10.1006/jmsp.1996.0195
11. Macdonald JN, Norbury D, Sheridan J (1978) Spectrochim Acta
A 34A:815. doi:10.1016/0584-8539(78)80035-X
12. Jonvik T (1988) J Mol Struct 172:213. doi:10.1016/0022-
2860(88)87018-2
13. Frisch MJ, Trucks GW, Schlegel HB, Scuseria GE, Robb MA,
Cheeseman JR, et al (2004) Gaussian 03, revision E.01; Gaussian,
Inc., Wallingford, CT
14. Pulay P (1969) Mol Phys 17:197. doi:10.1080/002689769
00100941
15. Møller C, Plesset MS (1934) Phys Rev 46:618. doi:10.1103/Phys
Rev.46.618
16. Guirgis GA, Zhu X, Yu Z, Durig JR (2000) J Phys Chem A
104:4383. doi:10.1021/jp993430o
17. Chantry GW (1971) The raman effect, vol 2. Marcel Dekker Inc.,
New York
18. Frisch MJ, Yamaguchi Y, Gaw JF, Schaefer HFIII, Binkley JS
(1986) J Chem Phys 84:531. doi:10.1063/1.450121
19. Amos RD (1986) Chem Phys Lett 124:376. doi:10.1016/0009-
2614(86)85037-0
20. Polavarapu PL (1990) J Phys Chem 94:8106. doi:10.1021/
j100384a024
21. Durig JR, Ng KW, Zheng C, Shen S (2004) Struct Chem 5:149.
doi:10.1023/B:STUC.0000011249.33964.2c
22. McKean DC (1984) J Mol Struct 113:251. doi:10.1016/0022-
2860(84)80149-0
23. van der Veken BJ, Herrebout WA, Durig DT, Zhao W, Durig JR
(1999) J Phys Chem A 103:1976. doi:10.1021/jp9835162
24. Durig JR, Lee MJ, Little TS (1991) Struct Chem 2:195. doi:
10.1007/BF00676631
25. Gatial A, Klaeboe P, Nielsen CJ, Powell DL, Sulzle D, Kondow
AJ (1989) J Raman Spectrosc 20:239. doi:10.1002/jrs.1250
200408
26. Durig JR, Lee MJ, Little TS (1990) J Raman Spectrosc 21:529.
doi:10.1002/jrs.1250210903
27. Bulanin MO (1973) J Mol Struct 19:59. doi:10.1016/0022-2860
(73)85256-1
28. van der Veken BJ, DeMunck FR (1992) J Chem Phys 97:3060.
doi:10.1063/1.463047
29. Herrebout WA, van der Veken BJ, Wang A, Durig JR (1995) J
Phys Chem 97:578. doi:10.1021/j100002a020
30. Bulanin MO (1995) J Mol Struct 347:73. doi:10.1016/0022-2860
(95)08537-6
31. Herrebout WA, van der Veken BJ (1996) J Phys Chem 100:9671.
doi:10.1021/jp953713q
32. Vogelsanger B, Caminati W, Bauder A (1987) Chem Phys Lett
141:245. doi:10.1016/0009-2614(87)85018-2
Table 8 Quadratic centrifugal distortion constants (kHz) for equatorial and axial chlorocyclobutane
Equatorial Axial
C4H735Cl C4H7
37Cl C4H735Cl C4H7
37Cl
MP2(full)/ 6-31G(d) Exp.a MP2(full)/ 6-31G(d) Exp.a MP2(full)/ 6-31G(d) Exp.a MP2(full)/ 6-31G(d) Exp.a
DJ 0.31 0.34(2) 0.30 0.53(6) 1.03 1.2(1) 0.99 1.8(2)
DJK 1.31 1.31(4) 1.25 0.8(2) -1.97 -3.6(3) -1.91 -5(1)
DK 5.37 – 5.46 – 6.25 – 6.21 –
dJ 0.0336 0.0449(8) 0.0316 0.0 -0.0286 0.0 -0.0265 0.0
dK 1.21 – 1.18 – 0.71 – 0.68 –
a Values taken from [10]
948 Struct Chem (2008) 19:935–948
123
Copyright © 2022 FDOKUMEN