The Process Chain for Aircraft Cabin Conversion
64
Universitatea Politehnica Bucureşti Splaiul Independenţei 313 060042 Bucureşti The Process Chain for Aircraft Cabin Conversion Identification and Optimization Algorithms Mihaela Niţă 2011-01-07
-
Upload
khangminh22 -
Category
Documents
-
view
1 -
download
0
Transcript of The Process Chain for Aircraft Cabin Conversion

Universitatea Politehnica Bucureşti
Splaiul Independenţei 313
060042 Bucureşti
The Process Chain
for Aircraft Cabin Conversion
Identification and Optimization Algorithms
Mihaela Niţă
2011-01-07

2
Abstract
This report gathers part of the results obtained during the research period for the doctoral
studies with the topic “Contributions to the Optimization Methodology for Aircraft Cabin
Conversion”. These results were obtained in cooperation with an industrial partner, called
ELAN GmbH, and the University of Applied Sciences in Hamburg. The aim of this report is
to investigate matrix based process optimization algorithms. The algorithms are applied to the
process chain for aircraft cabin conversions, identified from the perspective of an engineering
organization, different from the aircraft manufacturer. The algorithms should increase the
efficiency of the engineering system and highlight key processes. The approach of this case
study is unique, and the results deliver the optimal sequence of processes throughout the
entire cabin conversion project. Results on this topic were published in the proceedings of
three conferences.

3
Table of Content
Abstract ................................................................................................................................. 2
List of Figures ............................................................................................................................ 5
List of Tables.............................................................................................................................. 6
List of Abbreviations.................................................................................................................. 7
1 Introduction ........................................................................................................... 9
1.1 Aircraft Cabin Conversions Today.......................................................................... 9
1.2 Purpose and Structure of Work ............................................................................. 12
2 Airworthiness of Aircraft Cabin Conversions .................................................. 14
3 Process Representation Models.......................................................................... 19
3.1 Flow Charts ........................................................................................................... 19
3.2 Matrix Representation ........................................................................................... 21
3.3 Concurrent Engineering Concept .......................................................................... 23
4 Process Chain Description .................................................................................. 25
4.1 The Process Chain for Cabin Design .................................................................... 25
4.1.1 Process Chain Description..................................................................................... 25
4.1.2 The Knowledge Based Engineering Concept........................................................ 27
4.2 The Process Chain for Cabin Conversion ............................................................. 27
4.2.1 Process Chain Description..................................................................................... 27
4.2.2 The Elements of the Process Chain....................................................................... 31
4.2.3 The Completion Center Concept ........................................................................... 35
5 Process Chain Optimization with Dependency and Structure Modeling
Methodology......................................................................................................... 38
5.1 The DSM Methodology......................................................................................... 38
5.1.1 Types of DSMs and their Application................................................................... 38
5.1.2 Optimization Algorithms....................................................................................... 41
5.2 Analysis of the DSM for the Process Chain for Cabin Conversion ...................... 44
5.2.1 Partitioning Algorithm .......................................................................................... 44
5.2.2 Eigenstructure Analysis......................................................................................... 45
5.2.3 Cross Impact Analysis........................................................................................... 47
6 Conclusions and Outlook .................................................................................... 51
List of References ................................................................................................................... 52

4
Appendix A Example of a Conversion Scenario and Required Input Information......... 56
A.1 Description ............................................................................................................ 56
A.2 Delivery Milestones Plan ...................................................................................... 56
A.3 Mechanical Refurbishing Tasks ............................................................................ 57
A.4 Electrical Refurbishing Tasks ............................................................................... 61
A.5 Conclusions ........................................................................................................... 62

5
List of Figures
Fig. 1.1 Typical process flow when the company is subcontracted by the aircraft
manufacturer.......................................................................................................... 10
Fig. 1.2 Typical process flow when the company works independently from the aircraft. 11
Fig. 2.1 Preparation for DOA implementation – Process Chain representation................. 17
Fig. 3.1 Design Structure Matrix in contrast to a direct graph (digraph) .......................... 22
Fig. 3.2 Configuration possibilities of the interrelations between tasks............................. 23
Fig. 4.1 Cabin layout obtained with Pacelab Cabin tool .................................................... 27
Fig. 4.2 Process chain concept for cabin conversions ........................................................ 28
Fig. 4.3 Coding system used for the process illustration.................................................... 31
Fig. 4.4 Process illustration: Offer Phase ........................................................................... 32
Fig. 4.5 Process illustration: Concept Phase....................................................................... 33
Fig. 4.6 Process illustration: Definition Phase.................................................................... 34
Fig. 4.7 Process illustration: Design Phase......................................................................... 34
Fig. 4.8 Process illustration: Certification Phase................................................................ 35
Fig. 4.9 Process illustration: Hand-Over Phase .................................................................. 35
Fig. 4.10 Process illustration: Adjustment Phase ................................................................. 35
Fig. 4.11 Completion Center concepts ................................................................................. 37
Fig. 5.1 Example of DSM showing the relations between the main phases of the process
chain for cabin conversion .................................................................................... 38
Fig. 5.2 Classification of DSM........................................................................................... 39
Fig. 5.3 DSMs and DMMs for the five project domains .................................................... 41
Fig. 5.4 The partitioned matrix obtained from the original matrix shown in Figure 5.1.... 43
Fig. 5.5 The partitioned DSM resulted after running the partitioning algorithm on the
original DSM matrix ............................................................................................. 45
Fig. 5.6 Work Transformation Matrix (WTM)................................................................... 46
Fig. 5.7 Cross Impact Matrix example ............................................................................... 48
Fig. 5.8 Cross Impact Diagram........................................................................................... 48
Fig. 5.9 The Cross-Impact Diagram based on the DSM..................................................... 49

6
List of Tables
Table 3.1 Comparison of common process modelling methodologies ................................. 21
Table 5.1 Interaction quantification scheme ......................................................................... 40
Table 5.2 Main characteristics of DSMs and DMMs............................................................ 41
Table 5.3 Comparison between DSM and DMM.................................................................. 44
Table 5.4 The processes with the largest eigenvalues ........................................................... 47
Table 5.5 Results for the parameters describing the Cross-Impact diagram......................... 48
Table 5.6 Selected processes for each zone of influence ...................................................... 49
Table A.1 Delivery Milestone Plan for the selected conversion example ............................. 56
Table A.2 Description of mechanical tasks, required input data, difficulties encountered
when the data would be missing, alternatives to unavailable data and feasibility of
the task................................................................................................................... 57
Table A.3 Description of electrical tasks, i.e. IFE and new enhanced CIDS with respect to
required input data, difficulties encountered when the data would be missing,
alternatives to unavailable data and feasibility (do-ability) of the task................. 61

7
List of Abbreviations
AAP Aft Attendant Panel
AIP Attendant Indication Panel
C/B Circuit Breaker
CFK Carbon (Kohlenstoff) Faserverstärkte Kunststoffe
CIDS Cabin Intercommunication Data System
CR Customer Request
CVE Compliance Verification Engineers
DEU Decoder/Encoder Unit
DMM Domain Mapping Matrix
DO Design Organization
DOA Design Organization Approval
DOM Design Organization Manual
DSM Design Structure Matrix
DSM Dependency and Structure Modeling Methodology
DTS Detailed Technical Sheet
EASA European Aviation Safety Agency
EFPMS Emergency Floor Path Marking System
EPSU Emergency Power Supply Unit
ER Emergency
FAA Federal Aviation Administration
FAP Flight Attendant Pannel
ICAO International Civil Aviation Organization
IFE In-Flight Entertainment
JAA Joint Aviation Authorities
KBE Knowledge Based Engineering
LLT Long Lead Time
MDM Multiple Domain Matrix
NTF Non Textile Floor
OEM Original Equipment Manufacturer
PD Principle Diagram
PRAM Pre Recorded Announcements and Music
PSU Passenger Service Unit
SA Single Aisle
SB Service Bulletin
SSM System Schematic Manual
STC Supplemental Type Certificate
TC Type Certificate
UML Unified Modeling Language
VCC Video Control Center

8
WD Wiring Diagram
WTM Work Transformation Matrix

9
1 Introduction
An engineering organization, especially in the aeronautical industry, needs a very efficient
process management. The engineering results ‘travel’ inside the company, as well as between
the company and the supplier / customer. Well managing multiple partners and high amount
of data are examples of issues on which the efficiency of the entire system very much
depends.
On the application of aircraft cabin conversions a methodology is studied for optimizing the
process chain. In this report, the accuracy of the processes is not considered primarily, but the
way to manage and optimize them. The way to handle the processes is a very important topic
for the industry and represents a requirement from the certification authorities.
1.1 Aircraft Cabin Conversions Today
Today, an engineering company, different from the aircraft manufacturer, that delivers the
engineering work for aircraft cabin conversions, has two possibilities to remain in the combat
for a market share1. The engineering company is either on the list of main subcontractors of a
large aircraft manufacturer, or has developed the capability to develop itself the complete
design, including certification, without the support of the aircraft manufacturer. In the first
case, the engineering company is dependent on the aircraft manufacturer and sometimes has
to accept conditions, often not advantageous. In the second case, once the capability to deliver
a safe design is build up according to the EASA requirements (see Section 3), missing
information becomes an important issue, as the aircraft manufacturer – now the competitor –
is the only one possessing the original drawings. Typical process flows for both cases are
illustrated in Figures 1.1 and 1.2.
Usually the work is delivered in the form of a Service Bulletin (SB). The SB’s represent the
form in which the engineering work is further transmitted to the aircraft operator, which has
the responsibility to implement the instructions comprised within. Such a document – the
deliverable – usually contains:
• the title of the document and the aircraft involved,
• the design change specifications comprising of installation instructions and drawings,
• the requirements and the limitations,
• the operational characteristics,
• the necessary materials,
• the parts lists and kit lists, 1 Our study (see the paper ‘Business Opportunities in Aircraft Cabin Conversion and Refurbishing’,
Niţă 2010a) showed a very high potential of the cabin conversion market for the next 20 years.

10
• warnings and cautions for the workers.
Fig. 1.1 Typical process flow when the company is subcontracted by the aircraft manufacturer

11
Fig. 1.2 Typical process flow when the company works independently from the aircraft
manufacturer. Below, the current procedure refers to the same process flow as in Fig. 1.1, but the aircraft manufacturer box is replaced with a box called ‘Customer’
The more interesting scenario is the second one, when the engineering company conducts
independent cabin conversions. In this case the customer is the aircraft operator (airline or
private person) directly. As showed in Figure 1.2, in order to achieve this, input data is
required. The input data required consists mainly of aircraft cabin drawings. Appendix A
describes a conversion scenario and the required input information. The aircraft manufacturer
will be reluctant in sharing this information to the competitive engineering company. In some
cases an agreement can be set2.
Part of this data can be obtained through other suppliers of the customer. For instance, if the
conversion implies changing the IFE system, the audio / video equipment manufacturer may
be in the possession of data regarding electrical connection possibilities.
2 In the USA the tradition is rather different than in Europe. Here agreements are easier to obtain and more
advantageous due to the long tradition of OEM independent completion center. In Europe it s more difficult to obtain input information due to a different tradition: here the aircraft manufacturer works with many subcontracting companies, dependent on the OEM. The subcontractors have access to the information, only if the customer is the OEM itself, otherwise they become competitors for the aircraft manufacturer.

12
The task of delivering the conversion becomes very challenging. The process of changing the
cabin from an initial destination / layout to a new one can only be performed under the
supervision of the certification authorities. Section 3 describes the company set up criteria
which need to be fulfilled.
1.2 Purpose and Structure of Work
This report has multiple objectives. First, it aims to present the current picture of aircraft
cabin conversion providers:
• in their relation with the aircraft manufacturer,
• in their options for improving the business,
• in their challenges from customers and regulators,
• in their choices for capability growing.
The aircraft cabin conversions market is a very sustainable and profitable market, for a very
first, simple reason: cabin upgrades occur in cycles, no matter how the world financial context
looks like. For competition motives – greener, cheaper, lighter, more comfortable – aircraft
operators need to constantly improve their product – which is represented by the cabin.
Aircraft manufacturers also conduct cabin upgrades for their customers, they often cannot
face a growing demand. More interesting is to analyze the view of engineering companies
aiming to develop their capabilities to undertake independent cabin conversion designs.
The second objective is to illustrate the regulatory frame in which the engineering design
work needs to be performed. An aircraft is build with several standard cabin configurations.
Any change to the original design (called ‘type design’) needs to be approved by the
certification authorities (for Europe, EASA). In order to be able to perform these changes
safely, a very good ‘Design Assurance System’ needs to be established. The process flow
optimization becomes a key factor.
The third objective is to investigate available process representation models. The most
common representation is in the form of flow charts. Flow charts are suggestive and easy to
visualize, but only if the process chain is simple. Complex process chains need easier-to
follow representation models, capable in the same time of capturing the relations between
processes in an unbiased way.
The forth objective is to identify the process chain for aircraft cabin conversion from the
perspective of an engineering company (design organization), different than the aircraft
manufacturer. Input for achieving this objective was given directly from the industry, through
the company ELAN GmbH.

13
The fifth objective is to investigate and apply an optimization methodology. Chosen was a
matrix based methodology, allowing several optimization algorithms. These algorithms have
never before been used in this context.
To every objective a separate section was allocated. An Appendix gives an example of cabin
conversion scenario and illustrates the challenges and way to solve them.
Section 1 Introduction: sets the scene and presents the current industry situation in
the area of aircraft cabin conversions.
Section 2 Airworthiness of Aircraft Cabin Conversions: illustrates EASA
requirements for conducting safe designs, these requirements are important
as they reflect on the process optimization.
Section 3 Process Representation Models: compares several process representation
methods and selects the one that allows a promising mathematical approach
to process optimization.
Section 4 Process Chain Description: presents a possible process chain for cabin
conversions to be followed by an engineering company different than the
aircraft manufacturer.
Section 5 Process Chain Optimization with Dependency and Structure Modelling
Methodology: applies and extrapolates a matrix based process investigation
and optimization method.
Section 6 Conclusions and Outlook: applies and extrapolates a matrix based process
investigation and optimization method.

14
2 Airworthiness of Aircraft Cabin Conversions
In aviation, the safety of the crew and passengers is quantified through the term
airworthiness. If it is shown that the aircraft complies with the applicable standards, a
certificate of airworthiness is issued for each aircraft individually, demonstrating that the
required level of safety is fulfilled. Responsible for providing standards for the aviation safety
and environmental protection are certification authorities. Certification authorities are also
responsible for approving any design, manufacture or maintenance of airplanes or
components, as well as for monitoring the implementation of the safety rules. Certification
authorities are:
• International Civil Aviation Organization (ICAO)
• Civil Aviation Authorities
• Joint Aviation Authorities (JAA)
• European Aviation Safety Agency (EASA)3
• Federal Aviation Administration (FAA)
Any organization that undertakes design work needs to apply for a Design Organization
Approval (DOA). Every product designed by a design organization holds a type certificate
(TC), where all the specifications of the product are mentioned. The respective design
organization is approved by EASA and the type certificate is also issued by the Agency. This
type certificate shows that the design organization has proven compliance of the type design
with all applicable requirements (21A.14, EASA 2009a).
In the case of cabin conversions, one is not talking about designing products, but designing
changes to products. There are either minor or major changes to the type design. Minor
changes are to be classified and approved either by the Agency or the design organization
(further referred to as DO), under a procedure agreed with EASA (EC 1702/2003, subpart D,
21A.95, EASA 2009a). Major changes can be classified by the TC holder but can be
performed only under the surveillance of the authority. Design Organizations, other than the
TC holder, need a supplemental type certificate (STC) and the approval from the TC holder to
perform the changes (see Subpart E from EC 1702/2003, EASA 2009a).
To summarize, cabin conversion certifications are possible under the following categories:
• Change of Type Certificate
• Supplemental Type Certificate - STC
• Repair approval
Optimization of cabin conversion design processes is required by EASA (EASA 2009a). This
is reflected in the criteria for the DO approval, which will be further shortly presented.
3 Further on, the requirements coming from EASA will be discussed.

15
The document in which these requirements are stated is Annex Part 21, Subpart J, to (EC) No.
1702/2003 (EASA 2009a). This document sets the requirements that need to be fulfilled by
any organization wanting to develop design work for aeronautical products. Requirements
from Subpart J interfere with requirements from other sub-parts.
The Acceptable Means of Compliance and Guidance Material illustrate the means by which
the requirements stated in the rule can be achieved. Once the compliance is demonstrated, the
applicant receives a Type Certificate or, as it is the case, a Restricted or a Supplemental Type
Certificate (EASA 2009b).
Cabin conversion designs are, as mentioned before, changes to the type design. An applicant
for a change to the type design of a product needs to submit an application which has to
include the description of the change, as well as the identification of (article 21A.93 EASA
2009a):
• parts of the type design and manuals affected by the change,
• certification requirements and environmental protection requirements,
• necessary re-investigation in order to show compliance.
The EASA certification specifications – CS 25 and CS 23 – provide the requirements for
certifying cabin related designs. Additional certification requirements in the field of cabin
conversions come from operation – JAR Ops.
To set up a design organization in the form required by EASA to issue the approval, several
requirements are to be fulfilled:
• A scope of approval needs to be clearly defined: For cabin-related activities the technical
fields implied in the definition of the scope are:
� Installation of Avionics and Equipment
� Environmental Systems
� Electrical Systems
� Cabin Interior
� Galleys or other interior equipment
• A specialized personnel covering key functions, depending on the scope of work; the
absolute minimum for a very limited scope could be defined for 5 persons, as such:
� Head of the DO
� Head of the Office of Airworthiness
� Compliance Verification Engineer
� Design Engineer
� Quality Management Engineer
• A monitoring system for preventing undetectable errors and failures, which may not be
observed by the Agency.
• A design assurance system, that includes the independent monitoring of compliance.

16
• A design organization manual that describes the organization, the relevant procedures
and the products or changes to products to be designed.
Through the DOA itself the Agency is looking to develop among the design companies a
safer and more complex self-control function. The purpose is to discharge the responsibility
of certifying the product on the engineering and certification team of the DO, while EASA is
supervising carefully the actions. The technical processes inside the organization, together
with the tools, become of major importance.
The implementation of the EASA standards for creating a Design Organization can follow
this sequence (Figure 2.1) (CAMR 2009):
• Preparation
• Implementation
• Evaluation
• Learning
The preparation phase includes:
• Understanding the EASA requirements for DOA
• Identifying the purpose of DOA
• Identifying the objectives for getting the DOA
• Identifying and evaluating the consequences of receiving the approval
• Identifying the consequences of not having a DOA
• Identifying the most important points of the integration of the new organization within the
company
• Assigning a responsible person/team capable of evaluating the DO implementation
process
• Determining the functions and responsibilities of the personnel involved in getting the
DOA
• Identifying the activities, already existing in the company, which can be part of DO
• Defining clear goals and proper management strategy for implementing DO concept
• Identifying the key performance indicators
• Indentifying the type of necessary documents inside the DO, by respecting EASA
indications
• Identifying simplest and clearest way to create the documents, by considering aspects like:
form, annotations, signatories
• Preparing the implementation plan, based on a schedule
• Preparing the implementation processes
• Evaluating the costs and the revenues
Part of the implementation plan prepared during this phase should, first of all, be all the
aspects quoted in the Part 21 and the other relevant parts referred to in this chapter. Secondly,

17
other sources, such as technical documentation standards or quality management standards,
can be taken into account. This means that the implementation plan must include prescriptions
regarding:
• The setting up of the Design Assurance System
• The functions and responsibilities of the personnel inside the DO
• The creation of the DOM
• The way the Monitoring System will function
• The tools necessary for the flawless functioning of the DO
• The showing of compliance
• The Quality Management Strategy
The preparation phase is of major importance and implies the contact with the EASA.
Fig. 2.1 Preparation for DOA implementation – Process Chain representation

18
The Implementation phase includes:
• Implementing the plan elaborated during the preparation phase
• Collecting data to supply it to the evaluation phase
• Supervising the plan integration
• Creating a knowledge base
The Evaluation phase includes:
• Evaluating the functioning of the components of the DO
• Reviewing of the processes, if it’s necessary
• Standardizing the processes
• Evaluating and standardizing the document flow
• Establishing monitoring measures
• Analyzing and evaluating the tools
The Learning phase includes:
• Assessing the results from the evaluation phase
• Reflecting on the possible improvements and implementing them
• Standardizing all the procedures inside DO
• Standardizing the document flow, regarding annotations, form and signatories
• Standardizing the communication system within DO and with EASA
• Standardizing the data storage
These phases were established with the help of the methodology for implementing the
concurrent engineering concept developed at the Center for Advanced Manufacturing
(CAMR) of the University of South Australia. The concurrent engineering concept will also
be presented in the following chapters.

19
3 Process Representation Models
In order to establish and improve processes, to document them (e.g. for compliance reasons),
or to define roles and responsibilities as well as to understand the relation between them, the
process planning and modeling activities have a vital importance. Models allow processes to
be controlled and analyzed with the purpose of improving them. There are numerous
approaches available to support process management, each depicting various aspects.
3.1 Flow Charts
Typically, processes are modeled as flow charts that produce large process maps to describe
how a company is progressing from a customer request to the delivery. They are focusing on
information flows from one activity to another. Most of them capture the interactions between
tasks, documents, events, roles or resources, and time (see Table 3.1). Some of these methods,
applicable also in aerospace industry, are (König 2008):
- Structured Analysis and Design Technique (SADT) - it is part of a series of structured
methods, that represent a collection of analysis, design, and programming techniques.
Basically it describes systems as hierarchy of functions and can be used as a functional
analysis tool; it uses successive levels of details: either through a top-down decomposition
approach or by means of activity models and data models diagrams (Nam Pyo Suh 2001);
- Integrated Definition (IDEF) - is a family of modeling languages covering function
modeling, information modeling, knowledge acquisition or object-oriented analysis and
design; IDEF0 is a language building on SADT and IDEF1 addresses information models
There are up to 14 languages (developed through the US Air Force funding), each having a
specific purpose; IDEF 3 refers to Process Description Capture (Mayer 1995);
- UML-Activity diagrams - includes a set of graphical notations techniques to create abstract
models of specific systems; it uses entity relationship diagrams and work flow modeling
(Noran 2009);
- Business Process Modeling Notation (BPMN) - provides a graphical notation for specifying
business processes in a Business Process Diagram (BPD); it is similar to UML; it uses
elements like flow objects, connecting objects, swim-lanes and artifacts (Simpson 2004);
- XML Process Definition Language (XPDL) - is a format standardized by the Workflow
Management Coalition (WfMC) to interchange Business Process definitions between

20
different workflow products; it has been designed specifically to store all aspects of a BPMN
diagrams (Van der Aalst 2009);
- Process Module Methodology (PMM) - methodology for the flexible planning, monitoring
and controlling of highly complex dynamic development processes; The fundamental
approach adopted here is to specify the process steps but not the order in which they should
occur, allowing the process to be amended easily when they run (Bichlmaier 1999);
- Event-driven Process Chains (EPC), either event-driven or object-oriented (oEPK) - are
used to analyze processes for the purpose of an ERP (Enterprise Resource Planning)
implementation, which is a computer software system used to manage and coordinate
resources, information and functions of a company (Van der Aalst 2009);
- PERT (Program Evaluation and Review Technique) - is a method to analyze the involved
tasks in completing a given project; it identifies the minimum time needed to complete the
total project; it uses key terms like: critical path, lead time, optimistic time or expected time
(Chanas 2001);
- Critical Path Method (CPM) - it determines critical activities using the same approach as
PERT: by representing the duration along with the processes and relations between them and
by calculating meaningful durations like for instance the latest when an activity can start
without affecting the project (Chanas 2001);
- Work Breakdown Structure (WBS) - illustrates all the activities being part of a project, by
breaking them down up to achieving the deliverables; it is a highly used method also in the
aerospace sector: Airbus has set the WBS usage as requirement for their subcontractors. The
WBS is detailed enough and can be used as management control tool (AP 1500). Along with
the WBS, the OBS (Organization Breakdown Structure, for personnel and responsibilities)
and the RBS (Resources Breakdown Structure, for identifying resources associated to the
work package) can be used;
- GANTT – is a bar chart illustrating a project schedule, by representing start and finish dates;
it is highly used in every domain of activity.
Table 3.1 compares some of the methodologies briefly presented above. These methodologies
were studied having in mind the type of processes involved in cabin conversion. However,
flow charts are not the only available method (see next paragraph).

21
Table 3.1 Comparison of common process modelling methodologies (König 2008)
3.2 Matrix Representation
Another possible way of representation for system analysis and management is the use of
matrices. Recently developed, was the Design Structure Matrices (DSM) and its derivatives:
Domain Mapping Matrix (DMM) – allowing mapping between two different views on a
system and Multiple Domain Matrix (MDM) – combining a DSM and a DMM into a
complete system representation.
The DSM is a square matrix that shows relationships between elements in a system (DSM
2009). The Design Organization, as EASA requires, needs to function as a system which in
the end needs to prove to the authorities that it can deliver a certified design or modification to
a design. The optimal functioning of the DO as a system is determined by interactions
between its constituent elements. The DSM provides a simple representation, allowing the
analysis of these interactions and permitting their visualization.
The first step in using this approach is to identify all the sub-systems of the systems. In our
case the system is represented by the set of tasks to be performed inside the Completion
Center, for achieving a certified cabin conversion. The tasks names are placed down the side
of the matrix as row headings and across the top as column headings in the same order. If
there exists an edge from node i to node j, then the value of element ij (row i, column j) is
unity (or marked with an X). Otherwise, the value of the element is zero (or left empty). In the
binary matrix representation of a system, the diagonal elements of the matrix do not have any
interpretation in describing the system, so they are usually either left empty or blacked out
(see Figure 3.1) (DSM 2009).

22
Fig. 3.1 Design Structure Matrix in contrast to a direct graph (digraph) (DSM 2009)
The difference between the two representation forms is shown in Figure 3.1. Matrices are
useful in systems modeling as they can represent the presence or absence of a relationship
between pairs of elements in a system. It provides a mapping of the tasks and allows the
detailed analysis of a limited set of elements in the context of the overall structure. Reading
along a specific row reveals which tasks receive information from the task corresponding to
that row (DSM 2009).
The way to ‘read’ the matrix is:
• Task A transfers information to Task C
• Task B transfers information to Task C
If the arrow would have been positioned the other way around, then the following relations
would have been valid:
• Task C transfers information to Task A
• Task C transfers information to Task B
There are three types of configuration possibilities of the interrelations between tasks (see
Figure 3.2, Eppinger 2002):
• Parallel
• Sequential
• Coupled
The parallel configuration shows that the tasks are independent on each other (example:
between tasks A and K there is no information flow). The sequential configuration shows the
information flow is unidirectional between two tasks (example: task C receives information
from task B). In the case of coupled tasks the information flow is dual, coming from both start
and end task (example: task H receives information from task E, task D receives information
from task E and task D gives back information to task H). In contrast to Figure 3.1, here the
arrow is set downwards, which means the feed-forward information flow is visible in the
lower half of the matrix. The user can set the direction as he likes.

23
Fig. 3.2 Configuration possibilities of the interrelations between tasks (Eppinger 2002)
3.3 Concurrent Engineering Concept
The Concurrent Engineering concept was found to be suitable for optimizing design cycles,
especially in the preliminary phases. This paper aims to describe the processes behind an
airworthy design, whether it is a complete cabin design or the design of a cabin modification.
Optimizing a process chain of a complex system, like a Completion Center, means looking to
minimize the errors. Using a concurrent engineering approach, for example by developing
parallel design tasks, was found to be helpful with this respect.
In this paragraph, the concept is briefly presented, as a helpful methodology to be considered
when implementing design processes inside Completion Centers.
Concurrent Engineering takes into account all the elements of the life cycle of the product at
an early stage and in the same time (or concurrently). Therefore, processes like establishing
requirements, creating and running computational models or testing the product are optimized
through the iterative design approach (Zhong 2009).
Some of the driving characteristics of this concept are:
• Parallelization of the design tasks
• Early design reviews
• Software tools, allowing adaptation of the design in an early phase
• Good communication among the engineering team
To achieve the results which come along with the implementation of Concurrent Engineering,
it is necessary to create a specific design environment in the form of a facility allowing
efficient data interchange and communication between the engineers responsible for different
tasks. Such a facility should be modeled through at least the use of (DLR 2009, ESA 2009):

24
• An array of design stations equipped with Hardware and Software tools suitable for each
discipline
• Video conferencing equipment
• Access to Knowledge databases
The use of this concept within a Completion Centre can be done by integrating the
perspectives of all design phases in the early phases of the concept. In cabin refurbishing it is
important to consider the certification requirements already in the preliminary discussions.
The consequence is reducing later modifications and delays in the end phases of the cabin
design.
Why Concurrent Engineering and DSM?
Concurrent Engineering can also be described through the DSM model of representation, as it
is shown in (Schlick 2008). This is the reason why the decision is taken to research more in
depth the matrix way of process representation.
Another argument is that the method has been already applied by one of the most important
aircraft manufacturers, Airbus, in an attempt to implement the Multidisciplinary Design
Optimization in analyzing complex new projects, like the A3XX (the present A380). A way
of dealing with such challenges is by breaking the large task of system optimization into
smaller concurrently executed, and yet, coupled tasks, identified with engineering disciplines
or subsystems (Sobieski 1989). Cabin design and conversion, is similar with aircraft design,
in which the Multidisciplinary Design Optimization has been applied. The only difference is
the scale: even if cabin design is only a part of aircraft design, there are a lot of interfering
systems which need to be integrated. Therefore a representation allowing both a global and a
detailed view, an hierarchical and a non-hierarchical view between tasks is to be considered
also in the process representation of this paper.

25
4 Process Chain Description
4.1 The Process Chain for Cabin Design
4.1.1 Process Chain Description
At a smaller scale, the cabin design reflects the process steps of aircraft design. Once the
fuselage conception is completed, the cabin requirements for safety and operation must then
be reflected in the cabin architecture development. This section approaches cabin architecture
development issues and aims to determine the process steps involved by the modeling.
The cabin architecture needs to integrate a large amount of different systems and components:
• Cabin communication
• Entertainment system
• Air conditioning system
• Oxygen system
• Emergency floor path marking
• Lights
• Service (galleys)
• Utilities (lavatories, stowages)
• Seats (flight attendants and passengers)
The overall optimization and integration of parametric models becomes an important issue.
When observing the development of system architecture (Reis 2010), the following process
steps can be identified for the cabin architecture:
1. Creation of a component library
2. Definition of placement constraints
3. Generation of an initial architecture
4. Identification of relevant parameters
5. Investigation of competing architectures
6. Post-processing and analysis of the results
The input data required when defining the cabin architecture (i.e. an initial Step 0) is a
fuselage shape optimized with respect to cabin requirements. An optimized fuselage shape
accounts for both performance-based parameters, such as fuselage slenderness, and comfort-
based parameters, such as number of seats abreast. Niţă 2010b presents a handbook method
for fuselage preliminary design and cabin optimization.

26
Steps 1 to 6 use a Knowledge Based Engineering (KBE) approach. This approach uses
knowledge databases and data association (Russell 2003) in order to automate the design
process. Section 2.2 details this concept.
Step 1.) refers to the implementation of a reusable component library into the architectural
development. Items like seats, galleys, lavatories or stowage bins can be stored together with
their parametric description and linked to the fuselage, inside dedicated zones.
Step 2.) defines first of all the regulatory placement constraints (e.g. no item needs to be
positioned within a specified area near the emergency exits). However, operator constraints
(e.g. the first overhead stowage bin on the right contains the In Flight Entertainment – IFE
system) must be considered as well.
Step 3.) generates possible architectural layouts according to the previously defined
constraints.
Step 4.) chooses the relevant parameters which bare the optimization. For the cabin design, a
performance based optimization concentrates on reduction of drag, fuel consumption or mass.
These parameters are influenced, for instance, by the fuselage slenderness parameter.
Step 5.) investigates the resulting architectures after running the optimization.
Step 6.) concludes upon obtaining the values of each parameter and evaluates the resulting
configurations. In the end a valid configuration, fulfilling the constraints, will be generated.
Currently a KBE software called Pacelab Cabin, created by PACE GmbH, is available for
generating preliminary cabin layouts. This tool is able to cover the 6 defined steps. However,
the capabilities depend on the available database and the optimization possibilities are limited.
An optimized cabin architecture can be achieved on the basis of Pacelab Cabin if all the
systems in the cabin are considered at the same time. Currently the tool is not able to include
for instance the Passenger Service Unit (PSU) and the overhead stowages layout in
connection to the seats layout.
The fulfillment of the process steps enumerated above would ensure (Reis 2010):
• Optimized physical placement of cabin items.
• Optimized sizing with respect to regulatory, geometric, volumetric, electric and thermal
constraints.
• Optimized centre of gravity variance and its impact on aerodynamics, mission and
operational flight performance.
• Optimized cabin architecture changes against fuselage sizing process and the impact on
mass, range, fuel burn and cost (this evaluation is especially important for cabin
refurbishing and conversion).

27
4.1.2 The Knowledge Based Engineering Concept
The KBE concept was proposed as a viable approach for cabin architecture development. This
sub-section aims to deliver the background for a better understanding of this concept.
Several studies have been performed on KBE and its utility. It is commonly agreed that
Knowledge Based Engineering aims to capture and reuse product and process
multidisciplinary knowledge in an integrated way. The results should reduce time and cost for
engineering applications, automate repetitive design tasks (like multiple seat representation in
the cabin layout), and support conceptual design activities. KBE allows manipulating the
geometry and annexed knowledge and supports the investigation of multiple what-if on their
design.
A tool using KBE, such as Pacelab Cabin, gathers technical rules, generated by customer or
certification requirements, into a knowledge database. The rules can then be used, modified
and updated or newly created by the user. During the negotiations phase in the case of cabin
upgrades and conversions, it is important for an engineering office to be able to create fast
cabin layouts and show to the customer the many modification possibilities. An illustration of
some results obtained with this program is shown in Figure 4.1 (see also Szasz 2009).
Fig. 4.1 Cabin layout obtained with Pacelab Cabin tool
4.2 The Process Chain for Cabin Conversion
4.2.1 Process Chain Description
There is not just one path towards achieving an optimized process chain for cabin conversion.
The processes can be adapted according to the needs and the scope of each project. The only
condition for the company is to have a Design Organization Approval (DOA) showing that
the EASA prescriptions are fulfilled.

28
The flow of processes and documents for cabin conversion should be in such a way
organized, that it minimizes parameters like: time, costs, effort and, especially, errors. A
typical path is described below.
The first attempt to define the customer requirements is made in the Offer Phase. If the offer
is accepted by both partners, then the technical document, describing it and the technical
implications, serves as input for the Conversion Processing. The output of the processing,
summarized in the Hand Over Phase, comes back to the customer, and a loop closes (see
Figure 4.2).
In this paper, the proposed Process Chain is divided into three parts:
• Part A, referring to the offer phase description,
• Part B, referring to the description of the processes for completing the conversion,
• Part C, describing the end processes and the outputs received from the customer.
Fig. 4.2 Process chain concept for cabin conversions
A: Offer
The Offer Phase starts with the Customer Request which is formalized through a preliminary
document briefly describing the requirements of the customer and the implications within the
design organization. In the same time, this document represents the first decision gate for both
partners. If the two parts agree, then the Technical Offer will describe in detail the actions
which are to be followed in order to finalize the customer request.
Parallel to this activity, the engineering office should make a feasibility study, to see if it is a
benefit for the company to accept the proposed task from the customer. For example, it would

29
be quite difficult to comply with the requirements from customers having products not
conforming to the type certification basis. If each decision gate ends with a “yes”, the outputs
enter then the Process Chain B.
B: Conversion Processing
The conversion cycle gathers all the phases related to the design and certification of the
conversion work. These phases are:
1. Concept
2. Definition
3. Design
4. Adjustment
5. Certification
Each phase has its own number of sub-phases, which can also be further divided into smaller
processes. Their representation and optimization is performed in Section 5.
1. Concept Phase
The first stage in the development of a product is the conception. The actions required at the
beginning of a project are mainly referring to:
• understanding and filtering the customer requirements,
• understanding and filtering the certification requirements,
• making an internal feasibility study,
• studying the design possibilities,
• organizing the work flow,
• developing the preliminary design,
• developing the testing and verification methods.
2. Definition Phase
The definition phase approaches the same issues more in depth, with the purpose of achieving
the final version of the design. The main steps are:
• defining the certification basis,
• defining the Means of Compliance,
• defining the process steps,
• assigning and organizing a team,
• analyzing mechanical and electrical loads, tolerances,
• analyzing interference between components,
• testing the design,
• validating the design concept.

30
3. Design Phase
The design engineers perform the design work based on the prescriptions of a Chief of
Design, assigned already in the conception phase, and those of the airworthiness engineers
and Compliance Verification Engineers (CVE). Mainly, during this phase it is required to:
• perform the design according to the prescriptions elaborated during the earlier phases,
• verify the design (Design Verification Engineers),
• give feedback to the project leader.
4. Adjustment Phase
The adjustment phase sums up those activities aimed to improve the overall functioning of the
company delivering the conversion. Some of the processes belonging to this phase are:
• getting feedback from every engineering department,
• detecting points of improvement,
• proposing optimized solutions.
5. Certification
According to CS 25.21 (EASA 2009c) the certification process of an aircraft means proving
that the design complies with all the requirements stated in the specifications emitted by the
Authority. For efficiency, the certification process should start from the early phase of the
conception, in parallel to the design development activities. For reducing time and errors,
certain aspects need to be already considered when the concept is developed. The certification
process is under the responsibility of the Office of Airworthiness (EASA 2009a).
Mainly the steps are:
• establishing contact with the authorities,
• creating the means of compliance (tests and corresponding documentation),
• creating and approving the certification documentation, under DOA privileges,
• creating certification documentation for getting EASA approval (where the privileges do
not apply),
• signing the declaration of compliance (responsibility of head of DO).
C: Hand Over
Once the design is performed and verified, the next step is to hand over the results to the
customer. The form of the results is written documentation, describing the assembly process
in detail. The size and complexity of the technical documentation depends on the size of the
conversion project. Besides the technical documentation, assistance should be as well
provided. The steps involved in this phase require:
• taking over the final version of the design documentation,

31
• creating the assembly instructions, based on the design documentation,
• verifying the documentation,
• providing assistance,
• delivering the results to the customer.
The output of the finalized conversion process becomes the input for the hand over phase, and
receives the name “deliverable”. Together with the deliverable, the engineering office needs
to provide assistance to the customer, once the work package is finished.
Under the hypothesis that the company performs only the design work, and not the
manufacture and assembly, the deliverable is in fact a document, gathering all the data
necessary for the design to be executed: technical documentation, procedures and instructions
for assembly, part lists, instructions and cautions for continued airworthiness and
maintenance.
4.2.2 The Elements of the Process Chain
In order to identify each process within the system, they need to be labeled. The chosen
coding system will be used by the Data Management System of the design organization,
which will allow users to control and administrate the data produced / required by every
process. A simple coding system used in this paper is illustrated below.
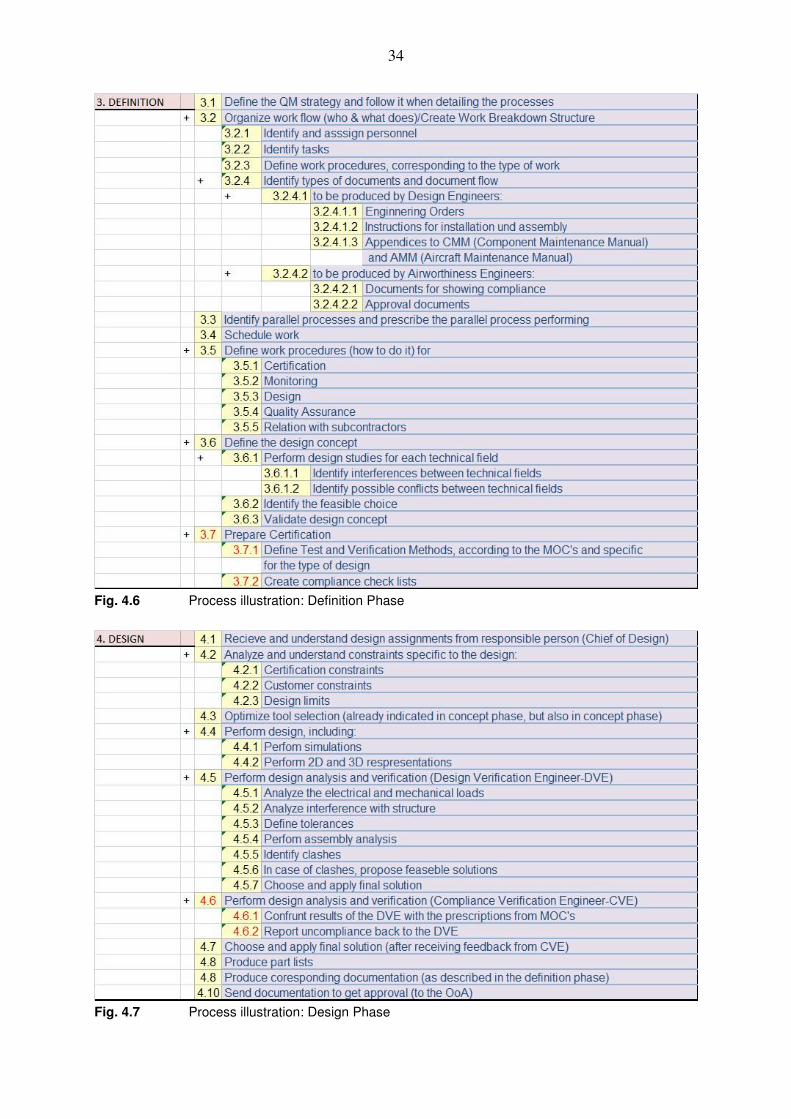
Fig. 4.3 Coding system used for the process illustration
Figures 4.4 to 4.10 list the process chain. Marked in red are those processes that are
certification related.

32
Fig. 4.4 Process illustration: Offer Phase

33
Fig. 4.5 Process illustration: Concept Phase
34
Fig. 4.6 Process illustration: Definition Phase
Fig. 4.7 Process illustration: Design Phase

35
Fig. 4.8 Process illustration: Certification Phase
Fig. 4.9 Process illustration: Hand-Over Phase
Fig. 4.10 Process illustration: Adjustment Phase
4.2.3 The Completion Center Concept
A Completion Center can deliver a range of modifications from simple cabin upgrades to
complete, highly specialized conversions, usually attributed to VIP aircraft. The range of
cabin conversions throughout the commercial aircraft life can be as follows:
− At age 0: several initial standard cabin layouts are created by the aircraft manufacturer.
− At age 5 to 20 years: several cyclic cabin upgrades caused by worn out furnishing or due to
change of aircraft ownership are undertaken inside a Completion Center; if the owner is a
VIP, the design and engineering work normally demands a complex certification process,
especially if the customer is asking for unusual furnishings.
− After age of 20 years: the only scenario possible is pax-to-freighter conversion, undertaken
either by the aircraft manufacturer of within a Completion Center.

36
In common understanding, the notion Completion Center, refers to those organizations able to
deliver aircraft cabin conversions independent of other companies.
Lately, several other possible ways to define the term Completion Center have come into use.
Accordingly, a design organization (DO) can call itself a Completion Center even without
seeing the aircraft, by delivering only the design work. Another possibility for a company to
call itself Completion Center is to conduct the work for the customers through intermediaries,
as a developer. Figure 4.11 illustrates all these possibilities:
− Possibility 1: the Completion Center covers only the design and engineering work (D&E)
itself. The work embodiment, certification and organization of the whole tasks is done by
other companies. Currently engineering offices working as subcontractors for aircraft
manufacturers in the area of cabin conversions can grow into becoming an independent
Completion Center according to this definition.
− Possibility 2: the Completion Center covers the work embodiment while other companies
are responsible for organization of all the tasks and the documentation related to design,
engineering and certification.
− Possibility 3: the Completion Center acts as a developer. A developer works like a building
project organizer or a travel agency – it has neither the capability to perform the design and
engineering work nor the work embodiment, but it is able to organize these tasks for the
customer through third party involvement.
− Possibility 1+2: the Completion Center is able to ensure both design and engineering
(D&E) as well as work embodiment. Since this type of Completion Center comprises all
the work necessary for the conversion itself, an independent developer is not necessary.
This definition of Completion Center is the one from the industry's common
understanding. It is also the most common type of Completion Center; a well known
example of this type of Completion Center is Lufthansa Technik.
− Possibility 2+3: the Completion Center acts as a developer and has the capability to do the
work embodiment itself. D&E are outsourced.
− Possibility 3+1: the Completion Center acts as a developer. It also has the capability to
ensure the D&E work itself. The work embodiment is subcontracted to another company.
When looking at the companies dealing today with cabin conversions, some observations can
be extracted:
• A frequent scenario is VIP Completion. VIP customers are usually high paying and high
demanding. VIP completion on large aircraft can result in big contracts.
• Certification work is performed under the Aviation Authorities, which usually require a
certificate showing the capability of performing the design (DOA – Design Organization
Approval). However, a company can function as a Completion Center without DOA, if
certification work is subcontracted.

37
Fig. 4.11 Completion Center concepts

38
5 Process Chain Optimization with Dependency
and Structure Modeling Methodology
5.1 The DSM Methodology
The Dependency and Structure Modeling Methodology started in the 1980’s from the idea of
using graph theory in order to represent the sequence of design tasks of a complex
engineering project as a network of interactions (Steward 1991). This network is represented
by a quadratic matrix with identical row and column headings, called Design Structure Matrix
(DSM), containing relations and interactions in their nodes (see Figure 5.1).
5.1.1 Types of DSMs and their Application
There are several types of domains as well as relations which can be expressed through a
DSM. This diversity leads to a DSM classification as shown in Figure 5.2.
Static DSMs do not depend on time, therefore the elements exist simultaneously. Such
elements are components of a system, in which case the DSM is component-based, or
members of a team, in which case the DSM is people-based. A static DSM analysis would
provide results with respect to product decomposition or information flow among members of
an organization (Browning 2001, Bartolomei 2009).
Time-based DSMs consists of time dependent nodes. The elements of the matrix can be
represented by activities. In this case the DSM analysis provides their optimal sequencing.
The nodes (or elements) can also be represented by parameters related to system activities. An
analysis of such a DSM would help identifying activities that influence the design parameters
(Bartolomei 2009).
Fig. 5.1 Example of DSM showing the relations between the main phases of the process chain for cabin conversion

39
Fig. 5.2 Classification of DSM (based on Browning 2001)
The way to read a DSM can be shown based on Figure 5.1:
• The input information can be read along the rows – i.e. process 4 (design phase) receives
information from processes 1, 2 and 3 (offer, concept and definition).
• The output information can be read along the columns – i.e. process 4 (design phase) gives
information to process 3 (definition).
• The information exchange is marked through the logical operator true / 1.
The order can be inversed if the user decides to change this convention. In this case one can
read the input information on the column and vice-versa. Usually this convention is indicated
by an arrow mark above the matrix (as shown on Figure 5.1).
The logical operators only show the coupling between the nodes. It is possible to replace them
by numbers in order to show the degree of dependency between the elements (DSM 2009):
• 1 – high dependency
• 2 – medium dependency
• 3 – low dependency
Browning 2001 and Pimmler 1994 use positive and negative numbers, called coupling
coefficients, to express the ranking of the interactions (see Table 5.1). Negative numbers need
to be carefully implemented into the tools which optimize DSMs, as they may not function
properly.
The key factor in using the DSM methodology is the correct input of the logical operators,
respectively coupling coefficients into the matrix. Researchers of this topic (Browning 2001,
Pimmler 1994, Danilovic 2007, Bartolomei 2008) agree on the following preparing steps:
1. Clear definition of system boundary and functionality
2. Identification of system components
Proper fulfillment of Steps 1 and 2 make step 3 possible, which needs additional information
from the members of the organizational staff and engineers:
3. Identification of interfaces between components.

40
Table 5.1 Interaction quantification scheme (based on Pimmler 1994)
Information Weight Information exchange is…
Required: Desired: Indifferent: Undesired: Detrimental:
+ 2 + 1 0 - 1 - 2
…necessary for functionality …beneficial but not absolutely necessary for functionality …does not affect functionality …causes negative effects but does not prevent functionality …must be prevented to achieve functionality
The engineers need to be questioned with respect to the type and frequency of interactions
between the components, in order to estimate the right position and intensity of the coupling
coefficient. The additional sub-steps are required:
3.1 Preparation of questionnaires
3.2 Gathering and analyzing the results.
3.3 Implementing the results into the matrix
A Design Structure Matrix can only be used to analyze interactions between elements of the
same type. In order to see for instance which team is suitable for which activity, one would
need to combine a people-based DSM with an activity-based DSM and analyze the
interactions as a whole. This analysis is possible in the frame of a Domain Mapping Matrix
(DMM). A DMM is a rectangular matrix which examines interactions between two domains.
The literature about DMMs indicates that there are at least 5 major domains which interact in
product development (Danilovic 2007):
1. Goals
2. Product
3. Process
4. Organization
5. Tools
The interactions inside the five domains listed above are represented in DSMs. The
interactions between the domains are illustrated with DMMs (see Figure 5.3).
DMM analysis methods are relatively new, thus the literature is limited. The advantage of
expanding the analysis beyond single domain information gives however enough reason to
consider the DMM approach. To summarize, the main characteristics of both DSM and
DMM are listed in Table 5.2.

41
Fig. 5.3 DSMs and DMMs for the five project domains (Danilovic 2007)
Table 5.2 Main characteristics of DSMs and DMMs (based on information gathered from
Browning 2001, Danilovic 2007, Bartolomei 2008) Criteria DSM DMM
Representation
Dimension
Focus of Analysis
nxn matrix
Single domain
Tasks Activities Parameters Components People Information flow Deliverable flow
nxm matrix
Dual domain
Components / Organization Project / Organizational Structure Functionality / Product Architecture Information flow
5.1.2 Optimization Algorithms
Several analysis algorithms are applicable depending on the type of elements represented into
the matrices. The aim of the investigation towards the DSM methodology is to apply it for the
optimization processes required to perform an aircraft cabin conversion. The interest of this
technical note is therefore to highlight and apply those algorithms suitable for activity based
components analysis.
In Section 4 a number of 143 processes for completing a cabin conversion (while considering
a low degree of detail) were identified. The analysis of a great number of processes with the

42
DSM method requires the automation of the optimization. Highly detailed DSMs use
programmed algorithms and computer aid.
If the purpose is to optimize the sequence of the activities, the suitable algorithm is called
partitioning or sequencing. If the purpose is to assign proper personnel to specific tasks, the
suitable algorithm is called clustering, as it allows grouping of the highly related elements
into clusters (Danilovic 2007, Bartolomei 2008, Eppinger 2002).
Partitioning aims to reorder the sequence of the elements in order to obtain a lower triangular
matrix (according to the convention from Figure 5.1, otherwise the algorithm would deliver
an upper triangular matrix). This is achieved by manipulating the rows and columns of the
matrix such that the coefficients move closer to the main diagonal and reduce the negative
feedback between the elements. The result is a minimized waiting time between activities.
The conclusion to be drawn (Bartolomei 2008) is that minimizing feedback eliminates the
process iteration and spares time.
When looking at the matrix in Figure 5.1, it can be observed that coefficients above the
diagonal indicate the necessity of a task to wait for the completion of another task which is to
be fulfilled in the future.
The problem formalization can be expressed through the following exemplary question for
element number 5: Can process number 5 be fulfilled after processes 6 and 7? If yes, then
insert 1. Do processes 1, 2, 3, 4 give information to process 5? If yes, then insert 1.
The following observations after analyzing Figure 5.1 can be extracted:
1. The concept phase can suffer modifications after the definition phase.
2. The definition phase can suffer modifications after the design phase.
3. The design is influenced by the certification requirements, and can later suffer
modifications accordingly.
4. All phases provide information for the adjustment phase.
5. All phases, besides adjustment and handover give information to certification phase.
6. Handover phase receives information from all other phases, besides adjustment, to which
it gives feedback.
Applying the partitioning algorithm to the matrix in Figure 5.1 means reordering the phases in
the most economical manner. Due to the fact that the dimensions of the matrix are small, a
manual manipulation is possible. The following steps are required (based on DSM 2009):
1. Identification of the elements which do not receive information from the others (by
looking for empty columns) and moving them to the right.
2. Identification of the elements which do not give information to the others (by looking for
empty rows) and moving them to the left.

43
3. If after steps 1 and 2 there are no remaining elements in the DSM, then the matrix is
completely partitioned; otherwise, the remaining elements contain information circuits,
which can be further optimized.
DSM 2009 provides a tool, developed at the Technical University München, which can
automate the process of partitioning. Figure 5.4 shows the partitioned matrix obtained with
this tool from the original matrix shown in Figure 5.1.
Fig. 5.4 The partitioned matrix obtained from the original matrix shown in Figure 5.1
From the results obtained, the following conclusions can be extracted:
• The adjustment phase was moved at the end of the sequence; it is the last to be fulfilled,
once it receives the feedback from all other phases.
• There are still coefficients above the diagonal (market in light blue) but they are required
for the proper functioning of the system.
• The light blue indicates that the information exchange is bidirectional, which means the
three phases are coupled.
Besides partitioning, another algorithm may be of interest when it comes to setting up a
completion center. The clustering algorithm will be further illustrated, but its application is
beyond the purpose of this paper.
While partitioning is suitable for time-dependent elements, clustering is suitable for time-
independent systems, such as product architecture or project organization (Danilovic 2007).
Clustering focuses on identifying groups of items. It is, for example, useful when the elements
of the matrix are people, which need to be grouped in teams. When it comes to designing a
product, another application of the clustering algorithm is in the system decomposition and
can help identifying the sub-components suitable for the system modularization. The
procedure is similar to partitioning: columns and rows are reordered with the purpose to

44
underline the elements which are highly interconnected. Interactions between clusters are, in
the same time, minimized (Bartolomei 2008).
Table 5.3 Comparison between DSM and DMM (based on Danilovic 2007)
DSM Dimensions
Partitioning analysis Clustering analysis DMM
Partitioning algorithm
Block diagonalization / Triangularization
Clustering in blocks along the diagonal
Move items into clusters
Result of the analysis
Sequence of items, activities
Cluster of items Cluster of items
Visualization of dependencies
Feedback and circuits Loop of items Parallel items Sequence of items
Cluster of items Dependencies of clusters
Cluster of items Dependencies of clusters
Key words Tasks Activities Information flow Deliverables
Parameters Components People Organization Information flow
Components / Organization Project / Organizational Structure Functionality / Product architecture
Partitioning and clustering are algorithms suitable for DSM analysis. When it is required to
analyze the interaction between two domains within a DMM, the algorithms need to be
adapted. Danilovic 2007 provides an analysis with respect to applicable algorithms for
DMMs. His conclusions are summarized in Table 5.3.
5.2 Analysis of the DSM for the Process Chain for Cabin
Conversion
In the previous section a DSM analysis was already performed on the coarse matrix
(illustrated in Figure 5.1) with the purpose to exemplify the functioning of the partitioning
algorithms. The following paragraphs will apply the algorithm for the fine matrix, which
includes all the processes identified in Section 4. Other two types of analyses are as well
illustrated: the eigenstructure analysis and the cross impact analysis.
5.2.1 Partitioning Algorithm
The processes were introduced in the EXCEL tool (DSM 2009) and the algorithm was run.
By manipulating the rows and columns, a minimal feedback process configuration was
obtained. Figure 5.5 illustrates, as far as possible, the partitioned DSM.

45
This analysis required a long preparation time and the main difficulties consisted of:
• understanding the dependencies between each process,
• inserting them into the matrix,
• having a clear view over the whole complex structure.
After overcoming these difficulties and running the algorithm, the following conclusions were
extracted:
• Definition, Design and Certification phases are coupled (light blue); they create an
information cycle which needs iteration, and therefore further optimization.
• Other small couplings exist between the teams for engineering, certification and quality
assurance.
• A detailed analysis of the matrix and of each of the illustrated dependency allows a better
understanding of the results.
5.2.2 Eigenstructure Analysis
When aiming to optimize a large number of processes, it helps conducting an analysis which
allows the extraction of the most important ones. The eigenstructure analysis for DSMs was
developed by Smith and Eppinger in (Smith 1997). In our case it helps underlining those
processes which have a major influence on the system.
Fig. 5.5 The partitioned DSM resulted after running the partitioning algorithm on the original
DSM matrix

46
The eigenvalues and eigenvectors determine the nature of the convergence of the design
process in a similar way with the aircraft dynamics:
• the eigenvalues give information about the rate of convergence,
• the eigenvectors give information about the shape of the natural motion.
An interesting similarity between the dynamical behavior of a physical system and the
behavior of the tasks/processes of an engineering system can be noticed. In both cases large
magnitude positive eigenvalues give information about the convergence of the system.
Another interesting analysis is to optimize the duration of the development time
(Smith 1997):
• Serial tasks can be evaluated by summing their individual times.
• Parallel tasks can be evaluated by finding the maximum of those task times.
In this case a Work Transformation Matrix (WTM) (Smith 1997) needs to be used. Each
iteration causes rework; the amount of rework is quantified through this matrix. The off
diagonal elements of WTM represent the strength of dependence between tasks – for our
analysis, the rework necessary for each task. The diagonal elements represent the time that it
takes to complete each task during the first iteration (see Figure 5.6).
Fig. 5.6 Work Transformation Matrix (WTM) (Smith 1997)
The eigenstructure analysis of the process chain was performed on the WTM under the
consideration that the amount of rework is 100%. In this way the problem became simpler to
handle (by inserting 1 instead of proportions of 1) and the results were covered by the largest
safety margin possible. The steps for conducting the analysis were:
1. Building the WTM.
2. Calculating the eigenstructure i.e. eigenvalues and eigenvectors of the matrix.
3. Interpreting the magnitude of the eigenvalues.
The results are summarized by Table 5.4.
Within a Completion Center, it seems that certification, along with quality assurance play a
key role along with the planning the design and engineering process and the team selection. A
second major importance is represented by the tasks grouped under the design analysis and
verification. The results are plausible, especially when considering the way EASA developed

47
the DOA requirements. For EASA the self control capability of each design organization
presents a major importance.
Table 5.4 The processes with the largest eigenvalues
Process ID
Process Title Eigenvalue
50 Organizing team for certification 6.43
51 Organizing team for quality assurance 2.21
52 Planning the Design & Engineering process 2.21
53 Assigning Teams for each technical field 2.31
106 Analyzing electrical and mechanical loads 1.62
113 Performing design analysis and verification 1.62
121 Perform test and compliance verification 1.00
5.2.3 Cross Impact Analysis
Another type of analysis which can be performed based on the DSM is the Cross-Impact
Analysis. The data is analyzed by means of a Cross Impact Matrix, as illustrated in Figure 5.7.
The red numbers represent the strength of the influence exercised by each factor / task over
the rest of the factors / tasks. It is assumed for our analysis that the influence is always either
1 or 0. Depending on the convention, the tasks are either passive or active. The aim of the
Cross-Impact Analysis is to identify several meaningful influence zones and the processes
belonging to them. The values representing the strength of the relations are summarized per
row and per column. The results are graphically represented as shown in Figure 5.8. There are
five meaningful zones which can be identified:
1. Zone I: Reactive Processes – Changes of elements in this area have a strong influence on
the system; they give a lot of information to the rest of the components.
2. Zone II: Dynamic Processes – Changes of elements in this area have an important
influence on the system; the information exchange is strong on both sides.
3. Zone III: Impulsive Processes – Elements in this area have a small influence on the
system but are strongly influenced by other system changes.
4. Zone IV: Low Impact Processes – Elements in this area have a small influence on the
system and are poorly influenced by other system changes.
5. Zone V: Neutral Processes – Elements in this area find themselves at the intersection
with other domains; neutral means safe from unexpected effects.

48
Fig. 5.7 Cross Impact Matrix example (based on Phleps 2009)
Fig. 5.8 Cross Impact Diagram (based on Phleps 2009)
Based on the DSM, the following results for the parameters describing the diagram were
obtained through EXCEL calculation (see Table 5.5):
Table 5.5 Results for the parameters describing the Cross-Impact diagram
Partitioned DSM Activity Pasivity
Sum 5271 5271
Mean Value 36.86 36.86
Standard Deviation 40.067 19.147
Minimum 0 0
Maximum 142 85
Due to the large number of processes the diagram is not easy to interpret. However ‘clouds’ of
processes can be identified. The diagram is shown in Figure 5.9 and an overview of the results
in Table 5.6.

49
Fig. 5.9 The Cross-Impact Diagram based on the DSM
Table 5.6 Selected processes for each zone of influence
Zone I (2) Assign Offer Leader (126) Receive approval for major changes (9) Conceive preliminary solutions for discussing it with the customer (based on the first meeting) (10) Create preliminary representation of the solutions found (12) Identify required resources (based on the first meeting) (14) Make feasibility studies (16) Get signed agreement
Zone II (94) Validate design concept (87) Define work procedures for quality assurance (79) Define tasks (definition phase) (93) Identify feasible choice (when it comes to interferences) (design phase) (73) Conceive preliminary models(concept phase) (61) Identify certification basis (concept phase) (54) Plan the design and engineering process
Zone III (137) Analyze overall functioning of the DO (133) Register Lessons Learned (75) Verify the fulfillment of the customer request (139) Propose optimized solutions (for the functioning of DO) (143) Prepare updated procedures for the functioning of the DO (138) Detect points of improvement (of the DO) (119) Send documentation to EASA (to get approval)
Zone IV (27) Make adjustments of the DTS after confronting it with CR
Zone V (17) Write DTS (18) Estimate the size of the work package (24) Make estimations regarding design effort (30) Perform aircraft inspection (31) Write document describing diagnosis (32) Identify the technical fields involved in the design process (concept phase) (62) Analyze certification requirements (concept phase)

50
Processes in zone I, like feasibility studies or getting the signed agreement, strongly influence
the rest of the processes: unless the contract is signed and the technical proposal accepted, the
rest of the processes are not run anymore.
Processes in zone II, like validating the design concept or identifying the certification basis,
are very important for the functioning of the system and require a lot of information from the
rest of the processes.
Processes in zone III, like proposing solutions for an optimized functioning are processes
which require a lot of feedback information from the rest of the processes, while their
influence may be important in the future, and not for the respective project / iteration.
Processes in zone IV, like adjusting a document, once new information is available, have a
low impact on the system.
Processes in zone V, like estimating the size of the work package and design effort, are in the
neutral zone. They are important for the system, but the results are rather expected.

51
6 Conclusions and Outlook
The necessity of optimizing the engineering processes is a key factor in the aeronautical
industry. In Europe many subcontracting companies depend on a large aircraft manufacturer.
In their attempt to gain more freedom, a growth in their capability is demanded.
This report showed how a simple matrix approach can aid this process. The optimization was
performed on a high number of processes, which made the implementation of the algorithms
rather difficult. The larger the design structure matrix, the more complex its preparation for
optimization (i..e. setting the relations between the processes).
The analyses performed on the detailed DSM were:
- The partitioning algorithm, delivered the optimal sequence of the basic processes inside the
completion center. This algorithm had as an objective minimizing the feedback information.
However, due to the high number of processes, the partitioning algorithm had to be run
several times, and the results may still be locally invalid. Another point which influences the
accuracy of the results is the fact that these processes are rather general processes; most of
them can be further divided into sub-processes / subtasks. In this case an overall analysis with
DSM would be impossible due to the large number of relations which need to be established.
In this case the matrix would be too large, and the automation of the relations input is not
possible. It makes more sense to conduct such an analysis on smaller DSMs characterizing a
smaller subsystem, comprising of one or several phases.
- The eigenstructure analysis, based on the WTM extracted from DSM, started with the idea
of finding similarities between the functioning of an engineering system and the dynamic
behavior of an aircraft. The way such a system oscillates is similar with the ‘oscillations’
inside a design organization, when rework is required. The results underlined those processes
with the largest eigenvalues, i.e. with the greatest influence on the engineering system. This
analysis can be further extended if for each process the rework load is fractionally expressed.
This type of analysis on WTM is especially suitable for reconversion tasks, as it allows the
estimation of how much work is required for the rest of the cabin items if one item is being
replaced / reconverted. It also allows the calculation of the total time or the partial times for
performing the cabin conversions.
- The cross impact diagram delivered groups of processes belonging to five spheres: reactive,
dynamic, impulsive, low impact and neutral. Indeed the process chain assumes tasks which
are vital for the entire chain as well as tasks which do not have an important influence on the
system. The results are plausible. They could be however used on smaller DSMs in order to
identify especially those tasks which poorly influence the system. Such tasks may be further
coupled or ignored.

52
List of References AP 1500 AIRBUS PROCEDURE: AP1500 – General Requirements for
Engineering Design Suppliers (GREDS), 2005
Bartolomei 2008 BARTOLOMEI, J; COKUS, M.; DAHLGREN, J.; DE NEUFVILLE, R.;
MALDONADO, D; WILDS, J.: Analysis and Application of Design
Structure Matrix, Domain Mapping Matrix and Engineering System
Matrix Frameworks. Massachusetts Institute of Technology,
Engineering Systems Division, 2008.
Bartolomei 2009 BARTOLOMEI, J; SILBEY, S; HASTINGS, D; DE NEUFVILLE, R and
Rhodes, H.: Bridging the Unspannable Chasm : Qualitative
Knowledge Construction for Engineering Systems. In: Second
International Symposium on Engineering Systems, MIT, (Cambridge,
Massachusetts, June 15-17, 2009)
Bichlmaier 1999 BICHLMAIER, Christoph; GRUNWALD, Stefan: PMM – Process Module
Methodology for Integrated Design and Assembly Planning. In:
Proceedings of the 4th
Design for Manufacturing Conference, Las
Vegas, Nevada, 12-15 September 1999. – URL:
http://cadcam.yonsei.ac.kr/abstract_system/200301_processplan_pdf/p
pm.pdf
Browning 2001 BROWNING, T.: Applying the Design Structure Matrix to System
Decomposition and Integration Problems : A Review and New
Directions. In: IEEE Transactions on Engineering Management, Vol.
48, No. 3, August 2001
CAMR 2009 NAGALINGAM, Sev: A Guide to Introducing Concurrent Engineering
in your Organisation. – Based on research conducted at the Centre for
Advanced Manufacturing Research (CAMR), of the University of
South Australia. URL:http://www.smartlink.net.au/library/concurrent.
pdf (2009-06-22)
Chanas 2001 CHANAS, Stefan; ZIELI, Pawelinsky: Critical Path Analysis in the
Network with Fuzzy Activity Times. In: Fuzzy Sets and Systems, 122
(2001), pp. 195–204. – ISSN: 0165-0114, URL:
http://citeseerx.ist.psu.edu/ viewdoc/download?doi=10.1.1.97.997&re
p=rep1& type=pdf (2009-06-22)

53
Danilovic 2007 DANILOVIC, M; BROWNING, T.: Managing Complex Product
Development Projects with Design Structure Matrices and Domain
Mapping Matrices. In: International Journal of Project Management,
25 (2007), pp. 300-314
DLR 2009 URL: http://www.dlr.de/irs/en/desktopdefault.aspx/tabid-4392/7172_
read-10767 (2009-06-22)
DSM 2009 URL: http://dsmweb.org/ (2009-07-02). – DSM dedicated website,
maintained by the Institute of Product Development, at the Technical
University München
EASA 2009a EUROPEAN AVIATION SAFETY AGENCY: Commission Regulation (EC)
No 1702/2003, Annex Part 21, September 2003. – URL: http://eur-
lex.europa.eu/LexUriServ/site/en/oj/2003/l_243/l_24320030927en000
60079.pdf (2009-02-17)
EASA 2009b EUROPEAN AVIATION SAFETY AGENCY: Acceptable Means of
Compliance and Guidance Material to Part 21, 2003. – URL:
http://easa.eu.int/ws_prod/g/doc/Agency_Mesures/Certification_Spec/
decision_ED_2003_01_RM.pdf (2009-07-08)
EASA 2009c EUROPEAN AVIATION SAFETY AGENCY: URL: http://www.easa.eu.int
/ws_prod/g/g_faq_main.php. – referring to FAQ (2009-02-17)
Eppinger 2002 EPPINGER, D. Steven: Managing Complex System Development
Projects, 2002. – URL: http://mit.edu/eppinger/www/abstracts.html
(2009-06-22)
ESA 2009 URL: http://www.esa.int/SPECIALS/CDF/index.html (2009-06-22)
König 2008 KÖNIG, Carsten; KREIMEYER, Matthias; BRAUN, Thomas: Multiple-
Domain Matrix as a Framework for Ssystematic Process Analysis. In:
10th
International Design Structure Matrix Conference, DSM’08,
(Stockholm, Sweden, 11-12 November 2008), München : Hanser, pp.
231–244. – ISBN: 978-3-446-41825-7
Mayer 1995 MAYER, J. Richard; MENZEL, P. Christopher; PAINTER, K. Michael;
DEWITTE, S. Paula; BLINN, Thomas; PERAKATH, Benjamin;
Knowledge Based Systems, Logistics Research Division: Information
for Concurrent Engineering (IICE): IDEF 3 Process Description
Capture Method Report. Texas : Knowledge Based Systems, 1995. –

54
1500 University Drive East College Station, Texas 77840-2335.
Interim Technical Report for Period April 1992 - September 1995
Nam Pyo Suh 2001 NAM PYO SUH: Axiomatic Design –Advances and Applications. New
York : Oxford University Press, 2001.
Niţă 2010a NIŢĂ, Mihaela; SCHOLZ, Dieter: Business Opportunities in Aircraft
Cabin Conversion and Refurbishing. In: CURRAN, Richard (Ed.):
ATOS 2010 Book of Abstracts (1st International Air Transport and
Operations Symposium, TU Delft, 14-15 April 2010). Amsterdam :
IOS Press, 2010, p. 34. - ISBN: 978-90-5623-082-1. Paper No 2010-
331. Full paper download: http://CARISMA.ProfScholz.de
Niţă 2010b NIŢĂ, M.; SCHOLZ, D.: From Preliminary Aircraft Cabin Design to
Cabin Optimization. In: German Aerospace Congress 2010 (DLRK
2010, 31.08-02.09 2010, Hamburg)
Noran 2009 NORAN, Ovidiu: Business Modeling : UML vs. IDEF, Griffith
University, School of Computing and Information Technology. –
URL: http://www.cit.gu.edu.au/~no ran/Docs/UMLvsIDEF.pdf (2009-
06-21)
Phleps 2009 PHLEPS, P.: Szenariostudie im Rahmen des Spitzencluster
Leuchtturmprojektes „Effizienter Flughafen“ : Workshop
presentation, 14-15 October 2009
Pimmler 1994 PIMMLER, T; EPPINGER, S.: Integration Analysis of Product
Decomposition. In: ASME : Design Theory and Methodology
Conference (Minneapolis MN, September 1994)
Reis 2010 REIS, G.: Systems Architectural Development : A New Paradigm for
Early-Stage Design. Atlanta : PACE America Inc., 2010. – URL:
http://www.pace.de (2010-03-03)
Russell 2003 RUSSELL, S; NORVIG, P.: Artificial Intelligence : A Modern Approach.
New Jersey : Prentice Hall, 2003.
Schlick 2008 SCHLICK, M. Christopher; DUCKWITZ, Sönke; GÄRTNER, Thomas,
SCHMIDT, Thomas: A Complexity Measure for Concurrent
Engineering Projects Based on the DSM. In: 10th
International Design
Structure Matrix Conference, DSM’08, (Stockholm, Sweden, 11-12

55
November 2008), München : Hanser, pp. 219–230. – ISBN: 978-3-
446-41825-7
Simpson 2004 SIMPSON, C. Richard; NASA, Johnson Space Center: An XML
Representation for Crew Procedures, 2004
Smith 2007 SMITH, R; EPPINGER, S.: Identifying Controlling Features of
Engineering Design Iteration. In: Management Science, Vol. 43
(March, 1997), No. 3, pp. 276-293
Sobieski 1989 SOBIESZCZANSKY-SOBIESKI, Jaroslaw: Multidisciplinary Optimization
for Engineering Systms : Achievements and Potential. In:
Optimization: Methods and applications, possibilities and limitations :
Proceedings of the International Seminar (Bonn, Federal Republic of
Germany, June 7-8, 1989). Berlin and New York : Springer, 1989, pp.
42-62
Steward 1991 STEWARD, D.: Planning and Managing the Design of Systems. In:
KOCAOGLU, F. Dundar; NIWA, Kiyoshi: Technology Management :
The new International Language (PICMET '91 - Proceedings of
Portland International Conference on Management of Engineering
and Technology Portland Oregon USA 1991). Portland, 1991, pp.
189-193. - ISBN: 0-7803-0161-7
Szasz 2009 SZASZ, B.: Cabin Refurbishing Supported by Knowledge Based
Engineering Software. Hamburg University of Applied Sciences,
Master Thesis 2009
Van der Aalst 2009 VAN DER AALST, M. P. Wil: Patterns and XPDL: A Critical Evaluation
of the XML Process Definition Language. – Department of
Technology Management Eindhoven University of Technology, The
Netherlands. URL: http://is.tm.tue.nl/research/patterns/download/ce-
xpdl.pdf (2009-06-21)
Zhong 2009 ZHONG, Peisi; SONG, Jiandong; LU, Mei: DSM Based Process
Analysis for Concurrent Product Development and Its
Implementation. Advanced Manufacturing Technology Center,
Shandong University of Science and Technology, Qingdao, P.R.
China. – Digital Library of URL: http://dsmweb.org (2009-06-21)

56
Appendix A
Example of a Conversion Scenario and Required
Input Information
A.1 Description
The cabin modification example consists of the installation of the Enhanced Cabin, aimed to
provide a better appearance and improved comfort for passengers. The following subtasks are
included:
• the installation of the enhanced CIDS;
• the installation of changes with respect to cabin interior:
� ceiling panel,
� overhead stowage compartment including boxes, doors and grip rails,
� seat row numbering,
� cove light panel,
� side wall lining;
• the installation of changes with respect to the IFE system
A.2 Delivery Milestones Plan
Table A.1 Delivery Milestone Plan for the selected conversion example
Milestone Due Date Deliverable
Z00 06.03.2009 Kick Off Meeting
Z01 12.03.2009 LLT ATA 25
Z02 31.03.2009 Drawing Set 1: Partition installation Seat installation Hatrack box and Hatrack door EFPMS Sidewall lining Griprails InstallationEquipment 80VU CIDS equipment inst. and CIDS cable routing, each 25%
Z03 21.04.2009 Drawing Set 2: NTF Endpanels Emergency Exit Jointstrip Seat Track cover Doorframe lining Cove light panels Ancillery parts

57
Door frame 4 – insulation VCC-inst. Monitor-inst. CIDS equipment inst. and CIDS cable routing, each 25%
Z04 06.05.2009 Drawing Set 3: PSU PSU new air outlets Ceiling Curtain rail Ceiling F14-F21 FAP-cover Hatrack connection parts Ceiling F65-F68 2000VU mod. to 115VC Adaption of available VCC inst. Inst. of Wiring for 2000VU, 80VU - LHS Hatrack CIDS equipment inst. and CIDS cable routing, each 25%
Z05 06.05.2009 LLT ATA 23
Z06 27.05.2009 Drawing Set 4: Emerg. Equipment Emerg. Equipment brackets Cabin placards P-Loc status3 Sys. prov. For PRAM in IFE, video, audio incl. routing Wiring prov. between 1st LH-Hatrack,2000VU and 80VU CIDS equipment inst. and CIDS cable routing. each 25%
Z07 10.06.2009 Drawing Set: Top drawing
Recap Recap Meeting after Drawing Completion
Z08 Working Party Support for S/C drawing set
Recap Recap Meeting after Working Party
A.3 Mechanical Refurbishing Tasks
Table A.2 Description of mechanical tasks, required input data, difficulties encountered when the
data would be missing, alternatives to unavailable data and feasibility of the task
EC
Input data Difficulties Alternatives Feasibility
Seat
Insta
llati
on
Fuselage contour.
Monuments: location,
dimensions.
Seats: documents
from seat
manufacturer
(dimensions).
Seat rails: location,
type.
Getting data from seat
and monuments
manufacturer.
Determining the
dimensions and position
of the monuments,
without the original
layout: e.g. location of the
reference point.
Direct measurements.
Additional data from seat
manufacturer.
Photographs (with
dimensions).
Data from monuments
manufacturers.
+ +

58
Seat
track
co
ver
Monuments: location,
dimensions.
Seats layout.
Information about the
seat track covers.
There are three types of
seat track covers used by
Airbus; if there is no other
manufacturer, these parts
must be ordered from
Airbus; a new design
involves having DOA.
Direct measurements.
Photographs (with
dimensions).
Data from monuments
manufacturers.
Data from seat track cover
manufacturer (if there is
one different than Airbus).
– + E
FP
MS
Monuments: location,
dimensions.
Seats layout.
Seat rail position.
Path Marking
manufacturer info
(e.g. Lufthansa
produces non-
electrical EFPMS).
For electrical EFPMS the
complexity of this task is
greater, as electrical
connection possibilities
must be investigated.
Getting the correct
dimensions and positions.
Direct measurements.
Photographs (with
dimensions).
+ –
Sid
ew
all
pan
el
Sid
ew
all
em
erg
en
cy e
xit
C
ove lig
ht
pan
el
Fuselage contour.
Lining contour.
Location and
dimensions of seats
and monuments.
Information about
brackets.
It is impossible to
reproduce the same type
of lining without the
original drawings.
A new design, in
accordance with the
airline requirements can
only be achieved under
DOA.
Buying the parts from Diehl
(small chance of
happening).
Self measuring.
Self (new) designing – only
under DOA.
– –
Ceilin
g
Fuselage contour
(does not depend on
the position of the
monuments).
Information about
brackets.
Information about
electrical connection
possibilities (e.g.
EXIT sign).
It is impossible to
reproduce the same type
of ceiling without the
original drawings.
A new design, in
accordance with the
airline requirements can
only be achieved under
DOA.
Buying the parts from Diehl
(small chance of
happening).
Self measuring.
Self (new) designing – only
under DOA.
– –
Do
or
fram
e lin
ing
Fuselage contour.
Lining contour.
Location and
dimensions of seats
and monuments.
Information about
brackets.
It is impossible to
reproduce the same type
of ceiling without the
original drawings.
A new design, in
accordance with the
airline requirements can
only be achieved under
DOA.
Buying the parts from Diehl
(small chance of
happening).
Self measuring.
Self (new) designing – only
under DOA.
– –

59
Hatr
ac
k b
in
Monuments:
dimensions, location.
Seats: dimensions,
position.
Fuselage contour.
Fuselage frames.
There are only special
connection points where
the hatracks can be
mounted on the fuselage
frames – this would
require aircraft
manufacturer drawings,
but company could
handle this based on
experience.
Information can be made
available by the hatrack bin
manufacturer – for SA:
Fischer.
Usually a retrofit project
implies the replacement or
adaptation of one of the
hatracks.
+ – H
atr
ac
k d
oo
r, g
rip
ra
ils
, co
vers
Monuments:
dimensions and
location.
Data from hatrack
doors manufacturer.
Data about the
hatrack bins.
The current hatracks,
rails and doors come
from Diehl (doughter of
Airbus – small chance of
getting information). The
new hatracks and hatrack
related parts are
produced by Fischer.
Direct measuring.
Photographs (with
dimensions).
+ –
Hatr
ac
k c
on
ne
cti
on
part
s
Monuments: position
and dimensions.
Seats layout.
Fuselage structure
layout – the position
of the frames.
The hatracks are
connected to the
structure, therefore
information must be
made available for the
area belonging to the
fuselage frames; the
location of these frames
must be known.
Hatrack manufacturer may
provide information about
the fuselage frames.
Aircraft inspection.
Direct measuring.
+ –
Cu
rtain
an
d c
urt
ain
ra
il
Monuments: position
and dimensions.
Seats layout.
If there are already
connection holes in the
monuments, their position
must be known.
Aircraft inspection.
Direct measuring.
Photographs (with
dimensions).
+ +
Em
erg
en
cy e
qu
ipm
en
t, E
merg
en
cy
bra
ck
ets
ER layout from the
Airline.
The quantity and
location according to
the legislation.
Data about the
dimensions of the ER
equipment from the
manufacturer.
The hatrack layout
and dimensions.
The flight attendant
seat layout and type.
The ER equipment must
be secured through
brackets within the
hatrack, under the seat of
the flight attendants, or
within other monuments
(e.g. dog house); the
layout of these
monuments along with
the dimensions of the
equipment must be
known.
Airbus produces part of
the ER equipment.
Aircraft inspection.
Direct measuring.
Information from the ER
equipment manufacturer.
+ –

60
An
cilla
ry p
art
s
They refer to: baby
basinets, literature
pockets, or magazine
racks.
Monuments layout:
position and
dimensions.
Seats layout
Data from the
ancillary parts
manufacturer:
dimensions.
Getting the monuments
and seats layout.
Aircraft inspection.
Direct measuring.
Photographs (with
dimensions).
+ + P
lac
ard
s c
ab
in,
se
at
row
nu
mb
eri
ng
, E
R,
do
ors
ER layout.
Monuments: position
and dimensions.
Inner layout of the
monuments.
Number of seats.
The placards are
produced usually
produced by the aircraft
manufacturer (e.g.
Airbus); either the airline
or the DO must choose
from the catalogue, and
buy them accordingly.
Aircraft inspection.
Direct measuring.
For new monuments, the
inner layout can be
obtained from the
monuments manufacturer.
+ +
NT
F (
No
n T
exti
le F
loo
r) Fuselage contour.
Monuments layout.
Location of floor
connectors for
monuments.
Flight attendants seat
layout and seat type
(connected on the
floor or not).
The NTF is required in
the area near the doors
and monuments and
under the galley (the
lavatory has its own NTF)
Getting the exact cabin
layout in this area, as well
as the exact galley
specification.
Aircraft inspection.
Direct measuring.
Information from galley
manufacturer.
+ –
Jo
int
str
ip
Position of the
curtains.
Floor layout and floor
type.
The joint strips connect
the NTF and the textile
covering. The floor is part
of the primary structure,
therefore information
about the floor can only
be obtained from the
aircraft manufacturer.
If the floor is from CFK,
one cannot make holes in
it, and it must be ordered
from aircraft manufacturer
If the floor is not from CFK,
aircraft inspection my be
enough to find out if there
are available holes; if not,
such a design modification
must be certified under
DOA.
+ –
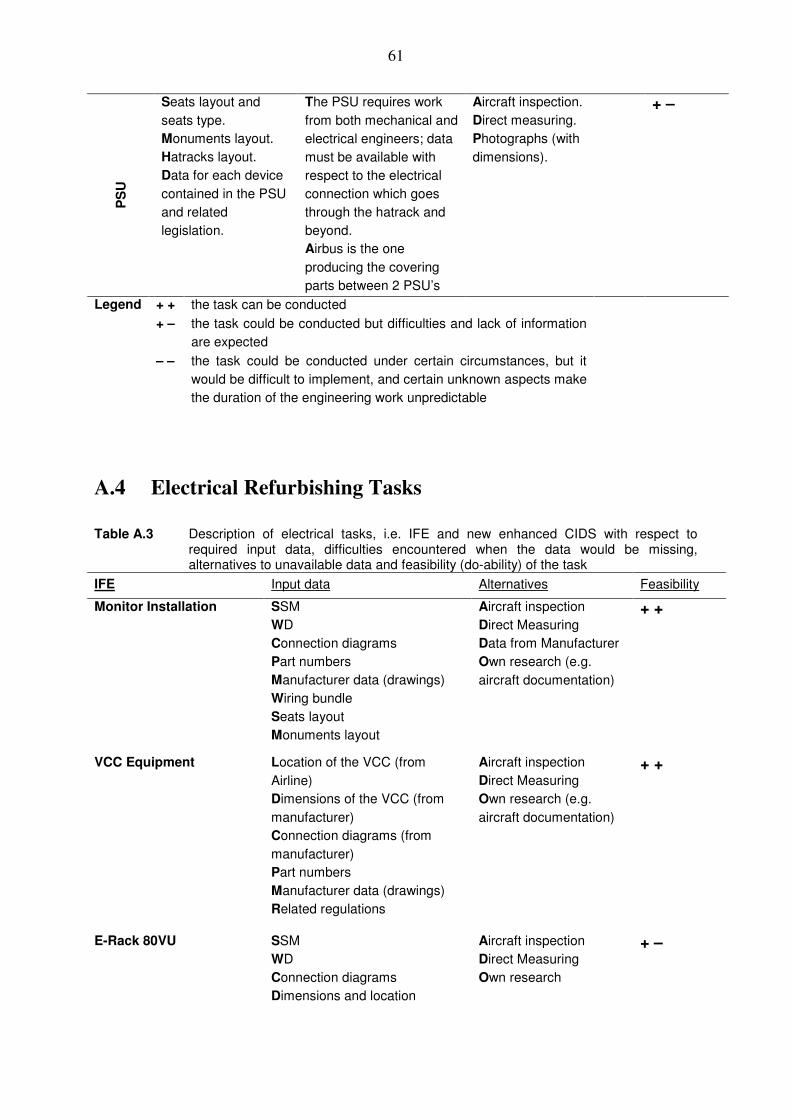
61
PS
U
Seats layout and
seats type.
Monuments layout.
Hatracks layout.
Data for each device
contained in the PSU
and related
legislation.
The PSU requires work
from both mechanical and
electrical engineers; data
must be available with
respect to the electrical
connection which goes
through the hatrack and
beyond.
Airbus is the one
producing the covering
parts between 2 PSU’s
Aircraft inspection.
Direct measuring.
Photographs (with
dimensions).
+ –
Legend + + the task can be conducted
+ – the task could be conducted but difficulties and lack of information
are expected
– – the task could be conducted under certain circumstances, but it
would be difficult to implement, and certain unknown aspects make
the duration of the engineering work unpredictable
A.4 Electrical Refurbishing Tasks
Table A.3 Description of electrical tasks, i.e. IFE and new enhanced CIDS with respect to
required input data, difficulties encountered when the data would be missing, alternatives to unavailable data and feasibility (do-ability) of the task
IFE Input data Alternatives Feasibility
Monitor Installation SSM
WD
Connection diagrams
Part numbers
Manufacturer data (drawings)
Wiring bundle
Seats layout
Monuments layout
Aircraft inspection
Direct Measuring
Data from Manufacturer
Own research (e.g.
aircraft documentation)
+ +
VCC Equipment Location of the VCC (from
Airline)
Dimensions of the VCC (from
manufacturer)
Connection diagrams (from
manufacturer)
Part numbers
Manufacturer data (drawings)
Related regulations
Aircraft inspection
Direct Measuring
Own research (e.g.
aircraft documentation)
+ +
E-Rack 80VU SSM
WD
Connection diagrams
Dimensions and location
Aircraft inspection
Direct Measuring
Own research
+ –

62
Circuit breaker panels
2000VU
PD
WD
Connection diagrams
Dimensions and location
Aircraft inspection
Direct Measuring
Own research
+ –
New enhanced CIDS Input data Alternatives Feasibility
Cable routing Original cable routing
SSM
WD
List of harnesses
Hook-up List
Aircraft inspection
Direct Measuring
Own research and
experience
+ –
– –
Depends on
the size of
the change
Equipment installation &
Bracket installations
SSM
WD
Equipment related data (from
manufacturer)
Bracket related data (from
manufacturer)
Aircraft inspection
Direct Measuring
Own research and
experience
Data from equipment
manufacturer
+ –
DEU + +
FAP, AAP, AIP
installation
+ +
Smoke detection + +
Ballast Units + +
EPSU + +
Exit light lens + +
Pin programming – –
C/B – –
Legend + + the task can be conducted
+ – the task could be conducted but difficulties and lack of information
are expected
– – the task could be conducted under certain circumstances, but it
would be difficult to implement, and certain unknown aspects make
the duration of the engineering work unpredictable
A.5 Conclusions
Mechanical Tasks:
• A feasible alternative for missing information is always inspecting the aircraft,
measuring and making photographs. Observations / difficulties with this concern:
� The first condition in this case is to have the aircraft available enough time
for the inspection.
� It may be the case that the aircraft is not available for inspection – in this
case a solution must be found together with the airline, depending on the

63
complexity of the refurbishing – they may have an aircraft with a similar
layout standing on ground.
� This is rather the Lufthansa Technik way – they have aircraft available.
� If the airlines are not willing to set an aircraft inspection date, another
possibility is to seek the agreement either with completion centers like
Lufthansa Technik, or with aircraft disposal companies.
� When measurements in front and in the rear of the fuselage are required, a
systematic method (like in FEM) must be applied and enough measuring
points must be selected, in order to get to the required measuring tolerance.
� A problem in measuring is defining the ‘point zero’, which must be constant
along the entire project; the flexibility exist to choose a different point for
each case/aircraft.
• The cabin layout – position and dimensions of seats, monuments and hatracks along with
the fuselage contour is almost for all refurbishing scenarios required. When measuring all
the dimensions and rebuilding this layout, the question arises: how exact are the
measurements, how big the tolerances should be. The answer may come only from
practice, and experience will play a major role.
• Depending on the type of the refurbishing/upgrade/modification, specific information is
required. Usually several small tasks within the same project are related and require the
same type of information: e.g. when a hatrack bin requires a modification, this must be
done according to the seats and monuments layout; once these layouts are known, they
may be used for instance also for the carpet installation. Therefore, the same information
(seats, monuments layout) may be used several times – the effort for gathering it must be
efficiently managed, in accordance with (as far as possible) its plural utility.
• The long term advantage of this approach – rebuilding the designs based on aircraft
inspection – is that an own database will be formed and used as a knowledge base.
• Several items are either very difficult or impossible to measure – e.g. lateral covering
(lining). The alternative is to measure only basic dimensions and to redesign the hole
lining again, in accordance with the airline wishes. A small lining modification would not
be possible, but to redesign it and to produce a new concept is possible. However, this is
achievable only under DOA.
• DOA gives enough flexibility to cover, theoretically, the missing parts of measuring and
inspecting, by creating new designs. This involves certification activities (granted in any
case by a DO approval). Another issue is the production of these new designs. The
engineering company may consider getting a POA (Production Organization Approval) as
well.
Electrical Tasks:
The tasks involving electrical engineering are challenged by the complexity of the wiring
network of an aircraft, particularly due to the fact that these networks may vary from one
aircraft to another of its kind. Basically the input information, always required when it comes
to refurbishing electrical devices, is (Michalke 2009a):

64
• A general understanding of the electrical wiring of the entire aircraft/the system involved
in the refurbishing, by means of Principle Diagrams (PD).
• Additionally basic information provided by Wiring Diagrams (WD), which contain the
description of the circuits as well as their identification placards.
• Connection diagrams, in order to understand the functioning of the system.
When it comes to installing new electrical devices, a very good source of information is the
manufacturer of the respective device, who provides information with respect to the electrical
connections, necessary source of power, and may also have additional information about the
wiring network of the respective system in the aircraft.
Very useful in understanding the overall functioning of the electrical systems are the Wiring
Diagram Manual (WDM) and the System Schematic Manual (SSM).
Table A.3 summarizes, for this example, the items which needed electrical engineering
processing, the input information required for each item, as well as the conclusion towards the
feasibility of the respective item modification. The data was gathered with the aid of
Michalke 2009a and Michalke 2009b.
Difficulties:
• A long inspection time would be required for understanding the system, the connection
possibilities, as well as the implications of each change.
• Most of the equipments are produced by aircraft manufacturers (e.g. Airbus) or aircraft
manufacturer partners and their information is required
• If a new equipment is installed (especially for CIDS, e.g. a new smoke detector), it must
be verified that the respective equipment can function inside the system, as part of a
whole.
• The complexity of an ‘aircraft manufacturer independent’ task (with electrical
implications) is rather unpredictable, as unexpected problems may occur during the
conversion processing, which otherwise might have been easily solved with OEM input.
A prediction of the duration for the conversion scenario under these circumstances is
difficult to make. This would be unacceptable in practice, however the company would
grow in experience and the duration would decrease in time.