The Power of Biomass: Experts Disclose the Potential for Success of Bioenergy Technologies
21
The power of biomass: Experts disclose the potential for success of bioenergy technologies Giulia Fiorese a,b,n , Michela Catenacci a , Valentina Bosetti a,c , Elena Verdolini a,c a FEEM—Fondazione Eni Enrico Mattei, Corso Magenta 63, 20123 Milano, Italy b European Commission, Joint Research Centre, Institute for Environment and Sustainability, Via E. Fermi 2749, I-21027 Ispra, VA, Italy c CMCC—Centro Euro-Mediterraneo per i Cambiamenti Climatici, Lecce, Italy HIGHLIGHTS We collect novel evidence on bioenergy technologies for the production of electricity. Applied research and demonstration are key areas of funding. Without climate policy, by 2030 bioenergy will unlikely be cost-competitive. Europe will first achieve a breakthrough in production costs. A high contribution of biomass to the production of electricity is very unlikely. article info Article history: Received 22 May 2013 Received in revised form 12 September 2013 Accepted 6 October 2013 Available online 8 November 2013 Keywords: Expert elicitation Research, development and demonstration Bioenergy abstract This paper focuses on technologies which use thermo-chemical or biochemical processes to convert biomass into electricity. We present the results from an expert elicitation exercise involving sixteen leading experts coming from different EU Member States. Aim of the elicitation was to assess the potential cost reduction of RD&D (research, development and demonstration) efforts and to identify barriers to the diffusion of these technologies. The research sheds light on the future potential of bioenergy technologies both in OECD (Organisation for Economic Co-operation and Development) and non-OECD countries. The results we present are an important input both for the integrated assessment modeling community and for policy makers who draft public RD&D strategies. & 2013 Elsevier Ltd. All rights reserved. 1. Introduction Biomass is the biodegradable fraction of products, wastes or residues from agriculture, forestry, industry or households (Angelis-Dimakis et al., 2011). Biomass is a well-known and widely used renewable source of energy since it can be used to produce electricity, heat, but also liquid and gaseous fuels (McKendry, 2002a). Furthermore, biomass can be stored and energy can be produced on demand, contrary to other renewable sources of energy such as solar and wind, which are characterized by intermittency. Biomass energy plays a crucial role in climate change mitiga- tion as emphasized in the IPCC Special Report on Renewable Energy Sources: relying more heavily on certain technological options such as perennial cropping systems, the use of biomass residues and wastes and advanced conversion systems could reduce emissions by 80 to 90% compared to the fossil energy baseline scenario (Chum et al., 2011). This paper focuses on bioenergy technologies that convert biomass into electricity via thermochemical or biochemical con- version paths. Given the relevance of these technologies, we assess their potential and future costs. The production of liquid biofuels for the transport sector has been the object of a separate investigation (Fiorese et al., 2013). For bioenergy to play a significant role in the coming decades, several issues must be addressed. First, biomass resources are scarce. Their widespread use could lead to high demand for feedstock and raise concerns with respect to the social and environmental sustainability of its supply, the potential competi- tion for land with food production (Dornburg et al., 2008; Tilman et al., 2009), the threat for biodiversity and soil fertility (Lal, 2005), and the consequences on forests’ carbon sinks (Böttcher et al., 2012). Recent research shows that land use and land cover changes driven by biomass production for energy purposes may negatively impact the life cycle GHG emissions balance (Agostini et al., 2013; Contents lists available at ScienceDirect journal homepage: www.elsevier.com/locate/enpol Energy Policy 0301-4215/$ - see front matter & 2013 Elsevier Ltd. All rights reserved. http://dx.doi.org/10.1016/j.enpol.2013.10.015 n Corresponding author at: European Commission, Joint Research Centre, Institute for Environment and Sustainability, Via Enrico Fermi 2749, I-21027 Ispra, VA, Italy. Tel.: þ39 332 786280; fax: þ39 2 5203 36946. E-mail addresses: giulia.fi[email protected] (G. Fiorese), [email protected] (M. Catenacci), [email protected] (V. Bosetti), [email protected] (E. Verdolini). Energy Policy 65 (2014) 94–114
-
Upload
independent -
Category
Documents
-
view
1 -
download
0
Transcript of The Power of Biomass: Experts Disclose the Potential for Success of Bioenergy Technologies
The power of biomass: Experts disclose the potential for successof bioenergy technologies
Giulia Fiorese a,b,n, Michela Catenacci a, Valentina Bosetti a,c, Elena Verdolini a,c
a FEEM—Fondazione Eni Enrico Mattei, Corso Magenta 63, 20123 Milano, Italyb European Commission, Joint Research Centre, Institute for Environment and Sustainability, Via E. Fermi 2749, I-21027 Ispra, VA, Italyc CMCC—Centro Euro-Mediterraneo per i Cambiamenti Climatici, Lecce, Italy
H I G H L I G H T S
� We collect novel evidence on bioenergy technologies for the production of electricity.� Applied research and demonstration are key areas of funding.� Without climate policy, by 2030 bioenergy will unlikely be cost-competitive.� Europe will first achieve a breakthrough in production costs.� A high contribution of biomass to the production of electricity is very unlikely.
a r t i c l e i n f o
Article history:Received 22 May 2013Received in revised form12 September 2013Accepted 6 October 2013Available online 8 November 2013
Keywords:Expert elicitationResearch, development and demonstrationBioenergy
a b s t r a c t
This paper focuses on technologies which use thermo-chemical or biochemical processes to convertbiomass into electricity. We present the results from an expert elicitation exercise involving sixteenleading experts coming from different EU Member States. Aim of the elicitation was to assess thepotential cost reduction of RD&D (research, development and demonstration) efforts and to identifybarriers to the diffusion of these technologies. The research sheds light on the future potential ofbioenergy technologies both in OECD (Organisation for Economic Co-operation and Development) andnon-OECD countries. The results we present are an important input both for the integrated assessmentmodeling community and for policy makers who draft public RD&D strategies.
& 2013 Elsevier Ltd. All rights reserved.
1. Introduction
Biomass is the biodegradable fraction of products, wastes orresidues from agriculture, forestry, industry or households(Angelis-Dimakis et al., 2011). Biomass is a well-known and widelyused renewable source of energy since it can be used to produceelectricity, heat, but also liquid and gaseous fuels (McKendry,2002a). Furthermore, biomass can be stored and energy can beproduced on demand, contrary to other renewable sources ofenergy such as solar and wind, which are characterized byintermittency.
Biomass energy plays a crucial role in climate change mitiga-tion as emphasized in the IPCC Special Report on RenewableEnergy Sources: relying more heavily on certain technological
options such as perennial cropping systems, the use of biomassresidues and wastes and advanced conversion systems couldreduce emissions by 80 to 90% compared to the fossil energybaseline scenario (Chum et al., 2011).
This paper focuses on bioenergy technologies that convertbiomass into electricity via thermochemical or biochemical con-version paths. Given the relevance of these technologies, we assesstheir potential and future costs. The production of liquid biofuelsfor the transport sector has been the object of a separateinvestigation (Fiorese et al., 2013).
For bioenergy to play a significant role in the coming decades,several issues must be addressed. First, biomass resources arescarce. Their widespread use could lead to high demand forfeedstock and raise concerns with respect to the social andenvironmental sustainability of its supply, the potential competi-tion for land with food production (Dornburg et al., 2008; Tilmanet al., 2009), the threat for biodiversity and soil fertility (Lal, 2005),and the consequences on forests’ carbon sinks (Böttcher et al.,2012). Recent research shows that land use and land cover changesdriven by biomass production for energy purposes may negativelyimpact the life cycle GHG emissions balance (Agostini et al., 2013;
Contents lists available at ScienceDirect
journal homepage: www.elsevier.com/locate/enpol
Energy Policy
0301-4215/$ - see front matter & 2013 Elsevier Ltd. All rights reserved.http://dx.doi.org/10.1016/j.enpol.2013.10.015
n Corresponding author at: European Commission, Joint Research Centre,Institute for Environment and Sustainability, Via Enrico Fermi 2749, I-21027 Ispra,VA, Italy. Tel.: þ39 332 786280; fax: þ39 2 5203 36946.
E-mail addresses: [email protected] (G. Fiorese),[email protected] (M. Catenacci), [email protected] (V. Bosetti),[email protected] (E. Verdolini).
Energy Policy 65 (2014) 94–114
Gelfand et al., 2011; Fargione et al., 2008; Searchinger et al., 2008).Report COM(2010)11 of the European Commission addressesprecisely these issues and puts forward recommended sustain-ability criteria for solid and gaseous biomass1 (EuropeanCommission, 2010). This testifies to the ongoing discussion onthe need for mandatory sustainability criteria at the EU level, forwhich EU legislation is soon expected (e.g., Fritsche et al., 2013).
Second, the cost of electricity from biomass is generally high,not competitive with the cost of electricity from fossil sourcesunless some form of financial support is in place (IEA, 2012a). Bio-electricity costs depend on the specific conversion process, thenature and cost of the feedstock, as well as plant size. When lowcost feedstocks are available, plant scale is large and co-generationis viable,2 the costs of electricity from biomass can be competitive.Unfortunately, today these conditions are realized only in a verylimited number of cases.
Assuring the continuity and the quality of biomass supply,improving the efficiency of conversion plants, and buildingadvanced conversion plants with innovative technologies are someof the possible ways to decrease the costs of electricity frombiomass while addressing the environmental and social concernshighlighted above (IEA, 2012a; Baxter et al., 2011; Bauen et al.,2009; Farrell and Gopal, 2008). Research, development anddemonstration (RD&D) funding is expected to increase the effi-ciency of bioenergy technologies and to reduce their cost. How-ever, the role of future RD&D in bioenergy competitiveness andcommercial success is uncertain. Moreover, given the great varietyof feedstocks and the different level of maturity of the varioustechnological options, each technological path will require adifferent focus of RD&D spending, namely basic research, appliedresearch or demonstration.
To better understand the potential contribution of bioenergyand the role of RD&D in fostering the development of bioenergytechnologies, we surveyed sixteen leading experts in this sector.The group of respondents was very diverse, with experts fromdifferent EU Member States and with different professional back-grounds (private sector, academia, institution). The outcomes ofthis research include probabilistic information on the future costsof electricity produced from biomass and on the potential role ofRD&D in reducing these costs.
This paper contributes to the literature by providing novelevidence on the likely evolution of biomass electricity costs inthe coming decades and on the range of uncertainty surroundingthem. We thus complement the insights obtained from energysystemmodels such as POLES (IPTS, 2010) or integrated assessmentmodels such as WITCH (Bosetti et al., 2006). Moreover, we elicitedthe experts’ opinions on future bioenergy diffusion scenarios byextensively discussing possible barriers and the most effectivesolutions to overcome them. Therefore, the analysis of the experts’data results in a number of important policy recommendations thatcan guide future RD&D choices and the commitment of the EU andits Member States in supporting biomass technologies.
The next section of the paper reviews the current status ofbioenergy technologies. Section 3 describes the expert elicitationprocess. Section 4 presents the experts’ assessment of the currentstatus of biomass technologies. Section 5 illustrates the experts’projections of the cost of electricity from biomass under fivedifferent RD&D funding scenarios. Section 6 discusses the likelydiffusion of bioenergy in the market. We focus on (i) the regions thatwill most likely achieve cost-competitiveness first, (ii) the potential
barriers to bioenergy success, (iii) the possible negative externalitiesassociated with biomass technologies and (iv) the dynamics ofknowledge spillovers and technology transfer. The last section ofthe paper concludes and discusses the main findings of the study.
2. Bioenergy today
Biomass is the largest renewable energy source worldwide3
(IEA, 2012c), but its use differs significantly by region. In Africa47.8% of the 2010 total primary energy supply came from biomass(328 Mtoe of 686 Mtoe), while in OECD countries the correspond-ing figure was 4.5% (242 Mtoe out of 5406 Mtoe; IEA, 2012c). Indeveloping countries, biomass technologies are typically charac-terized by very low efficiencies, and in some cases severe impactson human health (i.e. biomass use in domestic stoves or fire-places). On the contrary, advanced technologies are available inmore developed countries, where biomass is primarily used toproduce electricity.
In the EU27, the contribution of solid biomass and biogas to the2010 gross electricity production was however rather small,roughly 3% of 3345 TWh (European Commission, 2012).4 The mostimportant energy sources, namely nuclear and coal, account for amuch larger share (27% each), followed by natural gas and hydro(24% and 12%, respectively).
Notwithstanding this limited contribution to current electricitysupply, biomass is one of the energy sources that the EuropeanCommission plans to further support to address the rising climateand energy concerns. Directive 2009/28/EC (EuropeanCommission, 2009) sets legally binding shares of renewableenergy in gross final energy consumption for each EU MemberState, in line with the Climate and Energy Package (COM/2008/30;European Commission, 2008a). To comply with these require-ments by 2020, in 2010 each EU Member State submitted aNational Renewable Energy Action Plan to the European Commis-sion specifying how each member would raise its share of renew-able energy sources. Altogether, these plans imply that in 2020solid and gaseous biomass for heating, cooling and electricity willsupply about 46% of the EU renewable targets (110 out of240 Mtoe) and 9.4% of total EU final energy consumption(Beurskens et al., 2011). In practice, meeting these targets meansraising biomass electricity production in the EU from about114 TWh in 2010 to 232 TWh by 2020 (Beurskens et al., 2011;Banja et al., 2013). This increase can be achieved only if moreefficient or novel biomass conversion technologies become com-mercial and if bioenergy production costs are reduced.
As already mentioned, biomass is a versatile resource and canbe converted to energy via several conversion routes. Some of themost relevant factors in choosing a specific conversion route are
1 Recommended sustainability criteria for solid and gaseous biomass (ReportCOM(2010)11) aim at reaching given GHG savings compared to fossil fuels,preserving land with high carbon stock and high biodiversity value, and applyingsustainable forest management criteria.
2 Viable cogeneration means that most of the heat co-produced is used.
3 In 2010, world total primary energy supply was 12,782 Mtoe, of which 13%(1657 Mtoe) was produced from renewable energy sources with the followingshares 9.8% biofuels and wastes, 2.3% hydro, 0.9% geothermal, solar, wind, heat andothers (IEA, 2012c). In 2010, 1.3% (279 TWh) of world electricity generation(21,431 TWh; IEA, 2012b) was produced from biofuels and waste, while in OECDcountries this figure was 2% (215 TWh out of 10,744 TWh of total gross electricitygeneration; IEA, 2011). According to IEA definitions, biofuels and waste includesolid biofuels, liquid biofuels, renewable municipal waste and biogases.
4 The total gross electricity produced from solid biomass in 2010 in EU27 was69.9 TWh (EurObserv'ER, 2012). Germany, Finland and Sweden are the countrieswith the highest production of electricity from solid biomass, each with about10 TWh. The contribution of biogas was also relevant: in 2010 it accounted for30.3 TWh of total gross electricity production (EurObserv'ER, 2012). More than halfof this electricity (16.2 TWh) is produced in Germany, where biogas has experi-enced an incredible development in the recent years. Other EU27 countriescontribute with much smaller amounts of electricity from biogas: the UnitedKingdom with 5.7 TWh, Italy with 2.1 TWh and all other countries with 1 TWh orless (EurObserv'ER, 2012).
G. Fiorese et al. / Energy Policy 65 (2014) 94–114 95
the nature of the feedstock, the availability of a given technologyand the demand for a specific energy product, namely electricity,heat or fuels (McKendry, 2002b, 2002c; Bauen et al., 2009). Somebiomass technologies are in principle able to adapt to differentfeedstocks and to produce different energy products. Some tech-nologies that could be used to convert biomass to commercialenergy are already available in other sectors (e.g., Organic RankineCycles, ORC, and pyrolysis are well proven for geothermal applica-tions and for niche applications in the food industry respectively),but still need to be adapted to bioenergy applications.
Biomass conversion technologies are therefore diverse andcharacterized by different stages of development and deployment.Combustion and gasification of biomass are key conversion tech-nologies for the production of power and combined heat fromsolid biomass. Co-firing biomass with coal is a well proven meansto use biomass and exploit scale efficiencies of a coal plant. Fastpyrolysis allows the production of a bio-oil with higher energydensity than the original feedstocks, thus improving handling,storage and transport. The key conversion technology for animalwastes and other high-moisture content materials is anaerobicdigestion for biogas production.
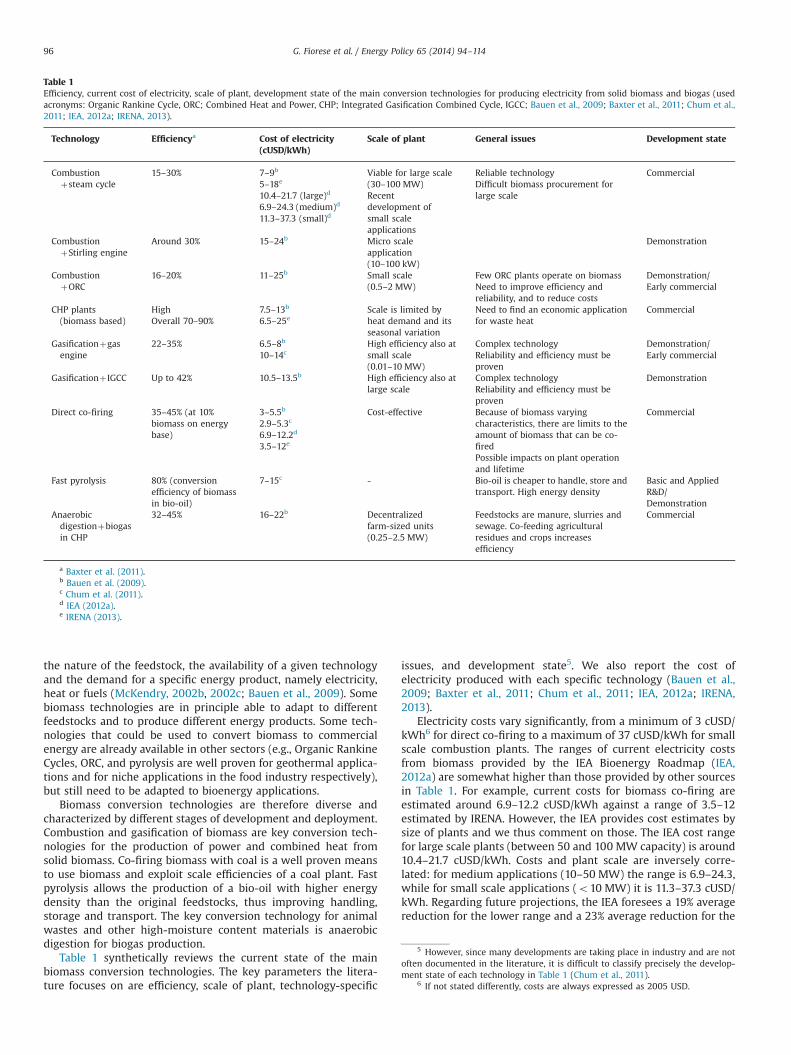
Table 1 synthetically reviews the current state of the mainbiomass conversion technologies. The key parameters the litera-ture focuses on are efficiency, scale of plant, technology-specific
issues, and development state5. We also report the cost ofelectricity produced with each specific technology (Bauen et al.,2009; Baxter et al., 2011; Chum et al., 2011; IEA, 2012a; IRENA,2013).
Electricity costs vary significantly, from a minimum of 3 cUSD/kWh6 for direct co-firing to a maximum of 37 cUSD/kWh for smallscale combustion plants. The ranges of current electricity costsfrom biomass provided by the IEA Bioenergy Roadmap (IEA,2012a) are somewhat higher than those provided by other sourcesin Table 1. For example, current costs for biomass co-firing areestimated around 6.9–12.2 cUSD/kWh against a range of 3.5–12estimated by IRENA. However, the IEA provides cost estimates bysize of plants and we thus comment on those. The IEA cost rangefor large scale plants (between 50 and 100 MW capacity) is around10.4–21.7 cUSD/kWh. Costs and plant scale are inversely corre-lated: for medium applications (10–50 MW) the range is 6.9–24.3,while for small scale applications (o10 MW) it is 11.3–37.3 cUSD/kWh. Regarding future projections, the IEA foresees a 19% averagereduction for the lower range and a 23% average reduction for the
Table 1Efficiency, current cost of electricity, scale of plant, development state of the main conversion technologies for producing electricity from solid biomass and biogas (usedacronyms: Organic Rankine Cycle, ORC; Combined Heat and Power, CHP; Integrated Gasification Combined Cycle, IGCC; Bauen et al., 2009; Baxter et al., 2011; Chum et al.,2011; IEA, 2012a; IRENA, 2013).
Technology Efficiencya Cost of electricity(cUSD/kWh)
Scale of plant General issues Development state
Combustionþsteam cycle
15–30% 7–9b Viable for large scale(30–100 MW)
Reliable technology Commercial5–18e Difficult biomass procurement for
large scale10.4–21.7 (large)d Recentdevelopment ofsmall scaleapplications
6.9–24.3 (medium)d
11.3–37.3 (small)d
CombustionþStirling engine
Around 30% 15–24b Micro scaleapplication(10–100 kW)
Demonstration
CombustionþORC
16–20% 11–25b Small scale(0.5–2 MW)
Few ORC plants operate on biomass Demonstration/Early commercialNeed to improve efficiency and
reliability, and to reduce costsCHP plants(biomass based)
High 7.5–13b Scale is limited byheat demand and itsseasonal variation
Need to find an economic applicationfor waste heat
CommercialOverall 70–90% 6.5–25e
Gasificationþgasengine
22–35% 6.5–8b High efficiency also atsmall scale(0.01–10 MW)
Complex technology Demonstration/Early commercial10–14c Reliability and efficiency must be
provenGasificationþ IGCC Up to 42% 10.5–13.5b High efficiency also at
large scaleComplex technology DemonstrationReliability and efficiency must beproven
Direct co-firing 35–45% (at 10%biomass on energybase)
3–5.5b Cost-effective Because of biomass varyingcharacteristics, there are limits to theamount of biomass that can be co-fired
Commercial2.9–5.3c
6.9–12.2d
3.5–12e
Possible impacts on plant operationand lifetime
Fast pyrolysis 80% (conversionefficiency of biomassin bio-oil)
7–15c - Bio-oil is cheaper to handle, store andtransport. High energy density
Basic and AppliedR&D/Demonstration
Anaerobicdigestionþbiogasin CHP
32–45% 16–22b Decentralizedfarm-sized units(0.25–2.5 MW)
Feedstocks are manure, slurries andsewage. Co-feeding agriculturalresidues and crops increasesefficiency
Commercial
a Baxter et al. (2011).b Bauen et al. (2009).c Chum et al. (2011).d IEA (2012a).e IRENA (2013).
5 However, since many developments are taking place in industry and are notoften documented in the literature, it is difficult to classify precisely the develop-ment state of each technology in Table 1 (Chum et al., 2011).
6 If not stated differently, costs are always expressed as 2005 USD.
G. Fiorese et al. / Energy Policy 65 (2014) 94–11496
higher range by 20307. On the contrary, according to IRENA thelower range will not significantly decrease by 2020, while thehigher range of less mature technologies (such as gasification) willdecrease by about 10–17%8.
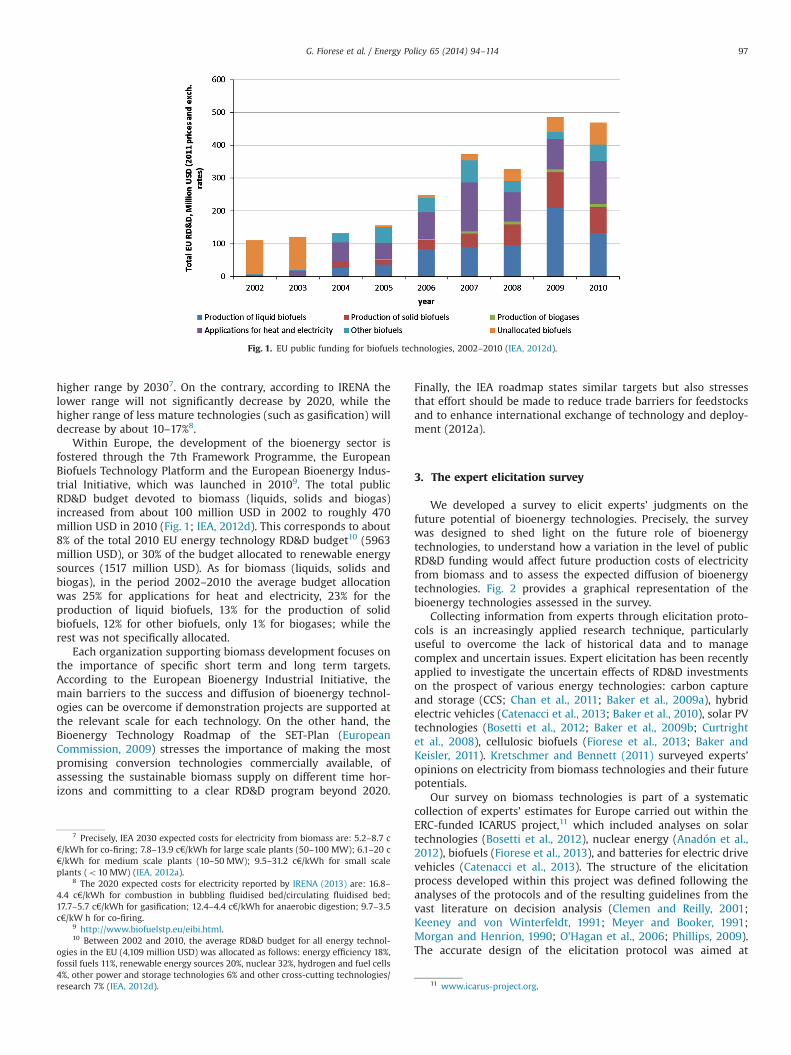
Within Europe, the development of the bioenergy sector isfostered through the 7th Framework Programme, the EuropeanBiofuels Technology Platform and the European Bioenergy Indus-trial Initiative, which was launched in 20109. The total publicRD&D budget devoted to biomass (liquids, solids and biogas)increased from about 100 million USD in 2002 to roughly 470million USD in 2010 (Fig. 1; IEA, 2012d). This corresponds to about8% of the total 2010 EU energy technology RD&D budget10 (5963million USD), or 30% of the budget allocated to renewable energysources (1517 million USD). As for biomass (liquids, solids andbiogas), in the period 2002–2010 the average budget allocationwas 25% for applications for heat and electricity, 23% for theproduction of liquid biofuels, 13% for the production of solidbiofuels, 12% for other biofuels, only 1% for biogases; while therest was not specifically allocated.
Each organization supporting biomass development focuses onthe importance of specific short term and long term targets.According to the European Bioenergy Industrial Initiative, themain barriers to the success and diffusion of bioenergy technol-ogies can be overcome if demonstration projects are supported atthe relevant scale for each technology. On the other hand, theBioenergy Technology Roadmap of the SET-Plan (EuropeanCommission, 2009) stresses the importance of making the mostpromising conversion technologies commercially available, ofassessing the sustainable biomass supply on different time hor-izons and committing to a clear RD&D program beyond 2020.
Finally, the IEA roadmap states similar targets but also stressesthat effort should be made to reduce trade barriers for feedstocksand to enhance international exchange of technology and deploy-ment (2012a).
3. The expert elicitation survey
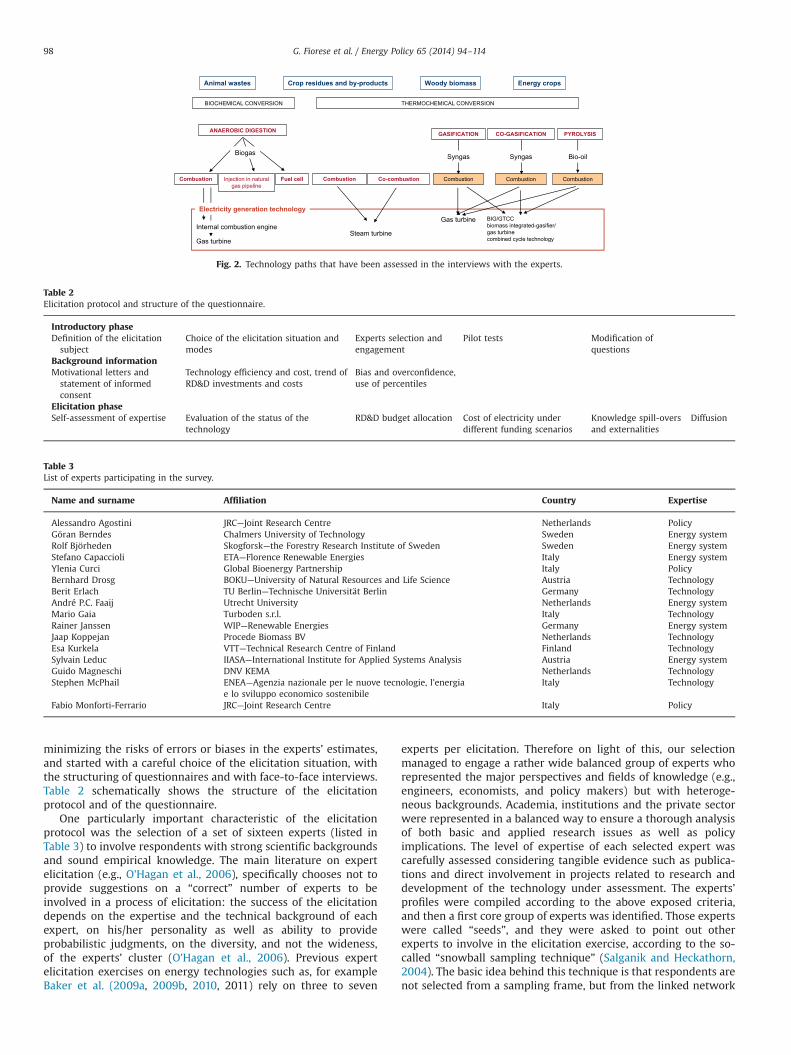
We developed a survey to elicit experts’ judgments on thefuture potential of bioenergy technologies. Precisely, the surveywas designed to shed light on the future role of bioenergytechnologies, to understand how a variation in the level of publicRD&D funding would affect future production costs of electricityfrom biomass and to assess the expected diffusion of bioenergytechnologies. Fig. 2 provides a graphical representation of thebioenergy technologies assessed in the survey.
Collecting information from experts through elicitation proto-cols is an increasingly applied research technique, particularlyuseful to overcome the lack of historical data and to managecomplex and uncertain issues. Expert elicitation has been recentlyapplied to investigate the uncertain effects of RD&D investmentson the prospect of various energy technologies: carbon captureand storage (CCS; Chan et al., 2011; Baker et al., 2009a), hybridelectric vehicles (Catenacci et al., 2013; Baker et al., 2010), solar PVtechnologies (Bosetti et al., 2012; Baker et al., 2009b; Curtrightet al., 2008), cellulosic biofuels (Fiorese et al., 2013; Baker andKeisler, 2011). Kretschmer and Bennett (2011) surveyed experts’opinions on electricity from biomass technologies and their futurepotentials.
Our survey on biomass technologies is part of a systematiccollection of experts’ estimates for Europe carried out within theERC-funded ICARUS project,11 which included analyses on solartechnologies (Bosetti et al., 2012), nuclear energy (Anadón et al.,2012), biofuels (Fiorese et al., 2013), and batteries for electric drivevehicles (Catenacci et al., 2013). The structure of the elicitationprocess developed within this project was defined following theanalyses of the protocols and of the resulting guidelines from thevast literature on decision analysis (Clemen and Reilly, 2001;Keeney and von Winterfeldt, 1991; Meyer and Booker, 1991;Morgan and Henrion, 1990; O'Hagan et al., 2006; Phillips, 2009).The accurate design of the elicitation protocol was aimed at
Fig. 1. EU public funding for biofuels technologies, 2002–2010 (IEA, 2012d).
7 Precisely, IEA 2030 expected costs for electricity from biomass are: 5.2–8.7 c€/kWh for co-firing; 7.8–13.9 c€/kWh for large scale plants (50–100 MW); 6.1–20 c€/kWh for medium scale plants (10–50 MW); 9.5–31.2 c€/kWh for small scaleplants (o10 MW) (IEA, 2012a).
8 The 2020 expected costs for electricity reported by IRENA (2013) are: 16.8–4.4 c€/kWh for combustion in bubbling fluidised bed/circulating fluidised bed;17.7–5.7 c€/kWh for gasification; 12.4–4.4 c€/kWh for anaerobic digestion; 9.7–3.5c€/kW h for co-firing.
9 http://www.biofuelstp.eu/eibi.html.10 Between 2002 and 2010, the average RD&D budget for all energy technol-
ogies in the EU (4,109 million USD) was allocated as follows: energy efficiency 18%,fossil fuels 11%, renewable energy sources 20%, nuclear 32%, hydrogen and fuel cells4%, other power and storage technologies 6% and other cross-cutting technologies/research 7% (IEA, 2012d). 11 www.icarus-project.org.
G. Fiorese et al. / Energy Policy 65 (2014) 94–114 97
minimizing the risks of errors or biases in the experts’ estimates,and started with a careful choice of the elicitation situation, withthe structuring of questionnaires and with face-to-face interviews.Table 2 schematically shows the structure of the elicitationprotocol and of the questionnaire.
One particularly important characteristic of the elicitationprotocol was the selection of a set of sixteen experts (listed inTable 3) to involve respondents with strong scientific backgroundsand sound empirical knowledge. The main literature on expertelicitation (e.g., O'Hagan et al., 2006), specifically chooses not toprovide suggestions on a “correct” number of experts to beinvolved in a process of elicitation: the success of the elicitationdepends on the expertise and the technical background of eachexpert, on his/her personality as well as ability to provideprobabilistic judgments, on the diversity, and not the wideness,of the experts’ cluster (O'Hagan et al., 2006). Previous expertelicitation exercises on energy technologies such as, for exampleBaker et al. (2009a, 2009b, 2010, 2011) rely on three to seven
experts per elicitation. Therefore on light of this, our selectionmanaged to engage a rather wide balanced group of experts whorepresented the major perspectives and fields of knowledge (e.g.,engineers, economists, and policy makers) but with heteroge-neous backgrounds. Academia, institutions and the private sectorwere represented in a balanced way to ensure a thorough analysisof both basic and applied research issues as well as policyimplications. The level of expertise of each selected expert wascarefully assessed considering tangible evidence such as publica-tions and direct involvement in projects related to research anddevelopment of the technology under assessment. The experts’profiles were compiled according to the above exposed criteria,and then a first core group of experts was identified. Those expertswere called “seeds”, and they were asked to point out otherexperts to involve in the elicitation exercise, according to the so-called “snowball sampling technique” (Salganik and Heckathorn,2004). The basic idea behind this technique is that respondents arenot selected from a sampling frame, but from the linked network
Fig. 2. Technology paths that have been assessed in the interviews with the experts.
Table 2Elicitation protocol and structure of the questionnaire.
Introductory phaseDefinition of the elicitationsubject
Choice of the elicitation situation andmodes
Experts selection andengagement
Pilot tests Modification ofquestions
Background informationMotivational letters andstatement of informedconsent
Technology efficiency and cost, trend ofRD&D investments and costs
Bias and overconfidence,use of percentiles
Elicitation phaseSelf-assessment of expertise Evaluation of the status of the
technologyRD&D budget allocation Cost of electricity under
different funding scenariosKnowledge spill-oversand externalities
Diffusion
Table 3List of experts participating in the survey.
Name and surname Affiliation Country Expertise
Alessandro Agostini JRC—Joint Research Centre Netherlands PolicyGöran Berndes Chalmers University of Technology Sweden Energy systemRolf Björheden Skogforsk—the Forestry Research Institute of Sweden Sweden Energy systemStefano Capaccioli ETA—Florence Renewable Energies Italy Energy systemYlenia Curci Global Bioenergy Partnership Italy PolicyBernhard Drosg BOKU—University of Natural Resources and Life Science Austria TechnologyBerit Erlach TU Berlin—Technische Universität Berlin Germany TechnologyAndré P.C. Faaij Utrecht University Netherlands Energy systemMario Gaia Turboden s.r.l. Italy TechnologyRainer Janssen WIP—Renewable Energies Germany Energy systemJaap Koppejan Procede Biomass BV Netherlands TechnologyEsa Kurkela VTT—Technical Research Centre of Finland Finland TechnologySylvain Leduc IIASA—International Institute for Applied Systems Analysis Austria Energy systemGuido Magneschi DNV KEMA Netherlands TechnologyStephen McPhail ENEA—Agenzia nazionale per le nuove tecnologie, l’energia
e lo sviluppo economico sostenibileItaly Technology
Fabio Monforti-Ferrario JRC—Joint Research Centre Italy Policy
G. Fiorese et al. / Energy Policy 65 (2014) 94–11498
of existing members of the sample. This method is used tocomplete a sound and reliable list of experts for each technology,ensuring that all the relevant perspectives have been included(Giupponi et al., 2006). All answers are anonymously reported inthe rest of the paper and the order of the experts does not reflectthe one in Table 3. Pilot interviews were carried out to test thewhole elicitation process and to eventually modify parts of thequestionnaire. During each interview, the experts were firstbriefed on the project's purpose and then warned about theoccurrence of specific heuristics or biases in the estimates.
For more detailed information on the protocol structure and onthe techniques applied to control and detect bias occurrence, pleaserefer to Bosetti et al. (2012) and to Fiorese et al. (2013). Surveys werecarried out in 2011. Follow-up interviews also allowed us to checkthe elicited information, to deepen the discussion with each expert,and, when necessary, to correct possible inconsistencies. The com-plete elicitation protocol is provided in Appendix A.
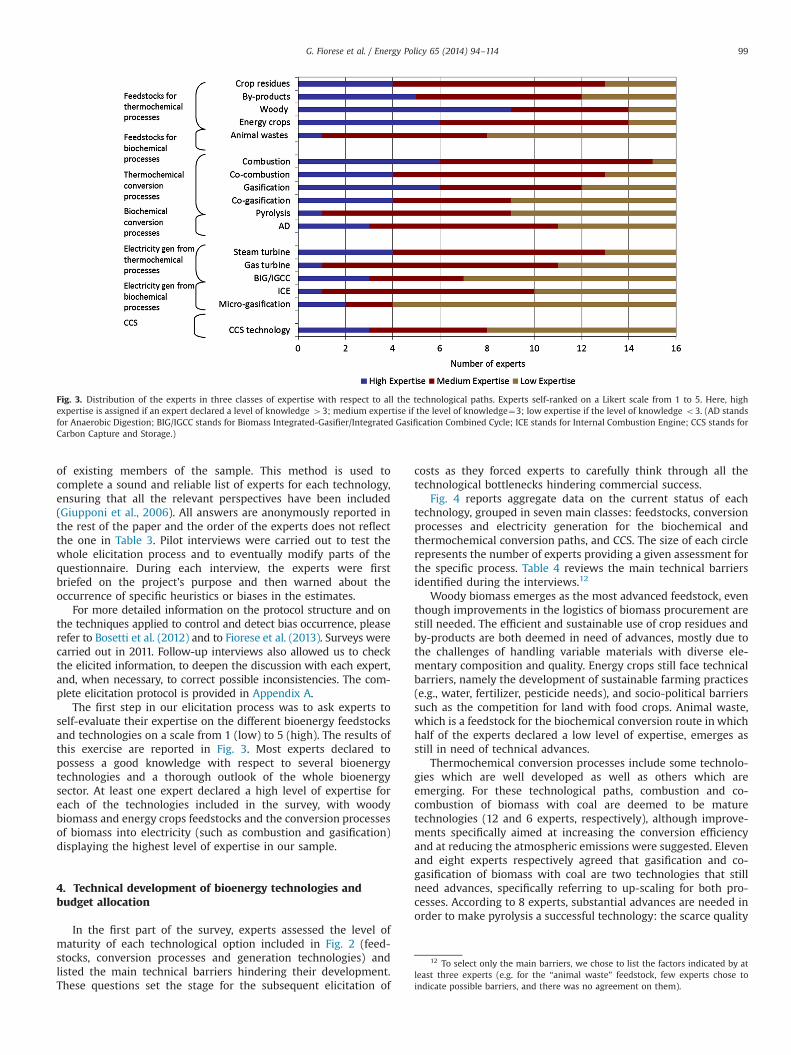
The first step in our elicitation process was to ask experts toself-evaluate their expertise on the different bioenergy feedstocksand technologies on a scale from 1 (low) to 5 (high). The results ofthis exercise are reported in Fig. 3. Most experts declared topossess a good knowledge with respect to several bioenergytechnologies and a thorough outlook of the whole bioenergysector. At least one expert declared a high level of expertise foreach of the technologies included in the survey, with woodybiomass and energy crops feedstocks and the conversion processesof biomass into electricity (such as combustion and gasification)displaying the highest level of expertise in our sample.
4. Technical development of bioenergy technologies andbudget allocation
In the first part of the survey, experts assessed the level ofmaturity of each technological option included in Fig. 2 (feed-stocks, conversion processes and generation technologies) andlisted the main technical barriers hindering their development.These questions set the stage for the subsequent elicitation of
costs as they forced experts to carefully think through all thetechnological bottlenecks hindering commercial success.
Fig. 4 reports aggregate data on the current status of eachtechnology, grouped in seven main classes: feedstocks, conversionprocesses and electricity generation for the biochemical andthermochemical conversion paths, and CCS. The size of each circlerepresents the number of experts providing a given assessment forthe specific process. Table 4 reviews the main technical barriersidentified during the interviews.12
Woody biomass emerges as the most advanced feedstock, eventhough improvements in the logistics of biomass procurement arestill needed. The efficient and sustainable use of crop residues andby-products are both deemed in need of advances, mostly due tothe challenges of handling variable materials with diverse ele-mentary composition and quality. Energy crops still face technicalbarriers, namely the development of sustainable farming practices(e.g., water, fertilizer, pesticide needs), and socio-political barrierssuch as the competition for land with food crops. Animal waste,which is a feedstock for the biochemical conversion route in whichhalf of the experts declared a low level of expertise, emerges asstill in need of technical advances.
Thermochemical conversion processes include some technolo-gies which are well developed as well as others which areemerging. For these technological paths, combustion and co-combustion of biomass with coal are deemed to be maturetechnologies (12 and 6 experts, respectively), although improve-ments specifically aimed at increasing the conversion efficiencyand at reducing the atmospheric emissions were suggested. Elevenand eight experts respectively agreed that gasification and co-gasification of biomass with coal are two technologies that stillneed advances, specifically referring to up-scaling for both pro-cesses. According to 8 experts, substantial advances are needed inorder to make pyrolysis a successful technology: the scarce quality
Fig. 3. Distribution of the experts in three classes of expertise with respect to all the technological paths. Experts self-ranked on a Likert scale from 1 to 5. Here, highexpertise is assigned if an expert declared a level of knowledge 43; medium expertise if the level of knowledge¼3; low expertise if the level of knowledge o3. (AD standsfor Anaerobic Digestion; BIG/IGCC stands for Biomass Integrated-Gasifier/Integrated Gasification Combined Cycle; ICE stands for Internal Combustion Engine; CCS stands forCarbon Capture and Storage.)
12 To select only the main barriers, we chose to list the factors indicated by atleast three experts (e.g. for the “animal waste” feedstock, few experts chose toindicate possible barriers, and there was no agreement on them).
G. Fiorese et al. / Energy Policy 65 (2014) 94–114 99
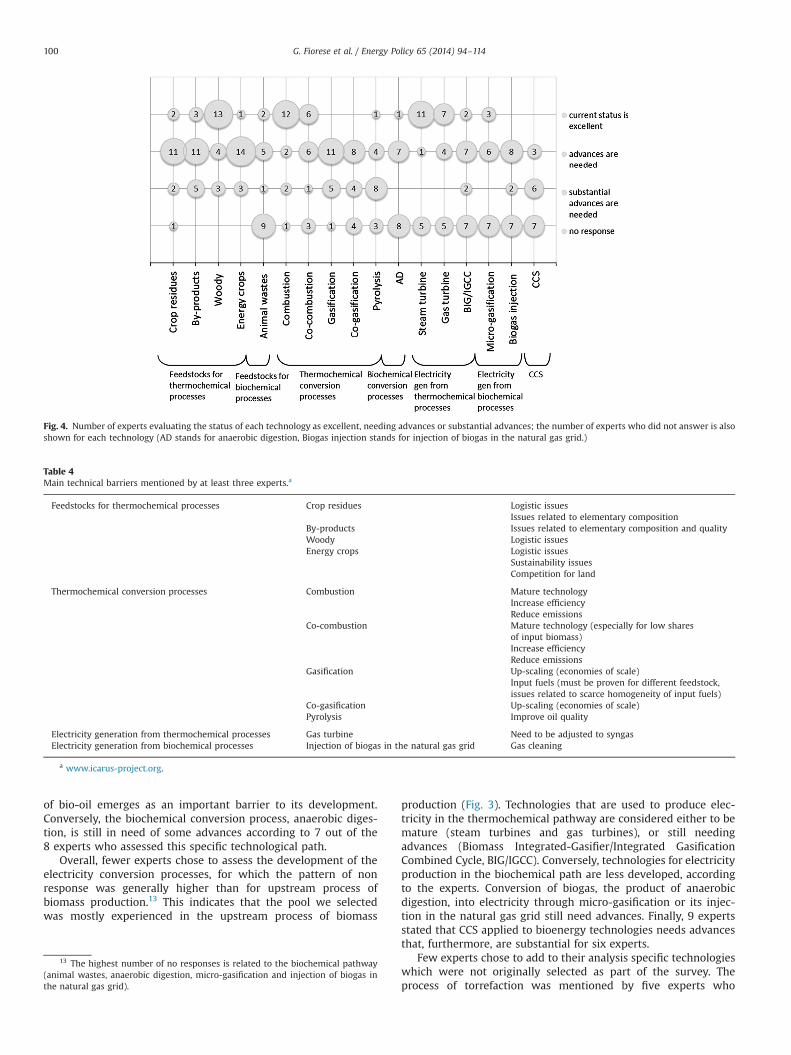
of bio-oil emerges as an important barrier to its development.Conversely, the biochemical conversion process, anaerobic diges-tion, is still in need of some advances according to 7 out of the8 experts who assessed this specific technological path.
Overall, fewer experts chose to assess the development of theelectricity conversion processes, for which the pattern of nonresponse was generally higher than for upstream process ofbiomass production.13 This indicates that the pool we selectedwas mostly experienced in the upstream process of biomass
production (Fig. 3). Technologies that are used to produce elec-tricity in the thermochemical pathway are considered either to bemature (steam turbines and gas turbines), or still needingadvances (Biomass Integrated-Gasifier/Integrated GasificationCombined Cycle, BIG/IGCC). Conversely, technologies for electricityproduction in the biochemical path are less developed, accordingto the experts. Conversion of biogas, the product of anaerobicdigestion, into electricity through micro-gasification or its injec-tion in the natural gas grid still need advances. Finally, 9 expertsstated that CCS applied to bioenergy technologies needs advancesthat, furthermore, are substantial for six experts.
Few experts chose to add to their analysis specific technologieswhich were not originally selected as part of the survey. Theprocess of torrefaction was mentioned by five experts who
Table 4Main technical barriers mentioned by at least three experts.a
Feedstocks for thermochemical processes Crop residues Logistic issuesIssues related to elementary composition
By-products Issues related to elementary composition and qualityWoody Logistic issuesEnergy crops Logistic issues
Sustainability issuesCompetition for land
Thermochemical conversion processes Combustion Mature technologyIncrease efficiencyReduce emissions
Co-combustion Mature technology (especially for low sharesof input biomass)Increase efficiencyReduce emissions
Gasification Up-scaling (economies of scale)Input fuels (must be proven for different feedstock,issues related to scarce homogeneity of input fuels)
Co-gasification Up-scaling (economies of scale)Pyrolysis Improve oil quality
Electricity generation from thermochemical processes Gas turbine Need to be adjusted to syngasElectricity generation from biochemical processes Injection of biogas in the natural gas grid Gas cleaning
a www.icarus-project.org.
Fig. 4. Number of experts evaluating the status of each technology as excellent, needing advances or substantial advances; the number of experts who did not answer is alsoshown for each technology (AD stands for anaerobic digestion, Biogas injection stands for injection of biogas in the natural gas grid.)
13 The highest number of no responses is related to the biochemical pathway(animal wastes, anaerobic digestion, micro-gasification and injection of biogas inthe natural gas grid).
G. Fiorese et al. / Energy Policy 65 (2014) 94–114100
evaluated its status as in need of substantial advances, since thetechnology still has to be demonstrated. Organic Rankine Cyclewas mentioned by three experts and was evaluated as a technol-ogy needing further improvements.
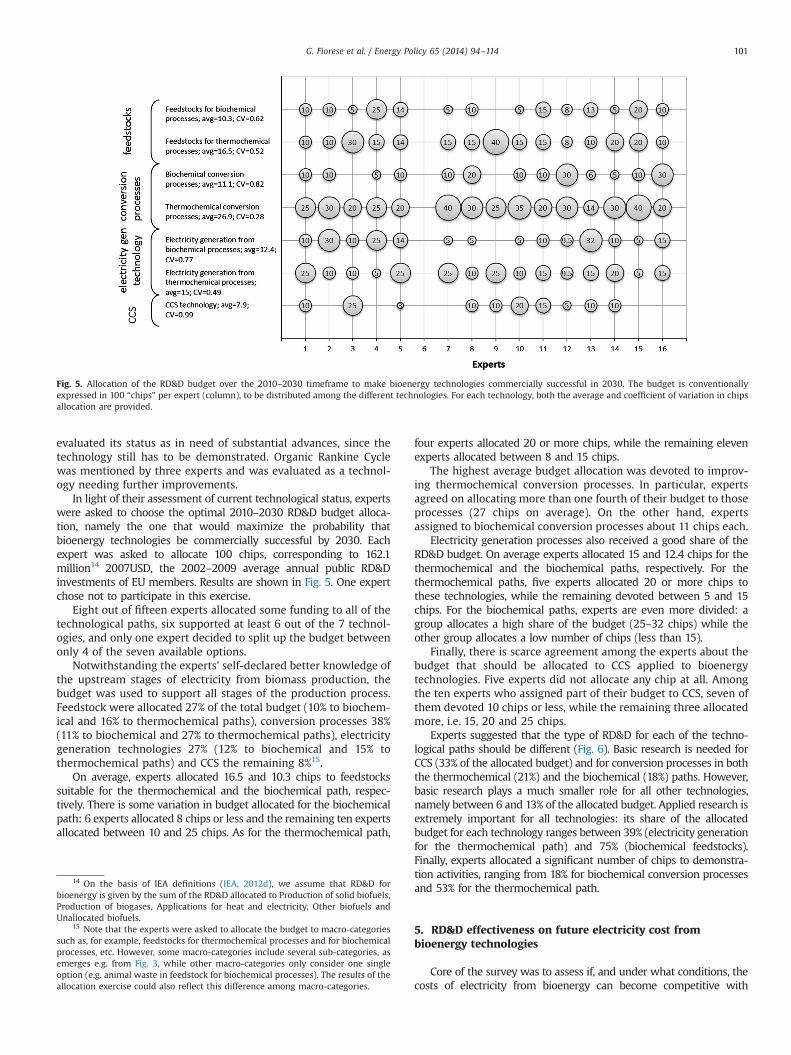
In light of their assessment of current technological status, expertswere asked to choose the optimal 2010–2030 RD&D budget alloca-tion, namely the one that would maximize the probability thatbioenergy technologies be commercially successful by 2030. Eachexpert was asked to allocate 100 chips, corresponding to 162.1million14 2007USD, the 2002–2009 average annual public RD&Dinvestments of EU members. Results are shown in Fig. 5. One expertchose not to participate in this exercise.
Eight out of fifteen experts allocated some funding to all of thetechnological paths, six supported at least 6 out of the 7 technol-ogies, and only one expert decided to split up the budget betweenonly 4 of the seven available options.
Notwithstanding the experts’ self-declared better knowledge ofthe upstream stages of electricity from biomass production, thebudget was used to support all stages of the production process.Feedstock were allocated 27% of the total budget (10% to biochem-ical and 16% to thermochemical paths), conversion processes 38%(11% to biochemical and 27% to thermochemical paths), electricitygeneration technologies 27% (12% to biochemical and 15% tothermochemical paths) and CCS the remaining 8%15.
On average, experts allocated 16.5 and 10.3 chips to feedstockssuitable for the thermochemical and the biochemical path, respec-tively. There is some variation in budget allocated for the biochemicalpath: 6 experts allocated 8 chips or less and the remaining ten expertsallocated between 10 and 25 chips. As for the thermochemical path,
four experts allocated 20 or more chips, while the remaining elevenexperts allocated between 8 and 15 chips.
The highest average budget allocation was devoted to improv-ing thermochemical conversion processes. In particular, expertsagreed on allocating more than one fourth of their budget to thoseprocesses (27 chips on average). On the other hand, expertsassigned to biochemical conversion processes about 11 chips each.
Electricity generation processes also received a good share of theRD&D budget. On average experts allocated 15 and 12.4 chips for thethermochemical and the biochemical paths, respectively. For thethermochemical paths, five experts allocated 20 or more chips tothese technologies, while the remaining devoted between 5 and 15chips. For the biochemical paths, experts are even more divided: agroup allocates a high share of the budget (25–32 chips) while theother group allocates a low number of chips (less than 15).
Finally, there is scarce agreement among the experts about thebudget that should be allocated to CCS applied to bioenergytechnologies. Five experts did not allocate any chip at all. Amongthe ten experts who assigned part of their budget to CCS, seven ofthem devoted 10 chips or less, while the remaining three allocatedmore, i.e. 15, 20 and 25 chips.
Experts suggested that the type of RD&D for each of the techno-logical paths should be different (Fig. 6). Basic research is needed forCCS (33% of the allocated budget) and for conversion processes in boththe thermochemical (21%) and the biochemical (18%) paths. However,basic research plays a much smaller role for all other technologies,namely between 6 and 13% of the allocated budget. Applied research isextremely important for all technologies: its share of the allocatedbudget for each technology ranges between 39% (electricity generationfor the thermochemical path) and 75% (biochemical feedstocks).Finally, experts allocated a significant number of chips to demonstra-tion activities, ranging from 18% for biochemical conversion processesand 53% for the thermochemical path.
5. RD&D effectiveness on future electricity cost frombioenergy technologies
Core of the survey was to assess if, and under what conditions, thecosts of electricity from bioenergy can become competitive with
Fig. 5. Allocation of the RD&D budget over the 2010–2030 timeframe to make bioenergy technologies commercially successful in 2030. The budget is conventionallyexpressed in 100 “chips” per expert (column), to be distributed among the different technologies. For each technology, both the average and coefficient of variation in chipsallocation are provided.
14 On the basis of IEA definitions (IEA, 2012d), we assume that RD&D forbioenergy is given by the sum of the RD&D allocated to Production of solid biofuels,Production of biogases, Applications for heat and electricity, Other biofuels andUnallocated biofuels.
15 Note that the experts were asked to allocate the budget to macro-categoriessuch as, for example, feedstocks for thermochemical processes and for biochemicalprocesses, etc. However, some macro-categories include several sub-categories, asemerges e.g. from Fig. 3, while other macro-categories only consider one singleoption (e.g. animal waste in feedstock for biochemical processes). The results of theallocation exercise could also reflect this difference among macro-categories.
G. Fiorese et al. / Energy Policy 65 (2014) 94–114 101
conventional fossil electricity, in the absence of other specific supports.To this end, we elicited the experts’ opinion on the probabilistic futurecosts of electricity from biomass. Given the importance of RD&Dinvestment in securing further cost reductions, we asked the expertsto provide cost estimates under five different RD&D funding scenarios.In the first scenario, the current level of public investment in RD&D forbioenergy (161.1 million 2007USD) is assumed constant until 2030.16
The second and third scenarios considered a þ50% and þ100%increase in the RD&D budget over the whole period, respectively. Inthe fourth and fifth scenarios RD&D funding over the whole periodwas decreased by 50% and 100% RD&D, respectively. The final scenarioeffectively set the public RD&D biomass budget to zero.
Experts were told that the only variable changing across thescenarios was public EU funding, while private funding as well asother countries’ RD&D programs remained the same. Furthermore,we specifically asked the experts to assume no additional incen-tive or subsidy for biomass electricity production.
To avoid anchoring effects and to minimize naturally occurringerrors or biases in the experts’ estimates, we structured this section ofthe questionnaire in two parts. In the first one, experts were asked toprovide the 90th, 10th and 50th percentiles of the future cost ofelectricity from bioenergy in 2030 under different RD&D investmentscenarios. In the second part, we asked each expert to estimate theprobability that, conditional on each of the RD&D investment scenar-ios, the cost of electricity from bioenergy in 2030 would be lower thanthree cost targets: 11.27, 5.55 and 3 cUSD/kWh.17 The double
elicitation question allowed us to investigate in greater depth theexperts’ opinion, stretch his/her potential overconfidence and test forreaction to possible inconsistencies.18
Future costs under the different RD&D funding scenarios arereported in Figs. 7 and 8. The elicited costs indicate a high degreeof uncertainty and variance among the experts. These in turnderive from the fact that each expert referred to a differenttechnology or to a mix of technologies when providing costestimates. Moreover, each expert made different assumptions onkey variables, such as feedstock characteristics or plant scale.
Experts are clustered in two groups. The first is composed ofExperts 2 to 9, who considered amix of bioenergy technologies and byExpert 10 who provided the cost of electricity for cogeneration andgasification with synthesis of syngas. This cluster of experts providedrelatively optimistic estimates compared to those of the second group(Experts 11, 12 and 13, extreme right in Fig. 7) who indicated theircosts specifically for the biochemical route.
Expert 1 emerges as an outlier: the estimates refer to a mix oftechnologies but are much higher than those of other experts.19 SinceExpert 1 clearly expressed his/her pessimism regarding the potentialof the technology per se, we chose not to include his/her values in theaverage estimates and in the subsequent description of results.
Excluding Expert 1, the average best estimate (50th percentile)of bioenergy cost in 2030, under current RD&D funding, is 10.8cUSD/kWh. The aggregate statistics show that experts are con-vinced that RD&D investments will strongly influence the cost ofelectricity from biomass in the future. The average best estimate ofcost is 11% and 17% lower in the þ50% and þ100% scenarios,respectively. Smaller RD&D budgets would result in higher costs:the �50% and �100% budget scenarios increase the experts’average best estimate by 14% and 23%, respectively.
Fig. 6. Sum of the RD&D allocated by all experts among different technologies and breakdown of the budget among basic, applied and demonstration RD&D.
16 We asked the experts to consider the average yearly expenditure over theperiod 2004–2009 in order to smooth out the recent slowdown in investments dueto the economic crisis. Numbers were presented both in 2005 Euros and Dollars.
17 The three different “breakthrough” cost levels correspond to projections ofthe costs of electricity from fossil fuels or nuclear in 2030. The first breakthroughcost (11.27 cUSD/kWh) corresponds to the projected cost of electricity fromtraditional coal power plants in 2030, in the presence of a specific policy to controlCO2 emissions (thus effectively increasing electricity costs from fossil sources).Specifically, we assumed a carbon price accounting for more than half of the cost ofelectricity (5.8 cUSD/kWh), which is in line with a 550 ppm CO2 only stabilizationtarget by 2100 (according to projection of the WITCH model in Bosetti et al. (2009).The second breakthrough cost (5.55 cUSD/kWh) is the projected cost of electricityfrom traditional fossil fuels in 2030, without considering any carbon tax. Finally, thethird breakthrough cost (3 cUSD/kWh) assumes that bioenergy might becomecompetitive with the levelized cost of electricity from nuclear power.
18 Since experts typically think in terms of technological endpoints and not interms of costs, we provided them with a formula deriving the cost of electricityfrom specific technical factors, such as feedstock costs, efficiency, capital costs andoperational and maintenance cost. Experts who did not feel at ease with directlyproviding monetary estimates, were free to use the formula to estimate howimprovements in technical factors would result in lower monetary costs.
19 His/her best estimate is 23 cUSD/kWh under the business as usual scenario.
G. Fiorese et al. / Energy Policy 65 (2014) 94–114102
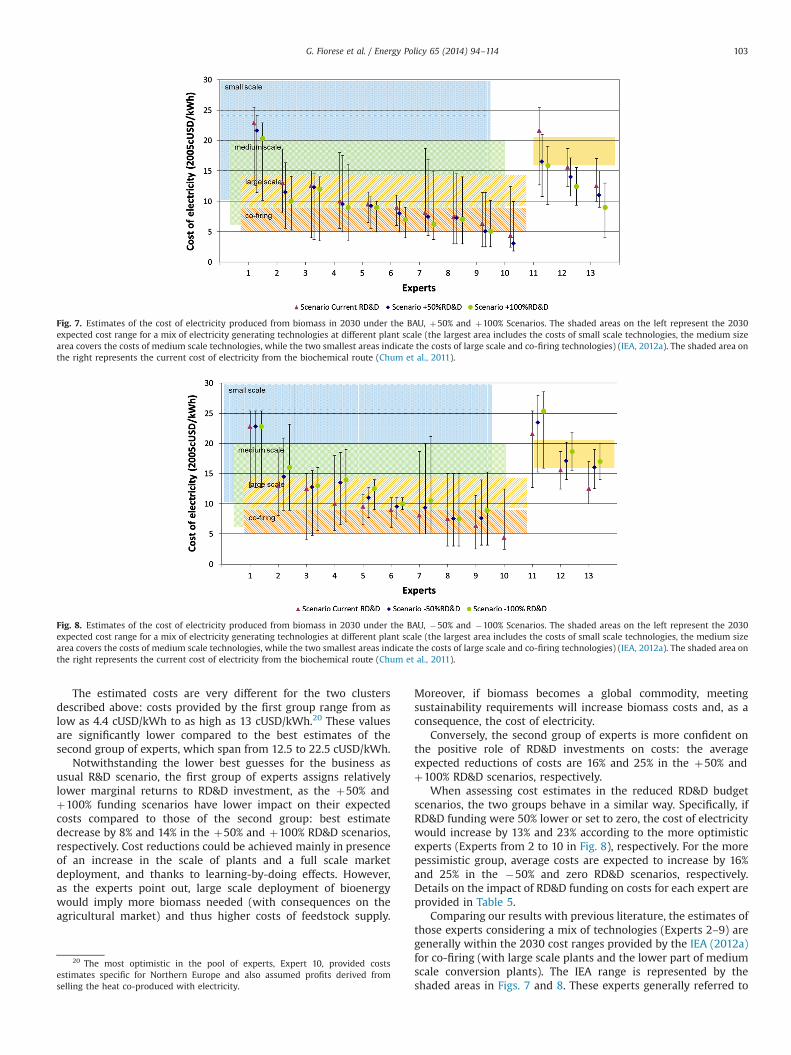
The estimated costs are very different for the two clustersdescribed above: costs provided by the first group range from aslow as 4.4 cUSD/kWh to as high as 13 cUSD/kWh.20 These valuesare significantly lower compared to the best estimates of thesecond group of experts, which span from 12.5 to 22.5 cUSD/kWh.
Notwithstanding the lower best guesses for the business asusual R&D scenario, the first group of experts assigns relativelylower marginal returns to RD&D investment, as the þ50% andþ100% funding scenarios have lower impact on their expectedcosts compared to those of the second group: best estimatedecrease by 8% and 14% in the þ50% and þ100% RD&D scenarios,respectively. Cost reductions could be achieved mainly in presenceof an increase in the scale of plants and a full scale marketdeployment, and thanks to learning-by-doing effects. However,as the experts point out, large scale deployment of bioenergywould imply more biomass needed (with consequences on theagricultural market) and thus higher costs of feedstock supply.
Moreover, if biomass becomes a global commodity, meetingsustainability requirements will increase biomass costs and, as aconsequence, the cost of electricity.
Conversely, the second group of experts is more confident onthe positive role of RD&D investments on costs: the averageexpected reductions of costs are 16% and 25% in the þ50% andþ100% RD&D scenarios, respectively.
When assessing cost estimates in the reduced RD&D budgetscenarios, the two groups behave in a similar way. Specifically, ifRD&D funding were 50% lower or set to zero, the cost of electricitywould increase by 13% and 23% according to the more optimisticexperts (Experts from 2 to 10 in Fig. 8), respectively. For the morepessimistic group, average costs are expected to increase by 16%and 25% in the �50% and zero RD&D scenarios, respectively.Details on the impact of RD&D funding on costs for each expert areprovided in Table 5.
Comparing our results with previous literature, the estimates ofthose experts considering a mix of technologies (Experts 2–9) aregenerally within the 2030 cost ranges provided by the IEA (2012a)for co-firing (with large scale plants and the lower part of mediumscale conversion plants). The IEA range is represented by theshaded areas in Figs. 7 and 8. These experts generally referred to
Fig. 7. Estimates of the cost of electricity produced from biomass in 2030 under the BAU, þ50% and þ100% Scenarios. The shaded areas on the left represent the 2030expected cost range for a mix of electricity generating technologies at different plant scale (the largest area includes the costs of small scale technologies, the medium sizearea covers the costs of medium scale technologies, while the two smallest areas indicate the costs of large scale and co-firing technologies) (IEA, 2012a). The shaded area onthe right represents the current cost of electricity from the biochemical route (Chum et al., 2011).
Fig. 8. Estimates of the cost of electricity produced from biomass in 2030 under the BAU, �50% and �100% Scenarios. The shaded areas on the left represent the 2030expected cost range for a mix of electricity generating technologies at different plant scale (the largest area includes the costs of small scale technologies, the medium sizearea covers the costs of medium scale technologies, while the two smallest areas indicate the costs of large scale and co-firing technologies) (IEA, 2012a). The shaded area onthe right represents the current cost of electricity from the biochemical route (Chum et al., 2011).
20 The most optimistic in the pool of experts, Expert 10, provided costsestimates specific for Northern Europe and also assumed profits derived fromselling the heat co-produced with electricity.
G. Fiorese et al. / Energy Policy 65 (2014) 94–114 103
more costly technologies (such as conversions in small scaleplants) to set the 90th percentile and to less costly technologies(such as co-firing) to set the 10th percentile.
Most of the cost estimates provided by the experts are close to thelower bound of the IEA projections (IEA, 2012a). When asked toassume an increase in RD&D budget (Fig. 7), nine experts providedcosts below the more optimistic IEA projections for co-firing21.
As for biochemical conversions, we compare the experts’estimates to the current costs reported in the IPCC SRREN report(Chum et al., 2011). Our experts’ best guesses of the 2030 costs ofelectricity from biomass are generally lower than the current costsprovided by the IPCC, which are in the range of 17–21 cUSD/kWh.This testified to the experts’ belief that RD&D investment will helpimprove the efficiency of these technologies (Fig. 7). If RD&Dsupport to biomass is reduced or eliminated, experts’ estimatesincrease and become as high as the current costs provided by theIPCC (Fig. 8). This implicitly indicates that reductions in the publicRD&D budget would effectively translate in no cost improvementfor those technologies over the next 20 years.
Finally, experts’ estimates for thermochemical conversions pathsare in line with the expected cost reductions for 2020 provided in theIRENA report (IRENA, 2013). On the other hand, the experts are morepessimistic with respect to costs of biochemical conversions than theestimates presented in IRENA (2013); this might partly be due to thefact that our study and the IRENA study focus on different techno-logical paths within biochemical conversion.
Experts agree that feedstocks’ cost is the biggest component ofthe final cost of electricity. However, other factors also play a role,such as the need to secure capital investment for plant construc-tion, which varies according to the conversion technology, or theavailability of heat sinks to exploit the co-produced heat.
According to the majority of the experts, the production ofelectricity from biomass will evolve towards a mixed system ofsmall and large scale conversion plants. Three experts howeverdisagree, and believe that the greater role will be played by smallscale plants. Only one expert expects large scale plants to prevail.
When asked to estimate future costs in any RD&D scenariodifferent from the current one, the uncertainty associated with theexperts’ estimates, and measured as the difference between the 90thand 10th percentile, increases. In particular, all but one estimateprovided for the þ50% and þ100% RD&D scenarios, display anaverage increase in the uncertainty of 5% and 7%, respectively. For the
�50% and �100% scenarios, the uncertainty in the experts’ esti-mates increases on average by 1% and 4%, respectively.
The consistency of the experts’ cost estimates was checked bycomparing the elicited values with the experts’ probabilities that thecost of bioenergy in 2030 will be lower than threshold values, underall the different RD&D investment scenarios. About 25% of theelicited probabilities presented some inconsistencies compared tothe cost predictions provided by the experts under the three fundingscenarios. Follow-up interviews were therefore carried out to allowthe experts to critically reassess their answers. These new updatedvalues were those used for the analyses of the present section.
6. Diffusion of bioenergy technologies
In the fourth section of the questionnaire, we asked the experts toindicate in which geographical area of the world biomass technolo-gies have the highest probability of reaching commercial successfirst. Fourteen experts declared that the European Unionwould reachcost competitiveness first. Brazil, the USA and China follow, and werechosen by 4 experts, 3 experts and 1 expert, respectively.
We also inquired about the dynamics of technology transferbetween countries and regions of the world and their impact onnational RD&D programs. Most experts (13) affirmed that thecurrent conditions reflect a relatively successful cooperationamong different countries, which results in significant knowledgespillovers. In this framework, RD&D programs not only have thepurpose of developing biomass technologies nationally, but also ofmaintaining and improving a country's absorptive capacity. Anational RD&D program is therefore a binding need to be readyto adopt breakthrough technologies developed by other countries.
Given the dynamics of technology diffusion and spillovers, weasked the experts to assess the likelihood of different biomassenergy penetration scenarios by 2050. Assuming that bioenergytechnologies would be technically ready to compete with conven-tional electricity sources by 2030, we proposed three rates ofbioenergy penetration in the electricity generation mix, namely alow (10–25%), medium (25–50%) or high (450%) scenario. Weseparately assessed these probabilities for three groups of coun-tries where the deployment of biomass for power productioncould follow very different pathways: OECD, fast-growing coun-tries and developing countries.
Table 6 shows that our pool of experts is confident in thepotential of biomass technologies for electricity supply. For OECDcountries, seven experts assigned a high probability (more than60%) to the low penetration rate scenario. A bigger group believed
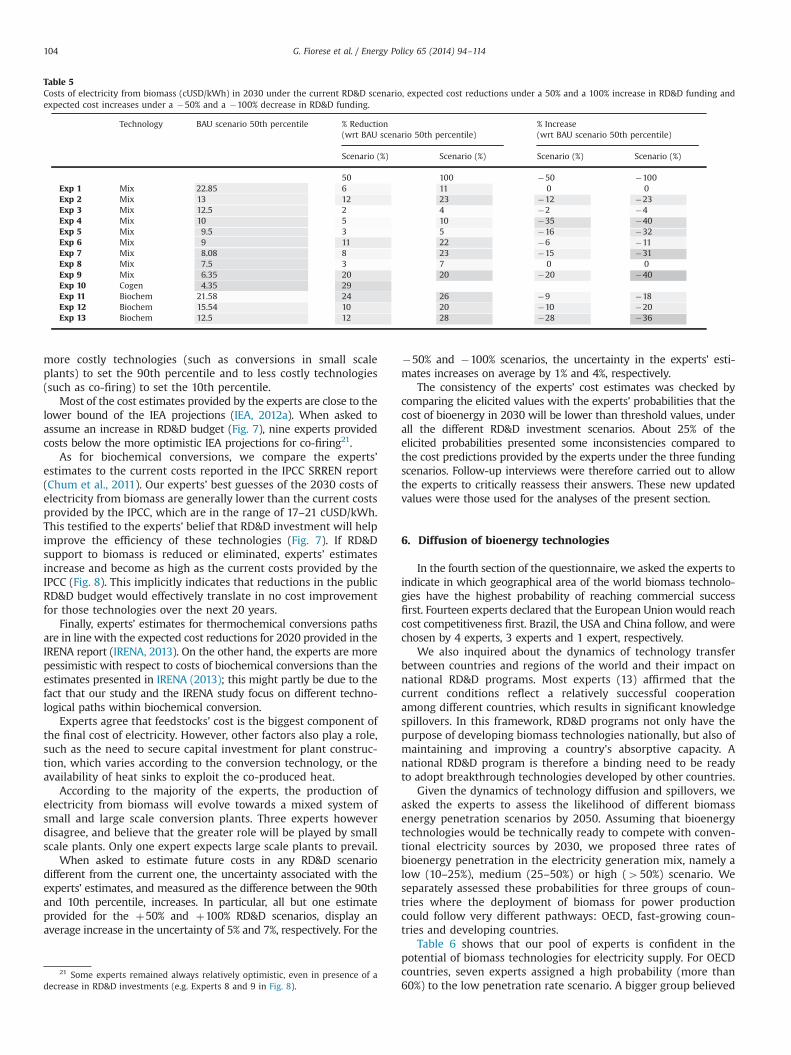
Table 5Costs of electricity from biomass (cUSD/kWh) in 2030 under the current RD&D scenario, expected cost reductions under a 50% and a 100% increase in RD&D funding andexpected cost increases under a �50% and a �100% decrease in RD&D funding.
21 Some experts remained always relatively optimistic, even in presence of adecrease in RD&D investments (e.g. Experts 8 and 9 in Fig. 8).
G. Fiorese et al. / Energy Policy 65 (2014) 94–114104
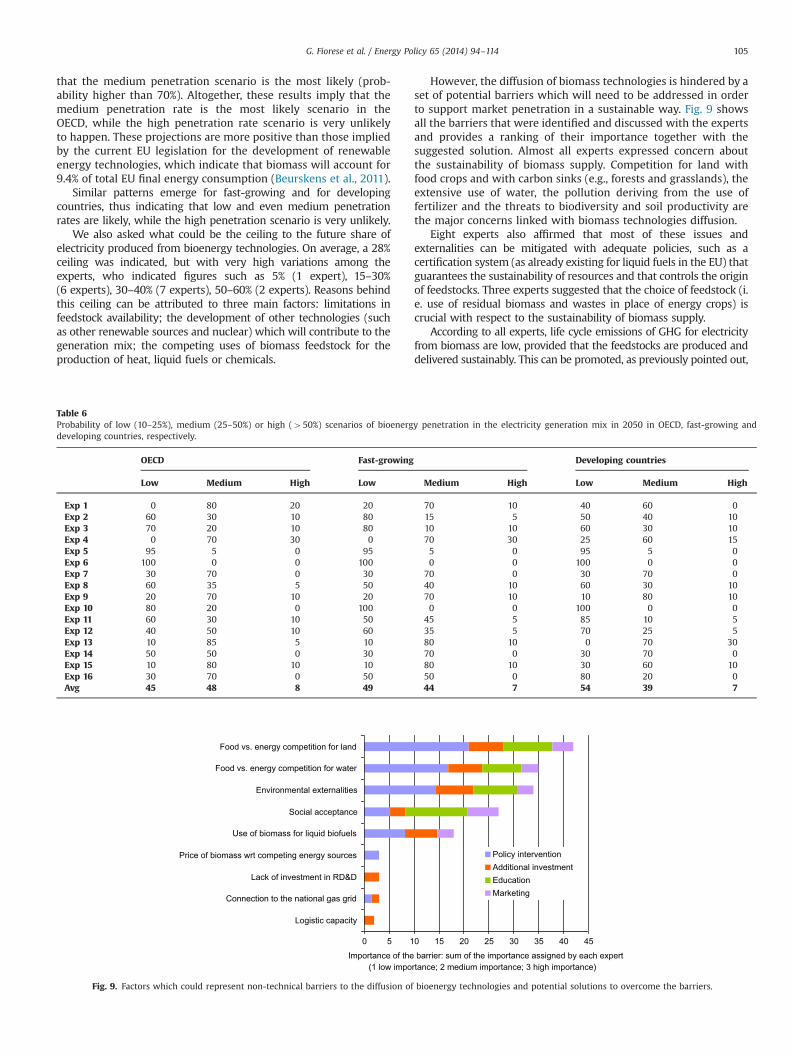
that the medium penetration scenario is the most likely (prob-ability higher than 70%). Altogether, these results imply that themedium penetration rate is the most likely scenario in theOECD, while the high penetration rate scenario is very unlikelyto happen. These projections are more positive than those impliedby the current EU legislation for the development of renewableenergy technologies, which indicate that biomass will account for9.4% of total EU final energy consumption (Beurskens et al., 2011).
Similar patterns emerge for fast-growing and for developingcountries, thus indicating that low and even medium penetrationrates are likely, while the high penetration scenario is very unlikely.
We also asked what could be the ceiling to the future share ofelectricity produced from bioenergy technologies. On average, a 28%ceiling was indicated, but with very high variations among theexperts, who indicated figures such as 5% (1 expert), 15–30%(6 experts), 30–40% (7 experts), 50–60% (2 experts). Reasons behindthis ceiling can be attributed to three main factors: limitations infeedstock availability; the development of other technologies (suchas other renewable sources and nuclear) which will contribute to thegeneration mix; the competing uses of biomass feedstock for theproduction of heat, liquid fuels or chemicals.
However, the diffusion of biomass technologies is hindered by aset of potential barriers which will need to be addressed in orderto support market penetration in a sustainable way. Fig. 9 showsall the barriers that were identified and discussed with the expertsand provides a ranking of their importance together with thesuggested solution. Almost all experts expressed concern aboutthe sustainability of biomass supply. Competition for land withfood crops and with carbon sinks (e.g., forests and grasslands), theextensive use of water, the pollution deriving from the use offertilizer and the threats to biodiversity and soil productivity arethe major concerns linked with biomass technologies diffusion.
Eight experts also affirmed that most of these issues andexternalities can be mitigated with adequate policies, such as acertification system (as already existing for liquid fuels in the EU) thatguarantees the sustainability of resources and that controls the originof feedstocks. Three experts suggested that the choice of feedstock (i.e. use of residual biomass and wastes in place of energy crops) iscrucial with respect to the sustainability of biomass supply.
According to all experts, life cycle emissions of GHG for electricityfrom biomass are low, provided that the feedstocks are produced anddelivered sustainably. This can be promoted, as previously pointed out,
Table 6Probability of low (10–25%), medium (25–50%) or high (450%) scenarios of bioenergy penetration in the electricity generation mix in 2050 in OECD, fast-growing anddeveloping countries, respectively.
OECD Fast-growing Developing countries
Low Medium High Low Medium High Low Medium High
Exp 1 0 80 20 20 70 10 40 60 0Exp 2 60 30 10 80 15 5 50 40 10Exp 3 70 20 10 80 10 10 60 30 10Exp 4 0 70 30 0 70 30 25 60 15Exp 5 95 5 0 95 5 0 95 5 0Exp 6 100 0 0 100 0 0 100 0 0Exp 7 30 70 0 30 70 0 30 70 0Exp 8 60 35 5 50 40 10 60 30 10Exp 9 20 70 10 20 70 10 10 80 10Exp 10 80 20 0 100 0 0 100 0 0Exp 11 60 30 10 50 45 5 85 10 5Exp 12 40 50 10 60 35 5 70 25 5Exp 13 10 85 5 10 80 10 0 70 30Exp 14 50 50 0 30 70 0 30 70 0Exp 15 10 80 10 10 80 10 30 60 10Exp 16 30 70 0 50 50 0 80 20 0Avg 45 48 8 49 44 7 54 39 7
0 5 10 15 20 25 30 35 40 45
Logistic capacity
Connection to the national gas grid
Lack of investment in RD&D
Price of biomass wrt competing energy sources
Use of biomass for liquid biofuels
Social acceptance
Environmental externalities
Food vs. energy competition for water
Food vs. energy competition for land
Importance of the barrier: sum of the importance assigned by each expert (1 low importance; 2 medium importance; 3 high importance)
Policy interventionAdditional investmentEducationMarketing
Fig. 9. Factors which could represent non-technical barriers to the diffusion of bioenergy technologies and potential solutions to overcome the barriers.
G. Fiorese et al. / Energy Policy 65 (2014) 94–114 105
by a certification system of biomass supply. However, since emissionscan vary with the specific application and with the location of theproject, life cycle emissions should always be assessed for the specificbioenergy system, as specifically pointed out by five experts. Comput-ing life-cycle emissions by considering the whole supply chain inspecific regions and applications would allow accounting for allsources not only for direct but also for indirect emissions, such asthose due to the use of fertilizers and pesticides or of digestate inanaerobic digestion processes, as well as methane emissions from theuse of biogas in engines.
Furthermore, two experts highlighted the necessity of investing toimprove agricultural development. Bioenergy production in thepublic eye is often associated with the presence of waste plants;for this reason, social acceptance of bioenergy is another major non-technical barrier that should be overcome with education andmarketing. Finally, barriers related to economic and finance issueswere considered less relevant than those related to environmentaland sustainability issues.
7. Conclusions
Bioenergy is a crucial component of the EU renewable energytargets. However, progress is needed to guarantee sustainablefeedstocks supply, to improve the energy conversion and to makebioenergy competitive with fossil fuel electricity.
We study the future prospects of bioenergy technologies relyingon sixteen EU leading experts through an ad hoc elicitation protocol.We assess the current status of technologies, their future develop-ments and the expected cost of electricity from biomass conditionalon different EU public RD&D funding scenarios. This results inimportant insights and policy recommendations for bioenergy.
Many of the selected technologies, which are currently underdevelopment, present a good potential to overcome technical bottle-necks by 2030. However it is very unlikely that electricity frombiomass will be cost-competitive with electricity from fossil fuels inthe absence of a climate policy. Several technologies, such asgasification, are already in the demonstration phase. RD&D is thuscrucial in supporting the final phases of the development ofbioenergy technology, and investments should be concentrated onapplied research and demonstration. On the other hand, basicresearch should always be present although with a less relevantrole. This is in line with current guidelines for the development ofbioenergy technology (e.g., European Bioenergy Industrial Initiative)but in sharp contrast with the EU historical budget allocation, mainlyfocused on basic research.
Assuming the current level of annual EU public RD&D until 2030,most experts’ best estimates of the cost of electricity from biomass liein the 7.5–13 cUSD/kWh range for a mix of technologies, with a 2030average cost of 8.9 cUSD/kWh.22 The cost of electricity frombiochemical conversions is higher, on average estimated at 16.5cUSD/kWh. Without any variation in RD&D in the next 20 years,the lower cost scenario (3 cUSD/kWh) is unlikely.23 The probabilitythat electricity from biomass will be competitive with electricityfrom fossil fuels (5.55 cUSD/kWh) is equal to 21%. On the other hand,with a climate policy in place (cost of electricity from coal at 11.26
cUSD/kWh), the probability rises to 54%, making cost competitive-ness in 2030 more likely than not.
Increases in RD&D funding lead to a decrease of the cost ofelectricity from biomass, which differs depending on the conversionroute considered. For thermochemical conversions, a 50% increase inRD&D leads to an 8% reduction of costs (9.5 cUSD/kWh). For thistechnology, further increases of the RD&D effort are unlikely to havea significant effect on cost reduction; however, they reduce thedivergence of experts’ estimates of the future costs of electricity.
The role of RD&D investment for biochemical conversions israther different. The average expected cost decreases by 16% and25% with 50% and 100% more RD&D funding, respectively. However,the cost of electricity generated with these technologies remainsconsistently higher than that obtained through thermochemicalconversions. For both conversion routes, even when doubling theRD&D effort, it remains unlikely (33% probability) that electricityfrom biomass will be competitive with that from fossil fuels withoutcarbon policy. On the other hand, if a carbon policy were in place, thecost-competitiveness would likely be reached (69% probability).
The role of RD&D on electricity costs is confirmed by the resultsrelative to the lower-than-current RD&D scenarios. An RD&D reduc-tion by half or more would make the cost competitiveness ofelectricity from biomass without carbon policy very unlikely (9%probability). With a carbon policy in place, chances would be higher(40% probability), but still lower than in the scenarios assuming anRD&D program.
The EU emerged as the region of the world with the greatestprobability of reaching a breakthrough and thus making electricityfrom biomass competitive. The chances of this happening in Brazilor in the USA are significantly smaller. This probably reflects thedifferent focus of EU and non-EU policy: the former more focusedtowards the promotion of biomass for electricity supply, the lattermore focused on biofuel technologies.
Experts showed little consensus when asked to assess the futurecontribution of bioenergy to the production of electricity, eventhough they agreed in considering very unlikely a high penetrationscenario. Half of the experts foresee a possible 10–25% penetrationscenario in 2050, while the others seven experts evaluate a 25–50%diffusion scenario as the most likely to happen. This vision isanalogous for OECD, fast growing and developing countries; howevera lower penetration rate appears more probable for the latter group.The scarcity of feedstocks and the competing use of biomass forbioenergy and biofuels emerged as the two most important factorslimiting the diffusion of electricity from biomass.
Experts expressed concern regarding the sustainability ofbiomass supply and the consequences that an increasing use ofbiomass could have on global land use, biodiversity and water use.However, these issues can be managed and negative impacts canbe limited when policies that promote biomass sustainable use(such as certification schemes) are put in place.
Acknowledgments
The research leading to these results has received funding from theEuropean Research Council under the European Community’s SeventhFramework Programme (FP7/2007-2013) / ERC grant agreement no.240895 – project ICARUS “Innovation for Climate ChangeMitigation: Astudy of Energy R&D, Its Uncertain Effectiveness and Spillovers”. Wethank the participating experts listed in Table 3, Agostino Gambarotta(Università di Parma) and Paolo Magni (Fondazione Politecnico diMilano) who helped us for the pilot tests. We are also grateful toJacopo Crimi, Barbara Racah, Laura Diaz Anadon, Erin Baker, GrangerMorgan and the other participants in the Carnegie Mellon CEDM/CDMC seminar series for their suggestions.
22 The average cost excludes Expert 1, see Section 5 for details.23 We use here the same framework for the treatment of uncertainties as
defined in the IPCC AR4 report (IPCC, 2007): “Where uncertainty in specificoutcomes is assessed using expert judgment and statistical analysis of a body ofevidence (e.g. observations or model results), then the following likelihood rangesare used to express the assessed probability of occurrence: virtually certain 499%;extremely likely 495%; very likely 490%; likely 466%; more likely than not450%; about as likely as not 33% to 66%; unlikely o33%; very unlikely o10%;extremely unlikely o5%; exceptionally unlikely o1%.”
G. Fiorese et al. / Energy Policy 65 (2014) 94–114106
Appendix A. The elicitation protocol
A.1. Self-evaluation of expertise
Please indicate how you would evaluate your level of expertise with respect to each of the following components of biofuel productioninputs, processes and technology:
Not familiar Basic knowledge Good knowledge Expert knowledge Among top experts
FeedstockAnimal wastesCrop residuesBy-productsWoodyEnergy crops
Other (specify)……………Conversion processes
Anaerobic digestionCombustionCo-combustionGasificationCo-gasificationPyrolysis for bio-oil
Other (specify)……………Electricity generation technology
Internal combustion engineMicro-gasificationSteam turbineGas turbineBIG/IGCC
Other (specify)……………CCS technology
CCSOther (specify)……………
A.2. Questionnaire
We are interested in understanding what specific conditions will lead to the commercial success of second and third generation biofueltechnologies and their diffusion thereafter. To achieve “commercial success” they will have to become economically competitive incomparison to conventional fossil fuels (with or without considering a price on carbon).
A.2.1. Evaluation of the status of the technology and barriers to commercial successIn this section we are interested in understanding which elements of the biofuel production path represent potential barriers to the
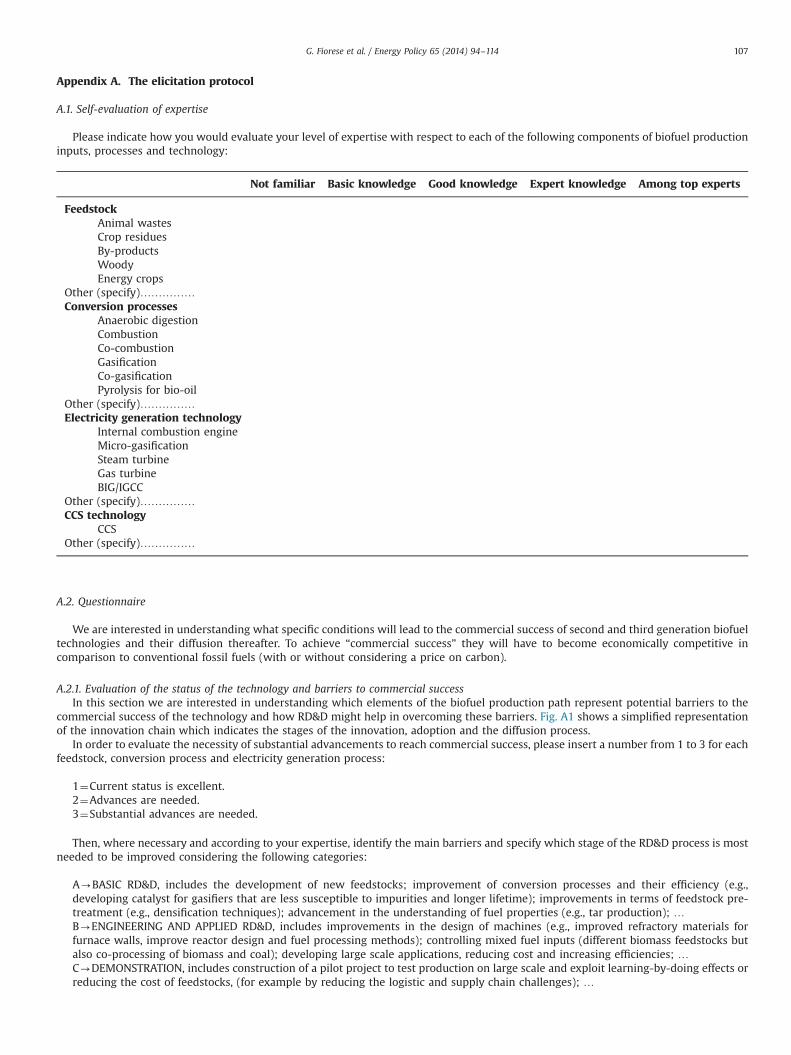
commercial success of the technology and how RD&D might help in overcoming these barriers. Fig. A1 shows a simplified representationof the innovation chain which indicates the stages of the innovation, adoption and the diffusion process.
In order to evaluate the necessity of substantial advancements to reach commercial success, please insert a number from 1 to 3 for eachfeedstock, conversion process and electricity generation process:
1¼Current status is excellent.2¼Advances are needed.3¼Substantial advances are needed.
Then, where necessary and according to your expertise, identify the main barriers and specify which stage of the RD&D process is mostneeded to be improved considering the following categories:
A-BASIC RD&D, includes the development of new feedstocks; improvement of conversion processes and their efficiency (e.g.,developing catalyst for gasifiers that are less susceptible to impurities and longer lifetime); improvements in terms of feedstock pre-treatment (e.g., densification techniques); advancement in the understanding of fuel properties (e.g., tar production); …B-ENGINEERING AND APPLIED RD&D, includes improvements in the design of machines (e.g., improved refractory materials forfurnace walls, improve reactor design and fuel processing methods); controlling mixed fuel inputs (different biomass feedstocks butalso co-processing of biomass and coal); developing large scale applications, reducing cost and increasing efficiencies; …C-DEMONSTRATION, includes construction of a pilot project to test production on large scale and exploit learning-by-doing effects orreducing the cost of feedstocks, (for example by reducing the logistic and supply chain challenges); …
G. Fiorese et al. / Energy Policy 65 (2014) 94–114 107
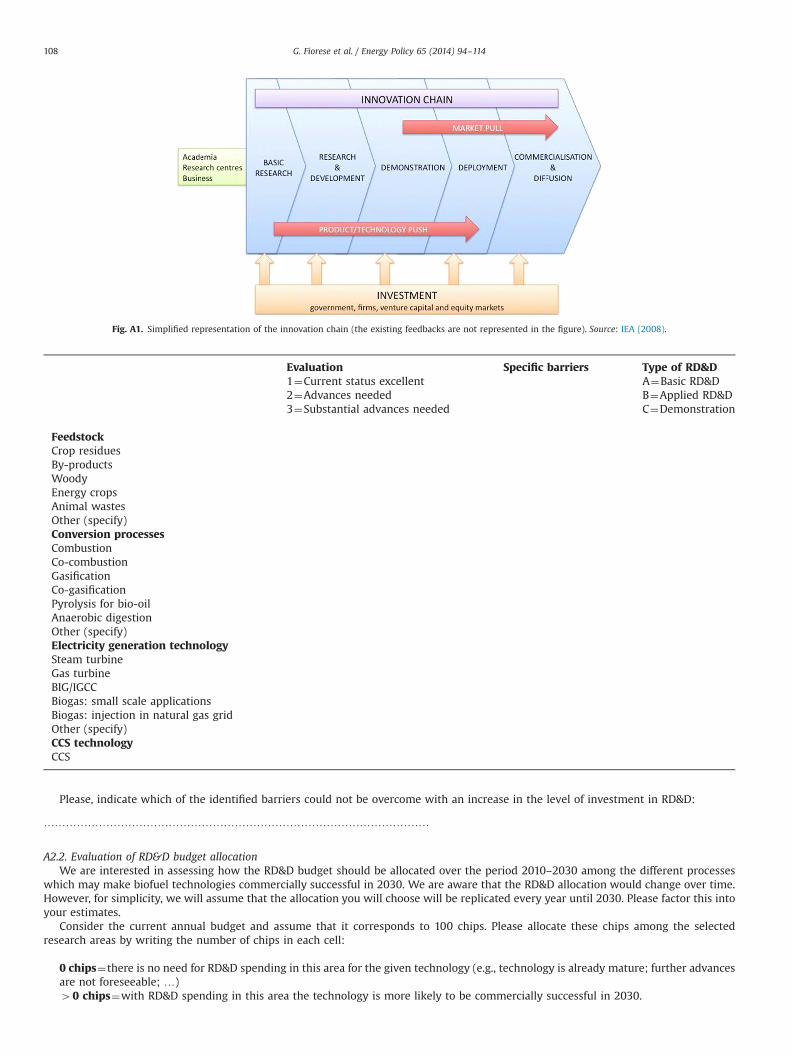
Fig. A1. Simplified representation of the innovation chain (the existing feedbacks are not represented in the figure). Source: IEA (2008).
Evaluation Specific barriers Type of RD&D1¼Current status excellent2¼Advances needed3¼Substantial advances needed
A¼Basic RD&DB¼Applied RD&DC¼Demonstration
FeedstockCrop residuesBy-productsWoodyEnergy cropsAnimal wastesOther (specify)Conversion processesCombustionCo-combustionGasificationCo-gasificationPyrolysis for bio-oilAnaerobic digestionOther (specify)Electricity generation technologySteam turbineGas turbineBIG/IGCCBiogas: small scale applicationsBiogas: injection in natural gas gridOther (specify)CCS technologyCCS
Please, indicate which of the identified barriers could not be overcome with an increase in the level of investment in RD&D:
……………………………………………………………………………………………
A2.2. Evaluation of RD&D budget allocationWe are interested in assessing how the RD&D budget should be allocated over the period 2010–2030 among the different processes
which may make biofuel technologies commercially successful in 2030. We are aware that the RD&D allocation would change over time.However, for simplicity, we will assume that the allocation you will choose will be replicated every year until 2030. Please factor this intoyour estimates.
Consider the current annual budget and assume that it corresponds to 100 chips. Please allocate these chips among the selectedresearch areas by writing the number of chips in each cell:
0 chips¼there is no need for RD&D spending in this area for the given technology (e.g., technology is already mature; further advancesare not foreseeable; …)40 chips¼with RD&D spending in this area the technology is more likely to be commercially successful in 2030.
G. Fiorese et al. / Energy Policy 65 (2014) 94–114108
Number of chips
FeedstockBiochemical conversionThermochemical conversionConversion processesBiochemical conversionThermochemical conversionElectricity generation technologyBiochemical conversionThermochemical conversionCCS technologyCCS
A.2.3. Evolution of bioenergy costs in different RD&D funding scenariosWe are interested in analysing the evolution of the expected cost of bioenergy technologies in power generation under different RD&D
funding scenarios. The aim is then to assess whether electricity generated from biomass will become competitive with electricitygenerated from fossil fuels (with or without accounting for a carbon tax). Cost competitiveness does not necessarily imply immediate andextensive diffusion of the technology, as there might exist other barriers to diffusion that we will investigate in the subsequent section. Fornow, let us concentrate on cost improvements.
Production costs should be estimated considering the total annual costs of producing a kWh of electricity from biomass. Totalestimated costs include annual capital costs, operating and maintenance costs (including maintenance, consumables, labour, wastehandling), biomass feedstock costs. No incentive or subsidy should be accounted for.
As an example, Table A1 lists the costs which can be attributed to feedstock, capital costs and operation and maintenance (O&M) forselected technologies. It also lists the assumptions about technology efficiency and the plant capacity necessary to calculate suchestimates.
The cost of generating electricity from biomass depends on (assumptions about) the following factors:
- Feedstock yields, defined as dry ton of feedstock per hectare of land;- Plant capacity, defined as the amount of processed biomass per day and measured in dry tons/day;- Plant lifetime, defined as the useful years of functioning of a plant;- Operation and maintenance costs, usually calculated as a percentage of Capital Costs;- Technology efficiency.
The current status of the above characteristics could be improved via further RD&D in order to lower the costs of electricity productionfrom biomass.
If you have in mind a specific amount of annual RD&D investment (for the next 20 years) and/or a time horizon that would allowbioenergy technologies to achieve commercial success, please state it now.
……………………………………………………………………………………………
Table A1Breakdown of selected cost estimates (2005 USD) and main assumptions for their calculation.
Gasification Flash Pyrolysis Biogas Biomass combustion steam cycle
Small scale Large scaleVoets et al. (2011) European Commission (2008b)
Annualized capital cost cUSD/kWh 7.61 3.20 3.97 4.63 2.98O&M expense cUSD/kWh 2.59 2.04 1.44 3.27 2.11Fuel cost cUSD/kWh 3.12 4.18 2.75 3.55 2.94Cost of electricity cUSD/kWh 13.32 9.42 8.16 11.44 8.03Assumptions:Plant capacity MW 5 5 0.3 5 30Project life y 20 20 25 30 30O&M % 4% 8% 4% 8% 8%Plant efficiency % 36% 44% 31% 24% 29%Capacity factor % 80% 80% 80% 80% 80%Biomass cost USD/dt 53.02 53.02 40 40 40Biomass HHV GJ/dt 17 17 – 17 17Discount rate % 10% 10% 10% 10% 10%
G. Fiorese et al. / Energy Policy 65 (2014) 94–114 109
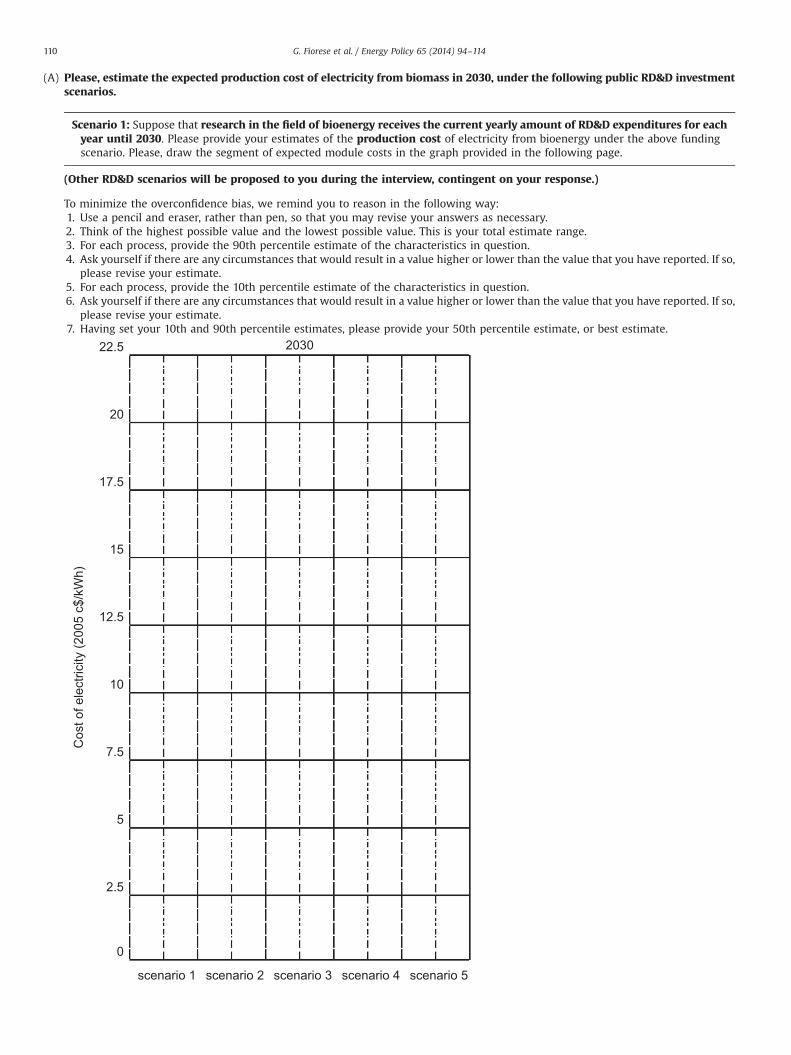
(A) Please, estimate the expected production cost of electricity from biomass in 2030, under the following public RD&D investmentscenarios.
Scenario 1: Suppose that research in the field of bioenergy receives the current yearly amount of RD&D expenditures for eachyear until 2030. Please provide your estimates of the production cost of electricity from bioenergy under the above fundingscenario. Please, draw the segment of expected module costs in the graph provided in the following page.
(Other RD&D scenarios will be proposed to you during the interview, contingent on your response.)
To minimize the overconfidence bias, we remind you to reason in the following way:1. Use a pencil and eraser, rather than pen, so that you may revise your answers as necessary.2. Think of the highest possible value and the lowest possible value. This is your total estimate range.3. For each process, provide the 90th percentile estimate of the characteristics in question.4. Ask yourself if there are any circumstances that would result in a value higher or lower than the value that you have reported. If so,
please revise your estimate.5. For each process, provide the 10th percentile estimate of the characteristics in question.6. Ask yourself if there are any circumstances that would result in a value higher or lower than the value that you have reported. If so,
please revise your estimate.7. Having set your 10th and 90th percentile estimates, please provide your 50th percentile estimate, or best estimate.
203022.5
20
17.5
15
12.5
10
Cos
t of e
lect
ricity
(200
5 c$
/kW
h)
7.5
5
2.5
0
scenario 1 scenario 2 scenario 3 scenario 4 scenario 5
G. Fiorese et al. / Energy Policy 65 (2014) 94–114110

(B) Please, state the probability that the cost of biomass generated electricity will be equal or below the provided breakthroughvalues within 2030 under the following public RD&D investment scenarios.
Scenario 1: Suppose that research in the field of biofuel receives the current yearly amount of RD&D expenditures for eachyear until 2030. Please complete the table below.
(Other RD&D scenarios will be proposed to you during the interview, contingent on your response.)
Cost of electricity Probability
Scenario 1 Scenario 2 Scenario 3 Scenario 4 Scenario 5
r11.27 cUSD/kWhr5.55 cUSD/kWhr3 cUSD/kWh
When providing production costs, were you referring to an EU country?□ yes□ no
In this section, we have asked you to discuss the production cost of electricity from biomass. Please indicate whether upon answering thequestions you were referring to the technology that you consider to be the most promising or to a mix of bioenergy technologies.
……………………………………………………………………………………………
Upon answering the question did you have in mind an optimal allocation of RD&D effort as you specified using ‘chips’ in Section 3 or thecurrent allocation as provided in Fig. 1?
……………………………………………………………………………………………
What factor do you believe will affect the most the cost of electricity generated from biomass:□ Feedstock□ Initial investment□ O&M costs□ …
Do you believe the bioenergy sector will develop towards:□ Small scale, decentralized plants□ Large scale, centralized plants□ A mix of the two above□ …
A.2.4. Discussion questions on knowledge spillovers and externalities
Which of the following countries do you think is more likely to be the first to reach a commercially successful breakthrough?□ Europe□ USA□ Japan□ China□ Other (specify) ……………………………
Do you think that the INNOVATION resulting from the EU R&D program will be affected by other countries’ R&D programs andinnovation (KNOWLEDGE SPILLOVERS)?
□ Secrecy – no cooperation—no knowledge spillovers□ Cooperation – knowledge spillovers – need for own r&d to develop absorptive capacity□ No secrecy – full knowledge spillovers – little role for own r&d program
Are you concerned about negative externalities which might derive from the diffusion of bioenergy technologies and mightimpact the environment and society as a whole?
…………………………………………………………………………………………What is your opinion with regards to bioenergy life cycle emissions?
……………………………………………………………………………………
G. Fiorese et al. / Energy Policy 65 (2014) 94–114 111
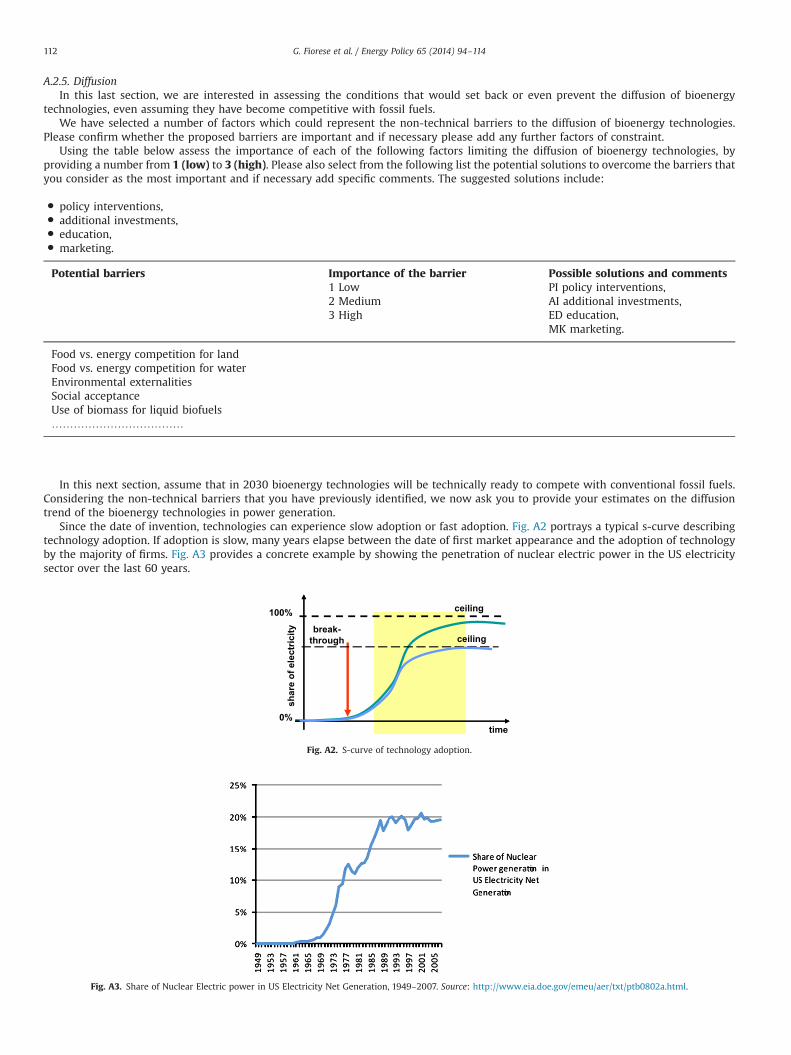
A.2.5. DiffusionIn this last section, we are interested in assessing the conditions that would set back or even prevent the diffusion of bioenergy
technologies, even assuming they have become competitive with fossil fuels.We have selected a number of factors which could represent the non-technical barriers to the diffusion of bioenergy technologies.
Please confirm whether the proposed barriers are important and if necessary please add any further factors of constraint.Using the table below assess the importance of each of the following factors limiting the diffusion of bioenergy technologies, by
providing a number from 1 (low) to 3 (high). Please also select from the following list the potential solutions to overcome the barriers thatyou consider as the most important and if necessary add specific comments. The suggested solutions include:
� policy interventions,� additional investments,� education,� marketing.
Potential barriers Importance of the barrier Possible solutions and comments1 Low PI policy interventions,2 Medium AI additional investments,3 High ED education,
MK marketing.
Food vs. energy competition for landFood vs. energy competition for waterEnvironmental externalitiesSocial acceptanceUse of biomass for liquid biofuels………………………………
In this next section, assume that in 2030 bioenergy technologies will be technically ready to compete with conventional fossil fuels.Considering the non-technical barriers that you have previously identified, we now ask you to provide your estimates on the diffusiontrend of the bioenergy technologies in power generation.
Since the date of invention, technologies can experience slow adoption or fast adoption. Fig. A2 portrays a typical s-curve describingtechnology adoption. If adoption is slow, many years elapse between the date of first market appearance and the adoption of technologyby the majority of firms. Fig. A3 provides a concrete example by showing the penetration of nuclear electric power in the US electricitysector over the last 60 years.
ceiling
break-through
time
shar
e of
ele
ctric
ity
100%
0%
ceiling
Fig. A2. S-curve of technology adoption.
Fig. A3. Share of Nuclear Electric power in US Electricity Net Generation, 1949–2007. Source: http://www.eia.doe.gov/emeu/aer/txt/ptb0802a.html.
G. Fiorese et al. / Energy Policy 65 (2014) 94–114112

We propose three scenarios, which correspond to specific penetration rates of bioenergy technologies within the power generationmix. With the aim to facilitate the understanding of the proposed scenarios, keep in mind that currently 30% of power generation inWestern Europe is provided by nuclear, 20% by natural gas and 7% by solid biomass. Please, assign a probability to the following scenarios:
Percent of power generation by 2050
10% 25% 450%
OECD ¼ 100%Fast growing ¼ 100%Developing countries ¼ 100%
We would like these three scenarios to loosely represent all possible options, so we ask you to ensure that the sum of probabilitiesis 100%.
The diffusion trend of bioenergy technologies in power generation will eventually reach a ceiling. Can you specify what this ceiling maybe (as percent of total power generation)?
……………………………………………………………………………………………What do you believe will be the major causes of the ceiling?
……………………………………………………………………………………………
Once the technology reaches the market in the first country, how long will it take for the technology to be diffused to otherOECD countries?
□ no time lag□ 5 years□ 10 years□ more (specify) ………….
Once the technology reaches the market in the first country, how long will it take for the technology to be diffused to fastgrowing countries?
□ no time lag□ 5 years□ 10 years□ more (specify) ………….
Once the technology reaches the market in the first country, how long will it take for the technology to be diffused to other nonOECD countries?
□ no time lag□ 5 years□ 10 years□ more (specify) ………….
References
Agostini, A., J. Giuntoli, A. Boulamanti, 2013. Carbon Accounting of Forest Bioenergy,Conclusions and Recommendations from a Critical Literature Review, L. Marelli(Ed.), JRC Technical Report, Report EUR 25354EN.
Anadón, L.D., Bosetti, V., Bunn, M., Catenacci, M., Lee, A., 2012. Expert judgmentsabout RD&D and the future of nuclear energy. Environ. Sci. Technol. Art 46 (21),11497–11504.
Angelis-Dimakis, A., Biberacher, M., Dominguez, J., Fiorese, G., Gadocha, S.,Gnansounou, E., Guariso, G., Kartalidis, A., Panichelli, L., Pinedo, I., Robba, M.,2011. Methods and tools to evaluate the availability of renewable energysources. Renewable Sustainable Energy Rev. 15 (2), 1182–1200.
Baker, E., Keisler, J., 2011. Cellulosic biofuels: expert views on prospects foradvancement. Energy 36 (1), 595–605.
Baker, E., Chon, H., Keisler, J., 2009a. Carbon capture and storage: combiningeconomic analysis with expert elicitations to inform climate policy. Clim.Change 96, 379–408.
Baker, E., Chon, H., Keisler, J., 2009b. Advanced solar R&D: combining economicanalysis with expert elicitations to inform climate policy. Energy Econ. 31, 37–49.
Baker, E., Chon, H., Keisler, J., 2010. Battery technology for electric and hybridvehicles: expert views about prospects for advancement. Technol. ForecastingSoc. Change 77 (7), 1139–1146.
Banja, M., F. Monforti-Ferrario, N. Scarlat, 2013. Review of Technical Assessment ofNational Renewable Energy Action Plans 2012, JRC Scientific and Policy Report,Report EUR 25757EN.
Bauen, A., Berndes, G., Junginger, M., Londo, M., Vuille, F., Ball, R., Bole, T., Chudziak,C., Faaij, A., Mozaffarian, H., 2009. Bioenergy—A Sustainable and Reliable EnergySource. A Review of Status and Prospects. IEA Bioenergy, Paris.
Baxter, D., N. Scarlat, J. Giuntoli, 2011. Bioenergy—Power and Heat Generation. In2011 Technology Map of the European Strategic Energy Technology Plan (SET-Plan), Technology Descriptions, JRC-IET—Joint Research Centre-Institute forEnergy and Transport, JRC Scientific and Technical Reports, Luxemburg,⟨http://setis.ec.europa.eu/⟩.
Beurskens, L.W.M., M. Hekkenberg, P. Vethman, 2011. Renewable Energy Projec-tions as Published in the National Renewable Energy Action Plans of theEuropean Member States Covering all 27 EU Member States with updates for 20Member States, ECN-E–10-069, ⟨http://www.ecn.nl/units/ps/themes/renewable-energy/projects/nreap/reports/⟩.
Bosetti, V., Carraro, C., Galeotti, M., Massetti, E., Tavoni, M., 2006. WITCH: a worldinduced technical change hybrid model. Energy J. 27, 13–37.
Bosetti, V., Carraro, C., Massetti, E., Sgobbi, A., Tavoni, M., 2009. Optimal energyinvestment and R&D strategies to stabilize greenhouse gas atmosphericconcentrations. Resour. Energy Econ. 31 (2), 123–137.
Bosetti, V., Catenacci, M., Fiorese, G., Verdolini, E., 2012. The future prospect of PV andCSP solar technologies: an expert elicitation survey. Energy Policy 49, 308–317.
Böttcher, H., Verkerk, P.J., Gusti, M., Havlík, P., Grassi, G., 2012. Projection of thefuture EU forest CO2 sink as affected by recent bioenergy policies using twoadvanced forest management models. GCB Bioenergy 4, 773–783.
Catenacci, M., Verdolini, E., Bosetti, V., Fiorese, G., 2013. Going electric: expertsurvey on the future of battery technologies for electric vehicles. Energy Policy61, 403–413.
G. Fiorese et al. / Energy Policy 65 (2014) 94–114 113
Chan, G., L. Diaz Anadon, M. Chan, A. Lee, 2011. Expert Elicitation of Cost,Performance, and RD&D Budgets for Coal Power with CCS, Working Paper,Energy Procedia, 4, 2685–2692.
Chum, H., A. Faaij, J. Moreira, G. Berndes, P. Dhamija, H. Dong, B. Gabrielle, A. GossEng, W. Lucht, M. Mapako, O. Masera Cerutti, T. McIntyre, T. Minowa, K.Pingoud, 2011. Bioenergy. In: IPCC Special Report on Renewable Energy Sourcesand Climate Change Mitigation [O. Edenhofer, R. Pichs‐Madruga, Y. Sokona, K.Seyboth, P. Matschoss, S. Kadner, T. Zwickel, P. Eickemeier, G. Hansen, S.Schlömer, C. von Stechow (Eds.)], Cambridge University Press, Cambridge,United Kingdom and New York, NY, USA.
Clemen, R.T., Reilly, T., 2001. Making Hard Decisions with DecisionTools. DuxburyThomson Learning, Pacific Grove, CA.
Curtright, A., Morgan, G.W., Keith, D.W., 2008. Expert assessments of futurephotovoltaic technologies. Environ. Sci. Technol. 42 (24), 9031–9038.
Dornburg, V., A. Faaij, H. Langeveld, G. van de Ven, F. Wester, H. van Keulen, K. vanDiepen, J. Ros, D. van Vuuren, G.J. van den Born, M. van Oorschot, F. Smout, H.Aiking, M. Londo, H. Mozaffarian, K. Smekens, M. Meeusen, M. Banse, E. Lysen,S. van Egmond (2008). Biomass Assessment: Assessment of Global BiomassPotentials and Their Links to Food, Water, Biodiversity, Energy Demand andEconomy, Netherlands Environmental Assessment Agency MNP, Report 500102012, January 2008.
European Commission, 2008a. Communication from the Commission to theEuropean Parliament, the Council, the European Economic and Social Commit-tee and the Committee of the Regions – 20 20 by 2020 – Europe's climatechange opportunity, COM(2008)30.
European Commission, 2008b. Energy Sources, Production Costs and Performanceof Technologies for Power Generation, Heating and Transport, EuropeanCommission, COM(2008)744.
European Commission, 2009a. Directive 2009/28/EC of the European Parliamentand of the Council of 23 April 2009 on the Promotion of the use of Energy fromRenewable Sources and Amending and Subsequently Repealing Directives2001/77/EC and 2003/30/EC.
European Commission, 2009b. Commission Staff Working Document Accompany-ing Document to the Communication from the Commission to the EuropeanParliament, the Council, the European Economic and Social Committee and theCommittee of the Regions on Investing in the Development of Low CarbonTechnologies (SET-Plan).A technology Roadmap (SEC (2009)1295).
European Commission, 2010. Report from the Commission to the Council and theEuropean Parliament on Sustainability Requirements for the use of Solid andGaseous Biomass Sources in Electricity, Heating and Cooling, COM(2010)11.
European Commission, 2012. EU energy in Figures, Statistical Pocketbook 2012,⟨http://ec.europa.eu/energy/observatory/statistics/statistics_en.htm⟩.
EurObserv'ER, 2012. Interactive EurObserv'ER Database, online: www.eurobserv-er.org (accessed 26 September 2012).
Fargione, J., Hill, J., Tilman, D., Polasky, S., Hawthorne, P., 2008. Land clearing andthe biofuel carbon debt. Science 319 (5867), 1235–1238.
Farrell, A.E., Gopal, A.R., 2008. Bioenergy research needs for heat electricity, andliquid fuels. MRS Bull. 33, 373–380.
Fiorese, G., Catenacci, M., Verdolini, E., Bosetti, V., 2013. Advanced biofuels: futureperspectives from an expert elicitation survey. Energy Policy 56, 293–311.
Fritsche, U.R, L. Iriarte, J. de Jong, E. van Thuijl, E. Lammers, A. Agostini, N. Scarlat,2013. Sustainability Criteria and Indicators for Solid Bioenergy from Forestsbased on the Joint Workshops on Extending the RED Sustainability Require-ments to Solid Bioenergy, ⟨http://www.iinas.org/redex.html⟩.
Gelfand, I., Zenone, T., Jasrotia, P., Chen, J., Hamilton, S.K., Robertson, G.P., 2011.Carbon debt of conservation reserve program (CRP) grasslands converted tobioenergy production. PNAS 108 (33), 13864–13869.
Giupponi C., R. Camera, A. Fassio, A. Lasut, J. Mysiak, A. Sgobbi, 2006. NetworkAnalysis, Creative System Modelling and Decision Support: the NetSyMoDApproach, FEEM Working Paper, Nota di lavoro 46. 2006.
IEA International Energy Agency, 2008. Energy Technology Perspectives 2008:Scenarios and Strategies to 2050, OECD/IEA, Paris.
IEA International Energy Agency, 2011. Renewables Information 2011 Edition.IEA International Energy Agency, 2012a. Technology Roadmap, Bioenergy for Heat
and Power, OECD/IEA, Paris.IEA International Energy Agency, 2012b. 2012 Key World Energy Statistics, Paris.IEA International Energy Agency, 2012c. Renewables Information-2012 Edition, Paris.IEA International Energy Agency, 2012d. RDD Budget Database, Accessed October
2012.IPCC, 2007. Climate Change 2007: Synthesis Report. Contribution of Working
Groups I, II and III to the Fourth Assessment Report of the IntergovernmentalPanel on Climate Change [Core Writing Team, Pachauri, R.K and Reisinger, A.(Eds.)], IPCC, Geneva, Switzerland, 104 pp.
IPTS Institute for Prospective Technological Studies, 2010. Prospective Outlook forthe Long term Energy System—POLES Manual, Joint Research Centre (JRC) ofthe European Union, Institute for Prospective Technological Studies (IPTS),Sevilla.
IRENA International Renewable Energy Agency, 2013. Renewable Power GenerationCosts in 2012: an overview, IRENA Report.
Keeney, R.L., Von Winterfeldt, D., 1991. Eliciting probabilities from experts incomplex technical problems. Trans. Eng. Manage. 38, 191–201.
Kretschmer, B., S. Bennett, 2011. Analysing Bioenergy Implementation in EUMember States: Results from the Biomass Futures Expert Survey, ⟨http://www.ieep.eu/assets/827/IEEP_Biomass_Futures_Expert_Survey.pdf⟩.
Lal, R., 2005. Soil erosion and carbon dynamics. Soil Tillage Res. 81, 137–142.McKendry, P., 2002a. Energy production from biomass (Part 1): Overview of
biomass. Bioresour. Technol. 83 (1), 37–46.McKendry, P., 2002b. Energy production from biomass (Part 2): Conversion
technologies. Bioresour. Technol. 83 (1), 47–54.McKendry, P., 2002c. Energy production from biomass (Part 3): Gasification
technologies. Bioresour. Technol. 83 (1), 55–63.Meyer, M.A., Booker, J.M., 1991. Eliciting and Analyzing Expert Judgment: A
Practical Guide. Academic Press Ltd., London.Morgan, G., Henrion, M., 1990. Uncertainty: A Guide to Dealing with Uncertainty in
Quantitative Risk and Policy Analysis. Cambridge University Press, New York.O'Hagan, A., Buck, C.E., Daneshkhan, A., Eiser, J.R., Garthwaite, P.H., Jenkinson, D.J.,
Oakey, J.E., Rakow, T., 2006. Uncertain Judgments: Eliciting Experts’ Probabil-ities. John Wiley & Sons, Ltd..
Phillips, L.D., 1999. Group elicitation of probability distributions: are many headsbetter than one?. In: Shanteau, J., et al. (Eds.), Decision Science and Technology:Reactions on the Contributions of Ward Edwards. Kluwer Academic Publishers,Norwell, MA, pp. 313–330.Poppe, M., Horta Nogueira, L.A., 2009. Le bioéthanol: de l’expérience brési-lienne à la formation d’un marché global. Revue de l’Énergie 591, 1–10.
Salganik, M.J., Heckathorn, D.D., 2004. Sampling and estimation in hidden popula-tions using respondent-drive sampling. Sociological. Method. 34, 193–239.
Searchinger, T., Heimlich, R., Houghton, R.A., Dong, F., Elobeid, A., Fabiosa, J., Tokgoz,S., Hayes, D., Yu, T.H., 2008. Use of U.S. croplands for biofuels increasesgreenhouse gases through emissions from land-use change. Science 319,1238–1240.
Tilman, D., Socolow, R., Foley, J.A., Hill, J., Larson, E., Lynd, L., Pacala, S., Reilly, J.,Searchinger, T., Somerville, C., Williams, R., 2009. Beneficial biofuels—the food,energy, and environment trilemma. Science 325, 270–271.
Voets, T., Kuppens, T., Cornelissen, T., Thewys, T., 2011. Economics of electricity andheat production by gasification or flash pyrolysis of short rotation coppice inFlanders (Belgium), Biomass and Bioenergy. Biomass Bioenergy 35 (5), 1912–1924.
G. Fiorese et al. / Energy Policy 65 (2014) 94–114114