The Pierre Auger Observatory scaler mode for the study of solar activity modulation of galactic...
17
The Pierre Auger Observatory scaler mode for the study of solar activity modulation of galactic cosmic rays This article has been downloaded from IOPscience. Please scroll down to see the full text article. 2011 JINST 6 P01003 (http://iopscience.iop.org/1748-0221/6/01/P01003) Download details: IP Address: 131.215.220.185 The article was downloaded on 24/06/2011 at 16:16 Please note that terms and conditions apply. View the table of contents for this issue, or go to the journal homepage for more Home Search Collections Journals About Contact us My IOPscience
Transcript of The Pierre Auger Observatory scaler mode for the study of solar activity modulation of galactic...
The Pierre Auger Observatory scaler mode for the study of solar activity modulation of
galactic cosmic rays
This article has been downloaded from IOPscience. Please scroll down to see the full text article.
2011 JINST 6 P01003
(http://iopscience.iop.org/1748-0221/6/01/P01003)
Download details:
IP Address: 131.215.220.185
The article was downloaded on 24/06/2011 at 16:16
Please note that terms and conditions apply.
View the table of contents for this issue, or go to the journal homepage for more
Home Search Collections Journals About Contact us My IOPscience

2011 JINST 6 P01003
PUBLISHED BY IOP PUBLISHING FOR SISSA
RECEIVED: August 17, 2010REVISED: November 24, 2010
ACCEPTED: December 1, 2010PUBLISHED: January 12, 2011
The Pierre Auger Observatory scaler mode for thestudy of solar activity modulation of galactic cosmicrays
The Pierre Auger collaboration
The Pierre Auger Observatory,Malargue, Argentina
ABSTRACT: Since data-taking began in January 2004, the Pierre Auger Observatory has beenrecording the count rates of low energy secondary cosmic rayparticles for the self-calibrationof the ground detectors of its surface detector array. Aftercorrecting for atmospheric effects, mod-ulations of galactic cosmic rays due to solar activity and transient events are observed. Temporalvariations related with the activity of the heliosphere canbe determined with high accuracy due tothe high total count rates. In this study, the available dataare presented together with an analysisfocused on the observation of Forbush decreases, where a strong correlation with neutron monitordata is found.
KEYWORDS: Cherenkov detectors; Large detector systems for particleand astroparticle physics;Particle detectors
c© 2011 IOP Publishing Ltd and SISSA doi:10.1088/1748-0221/6/01/P01003
2011 JINST 6 P01003
Contents
1 Introduction 1
2 The scaler mode 3
3 Scaler data treatment 3
4 Data interpretation 4
5 Conclusions 8
1 Introduction
The heliospheric modulation of Galactic Cosmic Rays (GCRs)observed near Earth is controlledby the solar activity. In particular it is influenced by the variability of solar wind (SW) conditions,due to the solar cycle modulation (e.g., through changes of the global structure and polarity of themagnetic field in the heliosphere) and to transient eruptions of solar ejecta. The variation of thediffusion coefficient due to different levels and properties of interplanetary magnetic field (IMF)fluctuations can also affect this modulation.
The observed modulation of cosmic rays (CRs) intensity provides information about the trans-port of particles in the inner and outer heliosphere, and also about particles coming into the solarsystem from the Local Interstellar medium, see for example [1]. In particular GCRs intensityobserved near Earth have shown a long-term modulation (associated with the solar cycle) andshort-term variations, such as Forbush decreases [2]. These transient events are short-term periodsof strong depressions of the cosmic ray flux observed at Earth. As observed in neutron monitors(NMs) and muon detectors, the structure of Forbush decreases is asymmetrical, starting suddenlyand recovering smoothly with typical recovery times of the order of several days. A typical Forbushdecrease is caused by the transit of a solar ejecta (i.e., theinterplanetary manifestation of a CoronalMass Ejection, CME) near Earth [3].
Dedicated neutron monitors are being used since several decades ago as ground observatoriesto measure variations of CRs intensities. More recently many ground based CR detectors aimingat CR physics at higher energies are also being used for thesestudies.
The Pierre Auger Observatory [4] was designed to study the physics of cosmic rays at thehighest energies. It is located in Malargue, Argentina (69.3o W, 35.3o S, 1400 m a.s.l.). Detectionof cosmic rays of energies above 1018 eV requires the instrumentation of a huge detection area, dueto the extremely low flux of particles at these extreme energies. The Auger Observatory combinestwo detection techniques in a hybrid design: the observation of the fluorescence light produced bythe secondary particles as they propagate through the atmosphere, and the direct measurement ofparticles reaching ground level. The layout of the Pierre Auger Observatory is shown in figure1.
– 1 –

2011 JINST 6 P01003
Figure 1. Layout of the Pierre Auger Observatory at Malargue, Argentina. The position of the four FDbuildings surrounding the SD array are indicated by the black squares, with gray lines indicating the fieldof view of the six telescopes at each building. Orange dots mark the position of each of the 1600 water-Cherenkov detectors, with a 1.5 km spacing between nearest neighbours.
The interaction of a high-energy particle with the atmosphere produces a cascade with a hugenumber of secondary particles called an Extensive Atmospheric Shower (EAS). The longitudinaldevelopment of the EAS is followed by the Fluorescence Detector [5] (FD) consisting of 24 tele-scopes grouped in units of six telescopes at four different locations (Los Leones, Coihueco, LomaAmarilla and Los Morados). FD operates only in moonless and clear-weather nights, with an oper-ational average duty cycle of 13% of the total time. It overlooks the atmosphere above a 3000 km2
area, where the Surface Detector (SD) [4] is deployed.
The SD is an array of more than 1600 water-Cherenkov detectors placed in a triangular gridwith a spacing of 1500 m. The lateral (transverse) distribution of secondary particles of EASat ground level is sampled by using the SD array. Each water-Cherenkov detector consists of apolyethylene tank (10 m2 area) containing 12 tonnes of high-purity water in a highly-reflectiveTyvekR© liner bag [6], providing a total of about 16000 m2 of collection area for the full SD array.Cherenkov radiation generated by the passage of charged particles through the water volume ineach detector is collected by three 9” Photonis XP1805PA/1 photomultiplier tubes (PMTs). Theoutput signals from the PMTs (one directly from the anode andthe other one from the last dynodewith an amplification factor of 32 to increase the dynamic range) are processed by six 10-bit flashanalog-to-digital converters (FADC) with a sampling rate of 40 MHz (25 ns per time bin). A GPSsystem is used for timing and synchronisation. Each detector is powered by two solar panels andbatteries, working as an autonomous station linked to the central data acquisition system (CDAS)
– 2 –
2011 JINST 6 P01003
in Malargue through a dedicated radio network. Typically,more than 98% of the detectors areoperational at any given time.
The calibration is performed by local electronics in each detector [7], given the limited avail-able bandwidth (1200 bps per station [8]). The signal produced in a detector by a vertical andcentral through-going muon, known as the vertical-equivalent muon (VEM), is used as a referencefor calibration. Signals recorded by the detectors are converted to units of VEM.
The detectors are sensitive to charged particles in the EAS at ground level (essentially domi-nated byµ± ande±), as well as to high energy photons, as these convert ine+e− pairs in the watervolume. While the detector acts as a calorimeter forγ ande±, the energy deposited by energeticmuons (with energiesE & 350 MeV) is nearly proportional to the track length of the muon throughthe detector, as the water volume is not enough to stop them. These muons therefore produce acharacteristic hump in a background charge histogram [9, 10] that can be used for calibration [7].Using a test detector with an external trigger from a muon hodoscope, the muon hump in the chargehistogram was found to be at (1.03±0.02) VEM [10, 11].
Given the typical energy losses of muons in water for high energy muons [12], (dE/dx)µ ≃
2 MeV cm−1, a vertical and central muon deposits∼ 240 MeV in a detector with 1.2 m depth ofwater. At the operating gain of the SD detector, the correspondence between the amplitude of thepulse in FADC counts and the energy deposited by a particle inthe detector is 1 FADC≃ 5 MeV.For details, see [7].
2 The scaler mode
The single particle technique [13], used in many cosmic rays experiments, consists in recording lowthreshold rates (scalers) with all the surface detectors ofthe array. Transient events such as GammaRay Bursts (GRBs) [14–17] and solar flares [18, 19] are expected to be seen as a significant changeof the counting rates from the expected value.
In March 2005, a first set of scalers was implemented in all thedetectors of the SD [14], for thesearch of GRBs and for long term stability and monitoring studies. These counters registered anysignal above a threshold of 3 FADC counts, corresponding to an energy of∼ 15 MeV deposited byparticles that reach the detector in a 25 ns bin. The typical average scaler rates obtained were around3800 counts per second per detector, i.e, 380 counts s−1 m−2. A new scaler mode, with a thresh-old of 3 FADC counts and an upper bound of 20 FADC counts (∼ 100 MeV) was introduced inSeptember 2005 to remove signals produced by muons and thus to reduce the background noise forGRBs searches, reducing the average scaler rate of each detector to∼ 2000 counts per second [14].The rates at each detector are registered for every second and sent to the CDAS for storage andfurther analysis. The main characteristics of the scalers in both periods are summarised in table1.
3 Scaler data treatment
Scaler rates are influenced by the intrinsically non-constant rate of low energy-particles, atmo-spheric conditions and eventual instrumental instabilities. These effects have to be taken into ac-count before searching for transient events (that last longer than a few minutes) and for studyingthe long term solar modulation of the galactic cosmic ray flux[19].
– 3 –
2011 JINST 6 P01003
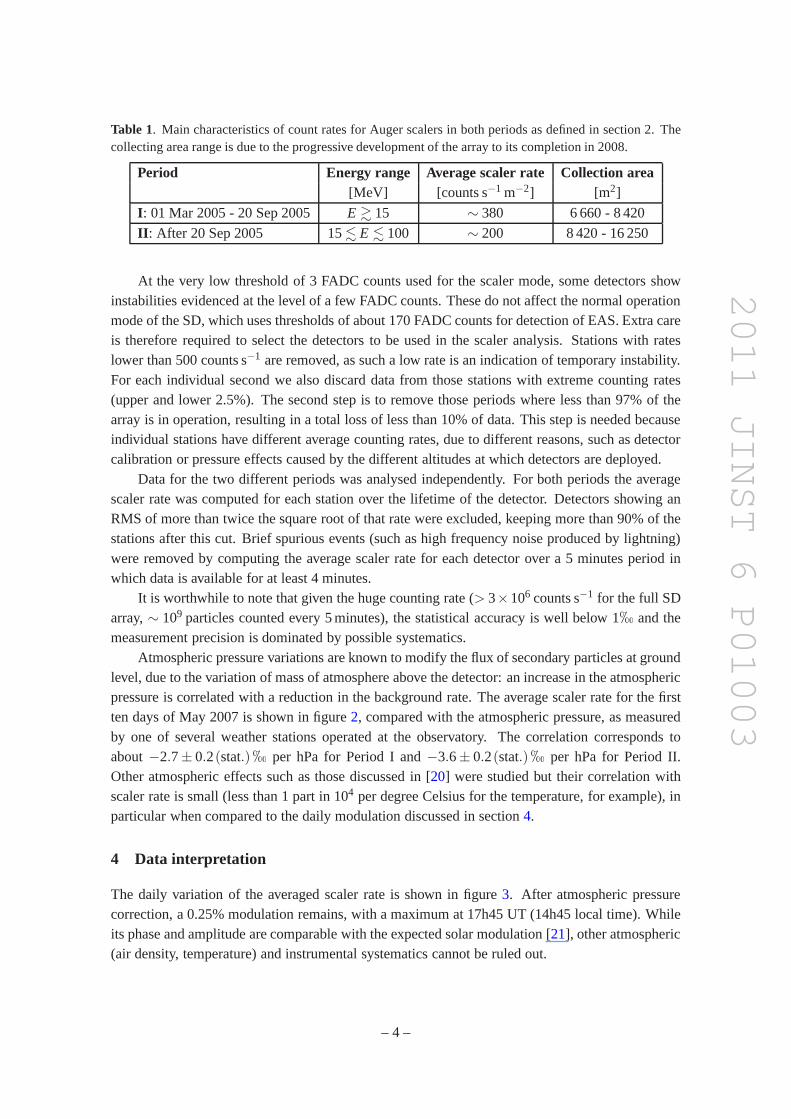
Table 1. Main characteristics of count rates for Auger scalers in both periods as defined in section 2. Thecollecting area range is due to the progressive developmentof the array to its completion in 2008.
Period Energy range Average scaler rate Collection area[MeV] [counts s−1 m−2] [m2]
I: 01 Mar 2005 - 20 Sep 2005 E & 15 ∼ 380 6 660 - 8 420
II: After 20 Sep 2005 15. E . 100 ∼ 200 8 420 - 16 250
At the very low threshold of 3 FADC counts used for the scaler mode, some detectors showinstabilities evidenced at the level of a few FADC counts. These do not affect the normal operationmode of the SD, which uses thresholds of about 170 FADC countsfor detection of EAS. Extra careis therefore required to select the detectors to be used in the scaler analysis. Stations with rateslower than 500 counts s−1 are removed, as such a low rate is an indication of temporary instability.For each individual second we also discard data from those stations with extreme counting rates(upper and lower 2.5%). The second step is to remove those periods where less than 97% of thearray is in operation, resulting in a total loss of less than 10% of data. This step is needed becauseindividual stations have different average counting rates, due to different reasons, such as detectorcalibration or pressure effects caused by the different altitudes at which detectors are deployed.
Data for the two different periods was analysed independently. For both periods the averagescaler rate was computed for each station over the lifetime of the detector. Detectors showing anRMS of more than twice the square root of that rate were excluded, keeping more than 90% of thestations after this cut. Brief spurious events (such as highfrequency noise produced by lightning)were removed by computing the average scaler rate for each detector over a 5 minutes period inwhich data is available for at least 4 minutes.
It is worthwhile to note that given the huge counting rate (> 3×10⁶ counts s−1 for the full SDarray,∼ 109 particles counted every 5 minutes), the statistical accuracy is well below 1h and themeasurement precision is dominated by possible systematics.
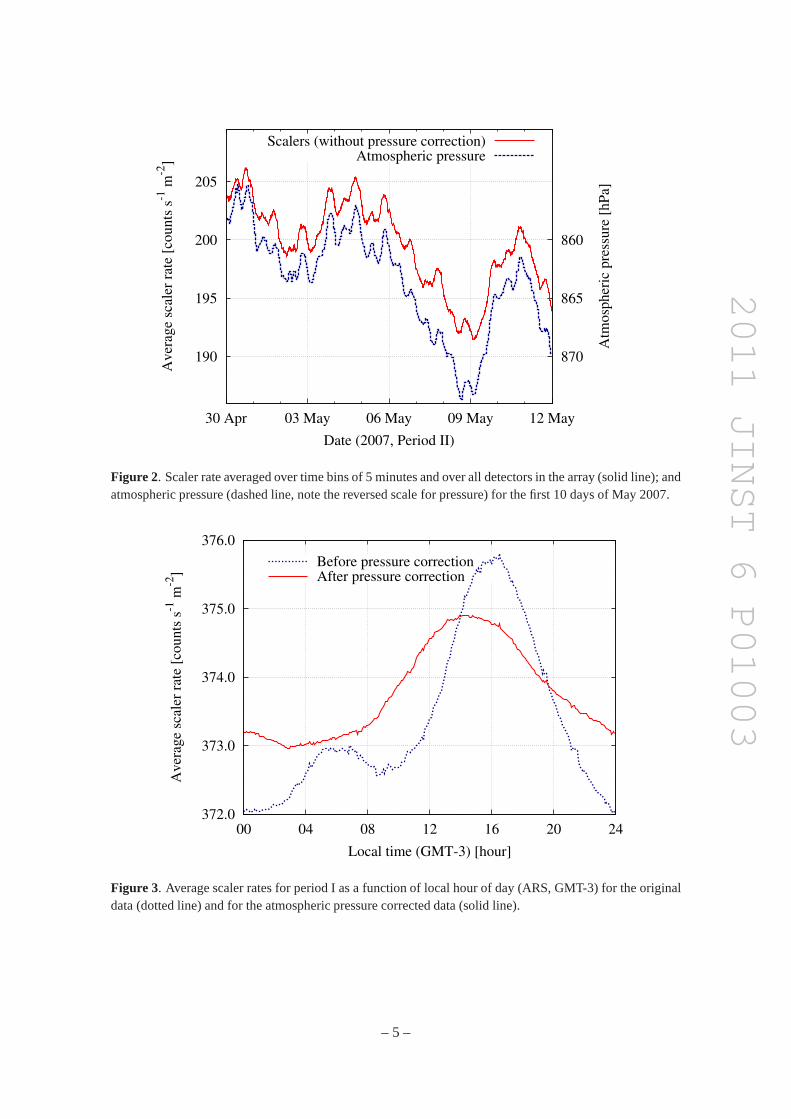
Atmospheric pressure variations are known to modify the fluxof secondary particles at groundlevel, due to the variation of mass of atmosphere above the detector: an increase in the atmosphericpressure is correlated with a reduction in the background rate. The average scaler rate for the firstten days of May 2007 is shown in figure2, compared with the atmospheric pressure, as measuredby one of several weather stations operated at the observatory. The correlation corresponds toabout−2.7± 0.2(stat.)h per hPa for Period I and−3.6± 0.2(stat.)h per hPa for Period II.Other atmospheric effects such as those discussed in [20] were studied but their correlation withscaler rate is small (less than 1 part in 104 per degree Celsius for the temperature, for example), inparticular when compared to the daily modulation discussedin section4.
4 Data interpretation
The daily variation of the averaged scaler rate is shown in figure 3. After atmospheric pressurecorrection, a 0.25% modulation remains, with a maximum at 17h45 UT (14h45 local time). Whileits phase and amplitude are comparable with the expected solar modulation [21], other atmospheric(air density, temperature) and instrumental systematics cannot be ruled out.
– 4 –
2011 JINST 6 P01003
190
195
200
205
30 Apr 03 May 06 May 09 May 12 May
870
865
860
Aver
age
scal
er r
ate
[counts
s-1
m-2
]
Atm
osp
her
ic p
ress
ure
[hP
a]
Date (2007, Period II)
Scalers (without pressure correction)Atmospheric pressure
Figure 2. Scaler rate averaged over time bins of 5 minutes and over alldetectors in the array (solid line); andatmospheric pressure (dashed line, note the reversed scalefor pressure) for the first 10 days of May 2007.
372.0
373.0
374.0
375.0
376.0
00 04 08 12 16 20 24
Aver
age
scal
er r
ate
[counts
s-1
m-2
]
Local time (GMT-3) [hour]
Before pressure correctionAfter pressure correction
Figure 3. Average scaler rates for period I as a function of local hourof day (ARS, GMT-3) for the originaldata (dotted line) and for the atmospheric pressure corrected data (solid line).
– 5 –
2011 JINST 6 P01003
365
375
385
Apr2005
May2005
Jun2005
Jul2005
Aug2005
Sep2005
68
71
74
77
Aver
age
scal
er r
ate
[counts
s-1
m-2
]
Rom
e N
M r
ate
[counts
s-1
]
Date (Period I)
Auger SD scalers (after pressure correction)Rome neutron monitor
195
200
205
Jul2006
Aug2006
Sep2006
Oct2006
Nov2006
Dec2006
74
76
78
80
Aver
age
scal
er r
ate
[counts
s-1
m-2
]
Rom
e N
M r
ate
[counts
s-1
]
Date (Period II)
Auger SD scalers (after pressure correction)Rome neutron monitor
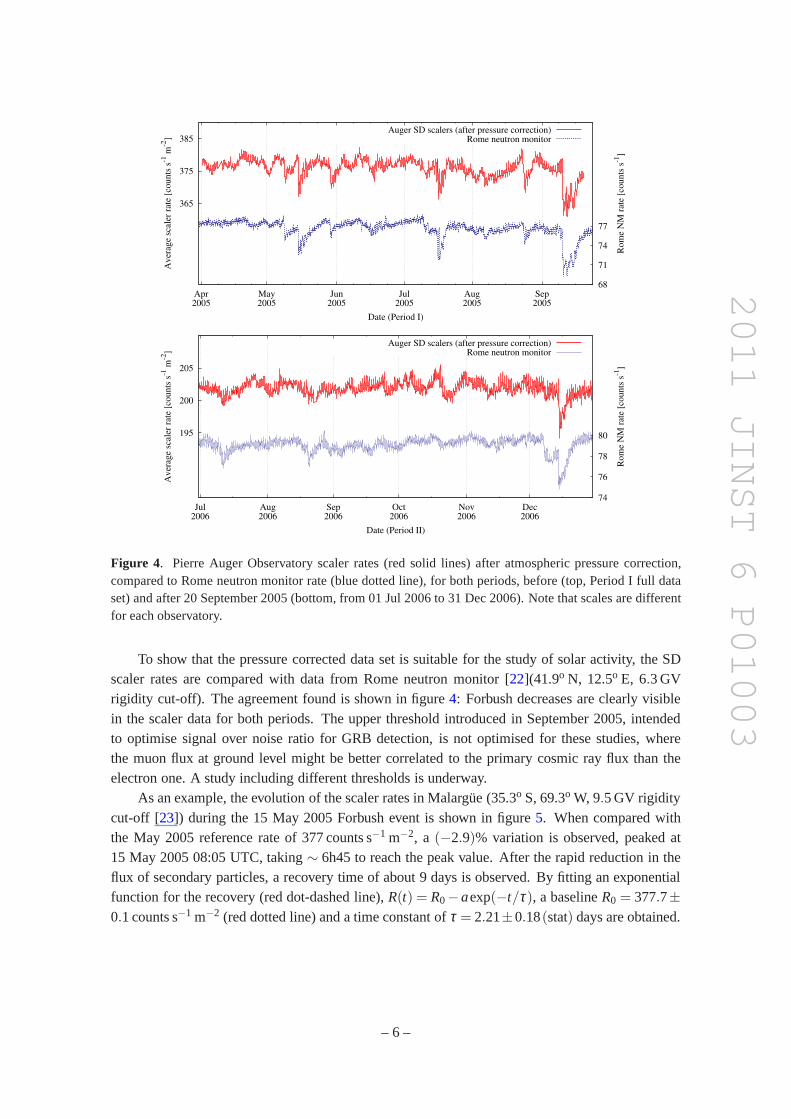
Figure 4. Pierre Auger Observatory scaler rates (red solid lines) after atmospheric pressure correction,compared to Rome neutron monitor rate (blue dotted line), for both periods, before (top, Period I full dataset) and after 20 September 2005 (bottom, from 01 Jul 2006 to 31 Dec 2006). Note that scales are differentfor each observatory.
To show that the pressure corrected data set is suitable for the study of solar activity, the SDscaler rates are compared with data from Rome neutron monitor [22](41.9o N, 12.5o E, 6.3 GVrigidity cut-off). The agreement found is shown in figure4: Forbush decreases are clearly visiblein the scaler data for both periods. The upper threshold introduced in September 2005, intendedto optimise signal over noise ratio for GRB detection, is notoptimised for these studies, wherethe muon flux at ground level might be better correlated to theprimary cosmic ray flux than theelectron one. A study including different thresholds is underway.
As an example, the evolution of the scaler rates in Malargue(35.3o S, 69.3o W, 9.5 GV rigiditycut-off [23]) during the 15 May 2005 Forbush event is shown in figure5. When compared withthe May 2005 reference rate of 377 counts s−1 m−2, a (−2.9)% variation is observed, peaked at15 May 2005 08:05 UTC, taking∼ 6h45 to reach the peak value. After the rapid reduction in theflux of secondary particles, a recovery time of about 9 days isobserved. By fitting an exponentialfunction for the recovery (red dot-dashed line),R(t) = R0−aexp(−t/τ), a baselineR0 = 377.7±0.1 counts s−1 m−2 (red dotted line) and a time constant ofτ = 2.21±0.18(stat) days are obtained.
– 6 –
2011 JINST 6 P01003
365
370
375
380
385
0 2 4 6 8 10 12 1459
60
61
62
63
64
Aver
age
Auger
sca
ler
rate
[co
unts
s-1
m-2
]
Los
Cer
rill
os
rate
[co
unts
s-1
]
Days since 13 May 2005 00:00 UTC (Period I)
6h45m
Average Auger SD scalersLos Cerrillos (Chile) 6NM64
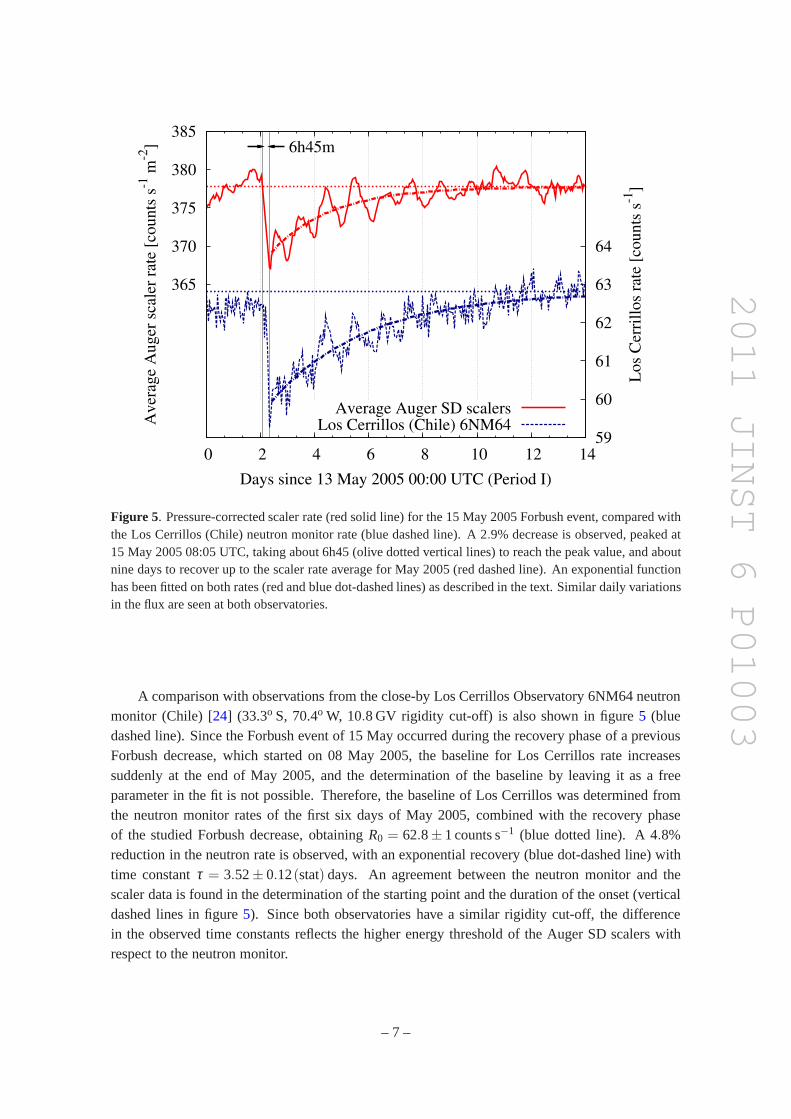
Figure 5. Pressure-corrected scaler rate (red solid line) for the 15May 2005 Forbush event, compared withthe Los Cerrillos (Chile) neutron monitor rate (blue dashedline). A 2.9% decrease is observed, peaked at15 May 2005 08:05 UTC, taking about 6h45 (olive dotted vertical lines) to reach the peak value, and aboutnine days to recover up to the scaler rate average for May 2005(red dashed line). An exponential functionhas been fitted on both rates (red and blue dot-dashed lines) as described in the text. Similar daily variationsin the flux are seen at both observatories.
A comparison with observations from the close-by Los Cerrillos Observatory 6NM64 neutronmonitor (Chile) [24] (33.3o S, 70.4o W, 10.8 GV rigidity cut-off) is also shown in figure5 (bluedashed line). Since the Forbush event of 15 May occurred during the recovery phase of a previousForbush decrease, which started on 08 May 2005, the baselinefor Los Cerrillos rate increasessuddenly at the end of May 2005, and the determination of the baseline by leaving it as a freeparameter in the fit is not possible. Therefore, the baselineof Los Cerrillos was determined fromthe neutron monitor rates of the first six days of May 2005, combined with the recovery phaseof the studied Forbush decrease, obtainingR0 = 62.8± 1 counts s−1 (blue dotted line). A 4.8%reduction in the neutron rate is observed, with an exponential recovery (blue dot-dashed line) withtime constantτ = 3.52± 0.12(stat) days. An agreement between the neutron monitor and thescaler data is found in the determination of the starting point and the duration of the onset (verticaldashed lines in figure5). Since both observatories have a similar rigidity cut-off, the differencein the observed time constants reflects the higher energy threshold of the Auger SD scalers withrespect to the neutron monitor.
– 7 –

2011 JINST 6 P01003
5 Conclusions
Observations of CR intensities play an important role in ourunderstanding of the interplanetary andinterstellar media, and also on our knowledge on physical mechanisms involving the interactionbetween charged particles and the magnetized plasma in the heliosphere. Some recent studies havestarted to combine ground observations of CRs with observations of energetic particles made byspacecrafts, with very promising results [25–27].
We have described how low energy radiation rates are registered with high statistics at all thesurface detector array stations of the Pierre Auger Observatory, with a current collection area ofmore than 16 000 m2. A data processing method, based on a previous one intended for the searchof GRBs, has been implemented to observe modulation effects. After correcting for pressure,the behaviour of scaler rates shows a good agreement with data from neutron monitors. Water-Cherenkov detectors, operating in scaler mode, are therefore highly sensitive to Forbush decreasesand other transient events related to solar activity modulation of galactic cosmic rays.
Additional analyses of scaler rates at individual detectors, different scaler lower and upperthresholds, and simulations of low energy cosmic rays (to determine the primary energies respon-sible for the observed modulation) are underway.
Acknowledgments
The successful installation and commissioning of the Pierre Auger Observatory would not havebeen possible without the strong commitment and effort fromthe technical and administrative staffin Malargue.
We are grateful to Prof. Enrique G. Cordaro and the Observatorio Radiacion Cosmica of theUniversidad de Chile, who kindly provided the neutron monitor data of Los Cerrillos Observatory.
We are very grateful to the following agencies and organizations for financial support:Comision Nacional de Energıa Atomica, Fundacion Antorchas, Gobierno De La Provincia deMendoza, Municipalidad de Malargue, NDM Holdings and Valle Las Lenas, in gratitude fortheir continuing cooperation over land access, Argentina;the Australian Research Council; Con-selho Nacional de Desenvolvimento Cientıfico e Tecnologico (CNPq), Financiadora de Estudose Projetos (FINEP), Fundacao de Amparo a Pesquisa do Estado de Rio de Janeiro (FAPERJ),Fundacao de Amparo a Pesquisa do Estado de Sao Paulo (FAPESP), Ministerio de Ciencia e Tec-nologia (MCT), Brazil; AVCR AV0Z10100502 and AV0Z10100522, GAAV KJB300100801 andKJB100100904, MSMT-CR LA08016, LC527, 1M06002, and MSM0021620859, Czech Repub-lic; Centre de Calcul IN2P3/CNRS, Centre National de la Recherche Scientifique (CNRS), ConseilRegional Ile-de-France, Departement Physique Nucleaire et Corpusculaire (PNC-IN2P3/CNRS),Departement Sciences de l’Univers (SDU-INSU/CNRS), France; Bundesministerium fur Bildungund Forschung (BMBF), Deutsche Forschungsgemeinschaft (DFG), Finanzministerium Baden-Wurttemberg, Helmholtz-Gemeinschaft Deutscher Forschungszentren (HGF), Ministerium furWissenschaft und Forschung, Nordrhein-Westfalen, Ministerium fur Wissenschaft, Forschungund Kunst, Baden-Wurttemberg, Germany; Istituto Nazionale di Fisica Nucleare (INFN), Isti-tuto Nazionale di Astrofisica (INAF), Ministero dell’Istruzione, dell’Universita e della Ricerca(MIUR), Italy; Consejo Nacional de Ciencia y Tecnologıa (CONACYT), Mexico; Ministerie van
– 8 –
2011 JINST 6 P01003
Onderwijs, Cultuur en Wetenschap, Nederlandse Organisatie voor Wetenschappelijk Onderzoek(NWO), Stichting voor Fundamenteel Onderzoek der Materie (FOM), Netherlands; Ministry ofScience and Higher Education, Grant Nos. 1 P03 D 014 30 and N N202 207238, Poland; Fundacaopara a Ciencia e a Tecnologia, Portugal; Ministry for Higher Education, Science, and Technol-ogy, Slovenian Research Agency, Slovenia; Comunidad de Madrid, Consejerıa de Educacion dela Comunidad de Castilla La Mancha, FEDER funds, Ministeriode Ciencia e Innovacion andConsolider-Ingenio 2010 (CPAN), Generalitat Valenciana,Junta de Andalucıa, Xunta de Galicia,Spain; Science and Technology Facilities Council, United Kingdom; Department of Energy, Con-tract Nos. DE-AC02-07CH11359, DE-FR02-04ER41300, National Science Foundation, Grant No.0450696, The Grainger Foundation USA; ALFA-EC / HELEN, European Union 6th FrameworkProgram, Grant No. MEIF-CT-2005-025057, European Union 7th Framework Program, Grant No.PIEF-GA-2008-220240, and UNESCO.
The Pierre Auger collaboration
P. Abreu73, M. Aglietta55, E.J. Ahn89, D. Allard31, I. Allekotte1, J. Allen92, J. AlvarezCastillo66, J. Alvarez-Muniz80, M. Ambrosio48, A. Aminaei67, L. Anchordoqui106, S. Andringa73,T. Anticic25, A. Anzalone54, C. Aramo48, E. Arganda77, K. Arisaka97, F. Arqueros77,H. Asorey1, P. Assis73, J. Aublin33, M. Ave37,98, M. Avenier34, G. Avila10, T. Backer43,D. Badagnani6, M. Balzer38, K.B. Barber11, A.F. Barbosa14, R. Bardenet32, S.L.C. Barroso20,B. Baughman94, J.J. Beatty94, B.R. Becker103, K.H. Becker36, A. Belletoile34, J.A. Bellido11,S. BenZvi105, C. Berat34, T. Bergmann38, X. Bertou1, P.L. Biermann40, P. Billoir33, F. Blanco77,M. Blanco78, C. Bleve36,47, H. Blumer39,37, M. Bohacova98,27, D. Boncioli49, C. Bonifazi23,33,R. Bonino55, N. Borodai71, J. Brack87, P. Brogueira73, W.C. Brown88, R. Bruijn83, P. Buchholz43,A. Bueno79, R.E. Burton85, N.G. Busca31, K.S. Caballero-Mora39, L. Caramete40, R. Caruso50,A. Castellina55, O. Catalano54, G. Cataldi47, L. Cazon73, R. Cester51, J. Chauvin34, A. Chiavassa55,J.A. Chinellato18, A. Chou89,92, J. Chudoba27, R.W. Clay11, E. Colombo2, M.R. Coluccia47,R. Conceicao73, F. Contreras9, H. Cook83, M.J. Cooper11, J. Coppens67,69, A. Cordier32, U. Cotti65,S. Coutu95, C.E. Covault85, A. Creusot75, A. Criss95, J. Cronin98, A. Curutiu40, S. Dagoret-Campagne32, R. Dallier35, S. Dasso7,4, K. Daumiller37, B.R. Dawson11, R.M. de Almeida18,23,M. De Domenico50, C. De Donato66,46, S.J. de Jong67, G. De La Vega8, W.J.M. de MelloJunior18, J.R.T. de Mello Neto23, I. De Mitri47, V. de Souza16, K.D. de Vries68, G. Decerprit31,L. del Peral78, O. Deligny30, A. Della Selva48, H. Dembinski37, A. Denkiewicz2, C. DiGiulio49, J.C. Diaz91, M.L. Dıaz Castro15, P.N. Diep107, C. Dobrigkeit 18, J.C. D’Olivo66,P.N. Dong107,30, A. Dorofeev87, J.C. dos Anjos14, M.T. Dova6, D. D’Urso48, I. Dutan40, J. Ebr27,R. Engel37, M. Erdmann41, C.O. Escobar18, A. Etchegoyen2, P. Facal San Luis98, H. Falcke67,70,G. Farrar92, A.C. Fauth18, N. Fazzini89, A.P. Ferguson85, A. Ferrero2, B. Fick91, A. Filevich2,A. Filipcic74,75, I. Fleck43, S. Fliescher41, C.E. Fracchiolla87, E.D. Fraenkel68, U. Frohlich43,B. Fuchs14, W. Fulgione55, R.F. Gamarra2, S. Gambetta44, B. Garcıa8, D. Garcıa Gamez79,D. Garcia-Pinto77, X. Garrido37, A. Gascon79, G. Gelmini97, H. Gemmeke38, K. Gesterling103,P.L. Ghia30,55, U. Giaccari47, M. Giller72, H. Glass89, M.S. Gold103, G. Golup1, F. GomezAlbarracin6, M. Gomez Berisso1, P. Goncalves73, D. Gonzalez39, J.G. Gonzalez39, B. Gookin87,D. Gora39,71, A. Gorgi55, P. Gouffon17, S.R. Gozzini83, E. Grashorn94, S. Grebe67, M. Grigat41,
– 9 –

2011 JINST 6 P01003
A.F. Grillo56, Y. Guardincerri4, F. Guarino48, G.P. Guedes19, J.D. Hague103, P. Hansen6,D. Harari1, S. Harmsma68,69, J.L. Harton87, A. Haungs37, T. Hebbeker41, D. Heck37, A.E. Herve11,C. Hojvat89, V.C. Holmes11, P. Homola71, J.R. Horandel67, A. Horneffer67, M. Hrabovsky28,27,T. Huege37, A. Insolia50, F. Ionita98, A. Italiano50, S. Jiraskova67, K. Kadija25, M. Kaducak89,K.H. Kampert36, P. Karhan26, T. Karova27, P. Kasper89, B. Kegl32, B. Keilhauer37, A. Keivani90,J.L. Kelley67, E. Kemp18, R.M. Kieckhafer91, H.O. Klages37, M. Kleifges38, J. Kleinfeller37,J. Knapp83, D.-H. Koang34, K. Kotera98, N. Krohm36, O. Kromer38, D. Kruppke-Hansen36,F. Kuehn89, D. Kuempel36, J.K. Kulbartz42, N. Kunka38, G. La Rosa54, C. Lachaud31,P. Lautridou35, M.S.A.B. Leao22, D. Lebrun34, P. Lebrun89, M.A. Leigui de Oliveira22,A. Lemiere30, A. Letessier-Selvon33, I. Lhenry-Yvon30, K. Link39, R. Lopez61, A. LopezAguera80, K. Louedec32, J. Lozano Bahilo79, A. Lucero2,55, M. Ludwig39, H. Lyberis30,M.C. Maccarone54, C. Macolino33, S. Maldera55, D. Mandat27, P. Mantsch89, A.G. Mariazzi6,V. Marin35, I.C. Maris33, H.R. Marquez Falcon65, G. Marsella52, D. Martello47, L. Martin35,O. Martınez Bravo61, H.J. Mathes37, J. Matthews90,96, J.A.J. Matthews103, G. Matthiae49,D. Maurizio51, P.O. Mazur89, G. Medina-Tanco66, M. Melissas39, D. Melo51, E. Menichetti51,A. Menshikov38, C. Meurer41, S. Micanovic25, M.I. Micheletti2, W. Miller103, L. Miramonti46,S. Mollerach1, M. Monasor98, D. Monnier Ragaigne32, F. Montanet34, B. Morales66, C. Morello55,E. Moreno61, J.C. Moreno6, C. Morris94, M. Mostafa87, S. Mueller37, M.A. Muller18, G. Muller41,M. Munchmeyer33, R. Mussa51, G. Navarra55 †, J.L. Navarro79, S. Navas79, P. Necesal27,L. Nellen66, P.T. Nhung107, N. Nierstenhoefer36, D. Nitz91, D. Nosek26, L. Nozka27, M. Nyklicek27,J. Oehlschlager37, A. Olinto98, P. Oliva36, V.M. Olmos-Gilbaja80, M. Ortiz77, N. Pacheco78,D. Pakk Selmi-Dei18, M. Palatka27, J. Pallotta3, N. Palmieri39, G. Parente80, E. Parizot31,A. Parra80, J. Parrisius39, R.D. Parsons83, S. Pastor76, T. Paul93, V. Pavlidou98 c, K. Payet34,M. Pech27, J. Pekala71, R. Pelayo80, I.M. Pepe21, L. Perrone52, R. Pesce44, E. Petermann102,S. Petrera45, P. Petrinca49, A. Petrolini44, Y. Petrov87, J. Petrovic69, C. Pfendner105, N. Phan103,R. Piegaia4, T. Pierog37, P. Pieroni4, M. Pimenta73, V. Pirronello50, M. Platino2, V.H. Ponce1,M. Pontz43, P. Privitera98, M. Prouza27, E.J. Quel3, J. Rautenberg36, O. Ravel35, D. Ravignani2,B. Revenu35, J. Ridky27, S. Riggi50, M. Risse43, P. Ristori3, H. Rivera46, C. Riviere34, V. Rizi45,C. Robledo61, G. Rodriguez80, J. Rodriguez Martino9,50, J. Rodriguez Rojo9, I. Rodriguez-Cabo80, M.D. Rodrıguez-Frıas78, G. Ros78, J. Rosado77, T. Rossler28, M. Roth37, B. Rouille-d’Orfeuil98, E. Roulet1, A.C. Rovero7, F. Salamida37,45, H. Salazar61, G. Salina49, F. Sanchez2,M. Santander9, C.E. Santo73, E. Santos73, E.M. Santos23, F. Sarazin86, S. Sarkar81, R. Sato9,N. Scharf41, V. Scherini46, H. Schieler37, P. Schiffer41, A. Schmidt38, F. Schmidt98, T. Schmidt39,O. Scholten68, H. Schoorlemmer67, J. Schovancova27, P. Schovanek27, F. Schroeder37, S. Schulte41,F. Schussler37, D. Schuster86, S.J. Sciutto6, M. Scuderi50, A. Segreto54, D. Semikoz31,M. Settimo47, A. Shadkam90, R.C. Shellard14,15, I. Sidelnik2, G. Sigl42, A. Smiałkowski72,R. Smıda37,27, G.R. Snow102, P. Sommers95, J. Sorokin11, H. Spinka84,89, R. Squartini9,J. Stapleton94, J. Stasielak71, M. Stephan41, E. Strazzeri54, A. Stutz34, F. Suarez2, T. Suomijarvi30,A.D. Supanitsky66, T. Susa25, M.S. Sutherland94, J. Swain93, Z. Szadkowski36,72, A. Tamashiro7,A. Tapia2, T. Tarutina6, O. Tascau36, R. Tcaciuc43, D. Tcherniakhovski38, D. Tegolo50,59,N.T. Thao107, D. Thomas87, J. Tiffenberg4, C. Timmermans69,67, D.K. Tiwari65, W. Tkaczyk72,C.J. Todero Peixoto22, B. Tome73, A. Tonachini51, P. Travnicek27, D.B. Tridapalli17, G. Tristram31,E. Trovato50, M. Tueros6, R. Ulrich95,37, M. Unger37, M. Urban32, J.F. Valdes Galicia66,
– 10 –

2011 JINST 6 P01003
I. Valino80,37, L. Valore48, A.M. van den Berg68, B. Vargas Cardenas66, J.R. Vazquez77,R.A. Vazquez80, D. Veberic75,74, T. Venters98, V. Verzi49, M. Videla8, L. Villasenor65,H. Wahlberg6, P. Wahrlich11, O. Wainberg2, D. Warner87, A.A. Watson83, M. Weber38,K. Weidenhaupt41, A. Weindl37, S. Westerhoff105, B.J. Whelan11, G. Wieczorek72, L. Wiencke86,B. Wilczynska71, H. Wilczynski71, M. Will 37, C. Williams98, T. Winchen41, L. Winders106,M.G. Winnick11, M. Wommer37, B. Wundheiler2, T. Yamamoto98 a, P. Younk87, G. Yuan90,A. Yushkov48, B. Zamorano79, E. Zas80, D. Zavrtanik75,74, M. Zavrtanik74,75, I. Zaw92,A. Zepeda62, M. Ziolkowski43
1 Centro Atomico Bariloche and Instituto Balseiro (CNEA- UNCuyo-CONICET), San Carlos deBariloche, Argentina2 Centro Atomico Constituyentes (Comision Nacional de Energıa Atomica/CONICET/UTN-FRBA), Buenos Aires, Argentina3 Centro de Investigaciones en Laseres y Aplicaciones, CITEFA and CONICET, Argentina4 Departamento de Fısica, FCEyN, Universidad de Buenos Aires y CONICET, Argentina6 IFLP, Universidad Nacional de La Plata and CONICET, La Plata, Argentina7 Instituto de Astronomıa y Fısica del Espacio (CONICET- UBA), Buenos Aires, Argentina8 National Technological University, Faculty Mendoza (CONICET/CNEA), Mendoza, Argentina9 Pierre Auger Southern Observatory, Malargue, Argentina10 Pierre Auger Southern Observatory and Comision Nacional de Energıa Atomica, Malargue,Argentina11 University of Adelaide, Adelaide, S.A., Australia14 Centro Brasileiro de Pesquisas Fisicas, Rio de Janeiro, RJ,Brazil15 Pontifıcia Universidade Catolica, Rio de Janeiro, RJ, Brazil16 Universidade de Sao Paulo, Instituto de Fısica, Sao Carlos, SP, Brazil17 Universidade de Sao Paulo, Instituto de Fısica, Sao Paulo, SP, Brazil18 Universidade Estadual de Campinas, IFGW, Campinas, SP, Brazil19 Universidade Estadual de Feira de Santana, Brazil20 Universidade Estadual do Sudoeste da Bahia, Vitoria da Conquista, BA, Brazil21 Universidade Federal da Bahia, Salvador, BA, Brazil22 Universidade Federal do ABC, Santo Andre, SP, Brazil23 Universidade Federal do Rio de Janeiro, Instituto de Fısica, Rio de Janeiro, RJ, Brazil25 Rudjer Boskovic Institute, 10000 Zagreb, Croatia26 Charles University, Faculty of Mathematics and Physics, Institute of Particle and NuclearPhysics, Prague, Czech Republic27 Institute of Physics of the Academy of Sciences of the Czech Republic, Prague, Czech Republic28 Palacky University, Olomouc, Czech Republic30 Institut de Physique Nucleaire d’Orsay (IPNO), Universite Paris 11, CNRS-IN2P3, Orsay,France31 Laboratoire AstroParticule et Cosmologie (APC), Universite Paris 7, CNRS-IN2P3, Paris,France32 Laboratoire de l’Accelerateur Lineaire (LAL), Universite Paris 11, CNRS-IN2P3, Orsay, France33 Laboratoire de Physique Nucleaire et de Hautes Energies (LPNHE), Universites Paris 6 et Paris7, CNRS-IN2P3, Paris, France
– 11 –

2011 JINST 6 P01003
34 Laboratoire de Physique Subatomique et de Cosmologie (LPSC), Universite Joseph Fourier,INPG, CNRS-IN2P3, Grenoble, France35 SUBATECH, CNRS-IN2P3, Nantes, France36 Bergische Universitat Wuppertal, Wuppertal, Germany37 Karlsruhe Institute of Technology - Campus North - Institutfur Kernphysik, Karlsruhe,Germany38 Karlsruhe Institute of Technology - Campus North - Institutfur Prozessdatenverarbeitung undElektronik, Karlsruhe, Germany39 Karlsruhe Institute of Technology - Campus South - Institutfur Experimentelle Kernphysik(IEKP), Karlsruhe, Germany40 Max-Planck-Institut fur Radioastronomie, Bonn, Germany41 RWTH Aachen University, III. Physikalisches Institut A, Aachen, Germany42 Universitat Hamburg, Hamburg, Germany43 Universitat Siegen, Siegen, Germany44 Dipartimento di Fisica dell’Universita and INFN, Genova,Italy45 Universita dell’Aquila and INFN, L’Aquila, Italy46 Universita di Milano and Sezione INFN, Milan, Italy47 Dipartimento di Fisica dell’Universita del Salento and Sezione INFN, Lecce, Italy48 Universita di Napoli ”Federico II” and Sezione INFN, Napoli, Italy49 Universita di Roma II ”Tor Vergata” and Sezione INFN, Roma,Italy50 Universita di Catania and Sezione INFN, Catania, Italy51 Universita di Torino and Sezione INFN, Torino, Italy52 Dipartimento di Ingegneria dell’Innovazione dell’Universita del Salento and Sezione INFN,Lecce, Italy54 Istituto di Astrofisica Spaziale e Fisica Cosmica di Palermo(INAF), Palermo, Italy55 Istituto di Fisica dello Spazio Interplanetario (INAF), Universita di Torino and Sezione INFN,Torino, Italy56 INFN, Laboratori Nazionali del Gran Sasso, Assergi (L’Aquila), Italy59 Universita di Palermo and Sezione INFN, Catania, Italy61 Benemerita Universidad Autonoma de Puebla, Puebla, Mexico62 Centro de Investigacion y de Estudios Avanzados del IPN (CINVESTAV), Mexico, D.F., Mexico65 Universidad Michoacana de San Nicolas de Hidalgo, Morelia,Michoacan, Mexico66 Universidad Nacional Autonoma de Mexico, Mexico, D.F., Mexico67 IMAPP, Radboud University, Nijmegen, Netherlands68 Kernfysisch Versneller Instituut, University of Groningen, Groningen, Netherlands69 NIKHEF, Amsterdam, Netherlands70 ASTRON, Dwingeloo, Netherlands71 Institute of Nuclear Physics PAN, Krakow, Poland72 University of Łodz, Łodz, Poland73 LIP and Instituto Superior Tecnico, Lisboa, Portugal74 J. Stefan Institute, Ljubljana, Slovenia75 Laboratory for Astroparticle Physics, University of Nova Gorica, Slovenia76 Instituto de Fısica Corpuscular, CSIC-Universitat de Valencia, Valencia, Spain
– 12 –

2011 JINST 6 P01003
77 Universidad Complutense de Madrid, Madrid, Spain78 Universidad de Alcala, Alcala de Henares (Madrid), Spain79 Universidad de Granada & C.A.F.P.E., Granada, Spain80 Universidad de Santiago de Compostela, Spain81 Rudolf Peierls Centre for Theoretical Physics, Universityof Oxford, Oxford, United Kingdom83 School of Physics and Astronomy, University of Leeds, United Kingdom84 Argonne National Laboratory, Argonne, IL, U.S.A.85 Case Western Reserve University, Cleveland, OH, U.S.A.86 Colorado School of Mines, Golden, CO, U.S.A.87 Colorado State University, Fort Collins, CO, U.S.A.88 Colorado State University, Pueblo, CO, U.S.A.89 Fermilab, Batavia, IL, U.S.A.90 Louisiana State University, Baton Rouge, LA, U.S.A.91 Michigan Technological University, Houghton, MI, U.S.A.92 New York University, New York, NY, U.S.A.93 Northeastern University, Boston, MA, U.S.A.94 Ohio State University, Columbus, OH, U.S.A.95 Pennsylvania State University, University Park, PA, U.S.A.96 Southern University, Baton Rouge, LA, U.S.A.97 University of California, Los Angeles, CA, U.S.A.98 University of Chicago, Enrico Fermi Institute, Chicago, IL, U.S.A.102 University of Nebraska, Lincoln, NE, U.S.A.103 University of New Mexico, Albuquerque, NM, U.S.A.105 University of Wisconsin, Madison, WI, U.S.A.106 University of Wisconsin, Milwaukee, WI, U.S.A.107 Institute for Nuclear Science and Technology (INST), Hanoi, Vietnam
(†) Deceased(a) at Konan University, Kobe, Japan(c) at Caltech, Pasadena, U.S.A.
References
[1] K. Herbst et al.,On the importance of the local interstellar spectrum for thesolar modulationparameter, J. Geophys. Res.115 (2010) D00I20.
[2] S.E. Forbush,Three Unusual Cosmic-Ray Increases Possibly Due to ChargedParticles from the Sun,Phys. Rev.70 (1946) 771.
[3] H.V. Cane,Coronal Mass Ejections and Forbush Decreases, Space Sci. Rev.93 (2000) 55.
[4] PIERRE AUGER collaboration, J. Abraham et al.,Properties and performance of the prototypeinstrument for the Pierre Auger Observatory, Nucl. Instrum. Meth.A 523 (2004) 50.
[5] PIERRE AUGER collaboration, J. Abraham et al.,The Fluorescence Detector of the Pierre AugerObservatory, Nucl. Instrum. Meth.620 (2010) 227.
– 13 –

2011 JINST 6 P01003
[6] PIERRE AUGER collaboration, I. Allekotte et al.,The Surface Detector System of the Pierre AugerObservatory, Nucl. Instrum. Meth.A 586 (2008) 409.
[7] PIERRE AUGER collaboration, X. Bertou et al.,Calibration of the surface array of the Pierre AugerObservatory, Nucl. Instrum. Meth.A 568 (2006) 839.
[8] PIERRE AUGER collaboration, P.D.J. Clark and D. Nitz,Communications in the Auger Observatory,in Proceedings of the 27th International Cosmic Ray Conference (ICRC 2001), Hamburg, Germany(2001), pg. 765–768.
[9] P. Bauleo et al.,A water tank Cerenkov detector for very high energy astroparticles,Nucl. Instrum. Meth.A 406 (1998) 69.
[10] PIERRE AUGER collaboration, M. Aglietta et al.,Response of the Pierre Auger Observatory WaterCherenkov Detectors to Muons, in Proceedings of the 29th International Cosmic Ray Conference(ICRC 2005), Pune, India (2005), pg. 83–86.
[11] PIERRE AUGER collaboration, A. Etchegoyen et al.,Muon-track studies in a water Cherenkovdetector, Nucl. Instrum. Meth.A 545 (2005) 602.
[12] D. Alexander, K.M. Pathak and M.G. Thompson,Cerenkov energy loss of muons in water,J. Phys.A 1 (1968) 578.
[13] C. Morello, L. Periale and G. Navarra,A search for high-energy cosmic gamma-ray bursts,Nuovo Cim.C 7 (1984) 682.
[14] PIERRE AUGER collaboration, X. Bertou,Search for Gamma Ray Bursts using the single particletechnique at the Pierre Auger Observatory, in Proceedings of the 30th International Cosmic RayConference (ICRC 2007), Mexico DF, Mexico (2008), pg. 441–444.
[15] D. Allard et al.,Use of water-Cherenkov detectors to detect gamma ray burstsat the Large ApertureGRB Observatory (LAGO), Nucl. Instrum. Meth.A 595 (2008) 70.
[16] A. Budano et al.,Search for Gamma Ray Bursts with the Argo-YBJ Detector in Scaler Mode,Astrophys. J.699 (2009) 1281.
[17] PIERRE AUGER collaboration, D. Thomas,Search for coincidences with astrophysical transients inPierre Auger Observatory data, in Proceedings of the 31st International Cosmic Ray Conference(ICRC 2009), Lodz, Poland (2009).
[18] ICE CUBE collaboration, R. Abbasi et al.,Solar Energetic Particle Spectrum on 2006 December 13Determined by IceTop, Astrophys. J.689 (2008) L65.
[19] PIERRE AUGER collaboration, H. Asorey,Cosmic Ray Solar Modulation Studies at the Pierre AugerObservatory, in Proccedings of the 31st International Cosmic Ray Conference (ICRC 2009), Lodz,Poland (2009).
[20] E. Eroshenko et al.,Relationships between neutron fluxes and rain flows,Adv. Space Res.46 (2010) 637.
[21] R. Caballero and J.F. Valdes-Galicia,Solar modulation of galactic cosmic-ray intensity as seen byneutron monitors during 1990–1999 — I. Rigidity Dependenceand Correlations with Solar ActivityParameters, Solar Phys.212 (2004) 209.
[22] M. Storini et al.,Rome Neutron Monitor, supported by INAF/UNIRomaTre collaboration,http://cr0.izmiran.rssi.ru/rome/main.htm.
[23] D.F. Smart and M.A. Shea,Grid of Calculated Cosmic Ray Vertical Cutoff Rigidities for Epoch2000.0, in Proceedings of the 30th International Cosmic Ray Conference (ICRC 2007), Mexico DF,Mexico (2007), pg. 737–740.
– 14 –
2011 JINST 6 P01003
[24] E.G. Cordaro and E.F. Olivares,Cosmic Rays 6-NM-64 Neutron Monitor Data, Los Cerrillos CosmicRays Observatory, in Report of Cosmic Rays Research Laboratory 2005, ISSN 0717-361X, 2005,Santiago, Chile.
[25] J.W. Bieber et al.,Spaceship Earth Observations of the Easter 2001 Solar Particle Event,Astrophys. J. Lett.601 (2004) L103.
[26] T. Kuwabara et al.,Determination of interplanetary coronal mass ejection geometry and orientationfrom ground-based observations of galactic cosmic rays, J. Geophys. Res.114 (2009) A05109.
[27] T. Mulligan et al.,Short-period variability in the galactic cosmic ray intensity: High statisticalresolution observations and interpretation around the time of a Forbush decrease in August 2006,J. Geophys. Res.114 (2009) A07105.
– 15 –