The modified three point Gaussian method for determining Gaussian peak parameters
Upload
independentCategory
view
1download
0
CONCURRENCY AND COMPUTATION: PRACTICE AND EXPERIENCEConcurrency Computat.: Pract. Exper. 2010; 22:1549–1558Published online 5 October 2009 inWiley InterScience (www.interscience.wiley.com). DOI: 10.1002/cpe.1514
The peak point of LURR andits significance
Xiang-Chu Yin1,2,∗,†, Lang-Ping Zhang1,2, Yongxian Zhang2,4,Keyin Peng2,4, Haitao Wang2,5, Zhiping Song2,6, Xiaotao Zhang2,4
and Shuai Yuan2,3
1Institute of Earthquake Science, China Earthquake Administration (CEA), Beijing100036, China2LNM (State Key Laboratory of Nonlinear Mechanics), Institute of Mechanics,Chinese Academy Sciences (CAS), No. 15 Beisihuanxi Road, Beijing 100190,China3CAS, Graduate University, Beijing 100049, China4China Earthquake Network Center, CEA, Beijing 100036, China5Xinjiang Earthquake Bureau, CEA, Urumchi 830011, China6Shanghai Earthquake Bureau, CEA, Shanghai 200062, China
SUMMARY
The Load/Unload Response Ratio (LURR) value fluctuates around one during the early stage of theseismogenic process and then rises and reaches its peak point before the occurrence of a strong earthquake;the strong earthquake however does not onset at that time, but after the peak point LURR decreasessharply at the eve of the main shock before the final event outbreak. Thus, the peak point of LURR isahead of the occurrence of an earthquake. We denote the lead time as T2. The discovery of peak pointfor LURR and the relationship between T2 and magnitude M is of great significance as the peak point isusually easy to determine and then we can predict the occurrence time for the coming event according toEquation (3) so that we can enhance the precision of time for earthquake prediction in terms of LURRfrom ‘year’ scale to ‘month’ scale. The variation of LURR around the Wenchuan earthquake and itslesson to us are depicted in the paper. Copyright © 2009 John Wiley & Sons, Ltd.
Received 21 October 2008; Accepted 24 July 2009
KEY WORDS: Load/Unload Response Ratio (LURR); earthquake prediction; peak point of LURR; Wenchuanearthquake
∗Correspondence to: Xiang-Chu Yin, LNM, Institute of Mechanics, CAS, No.15 Beisihuanxi Road, Beijing 100190, China.†E-mail: [email protected], [email protected]
Contract/grant sponsor: Informalization Construction Project of Chinese Academy of Sciences; contract/grant number:INFO-115-B01Contract/grant sponsor: NSFC; contract/grant number: 10721202Contract/grant sponsor: Major State Basic Research Programs; contract/grant number: 2004CB418406
Copyright q 2009 John Wiley & Sons, Ltd.

1550 X.-C. YIN ET AL.
INTRODUCTION
Load/Unload Response Ratio (LURR) is a new approach to earthquake prediction. Till date wehave made tremendous achievement in real earthquake prediction practice using LURR, especiallyfor medium term earthquake prediction (e.g. one-year time scale) [1–12].Every year, in November, our team submits an annual report [13–16] on LURR spatial scan-
ning for the mainland of China to the relevant authorities, in which the LURR anomaly regionsare represented. These reports have been published in the book series. The Research on SeismicTendency of China in xxxx year, edited by the Center for the Analysis and Prediction (now it ischanged as Institute of Earthquake Science), CSB and published at the end of the same year. It ispredicted that there will be strong earthquakes occurring in the future (especially in the next year)in the seismogenic regions based on the LURR anomaly regions, but larger than them [12].Since the year of 2004, we have made a major breakthrough in annual earthquake prediction
in terms of LURR. In 2004, 33 strong earthquakes (M ≥ 5) occurred in the Chinese mainland.Among them 16 events occurred in the data scarcity regions from where the data were unavailablefor calculating LURR and should be neglected during the evaluation prediction effect. Among theother 17 strong earthquakes, 15 events fell into the seismogenic regions predicted at the end of year2003 using LURR. The percentage is 15
17 = 88%. For 2005, 2006 and 2007 these percentages are
Figure 1. The LURR anomaly regions according to the results calculated in November 2003 and the epicenterdistribution map of the earthquakes with magnitude M ≥ 5 that occurred in 2004 in the mainland of China.
Copyright q 2009 John Wiley & Sons, Ltd. Concurrency Computat.: Pract. Exper. 2010; 22:1549–1558DOI: 10.1002/cpe

THE PEAK POINT OF LURR 1551
1213 = 92%, 8
9 = 89% and 1212 = 100%, respectively. The average percentage in the four years from
2004 to 2007 is 92%.The details of the prediction for 2004 in terms of LURR have been depicted in [11–13]. Owing to
space limitations, here we only depict the LURR anomaly regions according to the result calculatedin November 2003 and the epicenters distribution map of the earthquakes with magnitude M ≥ 5occurred in the next year (2004) in the Chinese mainland (Figure 1).
THE PEAK POINT OF LURR AND ITS SIGNIFICANCE
As introduced above the annual earthquake prediction using LURR has been progressing steadilyin the recent years. Our most important goal is to enhance the preciseness of the prediction time interms of LURR.According to the comprehensive research in the variation of LURR (experimental, numerical,
analytical researches, real seismic data and analysis with damage mechanics), the evolution lawof LURR is that the LURR value fluctuates around 1 during the early stage of the seismogenicprocess and then rises and reaches its maximum (significantly larger than 1), called peak pointbefore the occurrence of a strong earthquake or catastrophic failure of the specimen; however, thestrong earthquake does not onset at that time, but after the peak point LURR decreases sharply atthe eve of the main shock and finally the outbreak of the event.The entire process is shown in Figure 2. The picture on the left is the result of seismic data
(Loma Preita earthquake) [12], the middle one is an experimental result of rock specimen [8,17]and the one on the right is an analytical result in terms of damage mechanics [18].In other words, the earthquake lags behind the peak point of LURR or the peak point of LURR
will be ahead of the occurrence of earthquake. We denoted the lead time (the duration between the
Figure 2. THE LURR evolution curves with different measures: left—seismic data; middle–rock acousticemission experiment and right—damage mechanics analysis.
Copyright q 2009 John Wiley & Sons, Ltd. Concurrency Computat.: Pract. Exper. 2010; 22:1549–1558DOI: 10.1002/cpe

1552 X.-C. YIN ET AL.
Figure 3. The definitions of T , T1 and T2.
Table I. T 2 as the function of magnitude M .
Magnitude R (km) Tw (mon) T2 (mon)
5 100 15 5 ± 26 200 18 14 ± 47 300 24 22 ± 58 300 24 28 ± 8
Note: R is the radius of space window and Tw is the time window in LURR specialscanning.
time of LURR peak point and the occurrence of the quake) as T2 and the total anomaly durationof LURR as T (Figure 3)
T = T1 + T2 (1)
T , T1 and T2 depend on the magnitude M of the incoming event as follows [12,19]:T2 = 60(1 − 2.3× 10−0.08M ) (2)
and
T = 80(1 − 2.5× 10−0.09M ) (3)
For the sake of clarity, we calculate T2 for M = 5, 6, 7 and 8 and list the results in Table I.
Copyright q 2009 John Wiley & Sons, Ltd. Concurrency Computat.: Pract. Exper. 2010; 22:1549–1558DOI: 10.1002/cpe

THE PEAK POINT OF LURR 1553
The discovery of peak point for LURR and the relationship between T2 and magnitude M is ofgreat significance since the peak point is usually easy to determine and then we can predict theoccurrence time for the coming event according to Equation (3). In this way we can enhance theprecision of prediction time in terms of LURR from ‘year’ scale to ‘month’ scale.
THE VARIATION OF LURR AROUND THE WENCHUAN EARTHQUAKE
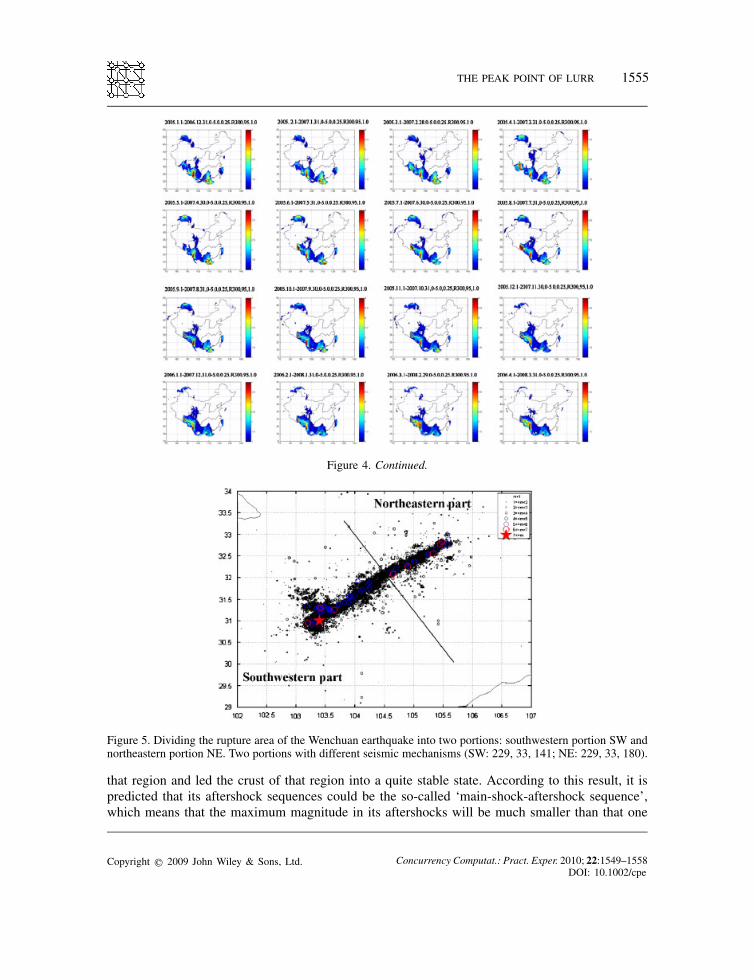
On 12 May 2008, a great earthquake with magnitude Ms8 (Mw7.9) occurred at Wenchuan city,Sichuan Province, south-western China. Its epicenter was located at (103.50◦E, 30.95◦N) and therupture occurred over a length of ∼ 270 km along Longmen Shan faults.The LURR evolution before theWenchuan earthquake is shown in Figure 4. Figure 4 is the LURR
special scanning for the Chinese mainland, which was calculated before Wenchuan earthquake. Thetime window is two years and the special window is a circle region with radius 300 km. There are 48maps of the LURR anomaly regions in different time arranged in temporal order from top to bottomand from left to right. The first map at the top left corner is the time window from 2002.05.01 to2004.04.30, and the last map is the time window from 2006.02.01 to 2008.03.31 (from now on wejust note the end time of the time window).According to Equations (1)–(3), for an earthquake with M8, its T1 should be 20± 8 months and
T2 should be 28±8 months. This implies that its LURR anomaly duration should last about 4 yearsand T2 would be about 2–3 years.In fact the LURR anomaly along Longmen Shan appeared in 2005.01 (Figure 4)—41 months
ahead of the great earthquake and the peak point of LURR was in 2006.06, 23 months beforethe earthquake. This means that the LURR evolution along Longmen Shan has described theseismogenic progress of the Wenchuan earthquake very well.In fact, in our annual report [15] written at the end of 2005, we had indicated that there was a
LURR anomaly region in the Sichuan Province. Furthermore, in our annual report [16] written atthe end of 2006, we pointed out clearly that ‘along the belt (Longmen Shan) the LURR anomalyhad lasted for a long time’ and predicted that ‘a strong earthquake will occurred there within18 months starting from August 2006’. ‘Within 18 months starting from August 2006’ means aperiod with its end of March 2008 which was just 2 months ahead of the occurrence time of theWenchuan earthquake.Unfortunately at the end of 2007 when we wrote the annual report for 2008, we made a terrible
mistake by not insisting on this earthquake prediction for the Longmen Shan region once more, butgave it up, since at that time the LURR peak point had passed a long time ago (more than one year),but the predicted had not occurred and the LURR anomaly degree in that region was gettingmore andmore less. Such a mistake misled us to not having successfully predicted the Wenchuan earthquake.It is a little more gratifying that we had predicted the type of the aftershock sequence of the
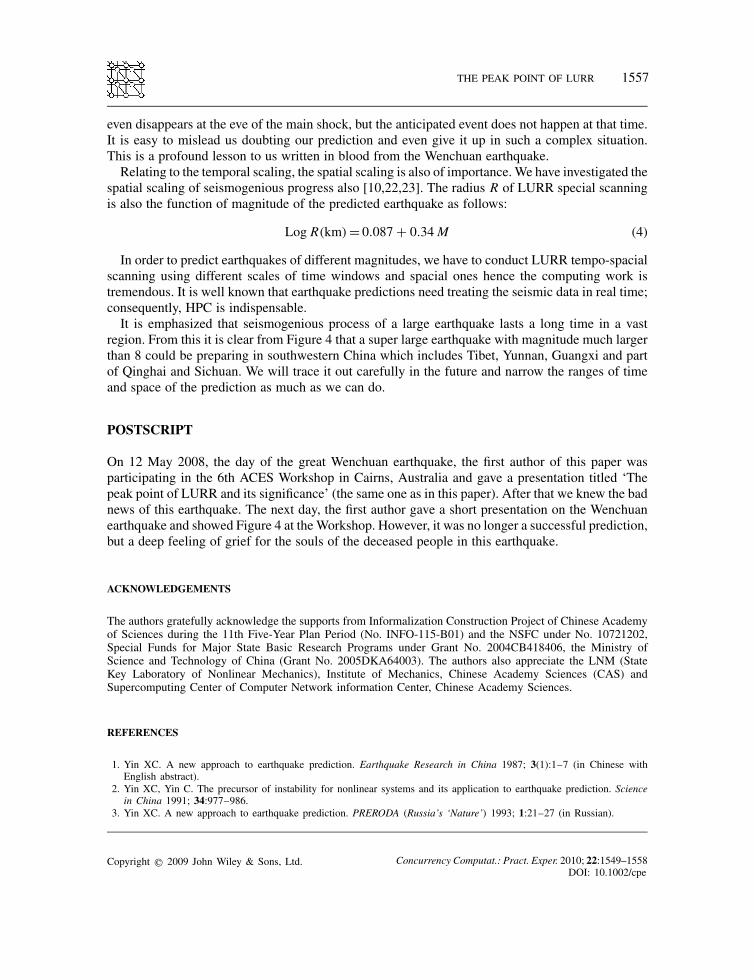
Wenchuan earthquake and some strong aftershocks successfully in terms of LURR. We divided thewhole aftershock area of the Wenchuan earthquake into two portions: SW and NE (see in Figure 5),as ‘reverse and right-slip components are of comparable magnitude along the southwestern portionof the rupture, but right-slip dominates the northeastern portion of the rupture’ [20,21].The LURR evolutions of SW and NE portions are shown in Figure 6, respectively, which indicate
that the values of LURR for both portions SW and NE were less than the unity obviously just afterthe main shock. This implies that the main shock had released most of the accumulated energy in
Copyright q 2009 John Wiley & Sons, Ltd. Concurrency Computat.: Pract. Exper. 2010; 22:1549–1558DOI: 10.1002/cpe

1554 X.-C. YIN ET AL.
Figure 4. The results of LURR spatial scanning in different periods.
Copyright q 2009 John Wiley & Sons, Ltd. Concurrency Computat.: Pract. Exper. 2010; 22:1549–1558DOI: 10.1002/cpe
THE PEAK POINT OF LURR 1555
Figure 4. Continued.
Figure 5. Dividing the rupture area of the Wenchuan earthquake into two portions: southwestern portion SW andnortheastern portion NE. Two portions with different seismic mechanisms (SW: 229, 33, 141; NE: 229, 33, 180).
that region and led the crust of that region into a quite stable state. According to this result, it ispredicted that its aftershock sequences could be the so-called ‘main-shock-aftershock sequence’,which means that the maximum magnitude in its aftershocks will be much smaller than that one
Copyright q 2009 John Wiley & Sons, Ltd. Concurrency Computat.: Pract. Exper. 2010; 22:1549–1558DOI: 10.1002/cpe

1556 X.-C. YIN ET AL.
Figure 6. The evolution of LURR for the two portions of rupture area of the Wenchuan earthquake.The curve denotes LURR and the vertical lines denote earthquakes.
of the main shocks. Till now, more than 15 months after the main shock, the strongest aftershockwas M 6.4 that is not comparable with the magnitude of the main shock.Figure 6 manifests that the strong aftershocks (M ≥ 5) usually occurred behind the peak points
of LURR for both NE and SW portions. We have traced the LURR continuously since the mainshock and successfully predicted most strong aftershocks in real time.
CONCLUDING REMARKS
As mentioned above for a large earthquake (M ≥ 7), the whole LURR anomaly duration (T ) andeven T2 would last several years. After the peak point of LURR, it usually decreases sharply and
Copyright q 2009 John Wiley & Sons, Ltd. Concurrency Computat.: Pract. Exper. 2010; 22:1549–1558DOI: 10.1002/cpe
THE PEAK POINT OF LURR 1557
even disappears at the eve of the main shock, but the anticipated event does not happen at that time.It is easy to mislead us doubting our prediction and even give it up in such a complex situation.This is a profound lesson to us written in blood from the Wenchuan earthquake.Relating to the temporal scaling, the spatial scaling is also of importance. We have investigated the
spatial scaling of seismogenious progress also [10,22,23]. The radius R of LURR special scanningis also the function of magnitude of the predicted earthquake as follows:
Log R(km) = 0.087 + 0.34M (4)
In order to predict earthquakes of different magnitudes, we have to conduct LURR tempo-spacialscanning using different scales of time windows and spacial ones hence the computing work istremendous. It is well known that earthquake predictions need treating the seismic data in real time;consequently, HPC is indispensable.It is emphasized that seismogenious process of a large earthquake lasts a long time in a vast
region. From this it is clear from Figure 4 that a super large earthquake with magnitude much largerthan 8 could be preparing in southwestern China which includes Tibet, Yunnan, Guangxi and partof Qinghai and Sichuan. We will trace it out carefully in the future and narrow the ranges of timeand space of the prediction as much as we can do.
POSTSCRIPT
On 12 May 2008, the day of the great Wenchuan earthquake, the first author of this paper wasparticipating in the 6th ACES Workshop in Cairns, Australia and gave a presentation titled ‘Thepeak point of LURR and its significance’ (the same one as in this paper). After that we knew the badnews of this earthquake. The next day, the first author gave a short presentation on the Wenchuanearthquake and showed Figure 4 at theWorkshop. However, it was no longer a successful prediction,but a deep feeling of grief for the souls of the deceased people in this earthquake.
ACKNOWLEDGEMENTS
The authors gratefully acknowledge the supports from Informalization Construction Project of Chinese Academyof Sciences during the 11th Five-Year Plan Period (No. INFO-115-B01) and the NSFC under No. 10721202,Special Funds for Major State Basic Research Programs under Grant No. 2004CB418406, the Ministry ofScience and Technology of China (Grant No. 2005DKA64003). The authors also appreciate the LNM (StateKey Laboratory of Nonlinear Mechanics), Institute of Mechanics, Chinese Academy Sciences (CAS) andSupercomputing Center of Computer Network information Center, Chinese Academy Sciences.
REFERENCES
1. Yin XC. A new approach to earthquake prediction. Earthquake Research in China 1987; 3(1):1–7 (in Chinese withEnglish abstract).
2. Yin XC, Yin C. The precursor of instability for nonlinear systems and its application to earthquake prediction. Sciencein China 1991; 34:977–986.
3. Yin XC. A new approach to earthquake prediction. PRERODA (Russia’s ‘Nature’) 1993; 1:21–27 (in Russian).
Copyright q 2009 John Wiley & Sons, Ltd. Concurrency Computat.: Pract. Exper. 2010; 22:1549–1558DOI: 10.1002/cpe

1558 X.-C. YIN ET AL.
4. Yin XC, Yin C, Chen XZ. The precursor of instability for nonlinear system and its application to earthquakeprediction—The load–unload response ratio theory. ‘Non-linear Dynamics and Predictability of Geophysical Phenomena’(Geophysical Monograph, vol. 83), Naman WI, Gabrelov AM, Turcotte DL (eds.). AGU: Washington, DC, U.S.A., 1994;55–60.
5. Yin XC, Chen XZ, Song ZP, Yin C. A new approach to earthquake prediction—The load/unload response ratio (LURR)theory. Pure and Applied Geophysics 1995; 145(3–4):701–715.
6. Yin XC, Wang YC, Peng KY, Bai YL, Wang HT, Yin XF. Development of a new approach to earthquake prediction:Load/unload response ratio (LURR) theory. Pure and Applied Geophysics 2000; 157(11–12):2365–2383.
7. Yin XC, Mora P, Peng K, Wang YC, Weatherly D. Load–unload response ratio and accelerating moment/energy releasecritical region scaling and earthquake prediction. Pure and Applied Geophysics 2002; 159(9):2511–2523.
8. Yin XC, Yu HZ, Victor K, Xu ZY, Wu Z, Li M, Peng K, Surgey E, Li Q. Load–unload response ratio (LURR),accelerating energy release (AER) and state vector evolution as precursors to failure of rock specimens. Pure andApplied Geophysics 2004; 161(11–12):2405–2416.
9. Zhang H, Yin XC, Liang NG. The spatial variation of LURR and seismic tendency in western united states. EarthquakeResearch in China 2005; 19(3):338–345.
10. Yin XC, Zhang LP, Zhang HH, Yin C, Wang YC, Zhang YX, Peng KY, Wang HT, Song ZP, Yu HZ, Zhuang JC.LURR’s twenty years and its perspective. Pure and Applied Geophysics 2006; 163(11–12):2317–2341.
11. Zhang L, Yin XC, Liang NG. Application of load/unload response ratio in study of seismicity in the region of Iran.Earthquake Research in China 2007; 21(2):147–155.
12. Yin XC, Zhang LP, Zhang YX, Peng KY, Wang HT, Song ZP, Yu HZ, Zhang HH, Yin C, Wang YC. The newestdevelopment of load/unload response ratio (LURR). Pure and Applied Geophysics 2008; 165(3–4):711–722.
13. Yin XC, Zhang HH, Yu HZ, Zhang YX, Peng KY. Prediction of seismic tendency of Chinese mainland in 2004 in termsof LURR. The Research on Seismic Tendency of China in 2004 (Center for Analysis and Prediction, CSB). SeismologicalPress: Beijing, 2003; 282–285 (in Chinese).
14. Yin XC, Zhang HH, Yu HZ, Zhang YX, Peng KY. Prediction of seismic tendency of Chinese mainland in 2004 in termsof LURR. The Research on Seismic Tendency of China in 2005 (Institute of Earthquake Science, CSB). SeismologicalPress: Beijing, 2004; 285–291 (in Chinese).
15. Yin XC, Zhang LP, Yu HZ, Zhang YX, Peng KY. Prediction of seismic tendency of Chinese mainland in 2006 in termsof LURR. The Research on Seismic Tendency of China in 2006 (Institute of Earthquake Science, CSB). SeismologicalPress: Beijing, 2005; 92–96 (in Chinese).
16. Yin XC, Zhang LP, Yu HZ, Zhang YX, Peng KY. Prediction of seismic tendency of Chinese mainland in 2004 in termsof LURR. The Research on Seismic Tendency of China in 2005 (Institute of Earthquake Science, CSB). SeismologicalPress: Beijing, 2006; 106–111 (in Chinese).
17. Zhang HH, Yin XC, Liang NG, Yu HZ, Li SY, Wang YC, Yin C, Kukshenko V, Tomiline N, Elizarov S. Acousticemission experiments of rock failure under load simulating the hypocenter condition. Pure and Applied Geophysics 2006;163(11–12):2389–2406.
18. Yu HZ, Yin XC, Liang NG. Research on the precursor of earthquakes use damage rheology model. Progress in Geophysics2004; 19(2):404–413 (in Chinese with English abstract).
19. Zhang H, Yin XC, Liang NG. A statistical research on LURR anomaly duration before strong earthquakes occurred inchinese mainland. Earthquake Research in China 2005; 21:486–495.
20. Burchfiel BC, Royden LH, Vander Hilst RD, Hager BH, Chen Z, King RW, Li C, Lu J, Yao H, Kirby E.A Geological and Geophysical Context for the Wenchuan Earthquake of 12 May 2008, Sichuan, People’s Republic of China,July 2008; 4–11. GSA Today.
21. Zhang PZ, Xu XW, Wen XZ, Ran YK. Slip rates and recurrence intervals of the Longmen Shan active fault zone, andtectonic implications for the mechanism of the 12 May Wenchuan earthquake, 2008, Sichuan, China. Chinese Journalof Geophysics 2008; 51(4):1066–1073 (in Chinese with English abstract).
22. Peter M, Wang YC, Yin XC, Peng K. Relationship between the critical regions for accelerating moment releaseand load–unload response ratio. AGU (American Geophysical Union) 2000 Fall Meeting, San Francisco, 10–17December 2000.
23. Peng K, Yin XC, He R. The scale of seismogenic region and accelerate strain energy release in terms of critical pointhypothesis. Earthquake Research in China 2003; 19:425–430 (in Chinese with English abstract).
Copyright q 2009 John Wiley & Sons, Ltd. Concurrency Computat.: Pract. Exper. 2010; 22:1549–1558DOI: 10.1002/cpe
Copyright © 2022 FDOKUMEN