The Overseas Listing Puzzle: Post-IPO Performance of Chinese Stocks and ADRs in the US Market
20
This article appeared in a journal published by Elsevier. The attached copy is furnished to the author for internal non-commercial research and education use, including for instruction at the authors institution and sharing with colleagues. Other uses, including reproduction and distribution, or selling or licensing copies, or posting to personal, institutional or third party websites are prohibited. In most cases authors are permitted to post their version of the article (e.g. in Word or Tex form) to their personal website or institutional repository. Authors requiring further information regarding Elsevier’s archiving and manuscript policies are encouraged to visit: http://www.elsevier.com/copyright
Transcript of The Overseas Listing Puzzle: Post-IPO Performance of Chinese Stocks and ADRs in the US Market

This article appeared in a journal published by Elsevier. The attachedcopy is furnished to the author for internal non-commercial researchand education use, including for instruction at the authors institution
and sharing with colleagues.
Other uses, including reproduction and distribution, or selling orlicensing copies, or posting to personal, institutional or third party
websites are prohibited.
In most cases authors are permitted to post their version of thearticle (e.g. in Word or Tex form) to their personal website orinstitutional repository. Authors requiring further information
regarding Elsevier’s archiving and manuscript policies areencouraged to visit:
http://www.elsevier.com/copyright

Author's personal copy
J. of Multi. Fin. Manag. 22 (2012) 193– 211
Contents lists available at SciVerse ScienceDirect
Journal of Multinational FinancialManagement
journal homepage: www.elsevier.com/locate/econbase
The overseas listing puzzle: Post-IPO performance ofChinese stocks and ADRs in the U.S. market
Yongli Luoa,∗, Fang Fangb, Omar A. Esquedac
a Wayland Baptist University, Plainview, TX 79072, United Statesb The University of Texas-Pan American, Edinburg, TX 78541, United Statesc Tarleton State University, Stephenville, TX 76402, United States
a r t i c l e i n f o
Article history:Received 12 December 2011Accepted 22 June 2012Available online 2 July 2012
JEL classification:G12G15G24G32
Keywords:American depositary receiptsInitial public offeringsCross-listingChinese stocks
a b s t r a c t
The “China concepts stock” in the U.S. has attracted a great dealof attention among international investors due to the fast growthin Chinese economy. This paper examines the aftermarket perfor-mance and the motivations to list in the U.S. for Chinese firms over1993–2010 by considering the great impact of split-share structurereform in China. We find that the Chinese firms in the U.S. generallyunderperform the benchmark and industry peers in the post-IPOperiod of 3 years. The Chinese cross-listing ADRs show superiorperformance relative to the single-listings in the long run. It seemsthat more stringent listing requirements and accounting standardshelp to improve the corporate governance and operating perfor-mance of the Chinese firms. The evidence also supports that theChinese issuers are motivated to cross-list in the U.S. due to over-investment incentives, leverage effects or free-cash-flow signaling,which is consistent with agency theory and signaling hypothesis.
© 2012 Elsevier B.V. All rights reserved.
1. Introduction
The “China concepts stock” in the U.S. market has attracted a great deal of attention among inter-national investors due to the fast growth in Chinese economy. The “China concepts stock” is a setof stock issued by companies whose assets or earnings have significant activities in Mainland China.Investments in these stocks are considered as one of the purest investment plays on China’s long-term economic growth outside of foreign direct investment. Claessens et al. (2006) document that a
∗ Corresponding author at: Wayland Baptist University, School of Business, 1900 West 7th Street, CMB #252. Plainview, TX79072, United States. Tel.: +1 956 534 3596.
E-mail address: [email protected] (Y. Luo).
1042-444X/$ – see front matter © 2012 Elsevier B.V. All rights reserved.http://dx.doi.org/10.1016/j.mulfin.2012.06.008

Author's personal copy
194 Y. Luo et al. / J. of Multi. Fin. Manag. 22 (2012) 193– 211
country with better economic fundamentals such as higher growth opportunities and income level isassociated with more internationalization of the firms including listing, trading and capital raising ininternational exchanges. Since 1993, increasing numbers of Chinese firms have cross-listed in the U.S.market, and many international investors buy shares in these companies in order to participate in thespectacular growth of the Chinese economy (Cheung et al., 2009). As of 2011, 243 Chinese firms havelisted in the U.S. in the form of initial public offerings (IPOs) and American Depository Receipts (ADRs),and the market share of Chinese firms accounts for 73.33% of the market share among all the foreignlistings in the U.S. market (Ritter, 2011). Initially, a majority of the Chinese firms were traded in theU.S. in the form of ADRs and served as a vehicle to signal the quality of state owned enterprises (SOEs).1
According to the logic of the Chinese government—“Let the most beautiful daughter marry first”, theChinese ADRs are selected by the government or dominated by SOEs and their issuances are primar-ily determined by political relations, not by the firms’ desire to find growth opportunities or expandforeign sales (Hung et al., 2008). Thus, the Chinese ADRs typically have more professional boards ofdirectors, use greater accounting conservatism, and exhibit higher investment efficiency than theirdomestic counterparts. In addition, Chinese companies traditionally have separate, restricted shareclasses for domestic residents and foreigners.2 Very few studies have examined the difference betweendomestic shares and foreign shares issued by Chinese firms. For example, Eun and Huang (2007) showthat Chinese investors value local A-shares more highly if the firm has corresponding B- and H-sharesavailable to foreign investors. Yang and Lau (2006) document that there are differences between Chi-nese firms listed as H-shares in Hong Kong and ADRs in the U.S., and they suggest that the Hong Kongmarket may offer a better information environment for Chinese firms compared to the U.S. market.Fernald and Rogers (2002) document that the foreign shares were sold intentionally low with deepdiscounts to attract global investors, and these shares are identical other than who is allowed to ownthem, but foreigners have generally paid only about one-quarter the price paid by domestic residents.
The “China concepts stock” has faced great challenges since a split-share structure reform occurredin China and many overseas-listed Chinese companies have tainted by fraud scandals in recent years.Due to historical reasons, a large amount of non-tradable shares exist in Chinese stock market and thiscauses severe agency problems. Starting from 2005, the CSRC launched a split-share structure reformaimed at eliminating all non-tradable shares and transferring non-tradable shares into tradable shares.This mandatory institutional change has resulted in significant changes in the IPO issuance and firmliquidity, and the domestic Chinese markets for new issuances were frozen in 2005. Since then, aremarkable increase in overseas listings has been observed as more and more Chinese firms seek tocross-list in the U.S. exchanges. However, many of these companies seek to list in the U.S. throughreverse mergers or backdoor IPO listings. According to the Public Company Accounting Oversight Board(PCAOB), more than 150 Chinese companies have backdoored their way onto the U.S. since 2006 byusing old shells of listed U.S. companies (the total market capitalization of such firms is over 12.8billion U.S. dollars in 2010). Because these types of listings become public by merging with the U.S.publicly traded shell companies without the regulatory rigors involved in a traditional IPO, many ofthem are found to be less regulated or have been accused of fraud or shoddy accounting. This attracteda great deal of attention from the U.S. Securities and Exchange Commission (SEC) and the SEC startedinvestigating them as well as the network of U.S. auditors and public relations firms who marketedsuch companies to the U.S. market. As a result, many international investors suffered huge losses andencountered difficulties in understanding the value and institutional features of these Chinese firms.
1 Mr. Daojong Zhou, the former chairman of the China Securities Regulatory Commission (CSRC) talked to the CEOs of foreignlisted firms and said: “Overseas-listed companies are all outstanding enterprises that are representatives of their respectiveindustries to an extent. I hope you can also be the models of listed companies. The behavior of an overseas-listed company is notonly the company’s own business, it relates to our country’s image of reform and openness (May 26, 1995, CSRC web news).”
2 There are five types of Chinese shares: (1) government shares, which are held by the State Assets Management Bureau(SAMB); (2) legal entity shares (or C shares), which are held by other state-owned enterprises; (3) employee shares, whichare held by managers and employees; (4) ordinary domestic individual shares (or A-shares), which can be purchased only byChinese citizens on the Shanghai (SHSE) or the Shenzhen (SZSE) stock exchange; and (5) foreign shares, which can be purchasedonly by foreign investors in Mainland China (B-share), in Hong Kong (H-share), or in the U.S. (N-share). The first three types ofshares are not tradable in the official exchanges, although employee shares are allowed to be listed three years after the IPO.

Author's personal copy
Y. Luo et al. / J. of Multi. Fin. Manag. 22 (2012) 193– 211 195
Fig. 1. Average first-day returns on European and non-European IPOs. (A) Average first-day returns on (mostly) European IPOs.(B) Average first-day returns on non-European IPOs.Data source: Ritter’s website at http://bear.warrington.ufl.edu/ritter/ipodata.htm.
This study is compelling because the motivations for Chinese firms to list overseas differ from theircounterparts in the European or non-European countries in many ways.3 First, China is among themost common countries that list IPOs and ADRs in the U.S., and the short-run Chinese domestic IPOunderpricing is extremely high (Loughran et al., 2011). Fig. 1 illustrates that the average first-day returnon Chinese domestic IPOs is 137.4% (Chen et al., 2009), which is far above the average first-day returnson most of the European IPOs (less than 30%) and the average first-day returns on non-European IPOs(less than 40% except for Korea, Malaysia and India). Comparing to the average first-day return on thedomestic U.S. which is only 16.8% (Ibbotson et al., 1994), the short-run abnormal return on Chinesedomestic IPOs is so high that calls for further investigation. However, extant literature mostly focuseson the short-run effects of Chinese domestic IPOs, providing little evidence on the long-run marketperformance of the Chinese cross-listings. Second, the remarkable economic growth in China leads tostrong incentives for Chinese firms to seek for international capital via overseas listings. Due to dataavailability, previous studies mainly focus on the long-run IPO performance for H-shares that are listed
3 Karolyi (2006) conducts a detailed review of the cross-listing literature and empirical findings; Bianconi and Tan (2008)also provide a thorough investigation of the motivations for overseas listings.

Author's personal copy
196 Y. Luo et al. / J. of Multi. Fin. Manag. 22 (2012) 193– 211
on the Stock Exchange of Hong Kong (SEHK); however, as more and more firms cross-listed in the U.S.market, the number of Chinese listings in the U.S. became greater than the number of the listings inHong Kong. In addition, the Chinese domestic A-share and overseas listed H-shares or N-shares aresegmented (Jia et al., 2005). Therefore, it is important to examine how Chinese firms make decisionsto list abroad and what are the determinants of their post-IPO performance. In addition, literaturesuggests that the aftermarket performance for both IPOs and ADRs varies across markets. For example,Li et al. (2006) state that the returns on Chinese A-share and H-shares are significantly different, andChinese ADRs and H-shares have advantages to B-shares. Wang et al. (2004) also study the effects ofgoing public for Chinese SOEs and confirm the previous findings that the overseas listed shares aretraded with deep discounts and the return differentials can be explained by their risk premiums. Third,China is the only country in which the government controls the size of the stock market, the pace ofissue and the allocation of resources (Zhang and King, 2010). Zhang and King (2010) show that theaverage length of time for Chinese firms to list on a domestic exchange is 5 years. Gao (2002) also showsthat the Chinese government represents an extreme case in terms of setting strict regulations for initialpublic offerings. Moreover, the privatization of government-owned banks takes away the cheap andeasy access to bank loans, limiting the sources of capital for Chinese firms (Luo and Jackson, 2012).Therefore, to avoid the long and cumbersome process to list on domestic exchanges, the issuers aremotivated to list overseas in order to meet their urgent capital needs. On the other hand, most Europeandomestic capital markets are well established and therefore regarded as efficient, while the Chinesedomestic stock markets are not efficient and the market prices of equity have strong intervention bythe government and generally do not reflect the firms’ market performances (Chen et al., 1997; Zhangand Zhou, 2001). In addition, the Chinese domestic market is considered to be highly speculative andfull of unexpected risks. For an investor seeking better investment environment and long-term marketreturns, the Chinese domestic exchange is not an ideal choice. Moreover, the Chinese domestic marketis dominated by retail investors rather than institutional holders. In the U.S. and European economies,institutions and foreign investors account for over 60% of the market capitalization, while the holdingsof institutions and foreign investors in China are less than 25% (Gao, 2002). Due to the risk-aversionnature of retail investors, the Chinese stock market is very volatile and sensitive to rumors and insideinformation, which results in very unstable supplies of capital and uncertain long-run uncertaintiesfor investors.
Our study has important implications for international investors, the major contributions can besummarized as follows.
First, this is the first empirical study to comprehensively examine the motivations and the long-run performance of Chinese firms in the U.S. market. As of December, 2011, China is ranked as thesecond largest country in the number of stocks and ADRs listed on the U.S. exchanges, and the totalnumber of listings in the U.S. exceeded that of the listings in Hong Kong. However, due to languagebarriers, geological preference, and the costs of offering, Hong Kong and Singapore are the first choicesfor Chinese issuers (Sarkissian and Schill, 2004). The Chinese corporations account for 6% of the totalvalue and 15% of total turnover in the Singapore Exchange, and 46% of total value and 56% of totalturnover in the Hong Kong Exchange (Cheung et al., 2009). However, the reasons for Chinese firms tolist in the U.S. and European markets are quite different. Sarkissian and Schill (2004) point out thatthe U.S. and European markets are attractive due to the market size and liquidity rather than regionalpreference or cultural similarity.
Second, our study has important implication for international investors to better understand theinstitutional features of the “China concepts stock” in the U.S. market. Initially, N-shares are issued atdeep discount relative to the local shares to attract global investors. However, the goal of our study isto see whether China’s privatization program, as a whole, can leverage on the U.S. market to improvethe SOEs’ performance. Hence, we use a unique sample of Chinese firms in the U.S. over 1993–2010.Particularly, we compare the market performance between cross-listed ADRs and single-listings inthe U.S., while previous studies mainly focus on the studies of H-shares or domestic A-shares. Forexample, Sun and Tong (2003) and Wang et al. (2004) study the going public process and success ofChinese A-shares by observing the stock behaviors of the SOEs. Zhang and King (2010) compare thesample of issuers that list outside of China with those that list on domestic exchanges. Our study,on the other hand, focuses on Chinese shares listed on the U.S. exchanges and compares the firm

Author's personal copy
Y. Luo et al. / J. of Multi. Fin. Manag. 22 (2012) 193– 211 197
performance relative to their U.S. benchmarks or industry peers. Specifically, we use different con-ventional proxies for form benchmarks (such as firm size, book-to-market ratio, and equally weightedor value-weighted industry portfolios). Therefore, our study provides further insights for internationalinvestors into the understanding of the long-run investment opportunity and firm value in Chinesefirms.
Third, we examine the impacts of split-share structure reform on overseas listings in China. Wewant to see how this institutional change is related to the motivations to list overseas and long-runfirm performances of the Chinese ADRs and IPOs in the U.S. market. At the early stage, the maintarget of overseas listing of Chinese firms was to raise foreign capital. “Crossing the river throughtouching stones”, which is a Chinese saying that means doing things by trial and error, and thisis also the approach that China is following with overseas listings (Jia et al., 2005). Mr. Zhou, theformer chairman of the CSRC also mentioned that “Recommending medium-to-large SOEs for over-seas listing is useful in raising necessary foreign capital; but more importantly, it prods SOEs tolearn from the successful experiences of overseas companies, helping them to match internationalstandards, and making it possible for them to compete in the international market (July 26, 1995,CSRC web news).” Cheung et al. (2009) also find that there are significant differences in informa-tion disclosure between China and the neighboring Hong Kong market. Propped up firms are morelikely to have foreign shareholders (such as B-shares, H-shares and ADRs) compared to firms subjectto tunneling listed on the Chinese domestic markets. Thus, this paper examines the post-IPO per-formance deviations between the two types of listings (single-listings and cross-listed ADRs), andprovides further insight into the understanding of the great impacts of institutional changes on firmvalue.
Last and most importantly, we broaden the scope of the existing literature by examining the listingdecisions of Chinese firms from various stems of previous hypotheses based on agency theory, signal-ing hypothesis and corporate governance theory. Zhang and King (2010) recently demonstrate thatthe motives of Chinese companies to list abroad differ by the types of issues and by the market loca-tion. Cross-listing issuers are motivated by the legal and accounting standards of the foreign markets,as well as the demands for external capital and foreign expertise. In this paper, we simultaneouslyinvestigate the motives for Chinese firms to list abroad by incorporating the new risk factors summa-rized in Karolyi (2006) and other factors unique to Chinese companies. We study the importance offirm leverage, manager’s overinvestment and corporate governance on the long-run performance ofthe Chinese cross-listed firms in the context of liquidity hypothesis, signaling hypothesis and bondinghypothesis.
The results reveal that the Chinese firms in the U.S. generally underperform the U.S. bench-mark and industry peers within the first 3 years horizon after their initial public offerings. Thedifference in market performance between cross-listing ADRs and single-listings is significant andweakly supported in the long run, and cross-listing ADRs typically outperform those single-listingsdue to more stringent listing requirements and accounting standards which help to improve thecorporate governance and operating performance of Chinese ADRs in the United States. The firms’operating performances could hardly interpret the holding period abnormal returns relative to theirbenchmarks, implying that the Chinese ADRs are dominated by SOEs and their issuances are pri-marily determined by political relations, not by the firms’ desire to find growth opportunities orexpand foreign sales (Hung et al., 2008). Importantly, we find that Tobin’s Q and capital struc-ture changes provide significantly predictive information about the aftermarket performance ofthe Chinese firms. The results show that Chinese overseas listings are driven by over-investmentincentives, leverage effects, and free-cash-flow signaling, which is consistent with agency the-ory and signaling hypothesis. Our results have important implications for international investors,suggesting that international investors need further investigation of the types of listings and insti-tutional features of the Chinese firms in the U.S. rather than simply speculating the “China conceptsstock.”
The rest of the paper is structured as follows. Section 2 presents the literature and hypotheses.Section 3 discusses the data and provides descriptive statistics. Section 4 constructs the methodologiesand presents the empirical analyses, and Section 5 concludes.

Author's personal copy
198 Y. Luo et al. / J. of Multi. Fin. Manag. 22 (2012) 193– 211
2. Literature review and hypotheses
Earlier research based on market segmentation or risk premium hypothesis states that firms seekcross-border issuance in order to overcome barriers and gain access to more international invest-ments (Black, 1974; Solnik, 1974; Errunza and Losq, 1985; Merton, 1987; Foerster and Karolyi, 1998,1999). Simultaneously, the liquidity theory claims that cross-listing firms can benefit from a lowercost of capital in the sense that the greater the liquidity, the lower the spreads (Fanto and Karmel,1997; Pagano et al., 2002; Burns, 2004; Tolmunen and Torstila, 2005). The existing literature alongthe dimension of liquidity theory states that globalization improves the firms’ opportunities to raisecapital, and thus significantly increases the firms’ liquidity and lowers the firms’ leverage. Sarkissianand Schill (2004) examine the market preferences of firms listing abroad and find that geographic,economic, cultural, and industrial proximity is the main determinant of the choice of overseas listingexchange. On the other hand, the U.S. and European markets are attractive alternatives when oneconsiders market size and liquidity. Existing literature typically agrees that cross-listed firms obtain ashort-term positive abnormal return and a long-run negative abnormal return (Jayaraman et al., 1993;Miller, 1999; Foerster and Karolyi, 1999; Benos and Weisbach, 2004). Foerster and Karolyi (1999) showthat ADRs earn an abnormal return of 19% during the prelisting year, an additional 1.2% during thelisting week, but incur losses of 14% during the year following listing. They conclude that the resultscan be partially explained by the subsequent increases in liquidity and the amount of capital raisedat the time of cross-listing. Similar to Foerster and Karolyi (1999), Miller (1999) analyzes the stockprice in response to cross-listing events and confirms the short term gains. Moreover, Mittoo (2003)points out that the effects of liquidity and market segmentation vary over time, he finds that Canadianfirms underperform a benchmark index by 13–30% during a 3-year period after cross-listing in theU.S., which is consistent with the results of Alexander et al. (1988). Mittoo (2003) also documents adeterioration of operating performance during the 3 years following the cross-listing event. Sarkissianand Schill (2009) use a longer period of up to 10 years before and after the cross-listing event to studythe stock performance of cross-listed firms and they find little evidence of a permanent effect on stockreturns for firms that list abroad.
The economic rationale for this liquidity effect has been well documented in Jensen and Meckling’s(1976) seminal work. The agency theory states that an overseas listing contributes to corporate valueby increasing the firms’ free cash flow and reducing the firms’ leverage. There are two reasons. First,free cash flow implies a strong information effect for both IPOs and ADRs listed in the U.S. marketover the long run. It not only depends upon agency considerations, but also has different informationeffects on different firms. Jensen (1986) predicts that the availability of free cash flow in a firm canaffect managers’ investment decision, and the ability to invest over time is constraint with the levelof earnings or debt. Second, the capital structure indicates that pure leverage changes have a strongannouncement effect for the short-run market return as well as long-run operating performance.These predictions are also consistent with the differential information effects observed by Howe et al.(1992) and Denis et al. (1994) that the reduction in the agency costs provides a different rationalefor increases in earnings because reducing firm leverage is perceived as good news for over-investingfirms. In addition, previous event studies have investigated the impact of debt-for-equity exchangeson long-run stock performance and confirm that the leverage changes have significant effects onthe aftermarket performance of publicly listed firms (Jensen, 1986; Stulz, 1999). Therefore, free cashflow and capital structure policies interact to provide significant predictive information about futureabnormal stock returns. Thus, we propose an agency-based hypothesis stating that the abnormalreturns of overseas listed firms are associated with firms’ leverage due to liquidity effects.
Other theories in support of signaling effects claim that globalization of capital markets affectsfirm values because cross-listing signals market participants about the firm’s quality and long-runprofitability (Tinic and West, 1974; Amihud and Mendelson, 1987; Werner and Kleidon, 1996; Smithand Sofianos, 1997; Domowitz et al., 1998; Foerster and Karolyi, 1998, 1999; Miller, 1999). The sig-naling theory hypothesizes that the overseas-listing decision is driven by top management, and thusthe long-run stock performance is substantially affected by the managers’ over-investment strate-gies. Loughran and Ritter (1995) present evidence that companies successfully time their offeringsfor periods when valuations are high, with investors receiving low returns in the long-run. The
Author's personal copy
Y. Luo et al. / J. of Multi. Fin. Manag. 22 (2012) 193– 211 199
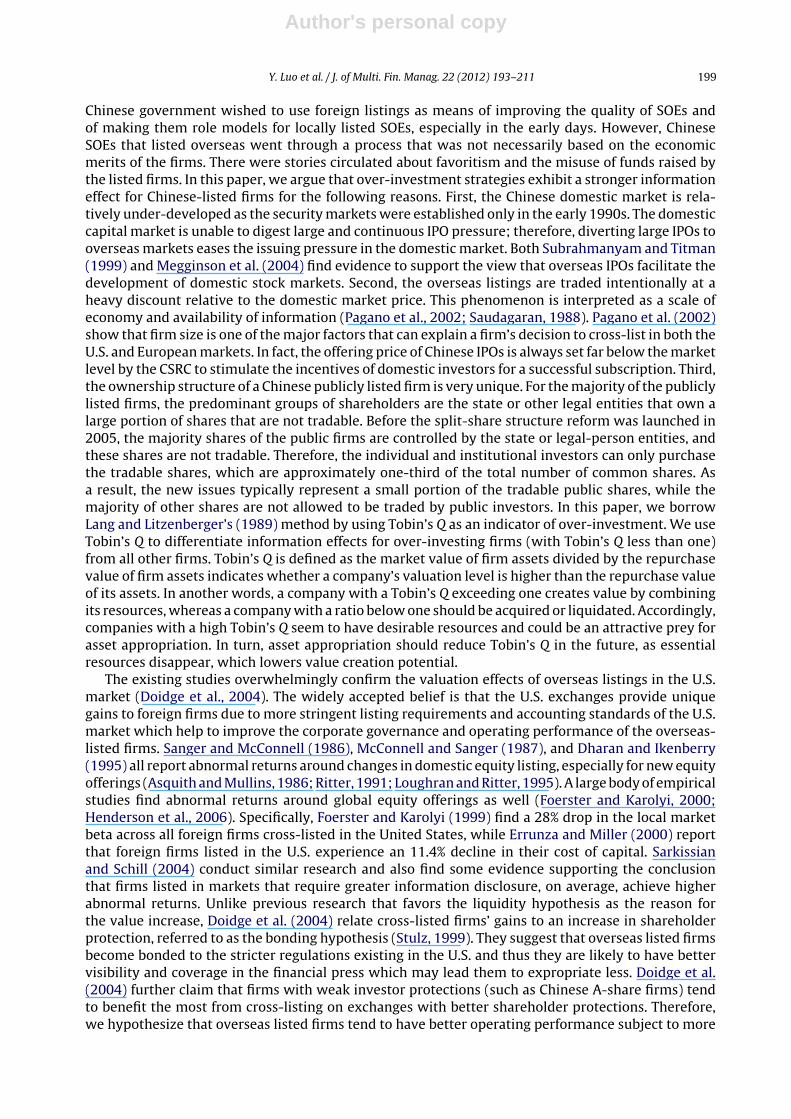
Chinese government wished to use foreign listings as means of improving the quality of SOEs andof making them role models for locally listed SOEs, especially in the early days. However, ChineseSOEs that listed overseas went through a process that was not necessarily based on the economicmerits of the firms. There were stories circulated about favoritism and the misuse of funds raised bythe listed firms. In this paper, we argue that over-investment strategies exhibit a stronger informationeffect for Chinese-listed firms for the following reasons. First, the Chinese domestic market is rela-tively under-developed as the security markets were established only in the early 1990s. The domesticcapital market is unable to digest large and continuous IPO pressure; therefore, diverting large IPOs tooverseas markets eases the issuing pressure in the domestic market. Both Subrahmanyam and Titman(1999) and Megginson et al. (2004) find evidence to support the view that overseas IPOs facilitate thedevelopment of domestic stock markets. Second, the overseas listings are traded intentionally at aheavy discount relative to the domestic market price. This phenomenon is interpreted as a scale ofeconomy and availability of information (Pagano et al., 2002; Saudagaran, 1988). Pagano et al. (2002)show that firm size is one of the major factors that can explain a firm’s decision to cross-list in both theU.S. and European markets. In fact, the offering price of Chinese IPOs is always set far below the marketlevel by the CSRC to stimulate the incentives of domestic investors for a successful subscription. Third,the ownership structure of a Chinese publicly listed firm is very unique. For the majority of the publiclylisted firms, the predominant groups of shareholders are the state or other legal entities that own alarge portion of shares that are not tradable. Before the split-share structure reform was launched in2005, the majority shares of the public firms are controlled by the state or legal-person entities, andthese shares are not tradable. Therefore, the individual and institutional investors can only purchasethe tradable shares, which are approximately one-third of the total number of common shares. Asa result, the new issues typically represent a small portion of the tradable public shares, while themajority of other shares are not allowed to be traded by public investors. In this paper, we borrowLang and Litzenberger’s (1989) method by using Tobin’s Q as an indicator of over-investment. We useTobin’s Q to differentiate information effects for over-investing firms (with Tobin’s Q less than one)from all other firms. Tobin’s Q is defined as the market value of firm assets divided by the repurchasevalue of firm assets indicates whether a company’s valuation level is higher than the repurchase valueof its assets. In another words, a company with a Tobin’s Q exceeding one creates value by combiningits resources, whereas a company with a ratio below one should be acquired or liquidated. Accordingly,companies with a high Tobin’s Q seem to have desirable resources and could be an attractive prey forasset appropriation. In turn, asset appropriation should reduce Tobin’s Q in the future, as essentialresources disappear, which lowers value creation potential.
The existing studies overwhelmingly confirm the valuation effects of overseas listings in the U.S.market (Doidge et al., 2004). The widely accepted belief is that the U.S. exchanges provide uniquegains to foreign firms due to more stringent listing requirements and accounting standards of the U.S.market which help to improve the corporate governance and operating performance of the overseas-listed firms. Sanger and McConnell (1986), McConnell and Sanger (1987), and Dharan and Ikenberry(1995) all report abnormal returns around changes in domestic equity listing, especially for new equityofferings (Asquith and Mullins, 1986; Ritter, 1991; Loughran and Ritter, 1995). A large body of empiricalstudies find abnormal returns around global equity offerings as well (Foerster and Karolyi, 2000;Henderson et al., 2006). Specifically, Foerster and Karolyi (1999) find a 28% drop in the local marketbeta across all foreign firms cross-listed in the United States, while Errunza and Miller (2000) reportthat foreign firms listed in the U.S. experience an 11.4% decline in their cost of capital. Sarkissianand Schill (2004) conduct similar research and also find some evidence supporting the conclusionthat firms listed in markets that require greater information disclosure, on average, achieve higherabnormal returns. Unlike previous research that favors the liquidity hypothesis as the reason forthe value increase, Doidge et al. (2004) relate cross-listed firms’ gains to an increase in shareholderprotection, referred to as the bonding hypothesis (Stulz, 1999). They suggest that overseas listed firmsbecome bonded to the stricter regulations existing in the U.S. and thus they are likely to have bettervisibility and coverage in the financial press which may lead them to expropriate less. Doidge et al.(2004) further claim that firms with weak investor protections (such as Chinese A-share firms) tendto benefit the most from cross-listing on exchanges with better shareholder protections. Therefore,we hypothesize that overseas listed firms tend to have better operating performance subject to more

Author's personal copy
200 Y. Luo et al. / J. of Multi. Fin. Manag. 22 (2012) 193– 211
stringent corporate governance, and the government-backed ADRs tend to have relatively superiorperformances in contrast to those of the single-listed Chinese IPOs in the U.S. market.
In addition, much evidence has been assembled in support of the corporate governance hypothesisbecause globalization improves corporate governance and thereby lowers the cost of capital (Foersterand Karolyi, 1993, 1999; Jayaraman et al., 1993; Alexander et al., 1988; Errunza and Miller, 2000; Kaulet al., 2006; Hail and Leuz, 2009). It assumes that a firm’s value depends heavily on its corporate gov-ernance system due to “information asymmetry” and “bonding” hypotheses; hence, firms often makea decision to list on foreign markets with more rigorous corporate governance procedures because ofthe poor domestic disclosure or transparency standards.
Changes in corporate governance and firm characteristics convey information to the stock marketabout the future performance of the firms. The legal system is an effective external mechanism toprotect minority shareholders. Many studies posit that the Chinese stock market institution is veryunique and quite different from that of the U.S. stock market. In China, all shares have the same votingand cash flow rights by law, but in reality, the stock market is segmented, as Chinese listed shares canbe classified according to the residency of their owner as domestic (A-shares) or foreign (B-, H-, and N-shares). A-shares are available exclusively to Chinese domestic investors, and are denominated in theChinese currency, while foreign shares are only available for trade by non-residents. Huang and Song(2005) studied the pre- and post-listing financial and operating performance for a complete sampleof H-shares between 1993 and 2000. One of the surprising findings is that the performance of newlylisted private firms declined more than that of the state-owned H-firms. The authors attribute suchan anomaly to the positive privatization effect that offsets the negative IPO effect for the H-firms. Kaoet al. (2009) focus on two sets of IPO regulations: pricing regulations and penalty regulations. Theyfind that Chinese IPO firms that report higher pricing-period accounting performance have engaged inmore income-increasing earnings management. On the other hand, penalty regulations have deterredIPO firms from making over-optimistic earnings forecasts and therefore have a positive impact onthe behavior of IPO firms. Tian (2011) finds that the extreme Chinese IPO underpricing is principallycaused by government intervention with IPO pricing regulations and the control of IPO share supplies.In this study, we use the industry peers from the home country as a benchmark,4 assuming that thegoal of Chinese firms cross-listing in the U.S. is to achieve better corporate governance and higherpermanent valuation gains; thus, we hypothesize that the aftermarket performance of single-listedADRs or stocks will be distinct relative to those cross-listed ADRs due to more stringent legislativeinstitutions and accounting standards which help to improve the corporate governance and operatingperformance of the overseas-listed Chinese firms.
3. Data
The Chinese stock market was established in the early 1990s. The Shanghai Securities Exchange(SHSE) was opened in 1990, followed by the establishment of the Shenzhen Stock Exchange (SZSE)in 1991. From May 2004, SZSE formally established a Small and Medium Enterprise (SME) board forgrowing firms. Meanwhile, the Chinese stock market was made partially accessible to foreign investors.In 2005, the CSRC introduced a split-share structure reform. Under this framework, non-tradableshares eventually become limited-tradable shares and in a longer horizon, the limited-tradable shareswill become regular tradable shares until they can trade without limit. Most Chinese firms chooseto cross-list in Hong Kong. SEHK provides a main listing board for major companies with a record ofconsistent operation and profit as well as a Growth Enterprise Market (GEM) that was established onNovember 25, 1999. In recent years, there is a growing body of Chinese firms that list stocks or ADRsin the U.S. markets, including AMEX, NYSE and NASDAQ.
As of December 31, 2010, a total of 1955 A-shares and 108 B-shares were listed on MainlandChina domestic markets (including both SHSE and SZSE) with a total tradable market capitalization
4 It would be interesting to construct a new study by using the Chinese domestic benchmarks to further investigate thisspecification. In this study, using the U.S. benchmarks is more appropriate rather than using the domestic industry peersbecause 80% of our sample firms is only listed in the U.S. markets in the forms of ADRs and stocks.

Author's personal copy
Y. Luo et al. / J. of Multi. Fin. Manag. 22 (2012) 193– 211 201
Table 1Descriptive statistics of different types of Chinese shares listed on both domestic and overseas markets.
Domestic listings (SHSE + SZSE) Overseas listings
A-share B-share H-shares N-shares
Main board GEM NYSE NASDAQ
Total number of shares 1955 108 165 29 63 180Market capitalization 3981.94 38.17 672.95 0.59 10.01 10.50
The data are collected and calculated as of December 31, 2010 from the following data sources: China SecuritiesRegulatory Commission (http://www.csrc.gov.cn/pub/newsite/sjtj/), Hong Kong Exchanges and Clearing Limited-China Dimension (http://www.hkex.com.hk/eng/stat/smstat/chidimen/cd hmb.htm), New York Stock Exchange–ListingDirectory (http://www.nyse.com/about/listed/lc all region 7.html?country=2), and NASDAQ-Company lists in China(http://www.nasdaq.com/screening/companies-by-region.aspx?region=Asia&country=China).This table reports the total number of shares and market capitalization for different types of Chinese shares listed in bothdomestic and overseas markets. A-shares are those shares that can only be purchased by Chinese citizens on the SHSE or theSZSE in Mainland China, while B-shares are foreign shares listed on the SHSE or the SZSE that can be purchased by foreigninvestors. H-shares are issued by Mainland Chinese firms but listed or cross-listed on the Hong Kong Stock Exchange (SEHK),which provides a main listing board for major companies with a record of consistent operation and profit as well as a GrowthEnterprise Market (GEM). N-shares are those stocks or ADRs issued by Chinese firms in the U.S. capital market, which includesNYSE and NASDAQ. The market capitalizations are reported in billions U.S. dollar. The local currencies are converted to the U.S.dollar as of the exchange rate on December 31, 2010 (1USD = 7.77249 HKD, 1USD = 6.60231 CNY).
of Chinese yuan 265,422.59 billion (equivalent to 4020.15 billion U.S. dollar). According to the CSRCoverseas listing statistics, a total of 165 H-shares were issued, among which 136 H-shares were listedon the main board of SEHK with market capitalization of HK$ 5,230.48 billion (equivalent to 672.95billion U.S. dollar), and 29 stocks were listed on GEM with a market capitalization of 0.59 billion U.S.dollar. Moreover, 63 Chinese firms listed their stocks or ADRs on NYSE and 180 Chinese firms listedtheir stocks or ADRs on NASDAQ and the market capitalization for each exchange is around 10 billionU.S. dollar. A detailed statistical summary of the Chinese shares on both domestic and overseas marketsis reported in Table 1.
Table 2 reports the market share of Chinese and foreign companies among the U.S. listings over1993–2011. The statistics shows that Bermuda, Canada, China, Greece, Israel, the Netherlands, and theUnited Kingdom are the most common countries for IPOs that list in the United States. Before 2001, thenumber of Chinese IPOs constituted only a very small portion of the foreign issuance (less than 10%),while after 2001, the number of Chinese IPOs jumped to more than 20% with a peak of 75% in 2009among all the foreign IPOs in the U.S. market. During the past two decades, the number of ChineseADRs listed in the U.S. have increased remarkably as well. After 2001, about 50% of the foreign ADRsin the U.S. were issued by Chinese firms. Particularly, during the time of recent financial crisis, morethan 90% of the new ADR issuances are from China as indicated by the number of Chinese ADRs overforeign ADRs with 100% in 2008, 77.78% in 2009, 94.12% in 2010 and 91.67% in 2011.
The sample consists of 73 Chinese firms that issued either stocks or ADRs in the U.S. during theperiod 1993–2010. The Chinese ADRs are typically listed before 2005, while the Chinese stocks orsingle-listings are mostly issued after 2005. Among all the ADR listings, we only choose type II andtype III ADRs and exclude all the ADRs that are traded via over the counter (OTC) or under 144A. We alsoexclude those firms that do not have continuously available trading history for at least 12 months. Thefinal sample consists of 73 firms including 59 single-listing ADRs/stocks and 14 cross-listing ADRs.5
The market and financial data are retrieved from China Center for Economic Research (CCER), Mergentonline, DataStream and the Center for Research in Security Prices (CRSP) database.
5 A single-listing ADR is an ADR whose underlying share is not publicly traded in the issuer’s home market. It is listed andtraded only in the ADR market, and its cancellation will not result in delivery of a locally listed ordinary share. In this study, weredeem the single-listing ADRs as the same as single-listed stocks in the U.S. markets.

Author's personal copy
202 Y. Luo et al. / J. of Multi. Fin. Manag. 22 (2012) 193– 211
Table 2The market share of Chinese and foreign companies among the U.S. listings 1993–2011.
Year Number of IPOs Number of ADRs
Total Domestic Foreign Chinese % Chinese/foreign Foreign Chinese % Chinese/foreign(1) (2) (3) (4) (4)/(3) (5) (6) (6)/(5)
1993 528 488 40 1 2.50% 19 1 5.26%1994 421 386 35 3 8.57% 18 2 11.11%1995 474 432 42 1 2.38% 17 1 5.88%1996 707 643 64 1 1.56% 32 1 3.13%1997 506 428 78 4 5.13% 33 3 9.09%1998 297 258 39 2 5.13% 13 1 7.69%1999 504 451 53 1 1.89% 28 0 0.00%2000 420 335 85 7 8.24% 40 4 10.00%2001 84 74 10 2 20.00% 5 2 40.00%2002 68 63 5 1 20.00% 2 1 50.00%2003 65 59 6 2 33.33% 3 2 66.67%2004 191 161 30 9 30.00% 17 9 52.94%2005 173 143 30 8 26.67% 13 8 61.54%2006 172 138 34 9 26.47% 15 7 46.67%2007 191 138 53 29 54.72% 31 27 87.10%2008 25 18 7 4 57.14% 4 4 100.00%2009 50 38 12 9 75.00% 9 7 77.78%2010 126 81 45 33 73.33% 34 32 94.12%2011 93 71 22 13 59.09% 12 11 91.67%
1993–2011 5095 4405 690 139 20.14% 345 123 35.65%
This table reports the market share of foreign companies among the U.S. listings over 1993–2011, including all the ADRsas well as other IPOs. The statistics excludes IPOs with an offer price below $5.00 per share, unit offers, REITs, closed-endfunds, partnerships, banks and S&Ls, and IPOs not listed on CRSP within six months of the offer date. Bermuda-domiciledcompanies are included as foreign, irrespective of the main country of operations. The authors have deleted those listings thatcan be found in “SDC Corrections” on Ritter’s IPO Data page) from the IPO counts. The count for Chinese IPOs does not includethose from Hong Kong, and excludes “reverse mergers” and best efforts IPOs. The data are obtained from Ritter’s website athttp://bear.warrington.ufl.edu/ritter/IPOs2011Foreign1912.pdf.
4. Methodology
4.1. Measuring the long-run aftermarket performance of Chinese stocks and ADRs
It is a general belief that IPO firms typically experience a significant under-performance relativeto their benchmarks in the subsequent 3–5 years after issuance (Ritter, 1991; Loughran and Ritter,1995). Such a phenomenon has been widely observed in the U.S. market as well as other internationalexchanges.6 Since the Chinese firms have a relatively short trading history in the U.S. market, weexamine the long-run Chinese IPOs and ADRs performance by constructing the buy and hold abnor-mal returns relative to the benchmark of different conventional proxies from 1 to 3 years after theissuances. Previous studies suggest that the measure of long-run performance for IPOs is sensitive tothe benchmark used. Barber and Lyon (1997) show that when long-run performances are calculated,the test statistics are negatively biased. This bias is, however, not present when abnormal returns arecalculated as the return of a sample firm less the return of a single control firm matched on size orbook-to-market (B/M) ratio. Moreover, the size and B/M characteristics have been documented exten-sively as important determinants of stock returns in previous literatures (Lakonishok et al., 1994;Loughran and Ritter, 1995; Daniel and Titman, 1997; Davis et al., 2000; Daniel et al., 2001). Follow-ing Ritter’s (1991) procedure, we construct three forms of benchmarks: size and B/M matching byindustry, equally weighted portfolio matching by industry and value-weighted portfolio matching byindustry.
6 The results have been recently challenged by the study of Megginson et al. (2000). They examined the long-run (1–5 years)performance of 158 share issue privatizations from 33 countries (including Chinese SOEs that are listed on the SEHK) and foundstatistically significant positive excess returns relative to a variety of benchmarks.

Author's personal copy
Y. Luo et al. / J. of Multi. Fin. Manag. 22 (2012) 193– 211 203
To control for both size and B/M effects, each sample firm is matched with a firm that has the closestB/M ratio and the same size quintiles in the preceding year. In addition, the matching firms have tobe listed for at least 3 years and have the necessary market value at the end of the issuing calendarmonth. The procedure for matching firms by size and B/M is based upon their market capitalizationand SIC code. Except for retrieving the book value for each matching firm from the annual accountingreport, we chose to compute the market value by multiplying the total share of outstanding and themarket price at the end of the issuing month for each firm. Since the total shares outstanding for eachfirm vary over time, B/M is defined as the previous year’s book equity divided by the total marketequity. If the matching firms cannot be achieved by utilizing the 4-digit SIC code, we match the firmswith the 2-digit SIC code and the closest B/M ratio. The alternative measure to find matching firms isto form a portfolio by industry with the same 4-digits SIC code. After obtaining the matching firms,we retrieve the market data for each firm from CRSP and calculate the stock returns over the samesample period. The industry benchmark portfolio return is formulated in two ways: equally weightedand value-weighted. We also use other popular matching techniques for robustness check and theresults are essentially consistent for different measures of matching firms.
To measure the long-run performance, we define the buy and hold return (BHR) for each stock ias the geometric average rate of return over the time periods t. In this paper, t is the relative monthup to 36 months after the IPO or ADR issuing month. Specifically, t = 12, 24, and 36 denoting the first,second and third year BHR for each stock i. Specifically, it is expressed as the following equation:
BHRi,t =T∏
t=1
(1 + reti,t) − 1 (1)
The buy and hold abnormal return (BHAR) for each stock i is defined as the geometric average rateof return over the time periods t of stock i relative to the benchmark. In specific, BHAR is the BHR ofstock i relative to the return on the matching firms by size and B/M; EWAR is the BHR of stock i relativeto the equally weighted benchmark portfolio return of the same industry (by 4-digits SIC code); VWARis the BHR of stock i relative to the value-weighted benchmark portfolio return of the same industry(by 4-digits SIC code); correspondingly, the BHAR can be expressed in the following equation:
BHARi,t =(
T∏t=1
(1 + reti,t) − 1
)−(
T∏t=1
(1 + retB,t) − 1
)(2)
where retB,t is the formulated benchmark (or portfolio) return at time t.Table 3 presents the summary of descriptive statistics for BHR and BHAR over the sample period.
Although the mean buy and hold abnormal returns for different periods of ADRs and IPOs relative totheir benchmarks are overwhelmingly positive, the median BHARs for the proxies over most of thesample periods are negative. Further examination shows that the positive means are largely driven byoutliers.7 The BHARs for IPO and ADR firms are lower than their matching firms during the first yearand the following second and third years. During the first year, the median BHAR return for the samplefirms is −14% over the benchmark matched by size and B/M, −5.5% and −5.0% over the equally weightedindustry-matched benchmark and value-weighted industry-matched benchmark respectively. Duringthe second and third years after IPO, the median BHAR returns still remain negatively between −11.1%and −19.5%. The distributions of monthly abnormal returns are skewed with high kurtosis, and theaccumulative volatilities of the returns increase consistently over time. The assumptions of normaldistribution of the returns are overwhelmingly rejected by Jarque–Bera (1980) test. Generally, theChinese ADRs and IPOs underperform their matching firms for all different holding periods. The resultsare consistent with the findings of Zhang and King (2010) that the stock returns after the listing eventsare generally negative for Chinese ADRs and foreign IPO stocks.
7 After controlling for outliers, we did the non-parametric one-way tests showing that the mean BHARs for different periodsof ADRs and IPOs relative to their matching firms are consistent with the median BHARs.

Author's personal copy
204 Y. Luo et al. / J. of Multi. Fin. Manag. 22 (2012) 193– 211
Table 3Descriptive statistics of buy and hold abnormal returns over different sample periods.
Mean Median Max Min SD Skewness Kurtosis J–B test N
First yearBHR 0.968 0.879 2.847 0.135 0.660 1.155 3.995 19.235*** 73BHAR 0.014 −0.140 1.774 −0.760 0.565 1.456 4.838 36.068*** 73EWAR 0.062 −0.055 1.777 −0.970 0.553 1.268 4.545 26.828*** 73VWAR 0.265 −0.050 1.852 −0.752 0.582 0.921 3.441 10.918*** 73
Second yearBHR 1.114 0.669 5.291 0.046 1.034 1.459 5.437 39.755*** 66BHAR 0.149 −0.195 3.942 −1.006 0.889 1.621 6.519 62.970*** 66EWAR 0.074 −0.111 3.758 −1.444 0.832 1.748 7.742 95.463*** 66VWAR 0.404 −0.146 4.144 −0.930 0.897 1.544 6.306 56.287*** 66
Third yearBHR 1.274 0.773 5.233 0.059 1.267 1.313 3.977 14.059*** 43BHAR 0.262 −0.146 4.030 −0.971 1.202 1.343 4.050 14.898*** 43EWAR 0.129 −0.281 3.994 −1.205 1.109 1.586 5.251 27.098*** 43VWAR 0.371 −0.140 4.348 −0.886 1.165 1.572 5.119 25.764*** 43
This table depicts the summary of descriptive statistics of BHR, BHAR, EWAR and VWAR for 73 Chinese stocks and ADRs listedin the U.S. in the first year, the second year and the third year after an initial public offering. BHR is the buy and hold returnfor each stock i which is defined as the geometric average rate of return over the time periods of t. BHAR is the BHR of stocki relative to the return on the benchmark matched by size and book-to-market ratio in the same industry; EWAR is the BHRof stock i relative to the equally weighted benchmark portfolio return of the same industry (by 4-digits SIC code); VWAR isthe BHR of stock i relative to the value-weighted benchmark portfolio return of the same industry (by 4-digits SIC code). N isthe total number of observations. J–B test is the Jarque–Bera (1980) test under the null of normal distribution. *** denotes 1%significance level.
4.2. Examining the abnormal returns differences between IPOs and ADRs
Table 4 reports the summary of two-sample t-test of the equality of the means and Pearson Chi-square test of the equality of the medians of the BHAR for the Chinese cross-listings vs. single-listingsin the U.S. in the first, second and third year as well as the overall sample period after initial publicoffering. Panel A reports the two-sample t-test for different periods of Chinese stocks and ADRs relativeto their matching firms. Although the single-listings seem to underperform the cross-listed ADRs forall different holding periods, the mean differences of abnormal returns between these two groups arenot likely to be statistically significant in the first year. Panel B reports the Pearson Chi-square test ofthe equality of medians for all the cross-listing ADRs and single-listings relative to their benchmarks.The Pearson Chi-square test has the advantage of making no assumption about the distribution of data.Technically speaking, it is non-parametric and distribution free, while the t-test is not robust enoughto handle this highly non-normal data with small sample size. As we can see in Panel B, over the longrun (24 or more months after the event date), the difference of BHAR returns between cross-listingsand single-listings appears to be significant by using more stringent benchmarks. The differences inmedians between cross-listing ADRs and single-listings matched by size and B/M in the same industryare statistically significant in the second and third years, and the results are also partially supported bythe portfolio-matched benchmarks. The results imply that the aftermarket performance of cross-listedADRs is superior to that of the single-listings over time. The cross-listed firms generally outperformthose single-listings because they are subject to more stringent listing requirements and accountingstandards which help to improve the corporate governance and operating performance. However, theevidence in support of the corporate governance theory and bonding hypothesis varies over time anddiffers with the methodologies used to form benchmarks.
4.3. Testing hypotheses and selecting determinants of the abnormal returns
The stylized facts illustrate that firms choose to list their equity in foreign markets and subsequentlyrealize substantive valuation gains. Such gains are generally attributed to a reduction of the super-riskpremium associated with the barriers or disadvantaged characteristics of the particular home equity

Author's personal copy
Y. Luo et al. / J. of Multi. Fin. Manag. 22 (2012) 193– 211 205
Table 4Two-sample t-test and Pearson Chi-square test of the equality of buy and hold abnormal return for cross-listing ADRs vs.single-listing ADR/stocks.
N BHAR EWAR VWAR
Panel A: two-sample t-test of the equality of the meansFirst year Single-listing 59 −0.006 0.104 0.299
Cross-listing 14 0.101 −0.117 0.122t-test −0.750 1.662 1.142
Second year Single-listing 54 −0.043 −0.033 0.253Cross-listing 12 1.011 0.324 0.861t-test −3.152*** −0.988 −1.687
Third year Single-listing 34 0.063 0.053 0.213Cross-listing 9 0.919 −0.076 0.459t-test −1.984** 0.280 −0.528
Overall Single-listing 147 −0.004 0.041 0.262Cross-listing 35 0.632 0.040 0.472t-test −3.263*** 0.008 −1.060
Panel B: Pearson Chi-square test of the equality of the mediansFirst year Single-listing 59 −0.204 −0.011 0.188
Cross-listing 14 −0.034 −0.223 −0.044Chi-square 5.389** 1.553 1.282
Second year Single-listing 54 −0.243 −0.188 −0.048Cross-listing 12 0.778 0.132 0.567Chi-square 10.185*** 4.660** 7.704***
Third year Single-listing 34 −0.341 −0.313 −0.159Cross-listing 9 0.451 −.347 0.188Chi-square 5.064** 0.056 1.142
Overall Single-listing 147 −0.232 −0.132 0.023Cross-listing 35 0.399 −0.111 0.281Chi-square 16.760*** 0.127 2.032*
This table reports the summary of two-sample t-test and Pearson Chi-square test of the equality of buy and hold abnormalreturn for the Chinese cross-listing ADRs vs. single-listing ADRs (or stocks) in the U.S. in the first year, second year, thirdyear and the overall sample period after the initial public offering. BHAR is the BHR of stock i relative to the return on thebenchmark matched by size and B/M ratio in the same industry; EWAR is the BHR of stock i relative to the equally weightedbenchmark portfolio return of the same industry (by 4-digits SIC code); VWAR is the BHR of stock i relative to the value-weightedbenchmark portfolio return of the same industry (by 4-digits SIC code). ***, **, * denote 1%, 5%, and 10% significance levelrespectively.
market. On the other hand, the overseas listing is costly, thus there must be some compelling reasonsfor Chinese firms to take a more costly route to raise capital in the U.S. market. In this study, we usethe return-on-equity (ROE) ratio to measure the firms’ operating performances. For robustness check,we also introduce two accounting performance ratios, return-on-asset (ROA) ratio and cash-flow-to-equity (CFE) ratio, to measure a firm’s profitability. To test the signaling hypothesis, we employ Tobin’sQ (TOBIN) ratio that is defined as the market value of a company divided by the replacement valueof the firm’s assets. Moreover, we use the total debt-to-equity (LEV) ratio to measure the leveragechanges for each firm. The following step describes the explanatory variables that are used in themodel and summarizes the statistical features over the first, second and third year horizons. Table 5shows that the mean and median values of Tobin’s Q and leverage are overwhelmingly larger than1 with non-normality distributions. All the CFE ratios are around 15–20%, implying the possibility offree-cash-flow effects. The market performance represented by ROE are 19.9% on average in the firstyear, but drops to 8.6% in the following year, and increases slightly to 11.3% in the third year. Thechanges in ROE suggest a potential market timing effect. In addition, the high leverage and low ROAratio suggest that the Chinese overseas-listed firms typically have sufficient funds but poor operatingefficiency. In general, the descriptive statistics seems to support the long-run IPO underperformancehypotheses and signaling theory.
To further diagnostically check the relationships between the abnormal returns and the explanatoryvariables, we report the correlation matrix in Table 6. It illustrates that the buy and hold abnormalreturns matched by different proxies are highly correlated. The correlation between BHAR and EWAR

Author's personal copy
206 Y. Luo et al. / J. of Multi. Fin. Manag. 22 (2012) 193– 211
Table 5Descriptive statistics of the explanatory variables over different horizons.
Mean Median Max Min SD Skewness Kurtosis J–B test N
First yearCFE 0.263 0.230 1.022 −0.238 0.232 1.195 5.163 29.859*** 73LEV 3.619 2.189 19.046 1.182 3.411 2.384 8.986 168.41*** 73ROA 0.132 0.104 0.586 −0.239 0.146 0.821 5.044 19.761*** 73ROE 0.266 0.196 1.618 −0.642 0.319 1.327 7.515 78.850*** 73TOBIN 2.970 1.541 12.851 1.008 3.006 2.023 6.538 26.479*** 73
Second yearCFE 0.149 0.127 0.395 −0.013 0.108 0.693 2.625 4.723* 62LEV 7.092 4.705 33.421 1.132 7.401 2.186 7.158 94.040*** 62ROA 0.087 0.075 0.464 −0.073 0.081 1.705 9.368 134.783*** 62ROE 0.119 0.110 0.561 −0.155 0.111 0.941 6.385 38.745*** 62TOBIN 3.312 2.492 14.837 0.871 2.571 2.002 8.556 109.435*** 62
Third yearCFE 0.164 0.158 0.426 −0.041 0.125 0.093 2.099 11.128** 34LEV 4.569 3.038 22.638 1.060 4.170 2.658 11.496 142.279*** 34ROA 0.078 0.063 0.314 −0.054 0.087 0.827 3.455 4.171* 34ROE 0.091 0.098 0.428 −0.953 0.216 −3.257 17.290 349.389*** 34TOBIN 3.222 1.788 17.956 0.852 3.546 2.832 11.054 133.315*** 34
This table depicts the summary of descriptive statistics of the explanatory variables for 73 Chinese stocks and ADRs listed in theU.S. in the first year, second year and third year after the initial public offering. CFE is cash flow to total equity ratio; LEV is totaldebt to total equity; ROA is return on asset; ROE is return on equity; TOBIN is Tobin’s Q. N is the total number of observations.J–B test is the Jarque–Bera (1980) test for normality.
* 10% significance level.** 5% significance level.
*** 1% significance level.
is 0.92, and the correlation between BHAR and VWAR is 0.91. The high correlations among differentfirms’ performance measures are also observed in the table. All the abnormal returns are negativelyrelated to the firm’s leverage, but positively associated with firm’s value represented by Tobin’s Q.Moreover, the abnormal returns have a positive but relatively weak relationship with the operatingperformance measures, such as CFE, ROE and ROA. To check whether these variables are collinear, weperform a variance inflation factor (VIF) test by using BHAR as dependent variable. The VIF indicatorsare substantially lower than 10, so collinearity should not be a problem.
Table 6Correlation matrix.
BHAR EWAR VWAR CFE LEV ROA ROE TOBIN VIF
BHAR 1EWAR 0.923 1VWAR 0.913 0.916 1CFE 0.115 0.001 0.057 1 1.90LEV −0.187 −0.153 −0.152 −0.376 1 1.27ROA 0.103 0.059 0.040 0.539 −0.042 1 2.96ROE 0.150 0.087 0.085 0.656 −0.186 0.927 1 2.72TOBIN 0.302 0.399 0.301 −0.053 0.073 0.303 0.238 1 1.19
This table presents the Pearson correlation matrix between each selected variable for 73 Chinese stocks and ADRs listed in theU.S. over the sample period after the initial public offering. BHAR is the BHR of stock i relative to the return on the benchmarkmatched by size and B/M ratio in the same industry; EWAR is the BHR of stock i relative to the equally weighted benchmarkportfolio return of the same industry (by 4-digits SIC code); VWAR is the BHR of stock i relative to the value-weighted benchmarkportfolio return of the same industry (by 4-digits SIC code). CFE is cash flow to total equity ratio; LEV is total debt to total equity;ROA is return on asset; ROE is return on equity; TOBIN is Tobin’s Q. VIF is variance inflation factor test for collinearity (by usingBHAR as dependent).

Author's personal copy
Y. Luo et al. / J. of Multi. Fin. Manag. 22 (2012) 193– 211 207
4.4. Empirical results on the determinants of abnormal returns
We construct the following model by regressing the BHAR relative to different benchmarks on thefirm’s leverage, operating performance, and Tobin’s Q over the first, second and third-year period afterthe initial public offering. Based on our hypotheses, the testing model is specified as follows in Eq. (3):
BHARi,t = ̨ + ˇP × Performancei,t + ˇO × Overinvestmenti,t + ˇL × Leveragei,t + εi,t (3)
The testing equation can be rewritten as follows in Eqs. (4)–(6):
BHARi,t/VWARi,t/EWARi,t = ˛1 + ˇ1 × ROEi,t + ˇ2 × TOBINi,t + ˇ3 × LEVi,t + εi,t (4)
BHARi,t/VWARi,t/EWARi,t = ˛2 + �1 × ROAi,t + �2 × TOBINi,t + �3 × LEVi,t + εi,t (5)
BHARi,t/VWARi,t/EWARi,t = ˛3 + �1 × CFEi,t + �2 × TOBINi,t + �3 × LEVi,t + εi,t (6)
where BHAR is the BHR of stock i relative to the return on the benchmark matched by size and B/Mratio in the same industry; VWAR is the BHR of stock i relative to the value-weighted benchmarkportfolio return of the same industry (by 4-digits SIC code). EWAR is the BHR of stock i relative tothe equally weighted benchmark portfolio return of the same industry (by 4-digits SIC code); ROE isreturn on equity; TOBIN is Tobin’s Q; LEV is total debt to total equity ratio; ROA is return on asset; CFEis cash flow to total equity.
The results indicate that Tobin’s Q and firm leverage provide significantly predictive informationabout the long-run market performance of Chinese firms listed in the U.S. market. We use Tobin’s Qwith a value less than one as an indicator of over-investment. Table 7 shows that Tobin’s Q is statisticallysignificant at the 1% level to interpret the market abnormal returns for Chinese overseas IPOs and ADRs.We find that one unit of increase in Tobin’s Q tends to increase the buy and hold abnormal returnsby 10%. The results show there is a stronger information effect of Tobin’s Q on BHARs, supportingthe over-investment hypothesis that changes in Tobin’ Q may convey information regarding a firm’sfuture market performance.8
The results also demonstrate that the firm’s leverage has a strong information effect for those Chi-nese firms listed in the United States. The debt-to-equity ratio is statistically significant and negativelycorrelated with the abnormal returns, one unit of increase in the firm’s leverage tends to reduce thefirms’ long-run abnormal returns by 2–3%. It shows that high firm leverage tends to deteriorate thefirms’ long-run abnormal returns relative to their benchmarks. Following Stulz’ (1999) arguments,combined with those of Jensen (1986), we conclude that capital structure changes reflect the changesin agency costs. The results imply that free cash flow may be used to fund negative net present value(NPV) projects (Jensen, 1986). Therefore, our results are in support of the agency theory and consistentwith free cash flow hypothesis that globalization improves the Chinese firms’ opportunities to raisecapital, and thus changes the firms’ leverage and long-run abnormal returns.
Table 7 shows that the Chinese firms generally underperform the U.S. benchmark and industrypeers in the long run and the issuers experience a significant drop in operating performance in 3 yearsafter IPO. The Chinese firms do not seem to enjoy better net income growth or greater returns in cap-ital expenditure than their industry peers. The holding period abnormal returns have no significantrelationship with the firms’ operating performance that is represented by ROA, ROE, and CFE. Theresults are consistent with the previous findings that the Chinese ADRs are dominated by SOEs andtheir issuances are primarily determined by political relations, not by the firms’ desire to find growthopportunities or expand foreign sales (Hung et al., 2008). Moreover, since the primary goal of autho-rization for overseas listing is to raise capital rather than to pursue long-run profitability, the initialprice is intentionally issued at a deep discount price relative to the domestic market price. To seekapproval for the quotas to be listed abroad, the firms have to suffer extraordinary costs for approval
8 Lang and Litzenberger (1989) argue that, on average, over-invested firms have greater price reactions to changes in thefirms’ fundamentals.

Author's personal copy
208 Y. Luo et al. / J. of Multi. Fin. Manag. 22 (2012) 193– 211
Table 7Cross-sectional regressions of the determinants of buy and hold abnormal returns.
Dependentvariables
Panel A Panel B Panel C
BHAR EWAR VWAR BHAR EWAR VWAR BHAR EWAR VWAR
ROE 0.203(0.24)
−0.163(−0.28)
0.042(0.07)
ROA −0.303(−0.25)
−0.742(−0.66)
−0.657(−0.55)
CFE 0.240(0.27)
−1.349(−1.67)
−0.691(−0.80)
TOBIN 0.103***
(3.27)0.137***
(4.60)0.111***
(3.52)0.107***
(3.37)0.141***
(4.64)0.117***
(3.64)0.106***
(3.46)0.135***
(4.65)0.113***
(3.68)LEV −0.041**
(−2.59)−0.028*
(−1.89)−0.032**
(−2.04)−0.042***
(−2.69)−0.028*
(−1.89)−0.032**
(−2.06)−0.039**
(−2.20)−0.038**
(−2.27)−0.039**
(−2.18)Constant 0.131
(0.70)−0.218(−1.40)
0.180(1.10)
0.173(0.98)
−0.190(−1.19)
0.220(1.30)
0.108(0.44)
0.055(0.24)
0.337(1.40)
N 104 109 109 104 109 109 101 106 106R2 0.15 0.19 0.13 0.15 0.19 0.14 0.15 0.21 0.14Adj. R2 0.126 0.163 0.109 0.126 0.165 0.112 0.123 0.183 0.119
This table reports the cross-sectional regressions of buy and hold abnormal returns on the explanatory variables for 73 Chinesestocks and ADRs listed in the U.S. over the sample period after the initial public offering. The estimated equation is
BHARi,t/VWARi,t/EWARi,t = ˛1 + ˇ1 × ROEi,t + ˇ2 × TOBINi,t + ˇ3 × LEVi,t + εi,t
BHARi,t/VWARi,t/EWARi,t = ˛2 + �1 × ROAi,t + �2 × TOBINi,t + �3 × LEVi,t + εi,t
BHARi,t/VWARi,t/EWARi,t = ˛3 + �1 × CFEi,t + �2 × TOBINi,t + �3 × LEVi,t + εi,t
BHAR is the BHR of stock i relative to the return on the benchmark matched by size and B/M ratio in the same industry; VWAR isthe BHR of stock i relative to the value-weighted benchmark portfolio return of the same industry (by 4-digits SIC code). EWARis the BHR of stock i relative to the equally weighted benchmark portfolio return of the same industry (by 4-digits SIC code);CFE is cash flow to total equity ratio; LEV is total debt to total equity; ROA is return on asset; ROE is return on equity; TOBIN isTobin’s Q. N is the total number of observations. t-statistics are presented in parentheses.
* 10% significance level.** 5% significance level.
*** 1% significance level.
of overseas listings. In sum, the results are consistent with the signaling hypothesis and agency the-ory, suggesting that Chinese overseas listings and financing policies are driven by over-investmentincentives, leverage effects and free-cash-flow signaling.
5. Conclusions
The results reveal that the overseas-listed Chinese IPOs and ADRs generally underperform the U.S.benchmark and industry peers within the first 3-year horizon after the initial public offering. Theinstitutional change caused by split-share structure reform has great impacts on the motivations tolist abroad for Chinese firms. The long-run abnormal returns between cross-listing ADRs and single-listings appear to be statistically different over time, and cross-listing ADRs generally outperformsingle-listings due to the more stringent listing requirements and accounting standards which help toimprove the corporate governance and operating performance of the Chinese firms. The results seemsto support corporate governance theory and bonding hypothesis, although the evidence is weaklysupported in the short run and differs from the methodologies used to form the benchmarks.
Subsequent to the listing events, the operating performances that are represented by ROA, CFE andROE have no significant interpreting power to the holding period abnormal returns of the Chinesefirms relative to their benchmarks. The result is consistent with the findings of Hung et al. (2008) thatthe Chinese ADRs are dominated by SOEs and their issuances are primarily determined by politicalrelations, not by the firms’ desire to find growth opportunities or expand foreign sales. It impliesthat the Chinese overseas listings are driven by the government for political purpose, and the results
Author's personal copy
Y. Luo et al. / J. of Multi. Fin. Manag. 22 (2012) 193– 211 209
are consistent with the previous findings that the listing process was not necessarily based on theeconomic merits of the firms.
The results appear to support signaling theory and are consistent with agency theory. Tobin’s Q andfirm leverage provide significantly predictive information about the aftermarket performance of theChinese ADRs and IPOs in the U.S. market. The findings indicate that the Chinese issuers are motivatedto cross-list in the U.S. due to over-investment incentives, leverage effects, and free-cash-flow signal-ing. We suggest that international investors need further investigation of the institutional features ofthe Chinese overseas listings rather than simply speculating in the “China concepts stock.” The find-ings have important implications for international portfolio diversification and the understanding oflong-run investment opportunities in the Chinese overseas-listed firms.
Acknowledgements
The previous draft of the paper is presented and circulated at the Financial Management Association(FMA) 2011 annual meeting with a different version. The authors are grateful to the helpful commentsfrom Dr. Thanh N. Ngo, William G. Christie, Gergana L. Kostova and the session participants at the FMA2011 conference. This paper is under Dr. Ngo’s mentorship for the College Research and Development(CRD) program and is named as 2nd prize winner among the best PhD students’ papers at the Collegeof Business Administration at University of Texas-Pan American.
References
Alexander, G., Eun, C., Janakiramanan, S., 1988. International listings and stock returns: some empirical evidence. J. Finan. Quant.Anal. 23, 135–151.
Amihud, A., Mendelson, H., 1987. Trading mechanisms and stock returns: an empirical investigation. J. Finance 42, 533–555.Asquith, P., Mullins, D.W., 1986. Equity issues and offering dilution. J. Finan. Econ. 15, 61–89.Barber, B., Lyon, J., 1997. Detecting long-run abnormal stock returns: the empirical power and specification of test statistics. J.
Finan. Econ. 43, 341–372.Benos, E., Weisbach, M.S., 2004. Private benefits and cross-listings in the United States. Emerg. Markets Rev. 5, 217–240.Bianconi, M., Tan, L., 2008. Cross-listing premium in the US and the UK destination. Tufts University, Working Paper.Black, F., 1974. International capital market equilibrium with investment barriers. J. Finan. Econ. 1, 337–352.Burns, N., 2004. The role of cross-listed stocks as an acquisition currency: evidence from takeovers of U.S. firms. University of
Georgia, Working Paper.Chen, X., Chen, X., Gu, B., 1997. Empirical study of Chinese stock market efficiency. Acc. Res. 9, 13–17.Chen, Z., Choi, J.J., Jiang, C., 2009. Private benefits in IPOs: evidence from state-owned firms. AFA 2009 San Francisco, Meetings
Paper. Available at SSRN: http://ssrn.com/abstract=1089563.Cheung, Y., Jing, L., Lu, T., Rauc, P.R., Stouraitisa, A., 2009. Tunneling and propping up: an analysis of related party transactions
by Chinese listed companies. Pacific-Basin Finance J. 17, 372–393.Claessens, S., Klingebiel, D., Schmukler, S.L., 2006. Stock market development and internationalization: do economic fundamen-
tals spur both similarly? J. Empirical Finance 13, 316–350.Daniel, K., Titman, S., 1997. Evidence on the characteristics of cross-sectional variance in common stock returns. J. Finance 52,
1681–1714.Daniel, K., Titman, S., Wei, K.C., 2001. Explaining the cross-section of stock returns in Japan: factors or characteristics? J. Finance
56, 743–766.Davis, J., Fama, E., French, K., 2000. Characteristics, covariance, and average returns: 1929 to 1997. J. Finance 50, 1579–1593.Denis, D., Denis, D., Sarin, A., 1994. The information content of dividend changes: cash flow signaling, overinvestment, and
dividend clienteles. J. Finan. Quant. Anal. (December), 576–592.Dharan, B., Ikenberry, D., 1995. The long-run negative drift of post-listing stock returns. J. Finance 50, 1547–1574.Doidge, C., Karolyi, G.A., Stulz, R., 2004. Why are foreign firms listed in the U.S. worth more? J. Finan. Econ. 71, 205–238.Domowitz, I., Glen, J., Madhavan, A., 1998. International cross-listing and order flow migration: evidence from an emerging
market. J. Finance 53, 2001–2027.Errunza, V., Losq, E., 1985. International asset pricing under mild segmentation: theory and tests. J. Finance 40, 105–124.Errunza, V., Miller, D., 2000. Market segmentation and the cost of capital in international equity markets. J. Finan. Quant. Anal.
35, 577–600.Eun, C.S., Huang, W., 2007. Asset pricing in China’s domestic stock markets: is there a logic? Pacific-Basin Finance J. 15, 452–480.Fanto, J.A., Karmel, R.S., 1997. A report on the attitudes of foreign companies regarding a US listing. Stanford J. Law Bus. Finance
3, 51–83.Fernald, J., Rogers, J.H., 2002. Puzzles in the Chinese stock market. Rev. Econ. Statist. 84, 416–432.Foerster, S., Karolyi, G.A., 1993. International listings of stocks: the case of Canada and the U.S. J. Int. Bus. Stud. 24, 763–784.Foerster, S., Karolyi, G.A., 1998. Multi-market trading and liquidity: a transaction data analysis of Canada–U.S. inter listings. J.
Int. Finan. Markets Inst. Money 8, 393–412.Foerster, S., Karolyi, G.A., 1999. The effects of market segmentation and investor recognition on asset prices: evidence from
foreign stocks listing in the United States. J. Finance 54, 981–1013.Foerster, S., Karolyi, G.A., 2000. The long run performance of global equity offerings. J. Finan. Quant. Anal. 35, 499–528.

Author's personal copy
210 Y. Luo et al. / J. of Multi. Fin. Manag. 22 (2012) 193– 211
Gao, S., 2002. China stock market in a global perspective. Research Report, Dow Jones Indexes. Dow Jones & Company, SouthBrunswick, NJ.
Hail, L., Leuz, C., 2009. Cost of capital effects and changes in growth expectations around U.S. cross-listings. J. Finan. Econ. 93,428–454.
Henderson, B.J., Jegadeesh, N., Weisbach, M.S., 2006. World markets for raising new capital. J. Finan. Econ. 82, 63–101.Howe, K.M., He, J., Kao, W., 1992. One time cash flow announcements and free cash flow theory: share repurchases and special
dividends. J. Finance (December), 1963–1975.Huang, G., Song, F.M., 2005. The financial and operating performance of China’s newly listed H-firms. Pacific-Basin Finance J. 13
(1), 53–80.Hung, M., Wong, T.J., Zhang, T., 2008. Political relations and overseas stock exchange listing: evidence from Chinese state-owned
enterprises. SSRN: http://ssrn.com/abstract=1224162.Ibbotson, R.G., Sindelar, J.R., Ritter, J.R., 1994. The market’s problems with the pricing of initial public offerings. J. Appl. Corp.
Finance 7, 66–74.Jarque, C.M., Bera, A.K., 1980. Efficient tests for normality, homoscedasticity and serial independence of regression residuals.
Econ. Lett. 6, 255–259.Jayaraman, N., Shastri, K., Tandon, K., 1993. The impact of international cross-listings on risk and return: evidence from American
Depository Receipts. J. Banking Finance 17, 91–103.Jensen, M.C., Meckling, W.H., 1976. Theory of the firm: managerial behavior, agency costs and ownership structure. J. Finan.
Econ. 3, 305–360.Jensen, M.C., 1986. Agency costs of free cash flow, corporate finance, and takeovers. Am. Econ. Rev. (May), 659–665.Jia, J., Sun, Q., Tong, W., 2005. Privatization through an overseas listing: evidence from China’s H-Share firms. Finan. Manage.
34, 5–30.Kao, J., Wu, D., Yang, Z., 2009. Regulations, earnings management, and post-IPO performance: the Chinese evidence. J. Banking
Finance 33, 63–76.Karolyi, G.A., 2006. The world of cross-listings and cross-listings of the world: challenging conventional wisdom. Rev. Finance
10, 99–152.Kaul, A., Vikas, M., Blake, P., 2006. Ownership, foreign listings, and market valuation. CEI Working Paper Series 2005-13. Center
for Economic Institutions, Hitotsubashi University.Lakonishok, J., Shleifer, A., Vishny, R., 1994. Contrarian investment, extrapolation, and risk. J. Finance 49, 1541–1578.Lang, L.H.P, Litzenberger, R.H., 1989. Dividend announcements: cash flow signaling vs. free cash flow hypothesis? J. Finan. Econ.
(September), 181–191.Li, Y., Yan, D., Greco, J., 2006. Market segmentation and price differentials between A shares and H shares in the Chinese stock
markets. J. Multinat. Finan. Manage. 16, 232–248.Loughran, T., Ritter, J.R., 1995. The new issues puzzle. J. Finance 50, 23–51.Loughran, T., Ritter, J.R., Rydqvist, K., 2011. Initial public offerings: international insights. Retrieved from
http://bear.warrington.ufl.edu/ritter/IntDec2011.pdf.Luo, Y., Jackson, D., 2012. Executive compensation, ownership structure and firm performance in Chinese financial corporations.
Global Bus Finance Rev. 17 (1), 56–74.McConnell, J.J., Sanger, G.C., 1987. The puzzle in post-listing common stock returns. J. Finance 42, 119–140.Megginson, W., Netter, J., Nash, R., Schwartz, A., 2000. The long-term returns to investors in share issue privatizations. Finan.
Manage. 29, 67–77.Megginson, W.L., Nash, R.C., Netter, J., Poulsen, A., 2004. The choice of private versus public capital markets: evidence from
privatizations. J. Finance 59, 2835–2870.Merton, R., 1987. Presidential address: a simple model of capital market equilibrium with incomplete information. J. Finance
42, 483–510.Miller, D.P., 1999. The market reaction to international cross-listings: evidence from depositary receipts. J. Finan. Econ. 51,
103–123.Mittoo, U.R., 2003. Globalization and the value of US listing: revisiting Canadian evidence. J. Banking Finance 27, 1629–1661.Pagano, M., Roell, A.A., Zechner, J., 2002. The geography of equity listing: why do European companies list abroad? J. Finance
57, 2651–2694.Ritter, J.R., 1991. The long-run performance of initial public offerings. J. Finance 46, 3–27.Ritter, J.R., 2011. The market share of foreign companies among U.S. listings, 1988–2011. Retrieved from
http://bear.warrington.ufl.edu/ritter/IPOs2011Statistics020112.pdf.Sanger, G.C., McConnell, J.J., 1986. Stock exchange listings, firm value, and security market efficiency: the impact of NASDAQ. J.
Finan. Quant. Anal. 21, 1–25.Sarkissian, S., Schill, M.J., 2004. The overseas listing decision: new evidence of proximity preference. Rev. Finan. Stud. 17,
769–809.Sarkissian, S., Schill, M.J., 2009. Are there permanent valuation gains to overseas listing? Rev. Finan. Stud. 22, 371–412.Saudagaran, S., 1988. An empirical study of selected factors influencing the decision to list on foreign stock exchanges. J. Int.
Bus. Stud. 19, 101–127.Smith, K., Sofianos, G., 1997. The impact of a NYSE listing on the global trading of non-US stocks. NYSE Working Paper.Solnik, B., 1974. An equilibrium model of the international capital market. J. Econ. Theory 18, 365–378.Stulz, R., 1999. Globalization, corporate finance, and the cost of capital. J. Appl. Corp. Finance 12, 8–25.Subrahmanyam, A., Titman, S., 1999. The going-public decision and the development of financial markets. J. Finance 54,
1045–1082.Sun, Q., Tong, W., 2003. China share issue privatization: the extent of its success. J. Finan. Econ. 70, 183–222.Tian, L., 2011. Regulatory underpricing: determinants of Chinese extreme IPO returns. J. Empirical Finance 18, 78–90.Tinic, S., West, R., 1974. Marketability of common stocks in Canada and the USA: a comparison of agent versus dealer dominated
markets. J. Finance 29, 729–746.Tolmunen, P., Torstila, S., 2005. Cross-listings and M&A activity: transatlantic evidence. Finan. Manage. 34, 123–142.

Author's personal copy
Y. Luo et al. / J. of Multi. Fin. Manag. 22 (2012) 193– 211 211
Wang, X., Xu, L.C., Zhu, T., 2004. State-owned enterprises going public. Econ. Transition 12, 467–487.Werner, I., Kleidon, A., 1996. U.S. and U.K. trading of British cross-listed stocks: an intraday analysis of market integration. Rev.
Finan. Stud. 9, 619–664.Yang, T., Lau, S.T., 2006. Choice of foreign listing location: experience of Chinese firms. Pacific-Basin Finance J. 14, 311–326.Zhang, C.X., King, T.D., 2010. The decision to list abroad: the case of ADRs and foreign IPOs by Chinese companies. J. Multinat.
Finan. Manage. 20, 71–92.Zhang, Y., Zhou, Y., 2001. Is Chinese stock market weakly efficient? J. Finan. Res. 24, 34–40.