
The opening of the European electricity market and environmental policy: does the degree of...
46
FACULTY OF ECONOMICS AND APPLIED ECONOMIC SCIENCES CENTER FOR ECONOMIC STUDIES ENERGY, TRANSPORT & ENVIRONMENT KATHOLIEKE UNIVERSITEIT LEUVEN WORKING PAPER SERIES n°2003-15 A. Bigano (Fondazione Eni-Enrico Mattei (Venice Italy)) S. Proost (K.U.Leuven) December 2003 secretariat: Isabelle Benoit KULeuven-CES Naamsestraat 69, B-3000 Leuven (Belgium) tel: +32 (0) 16 32.66.33 fax: +32 (0) 16 32.69.10 e-mail: [email protected] http://www.kuleuven.be/ete The opening of the European electricity market and environmental policy: does the degree of competition matter?
-
Upload
independent -
Category
Documents
-
view
0 -
download
0
Transcript of The opening of the European electricity market and environmental policy: does the degree of...
FACULTY OF ECONOMICS AND APPLIED ECONOMIC SCIENCES CENTER FOR ECONOMIC STUDIES ENERGY, TRANSPORT & ENVIRONMENT
KATHOLIEKE UNIVERSITEIT
LEUVEN
WORKING PAPER SERIES n°2003-15
A. Bigano (Fondazione Eni-Enrico Mattei (Venice Italy)) S. Proost (K.U.Leuven)
December 2003
secretariat: Isabelle Benoit KULeuven-CES
Naamsestraat 69, B-3000 Leuven (Belgium) tel: +32 (0) 16 32.66.33 fax: +32 (0) 16 32.69.10
e-mail: [email protected] http://www.kuleuven.be/ete
The opening of the European electricity market and environmental policy: does the degree of competition
matter?
ENERGY, TRANSPORT AND ENVIRONMENT CENTER FOR ECONOMIC STUDIES Naamsestraat 69 B-3000 LEUVEN BELGIUM
KATHOLIEKEUNIVERSITEIT
LEUVEN
The opening of the European electricity market and environmental policy: does the degree of
competition matter?1
Andrea Bigano2 and Stef Proost3
Abstract
This paper studies the relevance of strategic trade effects in the environmental policy for
the European electricity sector. The production, investment and trade of electricity are
modelled for four European countries. Three market regimes are distinguished: perfect
competition, price regulation and Cournot competition. The model is used to examine the
effect of the degree of competition on the state of the environment and to study the
strategic trade effects of unilateral environmental policies.
Keywords: Electricity, Trade and the Environment,
JEL-classification: L94, F18, D43.
Corresponding Address: Andrea Bigano
1 This research was funded by a research grant of the Katholieke Universiteit Leuven (OT), We acknowledge
useful comments from A. Ulph, E. Schokkaert, F.Abraham, F. Spinnewijn, C. Crombez, L. Franckx, and from seminar participants at The 2nd World Congress of Environmental and Resource Economists (Monterrey, California, USA,) at the Twelfth EAERE Conference (Bilbao,Spain), RFF (Washington DC, USA), SPEED (Oldenb urg, Germany).
2 Fondazione Eni-Enrico Mattei (Venice Italy), The Abdus Salam Center for Theoretical Physics, (Trieste, Italy) and the Center for Economic Studies, Katholieke Universiteit Leuven (Leuven, Belgium).
3 Center for Economic Studies,Katholieke Universiteit Leuven (Leuven, Belgium).

Fondazione Eni Enrico Mattei
Campo S.Maria Formosa
Castello 4778-5252 / 30122 Venezia
Italy
FAX +39-41-2711461 /e-mail:[email protected]
The Opening of the European Electricity Market and Environmental Policy: Does the Degree of Competition Matter?
3
The Opening of the European Electricity Market
and Environmental Policy: Does the Degree of
Competition Matter?
1. INTRODUCTION
Virtually all generation technologies have some negative impact on the environment. By far
the most significant externality is air pollution. At present the most relevant and
widespread form of European regulation is the application of technical emission standards
prescribed by the 1988 Large Combustion Plant Directive for SO2, NOx and TSP (LCPD).
The proposal of a European CO2 tax has long been debated and no formal agreement has
never been reached.
As elsewhere in the world, the European electricity sector is undergoing a substantial
restructuring process. In 1996 a European Directive set goals and the modalities of the
liberalisation and of the integration of the national electricity markets (Directive 96/92/EC).
After 2006, all consumers will be admitted to the market. Member States are required to
allow access to their electricity sector by means of non-discriminatory pricing of electricity
transmission, and by means of non-discriminatory procedures for construction of new
generation capacity. The presence of very large producers in some European countries
coupled with a sub-optimal international transmission capacity will most probably lead to
monopolistic competition rather than perfect competition in the transition phase.
In this paper we analyze the interaction between environmental policy and market
liberalisation in Europe with a multi-country, dynamic partial equilibrium model for the
European electricity market. We study two questions. First we try to assess what are the
likely effects of the degree of competition on the state of the environment. Second we
examine whether, in the imperfect competition case, it pays for a country to relax its
environmental policy as predicted by the strategic trade literature.
In section 2 we review the theoretical and applied literature. In section 3 we present our
model. In section 4 we study the effect of the degree of competition on the state of the
environment. In section 5 we study the effects of unilateral deviations of environmental
policy. Section 6 concludes.
The Opening of the European Electricity Market and Environmental Policy: Does the Degree of Competition Matter?
4
2. NON-COMPETITIVE ELECTRICITY MARKETS AND
ENVIRONMENTAL POLICY: INSIGHTS FROM THEORY
A non-competitive market for electricity in Europe has important consequences for the
way environmental policies can be implemented.
Trade under oligopolistic competition is characterised by positive profits. This provides an
incentive to national governments to help domestic firms earn higher profits in the
international arena. To this purpose, indirect commitment devices may be used when
explicit trade policies4 are forbidden by trade agreements. National environmental policies
have a direct influence on production costs of firms. Given the objective differences in the
environmental situation of each country, their strategic use cannot easily be detected and
prohibited. Thus, environmental policy makes a good candidate for an indirect trade policy
device. From this idea stems quite a large literature on the interaction between
environmental policy and trade. The first applications are due to Barrett (1994) for
environmental standards and Conrad (1993, 1995) for taxes. These studies show that,
compared to first best policies based on the rule that equates marginal social benefit to
marginal social cost, environmental policies chosen by governments in the Nash
equilibrium are tougher under Bertrand competition and less stringent under Cournot
competition.
The theoretical models used in this strand of literature are in general very simple, with just
two countries, one producer per country, homogeneous products, a single technology,
domestic pollution and the whole output sold to a third country. Kennedy (1994) shows
that including domestic consumers and transboundary pollution in the analysis compounds
somehow the incentives of domestic governments to distort environmental policy. On one
hand, governments would be happier if domestic consumers could be satisfied by foreign
production: in presence of limited transboundary pollution, domestic damages would then
decrease. On the other hand, governments are still interested in relaxing local
environmental polices, thus expanding domestic market shares both for strategic reasons
and because part of the resulting environmental damage would be shifted away by
transboundary pollution. The overall incentive should be in general ambiguous, but in the
specification chosen by Kennedy the second strategic effect prevails.
Technology choice and capacity setting are particularly important for the electricity sector,
because electricity can be generated using different technologies, each of them
4 Brander and Spencer (1985) analyse the rent-shifting behaviour of two governments, which try to support their
national producer in an international Cournot duopoly, by means of export subsidies. These subsidies act as devices that commit national producers to a certain level of output and hence to a higher market share than the one they would have achieved in a simple Cournot equilibrium.
The Opening of the European Electricity Market and Environmental Policy: Does the Degree of Competition Matter?
5
characterised by different costs and by different impacts on the environment. The
available capacity of these technologies determines the response of the firms to
environmental policy. Also, generation and transmission capacity licensing can be powerful
strategic instruments in the hands of the governments.
These issues have not yet been studied in a theoretical framework. However at least the
generation capacity aspects and the differences in environmental impacts among
technologies, are related to those studied in the literature on strategic innovation and the
environment (for instance Ulph (1994) Ulph (1996), and Ulph and Ulph (1996). In these
papers, a role analogous to the one of capacity investments is played by R&D
expenditures. The first two papers consider respectively process and environmental (i.e.
emission–reducing) R&D. The third paper considers them jointly, proving that they have
the same distortionary effect on environmental policy. In general, however, it remains
ambiguous whether this will lead to environmental policies that are stricter or more lax
than first best ones. Finally, the dynamic analysis by Feenstra (1998) considers explicitly
the role of investments, but her analysis is confined to the case of a single technology.
The theoretical literature shows that governments have indeed incentives to distort their
environmental policies in an international oligopolistic market, but the magnitude and the
direction of the incentives remain ambiguous. Moreover, theoretical models necessarily
give an oversimplified depiction of the reality, and thus cannot capture all the complexity
of the European electricity sector.
3. MODELLING ELECTRICITY MARKETS AND
ENVIRONMENTAL POLICY
3.1. Existing models
In the empirical literature, we have either models considering environmental policy within a
perfectly competitive European or American electricity market, or imperfectly competitive
models of the electricity market where environmental policy plays no role.
Examples of the first kind of models are Holster (1997) for the European market and
Palmer et al. (2001) for the American market. The first model compares a combined
CO2/Energy tax policy set by the European Commission with a CO2 tax set independently
by a national government alone, finding the latter to be ineffective. The second model
considers the interactions between the liberalisation of the American electricity market and
two versions of a NOx emission cap (seasonal and annual). In particular they analyse the
The Opening of the European Electricity Market and Environmental Policy: Does the Degree of Competition Matter?
6
welfare impacts and cost effectiveness of these two policies under “limited restructuring”,
whereby some States retain price regulation, and under “nationwide restructuring”
whereby perfect competition is assumed for the whole country. They find, unsurprisingly,
that the annual cap under nationwide restructuring dominates the other scenarios where
either liberalisation or environmental policy (or both) is incomplete5.
Some national electricity models explicitly include imperfect competition6. For instance,
Green and Newbery (1992) describe the deregulated English spot market. Their model
does not consider investment decisions. Their aim is to assess whether the deregulation
actually implemented in the United Kingdom in 90’s is preferable to a regulated setting. It
turns out that either regulation or a more fragmented structure would be advisable, and
that the duopolistic market engendered by the reform fails to attain the Bertrand outcome
the British government expected. Kemfert (1999) presents a Cournot model of the German
electricity market. She finds that such setting gives a more plausible representation of the
German market than downright perfect competition.
Wei and Smeers (1996, parts I and II)(, consider an imperfectly competitive electricity
market for three European Countries under alternative assumptions regarding short run
price determination: either optimal spot pricing or second lowest marginal cost pricing.
These studies have a two stage structure: first, a long run Cournot equilibrium in
capacities is computed, then prices and output are determined according to the
institutional assumptions regarding the short run price setting. Their representation of the
European electricity market however is too sketchy to derive any policy conclusion, and
they are mostly interested in demonstrating that their algorithm reaches a unique
equilibrium.
The only model we are aware of that assesses the European environmental policy within
an imperfect competition framework is Böhringer et al. (2001). They present a general
equilibrium model for Germany and consider, like Holster (1997) a unilateral introduction of
a CO2 tax. They find that the resulting shift towards less carbon-intensive industries is
more pronounced under imperfect than under perfect competition, but their cost appraisal
does not yield clear-cut results. They assume that market power in the electricity sector is
rather limited, positioning de-facto this paper at the borderline between perfect
competition and oligopolistic competition analysis. Most importantly their representation of
5 Welsch (1998) analyses the consequences of a phase-out of nuclear power generation in Germany within a
perfect competition, general equilibrium model of the European economy. Although it is not directly concerned with environmental policy, Welsch (1998) shows that renouncing to the nuclear technology in Germany brings about a substantial increase in Germany’s CO2 emissions, and concludes that the rationale for such policy should be sought in politics rather than in economics.
6 A survey of these models is provided by Smeers (1997).
The Opening of the European Electricity Market and Environmental Policy: Does the Degree of Competition Matter?
7
oligopolistic behaviour relies on exogenous mark-ups rather than on an explicit game-
theoretic model.
3.2. A simple description of our model.
We present here a simplified version of our model. A description of the full model is
provided in Appendix A. In this Section we focus on the simple problem of two countries,
labelled Home and Foreign, that host each an electricity producer, and that are
interconnected by two international transmission lines with fixed capacity HFQ and FHQ .
The first line conveys electricity from the Home Country to the Foreign Country, the
second line is used for electricity flowing in the opposite direction. Using the international
transmission lines involves a cost of u Euro/MWh for the seller.
Each producer can generate electricity by means of two technologies, a clean one (labelled
c), and a dirty one (labelled d) available in capacities ,c dX X and , ,c dY Y respectively in
the Home and Foreign Country. Each unit of output from clean plants ( )c cx y emits ce
tons of pollutant; each unit of output from dirty plants ( )d dx y emits de ( )d ce >e tons
of pollutant. Electricity can be generated at a cost of cc Euro/MWh using the clean
technology, and at a cost of dc Euro/MWh using the dirty technology.
We consider a three-stage game. In the environmental policy stage, governments set their
environmental policy. In the investment stage, firms set their generation capacity for both
technologies. In the production stage firms compete, taking as given their available
capacity and the environmental policy.
3.2.1. The Production Stage
In the production stage, firms minimise the cost of producing any output level iQ , and
choose how much to produce, and where to sell their production, in order to maximise
their profits, for given capacity levels ,c dX X and ,c dY Y . We assume that each country
sells on the domestic market iiQ MWh and ijQ MWh on the rival country’s market, where
i,j=H,F and i ii ijQ=Q +Q . Firms are subject to environmental policies in the form of
taxes per unit of emissions H Ft ,t (and/or emission standards He and Fe ) respectively in
the Home Country and in the Foreign Country.
The Opening of the European Electricity Market and Environmental Policy: Does the Degree of Competition Matter?
8
The cost function to be minimised by the Home firm is
( , , ) ( )c c d d c c d dH H H H H H H H H H H HC Q t e c x c x t e x e x= + + + , subject to:
;d dH Hx X≤
;c cH Hx X≤
;c dH H Hx x Q+ ≥
c c d dH H H H He x e x e+ ≤ .
We assume that the solution to this production problem can be represented by a function
,( , , , )H H H c dC Q t e X X
Having allocated production efficiently between the two technologies, the two firms
compete on the international market. Under Cournot competition, this means that each
firm maximises its profits taking into account production and export decisions of its
opponent. The profit function to be maximised by the Home firm is:
( , , , , , , , , , ) ( , , , ) ( , , , , )H H HF F FH H H HF c d H HF F FH H H H c d HFQ Q Q Q t e Q u X X R Q Q Q Q C Q t e X X uQΠ = − −
subject to HF HFQ Q≤ , and taking as given FQ and FHQ .
A Cournot equilibrium for this stage of the game, is a vector * * * *, , ,H HF F FH
Q Q Q Q such that
* *,H HF
Q Q is a best response to * *,F FH
Q Q and vice versa, given
, , , , , , , , , , .c d c dH F H F HF FH H H F Fu t t e e Q Q X X X X The equilibrium pay-off for the Home Country is
then * * ( , , , , , , , , , , )H H
c d c dH F H F HF FH H H F Fu t t e e Q Q X X X XΠ = Π .
3.2.2. The Investment Stage
In the investment stage, firms set the capacities of their plants taking as given the
environmental policies of the governments, in order to maximise profits for the
corresponding Cournot equilibrium. In other words, in this stage firms commit to a
generation capacity level that would put them in the best conditions to compete. In our
numerical model, the commitment to an optimal level of investment will be characterised
by the assumption of open-loop strategies7.
7 We prefer to focus on open-loop equilibria both because they are numerically more tractable, and because we
intend to stress the commitment properties of investments.
The Opening of the European Electricity Market and Environmental Policy: Does the Degree of Competition Matter?
9
The Home firm chooses ,c dH HX X in order to maximise
( )* ( , , , , , , , , , , ) ,H H
c d c dH F H F HF FH H H F F Hu t t e e Q Q X X X X S XΠ = Π −%
where ( ) ( ),c dH H HS X S X X= is the investment cost.
A Nash equilibrium for this stage of the game, is a vector * * * *, , ,c d c dH H F FX X X X such that
* *,c dH HX X is a best response to * *,c d
F FX X and vice versa, given H F H F HF FHu t t e e Q Q, , , , , , .
The ex-ante equilibrium pay-off for the Home Country is then
* * ( , , , , , , )H H H F H F HF FHu t t e e Q QΠ = Π% % .
3.3. The Environmental Policy Stage
In the environmental policy stage, governments set their environmental policies in a non-
cooperative way. The Home government’s objective function is the sum of domestic
consumer surplus (CS), domestic firms’ profits, and domestic tax revenues, minus
domestic environmental damages ( )HHD e :
( )( ) ( ) ( ) ( ) ( )
, , , , , , , ,
, , , , , , .
H H HF F FH H H HF H
HH FH H HF F FH H H H HF H H H H
W Q Q Q Q t e Q X u
CS Q Q R Q Q Q Q C Q t e uQ S X t e D e
=
+ − − − + −
The Foreign government has an analogous objective function.
From the Trade and Environment literature, we expect that governments do not apply first
best environmental policies. Instead, they would distort them in order to increase domestic
welfare at the expense of the rival country8.
Governments face conflicting incentives stemming from the consumers’ surplus part of
their objective function. Consumers’ surplus depends partly on electricity imports, and
partly on domestic production. As pointed out by Kennedy (1994), in a Cournot setting,
incrementing the import-dependent component of consumers’ surplus calls for more strict
environmental policies, because this would favour the foreign producer and would allow
domestic consumers to import more. On the other hand, incrementing domestic
consumers’ surplus by means of domestic production calls for less stringent environmental
policies, because this favours the domestic producer. In our model, international trade is
8 Note that, in principle, if the jurisdiction over a line pertains to the country that receives the electricity,
governments could use the access to the national grid as an extra trade policy tool. However, the Internal Market in Electricity Directive 96/62/EC explicitly calls for non-discriminatory access to national grids. Note that it does not require the existing transmission capacity to be expanded, only fair and transparent rules for accessing the national grids. In our model, this is taken into account by assuming a single price u for international transmission of electricity, and fixed transmission capacity.
The Opening of the European Electricity Market and Environmental Policy: Does the Degree of Competition Matter?
10
bounded by the capacity of international connection lines. This limits the amount of
electricity that can be imported, and hence the incentive for the governments to set overly
restrictive policies. We would then expect that the concern for the welfare of consumers
would rather push the governments towards less strict environmental policies.
The incentives to promote domestic profits are more straightforward. Each government
would set less stringent environmental policies if this contributes to commit the national
producer to lower production costs (without generating excessive environmental
damages).
In our simulations the environmental policy stage is not modelled in an extensive way. We
content ourselves with evaluating unilateral deviations from first-best environmental
policies, without characterising a full Nash equilibrium in the policy game.
3.4. Model implementation and Data Used
The focus of the model is on the electricity sector of Belgium, the Netherlands, France and
Germany, for a time horizon of 35 years.
Whilst we intend to capture many of the differences among the four countries by means
of country-specific data, we do take some simplifying assumptions. In particular, we
assume that the shape of the demand functions and the way consumers allocate their
purchases of electricity through sub-periods (peak, off peak) do not depend on their place
of residence. Moreover, in each country there is just one producer which can generate
electric power using several plants. Whilst this is a realistic hypothesis for France and
Belgium, where market concentration is very high, it amounts to a serious simplification of
the Dutch and German electricity industry. At least three large generators can be found
there. Our hypothesis of a single national producer means that they behave like a cartel.
We also assume that fuel prices and relative growth rates are determined on the world
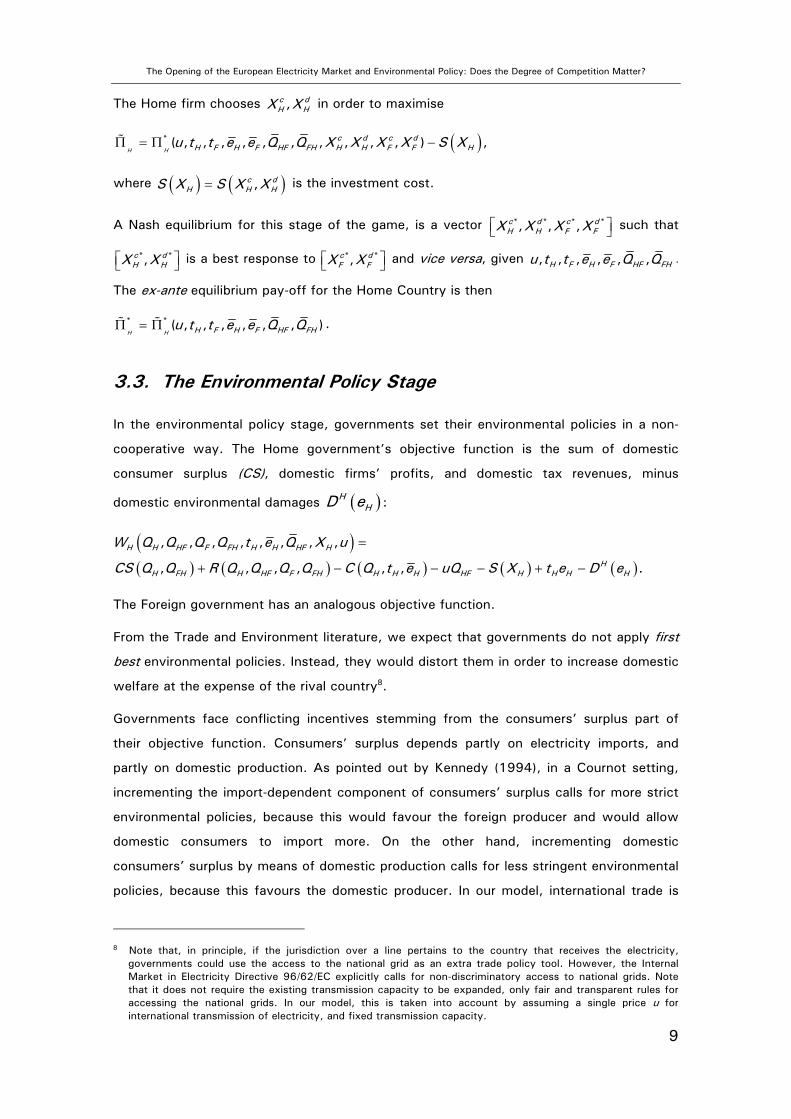
market and are exogenous. Fuel prices are shown in Figure 1. Finally, given the
unavailability of transmission cost data, we set transmission costs at 16.7 Euro/MWh for
international lines and 4.5 Euro/MWh for national lines. These assumptions are obtained by
calibration of electricity prices in 2000.
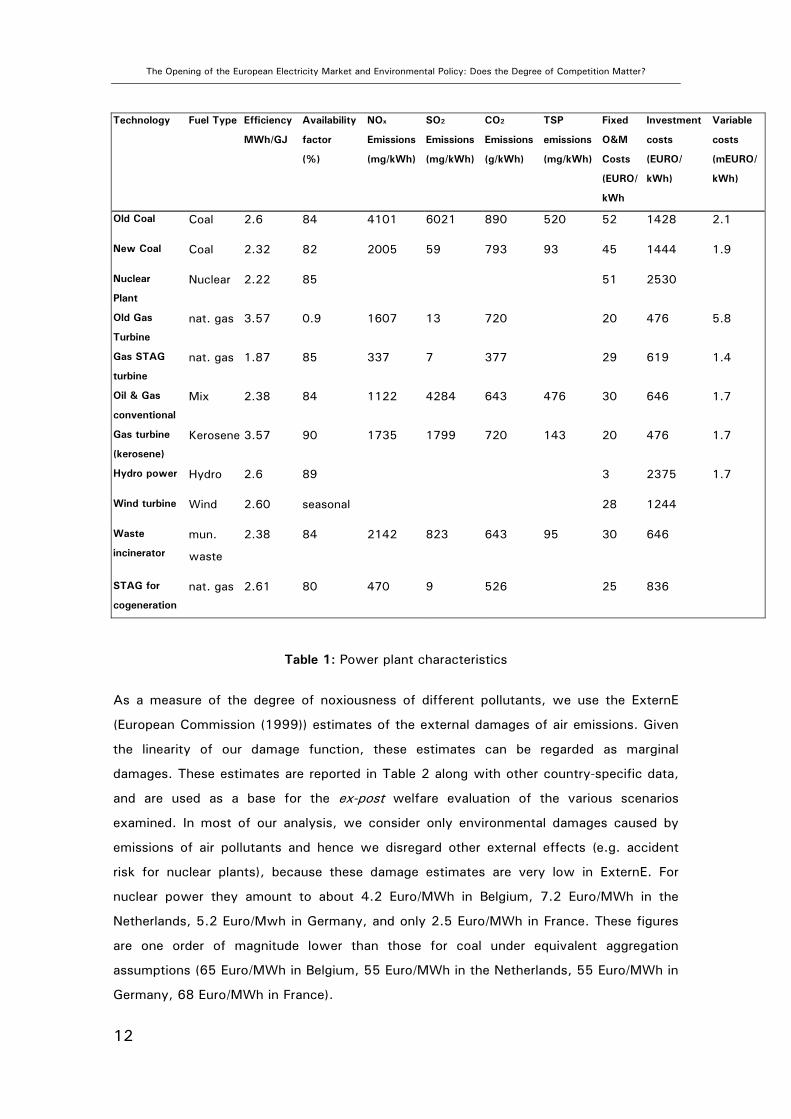
Producers have at their disposal the technologies described in Table 1. In a cost–
minimizing framework, from Figure 1 and Table 1, one would expect that coal and nuclear
plants, given their low running costs to be used first, whereas gas turbines would be more
likely used to cope with peak demand. As to investments in new capacity, we expect the
relationship between investment on one hand and fuel and other variable costs on the
other, to play a major role in the technology choices of the producers, with expensive
The Opening of the European Electricity Market and Environmental Policy: Does the Degree of Competition Matter?
11
units installed only if they guarantee low operation costs. We assume moreover that these
unit production and investment costs are not influenced by the market regime.
Figure 1: Fuel prices
The four countries remain very different from each other in several respects. In particular,
the electricity demanded in 2000, the installed capacity for each technology in 2000, the
external costs of each pollutant, the share of small consumers in total demand (and,
consequently, average demand elasticity9), the demand’s growth rates, and finally the pre-
existing environmental policies are different in each country. For demand data, we draw
upon the estimates used in the European Union Energy Outlook to 2020.
9 We assume point elasticity of -0.40 for residential consumers and -0.70 for large consumers.
0
1
2
3
4
5
6
7
8
2000 2005 2010 2015 2020 2025 2030
Euro/GJ
coal
nuclear gas
fossil mix
kerosene
The Opening of the European Electricity Market and Environmental Policy: Does the Degree of Competition Matter?
12
Table 1: Power plant characteristics
As a measure of the degree of noxiousness of different pollutants, we use the ExternE
(European Commission (1999)) estimates of the external damages of air emissions. Given
the linearity of our damage function, these estimates can be regarded as marginal
damages. These estimates are reported in Table 2 along with other country-specific data,
and are used as a base for the ex-post welfare evaluation of the various scenarios
examined. In most of our analysis, we consider only environmental damages caused by
emissions of air pollutants and hence we disregard other external effects (e.g. accident
risk for nuclear plants), because these damage estimates are very low in ExternE. For
nuclear power they amount to about 4.2 Euro/MWh in Belgium, 7.2 Euro/MWh in the
Netherlands, 5.2 Euro/Mwh in Germany, and only 2.5 Euro/MWh in France. These figures
are one order of magnitude lower than those for coal under equivalent aggregation
assumptions (65 Euro/MWh in Belgium, 55 Euro/MWh in the Netherlands, 55 Euro/MWh in
Germany, 68 Euro/MWh in France).
Technology Fuel Type Efficiency
MWh/GJ
Availability
factor
(%)
NOx
Emissions
(mg/kWh)
SO2
Emissions
(mg/kWh)
CO2
Emissions
(g/kWh)
TSP
emissions
(mg/kWh)
Fixed
O&M
Costs
(EURO/
kWh
Investment
costs
(EURO/
kWh)
Variable
costs
(mEURO/
kWh)
Old Coal Coal 2.6 84 4101 6021 890 520 52 1428 2.1
New Coal Coal 2.32 82 2005 59 793 93 45 1444 1.9
Nuclear
Plant
Nuclear 2.22 85 51 2530
Old Gas
Turbine
nat. gas 3.57 0.9 1607 13 720 20 476 5.8
Gas STAG
turbine
nat. gas 1.87 85 337 7 377 29 619 1.4
Oil & Gas
conventional
Mix 2.38 84 1122 4284 643 476 30 646 1.7
Gas turbine
(kerosene)
Kerosene 3.57 90 1735 1799 720 143 20 476 1.7
Hydro power Hydro 2.6 89 3 2375 1.7
Wind turbine Wind 2.60 seasonal 28 1244
Waste
incinerator
mun.
waste
2.38 84 2142 823 643 95 30 646
STAG for
cogeneration
nat. gas 2.61 80 470 9 526 25 836
The Opening of the European Electricity Market and Environmental Policy: Does the Degree of Competition Matter?
13
Table 2: Country-specific data10.
10 Sources: European Commission, UNIPEDE, Oosterhuis et al., authors’ calculations and ExternE. The figures in
brackets refer to gas plants. The estimate for CO2 emission damage refers only to a mid-low estimate of global warming damages, the sole category of damages considered for this pollutant in the ExternE project.
Belgium France
Consumption in 2000 (GWh)
69239 347519
Share of small consumers in totaldemand
2000 2005 2010 2015-2035 2000 2005 2010 2015-2035
2.06% 1.6% 1.73% 0.7% 1.08% 1.16% 2.9% 1.4%Maximum Generating Capacity (MW)
NuclearConv.
ThermalHydro
Other Renewables
NuclearConv.
ThermalHydro
Other Renewables
5713 7572 1403 5 62900 26200 25350 0SO2 Standards ex LCPD/88NOx Standards ex LCPD/88External costs (EURO/Ton)
NOx 0 12141 (13553)
0 0 0 16100 (16100)
0 0
SO2 013036
(11338)0 0 0
8900 (0)
0 0
CO2 0 18 0 0 0 18 0 0
TSP 024536
(0) 0 0 06100 (0) 0 0
Germany The Netherlands
Consumption in 2000 (GWh)
459656 84578
Share of small consumers in totaldemand
2000 2005 2010 2015-2035 2000 2005 2010 2015-2035
1.03% 1.45% 1.52% 1.09% 2.22% 2.44% 1.78% 2%
Maximum Generating Capacity (MW)
NuclearConv.
ThermalHydro
Other Renewables
NuclearConv.
ThermalHydro
Other Renewables
22315 78900 8875 2450 449 19280 37 375
SO2 Standards ex LCPD/88
NOx Standards ex LCPD/88
External costs (EURO/Ton)
NOx 015398
(14648)0 0 0
6980 (7410)
0 0
SO2 0 (0) 0 0 0 (0) 0 0
CO2 0 18 0 0 0 18 0 0
TSP 021579
(0)0 0 0
16576 (0)
0 0
67% 68%
72% 77%
400 mg/m³ +Cap on Total Emissions (70.3 Mton/year) -
650 (150) mg/m³ + Cap on Total Emissions (52.2 Mton/year)
-
Demand growth rates
Demand growth rates
400 mg/m³
650 (150) mg/m³
400 mg/m³ + Cap on Total Emissions (30 Mton/year)
650 (150) mg/m³+Cap on Total Emissions (18 Mton/year)
The Opening of the European Electricity Market and Environmental Policy: Does the Degree of Competition Matter?
14
From Table 2, one notices that the modalities of electricity generation differ strongly
among countries. For instance, France relies more heavily on nuclear generation than the
other countries; gas powered plants are more widespread in the Netherlands, whereas the
share of coal plants is still important in Germany.
Finally, we assume different interconnection capacities between each pair of countries.
Given the lack of available data, we derived our assumed capacities from the maximum
monthly value of load flows between countries11 and we increased those figures by 10%.
These capacities are shown in Table 3. We assumed the same capacity for each flow
direction, no constraints for domestic transmission, and no direct interconnection between
France and the Netherlands12.
Belgium Germany France The Netherlands
Belgium + ∞ 1550 2000 1350
Germany 1550 + ∞ 2600 3300
France 2000 2600 + ∞ 0
The Netherlands 1350 3300 0 + ∞
Table 3: Capacity (MW) of international transmission lines
3.5. The baseline
We will use three alternative assumptions on market regime: Perfect Competition, Price
Regulation for the whole time horizon and Cournot Competition. All scenarios have a
common starting point: a regulated price in the period 2000-2004; after this period, each
scenario then jumps to one of the three market regimes for the rest of the horizon. Instead
of presenting each environmental scenario in each market regime in turn, we prefer to take
the first two market regimes as alternative benchmarks and to focus directly on the
differences between the Cournot outcome and these benchmarks in each scenario.
11 Load flows between countries at 3:00 and 11:00 a.m., as reported in the 1999 UCTE Statistical Yearbook. 12 See Appendix A for a detailed description of transmission capacity constraints.
The Opening of the European Electricity Market and Environmental Policy: Does the Degree of Competition Matter?
15
In the baseline we assume that the following environmental regulation is in place (see
Table 4):
Environmental Problem Regulation assumed in baseline
NOx, TSP, SO2 Large Combustion Plant Directive (1988) implemented
by member state under the form of national bubbles,
the caps stay fixed for the whole horizon
CO2 We assume that there is a damage of 18 Euro/ton for
the period 2010-2034, a carbon tax CAN be
introduced.
Nuclear safety We assume that the EU legislation on nuclear safety is
observed
Renewables No minimum quota’s are imposed
Table 4: Environmental regulation in the baseline
Compared to the benchmark there is only one environmental policy variable that will be
changed: the unilateral tax on CO2 emissions in the electricity sector. We have assumed
that there is a marginal damage of CO2 equal to 18 Euro/ton. This damage can be
understood in two ways. First it can be seen as (discounted) climate change damage and
second as the shadow cost of meeting the EU Kyoto obligation in Europe. Any CO2
reduction effort in the electricity sector comes down to a reduced call upon internationally
traded carbon emission rights whose cost we fix at 18 Euro / ton.
We will later on use unilateral CO2 tax deviations to evaluate the incentives for national
governments to deviate from a uniform European CO2 tax in a Cournot equilibrium.
The Opening of the European Electricity Market and Environmental Policy: Does the Degree of Competition Matter?
16
4. POLICY SIMULATIONS
4.1. Who Benefits from Imperfect Competition?
Before examining environmental impacts it may useful to compare briefly the three market
regimes. We compare the perfect competition outcome with the Cournot outcome in Table
5. Our simulations confirm the traditional result that imperfect competition reduces
aggregate welfare, and that the benefits stemming from monopoly profits and lower
environmental damages are more than compensated by the decrease in consumers’
surplus.
Bn Euro B D F NL TOTALConsumer Surplus -57.33 -375.03 -305.75 -77.80 -815.90Producers Profits 18.40 114.67 99.02 18.64 250.73Taxes 9.65 52.95 46.53 7.45 116.58Damage SO2 -2.38 -69.62 -2.26 1.73 -72.52Damage NOx -2.32 -84.74 -15.88 -0.15 -103.10Damage CO2 -1.59 -34.70 -8.44 -1.45 -46.17 Damage TSP -0.41 -14.67 -1.42 0.34 -16.16Environmental Damages -6.70 -203.72 -28.00 0.47 -237.95Environmental taxes 0 0 0 0 0Social welfare -22.58 -3.69 -132.19 -52.18 -210.64
Table 5: Baseline case. Difference between Cournot and Perfect Competition.
Welfare outcomes (Bn Euro)13
Table 5 presents for the Baseline case, the cumulative welfare difference between the
Cournot and the Perfect Competition outcomes. It includes consumer surplus of electricity
consumers, producers profits, total tax revenues and revenues from CO2 taxes only,
monetary damages of CO2, SO2, NOx and TSP emissions and their total value.
From Table 5 one concludes that the most important welfare effect of Cournot
Competition is the reduction in consumers’ surplus. Consumers under Cournot Competition
pay prices that are on average14 45% higher than regulated prices in 2000. The largest
effects take place in the countries with the largest internal market, namely Germany and
France. The main winners under Cournot Competition are of course the producers, whose
profits increase considerably. Notice that profits are proportional to the size of the internal
market of each country. This indicates that transmission capacity constraints provide
13 A negative sign means that the Perfect Competition case has a larger value. 14 Weighted average prices, where market shares are used as weights.
The Opening of the European Electricity Market and Environmental Policy: Does the Degree of Competition Matter?
17
strong local market powers to producers on their domestic markets. Not all the countries
suffer to the same extent from imperfect competition. Germany has a rather dirty initial
generation mix so that a reduction of domestic output gives large environmental benefits.
B D F NL TOTALConsumer Surplus -47.64 -309.27 -236.38 -62.62 -655.90Producers' Profits 13.96 81.45 63.81 12.14 171.37Taxes 5.56 22.40 15.94 1.57 45.47Damage SO2 -2.37 -69.11 -1.44 1.63 -71.29Damage Nox -2.32 -82.69 -13.55 -0.14 -98.70Damage CO2 -1.55 -33.59 -7.29 -1.04 -43.47Damage TSP -0.42 -14.45 -1.16 0.31 -15.72Environmental Damages -6.65 -199.84 -23.44 0.76 -229.17Environmental Taxes 0 0 0 0 0Social Welfare -21.46 -5.58 -133.19 -49.67 -209.90
Table 6: Baseline case. Difference between Cournot Competition and Price
Regulation. Welfare outcomes (Bn Euro)15
Table 6 compares Cournot Competition with Price Regulation. We find the same kind of
results16 as in Table 5 but differences are a little less marked, because under Price
Regulation national firms retain an important profit margin. Profits under Cournot
Competition remain by far the highest of the three market regimes considered.
Some international trade of electricity takes place in all market regimes. Given the strong
similarity in trade patterns among regimes, we exemplify them by reporting only those
under Cournot Competition in Figure 2.
15 A negative sign means that the Price Regulation case has a larger value. 16 The solver treats this case as a perfect competition model where the cost function has been shifted upw ards.
The Opening of the European Electricity Market and Environmental Policy: Does the Degree of Competition Matter?
18
Figure 2: Baseline case. Net trade flows under Cournot Competition
Trade patterns are not very much affected by the kind of competition, and are particularly
similar under Perfect Competition and Price Regulation. With the exception of France,
trade balances are slightly higher in magnitude under Perfect Competition. France and
Germany are net exporters of electricity, while Belgium and the Netherlands are net
importers. In fact, Germany and France have much larger available capacities in cheap
base load technologies than Belgium and the Netherlands and are always able to export
some of their production.
4.2. Does Imperfect Competition Help to Meet Environmental Targets?
Given the partial equilibrium setting of our model, we must distinguish between targets
clearly specified for the electricity sector, such as the Belgian and Dutch caps on SO2 and
NOx emission, and targets specified for the whole national economy, such as CO2 targets
under the Kyoto Protocol. For the second type of targets, we measure the reduction in
total CO2 emissions in the electricity sector.
From our computations it is clear that, whilst the Belgian and Dutch NOx emission
constraints are always binding in the Baseline scenario under Perfect Competition, their
stringency declines under Cournot Competition. In particular, actual Belgian NOx emissions
Net Trade Flows BExport-Import
-5000-4000-3000-2000-1000
01000200030004000
2000 2005 2010 2015 2020 2025 2030GW
h
BDFNL
Net Trade Flows DExport-Import
-6000-4000-2000
02000400060008000
100001200014000
2000 2005 2010 2015 2020 2025 2030
GW
h
BDFNL
Net Trade Flows FExport-Import
-3000-2000-1000
0100020003000400050006000
2000 2005 2010 2015 2020 2025 2030
GW
h
BDFNL
Net Trade Flows NLExport-Import
-14000-12000-10000-8000-6000-4000-2000
020004000
2000 2005 2010 2015 2020 2025 2030
GW
hBDFNL
The Opening of the European Electricity Market and Environmental Policy: Does the Degree of Competition Matter?
19
are below the target in the period 2005-2019, whereas NOx emissions remain a binding
constraint in the Netherlands in all periods but 2005-2009.
Quite the opposite story happens for SO2 emissions. The SO2 constraint is never binding in
both countries under Perfect Competition, but becomes binding for the Netherlands in
three periods under Cournot Competition.
This is illustrated in Figure 3 below. Cournot Competition brings about two effects that
have a direct influence on the stringency of environmental policies: technology substitution
and output reduction. Note that it is not granted that the first factor will lead to the
adoption of less polluting technologies. In fact, from Table 5 one notices that
environmental damages actually increase in the Netherlands under Cournot Competition.
This is due to the fact that output reduction in this country mainly affects the investment
in new nuclear, wind and gas plants (which have no or very low air emissions) while the
use of waste incinerators and kerosene plants actually increases. Given the higher prices
prevailing under Cournot Competition, the Dutch generator has to invest less in new base-
load capacity. It is more profitable to invest in plants more suitable for peak-load
generation, such as waste incinerators and kerosene plants, which bring about substantial
emissions.
Figure 3: Baseline scenario. Emission reductions in excess of the targets for SO2
and NOx under Cournot Competition
Standards- actual emissions
0
10
20
30
40
50
60
2000 2005 2010 2015 2020 2025 2030
years
Mto
n
SO2 B
SO2 NL
NOx B
NOx NL

The Opening of the European Electricity Market and Environmental Policy: Does the Degree of Competition Matter?
20
Figure 4: Baseline scenario.+ European CO2 tax. Difference between CO2
emissions under Perfect versus Cournot Competition
Turning to CO2 emissions, Figure 4 illustrates the differences in CO2 emissions between
Perfect and Cournot Competition in the baseline scenario to which we have added a CO2
tax. Figure 4 shows that, over the whole time horizon considered, the CO2 tax achieves
more substantial CO2 emission reductions under Cournot Competition but this does not
necessarily hold in each period and in each country. Compared to Cournot Competition,
these emissions are slightly lower under Perfect Competition in Belgium from 2020
onwards, in the Netherlands between 2010 and 2019, while France has substantially
lower emissions under Perfect Competition starting from 2030. This is due to an effect
similar to the one that we have noticed taking place in the Netherlands for SO2 emissions.
France in particular does not invest at all in new nuclear plants in this scenario under
Cournot Competition, while it does invest in new nuclear capacity under Perfect
Competition after 2025.
B D F NL TOTALConsumers Surplus -57.88 -365.13 -287.82 -81.38 -792.21Producers Profits 19.60 116.90 91.83 22.64 250.98Taxes 10.03 44.24 39.36 10.96 104.60Damage SO2 -2.48 -60.23 -1.81 0.44 -64.08Damage NOx -2.35 -47.70 -3.51 -0.10 -53.67Damage CO2 -0.91 -15.69 -2.20 -0.09 -18.89Damage TSP -0.41 -10.58 -0.25 0.08 -11.16Environmental Damages -6.15 -134.20 -7.78 0.32 -147.81Environmental taxes -0.66 -10.66 -2.01 -0.06 -13.39Social Welfare -22.09 -69.79 -148.85 -48.10 -288.83
Table 7: Baseline scenario.+ European CO2 tax U-Kyoto Tax scenario. Difference
between Cournot and Perfect Competition. Welfare outcomes (Bn Euro)
-100
-50
0
50
100
150
200
2000 2005 2010 2015 2020 2025 2030
years
Mto
n BDFNL
The Opening of the European Electricity Market and Environmental Policy: Does the Degree of Competition Matter?
21
B D F NL TOTALConsumer Surplus -49.34 -305.48 -226.01 -66.36 -647.19Producers Profits 15.61 87.09 60.54 15.82 179.06Taxes 6.26 16.86 12.36 4.68 40.17Damage SO2 -2.45 -60.74 -1.63 0.59 -64.24Damage NOx -2.34 -47.35 -2.60 -0.11 -52.38Damage CO2 -0.90 -15.41 -1.67 -0.17 -18.15Damage TSP -0.40 -10.62 -0.20 0.11 -11.12Environmental Damages -6.10 -134.12 -6.10 0.41 -145.90Environmental Taxes -0.65 -10.35 -1.52 -0.09 -12.61Social Welfare -21.37 -67.41 -147.01 -46.28 -282.06
Table 8: Baseline + CO2 tax scenario. Difference between Cournot and Price
Regulation. Welfare outcomes (Bn Euro)
As to the welfare effects of a European Kyoto tax, consider Table 7 and Table 8. These
tables present the same kind of results as in Table 5 and Table 6, respectively, under the
hypothesis that a European tax on CO2 equal to half the (assumed) marginal damage of
this pollutant (18 Euro/ton) is implemented in 2005-2009 and that a European tax on CO2
equal to the (assumed) full marginal damage is implemented from 2010 onwards.
Comparing Table 7 with Table 5 one notices that the difference in welfare between the
two market regimes increases with the implementation of a CO2 tax. This happens
because correcting an externality unambiguously improves welfare under Perfect
Competition. Under Cournot Competition, Pigouvian taxes should be coupled with a
production subsidy in order to restore optimality. If used alone, they result in extra
deadweight losses because the existing imperfect competition distortions are aggravated17.
A similar argument explains what happens under Price Regulation. Comparing Table 7 with
Table 8, one notices a slight decrease in the difference in welfare with respect to the
Cournot case, when the comparison is drawn against price regulation instead of perfect
competition. Under Price Regulation, firms have a small profit margin, and imposing a
Pigouvian tax brings about a small deadweight loss18.
17 The implementation of a CO2 tax also helps meeting the SO2 and NOx targets. From the comparison of Table 5
with Table 7, one notices that the decrease in damages from these pollutants is more pronounced in Belgium under a CO2 tax, whereas in the Netherlands the increase in SO2 damages is smaller. This happens because of the correlation between emission factors across technologies. A plant that emits significant amounts of CO2 is likely to have significant SO2 and NOx emissions as well. Therefore a policy aimed at reducing CO2 emissions, in absence of specific abatement technology, will lead to reduction in the emissions of other pollutants, through output reductions from the polluting plants. This holds both under Perfect and Cournot competition.
18 Trade patterns are not very much affected by the presence of a CO2 tax. Since the implementation of a CO2 tax results in higher prices and lower demand, trade balances are slightly higher in magnitude in the Baseline scenario.
The Opening of the European Electricity Market and Environmental Policy: Does the Degree of Competition Matter?
22
4.2.1. Is there an Incentive for Individual Countries to Relax Their
Environmental Policy as Predicted by the Strategic Trade
Literature?
In order to fully answer this question, one should in principle compute the Nash equilibrium
of the game in which each country sets its environmental policies taking as given the
environmental policies of the other countries19. We do not take this option, both because it
is computationally very demanding, and because, within the European Union, countries do
not enjoy complete freedom in their environmental policy choices. The targets set in
European Directives or in the international protocols heavily limit their strategy space.
However, countries are given some leeway in the implementation of these targets. We ask
ourselves, therefore, whether national governments would be interested in unilateral
deviations from the CO2 tax set at the common marginal damage level (or opportunity cost
level) of 18 Euro/ton. The results are shown in the following Figures and in the Tables
presented in Appendix B20.
19 Had we assumed perfect foresight also on the part of governments, we would expect that only a government
that can foresee welfare gains for its country would engage in strategic environmental policy distortions. However, a common result in the Trade and Environment literature is that distortionary policies lead to a prisoner’s dilemma. In fact a country adopting a commitment device to support its national producer would gain with respect to a free-trade outcome if it were the only one to take such option, while a free-trade outcome is superior to the Nash equilibrium where all the countries pre-commit. A myopic perspective is hence more appropriate.
20 In this section and in Appendix B we distinguish between “Social welfare only CO2”, which takes into account only CO2 damages in the damage function and “Social Welfare”, which takes into account damages from all air pollutants. This distinction has been introduced to highlight the fact that, in the EU-Kyoto Tax scenarios, a CO2 tax also reduces other emissions and this has relevance for the incentives to deviate.

The Opening of the European Electricity Market and Environmental Policy: Does the Degree of Competition Matter?
23
94%
96%
98%
100%
102%
104%
106%
108%
110%
100% 90% 80% 70% 60% 50% 40% 30% 20% 10% 0%% tax
% w
elfa
re
Belgium Germany France the Netherlands
Figure 5a: Welfare effects of unilateral deviations in Belgium from CO2 tax under Cournot
competition, damages from all pollutants included in welfare.
98%
99%
100%
101%
102%
100% 90% 80% 70% 60% 50% 40% 30% 20% 10% 0%
% tax
% w
elfa
re
Belgium Germany France the Netherlands
Figure 6b: Welfare effects of unilateral deviations in Belgium from CO2 tax under Cournot
competition, only damages from CO2 included in welfare
The Opening of the European Electricity Market and Environmental Policy: Does the Degree of Competition Matter?
24
85%87%89%91%93%95%97%99%
101%103%
100% 90% 80% 70% 60% 50% 40% 30% 20% 10% 0%
% tax
wel
fare
%
Belgium Germany France the Netherlands
Figure 7a: Welfare effects of unilateral deviations in Germany from CO2 tax under Cournot competition, damages from all pollutants included in welfare
95%96%97%98%99%
100%101%102%103%104%
100% 90% 80% 70% 60% 50% 40% 30% 20% 10% 0%
% tax
wel
fare
%
Belgium Germany France the Netherlands
Figure 8b: Welfare effects of unilateral deviations in Germany from CO2 tax under Cournot competition only damages from CO2 included in welfare
The Opening of the European Electricity Market and Environmental Policy: Does the Degree of Competition Matter?
25
94%95%96%97%98%99%
100%101%102%103%
100% 90% 80% 70% 60% 50% 40% 30% 20% 10% 0%
% tax
wel
fare
%
Belgium Germany France the Netherlands
Figure 9a: Welfare effects of unilateral deviations in France from CO2 tax under Cournot competition, damages from all pollutants included in welfare
98%
99%
100%
101%
102%
100% 90% 80% 70% 60% 50% 40% 30% 20% 10% 0%
% tax
wel
fare
%
Belgium Germany France the Netherlands
Figure 10b: Welfare effects of unilateral deviations in France from CO2 tax under Cournot competition, only damages from CO2 included in welfare
The Opening of the European Electricity Market and Environmental Policy: Does the Degree of Competition Matter?
26
95%
96%
97%
98%
99%
100%
101%
102%
100% 90% 80% 70% 60% 50% 40% 30% 20% 10% 0%
% tax
wel
fare
%
Belgium Germany France the Netherlands
Figure 11a: Welfare effects of unilateral deviations in The Netherlands from CO2 tax under Cournot competition, damages from all pollutants included in welfare
98%
99%
100%
101%
100% 90% 80% 70% 60% 50% 40% 30% 20% 10% 0%
% tax
wel
fare
%
Belgium Germany France the Netherlands
Figure 12b: Welfare effects of unilateral deviations in The Netherlands from CO2 tax under Cournot competition, only damages from CO2 included in welfare
The Opening of the European Electricity Market and Environmental Policy: Does the Degree of Competition Matter?
27
0%
20%
40%
60%
80%
100%
120%
B D F NL B D F NL B D F NL B D F NL B D F NL
80% 60% 40% 10% 0%
% tax
% w
elfa
re c
ompo
nent
s
Surplus Small Consumers Producers Profits Taxes Environmental Damages Environmental taxes
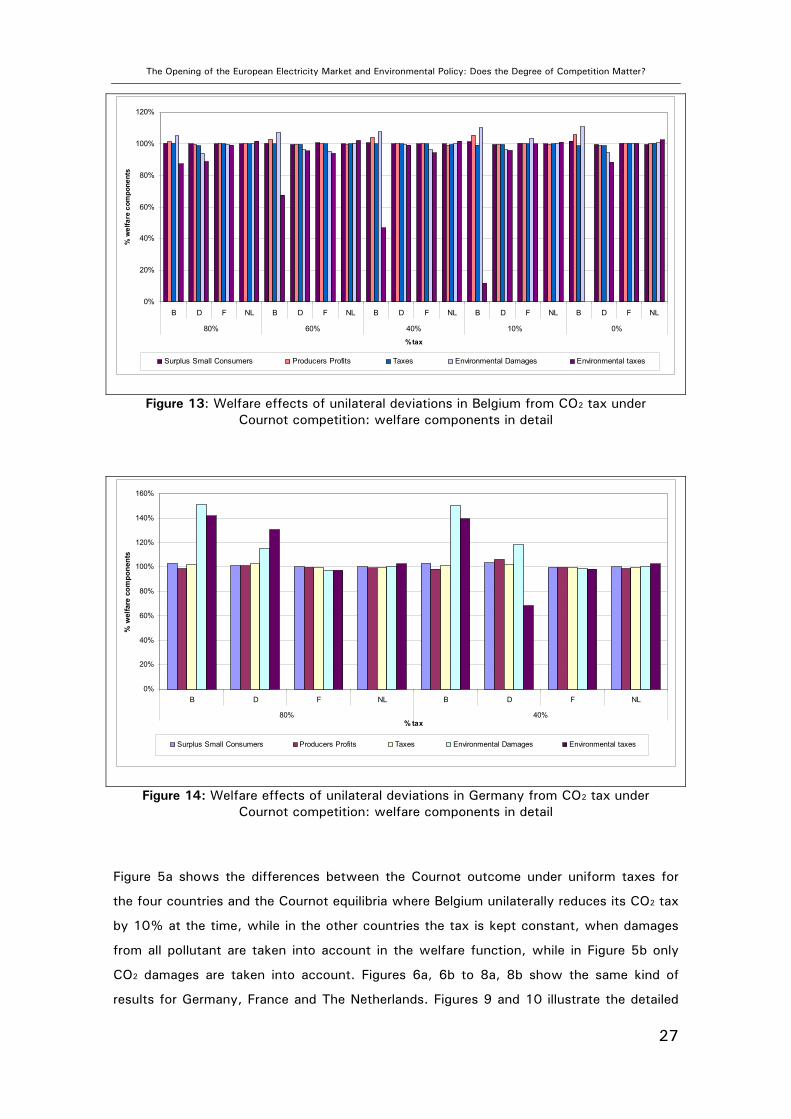
Figure 13: Welfare effects of unilateral deviations in Belgium from CO2 tax under Cournot competition: welfare components in detail
0%
20%
40%
60%
80%
100%
120%
140%
160%
B D F NL B D F NL
80% 40%% tax
% w
elfa
re c
ompo
nent
s
Surplus Small Consumers Producers Profits Taxes Environmental Damages Environmental taxes
Figure 14: Welfare effects of unilateral deviations in Germany from CO2 tax under Cournot competition: welfare components in detail
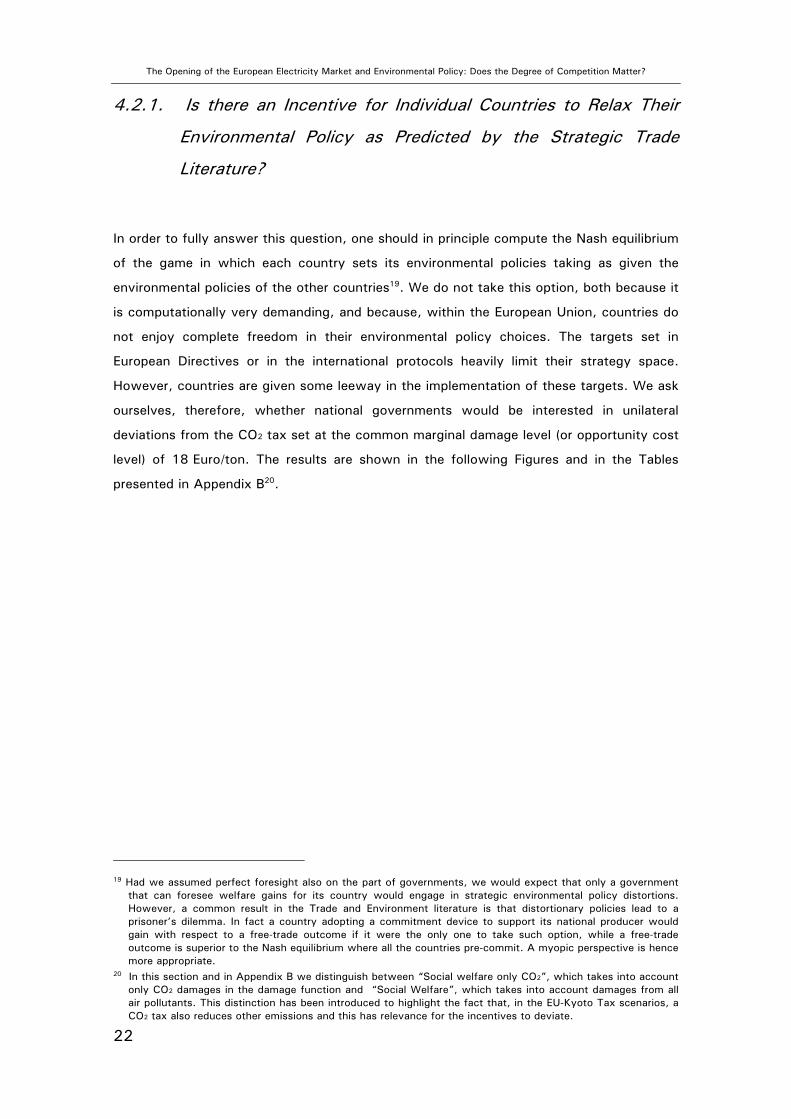
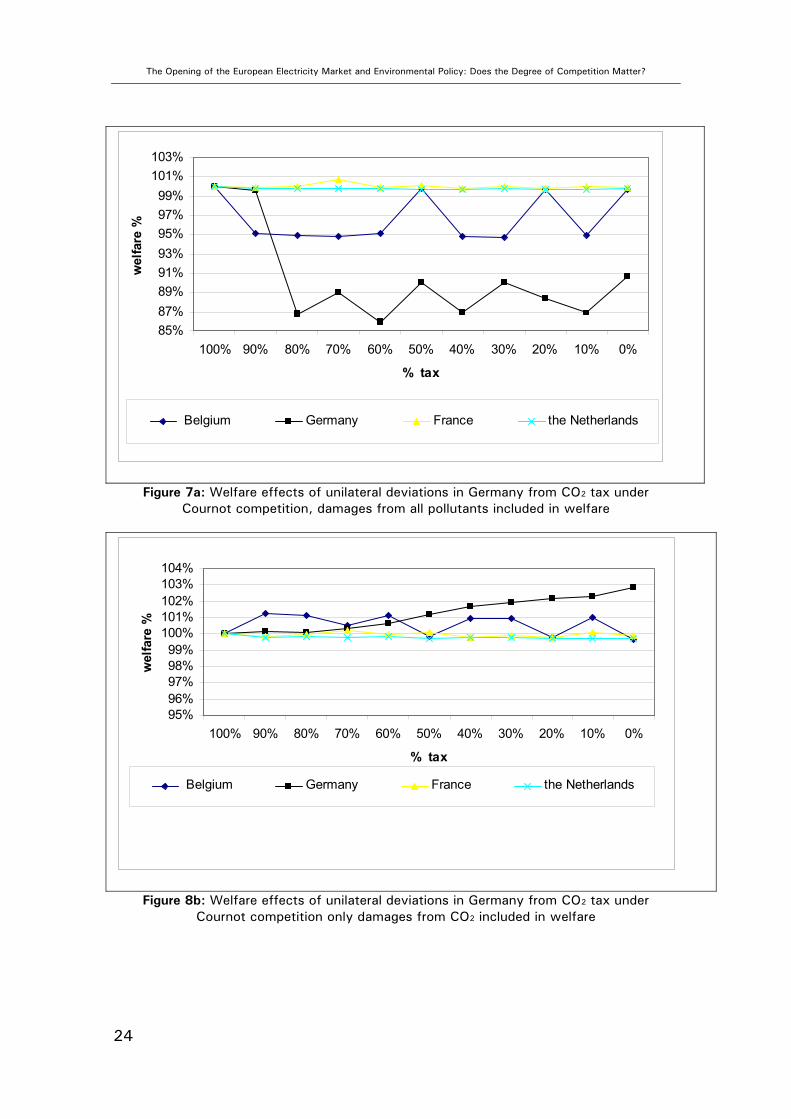
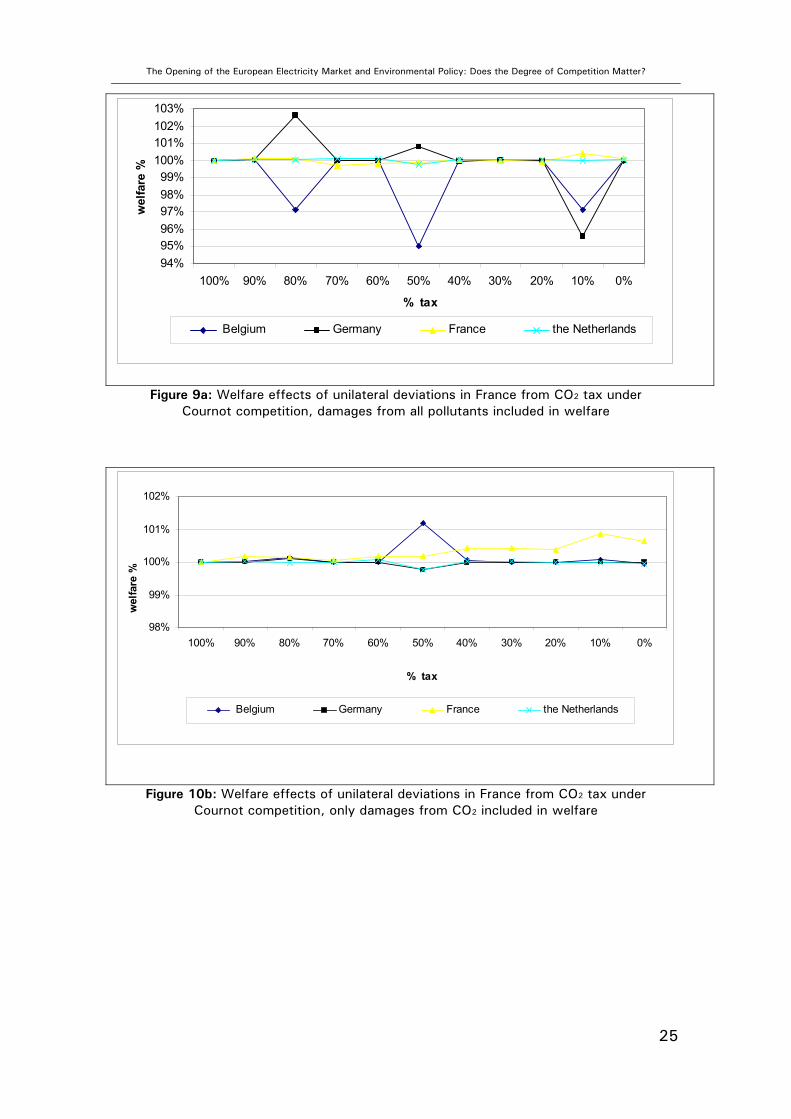
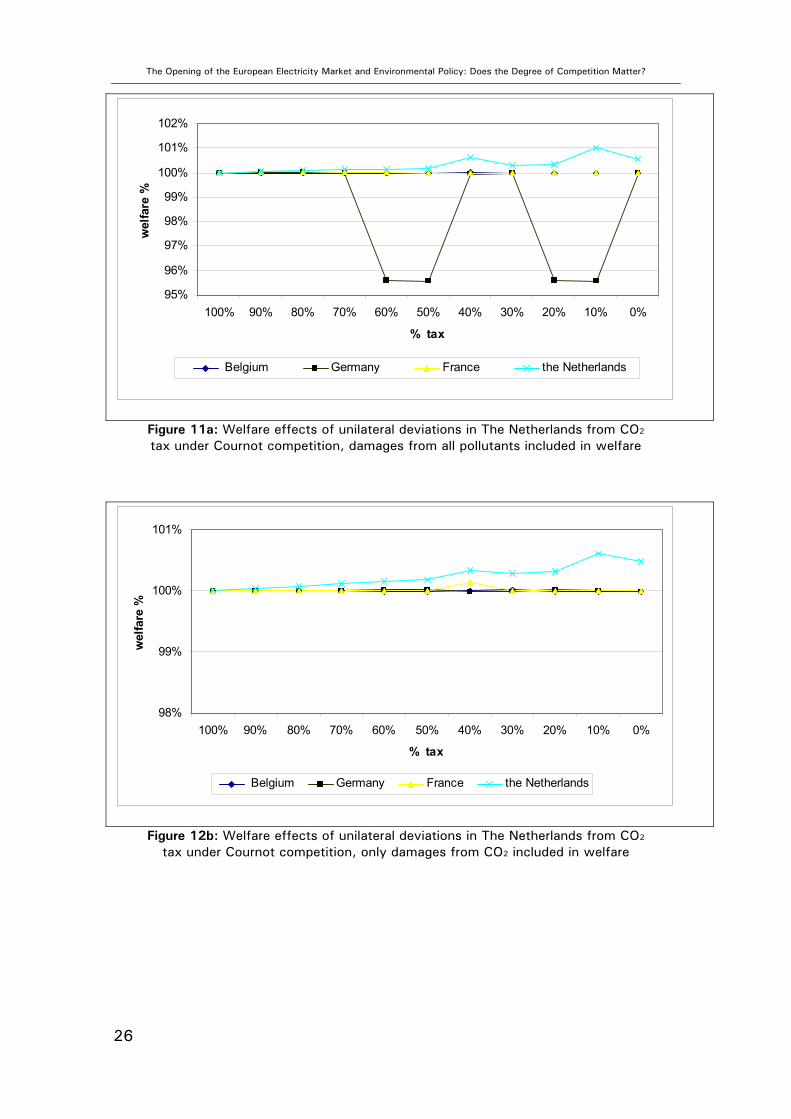
Figure 5a shows the differences between the Cournot outcome under uniform taxes for
the four countries and the Cournot equilibria where Belgium unilaterally reduces its CO2 tax
by 10% at the time, while in the other countries the tax is kept constant, when damages
from all pollutant are taken into account in the welfare function, while in Figure 5b only
CO2 damages are taken into account. Figures 6a, 6b to 8a, 8b show the same kind of
results for Germany, France and The Netherlands. Figures 9 and 10 illustrate the detailed
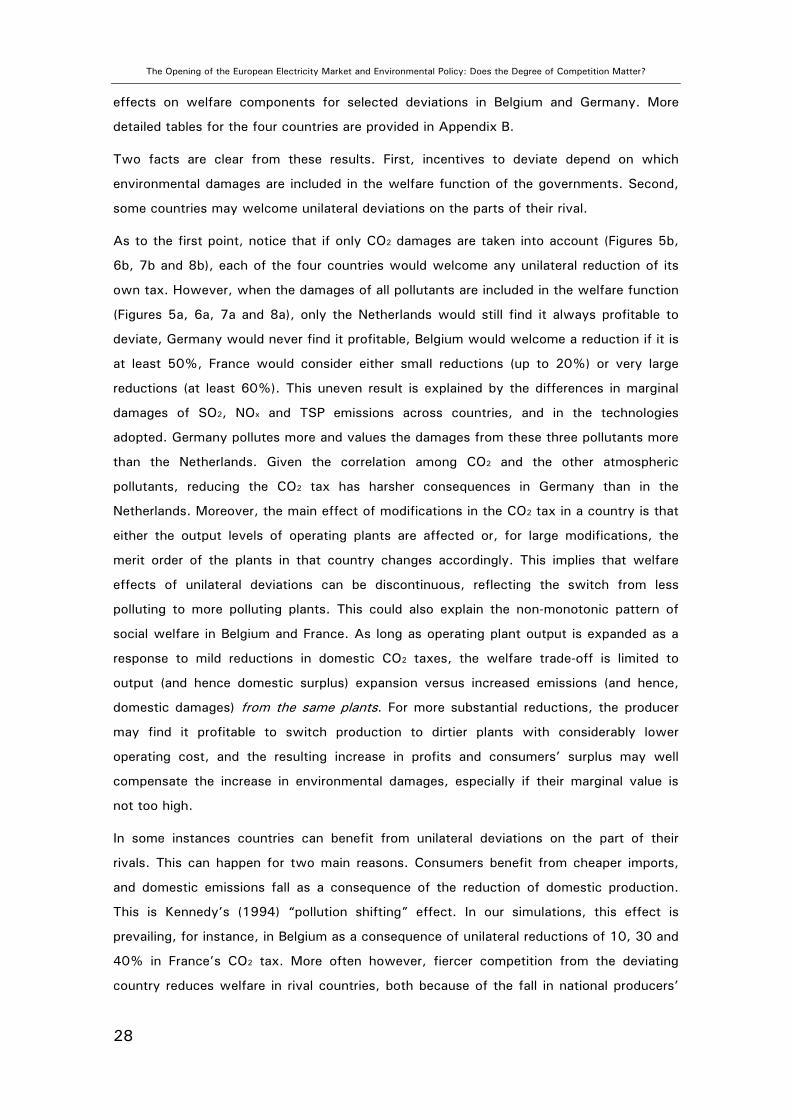
The Opening of the European Electricity Market and Environmental Policy: Does the Degree of Competition Matter?
28
effects on welfare components for selected deviations in Belgium and Germany. More
detailed tables for the four countries are provided in Appendix B.
Two facts are clear from these results. First, incentives to deviate depend on which
environmental damages are included in the welfare function of the governments. Second,
some countries may welcome unilateral deviations on the parts of their rival.
As to the first point, notice that if only CO2 damages are taken into account (Figures 5b,
6b, 7b and 8b), each of the four countries would welcome any unilateral reduction of its
own tax. However, when the damages of all pollutants are included in the welfare function
(Figures 5a, 6a, 7a and 8a), only the Netherlands would still find it always profitable to
deviate, Germany would never find it profitable, Belgium would welcome a reduction if it is
at least 50%, France would consider either small reductions (up to 20%) or very large
reductions (at least 60%). This uneven result is explained by the differences in marginal
damages of SO2, NOx and TSP emissions across countries, and in the technologies
adopted. Germany pollutes more and values the damages from these three pollutants more
than the Netherlands. Given the correlation among CO2 and the other atmospheric
pollutants, reducing the CO2 tax has harsher consequences in Germany than in the
Netherlands. Moreover, the main effect of modifications in the CO2 tax in a country is that
either the output levels of operating plants are affected or, for large modifications, the
merit order of the plants in that country changes accordingly. This implies that welfare
effects of unilateral deviations can be discontinuous, reflecting the switch from less
polluting to more polluting plants. This could also explain the non-monotonic pattern of
social welfare in Belgium and France. As long as operating plant output is expanded as a
response to mild reductions in domestic CO2 taxes, the welfare trade-off is limited to
output (and hence domestic surplus) expansion versus increased emissions (and hence,
domestic damages) from the same plants. For more substantial reductions, the producer
may find it profitable to switch production to dirtier plants with considerably lower
operating cost, and the resulting increase in profits and consumers’ surplus may well
compensate the increase in environmental damages, especially if their marginal value is
not too high.
In some instances countries can benefit from unilateral deviations on the part of their
rivals. This can happen for two main reasons. Consumers benefit from cheaper imports,
and domestic emissions fall as a consequence of the reduction of domestic production.
This is Kennedy’s (1994) “pollution shifting” effect. In our simulations, this effect is
prevailing, for instance, in Belgium as a consequence of unilateral reductions of 10, 30 and
40% in France’s CO2 tax. More often however, fiercer competition from the deviating
country reduces welfare in rival countries, both because of the fall in national producers’
The Opening of the European Electricity Market and Environmental Policy: Does the Degree of Competition Matter?
29
profits, and because the rival producers are forced to adopt dirtier technology to sustain
competition, in a sort of a race to the bottom.
An unilateral tax reduction not always induces a fall in the profits of the rival countries (in
fact this happens consistently in our simulations only for unilateral deviations in Germany,
as shown in Figure 10). Given the discrete nature of technology adoption decisions, and
the different transmission capacities of international lines, if a non-deviating country loses
market share on a given market as a consequence of a tax reduction in another country, it
is not granted that the deviating country would be able to cover it fully. Then some other
country could be in a position to satisfy the residual demand, thus expanding its own
market share and its profits.
5. CONCLUSIONS
In this paper, we used a dynamic numerical model to assess the importance of the degree
of competition for the implementation of environmental policies within the European
electricity sector.
Our model compares three market regimes: the widely used perfect competition paradigm,
a price regulated monopoly regime, and a multi-market Cournot model. The three market
regimes have the same electricity transmission constraints. Our environmental policy focus
has been on the stringency of environmental policies under imperfect versus perfect
competition. Moreover, we examined the effects of unilateral distortions of a CO2 tax.
Our simulations confirm that, even if environmental policy is not optimal, as it is clearly
the case for the European electricity sector, perfect competition is clearly superior to
Cournot competition when it comes to welfare comparisons. The price regulation regime
stands in between the two, but quite close to the perfect competition outcome due to the
low profit margin assumed. The higher profits and the lower environmental damages that
result from Cournot competition fail to compensate for the huge losses in consumer
surplus. In our framework, this result is reinforced by two factors. On the one hand, the
limited international transmission capacity leaves significant local market power to
generators on their domestic markets. On the other hand, the decrease in output under
imperfect competition is sometimes accompanied by a shift towards more polluting
technologies, thus reducing the beneficial environmental effects of lower output levels.
As a consequence, our results on the interaction between the market regime and
environmental targets are mixed. Whilst the stringency of sulphur dioxide targets declines
under Cournot competition, NOx targets become more difficult to reach under Cournot
competition. As to CO2 taxes, their implementation under Cournot competition leads to
The Opening of the European Electricity Market and Environmental Policy: Does the Degree of Competition Matter?
30
larger deadweight losses, and hence, the lower emission levels are reached at a higher
social cost. Moreover, although overall CO2 emissions are higher under perfect
competition, some countries actually experience higher CO2 levels in some years under
Cournot competition.
Our investigation on strategic incentives showed that the appeal of unilateral deviations of
environmental policy depends crucially on which kind of objective function the
governments have and on the environmental policy is pursued for the other pollutants. If
they take into account damages from all pollutants and that these pollutants are
insufficiently regulated, the attractiveness of unilateral deviations declines sharply
compared to the case in which they take only carbon emission damages into account or
that the other pollutants are regulated optimally. An interesting and somewhat surprising
collateral result is that some governments may welcome unilateral deviations on the part
of their opponents. We singled out two factors that may explain this result. On one hand,
Kennedy’s (1994) “pollution shifting” effect induces governments to welcome to a certain
extent electricity imports because of the induced increase in consumers’ surplus and
decrease in domestic emissions. On the other hand, in presence of transmission
constraints and several technologies, a unilateral deviation may cause a rival to lose more
market share than the generator based in the deviating country is actually able to cover.
Other producers may then jump in and cover the residual demand.
Overall, our simulations suggest that it is worthwhile taking into consideration factors that
may lead to preservation of market power, when evaluating environmental policies for the
electricity sector
However, our results require a number of qualifications. For one thing, the numerical
model in its present form hinges on some strong hypotheses.
In particular the values chosen for transmission costs, transmission capacities, marginal
damages of emissions, CO2 tax rate, elasticity of demand, mark-ups on costs in 2000 are
all based on educated guesses or, at best, adapted from studies not immune from
uncertainties (such as, for instance, ExternE estimates for external damages).
Moreover, some equations of the model are quite rough representations of the real
constraints that they are supposed to depict. In particular, international electricity
transmission flow equations disregard Kirkhoff’s laws, transboundary pollution is included
only in the sense that CO2 marginal damages are the same everywhere, but no
transboundary matrix for conventional pollutants has been included, and trade to countries
other than the four included in the model is not considered, not even as residual trade. Our
on-going research is directed to overcome these drawbacks and also to include other

The Opening of the European Electricity Market and Environmental Policy: Does the Degree of Competition Matter?
31
policy scenarios such as the recent Directive Proposal on renewable energy sources21. Our
preliminary results indicate that imposing renewable source quotas to European countries
can involve serious welfare losses in absence of flexible implementation instruments.
21 Parliament and Council Directive Proposal No. 500PC0279 (10/05/2000)

The Opening of the European Electricity Market and Environmental Policy: Does the Degree of Competition Matter?
32
Appendix A : Description of the Numerical Model
Our model considers the dynamic equilibrium for the electricity sector of four neighbouring
European countries: Belgium, the Netherlands, France and Germany. The model is dynamic
in the sense that the electricity market equilibrium is modelled for a long time horizon
(2000-2034). Such a time span is sufficient to cover the long lifetimes that power
production investments generally have, and hence the main differences between nuclear
power generation and other technologies can be properly highlighted. Thus, a dynamic
setting allows us to take into full consideration the consequences in terms of technology
choice of the various policy scenarios we analyse. We assume that all agents have perfect
foresight.
Our model consists of:
• A supply module for electricity generation in each country;
• A demand module for electricity in each country;
• An environmental module describing external damages caused by electricity generation
in each country;
• A regulatory module describing environmental targets binding for electricity generation
in each country;
• A transmission module describing how electricity can be physically exchanged in the
international market;
We consider six sub-periods within a year (base, load, medium, shoulder, high, and peak)
all having the same length across the four countries. In each country, a single electric
utility supplies electricity to the national and international grids using the following
technologies:
NP • Nuclear power plants KEROP • Kerosene turbines
CP • Coal power plants HYP • Hydro power turbines
NCP • New coal power plants WP • Wind turbines
MIXP • Mixed fossil fuel power
plants
WAP • Municipal waste
incinerators
GP • Gas turbines CHP • Gas-based co-generation
plants
NGP • New gas turbines (STAG)
The Opening of the European Electricity Market and Environmental Policy: Does the Degree of Competition Matter?
33
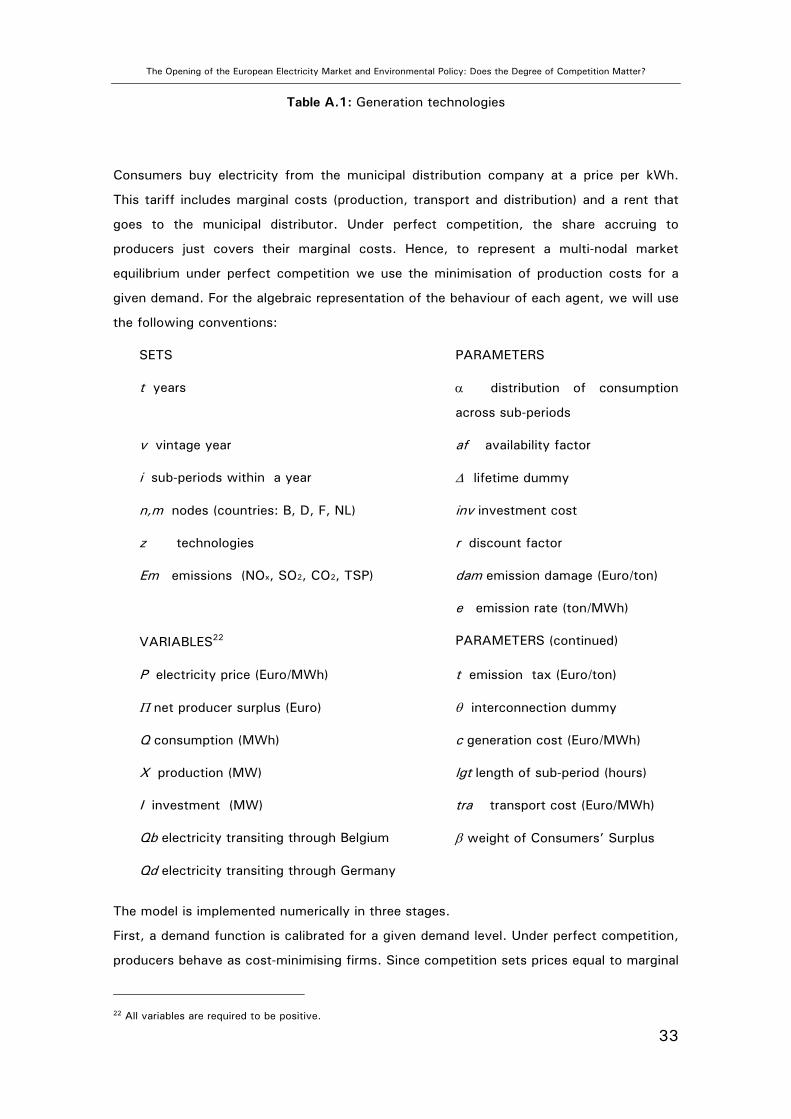
Table A.1: Generation technologies
Consumers buy electricity from the municipal distribution company at a price per kWh.
This tariff includes marginal costs (production, transport and distribution) and a rent that
goes to the municipal distributor. Under perfect competition, the share accruing to
producers just covers their marginal costs. Hence, to represent a multi-nodal market
equilibrium under perfect competition we use the minimisation of production costs for a
given demand. For the algebraic representation of the behaviour of each agent, we will use
the following conventions:
SETS PARAMETERS
t years α distribution of consumption
across sub-periods
v vintage year af availability factor
i sub-periods within a year ∆ lifetime dummy
n,m nodes (countries: B, D, F, NL) inv investment cost
z technologies r discount factor
Em emissions (NOx, SO2, CO2, TSP) dam emission damage (Euro/ton)
e emission rate (ton/MWh)
VARIABLES22 PARAMETERS (continued)
P electricity price (Euro/MWh) t emission tax (Euro/ton)
Π net producer surplus (Euro) θ interconnection dummy
Q consumption (MWh) c generation cost (Euro/MWh)
X production (MW) lgt length of sub-period (hours)
I investment (MW) tra transport cost (Euro/MWh)
Qb electricity transiting through Belgium β weight of Consumers’ Surplus
Qd electricity transiting through Germany
The model is implemented numerically in three stages.
First, a demand function is calibrated for a given demand level. Under perfect competition,
producers behave as cost-minimising firms. Since competition sets prices equal to marginal
22 All variables are required to be positive.
The Opening of the European Electricity Market and Environmental Policy: Does the Degree of Competition Matter?
34
costs, for a given demand producers minimise the total costs of electricity supply. We
exploit this feature for the calibration of the demand function ( )n,t n,t n,t n,tP = a - b Q , where
n,tQ is the total quantity sold at t node n during year t. For calibration, demand is
exogenously fixed to the observed levels in 2000-2004, and to projected levels in
subsequent periods. We have taken into account that what is observed in 2000-2004 is
actually the result of price regulation policies by including a price margin per MWh in that
year.
Second, a benchmark perfect competition scenario, with price regulation in 2000, is
computed by means of a welfare maximisation. We use the outcome for 2000 of this
reference scenario as the common starting point for all our policy scenarios.
Finally, we compute our policy scenarios. We compare outcomes under perfect
competition to outcomes under Cournot competition and price regulation.
A number of constraints further define our problem, and are always present in the three
stages described.
Firstly23, generated electricity actually supplied at each node, must equal demand at that
node.
, ,
, , , , ,,
(1 )i n n t
in m z i m n t
m zi n
Qloss X
lgt
αθ
+ ≤
∑∑ ∑ (A.1)
Moreover, each electric producer must take into account capacity constraints for its power
plants and reserve constraints for national grids, in order to assure enough supply of
electricity even in peak periods.
, , , , , , , ,z i n m t v t n v n z vm v t
X af I≤
≤ ∆∑ ∑ (A.2)
( ) ,, , , , ,
,
1 PK nn n t v t n v n z v
v tPK n
res Q < af Ilgtα
≤
+ ∆∑ (A.3)
Equation (A.2) simply stipulates that output in any given year should never exceed the
available capacity, determined by the investments made until that year. Equation (A.3)
requires that the same capacity must be sufficient to cover demand in each period plus a
reserve margin. Implicitly, it amounts to assuming that each country is in principle self-
sufficient, and that trade occurs for comparative efficiency reasons.
23 In what follows, production z,i,n,m,t X is indexed not only for the period and sub-period in which it is
produced, the firm that produces it, the technology used for production, but also for the country where it is
generated and the country where it is sent. This allows us to regard the sum of z,i,n,m,t X over m as
The Opening of the European Electricity Market and Environmental Policy: Does the Degree of Competition Matter?
35
Existent environmental policies are taken into account in terms of unit emissions
specifications of the plants and in the form of maximum allowed NOx and SO2 emissions
from Dutch and Belgian plants. The latter are specified in the model by means of the
following constraints:
i n em z n t z i n m t em n tm i z
lgt e X e≤∑∑ ∑, , , , , , , , , , for n=B,NL and 2 Xem=SO ,NO (A.4)
Finally, international electricity sales are constrained by the capacity and the shape of the
grid. Since this is rather complex, we will now describe it in detail here.
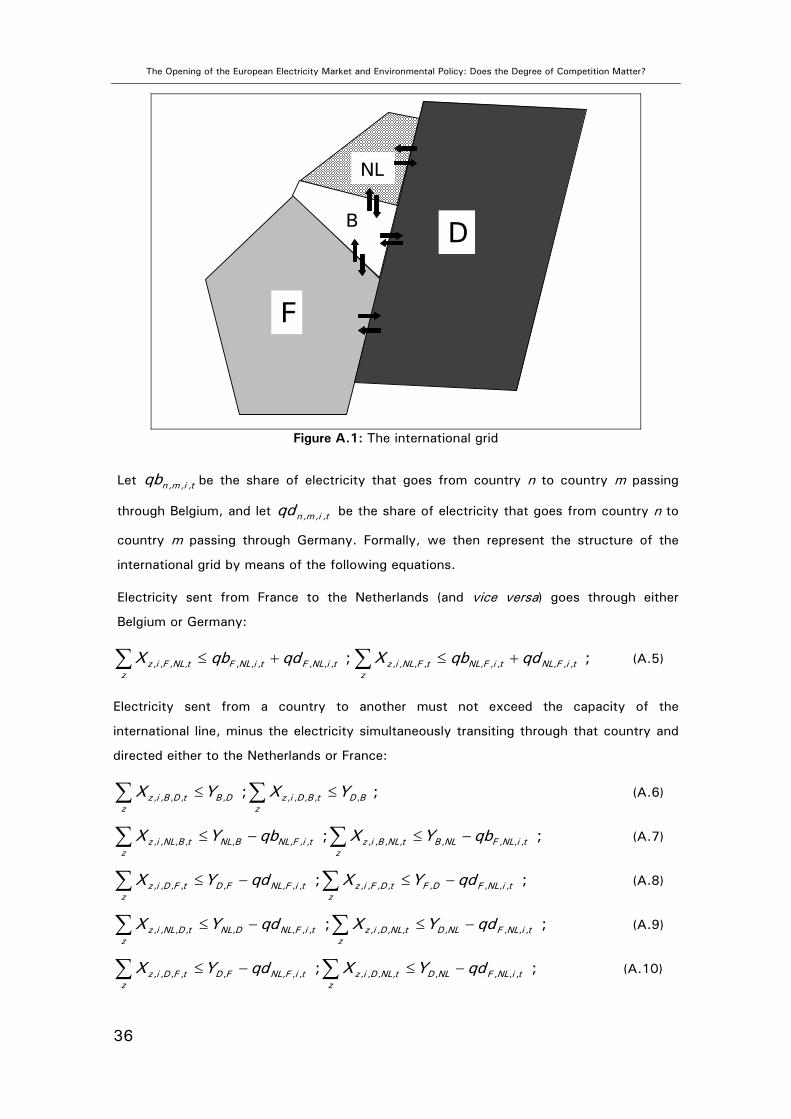
In order to understand how we model the international transmission of electricity, consider
Figure A.1. As shown in the figure, we assume that there are direct interconnections
between any couple of countries but the Netherlands and France, and that there are two
separate lines connecting any couple of interconnected countries, one for each flow
direction. Therefore, electricity traded at any moment between the Netherlands and France
must be transmitted using the existing links connecting them with the other two countries,
and using the transmission capacity not utilized in that moment for direct trade between
countries directly interconnected. For instance, if the French producer sells i ,tX MW to
the Dutch market at time i of year t, this amount of electricity may reach its destination
either passing through Germany or passing through Belgium, but only if at that moment
there is enough transmission capacity on the links between France and Germany, Germany
and the Netherlands, and/or between France and Belgium, Belgium and the Netherlands.
Of course this also influences what can be directly traded between countries that have a
direct interconnection. The actual capacity of these lines is then reduced by what is used
in order to allow trade between the Netherlands and France.
We take, however, some simplifying assumptions. In particular:
• All transmission lines entail the same transmission cost. This incidentally implies
that the transmission cost between France and the Netherlands is double the cost
between any two directly interconnected countries;
• Electricity follows the most direct path to any destination. Hence, we rule out the
possibility that in order to go from France to the Netherlands (and vice versa),
electricity will use the Belgium-Germany line as well.
production per unit of time in country n with technology z, and the sum of z,i,n,m,t X over z as sales per unit
of time of a firm based in n to country m.
The Opening of the European Electricity Market and Environmental Policy: Does the Degree of Competition Matter?
36
Figure A.1: The international grid
Let n ,m,i ,tqb be the share of electricity that goes from country n to country m passing
through Belgium, and let n ,m,i ,tqd be the share of electricity that goes from country n to
country m passing through Germany. Formally, we then represent the structure of the
international grid by means of the following equations.
Electricity sent from France to the Netherlands (and vice versa) goes through either
Belgium or Germany:
, , , , , , , , , , ;z i F NL t F NL i t F NL i tz
X qb qd≤ +∑ , , , , , , , , , , ;z i NL F t NL F i t NL F i tz
X qb qd≤ +∑ (A.5)
Electricity sent from a country to another must not exceed the capacity of the
international line, minus the electricity simultaneously transiting through that country and
directed either to the Netherlands or France:
, , , , , , , , , ,; ;z i B D t B D z i D B t D Bz z
X Y X Y≤ ≤∑ ∑ (A.6)
, , , , , , , , , , , , , , , ,; ;z i NL B t NL B NL F i t z i B NL t B NL F NL i tz z
X Y qb X Y qb≤ − ≤ −∑ ∑ (A.7)
, , , , , , , , , , , , , , , ,; ;z i D F t D F NL F i t z i F D t F D F NL i tz z
X Y qd X Y qd≤ − ≤ −∑ ∑ (A.8)
, , , , , , , , , , , , , , , ,; ;z i NL D t NL D NL F i t z i D NL t D NL F NL i tz z
X Y qd X Y qd≤ − ≤ −∑ ∑ (A.9)
, , , , , , , , , , , , , , , ,; ;z i D F t D F NL F i t z i D NL t D NL F NL i tz z
X Y qd X Y qd≤ − ≤ −∑ ∑ (A.10)
F
B
NL
D
The Opening of the European Electricity Market and Environmental Policy: Does the Degree of Competition Matter?
37
, , , , , , , , , , , , , , , ,; ;z i B NL t B NL F NL i t z i B F t B F NL F i tz z
X Y qb X Y qb≤ − ≤ −∑ ∑ (A.11)
, , , , , , , , , , , , , , , ,; ;z i F B t F B F NL i t z i B F t B F NL F i tz z
X Y qb X Y qb≤ − ≤ −∑ ∑ (A.12)
Finally, electricity traded between the two not interconnected countries (France and the
Netherlands), must equal the available transmission capacity connecting them to the other
two countries minus the electricity otherwise traded using those lines:
, , , , , , , , , , , , , , , , , , , , , , ;z i NL F t NL D NL B z i D F t z i B F t z i NL D t z i NL B tz z z z z
X Y Y X X X X≤ + − − − −∑ ∑ ∑ ∑ ∑ (A.13)
, , , , , , , , , , , , , , , , , , , , , , .z i F NL t F D F B z i F D t z i F B t z i D NL t z i B NL tz z z z z
X Y Y X X X X≤ + − − − −∑ ∑ ∑ ∑ ∑ (A.14)
We can now describe more precisely the three stages of our model.
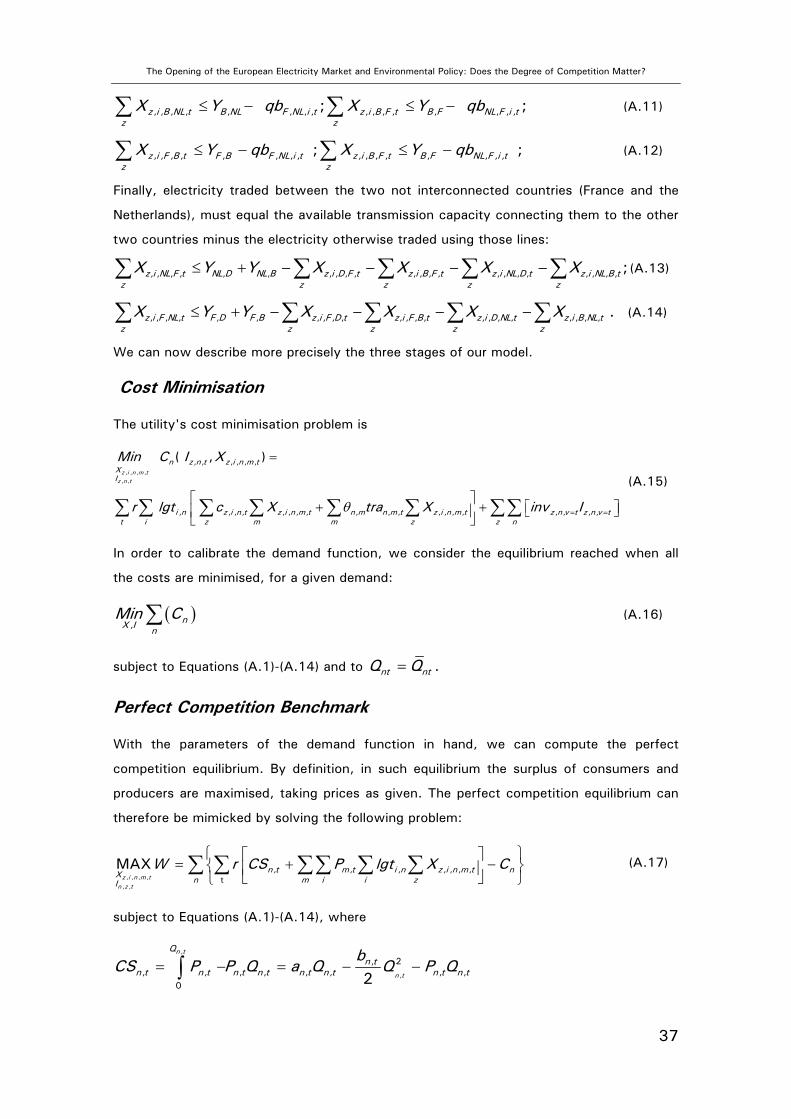
Cost Minimisation
The utility's cost minimisation problem is
z i n m tz n t
n z n t z i n m tXI
i n z i n t z i n m t n m n m t z i n m t z n v t z n v tt i z m m z z n
Min C I X
r lgt c X tra X inv Iθ = =
=
+ + ∑ ∑ ∑ ∑ ∑ ∑ ∑∑
, , , ,, ,
, , , , , ,
, , , , , , , , , , , , , , , , , , ,
( , )
(A.15)
In order to calibrate the demand function, we consider the equilibrium reached when all
the costs are minimised, for a given demand:
( ), nX I
n
Min C∑ (A.16)
subject to Equations (A.1)-(A.14) and to nt ntQ Q= .
Perfect Competition Benchmark
With the parameters of the demand function in hand, we can compute the perfect
competition equilibrium. By definition, in such equilibrium the surplus of consumers and
producers are maximised, taking prices as given. The perfect competition equilibrium can
therefore be mimicked by solving the following problem:
z i n m tn z t
n t m t i n z i n m t nXn m i i zI
W r CS P lgt X C = + −
∑ ∑ ∑∑ ∑ ∑, , , ,
, ,
, , , , , , ,t
MAX (A.17)
subject to Equations (A.1)-(A.14), where
n t
n t
Qn t
n t n t n t n t n t n t n t n t
bCS P P Q a Q Q P Q= − = − −∫
,
,
2,, , , , , , , ,
0 2
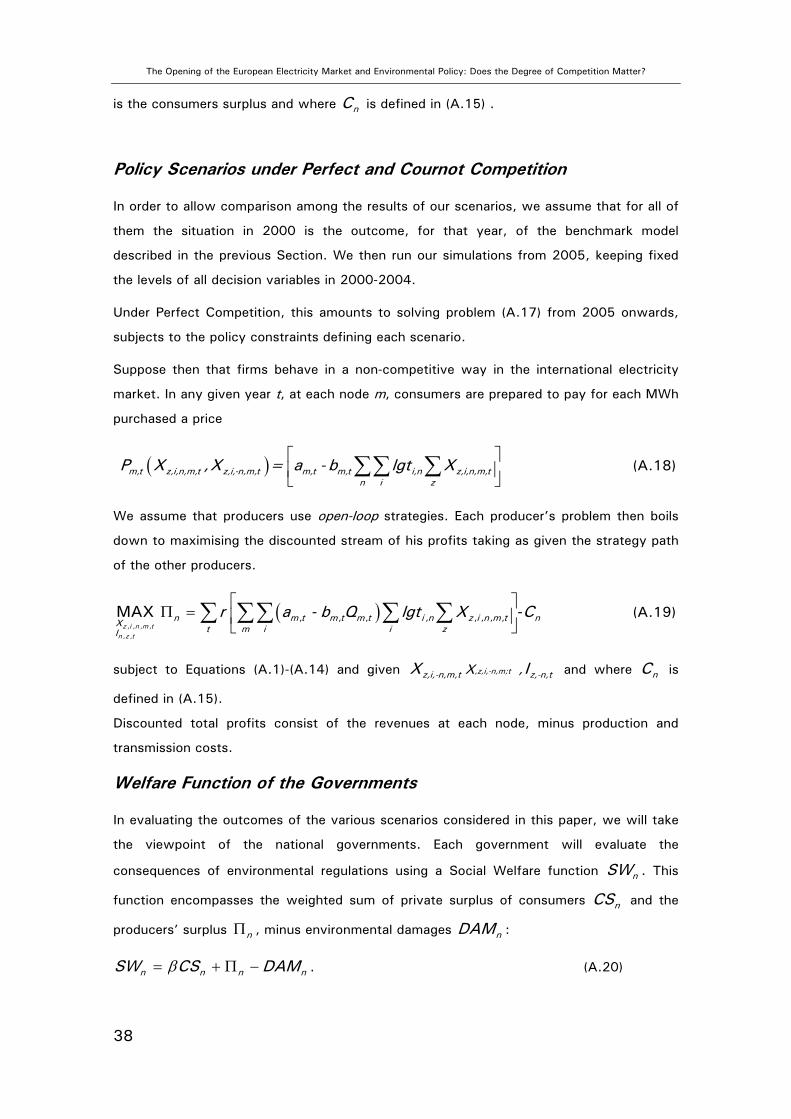
The Opening of the European Electricity Market and Environmental Policy: Does the Degree of Competition Matter?
38
is the consumers surplus and where nC is defined in (A.15) .
Policy Scenarios under Perfect and Cournot Competition
In order to allow comparison among the results of our scenarios, we assume that for all of
them the situation in 2000 is the outcome, for that year, of the benchmark model
described in the previous Section. We then run our simulations from 2005, keeping fixed
the levels of all decision variables in 2000-2004.
Under Perfect Competition, this amounts to solving problem (A.17) from 2005 onwards,
subjects to the policy constraints defining each scenario.
Suppose then that firms behave in a non-competitive way in the international electricity
market. In any given year t, at each node m, consumers are prepared to pay for each MWh
purchased a price
( )m,t z,i,n,m,t z,i,-n,m,t m,t m,t i,n z,i,n,m,tn i z
P X ,X = a - b lgt X
∑∑ ∑ (A.18)
We assume that producers use open-loop strategies. Each producer’s problem then boils
down to maximising the discounted stream of his profits taking as given the strategy path
of the other producers.
( )z i n m t
n z t
n m t m t m t i n z i n m t nXt m i i zI
r a - b Q lgt X C Π = ∑ ∑∑ ∑ ∑
, , , ,, ,
, , , , , , , ,MAX - (A.19)
subject to Equations (A.1)-(A.14) and given z,i,-n,m,tX X,z,i,-n,m;t , z,-n,tI and where nC is
defined in (A.15).
Discounted total profits consist of the revenues at each node, minus production and
transmission costs.
Welfare Function of the Governments
In evaluating the outcomes of the various scenarios considered in this paper, we will take
the viewpoint of the national governments. Each government will evaluate the
consequences of environmental regulations using a Social Welfare function nSW . This
function encompasses the weighted sum of private surplus of consumers nCS and the
producers’ surplus nΠ , minus environmental damages nDAM :
n n n nSW CS DAMβ= + Π − . (A.20)
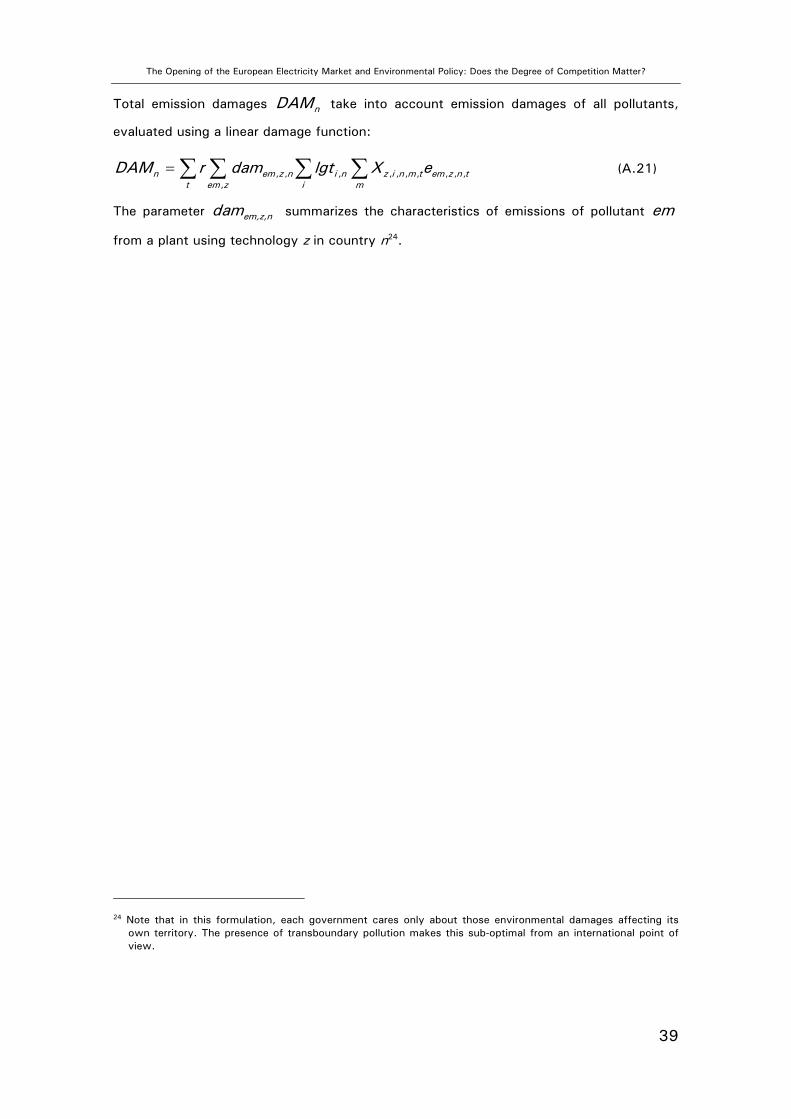
The Opening of the European Electricity Market and Environmental Policy: Does the Degree of Competition Matter?
39
Total emission damages nDAM take into account emission damages of all pollutants,
evaluated using a linear damage function:
n em z n i n z i n m t em z n tt em z i m
DAM r dam lgt X e= ∑ ∑ ∑ ∑, , , , , , , , , ,,
(A.21)
The parameter em,z,n dam summarizes the characteristics of emissions of pollutant em
from a plant using technology z in country n24.
24 Note that in this formulation, each government cares only about those environmental damages affecting its
own territory. The presence of transboundary pollution makes this sub-optimal from an international point of view.
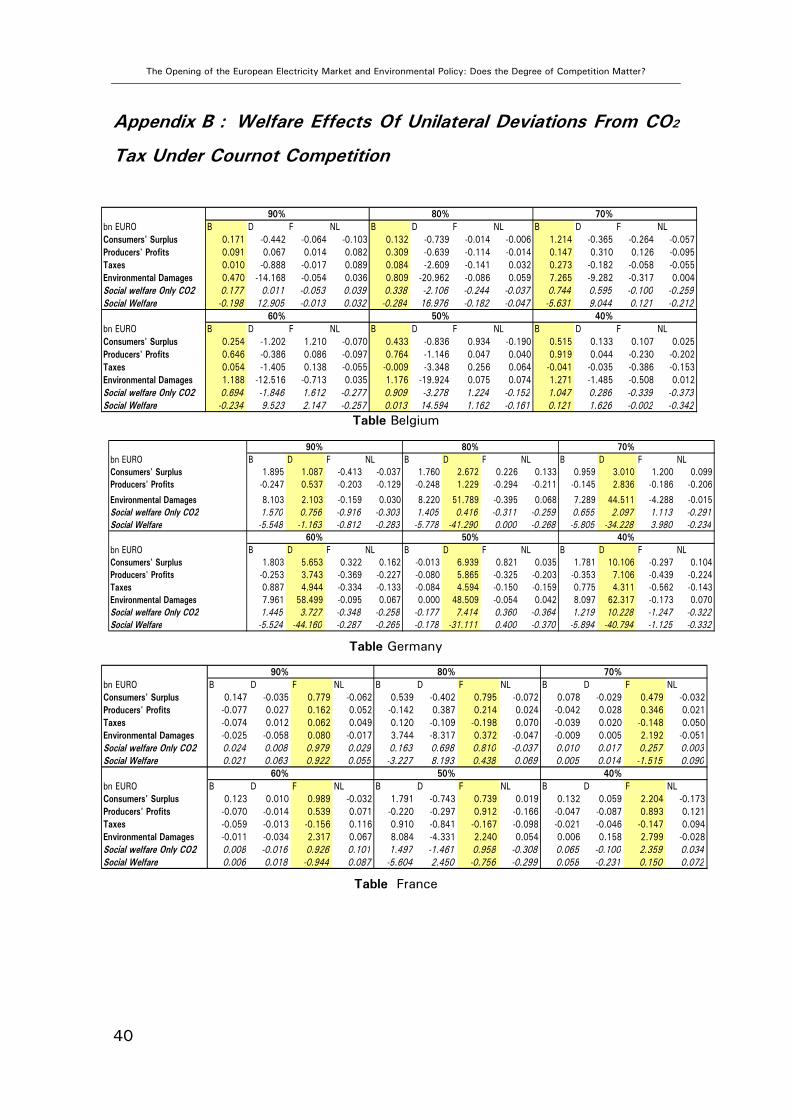
The Opening of the European Electricity Market and Environmental Policy: Does the Degree of Competition Matter?
40
Appendix B : Welfare Effects Of Unilateral Deviations From CO2
Tax Under Cournot Competition
Table Belgium
Table Germany
Table France
90% 80% 70%bn EURO B D F NL B D F NL B D F NLConsumers' Surplus 1.895 1.087 -0.413 -0.037 1.760 2.672 0.226 0.133 0.959 3.010 1.200 0.099Producers' Profits -0.247 0.537 -0.203 -0.129 -0.248 1.229 -0.294 -0.211 -0.145 2.836 -0.186 -0.206
Environmental Damages 8.103 2.103 -0.159 0.030 8.220 51.789 -0.395 0.068 7.289 44.511 -4.288 -0.015Social welfare Only CO2 1.570 0.756 -0.916 -0.303 1.405 0.416 -0.311 -0.259 0.655 2.097 1.113 -0.291Social Welfare -5.548 -1.163 -0.812 -0.283 -5.778 -41.290 0.000 -0.268 -5.805 -34.228 3.980 -0.234
60% 50% 40%bn EURO B D F NL B D F NL B D F NLConsumers' Surplus 1.803 5.653 0.322 0.162 -0.013 6.939 0.821 0.035 1.781 10.106 -0.297 0.104Producers' Profits -0.253 3.743 -0.369 -0.227 -0.080 5.865 -0.325 -0.203 -0.353 7.106 -0.439 -0.224Taxes 0.887 4.944 -0.334 -0.133 -0.084 4.594 -0.150 -0.159 0.775 4.311 -0.562 -0.143Environmental Damages 7.961 58.499 -0.095 0.067 0.000 48.509 -0.054 0.042 8.097 62.317 -0.173 0.070Social welfare Only CO2 1.445 3.727 -0.348 -0.258 -0.177 7.414 0.360 -0.364 1.219 10.228 -1.247 -0.322Social Welfare -5.524 -44.160 -0.287 -0.265 -0.178 -31.111 0.400 -0.370 -5.894 -40.794 -1.125 -0.332
90% 80% 70%bn EURO B D F NL B D F NL B D F NLConsumers' Surplus 0.147 -0.035 0.779 -0.062 0.539 -0.402 0.795 -0.072 0.078 -0.029 0.479 -0.032Producers' Profits -0.077 0.027 0.162 0.052 -0.142 0.387 0.214 0.024 -0.042 0.028 0.346 0.021Taxes -0.074 0.012 0.062 0.049 0.120 -0.109 -0.198 0.070 -0.039 0.020 -0.148 0.050Environmental Damages -0.025 -0.058 0.080 -0.017 3.744 -8.317 0.372 -0.047 -0.009 0.005 2.192 -0.051Social welfare Only CO2 0.024 0.008 0.979 0.029 0.163 0.698 0.810 -0.037 0.010 0.017 0.257 0.003Social Welfare 0.021 0.063 0.922 0.055 -3.227 8.193 0.438 0.069 0.005 0.014 -1.515 0.090
60% 50% 40%bn EURO B D F NL B D F NL B D F NLConsumers' Surplus 0.123 0.010 0.989 -0.032 1.791 -0.743 0.739 0.019 0.132 0.059 2.204 -0.173Producers' Profits -0.070 -0.014 0.539 0.071 -0.220 -0.297 0.912 -0.166 -0.047 -0.087 0.893 0.121Taxes -0.059 -0.013 -0.156 0.116 0.910 -0.841 -0.167 -0.098 -0.021 -0.046 -0.147 0.094Environmental Damages -0.011 -0.034 2.317 0.067 8.084 -4.331 2.240 0.054 0.006 0.158 2.799 -0.028Social welfare Only CO2 0.008 -0.016 0.926 0.101 1.497 -1.461 0.958 -0.308 0.065 -0.100 2.359 0.034Social Welfare 0.006 0.018 -0.944 0.087 -5.604 2.450 -0.756 -0.299 0.058 -0.231 0.150 0.072
90% 80% 70%bn EURO B D F NL B D F NL B D F NLConsumers' Surplus 0.171 -0.442 -0.064 -0.103 0.132 -0.739 -0.014 -0.006 1.214 -0.365 -0.264 -0.057Producers' Profits 0.091 0.067 0.014 0.082 0.309 -0.639 -0.114 -0.014 0.147 0.310 0.126 -0.095Taxes 0.010 -0.888 -0.017 0.089 0.084 -2.609 -0.141 0.032 0.273 -0.182 -0.058 -0.055Environmental Damages 0.470 -14.168 -0.054 0.036 0.809 -20.962 -0.086 0.059 7.265 -9.282 -0.317 0.004Social welfare Only CO2 0.177 0.011 -0.053 0.039 0.338 -2.106 -0.244 -0.037 0.744 0.595 -0.100 -0.259Social Welfare -0.198 12.905 -0.013 0.032 -0.284 16.976 -0.182 -0.047 -5.631 9.044 0.121 -0.212
60% 50% 40%bn EURO B D F NL B D F NL B D F NLConsumers' Surplus 0.254 -1.202 1.210 -0.070 0.433 -0.836 0.934 -0.190 0.515 0.133 0.107 0.025Producers' Profits 0.646 -0.386 0.086 -0.097 0.764 -1.146 0.047 0.040 0.919 0.044 -0.230 -0.202Taxes 0.054 -1.405 0.138 -0.055 -0.009 -3.348 0.256 0.064 -0.041 -0.035 -0.386 -0.153Environmental Damages 1.188 -12.516 -0.713 0.035 1.176 -19.924 0.075 0.074 1.271 -1.485 -0.508 0.012Social welfare Only CO2 0.694 -1.846 1.612 -0.277 0.909 -3.278 1.224 -0.152 1.047 0.286 -0.339 -0.373Social Welfare -0.234 9.523 2.147 -0.257 0.013 14.594 1.162 -0.161 0.121 1.626 -0.002 -0.342
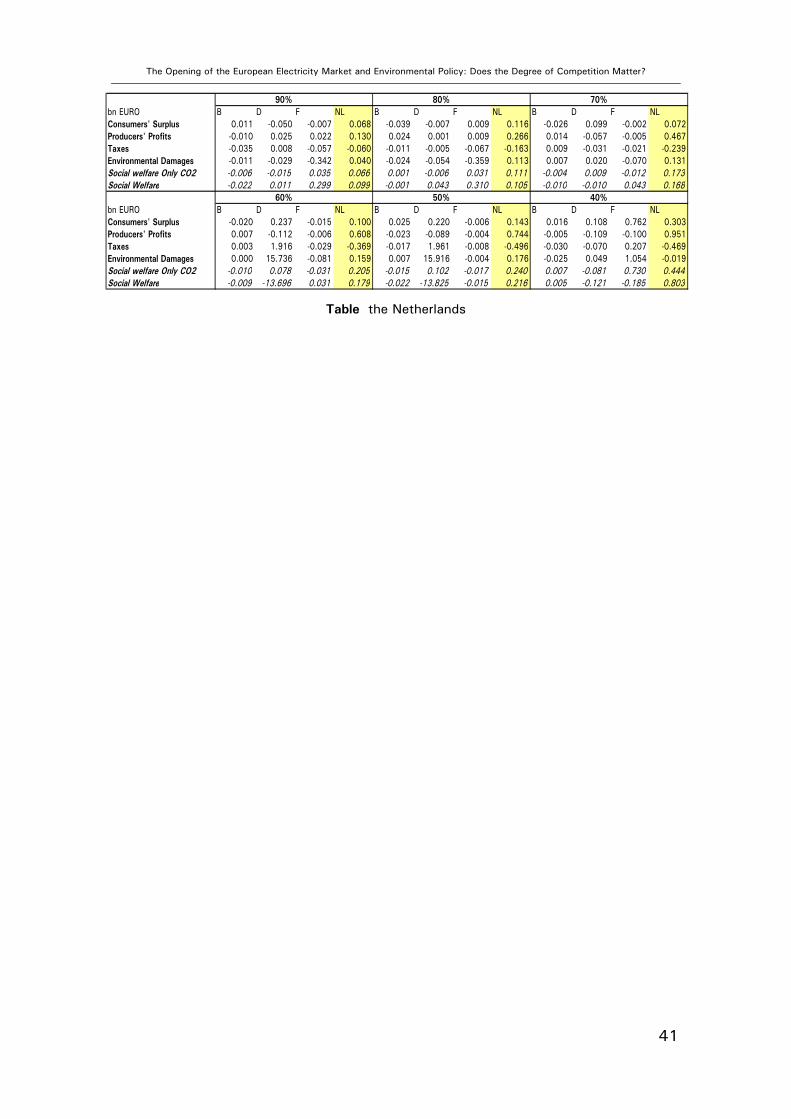
The Opening of the European Electricity Market and Environmental Policy: Does the Degree of Competition Matter?
41
Table the Netherlands
90% 80% 70%bn EURO B D F NL B D F NL B D F NLConsumers' Surplus 0.011 -0.050 -0.007 0.068 -0.039 -0.007 0.009 0.116 -0.026 0.099 -0.002 0.072Producers' Profits -0.010 0.025 0.022 0.130 0.024 0.001 0.009 0.266 0.014 -0.057 -0.005 0.467Taxes -0.035 0.008 -0.057 -0.060 -0.011 -0.005 -0.067 -0.163 0.009 -0.031 -0.021 -0.239Environmental Damages -0.011 -0.029 -0.342 0.040 -0.024 -0.054 -0.359 0.113 0.007 0.020 -0.070 0.131Social welfare Only CO2 -0.006 -0.015 0.035 0.066 0.001 -0.006 0.031 0.111 -0.004 0.009 -0.012 0.173Social Welfare -0.022 0.011 0.299 0.099 -0.001 0.043 0.310 0.105 -0.010 -0.010 0.043 0.168
60% 50% 40%bn EURO B D F NL B D F NL B D F NLConsumers' Surplus -0.020 0.237 -0.015 0.100 0.025 0.220 -0.006 0.143 0.016 0.108 0.762 0.303Producers' Profits 0.007 -0.112 -0.006 0.608 -0.023 -0.089 -0.004 0.744 -0.005 -0.109 -0.100 0.951Taxes 0.003 1.916 -0.029 -0.369 -0.017 1.961 -0.008 -0.496 -0.030 -0.070 0.207 -0.469Environmental Damages 0.000 15.736 -0.081 0.159 0.007 15.916 -0.004 0.176 -0.025 0.049 1.054 -0.019Social welfare Only CO2 -0.010 0.078 -0.031 0.205 -0.015 0.102 -0.017 0.240 0.007 -0.081 0.730 0.444Social Welfare -0.009 -13.696 0.031 0.179 -0.022 -13.825 -0.015 0.216 0.005 -0.121 -0.185 0.803
The Opening of the European Electricity Market and Environmental Policy: Does the Degree of Competition Matter?
42
REFERENCES.
Barrett, Scott (1994). Strategic Environmental Policy and International Trade. Journal of
Public Economics, Vol. 53, n. 3, pp. 325-338.
Bigano, A., Proost, S. and Van Rompuy, J. (2000). Alternative Environmental Regulations
Schemes for the Belgian Power Generation Sector. Environmental and Resources
Economics. Vol. 16, pp. 121-160.
Böhringer, C, Welsch, H, Löschel, A. (2001), Environmental Taxation and Structural
Change in an Open Economy - A CGE Analysis with Imperfect Competition and Free Entry,
ZEW Discussion Papers No. 01-07, Mannheim
Burtraw, Dallas, Palmer, Karen, and Heintzelman, Martin (2000). Electricity Restructuring:
Consequences and Opportunities for the Environment. Resources for the Future Discussion
Paper N. 00-39, Washington D.C.
Brander, J. A. and Spencer, B. J. (1985). Export Subsidies and International Market Share
Rivalry. Journal of International Economics Vol. 18, pp. 83-100.
Conrad, Klaus (1993). Taxes and Subsidies for Pollution Intensive Industries as Trade
Policy. Journal of Environmental Economics and Management 25, pp. 121-135.
Conrad, K. (1995). Choosing Emission Taxes Under International Price Competition.
Fondazione Eni - Enrico Mattei Working Paper 18.95, Milano.
European Commission (1998). Directive on Curbing Emissions from Large Combustion
Plants (Proposal). Supplement to Europe Environment, n. 528, 8th September 1998.
European Commission (1999) ExternE: Externalities of Energy, Vol. I-V, European
Commission DG XII, Luxembourg.
European Commission (2000) Amended Proposal For a Directive of the European
Parliament and of the Council on The Promotion of Electricity from Renewable Sources in
the Internal Electricity Market.
Feenstra, Talitha (1998). Environmental Policy Instruments and International Rivalry - A
Dynamic Analysis. Ph.D. Dissertation, CentER for Economic Research, Tilburg University,
the Netherlands.
Kemfert, Claudia (1999). The Liberalisation Process of the German Electricity Market.
Strategies and Opportunities. Fondazione Eni-Enrico Mattei Working Paper n. 95.99
Milano.
The Opening of the European Electricity Market and Environmental Policy: Does the Degree of Competition Matter?
43
Kennedy, Peter W. (1994). Equilibrium Pollution Taxes in Open Economies with Imperfect
Competition. Journal of Environmental Economics and Management, Vol. 27, pp.49-63.
Hobbs, Benjamin (1986). Network Models of Spatial Oligopoly With an Application to
Deregulation of Electricity Generation. Journal of Operational Research, Vol 34, pp 395-
409.
Hogan, William W. (1997) A Market Power Model with Strategic Interaction in Electricity
Networks. The Energy Journal, Vol. 18, n. 4, pp. 107-141.
Hoster, Frank, (1997): Effects of National Energy Policies on Carbon Dioxide Emissions in
an European Internal Electricity Market: Results From a Simulation Model of the European
Power Systems. Fondazione Eni-Enrico Mattei Working Paper 79.97, Milano.
Palmer, Karen, Burtraw, Dallas, Bharvikar Ranijt, and Paul, Anthony (2001). Restructuring
and the Cost of Reducing NOx Emissions in Electricity Generation. Resources for the Future
Discussion Paper N. 01-10REV, Washington D.C.
Proost, Stef. and Van Regemorter, Denise (2000) How to Achieve Kyoto Targets in
Belgium – Modelling Methodology and Some Results. ETE Working Paper Series n. 8-
2000, CES, Katholieke Universiteit Leuven.
Smeers, Yves. (1997): Computable Equilibrium Models and the restructuring of the
European Electricity and Gas Market. The Energy Journal. Vol. 18(4), pp:1-31.
Ulph, A. (1996): Environmental Policy And International Trade When Governments And
Producers Act Strategically. Journal Of Environmental Economics And Management, Vol.
30, n. 3, pp. 265-281.
Ulph, Alistair (1997): Harmonisation, Minimum Standards, and Optimal International
Environmental Policy Under Asymmetric Information. Discussion Paper n. 9701,
Department of Economics, University of Southampton.
Ulph, D. (1994) Strategic Innovation And Strategic Environmental Policy. in Carraro, C.
(ed) Trade, Innovation, Environment. Kluwer Academic Publishers.
Ulph A. and Ulph, D. (1996) Trade, Strategic Innovation And Strategic Environmental
Policy – A General Analysis. in Carraro, C., Katsoulacos, Y. and Xepapadeas, A. (eds)
Environmental Policy And Market Structure. Kluwer Academic Publishers, pp. 180-208.
UNIPEDE (1998). Electricity Outlook 1999. Ref. N. 1998-512-0003, UNIPEDE, Brussels.
UCTE (2001) Statistical Yearbook 2000. UCTE, Berlin, Germany.
Wei, J-Y and. Smeers, Y. (1997): Spatially Oligopolistic Models With Cournot Producers
and Regulated Transportation Prices. C.O.R.E Working Paper n. 9260, Université
Catholique de Louvain.

The Opening of the European Electricity Market and Environmental Policy: Does the Degree of Competition Matter?
44
Welsch, H. (1998). Coal Subsidisation and Nuclear Phase-out in a General Equilibrium
Model for Germany. Energy Economics, Vol. 20, pp. 203-222.
The Center for Economic Studies (CES) is the research division of the Department of Economics of the Katholieke Universiteit Leuven. The CES research department employs some 100 people. The division Energy, Transport & Environment (ETE) currently consists of about 15 full time researchers. The general aim of ETE is to apply state of the art economic theory to current policy issues at the Flemish, Belgian and European level. An important asset of ETE is its extensive portfolio of numerical partial and general equilibrium models for the assessment of transport, energy and environmental policies.
ETE WORKING PAPER SERIES 2003
n°2003-15 Bigano A., Proost S. (2003), The opening of the European electricity market and environmental policy: does the degree of competition matter?
n°2003-14 Pepermans G., Willems B. (2003), Regulating transmission in a spatial oligopoly: a numerical illustration for Belgium
n°2003-13 Eyckmans J., Pepermans G. (2003), Is er toekomst voor kernenergie in België?
n°2003-12 Franckx L. and D’Amato A. (2003), Environmental policy as a multi-task principal-agent problem
n° 2003-11 Proost S. And Van Dender K. (2003), Marginal Social Cost Pricing For All Transport Modes And The Effects Of Modal Budget Constraints
n° 2003-10 Mayeres I., Van Regemorter D. (2003), Modelling the health related benefits of environmental policies - a CGE ANALYSIS for the EU countries with GEM-E3
n° 2003-09 De Borger B., Proost S., Van Dender K. (2003), Congestion And Tax Competition In A Parallel Network
n° 2003-08 Pepermans G., Driesen J., Haeseldonckx D., D’haeseleer W. and Belmans R. (2003), Distributed generation: definition, benefits and issues
n° 2003-07 Moons E., The development and application of economic valuation techniques and their use in environmental policy – A survey
n° 2003-06 Muys B., Deckmyn G., Moons E., Quijano J.G., Proost S. and Ceulemans R. (2003), An integrated decision support tool for the prediction and evaluation of efficiency, environmental impact and total social cost of forestry projects in the framework of the Kyoto protocol
n° 2003-05 Proost, S. and Van Regemorter, D. (2003), Climate change policy in European countries and its effects on industry
n° 2003-04 Willems, B. (2003), Should an incumbent generator be allowed to buy import transmission capacity?
n° 2003-03 Rousseau, S. and Billiet, C.M. (2003), Using emission standards under incomplete compliance