The Genetic Structure and History of Africans and African Americans
Upload
independentCategory
view
4download
0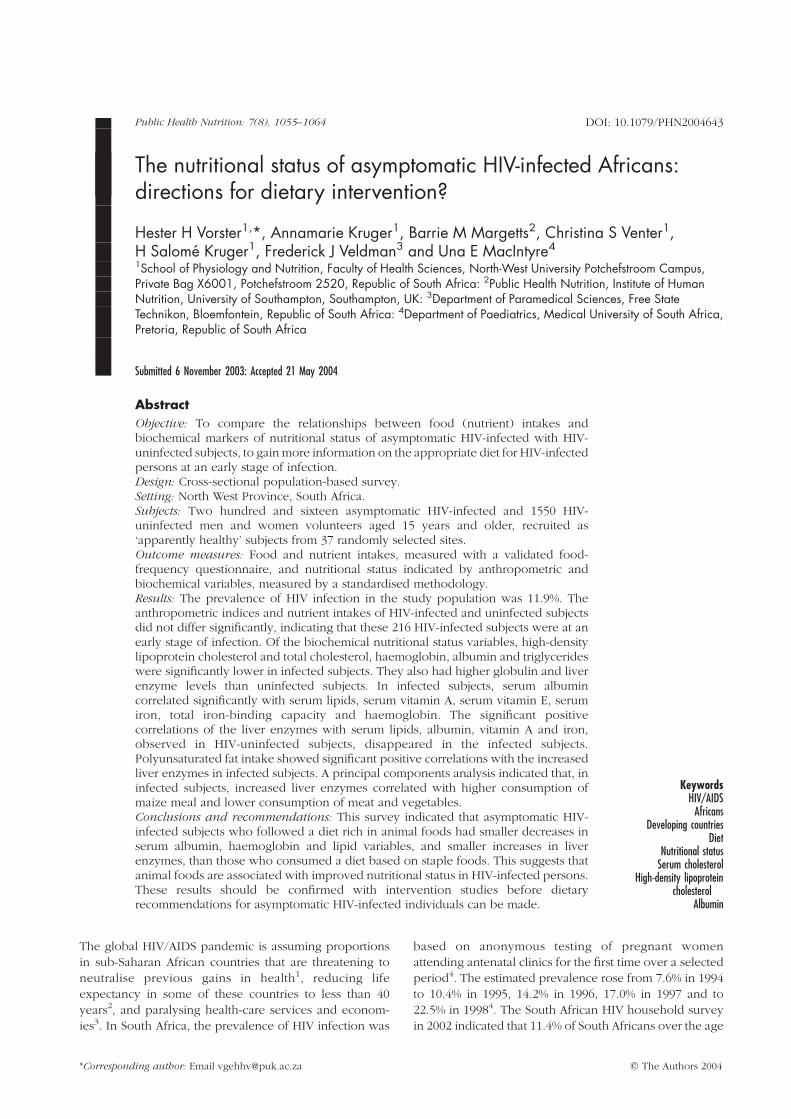
The nutritional status of asymptomatic HIV-infected Africans:directions for dietary intervention?
Hester H Vorster1,*, Annamarie Kruger1, Barrie M Margetts2, Christina S Venter1,H Salome Kruger1, Frederick J Veldman3 and Una E MacIntyre4
1School of Physiology and Nutrition, Faculty of Health Sciences, North-West University Potchefstroom Campus,Private Bag X6001, Potchefstroom 2520, Republic of South Africa: 2Public Health Nutrition, Institute of HumanNutrition, University of Southampton, Southampton, UK: 3Department of Paramedical Sciences, Free StateTechnikon, Bloemfontein, Republic of South Africa: 4Department of Paediatrics, Medical University of South Africa,Pretoria, Republic of South Africa
Submitted 6 November 2003: Accepted 21 May 2004
Abstract
Objective: To compare the relationships between food (nutrient) intakes andbiochemical markers of nutritional status of asymptomatic HIV-infected with HIV-uninfected subjects, to gain more information on the appropriate diet for HIV-infectedpersons at an early stage of infection.Design: Cross-sectional population-based survey.Setting: North West Province, South Africa.Subjects: Two hundred and sixteen asymptomatic HIV-infected and 1550 HIV-uninfected men and women volunteers aged 15 years and older, recruited as‘apparently healthy’ subjects from 37 randomly selected sites.Outcome measures: Food and nutrient intakes, measured with a validated food-frequency questionnaire, and nutritional status indicated by anthropometric andbiochemical variables, measured by a standardised methodology.Results: The prevalence of HIV infection in the study population was 11.9%. Theanthropometric indices and nutrient intakes of HIV-infected and uninfected subjectsdid not differ significantly, indicating that these 216 HIV-infected subjects were at anearly stage of infection. Of the biochemical nutritional status variables, high-densitylipoprotein cholesterol and total cholesterol, haemoglobin, albumin and triglycerideswere significantly lower in infected subjects. They also had higher globulin and liverenzyme levels than uninfected subjects. In infected subjects, serum albumincorrelated significantly with serum lipids, serum vitamin A, serum vitamin E, serumiron, total iron-binding capacity and haemoglobin. The significant positivecorrelations of the liver enzymes with serum lipids, albumin, vitamin A and iron,observed in HIV-uninfected subjects, disappeared in the infected subjects.Polyunsaturated fat intake showed significant positive correlations with the increasedliver enzymes in infected subjects. A principal components analysis indicated that, ininfected subjects, increased liver enzymes correlated with higher consumption ofmaize meal and lower consumption of meat and vegetables.Conclusions and recommendations: This survey indicated that asymptomatic HIV-infected subjects who followed a diet rich in animal foods had smaller decreases inserum albumin, haemoglobin and lipid variables, and smaller increases in liverenzymes, than those who consumed a diet based on staple foods. This suggests thatanimal foods are associated with improved nutritional status in HIV-infected persons.These results should be confirmed with intervention studies before dietaryrecommendations for asymptomatic HIV-infected individuals can be made.
KeywordsHIV/AIDS
AfricansDeveloping countries
DietNutritional status
Serum cholesterolHigh-density lipoprotein
cholesterolAlbumin
The global HIV/AIDS pandemic is assuming proportions
in sub-Saharan African countries that are threatening to
neutralise previous gains in health1, reducing life
expectancy in some of these countries to less than 40
years2, and paralysing health-care services and econom-
ies3. In South Africa, the prevalence of HIV infection was
based on anonymous testing of pregnant women
attending antenatal clinics for the first time over a selected
period4. The estimated prevalence rose from 7.6% in 1994
to 10.4% in 1995, 14.2% in 1996, 17.0% in 1997 and to
22.5% in 19984. The South African HIV household survey
in 2002 indicated that 11.4% of South Africans over the age
q The Authors 2004*Corresponding author: Email [email protected]
Public Health Nutrition: 7(8), 1055–1064 DOI: 10.1079/PHN2004643
of 2 years (4.5 million people) are living with HIV/AIDS5.
In a population of just under 40 million4, it is estimated that
in 1998 alone more than 100 000 children were orphaned
by AIDS-related deaths6, and that by the year 2010, 16% of
all South African children will be orphans, more than 70%
of whom will have been orphaned by AIDS5.
Due to economic constraints, in most sub-Saharan
African countries anti-retroviral therapy is beyond the
reach of all but a privileged few3, and in the past, emphasis
was on prevention strategies. In 2003, the South African
Government announced a comprehensive plan for the
care, management and treatment of people infected with
the virus and suffering from AIDS7. Optimising nutritional
status is a key objective in this plan7. Considering that free
anti-retroviral therapy will probably not be available for
some time and especially not for asymptomatic people,
the role of nutrition is important at this stage of the
infection. It is generally accepted that ‘optimum’ nutrition
could improve the quality of life of people living with HIV/
AIDS, that it may slow the progression of HIV infection to
AIDS and that it may improve tolerance to anti-retroviral
therapy8–15.
In rural Uganda, rates of all-cause mortality in HIV/AIDS
subjects are much higher and progression times to death
much shorter than in developed countries9. This could
possibly be related to poor nutritional status. There is an
established relationship of wasting10, micronutrient
deficiencies11 and oxidative stress12 with progression of
HIV/AIDS. The World Health Organization and the Food
and Agriculture Organization of the United Nations
recognised the importance of nutrition in people living
with HIV/AIDS and produced a manual on nutritional care
for infected people and caregivers16. This manual focuses
on practical advice, concentrating on local available foods,
beverages and spices. The manual recommends ‘healthy,
balanced’ nutrition with seven food-based messages:
enjoy a variety of foods; eat staple foods with each meal;
eat legumes if possible every day; eat animal and milk
products regularly; eat vegetables and fruit every day; use
fats and oils as well as sugar and sugary foods; drink plenty
of clean and safe water. These messages are compatible
with ‘adequate’ intakes of energy and micronutrients and
also with traditional staple foods, which will make the diet
affordable and acceptable, provided that household food
security is not compromised.
There are two major unanswered questions regarding
nutrition of HIV-infected people. The first is whether
‘optimal’ nutritional status will in fact delay the
progression of the disease and the second is what type
of diets (foods and combination of foods) will lead to
optimal nutrition status in infected people. There seems to
be circumstantial evidence7–15 that the first question can
be answered in the affirmative. It may be difficult to
answer the second question – ethical considerations in
conducting clinical trials with different diets in infected
subjects may be problematic. One way to seek an indirect
answer to this second question is to examine relationships
between dietary/nutrient intakes and nutritional status of
infected people in epidemiological studies. In this paper
we report on these relationships in 216 asymptomatic HIV-
infected subjects compared with 1550 uninfected subjects
who participated in the THUSA survey, conducted from
1996 and 1998 in the North West Province of South Africa.
Methods
Subjects and study design
‘Thusa’ is a Setswana word meaning help, and is also an
acronym for Transition and Health during Urbanisation of
South Africans. The main aim of the THUSA survey was to
monitor the impact of urbanisation on health determinants
of South Africans to provide information for appropriate
health interventions. The methods of sample selection, all
measurements and analyses have previously been
described17. Briefly, 1854 ‘apparently healthy’ African
volunteers, aged 15 years and older, were recruited from
37 randomly selected sites throughout the North West
Province. Subjects were stratified into five levels of
urbanisation, based on where they lived and type of
employment. For data analysis on HIV-infected and
uninfected subjects, subjects were grouped together, but
statistical analyses controlled for area of residence.
Pregnant and lactating women, subjects with any known
disease, those taking any form of chronic medication, with
oral temperature above 378C and inebriated subjects were
excluded. Complete data were available for 1817 subjects.
Measurements and biochemical analyses
Demographic information, health histories, psychological
profiles18 and dietary intake data19 were obtained during
individual interviews by specially trained, multilingual
fieldworkers in the language of the subject’s choice, using
questionnaires specially designed or adapted and vali-
dated for this population. A validated20 quantitative food-
frequency questionnaire was used to obtain habitual
dietary intake data. Nutrient intakes were calculated using
a programme based on the South African food compo-
sition tables21. Anthropometric measurements (height,
weight, body circumferences and skinfold thicknesses)
were measured in triplicate by post-graduate biokinetics
students, standardised by a level III anthropometrist. Two
experienced researchers measured blood pressures after
subjects have been seated for at least 10 min. Two
specially trained nursing sisters assessed clinical signs of
malnutrition. Fasting blood samples were drawn from the
vena cephalica using a sterile butterfly infusion set
(Johnson & Johnson; 21G, 19 mm) and sterile syringes,
after which a 2 hour glucose tolerance test was performed.
Serum, citrated and EDTA (ethylenediaminetetraacetic
acid) plasma were prepared immediately in the field using
a Universal 16Re Hettich centrifuge (Tuttlingen,
Germany) with cooling facilities. Haematocrit and
HH Vorster et al.1056
haemoglobin concentrations were determined in the field
on EDTA blood. Serum and plasma samples were stored in
Eppendorff tubes at 2208C in the field for 2–4 days and
later at 2848C in the laboratory. Serum proteins, minerals,
electrolytes, glucose, lipids and enzymes were determined
with the DAX system (discrete analyser, Technicon
DAX48; Miles Inc. Diagnostic Division, Tarrytown, NY,
USA). Serum insulin, vitamins A, B6, B12 and E, iron,
ferritin, transferrin and iron-binding capacity as well as
erythrocyte folate and urinary sodium and potassium were
determined with high-performance liquid chromatog-
raphy, immunological and colorimetric methods. Plasma
fibrinogen was measured with the Clauss method using
the ACL 200 (Instrumentation Laboratory, Milan, Italy)
system. HIV status was determined with an enzyme-
immunological method (Enzymum-Test, anti-HIV 1 þ 2 þ
subtype, catalogue no. 1557319; Boehringer Mannheim,
Mannheim, Germany). Appropriate standards were used
in all instances.
Statistical analysis
The data were analysed using the SPSS package (SPSS Inc.,
Chicago, IL, USA). Means, medians, standard deviations,
standard errors and 95% confidence intervals were
calculated. Data that were not normally distributed were
normalised by logarithmic transformation, or where
normalisation was not possible, data were analysed
using non-parametric statistical tests.
Analysis of variance adjusted for age, gender, area of
residence and year of study was used to compare
metabolic variables of HIV-infected and uninfected
subjects. Partial correlations, controlling for age, gender,
area of residence and year of study, were determined to
explore associations between nutrient intakes and
biochemical indicators of nutritional status. A principal
components analysis was used to derive a summary
measure of the relative importance of the foods measured
in the food-frequency questionnaire. This summary
measure was subsequently included in regression models
to provide an estimate of overall dietary patterns and
relationships with biochemical variables.
Data collections of the THUSA study were done in 1996
and 1998. To test if the two sets of data could be combined,
total reported energy intakes of women in the 1996 and
1998 datasets were compared. The mean intake of the
1996 group was 7973.7 kJ and that in the 1998 group was
7997.1 kJ, and it was judged that the two sets of data could
be combined.
Ethical considerations
The study was done with the full co-operation of the North
West Department of Health and Social Services and with
the permission of the various communities from which
subjects were recruited. It was also approved by the Ethics
Committee of Potchefstroom University (approval no.
4M5-95). All subjects were fully informed about the
objectives and procedures of the study in their home
language and all signed an informed consent form.
Illiterate people signed with a cross. After completion of
the study, additional approval from the same ethics
committee (but not from the subjects) was obtained to test
anonymously for HIV status. Subjects identified with
hypertension, diabetes mellitus and anaemia (who
complained of not feeling well) were referred to local
clinics, hospitals or their physicians. Subjects received
lunch after completion of the glucose tolerance test and
their travel expenses were paid. Volunteers who did not
meet the inclusion criteria were screened for hypertension
and diabetes mellitus and referred for treatment if
necessary. Subjects who requested HIV testing were
informed that this testing could be obtained from health
facilities with pre- and post-test counselling capacity.
Results
Table 1 shows that of these ‘apparently healthy’
asymptomatic subjects, 12.3% of the men and 11.5% of
the women tested HIV-positive. The highest rates were
seen in the 25–34.9-year-old groups. There was a
statistically significant increase in the percentage of
infected subjects from 1996 to 1998.
Table 2 compares the mean age, anthropometric indices
and blood pressures of HIV-infected and uninfected men
and women. The HIV-infected subjects were slightly but
significantly younger than the uninfected subjects. When
adjusted for age, gender, area of residence and year of
Table 1 Proportion of HIV-infected men and women by year ofstudy and age group
Gender, year andage group
Percentage(95% confidence interval)
MenBoth years 12.3 (10.2–14.8)1996 8.8 (6.2–12.3)*1998 15.2 (12.2–18.9)*Age group (years)
15–24.9 11.925–34.9 16.935–44.9 12.945–54.9 7.855–64.9 14.765 þ 7.3
WomenBoth years 11.5 (9.7–13.6)1996 8.1 (6.0–10.8)*1998 14.8 (12.1–18.0)*Age group (years)
15–24.9 13.925–34.9 14.735–44.9 10.745–54.9 8.455–64.9 7.665 þ 11.9
Adjusted for age, area of residence and year of study.* Significantly different (P # 0.05).
Nutritional status of asymptomatic HIV-infected Africans 1057
study, no significant difference in anthropometric vari-
ables and blood pressures was observed.
Table 3 lists all of the metabolic (biochemical) variables
that differed significantly, as well as those with no
significant differences, between HIV-infected and unin-
fected subjects when data were adjusted for age, gender,
area of residence and year of study. Haemoglobin levels of
the infected subjects were significantly lower, without
differences in the other iron status variables (serum iron,
ferritin, transferrin and iron-binding capacity). Total serum
protein and globulin were significantly higher while
albumin was significantly lower in infected subjects.
Plasma fibrinogen, a major acute-phase blood protein,
did not differ significantly. Total serum cholesterol,
Table 3 Variables that differed significantly and did not differ between HIV-infected and uninfected subjects
HIV-infected(n ¼ 212)
HIV-uninfected(n ¼ 1523)
Variable Mean* SE 95% CI Mean* SE 95% CI P-value†
Variables that differedBlood
Haematocrit (%) 41.4 0.32 40.7–41.9 43.1 0.12 42.9–43.3 0.000Haemoglobin (g l21) 12.4 0.14 12.2–12.7 12.8 0.05 12.7–12.9 0.029
SerumAlbumin (g l21) 41.3 0.30 40.6–41.7 43.6 0.11 43.4–43.8 0.000Globulin (g l21) 36.8 0.43 36.0–37.7 30.3 0.16 30.0–30.6 0.000Total protein (g l21) 78.1 0.46 77.0–78.8 73.8 0.17 73.5–74.1 0.000Total cholesterol (mmol l21) 3.90 0.07 3.78–4.05 4.17 0.03 4.12–4.22 0.000HDL-cholesterol (mmol l21) 1.09 0.02 1.04–1.13 1.19 0.01 1.17–1.21 0.000Triglycerides (mmol l21) 1.09 0.05 0.99–1.19 1.21 0.02 1.17–1.24 0.039ALT (IU l21) 15.6 1.0 14.0–17.7 12.2 0.4 11.5–12.9 0.000AST (IU l21) 31.7 2.4 27.1–36.3 22.1 0.9 20.4–23.8 0.000LD (IU l21) 140.4 2.3 135.9–144.9 132.5 0.9 130.8–134.2 0.001
Variables that did not differSerum
Sodium (mmol l21) 137.2 0.35 136.6–137.9 137.8 0.13 137.5–138.0 0.134Potassium (mmol l21) 3.9 0.03 3.9–4.1 3.9 0.01 3.9–4.0 0.973Chloride (mmol l21) 103.3 0.24 102.8–103.8 103.8 0.09 103.6–103.9 0.061Urea (mmol l21) 3.4 0.09 3.3–3.6 3.6 0.03 3.5–3.6 0.099Uric acid (mmol l21) 0.3 0.009 0.29–0.33 0.3 0.003 0.29–0.31 0.253Creatinine (mmol l21) 83.5 0.94 81.6–85.3 82.4 0.35 81.7–83.1 0.299Calcium (mmol l21) 2.3 0.006 2.3–2.3 2.3 0.002 2.3–2.3 0.537Magnesium (mmol l21) 0.83 0.006 0.82–0.84 0.84 0.002 0.83–0.84 0.119Iron (mmol l21) 16.4 0.59 15.2–17.6 16.9 0.222 16.5–17.4 0.407TIBC (mmol l21) 66.2 0.92 64.4–68.0 67.5 0.341 66.8–68.2 0.200% Iron saturation 25.9 0.98 24.1–27.9 25.9 0.36 25.2–26.6 0.965Ferritin (mg l21) 133.4 17.5 99–167.8 141.5 6.5 128.7–154.3 0.665Fibrinogen (g l21) 3.4 0.08 3.3–3.6 3.4 0.3 3.4–3.5 0.852Glucose (mmol l21) 4.7 0.115 4.5–4.9 4.8 0.042 4.6–4.9 0.408Vitamin A (mg dl21) 44.4 1.29 41.9–46.9 46.7 0.47 45.8–47.6 0.104Vitamin E (mg l21) 8.7 0.25 8.17–9.15 9.03 0.9 8.8–9.2 0.169
SE – standard error; CI – confidence interval; HDL – high-density lipoprotein; ALT – alanine aminotransferase; AST – aspartate amino-transferase; LD – lactate dehydrogenase; TIBC – total iron-binding capacity.* Estimated marginal mean.† Linear independent pairwise comparison adjusted for age, area of residence, year of study and gender.
Table 2 Comparison of mean (standard deviation) age, anthropometry and blood pressure of HIV-infected and uninfected menand women
Men Women
VariableHIV-infected
(n ¼ 97)HIV-uninfected
(n ¼ 654)HIV-infected
(n ¼ 119)HIV-uninfected
(n ¼ 896) Significance*†
Age (years) 35.1 (14.5) 37.7 (15.5) 34.8 (12.7) 38.2 (14.3) 0.002†95% confidence interval 32.2–38.1 35.5–38.9 32.5–37.1 37.3–39.1
Body mass index (kg m22) 20.1 (3.1) 21.2 (4.2) 26.1 (5.6) 27.0 (6.9) NS*Sum of seven skinfold thicknesses (mm) 64.8 (33.4) 70.7 (42.0) 115.1 (99.2) 96.0 (86.6) NS*Waist-to-hip ratio 0.85 (0.09) 0.84 (0.06) 0.76 (0.07) 0.76 (0.07)Systolic blood pressure (mmHg) 127.4 (16.7) 126.6 (16.8) 122.1 (16.6) 128.0 (22.2) NS*Diastolic blood pressure (mmHg) 77.4 (12.2) 77.1 (11.3) 77.0 (11.2) 78.8 (13.7) NS*
* Significant differences tested with linear independent pairwise comparison adjusting for age and gender. NS – not significant (P . 0.05).† Significant difference tested with t-test, adjusted for age, area of residence and year of study.
HH Vorster et al.1058
high-density lipoprotein (HDL)-cholesterol and triglycer-
ides were significantly lower in the infected subjects.
Three of the measured liver enzymes in serum, alanine
aminotransferase (ALT), aspartate aminotransferase (AST)
and lactate dehydrogenase (LD), were statistically signifi-
cantly higher in the infected subjects, reflecting tissue and
cell damage in these asymptomatic subjects. None of the
many other biochemical variables measured, including
several serum/plasma vitamin levels, differed significantly
between the two groups when controlled for age, gender,
year of the study and area of residence.
Table 4 presents mean nutrient intake data according to
HIV status and gender. There was no statistically
significant difference in mean nutrient intakes between
HIV-infected and uninfected subjects. Adjusting for age,
gender, area of residence and year of study made little
difference to the relationships seen for unadjusted male
and female data. Compared with dietary guidelines23, it
seems that all groups followed a ‘prudent’ diet with total
fat providing less than 26% of total energy. Based on US
recommended dietary allowances22 folate intake
appeared to be adequate, but mean intakes of most
other micronutrients were less than the recommended
dietary allowances. Although macronutrient intakes were
within the range considered desirable and prudent to
reduce risk of non-communicable chronic diseases, intake
of micronutrients was not adequate.
Table 5 shows significant partial correlations (controlled
for age, gender, year of study and area of residence) of
haemoglobin, serum albumin, AST and total cholesterol.
These variables were selected because of the significant
differences in mean values of infected and uninfected
subjects, and because the patterns of correlations in the
serum lipids were similar, as were those in the liver
enzymes. In the HIV-infected subjects, correlations were
generally higher; many of those observed in uninfected
subjects disappeared while a few new ones emerged.
Serum albumin in HIV-infected subjects showed a high
negative correlation with serum globulin (r ¼ 20.62,
P ¼ 0.001) and positive correlations with serum choles-
terol, HDL-cholesterol, haemoglobin, vitamins A and E, as
well as serum iron and total iron-binding capacity. Serum
albumin did not correlate with the liver enzymes in these
subjects. The latter correlated positively with each other
and with serum glucose. These liver enzymes, indicative of
cell damage and probably an inflammatory response, all
correlated positively with total dietary fat intake, and
specifically with polyunsaturated fat intake (correlations
of r ¼ þ0.21, þ0.22, þ0.41 and þ0.63, P # 0.005 with
alkaline phosphatase, g-glutamyl transferase, ALT and
AST, respectively).
A principal components analysis was used to summarise
dietary patterns. The first principal component (which
explained 13% of the variation) highlighted the contrast in
intakes between meat, fruit and vegetables in one
direction and the consumption of mainly staples (maize
meal): a high positive score reflected a diet higher in meat
and vegetable products, and a more negative score
reflected a diet higher in maize meal porridge and samp.
Table 6 presents the mean dietary score derived from this
first principal component for each third of the distribution
of AST for HIV-infected subjects only. This shows that
Table 4 Comparison of habitual mean (standard deviation) dietary intakes of HIV-infected and uninfected men and women
Men Women
VariableHIV-infected
(n ¼ 93)HIV-uninfected
(n ¼ 654)HIV-infected
(n ¼ 119)HIV-uninfected
(n ¼ 896)RDA23 and dietary
guidelines
Energy (kJ) 10 099 (4475) 9487 (3787) 8271 (3136) 7933 (3053)Plant protein (g) 39.6 (19.8) 36.4 (16.8) 32.5 (14.5) 30.6 (13.7)Animal protein (g) 28.4 (16.2) 29.6 (16.6) 26.2 (14.8) 26.9 (16.1)Total fat (g) 60.7 (28.8) 58.9 (26.7) 56.6 (27.9) 54.1 (25.6)P/S ratio 0.98 (0.50) 0.89 (0.36) 0.88 (0.38) 0.88 (0.37) 1.0Cholesterol (mg) 345 (258) 343 (225) 279 (191) 284 (204)Carbohydrate (g) 361 (162) 341 (153) 311 (131) 293 (131)Added sugar (g) 54.2 (41.8) 54.0 (47.4) 55.7 (47.9) 51.7 (47.6)Dietary fibre (g) 19.6 (10.5) 18.1 (9.1) 17.2 (8.2) 16.2 (7.5) 25–30Protein (% of energy) 11.8 (2.1) 12.0 (2.1) 11.6 (2.1) 11.9 (2.2) 10–15Fat (% of energy) 24.4 (7.2) 24.9 (7.6) 25.5 (7.0) 25.9 (7.5) ,30Carbohydrate (% of energy) 65.8 (9.3) 64.8 (9.9) 64.5 (9.4) 63.8 (10.0) .55Calcium (mg) 448 (248) 462 (271) 405 (213) 408 (246) 800–1200Magnesium (mg) 369 (212) 354 (178) 304 (129) 287 (126) 320–420Phosphorus (mg) 1214 (592) 1163 (484) 991 (367) 955 (375) 700Potassium (mg) 2282 (902) 2260 (905) 2124 (853) 2020 (793) –Sodium (mg) 1457 (980) 1348 (778) 1271 (701) 1232 (705) –Zinc (mg) 9.1 (4.3) 8.9 (3.8) 8.2 (3.4) 8.0 (3.5) 8–11Iron (mg) 9.1 (4.5) 9.2 (4.4) 8.9 (4.3) 8.5 (4.1) 10–15Vitamin A (RE) 763 (651) 696 (619) 741 (577) 764 (731) 800–1000Ascorbic acid (mg) 33.4 (31.8) 349 (35.5) 40.0 (46.7) 38.8 (42.0) 60Folate (mg) 237 (136) 221 (98.9) 197 (81) 182 (82) 150–200
RDA – US recommend dietary allowances in ranges for adult men and women; P/S ratio – ratio of polyunsaturated fat to saturated fat; RE– retinol equivalents.
Nutritional status of asymptomatic HIV-infected Africans 1059
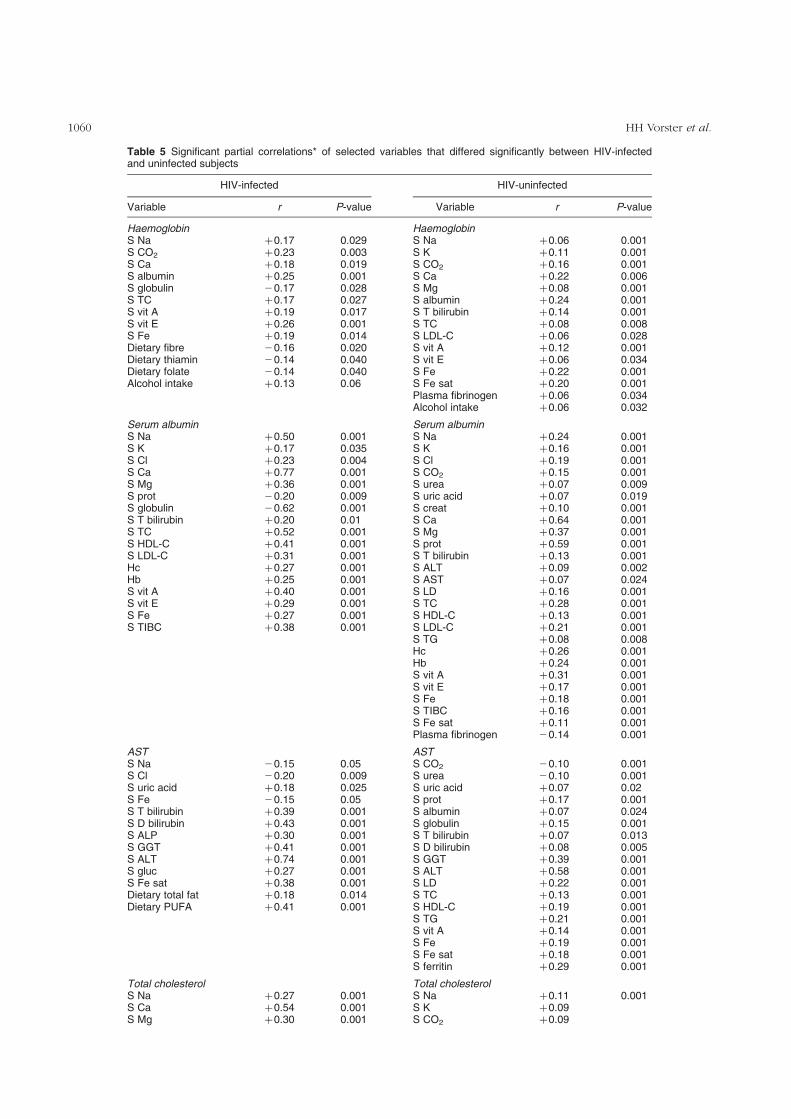
Table 5 Significant partial correlations* of selected variables that differed significantly between HIV-infectedand uninfected subjects
HIV-infected HIV-uninfected
Variable r P-value Variable r P-value
Haemoglobin HaemoglobinS Na þ0.17 0.029 S Na þ0.06 0.001S CO2 þ0.23 0.003 S K þ0.11 0.001S Ca þ0.18 0.019 S CO2 þ0.16 0.001S albumin þ0.25 0.001 S Ca þ0.22 0.006S globulin 20.17 0.028 S Mg þ0.08 0.001S TC þ0.17 0.027 S albumin þ0.24 0.001S vit A þ0.19 0.017 S T bilirubin þ0.14 0.001S vit E þ0.26 0.001 S TC þ0.08 0.008S Fe þ0.19 0.014 S LDL-C þ0.06 0.028Dietary fibre 20.16 0.020 S vit A þ0.12 0.001Dietary thiamin 20.14 0.040 S vit E þ0.06 0.034Dietary folate 20.14 0.040 S Fe þ0.22 0.001Alcohol intake þ0.13 0.06 S Fe sat þ0.20 0.001
Plasma fibrinogen þ0.06 0.034Alcohol intake þ0.06 0.032
Serum albumin Serum albuminS Na þ0.50 0.001 S Na þ0.24 0.001S K þ0.17 0.035 S K þ0.16 0.001S Cl þ0.23 0.004 S Cl þ0.19 0.001S Ca þ0.77 0.001 S CO2 þ0.15 0.001S Mg þ0.36 0.001 S urea þ0.07 0.009S prot 20.20 0.009 S uric acid þ0.07 0.019S globulin 20.62 0.001 S creat þ0.10 0.001S T bilirubin þ0.20 0.01 S Ca þ0.64 0.001S TC þ0.52 0.001 S Mg þ0.37 0.001S HDL-C þ0.41 0.001 S prot þ0.59 0.001S LDL-C þ0.31 0.001 S T bilirubin þ0.13 0.001Hc þ0.27 0.001 S ALT þ0.09 0.002Hb þ0.25 0.001 S AST þ0.07 0.024S vit A þ0.40 0.001 S LD þ0.16 0.001S vit E þ0.29 0.001 S TC þ0.28 0.001S Fe þ0.27 0.001 S HDL-C þ0.13 0.001S TIBC þ0.38 0.001 S LDL-C þ0.21 0.001
S TG þ0.08 0.008Hc þ0.26 0.001Hb þ0.24 0.001S vit A þ0.31 0.001S vit E þ0.17 0.001S Fe þ0.18 0.001S TIBC þ0.16 0.001S Fe sat þ0.11 0.001Plasma fibrinogen 20.14 0.001
AST ASTS Na 20.15 0.05 S CO2 20.10 0.001S Cl 20.20 0.009 S urea 20.10 0.001S uric acid þ0.18 0.025 S uric acid þ0.07 0.02S Fe 20.15 0.05 S prot þ0.17 0.001S T bilirubin þ0.39 0.001 S albumin þ0.07 0.024S D bilirubin þ0.43 0.001 S globulin þ0.15 0.001S ALP þ0.30 0.001 S T bilirubin þ0.07 0.013S GGT þ0.41 0.001 S D bilirubin þ0.08 0.005S ALT þ0.74 0.001 S GGT þ0.39 0.001S gluc þ0.27 0.001 S ALT þ0.58 0.001S Fe sat þ0.38 0.001 S LD þ0.22 0.001Dietary total fat þ0.18 0.014 S TC þ0.13 0.001Dietary PUFA þ0.41 0.001 S HDL-C þ0.19 0.001
S TG þ0.21 0.001S vit A þ0.14 0.001S Fe þ0.19 0.001S Fe sat þ0.18 0.001S ferritin þ0.29 0.001
Total cholesterol Total cholesterolS Na þ0.27 0.001 S Na þ0.11 0.001S Ca þ0.54 0.001 S K þ0.09S Mg þ0.30 0.001 S CO2 þ0.09
HH Vorster et al.1060
those subjects in the lowest third of AST had a statistically
significantly higher mean dietary score than subjects in the
middle and highest third of AST. There were also
statistically significant negative Spearman correlations
between each of the three liver enzymes (AST, LD, ALT)
and the diet score, suggesting that subjects with the
highest liver enzyme levels were more likely to have a diet
lower in meat and vegetables.
The dietary score was included in a regression model
together with other variables (such as gender, age, area of
residence) and HIV status, with albumin as the outcome
measure. Albumin was chosen as a marker of deterioration
in the metabolic profile. When controlling for all other
variables in the model, albumin rose by 2.52 g l21 from
HIV-uninfected to infected subjects; the effect of the first
principal component was statistically significant, even after
adjusting for the effects of all other variables in the model.
Table 7 shows the odds ratios and 95% confidence
intervals of albumin, globulin, AST and total cholesterol in
thirds for HIV-infected compared with HIV-uninfected
subjects, with the lowest third as reference category.
Discussion
The THUSA study was not designed to measure the
prevalence or incidence of HIV infection. The main
objective was to assess the impact of urbanisation on
health risks in ‘apparently healthy’, disease-free volun-
teers. The data on these 216 asymptomatic HIV-infected
subjects are nevertheless important because the nutritional
status and biochemical nutritional profile of these subjects,
compared with the rest of the HIV-uninfected study
population, may provide useful information for examining
appropriate, evidence-based dietary guidelines for HIV-
infected Africans.
The absence of significant differences between HIV-
infected and uninfected subjects in body mass index (BMI)
and total sum of skinfold thicknesses probably indicates
that the majority of the HIV-infected but asymptomatic
subjects were at an early stage of the infection. Weight loss
and wasting of HIV/AIDS result from diarrhoea and
malabsorption, increased nutrient requirements due to
infections, altered metabolism and decreased intakes12.
Kotler20 mentions that a decreased body cell mass is
observed early in HIV infection. It predates significant
immune suppression, indicating that the virus itself may be
involved. Body cell mass was not determined in this study,
but total fat percentage calculated from the seven skinfold
thicknesses did not differ significantly between infected
and uninfected subjects. Furthermore, there were virtually
no differences in mean nutrient intakes of HIV-infected
and uninfected subjects. The biochemical variables
Table 5 Continued
HIV-infected HIV-uninfected
Variable r P-value Variable r P-value
S albumin þ0.52 0.001 S urea þ0.11 0.001S globulin 20.26 0.001 S uric acid þ0.12 0.001S LD þ0.18 0.019 S creat þ0.12 0.001S HDL-C þ0.32 0.001 S Fe þ0.07S LDL-C þ0.88 0.001 S Ca þ0.29 0.001S TG þ0.27 0.001 S Mg þ0.14 0.001Hb þ0.17 0.027 S prot þ0.28 0.001S vit A þ0.25 0.001 S albumin þ0.27 0.001S vit E þ0.43 0.001 S globulin þ0.98 0.001S TIBC þ0.24 0.001 S GGT þ0.67Dietary saturated fat þ0.14 0.07 S ALT þ0.11 0.001S Ca þ0.15 0.05 S AST þ0.12 0.001
S LD þ0.13 0.001S HDL-C þ0.22 0.001S LDL-C þ0.91 0.001S TG þ0.33 0.001Hc þ0.11 0.001Hb þ0.078 0.088S gluc þ0.06 0.042S vit A þ0.24 0.001S vit E þ0.53 0.001S TIBC þ0.12 0.001Energy 20.06 0.025Plant protein 20.08 0.002Thiamin 20.055 0.043
S – serum; TC – total cholesterol; vit A – vitamin A; vit E – vitamin E; prot – protein; T bilirubin – total bilirubin; D bilirubin– direct (conjugated) bilirubin; HDL-C – high-density lipoprotein cholesterol; LDL-C – low-density lipoprotein cholesterol; Hc– haematocrit; Hb – haemoglobin; TIBC – total iron-binding capacity; ALP – alkaline phosphatase; GGT – g-glutamyl trans-ferase, gluc – glucose; Fe sat – % iron saturation; PUFA – polyunsaturated fatty acids; LD – lactate dehydrogenase; TG –triglycerides; creat – creatinine; ALT – alanine aminotransferase; AST – aspartate aminotransferase.* Controlled for age, gender, year of study and area of residence (urban, rural).
Nutritional status of asymptomatic HIV-infected Africans 1061
indicative of nutritional status that differed significantly
between the two groups (Table 3) could therefore reflect
early effects of the virus and the body’s responses to these
effects. The two acute-phase proteins measured, plasma
fibrinogen and serum ferritin, did not differ significantly
between groups, possibly indicating that the acute-phase
response was not operative in the HIV subjects. However,
early tissue damage and an inflammatory response were
probably present, revealed by the statistically significantly
higher ALT, AST and LD values, as well as the decreased
albumin levels of the infected persons. The significantly
lower haematocrit and haemoglobin levels of the HIV-
infected subjects were not accompanied by differences in
serum iron, ferritin, transferrin or total iron-binding
capacity. The early anaemia reported for HIV-infected
subjects seems therefore not to be dietary related. The
significant correlations between haemoglobin and albu-
min (r ¼ þ0.25, P ¼ 0.001), globulin (r ¼ 20.17,
P ¼ 0.028), serum vitamin A (r ¼ þ0.19, P ¼ 0.017),
vitamin E (r ¼ þ0.26, P ¼ 0.001) and iron (r ¼ þ0.19,
P ¼ 0.014) suggest, however, that maintaining an ‘optimal’
nutrition status and preventing a decrease in albumin may
be associated with higher levels of haemoglobin. The
mechanism remains obscure. It is intriguing that con-
sumption of dietary fibre showed a significant negative
correlation with haemoglobin in the infected subjects (the
other two correlates, thiamin and folate, may be related to
dietary fibre since they share similar food sources). This
suggests that consumption of foods rich in fibre may be
associated with lower haemoglobin values in HIV-infected
persons. The absence of decreases in serum iron and other
iron status variables argues against an inhibition of iron
absorption. At a later stage of the disease10,24 in African
patients who had BMI of 18.9 kg m22 (men) and
22.7 kg m22 (women)10, the decreased haematocrit and
haemoglobin values were accompanied by decreased
serum vitamin B12 and erythrocyte folate values24,
indicating a diet-induced anaemia.
Decreased serum albumin and increased globulin and
total protein levels have been found in HIV-infected
subjects and AIDS patients by several authors (reviewed
by Gramlich and Mascioli13). Although the HIV-infected
subjects in this study still had high albumin levels, their
mean level was significantly lower than that of non-
infected subjects, reflecting a possible decrease in
nutrition status, even at this early stage. Van Staden
et al.24 reported a positive correlation between serum
albumin and total serum cholesterol. This study
supports that observation. The relationship between
serum albumin and total cholesterol of r ¼ þ0.28
(P ¼ 0.001) in the HIV-uninfected subjects increased to
r ¼ þ0.52 (P ¼ 0.001) in the infected subjects (Table 5).
As in the case for haemoglobin, the significant positive
correlations of albumin with serum vitamins A and E,
serum iron and total iron-binding capacity suggest that
albumin levels will be higher in subjects with good
nutrition status.
The decreased total serum cholesterol observed in our
HIV-infected subjects was also reported by others25,26. As
for serum albumin12, there appears to be an association
between disease stage and serum cholesterol level25. The
decrease in cholesterol of the HIV-infected subjects was
accompanied by a decrease in HDL-cholesterol. Serum
glucose and insulin levels during the glucose tolerance
tests did not differ significantly between infected and
uninfected subjects. It therefore appears that the early
alterations in serum albumin and lipids are not insulin-
related. The reason for and mechanism of the observed
decreases in serum lipids at this early stage of HIV
infection, even before weight or other anthropometric
changes are present, are not clear. The correlates of total
serum cholesterol (Table 5) suggest that those infected
subjects with higher levels of albumin, serum vitamins A
and E and serum iron (therefore, with a ‘better’ nutrition
status) had less reductions in serum cholesterol. In the
infected subjects, the significant correlation between
consumption of saturated fat (from animal products) and
serum total cholesterol further suggests that in this
instance, a diet rich in animal products may be beneficial
in preventing this decrease.
The significant positive correlations between the
consumption of polyunsaturated fat and liver enzymes
(Table 5) may be an indication that these fatty acids
(mainly sunflower oil in the diets of the participating
subjects) should be limited in the diet of HIV-infected
persons. Although these subjects were on a relatively
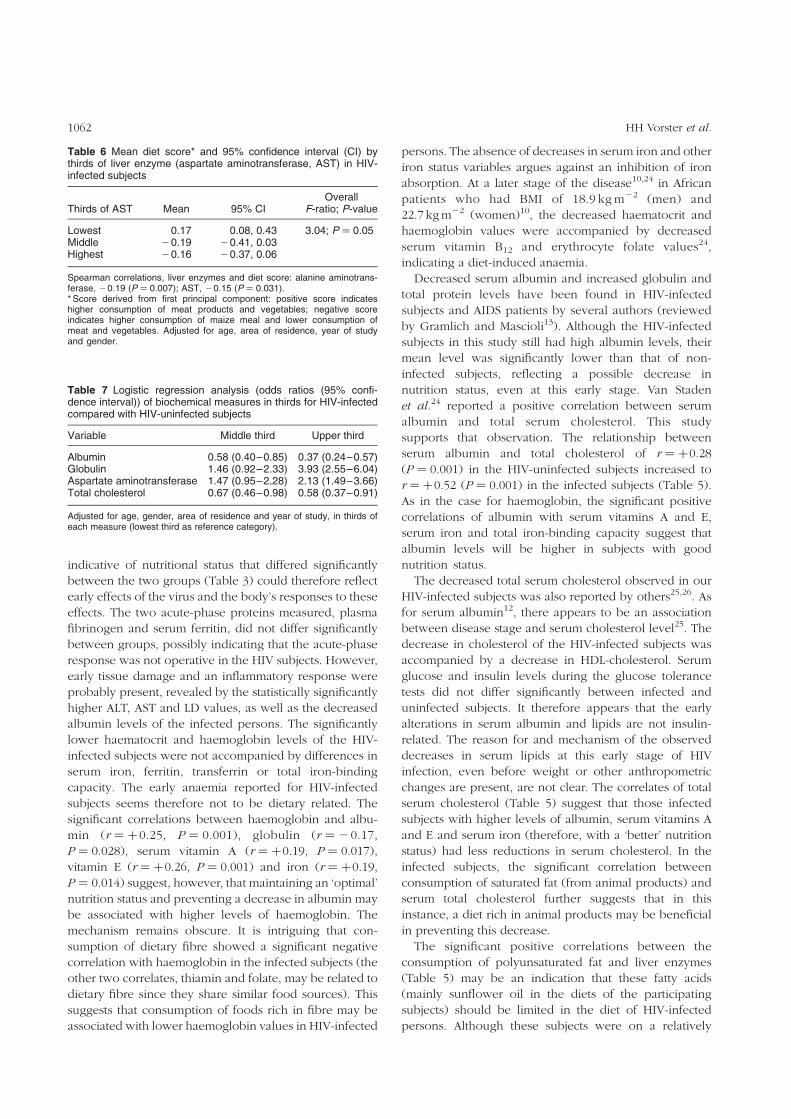
Table 6 Mean diet score* and 95% confidence interval (CI) bythirds of liver enzyme (aspartate aminotransferase, AST) in HIV-infected subjects
Thirds of AST Mean 95% CIOverall
F-ratio; P-value
Lowest 0.17 0.08, 0.43 3.04; P ¼ 0.05Middle 20.19 20.41, 0.03Highest 20.16 20.37, 0.06
Spearman correlations, liver enzymes and diet score: alanine aminotrans-ferase, 20.19 (P ¼ 0.007); AST, 20.15 (P ¼ 0.031).* Score derived from first principal component: positive score indicateshigher consumption of meat products and vegetables; negative scoreindicates higher consumption of maize meal and lower consumption ofmeat and vegetables. Adjusted for age, area of residence, year of studyand gender.
Table 7 Logistic regression analysis (odds ratios (95% confi-dence interval)) of biochemical measures in thirds for HIV-infectedcompared with HIV-uninfected subjects
Variable Middle third Upper third
Albumin 0.58 (0.40–0.85) 0.37 (0.24–0.57)Globulin 1.46 (0.92–2.33) 3.93 (2.55–6.04)Aspartate aminotransferase 1.47 (0.95–2.28) 2.13 (1.49–3.66)Total cholesterol 0.67 (0.46–0.98) 0.58 (0.37–0.91)
Adjusted for age, gender, area of residence and year of study, in thirds ofeach measure (lowest third as reference category).
HH Vorster et al.1062
low-fat (prudent) diet (see Table 3), the results suggest
that, even at this low level of fat intake, polyunsaturates
are associated with increased liver cell damage.
The question arises of whether the observed deterio-
ration in haemoglobin, albumin and serum lipids can be
prevented by a better diet. The THUSA subjects followed a
prudent, low-fat, high-carbohydrate diet, which was
micronutrient-deficient. The principal components anal-
ysis suggests that HIV-infected subjects who followed this
dietary pattern were more likely to have higher liver
enzyme levels, suggestive of early metabolic changes.
Those HIV-infected subjects who consumed a diet higher
in meat and vegetables were likely to have what might be
considered a ‘better’ metabolic state as indicated with
higher levels of the mentioned nutritional status variables.
It is not clear which nutrients might be responsible for
these associations. The intake of a number of nutrients
would be expected to differ between those on a diet
higher in meat (animal protein, saturated fat, riboflavin,
calcium, phosphorus, zinc), fresh fruits and vegetables
(ascorbic acid, magnesium, potassium) compared with a
diet based mainly on maize meal. In summary, Table 7
suggests that among those who are HIV-positive, those
with a diet score highlighting higher consumption of meat
and vegetables, in contrast with more maize-based diets,
had lower liver enzyme levels.
Is there a dietary pattern that might be optimal to reduce
the rate of progression of HIV/AIDS? The results of this
study suggest that there may be. The results indicated that
an ‘affluent, Western’ type of diet, different from the
prudent diet recommended for optimal health21,27, is
positively associated with metabolic variables known to
decrease in HIV-infected subjects proportionally to
disease stage12,25. Urgent research is necessary for a better
understanding of the early metabolic effects of HIV and
ways that diet can be used to reduce the impact of HIV
infection on health. This study gives an indication that
there is a need to acknowledge that what might be
considered a ‘healthy’ diet in the general population with a
low HIV/AIDS prevalence might not be optimal for a
population with a high incidence of HIV/AIDS. Should the
results of this study be confirmed by future research, it
could have a profound influence on the development of
dietary guidelines and possibly of food supplements for
populations with high HIV/AIDS prevalence. It is
suggested that the possible ‘protective’ effect of a diet
containing sufficient amounts of meat, fruit and veg-
etables, rather than of mainly maize-based staple foods,
should be examined in HIV-infected subjects.
Acknowledgements
The THUSA study was funded by grants from the National
Research Foundation, South African Medical Research
Council, South African Sugar Association, The Dry Bean
Producers Organization and Potchefstroom University.
References
1 Joint United Nations Programme on HIV/AIDS (UNAIDS).AIDS Epidemic Update: December 1998. Geneva: WorldHealth Organization, 1998.
2 Foster G. Today’s children – challenges to child healthpromotion in countries with severe AIDS epidemics. AIDSCare 1998; 10(1): S17–S23.
3 Fauci AS. The AIDS epidemic. Considerations for the 21stcentury. New England Journal of Medicine 1999; 341(14):1046–50.
4 Anon. Health and related indicators. In: Ntuli A, ed. SouthAfrican Health Review 1998. Durban: Health Systems Trust,1998; 203–15.
5 Day C, Gray A. Health and related indicators. In: Ijumba P,Ntuli A, Barron P, eds. South African Health Review 2002.Durban: Health Systems Trust, 2002; 411–533.
6 North West Province Department of Health. Results of theHIV sero-prevalence survey of women attending antenatalclinics in the North West Province, 1998. Mmabatho:Department of Health, North West Province of South Africa,1999; 1–11.
7 South African Government Department of Health. HIV andAIDS Care, Management and Treatment for South Africa[online], 2003. Available at: http://www.gov.za/reports/2003/aidsplan/report.pdf. Accessed 8 March 2004.
8 South African Government Department of Health. SouthAfrican National Guidelines on Nutrition for People livingwith TB, HIV/AIDS and Other Chronic DebilitatingConditions. Pretoria: Department of Health, South Africa,2001; 1–28.
9 Morgan D, Maude GH, Malamba SS, Okongo MJ, Wagner H-U, Mulde D, et al. HIV-1 disease progression and AIDS-defining disorders in rural Uganda. Lancet 1997; 350:245–50.
10 Macallan DC. Wasting in HIV infection and AIDS. Journal ofNutrition 1999; 129(Suppl. 1S): 238S–42S.
11 Dannhauser A, Van Staden AM, Van der Ryst E, Nel M, MaraisN, Erasmus E, et al. Nutritional status of HIV-1 seropositivepatients in the Free State Province of South Africa:anthropometric and dietary profile. European Journal ofClinical Nutrition 1999; 53: 165–73.
12 Romero-Alvira D, Roche E. The keys of oxidative stress inacquired immune deficiency syndrome apoptosis. MedicalHypotheses 1998; 51(2): 169–73.
13 Gramlich LM, Mascioli EA. Nutrition and HIV infection[Review]. Journal of Nutritional Biochemistry 1995; 6: 2–11.
14 Moscardini C, Tonger-Decker R, Ostroski MB. Nutritionalneeds in the AIDS patients. Recognizing and treating wastingsyndrome. Advance for Nurse Practitioners 1997; 5(6): 34–7.
15 Casey KM. Malnutrition associated with HIV/AIDS. Part two:Assessment and interventions. Journal of the Association ofNurses in AIDS Care 1997; 8(5): 9–48.
16 World Health Organization/Food and Agriculture Organiz-ation of the United Nations (FAO). Living Well withHIV/AIDS. A Manual on Nutritional Care and Support forPeople living with HIV/AIDS. Rome: FAO, 2002; 1–97.
17 Vorster HH, Wissing MP, Venter CS, Kruger HS, Kruger A,Malan NT, et al. The impact of urbanisation on physical andmental health of South Africans in the Northwest Province ofSouth Africa: the THUSA study. South African Journal ofScience 2000; 96: 505–14.
18 Wissing M, Thekiso S, Stapelberg R, van Quickelberge L,Choabi P, Moroeng C, et al. The psychometric properties ofscales measuring psychological well-being in an Africangroup. Presented at International Africa Psychology Con-gress, Durban, South Africa, 18–23 July 1999.
19 MacIntyre UE, Venter CS, Vorster HH. A culture-sensitivequantitative food frequency questionnaire used in an African
Nutritional status of asymptomatic HIV-infected Africans 1063
population: 1. Development and reproducibility. PublicHealth Nutrition 2000; 4(1): 53–62.
20 Kotler DP. Management of nutritional alterations and issuesconcerning quality of life. Journal of Acquired ImmuneDeficiency Syndromes and Human Retrovirology 1997;16(Suppl. 1): S30–5.
21 Langenhoven M, Kruger M, Gouws E, Faber M. MRC FoodComposition Tables, 3rd ed. Parow: Medical ResearchCouncil, 1991; 245.
22 Food and Nutrition Board, National Research Council,National Academy of Sciences. Recommended DietaryAllowances, 10th ed. Washington, DC: National AcademyPress, 1989.
23 James WPT. Policy and a prudent diet. In: Garrow JS, JamesWPT, Ralph A, eds. Human Nutrition and Dietetics, 9th ed.London: Churchill Livingstone, 1993; 767–75.
24 Van Staden AM, Barnard HC, Nel M, Attwood EM,Oosthuizen GM, Dannhauser A, et al. Nutritional status ofHIV-1 seropositive patients in the Free State Province ofSouth Africa. Central African Journal of Medicine 1998;44(10): 246–50.
25 Constans J, Peuchant E, Pellegrin JL, Sergeant C, Hamon C,Duboury L, et al. Fatty acids and plasma antioxidants in HIV-positive patients: correlation with nutritional and immuno-logical status. Clinical Biochemistry 1995; 28: 421–6.
26 Anes WA, Warrier R, Lybanon JI, Sharma R. Plasmanutritional changes antedate AIDS in hemophiliacs. ClinicalResearch 1989; 37: 467A.
27 Grunfeld C. Metabolic mechanisms for wasting in AIDS. In:Proceedings of the Second Annual Nutrition and AIDSConference, Stanford University, Palo Alto, CA, USA, 1989;13–6.
HH Vorster et al.1064
Copyright © 2022 FDOKUMEN