The nature and distribution of bottom simulating reflectors at the Costa Rican convergent margin
11
The nature and distribution of bottom simulating re£ectors at the Costa Rican convergent margin Ingo A. Pecher, 1, * Cesar R. Ranero, 1 Roland von Huene, 1 Timothy A. Minshull 2 and Satish C. Singh 3 1 GEOMAR, University of Kiel, Wischhofstrasse 1-3, 24148 Kiel, Germany 2 Bullard Laboratories, Department of Earth Sciences, University of Cambridge, Madingley Road, Cambridge, CB3 0EZ, UK 3 BIRPS, Bullard Laboratories, Department of Earth Sciences, University of Cambridge, Madingley Road, Cambridge, CB3 0EZ, UK Accepted 1997 October 10. Received 1997 October 10; in original form 1996 September 18 SUMMARY Bottom simulating re£ectors (BSRs) at the base of the hydrate stability zone are often observed in marine seismic re£ection data. The compressional (P-)wave velocity structure of a BSR o¡shore Costa Rica was analysed by applying a full-waveform inversion technique. The resulting velocity pro¢le indicates that the BSR is caused by a thin low-velocity layer, suggesting the presence of at least a small amount of free gas in the sediment pore space. In undisturbed sediment sections, BSRs o¡shore Costa Rica are observed over much of the continental margin. They frequently occur at shallow depths beneath the sea£oor, usually *100^400 m; at some locations BSRs appear to intersect the sea£oor. This was interpreted as an indication that hydrates in the study area form partly from methane which was produced beneath the hydrate stability zone and migrated upwards. In the study area, the vertical movement of the hydrate stability zone relative to a given point in the sediment column, one of the potential factors leading to BSR formation or suppression, is controlled by both sedimentation and vertical tectonism. Both processes may hence play a role in controlling BSR distri- bution. BSRs are absent in areas which have been a¡ected by slumping, except where the sedimentary section above the BSR remained intact during slumping. This indicates that slope failure can cause the destruction of BSRs. Key words: convergent margins, Costa Rica, methane hydrates, seismic re£ections, waveform inversion. 1 INTRODUCTION Gas hydrates are crystalline structures of water molecules surrounding hydrate-forming gas, which in sediment is mostly methane. Methane hydrates are stable in the Earth in perma- frost regions at low temperatures and moderate pressures (continental hydrates) and in deep-sea sediments at moderate temperatures and higher pressures (oceanic hydrates). The signi¢cance of methane hydrates is mainly the large amount of methane assumed to be stored in gas hydrates. Kvenvolden (1988) estimated that natural hydrates contain about twice as much carbon as all fossil fuels. The base of the hydrate stability zone (BHSZ) could represent a zone of weakness within the sediment column (e.g. Booth, Winters & Dillon 1994), methane released from hydrates might play a role in global warming and deglaciation (e.g. Paull, Ussler & Dillon 1991) and methane hydrates form a potential energy reservoir (e.g. Kvenvolden 1993). Bottom simulating re£ectors (BSRs) are commonly believed to mark the base of hydrate-bearing sediments. They are characterized by a negative polarity compared to the sea- £oor re£ection indicating a decrease in seismic impedance and hence most probably velocity: density is not expected to be a¡ected signi¢cantly by the presence of hydrates or gas in sediments. A negative velocity contrast at the BHSZ might be explained by the partial replacement of pore water by solid hydrates in sediments within the hydrate stability zone (HSZ), possibly causing a velocity increase in the bulk sediment. In addition, free gas might be trapped at the BHSZ because the permeability of sediments is believed to be decreased by hydrates. Replacing part of the pore water with free gas leads to a sharp drop in compressional-wave velocity (V p ) (Domenico 1977) and might contribute signi¢cantly to the observed negative impedance contrast. * Now at: Woods Hole Oceanographic Institution, Department of Geology and Geophysics, Woods Hole, MA 02543, USA. E-mail: [email protected] Geophys. J. Int. (1998) 133, 219^229 ß 1998 RAS 219 GJI000 21/4/98 06:58:40 3B2 version 5.20 The Charlesworth Group, Huddersfield 01484 517077 by guest on July 24, 2016 http://gji.oxfordjournals.org/ Downloaded from
-
Upload
independent -
Category
Documents
-
view
2 -
download
0
Transcript of The nature and distribution of bottom simulating reflectors at the Costa Rican convergent margin
The nature and distribution of bottom simulating re£ectors at theCosta Rican convergent margin
Ingo A. Pecher,1,* Cesar R. Ranero,1 Roland vonHuene,1 Timothy A.Minshull 2
and Satish C. Singh 3
1GEOMAR, University of Kiel, Wischhofstrasse 1-3, 24148 Kiel, Germany2Bullard Laboratories, Department of Earth Sciences, University of Cambridge, Madingley Road, Cambridge, CB3 0EZ, UK3BIRPS, Bullard Laboratories, Department of Earth Sciences, University of Cambridge, Madingley Road, Cambridge, CB3 0EZ, UK
Accepted 1997 October 10. Received 1997 October 10; in original form 1996 September 18
SUMMARYBottom simulating re£ectors (BSRs) at the base of the hydrate stability zone areoften observed in marine seismic re£ection data. The compressional (P-)wave velocitystructure of a BSR o¡shore Costa Rica was analysed by applying a full-waveforminversion technique. The resulting velocity pro¢le indicates that the BSR is caused by athin low-velocity layer, suggesting the presence of at least a small amount of free gas inthe sediment pore space. In undisturbed sediment sections, BSRs o¡shore Costa Ricaare observed over much of the continental margin. They frequently occur at shallowdepths beneath the sea£oor, usually *100^400 m; at some locations BSRs appear tointersect the sea£oor. This was interpreted as an indication that hydrates in the studyarea form partly from methane which was produced beneath the hydrate stability zoneand migrated upwards. In the study area, the vertical movement of the hydrate stabilityzone relative to a given point in the sediment column, one of the potential factorsleading to BSR formation or suppression, is controlled by both sedimentation andvertical tectonism. Both processes may hence play a role in controlling BSR distri-bution. BSRs are absent in areas which have been a¡ected by slumping, except wherethe sedimentary section above the BSR remained intact during slumping. This indicatesthat slope failure can cause the destruction of BSRs.
Key words: convergent margins, Costa Rica, methane hydrates, seismic re£ections,waveform inversion.
1 INTRODUCTION
Gas hydrates are crystalline structures of water moleculessurrounding hydrate-forming gas, which in sediment is mostlymethane. Methane hydrates are stable in the Earth in perma-frost regions at low temperatures and moderate pressures(continental hydrates) and in deep-sea sediments at moderatetemperatures and higher pressures (oceanic hydrates). Thesigni¢cance of methane hydrates is mainly the large amount ofmethane assumed to be stored in gas hydrates. Kvenvolden(1988) estimated that natural hydrates contain about twice asmuch carbon as all fossil fuels. The base of the hydrate stabilityzone (BHSZ) could represent a zone of weakness within thesediment column (e.g. Booth,Winters & Dillon 1994), methanereleased from hydrates might play a role in global warming and
deglaciation (e.g. Paull, Ussler & Dillon 1991) and methanehydrates form a potential energy reservoir (e.g. Kvenvolden1993).Bottom simulating re£ectors (BSRs) are commonly believed
to mark the base of hydrate-bearing sediments. They arecharacterized by a negative polarity compared to the sea-£oor re£ection indicating a decrease in seismic impedance andhence most probably velocity: density is not expected to bea¡ected signi¢cantly by the presence of hydrates or gas insediments. A negative velocity contrast at the BHSZ mightbe explained by the partial replacement of pore water by solidhydrates in sediments within the hydrate stability zone (HSZ),possibly causing a velocity increase in the bulk sediment.In addition, free gas might be trapped at the BHSZ becausethe permeability of sediments is believed to be decreasedby hydrates. Replacing part of the pore water with free gasleads to a sharp drop in compressional-wave velocity (Vp)(Domenico 1977) and might contribute signi¢cantly to theobserved negative impedance contrast.
*Now at: Woods Hole Oceanographic Institution, Departmentof Geology and Geophysics, Woods Hole, MA 02543, USA.E-mail: [email protected]
Geophys. J. Int. (1998) 133, 219^229
ß 1998 RAS 219
GJI000 21/4/98 06:58:40 3B2 version 5.20The Charlesworth Group, Huddersfield 01484 517077
by guest on July 24, 2016http://gji.oxfordjournals.org/
Dow
nloaded from
It is usually impossible to resolve the base of a possiblefree-gas zone at BSRs by applying conventional processingtechniques such as deconvolution to standard re£ectionseismic data, that is data with a frequency range of approxi-mately 5^50 Hz. Full-waveform inversion has proved to be areliable method for investigating the velocity structure ofBSRs: Vp pro¢les obtained from vertical seismic pro¢ling dataat Ocean Drilling Program (ODP) Site 889 (MacKay et al.1994) matched well with earlier results from waveforminversion (Singh, Minshull & Spence 1993; Singh & Minshull1994).The occurrence of BSRs in seismic re£ection data is one of
the most important indications of the presence of gas hydratesin marine sediments. However, hydrate commonly occurs inareas where no BSRs are observed (e.g. von Huene et al. 1985).A better understanding of the conditions required for thepresence of BSRs in addition to hydrate occurrence is thereforedesirable in order to constrain the quantity of hydrates presentin submarine sediments better.Seismic data from o¡shore Costa Rica obtained in 1992
(Table 1) south of Nicoya and Osa Peninsula frequently displayBSRs. We studied their nature by applying the full-waveforminversion method used by Singh, Minshull & Spence (1993) andinvestigated the distribution of BSRs in the study area.
2 GEOLOGICAL SETTING
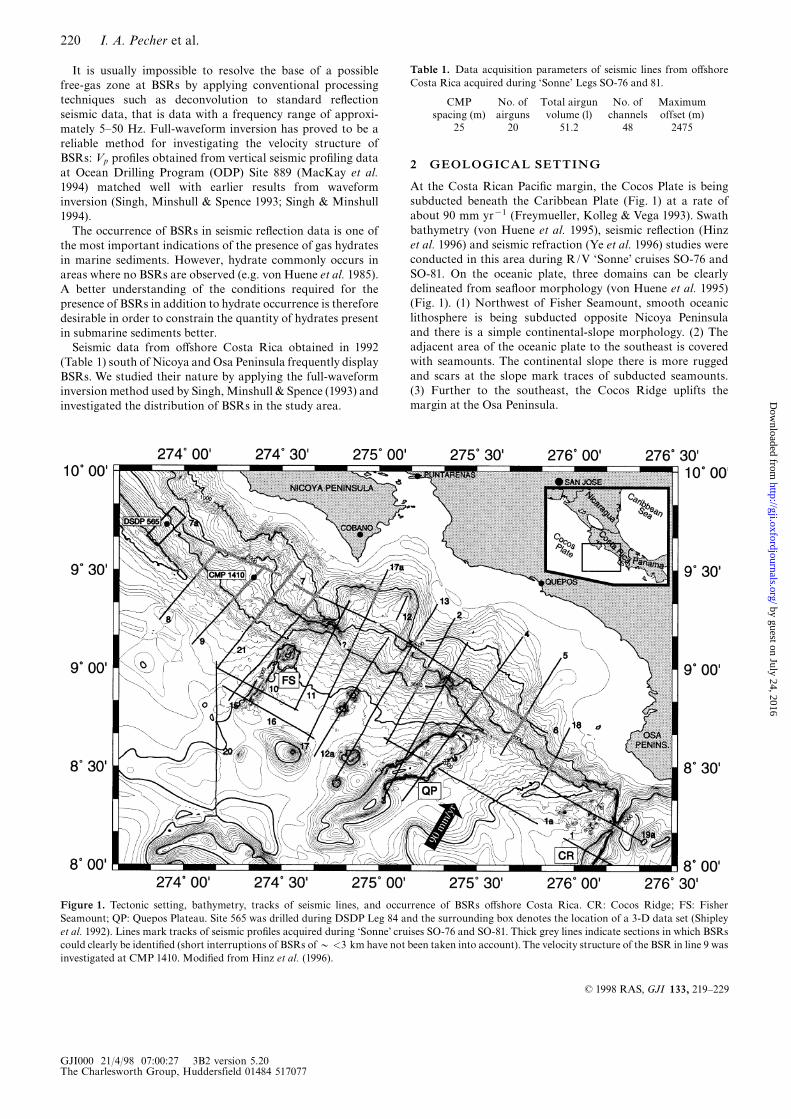
At the Costa Rican Paci¢c margin, the Cocos Plate is beingsubducted beneath the Caribbean Plate (Fig. 1) at a rate ofabout 90 mm yr{1 (Freymueller, Kolleg & Vega 1993). Swathbathymetry (von Huene et al. 1995), seismic re£ection (Hinzet al. 1996) and seismic refraction (Ye et al. 1996) studies wereconducted in this area during R/V `Sonne' cruises SO-76 andSO-81. On the oceanic plate, three domains can be clearlydelineated from sea£oor morphology (von Huene et al. 1995)(Fig. 1). (1) Northwest of Fisher Seamount, smooth oceaniclithosphere is being subducted opposite Nicoya Peninsulaand there is a simple continental-slope morphology. (2) Theadjacent area of the oceanic plate to the southeast is coveredwith seamounts. The continental slope there is more ruggedand scars at the slope mark traces of subducted seamounts.(3) Further to the southeast, the Cocos Ridge uplifts themargin at the Osa Peninsula.
Figure 1. Tectonic setting, bathymetry, tracks of seismic lines, and occurrence of BSRs o¡shore Costa Rica. CR: Cocos Ridge; FS: FisherSeamount; QP: Quepos Plateau. Site 565 was drilled during DSDP Leg 84 and the surrounding box denotes the location of a 3-D data set (Shipleyet al. 1992). Lines mark tracks of seismic pro¢les acquired during `Sonne' cruises SO-76 and SO-81. Thick grey lines indicate sections in which BSRscould clearly be identi¢ed (short interruptions of BSRs of* <3 km have not been taken into account). The velocity structure of the BSR in line 9 wasinvestigated at CMP 1410. Modi¢ed from Hinz et al. (1996).
Table 1. Data acquisition parameters of seismic lines from o¡shoreCosta Rica acquired during `Sonne' Legs SO-76 and 81.
CMP No: of Total airgun No: of Maximumspacing (m) airguns volume (l) channels offset (m)
25 20 51:2 48 2475
GJI000 21/4/98 07:00:27 3B2 version 5.20The Charlesworth Group, Huddersfield 01484 517077
ß 1998 RAS, GJI 133, 219^229
220 I. A. Pecher et al.
by guest on July 24, 2016http://gji.oxfordjournals.org/
Dow
nloaded from

The crustal structure is characterized by several unitsdescribed below, which have been consistently observed alongthe entire margin in seismic re£ection and refraction data(Hinz et al. 1996; Ye et al. 1996). Seismic line 9, locatednorthwest of Fisher Seamount, and relatively close to DSDPSite 565, displays all these crustal units (Fig. 2). The top of theigneous oceanic crust is identi¢ed as a strong re£ector at whichthe seismic character changes from subhorizontal, relativelycontinuous horizons of the basal sediment layer to di¡usere£ections. This boundary can be traced far beneath theaccretionary complex. Three main seismic units characterizethe middle and upper slope (von Huene & Flueh 1994). (1) Theslope sediments extend from the sea£oor down to the so-called`rough surface' (Shipley et al. 1992). (2) The margin wedgeis a unit from the rough surface down to a sequence of sub-horizontal layered re£ections. Preliminary results of OceanDrilling Program Leg 170 indicate that the seawardmost edgeof this unit is composed of Miocene breccias containing somefragments of ophiolitic material, similar to those found in theNicoya ophiolitic complex onshore. The scienti¢c party of Leg170 concluded that this margin wedge appears to have a¤nitieswith onshore geology (Kimura et al. 1998). (3) A unit of layeredhigh-amplitude re£ections, delineating the location of the plate
boundary, is interpreted as subducted sediments (Hinz et al.1996).Pleistocene sediment accumulation (uncorrected for com-
paction) was measured as 77 m in 0.47 Myr at DSDP Site 565(von Huene et al. 1985). Organic carbon at this site was 0.5^1.7per cent (Kvenvolden & McDonald 1985). Concentrationof C1=C2 (methane/ethane) in hydrocarbon gases suggesteda mainly microbial source for the formation of methane,although a general downward increase of higher-molecular-weight hydrocarbons indicated additional lower-temperaturediagenetic production at greater depths (Kvenvolden &McDonald 1985). Gas hydrates were recovered at Site 565 at285 and 319 mbsf as white, ice-like pieces that bubbled. Theamount of C1 was more than 30 times higher than its solubilityunder in situ conditions. C1=C2 was 2000 (Kvenvolden &McDonald 1985), again indicating a mainly biogenic source ofmethane. Close to the position of this hydrate sample, gas-releasing muddy sandstone was recovered, which probablycontained hydrates. Chlorinity pro¢les displayed a decreasefrom the sea£oor to the bottom of the hole from 1.9 to 1.4 percent, which was attributed to pore-water freshening caused byhydrate dissociation during core recovery (von Huene et al.1985).
Figure 2. Post-stack depth-migrated section re-stretched to time of the landward part of Costa Rica line 9. CMP spacing is 25 m, AGC (automaticgain control) window is 1 s. The interpretation followed Hinz et al. (1996). The dashed line indicates the landward termination of the accretionarywedge. CMPs 1410 and 2160 are referred to in the text.
GJI000 21/4/98 07:00:39 3B2 version 5.20The Charlesworth Group, Huddersfield 01484 517077
ß 1998 RAS,GJI 133, 219^229
221Bottom simulating re£ectors at the Costa Rican margin
by guest on July 24, 2016http://gji.oxfordjournals.org/
Dow
nloaded from

3 DATA ANALYSIS
Common midpoint (CMP) 1410 in Costa Rica line 9 wasselected as suitable for studying the ¢ne velocity structure byapplying the 1-D full-waveform inversion technique becauseboth the BSR and the sea£oor are subhorizontal and relativelycontinuous at this location. The primary and the ¢rst multiplere£ections from the sea£oor were compared in order to testwhether the sea£oor can be regarded as a single horizon ratherthan a series of closely spaced re£ectors. For this purpose,we stacked 20 near-o¡set traces and extracted primary andmultiple signals. After applying a scaling factor compensatingfor the sea£oor re£ection coe¤cient (Rsf ), the re£ectioncoe¤cient of {1 at the air/water boundary and geometricalspreading, both signals had a similar shape (Fig. 3). Thisindicates that the seismic signal was re£ected at a singlehorizon. Some di¡erences in later parts of primary andmultiple signals may be attributed to noise or to primaryarrivals from deeper layers which interfere with the multiplefrom the sea£oor. A value of 0:14 was obtained for Rsf bycomparing peak-to-peak amplitudes of primary and multiplere£ections (e.g. Warner 1990).CMPs 1410 and 1411 were merged in order to obtain a
CMP supergather which contains all shot^receiver o¡sets(hereafter, we refer to it as CMP 1410). Amplitudes variedsigni¢cantly within CMP gather 1410, probably owing todi¡erences in receiver sensitivities. Therefore, we recoveredamplitudes using a deterministic approach. Energies of there£ection from the sea£oor were determined for each trace in a200 ms window. The theoretical energy-versus-o¡set functionof the sea£oor re£ection was computed taking into accountgeometrical spreading, directivities and amplitude-versus-o¡set (AVO) dependence of the sea£oor (Sheri¡ & Geldart1982). Correction factors were computed for each trace inorder to match the theoretical energy-versus-o¡set perform-ance. This factor was applied to the whole trace. The validity ofthis approach had previously been tested using a data set froma di¡erent region (Peru), which did not display strong ampli-tude variations between adjacent traces. On this data set,
the theoretical energy-versus-o¡set function matched wellthe energy-versus-o¡set behaviour of the data (Pecher 1995).Fig. 4 shows the pre-processed CMP supergather.This data set was transformed into the intercept time^
slowness (q, p) domain using an exact Radon transform(Chapman 1981), modi¢ed by Korenaga et al. (1997). Thisdata set was used to determine the long-wavelength velocityfunction. For the waveform inversion, the data were Fouriertransformed into the frequency^slowness (u, p) domain anddirectivity corrected (Sheri¡ & Geldart 1983). According todepth sensors, the streamer was about 10 m shallower at nearand far o¡sets than at mid-ranges.Variations in streamer depthlead to di¡erent shapes of the recorded source signal, which is asuperposition of the upgoing signal and the ghost signalre£ected at the water/air interface. Streamer depth wasrelatively constant at 40 m for receivers corresponding top~0:06{0:20 s km{1.We therefore did not use the lowest andhighest slownesses of the (q, p) gather.Because the sea£oor consists of a single horizon, the source
wavelet was extracted by stacking traces in the (q, p) gather in awindow around the sea£oor after correcting for water velocity.Di¡erences in travel-path lengths between re£ections andreceiver ghosts increase with o¡set, leading to tuning e¡ects inthe composite signal at the streamer. These tuning e¡ects wereaveraged out by using stacked (q, p)-transformed traces overthe whole range of slownesses.
3.1 Starting velocity model
Waveform inversion aims to optimize a seismic model of thesubsurface such that the sample-by-sample mis¢t betweensynthetic data, computed from the model, and real data is
Figure 3. Primary (left) and multiple (right) signal from the sea£oorafter stacking 20 near-o¡set traces around CMP 1410. The multiplesignal was multiplied by {1 and scaled such that peak-to-peakamplitudes from both primary and multiple are approximately thesame.
Figure 4. CMP 1410 supergather. Refer to text for details aboutprocessing. No AGC. A broad bandpass ¢lter of 5^80 Hz was appliedto eliminate high-frequency noise. A 50 Hz noise peak had to besuppressed in trace 20 (1050 m o¡set), to which therefore a 5^45 Hzbandpass was applied. The resulting di¡erent shape of the waveformdoes not a¡ect the inversion much since the waveform inversion wasperformed in the frequency domain: `waveforms' in the frequencydomain di¡er only in that trace 20 lacks frequencies above 50 Hz.
GJI000 21/4/98 07:00:50 3B2 version 5.20The Charlesworth Group, Huddersfield 01484 517077
ß 1998 RAS, GJI 133, 219^229
222 I. A. Pecher et al.
by guest on July 24, 2016http://gji.oxfordjournals.org/
Dow
nloaded from
minimized. A good long-wavelength seismic starting velocitymodel is required to ensure that the inversion ¢nds the globalminimum of the mis¢t function rather than converging to alocal minimum. We determined a long-wavelength velocitymodel by applying a traveltime inversion scheme to the (q, p)gather. An optimum model of interval velocities of the watercolumn, the layer between the sea£oor and the BSR, and alayer beneath the BSR was obtained by a combination of aglobal grid search, a Monte Carlo inversion and a Simplexoptimization (e.g. Singh & Minshull 1994).An interval velocity model obtained from the Monte Carlo
inversion cannot be used as a long-wavelength starting modelfor the waveform inversion. Sharp (i.e. high-wavenumber)velocity contrasts in particular at the BSR would introduceartefacts and cause the waveform inversion to converge toa local minimum of the mis¢t function. Interval velocitieswere therefore ¢rst transformed into a gradient model in sucha manner that (1) vertical traveltime between two pickedhorizons was kept constant, and (2) there was no velocitycontrast at the sea£oor; the sea£oor re£ection is produced by achange in density (e.g. Pecher et al. 1996).
The velocity gradient, which was required to match thetraveltime constraint (1) between the sea£oor and the BSRunder assumption (2), that Vp at the sea£oor is the same as Vp
in the water column, resulted in Vp at the BSR being slightlyhigher than the interval velocity beneath it. If starting with thisvalue for Vp at the top of the layer beneath the BSR, a negativevelocity gradient would be required in this layer in order toful¢l assumption (1). A negative velocity gradient over a largerdepth interval, however, was not a reasonable large-scalestarting velocity model for a marine sediment column. Wetherefore modi¢ed this approach such that velocity increaseslinearly with depth until it reaches the velocity value inthe interval beneath the BSR at a certain depth zi above theBSR. Below zi, Vp is kept constant. zi was obtained usinga linear search algorithm in order to match the traveltimeassumption.Assumption (2) was justi¢ed by the results from DSDP Site
565. In order to produce the re£ection coe¤cientRsf~0:14, thedensity of the sea£oor was computed as 1.37 g cm{3. Thiscompares well with *1.35^1.40 g cm{3 measured in coresfrom Site 565 in the ¢rst few metres beneath the sea£oor. Vp inthese cores was measured as *1.50^1.55 km s{1 compared to1.46 km s{1 used in our starting model.Density (o), shear-wave velocity (Vs) and seismic quality
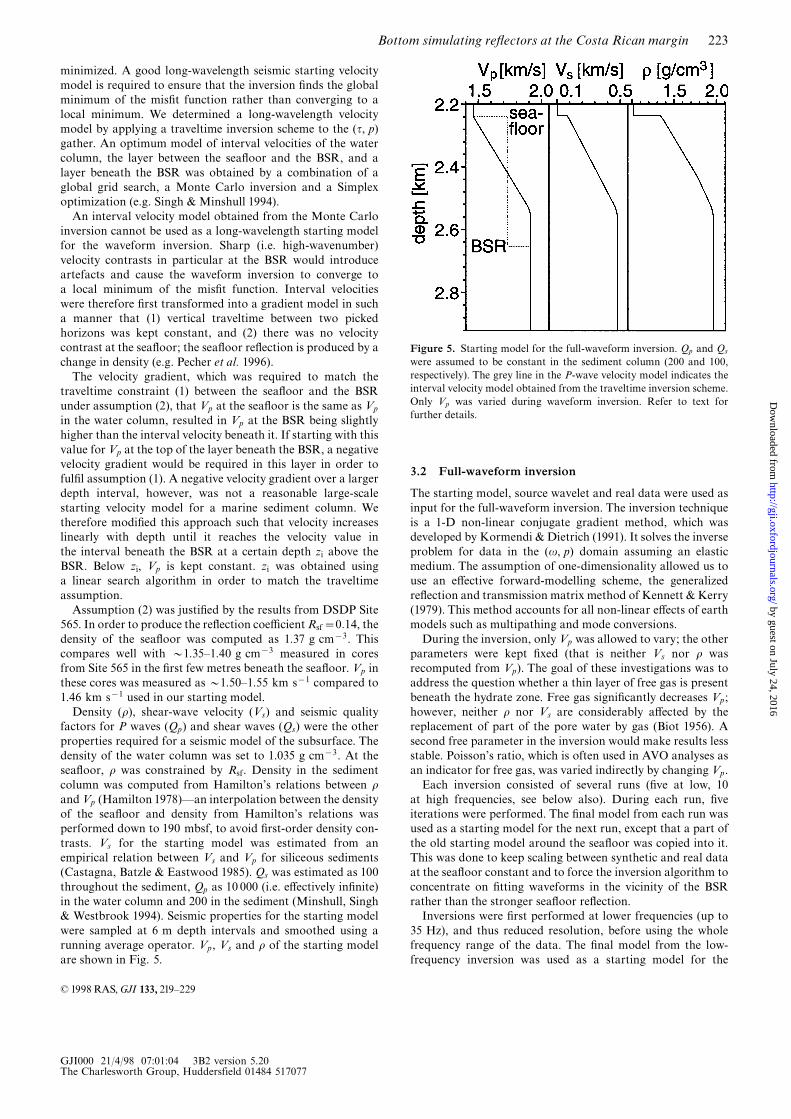
factors for P waves (Qp) and shear waves (Qs) were the otherproperties required for a seismic model of the subsurface. Thedensity of the water column was set to 1.035 g cm{3. At thesea£oor, o was constrained by Rsf. Density in the sedimentcolumn was computed from Hamilton's relations between oand Vp (Hamilton 1978)öan interpolation between the densityof the sea£oor and density from Hamilton's relations wasperformed down to 190 mbsf, to avoid ¢rst-order density con-trasts. Vs for the starting model was estimated from anempirical relation between Vs and Vp for siliceous sediments(Castagna, Batzle & Eastwood 1985). Qs was estimated as 100throughout the sediment, Qp as 10 000 (i.e. e¡ectively in¢nite)in the water column and 200 in the sediment (Minshull, Singh& Westbrook 1994). Seismic properties for the starting modelwere sampled at 6 m depth intervals and smoothed using arunning average operator. Vp, Vs and o of the starting modelare shown in Fig. 5.
3.2 Full-waveform inversion
The starting model, source wavelet and real data were used asinput for the full-waveform inversion. The inversion techniqueis a 1-D non-linear conjugate gradient method, which wasdeveloped by Kormendi & Dietrich (1991). It solves the inverseproblem for data in the (u, p) domain assuming an elasticmedium. The assumption of one-dimensionality allowed us touse an e¡ective forward-modelling scheme, the generalizedre£ection and transmission matrix method of Kennett & Kerry(1979). This method accounts for all non-linear e¡ects of earthmodels such as multipathing and mode conversions.During the inversion, only Vp was allowed to vary; the other
parameters were kept ¢xed (that is neither Vs nor o wasrecomputed from Vp). The goal of these investigations was toaddress the question whether a thin layer of free gas is presentbeneath the hydrate zone. Free gas signi¢cantly decreases Vp;however, neither o nor Vs are considerably a¡ected by thereplacement of part of the pore water by gas (Biot 1956). Asecond free parameter in the inversion would make results lessstable. Poisson's ratio, which is often used in AVO analyses asan indicator for free gas, was varied indirectly by changing Vp.Each inversion consisted of several runs (¢ve at low, 10
at high frequencies, see below also). During each run, ¢veiterations were performed. The ¢nal model from each run wasused as a starting model for the next run, except that a part ofthe old starting model around the sea£oor was copied into it.This was done to keep scaling between synthetic and real dataat the sea£oor constant and to force the inversion algorithm toconcentrate on ¢tting waveforms in the vicinity of the BSRrather than the stronger sea£oor re£ection.Inversions were ¢rst performed at lower frequencies (up to
35 Hz), and thus reduced resolution, before using the wholefrequency range of the data. The ¢nal model from the low-frequency inversion was used as a starting model for the
Figure 5. Starting model for the full-waveform inversion. Qp and Qs
were assumed to be constant in the sediment column (200 and 100,respectively). The grey line in the P-wave velocity model indicates theinterval velocity model obtained from the traveltime inversion scheme.Only Vp was varied during waveform inversion. Refer to text forfurther details.
GJI000 21/4/98 07:01:04 3B2 version 5.20The Charlesworth Group, Huddersfield 01484 517077
ß 1998 RAS,GJI 133, 219^229
223Bottom simulating re£ectors at the Costa Rican margin
by guest on July 24, 2016http://gji.oxfordjournals.org/
Dow
nloaded from
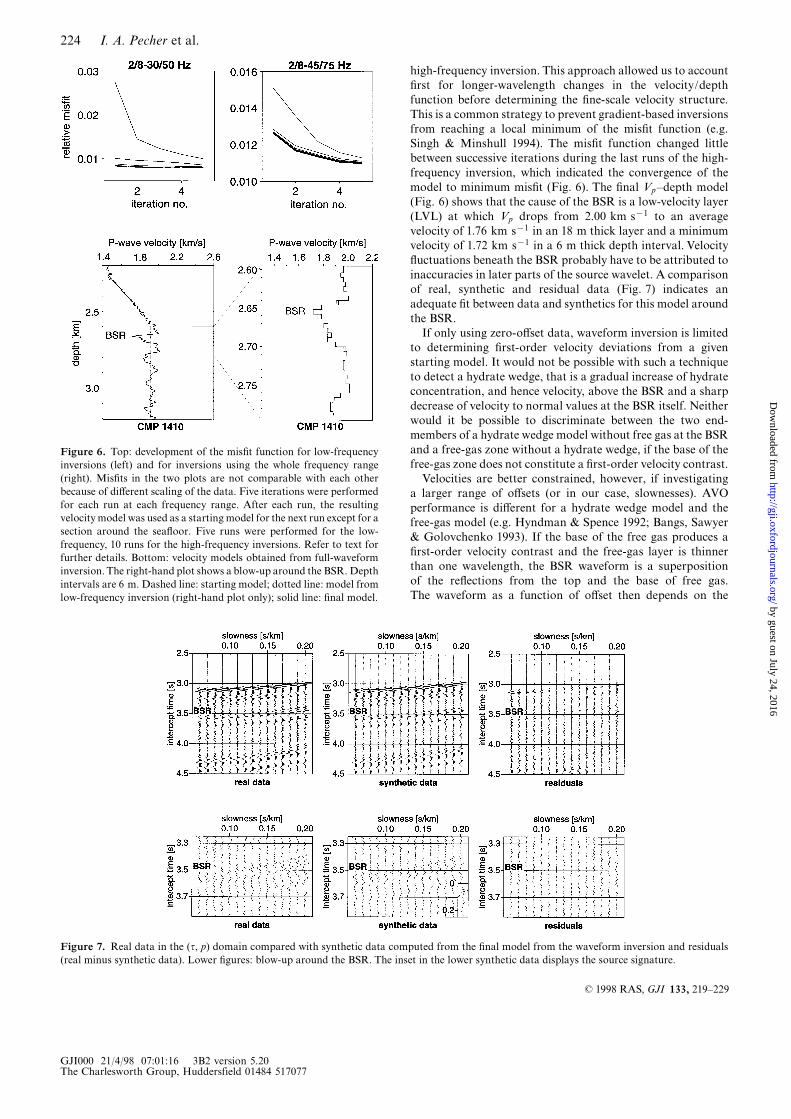
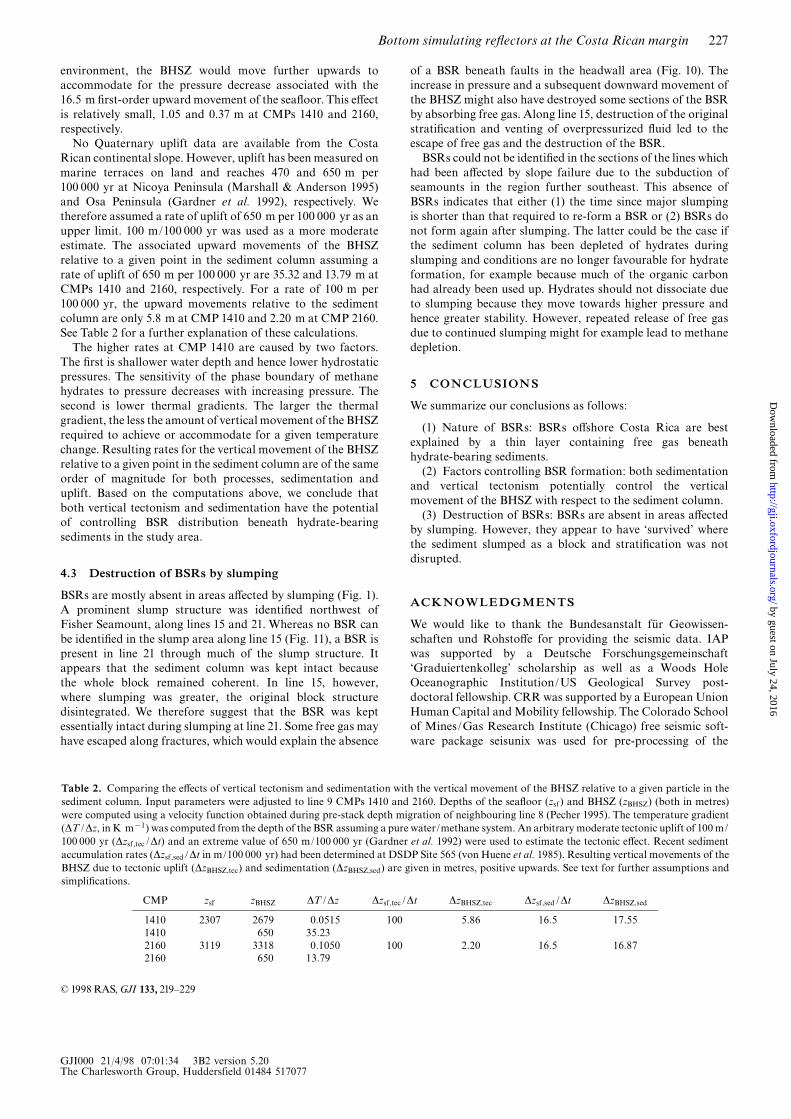
high-frequency inversion. This approach allowed us to account¢rst for longer-wavelength changes in the velocity/depthfunction before determining the ¢ne-scale velocity structure.This is a common strategy to prevent gradient-based inversionsfrom reaching a local minimum of the mis¢t function (e.g.Singh & Minshull 1994). The mis¢t function changed littlebetween successive iterations during the last runs of the high-frequency inversion, which indicated the convergence of themodel to minimum mis¢t (Fig. 6). The ¢nal Vp^depth model(Fig. 6) shows that the cause of the BSR is a low-velocity layer(LVL) at which Vp drops from 2.00 km s{1 to an averagevelocity of 1.76 km s{1 in an 18 m thick layer and a minimumvelocity of 1.72 km s{1 in a 6 m thick depth interval. Velocity£uctuations beneath the BSR probably have to be attributed toinaccuracies in later parts of the source wavelet. A comparisonof real, synthetic and residual data (Fig. 7) indicates anadequate ¢t between data and synthetics for this model aroundthe BSR.If only using zero-o¡set data, waveform inversion is limited
to determining ¢rst-order velocity deviations from a givenstarting model. It would not be possible with such a techniqueto detect a hydrate wedge, that is a gradual increase of hydrateconcentration, and hence velocity, above the BSR and a sharpdecrease of velocity to normal values at the BSR itself. Neitherwould it be possible to discriminate between the two end-members of a hydrate wedge model without free gas at the BSRand a free-gas zone without a hydrate wedge, if the base of thefree-gas zone does not constitute a ¢rst-order velocity contrast.Velocities are better constrained, however, if investigating
a larger range of o¡sets (or in our case, slownesses). AVOperformance is di¡erent for a hydrate wedge model and thefree-gas model (e.g. Hyndman & Spence 1992; Bangs, Sawyer& Golovchenko 1993). If the base of the free gas produces a¢rst-order velocity contrast and the free-gas layer is thinnerthan one wavelength, the BSR waveform is a superpositionof the re£ections from the top and the base of free gas.The waveform as a function of o¡set then depends on the
Figure 6. Top: development of the mis¢t function for low-frequencyinversions (left) and for inversions using the whole frequency range(right). Mis¢ts in the two plots are not comparable with each otherbecause of di¡erent scaling of the data. Five iterations were performedfor each run at each frequency range. After each run, the resultingvelocitymodel was used as a starting model for the next run except for asection around the sea£oor. Five runs were performed for the low-frequency, 10 runs for the high-frequency inversions. Refer to text forfurther details. Bottom: velocity models obtained from full-waveforminversion. The right-hand plot shows a blow-up around the BSR. Depthintervals are 6 m. Dashed line: starting model; dotted line: model fromlow-frequency inversion (right-hand plot only); solid line: ¢nal model.
Figure 7. Real data in the (q, p) domain compared with synthetic data computed from the ¢nal model from the waveform inversion and residuals(real minus synthetic data). Lower ¢gures: blow-up around the BSR. The inset in the lower synthetic data displays the source signature.
GJI000 21/4/98 07:01:16 3B2 version 5.20The Charlesworth Group, Huddersfield 01484 517077
ß 1998 RAS, GJI 133, 219^229
224 I. A. Pecher et al.
by guest on July 24, 2016http://gji.oxfordjournals.org/
Dow
nloaded from

o¡set-dependent changes of travel-path lengths in the free-gas zone, and hence the absolute velocity in the gas layerrather than velocities relative to the starting model. The full-waveform inversion scheme applied for our analysis accountsfor both amplitude and waveform versus o¡set. The robustnessof this approach with respect to a given starting model wasproved by tests performed by Minshull et al. (1994) and Singh& Minshull (1994). They demonstrated on data from Cascadiaand o¡shore Colombia that full-waveform inversion resultedin a low-velocity layer even if a hydrate wedge model was usedas a starting model. The low-velocity model for the Cascadiadata was later con¢rmed by drilling. In both cases, however,part of the BSR re£ection was caused by elevated velocitiesabove. We therefore conclude that most probably a thin low-velocity layer is present at the BSR o¡shore Costa Rica, but itis not possible to quantify how much of the BSR re£ectivitymay be attributed to elevated velocities above the BSR.Inaccuracies in the assumed source wavelet constitute a
possible pitfall for waveform inversion. The data set wastherefore inverted again to test whether such inaccuraciesconsiderably a¡ect resulting velocities at the BSR. For thispurpose, a `synthetic' source wavelet, a combination of twoRicker wavelets, which have about the same main frequency asthe data-derived source wavelet, was used. The second Rickerwavelet, which corresponds to the ghost signal from the water/air interface, was superimposed on the ¢rst wavelet with aslight delay according to the depth of the streamer. Theresulting velocity pro¢le is plotted in Fig. 8, together with theresults from the inversion using the data-derived sourcewavelet. The structure at the BSR did not change much, butundulations beneath it are stronger. A second LVL about100 m beneath the BSR is caused by the lack of a bubble signalin the `synthetic' source wavelet.We conclude that there is strong evidence that the BSR
is caused by a thin LVL beneath the hydrate stabilityzone. Although the resulting velocity values themselves, of>1.7 km s{1, do not unambiguously predict free gas, wesuggest that the best reasonable explanation for a thin LVL atthe BHSZ is the presence of at least a small amount of free
gas. The amount of free gas is di¤cult to constrain, mainlybecause of the strongly non-linear dependence of Vp on gasconcentration (Domenico 1977). Our results are in line withmost other studies of highly re£ective BSRs worldwide (e.g.Minshull et al. 1996).
4 DISTRIBUTION OF BSRS
BSRs are widespread in the study area (Fig. 1). Northwest ofFisher Seamount and southeast of Quepos Plateau, BSRsextend almost continuously from the upper slope down nearlyto the trench axis. Fig. 9 shows the landward end of line 21,which coincides with the landward termination of the BSR.The BSR approaches the sea£oor at this location. At thetrenchward side of this line, the BSR starts at the decollement(Fig. 10). The otherwise very continuous BSR along line 21 isinterrupted only in a short section across a slump headwall,which will be discussed later in the text. The BSR is absentalong line 15 between about the 2000 m isobath and the trench,in an area of a huge slump (von Huene et al. 1995). BetweenFisher Seamount and Quepos Plateau, the slope appears to beindented by the subduction of a swath of seamounts. Whereslope failures in the trailing wake of subducted seamounts arepresent, there are no BSRs (e.g. lines 2, 3, 11 and 13).
4.1 Methane supply for gas-hydrate formation
Methane of biogenic origin for hydrate formation could besupplied from below the HSZ or it could be formed in situ.The former process requires transportation of methaneupwards into the HSZ, the latter requires a biogenic methaneproduction rate su¤ciently high to produce the minimumconcentration of methane to form gas hydrates. It is commonlyassumed that gas hydrates in nature form from methane in thevapour phase (e.g. Sloan 1990), although recently some studieshave suggested that there is evidence that hydrates may formfrom dissolved methane (e.g. Hyndman & Davis 1992; Brownet al. 1996). The formation of hydrates from the gas phasemeans that the minimum amount of CH4 to allow hydrate
Figure 8. Upper left: source wavelet derived from the data comparedwith the `synthetic' source wavelet. Lower left: corresponding ampli-tude spectra. Right: comparison of velocity models in the vicinity of theBSR obtained from full-waveform inversion using the data-derivedsource wavelet (dotted line) and the `synthetic' source wavelet (solidline).
Figure 9. Post-stack time-migrated section of line 21 at its landwardend, which coincides with the landward termination of the BSR. TheBSR almost intersects the sea£oor. Scaling, CMP distance and AGCwindow are as in line 9 (Fig. 2).
GJI000 21/4/98 07:01:20 3B2 version 5.20The Charlesworth Group, Huddersfield 01484 517077
ß 1998 RAS,GJI 133, 219^229
225Bottom simulating re£ectors at the Costa Rican margin
by guest on July 24, 2016http://gji.oxfordjournals.org/
Dow
nloaded from

formation is the amount that is soluble in water. Paull, Ussler& Borowski (1994) demonstrated that for the Blake Ridge areawith a HSZ extending down to*600 mbsf, it would be hard toform su¤cient methane in situ to explain hydrate occurrenceswithin the HSZ.BSRs o¡ Costa Rica are shallower, mostly*100^400 mbsf.
The observation of shallow BSRs (and hence hydrate occur-rences above a BHSZ at shallow depths beneath the sea£oor)may indicate that part of the methane supplied for hydrateformation is produced beneath the HSZ: production ofmethane in the sediment column with time (and hence depthbeneath the sea£oor) would have to be very high to supplyenough in situ methane to exceed the solubility of methane inthe pore water at shallow depths beneath the sea£oor. The highsedimentation rate in this region supports this suggestion,because this would result in a relatively short time betweendeposition of sediment and burial beneath the BHSZ. As aconsequence, methane would have to be transported upwards,dissolved in pore £uids or as gas bubbles, perhaps alongwith uprising £uids. This would suggest a link between £uidexpulsion and hydrate formation: high expulsion rates ofmethane-rich £uids or gas bubbles which migrate along with£uids would mean a high supply of methane for hydrateformation. A lack of suitable geochemical data, however,makes it impossible for us to constrain quantitatively methaneproduction rates in the study area. It should also be cautionedthat the whole picture of gas-hydrate and free-gas formationwould change considerably if hydrates can form fromsubsaturated £uids.
4.2 Enhancement/suppression of BSR formation:vertical movement of the BHSZ
An upward movement of the BHSZ relative to a given point ina hydrate-bearing sediment column is expected to lead to adissociation of gas hydrates which would release methane gasand thus cause an enhancement of the BSR. A downward
movement, on the other hand, may suppress the formation ofBSRs by absorbing existing gas into the hydrate stabilityzone, thus reducing the sharpness of the velocity contrastbetween hydrate-bearing sediments and the underlying sedi-ment column. Hence, BSR occurrence o¡shore Costa Ricamight be controlled by small-scale tectonism, as suggested forsome areas at the Peruvian margin (Pecher et al. 1996).Tectonic uplift of the entire sediment column leads to a
decrease in pressure, a shift of hydrate stability towardslower temperatures and subsequently an upward movement ofthe BHSZ relative to the sea£oor (and hence any sedimentparticle) towards lower temperatures. Sedimentation, becauseof its insulating e¡ect, leads to an upward movement ofisotherms and hence an upward movement of the BHSZrelative to a given point in the sediment column. Subsidenceand erosion on the other hand would shift the BHSZ down-wards. We quanti¢ed the possible e¡ects of these processes(uplift/subsidence and erosion/deposition) by comparing thepresent depth of the BHSZ with the hypothetical depth ofthe BHSZ 100 000 yr ago using the following assumptions andsimpli¢cations: (1) no compaction of the sediment column;(2) no isostatic response to the increased sediment load;(3) no pressure corrections for changing sea levels during iceages; (4) constant thermal gradient both in depth (that isconstant thermal conductivity of the sediment) and in time(that is steady-state heat £ux); (5) hydrostatic pressure; and(6) a pure water/methane system. The input parameters wereadjusted to match the predicted conditions at CMPs 1410 and2160 along line 9 (Fig. 2). Temperatures were determined usinga thermal gradient computed from the depth of the BSR and abottom water temperature of 2 0C.Recent sedimentation at Site 565 was measured as 77 m in
0.47 Myr, corresponding to 16.5 m per 100 000 yr (von Hueneet al. 1985). Accordingly, isotherms should be shifted upwardsby the same rate. This would lead to a ¢rst-order upwardmovement of the BHSZ relative to a given sediment particleof 16.5 m in the past 100 000 yr. Assuming a stable tectonic
Figure 10. Post-stack time-migrated section of the seaward part of Costa Rica line 21. Scaling, CMP spacing and AGC window are as in line 9(Fig. 2). The interpretation followed Hinz et al. (1996). The BSR has `survived' a large slump.
GJI000 21/4/98 07:01:31 3B2 version 5.20The Charlesworth Group, Huddersfield 01484 517077
ß 1998 RAS, GJI 133, 219^229
226 I. A. Pecher et al.
by guest on July 24, 2016http://gji.oxfordjournals.org/
Dow
nloaded from
environment, the BHSZ would move further upwards toaccommodate for the pressure decrease associated with the16.5 m ¢rst-order upward movement of the sea£oor. This e¡ectis relatively small, 1.05 and 0.37 m at CMPs 1410 and 2160,respectively.No Quaternary uplift data are available from the Costa
Rican continental slope. However, uplift has been measured onmarine terraces on land and reaches 470 and 650 m per100 000 yr at Nicoya Peninsula (Marshall & Anderson 1995)and Osa Peninsula (Gardner et al. 1992), respectively. Wetherefore assumed a rate of uplift of 650 m per 100 000 yr as anupper limit. 100 m/100 000 yr was used as a more moderateestimate. The associated upward movements of the BHSZrelative to a given point in the sediment column assuming arate of uplift of 650 m per 100 000 yr are 35.32 and 13.79 m atCMPs 1410 and 2160, respectively. For a rate of 100 m per100 000 yr, the upward movements relative to the sedimentcolumn are only 5.8 m at CMP 1410 and 2.20 m at CMP 2160.See Table 2 for a further explanation of these calculations.The higher rates at CMP 1410 are caused by two factors.
The ¢rst is shallower water depth and hence lower hydrostaticpressures. The sensitivity of the phase boundary of methanehydrates to pressure decreases with increasing pressure. Thesecond is lower thermal gradients. The larger the thermalgradient, the less the amount of vertical movement of the BHSZrequired to achieve or accommodate for a given temperaturechange. Resulting rates for the vertical movement of the BHSZrelative to a given point in the sediment column are of the sameorder of magnitude for both processes, sedimentation anduplift. Based on the computations above, we conclude thatboth vertical tectonism and sedimentation have the potentialof controlling BSR distribution beneath hydrate-bearingsediments in the study area.
4.3 Destruction of BSRs by slumping
BSRs are mostly absent in areas a¡ected by slumping (Fig. 1).A prominent slump structure was identi¢ed northwest ofFisher Seamount, along lines 15 and 21. Whereas no BSR canbe identi¢ed in the slump area along line 15 (Fig. 11), a BSR ispresent in line 21 through much of the slump structure. Itappears that the sediment column was kept intact becausethe whole block remained coherent. In line 15, however,where slumping was greater, the original block structuredisintegrated. We therefore suggest that the BSR was keptessentially intact during slumping at line 21. Some free gas mayhave escaped along fractures, which would explain the absence
of a BSR beneath faults in the headwall area (Fig. 10). Theincrease in pressure and a subsequent downward movement ofthe BHSZ might also have destroyed some sections of the BSRby absorbing free gas. Along line 15, destruction of the originalstrati¢cation and venting of overpressurized £uid led to theescape of free gas and the destruction of the BSR.BSRs could not be identi¢ed in the sections of the lines which
had been a¡ected by slope failure due to the subduction ofseamounts in the region further southeast. This absence ofBSRs indicates that either (1) the time since major slumpingis shorter than that required to re-form a BSR or (2) BSRs donot form again after slumping. The latter could be the case ifthe sediment column has been depleted of hydrates duringslumping and conditions are no longer favourable for hydrateformation, for example because much of the organic carbonhad already been used up. Hydrates should not dissociate dueto slumping because they move towards higher pressure andhence greater stability. However, repeated release of free gasdue to continued slumping might for example lead to methanedepletion.
5 CONCLUSIONS
We summarize our conclusions as follows:
(1) Nature of BSRs: BSRs o¡shore Costa Rica are bestexplained by a thin layer containing free gas beneathhydrate-bearing sediments.(2) Factors controlling BSR formation: both sedimentation
and vertical tectonism potentially control the verticalmovement of the BHSZ with respect to the sediment column.(3) Destruction of BSRs: BSRs are absent in areas a¡ected
by slumping. However, they appear to have `survived' wherethe sediment slumped as a block and strati¢cation was notdisrupted.
ACKNOWLEDGMENTS
We would like to thank the Bundesanstalt fÏr Geowissen-schaften und Rohsto¡e for providing the seismic data. IAPwas supported by a Deutsche Forschungsgemeinschaft`Graduiertenkolleg' scholarship as well as a Woods HoleOceanographic Institution/US Geological Survey post-doctoral fellowship. CRR was supported by a European UnionHuman Capital and Mobility fellowship. The Colorado Schoolof Mines/Gas Research Institute (Chicago) free seismic soft-ware package seisunix was used for pre-processing of the
Table 2. Comparing the e¡ects of vertical tectonism and sedimentation with the vertical movement of the BHSZ relative to a given particle in thesediment column. Input parameters were adjusted to line 9 CMPs 1410 and 2160. Depths of the sea£oor (zsf ) and BHSZ (zBHSZ) (both in metres)were computed using a velocity function obtained during pre-stack depth migration of neighbouring line 8 (Pecher 1995). The temperature gradient(*T/*z, in K m{1) was computed from the depth of the BSR assuming a pure water/methane system. An arbitrary moderate tectonic uplift of 100 m/100 000 yr (*zsf,tec/*t) and an extreme value of 650 m/100 000 yr (Gardner et al. 1992) were used to estimate the tectonic e¡ect. Recent sedimentaccumulation rates (*zsf,sed/*t in m/100 000 yr) had been determined at DSDP Site 565 (von Huene et al. 1985). Resulting vertical movements of theBHSZ due to tectonic uplift (*zBHSZ,tec) and sedimentation (*zBHSZ,sed) are given in metres, positive upwards. See text for further assumptions andsimpli¢cations.
CMP zsf zBHSZ *T/*z *zsf,tec/*t *zBHSZ,tec *zsf,sed/*t *zBHSZ,sed
1410 2307 2679 0:0515 100 5:86 16:5 17:551410 650 35:232160 3119 3318 0:1050 100 2:20 16:5 16:872160 650 13:79
GJI000 21/4/98 07:01:34 3B2 version 5.20The Charlesworth Group, Huddersfield 01484 517077
ß 1998 RAS,GJI 133, 219^229
227Bottom simulating re£ectors at the Costa Rican margin
by guest on July 24, 2016http://gji.oxfordjournals.org/
Dow
nloaded from

seismic data prior to inversion, and GMT mapping software(Wessel & Smith 1991) for some ¢gures. We would like tothank E. E. Davis for thoroughly reviewing an earlierversion of this manuscript, as well as W. P. Dillon, J. S. Booth,D. R. Hutchinson and E. A. Silver for valuable discussions.
REFERENCES
Bangs, N.L., Sawyer, D.S. & Golovchenko, S., 1993. Free gas atthe base of the gas hydrate zone in the vicinity of the Chile triplejunction, Geology, 21, 905^908.
Biot, M.A., 1956. Theory of propagation of elastic waves in a £uid-saturated porous solid, I. Low-frequency range, J. acoust. Soc. Am.,28, 168^178.
Booth, J.S., Winters, W.J. & Dillon, W.P., 1994. Circumstantialevidence of gas hydrates and slope failure associations on the UnitedStates Atlantic continental margin, in International Conference onNatural Gas Hydrates, pp. 487^489, eds. Sloan, E.D., Happle J. &Hnatow, M.A., Plenum Press, New York, NY.
Brown, K.M., Bangs, N.L., Froehlich, P.N. &Kvenvolden, K.A., 1996.The nature, distribution, and origin of gas hydrate in the ChileTriple Junction region, Earth planet. Sci. Lett., 139, 471^483.
Castagna, J.P., Batzle, M.L. & Eastwood, R.L., 1985. Relationshipsbetween compressional-wave and shear-wave velocities in clasticsilicate rocks, Geophysics, 50, 571^581.
Chapman, C.H., 1981. Generalized Radon transforms and slant stacks,Geophys. J. R. astr. Soc., 66, 445^453.
Domenico, S.N., 1977. Elastic properties of unconsolidated poroussand reservoirs, Geophysics, 42, 1339^1368.
Freymueller, J.T., Kolleg, J.N. & Vega, V., 1993. Plate motions in thenorth Andean region, J. geophys. Res., 98, 21853^21863.
Gardner, T.W., Verdonck, D., Pinter, N.M., Slingerland, R.,Furlong, K.P., Bullard, T.F. & Wells, S.G., 1992. Quaternary uplift
astride the aseismic Cocos Ridge, Paci¢c coast, Costa Rica, Geol.Soc. Am. Bull., 104, 219^232.
Hamilton, E.L., 1978. Sound velocity^density relations in sea-£oorsediments and rocks, J. acoust. Soc. Am., 43, 366^377.
Hinz, K., von Huene, R., Ranero, C.R. & PACOMAR WorkingGroup, 1996. Tectonic structure of the convergent Paci¢c margino¡shore Costa Rica from multichannel seismic re£ection data,Tectonics, 15, 54^66.
Hyndman, R.D. & Davis, E.E., 1992. A mechanism for the formationof methane hydrate and sea£oor bottom-simulating re£ectors byvertical £uid expulsion, J. geophys. Res., 97, 7025^7041.
Hyndman, R.D. & Spence, G.D., 1992. A seismic study of methanehydrate marine bottom simulating re£ectors, J. geophys. Res., 97,6683^6698.
Kennett, B.L.N. & Kerry, N.J., 1979. Seismic waves in a strati¢ed halfspace, Geophys. J. R. astr. Soc., 57, 557^583.
Kimura, G., Silver, E.A., Blum, P. & ODP Leg 170 ShipboardScienti¢c Party, 1998. Proc. Ocean Drill. Program Initial Rep.170.
Korenaga, J., Holbrook, W.S., Singh, S.C. & Minshull, T.A., 1997.Natural gas hydrates on the southeast US margin: constraints fromfull waveform inversion and traveltime inversion of wide-angleseismic data, J. geophys. Res., 102, 15 345^15 365.
Kormendi, F. & Dietrich, M., 1991. Non-linear waveform inversion ofplane-wave seismograms in strati¢ed elastic media, Geophysics, 56,664^674.
Kvenvolden, K.A., 1988. Methane hydrateöa major reservoir ofcarbon in the shallow geosphere?, Chem. Geol., 71, 41^51.
Kvenvolden, K.A., 1993. Gas hydratesögeologic perspective andglobal change, Rev. Geophys., 91, 173^187.
Kvenvolden, K.A. &McDonald, T.J., 1985. Gas hydrates of the MiddleAmerica trenchöDeep Sea Drilling Project Leg 84, in Initial Rep.Deep Sea Drill., pp. 667^682, eds von Huene, R. et al., US PrintingO¤ce,Washington, DC.
Figure 11. Post-stack time-migrated section of the seaward part of Costa Rica line 15. Scaling, CMP spacing and AGC window are as in line 9(Fig. 2). The interpretation followed Hinz et al. (1996). The slump which can be seen in line 21 (Fig. 10) is more pronounced along this line and hasevidently destroyed the BSR.
GJI000 21/4/98 07:01:46 3B2 version 5.20The Charlesworth Group, Huddersfield 01484 517077
ß 1998 RAS, GJI 133, 219^229
228 I. A. Pecher et al.
by guest on July 24, 2016http://gji.oxfordjournals.org/
Dow
nloaded from

MacKay, M.E., Jarrard, R.D., Westbrook, G.K. & Hyndman, R.D.,1994. Origin of bottom simulating re£ectors: geophysical evidencefrom the Cascadia accretionary prism, Geology, 22, 459^462.
Marshall, J.S. & Anderson, R.S., 1995. Quaternary uplift and seismiccycle deformation, Peninsula de Nicoya, Costa Rica, Geol. Soc. Am.Bull., 107, 463^473.
Minshull, T.A., Singh, S.C. & Westbrook, G.K., 1994. Seismic velocitystructure at a gas hydrate re£ector, o¡shore western Colombia,from full waveform inversion, J. geophys. Res., 99, 4715^4734.
Minshull, T.A., Singh, S.C., Pecher, I.A., Korenaga, J. & Yuan, T.1996. Seismic waveform inversion studies of natural gas hydrates oncontinental margins, in Proc. Int. Conference on Natural GasHydrates, 2^6 June, Toulouse, France, pp. 517^524.
Paull, C.K., Ussler, W. & Dillon, W.P., 1991. Is the extent ofglaciation limited by marine gas-hydrates?, Geophys. Res. Lett., 18,432^434.
Paull, C.K., Ussler, W. & Borowski, W.S., 1994. Sources of biogenicmethane to form marine gas hydrates, in Int. Conference onNatural Gas Hydrates, pp. 392^409, eds. Sloan, E.D., Happle J. &Hnatow, M.A., Plenum Press, New York, NY.
Pecher, I.A., 1995. Seismic studies of bottom simulating re£ectors atthe convergent margins o¡shore Peru and Costa Rica, PhD thesis,UniversitÌt Kiel, Germany.
Pecher, I.A., Minshull, T.A., Singh, S.C. & von Huene, R., 1996.Velocity structure of a bottom simulating re£ector o¡shorePeru: results from full waveform inversion, Earth planet. Sci. Lett.,459^469.
Sheri¡, R.E. & Geldart, L.P., 1982. Exploration Seismology, Vol. 1,Cambridge University Press, Cambridge, UK.
Sheri¡, R.E. & Geldart, L.P., 1983. Exploration Seismology, Vol. 2,Cambridge University Press, Cambridge, UK.
Shipley, T.H., McIntosh, K.D., Silver, E.A. & Sto¡a, P.L., 1992. Three-dimensional seismic imaging of the Costa Rica accretionary prism:structural diversity in a small volume of the lower slope, J. geophys.Res., 97, 4439^4459.
Singh, S.C. & Minshull, T.A., 1994. Velocity structure of a gas hydratere£ector at Ocean Drilling Program Site 889 from a global seismicwaveform inversion, J. geophys. Res., 99, 24 221^24 233.
Singh, S.C., Minshull, T.A. & Spence, G.D., 1993.Velocity structure ofa gas hydrate re£ector, Science, 260, 204^207.
Sloan, E.D., 1990.Clathrate Hydrates of Natural Gases,Marcel BekkerInc., New York, NY.
von Huene, R. & Flueh, E.R., 1994. A review of marine geophysicalstudies along the Middle American Trench o¡ Costa Rica andthe problematic seaward terminus of the continental crust, inGeology of an Evolving Island Arc, Pro¢l 7, pp. 143^159, edsSeyfried, H. & Hellmann,W., University of Stuttgart, Germany.
von Huene, R., Aubouin, J. & Leg 84 Shipboard Scienti¢c Party, 1985.Initial Rep. Deep Sea Drill. Proj., US Printing O¤ce, Washington,DC.
von Huene, R. et al., 1995. Morphotectonics of the Paci¢c convergentmargin of Costa Rica, in Geologic and Tectonic Development ofthe Caribbean Plate Boundary in Southern Central America,pp. 291^308, ed. Mann, P., Geol. Soc. Am., Boulder, CO.
Warner, F., 1990. Absolute re£ection coe¤cients from deep seismicre£ections, Tectonophysics, 173, 15^23.
Wessel, P. & Smith,W.H.F., 1991. Free software helps map and displaydata, EOS, Trans. Am. geophys. Un., 72, 445^446.
Ye, S., Bialas, J., Flueh, E.R., Stavenhagen, A., Huene, R., Leandro, G.& Hinz, K., 1996. Crustal structure of the Middle Americantrench o¡ Costa Rica derived from OBS wide-angle seismic data,Tectonics, 15, 1006^1021.
GJI000 21/4/98 07:01:49 3B2 version 5.20The Charlesworth Group, Huddersfield 01484 517077
ß 1998 RAS,GJI 133, 219^229
229Bottom simulating re£ectors at the Costa Rican margin
by guest on July 24, 2016http://gji.oxfordjournals.org/
Dow
nloaded from