The Myth of the Missing White Voters: New Mexico
187
The Myth of the Missing White Voters: New Mexico No More Than 57,000 in Little Texas – Not Enough to Beat The Obama 79,547 Margin May 18, 2014 By Steven M. Kamp 1 Did Mitt Romney lose because white voters stayed home? Not in New Mexico, even though the rightwing psepho- commentariat thinks so now that Real Clear Politics Senior Elections Analyst Sean Trende 2 has created The Missing White 1 Sacramento attorney Steven M. Kamp, a graduate of Yale Law School (1981) and the University of California at Los Angeles (1978), and a veteran of Democratic campaigns in multiple states back to 1972, is nearing completion of The New Democratic Majority, a book analyzing American voting patterns between 1788 and 2012 for President, Congress, Governors, state downballot offices, state legislatures and ballot propositions. Mr. Kamp can be reached at [email protected] Mr. Kamp has written the California election law manual for the California Democratic Party since 1988 and similar manuals for Nevada and Kentucky in 2008-2012. The author thanks Patrick Reddy, Scott Rafferty, Harold Kwalwasser, and James Shoch for their editorial assistance. Maps and election return data used with permission of David Leip and the U.S. Election Atlas website, "Dave Leip's Atlas of U.S. Presidential Elections" http://uselectionatlas.org 2 The author is sending Mr. Trende a read-receipt electronic mail message with this article as an attachment. Mr. Trende did not respond to previous articles sent by the author in the same fashion regarding Ohio, Virginia, Pennsylvania, New Hampshire, Maine, Iowa, Wisconsin and Michigan. On September 4, 2013, Mr. Trende sent an electronic mail message to the author acknowledged receipt of the author’s Ohio article, and promising to respond “but not for several weeks.” On February 17, 2014, Mr. Trende responded to the author’s electronic mail message 1
-
Upload
independent -
Category
Documents
-
view
2 -
download
0
Transcript of The Myth of the Missing White Voters: New Mexico

The Myth of the Missing White Voters: New Mexico
No More Than 57,000 in Little Texas – Not Enough to Beat TheObama 79,547 Margin
May 18, 2014
By Steven M. Kamp1
Did Mitt Romney lose because white voters stayed home?
Not in New Mexico, even though the rightwing psepho-
commentariat thinks so now that Real Clear Politics Senior
Elections Analyst Sean Trende2 has created The Missing White
1 Sacramento attorney Steven M. Kamp, a graduate of Yale Law School (1981) and the University of California at Los Angeles (1978), and a veteran of Democratic campaigns in multiple states back to 1972, is nearing completion of The New Democratic Majority, a book analyzing American voting patterns between 1788 and 2012 for President, Congress, Governors, state downballot offices, state legislatures and ballot propositions. Mr. Kamp can be reached at [email protected]
Mr. Kamp has written the California election law manual for the California Democratic Party since 1988 and similar manuals for Nevada and Kentucky in 2008-2012.
The author thanks Patrick Reddy, Scott Rafferty, Harold Kwalwasser, and James Shoch for their editorial assistance.
Maps and election return data used with permission of David Leip and theU.S. Election Atlas website, "Dave Leip's Atlas of U.S. Presidential Elections"http://uselectionatlas.org
2 The author is sending Mr. Trende a read-receipt electronic mail message with this article as an attachment. Mr. Trende did not respond to previous articles sent by the author in the same fashion regarding Ohio, Virginia, Pennsylvania, New Hampshire, Maine, Iowa, Wisconsin and Michigan. On September 4, 2013, Mr. Trende sent an electronic mail message to the author acknowledged receipt of the author’s Ohio article,and promising to respond “but not for several weeks.” On February 17, 2014, Mr. Trende responded to the author’s electronic mail message
1

Voter Theory. The Theory has spawned a debate that even
became a cover story in The Week.3 It has now also become
received truth on The Right – on December 16, 2013, National
Review Online commentator John Fonte published “Re-branding the
GOP: From the party of big business to the party of the
little guy” and led off with a shout-out to Sean Trende:
As Sean Trende and others have noted, middle- and working-class voters did not turn out for Mitt Romney in the 2012 presidential election in the numbers that Republican leaders had expected. In the eyes of many of these once-Republican-leaning voters (including former Reagan Democrats), the GOP appears to be too closely linked to “big business.” In response, many conservative thinkers have called for a more populist GOP, oriented toward the middle and working classes and distant from corporate elites.
Trouble is, the Missing White Voter Theory is not based
on actual registered voters and actual voting, but rather on
a Census estimate that has both overestimated and
underestimated actual eligibility, registration and voting,
attaching the Minnesota article as follows:
“Steve; I appreciate the effort you keep putting into these, but to be honest, there is no earthly way I can read multiple 90-page documents on this. In a way, this is attacking a bit of a straw man, since I expressly state that the “missing whites” weren’t enough to flip the 2012 elections. They would be part of a GOP strategy, but not sufficient.”
In the second paragraph of his first 2013 article on this subject, Mr. Trende stated:
“what was really the most salient demographic change in 2012: The drop-off in white voters.” 3 July 26, 2013, page 16, “Talking Points -- Immigration: Can the GOP win as the White Party?”, and front cover.
2

both nationally and in New Mexico, Michigan, Minnesota,
Wisconsin, Iowa, Ohio and Virginia, three 2004-2012 targeted
and four swing states essential to Republican White House
hopes in 2016 and 2020. This author has already explained
why The Missing White Voter Theory will not flip into the
Republican column the states of Ohio, Virginia,
Pennsylvania, New Hampshire, Iowa, Wisconsin, Minnesota or
Michigan, or Maine’s Second Congressional District.4 This
4 “The Myth of the Missing White Voters: In Ohio, Not Registered and Not Voting –While Columbus Rocks for the Democrats.”
“The Myth of the Missing White Voters: Virginia Is For Lovers, Not Missing White Voters”
“The Myth of the Missing White Voters: Pennsylvania – Tombstone State for The Theory “
“The Myth of the Missing White Voters: New Hampshire – Democrats Vote Freely And Aren’t Dying.”
“The Myth of the Missing White Voters: As Maine Goes, So Ends The Missing White Voter Theory”
“The Myth of the Missing White Voters: Iowa – No Longer Registered, Thus No Longer Voting, While Hell Has Gone Methodist.”
“The Myth of the Missing White Voters: Thirty-Two Thousand in Rural Wisconsin, Not Enough to Flip the Badger State.”
“The Myth of the Missing White Voters: Minnesota – Not Enough in Outstate To Overcome The Twin Cities and Iron Range Democratic Margins.”
“The Myth of the Missing White Voters: Michigan – Over Two Million Registered Nonvoters, But Not Enough Actual Voting in Republican Michigan To Overcome The Wayne-Washtenaw-Ingham Democratic Margins.”
3

article will now explain why the Missing White Voter Theory
will not flip New Mexico, a state that voted Republican for
President as recently as 2004.
Who cares about New Mexico? Democrats … and, as
recently as 2004, some Republicans. New Mexico has only five
electoral votes, but it is an essential element of a
Democratic 257 electoral vote firewall strategy based on the
2004 John Kerry states (246 electoral votes in 2012-2020),
and two 2004 George Bush states that otherwise were
continuously Democratic between 1992 and 2012: Iowa and New
Mexico. The Iowa 6 and New Mexico 5 bring the Democratic
team to 257, only 13 electoral votes short of the 270 magic
number, meaning Democrats can win with either Ohio (18) or
Virginia (13) or Florida (29), or a combination of Nevada
(6) and Colorado (9). Thus, if Republicans (as they did in
2004), manage to sneak away with New Mexico by 5,988 votes,
and add Iowa by 10,059, Democrats are left with the 246 from
the John Kerry states, and need 24 more, meaning stand-alone
wins of Ohio (18) or Virginia (13) are not enough, nor is a
dual win of Colorado and Nevada (9 + 6); instead, Democrats
must win either Florida (29), or three of the quartet of
Ohio, Virginia, Colorado and Nevada.
Sean Trende says the Missing White Voters can be found
in New Mexico. In the lead-off article in his four-article
4
series, Trende described the Missing White Voter belt as a
diagonal that started in Maine and extends “down into New
Mexico”:
Below is a map of change in turnout by county, from 2008 to 2012. Each shade of blue means that turnout was progressively lower in acounty, although I stopped coding at -10 percent. Similarly, everyshade of red means that turnout was progressively higher, to a maximum of +10 percent.
The drop in turnout occurs in a rough diagonal, stretching from northern Maine, across upstate New York (perhaps surprisingly, turnout in post-Sandy New York City dropped off relatively little), and down into New Mexico. Michigan and the non-swing state, non-Mormon Mountain West also stand out. Note also that turnout is surprisingly stable in the Deep South; Romney’s problemwas not with the Republican base or evangelicals (who constituted a larger share of the electorate than they did in 2004). (Emphasisadded).
Mr. Trende did not textually specify the part of New Mexico
he was referring to, but he could only have been referring
to the 14 counties of Little Texas, because as displayed in
Chart VII at the end of this article, there are 33 New
Mexico counties, but only 13 are reported by the 2010 Census
as majority Non-Hispanic White (NHW): 11 of the 14 Little
Texas counties, the Albuquerque exurb county of Torrance,
plus the atomic center and double-Obama county of Los
Alamos. The other twenty counties (Democratic Nine, three of
the Albuquerque Metro Four, three in Little Texas, and five
5

of the Swing Vote Six) are all majority-minority, including
the vote-packed Bernalillo (Albuquerque), Dona Ana (Las
Cruces), McKinley (Gallup), of course Santa Fe and Taos,
and surprisingly, three relative urban hubs in Little Texas
-- Chaves (Roswell), Lea (Hobbs), and San Juan (Farmington).
In 2004, the Republicans used a variant of Sean
Trende’s theory to swipe New Mexico (fair and square) from
John Kerry even though New Mexico is majority non-Caucasian.
In 2004, Republicans successfully flipped New Mexico, using
a “missing white voter” strategy aimed at increasing
Republican turnout in the Caucasian-majority “Little Texas”
counties of eastern New Mexico, Alamagordo, and Farmington5,
a strategy lauded by Michael Barone: “[t]he Bush
volunteers . . . [went] everywhere, especially to rural
counties, many of them slow-growing places where many
politicians figure there are no more votes to be won . . .”.
Barone specifically noted the Bush campaign’s turnout
increases in New Mexico: “Lea County [Hobbs] in Little
Texas, which grew only 1% [from 2000 to 2004] turnout was up
28% and the county voted 79% for Bush . . . in the 10
counties of Little Texas, Bush’s margin increased by 18,000
and in San Juan County, mining country around Farmington, it
increased by another 5,000”, in contrast to the 2000-2004
5 Farmington is the county seat of San Juan County, which in 2010 is NHW41.2%, Hispanic 19.3%, and Native American 38.4%.
6

Democratic margin increases in Santa Fe and Taos (13,000
combined) and 6,500 in Bernalillo County.”6
However, a Republican belated encore performance is
unlikely in 2016.
Reason One: even with the 2008-2012 falloff in the
Obama vote, Democrats between 2004 and 2012 have moved from
a 5,988 deficit to a 79,547 margin, meaning Republicans in
2016 need 80,000 “missing white voters.” Between 2004 and
2012, Democrats increased their Santa Fe/Taos/Gallup
“Democratic Nine” nine-county raw number by 10,028, whereas
the Republican raw number in the “Little Texas Fourteen”
(including the counties centered on Farmington, Alamagordo,
Roswell and Hobbs) fell by 10,021. As can be seen, Republicans
lost their 5,988 statewide margin from 2004 and then 10,021
more in Little Texas alone, whereas Democrats more than made
up for their surprise 2004 loss with gains in the Democratic
Nine alone, where Republicans helped some more by losing
another 10,415 in the Democratic Nine, thus increasing the
Democratic margin from these nine counties alone by 20,443,
more than triple the 2004 statewide Republican margin.
Democrats also increased their raw number in the four-county
Albuquerque Metro area by 26,585; and by 5,776 in the Swing
Vote Six counties, the largest of which are Dona Ana (Las
Cruces) and Los Alamos. Democrats even gained in Little
6 Michael Barone, The Almanac of American Politics 2006, pages 23 (“American Politics in the Networking Era”) and 1117-1118 (New Mexico Presidential Politics).
7

Texas, up by 1,304. Republicans helped some more by losing
15,433 in Metro Albuquerque Four and 5,273 in the Swing Vote
Six counties. The only missing voter metrics that come close
to hitting 80,000 are two statewide ones:
a 55 percent turnout of the 2004-2012 growth in
the statewide estimated eligible non-voters (both
registered and unregistered, including all ethnic
backgrounds) that breaks Republican by 94-3-3;
or a lemming-like rush of 55 percent of the 2012
statewide eligible non-voter number of 797,470
(438,608) that breaks 57-40-3 Republican (even
though 85 percent of these non-voters did not vote
in 2008 either).
Using the eight-year 2004 – 2012 period to measure the all-
population gap between New Mexico estimated eligibles and
actual voting reveals the number 161,352, and at the 55
percent turnout rate used in the Missing White Voter
articles, only 88,743 are added, meaning that the 2016
Republican candidate defeats the 2012 Obama margin only at a
breakout of Republican 94-3-3, and only by a raw margin of
1,2097, which would be the second-closest New Mexico
Presidential margin in state history after the current
record (2000, Gore by a raw 366).7 88,743 x Republican 94% = 83,418 new Republican votes, offset by the Democratic 3% (2,662), with 3% to Others (2,664), resulting in a net Republican vote gain of 80,756 that sneaks past the Obama 2012 margin of79,547 by a raw margin of 1,209.
8

Reason Two: The linchpin of The Missing White Voter
Theory is the alleged 2008-2012 growth in the gap between
the Non-Hispanic White (NHW) Voting Age Population (VAP) and
the actual NHW vote, with a 55 percent turnout rate and a
70-30 percentage point Republican margin applied to this
eligible non-voter “voting gap” number. But in New Mexico,
the all-population Eligible Non-Voter “growth” number between
2008 and 2012 is 121,798, which at the 55 percent turnout
rate only adds 66,988 new voters, a number that is less than
the Obama margins from either 2012 or 2008. Thus, every one
of these estimated “missing” voters could magically show up
and register twenty-eight days before Election Day 2016, and
vote by no-excuses absentee ballot or in person, but the
Obama 2012 margin would still be ahead by 12,559.
Reason Three: using the Census Current Population
Survey (CPS) estimates that are the linchpin of The Theory
reveals that in New Mexico between 2008 and 2012, estimated
all-population eligibles growth exceeded the estimated voter
growth by only 42,000; for the Non-Hispanic White (NHW)
population, estimated eligibles growth exceeded voter growth
by 22,000. As for the 2004-2012 period, in these eight years
the estimated growth in eligibles exceeded the estimated
growth in voters by all of 84,000, and the estimated growth
in NHW eligibles exceeded the growth in NHW numbers by
26,000. Only one of these estimated numbers come anywhere
near the Obama 2012 margin of 79,547: the 2004-2012
9

estimated statewide growth in eligible nonvoters of 84,000.
At the 55 percent turnout rate used by Sean Trende in his
articles, no more than 46,200 new voters are added8, a
number that is only 58 percent of the Obama 2012 New Mexico
margin.
Reason Four: in the 14 Little Texas counties (including
San Juan (Farmington), Otero (Alamagordo), Lea (Hobbs),
Portales (Roosevelt) and Chaves (Roswell)), between 2004 and
2012, the 14-county registration rose by all of 16,199 and
voting for any office fell by 7,601, resulting in a
registered non-voter growth number of 23,800 – only 29.91
percent of the 2012 President Obama statewide margin of
79,547. If one looks solely at the 2012 Little Texas 14-
county registered nonvoter number of 102,804 and assumes a
55 percent Trende turnout percentage in 2016, the resulting
number is 56,542, which again underperforms the Obama 2012
New Mexico margin.
In addition, as discussed toward the end of this
article, New Mexico where 59% of the 2012 vote was cast
before Election Day has become part of the Democratic Left
Coast Early Voting Firewall, one of seven double-Obama
states west of El Paso that collectively have 98 of the 128
electoral votes in the 13 western states Don’t expect 2010
8
? 84,000 all-voter eligible non-voter growth x .55 = 46,200.
10

Governor Susana Martinez to save New Mexico or any other
state for the Republicans: she has never run statewide in a
Presidential year, and her 2010 raw number underperforms
John Kerry 2004.
Thus, because The Missing White Voter Theory does not
work in New Mexico, Michigan, Minnesota, Wisconsin, Iowa,
rural Maine, New Hampshire, or Pennsylvania – eight Blue
Wall electoral vote jurisdictions targeted by the
Republicans in 2000, 2004, 2008 and 2012 -- and does not
work in Ohio or Virginia -- it does not matter in 2016 or
20209, except as a secret Democratic black propaganda effort
to divert Republican resources (and this author knows
nothing).
The Missing White Voter Theory: It Started With the 2012 Non-Final
Ohio Returns that Did Not Include Provisional Ballots
9 As discussed in prior articles in this series, The Theory will not flip Ohio or Virginia.
11

Two days after Election Night 2012, Real Clear Politics
Senior Elections Analyst Sean Trende, extrapolating from
non-final Ohio numbers10, opined that Romney lost the
national popular vote because (nationwide) 6.5 million
Caucasian Republican eligible voters “stayed home,”
including allegedly enough rural 2004 or 2008 Republican
voters to give Ohio to Obama.11 The Trende Theory began in
Ohio, and likely ends in New Mexico somewhere between the
Swing Vote movie location of Texico in Curry County12 and the
Four Corners county of San Juan (Farmington). Caucasian
turnout may have been down, but not in the magnitude Trende
claims – and not by enough to alter the New Mexico result,
and with New Mexico, Nevada and Colorado went any Republican
hopes for winning the Electoral College via a southwestern
strategy.
10 That did not include the 173,765 ultimately counted provisional ballots. Under Ohio law, absentees are counted first, followed by the machine ballots, but the counting of the provisionals does not begin until ten days after Election Day.
11 Sean Trende, Real Clear Politics, November 8, 2012, “The Case of the MissingWhite Voters.”
12 The movie Swing Vote is about a fictional Presidential election where the Electoral College outcome turns on the five electoral votes of New Mexico. The movie features cameo Chris Matthews excited commentary that all New Mexico votes have been counted and result in an exact tie in NewMexico, meaning that the Electoral College turns on a re-vote of a mistaken vote by a named voter in the Texas-border town of Texico in Curry County. The voter gets to re-vote, and before he votes he is courted in a nationally televised exercise by representatives of both major party candidates. Although the swing voter is in Texico, the actual filming was in the Albuquerque suburb of Belen. www.wikipedia.org, “Swing Vote.”
12

The “Missing White Voter” route has become the
proverbial yellow- or red-bricked road for the rightwing
commentariat and blogosphere. However, The Missing White
Voter Theory is more of a long dead end road rather than a
through street to victory for the Republicans, because:
It is not based on actual registered voters or actual
voting, but on a post-election Census survey that in
2004, 2008 and 2012, did not come close to matching the
actual registered or voting population, nationally or
in New Mexico, Michigan, Minnesota, Wisconsin, Ohio,
Virginia, Pennsylvania, New Hampshire or Maine. In New
Mexico, it missed the 2004 total vote for any office by
a rounded 61,000, and missed the 2008 and 2012 total
vote numbers by 33,000 and 92,000. It comes up with
VAP numbers for all three years that differ from the
Professor Michael McDonald United States Election
Project New Mexico VAP numbers by 110,000 in 2004;
153,000 in 2008; and 157,000 in 2012.
In New Mexico, the Census survey estimates of the gap
between eligible voters and actual voters (“eligible
nonvoters”) that are the linchpin of The Theory show
that between 2004 and 2012, the increase in estimated
eligible versus estimated voters (“estimated eligible
nonvoters”) is all of 84,000. At the 55 percent
turnout rate used in the Trende articles, only 46,200
new voters are added.
13

In each of the 2004, 2008 and 2012 Presidential year
elections, between 636 and 797 thousand eligible New
Mexico voters did not vote: 636,118; 675,672; and
797,470. It is highly unlikely that Caucasian
solidarity appeals will stimulate a sufficiently large
Republican turnout from this constituency that has
regularly failed to register and failed to vote: the gap between
registration and voting was 330,071 in 2004; 350,436 in
2008; and 468,045 in 2012.
The total number of actual net lost Republican votes
between 2004 and 2012 in all 33 New Mexico counties is
41,142, whereas in this same period Democrats gained
44,393 – even after losing 57,087 between 2008 and
2012.
In the Democratic Nine counties, Democrats between 2004
and 2012 gained 10,728, whereas Republicans lost
10,415, thus fattening the statewide Democratic margin
by 21,143, an amount that is 26.57 percent of the Obama
2012 statewide margin.
In the Albuquerque Metro Four and Swing Vote Six
counties, Democrats gained a net 26,585 in Albuquerque
Metro and 5,776 in the Swing Vote counties, whereas
Republicans lost 15,433 and 5,273 – fattening the
Democratic margin by another 53,067.
Republican net raw vote losses and Democratic raw vote
gains between 2004 and 2012 occurred in all four New
14

Mexico subregions: Little Texas, Democratic Nine,
Albuquerque Metro, and the Swing Vote counties.
Between 2004 and 2012, Republicans lost raw votes in 31
of the 33 New Mexico counties, gaining votes only in
the Arizona border Little Texas county of Catron (plus
67) and the Albuquerque Metro exurban county of
Sandoval (plus 1,759). In contrast, Democrats gained
raw votes in 27 of the 33 counties, losing ground only
in the Swing Votes county of Los Alamos (minus 15); the
Little Texas counties of Eddy (Carlsbad, minus 738),
Roosevelt (Portales, minus 355), Chaves (Roswell, minus
122) and Quay (Tucumcari, minus 39); and the Democratic
Nine county of Grant (Silver City, minus 5).
The 2004-2012 registered non-voter growth number in the
Democratic Nine counties is 12,910; in the four
Albuquerque Metro counties it is 82,130; in the six
Swing Votes counties it is 18,934; in the 14 Little
Texas counties it is 23,800. Thus, Republican
prospecting in the New Mexico registered voter universe
for 2012 missing non-voters who voted in 2004 will
yield all of 23,800 in Little Texas, and the 113,974 in
the other three regions who are likely to be Hispanic,
Native American or Caucasian Democrats.
Before diving deep into actual New Mexico eligibility,
registration and voting statistics, let’s discuss The
15

Missing White Voter Theory. The Missing White Voter Theory
has been grasped by Republicans to avoid facing the
implications of what actually happened in 2008 and 2012:
back-to-back popular vote and Electoral College majorities
by a Democrat from a national total vote that was 6.921
million larger than the total vote in the 2004 reelection of
President Bush the Younger, and that flipped a net seven
states and 115 electoral votes between 2004 and 2012.
Moreover, the Democratic President was reelected amid the
worst Democratic incumbent economic environment since Jimmy
Carter in 1980, the outgoing Woodrow Wilson administration
in 1920, and the second Grover Cleveland administration in
1896, with numbers that caused two economic determinist
modelers to predict only 46 or 49 percent for Obama13, an
economic determinist electoral vote modeler to predict
Romney with 33014, Almanac of American Politics founder Michael
Barone to intone Romney 315 because of “fundamentals” -- and
don’t forget Peggy Noonan and her vibrating Northwest D.C.
yard signs. Horror of horrors, 2008 may have been a 13 The Professor Ray C. Fair Model in Fair, Predicting Presidential Elections (Stanford University Press, 2002), and available for 2004-2008-2012 at www.fairmodel.yale.edu, and the Professor Douglas Hibbs Bread and Peace Model, available at www.douglas-hibbs.com
14 Two University of Colorado professors who shall remain nameless, and who looked only at state-level economic data and ignored electoral history and everything else. The predicted Romney 330 included New Mexico, Wisconsin and Minnesota, with New Mexico moved from the Obama column in August to the “narrow Romney win” column in October. www.colorado.edu, “Updated election forecasting model still points to Romney win, University of Colorado study says” (October 4, 2012).
16

realigning election, and 2012 a confirming election . . .
for the Democrats.
President Obama’s reelection triggered a rampage of
rage on the Republican right, but the one rational response
came from Almanac of American Politics 2014 co-author Sean Trende,
whose review of non-final Ohio returns two days after the
election started him on the road to a 2013 conclusion that
6.5 million eligible Caucasian voters skipped the election.
The Missing White Voter Theory is based on the contrast
between Census estimates of eligible Non-Hispanic White
eligibility, registration and turnout for 2008 and 2012 and
the Census estimate of the actual 2012 vote – based on the
Census estimates and using a 55 percent turnout rate for
Trende-estimated nonvoting eligibles. Sean Trende did not
distinguish between unregistered and registered nonvoters;
instead, he conflated and continues to conflate the two
categories.15 15 In contrast, The Emerging Republican Majority author Kevin Phillips in 1972 debunked the McGovern “youth vote” theory with a three-step sequential analysis of registration, turnout, and percentage breakdown:
“Some 70 to 80 percent of the 18-24 year-olds will register. Of these, 70 to 80 per cent will actually vote. Thus, 49 per cent to 64 percent of those eligible will actually make it to the polls. Assume 60 percent (the national average) – or 15 million votes. Of these, McGovern will get 55 to 65 percent (8.25 to 9.75 million) and Richard Nixon will get 35-45 percent (5.25 to 6.75 million). By these calculations, then, the McGovern youth lead will range from 1.5 million to a very improbable 4.5 million” which Phillips predicted (correctly) would be swamped by 1968 George Wallace voters and 1968 Humphrey voters switching to Nixon.
New York Times Magazine, August 6, 1972, “Why Nixon Will Win” (Kevin Phillips), pages 33-34.
17

Mr. Trende concluded that 6.5 million eligible
Caucasian voters did not vote in 2012, and Republican
opponents of immigration reform and minority outreach16
seized upon The Theory as justification for doubling down on
the Republican obstructionism displayed in the 2013 Fiscal
Cliff and 2011 Debt Ceiling debacles, and most recently on
display in the October Twenty-Thirteen Temper Tantrum. The
Trende series was (according to Trende) purposely vague on
policy, but appeared to urge Republican “libertarian
populist” appeals to downscale Caucasian voters turned off
by the Bain Capital persona and reality of Mitt Romney,
although in this author’s opinion, any actual proposals will
amount to little more than faux-populist flapdoodle. The
electoral role model for The Missing White Voter Theory
appears to be Minnesota Governor Tim Pawlenty, who before
becoming a financial services lobbyist was twice elected
Governor of Minnesota – but with percentages of 44.37 and
46.69 in three-way engagements where the Jesse Ventura
Independence Party achieved 16.18 and 6.43 percentage points
-- but where the Democrats were held to 36.46 and 45.73.
The only New Mexico role model is 2010 Governor Susanna
16 Note that Sean Trende does not oppose either immigration reform or Republican minority outreach; see his June 21, 2013 and subsequent Real Clear Politics articles. As for the Government Shutdown, Trende Tweets available by a Google search of “Sean Trende Twitter” show him Tweetingthat the Shutdown had no upside for the Republicans but was unlikely to have electoral consequences except perhaps in 2013 Northern Virginia (which turned out to be an accurate prediction).
18

Martinez, but like all post-1968 New Mexico Governors she
was elected in a non-Presidential year: 2010, where she
achieved fewer raw votes than John Kerry achieved in 2004
New Mexico (Martinez 321,219 versus Kerry 370,942).
Democrats currently hold both New Mexico U.S. Senate seats.
The last non-incumbent Republicans elected to the U.S.
Senate from New Mexico were Pete Domenici (1972, when he
flipped the open Clinton Anderson Class II seat, last
Republican in 1918-1921 with Teapot Dome character Albert
Fall and special election winner Holm Burson) and astronaut
Harrison Schmitt (1976, when he defeated Democratic 1964
U.S. Senator Joseph Montoya for the Class I seat, last
Republican in 1928-1934 with progressive Bronson Cutting).
Senator Domenici held the Class II seat through 2008, when
Democrat Tom Udall flipped the seat, but Class I Senator
Schmitt was defeated in 1982 by Democratic Attorney General
Jeff Bingaman (whose campaign asked “what on earth has he
(Schmitt) done”), who held the seat until 2012 when retiring
Bingaman passed the baton to Congressman Martin Heinrich,
who will be in the seat through at least 2018. In other
words, the last times the Republicans elected a non-
incumbent New Mexico U.S. Senate candidate in a Presidential
year were 1972 and 1976, and in both years Republican
Presidential candidates carried New Mexico, one of whom
(President Ford in 1976) was a national popular vote loser.
In the 2014 U.S. Senate derby, the New Mexico Class II seat
19

is up, but no handicapper considers it to be in play17, even
though it was Republican as recently as 2002, and the
Democratic Senator (Martin Heinrich) is in his first
reelection campaign.
Now for some actual voting numbers. Between 2004 and
2012, the Republican national raw vote fell by a net
1,107,377, from an all-time high of 62,039,572 to the
second-ever Republican total in excess of 60 million –
60,932,235. Between 2008 and 2012, the national Republican
raw number rose by all of 981,912.18
Chart I: The National Popular Vote, 2004-2012
Total Vote Republican Democratic Other
Margin
2004 122,293,468 62,039,572 59,027,115
1,226,781 R 3,012,457
2008 131,463,122 59,950,323 69,499,428
2,013,371 D 9,549,105
17 The Upshot on April 23, 2014 gave Republicans less than a five percent chance of flipping this seat (New York Times, April 23, 2014, Section A, page 3, “Senate Control Is a Tossup As Democrats Make Gains” (Amanda Cook and Josh Katz)).18
? From 62,039,572 to 59,950,323, per the David Leip U.S. Election Atlas website accessed March 20, 2014. These numbers may or may not include the additional 6,435 votes from Kings County (Brooklyn), New York discovered and amended into the New York official totals on August 22, 2013. Between the November 25, 2013 and January 8, 2014 website access dates, the national total vote increased by 16,539, but 16,538 of the increase went to the “Others” column, and one vote went to the Democratic column.
20

2012 129,232,106 60,932,235 65,917,258
2,382,613 D 4,985,023
04-12: + 6,938,362 -- 1,107,337 + 6,890,123 +
1,155,832 D + 7,997,480
08-12: minus 2,231,162 + 981,912 minus 3,582,170 +
369,242 D minus 4,564,082
In the nine swing states – two that Romney re-flipped
from 2008 and seven that he missed – the Republican raw vote
between 2004 and 2012 rose by a net 352,719. As displayed
in Chart II below, Republicans won back Indiana even with a
vote drop of 58,895 and a Democratic gain of 183,876,
because the Republican base from the Nixon-Bush era was
large enough that it held the Democratic 2008 margin to
28,391, and Democrats from 2008 to 2012 crashed by 221,152.
Same story in North Carolina: Democratic increase more than
double the Republican increase, but a high enough Bush 2004
number to hold the 2008 Democratic margin to 14,177.
Different story in New Mexico: Republicans won the state by
only 5,988 in 2004, and subsequently lost 41,142 as
Democrats gained 44,393. Even worse story in Iowa:
Republicans won the state by only 10,059, then lost 21,340
while Democrats gained 80,646. Horrible story in Ohio:
Republicans won the state by 118,601, then lost 198,331 as
Democrats gained 86,542. In Florida, Virginia, Colorado and
Nevada, Republicans added a collective 433,352, but
21

Democrats added a whopping 1,626,849 – almost four times the
Republican addition.
Chart II: Swing States 2004 – 2012
State, R 2004 R. 2004-2012 Dem. 2004-2012
2012 Result
N.C. 435,317 + 309,229 + 652,542
Repub. Margin 92,004
Ind. 510,427 Minus 58,895 +
183,876 Repub. 267,656
N.M 5,988 Minus 41,142 + 44,393
Dem.. 79,547
Nev. 21,500 + 44,877 +
134,183 Dem. 67,806
Colo. 99,531 + 83,987 +
321,376 Dem. 137,858
Va. 262,217 + 105,563 +
517,078 Dem. 149,298
Fla. 380,978 + 198,925 + 654,212
Dem. 74,309
Ohio 118,601 Minus 198,331 + 86,542
Dem. 166,272
Iowa 10,059 Minus 21,340 + 80,646
Dem. 91,927
22

Republicans have to carry at least six of these nine states
to win the White House in 2016 or 2020. The Republicans
must hold Indiana and North Carolina, and flip Florida (29
electoral votes) plus three states with another 35 electoral
votes: Ohio 18, Virginia 13, and either Iowa (6), Colorado
(9), Nevada (6), or New Mexico (5). Alternatively,
Republicans must dislodge the equivalent 64 electoral votes
from the Blue Wall Kerry-Obama states19 that have 246
current electoral votes; Republicans will talk about
flipping not only New Hampshire (4), Pennsylvania (20),
Minnesota (10), Michigan (16), New Jersey (14) and Wisconsin
(10), even though the last year in which any of these states
gave a majority to a non-incumbent Republican was 1952
Minnesota, 1960 Wisconsin, and 1988 New Hampshire,
Pennsylvania, Michigan and New Jersey.
The fundamental Republican problem in New Mexico is
that the Grumpy Old Party not only peaked in 2004, but this
all-time high Presidential raw number of 376,930 that year
won by only 5,988, and in 2012, the Republicans are still
41,142 behind the 2004 number. In contrast, the Democrats
since 2004 added 101,480 in 2008, and even though President
Obama lost 57,087 between 2008 and 2012, Democrats are still
79,547 ahead, in part because New Mexico and Ohio were the
19 Ron Brownstein, National Journal, January 17, 2009, “Dems Find Electoral Safety Behind A Wall Of Blue.”
23

two swing states where the Mitt Romney raw number
underperformed John McCain, in New Mexico by 11,044: Romney
335,788 versus McCain 346,832. The only Republican New
Mexico Presidential raw numbers above 300 thousand are the
1984 President Reagan number of 307,101 and the three 2004,
2008 and 2012 numbers. In contrast, Democrats have broken
400 thousand twice, in 2008 (472,422) and 2012 (415,335).
Republicans could make it back to their 2004 number, but
would still be behind Obama 2008 by 95,492, and Obama 2012
by 38,405. Republicans can win only by converting half of
each of these numbers, suppressing 100 percent of them,
finding new voters equivalent to 100 percent of them, or
through The Missing White Voter Theory finding between 80
and 126 thousand eligible missing voters to enable the 2016
Republican nominee to sneak past the Democratic 2008 and
2012 margins.
24

Chart III: New Mexico VAP, Registration and Voting, 2004-2008-2012
Dem state New Mexico margins:
Kerry negative 5,9882008: 125,590 2012: 79,547
No state or county level VAP. Michael McDonald US ElectionsProject statewide VAP numbers used
2004 2008 2012 4-8 8-12 4-12
State VAP 1,411,419 1,505,830 1,583,992+ 94,411 + 78,162 + 172,573
Registration 1,105,372 nov 2 1,183,081 oct 17 1,254,567 oct 19 + 77,709 +71,486 + 149,195
E Day Vote 382,941 314,070 323,100 min 68,871 + 9,030 min. 59,841
Abs 156,020 172,136 88,848 + 16,116 min. 83,288 min.67,172
Early 236,340 347,159 374,574 + 110,819 + 27,415 + 138,234
Total 775,301 833,365 786,522 + 58,364 min. 46,843 min. 11,221
Pres. Vote Leip 756,304 830,158 783,757 + 73,854 min. 46,401 + 27,453
25

Skip pres. 18,997 3,207 2,765 min. 15,790 min.442 min. 16,232
Eligibles-reg gap 306,047 322,749 329,425 + 16,702 + 6,746 + 23,898
Eligibles-vote gap 636,118 675,672 797,470 + 39,554 + 121,798 + 161,352
Reg-Vote gap 330,071 350,436 468,045 + 20,365 + 117,609 + 137,975
New Mexico 2004-2012: Republicans Down, Democrats Up, By A Net 85,535
In addition to Ohio, Virginia, Pennsylvania, New
Hampshire, Maine, Iowa, Wisconsin, Minnesota and Michigan,
another testing ground for The Missing White Voter Theory
should be actual statewide VAP and county-level registration
and voting data from New Mexico for the presidential
elections of 2004, 2008 and 201220, with the focus on the
trend between 2004 and 2012.
Chart IV: New Mexico for President, 2004-2008-2012
2004 2008 2012 4-8 8-12 4-12
Tot.Pres.Vote 756,304 830,158 783,757 + 73,854 min.46,401 + 27,453
20 Unlike Wisconsin, New Mexico does not maintain county-level VAP numbers.
26

Democratic 370,942 472,422 415,335 + 101,480 min. 57,087 + 44,393
Republican 376,930 346,832 335,788 min. 30,098 min. 11,044 min. 41,142
Other 8,432 10,904 32,634 + 2,472 + 21,730 + 24,202
Margins R 5,988 D 125,590 D 79,547 + 131,578 min.46,043 + 85,535
Highest R raw number is 2004. Only other one above 300 T are 2008, 2012, 1984
Highest D raw number 2008 2008+2012 both above 400 T All others below 400 T
So why are we in New Mexico? New Mexico went Republican
in 2004, although the last time it cast any kind of margin
for a nationally losing Republican was in 1976 (President
Ford by 2.47 percentage points). Republicans post-Clinton
keep trying to win New Mexico, and have spent campaign funds
there in 2000, 2004, 2008 and 2012, although in both 2008
and 2012, the Republican raw number declined from the
previous Presidential election. In August 2012, Mitt Romney
campaigned in Hobbs, Lea County, Little Texas, with a pro-
carbon energy speech that even attracted a “missing white
voter” from 2008:
27

Justine Bearden, 26, of Hobbs did not vote in the presidential race four years ago. But this time, he said, Romney will get his vote.
"I like his stance on energy. That's what keeps us going," said Bearden, an electrician.21
However, barely a month later, three of the Romney New
Mexico campaign staff packed their bags for Colorado and
Nevada22, although on October 31, 2012, a pro-Romney Super
PAC (Restore Our Future) bought $800,000 of TV time in New
Mexico and $1 million in Minnesota23, in a Hail Mary Pass
move aimed at dislodging 15 electoral votes from the Obama
column. Note to 2016 campaign planners: of the 786,522 New
Mexico total vote in 2012, 58.92 percent was cast by either
mail ballot (88,848) or in early voting (374,574), with
early voting starting October 9 and ending Saturday,
November 324, meaning most of the mail ballot and early
votes had been cast before the October 31 pro-Romney ad buy
started. Republican 2012 attention to New Mexico may have
been driven by the 2000 result, where thanks to the Ralph
21 El Paso Times, August 23, 2012, “Mitt Romney visits Hobbs, NM, pledges to make North America energy independent” (Milan Simonich), available at www.elpasotimes.com 22 CNN Political Ticker Blog, September 20, 2012, “Republicans move campaign staff out of New Mexico” [www.politicalticker.blogs.cnn.com]
23 USA Today, October 31, 2012, “Pro Romney super PAC running ads in Minn.,N.M” (Catalina Carnia) [www.usatoday.com]
24 Data from the New Mexico Secretary of State website [www.sos.state.nm.us] with early voting dates found at “Voter FAQ.”
28

Nader 3.55%, Vice President Al Gore was held to a margin of
366 raw votes or six one hundredths of a percentage point,
followed by the 2004 result, where Bush the Younger actually
won.
Sean Trende in his initial Missing White Voter Theory
article described New Mexico as a state where The Theory
might apply, largely because of a claimed Perot
overperformance two decades ago in some states other than
New Mexico:
The drop in turnout occurs in a rough diagonal, stretching from northern Maine, across upstate New York (perhaps surprisingly, turnout in post-Sandy New York City dropped off relatively little), and down into New Mexico. Michigan and the non-swing state, non-Mormon Mountain West also stand out. Note also that turnout is surprisingly stable in the Deep South; Romney’s problemwas not with the Republican base or evangelicals (who constituted a larger share of the electorate than they did in 2004).
For those with long memories, this [diagonal] stands out as the heart of the “Perot coalition.” That coalition was strongest with secular, blue-collar, often rural voters who were turned off by Bill Clinton’s perceived liberalism and George H.W. Bush’s elitism. They were largely concentrated in the North and Mountain West: Perot’s worst 10 national showings occurred in Southern and border states. His best showings? Maine, Alaska, Utah, Idaho, Kansas, Nevada, Montana, Wyoming, Oregon and Minnesota. (Emphasis added)
Interestingly, Ross Perot in 1992 New Mexico with 16.12%
underperformed his national 18.91% by 2.79 percentage points,
and Perot broke the 20 percent threshold in only five of the
33 counties: three in Little Texas (Lincoln, Sierra and
Otero (Alamagordo)), the atomic center of Los Alamos, and
the Swing Vote county of Luna (Deming) in the Boot Heel.
29

Number Six was the Little Texas county of Lea (Hobbs) at
19.82%.
In contrast, Michael Barone in his infamous Election
Eve 2012 prediction of “Romney 315 [because of]
fundamentals”25 simply treated New Mexico as “Uncontested.
Obama” although the two University of Colorado professors
who used state-level economic data to predict Romney with
330 electoral votes, in early October moved New Mexico into
the “narrow Romney win” column.26 Dr. Larry Sabato, Kyle
Kondik and Geoffrey Skelley in their 2013 Crystal Ball analysis
of the 2016 election27 suggested a Midwestern strategy to
offset Democratic trends in the southwest:
Republicans might want to consider a Midwestern candidate in 2016 because if current demographic trends continue, the Midwest could be the must-win area for Republican presidential candidates. It’s whiter than the nation as a whole. This matters because Republicans may not be able to do much better than their current 20% of the votes of non-white voters (all racial groups combined),and non-whites will probably make up about 30% of the presidentialelectorate next time. Therefore, the GOP nominee will need to squeeze even more votes out of the nation’s white presidential
25 Michael Barone, “Going out on a limb: Romney beats Obama, handily”, The Washington Examiner,
November 2, 2012 [www.examiner.com].
26 Two University of Colorado professors who shall remain nameless, and who looked only at state-level economic data and ignored electoral history and everything else. The predicted Romney 330 also included Minnesota and Wisconsin (previous stops on the Electoral College Junket).
27 The Crystal Ball, “16 for ’16, Part 2: An Elephant Rises From The Heartland”, available at http://www.centerforpolitics.org/crystalball
30

electorate, which will make up the other 70% or so of 2016’s voters. (Keep in mind that Romney won whites with a landslide 59% on his way to a losing 47% of the total vote.)
Chart 1 shows the 12 states in the 2012 election where the winningcandidate received 53% or less of the vote -- in other words, the dozen most competitive states. Five of the 12 are in or near the Midwest and are much whiter than the nation as a whole. Their electorates were on average 85% white in 2012, versus 72% for the entire nation, according to national and state exit polls.
If Mitt Romney had won these five states -- Iowa, Minnesota, Ohio, Pennsylvania and Wisconsin -- he would have been president, with exactly 270 electoral votes. (Emphasis added)
“Ace of Spades HQ” website operator Brandon Finnigan in
his The Federalist article “The GOP’s “Just Get to
270″ Electoral Strategy Needs A Complete
Overhaul”, recommended that Republicans forget about
the southwest or Virginia and look to the Midwest for
the 2016 target list:I say we stop burning enormous amounts of money in Virginia, Nevada, and Colorado, and instead invest it in Pennsylvania, Florida, and the Midwestern states of Ohio, Minnesota, Wisconsin, Michigan and Iowa, with a goal of winning at least 300 electoral votes.
Mr. Finnigan’s analysis was based on a state-by-state comparison of the Republican popular vote percentage point two-party margins in 2000 and 2012, ignoring the Nader 2000 siphon factor, and assigning priority to states where the Republican percentage point margin between 2000 and 2012 grew more than the national Republican margin movement. Mr.Finnigan’s article said nothing about New Mexico, but his maps colored New Mexico deep blue. The Missing White Voter Theory lead article says some of the missing voters are in
31

New Mexico, but except for this stray comment, Republicans appear to be conceding New Mexico, which if true makes the 2016-2020 Blue Wall electoral vote total 251, or 257 with Iowa added; 263 with Nevada added; and a winning 272 with Colorado added.
New Mexico: America’s Atypical Bellwether State Now Overperforms for the Democrats
At this point it may be useful to compare New Mexico’s Presidential winner percentages with the national popular vote percentages (later in this article we will dive into the New Mexico county-level internals, which have flip-flopped between 1912 and 2012). Keep in mind that in the century’s worth of 26 Presidential elections between the NewMexico statehood year of 1912 and 2012, New Mexico has votedfor the Electoral College loser only twice (1976 Ford, 2000 Gore) and the national popular vote loser only once (1976 Ford), despite being the least Caucasian and most Hispanic or Native American state in the United States. Moreover, theHispanic culture in New Mexico (and southern Colorado) is not the immigrant culture of East Los Angeles or New York City, but rather is the remnant of the Old World Spanish empire.28 The Palace of the Governors in Santa Fe is the oldest continuously used public building in the United States, and its first 1610 use29 predates Plymouth Rock. Thus, ethnically balanced statewide tickets, bi-lingual
28 See the discussion in Kevin Phillips, The Emerging Republican Majority, pages393-395, and in any New Mexico state write-up in Michael Barone’s The Almanac of American Politics..
29 Michael Barone, The Almanac of American Politics 2014, pages 1115, 1132.
32

campaigning, and even campaign interpreters30 were a staple of New Mexico politics long before the Voting Rights Act. These tactics proved fruitful for Republicans at the beginning31: America’s second Hispanic U.S House Member was Republican Benigno Hernandez32, first elected to New Mexico At-Large in 1914 when he defeated 1912 Democratic incumbent Harvey Ferguson, only to lose to Democrat William Walton in a 1916 three-way where a Socialist took 3.07%. Hernandez came back to win a three-way in the 1918 Republican House retaking year. In 1920, the Republican baton was passed to Nestor Montoya, but in 1922, Republicans ran a suffragette, Adelina Otero-Warren, who lost to Democrat John Morrow in that year’s Democratic tsunami; Morrow held the seat until he was caught in the 1928 Al Smith undertow. Democrats elected their first New Mexico Hispanic U.S. House Member in1930, when future U.S. Senator Dennis Chavez defeated 1928 Republican Albert Simms.33
30 New Mexico’s first Hispanic Democratic Member of Congress, 1930 winner and 1936-1957 U.S. Senator Dennis Chavez, started his career as an interpreter as one of the interpreters for the successful 1916 Class I U.S. Senate campaign of Democrat Andreius Jones. www.wikipedia.org, “Dennis Chavez”. 31 If it were up to President Taft and the 61st Congress House, New Mexico and Arizona would have been admitted as one state so the New Mexico Republican vote could squash the Southern expatriate Democratic vote in Arizona, but a Southern Democratic filibuster in 1911 stopped the Republican legislation, and in 1912 New Mexico was admitted as state47 and Arizona as state 48. Todd Purdum, An Idea Whose Times Has Come (Henry Holt, New York, N.Y., 2014), page 277.
32 The first was California-4 Republican Romualdo Pacheco, winner by onevote on Election Night 1876, but loser in the Committee on Elections by 4 votes. Pacheco won the seat without a contest in 1878 and 1880.
33 The other Hispanic Democrat elected in 1930 was Louisiana-1 Joachim “Bathtub Joe” Fernandez.
33

At the Presidential level, the New Mexico Woodrow Wilson percentages in 1912 and 1916 were within one point ofthe national Wilson percentage, but in 1920 and 1924, the record-loser Southern-oriented James Cox and John W. Davis Democratic tickets overperformed national in New Mexico by more than five percentage points; however, Republican Herbert Hoover running against Al Smith overperformed national in New Mexico by 0.79 of a point. Democrats were unable to win a State Senate majority from 1912 through 1928, but flipped the State House in 1922 and held the majority in 1924, although they lost it in 1926, with the Republican majority holding in 1928. Republicans won the first Class II U.S. Senate seat election in 1918, but lost the seat in 1924, and would not win it back until the Pete Domenici win in 1972. Democrats won the Class I (current Martin Heinrich) seat in 1916 and 1922 with Andreius Jones, but lost the seat to progressive Republican Bronson Cutting in 1928. On the two-year-term gubernatorial front, between 1912 and 1948, Republicans prevailed only in 1918, 1920 and 1926.
In the New Deal era, New Mexico’s FDR and Truman
percentages overperformed national, by anywhere from eight
one hundredths of a percentage point (1944) to 6.83 points
(1948). In the Eisenhower 1952-1960 interregnum, New Mexico
overperformed for Eisenhower by 0.21 and 0.44 of a
percentage point, and overperformed for JFK 1960 by 0.43 of
a point (JFK won the state by a raw 2,294). However, in 1964
President Johnson underperformed national by 1.83 points.
During the 1932-1964 period, Republicans were unable to
34

elect either U.S. Senator34, although they elected two-year-
term Governors in 1950, 1956 and 1960 (a ticket-split in the
JFK year). Republicans were unable to win either At-Large
U.S. House seat (one from 1912 through 1940, and starting in
1942, two seats elected at-large) until 1968, when federal
enactment of a mandatory U.S. House districting statute35,
the Johnson Administration shutdown of Walker Air Force Base
in Roswell36, and Democrats running an Anglo candidate
against Republican Hispanic Manuel Lujan in the Santa
Fe/Albuquerque district resulted the Republicans wining both
New Mexico seats -- two of the net five national U.S. House
seats gained by the GOP in 1968. The district 1 1968
Albuquerque flip lasted all the way until 2006.
Republicans in 1966 elected progressive David Cargo as
Governor, and reelected him in 1968. In contrast, on the
state legislature front, Republicans lost control of the New
Mexico House in 1930 and the New Mexico Senate in 1932;
Republicans through 2014 have yet to win back the Senate, 34
? The Senators in the Class I seat were Democrats Dennis Chavez from 1936 through 1964, and Joseph Montoya from 1964 through 1976; in the Class II seat, Democrats Sam Bratton from 1924 through 1934; Carl Hatch from 1934 through 1948; and Clinton Anderson from 1948 through 1972.
Hatch is known to history for the authorship of the federal Hatch Act, which prior to 1993 prohibited all federal Executive Branch employees from off-duty partisan activity other than voting; Clinton Anderson is the second half of the Price-Anderson nuclear liability limitation statute.35
? Public Law 90-196, United States Code Title 2, section 2 (c).
36 Michael Barone, The Almanac of American Politics 1972, page 506.
35

and won back the House for only one biennium (in 1952),
meaning Democrats have controlled both chambers for 52
years. The current Santa Fe Roundhouse numbers: Senate
Democratic 24-17, House Democratic 38-30. The New Mexico
Senate is tied with the West Virginia House as the seventh-
longest currently and continuously Democratic state
legislature chamber in the United States.
For President Nixon’s 1972 reelection, New Mexico
overperformed by 0.38 of a point, and Republicans elected
their first U.S. Senator since 1934, Class II Senator Pete
Domenici (who was also the first Class II Republican since
1918-1924). Democrats in 1970 re-flipped the Las Cruces
district 2 U.S. House seat with conservative Democrat Harold
Runnels, who held the seat until 1980, but were unable to
win the Albuquerque district 1 seat lost in 1968 until 2006.
In 1976, New Mexico for the first time ever voted for the
national popular vote loser, Republican President Gerald
Ford, and did so with a 2.74 point overperformance that
likely helped astronaut Harrison Schmitt flip 1964 U.S.
Senator Joseph Montoya out of the Class I seat, which was
last Republican in 1928-1934 (progressive Bronson Cutting).
However, Democrats between 1970 and 1982 elected all five
Governors to four-year terms: in 1970 (Bruce King I), 1974
(Jerry Apodaca), 1978 (Bruce King II) and 1982 (Toney
Anaya).
36
New Mexico in 1980 voted for Ronald Reagan by 4.22
percentage points above national, but the overperformance
disappeared in The Eighties, with President Reagan in 1984
overperforming by only 0.93 of a point, and Vice President
Bush the Elder in 1988 underperforming national by 1.51
points. New Mexico won a third U.S. House district in the
1980 Census, and the tri-Democratic redistricters placed it
in Santa Fe-Taos, enabling 1980 district 1 narrow loser Bill
Richardson to easily prevail in 1982 district 3; through
2014 and likely beyond, New Mexico-3 has been Republican
only once, in a 1997 special election where the Green Party
took 16.78% and enabled a Republican to win with 42.78%, an
anomaly that was shelved in the 1998 general election won by
current U.S. Senator Tom Udall. Republicans in 1986 elected
their first Governor since 1968, Gary Carruthers, but he was
bounced in 1990 by the third successful gubernatorial run of
Bruce King (joined by future 1994 primary opponent Ms. Casey
Luna).
The 1992 Ross Perot air raid in New Mexico scored a
below-national 16.12%, but the Collateral Damage Ratio was
Republican 14.52 to 1, as Democrat Bill Clinton
underperformed Mike Dukakis by only one point (45.90 versus
46.90), whereas the Bush percentage crashed from 51.86% to
37.34%. Thus, Bill Clinton overperformed national by 2.89
points, and in 1996, President Clinton’s 49.18%
underperformed national by only five one hundredths of a
37

percentage point, even though the first Ralph Nader campaign
took 2.38%. In 2000, Nader took 3.55 points, causing Al Gore
to underperform national by 0.47 (Bush the Younger
underperformed national by 0.02), and the Nader siphon
pushed Gore’s margin down to a raw 366, the closest state-
level raw margin in 2000; only the Nader Santa Fe decline from
7.11 percent in 1996 to 6.50 percent in 2000 saved Gore from
a razor-thin New Mexico margin of 64 votes37 that would have
been the fourth-closest statewide Presidential raw margin in
American history.38
In the 1994 Republican tsunami, Republicans elected
future libertarian Gary Johnson as Governor, thanks in part
to a Green Party 10.26% for former Democratic Lieutenant
Governor Roberto Mondragon that enabled Gary Johnson to win
with 49.81% and a 9.89 point margin over three-term Governor
Bruce King. Republicans reelected Johnson with a two-way
54.53% in the relatively Democratic year of 1998, making
Johnson the first Republican Governor to be reelected since
1968. In the relatively Republican year of 2002, however,
Democrat Bill Richardson came back with a three-way 55.48%
37 A Nader 7.11% performance in 2000 Santa Fe against the total vote of 49,471 would have increased Nader’s raw vote from 3,215 to 3,517, and assuming they were all potential Gore votes, would have reduced the Goreraw vote in Santa Fe from 32,017 to 31,715. In adjacent Taos County, the Nader percentage rose from 6.57% to 9.77%. In Bernalillo (Albuquerque), Nader went from 2.89% to 4.05%.38
? Behind actual raw margins of 25 in Delaware 1852 (Franklin Pierce), 51in 1904 Maryland (Theodore Roosevelt), 56 in 1916 New Hampshire (WoodrowWilson), and knocking down to fifth place Hawaii 1960 (Kennedy by 115).
38

(with 5.47% to the Green Party), and in the Democratic year
of 2006, was reelected with a two-way 68.82%, the largest
gubernatorial percentage in New Mexico history.39
In 2004, President Bush the Elder drove a record
turnout in Little Texas and won New Mexico by a raw 5,988 or
0.79 of a point (Ralph Nader took 0.52%), from 49.84% that
underperformed national by 0.89 of a point. However, in
2008 and 2012, Barack Obama won New Mexico with percentages
that overperformed national by 4.05 and 1.98 percentage
points. Democrats in 2008 flipped the Class II U.S. Senate
seat of retiring Republican Pete Domenici with Congressman
Tom Udall, who achieved a two-way 61.33%, the highest non-
incumbent percentage in New Mexico Class II history.
Democrats in 2012 passed the Jeff Bingaman 1982 Class I
baton to district 1 Congressman Martin Heinrich with a two-
way 51.01% over previous district 1 Congresswoman Heather
Wilson. In between, Democrats in 2006 flipped the
Albuquerque district 1 U.S. House seat (where they passed
the baton in 2012), and for one 2008 term, won the Las
Cruces district 2 seat, but lost that one in the 2010
Republican tsunami, and through 2012 have been unable to win
back this Mitt Romney 52% seat. Other than the re-flip of
the district 2 U.S. House seat, the only Republican bright
39
? The only other New Mexico Governor to achieve 60 percent was 1962 Governor Jack Campbell, who was reelected in 1964 with a two-way 60.2%. CQ Guide to U.S. Elections, pages 1452-1453, and David Leip U.S. Election Atlas,www.uselectionatlas.com
39

spot was the 2010 gubernatorial win by Susana Martinez –
with a smaller raw number than John Kerry achieved in 2004,
not to mention Barack Obama 2008 or 2012. Republicans lost
every statewide downballot office in 2010 except Secretary
of State, where the Democratic incumbent was encumbered by
unforced error scandals in the office.
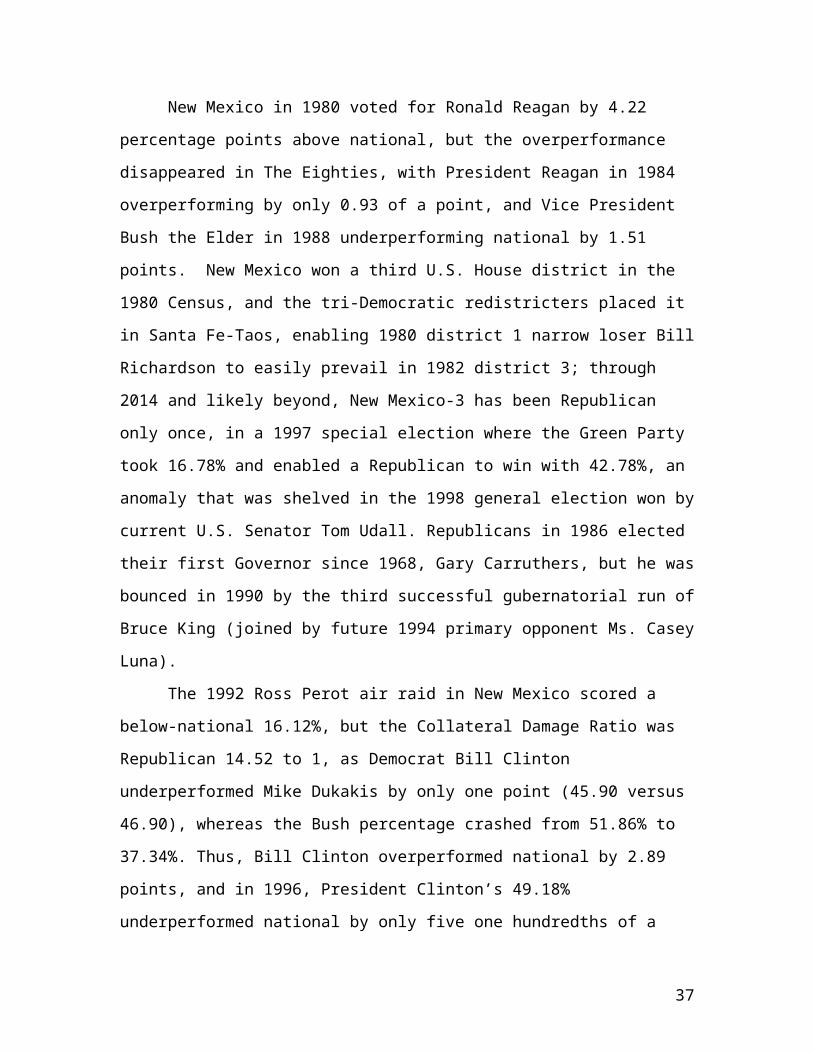
Chart V: New Mexico and the United States, 1912 – 2012
N.M. winner % USA NPV winner % Difference
1912 D 41.39% D 41.83%
D min. 0.44%
1916 D 50.20% D 49.25%
D + 0.95%
1920 R 54.68% R 60.35%
R min. 5.67%
1924 R 48.52% R 54.03%
R min. 5.51%
1928 R 59.01% R 58.22%
R + 0.79%
1932 D 62.72% D 57.41%
D + 5.31%
1936 D 62.69% D 60.80%
D + 1.89%
1940 D 56.59% D 54.72%
D + 1.87%
1944 D 53.47% D 53.39%
D + 0.08%
40
1948 D 56.38% D 49.55%
D + 6.83%
1952 R 55.39% R 55.18%
R + 0.21%
1956 R 57.81% R 57.37%
R + 0.44%
1960 D 50.15% D 49.72%
D + 0.43%
1964 D 59.22% D 61.05%
D min. 1.83%
1968 R 51.85% R 43.42%
R + 8.43%
1972 R 61.05% R 60.67%
R + 0.38%
1976 R 50.75% D 48.28% D 50.08% R 48.01% R +
2.74%, D min. 1.80%
McC. Not on NM ballot
1980 R 54.97% R 50.75%
R + 4.22%
1984 R 59.70% R 58.77%
R + 0.93%
1988 R 51.86% R 53.37%
R min. 1.51%
1992 D 45.90% D 43.01%
D + 2.89% Perot 16.12%
41

1996 D 49.18% D 49.23%
D min. 0.05%
Nader 2.38% Nader 0.71%
Nader + 1.67%
2000 D 47.91% R 47.85% D 48.38% R 47.87% D min.
0.47% R min. 0.02%
Nader 3.55% Nader 2.74%
Nader + 0.81%
2004 R 49.84% R 50.73%
R min. 0.89%
2008 D 56.91% D 52.86%
D + 4.05%
2012 D 52.99% D 51.01%
D + 1.98%
Returning to the mildly cold reality of New Mexico on
Election Day 2012, from 2008 levels the Obama margin in the
Democratic Nine counties fell by all of 9,811 from 85,327 in
2008 to 75,516 in 2012. In contrast, the Republican margin
rose by only 9,867 in the Little Texas Fourteen. In
Albuquerque Metro, the President Obama margin fell by
23,828, and in the six Swing Vote counties, it fell by
4,135. Thus, the statewide Obama margin fell by a net
46,043, but the Obama 2008 margin was 125,590, so Obama
prevailed by 79,547, assisted by the Republican fall-off of
42
11,044. Comparing 2004 to 2012, the Democratic margin
statewide is up by 85,535: up 21,143 in the Democratic Nine;
up 42,018 in Albuquerque Metro; up 11,049 in the Swing Vote
Six; augmented by a Republican margin decline of 11,325 in
the Little Texas 14. Even if the Republican margin in the
Little Texas 14 managed to rise back to the 2004 level of
65,745, it would be offset and then some by the 2012
Democratic Nine margin of 75,516, not to mention the
Democratic Albuquerque Metro margin of 46,765 and the
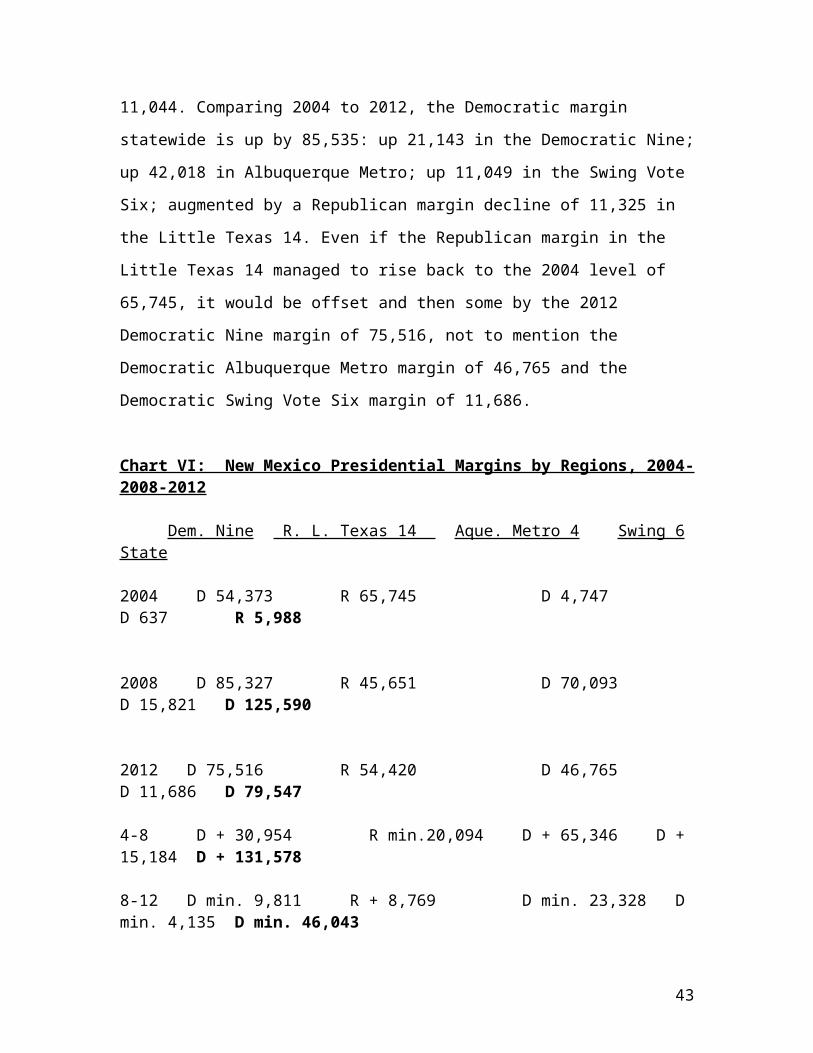
Democratic Swing Vote Six margin of 11,686.
Chart VI: New Mexico Presidential Margins by Regions, 2004-2008-2012
Dem. Nine R. L. Texas 14 Aque. Metro 4 Swing 6 State
2004 D 54,373 R 65,745 D 4,747 D 637 R 5,988
2008 D 85,327 R 45,651 D 70,093 D 15,821 D 125,590
2012 D 75,516 R 54,420 D 46,765 D 11,686 D 79,547
4-8 D + 30,954 R min.20,094 D + 65,346 D + 15,184 D + 131,578
8-12 D min. 9,811 R + 8,769 D min. 23,328 D min. 4,135 D min. 46,043
43

4-12 D + 21,143 R min. 11,325 D + 42,018 D + 11,049 D + 85,535
New Mexico: Small But Important Part of The Democratic Electoral College
Advantage
In the unlikely event that a Republican swipe of the 5
New Mexico electoral votes occurs, it reduces the Blue Wall
number from 257 to 252, meaning Democrats need 18 additional
electoral votes to win, so a stand-alone win of either
Virginia (13), Colorado (9), or Nevada (6) would not be
enough – Democrats would have to either win Ohio (18), win
Florida (29), or win all three two in the trio of Virginia
(13), Colorado (9) or Nevada (6). However, if Democrats hold
New Mexico (5), Iowa (6) and the 246 John Kerry electoral
votes40, at 257 they only need to win Virginia (13) or the
combination of Nevada (6) and Colorado (9).
In contrast, for Republicans to move up from 206 to 270
in the 2012-2020 Electoral College, they must add 64
electoral votes. Since it is highly unlikely the Republicans
will Right the Left Coast by flipping the 67 from California
(55) and Washington (12)41, Republicans are likely to target40 246 on the 2012-2016-2020 map. On the 2004 map, Kerry achieved 252.41
44

the three closest Romney loss states (Florida with 29, Ohio
18 and Virginia 13), but even if the GOP wins all three it
still need one other state with at least four electoral
votes (any one of New Mexico (5), Michigan (16), Iowa (6),
New Hampshire (4), Colorado (9), Minnesota (10), Wisconsin
(10), New Mexico (5) or Nevada (6)). Republicans could make
up for their inability to flip Minnesota (10) and Wisconsin
(10) or Ohio (18) by winning the twenty electoral votes from
the combination of New Mexico (5), Nevada (6) and Colorado
(9), which along with holding Ohio is how they won in 2004.
Without New Mexico, Nevada and Colorado, Republicans must
win Florida (29), Ohio (18), Virginia (13) and either New
Hampshire (4), Iowa (6), or a Kerry state.
New Mexico: Not Enough Republican Caucasian Voters, Missing or
Otherwise, In Little Texas To Offset The Democratic Margins In Santa Fe, Taos,
Las Cruces and Albuquerque
New Mexico does not have a sufficiently large pool of
Republican Little Texas Fourteen “missing white voters” to
flip the state, perhaps because the New Mexico exit polled ? California-Washington and California-Colorado are the smallest combination of states with 64-plus electoral votes, but the Obama percentage point margins in 2012 California, Washington, and Colorado were 23.09, 14.77 and 5.36.
45

2012 statewide electorate was the least Caucasian outside of
D.C.: 51 percent versus, for example, 87 percent in
Minnesota or 86 percent in Wisconsin. According to the 2010
Census website, the total New Mexico population of
2,059,179 was only 39.8% Non-Hispanic White (NHW), but was
47.0% Hispanic, 10.2% Native American, 2.4% African-
American, and 1.6% Asian-American.
As indicated in Chart VII at the end of this article,
of the 33 New Mexico counties, the only ones that are
majority NHW are Los Alamos, Torrance, and 11 of the 14
Little Texas counties. It should be noted that two of the
three large total vote counties in Little Texas, Chaves
(Roswell) and Lea (Hobbs), are both 53.3% Hispanic. As for
the other 12 Little Texas counties, five have Hispanic
minorities of 40 percent or more, and Otero (Alamagordo) is
Hispanic 35.3% and Native American 7.1%. The eligible or
registered nonvoter population in Little Texas is likely to
become more Hispanic and Native American over time, if it is
not already. This may explain why Democrats from 2004 loser
Kerry to 2012 reelected President Obama actually gained
1,304 raw votes in Little Texas, 21.77% of the 2004 Bush
statewide margin.
2004: Republican Peak Year Nationally and in New Mexico
46

Why compare 2004 and 2012? Because 2004 represents the
all-time high Republican raw number in the United States
(62,039,572) and in New Mexico (376,930). As for 2012, it
represents a Democratic comedown from the all-time raw
number high achieved in the 2008 United States (69,499,428)
and in New Mexico (472,422). Nationally, between 2008 and
2012 Obama lost 3,582,170 raw votes, but because Mitt Romney
added only a net 981,912, Obama won the national popular
vote by 4,985,023, a comedown from the 2008 margin of
9,549,105.42 In New Mexico, the Obama comedown from 2008
was 57,087 raw votes, but Romney in New Mexico
underperformed McCain by 11,044, enabling President Obama to
hold New Mexico by a comfortable 79,547 raw (10.15
percentage points). President Obama in 2012 New Mexico
turned out only 87.91% of his 2008 raw number of 472,422 –
much lower than Obama 2012 percentage turnouts of 2008
numbers in Minnesota (98.27%), Iowa (99.22%), Wisconsin
(96.64%), Ohio (93.23%) or Pennsylvania (91.26%)43, but 42
? Obama lost 33 electoral votes: 11 from Indiana, 15 from North Carolina, 1 from the Nebraska-2 U.S. House district, and 6 from Census net electoral vote losses in the double-Obama states.
43 Democratic Presidential raw vote numbers:
2008 2012Minnesota: 1,573,354 1,546,167
Iowa: 828,940 822,544
Wisconsin: 1,677,211 1,620,985
Pennsylvania: 3,276,263 2,990,274
47
enough when Romney only turned out 96.81% of his 2008
fifteen-point-loss raw number instead of increasing it.
This illustrates the fundamental problem the Republicans
have in New Mexico and other states: their contingent 2004
peak number has been swamped by the fundamental Democratic
turnout surge of 2008 that in 2012 came back at an 87.91%
clip, whereas Republicans in New Mexico could not even match
the McCain 2008 landslide loss number.
The Romney loss cannot be blamed on the Libertarian
candidacy of 1994-2002 Republican Governor Gary Johnson, who
only took 27,787 raw or 3.55 percent, gains over the 2008
Libertarian Bob Barr (2,428 raw, 0.29 percent) of 25,359 or
3.26 percentage points, although the Libertarian 2008-2012
increase in Los Alamos (from 0.61 to 5.62 percent) enabled
President Obama to hold the county by a plurality.
New Mexico 2012: Republicans Are Behind The Democrats in Net New
Votes Since 2004
The Republicans have lost 41,142 New Mexico votes since
2004, whereas the Democrats have added 44,393. When the New
Ohio: 2,940,044 2,741,167
48

Mexico polls closed on Election Night 2012 at 2100 hours
Eastern Standard Time44 the Electoral College outcome was
all over but the counting – as in Ohio, Romney
underperformed the McCain New Mexico raw number, so Barack
Obama would have needed to crash by 136,633 or 28.92 percent
for Romney to win New Mexico by one vote. Instead,
President Obama lost only 12.09 percent of his 2008 New
Mexico raw number, meaning he held New Mexico (5) along with
Nevada (6) and Virginia (13), an exact 270 even if he lost
Ohio, Florida, Iowa, and Colorado. Or, President Obama could
wait until the 2200 hours Eastern Standard Time poll closing
time in Colorado (9) and Iowa (6), and watch 15 electoral
votes come in that would make irrelevant any combined loss
of Florida, Ohio, and Virginia (al;l of which went for
President Obama).
Not Enough Registered Nonvoter Growth in Little Texas To Top The Obama
2012 Margin
The Missing White Voter Theory says New Mexico voters
in Little Texas stayed home, but the registered nonvoter
growth number in these 14 counties between 2004 and 2012 was
only 23,800 – less than one third of the 2012 Obama New
Mexico margin of 79,547. In other words, all 16,199 of the
44
? 1900 hours Mountain Standard Time.
49

2004-2012 Little Texas registration increase and all 7,601
of the 2004-2012 voting decrease could turn out at a 100%
Republican rate in 2016, and the Obama 2012 statewide margin
still prevails by 55,747.
The remaining 2004-2012 registered nonvoter growth in
New Mexico comes to 113,974: 12,910 in the Democratic Nine,
82,130 in Albuquerque Metro Four, and 18,934 in the Swing
Vote Six. Apply the 55 percent Trende turnout percentage to
these numbers from outside Little Texas, and one comes up
with another 62,685, which when added to 55 percent of the
Little Texas registered nonvoter growth number (13,090) adds
up to 75,775 – short of the 2012 Obama statewide margin by
3,772.
In his initial November 8, 2012, article, Mr. Trende
argued that Republican Ohio turnout rose in the white-collar
suburbia around Columbus and Cincinnati, but fell in blue-
collar or rural Ohio because these voters were turned off by
both President Obama and Mitt “47 percent” Romney. Trende
stated as follows on November 8, 2012:
We can see that the counties clustered around Columbus in the center of the state turned out in full force, as did the suburban counties near Cincinnati in the southwest. These heavily Republican counties are the growing areas of the state, filled with white-collar workers.
Where things drop off are in the rural portions of Ohio, especially in the southeast. These represent areas still hard-hit by the recession. Unemployment is high there, and the area has seen almost no growth in recent years.
My sense is these voters were unhappy with Obama. But his negativead campaign relentlessly emphasizing Romney’s wealth and tenure at
50

Bain Capital may have turned them off to the Republican nominee aswell. The Romney campaign exacerbated this through the challenger’s failure to articulate a clear, positive agenda to address these voters’ fears, and self-inflicted wounds like the “47 percent” gaffe. Given a choice between two unpalatable options, these voters simply stayed home.
These comments not only misstate the actual Ohio results
that would not be certified for another 28 days, they also
simply do not apply to the 2004 Bush state of New Mexico,
because of the 33 New Mexico counties, only 13 are majority
NHW, and one of these is the Bush-to-Obama/Obama county of
Los Alamos. The only New Mexico counties with a significant
Republican NHW vote are sixteen: the 11 Little Texas NHW-
majority counties, the Little Texas micropolitan majority-
minority counties of Chaves (Roswell), Lea (Hobbs), and San
Juan (Farmington)45, the Albuquerque exurb of Torrance, and
the Boot Heel county of Luna (Deming). None of these
counties have a significant Appalachian concentration (the
western end of the Appalachian Belt is in southern
Missouri). The total 2004-2012 registered nonvoter growth
number in these 16 counties is all of 26,260: Little Texas
23,800 (including Chaves, Lea and San Juan), Torrance 851,
and Luna 1,609. Los Alamos is majority NHW, but it went for
Barack Obama twice, two of the five Democratic Presidential
45 San Juan County by the 2010 Census is majority-minority, but it votesheavily Republican (62.39% for Romney 2012; only a 93 vote margin for President Johnson in 1964; and no Democratic wins between 1940 and 1960 and 1968-2012).
51

wins in the 16 elections since Los Alamos began reporting
separately in 1952.46
This article and its’ appended (at the end of this
article) Charts XX (registration, voting and turnout), XXI
(partisan voting), XXII (Democratic party registration), and
XXIII (Republican and Other party registration) divide the
33 New Mexico counties as follows: the Democratic Nine, the
Little Texas 14, the Albuquerque Metro Four, and the Swing
Vote Six.
The Democratic Nine were each carried by John Kerry
2004 and both Obama campaigns, and in parentheses is noted
the last year in which the county voted for a Republican
Presidential candidate: Santa Fe (1972), Taos (1972),
McKinley (Gallup, 1980), Grant (Silver City, 1980), Mora
(1972), Rio Arriba (Tierra Amarilla, 1956), San Miguel (Las
Vegas, 1956), Guadalupe (Santa Rosa, 1984), and Cibola
(Grants, 1984).47
In contrast, each of the Little Texas 14 voted for
President Bush the Younger, John McCain, and Mitt Romney; in
parentheses is noted the last year the county voted for a
Democratic Presidential candidate other than President Johnson
in 1964: Chaves (Roswell, 1948), Lea (Hobbs, 1960),
46 The other three: Adlai Stevenson 1952, JFK 1960, and President Johnson 1964. 47 Cibola County did not report separately until 1984; prior to 1981 it was part of Valencia County (www.wikipedia.org, “Cibola County, New Mexico”).
52

Roosevelt (Portales, 1948), San Juan (Farmington, 1936),
Otero (Alamagordo, 1960), DeBaca (1996), Sierra (1996), Eddy
(1996), Quay (1976), Union (1948, Goldwater), Harding (1948,
Goldwater), Curry (1948), Lincoln (1936, Goldwater), and
Catron (1948). As can be seen, three of the Little Texas 14
are the only Goldwater 1964 counties in New Mexico48, and of
the eleven LBJ Little Texas counties, San Juan last voted
Democratic in 1936, four last voted Democratic in 194849,
two last voted for another Democrat in 1960, Quay
(Tucumcari) last voted Democratic in 1976, and three
(DeBaca, Sierra and Eddy) gave President Clinton plurality
wins thanks to the Ross Perot encore siphon.50 If a
Republican is going to carry New Mexico, he or she must
wring every possible vote out of these 14 counties.
All but three of the remaining ten counties outside the
partisan-polarized Democratic Nine and Little Texas 14 have
been continuously Democratic post-1988, but all were
Republican in the Nixon-Ford-Reagan era. Four are in the
Albuquerque Metro area (Bernalillo, Sandoval, Torrance and
Valencia), and the Swing Vote Six are Dona Ana (Las Cruces),
Los Alamos, the Little Texas adjacent county of Colfax
(Raton), and the southwestern or Boot Heel counties of
48 Harding, Lincoln and Union.
49 Chaves (Roswell), Roosevelt (Portales), Curry and Catron.
50 DeBaca’s last Democratic Presidential majority was in 1976 (Jimmy Carter), Sierra’s was in 1948 and 1964 (Truman and Johnson), and Eddy’s was also in 1976 and 1964.
53

Socorro, Hidalgo (Lordsburg) and Luna (Deming). The
Albuquerque exurb of Torrance and the Boot Heel county of
Luna are the two that voted for Romney in 2012; Torrance
also voted Republican in 2004 and 2008, but Luna was
Republican in 2004, Democratic in 2008 and Republican in
2012. The atomic county of Los Alamos and the Colorado
border county of Colfax voted for Bush in 2004, but went for
Obama in 2008 and 2012.
Chart VIII below displays the relative registration and
vote shares of the regions, using 2004 and 2012 registration
and the total vote for any office in 2004 and 2012. As can
be seen, of the 1,254,567 registered voters in 2012 New
Mexico, 21.44% are in Little Texas and 20.25% are in the
Democratic Nine; the remaining 58.31% are in Albuquerque
Metro (45.32%) and the Swing Vote Six (12.99%). The total
vote for any office in 2012 (786,522) came 21.14% from
Little Texas, 20.34% from the Democratic Nine, 45.83% from
Albuquerque Metro, and 12.67% from the Swing Vote Six. As
can be seen, the registration proportion from Little Texas
was larger than the total vote proportion, but only by 30
one hundredths of a percentage point; in contrast,
Democratic Nine total vote proportion exceeded the
registration proportion by nine one hundredths of a
percentage point. Albuquerque Metro voting overperformed
registration by 51 one hundredths, and the Swing Vote Six
registration overperformed voting by 32 one hundredths.
54

Chart VIII: New Mexico Registration and Total Vote for AnyOffice by Regions, 2004-2008-2012State: 1,254,567 – 1,105,372 + 149,195 786,522 -- 4,875,692 min. 94,991
Dem. Nine Repub. LT 14 Metro AQUE 4 SwingVotes 6 State
2004 Reg. 242,071 252,888 467,388 143,025 1,105,372 2008 Reg. 251,814 250,043 522,435 158,789 1,183,081
2012 Reg. 254,169 269,087 568,648 162,663 1,254,567
2004 Vote. 160,841 173,884 341,350 99,026 775,301
2008 Vote 170,915 175,613 381,341 105,496 833,365
2012 Vote 160,029 166,283 360,480 99,730 786,522
Chart IX below shows the New Mexico 2004, 2008 and 2012
Presidential margins in each of the four regions and
statewide. As can be seen, the two partisan-polarized
regions in 2004 (Democratic Nine and Little Texas 14) gave a
23-county 11,372 vote edge to the Bush campaign, and even
55
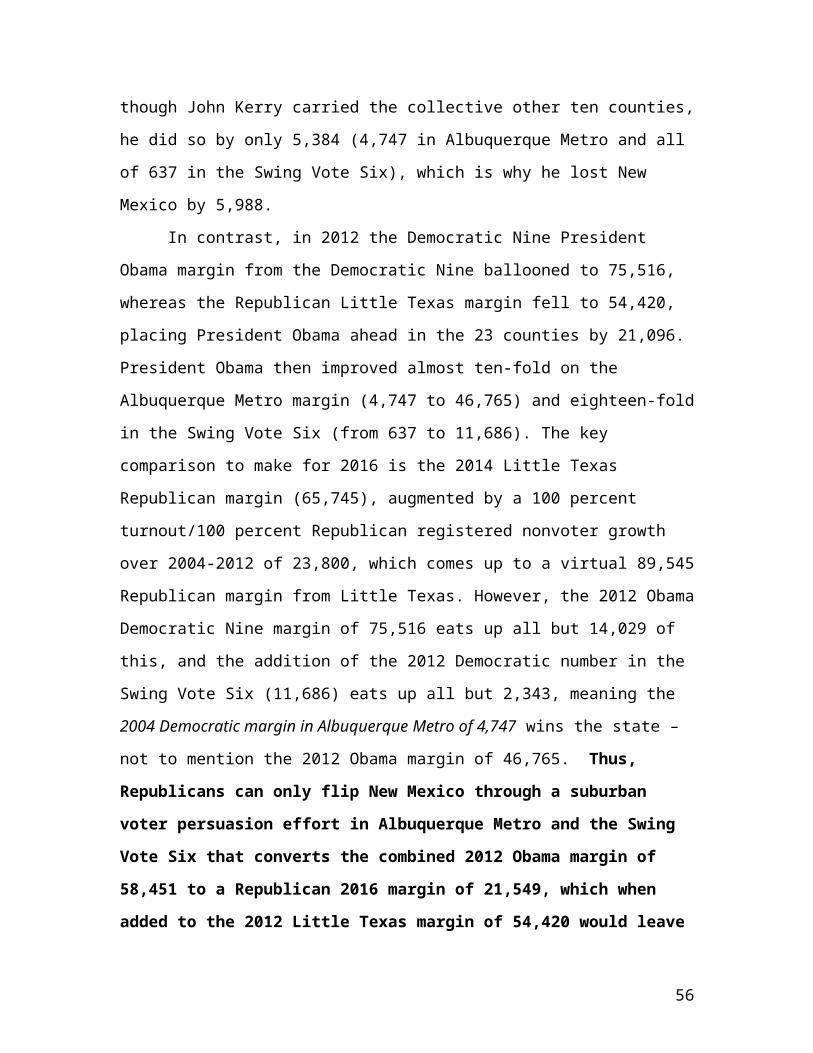
though John Kerry carried the collective other ten counties,
he did so by only 5,384 (4,747 in Albuquerque Metro and all
of 637 in the Swing Vote Six), which is why he lost New
Mexico by 5,988.
In contrast, in 2012 the Democratic Nine President
Obama margin from the Democratic Nine ballooned to 75,516,
whereas the Republican Little Texas margin fell to 54,420,
placing President Obama ahead in the 23 counties by 21,096.
President Obama then improved almost ten-fold on the
Albuquerque Metro margin (4,747 to 46,765) and eighteen-fold
in the Swing Vote Six (from 637 to 11,686). The key
comparison to make for 2016 is the 2014 Little Texas
Republican margin (65,745), augmented by a 100 percent
turnout/100 percent Republican registered nonvoter growth
over 2004-2012 of 23,800, which comes up to a virtual 89,545
Republican margin from Little Texas. However, the 2012 Obama
Democratic Nine margin of 75,516 eats up all but 14,029 of
this, and the addition of the 2012 Democratic number in the
Swing Vote Six (11,686) eats up all but 2,343, meaning the
2004 Democratic margin in Albuquerque Metro of 4,747 wins the state –
not to mention the 2012 Obama margin of 46,765. Thus,
Republicans can only flip New Mexico through a suburban
voter persuasion effort in Albuquerque Metro and the Swing
Vote Six that converts the combined 2012 Obama margin of
58,451 to a Republican 2016 margin of 21,549, which when
added to the 2012 Little Texas margin of 54,420 would leave
56

the Democratic Nine margin of 75,516 short by 453 votes. Of
course, Republicans must hope that Democrats do not move up
to the Obama 2008 levels of a Democratic Nine 85,327 (plus
9,811), Albuquerque Metro 70,093 (plus 23,328) or a Swing
Vote Six 15,821 (plus 4,135), which at a combined 171,241
would place the 2016 Democrat ahead of the souped-up Little
Texas Missing White Voter margin of 89,545 by 81,696 –
slightly more than the 2012 Obama margin of 79,547.
Chart IX: New Mexico Presidential Margins by Regions, 2004-2008-2012
Dem. Nine Repub. LT 14 Metro AQUE 4 Swing Votes 6 State
2004 D 54,373 R 65,745 D 4,747D 637 R 5,988
2008 D 85,327 R 45,651 D 70,093 D 15,821 D 125,590
2012 D 75,516 R 54,420 D 46,765 D 11,686 D 79,547
4-8 D + 30,954 R min. 20,094 D + 65,346D + 15,184 D + 131,578
8-12 D min. 9,811 R + 8,769 D min. 23,418 D min. 4,135 D min. 46,043
4-12 D + 21,143 R min. 11,325 D + 42,018 D + 11,049 D + 85,535
57

The Missing White Voter Theory Is Missing Actual Registrations and Actual
Voters
The Missing White Voter Theory has no actual voters.
Even though the final certified Ohio 2012 returns turned out
to be at variance with his November 8, 2012 article, Mr.
Trende in a subsequent four-part Real Clear Politics series51,
expanded his argument nationwide, arguing that “[t]he most
salient demographic change from 2008 to 2012 was the drop in
white voters” and claiming that a national 6.5 million
Caucasian eligible voters stayed home in 2012. Mr. Trende
stated in his 2013 articles that even if the missing 6.5
million broke 70-30 for Romney, by itself this group it 51 Real Clear Politics, June 21, 2013, “The Case of the Missing White Voters, Revisited”; June 25, 2013, “Does GOP Have to Pass Immigration Reform”; June 28, 2013, “The GOP and Hispanics: What the Future Holds”; July 2, 2013, “Demographics and the GOP, Part IV.” The July 2 article is a replyto critics Karl Rove, Jonathan Chait, and the concerned multitudes who expressed concern that GOP emphasis on running up Caucasian percentages would lead to unhealthy racial polarization.
58
would not have won the 2012 election for the Republicans,
but in 2016 and in future elections Republican appeals that
turn them out, combined with reduced African-American
Democratic turnout, would carry the day for the GOP –
because according to Trende, it is fine that the Nineteenth
Century anti-slavery party has become the Twenty-first
Century equivalent of the 1868 Democratic “White Man’s
Party”52 since “from a purely electoral perspective, that’s
not a terrible thing to be.”53 By author Kamp’s
calculations, since the Obama 2012 national popular vote
margin was 4,985,023, if Romney won 90 percent of the
“missing” 6.500 million, he would have won the rounded
national popular vote by a rounded 345,000 -- 66.782 million
versus 66.437 million54, or a two-party vote percentage of
50.13 percent.
52 Statement of the 1868 Democratic nominee, New York Governor Horatio Seymour, quoted by Ed Kilgore, “Doubling Down on the White Man’s Party”,June 26, 2013, The Washington Monthly Political Animal blog, www.washingtonmonthly.com53 Trende stated as follows in his June 25, 2013 article: “Democrats liked to mock the GOP as the “Party of White People” after the 2012 elections. But from a purely electoral perspective, that’s not a terrible thing to be.”
54 Assuming the added 6.500 million divides 2 percent for “others” (130,000), 8 percent for Obama (plus 520,000 on top of actual 65,917,258 = 66,437,258) and 90 percent for Romney (plus 5.850 million on top of actual 60,932,235 = 66,782,235). Actual vote figures from theDavid Leip U.S. Election Atlas website, www.uselectionatlas.org, accessed November 22, 2013 and January 8, 2014.
59

With respect to the outcome-determinative Electoral
College, Mr. Trende (whose initial November 8, 2012 article
was premised on Ohio) never posted in the text of any
article actual raw numbers of registered nonvoting “missing white
voters” in any state, although he does include charts based
on estimated national vote ethnic percentages (but not showing
any state breakdowns) showing Republicans using a “racial
polarization scenario” and a Caucasian 63% Republican
percentage winning between 296 and 329 electoral votes in
every election through 2036, and an exact 270 in 2040; in
his fourth article, Trende stated that the GOP Caucasian
percentage is “capped” at 70 percent.55
The numbers used in The Missing White Voter Theory do
not represent actual registered voters or voting voters in
any state. Rather, as Trende expressly states, he is using
only Census estimates of 2008 and 2012 turnout to which Trende adds
2008 exit poll ethnic percentages56:
Using the most commonly accepted exit-poll numbers about the 2008 electorate*, we can roughly calculate the number of voters of eachracial group who cast ballots that year. Using census estimates,
55 Trende stated on July 2, 2013: “Whatever the cause, the trend is real, and it’s not just due to Obama (in fact, the [Alan Abramowitz TimeFor A Change] model predicts the white vote in 2012 within two points). Now, the Democrats clearly have some sort of floor with whites -- it’s why I cap the Republican share of the white vote at 70 percent even in the “polarization” scenario. I just don’t think we’re at that floor yet.”
56 In 2012, exit polls were conducted in only 31 states. The quoted language comes from the Trende June 21, 2013 article under Point 1.
60

we can also conclude that all of these categories should have increased naturally from 2008 to 2012, due to population growth.
From mid-2008 to mid-2012, the census estimates that the number ofwhites of voting age increased by 3 million. If we assume that these “new” voters would vote at a 55 percent rate, we calculate that the total number of white votes cast should have increased byabout 1.6 million between 2008 and 2012.
***
Now, the raw exit-poll data haven’t come out yet, so we can’t calculate the 2012 data to tenths: The white vote for 2012 could have been anywhere between 71.5 percent of the vote or 72.4 percent (with 26,000 respondents, analysis to tenths is very meaningful). So the final answer is that there were 6.1 million fewer white voters in 2012 than we’d have expected, give or take amillion.**
The Current Population Survey data roughly confirm this. As I noted earlier, if you correct the CPS data to account for over-response bias, it shows there were likely 5 million fewer whites in 2012 than in 2008. When you account for expected growth, we’d find 6.5 million fewer whites than a population projection would anticipate.
The Census Current Population Survey Is Not The Best Evidence -- It
Overstated the 2012 National Popular Vote by 3.7 Million And Missed The Actual
New Mexico VAP and Voting in 2004, 2008, and 2012
The Census Survey used for the Missing White Voter
Theory produces VAP, registration, and voting numbers too
far from the actual results to be useful. The Trende series
inspired a cacophony of calumny (and some informed
commentary), but one salient point never emerged: the Census
survey data is not the equivalent of state or county-level
numbers of actual 2012 registered voters who “stayed home” rather
61
than voting for Romney.57 These numbers cannot be found in
the Census data, because the Census states that its’
eligibility, registration and voting numbers are derived
from self-reporting by a sample of roughly 50,000
respondents to the Current Population Survey (CPS) as to
their citizen 18-plus status, voter registration58, and
whether they voted. This is a commendably large sample, but
in 2012 it overstated the national total vote as 132.948
million, when the actual total vote for President was
129,232,106.59
The Census estimates for New Mexico VAP, registered
voters and actual voting for 2004, 2008 and 2012 differ
substantially from the United States Election Project VAP
numbers and the actual registration and voting numbers
available from the New Mexico Secretary of State website.
57 According to the New Mexico Secretary of State website, absentee ballots are automatically available to anyone who requests one by the Friday before Election Day (in 2014, October 31), or to persons who become ill after October 31 and present an affidavit signed by a health care provider. New Mexico also has in-person early voting starting 28 days before Election Day. www.sos.state.nm.us 58 Not required in the Nineteenth Century, but now a requirement in every state except North Dakota.
59 David Leip U.S. Election Atlas website, www.uselectionatlas.org, accessed March 20, 2014.
62

Chart X: New Mexico Census CPS Estimated Eligibility, Registration, Voting
2004 2008 2012 4-8 8-12 4-12
Elig. 1.301 M 1.352 M 1.426M + 51 T + 74 T + 125 T
Reg. 936 T 937 T 978 T + 1 T + 41 T + 42 T
Vot. 837 T 846 T 878 T + 9 T + 32 T + 41 T
El-Reg. 362 T 415 T 448 T + 53 T + 33 T + 86 T
Reg-Vot. 99 T 91 T 100 T min. 8 T + 9 T + 1 T
Elig.-Vot. 464 T 506 T 548T + 42 T + 42 T + 84 T
For 2004, the Census estimates a rounded 1.301
million eligible, 936 thousand registered and 837
thousand voting, but the actual numbers are United
States Election Project estimated VAP 1.411
million; an actual Secretary of State registered
voter number of 1,105,272; and a 775,301 total
vote for any office. Thus, the Census
underestimates VAP by 110 thousand; underestimates
63
registration by 169 thousand, and overestimates
voting by 62 thousand.
For 2008, the Census estimates 1.352 million
eligible, 937 thousand registered and 846 thousand
voting, but the actual numbers are United States
Election Project estimated VAP 1.505 million; a
registered voter number of 1,183,081, and a total
vote for any office of 833,365. Thus, the Census
underestimates VAP by 153 thousand, underestimates
registration by a whopping 263 thousand, and
overestimates actual voting by 13 thousand.
And for 2012, the Census estimates 1.426 million
eligible, 978 thousand registered, and 878
thousand voting, but the actual numbers are a
United States Election Project estimated VAP of
1,583,992; a registered voter number of 1,254,567;
and a total vote for any office of 786,522. Thus,
the Census underestimates VAP by 157 thousand,
underestimated registration by a whopping 276
thousand, and overestimates actual voting by 92
thousand.
However, in the New Mexico registered voter universe
there is no need to look to the CPS when actual state-level
and county-level registration and voting numbers are
available. Between 2004 and 2012, one can compare the
64

county-level registration and actual vote numbers, with the
difference the number of “registered nonvoters”. The only
missing element reveals “eligible nonvoters”: the county-
level VAP numbers, which appear to exist on a state election
administration website only in Wisconsin, or a statewide VAP
number, which while absent from the New Mexico Secretary of
State website can be found as a statewide estimate on the
Professor Michael McDonald United States Election Project
website. Other sources provide New Mexico county-level
Presidential voting data back to 1912, the first election
for President in New Mexico.60 The David Leip U.S. Election
Atlas website in a single screen charts New Mexico state-
level total vote and partisan numbers all the way back to
1912. These sources provide actual voting data, not estimates, and should be
looked to first in the search for the actual 6.5 million missing white voters.
Thus, one assigned to develop a 2016 Republican
strategy for flipping New Mexico would first go to the
county-level 2012 registered voter and actual voting numbers,
augmented by voter file data as to the number of and type of
elections in which each registered voter has participated
(“flags” in the typical precinct walk sheet or its’
Smartphone equivalent). Registered voters need only be
60 The David Leip U.S. Election Atlas website has actual votes down to the county level for all New Mexico Presidential elector elections back to 1912, as does the late Richard Scammon’s America at the Polls and America Votes back to 1920; Edgar Eugene Robinson’s The Presidential Vote has them from 1896 through 1932 and for 1932-1944 in They Voted for Roosevelt.
65

persuaded and turned out, whereas the unregistered first
need a registration drive.
The Missing White Voter Theory Census Estimate Predicates Show That The
Theory Will Not Flip New Mexico At The 55 Percent Turnout Rate Applied To The
Gap Between Growth In Eligibles and Growth in Voting
If the growth of unregistered eligible voters between
2008-2012 or 2004-2012 are the target groups, the CPS
estimates facially demonstrate that The Theory will not flip
New Mexico at the 55 percent turnout rate used by Mr. Trende
in his articles.
As can be seen from Chart X above, the Census estimates
that between 2008 and 2012, New Mexico eligibles rose by
74,000, but registration rose by 41,000, and voting rose by
32,000, meaning the eligible non-voter growth number is only
42,000, and the registered non-voter growth number is only
nine thousand. Since the 2012 Obama margin is 79,547, a 100
percent turnout of any of these numbers at 100 percent
Republican would not flip the state. As for 2004-2012, the
Census estimates that eligibility grew by 125 thousand,
registration grew by 42 thousand and voting by 41 thousand –
resulting in an eligible non-voter growth number of 84
66
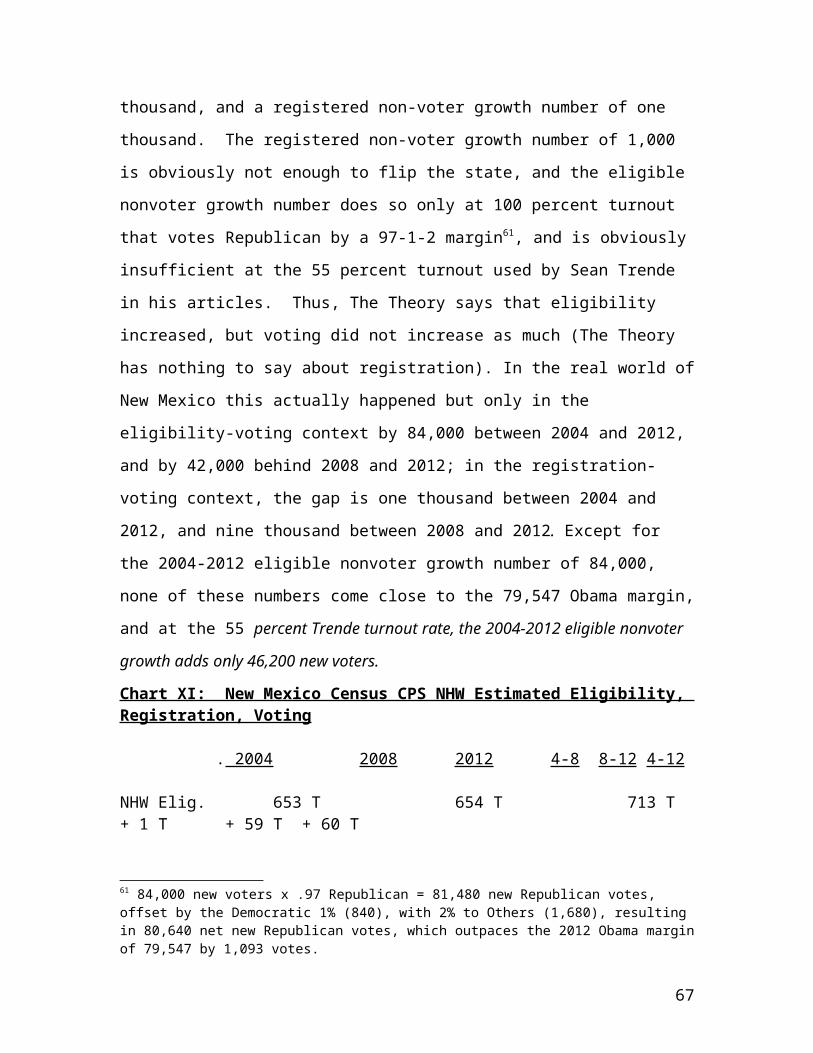
thousand, and a registered non-voter growth number of one
thousand. The registered non-voter growth number of 1,000
is obviously not enough to flip the state, and the eligible
nonvoter growth number does so only at 100 percent turnout
that votes Republican by a 97-1-2 margin61, and is obviously
insufficient at the 55 percent turnout used by Sean Trende
in his articles. Thus, The Theory says that eligibility
increased, but voting did not increase as much (The Theory
has nothing to say about registration). In the real world of
New Mexico this actually happened but only in the
eligibility-voting context by 84,000 between 2004 and 2012,
and by 42,000 behind 2008 and 2012; in the registration-
voting context, the gap is one thousand between 2004 and
2012, and nine thousand between 2008 and 2012. Except for
the 2004-2012 eligible nonvoter growth number of 84,000,
none of these numbers come close to the 79,547 Obama margin,
and at the 55 percent Trende turnout rate, the 2004-2012 eligible nonvoter
growth adds only 46,200 new voters.
Chart XI: New Mexico Census CPS NHW Estimated Eligibility, Registration, Voting
. 2004 2008 2012 4-8 8-12 4-12
NHW Elig. 653 T 654 T 713 T + 1 T + 59 T + 60 T
61 84,000 new voters x .97 Republican = 81,480 new Republican votes, offset by the Democratic 1% (840), with 2% to Others (1,680), resulting in 80,640 net new Republican votes, which outpaces the 2012 Obama marginof 79,547 by 1,093 votes.
67

NHW Reg. 509 T 496 T 545 T min.13 T + 49 T + 36 T
NHW Vot. 471 T 468 T 503 T min. 3 T + 35 T + 32 T
NHW El-Reg. 144 T 158 T 168 T + 14 T + 10 T + 24 T
NHW Reg-Vot. 38 T 28 T 42 T min.10 T + 14 T + 4 T
NHW Elig.-Vot. 182 T 186 T 208 T + 4 T + 22 T + 26 T
Highest all-pop is 4-12 eligibles-reg gap = 86,000 x .55 = 47,300 not enough; eligibles-voting 84,000 x .55 = 46,200Highest NHW is 4-12 eligibles-vote gap 26,000 x .55 = 14,300not enough
Note also that the numbers just discussed and displayed
in Chart X are all-population numbers, and New Mexico is
only 51% Non-Hispanic White. Although the CPS has state-
level NHW estimates, the Missing White Voter Theory articles
do not mention any of them. Chart XI provides the Census
estimates for the New Mexico NHW population only. Chart XI
displays NHW eligibles growing by 59 thousand from 2008
through 2012, and by 60 thousand from 2004 through 2012 –
neither of which defeats the 2012 Obama margin, even at 100
percent registration, turnout and Republican voting.
Between 2004 and 2012, the gap between eligibility and
68

voting grew by all of 26 thousand, and between 2008 and
2012, by twenty-two thousand. These estimate numbers that are
less than half the 2012 Obama margin, like the Little Texas
2004-2012 registered nonvoter growth of 23,800, are the sum
total of Missing White Voters in New Mexico. To paraphrase
Vice President Biden with a Nixon ellipsis, “Big (expletive
deleted) deal.”
Because The Missing White Voter Theory cannot flip New
Mexico, Democrats will likely not enjoy the irony of
Republicans trying to win the election among the
unregistered and alienated whom Republican Governors and
legislatures across the country in 2013 and 2014 have been
trying to keep from voting62, even if the 2016 Republican
nominee runs a registration drive trumpeting “White People
Wake Up” – the 1950 election eve segregationist slogan in
the 1950 North Carolina U.S. Senate Democratic primary.63
Actual Voting Age Population, Voter Registration and Voting In New
Mexico
62 Democrats control both chambers of the New Mexico Legislature, and the Republican bête noires of no-excuses mail ballots and early voting are by now well-established.
63 Samuel Lubell, The Future of American Politics (3d. ed. 1965), pages 106-113 (“Who Beat Frank Graham?”).
69

To find out if enough “missing white voters” actually
exist in New Mexico, the best sources are the state-level
VAP, and county-level registration, total vote, and partisan
vote changes between 2004 and 2012. In addition, New Mexico
uses partisan voter registration and a closed primary
system, thus offering another portal into partisan leanings.
New Mexico permits registration up to 28 days before
Election Day, two days fewer than the constitutional minimum
of Dunn v. Blumstein and the statutory minimum of the Voting
Rights Act Amendments of 1970.64 First-time mail registrants
are subject to photo ID requirements, the minimum required
by the Help America Vote Act of 2002; other voters at the
polls must either show a photo ID or sign an affidavit that
they do not possess a photo ID.65 Voters must update their
registration if they change their name, move, or desire to
change their party affiliation. Felons are not eligible to
vote in New Mexico if they have been convicted of a felony
and are currently serving any portion of the sentence, but
may re-register once the prison term or parole term is
completed. New Mexico offers both no-excuses absentee (mail
ballot) voting and early voting in person, starting 28 days
before Election Day. The New Mexico Secretary of State
website for 2004, 2008, and 2012 breaks down to the county
64 405 U.S. 330 (1972), and 42 U.S.C. section 1973-aa-1 (c) and (d). 65
? New Mexico Secretary of State website, www.sos.state.nm.us, “VoterFAQ.”
70

level the vote for each candidate subdivided by absentee
ballot, early voting, and Election Day voting.66 New Mexico
offers provisional ballots, but the Secretary of State
website does not elaborate on the counting rules, the number
issued, or the number counted as valid.
Map of New Mexico Political Regions, 2004-2012
Presidential General Election Map Comparison
New Mexico
2012 2008
2004 2000
66 The only discrepancy occurs for precincts with five or fewer voters, whose voting preferences are submerged in the overall county totals to protect the secrecy of the ballot in these precincts. See New Mexico Statutes Annotated 1-12-70 and New Mexico Administrative Code 1-10-33.
71

1996 1992
1988 1984
72

1980 1976
1972 1968
73

1964 1960
1956 1952
1948 1944
1940 1936
74

1932 1928
1924 1920
1916 1912
Dark Blue – Democratic Nine – Santa Fe, Taos, McKinley, Rio
Arriba, Mora, San Miguel, Cibola, Grant, Guadalupe
Red – Republican Little Texas 14 – Chaves, Roosevelt, Lea,
Otero, San Juan, Catron, Quay, Curry, Sierra, Lincoln, De
Baca, Eddy, Union, Harding
Turquoise – Albuquerque Metro Four – Bernalillo, Sandoval,
Torrance, Valencia
Green – Swing Vote Six – Dona Ana, Los Alamos, Colfax,
Hidalgo, Luna, Socorro
New Mexico’s 33 Counties: Only 13 Are Majority Caucasian
75

New Mexico has 33 counties67. This article and its’
accompanying charts divide them as the Democratic Nine, the
Republican Little Texas 14, the Albuquerque Metro Four, and
the Swing Vote Six. As charted in Chart VII at the end of
this article, the 2010 Census numbers show that only 13 of
the 33 New Mexico counties have Non-Hispanic White (NHW)
populations of fifty (50) percent or higher68, and 11 of these
are rural Little Texas counties other than the relatively
large ones of Chaves (Roswell), Lea (Hobbs) and San Juan
(Farmington); the other two are the atomic center of Los
Alamos and the Albuquerque exurb of Torrance. In the twelve
of these counties that voted for Mitt Romney in 2012 (Los
Alamos gave a plurality to President Obama), the total 2012
vote for any office was 88,889 – 11.30 percent of the 2012
statewide total vote for any office of 786,522.69 The total
number of 2012 registered non-voters in these counties is
3,639 in Torrance and 50,952 in the 11 Little Texas counties
– a total of 54,591 that is less than the Obama 2012 67 This was not always true. In 1912 and 1916, there were 26 counties (missing Catron, DeBaca, Harding, Hidalgo, Lea, Los Alamos and Cibola); in 1920, DeBaca, Hidalgo and Lea were born, making the county total 29. In 1924, Catron and Harding were born, making the county total 31. See Edgar Eugene Robinson, The Presidential Vote 1896-1932 (Stanford University Press, Palo Alto, California, 1934), pages 272-275). County 32 was addedin 1952 when the World War II secret atomic research center of Los Alamos became a county, and County 33 was added in 1981 when Cibola split off from Valencia County.68 www.census.gov, “2010 Census Interactive Population Search” for NewMexico and each of its 33 counties. 69 6,438 in the Albuquerque exurb of Torrance and 82,451 in the 11 Little Texas counties other than Chaves, Lea and San Juan.
76

statewide margin, and a 12,581 increase from the 42,010
registered nonvoter number in 2004.70 One hundred percent of
the 2012 nonvoter number (54,591) or the 2004-2012
registered nonvoter growth number (12,581) could turn out in
2016 and vote 100 percent Republican, and the 2012 Obama
margin of 79,547 prevails.
In 2012, Mitt Romney scored 60 percent or above in only
11 of the 33 New Mexico counties – the Little Texas redoubts
of Lea (Hobbs, the Number One Romney county at 73.75%),
followed by Catron, Union, Curry (Clovis), Roosevelt
(Portales), Eddy, DeBaca, Lincoln, Chaves (Roswell), San
Juan (Farmington), and Otero (Alamagordo), with counties 12,
13, 14, and 15 the Little Texas counties of Quay (Tucumcari)
and Sierra, the Albuquerque exurb of Torrance, and the
Little Texas county of Harding (54.41%). These counties have
a combined 2012 Presidential vote of 172,557, which is
21.98% of the 783,757 total Presidential vote in 2012 New
Mexico. In contrast, the top 15 Obama 2012 counties in New
Mexico have a total Presidential vote of 719,165, which is
91.75 per cent of the New Mexico 2012 Presidential vote, and
this list includes not only Santa Fe and Taos, but also
Bernalillo (Albuquerque) and Dona Ana (Las Cruces). If the
Republicans flip New Mexico in 2016 or 2020, they will do so
in the ten counties outside the partisan-polarized 23 from
70 The 2004 registered nonvoter numbers are 2,788 in Torrance and 39,222in the 11 Little Texas counties.
77

Little Texas (14) and the Democratic Nine – because the
Albuquerque Metro Four and the Swing Vote Six in 2012 cast
451,453 or 57.60% of the total 2012 New Mexico Presidential
vote. In further contrast, the total number of 2012
registered non-voters in the 14 Little Texas counties is
56,542, and in Torrance it is 3,639 – a total of 60,181 that
is less than one seventh of the swingable 451,453 in the ten
New Mexico counties that are outside the partisan-
polarization zones.
1992 and 1996 Ross Perot: Below-Average in New Mexico, But Above-
Average in Little Texas
The Missing White Voter Theory says New Mexico counties
where Ross Perot performed best in 1992 are the most likely
missing voter pool, even though Perot in 1992 New Mexico
underperformed national by 2.79 percentage points.
According to the 2013 Sean Trende articles, the best
statistical correlation for the “missing white voter” is a
county-level Ross Perot 1992 percentage above the national
Perot 18.91%. Of course, this three-way election took place
20 years ago, but in any event in 1992 New Mexico Ross Perot
achieved 16.12%, 2.79 percentage points below his national
percentage. Perot finished third in every county, but
achieved between 19.00% and 24.43% in 10 of the 33 counties,
78

led by the Little Texas county of Lincoln (24.43%)71, and
followed by the Little Texas county of Sierra, the Mexican
border/Boot Heel county of Luna (Deming), Los Alamos, and
the Little Texas county of Otero (Alamagordo), with the
number 6 county the Little Texas county of Lea (Hobbs) at
19.82%, followed by the Albuquerque exurb of Torrance at
19.44%, the Little Texas county of Union at 19.15%, the
Mexican border/Boot Heel county of Hidalgo (Lordsburg) at
19.09% and the Little Texas county of Chaves (Roswell) at
19.00%. The total 1992 Presidential vote in these ten
counties was 86,937, and in 2012, the total Presidential
vote was 99,913 – an increase of 12,976 (14.92 percent) when
the statewide total vote increased by 213,771 (37.50
percent); in other words, the total Presidential vote in the
Top Ten Perot counties in New Mexico grew 22.58 percentage
points less than the State of New Mexico as a whole.72 The
total number of 2012 registered non-voters in these
counties: 61,017, in yet another underperformance of the
2012 Obama margin of 79,54773. And remember that one of
71 Unlike the Little Texas counties directly on the Texas border, Lincoln (county seat Carrizozo, north-adjacent of Otero (Alamagordo)), is ancestrally Republican – in the 26 Presidential elections between 1912 and 2012, a Democrat won Lincoln only three times: Woodrow Wilson in 1912 by nine votes, and FDR in 1932 and 1936 (between 1932 and 1936, the FDR percentage dropped 9.51 percentage points). 72
? The total Presidential vote in 1992 New Mexico was 569,986, and in 2012, 783,757.
73 Lincoln 4,903 Sierra 2,872
79

these Top Ten Perot counties (Los Alamos) became a double-
Obama county.
The Ross Perot Air Raid 1992 collateral damage ratio
from the 1988 results in New Mexico was Republican 14.52,
Democratic 1.000 – not quite as lopsided as the Nevada 24-
to-1, but close enough to the California 19-to-2 Republican
damage ratio, and causing greater Republican damage than in
Iowa (where Perot took more from the 1988 Dukakis side of
the ledger than the 1988 Bush one), or in Wisconsin, where
Perot took about evenly from the 1988 Dukakis and 1988 Bush
columns. Outside of Iowa, Wisconsin, and North Dakota, the
Ross Perot air raid collateral damage ratio was lopsidedly
Republican, as high as the rounded 24-to-1 in Nevada (a
major 2004-2012 swing state we will discuss in the next
article) and more typically the rounded 19-to-2 ratio in
California (the 1992 state that broke the Republican Lock On
The Electoral College). The only other states where the
collateral damage ratio was close to even are Wisconsin and
Luna 5,069
Los Alamos 3,120
Otero 13,342
Lea 12,995
Torrance 3,639
Union 867
Hidalgo 1,252
Chaves 12,958
80

North Dakota (both Republican 11-10), South Dakota
(Republican 12-9) and Hawaii (Republican 8-6).74
Chart XII: Ross Perot Craters The Republican Vote in 1992
-- Selected States
Rank-Ordered by Perot %; Clinton Win States In Bolded Italics
Perot 1992 Bush 1992 Bush 1988 Dukakis 1988
Clinton 1992 D,R Shift 1988
N.M. 16.12% 37.34% 51.86% 46.90% 45.90% D minus 1.00%, R – 14.52%
Nevada 26.19% 34.73% 58.86% 37.92% 37.36% D minus
0.56%, R – 24.13%
Colo. 23.32% 35.87% 53.06% 45.28% 40.13% D minus
5.15%, R – 17.19%
Mich. 19.30% 36.38% 53.57% 45.67% 43.77% D minus 2.90%, R – 17.19%
Iowa 18.71% 37.27% 44.50% 54.71% 43.29% D minus11.42%, R – 7.13%
Wisc. 21.51% 36.78% 47.80% 51.41% 41.13% D minus 10.28%, R – 11.02%
74 Iowa was discussed in a previous article in this series. North Dakota and South Dakota have been Presidentially Republican since 1936 (going Democratic only in 1964), and the largely unnoticed Democratic gains in the Eighties were siphoned by Perot and taken by Bush the Younger in 2000. Hawaii since 1960 has gone Republican only in 1972.
81
Minn. 23.96% 31.85% 45.90% 52.91% 43.48% D minus 9.43%, R minus 14.05%
Cal. 20.63% 32.61% 51.13% 47.56% 46.01% D minus 1.55%, R – 18.52%
N.D. 23.07% 44.22% 56.03%
42.97% 32.18% D minus 10.79%, R – 11.81%
S.D. 21.80% 40.66% 52.85% 46.51% 37.14% D minus 9.37%, R – 12.19%
Haw. 14.22% 36.70% 44.75% 54.27% 48.09% D minus 6.18%, R – 8.05%
In the 1996 encore Ross Perot run75, the Perot New Mexico
5.80 percent was 2.60 percentage points below the national
8.40 percent – really no different from the 1992 minus 2.79
performance. Perot again finished third in all 33 counties;
achieved above 10 percent only in Hidalgo (Number One at
10.71%) and Lincoln (10.39%); broke nine percent only in Lea
(Hobbs), Luna (Deming), and Quay (Little Texas, county seat
Tucumcari); hit 8.97% in Sierra; and finished between seven
and eight percent in Roosevelt (Portales), Colfax, DeBaca,
Union, Catron, San Juan (Farmington), Socorro, Torrance,
Grant (Silver City) and Cibola (Grants). In 2008-2012, five
of these ten counties became double-Obama counties: Grant,
75 Not discussed by Sean Trende in any of his articles.
82

Cibola, Hidalgo, Colfax, and Socorro. In addition, the
total 2012 vote, Presidential or for any office, is much
higher in Bernalillo (Albuquerque), Dona Ana (Las Cruces),
and Santa Fe, none of which are top Perot counties in either
1992 or 1996.
Actual New Mexico Data Show That The 2004 – 2012 Growth in Registered
Non-Voters Beyond the Democratic Nine Counties Adds Only 68,675 -- Less Than
Either Obama Margin
Chart XIII: Registered Non-voters in New Mexico Regions,
2004 - 2012
Dem. Nine LT 14 Aque 4 Swing 6 State
2004 Reg. 242,071 252,888 467,388
143,025 1,105,372
2004 Vote 160,841 173,884 341,350
99,026 775,101
2012 Reg. 254,169 269,087 568,648
162,663 1,254,567
2012 Vote 160,029 166,283 360,480
99,730 786,522
Reg. N/V 2004 81,230 79,004 126,038
43,999 330,271
Reg. N/V 2012 94,140 102,804 208,168 62,933
468,045
83

RN/V Change 4-12 + 12,910 + 23,800 + 82,130 + 18,934 + 137,774
Reg. Change 4-12 + 12,098 + 16,199 + 101,260 + 19,638
+ 149,195
Vote Change 4-12 min. 812 min. 7,601 + 19,130 + 704
net + 11,421
Between 2004 and 2012, a net 149,195 new registrations
were added to the statewide New Mexico voting rolls, but
voting increased by only a net 11,421, meaning turnout went
down – but only by 137,774. If any of the non-registered
eligible or registered voters went “missing”, it was only by
their own choice, and their numbers are not large enough to
change the 2012 or 2008 outcome. True, 137,774 exceeds the
Obama 2012 margin of 79,574, but the Trende 55 percent
turnout rate only yields 75,775 new voters – less than the
Obama 2012 statewide margin. And this registered nonvoter
growth number of 137,774 is a statewide number, and includes
only 23,800 from Little Texas – but 12,910 from the
Democratic Nine; 82,130 from Albuquerque Metro Four; and
18,934 from the Swing Vote Six. Moreover, only two of the 19
counties outside Little Texas voted for Romney in 2012 (the
Albuquerque exurb of Torrance and the Mexican border county
of Luna). Even if one adds to the Little Texas 23,800 the
101,064 from combined Albuquerque Metro and the Swing Vote
Six, one comes up with 124,864 – meaning that at the 55
84

percent Trende turnout rate, only 68,675 are added, again
less than the 2012 Obama margin.
Perusal of the statewide and county-level registration
and voting numbers for 2004, 2008 and 2012 from the New
Mexico Secretary of State website and displayed in Chart I
at the beginning of this article show the following actual
voter movements:
Between 2004 and 2012, the U.S. Elections Project New
Mexico VAP rose by 172,573.
Between 2004 and 2012, New Mexico total registration
rose by 149,195.
Between 2004 and 2012, New Mexico voting for any office
fell by 11,221.
Between 2004 and 2012, the eligible non-voter number
rose by 161,352.
Between 2004 and 2012, the registered non-voter number
rose by 137,795.
In the registered voter universe, 55 percent of 137,795
equals 75,787 – not enough. If one adds a registration
drive that registers the eligible non-registered universe
growth of 23,557, and 55 percent of this addition turns out,
another 12,956 are added, which brings the Missing Voter
addition to 88,743, but to defeat the Obama 2012 margin by
all of 1,209 votes, the newly discovered registered and
85

unregistered missing voters must vote Republican by 94-3-
3.76 Trouble is, at least half of these Missing Voters are
Hispanic, Native American, or Democratic-leaning Caucasians;
indeed, if only ten percent are, the partisan percentage
breakout becomes Democratic 10, Others 3, Republican 87,
meaning the Obama 2012 margin prevails by 11,215.77 In the
Little Texas 14, where the 2004-2012 registered non-voter
growth number is 23,800, and the eligible non-voter
increment is unknown78, the lowest Obama 2012 percentage
anywhere in New Mexico is 23.98% in Lea County (Hobbs),
meaning any Missing Voter registration drive partisan
percentage is likely to break no better than Republican 77,
Democratic 20, Others 3, which is 17 percentage points less
than break the Republicans need.
New Mexico Voting 2004 To 2012: Total Vote Up, Democrats Up, Republicans
Down
As displayed in Chart II at the beginning of this
article, between 2004 and 2012:
76 88,743 x .94 Republican = 83,418, offset by Democratic 3 percent (2,662) with 3 percent to Others (2,662), resulting in 80,756 net new Republican votes, outpacing the Obama 2012 margin of 79,547 by 1,209.
77 88,743 x. 87 Republican = 77,206, offset by Democratic 10 percent (8,874) with 3 percent to Others (2,662), resulting in only 68,332 net new Republican votes, leaving the Obama 2012 margin ahead by 11,215.
78 Because there are no county-level VAP statistics outside Wisconsin.
86

The total New Mexico vote for President rose by
27,253, starting with an initial all-time high of
756,304 in 2004, followed by the all-time high of
830,158 in 2008, and a fall to 783,757 in 2012.
Republicans lost 41,142 votes, whereas Democrats
gained 44,393 and “Others” gained 24,202.
The Republican raw vote between 2004 and 2008 fell
by 30,098, whereas the Democratic number rose by
101,480, meaning 131,578 in two-party margin
shifted Democratic in one quadrennium.
Between 2008 and 2012, the Republican raw vote fell
by another 11,044, marking New Mexico as one of two
swing states where the Republican raw vote in 2012
underperformed McCain 2008.
Between 2008 and 2012, the New Mexico Democratic
raw vote for President fell by 57,087, but because
the New Mexico Democratic 2008 margin was 125,590,
meaning that after the Republicans lost another
11,044, President Obama still won by 79,547.
The total vote for “other” Presidential candidates
rose from 8,432 in 2004 (4,053 to an on-ballot
Ralph Nader, 2,382 Libertarian) to 21,730 in 2008
(Nader 5,327, Libertarian 2,428) and then to
24,202 in 2012 (Jill Stein Green 2,691, Gary
Johnson Libertarian 27,787). Thus, the on-ballot
presence of a 1994-2002 Republican Governor
87

increased the “other” vote by only 2,492 between
2008 and 2012, but increased the Libertarian vote
ten-fold.
If in 2016 the 2012 Democratic raw number of 415,335 remains
static, Republicans need to add to their 2012 Romney number
of 335,788 another 80,000 votes to win New Mexico by a near-
record close margin of a raw 453. To avoid recount
roulette, Republicans would be advised to aim for the
addition of 90,000 to 100,000, or 130,000 if they want to
defeat the Obama 2008 margin. This could come from
persuading 40,000 – 65,000 Democratic voters to switch, or
under The Missing White Voter Theory, from a Little Texas
Fourteen counties electorate of 80,000 or 130,000 that
“stayed home” in 2012 rather than choose between Mitt “47
percent” Romney and President Obama.
In Every Presidential Year, Between 330 and 468 Thousand Registered New
Mexico Voters Do Not Vote
As indicated in Chart III in this article, in each of
2004, 2008 and 2012, between 330 and 468 thousand registered
New Mexico voters do not vote for any office. Perusal of the voter
registration and total vote for any office numbers on the
New Mexico Secretary of State website reveals that in 2012,
468,045 registered New Mexico voters did not vote, and
88

another 329,425 were estimated as eligible but did not
register. This is not a new phenomenon: in 2008, 330,071
registered but did not vote, and in 2004, the registration-
voting gap was 350,436. The registered nonvoter growth in
2008-2012 of 117,609 and the 2004-2012 growth of 137,975,
when subjected to the 55 percent Trende turnout percentage,
result in additions of 64,684 and 75,886, and both numbers
underperform both the Obama 2012 and Obama 2008 margins.
New Mexico 2004-2012: Flipping from Republican to Democratic
In 2004, President Bush the Elder achieved the highest
post-1988 Republican Presidential percentage in New Mexico –
49.84%, 0.79 of a point or a raw 5,988 ahead of national
loser John Kerry. Unlike McCain or Romney, Bush actually
won New Mexico by achieving the highest-ever Republican raw
vote in New Mexico history: 376,930, ahead of Bush the Elder
1988 by 106,589 and President Reagan 1984 by 69,829.
As displayed in Chart IX above, Bush won in 2004 by
driving the Little Texas margin to 65,475, keeping the Kerry
margin in the Democratic Nine at 54,373, and keeping the
Kerry margins in Albuquerque and the Swing Vote Six counties
to levels that were 1-10 percent of the future 2012 Obama
margins.
89

The actual raw numbers that went into these margins are
displayed below in Charts XIV (Republican) and XV
(Democratic). In the Democratic Nine, the Democratic margin
between 2004 and 2012 went up by 21,143 – more than three
times the 2004 Bush statewide margin. Democrats added 10,728
raw votes from the Democratic Nine alone, and the Republican
raw vote fell by 10,415. In Little Texas, the Democratic raw
vote went up by 1,304, whereas the Republican raw vote fell
by 10,021. In Metro Albuquerque, Democrats added 26,585,
and Republicans lost 15,433; in the Swing Vote Six,
Democrats added 5,776, and Republicans lost 5,273. In the
Democratic Nine, the Republican raw loss is 97.08% of the
Democratic gain, indicating much of the Democratic gain may
have come from persuading Bush 2004 voters, since the total
vote for any office between 2004 and 2012 actually fell by
812. Similarly, in the Swing Vote Six, by contrast, the
Republican loss is 91.29% of the Democratic gain, and the
total vote for any office only went up by 704. Contrast
Albuquerque Metro, where the Republican loss was only 58.05%
of the Democratic gain, and total voting went up by 19,130,
so here the Democratic gains came from a mix of converted
Bush 2004 voters and new voters. In Little Texas, the
Republican loss of 11,325 is 8.68 times the Democratic gain
of 1,304, and voting fell by 7,601 even though registration
went up by 16,199. There are Missing White Voters in Little
Texas, but the 23,800 registered are not enough to flip New
90

Mexico, and the number of unregistered is nowhere near the
additional 56,000 that would add up to the near 80,000 Obama
2012 margin.
Chart XIV: New Mexico Republican Pres. Raw Vote by Regions,2004-2008-2012
Dem. Nine Repub. LT 14 Metro AQUE 4 Swing Votes 6 State
2004 49,399 117,568 162,582 47,381 376,930
2008 41,345 109,126 152,585 43,776 346,832
2012 38,984 107,547 147,149 42,108 335,788
4-8 min. 8,045 min. 8,442 min. 9,997 min. 3,605 min. 30,098
8-12 min. 2,361 min. 1,579 min. 5,436 min.1,668 min. 11,044
4-12 min. 10,415 min. 10,021 min. 15,433 min. 5,273 min. 41,142
Chart XV: New Mexico Democratic Pres. Raw Vote by Regions, 2004-208-2012
Dem. Nine Repub. LT 14 Metro AQUE 4 Swing Votes 6 State
2004 103,772 51,823 167,329 48,018 370,942
91

2008 126,672 63,476 222,678 59,596 472,422
2012 114,500 53,127 193,914 53,794 415,335
4-8 + 22,900 + 11,653 + 55,349 + 11,578 + 101,480
8-12 min. 12,172 min.10,349 min. 28,764min. 5,802 min. 57,087
4-12 + 10,728 + 1,304 + 26,585 + 5,776 + 44,393
These charts can also be used to see the relative
proportions of the party statewide raw vote coming from each
of the regions. For example, Little Texas in 2004 provided
31.19% of the New Mexico Bush vote, and in 2012, it provided
32.02% of the Romney vote -- an increase of 0.83 as the
statewide Republican vote fell. On the Democratic side, the
Democratic Nine provided only 27.97% of the 2004 Kerry vote
in New Mexico, and in 2012, provided only 27.56% of the
President Obama vote. The Little Texas proportion of the
Democratic vote was 13.97% in 2004, and in 2012, it was
12.79%, even though the Democratic vote in Little Texas went
up by 1,304. The Albuquerque Metro portion of the 2004 Kerry
vote was 45.10%, and its’ proportion of the 2012 President
Obama vote was 46.68%. The Swing Vote Six contributed
92

12.94% of the Kerry vote, and 12.95% of the President Obama
vote.
The Actual Republican Lost Votes From 2004 in Little Texas Are Barely 12
Percent of the Obama 2012 Margin in New Mexico
The 2012 Obama margin in New Mexico was 79,547. In the
14 Little Texas counties, the Republican actual lost vote
number between 2004 and 2012 is 10,021, only 12.59% of the
Obama 2012 margin of 79,547. The Republican 2004-2012 lost
vote number in Albuquerque Metro is 15,433, and in the Swing
Vote Six, it is 5,273; in the Democratic Nine, it is 10,415.
Republicans could turn out every one of these 41,142
“missing voters” and would still fall short of the 2012
Obama margin by 38,405.
Democratic Vote Gains and Republican Vote Losses Throughout New
Mexico in 2004-2012
Instead of chasing registered nonvoting Caucasians,
Republicans would be better off thinking up ways to re-
convert voters who made possible the Democratic 2004-2012
vote gains in 27 of the 33 New Mexico counties and the
Republican losses in 31 of the 33, in order to arrest the
ongoing Republican decline in and beyond Little Texas
93
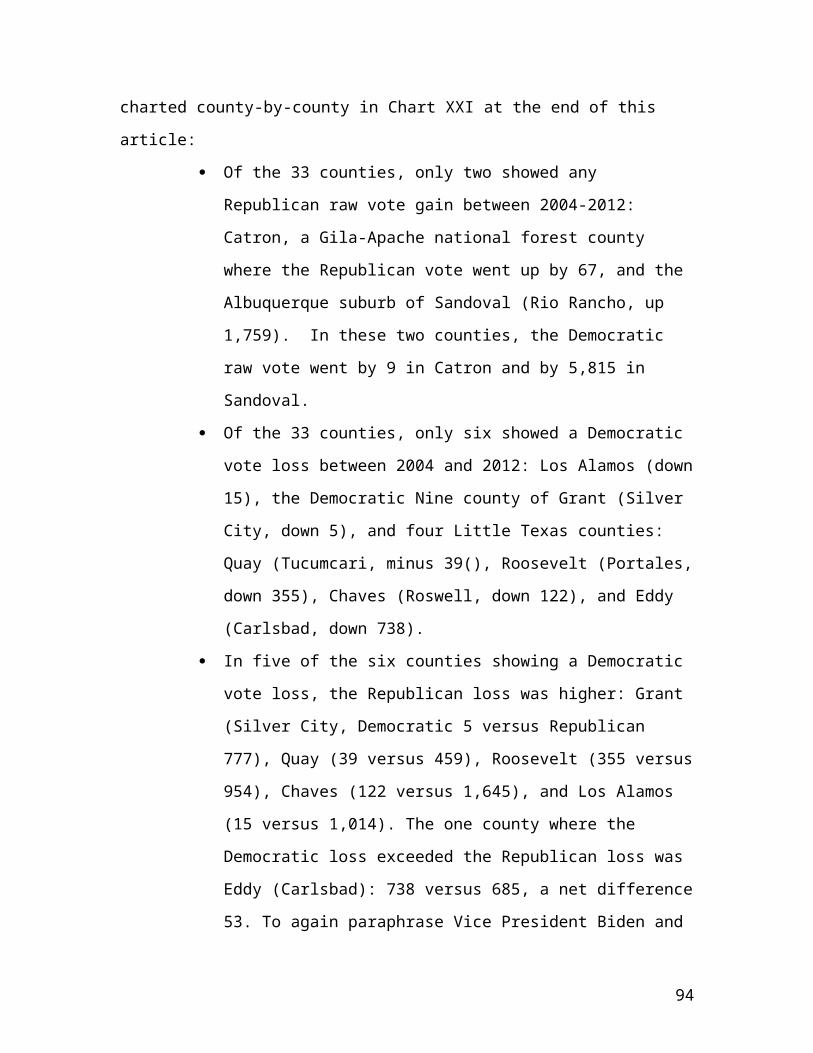
charted county-by-county in Chart XXI at the end of this
article:
Of the 33 counties, only two showed any
Republican raw vote gain between 2004-2012:
Catron, a Gila-Apache national forest county
where the Republican vote went up by 67, and the
Albuquerque suburb of Sandoval (Rio Rancho, up
1,759). In these two counties, the Democratic
raw vote went by 9 in Catron and by 5,815 in
Sandoval.
Of the 33 counties, only six showed a Democratic
vote loss between 2004 and 2012: Los Alamos (down
15), the Democratic Nine county of Grant (Silver
City, down 5), and four Little Texas counties:
Quay (Tucumcari, minus 39(), Roosevelt (Portales,
down 355), Chaves (Roswell, down 122), and Eddy
(Carlsbad, down 738).
In five of the six counties showing a Democratic
vote loss, the Republican loss was higher: Grant
(Silver City, Democratic 5 versus Republican
777), Quay (39 versus 459), Roosevelt (355 versus
954), Chaves (122 versus 1,645), and Los Alamos
(15 versus 1,014). The one county where the
Democratic loss exceeded the Republican loss was
Eddy (Carlsbad): 738 versus 685, a net difference
53. To again paraphrase Vice President Biden and
94

former President Nixon: “Big (expletive deleted)
deal.”
In the Democratic Nine, Democrats increased their
raw vote in eight of the nine counties, most
spectacularly in Santa Fe (up 3,798, Republican
loss 2,966) and McKinley (Gallup, up 2,790,
Republican loss 1,805). The only county with a
Democratic loss was Grant (Silver City): five raw
votes. Republicans lost raw votes in every
county, led by Santa Fe at 2,966, followed by
McKinley at 1,805, Rio Arriba (Tierra Amarilla)
at 1,752 (Democratic gain 1,712) and San Miguel
(Las Vegas) at 1,010 (Democratic gain 2,303).
In the Republican Little Texas 14, Republicans lost
votes in every county except Catron, led by the Romney
campaign stop county of Lea (Hobbs), where the
Republican vote fell by 1,882, followed by Chaves
(Roswell) at 1,645, Otero (Alamagordo) at 1,615,
and Curry (Clovis) at 1,398. Democrats actually
gained 434 in Lea, 481 in Curry, and 396 in
Otero, and in Chaves only lost 122.
In Albuquerque Metro, Republicans gained actual
votes only in the fast-growing suburb of Sandoval
(up 1,759), and even here the Democratic gain was
3.3 times higher (5,815). Republicans lost 15,046
in Bernalillo, 497 in Torrance, and 1,649 in
95

Valencia; in these counties, Democrats gained
18,487 in Bernalillo, 42 in Torrance, and 2,241
in Valencia.
In the Swing Vote Six, Republicans lost votes in
every county, led by Dona Ana (Las Cruces) at
2,226 and Los Alamos at 1,014. Democrats gained
in all counties except Los Alamos, led by a 5,377
gain in Dona Ana.
Partisan Registration Changes, 2004-2012: Democrats Up, Republicans Up
Less, Independents Up The Most, Greens Gone After 2004
New Mexico use of partisan voter registration and a
closed primary provides yet another portal into
partisanship. The only way to participate in the party
nomination process in New Mexico is to register Democratic
or Republican, since after 2004 the Green Party no longer
uses a party primary to nominate candidates. The statewide
and county-level partisan registration changes between 2004
and 2012 are displayed in Charts XXII and XXIII at the end
of this article.
In 2004, the statewide registration numbers were
Democratic 550,519; Republican 359,563; Other Parties and
Decline to State, 195,290, meaning that of the 1,105,372
total statewide registration, 49.80 percent were Democratic
and only 32.52 percent were Republican; 17.68% were Decline
96

to State or in other parties. Eight years later, total
statewide registration rose by 149,195 to 1,254,675. The
Democratic number increased by 45,570 to 596,089; the
Republican number rose by 36,279 to 395,842; the Other
number rose the most, by 67,346 to 262,636. In percentage
terms, Democrats fell to 47.50%, Republicans fell to 31.54%,
and Others rose to 20.96%, a gain of 3.28 percentage points.
Within the regions, registration by Others (outside the
two major parties) rose in every county. Republican
registration fell in five Democratic Nine counties (Santa
Fe, Taos, Rio Arriba, Mora and Cibola), and rose by only 565
in combined McKinley, Grant, San Miguel and Guadalupe
counties; Republican registration also fell in the Swing
Vote Six counties of Los Alamos and Socorro, but rose in the
other four. Republican registration rose in all 13 of the 14
Little Texas counties (falling by 70 in Lincoln, and rising
by a collective 11,774 in the other 13). Republican
registration also rose in all four Albuquerque Metro
counties, including increases of 11,513 in Bernalillo and
8,314 in Sandoval. However, the registration increase for
“Others” outpaced Republicans in Albuquerque Metro (33,400
versus 22,095), the Swing Vote Six (12,006 versus a net
3,253), the Democratic Nine (6,665 versus a net loss of 773)
and even in Little Texas (15,076 versus a net 11,704).
As for the Democrats, they gained a net 6,007 in the
Democratic Nine (gains of 7,581 in Santa Fe, Taos, Rio
97

Arriba, McKinley and San Miguel offset by losses totaling
1,574 in Mora, Cibola, Grant and Guadalupe); in Albuquerque
Metro, gained 35,977 in Bernalillo, 8,825 in Sandoval and
1,300 in Valencia, and lost only 337 in Torrance; in the
Swing Vote Six, gained 4,749 in Dona Ana (Las Cruces), 115
in Los Alamos, 138 in Colfax and 20 in Luna, offset by
losses totaling 643 in Socorro and Hidalgo. In Little
Texas, Democrats lost registration in 13 of the 14 counties,
gaining only in San Juan (up 97) and falling by a collective
10,678 in the other Little Texas counties, with the biggest
drop (2,378) occurring in the Romney banner county of Lea
(Hobbs).
Thus, Democratic voter registration is falling in
Little Texas, but Republican registration gains in these 14
counties are outpaced by Others. In the other 19 counties,
the Democratic gain was greater or the Democratic loss less
than the corresponding Republican number in 11 of the 19
counties, with Republicans outpacing Democrats only in Grant
(Silver City, Democratic minus 866, Republican plus 138),
Mora (minus 355, minus 12), Guadalupe (minus 294, plus 14),
Torrance (plus 423, minus 337), Socorro (minus 472, minus
164), Colfax (plus 138, plus 290), Hidalgo (minus 171, plus
220), and Luna (plus 20, plus 379). Contrast the ratios in
the high vote counties, where Republican registration gains
lag behind the Democrats: Bernalillo 11,513 versus 35,977;
98

Dona Ana 2,987 versus 4,749; and Santa Fe, minus 955 versus
plus 3,536.
A Century of Changing Partisan Coalitions in New Mexico: 1912 through
2012
Within New Mexico, a state that has voted for the
national Electoral College winner in 24 of the 26
Presidential elections between 1912 and 2012, the county-
level margins in the century of voting between 1912 and 2012
have flip-flopped: the Number One James Cox 1920 New Mexico
county of Lea (Hobbs) in Little Texas 92 years later was the
Number One New Mexico 2012 Mitt Romney county. The
percentages – 1920 Democratic 72.50%, 2012 Republican
73.75%.79 The intra-state change in the Land of Enchantment
reflects that inter-state national change. As displayed in
Chart XVI below, Republican areas in the McKinley and even
New Deal cycles have become Democratic strongholds; the
southern-settled Democratic Little Texas has become the
Republican stronghold; the swing vote is now in Albuquerque,
Rio Rancho (Sandoval County), Los Alamos, and Las Cruces,
and post-1988 has been consistently Democratic.
In 1912, Democratic challenger and national winner
Woodrow Wilson won the three electoral votes of New Mexico
79 Lea County did not report separately until 1920.
99

the same way he won the rest of America outside the Old
Confederacy: a plurality percentage in a four-way fest where
the Republican vote was split in half, the Democratic ticket
ran at a national 41.83%, and the Socialist (Eugene Debs)
took 5.99%. The New Mexico scoreboard: Wilson 41.39%, Taft
35.91%, Theodore Roosevelt (TR) 16.90%, Debs 5.79%, meaning
New Mexico versus national was Wilson minus 0.44, Taft plus
12.73, TR minus 10.49, Debs minus 0.20. On the raw margin
front, Democrat Wilson achieved a statewide margin of 2,704
by winning only two of the four New Mexico 2012 regions: the
Swing Vote Six by 514 and Little Texas by 4,280, as
Republican President Taft won the future Democratic Nine by
1,040 and future Albuquerque Metro by 1,050.80 In 1912, the
total New Mexico vote of 49,376 (not much larger than the
2012 Democratic margin in Bernalillo81) came 68.19% from the
rural Democratic Nine and Little Texas. Within the future
Democratic Nine, rural counties predominated – Hispanic Old
World San Miguel (Las Vegas) cast 4,453 votes, Rio Arriba 80 The Taft margins are the Taft margins over Wilson. In two future Albuquerque Metro counties (Bernalillo and Sandoval), Theodore Roosevelt(TR) finished first, with Wilson second in Bernalillo, and Taft second in Sandoval.
Bernalillo -- TR 1,394, Wilson 1,199, Taft 1,02, Socialist Eugene Debs 170.Sandoval -- TR 583, Taft 211, Wilson 126, Debs zero.
In Torrance and Valencia, Taft prevailed over Wilson by 130 in Torrance and 1,032 in Valencia.
81 44,331.
100

(Tierra Amarilla) 2,659, whereas Santa Fe cast only 2,898
and Taos only 1,918 – and all four future Democratic redoubt
counties went to President Taft, with national winner
Woodrow Wilson doing no better than 39.89% (Taos).
Four years later in 1916, President Woodrow Wilson
achieved three of his national eleven electoral vote margin
in New Mexico by a margin of 2,375 from a total vote of
66,787 that came 67.77% from the future Democratic Nine and
Little Texas. Republican Charles Evans Hughes won the
future Democratic Nine by 1,662, the future Albuquerque
Metro Four by 1,620, and the Swing Vote Six by 375 – but
lost Little Texas by the Wilson margin of 6,032, a margin
from Hobbs, Carlsbad, Alamagordo, Tucumcari and Clovis that
placed President Wilson on the future U.S. Route 66 road to
holding the White House by an eleven electoral vote margin
when he won California’s 13 by all of 3,773.
In 1920, the year of the most robust Republican
landslide in post-Appomattox (1865) American history82,
Warren Harding won New Mexico’s total vote of 105,406 by a
raw margin of 10,966, even though Harding lost Little Texas – but
only by 2,595; Harding won the Democratic Nine by 7,556,
82 Republican Warren Harding at 60.35% is the only non-incumbent U.S. Presidential candidate to top 60 percent of the national popular vote. Although President Richard Nixon in 1972 did a little better at 60.77%, and President Ronald Reagan in 1984 a little less at 58.77%, and both carried 49 of 50 states, Warren Harding brought in the biggest Republican U.S. House in American history: 302 of 435, with only 131 Democrats.
101

Metro Albuquerque Four by 2,985 and the Swing Vote Six by
3,020. Twelve years later, the Great Depression flipped New
Mexico Democratic, with FDR achieving a statewide margin of
40,872 on a statewide total vote of 151,606. FDR swept all
four regions, including Little Texas by 22,005 – but
Albuquerque Metro by only 3,024. Of course, Little Texas
actually had more votes than Albuquerque Metro: 47,046
versus 31,199.
In 1948, the last of the five consecutive Democratic
FDR Era wins, Truman won New Mexico by 25,161 – with Little
Texas contributing 18,375, and the other three regions
contributing lesser four-digit margins. Compared to 1932,
when challenger FDR won New Mexico by 40,872, the Little
Texas margin fell the least, by a mere 3,630; in contrast,
the future Democratic Nine centered on Santa Fe and Taos saw
its’ Democratic margin fall from 9,636 to 1,696, as national
loser Dewey scored 54.56% in Santa Fe, missed winning Taos
by 125 votes, and carried Mora and Guadalupe counties. The
Albuquerque Metro margin fell from 3,024 to 1,434, even as
the total presidential vote in the four-county region rose
from 31,199 to 48,452; the Swing Vote Six margin fell from
6,207 to 3,656 on a total vote that had fallen by 629.
The national Eisenhower 1952 landslide rolled through
New Mexico, with the Republican ticket led by the non-
incumbent General winning the total vote of 238,608 by a
statewide margin of 26,509. By 1952, air conditioning had
102

arrived in the Sunbelt, and the Albuquerque Metro portion of
statewide total vote in one quadrennium rose 3.79 points
from 25.94% in 1948 to 29.73% in 1952 – and Eisenhower won
Albuquerque Metro by 11,773, plus the Las Cruces centered
Swing Vote Six by 2,372; he also won Little Texas, but only
by 9,808, and the Democratic Nine, but only by 2,556, as
Adlai Stevenson carried the new Swing Vote Six county of Los
Alamos by 55 votes, the future Mitt Romney Little Texas
strongholds of Lea (Hobbs) by 466 and Eddy (Carlsbad) by
1,454; and the Democratic Nine counties of Grant (Silver
City, by 894), Rio Arriba (Tierra Amarilla, by 228), Taos
(by 114), and don’t forget Gallup in McKinley County – by
six votes; however, Adlai lost the Dewey county of Santa Fe
by 2,225. In the 1956 President Eisenhower reelection, the
Eisenhower margin rose in all four regions, with the largest
rise coming in Albuquerque Metro (11,773 to 20,826),
followed by the Swing Vote Six (2,372 to 3,736), Democratic
Nine (2,556 to 5,125) and Little Texas (9,808 to 11,003).
Eisenhower flipped Hispanic Old World Rio Arriba into its’
only Republican Presidential majority between 1932 and 2012;
flipped Los Alamos into its’ first-ever Republican majority
(with many more to come until 2008); flipped McKinley
(Gallup) into its’ first Republican win since 1928; flipped
Taos into its’ first Republican win since 1944; but could
not flip the southern border counties of Grant (Silver
City), Eddy (Carlsbad) and Lea (Hobbs), as the 1956
103

Heartland revolt against Eisenhower surged through rural New
Mexico, including the Swing Vote Six Eisenhower 1952 Mexico
border counties of Hidalgo (Lordsburg, 24 to 19) and Luna
(Deming, from 397 to 20); but not more Hispanic Colfax
(Raton), where the Eisenhower margin rose from 219 to 531,
or atomic Los Alamos, where the margin flipped from Adlai 55
to Ike 192; or urban Dona Ana (Las Cruces), where it rose
from 1,346 to 2,107; or Socorro, where it rose from 447 to
889.
John F. Kennedy 1960 campaign planers thought the rural
revolt against Eisenhower would be a base Democratic vote
for 1960 that could be added to a swing of the Eisenhower
Catholic vote. In one of his three wins in the 13 Western
states, JFK carried heavily Hispanic New Mexico and its’
four electoral votes by a raw margin of 2,294 that was not
decided until the Wednesday morning after Election Day. As
the total New Mexico presidential vote surged from 253,926
to 311,107, Kennedy flipped the margin by 42,984, with the
biggest portion (20,024 Republican margin loss) coming from
Albuquerque Metro, followed by the flip of the Santa Fe-
centered Democratic Nine (Eisenhower 5,125 to JFK 11,524),
and the Swing Vote Six (Eisenhower 3,736 to JFK 2,900) – but
not Little Texas, where the Republican margin increased from
11,003 to 11,556, in a year when the national and New Mexico
statewide margins were trending Democratic.
104

In 1960 Little Texas, Kennedy flipped Otero
(Alamagordo) from Eisenhower 1,361 to JFK 409 – a 1,770
margin shift that was 77.15% of his statewide 2,294 margin.
In Chaves (Roswell), the Republican margin fell from 3,268
to 2,877; in DeBaca, it fell from 251 to 115; in Harding, it
fell from 259 to 220; in San Juan (Farmington) it fell from
2,769 to 2,151; in Lincoln (Ruidoso), it fell from 897 to
583; in Catron (Reserve) it fell from 234 to 98; in Sierra
(Truth or Consequences) it fell from 919 to 670. All told,
Kennedy flipped 1,770 in margin from Otero and chopped 1,883
in Republican margin in these eight of the 14 Little Texas
counties. In the other six Little Texas counties, Nixon
overperformed Eisenhower by 4,206 in margin – cancelling the
3,583 Kennedy gain from eight Little Texas counties, and
then some. Kennedy held Eddy (Carlsbad) and Lea (Hobbs), but
in these counties the Stevenson 1956 margins fell by 408 in
Eddy and 221 in Lea. Just up the road in Roosevelt
(Portales), the Republican margin jumped five-fold from 461
to 2,278; in Curry (Clovis) it doubled, from 1,281 to 2,732;
in Quay (Tucumcari), it nearly doubled, from 323 to 602; and
in Union (Clayton) it rose from 588 to 618. Keep in mind
that in 1948, President Truman carried 12 of these 14
counties, losing only San Juan and Lincoln.
So if JFK was behind Adlai by 623 in Little Texas 14-
county margin, how did he win New Mexico by 2,294? He
started in Albuquerque Metro, which now cast 33.76% of the
105

total statewide vote, and where JFK slashed the Republican
margin from 20,826 to a near-loss 804. Bernalillo
(Albuquerque) went from Eisenhower 18,939 to Nixon 3,897,
thus shifting 15,042 in margin. In the future Albuquerque
suburban counties of Sandoval, Valencia and Torrance,
Kennedy flipped the Eisenhower counties of Sandoval (from
Eisenhower 405 by JFK 1,225) and Valencia (from Eisenhower
1,116 to JFK 2,114), and in Republican Torrance, he cut the
Republican margin from 366 to 246. In the Swing Vote Six,
Kennedy flipped Dona Ana (Las Cruces) from Eisenhower 2,107
to JFK 1,116; the atomic center of Los Alamos from
Eisenhower 192 to JFK 118; Hidalgo (Lordsburg) from
Eisenhower 19 to JFK 139; Luna (Deming) from Eisenhower 20
to JFK 125; Colfax (Raton) from Eisenhower 509 to JFK 871;
and Socorro from Eisenhower 889 to JFK 531. All told, JFK
moved 6,636 in margin by flipping all of the Swing Vote Six,
nearly triple his statewide margin.
Eight of the Democratic Nine became Democratic
strongholds in 196083, as the region moved 16,879 in margin
to the Democratic ticket. The Democratic margin in Grant
(Silver City) rose from Adlai 898 to JFK 1,910. Santa Fe
flipped from Eisenhower 2,362 to JFK 2,974; Taos from
Eisenhower 357 to JFK 1,011; Rio Arriba (Tierra Amarilla)
from Eisenhower 275 to JFK 2,534; McKinley (Gallup) from
Eisenhower 1,119 to JFK 1,337; Mora from Eisenhower 503 to
83 The ninth, Cibola (Grants), would not be created until 1981, when it was carved from the western part of Valencia County.
106

JFK 109; Guadalupe (Santa Rosa) from Eisenhower 338 to JFK
347; San Miguel (Las Vegas) from Eisenhower 1,069 to JFK
1,532. In the post-1960 future, Rio Arriba and Guadalupe
have been continuously Democratic through 2012 – Rio Arriba
since 1932 and Guadalupe since 1988. The only post-1960
years any of these nine counties went Republican were the
national Democratic disaster years of 1968 (Taos, Mora, San
Miguel), 1972 (Taos, Santa Fe, San Miguel, Grant, McKinley),
1980 (San Miguel, Grant, McKinley), and 1984 (San Miguel,
Cibola). The new county of Cibola went Republican in its’
first election (1984) but has been continuously Democratic
ever since.
In 1964, the negative national reaction to Arizonan
Barry Goldwater enabled President Johnson to carry 29 of the
32 New Mexico counties – all except the Little Texas rural
redoubts of Lincoln, Harding and Union, although the LBJ
margins in eight of the 1960 Nixon Little Texas counties of
Chaves (Roswell) and Roosevelt (Portales) were paltry: 231
in Chaves (Roswell), 143 in Roosevelt (Portales), 115 in
DeBaca (Fort Sumner), 108 in Curry (Clovis), 172 in Quay
(Tucumcari), 132 in Sierra (Truth or Consequences), 93 in
San Juan (Farmington), and 40 in Catron (Reserve).
The LBJ near-sweep of the 32 counties would be a
distant memory after 1968. In 1966, Republicans held Seat 2
At-Large Congressman Johnny Walker to a two-way 50.49% in
the last two-seat at-large U.S. House election in New Mexico
107

history. Republicans elected progressive David Cargo
Governor. In 1968, they reelected Governor Cargo, took both
U.S. House seats in the only Republican seat flips in the 13
western states, and of course carried the state for the
Nixon-Agnew ticket, by a statewide margin of 39,611 that
came 21,533 from Little Texas, 15,254 from Albuquerque
Metro, and 4,597 from the Swing Vote Six. Democratic Vice
President Humphrey carried the Democratic Nine, but only by
1,773. Nixon won New Mexico despite a George Wallace
statewide siphon of 25,737 that came 14,357 from Little
Texas. In 1972, President Nixon won every county except Rio
Arriba and San Miguel, and Republican Pete Domenici flipped
the Class II U.S. Senate seat that he would hold until 2008.
Between 1972 and 1976, the national Democratic
percentage increased 12.56 percentage points – the second or
third highest one-quadrennium Democratic gain in American
history84. The New Mexico gain from McGovern 36.56% to
Carter 48.28% was only 11.72 points, and New Mexico for the
only time between 1912 and 2012 voted for the national
popular vote loser, President Gerald Ford; Republicans also
won the Class I U.S. Senate seat when astronaut Harrison
Schmitt defeated 1964 Senator Joe Montoya. From 1968 to
84 After the 16.63 point Democratic increase between 1928 and 1932, and the 15.43 point gain between Stephen Douglas 1860 and George McLellan 1864 (if the 1860 numbers of Douglas 29.52% and Breckenridge 18.20% are added (47.72%), the 1860-1864 move from 47.72% to 44.95% becomes a 2.77 point loss.
The JFK to LBJ gain was only 11.33 percentage points.
108
1976, the Republican statewide margin fell from 39,611 to
10,271, with the largest Democratic gains occurring in the
Democratic Nine (from Humphrey 1,773 to Carter 14,093 =
12,320) and in Little Texas, where the Republican margin
fell from 21,533 to 9,848 ( = 11,685). However, in
Albuquerque Metro, the margin decline from Nixon 1968 to
Ford 1976 was only a paltry 4,330 (from 15,254 to 10,924) in
a four-county area that now cast 40.98% of the statewide
vote. In the Swing Vote Six, the margin fell from 4,597
Nixon to 3,592 Ford, a decline of only 1,005 in a six-county
region that now cast 12.52% of the statewide vote.
President Ford won suburbia north of North Carolina and west
of Memphis, and New Mexico was no exception.
At the county win level, Jimmy Carter carried each of
the Democratic Nine counties, as well as the Little Texas
counties of Quay (Tucumcari), DeBaca (Fort Sumner) and Eddy
(Carlsbad). The Quay win was by a 36-vote plurality and the
DeBaca win was by a 41-vote majority, but the Eddy win was
with a decent 53.73% (overperforming the national Carter
50.08% by 3.65 points) – however, Quay and DeBaca through
2012 would never again go Democratic, and Eddy would never
again give a Democratic majority (only two Bill Clinton
Perot-siphoned pluralities). In contrast, Carter ended
(through 2012 and likely longer) Republican wins in Santa
Fe, Taos, and Mora counties. In the Swing Vote Six, Carter
won Colfax, Socorro and Hidalgo, but lost Dona Ana, Luna,
109

and Los Alamos; in spite of Jimmy Carter’s atomic
engineering background, in Los Alamos Ford achieved 64.43%.
In Albuquerque Metro, Carter actually won usually Republican
rural Torrance by 64, as well as still-rural Sandoval and
Valencia by 962 and 715, but lost Bernalillo by 12,665.
Torrance has yet to go Democratic again, but suburbanizing
Sandoval and Valencia would go Democratic in 1992, 1996,
2008 and 2012, and Bernalillo would be continuously
Democratic from 1992 through 2012.
The 1980 Reagan landslide pulled President Carter
down to 36.78% in New Mexico, and he carried only the
Democratic Nine counties of Santa Fe, Taos, Rio Arriba, San
Miguel and Mora. In the 1984 President Reagan Morning in
America reelection, Walter Mondale achieved 39.23%, carried
all five Carter counties, and flipped McKinley (Gallup) and
Grant (Silver City), with decent percentages of 54.05% and
53.09%. Of the Democratic Nine, national loser Mondale
carried all except the new county of Cibola (Grants, by 438
votes) and Guadalupe (Santa Rosa, by 44 votes). The year
1984 was the last time any of the Democratic Nine would give
a majority or plurality to a Republican Presidential
candidate.
Four years later, the Democratic 1988 ticket had two
fluent Spanish speakers – Peace Corpsman Michael Dukakis and
Texas Senator Lloyd Bentsen. In the heavily Hispanic
Democratic Nine, from 1976 Carter levels the Democratic
110

margin doubled, from 14,093 to 28,937, in a region where the
statewide total vote share had increased from 18.77% to
19.53%. However, Vice President Bush the Elder won each of
the other regions: Little Texas by 15,935, and outcome-
critically, Albuquerque Metro by 33,352 and the Swing Vote
Six by 5,494, resulting in a statewide 51.86%, below the
national 53.37% but enough for CBS News Election Night 1988
commentator Dan Rather to tell viewers that “Bush is going
through New Mexico like a road runner”, as New Mexico fell
into the near-miss collection of states that kept Dukakis
and Bentsen out of the White House.
The 1991 recession launched the Ross Perot Air Raid of
1992, which in New Mexico scored a below-national 16.12%,
but most of the Perot raw number of 91,985 came from the
1988 Bush side of the ledger: Albuquerque Metro 38,907,
Swing Vote Six 13,697, and Little Texas 27,037 – a total of
79,641, and the Bush statewide margin was only 25,844. In
addition, Perot took 12,255 in the Democratic Nine. As a
result, from 1988 levels the Democratic margin in the
Democratic Nine rose by 11,306 even though the region’s
total vote only rose by 3,020. The Perot air raid also
enabled the Clinton-Gore ticket to flip Albuquerque Metro
and the Swing Vote Six, and reduced by more than half the
Republican Little Texas margin. In 1996, the encore Perot
run achieved a New Mexico 5.80%, and the Clinton percentage
111

rose to a near-majority 49.18%, despite the left-siphoning
2.38% from the first Ralph Nader campaign.
In 2000, Perot was gone, and Nader ran the most robust
of his four campaigns, scoring 3.55% in New Mexico. The
Democratic margin in the Democratic Nine actually fell
slightly, from 40,243 to 39,951 – because Nader took 6,519;
Democratic margins in Albuquerque Metro and the Swing Vote
Six crashed to 1,681 and 2,136 – because Nader took 10,263
and 2,143. In Little Texas, the absence of Perot and the
presence of the Bush Texas twang tripled the Republican
margin from President Bush the Elder 14,011 to candidate
Bush the Younger 43,042. As a result, Gore won New Mexico by
only 366, the closest state-level raw margin in 2000.
Between 2000 and 2004, America experienced a 16.00
percent total Presidential vote surge, but New Mexico was an
exception – because it overperformed. The total
presidential vote in New Mexico rose from 598,605 to
756,304, an addition of 157,699 that increased the total
vote by 26.34 percent, 10.34 percentage points ahead of the
national increase of 16.00 percent. The Democratic margin
the Democratic Nine rose by 14,422, but the Democratic
margin in Albuquerque Metro rose by only 3,066, and in the
Swing Vote Six, actually fell by 1,506. And the Republican
Margin in Little Texas rose by 22,343.
Between 2004 and 2012, the New Mexico total
presidential vote rose by 27,453. The Republican margin in
112

Little Texas fell by 11,325; the Democratic margin in the
Democratic Nine rose by 21,143; the Democratic Margin in
Albuquerque Metro rose by 42,018, and in the Swing Vote Six
it rose by 11,049.
As can be seen, in the century between 1912 and 2012,
New Mexico has mirrored national tides, except that it was
more Democratic than the national numbers in 1920, 1924,
1932 – 1948, 1992, and now 2008 and 2012. Within New Mexico,
Little Texas has moved from Democratic to Republican, and
the other three regions have become strongly Democratic.
Chart XVI: New Mexico Presidential Margins By 2012
Regions in Elections of 1912, 1916, 1920, 1932, 1948, 1952,
1956, 1960, 1968, 1976, 1988, 1992, 2000, 2004, 2012
State Dem. Nine Little Texas 14 Aque. 4
Swing Vote 6 85
85
? Some of the 2012 counties did not exist in various years between 1912 and 1981, the year Cibola County was carved out of Valencia County. Grouped by regions, the missing counties are as follows:
113

1912:
TPV86 49,376 18,773 14,899
7,635 8,069
D 2,704 R 1,040 D 4,280
R 1,050 D 514
1916:
TPV 66,787 25,141 20,095
10,168 11,383
D 2,375 R 1,662 D 6,032
R 1,620 R 375
1920:
TPV 105,406 33,766 35,094
18,622 17,924
R 10,966 R 7,556 D 2,595
R 2,985 R 3,020
1932:
Democratic Nine: all counties except Cibola in existence in 1912-2012. Cibola did not exist as a separate county until 1981, meaning its’ firstPresidential vote was in 1984.
Little Texas 14: Catron did not exist as a separate county in 1912, 1916 and 1920. DeBaca did not exist in 1912 and 1916. Harding did not exist in 1912, 1916 and 1920. Lea did not exist in 1912 and 1916.
Albuquerque Metro Four: all four counties existed between 1912 and 2012.
Swing Vote Six: Hidalgo did not exist in 1912 and 1916. Los Alamos did not exist as a separate county in 1912, 1916, 1920, 1924, 1928, 1932, 1936, 1940, 1944 and 1948. 86 Total Presidential Vote, statewide and in the four regions.
114
TPV 151,606 50,035 47,046
31,199 23,326
D 40,872 D 9,636 D 22,005
D 3,024 D 6,207
1948:
TPV 187,063 55,701 60,123
48,542 22,697
D 25,161 D 1,696 D 18,375
D 1,434 D 3,656
HW 1,037
Strom zero
1952:
TPV 238,608 60,602 76,832
70,950 30,224
R 26,509 R 2,556 R 9,808
R 11,773 R 2,372
1956:
TPV 253,926 61,128 82,595
79,702 30,501
R 40,690 R 5,125 R 11,003
R 20,826 R 3,736
1960:
TPV 311,107 66,032 103,392
105,040 36,643
D 2,294 D 11,754 R 11,556
R 804 D 2,900
115

1968:
TPV 327,281 64,846 99,983
121,480 40,972
R 39,611 D 1,773 R 21,533
R 15,254 R 4,597
GW 25,737 GW 2,532 GW 14,357
GW 5,944 GW 2,904
1976:
TPV 416,590 78,205 115,430
170,760 52,195
R 10,271 D 14,093 R 9,848
R 10,924 R 3,592
1988:
TPV 521,287 101,838 136,307
211,284 71,858
R 25,844 D 28,937 R 33,352
R 15,935 R 5,494
1992:
TPV 569,986 104,858 145,159
245,207 74,762
D 48,793 D 40,243 R 14,011
D 17,204 D 5,357
116

Perot raw 91,895 P 12,255 P 27,036
P 38,907 P 13,697
2000:
TPV 598,605 119,674 138,916
262,411 77,604
D 366 D 39,951 R 43,402
D 1,681 D 2,136
Nader raw 21,251 N 6,159 N 2,686
N 10,263 N 2,143
2004:
TPV 756,304 154,745 171,155
333,871 96,533
R 5,988 D 54,373 R 65,745
D 4,747 D 637
2012:
TPV 783,757 159,256 165,855
359,177 99,469
D 79,547 D 75,516 R 54,420
D 46,765 D 11,686
Siphons from the Left and Right: The Green Party and Governor Gary
Johnson
117

Both the Green Party left and the Libertarian right
have had some siphoning impact in New Mexico – indeed, the
Green Party may have indirectly created the 2012 Libertarian
Presidential candidate. In the 1994 Republican tsunami
election, future Libertarian Presidential candidate Gary
Johnson defeated three-term Democratic Governor Bruce King’s
reelection bid with only 49.81% -- thanks to the 10.16%
Green Party vote achieved by former Democratic Lieutenant
Governor Roberto Mondragon. In a May 13, 1997 special
election, the Santa Fe centered New Mexico-3 U.S. House
district went to a Republican who achieved 42.78% -- thanks
to the Green Party candidate achieving 16.78% and driving
the Democrat down to 39.77%; had 98 percent of the Green
vote gone to Governor King, he would have prevailed87. In
the 1998 general, district 3 was re-flipped by future U.S.
Senator Tom Udall, but in that year’s special for the
Albuquerque-centered district 1 U.S. House seat, the Green
candidate 15% enabled Republican Heather Wilson to win with
45%; in the general, the Green percentage fell to 10%, but
Congresswoman Heather Wilson still prevailed 48-42 over the
Democrat. In 2000, the Green percentage fell to 6%, but
Congresswoman Wilson prevailed 50-43-6. No Green candidate
ran after 2000, and when Heather Wilson ran for the U.S.
Senate in 2008, Democrat (and now Class I U.S. Senator)
87 Michael Barone, The Almanac of American Politics 2000, page 1066 (describing 98% of Greens for Governor Bruce King as “unlikely”).
118

Martin Heinrich won the seat, and in 2012 the Democratic
baton passed to Michelle Lujan Grisham as Heinrich went to
the Senate.
In 2004, the Green Party enrolled 9,724 voters, 88 one
hundredths of one percent of the 1,105,372 total
registration; of these 9,724, almost half were in
Albuquerque Metro – 4,785, and almost as many were in the
Democratic Nine (3,948), with far fewer in the Swing Vote
Six (572) or Little Texas (418)88. Green Party candidates
were the only November opponents to the 1994 Democratic
winner for State Treasurer and the 1998 Democratic winner
for State Auditor, and took over five percent in the 2002
engagements for Governor and Attorney General. After 2004,
the Green Party abolished its’ primary, and while it still
had ballot lines in the 2004, 2008 and 2012 Presidentials89,
the Green Party has not had a New Mexico gubernatorial or
state office candidate line after 2002.
On the Libertarian side, in 2012 the party’s
Presidential candidate was two-term New Mexico Governor Gary
Johnson, and his presence on the New Mexico ballot took
27,787 New Mexico votes, or 3.55 percent. This may have
further dampened any flickering hopes for Mitt Romney
winning New Mexico, since his 42.84% was 10.15 points behind88 See Chart XXIV at the end of this article.89
? Ralph Nader ran on the Green line in 2000 New Mexico, but not in 2004 (Independent) or 2008 (Independent). The Green Party candidate was David Cobb in 2004, Cynthia McKinney in 2008, and Jill Stein in 2012.
119

President Obama; had the Gary Johnson votes been with
Romney, the Romney percentage a more respectable 46.39%. The
Gary Johnson for President votes came only 15.50 percent
from Little Texas (4,309), with almost four times that
number coming from Albuquerque Metro, where the 16,012 was
57.62 percent of the statewide Gary Johnson vote; the
remainder came from the Swing Vote Six (2,859) and
Democratic Nine (4,607).90
New Mexico: Key State in the Democratic Far Western Early Voting Firewall
That Subsumes The Masked Republican Voters From The Desert
New Mexico, along with Nevada and Colorado in the
Rockies and the Pacific Coast powerhouses of California,
Oregon, Washington, and Hawaii, is becoming a default mail
ballot and in-person early voting state; in 2012, 59 percent
of the New Mexico total vote was cast before Election Day.
Each one of the 13 western states (eight in the Rockies,
five in the Pacific) offers no-excuses mail ballots, and 10
of the 13 also offer in-person early voting. The three that
do not offer in-person early voting are Oregon and
90 See Chart XXV at the end of this article.
120
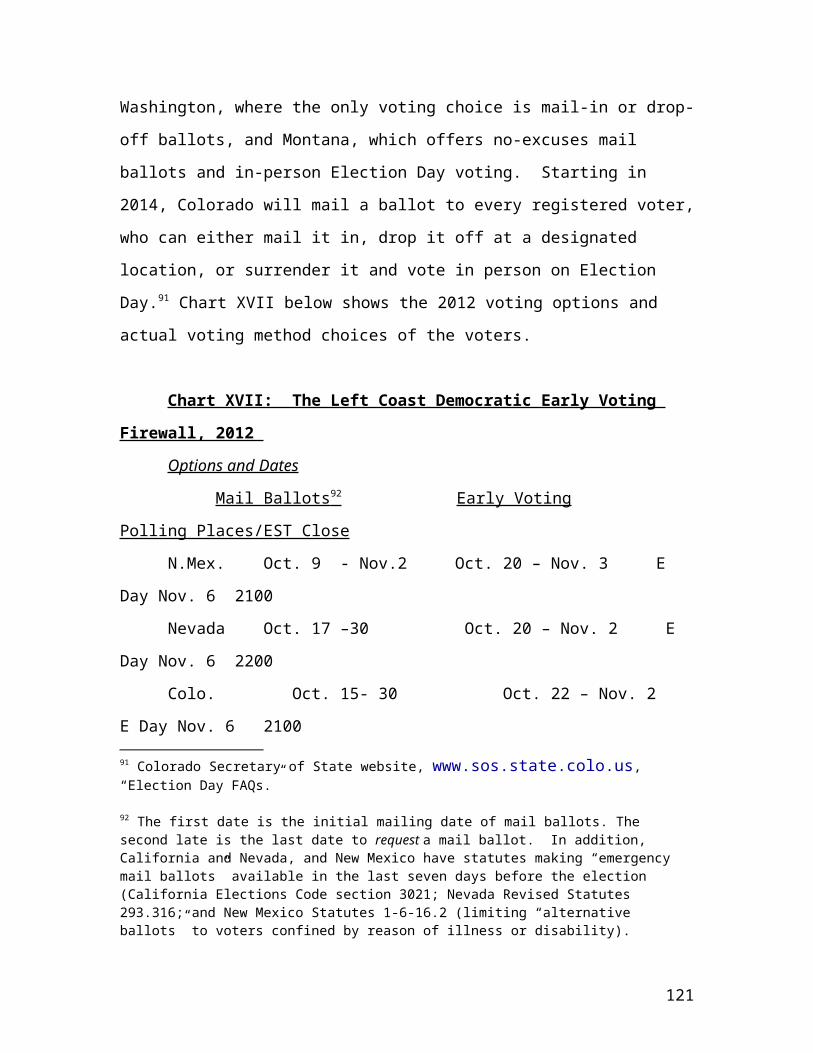
Washington, where the only voting choice is mail-in or drop-
off ballots, and Montana, which offers no-excuses mail
ballots and in-person Election Day voting. Starting in
2014, Colorado will mail a ballot to every registered voter,
who can either mail it in, drop it off at a designated
location, or surrender it and vote in person on Election
Day.91 Chart XVII below shows the 2012 voting options and
actual voting method choices of the voters.
Chart XVII: The Left Coast Democratic Early Voting
Firewall, 2012
Options and Dates
Mail Ballots 92 Early Voting
Polling Places/EST Close
N.Mex. Oct. 9 - Nov.2 Oct. 20 – Nov. 3 E
Day Nov. 6 2100
Nevada Oct. 17 –30 Oct. 20 – Nov. 2 E
Day Nov. 6 2200
Colo. Oct. 15- 30 Oct. 22 – Nov. 2
E Day Nov. 6 2100
91 Colorado Secretary of State website, www.sos.state.colo.us, “Election Day FAQs.”
92 The first date is the initial mailing date of mail ballots. The second late is the last date to request a mail ballot. In addition, California and Nevada, and New Mexico have statutes making “emergency mail ballots” available in the last seven days before the election (California Elections Code section 3021; Nevada Revised Statutes 293.316; and New Mexico Statutes 1-6-16.2 (limiting “alternative ballots” to voters confined by reason of illness or disability).
121

Calif. Oct. 8 – 30 Oct. 7 – Nov. 5
E Day Nov. 6 2300
Hi. Oct. 17 -30 Oct. 23 – Nov. 3
E Day Nov. 6 2300
Ore. Oct. 19 none
none ballots must arrive E Day
Wash. Oct. 19 none
none ballots postmarked E Day, arrive before E + 21
certification (E + 20)93
Vote Method Choices
Mail Ballots Early Voting
Polling Places Total/Mail+Early %
N.Mex. 88,848 374,574
323,100 786,522 59%
Nevada 85,670 619,381
311,613 1,016,664 69%
Colo. Mail+early 1,872,986
723,187 2,596,173 72%
93 Washington Revised Code (RCWA) 29A.60.190, states that ballots are counted if received either by 8:00 p.m. on Election Day or are postmarked on or before Election Day and received the day before the certification date (Election Day plus 21).
122

Calif.94 Mail 6,753,688
6,448,470 13,202,158 51%
Hi. Mail 200,552
236,607 437,159 46%
(Hawaii Early total is 476 overseas+200,076 absentee)
Ore. Mail 1,791,339
zero 1,791,339 100%
Wash. Mail 3,056,189
AVU 11,828 3,068,017 + 100% 101,366
As can be seen, the lowest early voting (mail + in-
person) percentage in these seven states is the 46% number
in Hawaii. On the mainland, the early voting percentages
start at 51% in California, and rise to 59% in New Mexico,
69% in Nevada and 72% in Colorado, ending up at 100% in
Oregon and Washington. The Nevada mail and early voting
results are typically released shortly after the 1900
Pacific Time poll closing, meaning that with 69% of the vote
counted at poll closing time, the Nevada result can be
called at 2200 hours Eastern Standard Time, one hour before
the polls close on the Pacific Coast.95
94 California allows in-person early voting at the 58 county elections offices starting 30 days before Election Day, but does not formalize it the way Nevada, New Mexico and Colorado do. Hence, the mail ballot number includes the early voting numbers.
95 In contrast, New Mexico Statutes 1-12-70 requires each of the 33 county clerks to report the precinct results to the Secretary of State on Election Night, and over the next 60 days break them down by mail ballots, in-person early voting, and Election Day polling place voting.
123

New Mexico breaks down the vote for each candidate between
mail ballots, in-person early voting, and Election Day
ballots, with the numbers for all three methods broken down
for each county (and within each county, each precinct). The
only exceptions are for voters in precincts with five or
fewer registered voters, and in these precincts separate
returns are masked within the overall county totals in order
to protect ballot secrecy.96 The masked numbers validate the
theory that less density and more remote locations equal
more Republicans: in 2004, the number of masked Bush votes
was 2,755 versus 26 for Kerry; in 2012, there were 4,709
masked votes for Romney and zero for Obama.
As can be seen in Charts XXVI (Democratic) and XXVII
(Republican) at the end of this article, a comparison of the
2012 and 2004 ballot breakdowns shows that early voting in
person is on the rise in New Mexico, reducing both mail-in
ballots and polling place ballots. On the Democratic side
from Kerry to Obama:
96
? The county-by-county voting methods are broken out in Charts XXVI (Democratic) and XXVII (Republican) at the end of this article. The onewrinkle is that in 2004, Chaves (Roswell) and Colfax (Raton) refused to break out the partisan vote by the three methods, so all ballots cast inthese two counties in 2004 have been arbitrarily assigned to the Election Day category.
In accordance with 1-12-70 NMSA [New Mexico Statutes Annotated] 1978 and1.10.33 NMAC [New Mexico Administrative Code], precincts with fewer thanfive voters are reported as a single total in the affected county summary pages.
124

In the Democratic Nine, Democratic mail ballots
fell from Kerry 21,757 to Obama 9,487, but in-
person early voting rose from Kerry 32,635 to
Obama 49,385. Old-fashioned Election Day shoe
leather was still in fashion, however, as the
Election Day vote rose from Kerry 49,377 to Obama
55,328, showing the shrewd Obama campaign
targeting of its’ turnout efforts.
On the Republican side in the Democratic Nine,
Republican mail ballots fell from Bush 7,946 to
Romney 4,168; Republican in-person early voting
barely rose, from Bush 14,953 to Romney 15,068;
Republican Election Day voting crashed from 26,484
to 17,575.
On the other side of the New Mexico partisan
divide – Little Texas – Democratic mail balloting
fell from 5,967 to 4,247; in-person early voting
rose from 15,952 to 21,085; and Election Day
Democratic ballots fell from 29,894 to 27,785.
Little Texas Republican mail ballots fell from
14,737 to 10,857; in-person early voting rose from
41,615 to 49,636; and Republican Election Day
ballots fell from 58,477 to 45,319.
Thus, in 2004, the mail + early voting numbers from the 23
partisan-polarized counties were Kerry 76,311, Bush 79,251
125

(Republican edge of 2,940). In 2012, the mail + early
voting numbers were Obama 84,204, Romney 79,729 (Democratic
edge of 4,475).
In Albuquerque Metro, Democratic mail ballots fell
from Kerry 40,435 to Obama 24,992; Democratic in-
person early voting rose from 48,648 to 104,352;
Democratic Election Day ballots fell from 78,246
to 64,570.
Republican Albuquerque Metro mail ballots fell
from 36,171 to 24,125; in-person early voting rose
from 48,404 to 76,971; Election Day ballots
crashed from 78,007 to 45,844.
In the Swing Vote Six, Democratic mail ballots
fell from 8,766 to 4,593; in-person early voting
rose from 13,495 to 23,362; and Election Day
ballots barely rose, from 25,757 to 25,839.
On the Republican side in the Swing Vote Six, mail
ballots fell from 6,956 to 3,819; in-person early
voting rose from 13,559 to 19,110; and Election
Day ballots fell from 26,866 to 18,587.
Thus, in the pivotal ten swing counties, the 2004 mail +
early voting numbers were Kerry 111,344, Bush 105,090
(Democratic edge of 6,254). The 2012 mail + early voting
126

numbers were Obama 157,229, Romney 124,025 (Democratic edge
of 33,204).
Statewide, the 2004 election prior to Election Day was
Kerry 187,655, Bush 184,341, a Democratic edge of 3,314. On
Election Day 2004, the Bush campaign added 2,755 masked
votes from the five-voter precincts plus 189,834 categorized
Election Day votes, moving to their final wining number of
376,930. In contrast, the Kerry campaign added only 26
masked votes and 183,261 categorized Election Day votes,
moving to 370,942, – a gap of 9,302, meaning the Democratic
early voting edge of 3,314 was overcome by the masked Bush
edge of 2,755 to 26 (net 2,729), and the Election Day
ballots edge of 189,834 to 183,261 (6,573) to create the
surprise Bush win by 5,988.
Eight years later, the 2012 election prior to
Election Day was Obama 241,433, Romney 203,754, meaning
Obama was already ahead by 37,679 when the Restore Our
Future Super PAC ad buy began on October 31, 2012. Romney
came up with 4,709 masked voters (almost double the 2004
Bush number), but only 122,616 Election Day voters, whereas
Obama added 173,892 Election Day voters (and no masked
voters), meaning Obama also won Election Day by 46,567.
These seven double-Obama states west of El Paso have 98
electoral votes on the 2012-2016-2020 Electoral College map,
meaning that if all seven stay Democratic, from the Eastern
and Central time zones the 2016 and 2020 Democratic
127

candidates need only win 172 of 410 electoral votes, whereas
Republicans need 240 of 410, assuming the GOP holds the 30
from Alaska, Idaho, Wyoming, Utah, Montana and Arizona. The
dominance of early voting in the 13 Far Western states means
that the last-minute ad buy flinging a fusillade of
falsehoods lit by dark money will not work, because in New
Mexico, 59% of the votes are cast as early as twenty-eight
days before the election (the mail ballot mailing date), a
fact that made the October 31, 2012 purchase of $800,000
worth of New Mexico TV ads by a pro-Romney Super PAC a
wasted effort.
Governor Susana Martinez: Hype from 2010, No Hope for 2016
Republicans won the New Mexico Governor’s office in
2010 for the first time since 1994-1998, as enough voters
decided it was time to reject the Bill Richardson Lieutenant
Governor (Diane Denish) in favor of Las Cruces prosecutor
Susana Martinez, who after achieving a three-way 53.29% and
6.74 point margin became America’s first-ever female
Hispanic Governor. Naturally, speculation about 2016
includes talk that a Veep or even a top-of-the-ticket
Republican candidacy by Governor Martinez (or Nevada 2010
Governor Brian Sandoval) might take New Mexico, Nevada,
Colorado and other Hispanic-influenced states out of the
Democratic column and provide most of the 64 electoral votes
128

the Republicans need to move up from 206 to the magic number
of 270. Of course, even assuming Martinez is reelected in
2014, a Martinez 2016 candidacy will have to get past
revelations about Martinez’s taped offensive remarks about
2010 Democratic nominee Lieutenant Governor Diane Denish,
the New Mexico state court whistleblower lawsuit brought by
several of her former employees, and even some of the
material rehashed in the Almanac 2014 New Mexico write-up, not
to mention whatever else is dug up by Democratic opposition
researchers between today and 2016.97
More fundamentally, the winning Martinez percentages
(which include wins of all four Albuquerque Metro and Swing
Vote Six counties) are based on a lower off-year turnout;
when stacked up against Obama 2012 raw numbers, there is a 97 Huffington Post Hill electronic mail newsletter, which states as follows:
SUSANA MARTINEZ LIKES A GOOD SWEAR - Knock the language up from "PG-13" to "R" andyou've got Dick Cheney's vote: "Listening to recordings of [New Mexico Governor Susana] Martinez talking with her aides is like watching an episode of HBO's Veep,with over-the-top backroom banter full of pique, self-regard, and vindictiveness. As Martinez and her campaign staff rewatched a recent televised debate, Martinez referred to Denish, her opponent, as 'that little bitch.' After Denish noted that the Albuquerque Chamber of Commerce had given her an award, [top aide Jay] McCleskey snapped, 'That's why we're not meeting with those fuckers.' In a September 2009 email mentioning one of Martinez's 2010 primary opponents, a formerstate representative named Janice Arnold-Jones, McCleskey wrote: 'I FUCKING HATE THAT BITCH!' And in yet another debate prep meeting, Kennicott mocked the languageskills of Ben Luján, a former state House speaker and a political icon to New Mexico Latinos: 'Somebody told me he's absolutely eloquent in Spanish, but his English? He sounds like a retard.'" [MoJo]
The whistleblower suit complaint can be found at www.motherjones.com, “Whistleblower Suit Alleges Corruption, Cronyism, Affairs, in Gov. Susana Martinez’s Administration” (May 8, 2014)(Andy Kroll).
Other 2010-2014 allegations are discussed in Michael Barone, The Almanac of American Politics 2014, pages 1119-1121.
129

gap that represents Presidential year voters that enabled
President Obama to win New Mexico by 10.15 points. Chart
XVIII below displays for each of the four New Mexico regions
a comparison of the Susana Martinez and Diane Demish raw
numbers in 2010 compared with the 2012 Mitt Romney and
Barack Obama raw numbers.
Chart XVIII: Susana Martinez 2010 versus Barack Obama 2012:
Raw Numbers
Dem. Nine Little Texas 14 Aque. Metro
Swing Vote Six State
2012 Obama 114,500 53,127
193,914 53,794 415,335
2010 Denish 79,034 37,888
128,449 35,243 280,614
Dem. Gap: 35,466 15,239
65,465 18,551 134,721
2012 Romney 38,984 107,547
147,149 42,108 335,788
2010 Martinez 45,773 91,307
143,947 40,192 321,219
Rep. Gap: (6,789) 16,240
3,202 1,916 14,569
130

The 2012 Obama raw margin was a statewide 79,547. The 2010
Martinez raw margin was a statewide 40,605. The Martinez
2010 raw number underperforms the 2012 Romney raw number by
a statewide 14,569, whereas the Democratic Denish raw number
underperforms the 2012 Obama number by 134,721 – nine times
the Republican gap. In addition, the Martinez 2010 campaign
in the Democratic Nine actually ran ahead of Romney 2012 by
6,789 votes – and did so in every county except the
southwestern county of Grants (Silver City). In Santa Fe,
the numbers were Romney 15,500, Martinez 17,441; in Taos,
Romney 2,730, Martinez 3,495; in McKinley (Gallup), Romney
5,546, Martinez 5,850; in Rio Arriba (Tierra Amarilla),
Romney 3,397, Martinez 4,818; in San Miguel (Las Vegas),
Romney 2,303, Martinez 3,508; Mora, Romney 595, Martinez
1,220; Cibola (Grants), Romney 2,998, Martinez 3,176; Grant
(Silver City), Romney 5,358, Martinez 5,165 (minus 193);
Guadalupe (Santa Rosa), Romney 557, Martinez 1,100. In
contrast, in Martinez’s home county of Dona Ana (Las
Cruces), her 2010 raw number of 24,628 ran 2,694 behind the
Romney 2012 number of 27,322; in Bernalillo (Albuquerque),
the Martinez 102,711 ran behind the Obama 150,739 by 48,028,
meaning that if the Obama 2012 vote in Bernalillo had all
voted in 2010, the Martinez statewide margin would have been
wiped out.
In 2016, the Martinez 6,789 overperformance in the
Democratic Nine will not happen because the Democratic
131

Presidential candidate will be someone other than Diane
Denish. In addition, the Democratic 2010-2012 raw number
upticks totaling 134,721 will be operating. Note that the
Martinez 2010 raw number of 321,219 is the highest
Republican gubernatorial raw number in New Mexico history,
but is behind the John Kerry 2004 number of 370,942, not to
mention both Barack Obama numbers (472,422 and 415,335).
The Missing White Voter Theory Eligible Nonvoter Turnout Has Never Occurred in
New Mexico, And Republican Caucasian Solidarity Appeals Will Turn Off Voters in
All of New Mexico Outside of Rural Little Texas
New Mexico electoral history will be made if enough of
the current registered nonvoters (or unregistered eligibles)
will both turn out in 2016 and break Republican at the 94
percent level needed to flip the Land of Enchantment. Most
studies of nonvoters conclude that they are similar to the
voting population, or are more liberal on economic issues
(and perhaps conservative on social issues). If the
Republican nominee in 2016 relies on white resentment
appeals to this “hidden” nonvoting (or even nonregistered)
electorate, he or (not likely) she runs the risk of
alienating existing Republican voters throughout New Mexico,
especially the few remaining Republican voters in the
Democratic Nine, not to mention Albuquerque Metro, the Swing
Vote Six, and perhaps even the ancestrally Republican Little
132

Texas rural county of Lincoln, which has never voted
Democratic outside of 1932-1936. As Sean Trende stated at
the end of in his July 2, 2013 article, “every action in
politics tends to create an opposite one.” Trende has repeatedly
noted in his The Lost Majority and elsewhere, that adding a new
element to a coalition frequently induces existing loyalists
to “head for the exits” (this happened to the Democratic
Party in fits and starts between the 1934 election of the
first African-American Democratic Congressmember in
Illinois-1 and the post-1964 departure of most Deep Southern
Caucasians). Thus, Trende’s own coalition analysis
militates against the idea that the Missing White Voters can
flip any state, much less the least NHEW state in America
outside of D.C.
Will The Missing White Voter Appeal Result In The First-Ever Democratic
Presidential Sweep of All 33 New Mexico Counties?
No Democratic candidate for President has carried all
33 New Mexico counties,98 but thanks to the Republican
nominating process, Lyndon Johnson in 1964 carried 29 of 32,
losing only Union, Harding and Lincoln. In 1964, Republican 98 In 2008, Barack Obama missed 15 of 33; in 2012, President Obama missed 16 of 33 (Luna County flipped). In 1996, President Clinton missed10 of 33. In 1964, President Johnson missed three (Union, Harding and Lincoln), and Cibola County did not exist; in 1936 President Roosevelt missed one (Socorro County); FDR in 1932 missed two (San Miguel and Valencia).
133

Deep South appeals to registered and unregistered
segregationists flipped the 1960 Kennedy states of Georgia,
Alabama, Louisiana, and South Carolina, plus the unpledged
state of Mississippi, but cost the Republicans everything
else, including the 1960 Nixon near-miss Western states of
New Mexico, Nevada and Hawaii. Within New Mexico,
Republicans in 1960 carried 13 of the 32 counties for
Nixon; narrowly lost the state with 49.41% (national minus
0.14 of a point); and prevented New Mexico from being called
before 0700 Wednesday morning.
However, with Goldwater in 1964 the Republican
percentage fell by 9.17 percentage points to 40.24 percent;
Goldwater lost 29 of the 32 counties, including the pivotal
1960 Nixon county of Bernalillo; and Democratic margins
increased in every one of the nineteen JFK 1960 counties. A
2016 Missing White Voter appeal will probably have the same
impact in the remaining Republican areas outside of the
Democratic Nine counties, not to mention metropolitan areas
in Pennsylvania, Minnesota, Wisconsin, Virginia, Ohio,
Florida, Colorado, and Nevada, and perhaps even Arizona,
Georgia, Indiana, North Carolina, Missouri and Montana.
134

Map – New Mexico for President, 1960 and 1964 – Mirror
Image Results
1964 1960
1964
1960
By Every Metric Inside and Outside The Theory, The Theory Cannot Flip
New Mexico
135

As can be seen, the 55 percent turnout rate expressly
used in the Trende articles can be applied to the statewide
growth in actual eligible 2004-2012 growth in nonvoters, or
the 2012 nonvoter number, or actual registered nonvoter
growth between 2004 and 2012 in the 14 Little Texas
counties, or the 2012 registered nonvoter number in the 14
Little Texas counties. Using any of these applications of
The Theory simply does not generate enough new voters at the
Trende 55 percent turnout rate to flip either the 2012 or
the 2008 Obama margins of 79,547 or 125,590 with one
exception: a lemming-like rush of 55 percent of the entire
statewide 2012 eligible non-voter population that breaks 57-40-3 Republican.
Chart XIX: The 55 Percent Turnout Rate Applied To Nonvoting
Populations in New Mexico
New Mexico eligible non-voter growth, 2008-2012:
121,798 x .55 = 66,988 (not enough)
New Mexico registered non-voter growth, 2008-2012:
117,609 x. 55 = 64,684 (not enough)
New Mexico eligible non-voter growth, 2004-2012:
161,352 x .55 = 88,743 (flips state only at
Republican 94-3-3)
New Mexico registered non-voter growth, 2004-2012:
137,975 x .55 = 75,787 (not enough)
136

Little Texas 14 counties registered non-voter
growth, 2004-2012: 23,800 x .55 = 13,090 (not
enough)
2012 Little Texas total registered non-voters:
102,804 x . 55 = 56,542 (not enough).
2012 New Mexico eligible non-voters: 797,470 x .55
= 438,608 that breaks 57-40-3 Republican (even
though 85 percent of these non-voters did not vote
in 2008 either).
2004-2012 Census CPS estimated growth in non-
voting eligibles: 84,000 x .55 = 46,200
2004-2012 Census CPS estimated growth in NHW non-
voting eligibles: 26,000 x .55 = 14,300
As can be seen, only one of the 2008-2012 or 2004-2012
nonvoter growth metrics generates a 55 percent turnout
number that exceeds 79,547 (the 2012 Obama margin) – 2004-
2012 eligible non-voter growth that in 2016 magically
materializes to register and votes Republican by a margin of
94-3-3.
If The Theory using its’ own estimates and as applied
to real world eligible and voting numbers in the most NHW
137

section of New Mexico (Little Texas) can generate enough new
voters to defeat the 2012 Obama margin only at 94 percent
Republican, it cannot flip New Mexico when the 2012 Romney
percentage is only 73.75% (Lea County, total Presidential
vote 17,015), and tops 70 percent in only two other counties
(Clayton and Catron, combined total Presidential vote
3,882). If The Missing White Voter Theory cannot flip New
Mexico, Virginia, and either Iowa or Nevada, unless it flips
a Kerry state such as Pennsylvania, Michigan, Minnesota, or
Wisconsin, it is irrelevant to the 2016 or 2020 Electoral
College outcome: Kerry 246 + Virginia 13 + New Mexico 5 + 6
from either Iowa or Nevada = 270 for Team Blue.
Strategy for Republicans: Eliminate the Gender and Nonwhite Gaps
Instead of chasing unregistered or registered nonvoting
Missing White Voters, Republicans would be better off trying
to win back the “lost majority” from three of the four
counties of Albuquerque Metro and the four in the Swing Vote
Six that they swept in the 1988 Bush win: Bernalillo,
Sandoval, Valencia, Los Alamos, Dona Ana, Hidalgo, and
Socorro. The 2012 Obama margin from these counties is 59,510
from a total vote of 438,980, meaning if Republicans convert
the 13.56 percentage point Democratic spread in these eight
counties into an 18.22 point Republican spread, they carry
these counties by a combined 79,965 and win New Mexico by
138

418 votes – assuming no Democratic gains anywhere else.
Moving 31.78 percentage points in margin in one quadrennium
is a tall order, but at least these voters exist on the
registration and voting rolls in enough numbers to actually
flip the state, whereas the Missing White Voters number in
Little Texas is no more than 23,800 or 56,542 – to quote
Vice President Biden as censored by the ghost of Richard
Nixon, “big [expletive deleted] deal.”
Republican Electoral College analysts may reluctantly
conclude that Romney was correct to pull staff out of New
Mexico early in a state where he fell short of the McCain
raw number that fell short by 15.13 percentage points in
2008. Of course, if Republicans can’t carry New Mexico and
its’ five electoral votes, they are back to the Scranton-St.
Cloud road to 270 which requires carrying every one of
Pennsylvania, Ohio, Iowa, Wisconsin, and Minnesota.
Thus, if Republican strategists wish to double down on
the unregistered, nonvoting angry white male population, be
my guest as Democrats on January 20, 2017 celebrate a third
consecutive White House inauguration (the first since 1949)
-- just don’t bet on the Missing White Voter Theory to
obtain any inaugural tickets, or invitations to the New
Mexico Inaugural Ball.
Next stop on the Electoral College Junket: Nevada
139

Chart VII: New Mexico’s 33 Counties Ranked by 2010 Census NHW Percentage
2010 – 2,059,179 Af Am 2.4% Native Am 10.2% Asian 1.6% Hispanic 47.0% NHW 39.8%
NHW 50%-Plus (13 counties)
Catron 75.7 Hisp. 19.4 Native 3.0
Los Alamos 75.0 Hisp. 15.6 Asian 6.2
Sierra 67.2 Hisp. 18.9
Lincoln 64.9 Hisp. 31.0
140

DeBaca 58.0 Hisp. 39.3
Harding 55.7 Hisp. 42.0
Torrance 55.1 Hispanic 39.8
Roosevelt (Portales) 54.7 Hisp. 40.4
Union 54.6 Hispanic 41.0
Quay 52.4 Hisp. 43.3
Otero (Alamagordo) 52.2 Hisp. 35.3 Native 7.1
Eddy 51.3 Hisp. 45.2
Curry 50.8 Hisp. 39.7 Af Am 6.8
Hispanic Majority (12 counties)
San Miguel NHW 19.6 Hisp. 76.9
Santa Fe NHW 43.7 Hisp. 50.9 Native 3.9
Taos NHW 36.1 Hisp. 56.2 Native 7.2
Valencia NHW 35.4 Hisp. 58.8 Native 5.2
Rio Arriba NHW 13.3 Hisp 71.3 Native 18.0
Mora NHW 18.1 Hisp. 80.6
Guadalupe NHW 15.8 Hisp 79.8
Dona Ana (Las Cruces) NHW 29.4 Hisp. 66.4
Hidalgo NHW 41.8 Hisp. 55.9
141

Lea (Hobbs) NHW 41.0% Hisp. 53.3 Af Am 4.4
Luna NHW 34.1 Hisp 63.2
Chaves (Roswell) 53.3 NHW 42.6
Native American Majority (1)
McKinley (Gallup) NHW 10.2 Hisp 13.8 Native 76.4
Hispanic-Native Majority or Near-Majority (7)
Bernalillo – NHW 40.9% Hisp. 48.4% Native 5.6% Asian 2.7% AfAm 3.4%
San Juan (Farmington) NHW 41.2 Hisp.19.3 Native 38.4
Sandoval NHW 46.6 Hisp. 36.3 Native 13.4 Af Am 2.5
Socorro NHW 37.1 Hisp. 48.9 Native 12.4
Cibola NHW 21.4% Hisp. 37.3 Native 41.4
Colfax NHW 48.6 Hisp 48.2 Native 10.2
Grant NHW 47.9 Hisp. 49.0 Native 1.9
142

Chart XX: New Mexico Counties Registration and Voting, 2012and 2004 – As of October Registration Close
Registration 2012 – 2004 Voting 2012 -- 2004 (“Total Voters”)
Democratic New Mexico (9 counties)
Santa Fe 99,474 -- 94,634 + 4,840 69,443 –67,782 + 1,661
Taos 24,817 -- 23,080 + 1,737 15,425 – 15,482 min. 57
Rio Arriba 25,832 – 24,839 + 993 15,458 – 15,613 min. 155
McKinley (Gallup) 38,324 -- 34,934 + 3,390 22,072 – 22,223min. 151
Mora 4,050 -- 4,413 min. 363 2,616 – 3,001min. 385
Cibola (Grants) 14,744 – 14,270 + 474 8,297 – 8,003 + 294
Grant (Silver City) 20,890 – 21,100 min. 210 12,991 – 13,751min. 760
San Miguel (Las Vegas) 22,543 – 21,081 + 1,462 11,562 – 12,832 min. 1,270
Guadalupe 3,495 – 3,720 min. 225 2,165 --2,154 + 11
TOTALS: 254,169 – 242,071 + 12,098 160,029 – 160,841 min. 812
143

Registration 2004-2012: up 12,098Voting 2004-2012: down 812Registered nonvoters 2004: 81,2302012 registered nonvoters: 94,140 x .55 = 51,7772004-12 registered nonvoters: up 12,910 x .55 = 7,100
Republican Little Texas (14 counties)
Harding 761 -- 785 min. 24 607 -- 649 min. 42
Union 2,636 – 2,523 + 113 1,769 – 1,894 min. 125
Quay 5,984 – 6,198 min. 214 3,659 – 4,129 min. 470
Curry 22,618 -- 21,554 + 1,064 13,704 -- 14,323 min. 619
Roosevelt 10,294 – 11,071 min. 777 6,014 -- 7,163 min. 1,149
DeBaca 1,399 – 1,462 min. 63 673 -- 1,084 min. 411
Chaves (Roswell) 33,352 – 33,520 min. 168 20,394 -- 22,156min. 1,762
144

Eddy 30,939 – 27,926 + 3,013 19,348 --20,340 min. 992
Lea (Hobbs) 30,059 – 29,333 17,064 --18,317 1,253
Lincoln 14,206 – 14,100 + 106 9,303 --9,273 + 30
Catron 3,118 -- 2,766 + 352 2,140-- 2,006 + 134
San Juan (Farmington) 72,273 – 63,340 + 8,933 46,374 – 45,938 + 436
Otero (Alamagordo) 33,452 – 31,052 + 2,400 20,110 -- 21,326 min. 1,216
Sierra 7,996 -- 7,258 5,124 -- 5,286 min. 162
TOTALS: 269,087 – 252,888 + 16,199 166,283 -- 173,884 min. 7,601
Registration 2004-2012: up 16,199Voting 2004-2012: down 7,601Registered nonvoters 2004: 79,004Registered nonvoters 2012: 102,804 x .55 = 56,542Registered nonvoters 2004-12: + 23,800 x .55 = 13,090
145

Metro Albuquerque 4 counties
Bernalillo 429,412 – 356,536 + 72,876 271,927 -- 262,617 + 9,310
Sandoval 86,217 – 63,951 + 22,266 54,245 --45,863 + 8,382
Torrance 10,077 – 9,503 + 574 6,438 -- 6,715 min. 277
Valencia 42,942 – 37,398 + 5,544 27,870 -- 26,155 + 1,715
TOTALS: 568,648 – 467,388 + 101,260 360,480 -- 341,350 + 19,130
Registration 2004-2012: up 101,620Voting 2004-2012: up 19,130Registered nonvoters 2004: 126,038Registered nonvoters 2012: 208,168 x .55 = 114,492Registered nonvoters 2004-12: up 82,130 x .55 = 45,171
Swing Votes 6 counties
Dona Ana (Las Cruces) 111,583 – 94,345 + 17,238 66,496 -- 63,777 + 2,719
Los Alamos 13,804 – 13,633 + 171 10,684 -- 11,232 min. 548
Socorro 12,054 – 12,445 min. 391 7,251 -- 8,158 min. 907
Colfax 9,407 – 8,549 + 858 5,805 -- 6,259 min. 454
146
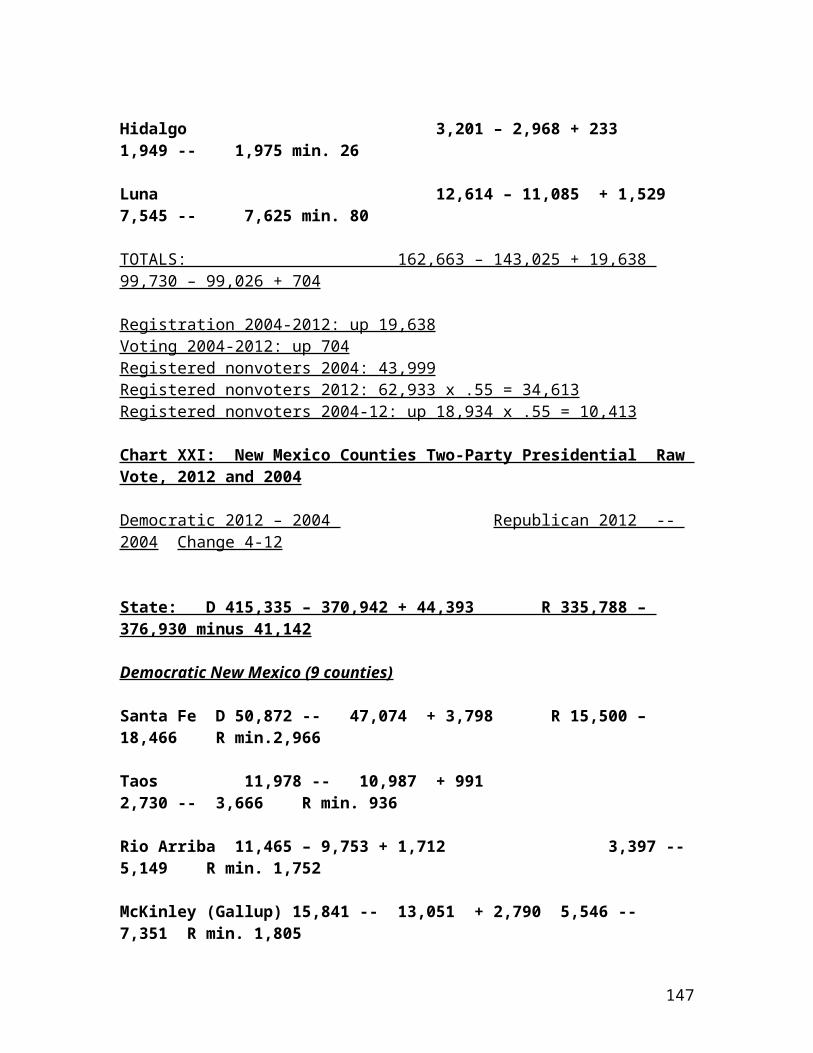
Hidalgo 3,201 – 2,968 + 233 1,949 -- 1,975 min. 26
Luna 12,614 – 11,085 + 1,529 7,545 -- 7,625 min. 80
TOTALS: 162,663 – 143,025 + 19,638 99,730 – 99,026 + 704
Registration 2004-2012: up 19,638Voting 2004-2012: up 704Registered nonvoters 2004: 43,999Registered nonvoters 2012: 62,933 x .55 = 34,613Registered nonvoters 2004-12: up 18,934 x .55 = 10,413
Chart XXI: New Mexico Counties Two-Party Presidential Raw Vote, 2012 and 2004
Democratic 2012 – 2004 Republican 2012 -- 2004 Change 4-12
State: D 415,335 – 370,942 + 44,393 R 335,788 – 376,930 minus 41,142
Democratic New Mexico (9 counties)
Santa Fe D 50,872 -- 47,074 + 3,798 R 15,500 – 18,466 R min.2,966
Taos 11,978 -- 10,987 + 991 2,730 -- 3,666 R min. 936
Rio Arriba 11,465 – 9,753 + 1,712 3,397 -- 5,149 R min. 1,752
McKinley (Gallup) 15,841 -- 13,051 + 2,790 5,546 -- 7,351 R min. 1,805
147

Mora 1,955 -- 1,876 + 79 595 -- 928 R min. 333
Cibola (Grants) 4,961 – 3,913 + 1,048 2,998 -- 3,477 R min. 479
Grant (Silver City) 7,090 – 7,095 min. 5 5,358 -- 6,135 R min. 777
San Miguel (Las Vegas) 8,850 – 8,683 + 167 2,303 -- 3,313 R min. 1,010
Guadalupe 1,488 – 1,340 + 148 557-- 914 R min. 357
TOTALS: D 114,500 – 103,772 + 10,728 R 38,984 – 49,399 min. 10,4152010 Denish-Martinez: D 79,034 -- R 45,773Margin: Denish 33,2612004 Raw Gap with 2010: D 24,738 R 3,6262012 Raw Gap with 2010: D 35,466 R negative 6,789
Democratic 2004-2012: up 10,728Republican 2004-2012: down 10,415Margins:2004 – Kerry by 54,3732012 – Obama by 75,516 D + 21,143
Registration 2004-2012: up 12,098Voting 2004-2012: down 812Registered nonvoters 2004: 81,2302012 registered nonvoters: 94,140 x .55 = 51,7772004-12 registered nonvoters: up 12,910 x .55 = 7,100
148

Republican Little Texas (14 counties)
Harding 260 -- 259 + 1 327-- 380 min. 53
Union 472 – 411 + 61 1,236 – 1,454 min. 218
Quay 1,383 – 1,422 min. 39 2,202 – 2,661 min. 459
Curry 4,022 -- 3,541 + 481 9,251-- 10,649 min. 1,398
Roosevelt 1,727 – 2,082 min. 355 4,043 -- 4,997 min. 954
DeBaca 287 – 281 + 6 586 -- 706 min. 120
Chaves (Roswell) 6,604 – 6,726 min. 122 13,088 -- 14,773 min. 1,645
Eddy 6,142 – 6,880 min. 738 12,583 -- 13,268 min. 685
Lea (Hobbs) 4,080 – 3,646 + 434 12,548 -- 14,430 min. 1,882
Lincoln 2,942 – 2,822 + 120 5,961 -- 6,070 min. 109
Catron 560 -- 551 + 9 1,494 -- 1,427 + 67
149

San Juan (Farmington) 15,855 – 14,843 + 1,012 28,849 – 29,525 min. 676
Otero (Alamagordo) 6,829 – 6,433 + 396 12,451 -- 14,066 min. 1,615
Sierra 1,964 -- 1,926 + 38 2,928 -- 3,162 min. 234
TOTALS: D 53,127 – 51,823 + 1,304 R 107,547 -- 117,568 min. 10,021 2010 Denish-Martinez: D 37,888 R 91,307 Margin: Martinez 53,4192010 Gap with 2004: D 13,935 R 26,2612010 Gap With 2012: D 15,239 R 16,240Democratic 2004-2012: up 1,304Republican 2004-2012: down 10,021Margins:2004: Bush by 65,7452012: Romney by 54,420 down 11,325
Registration 2004-2012: up 16,199Voting 2004-2012: down 7,601Registered nonvoters 2004: 79,004Registered nonvoters 2012: 102,804 x .55 = 56,542Registered nonvoters 2004-12: + 23,800 x .55 = 13,090
Metro Albuquerque 4 counties
Bernalillo 150,739 – 132,252 + 18,487 106,408 -- 121,454 min. 15,046
Sandoval 27,236 – 21,421 + 5,815 24,387 --22,628 + 1,759
150

Torrance 2,428 – 2,386 + 42 3,529 -- 4,026 min. 497
Valencia 13,511 – 11,270 + 2,241 12,825 --14,474 min. 1,649
TOTALS: D 193,914 – 167,329 + 26,585 R 147,149 -- 162,582 min. 15,4332010 Denish-Martinez: D 128,449 R 143,947Margin: Martinez 15,4982010 Gap with 2004: D 38,880 R 18,6352010 Gap with 2012: D 65,465 R 3,202
Democratic 2004-2012: up 26,585Republican 2004-2012: down 15,433Margins:2004: Kerry by 4,7472012: Obama by 46,765 up 42,018
Registration 2004-2012: up 101,620Voting 2004-2012: up 19,130Registered nonvoters 2004: 126,038Registered nonvoters 2012: 208,168 x .55 = 114,492Registered nonvoters 2004-12: up 82,130 x .55 = 45,171
Swing Votes 6 counties
Dona Ana (Las Cruces) 37,139 – 31,762 + 5,377 27,322 -- 29,548 min. 2,226
Los Alamos 5,191 – 5,206 min. 15 4,796 -- 5,810 min. 1,014
151

Socorro 4,058 – 4,025 + 33 2,722 -- 3,696 min. 974
Colfax 2,828 – 2,824 + 4 2,699 -- 3,082 min. 383
Hidalgo 995 – 861 + 134 899 -- 1,081 min. 182
Luna 3,583 – 3,340 + 243 3,670 -- 4,164 min. 494
TOTALS: D 53,794 – 48,018 + 5,776 R 42,108 -- 47,381 min. 5,2732010 Denish-Martinez: D 35,243 -- R40,192 Margin: Martinez 4,9492010 Gap with 2004: D 12,775 R 7,1892010 Gap with 2012: D 18,551 R 1,916
Democratic 2004-2012: up 5,776Republican 2004-2012: down 5,273Margins:2004: Kerry by 6372012: Obama by 11,686 up 11,049
Registration 2004-2012: up 19,638Voting 2004-2012: up 704Registered nonvoters 2004: 43,999Registered nonvoters 2012: 62,933 x .55 = 34,613Registered nonvoters 2004-12: up 18,934 x .55 = 10,413
152

Chart XXII: New Mexico Partisan Dem. Voter Registration By Counties, 2012 - 2004
State: 2012: 596,089 2004: 550,519 + 45,570 Democratic 2012 Democratic 2014 Change
Democratic New Mexico (9 counties)
Santa Fe 61,730 58,194 + 3,536
Taos 17,046 15,523 + 1,523
Rio Arriba 20,160 19,882 + 278
McKinley (Gallup) 24,403 22,702 + 1,701
Mora 3,096 3,451 min. 355
153

Cibola (Grants) 9,508 9,567 min. 59
Grant (Silver City) 11,891 12,757 min. 866
San Miguel (Las Vegas) 16,037 15,494 + 543
Guadalupe 2,836 3,130 min. 294
TOTALS: 166,707 160,700 + 7,581, min. 1,574, net + 6,007
Republican Little Texas (14 counties)
Harding 340 384 min. 44
Union 1,277 1,393 min. 116
Quay 3,018 3,817 min. 799
Curry 7,467 8,509 min. 1,042
Roosevelt 3,393 4,682 min. 1,289
DeBaca 781 987 min. 206
Chaves (Roswell) 11,051 13,007 min. 1,956
154

Eddy 13,438 15,261 min. 1,823
Lea (Hobbs) 9,236 11,614 min. 2,378
Lincoln 3,616 3,982 min. 366
Catron 908 977 min. 69
San Juan (Farmington) 24,176 24,079 + 97
Otero (Alamagordo) 10,693 11,198 min. 505
Sierra 3,005 3,090 min. 85
TOTALS: 92,399 -- 102,980 + 97, min. 10,678, net min. 10,581
Metro Albuquerque 4 counties
Bernalillo 198,286 -- 162,309 + 35,977
Sandoval 38,052 -- 29,227 + 8,825
Torrance 3,829 -- 4,166 min.337
155
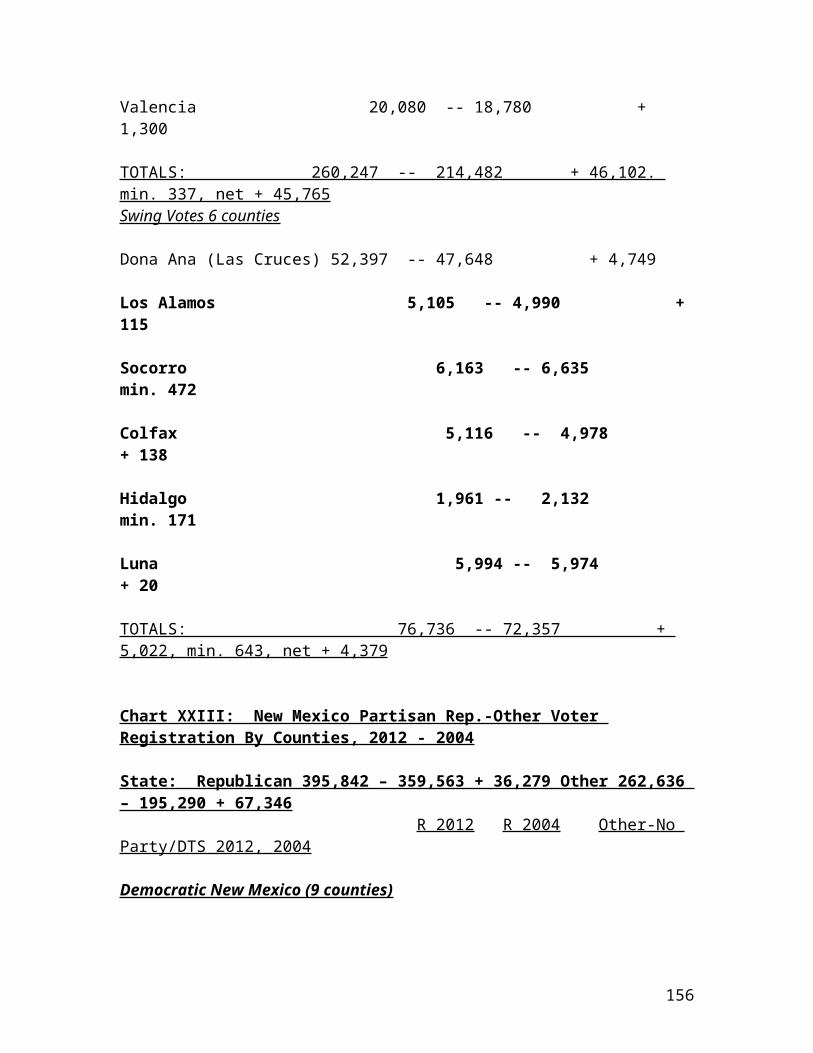
Valencia 20,080 -- 18,780 + 1,300
TOTALS: 260,247 -- 214,482 + 46,102. min. 337, net + 45,765Swing Votes 6 counties
Dona Ana (Las Cruces) 52,397 -- 47,648 + 4,749
Los Alamos 5,105 -- 4,990 + 115
Socorro 6,163 -- 6,635 min. 472
Colfax 5,116 -- 4,978 + 138
Hidalgo 1,961 -- 2,132 min. 171
Luna 5,994 -- 5,974 + 20
TOTALS: 76,736 -- 72,357 + 5,022, min. 643, net + 4,379
Chart XXIII: New Mexico Partisan Rep.-Other Voter Registration By Counties, 2012 - 2004
State: Republican 395,842 – 359,563 + 36,279 Other 262,636 – 195,290 + 67,346 R 2012 R 2004 Other-No Party/DTS 2012, 2004
Democratic New Mexico (9 counties)
156

Santa Fe 16,452 – 17,407 21,292 – 19,033 R min. 955, Other + 2,259
Taos 3,289 – 3,489 4,482 – 4,068 R min. 200, Other + 414
Rio Arriba 2,805 – 2,875 2,867 – 2,082 R min. 70, Other + 785
McKinley (Gallup) 6,279 – 6,048 7,642 – 6,184 R +231, Other + 1,458
Mora 730 – 742 224 -- 220 R min. 12, Other + 4
Cibola (Grants) 2,934 – 3,035 2,302 – 1,667 R min. 101, Other + 635
Grant (Silver City) 5,139 – 5,001 3,860 -- 3,342 R+ 138, Other + 318
San Miguel (Las Vegas) 3,055 – 2,873 3,451 – 2,714 R + 182, Other + 737
Guadalupe 478 – 464 181 – 126 R + 14, Other + 55
TOTALS: 41,161 – 41,934 46,301 – 39,436 R + 565, R min. 1,338, R net minus 773, Other + 6,665
Republican Little Texas (14 counties)
Harding 379 – 366 42 – 35 R + 13, Other + 7
157

Union 1,095 – 972 264 – 158 R + 123, Other +104
Quay 1,975 – 1,838 991 – 543 R + 137, Other + 448
Curry 10,693 – 10,167 4,458 – 2,878 R + 526, Other + 1,580
Roosevelt 4,971 – 4,508 1,930 – 1,881 R + 463, Other + 49
DeBaca 501 – 381 117 – 94 R + 120, Other + 23
Chaves (Roswell) 15,935 -- 15,364 6,366 – 5,149 R + 571, Other + 1,217
Eddy 12,259 – 9,702 5,242 – 2,963 R + 2,557, Other + 2,279
Lea (Hobbs) 15,058 – 13,209 5,765 – 4,510 R + 1,849, Other + 1,255
Lincoln 7,780 -- 7,850 2,810 – 2,268 R min. 70, Other + 542
Catron 1,716 – 1,495 494 – 294 R + 221, Other + 200
San Juan (Farmington) 32,467 – 28,461 15,630 – 10,800 R + 4,006, Other + 4,830
Otero (Alamagordo) 15,439 – 14,565 7,320 – 5,289 R+ 874, Other + 2,031
Sierra 3,427 – 3,113 1,564 – 1,055 R + 314, Other + 509
158

TOTALS: R 123,695 – 111,991 Other 52,993 – 37,917 R + 11,774, min. 70, net + 11,704, Other + 15,076 (all counties +)
Metro Albuquerque 4 counties
Bernalillo 134,319 – 122,806 96,807 – 71,421 R + 11,513, Other + 25,386
Sandoval 30,592 -- 22,278 17,573 – 12,446 R + 8,314, Other + 5,127
Torrance 4,353 -- 3,930 1,895 – 1,407 R+ 423, Other + 488
Valencia 14,140 – 12,295 8,722 – 6,323 R +1,845, Other + 2,399
TOTALS: R 183,404 – 161,309 Other 124,997 – 91,597 R + 22,095, Other + 33,400 (all counties +, +)
Swing Votes 6 counties
Dona Ana (Las Cruces) 30,920 – 27,933 28,266 – 18,764 R + 2,987, Other + 9,502
Los Alamos 5,329 – 5,788 3,370 – 2,855 R minus 459, Other + 515
Socorro 3,620 – 3,784 2,271 – 2,026 R minus 164, Other + 245
159

Colfax 2,924 – 2,634 1,367 –937 R + 290, Other + 460
Hidalgo 885 – 665 355 – 171 R + 220, Other + 184
Luna 3,904 – 3,525 2,716 –1,586 R + 379, Other + 1,130
TOTALS: 47,582 – 44,329 38,345 – 26,339 R + 3,876, min. 623, net + 3,253, Other + 12,006 (all counties + +)
Chart XXIV: New Mexico Green Party Registration By Counties, 2004
State: 9,724 Democratic New Mexico (9 counties)
Santa Fe 2,507
Taos 616
Rio Arriba 154
McKinley (Gallup) 156
Mora 13
Cibola (Grants) 46
Grant (Silver City) 282
San Miguel (Las Vegas) 174
Guadalupe 1
TOTALS: 3,948 (40.60 percent)
160

Republican Little Texas (14 counties)
Harding 1
Union 1
Quay 10
Curry 26
Roosevelt 27
DeBaca zero
Chaves (Roswell) 45
Eddy 37
Lea (Hobbs) 15
Lincoln 35
Catron 5
San Juan (Farmington) 112
Otero (Alamagordo) 65
Sierra 39
TOTALS: 418 (4.29 per cent)
Metro Albuquerque 4 counties
161

Bernalillo 4,045
Sandoval 429
Torrance 86
Valencia 225
TOTALS: 4,785 (49.20 percent)
Swing Votes 6 counties
Dona Ana (Las Cruces) 303
Los Alamos 88
Socorro 100
Colfax 33
Hidalgo 3
Luna 45
TOTALS: 572 (5.88 percent)
Chart XXV: New Mexico Gary Johnson Libertarian Pres. Vote By Counties, 2012
State: 27,787 Democratic New Mexico (9 counties)
Santa Fe 2,277
Taos 479
162
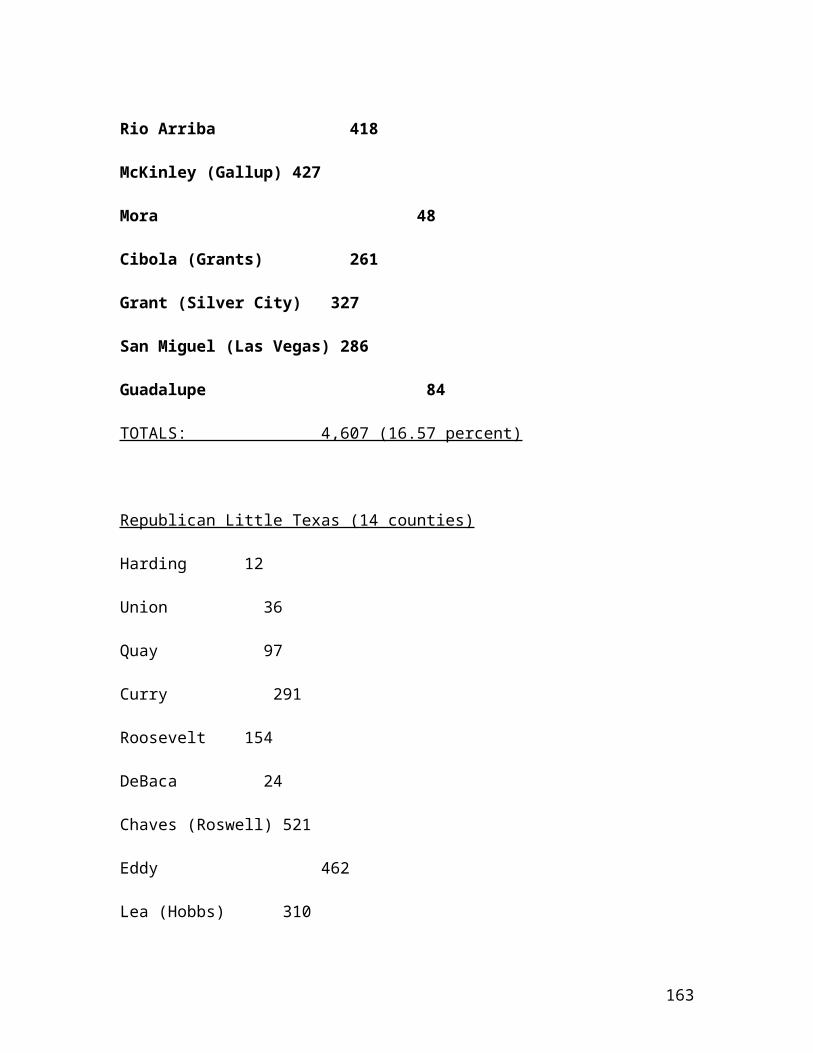
Rio Arriba 418
McKinley (Gallup) 427
Mora 48
Cibola (Grants) 261
Grant (Silver City) 327
San Miguel (Las Vegas) 286
Guadalupe 84
TOTALS: 4,607 (16.57 percent)
Republican Little Texas (14 counties)
Harding 12
Union 36
Quay 97
Curry 291
Roosevelt 154
DeBaca 24
Chaves (Roswell) 521
Eddy 462
Lea (Hobbs) 310
163
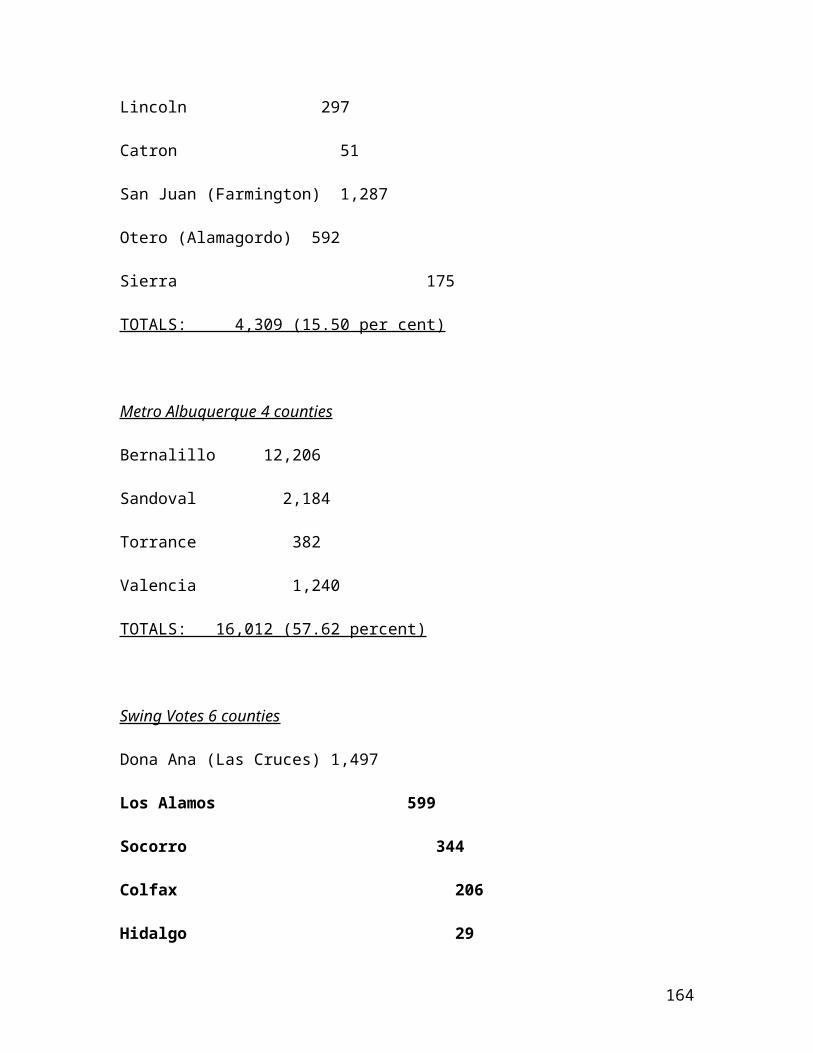
Lincoln 297
Catron 51
San Juan (Farmington) 1,287
Otero (Alamagordo) 592
Sierra 175
TOTALS: 4,309 (15.50 per cent)
Metro Albuquerque 4 counties
Bernalillo 12,206
Sandoval 2,184
Torrance 382
Valencia 1,240
TOTALS: 16,012 (57.62 percent)
Swing Votes 6 counties
Dona Ana (Las Cruces) 1,497
Los Alamos 599
Socorro 344
Colfax 206
Hidalgo 29
164

Luna 184
TOTALS: 2,859 (10.28 percent)
165

Chart XXVI: New Mexico Partisan Voting Type Dem. Numbers ByCounties, 2012 - 2004
In accordance with 1-12-70 NMSA 1978 and 1.10.33 NMAC, precincts with fewer than five voters are reported as a single total in the affected county summary pages. OBAMA KERRY
Mail Early E Day Mail Early E Day
Democratic New Mexico (9 counties)
Santa Fe 4,403 27,463 19,006 15,152 16,038 15,884
Taos 761 6,126 5,091 1,448 5,202 4,337
Rio Arriba 573 3,698 7,194 1,097 2,015 6,641
McKinley (Gallup) 336 3,985 11,520 889 1,630 10,532
Mora 224 645 1,086 250 491 1,135
Cibola (Grants) 298 1,513 3,150 453 795 2,662
Grant (Silver City) 1,795 2,500 2,795 906 3,002 3,187
166

San Miguel (Las Vegas) 702 3,407 4,741 1,189 3,234 4,260
Guadalupe 395 348 745 373 228 739
TOTALS: Obama 9,487 49,685 55,328 Kerry 21,757 32,635 49,377 = 103,769 (minus 3 from New Mexico SOS and David Leip county all-vote totals)(2012 Obama numbers identical)
2012 Obama: Pre Election Day 59,172 E Day 55,328 2004 Kerry: Pre-Election Day 54,392, Election Day 49,377 2004-12: Pre Election Day + 4,780, E Day + 5,951
Republican Little Texas (14 counties)
Harding 93 55 112 107 48 104
Union 43 167 262 57 126 228
Quay 124 617 642 190 517 715
Curry 276 1,424 2,322 529 1,072 1,940
Roosevelt 514 250 963 176 680 1,226
DeBaca 29 75 183 43 41 187
Chaves (Roswell) 449 2,951 3,204 * * 6,726
167

Eddy 391 2,101 3,650 934 2,293 3,653
Lea (Hobbs) 269 1,474 2,337 509 920 2,217
Lincoln 445 1,359 1,138 521 950 1,351
Catron 122 131 307 154 121 276
San Juan (Farmington) 808 6,270 8,777 1,599 5,800 7,444
Otero (Alamagordo) 522 3,228 3,069 818 2,535 3,080
Sierra 162 983 819 330 849 747
TOTALS: Obama 4,247 21,085 27,785 Kerry 5,967 15,952 29,894(53,113: minus 10 from SOS/Leip county numbers) (51,813: minus 10 from SOS/Leip county numbers)
* = Chaves County and Colfax County (“Swing Votes 6”) both reported total votes for absentee, early voting, and “regular precincts”, but unlike the other 31 New Mexico counties in 2004, did not break the partisan vote down by all three ballot categories. Thus, all 2004 Chaves County and Colfax County votes are arbitrarily assigned to the “Election Day” category, even though the total vote in 2004 Chaves County was mail 9,981; early voting 2,570; regular precincts 9,605; and the total vote in 2004 Colfax County was mail 1,051, early voting 1,151, regular precincts 4,057.As can be seen, in 2012 Chaves County and Colfax County,
168

like all other counties, broke down the candidate vote into the three categories.
2012 Pre Election Day 23,512, E Day 27,7852004 Pre Election Day 21,919, E Day 29,8942004-2012: Pre Election Day + 1,593, E Day minus 2,109
Metro Albuquerque 4 counties
Bernalillo 18,645 84,742 47,35232,347 41,394 58,511
Sandoval 3,508 14,603 9,1255,620 4,051 11,750
Torrance 298 516 1,614 549 337 1,500
Valencia 2,541 4,491 6,479 1,919 2,866 6,485
TOTALS: Obama 24,992 104,352 64,570 40,435 48,648 78,246 (193,914: same as SOS/Leip county all-vote numbers) (167,329: same as SOS/Leip county all-vote numbers)
2012: Pre Election Day 129,344 Election Day 64,5702004: Pre Election Day 89,083 Election Day 78,246 2004-12: Plus 40,261 Minus 13,676
Swing Votes 6 counties
Dona Ana (Las Cruces) 1,794 17,041 18,304 4,994 9,865 16,903
Los Alamos 1,523 2,259 1,409 2,331 906 1,969
169

Socorro 448 1,523 2,087 856 1,202 1,967
Colfax 387 712 1,729 * * 2,824
Hidalgo 195 244 556 155 148 558
Luna 246 1,583 1,754 430 1,374 1,536
TOTALS: Obama 4,593 23,362 25,839 8,766 13,495 25,757 (53,794: same as SOS/Leip county all-vote numbers)(48,018: same as SOS/Leip county all-vote numbers)
2012: Pre Election Day 27,955 Election Day 25,8392004: Pre Election Day 22,261 Election Day 25,7572004-12: Up 5,694 Up 82
Kerry statewide number 370,929 = 13 below actual 370,942 – masked by statute
Obama statewide number 415,325 = same as actual statewide number
Chart XXVII: New Mexico Partisan Voting Type Dem. Numbers By Counties, 2012 - 2004
In accordance with 1-12-70 NMSA 1978 and 1.10.33 NMAC, precincts with fewer than five voters are reported as a single total in the affected county summary pages. OBAMA KERRY
170

Mail Early E Day Mail Early E Day
Democratic New Mexico (9 counties)
Santa Fe 4,403 27,463 19,006 15,152 16,038 15,884
Taos 761 6,126 5,091 1,448 5,202 4,337
Rio Arriba 573 3,698 7,194 1,097 2,015 6,641
McKinley (Gallup) 336 3,985 11,520 889 1,630 10,532
Mora 224 645 1,086 250 491 1,135
Cibola (Grants) 298 1,513 3,150 453 795 2,662
Grant (Silver City) 1,795 2,500 2,795 906 3,002 3,187
San Miguel (Las Vegas) 702 3,407 4,741 1,189 3,234 4,260
Guadalupe 395 348 745 373 228 739
TOTALS: Obama 9,487 49,685 55,328 Kerry 21,757 32,635 49,377 = 103,769 (minus 3 from New Mexico SOS and David Leip county all-vote totals)(2012 Obama numbers identical)
2012 Obama: Pre Election Day 59,172 E Day 55,328 2004 Kerry: Pre-Election Day 54,392, Election Day 49,377
171

2004-12: Pre Election Day + 4,780, E Day + 5,951
Republican Little Texas (14 counties)
Harding 93 55 112 107 48 104
Union 43 167 262 57 126 228
Quay 124 617 642 190 517 715
Curry 276 1,424 2,322 529 1,072 1,940
Roosevelt 514 250 963 176 680 1,226
DeBaca 29 75 183 43 41 187
Chaves (Roswell) 449 2,951 3,204 * * 6,726
Eddy 391 2,101 3,650 934 2,293 3,653
Lea (Hobbs) 269 1,474 2,337 509 920 2,217
Lincoln 445 1,359 1,138 521 950 1,351
Catron 122 131 307 154 121 276
172

San Juan (Farmington) 808 6,270 8,777 1,599 5,800 7,444
Otero (Alamagordo) 522 3,228 3,069 818 2,535 3,080
Sierra 162 983 819 330 849 747
TOTALS: Obama 4,247 21,085 27,785 Kerry 5,967 15,952 29,894(53,113: minus 10 from SOS/Leip county numbers) (51,813: minus 10 from SOS/Leip county numbers)
* = Chaves County and Colfax County (“Swing Votes 6”) both reported total votes for absentee, early voting, and “regular precincts”, but unlike the other 31 New Mexico counties in 2004, did not break the partisan vote down by all three ballot categories. Thus, all 2004 Chaves County and Colfax County votes are arbitrarily assigned to the “Election Day” category, even though the total vote in 2004 Chaves County was mail 9,981; early voting 2,570; regular precincts 9,605; and the total vote in 2004 Colfax County was mail 1,051, early voting 1,151, regular precincts 4,057.As can be seen, in 2012 Chaves County and Colfax County, like all other counties, broke down the candidate vote into the three categories.
2012 Pre Election Day 23,512, E Day 27,7852004 Pre Election Day 21,919, E Day 29,8942004-2012: Pre Election Day + 1,593, E Day minus 2,109
Metro Albuquerque 4 counties
Bernalillo 18,645 84,742 47,35232,347 41,394 58,511
Sandoval 3,508 14,603 9,1255,620 4,051 11,750
173
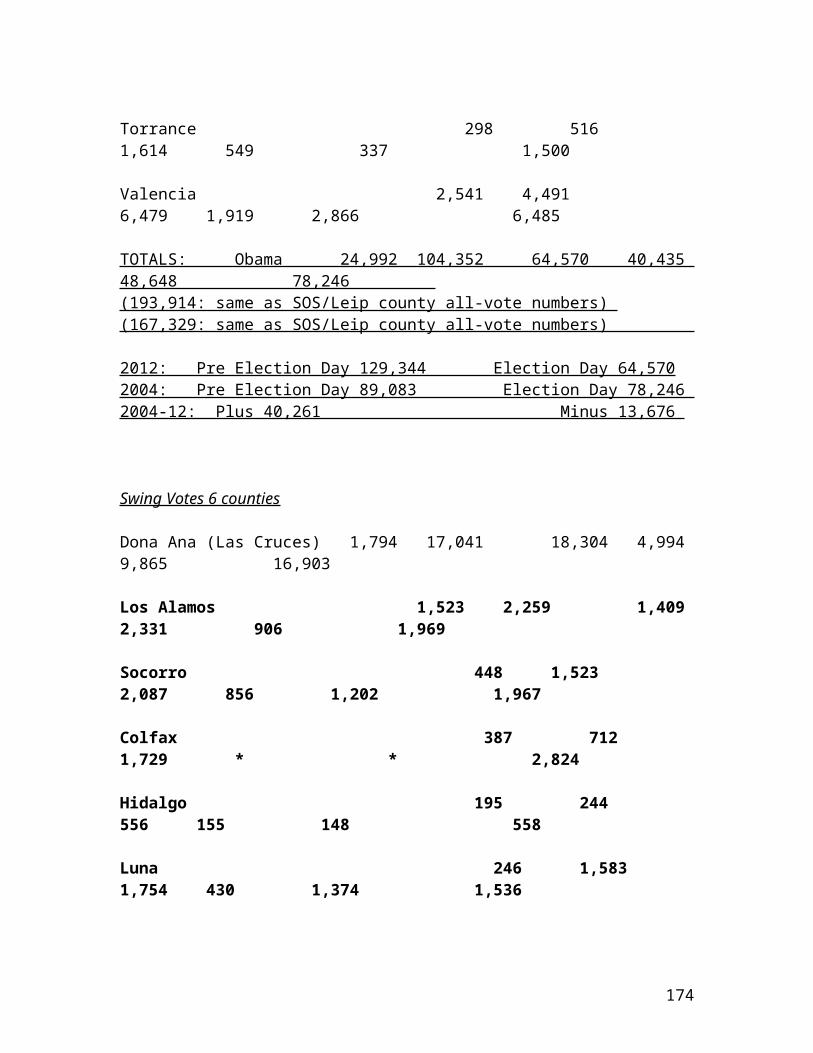
Torrance 298 516 1,614 549 337 1,500
Valencia 2,541 4,491 6,479 1,919 2,866 6,485
TOTALS: Obama 24,992 104,352 64,570 40,435 48,648 78,246 (193,914: same as SOS/Leip county all-vote numbers) (167,329: same as SOS/Leip county all-vote numbers)
2012: Pre Election Day 129,344 Election Day 64,5702004: Pre Election Day 89,083 Election Day 78,246 2004-12: Plus 40,261 Minus 13,676
Swing Votes 6 counties
Dona Ana (Las Cruces) 1,794 17,041 18,304 4,994 9,865 16,903
Los Alamos 1,523 2,259 1,409 2,331 906 1,969
Socorro 448 1,523 2,087 856 1,202 1,967
Colfax 387 712 1,729 * * 2,824
Hidalgo 195 244 556 155 148 558
Luna 246 1,583 1,754 430 1,374 1,536
174

TOTALS: Obama 4,593 23,362 25,839 8,766 13,495 25,757 (53,794: same as SOS/Leip county all-vote numbers)(48,018: same as SOS/Leip county all-vote numbers)
2012: Pre Election Day 27,955 Election Day 25,8392004: Pre Election Day 22,261 Election Day 25,7572004-12: Up 5,694 Up 82
Kerry statewide number 370,929 = 13 below actual 370,942 – masked by statute
Obama statewide number 415,325 = same as actual statewide number
Chart XXVIII: New Mexico Partisan Voting Type Rep. Numbers By Counties, 2012 - 2004
In accordance with 1-12-70 NMSA 1978 and 1.10.33 NMAC, precincts with fewer than five voters arereported as a single total in the affected county summary pages.
ROMNEY BUSHMail Early E Day
Mail Early E Day
Democratic New Mexico (9 counties)
175

Santa Fe 1,554 7,367 6,501 4,199 6,445 7,822
Taos 208 1,199 1,235 549 1,179 1,938
Rio Arriba 195 950 1,959 534 985 3,630
McKinley (Gallup) 257 1,625 2,281 646 1,496 5,209
Mora 55 228 312 127 252 549
Cibola (Grants) 162 1,093 1,531 395 1,027 2,039
Grant (Silver City) 1,381 1,700 2,235 820 2,339 2,976
San Miguel (Las Vegas) 235 724 1,267 454 1,071 1,788
Guadalupe 121 182 254 222 159 533
TOTALS: 4,168 15,068 17,575 7,946 14,953 26,484(36,811: minus 2,173 from SOS/Leip all-vote county numbers)(49,383: minus 16 from SOS/Leip all-vote county numbers)
2012 Pre Election Day 19,236, Election Day 17,5752004 Pre Election Day 22,899, Election Day 26,4842004-12: down 3,663, down 8,909
176

Republican Little Texas (14 counties)
Harding 124 78 125 126 109 145
Union 150 445 641 225 367 862
Quay 190 895 1,117 358 891 1,412
Curry 771 4,109 4,335 1,878 4,166 4,605
Roosevelt 1,515 595 1,930 547 1,838 2,612
DeBaca 60 164 362 127 127 452
Chaves (Roswell) 1,198 6,013 5,037 * * 14,773
Eddy 919 5,347 6,248 1,596 5,670 6,002
Lea (Hobbs) 1,030 5,495 5,961 2,502 4,189 7,739
Lincoln 824 2,944 2,193 1,011 2,320 2,739
Catron 300 328 829 310 291 826
San Juan (Farmington) 2,422 15,233 10,668 3,932 13,407 12,186
177

Otero (Alamagordo) 1,104 6,545 4,640 1,551 6,988 5,527
Sierra 250 1,445 1,233 574 1,252 1,336
TOTALS: 10,857 49,636 45,319 14,737 41,615 58,477(105,812 – 1,735 below the 107,547 SOS/Leip all-vote county totals)(114,829: 2,739 below the 117,568 SOS/Leip all-vote county totals)
2012 Pre Election Day: 60,493 E Day 45,319 2004 Pre Election Day: 56,352, E Day 58,4772004-12: Up 4,141, Down 13,158
Metro Albuquerque 4 counties
Bernalillo 17,572 – 57,830 – 30,919 27,481– 39,137 -- 54,836
Sandoval 3,461 -- 14,024 – 6,780 5,204 – 4,933 -- 12,491
Torrance 524 -- 826 -- 2,179 986 -- 660 -- 2,380
Valencia 2,568 -- 4,291 – 5,966 2,500 – 3,674 -- 8,300
TOTALS: 24,125 – 76,971 – 45,844 36,171 – 48,404 – 78,007(146,940 – 209 below SOS/Leip county all-vote numbers)(162,582: same as SOS/Leip county all-vote numbers) 2012: Pre Election Day 101,096, Election Day 45,844
178

2004: Pre Election Day 84,575, Election Day 78,0072004-12: Up 16,521, down 32,163
Swing Votes 6 counties
Dona Ana (Las Cruces) 1,702 – 13,315 – 11,871 2,951 -- 9,729 -- 16,868
Los Alamos 1,000 – 2,022 – 1,774 2,507 -- 827 -- 2,476
Socorro 253 -- 941 -- 1,370 632 – 1,043 -- 2,021
Colfax 381 -- 663 -- 1,655* -- * -- 3,082
Hidalgo 113 -- 189 -- 597 172 – 180 -- 729
Luna 370 – 1,980 – 1,320 694 – 1,780 -- 1,690
TOTALS: 3,819 – 19,110 – 18,587 6,956 – 13,559 – 26,866(41,516 – 592 below SOS/Leip all-vote county numbers)(47,381: same as SOS/Leip all-county vote numbers)
Bush statewide totals 374,175 – minus 2,755 from 376,930 (all in precincts of 20 or fewer voters whose results are masked by statute)
Romney statewide totals 331,079 = actual 335,788 minus 4,709(all in precincts of 20 or fewer masked by statute)
2012: Pre Election Day 22,929, E Day 18,587
179

2004: Pre Election Day 20,515, E Day 26,8662004-12: Up 2,414 Down 8,279
Chart XXVII: New Mexico Partisan Voting Type Rep. Numbers By Counties, 2012 - 2004
In accordance with 1-12-70 NMSA 1978 and 1.10.33 NMAC, precincts with fewer than five voters arereported as a single total in the affected county summary pages.
ROMNEY BUSHMail Early E Day
Mail Early E Day
Democratic New Mexico (9 counties)
Santa Fe 1,554 7,367 6,501 4,199 6,445 7,822
Taos 208 1,199 1,235 549 1,179 1,938
Rio Arriba 195 950 1,959 534 985 3,630
McKinley (Gallup) 257 1,625 2,281 646 1,496 5,209
Mora 55 228 312 127 252 549
Cibola (Grants) 162 1,093 1,531 395 1,027 2,039
180

Grant (Silver City) 1,381 1,700 2,235 820 2,339 2,976
San Miguel (Las Vegas) 235 724 1,267 454 1,071 1,788
Guadalupe 121 182 254 222 159 533
TOTALS: 4,168 15,068 17,575 7,946 14,953 26,484(36,811: minus 2,173 from SOS/Leip all-vote county numbers)(49,383: minus 16 from SOS/Leip all-vote county numbers)
2012 Pre Election Day 19,236, Election Day 17,5752004 Pre Election Day 22,899, Election Day 26,4842004-12: down 3,663, down 8,909
Republican Little Texas (14 counties)
Harding 124 78 125 126 109 145
Union 150 445 641 225 367 862
Quay 190 895 1,117 358 891 1,412
Curry 771 4,109 4,335 1,878 4,166 4,605
Roosevelt 1,515 595 1,930 547 1,838 2,612
DeBaca 60 164 362 127 127 452
181

Chaves (Roswell) 1,198 6,013 5,037 * * 14,773
Eddy 919 5,347 6,248 1,596 5,670 6,002
Lea (Hobbs) 1,030 5,495 5,961 2,502 4,189 7,739
Lincoln 824 2,944 2,193 1,011 2,320 2,739
Catron 300 328 829 310 291 826
San Juan (Farmington) 2,422 15,233 10,668 3,932 13,407 12,186
Otero (Alamagordo) 1,104 6,545 4,640 1,551 6,988 5,527
Sierra 250 1,445 1,233 574 1,252 1,336
TOTALS: 10,857 49,636 45,319 14,737 41,615 58,477(105,812 – 1,735 below the 107,547 SOS/Leip all-vote county totals)(114,829: 2,739 below the 117,568 SOS/Leip all-vote county totals)
2012 Pre Election Day: 60,493 E Day 45,319 2004 Pre Election Day: 56,352, E Day 58,4772004-12: Up 4,141, Down 13,158
182

Metro Albuquerque 4 counties
Bernalillo 17,572 – 57,830 – 30,919 27,481– 39,137 -- 54,836
Sandoval 3,461 -- 14,024 – 6,780 5,204 – 4,933 -- 12,491
Torrance 524 -- 826 -- 2,179 986 -- 660 -- 2,380
Valencia 2,568 -- 4,291 – 5,966 2,500 – 3,674 -- 8,300
TOTALS: 24,125 – 76,971 – 45,844 36,171 – 48,404 – 78,007(146,940 – 209 below SOS/Leip county all-vote numbers)(162,582: same as SOS/Leip county all-vote numbers) 2012: Pre Election Day 101,096, Election Day 45,8442004: Pre Election Day 84,575, Election Day 78,0072004-12: Up 16,521, down 32,163
Swing Votes 6 counties
Dona Ana (Las Cruces) 1,702 – 13,315 – 11,871 2,951 -- 9,729 -- 16,868
Los Alamos 1,000 – 2,022 – 1,774 2,507 -- 827 -- 2,476
Socorro 253 -- 941 -- 1,370 632 – 1,043 -- 2,021
Colfax 381 -- 663 -- 1,655* -- * -- 3,082
183

Hidalgo 113 -- 189 -- 597 172 – 180 -- 729
Luna 370 – 1,980 – 1,320 694 – 1,780 -- 1,690
TOTALS: 3,819 – 19,110 – 18,587 6,956 – 13,559 – 26,866(41,516 – 592 below SOS/Leip all-vote county numbers)(47,381: same as SOS/Leip all-county vote numbers)
Bush statewide totals 374,175 – minus 2,755 from 376,930 (all in precincts of 20 or fewer voters whose results are masked by statute)
Romney statewide totals 331,079 = actual 335,788 minus 4,709(all in precincts of 20 or fewer masked by statute)
2012: Pre Election Day 22,929, E Day 18,5872004: Pre Election Day 20,515, E Day 26,8662004-12: Up 2,414 Down 8,279
184