the motives and challenges facing south african vegans and ...
253
THE MOTIVES AND CHALLENGES FACING SOUTH AFRICAN VEGANS AND THE NUTRITIONAL QUALITY OF THEIR DIET By Sansha Kohidh Bachelor of Science in Dietetics, Post Graduate Diploma in Dietetics (UKZN) Dissertation submitted in fulfilment of the requirements for the degree of MASTER OF SCIENCE IN DIETETICS Dietetics and Human Nutrition School of Agricultural, Earth and Environmental Sciences College of Agriculture, Engineering and Science University of KwaZulu-Natal Pietermaritzburg May 2020
-
Upload
khangminh22 -
Category
Documents
-
view
2 -
download
0
Transcript of the motives and challenges facing south african vegans and ...

THE MOTIVES AND CHALLENGES FACING SOUTH AFRICAN
VEGANS AND THE NUTRITIONAL QUALITY OF THEIR DIET
By
Sansha Kohidh
Bachelor of Science in Dietetics, Post Graduate Diploma in Dietetics
(UKZN)
Dissertation submitted in fulfilment of the requirements for the degree of
MASTER OF SCIENCE IN DIETETICS
Dietetics and Human Nutrition
School of Agricultural, Earth and Environmental Sciences
College of Agriculture, Engineering and Science
University of KwaZulu-Natal
Pietermaritzburg
May 2020

ii
ABSTRACT
Introduction: A vegan diet is a voluntarily chosen plant-based diet that excludes all meat and
animal products and includes wholegrains and legumes, fruit and vegetables, nuts and seeds
and healthy fats. There are many different motives that influence an individual to become vegan
including ethical motives, environmental motives and health motives. Internationally, many
studies have been conducted to investigate these motives along with the nutritional intake and
quality of the vegan diet. This diet is also becoming increasingly popular in South Africa, yet
there is a paucity of studies that have been conducted to determine what motivates South
Africans to follow this diet, what challenges they face while following the diet and what the
nutritional quality of their diet is.
Aim: To determine the motives of South African vegans, challenges faced and the nutritional
quality of the South African vegan diet.
Objectives: To determine the demographic characteristics of South African vegans; the
motives that influenced the decision to become a vegan; challenges associated with following
a vegan diet and how these challenges are overcome; and to determine the nutritional quality
of dietary intake compared to recommendations (EARs) consumed and identify the variety of
food groups and types of processed food in the vegan diet.
Methods: A cross-sectional study in the form of an online questionnaire was conducted using
South African vegans who were part of the South African Vegan Society online group on
Facebook. The questionnaire consisted of four sections. Section one obtained information
regarding the demographics of South African vegans. Section two obtained information on the
main motives for following a vegan diet. Section three obtained information on the challenges
experienced while following a vegan diet and how these challenges were overcome. Section
four obtained information on the nutritional quality of the vegan diet which included a vegan-
specific Food Frequency Questionnaire (FFQ) with 291 food items and one 24-hour recall.
Results: The first two sections of the online questionnaire were completed by 205 respondents,
of which 82.4% (n = 169) were female and 17.6% (n = 36) were male. The respondents were
predominately White (82.4%, n = 169), resided in the Gauteng province (43.9%, n = 90), were
more likely to be single (53.2%, n = 109) and belonged to the 18-29 (29.3%, n = 60) and 40-49
age category (22.0%, n = 45). Most of the respondents had followed a vegan diet for one to
less than three years (38.5%, n = 79). A significant number of respondents did not engage in
smoking (83.9%, n = 172) but did consume alcoholic beverages less than once a week (60.0%,

iii
n = 123) (p<0.0005). Most of the respondents participated in varying amounts and intensities
of physical activity (84.9%, n = 174) and made use of nutritional supplements (72.7%, n = 149).
There was a significant agreement that ethical concern for animals (p<0.0005); followed by
protecting the environment (p < 0.0005); and the effect of animal product consumption on
climate change (p < 0.0005) were the main motivating factors for choosing to become a vegan.
Most of the respondents reported that their initial motivation to become a vegan had not
changed (71%, n = 146) and there was a significant agreement that experimenting with food
assisted the respondents during their transition into the vegan diet (p < 0.0005).
Section three of the questionnaire was completed by 197 respondents. Over one third of the
respondents reported that it was “easy” to transition into the diet (35.1%, n = 72) and their initial
emotions were enthusiasm and excitement (29.3%, n = 60). A significant number of
respondents reported that they did not experience any financial challenges following the diet
(74.6%, n = 176) and that their main challenge was finding vegan meal options in a restaurant
(p < 0.0005). The respondents in this study overcame any challenges by conducting research
on the internet and agreed that vegan recipes were easily accessible (p < 0.0005). The
respondents significantly agreed that a vegan diet was nutritionally complete and adequate for
a healthy lifestyle (p < 0.0005).
The FFQ was completed by 113 respondents. Respondents consumed a wide variety of fruit;
most often bananas (22.4%, n = 46) at least once a day, leafy-vegetables- most often cooked
spinach (24.9%, n = 51) at least once a week, non-leafy vegetables- most often cooked broccoli
(36.1%, n = 76) at least once a week. The starches most often consumed were whole-wheat
bread (18.0%, n = 37) once a week, grains and cereals- most often white or brown basmati rice
(20.0%, n = 41) once a month, peas and beans- most often chickpeas (32.2%, n = 66) at least
once a week, fats- most often olive oil (20.5%, n = 42) at least once a day, snacks- most often
potato chips (19.0%, n = 39) at least once a month. Desserts most often consumed were egg-
less cake (17.1%, n = 35) at least once a month, sweeteners- most often brown sugar (17.1%, n
= 35) at least once a day and beverages- coffee decaffeinated or regular (29.3%, n = 60) at least
once a day. The most commonly consumed plant-based milk alternative and meat alternative
was soy milk (21.0%, n = 43) consumed at least once a day and soya products (28.8%, n = 59)
at least once a week respectively.

iv
The 24-hour recall was completed by 134 respondents. The mean total energy of the
respondents was 7471.15 kJ (SD = 3093.39). Males had a mean total energy of 7893.76 kJ (SD
= 3415.37) and females had a mean total energy of 7374.22 kJ (SD = 3023.43).
All respondents met the estimated average requirement (EAR) for protein (56 g for males and
46 g for females), carbohydrates (130 g) and the percentage of total energy for fat (10 - 35%).
The respondents mean intake for protein was 74.73 g (SD = 52.28), carbohydrates 190.40 g
(SD = 190.40) and fat 62.34 g (SD = 62.34), which contributed 18.5%, 47.36% and 33.7%
respectively, of total energy in the diet. Females consumed significantly greater amounts of
added sugar than males (M = 20.51 g) vs (M = 13.18 g). Both gender categories met their EARs
for fibre, iron, vitamin C, vitamin B6, vitamin A, thiamine, riboflavin, folate and vitamin K.
The respondents had a decreased intake of cholesterol, saturated fat and mono-unsaturated fatty
acids and higher intakes of poly-unsaturated fatty acids. Females met their EARs for zinc and
niacin, 9.02 mg and 15.32 mg respectively, while males were below their EAR, consuming 9.8
mg and 15.59 mg respectively. Males met their EAR for vitamin E consuming 20.32 mg, while
females were below their EAR, consuming 13.56 mg of vitamin E. The respondents were
shown to be lacking in calcium, sodium, vitamin D and vitamin B12.
Conclusion: This study revealed that although veganism is widespread in South Africa, White
females living in Gauteng were more likely to be following this lifestyle and be members of the
South African Vegan Society online group on Facebook. Their main motive for following the
diet was preventing cruelty towards animals and protecting the environment and its resources.
This suggests that South African vegans are concerned about animal rights and the environment
and their knowledge about veganism should be further investigated. The main challenge faced
by the respondents was finding vegan options in restaurants. Therefore, restaurants that are
vegan-specific or have vegan options available are recommended to list their restaurants online
and upload their menus to assist vegans, as the internet was commonly used for research among
this group. Major retail supermarkets are recommended to increase their stock and variety of
options of vegan products especially plant-based milk and meat alternatives as these products
are widely consumed. Research has shown that the vegan diet is linked to many potential health
benefits, yet there is concern regarding whether the diet leads to nutrient deficiencies over time.
As veganism is growing in South Africa, this study highlights the need for fortified food
products and nutritional supplements to reduce nutrient deficiencies in the vegan diet.

v
Longitudinal studies will also assist in examining trends and sustainability of a vegan diet in
South Africa as well as determine whether nutrient deficiencies develop over time.


vii
DECLARATION OF ORIGINALITY
I, Sansha Kohidh, hereby declare that:
i. The research reported in this dissertation, except where otherwise indicated, is my original
research.
ii. This dissertation has not been submitted for any degree or examination at any other
university.
iii. This dissertation does not contain other persons’ data, pictures, graphs or other information
unless specifically acknowledged as being sourced from those persons.
iv. The dissertation does not contain other authors’ writing unless specifically acknowledged
as being sourced from other authors. Where other written sources have been quoted, then:
a. Their words have been rewritten but the general information attributed to them has
been referenced;
b. Where their exact words have been used, their writing has been placed inside
quotation marks, and referenced.
c. This dissertation does not contain text, graphics or tables copied and pasted from the
Internet, unless specifically acknowledged, and the source being detailed in the
dissertation and in the Reference section.
Signed: …………………………. Date: 22 September 2020
Sansha Kohidh (candidate)

viii
ACKNOWLEDGEMENTS
I would like to express my extreme gratitude to the following people that have assisted me
throughout the period of this study:
To my supervisor, Dr Nicky Wiles. Your immense knowledge, patience and encouragement
has greatly assisted me in completing this study. Thank you for your professional guidance and
being a dedicated mentor. Your prompt responses to my countless emails and flexibility in
scheduling our meetings has made this journey much easier.
To my statistician Dr Gill Hendry. Your statistical expertise and advice were a huge
contribution towards this study. Thank you for your time, patience and for broadening my
knowledge on statistics.
Thank you to the Halley Stott Foundation for funding the statistical analyses for this project.
Thank you to Dylan Barsby and Anna Jordan from the South African Vegan Society for
providing me the platform for my data collection.
I would like to thank my loving parents for always believing in me and supporting me along
the way. Thank you for understanding during the stressful moments and for showing a keen
interest in my work.
To my sister Jashna, who is a fellow registered Dietician, thank you for the countless hours at
campus assisting me with capturing my data and for always being available whenever I needed
your help. I valued your input and enthusiasm towards my study.
And finally I dedicate this Masters to my dearest Nani.

ix
TABLE OF CONTENTS
CONTENTS PAGE
ABSTRACT ............................................................................................................................... ii
PREFACE ................................................................................................................................. vi
DECLARATION OF ORIGINALITY .................................................................................... vii
ACKNOWLEDGEMENTS .................................................................................................... viii
TABLE OF CONTENTS .......................................................................................................... ix
LIST OF TABLES .................................................................................................................. xiii
LIST OF FIGURES .................................................................................................................. xv
APPENDICES ......................................................................................................................... xvi
CHAPTER 1: INTRODUCTION, THE PROBLEM AND ITS SETTING .................. 1-10
1.1 The importance of the study .............................................................................................. 1
1.2 Statement of the problem .................................................................................................. 3
1.3 Research objectives ........................................................................................................... 3
1.4 Hypotheses ........................................................................................................................ 3
1.5 Inclusion and exclusion criteria ......................................................................................... 3
1.6 Definition of terms ............................................................................................................ 4
1.7 Abbreviations .................................................................................................................... 7
1.8 Assumptions ...................................................................................................................... 9
1.9 Summary ........................................................................................................................... 9
1.10 Dissertation overview ...................................................................................................... 10
1.11 Referencing style ............................................................................................................. 10

x
CHAPTER 2: REVIEW OF THE RELATED LITERATURE................................. 11-64
2.1 Overview ........................................................................................................................ 11
2.2 Introduction and background to plant-based diets ......................................................... 11
2.2.1 History of veganism and the vegan diet ......................................................................... 14
2.2.2 Veganism as a social movement .................................................................................... 14
2.3 Motives for following a vegan diet ................................................................................ 15
2.3.1 Ethical motives ............................................................................................................... 17
2.3.2 Health motives ................................................................................................................ 20
2.3.3 Environmental motives .................................................................................................. 22
2.4 Challenges faced by vegans in society ........................................................................... 24
2.5 Definition of a vegan diet and its nutritional components ............................................. 28
2.5.1 Vegetarian food guide pyramid ...................................................................................... 29
2.5.2 The vegan plate .............................................................................................................. 30
2.5.3 The VegPlate .................................................................................................................. 33
2.6 Nutritional quality of the vegan diet .............................................................................. 36
2.6.1 Nutrient deficiencies in the vegan diet ........................................................................... 43
2.6.2 Meat substitutes .............................................................................................................. 46
2.6.3 Plant-based milk alternatives ......................................................................................... 53
2.7 Plant-based diets and veganism in South Africa ............................................................ 59
2.8 Conclusion ...................................................................................................................... 62
CHAPTER 3: METHODOLOGY ................................................................................... 65-88
3.1 Study design ................................................................................................................... 65
3.2 Study setting ................................................................................................................... 65
3.3 Type of study .................................................................................................................. 65
3.3.1 Cross sectional study ....................................................................................................... 65
3.3.2 The use of an online questionnaire .................................................................................. 66
3.4 Study population and sample selection ........................................................................... 75
3.4.1 Study population ............................................................................................................. 75
3.4.2 Sample selection .............................................................................................................. 75

xi
3.5 Questionnaire development .............................................................................................. 75
3.5.1 Section A of the questionnaire ........................................................................................ 76
3.5.2 Section B of the questionnaire ........................................................................................ 77
3.5.3 Section C of the questionnaire ........................................................................................ 78
3.5.4 Section D of the questionnaire ........................................................................................ 79
3.6 Pilot study ........................................................................................................................ 82
3.7 Data capturing and analyses ............................................................................................ 83
3.8 Data quality control ......................................................................................................... 85
3.8.1 Validity and reliability .................................................................................................... 85
3.8.2 Content validity ............................................................................................................... 86
3.8.3 Reliability ........................................................................................................................ 87
3.9 Reduction of bias ............................................................................................................. 87
3.10 Ethical considerations ..................................................................................................... 87
3.11 Summary ......................................................................................................................... 88
CHAPTER 4: RESULTS ............................................................................................ 89-128
4.1 The response rate and demographic characteristics of the respondents .......................... 89
4.2 The motives for following a vegan diet .......................................................................... 93
4.3 The challenges associated with following a vegan diet .................................................. 97
4.4 The nutritional quality of a vegan diet .......................................................................... 102
4.4.1 The food and beverage consumption of the respondents from the FFQ ....................... 103
4.4.2 Dietary consumption from the 24-hour recall ............................................................... 119
4.5 Summary ....................................................................................................................... 127
CHAPTER 5: DISCUSSION ................................................................................... 129-152
5.1 The response rate and demographic characteristics of the study population ................ 129
5.2 The motives for following a vegan diet ........................................................................ 132
5.3 The challenges associated with following a vegan diet ................................................ 135
5.4 The nutritional quality of a vegan diet .......................................................................... 137
5.4.1 The food frequency questionnaire ................................................................................. 140
5.4.2 The 24-hour recall ......................................................................................................... 146

xii
5.5 Summary ...................................................................................................................... 151
CHAPTER 6: CONCLUSION AND RECOMMENDATIONS ......................... 153-160
6.1 Introduction .................................................................................................................. 153
6.2 Conclusions of the study .............................................................................................. 153
6.2.1 The demographics of the present study ......................................................................... 153
6.2.2 The motives regarding the vegan diet ........................................................................... 154
6.2.3 The challenges associated with following a vegan diet ................................................ 154
6.2.4 The nutritional quality of the vegan diet ....................................................................... 155
6.3 Study limitations ........................................................................................................... 156
6.4 Recommendations based on the results of the study ..................................................... 157
6.4.1 Recommendations for dietetic practice ......................................................................... 157
6.4.2 Recommendations for consumers, food companies and restaurants ............................. 158
6.5 Recommendations for future research ........................................................................... 159
REFERENCES ..................................................................................................................... 161

xiii
LIST OF TABLES
Table 2.1: Definition of different vegetarian and vegan diets ................................................. 13
Table 2.2: The vegan plate guidelines ..................................................................................... 32
Table 2.3: Serving sizes and calcium content of foods from the VegPlate ............................. 34
Table 2.4: Number of servings using the VegPlate model ...................................................... 36
Table 2.5: Studies assessing the nutritional quality of the vegan diet ..................................... 39
Table 2.6: Vegan sources and nutrients ................................................................................... 45
Table 2.7: Nutritional composition of meat substitutes and meat products ............................ 48
Table 2.8: Biological value of protein ..................................................................................... 49
Table 2.9: Type of plant-based and vegetable-based milk alternatives .................................. 53
Table 2.10: Nutritional composition of cow’s milk and various plant milks .......................... 55
Table 3.1: Advantages and disadvantages of self-administered questionnaires and structured
interviews ............................................................................................................... 66
Table 3.2: Studies used to formulate demographic characteristics of the questionnaire ........ 76
Table 3.3: Studies used to assess the motives for following a vegan diet ............................... 77
Table 3.4: Studies used to assess the challenges associated with following a vegan diet ....... 79
Table 3.5: Studies used to assess 24-hour recalls and food frequency questionnaires ........... 80
Table 3.6: Data analysis of objectives ..................................................................................... 85
Table 4.1: Marital status, age category, level of education and monthly income of the
sample ..................................................................................................................... 90
Table 4.2: Respondent length of following a vegan diet ......................................................... 91
Table 4.3: Reported analyses of physical activity ................................................................... 92
Table 4.4: Duration of participating in physical activity in a day ........................................... 93
Table 4.5: Reported analyses of motives for following a vegan diet ...................................... 93
Table 4.6: The mean motivating factors for following a vegan diet ....................................... 94
Table 4.7: The mean of grouped motivating factors ............................................................... 96
Table 4.8: The mean factors for transition into following a vegan diet .................................. 96
Table 4.9: The mean of grouped transitioning factors ............................................................ 97
Table 4.10: The word used to best describe the transition into following a vegan diet .......... 98

xiv
Table 4.11: The emotions experienced at the beginning of following a vegan diet ................ 98
Table 4.12: Reported analyses of challenges faced during the transition into the vegan
diet ........................................................................................................................ 99
Table 4.13: The mean challenges faced while following a vegan diet .................................. 100
Table 4.14: Reported analyses of how challenges were overcome following a vegan diet .. 100
Table 4.15: The mean factors that assisted in overcoming challenges following a vegan
diet ....................................................................................................................... 101
Table 4.16: Reported analyses of statements about following a vegan diet .......................... 101
Table 4.17: The mean statements about following a vegan diet ........................................... 102
Table 4.18: Reported analyses of statements about nutritional quality of a vegan diet ........ 102
Table 4.19: The mean statements about nutritional quality of a vegan diet .......................... 103
Table 4.20: The frequency and consumption of food items from the FFQ ........................... 107
Table 4.21: The amount of food items consumed from the FFQ .......................................... 113
Table 4.22: Nutritional content of macronutrients from the 24-hour recall .......................... 121
Table 4.23: Nutritional content of minerals from the 24-hour recall .................................... 121
Table 4.24: Nutritional content of vitamins from the 24-hour recall .................................... 122
Table 4.25: Nutritional content of fatty acids and cholesterol from the 24-hour recall ........ 123
Table 4.26: Nutritional content of amino acids from the 24-hour recall ............................... 124
Table 4.27: Nutritional content of other nutrients from the 24-hour recall ........................... 124
Table 4.28: Estimated average requirement (EAR) table for
adults ................................................................................................................. 125
Table 5.1: VegPlate model serving size recommendations compared to the findings from the
24-hour recall and FFQ of the present study ....................................................... 146

xv
LIST OF FIGURES
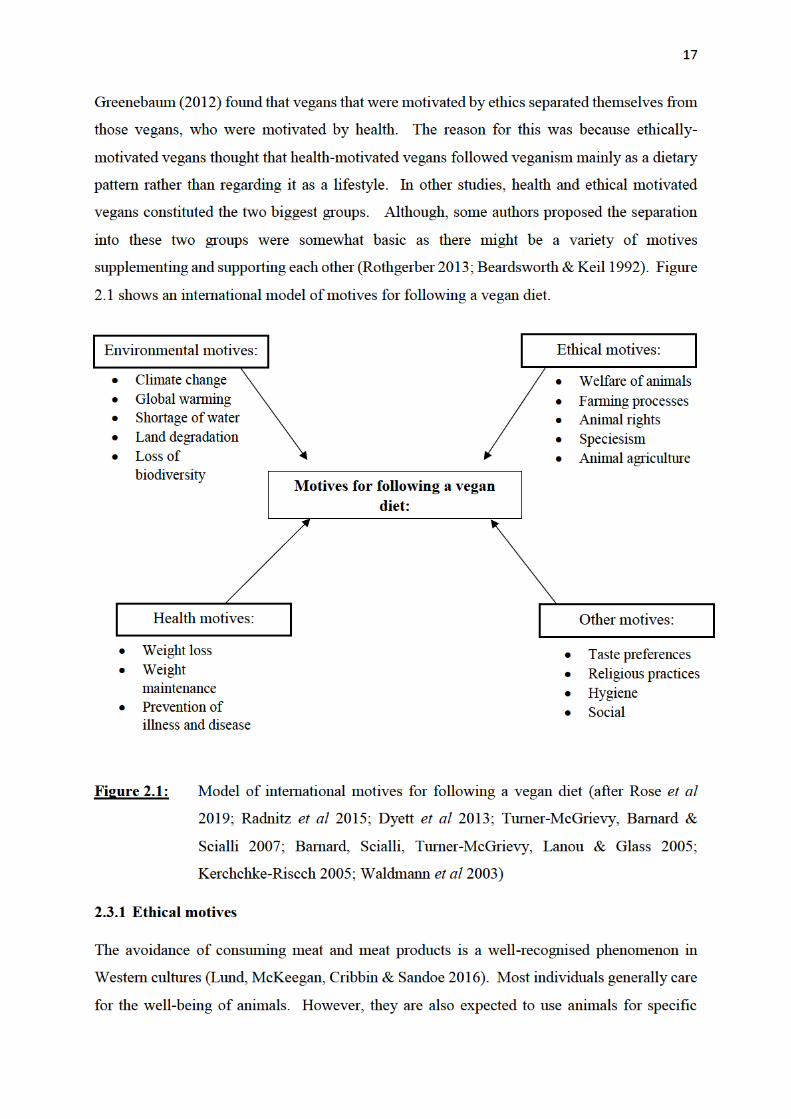
Figure 2.1: Model of international motives of following a vegan diet .................................... 17
Figure 2.2: Illustration of the vegetarian food guide pyramid ................................................ 29
Figure 2.3: Illustration of the vegan plate ............................................................................... 31
Figure 2.4: Illustration of the VegPlate model ........................................................................ 33
Figure 4.1: The EAR compared against mean intake for male and female respondents .... 126
Figure 4.2: The EAR compared against mean intake for male and female respondents ...... 126
Figure 4.3: The EAR compared against mean intake for male and female respondents ...... 127

xvi
LIST OF APPENDICES
Appendix A: Questionnaire.................................................................................................. 199
Appendix B: Household food measurements ....................................................................... 217
Appendix C: Gatekeepers permission ................................................................................. 234
Appendix D: Ethical clearance ............................................................................................. 235
Appendix E: Informed consent ............................................................................................ 236

1
CHAPTER 1: INTRODUCTION, THE PROBLEM AND ITS SETTINGS
1.1 The importance of the study
Vegans are a sub-group of the population who voluntarily decide to follow a diet that excludes
meat and animal products. They are also labelled as “strict vegetarians” (Kerschke-Risch
2015). Foods that are consumed in a vegan diet are mainly plant-based and have documented
health benefits. These foods include vegetables, fruit, wholegrains, nuts and seeds, legumes
and healthy fats (Key, Appleby & Rosell 2006; Spencer, Appleby, Davey & Key 2002). These
health benefits include lowering blood pressure (Pettersen, Anousheh, Fan, Jaceldo-Siegl &
Fraser 2012) and cholesterol levels (Bradbury, Crowe, Appleby, Schmidt, Travis & Key 2014),
a reduced cardiovascular disease risk (Satija & Hu 2018) and preventing diabetes (Tonstad,
Stewart, Oda, Batech, Herring & Fraser 2013).
American researchers Dyett, Sabate´, Haddad, Rajaram, & Shavlik (2013) noted that
individuals who follow a vegan diet may decide to do so for various reasons, and this in turn
affects their food and lifestyle decisions. These reasons can include a concern for the:
environment, health reasons, ethics surrounding animal rights, sensory aversion to animal meat
and influence from others. Qualitative and quantitative research revealed that the most common
reasons for following a vegan diet were ethical and health reasons (Dyett, Sabaté, Haddad,
Rajaram & Shavlik 2013, Ruby 2012). Interestingly, “ethical motivated vegans” continued
with the diet significantly longer than “health motivated vegans” (Radnitz et al 2015, Hoffman,
Stallings, Bessinger, & Brooks 2013).
Even though foods included in a vegan diet are mainly plant-based, it does not require the
individual to consume only whole foods or restrict the intake of refined sugar and fat (Tuso,
Ismail, Ha & Bartolotto (2013). An American qualitative study that interviewed self-defined
ethical motivated vegans, found that when a vegan diet is followed it is not necessarily a health-
based decision (Greenebaum 2012). Many vegans consume processed foods in the form of
vegan alternatives for dairy, cheese and meat. Hence, an individual who consumes meat
products in moderation can still be considered “healthy” whereas a vegan who consumes mostly
processed “junk” food can be considered “unhealthy”. This calls into question whether the
health benefits of following a vegan diet result from the elimination of meat products, or from
a general concern for one’s health that results in the selection of nutritious food and being
involved in other health-promoting activities such as regular physical activity (Radnitz et al
2015).

2
At the time of this study, there were over 10,000 vegan recipe books available for sale on the
Amazon website (Amazon 2019). Most of these books mainly addressed vegan health, fitness
and lifestyle issues (as evident in most titles) and hence did not address the original ethical and
political motives of vegans. This suggests that the books target a broader spectrum of
individuals. This indicates a change of image from a theory-based vegan to following a vegan-
based lifestyle (Kerschke-Risch 2015). Theory-based vegans use information from research to
drive their actions in society, expand their knowledge and understand the deeper meanings of
veganism (Frawley 2017).
Moreover, in recent years, many exclusively vegan supermarkets and retail stores have opened
internationally. This shows a correspondingly greater and economically attractive consumer
population for vegan products (Kerschke-Risch 2015), as vegans follow a lifestyle avoiding the
use of products associated with animal cruelty and are not just following a predominantly plant-
based diet. Although individuals who are following a vegan diet signify only a minor portion
of the population, there is a reason to believe that their general consumption trends will
influence and develop the food segment (Radnitz et al 2015). While there is an increase in
international research on veganism and vegan diets, there is yet to be a study completed on the
vegan diet in South Africa. At the time of data collection (August 2019), The South African
Vegan Society (SAVS) Facebook page had over 9 819 members.
South African vegan-specific restaurants are on the rise, while other popular restaurants are
adding vegan options to their menus. Major retail stores around the country are adding more
variation of vegan food products to their shelves. The launch of The Vegan Life magazine in
South Africa by Media24 in 2017 and 163 vegan published books by South African authors
available locally (Amazon 2020) shows that there is a growing interest in vegan diets in South
Africa. This may be due to greater awareness of animal abuse, research on the health benefits
of vegan diets and an increase in the accessibility of dairy and meat alternatives.
The following questions therefore arise:
What are the demographic characteristics of South African vegans?
What motivates South Africans to follow a vegan diet?
What are the challenges that South African vegans face and how are these challenges
addressed?
Is the diet of South African vegans nutritionally diverse?

3
Which food items are most frequently consumed in the diet of South African vegans?
Do South African vegans reach their daily nutritional requirements while consuming
this diet?
1.2 Statement of the problem
To determine the motives and challenges faced by South African vegans and the nutritional
quality of their diet.
1.3 Research objectives
The objectives of the study are as follows:
1.3.1 To determine the demographic characteristics of South Africa vegans.
1.3.2 To determine the motives for following a vegan diet.
1.3.3 To determine the challenges associated with following a vegan diet and how these
challenges are overcome.
1.3.4 To determine the nutritional quality of dietary intake compared to recommendations
(EARs) and to identify the variety of food groups and types of processed food consumed
in the vegan diet.
1.4 Hypotheses
The following hypotheses were proposed:
1.4.1 Females with a higher level of education would be more likely to follow a vegan diet.
1.4.2 Ethical reasons would be the main motive for becoming a vegan.
1.4.3 The main challenge that South African vegans face would be to find suitable vegan menu
items when eating out.
1.4.4 South African vegans would not meet their estimated average requirement (EAR) for
vitamin B12, vitamin D and calcium.
1.5 Inclusion and exclusion criteria
The following respondents were included:
South African citizens who were currently living in South Africa at the time of data
collection.
Able to access Facebook and complete an online survey.
Practising a vegan diet for at least 6 months.
From both male and female gender groups.
From all South African race groups.

4
From all age groups.
Provided informed consent to participate in the study.
Respondents were excluded if they were:
Non-vegan or partially vegan.
South African citizens currently living outside of South Africa.
1.6 Definition of terms
24-hour recall: A method of dietary assessment that involves
respondents being requested to provide estimates
of their complete food and beverage intake,
during the previous 24 hours or through a
midnight to midnight time period (Gibson 2005).
Added sugar: Sugar which is naturally present in syrups and
honey and added to foods during manufacturing
or by the consumer (Kaartinen, Similä, Kanerva,
Valsta, Harald & Männistö 2017).
Body mass index: The metric currently used for defining
anthropometric characteristics of height and
weight in adults. The index is calculated using
body weight (kilograms) divided by height
(meters) squared (Nuttall 2015).
Challenges: For the purpose of this study a challenge is a
character or nature that serves as a call to make a
special effort, a demand to explain, justify or a
difficulty in an undertaking a particular situation
(Gamez-Gutierrez & Saiz-Alvarez 2019).
Cross-sectional study: A study that is conducted at one point or
completed in a short period of time. This study is
generally conducted to estimate the prevalence of
the outcome of interest for the population under
study (Levin 2006).

5
Demographic characteristics: Demographic characteristics include qualities
such as age, sex, family status, education level,
income, occupation and race (Shimasaki 2014).
Environmentally motivated vegans: Vegans that are motivated to follow the diet
because of concerns for the environment such as
pollution caused by animal farming and land
degradation caused by animal grazing (Fox &
Ward 2008).
Ethical motivated vegans: Vegans who centre their nutritional choices on
concerns surrounding animal care including the
use of growth stimulants and antibiotic use in
animals (Craig 2009).
Food Frequency Questionnaire: A questionnaire which presents a list of food
items, which a respondent has to specify how
frequently each food item is consumed, such as
how many times per day, per week or per month.
It should be noted that the foods included in the
questionnaire are usually chosen for a specific
purpose and may not assess the total diet of the
respondent (Margetts & Nelson 1997).
Health motivated vegans: Vegans who are motivated to follow the diet
because of the health benefits associated with
consuming a diet which is free of animal meat and
milk (Howie 2018).
Nutritional quality: This describes the health or biological value of
different produce including taste, shelf-life,
freshness and fragrance, ratio of beneficial to
harmful substances as well as the risk of
pathogenic contamination. These important
quality characteristics govern consumer
behaviour (Köpke, Krämer & Leifert 2007).
Nutrition transition: This occurs when

6
populations implement a more contemporary
lifestyle during acculturation, urbanisation and
social and economic development which includes
modifications in dietary patterns and intake of
nutrients (Vorster 2002).
Omnivorous diet: For the purpose of this study, an omnivorous diet
consists of food from both plant and animal origin
(Zhang, Wang, Chen, Wei, Li, Zhao & Lu 2014).
Plant-based diet: A diet that encourages whole grains, nuts and
seeds, vegetables and fruit while limiting the
intake of animal foods, oils and processed food.
This diet is usually low in fat (Dinu, Abbate,
Gensini, Casini & Sofi 2017; Tuso et al (2013).
Polyphenol: A compound comprised of an extensive variety of
molecules, and are generally divided into non-
flavonoids and flavonoids. Flavonoids can be
found in fruit and vegetables and identified in
beverages that are plant-derived such as tea and
wine (Daglia 2012).
Processed food: Any foods other than raw agricultural
commodities and these foods can be classified by
the extent of changes which occurred in foods as
a result of processing (Poti, Mendez, Ng & Popkin
2015).
Reliability: Is the accurateness of a measure. The degree to
which an apparatus will consistently have the
same outcome if it is used on repetitive occasions
during the same condition (Heale & Twycross
2015).
Restrictive diet: Dietary patterns that restrict high energy
consumption and increases the intake of healthful

7
diet components (fruits, vegetables, whole grains,
and low-fat dairy) and decreases components of
an unhealthy diet (“empty calories” and saturated
fat) for health benefits (Boutté, Turner-McGrievy,
Wilcox, Hutto, Muth & Hoover 2018).
Supplements: Supplements can be defined as “a form of
complementary and alternative medicine that
include amino acids, biological/animal extracts,
herbals, minerals, and vitamins” (Smolinske
2017).
Validity: The degree to which an idea or concept is
precisely measured in a quantitative study (Heale
& Twycross 2015).
Vegan: An individual who follows a strict lifestyle
whereby all animal-derived products are avoided
as much as possible in all aspects of life (Jallinoja,
Vinnari & Niva 2018).
Vegan diet: A diet that excludes all food substances that are
derived from animals (Dinu et al 2017).
Vegan lifestyle: A lifestyle exclusively comprising of vegan
practices. Products made from animals and those
that have been tested on animals such as
household items, toiletries and clothing are
avoided (Cherry 2015).
Vegetarian: A person who follows a diet that excludes any
poultry, seafood or meat products, but may
contain dairy and eggs (Cofnas 2018).
1.7 Abbreviations
AI: Adequate Intake
ALA: Alpha-linolenic Acid

8
BMI: Body Mass Index
BMD: Bone Mineral Density
BV: Biological Value
CHD: Coronary Heart Disease
CVD: Cardiovascular Disease
DHA: Docosahexaenoic Acid
DRI: Dietary Reference Intake
EAR: Estimated Average Requirement
EPA: Eicosapentaenoic Acid
FBDG: Food Based Dietary Guideline
FFQ: Food Frequency Questionnaire
GI: Glycaemic Index
HDL: High-Density Lipoprotein
kCal: Kilocalorie
kJ: Kilojoule
KZN: KwaZulu-Natal
LA: Linoleic Acid
LDL: Low-Density Lipoprotein
MUFA: Mono-Unsaturated Fatty Acid
NCD: Non-Communicable Diseases
PBD: Plant-Based Diet
PBMA: Plant-Based Milk Alternative
PDCAAS: Protein Digestibility-Corrected Amino Acid Scores
PETA: People for the Ethical Treatment of Animals

9
PoPI: Protection of Personal Information
PUFA: Poly-unsaturated Fatty Acid
RDA: Recommended Dietary Allowance
SAVS: South African Vegan Society
SSB: Sugar-Sweetened Beverage
UL: Tolerable Upper Intake Level
USA: United States of America
WHO: World Health Organization
1.8 Assumptions
The following assumptions were made:
All respondents were vegan.
All respondents were computer literate.
Respondents were able to read and understand the English language.
All respondents were honest when completing the questionnaire.
1.9 Summary
Veganism has substantially increased internationally in the last few years. There is now a
greater focus on protecting animals from abuse, an accumulation of scientific research on the
health advantages of following a vegan diet and an increasing availability of dairy and meat
replacements in the market (Radnitz et al 2015). The motives behind following a vegan diet
have a strong influence on the dietary preferences, food choices and duration of following the
diet, as seen in many studies. Due to the growing trends of following a vegan diet in South
Africa, including an increase in vegan food products and vegan-specific restaurants, there is a
need to investigate how easy it is for South African vegans to be able to follow this diet. The
research conducted in this dissertation is aimed to determine the demographic characteristics of
South African vegans, their motives and challenges and the nutritional quality of their diet.
Therefore, it is anticipated that the objectives of this study will shed light on the statement of
the problem.

10
1.10 Dissertation Overview
This dissertation consists of six chapters. The first chapter provides information on the
importance and relevance of the study, outlining the objectives, hypotheses and scope of the
study. Chapter two outlines the current literature in relation to the research topic and objectives.
The third chapter provides details on the methodology used in the study and the fourth chapter
will present the results following the statistical analyses of the data. Chapter five discusses the
results of the study in relation to previous studies presented in chapter two.
The sixth chapter outlines the conclusions obtained from the study and provides
recommendations for future research.
1.11 Referencing style
This dissertation has been written using the referencing style compiled by the Discipline of
Dietetics and Human Nutrition at the University of KwaZulu-Natal, Pietermaritzburg.

11
CHAPTER 2: REVIEW OF THE RELATED LITERATURE
2.1 Overview
This chapter will address the literature regarding the history and background of plant-based
diets and how the vegan diet has become popular worldwide. The main motives for following
a vegan diet will be presented and the benefits of following a vegan diet will also be addressed.
The chapter will include insight into the challenges faced by vegans in society and a proposal
as to how these challenges can be overcome. It will also include the definition and nutritional
composition of a vegan diet and common plant-based alternatives that can be found
commercially. The chapter will conclude with plant-based diets and veganism from a South
African perspective.
2.2 Introduction and background to plant-based diets
The global demand for food is increasing due to population growth and nutrition transitioning,
resulting from a rise in income, which are associated with an increased prevalence of non-
communicable diseases (NCDs) (González-García, Green, Scheelbeek, Harris & Dangour
2020). Currently, the world has seen a remarkable shift in dietary behaviours, physical activity
and patterns of inactivity, body composition and NCDs. This shift is especially evident in low
to middle income countries, where the growth of agriculture, modern retail and food systems,
urbanisation and access to mass media are some underlying factors of the transition. This shift
is related to the nutrition transition which is associated with changes in the consumption of food
and beverages as well as reduced physical activity. There is a dietary shift toward including
higher amounts of refined carbohydrates, oils, added sweeteners, animal products and a reduced
amount of fruit, vegetables and legumes. This leads to most countries seeing an increase in
body mass index (BMI), waist circumference, overweight and obesity. The implications of
diets and body composition changing rapidly eventually results in increased NCDs (Popkin
2016). Globally, the most common NCD is cardiovascular disease (CVD), which includes both
stroke and coronary heart disease (CHD). This disease has led to an estimated 17.8 million
deaths globally in 2017, mainly in low to middle income countries (Global Burden of Disease
Study 2017 Causes of Death Collaborators 2018).
Diets closely link the health of humans and sustainability of the environment (Tilman & Clark
2014). In order to prevent the scarcity of energy resources, fresh water and land for crops, it
has been suggested that more people should follow a plant-based diet (Pimentel & Pimentel
2003), rather than an omnivorous diet. For the purpose of this study an omnivorous diet can be

12
defined as a diet which includes food from both plant and animal origin (Larsson & Johansson
2002). Lately, people in developed countries such as the United States of America (USA) and
Europe, have consumed increased amounts of meat products in larger proportions in their diet
(Stoll-Kleemann & Schmidt 2017). A study by Sans & Combis (2015), conducted in France,
investigated the world meat consumption patterns over the last fifty years (1961-2011). This
study found that meat consumption increased from 23.1 kg per person per year in the year 1961
to 42.20 kg per person per year in the year 2011. The most developed countries have therefore
achieved on average an animal-based protein consumption that exceeds their requirements.
However, according to the 2015 Dietary Guidelines Advisory Committee, a healthy dietary
pattern should include a high amount of fruit, vegetables, whole-grains, seafood, legumes and
nuts, non-fat or low-fat dairy and a moderate intake of alcohol. The diet should be low in
refined grains, sugar sweetened food products, processed and red meat (Tapsell, Neale, Satija
& Hu 2016). Therefore, guidelines in reducing meat consumption and consuming more plant-
based diets (PBDs) has become a key feature in addressing challenges associated with health
and sustainability (Graca, Godinho & Truninger 2019). A PBD can be defined as a diet that
mainly consists of minimally processed and fresh plant foods. The diet limits the intake of
dairy products, eggs and meat sources. When compared to a diet which includes meat sources,
there is an increased intake of vegetables, fruits, seeds and nuts, legumes and a range of grains
in a PBD (Key, Appleby, Davey, Allen, Spencer & Travis 2003; Li, Sinclair, Mann, Turner,
Ball, Kelly, Abedin & Wilson 1999). There are many important benefits to following a PBD,
particularly health-related, as the diet increases fibre intake and decreases unhealthy fat
consumption (Lea, Crawford & Worsley 2006).
The increased intake of plant foods reduces the risk of NCDs (Montonen, Knekt, Järvinen,
Aromaa, Reunanen 2003; Hu 2003; Bazzano, He, Ogden, Loria, Vupputuri, Myers & Whelton
2002; Messina 1999; Dwyer 1999; World Cancer Research Fund and American Institute for
Cancer Research 1997; Rottka 1990). People who reduce their intake of meat and increase the
amount of vegetables in their diet, tend to have lower systolic blood pressure, lower blood levels
of low-density lipoprotein (LDL) and a lower BMI (Yang, Zhang, Sun, Wang, Yan, Liu, Zhang
& Li 2011). In addition, a strict PBD results in reduced micro-inflammation and oxidative
stress when compared to an omnivorous diet (Sebeková, Boor, Valachovicová, Blazícek,
Parrák, Babinská, Heidland & Krajcovicová-Kudlácková 2006). Besides disease prevention, a
PBD improves quality of life, health status and assists with weight control (Zunft, Friebe,
Seppelt, Widhalm, de Winter, de Almeida, Kearney & Gibney (1999). There are also non-

13
health related benefits such as animal and environmental welfare (Lea et al 2006). When
compared to omnivorous diets, PBDs are more sustainable as the diet uses significantly less
amounts of natural resources and therefore has less harmful effects on the environment (Sabate´
& Soret 2014). A number of dietary patterns fall under the umbrella of plant-based diets. These
diet patterns include vegan, vegetarian, semi-vegetarian and pesco-vegetarian (Tonstad et al
2013). It should also be noted that the term PBD is occasionally used interchangeably with the
words vegan or vegetarian diets. These diets can be adopted for religious or ethical motives
which may or may not be health-related. It is therefore important to understand the definition
of these diets as presented in Table 2.1. A key difference in diets that restrict animal products
is that even though most of the diets are defined by the foods that are excluded in the diet, a
PBD is defined by what is included in the diet (Tuso et al 2013).
Table 2.1: Definition of different vegetarian and vegan diets (after Turner-McGrievy,
Mandes & Crimarco 2017; Tuso et al 2013)
Dietary group Definition of diet patterns
Vegan diet Does not contain any animal products (meat, fish, poultry, eggs, or
dairy) but emphasises plant-based foods, such as fruits, vegetables,
whole grains, and legumes/beans.
Vegetarian diet Does not contain meat, fish, or poultry but does contain eggs and
dairy, in addition to plant-based foods, such as fruits, vegetables,
whole grains, and legumes/beans.
Pesco-vegetarian diet Does not contain meat or poultry but does contain fish and shellfish,
eggs, and dairy, in addition to plant-based foods, such as fruits,
vegetables, whole grains, and legumes/beans.
Semi-vegetarian diet Contains all foods, including meat, poultry, fish and shellfish, eggs
and dairy, in addition to plant-based foods, such as fruits, vegetables,
whole-grains and legumes/beans. However, red meat and poultry
are fairly limited.
Plant-based diet Encourages plant foods in their whole form, especially vegetables,
fruits, legumes, and seeds and nuts (in smaller amounts). For
maximum health benefits this diet limits animal products. Total fat
is generally restricted.

14
The more extreme forms of PBDs are the vegetarian and vegan diet. In contrast to PBDs, these
diets may provide an inadequate consumption of energy and protein, as well as vitamins and
minerals. Vegans and vegetarians have lower serum levels of vitamin B12, vitamin D (25-
hydroxyvitamin D2 and D3), total cholesterol, as well as low plasma levels of beta-carotene
and alpha-tocopherol compared to omnivorous diets (Elorinne, Alfthan, Erlund, Kivimäki,
Paju, Salminen, Turpeinen & Voutilainen & Laakso 2016). During the last few years, there
have been a vast number of studies published on the vegetarian diet; however, there is limited
research on the vegan diet (Waldmann et al 2003).
2.2.1 History of veganism and the vegan diet
According to Williams (1896), for many years in different countries and cultures, the
consumption of animal flesh was thought to be ethically wrong and unhealthy. In 1847 in
Britain, a national Vegetarian Society was formed to propagate the ideology of the consumption
of non-animal foods (Twigg 1982). Both British vegetarians and the Vegetarian Society
defined vegetarianism as an acceptable intake of eggs and dairy products, provided that animals
were not killed to attain them (Leneman 1999).
In 1946, the editor of The Vegan newspaper, Donald Watson, stated that it was “strange that for
ninety years vegetarian literature contained nothing to question either morally or
physiologically the use of animal foods other than flesh” (The Vegan, p3, 1946). Watson then
formed an entirely new society named the Vegan Society as it seemed like a positive decision
to have a separate group for those individuals who avoided all animal products. His original
word, vegan, had become internationally recognised and understood and now appears in
dictionaries worldwide. The Vegetarian Society has continued to claim that their main priority
is to convince the greater population to omit poultry, fish and flesh from their diet. There has
been a rise in the number of food products that are animal-free and an increase in the number
of restaurants that prepare such food as well as strong health arguments about the diet (Leneman
1999).
2.2.2 Veganism as a social movement
Veganism refers to a philosophy or movement that supports and promotes avoidance from the
consumption of any animal product such as dairy, eggs and meat. It stands against both the
prevention of animal abuse and exploitation. Veganism varies from vegetarianism because
although vegetarianism promotes avoiding the consumption of meat products, it does not

15
advocate against the intake and use of other animal products such as eggs, dairy products and
honey (Ulusoy 2015).
According to Linderman & Stark (1999), veganism is known to be an alternate diet, a choice in
the food that is consumed, a lifestyle as well as a social movement. This provides a setting for
consumers to express and reflect on their own individualities and life choices. Cherry (2006)
stated that many social movements, more especially cultural movements, do not have goals or
adversaries which are conventionally identified. A good example of this is the vegan
movement. Since veganism focuses on omitting all animal sources from their lifestyle and diet,
it is often considered as the only goal or tactic of the animal rights movement (Munro 2005).
Although, veganism is closely associated with both the environmental and animal rights
movements, there are social movement organisations which exist that are dedicated to spreading
information on veganism (Vegetarian Resource Group 2006).
In the year 2016, the number of adult vegans in the United States were approximately 3.7
million, however, there are only tens of thousands of vegan individuals who are part of social
movement organisations. Therefore there are more practising vegans than members of a
particular vegan organisation (Vegetarian Resource Group 2016). This suggests that while
many vegans may be engaging in moral protests and activism, some are not associated with a
particular vegan organisation. Therefore, it is essential to consider veganism as a broader
movement rather than simply members as part of an organisation (Cherry 2006). Haenfler,
Johnson & Jones (2012) stated that while there are multiple organisations that exist such as the
Vegan Society or the Vegan Outreach, one does not need to join an organisation to become a
vegan. It is more important to engage in everyday actions of following a vegan lifestyle and
avoid being associated with the abuse of animals, than to become an associate of a movement
organisation. Both local and national organisations can only assist an individual in providing
the required social support for vegans and vegetarians who follow their own dietary lifestyle
(Maurer 2002).
2.3 Motives for following a vegan diet
Motivation is an influential source for understanding what drives consumer’s decisions and
actions (Solomon, Bamossy, Askegaard & Hogg 2006). Dyett et al (2013), stated that
individuals who follow a vegan diet, may do so for different reasons and this will affect their
overall food and lifestyle decisions. A study conducted in the United Kingdom by Beardsworth
& Keil (1991), found that motives for becoming vegetarian or vegan were usually “multi-

16
stranded” with the main reason for transition being for the improvement of health, spiritual or
moral, taste or texture or ecological reasons. The food choices made by a vegan may depend
on their motive for following the vegan diet, which could be for health reasons or the ethical
welfare of animals (Orlich, Jaceldo-Siegl, Sabaté, Fan, Singh & Fraser 2014). According to
literature, the motives for following a vegan diet which frequently emerge include health-
related, ethical, environmental, religious practices and taste preferences. Ethical or moral
reasons involve concern surrounding the welfare of animals, animal suffering during farming
processes, animal rights and speciesism (Radnitz et al 2015; Dyett et al 2013). Ecological or
environmental reasons were occasionally included as ethical reasons (Rothgerber 2013), while
it was separated in other studies.
According to Rose, Heller, Willits-Smith & Meyer (2019), environmental concerns include
climate change, shortages of fresh water, land degradation, water pollution as well as a loss of
biodiversity. The aspects of health-related motives include the perception that vegan diets are
beneficial for one’s body and health when compared to an omnivorous diet. In addition, vegan
diets can prevent disease and illness (Radnitz et al 2015; Rothgerber 2013; Timko, Hormes &
Chubski 2012; Beardsworth & Keil 1991). In other studies, weight-loss related and health-
related studies might have been grouped together as health-related motives. Beardsworth &
Keil (1992) stated that when ethical and environmental motives were compared to health-
related motives it was assumed to be linked to self-interest by a larger extent.
Most studies revealed that health-related and ethical motives make up the largest proportion of
the main motives for following a vegan diet. Environmental-related motives remain rather
unclear. Some studies show that environment-related motives have a minor contribution to
overall motives (Dyett et al 2013; Izmirli & Phillips 2011; Waldmann et al 2003), whereas
global warming concerns were the second most significant motive in a study done in Germany
(Kerschke-Risch 2015). Environmental-related and animal-related motives were not
investigated separately in other studies (Radnitz et al 2015; Rothgerber 2013). The distaste for
animal and meat products (Waldmann et al 2003) and following religious customs (Dyett et al
2013) formed part of less common motives. Other reasons such as social and hygiene motives
played a smaller role (Waldmann et al 2003). With regards to different backgrounds of motives,
some authors divided vegans into those motivated mainly by ethical concerns and those by
health and personal well-being (Radnitz et al 2015; Dyett et al 2013; Rothgerber 2013).

18
reasons which compromise their well-being, this includes the use of animals for food. The
“meat paradox” is maintained by psychological and cultural instruments which lessens this
conflict (Loughnan, Bastian & Haslam 2014; Plous 1993). According to Joy (2009), carnism
can be defined as the practise of eating meat and the main ideology involves the continuation
of animals to be used as food, by keeping welfare concerns of present structures of farming
invisible and meat farming as natural, common and essential. The consumption of meat is also
associated with masculinity in many cultures (Rothgerber 2013).
Different methods on the basis of justifying the consumption of meat are most likely reinforced
by general values and research has shown that meat eaters are more socially dominant than
vegans and vegetarians. Many vegans and vegetarians are presumed to follow a framework
based on ethics (Lund et al 2016). According to Fox & Ward (2008), ethical motivated vegans
and vegetarians tend to make their decisions within a “philosophical, ideological or spiritual
framework”. But according to quantitative (Rothgerber 2015) and qualitative studies (Hirschler
2011; Larsson, Ronnlund, Johansson & Dahlgren 2003; McDonald 2000), attitudes towards
animal rights and welfare plays a significant role in the conversion to a diet which is ethically
motivated. However, it is unclear if there are other animal ethical structures and how these
structures differ among vegans and vegetarians.
Sandoe, Christiansen & Holst (2008) presented five main ethics concepts or principles,
contractarian, utilitarian, animal rights, relational and respect for nature. These five views or
concepts assist with providing the answers to questions surrounding the abuse of animals. The
contractarian view focuses only on human self-regard and this view does not object the use of
animals for any particular reason. The utilitarian view states that is it acceptable to breed
animals for slaughter, provided that their welfare is considered and intensive production
procedures should be avoided. The animal rights view states that all living beings should be
treated with respect and animal rights are not overruled by the interest of humans. The
relational view highlights the relationship of humans and animals and the strength of this bond.
Therefore, there is acceptance of animal use provided that the animal-human bond is still
preserved. Views regarding the respect for nature involves speciesism, preserving the health
of ecosystems, integrity of genetics and other matters. The main focus of this view is the effect
that animal production has on biodiversity, where the consumption of animal meat may be an
issue of concern due to the substantial detrimental effects on the environment during livestock
production (Sandoe et al 2008).

19
A study by Rothgerber (2015) conducted in the USA, with 556 respondents, consisted of 18%
conscientious omnivores (n = 98), 8% ethical omnivores (n = 45), 16% health motivated
vegetarians (n = 88), 21% ethical motivated vegetarians (n = 118), 14% health motivated vegans
(n = 80) and 23% ethical motivated vegans (n = 127). Conscientious omnivores consume meat
products or fish only when certain ethical standards are followed. For example, conscientious
omnivores may have concerns about hormones or chemicals added to farmed meat from
factories, as opposed to concerns about the unethical treatment of factory farmed animals
(Rothgerber 2015). The study supported the assumption that obligation toward animal rights is
crucial in diet transformation. This shows that vegans adopt stronger views about animal rights
to a greater degree than vegetarians, who are more focused on animal rights than conscientious
omnivores, who are defined as those individuals who only consume meat from farms that treat
animals humanely. It is unclear as to what extent and whether commitment to animal rights is
required to continue following a vegan or vegetarian diet.
Vegetarianism, especially ethical vegetarianism has been categorised as a “moralisation
process” whereby the motivation behind the diet should be continuously strengthened (Rozin,
Markwith & Stoess 1997). Therefore, it is acceptable to hypothesise that vegans and
vegetarians who have stronger animal rights views tend to follow the diet for a longer duration
(Lund et al 2016). It is shown from theory and evidence based studies, that those who consume
meat have diverse views on animal ethics when compared to vegans and vegetarians. It is also
evident that the viewpoints of meat-eaters are less consistent (Rothgerber 2015).
Janssen, Busch, Rödiger & Hamm (2016), investigated the motives of consumers who follow
a vegan diet and their attitudes towards animal agriculture and found that 89.7% of vegan
respondents followed the diet related to animal motives. Vegans in this study believed that
animals and humans have similar feelings and that animals should have a natural death.
Interestingly, some vegans supported that humans should not keep animals as pets. The study
also had implications for the producers and retailers of vegan food products. It was identified
that there are a variety of consumer segments according to the different motives for following
a vegan diet, therefore vegan food is strategically positioned in the market. Since the majority
of vegan consumers are motivated by animal-related reasons for following the vegan diet, it is
advisable to mention that “no animals were harmed” in any communication strategy for vegan
food products. Companies can decide if they are targeting consumers in search of healthy diets,
protecting animal agriculture, improving health or all of these aspects (Janssen et al 2016).

20
2.3.2 Health motives
Plant-based diets are well-recognised to have reduced levels of fat especially saturated fat and
cholesterol. These diets offer more folate, vitamin C, fibre and phytochemicals from the
increased consumption of whole grains, legumes, nuts, fruit and vegetables, which are all vital
in preventing disease and providing optimum health and well-being (Dyett et al 2013). A well-
planned vegan diet can be healthy, nutritionally adequate and provide the essential health
benefits in the treating and preventing certain disease conditions (Craig 2009).
Individuals following these plant-based diets, particularly vegetarian or vegan diets have
reduced risks of certain cancers and have shown a reduction in body weight when compared to
meat-eaters (Key, Appleby, Spencer, Travis, Roddam & Allen 2009). Both vegan and
vegetarian diets have been known to effectively assist with weight loss (Barnard et al 2005;
Ornish, Scherwitz, Billings, Gould, Merritt, Sparler, Armstrong, Ports, Kirkeeide, Hogeboom
& Brand 1998) and maintaining weight (Turner-McGrievy et al 2007) as well as slowing the
progress of the initial stages of prostate cancer (Ornish et al 2005).
A limited number of studies assess and compare vegan, vegetarian and omnivorous respondents
as individual investigational groups. Therefore, it is difficult to identify if the health advantages
associated with the vegan diet could possibly be generalised to all vegetarians or even to
restrictive meat eaters who follow a healthy diet (Glick-Bauer & Yeh 2014). A case-controlled
study by Goff, Bell, So, Dornhorst & Frost (2005) conducted in the United Kingdom, compared
the profiles of omnivores (n = 25) and vegans (n = 24) who were matched by BMI, age and
gender and found that 21 vegans had lower blood pressure readings and reduced glucose and
fasting triacylglycerol concentrations when compared to the 25 omnivores. The biochemical
profile of vegans also showed to be both beta-cell and cardio protective. Similarly, a cross-
sectional study by Fontana, Meyer, Klein & Holloszy (2007), found the health profiles of
twenty one sedentary vegans in the USA, following a raw long-term vegan diet to be
comparable to those who participated in endurance exercises. These respondents were found
to have reduced BMI, insulin, glucose, blood pressure, lipoproteins, lipids and C-reactive
proteins when compared to the twenty one respondents who followed an omnivorous diet.
The Adventist Health Study-2 consisted of a total of 41 387 respondents, including Black (n =
7171) and non-Black respondents (n = 34 216) from the USA and Canada, who were diabetes-
free and provided demographic, anthropometric, lifestyle and dietary data. This study provided
a different platform for the comparison of not just vegetarians to omnivorous respondents

21
(reference group), but also to differentiate which of the four groups of vegetarian diets; known
as vegan, pesco-vegetarian, lacto-ovo vegetarian and semi-vegetarian, increases the incidence
of diabetes. A follow-up questionnaire after two years indicated that Black respondents had an
increased incidence of diabetes when compared to non-Black respondents. The vegetarian diets
were found to be advantageous when compared to omnivorous diet; however, vegan diets show
a specific advantage in lowing the risk of diabetes (Tonstad et al 2013; Tonstad, et al 2009) and
overall mortality (Orlich, Singh, Sabaté, Jaceldo-Siegl, Fan, Knutsen, Beeson & Fraser 2013).
The risk ratios for developing general and female-specific types of cancers were found to be
lower in individuals following a vegan diet. Vegans in this group were shown to have the
lowest range of BMI when compared to other diet forms (Rizzo, Jaceldo-Siegl, Sabate´ & Fraser
2013), however, researchers had shown that there was an inadequate consumption of nutrients
by respondents who followed strict vegetarian diets (Glick-Bauer & Yeh 2014).
A study by Dyett et al (2013), investigated the lifestyle behaviours and dietary motives of one
hundred vegans in the USA. Health reasons were the most reported motive for their choice in
following a vegan diet (47%). This was followed by welfare of animals (27%), religion (11%)
and a reduced percentage of diagnosed chronic diseases (15%). The interest and level of health
awareness in such restrictive diets are increasing due to the frequency of chronic illnesses and
the widespread prevalence of obesity. According to Lea & Worsley (2003a), people who are
health conscious accept vegetarian diets mainly because they recognise meat foodstuffs as
unhealthy and plant food products as providing a variety of health benefits. Obesity is known
to be a major risk factor in the development of NCDs. However, many vegans may not be at
risk of NCDs, especially those with particularly lower BMIs.
Sabaté & Wein (2010), showed that plant-based diets were associated with a reduced BMI and
lower obesity risk in both adults and children. There are vegans who follow the vegan diet to
either maintain their slimness or to lose weight. Whereas, some individuals may be addressing
the issue of obesity from an “image” perspective in their respective society. Weight loss
strategies contribute to improving overall health, with the exception of prevalent eating
disorders such as anorexia nervosa (Klopp, Heiss & Smith 2003).
With weight management and dieting, there are additional health aspects that appear to be
generally linked with the vegan lifestyle and assist in improving the health and well-being of
vegans (Phillips 2005). These factors include the intake of little or no alcohol, absence of
smoking and partaking in exercise on a regular basis. These factors are known to have a positive

22
outcome and reduce the likelihood of chronic diseases. The study by Dyett et al (2013), showed
that the majority of vegans took part in “moderate to vigorous” exercise more than three times
a week for at least thirty minutes per work-out session. In the study, 97% of vegans never
smoked and had never or rarely consumed alcoholic drinks such as beer, wine and liquor.
Certain food-related choices and behaviours can influence health consequences. In the study
by Dyett et al (2013), home-prepared meals were most frequently consumed by vegans and
boiling and steaming were the most common food preparation methods. Deep-fat frying was
not selected by any vegans who participated in the study and the use of mainly reduced-fat,
non-fat or low-fat food products were reported by 92% of the respondents (Dyett et al 2013).
While there are numerous publications with information about vegetarian and vegan diets, there
are insufficient data that have broader conclusions on the specific health motives of these diets.
The overall outcome is that vegetarians and vegans are generally more conscious about their
health and well-being when compared to meat-eaters (for example, avoiding the practice of
alcohol consumption and smoking) and because they follow diets that are reasonably healthy
(for example, reduced fat composition) (Key, Appleby & Rosell 2006).
Although some vegans are motivated by health reasons and have a desire to be slimmer, reduce
their blood pressure and serum cholesterol levels and lower their risk of CVD, the vegan diet
may lack certain vitamins and minerals. It is important that all vegans regularly consume foods
that are fortified with calcium, vitamin D and vitamin B12. More studies are needed to find the
relationship between vegan diets and the risk of certain conditions such as diabetes, cancer and
osteoporosis (Craig 2009).
2.3.3 Environmental motives
In many developed countries around the world, an association between the degradation of the
environment and agricultural production exists (Goodland 1997). The public should be made
aware of various global environmental concerns such as changes in climate (Johnson,
Franzluebbers, Weyers & Reicosky 2007), soil erosion (Trimble & Crosson 2000), toxic
substances in food and the endangering of certain animal species (Huston 1993). These
concerns have motivated sustainable production practices of food products and responsible use
of limited resources (Pinstrup-Andersen & Pandya-Lorch 1998). In particular, there is an
increased demand for animal products especially for those around the world who are
economically advantaged (Heitschmidt, Short & Grings 1996).

23
Published studies address the problems surrounding food production sustainability and the
impact of the environment from human consumption and other related systems (Beeton 2003).
Generally, research shows that diets that are plant-based are better for the environment than
meat-based diets (Leitzmann 2003; Pimental & Pimental 2003; Rejinders & Soret 2003). An
Italian study by Baroni, Cenci, Tettamanti & Berati (2006) evaluated the environmental impact
of various dietary patterns in combination with the different food production systems. It was
found that the “normal” omnivorous diet which uses conventional farming and agriculture
showed the highest impact on the environment, while the vegan diet which is based on organic
food production had the least environmental impact. The study further identified the “critical
points” of environmental effects and assessed the smallest alterations in eating patterns and how
these changes benefit the environment. It was found that people usually showed utmost
reluctance to altering their eating patterns, yet changing their way of eating may reverse major
environmental issues. Single foods were then analysed along with the effect that these foods
had on the environment. Beef in particular was found to have the largest effect on the
environment and other high impact foods included milk, fish and cheese (Baroni et al 2006).
According to Baroni et al (2006), 3 - 4% of the environmental impact is due to eutrophication
processes. Eutrophication is the excessive amount of plant growth on the surface of water
which results from nutrient enrichment by the activity of humans. This is one of the most
noticeable examples of human impact on the biosphere (Smith & Schindler 2009).
Eutrophication increases due to chemical-conventional agriculture and other organic production
procedures. These procedures include the impact of liquid manure from animal waste products,
chemical fertilisers and pesticides on the ecosystem (Baroni et al (2006). Moriconi (2001)
stated that in Italy alone, 19 million tons of farm animal waste could not be used as fertiliser
due to its reduced organic consistency and increased pollutant content. This waste would then
be layered on the ground, which in turn would lead to serious nitrogen pollution concerns,
polluting waterways, water springs and lead to sea eutrophication. Land use equates to 5 - 13%
of environmental impact. Yearly, close to seventeen million hectares of forests are demolished
and this is increasing. This land is not only used for cattle rearing, but also for animal grazing,
while wood production in the deforestation process has been relatively reduced (Kaimowitz,
Mertens, Wunder & Pacheco 2003).
Respiration damage from chemical inorganic substances amount to 15 - 18% of the
environmental impact, while 20 - 26% is because of the intake of fossil fuels. This due to the
transport and production of food products, energy management and pollution.

24
If animals are treated as “food production machines”, it is important to note that these machines
produce a vast amount of pollution, as they have a very high energy intake (Moriconi 2001).
The consumption of water contributes to 41 - 46% of environmental impact. Animal agriculture
and farming uses 70% of freshwater, 22% of water is used by industry and 8% of water usage
is for domestic reasons (World Watch Institute 2004).
A systematic review by Sanchez-Sabate & Sabate´ (2019), investigated the consumer attitudes
towards environmental concerns of meat consumption, found that the consumption of meat
contributes greatly to global warming. The greatest challenge is changing the food behaviour
of consumers. Food choices are influenced by numerous factors such as social norms, culinary
backgrounds and different taste preferences. The results of the review showed that many
consumers were aware of the impact that meat processing has on the environment and the
planet. Many consumers are willing to considerably reduce or stop the consumption of meat
for the benefit of the environment.
It is important to educate individuals residing in developed countries to change their dietary
behaviour and attitudes regarding the consumption of meat products and the impact it has on
the environment. There should be a shift in eating patterns to directly increase plant food
consumption. Therefore, vegan and vegetarian diets could also play an essential role in the
reduction of hunger and malnutrition in disadvantaged communities (Fox 1999; Gussow 1994).
2.4 Challenges faced by vegans in society
A vast majority of literature on meat consumption as a substantial part of the Westernised diet
continues to be of interest and many studies have attempted to discover the reason why
omnivores choose to include meat as part of their diet. For example, scholars have justified the
hardship of altering dietary patterns (Pohjolainen, Vinnari, & Jokinen 2015; Lea et al 2006),
the enjoyment of the taste of meat (Graca, Calheiros, & Oliveira 2015) and the masculine
characteristics that are identified when meat is consumed (Rothgerber 2013). The consumption
of food in a social setting can be identified as a profound social activity, whereby individuals
are categorised according to their food-related social practices (Delormier, Frohlich, & Potvin
2009). There is also a bonding experience among individuals during the process of food sharing
(Ochs & Shohet 2006).
Cole & Morgan (2011), found that people usually perceive vegans and vegetarians negatively
because they strictly disrupt the social connotations connected to food. Because of the dietary
deviation, it is argued that those individuals who follow vegan diets are likely to experience

25
stigma (Bresnahan, Zhuang & Zhu 2016). Stigma is known as treatment that is biased and
involves negative opinions towards those who possess undesirable characteristics or belong to
a different status group (Link & Phelan 2001). The bias treatment involves distancing one’s
self in a social setting from others who are different (Cialdini & Goldstein 2004). The stigma
linked to vegans may discourage other individuals to limit their animal product and meat intake
and move toward plant-based food products. This occurs because individuals expect the stigma
to follow from their unusual behaviour, and therefore they prefer to avoid being “labelled” and
treated as part of the stigmatised group (Quinn & Chaudoir 2009; Johnston 2002).
In general, literature reveals that individuals treat vegetarians, especially vegans negatively.
For example, Cole (2008) explained the detailed terminology used to address vegans. He stated
that scholars termed veganism as an “ascetic” practice that is hard to conserve. A study by
Potts & Parry (2010) conducted in New Zealand, examined online articles that had been
published, along with comments from chatrooms and personal blogs. They found that vegans
were described as mentally and physically weak and often oversensitive. Other authors
examined other sources of media such as newspapers and films for discussions on veganism
and vegans. The prevailing perceptions continued to be negative (Wright 2015; Cole & Morgan
2011). This led Cole & Morgan (2011) to term the negative views as “vegaphobia”. However,
the study by Rothgerber (2014) which compared the attitudes towards meat and animals among
strict vegetarians (n = 157) and semi-vegetarians (n = 57) found that usual attitudes was an
exception to the trend. Semi-vegetarians were less likely to dislike meat and to find meat
repulsive than were strict vegetarians even when the diet was being followed for health motives.
Yeh (2014) who examined the content of vegetarian magazines also found that vegetarians
favoured vegans and their dietary choices. Although this led to positive views, it was from
individuals who did not consume meat, and it is not a general view from the omnivorous
population. An additional factor may include the fact that some plant-based groups disrupt and
attempt to undermine social agreements. For example, although vegans and vegetarians are
alike, they do have different motives for the diets that they follow, like environmental or health
motives (Radnitz et al 2015; Greenebaum 2012; Fox & Ward 2008) and ethical and moral
reasons (Ruby 2012). These motives are mainly followed because of the exploitation and
suffering of animals, and many vegans take part in social activism and become members of
social movement groups (Wrenn 2017; Cherry 2006). Taking this into account, activists of
animal’s rights share similar views and concerns as ethical/moral vegans (Cherry 2010), and
vegans are associated with protesters who support animal rights movements (Cherry 2006).

26
This may lead to vegans being classified as outspoken activists who are prejudiced and
duplicitous for advocating animal rights above the rights of humans (Greenebaum 2012).
McDonald (2000) stated that those individuals who have recently transitioned into the vegan
diet, report frequent interrogation from meat-eaters, including their friends and family. The
hostile questions are usually accompanied by demeaning and open ridiculing of vegan
individualities. This can be seen as illicit or just an impermanent phase (Greenebaum 2012;
Hirschler 2011). According to Twine (2014), these negative attitudes commonly cause vegans
to experience social relationships that are tense with non-vegan individuals. This is generally
characterised by non-vegans refusing to taste or provide vegan dishes. Due to the tension,
vegans may lose friendships, have reduced contact with friends and family, be left out from
social activities, signifying that the social costs of following veganism can be quite high (Twine
2014; Greenebaum 2012; Hirschler 2011).
It is seen from literature that social stigma plays an important role in preventing change towards
a plant-based diet. This is essential in planning public health strategies which are aimed at
improving the overall well-being and health status of individuals. Research suggests that plant-
based food products should be labelled as meat-free (Apostolidis & McLeay 2016) and health
benefits of limiting meat intake should be continuously emphasised (De Backer & Hudders
2014). In order to improve social difficulties, public health interventions should be planned to
decrease social stigma and aim at changing general attitudes and beliefs surrounding vegan
diets (Mittal, Sullivan, Chekuri, Allee & Corrigan 2012). If personal and social circumstances
are made easier, only then will animal product intake be reduced and a plant-based diet be
adopted. Until then there may still be substantial resistance along with negative opinions related
to those who following a plant-based and meat-free diet (Markowski & Roxburgh 2019).
Other challenges to consuming plant-based options include taste preferences and unwillingness
to change dietary patterns (Lea et al 2006), as well as the lack of cooking skills related to
preparing legumes (Messina 2014). Although studies have found that the consumption of diets
which are healthier cost more than less healthy diets (Rao, Afshin, Singh & Mozaffarian (2013),
cost has not been shown to be a challenge when adopting a vegetarian or vegan diet (Lea et al
2006; Lea & Worsley 2003b).
The study by Turner-McGrievy, Leach, Wilcox & Frongillo (2016) conducted in the USA,
investigated the differences in environmental impact and food expenditures of four different
plant-based diets and an omnivorous diet among 63 adults for a six months weight-loss

27
intervention. For this time, the respondents were randomised to follow either a vegan,
vegetarian, pesco-vegetarian, semi-vegetarian or omnivorous diet. Respondents were
instructed to keep receipts of all food purchases at grocery stores, convenience stores, or other
stores where they had purchased their groceries and to provide an accurate total of food
expenditure. Respondents were also instructed to keep receipts of dining in restaurants
separately. Respondents repeated this for the two month and six month assessments. The study
found that baseline expenditure on groceries (p = 0.31) or changes in grocery expenditure at 2
months (p = 0.10) and six months (p = 0.10) did not significantly differ among the diet groups
even when eating at a restaurant at any point. It was also found that diets that relied on legumes
for protein, can be less expensive that diets that include dairy and legumes, dairy and poultry,
dairy and seafood or dairy and red meat.
Dietary interventions should be aimed at shifting individuals to follow a more plant-based
eating pattern, educate the public on how to select low-cost foods for the preparation of meals
and favouring non-animal protein sources that cost less, such as legumes. Therefore, the
adoption of vegan and vegetarian diets could result in reduced spending on meat for vegans;
eggs and dairy (Turner-McGrievy et al 2016). In order for individuals to continue maintaining
following a vegan diet in a society where consuming animal products is a norm, requires an
individual to have a conscious behaviour. Vegan consumers have restricted options for
spontaneous decisions related to food, especially when eating at a restaurant (Emre 2016). In
the study by Katcher, Ferdowsian, Hoover, Cohen & Barnard (2010), conducted in the United
States, found that a worksite vegan nutrition program is well-accepted and improves health-
related quality of life and work productivity. The respondents were employees from a major
insurance company (n = 113). One group of respondents were given instructions on how to
follow a low-fat vegan diet (n = 68) and the other received no dietary instructions (n = 45) for
22 weeks. The vegan group reported a reduction in food costs (p = 0.003) and an increased
difficulty in finding food options when eating out (p = 0.04), when compared to the control
group.
Vegetarian and vegan diets are increasing, which results in the demand for meatless options
(Greenway 2010). It has been commonly argued that restaurants often do not effectively
address and utilise this important developing trend, regardless of the financial challenges and
increase in competition within the restaurant industry (Shani & DiPietro 2007). The addition
of vegetarian and vegan meal options in restaurants is one of the top suggested strategies to
improve business. However, it should also be noted that catering to this group of patrons is a

28
complex task, as it requires managerial skills which are knowledge-based that rely on the
comprehensive understanding of the vegetarian segment and its unique characteristics.
Restaurant staff are required to become familiar with vegan and vegetarian techniques of
cooking, creating recipes that are attractive and the handling of meat-free ingredients (Licata
2009). In South Africa vegan and vegetarian diets are on the rise and the country is also a
popular tourist destination, therefore local restaurants should be catering to a wider variety of
consumers to address the growing demand and trends toward meat-less food options.
2.5 Definition of a vegan diet and its nutritional components
Vegetarian, semi-vegetarian and vegan diets are becoming progressively more popular. A
vegan diet involves the exclusive restriction to consume only plant-based foods, whereby all
animal food and derivatives are completely avoided (Richter, Boeing, Grunewald-Funk,
Heseker, Kroke, Leschik-Bonnet, Oberritter, Strohm & Watzl 2016). Even though the vegan
diet is associated with several good health outcomes, the severity of this strict dietary pattern
still remains a concern (Craig 2009). Without a doubt, there are perceptions that the vegetarian
diet, particularly the vegan diet is lacking significant nutrients including vitamin B12, iron,
calcium and protein (Rizzo et al 2013; Deriemaeker, Alewaeters, Hebbelinck, Lefevere,
Phillipaerts & Clarys 2010).
The vegan diet may include legumes, vegetables, nuts and seeds, essential plant-oils, fruit or
whole-grain food products and all of these food groups have been shown to be beneficial to
health (Boeing, Bechthold, Bub, Ellinger, Haller, Kroke, Leschik-Bonnet, Muller, Oberritter,
Schulze, Stehle & Watzl 2012). The food products consumed in a vegan diet are not necessarily
nutritious or beneficial for health. Particularly if the diet comprises of increased levels of fat,
table salt or sugar added to vegan meals (Richter et al 2016).
In recent years, there has been an increase in processed food products available to suit food
preferences of vegans, this has improved the supply of food for those following a vegan diet.
In July/August 2013, approximately 90% of the 852 vegans who participated in an online
survey in Germany, stated that it had become much easier to follow a vegan in recent years
(Kerschke-Risch 2015). Due to the increasing demand of vegan food, a range of replacement
and convenience vegan foods are now available in the market, including meat and cheese
substitutes. This has been created to respond to vegan consumers and their desire for a wider
variety of choices and to create familiar dishes (Hauner 2015). Some of the vegan food products
are greatly processed with numerous artificial additives, and the nutritional significance of these

29
additives raises concerns. However, if these foods are fortified with various micronutrients, it
can provide adequate nutrient quality in the vegan diet (Leitzmann 2003). Therefore, a number
of tools were created to assist vegetarians and vegans in selecting food groups, the quantities
that should be consumed and how to plan their meals in order to sustain a healthy diet (Messina,
Melina & Mangels 2003).
2.5.1 Vegetarian food guide pyramid
In 2003, a vegetarian food guide in the form of a pyramid was created to illustrate food groups
and serving sizes for all types of vegetarian diets. These guides were also used for those
following a vegan diet. The guide consisted of the following food groups: grains, protein foods,
vegetable, fruit, legumes, nuts, fats and calcium rich foods (Messina et al 2003). Figure 2.2
shows the vegetarian food guide pyramid.
Figure 2.2: Illustration of the vegetarian food guide pyramid (after Messina et al 2003)
There are supporting guidelines to assist the individual in planning a meal when using the
pyramid. These guidelines are as follows (Messina et al 2003):
Choose a variety of meals.

30
The number of serving sizes is minimum daily intakes. Choose more foods from any
group to meet energy requirements.
A single serving from the calcium-rich food group should provide 10% of daily
requirement for an adult. Choose eight or more servings from this group per day.
Canola and olive oil are the best fats that should be used for cooking. Include two
servings of daily of fats that contain omega-3 fatty acids.
It is important to gain adequate vitamin D from sunlight and fortified food sources or
supplements.
Include at least three good sources of vitamin B12 in the diet.
If sweets and alcohol is included in the diet, consume in moderation.
Vegan diets exclude animal products, therefore specific guidelines are required for the adequate
consumption of vitamin B12, which were not included in the pyramid. Plant foods have
insufficient vitamin B12 therefore a regular and reliable source should come from foods
fortified with vitamin B12, vitamin B12 supplements or both. Some vegetable-protein food
products, ready-to-eat cereals, nutritional yeasts and milk alternatives are now fortified with
vitamin B12 (Haddad, Sabaté & Whitten 1999b). Although, the pyramid showed the
constituents of a healthy diet, it does not emphasise the need for daily physical activity and how
to maintain a healthy body weight, and individuals had a difficult time understanding the
recommendations (McCullough, Feskanich, Stampfer, Giovannucci, Rimm, Hu, Spiegelman,
Hunter, Colditz & Willet 2002). Meal planning was also difficult as the pyramid included too
many recommended servings with large portions in each meal. Finally, although the fat group
was at the apex of the pyramid indicating that it is a small component of a healthy diet, fat is
also a significant component found in other food groups such as nuts, seeds and meat analogues
(Kahlon 2006).
2.5.2 The vegan plate
In 2014, a vegan plate guide was developed by the Academy of Nutrition and Dietetics and the
Dieticians of Canada. This plate consisted of five food groups namely: grains, nuts and seeds,
legumes, vegetables and fruits (Davis & Melina 2014). At the centre of the plate, calcium rich
foods were shown. Other essential nutrients were also illustrated such as omega-3, vitamin
B12, vitamin D and iodine. Figure 2.3 shows an illustration of the vegan plate and Table 2.2
shows guidelines on planning meals and eating healthy using the vegan plate.

31
Figure 2.3: Illustration of the vegan plate (Davis & Melina 2014, p434).

32
Table 2.2: The Vegan Plate Guidelines (Davis & Melina 2014, p435)
Food group and
serving sizes per
day
Foods in this group
with serving size
Calcium rich foods with
serving size
Additional notes
Vegetables:
5 or more serving
½ cup (125ml) raw or
cooked vegetables
1 cup (250ml) raw
leafy vegetables
½ cup (125ml)
vegetable juice
1 cup (250ml) cooked bok
choy, broccoli, collard
greens, kale, mustard
greens, napa cabbage or
okra
2 cups (500ml) raw bok
choy, broccoli, collard
greens, kale, mustard
greens or napa cabbage
½ cup (125ml) calcium-
fortified tomato or
vegetable juice
Include at least 2
daily servings of
calcium-rich
greens.
Choose from the
full rainbow of
colourful
vegetables: purple,
blue, green, yellow,
orange, red and
white.
Fruit:4 or more
servings
½ cup (125ml) fruit or
fruit juice
¼ cup (60ml) dried
fruit
1 medium fruit
½ cup (125ml) calcium-
fortified fruit juice
¼ cup (60ml) dried figs
2 oranges
Fruit are excellent
sources of
potassium.
Enjoy the full
spectrum of
colourful fruits and
make them your
sweet treats.
Legumes:
3 or more
servings
½ cup (125ml) cooked
beans, peas, lentils,
tofu or tempeh
1 cup (250ml) raw
peas or sprouted lentils
or peas
¼ cup (60ml) peanuts
1 cup (250ml) black or
white beans
½ cup (125ml) fortified soy
milk or soy yoghurt
½ cup (125ml) calcium-set
tofu (look for calcium in
the ingredient list), cooked
soy beans or soy nuts
Legumes are great
sources of protein,
iron and zinc with
an average of 7 to 9
grams of protein per
serving.
Include a selection
from this group at
most meals.
Grains:
3 or more
servings
½ cup (125ml) cooked
cereal, pasta, quinoa,
rice or other grain
1 ounce (28g) bread
½ cup (125ml) raw
corn or sprouted
quinoa, buckwheat or
other grain
1 ounce (28g) cold
cereal
1 ounce (28g) calcium-
fortified cereal or bread
1 calcium-fortified tortilla
Select whole grains
as often as possible.
Adjust the number
of grain servings to
suit your energy
needs: some need
many more
servings.
Some fortified
cereals and tortillas
are particularly high
in calcium
Nuts and Seeds:
1 or more
servings
¼ cup (60ml) nuts or
seeds
2 tablespoons (30ml)
nut or seed butter
¼ cup (60ml) almonds
2 tablespoon (30ml)
almond butter or sesame
tahini
Seeds and nuts
contribute copper,
selenium, other
minerals, vitamin E
and fat.
Choose some that
are rich in omega-3.

33
2.5.3 The VegPlate
The Academy of Nutrition and Dietetics in the USA released its latest position paper on
vegetarian diets in December 2016. This paper reinforced that well-planned vegetarian diets
should be suitable for all stages of life and be nutritionally adequate and healthful. The diet
should provide health benefits in the treatment and prevention of chronic diseases and result in
the least environmental damage (Melina, Craig & Levin 2016). A new Mediterranean VegPlate
was created according to the Italian dietary reference intakes (DRI). The plate is for adult
vegans and vegetarians as well as pregnant and lactating females. The plate is based on six
food groups, namely; protein-rich foods, grains, vegetables and fruit, seeds and fats. Table 2.3
shows the serving sizes of foods from the different groups of the VegPlate and their calcium
content. A variety of plant foods with importance given to certain critical nutrients are the most
crucial recommendation to achieve adequacy of the diet. Diary and eggs are considered
optional depending on the diet (Baroni, Goggi & Battino 2018). Figure 2.4 shows the basic
structure of the VegPlate model (A), this is for adults and pregnant and lactating females, the
small plates (B) added to the big plate which shows pregnant and lactation for the second
trimester (P2), third trimester (P3) and lactating (L).
Figure 2.4: Illustration of the VegPlate Model (Baroni et al 2018)

34
Table 2.3: Serving sizes and calcium content of foods from the VegPlate (Baroni et al
2018)
Food group Foods
(Calcium content per serving)
Serving size (household measures)
1. Grains Bread, crackers (whole flour) 30g (1 regular slice)
Whole cereal grains 30g, dry (1 ½ Tbsp)
Pasta, bulgur, couscous 30g, dry (1/3 cup)
Popcorn 30g, cooked (4 cups)
Ready-to-eat cereals 30g (3/4 cup)
Non-dairy milk made from cereals
(enriched with calcium, 240
milligrams (mg) **)
200ml (1 cup)
Potatoes 120g (1 egg-sized potato)
2. Protein-rich foods Legumes (soy beans 77mg*) 30g, raw (2 Tbsp)
Tofu (84 mg *), Tempeh (96mg *) 80g, 1/3 cup
Meat substitutes (with soy or gluten) 30g (3 regular slices)
Soy (enriched with calcium
240mg**) or cow’s milk (240mg **)
200ml (1 cup)
Soy (enriched with calcium 160mg
**) or
cow’s yoghurt (160mg **)
125g (1 single-serve container of
125g)
Eggs 60g (one, medium)
Cheese (165 mg *) 30g (1/3 cup)
3. Vegetables Cooked or raw vegetables (artichoke
86 mg*, broccoli 72 mg*, cardoon
96*, chicory 150 mg*,endive 93
mg*, rocket 160 mg*, garden cress
131 mg*, green radicchio 115 mg*,
taraxacum 187 mg*, turnip greens 97
mg*, watercress 170 mg*)
100g
Vegetables juice 100 ml (½ cup)
4. Fruits Raw fruit 150g (one, medium)
Cooked or sliced fruit 150g
Dry fruit (figs 84mg *) 30g
Fruit juice 150ml (3/4 cup)
5. Nuts and seeds Nuts and seeds (almonds 71mg*,
sesame 293 mg*)
30g (3 Tbsp)
Nuts and seed butter (almonds
71mg*, sesame 293mg *)
30g (3 Tbsp)
6. Fats Oil, mayonnaise and soft margarine 5g (½ Tbsp)
7. Calcium-rich
foods
*One serving of calcium-rich foods
**Two servings of calcium-rich
foods
Tap water, calcium 100mg/L
(125mg*)
Mineral water, calcium 350mg/L
(125mg*)
1,250 mL
350 mL
8. Omega-3 rich
foods (belonging
to group 5 and 6)
Flaxseed oil 5g (½ Tbsp)
Flaxseeds, to be consumed ground 10g (1 Tbsp)
Chia seeds, to be consumed ground 15g (1 ½ Tbsp)
Walnuts 30g (3 Tbsp)

35
The food groups included in the VegPlate model are as follows (Baroni et al 2018):
Grains: Wheat, corn, rice, millet, rye, barley, spelt, oat, buckwheat and their
derivatives (bread, pasta and rice milk) and potatoes.
Protein-rich food: Beans, chickpeas, lentils, fava beans, peas, soy beans and their
derivatives (tofu, tempeh and soymilk). Dairy products and eggs, although included in
this group, there foods were not considered for the calculations.
Vegetables: Twenty five of the most common type of vegetables in Italy.
Fruit: Eighteen most common type of fruit in Italy.
Nuts and seeds: Almonds, flax seeds, sesame seeds, sunflower seeds and walnuts.
Fats: Olive and flaxseed oils.
Calcium-rich foods group: Including the foods richest in calcium from all of the
previous groups, except for fats.
Omega- 3 (n-3) fatty acid rich foods group: Including foods highest in omega-3 fatty
acids from the fats and the nuts and seeds groups.
It is important that vegans and vegetarians receive practical information to achieve the best
dietary planning to meet nutritional requirements. The VegPlate is an easy tool to plan vegan,
vegetarian and lacto-ovo vegetarian diets. The tool provides detailed serving suggestions and
specific advice for managing critical nutrients in the diet (Baroni et al 2018). The number of
servings using the VegPlate for adults and pregnant and lactating females can be seen in Table
2.4.

36
Table 2.4: Number of servings using the VegPlate model (Baroni et al 2018)
Kilocalories
(kCal)
Grains Protein-
rich
foods
Vegetables Fruit Nuts
and
seeds
Fats Calcium-
rich
foods (a)
Omega-
3 Fatty
Acid
foods
(b,c)
VegPlate for adults
1,200 5 3 6 1 1 1 6 2
1,400 7 3 6 1 1 1 6 2
1,600 8 3 6 1.5 1.5 1 6 2
1,800 9 3 6 2 2 1 6 2
2,000 10 3 6 2.5 2 2 6 2
2,200 11 3 6 3 2.5 2 6 2
2,400 12 3 6 3 3 2 6 2
2,600 13 3 6 3.5 3 3 6 2
2,800 14 3 6 4 3 4 6 2
3,000 15 3 6 4.5 3 5 6 2
3,200 16 3 6 5 3 6 6 2
VegPlate for pregnancy and lactation
1,800 9 3 6 2 2 2 6 2
2,000 10 3 6 2.5 2 3 6 2
2,200 11 3 6 3 2 4 6 2
2,400 12 3 6 3 2.5 5 6 2
2,600 13 3 6 3.5 2.5 6 6 2
2,800 14 3 6 4 2.5 7 6 2
3,000 15 3 6 4.5 3 8 6 2
3,200 16 3 6 5 3 9 6 2
Additional servings, d 2nd trimester of pregnancy (P2)
260 0.5 0.5 0 1 0.5 0 - -
Additional servings, d 3rd trimester of pregnancy (P4)
500 1.5 2 0 0 1 0 - -
Additional servings, d Lactation (L)
500 1.5 1.5 0 0.5 1 0 - - a. This total number of servings must be consumed as calcium-rich foods from the other food groups.
b. Of which at least one serving of flaxseed oil.
c. The number of servings of omega-3 enriched foods must be included in the total number of servings of nuts
and seeds or fats.
d. To be added to the servings already set for the VegPlate for pregnancy and lactation.
2.6 Nutritional quality of the vegan diet
A current approach to measure the overall quality of diets is the use of indices to measure
dietary pattern analysis as an alternative to the more detailed nutrient methodology (Hu 2009).
The analysis of dietary patterns is a complimentary process to observe the outcome of a
particular diet: food and various nutrients are not eaten separately, and the “single food or
nutrient” method will not consider the multifaceted interactions among food and nutrients (Hu
2009). There are a limited number of studies that use indices to measure dietary quality and to
compare restricting diets with omnivorous diets. However, none of these studies investigated

37
a distinct set of vegan respondents and the results of these studies were indefinite (Clarys,
Deriemaeker, Huybrechts, Hebbelinck & Mullie 2013; Farmer, Larson, Fulgoni, Rainville &
Liepa 2011; Kennedy, Ohls, Ma & Fleming 1995).
A vegan diet must be balanced and well-planned in order for it to be consistent with good health
outcomes. A varied vegetarian and vegan diet can lessen the possibility of chronic diseases
(White & Frank 1994). However, it is important to take care during the adolescent years as
there is an increased demand for nutrients needed by the body. There should be sufficient
intakes of total energy, vitamins and minerals. Vegans are recommended to sustain a diet with
a range of vegetarian foods and to make certain that there are sufficient intakes of protein,
calcium, zinc, iodine, iron, riboflavin, selenium, vitamin D and vitamin B12 by consuming
enriched foods or supplements (Elorinne et al 2016).
A study by Clarys, Deliens, Huybrechts, Deriemaeker, Vanaelst, De Keyzer, Hebbelinck &
Mullie (2014) conducted in Belgium with 1475 respondents consisting of vegans (n = 104),
vegetarians (n = 573), semi-vegetarians (n = 498), pesco-vegetarians (n = 145) and omnivores
(n = 155), found that when compared to the omnivorous diet, the nutritional intake of vegans is
similar to that of earlier research. Vegans had a lower energy intake when compared to other
diets. The vegan group was also found to have a reduced dietary protein and cholesterol intake,
a reduced total fat, saturated and mono-unsaturated fatty acids (MUFA) intake and low sodium
and alcohol intake compared to the omnivorous group (p < 0.01). Saturated fat daily intake in
vegans was 21 g a day compared to 54 g for omnivores (p < 0.01). Vegans had the highest
consumption of dietary fibre, iron and poly-unsaturated fatty acids (PUFA). Sugar and
carbohydrate intakes were the same across all diets, while relative consumption was highest in
vegans and lowest in the omnivorous diet. This shows that higher carbohydrate consumption
may lead to improved macronutrient distribution in restrictive diets (Key et al 2009). It is
known that fruit is an important contribution to sugar and carbohydrate intake in more
restrictive diets, as consumption of fruit is typically higher (Craig 2009). Less healthy sources
of sugar (for example cookies, cakes, sweets and chocolate) most often contain animal products,
which allows a limited availability to vegans (Larsson & Johansson 2002). Interestingly
sodium intake in vegans was less than half when compared to the intake by omnivores, while
vegans reached only half of the values for required calcium intake (Clarys et al 2014).

38
Currently, it is much easier for vegans to compile a suitable vegan diet compared to many years
ago (Craig, Mangels & American Dietetic Association 2009). This is due to the growth and
adaptability of the vegan market. In addition, as the variety of fortified foods have increased,
new vegetarian and vegan convenience foods as well as nutritional supplements are now readily
available. There is also an increased awareness on how to appropriately plan vegan diets (Craig
et al 2009).
A large cohort study conducted on 199 944 respondents in the United Kingdom by Bradbury,
Tong & Key (2017), investigated the dietary consumption of high-protein foods and other major
foods among regular meat-eaters, low meat-eaters, poultry-eaters, fish-eaters, vegetarians and
vegans. In the study, respondents were classified as meat-eaters if they consumed red meat
including beef, lamb and pork more than three times a week and low-meat eaters if they
consumed red meat three or less than three times a week. Poultry-eaters reported consuming
no red meat or processed meat but did report consuming poultry while fish-eaters did not report
consuming red meat, processed meat or poultry and reported consuming at least one oily fish
or other fish. In the study, it was found that in the vegan group (n = 248), plant milk provided
2 - 3% of the total energy, while meat substitutes, legumes and nuts provided about 10% of
total energy. Therefore, the contribution that plant-based milks and meat substitutes make
towards the nutritional quality of the vegan diet will be further discussed in this section. Table
2.5 shows the studies that assessed the nutritional quality of the vegan diet and their findings.

39
Table 2.5: Studies assessing the nutritional quality of the vegan diet
Authors Objectives
Respondents Methodology Results Conclusion
Menal-Puey,
del Ruste &
Marques-
Lopes (2018)
Spain.
To determine and
evaluate the
dietary intake of
Spanish vegan
and vegetarian
population.
n = 102
Vegans:
n = 40
Vegetarians:
n = 62
A semi-
quantitative
food frequency
questionnaire
was developed
to assess
dietary
assessment.
Vegan respondents
showed higher
energy and fibre
intakes when
compared to
vegetarians.
Vegans showed
considerably
higher poly
unsaturated fatty
acids.
Vitamin B12
intake was lower in
vegans than
vegetarians.
The diet of both
vegans and
vegetarians were
well-balanced
with regards to
fibre and
macronutrients.
Vitamin B12 and
vitamin D intakes
should be
increased in both
diets.
Allès,
Baudry,
Méjean,
Touvier,
Péneau,
Hercberg &
Kesse-Guyot
(2017)
France.
To describe the
socio-
demographic and
nutritional
characteristics of
self-reported,
adult vegetarians
and vegans,
compared to
meat-eaters, from
the French
NutriNet-Santé
study.
n = 93 823
Vegans:
n = 789
Vegetarians:
n = 2370
Meat-eaters:
n = 90 664
Web-based
self-
administered
24-hour dietary
recalls via
interactive
interface.
Vegans had the
lowest total energy
intake and mean
contribution of
total proteins, total
lipids and saturated
fatty acids.
Vegans had the
highest
contribution of
polyunsaturated
fatty acids, plant
proteins and
simple and total
carbohydrates.
The vegan group
consumed the
highest fibre and
lowest dietary
intake of vitamin-
D and vitamin B-
12.
Overall
vegetarians and
vegans had better
macronutrient
composition and
diet quality. The
consumption of
meat substitutes
and nutrient
supplementation
should be
considered as
there are concerns
related to zinc,
iron and vitamin
B12 especially
among vegans.

40
Table 2.5: Studies assessing the nutritional quality of the vegan diet continued
Authors Objectives
Respondents Methodology Results Conclusion
Elorinne et al
(2016)
Finland.
To compare
dietary intake
and nutritional
status of Finnish
long-term vegans
and non-
vegetarians.
n = 41
Vegans:
n = 22
Non-
vegetarians:
n = 19
Dietary
consumption
and the use of
supplements
were estimated
using a 3 day
dietary record.
Nutritional
status was
evaluated by
measuring
biomarkers in
serum, plasma
and urine
samples.
The results showed
no significant
difference in total
energy
consumption
among the two
group.
However, there
were variances in
other nutrient and
essential nutrient
intakes.
Vegans consumed
significantly less
vitamin B12,
vitamin D, niacin,
saturated fat and
cholesterol (all
p<0.001).
Nutritional
education and
guidance is
important to
vegans and vegan
diets should be
regularly
supplemented
with essential
nutrients.
More prominence
should be placed
on iodine and
vitamin D to
ensure
requirements are
met. This will
contribute to a
more favourable
fatty acid and
lipid profile in
vegans.
Clarys et al
(2014)
Belgium.
To compare the
quality and the
contributing
components of
the vegan,
vegetarian, semi-
vegetarian,
pesco-vegetarian
and omnivorous
diet
n = 1475
Vegans:
n = 104
Vegetarians:
n = 573
Semi-
vegetarians:
n = 498
Pesco-
vegetarians:
n = 145
Omnivores:
n = 155
Cross sectional
online survey
with 52-item
FFQ
Healthy Eating
Index 2010
(HEI-2010)
and
Mediterranean
Diet Score
(MDS) was
calculated as
indicators for
diet quality
Vegans had a
lower energy
intake compared to
other diets.
The vegan group
had a lower total
fat consumption,
saturated and
mono-saturated fat,
dietary cholesterol,
dietary proteins,
alcohol (all
p<0.01)
Vegan group had
the lowest calcium
and highest iron,
dietary fibre and
poly-unsaturated
fatty acids.
Both the HEI-
2010 and MDS
indicated that the
vegan diet is the
most health diet
after estimating
the overall diet
quality.

41
Table 2.5: Studies assessing the nutritional quality of the vegan diet continued
Authors Objectives
Respondents Methodology Results Conclusion
Waldmann et
al (2003)
Germany.
To evaluate the
dietary intakes
and lifestyle
factors of
German vegans.
Vegans:
n = 154
A pre- and
main
questionnaire
with a two 9-
day food
frequency
questionnaires
and blood
sampling.
Overall energy
intake was in
proportion to the
total energy intake.
Protein
consumption was
at a low level.
Saturated,
monounsaturated,
and
polyunsaturated
fatty acids was in
line with current
recommendations.
Iron, vitamin B12
and calcium was
not within
recommended
values.
Vegans in this
study had an
above average
healthy lifestyle
and followed a
diet which was
well-balanced
with a high
density of
nutrients.
The intake of
calcium,
cobalamin and
iron needs to be
improved and
strict vegans
should consider
supplementation
of these vitamins
and minerals.
Larsson &
Johansson
(2002)
Sweden.
To compare the
dietary intake
and nutritional
status of young
Swedish vegans
and omnivores.
n = 60
Vegans:
n = 30
Omnivores:
n = 30
Diet history
interview to
measure
dietary intakes.
Blood samples,
doubly labelled
water method
and 24-hour
urine excretion
measures were
also used.
Energy intake from
the diet-history
was
underestimated
when compared to
the doubly labelled
water and urine
excretion.
Vegans consumed
below average
requirements of
selenium,
riboflavin, vitamin-
D, vitamin B12
and calcium.
The intake of
selenium and
calcium remained
low even with the
addition of dietary
supplements.
The dietary
patterns of vegans
varied
substantially and
were not in
accordance with
the average
recommendations
for some required
nutrients.

42
Table 2.5: Studies assessing the nutritional quality of the vegan diet continued
Authors Objectives
Respondents Methodology Results Conclusion
Haddad,
Berk,
Kettering,
Hubbard &
Peters (1999a)
United States.
To evaluate the
dietary and
nutritional status
of individuals
consuming a
vegan diet by
using
biochemical,
hematologic, and
immunologic
methods in
comparison with
a non-vegetarian
group.
Total n = 45
Vegans: n =
25
Non-
vegetarians:
n = 20
Four-day
dietary records
were
completed and
fasting,
peripheral
venous blood
samples were
taken from
both groups.
Vegan females
consumed more
dietary fibre and
less dietary
cholesterol.
They also
consumed
significantly lower
intakes of protein,
total fat, saturated
fat and
monounsaturated
fat both in quantity
and percentage of
energy intake when
compared to non-
vegan females.
The intakes of
vegan males
showed similar
trends.
Further research is
required to
explain the
associations
between diet,
body weight, and
immune function
processes in
healthy
individuals.
In order to guide health and nutrition professionals with dietary assessment of either groups or
individuals, dietary reference intakes (DRIs) are used. The term DRI refers to a set of four
reference values which are nutrient-based that represent an approach adopted by the Food and
Nutrition Board to provide quantitative estimations of nutrient consumption for the use in
assessment and planning of diets for healthy individuals. When sufficient information is
accessible, each nutrient has a set of DRIs. A particular nutrient can either have an estimated
average requirement (EAR), a recommended dietary allowance (RDA) or an adequate intake
(AI). In addition, many nutrients may also have a tolerable upper intake level (UL) (Murphy
& Poos 2002). It can be appropriate to compare individual nutrient intake with specific DRIs,
however, nutrient intake information alone cannot be used to determine the nutritional status.
The assessment of the diet is only one component of the assessment of nutritional status, on
condition that the dietary intake is collected accurately, the correct DRI is chosen and the results
are appropriately interpreted. However, in order to provide a valid assessment of the nutritional
status of an individual, it is preferred that dietary intake information is combined with
anthropometric, biochemical and clinical information (Murphy & Poos 2002).

43
Many South African studies have used DRIs to assess the nutritional status of individuals and
prevalence of nutritional deficiencies among groups of individuals including children. For
example, Kolahdooz, Spearing & Sharma (2013), conducted a study in a rural community in
KwaZulu-Natal, South Africa, consisting of 137 men and women and used AIs to determine
the nutritional adequacy of the study population. Daily nutrient intakes and energy values were
compared with the appropriate indications for all males and females over the age of 19 years.
When age and gender was available, dietary adequacy was calculated and used to determine
EARs. Similarly, Schutte, van Rooyen, Huisman, Kruger, Malan & De Ridder (2003), who
conducted the Thusa Bana study in South Africa, consisting of 694 Black African children
between the ages of 10 to 15 years, used the dietary intakes and compared this against the RDAs
for specific nutrients in the study. The RDA cut-offs used for the Thusa Bana study was
obtained from the Institute of Medicine, Food and Nutrition Board, Dietary Reference Intakes
document from the year 1998. The current RDAs are particularly important in identifying
nutritional deficiencies among high-risk groups including vegans and vegetarians. Many
international studies have compared the dietary intake of vegans and vegetarians to DRI’s
(Dyett, Rajaram, Haddad & Sabate´ 2014; Ströhle, Ströhle, Waldmann, Koschizke, Leitzmann
& Hahn 2011; Dunn-Emke, Weidner, Pettengill, Marlin, Chi & Ornish 2005).
2.6.1 Nutrient deficiencies in the vegan diet
According to Fields, Ruddy, Wallace, Shah, Millstine & Marks (2016), vegans are at increased
risk for many deficiencies such as protein, omega-3 fatty acids, calcium, vitamin D, iron and
vitamin B12. Health care professionals need to encourage vegan patients to consume a variety
of nutrients sources to meet recommended levels as seen in Figure 2.2.
2.6.1.1 Vitamin B12
Plant foods are comprised of an insufficient quantity of vitamin B12 and vegans have a
difficulty reaching the recommended dietary allowance (RDA) of 2.4 micrograms (μg) and
maintaining acceptable blood values of vitamin B12 (Fields et al 2016). Mandry, Lisowska,
Grevowiec & Walkowiak (2012) conducted a five year prospective study of twenty omnivores
in Poland, who changed to a strict vegan diet for five years. Half of the respondents consumed
natural products while the other half consumed foods fortified with vitamin B12. Vitamin B12
serum levels were taken before and 6, 12, 24 and 60 months after implementing the diet. The
results showed a significant decrease (p < 0.0002) in serum B12 levels in the whole study group
after 60 months of following the diet, however the group consuming natural products showed

44
lower levels of B12 when compared to the group consuming fortified B12 food products (p <
0.0001). Therefore, it can be noted that the transition from an omnivorous to a vegan diet can
be associated with an increased risk of vitamin B12 deficiency (Mandry et al 2012).
A cross sectional study by Gilsing, Crowe, Lloyd-Wright, Sanders, Appleby, Allen & Key
(2010), conducted in the United Kingdom involving 689 men (226 omnivores, 231 vegetarians
and 232 vegans), found that 52% of vegans, 7% vegetarians and one omnivore were vitamin
B12 deficient. Interestingly, there was no significant association between age and the duration
of adherence to a specific diet and serum vitamin B12 levels. It is important to consider the
occurrence of vitamin B12 deficiency in vegans and health care professionals should advise
vegans to consume supplemental vitamin B12 or foods fortified with vitamin B12. Vitamin
B12 levels should be periodically monitored to ensure sufficient intake (Fields et al 2016).
Foods fortified with vitamin B12 include some breakfast cereals, soy products, plant-based
milks and yeast extract which can assist in preventing a deficiency (Gilsing et al 2010).
2.6.1.2 Iron
One of the most common nutrient deficiencies globally is iron deficiency anaemia (Waldmann
et al 2003). Even though the haemoglobin levels in vegans may be unexpectedly higher than
the levels seen in omnivores, the levels of ferritin which stores iron, is reduced in vegans (Craig
2009). The vegan diet consists of nutrients to inhibit and enhance the absorption of iron such
as phytates and organic acids, respectively, resulting in fluctuating iron levels (Clays et al 2014;
Waldmann, Koschizke, Leitzmann & Hahn 2004). Iron deficiency prevalence is more common
in young woman following a vegan diet (Waldmann et al 2004). Fields et al (2016),
recommends that periodic assessments of iron status is conducted for all vegans especially
vegan woman of childbearing age and children. Vegans should be encouraged by health care
professionals to consume supplements with food that enhance iron absorption.
2.6.1.3 Calcium and vitamin D
Many studies have shown reduced intakes of calcium and vitamin D in the vegan diet
(Waldmann et al 2004; Parsons, van Dusseldorp, van der Vliet, van de Werken, Schaafsma &
van Staveren 1997). Several studies have demonstrated lower bone mineral density (BMD) in
vegans compared to non-vegans (Parsons et al 1997). When dietary calcium consumption is
reduced, calcium absorption in the gastrointestinal tract increases. Low animal protein
consumption reduces the excretion of renal calcium. Therefore, a vegan diet might lessen
negative skeletal effects. Increased alkalinity, vitamin K & phytoestrogens in the vegan diet

45
are believed to improve BMD. Health care professionals recommend that adult vegans have a
daily intake of at least 525 mg of calcium and 15 μg of vitamin D (Fields et al 2016).
2.6.1.4 Omega-3 fatty acids (EPA and DHA)
The human body is unable to make two essential fatty acids which has to be obtained from the
diet namely: linoleic acid (LA) and alpha-linolenic acid (ALA). The main constituent of many
vegetable-based oils is linoleic acid; as a result, vegans need to include vegetable fat in their
diet in order to avoid a fatty acid deficiency. ALA can be found in many vegan foods such as
flax seeds, walnuts, soy, soybean and canola (rapeseed) oil. There are two additional fatty
acids, eicosapentaenoic acid (EPA) and docosahexaenoic acid (DHA). Vegans would need to
consume large amounts of seaweed, walnuts, flax and chia seeds in order to attain both fatty
acids in the diet, therefore they are reliant on the production of EPA and DHA from ALA. Both
EPA and DHA are lacking in the vegan diet. The health outcomes of reduced levels of EPA
and DHA continues to be a concern, as both play an important role in metabolism. This includes
EPA’s effect on the aggregation of platelets (via thromboxane) and inflammation (via
leukotrienes) and the effect of DHA on visual and overall brain functioning. Health care
professionals can advise patients to consume DHA supplements which are plant-based such as
those made from algae (Fields et al 2016). Table 2.6 shows the summary of nutrients found in
common vegan food sources.
Table 2.6: Vegan sources and nutrients (Fields et al 2016)
Nutrient Vegan Sources
Vitamin B-12 Fortified soy and rice milk, cereals, meat substitutes,
nutritional yeast and supplements.
Calcium Collard greens, fortified plant milks and juices,
blackstrap and molasses.
Vitamin D Fortified plant milk and ultraviolet B-exposed
mushrooms
Iron Tofu, soy beans, collard greens, lentils and spinach.
Essential amino acids Legumes, buckwheat, hempseed, chia, soy and quinoa.
Omega- 3 fatty acids (EPA and DHA) Walnuts, flax seed, chia and algae (EPA and DHA).

46
2.6.2 Meat substitutes
Food decisions not only impact on one’s well-being but the sustainability of ecosystems. At
present, systems in place for food and meat production especially in the Western society, places
a substantial burden on the environment. Besides the negative environmental impact, there is
a rise in pollution of the water, soil and air from the inadequate transformation of feed into meat
from animals. For example, one kilogram of meat needs 3-10 kilograms of grain to be consumed
by the animal (Tilman, Cassman, Matson, Naylor & Polasky 2002). According to Post (2012),
there are three major concerns associated with the production of meat. The first concern is
environmental issues regarding the reduction of natural resources, deforestation and pollution.
The second concern is the issue of animal welfare, which involves the unethical and cruel
treatment of animals during the growing, transporting and slaughtering processes. The third
concern is public health problems surrounding livestock production for human consumption.
According to Wolk (2016), scientific evidence has shown that an increased consumption of red
meat, particularly processed red meat, may be related to an increased risk of major chronic
diseases such as CVD, type 2 diabetes mellitus, cancer and increased risk of mortality. The
term ‘red meat’ includes mutton, lamb, pork, veal and beef. The red colour is formed when
myoglobin in the muscle of these meat products is exposed to oxygen and transforms into a
reddish oxymyoglobin. Processed meat is meat that undergoes different treatments to extend
its shelf-life, improve flavour, quality and colour. Therefore, processed meat usually has a
higher content of sodium and nitrates/nitrites when compared to unprocessed meat (Wolk
2016). There are a variety of types of processed meat products and it is difficult to sort them
by categories, therefore companies label them according to parameters used in manufacturing
such as curing (addition of salt and other additives), smoking, cooking drying and packaging
(Santarelli, Pierre & Corpet 2008).
Steinfeld, Gerber, Wassenaar, Food and Agriculture Organization of the United Nations (FAO),
Castel, Rosales & de Haan (2006), stated that the consumption of red meat has been a popular
topic among non-medical researchers during the last two decades. This is due to the adverse
effects that red meat production has on the climate and the environment. Red meat production
results in fossil energy use, greenhouse gas emissions and increased water use and changes in
water quality due to various livestock operations involving water pollutants (namely animal
waste products, pesticides and fertilisers). If the demand for red meat changes, there may be a
positive impact on the environment, influencing how much meat is produced. Globally, it has

47
been estimated that meat consumption may double from year 2000 to year 2050 mostly as a
result of an increase in the world population and increased per capita meat consumption
(Alexandratos, Bruinsma, Boedeker, Schmidhuber, Broca, Shetty & Ottaviani 2006).
On the other hand, meat in general is considered one of the highest quality protein sources and
is widely consumed due to its appetising taste and flavour profiles. The functionality of meat
products also contribute to the development and growth of the food industry (Joshi & Kumar
2015). However, vegetarian and vegan foods have a larger space in today’s market due to
consumers’ increasing health and environmental concerns (Craig 2010). Meat alternatives are
used in place of animal meat in these diets. These alternative meat products can be referred to
as “faux meat”, “meat substitutes”, “meat alternatives” or “meat analogues”. A meat substitute
is a product that possesses the same chemical and/or aesthetic characteristics of certain varieties
of meat (Kumar, Chatli, Mehta, Singh, Malav & Verma 2017). An important pre-requisite for
a customer to accept a meat substitute is if they can recognise the meat substitute as being a
product that can be consumed as a replacement for meat. This means that the meat substitute
should have a similar form and usage to meat. In group discussions, many consumers specified
that the appearance of a meat substitute is important, and one should know how to cook a meal
with that particular meat substitute (Elzerman, Hoek, van Boekel & Luning 2011).
Another significant feature that is essential for the acceptance of meat substitutes are the sensory
properties including texture, taste and appearance of the products. Many consumers greatly
value the texture and taste of meat (Bredahl, Grunert & Fertin 1998; Grunert 1997). The
tenderness and juiciness are especially preferred texture characteristics. In order for meat
substitutes to be accepted by meat eaters, the substitute does not have to possess the same
sensory properties, but the taste and texture should be acceptable (Hoek, Luning, Stafleu & de
Graaf 2004). These replacement meat products are in the initial phase of progress and account
for just about 1 - 2 % in the overall meat industry (De Bakker & Dagevos 2012). Nevertheless,
due to these products being cheaper as protein is originated from vegetable sources, the demand
and use of these products will certainly increase as a replacement for expensive animal proteins
(Kumar et al 2017).
The vegan diet is mostly rich in fruit, vegetables and fibre. Protein sources can be included in
the diet with the regular intake of meat substitutes. The main component of material for meat
substitutes are vegetable proteins, such as soybean, wheat glutens, peanut, groundnut globulins,
yeast and sesame. The important ingredients used to prepare the meat substitutes are

48
vegetables, nuts, pulses, cereal proteins, mycoproteins and soy protein. However, consumer
choices have widened, and this has led to the addition of new ingredients (Kumar et al 2017).
Table 2.7 shows the nutritional composition of meat substitutes compared to meat products.
Table 2.7: Nutritional composition of meat substitutes and meat products (Bohrer 2019)
Product Energy
value
(kcal)
Protein
(g)
Fat (g) Saturated
Fat (g)
Cholesterol
(g)
Total
carbohydrates
(g)
Dietary
fibre
(g)
Na
(mg)
Fe
(mg)
Meat substitute products
Beyond burger 221.24 17.70 15.93 5.31 0.00 2.65 1.77 345.13 3.72
Impossible burger 212.39 16.81 12.39 7.08 0.00 7.96 2.65 327.43 3.72
MorningStar farms grillers
original burger
203.13 25.00 7.81 0.78 0.00 12.50 6.25 609.38 1.72
Boca all American veggie
burger
140.85 18.31 5.63 1.41 7.04 8.45 5.63 492.96 2.39
Gardein meatless meatballs 166.67 15.56 7.78 0.56 0.00 10.00 3.33 355.56 8.33
Tofurky ham roast with
glaze
203.70 20.37 5.56 0.46 0.00 18.52 0.93 592.59 1.76
Quorn brand chik’n nuggets 203.39 10.17 8.47 0.42 6.78 24.58 5.93 449.15 0.72
Traditional meat products
Ground beef (93% lean, 7%
fat), uncooked/raw
152.00 20.85 7.00 2.89 63.00 0.00 0.00 66.00 2.33
Ground beef (93% lean ,7%
fat), cooked, pan-fried
182.00 25.56 8.01 3.29 84.00 0.00 0.00 72.00 2.82
McDonald’s beef patty 266.67 23.33 20.00 8.33 83.33 0.00 0.00 400.00 3.33
Tyson fully cooked home-
style beef meatballs
300.00 15.56 16.47 5.88 47.06 5.88 1.18 352.94 2.12
Hormel cure 81 classic
boneless ham
105.95 18.45 3.57 1.19 50.95 0.24 0.00 1038.10 0.83
Tyson fully cooked chicken
nuggets
300.00 15.56 18.89 4.44 44.44 16.67 0.00 522.22 0.91
2.6.2.1 Ingredients of meat substitutes
2.6.2.1.1 Soy protein
Currently, the majority of meat substitute production is produced with the use of soy beans
(Kumar et al 2017). Soy beans are also known as “soya beans” mainly in Europe, however, for
the purpose of this literature review, the term “soy” will be used. Soy bean is a plant food
which contains high biological protein and the only plant protein which contains all the essential
amino acids required by the body. It is a complete protein which regulates body processes,
repairs tissue and promotes growth (Adigbo & Maddah 2011). Kumar et al (2017) stated that
soy is known to have functional and nutritional benefits. It is commonly used to provide
complete and fractional meat replacements due to its nutrient composition and decreased risk

49
of CVD. Soy also contains about 9.3% of fibre assisting with the regulation of the digestive
tract. It is also composed of various oligosaccharides, saccharose and a small amount of starch,
therefore soy is well tolerated by diabetics (Appiah, Boateng, Darko & Boateng 2017).
According to Wardlaw & Kessel (2002), soy protein is a beneficial alternative to include in the
vegan diet where non-animal sources of protein are essential. Soy beans have a similar
biological value when compared to meat. This comparison can be seen in Table 2.8. The
beans contain LA and is a good source of calcium. ALA which is an omega-3 fatty acid is also
found in soy beans. Soy is also rich in vitamin E, B1, B2 and B6, and minerals such as
potassium, magnesium and phosphorous (Appiah et al 2017).
Table 2.8: Biological value of protein (Hoffman & Falvo 2004)
Protein type Biological Value
(BV)
Beef 80
Casein 77
Egg 100
Milk 91
Soy protein 74
Wheat gluten 64
Whey protein 104
According to Joshi & Kumar (2015), soy protein concentrates and isolates provide more
advantages to manufactures of meat substitutes when compared with minimally and
unprocessed soy protein. There is an improvement on colour and flavour of the meat substitute
as minimally processed soy protein darkens the product and generally produces a bitter flavour.
There has been speculation that majority of manufactures use a combination of non-textured
and textured soy protein when producing meat substitutes. However, current literature suggests
the use of additional protein sources as well as soy ingredients during the formulation of meat
substitutes, to improve nutrition and functional purposes of these products (Joshi & Kumar
2015: Malav, Talukder, Gokulakrishnan & Chand 2015).
2.6.2.1.2 Cereal proteins
Cereal proteins are grouped into many different categories based on the origin of the plant used
(for example: rice, oats, wheat, barley) and the extent of processing (for example: the addition
of isolates, flour, seeds, flakes) (Malav et al 2015). Wheat is the most used type of cereal

50
protein used in the production of meat substitutes, together with seitan, wheat has been used for
several centuries. Seitan, which is also known as “wheat-meat” or “wheat gluten”, is a common
meat substitute (Malav et al 2015). It is also one of the simplest and cost-effective raw materials
used in the production of vegetarian burgers, sausages, schnitzels, nuggets and minced meat
(Joshi & Kumar 2015). However, oat, barley and rice ingredients are commonly found in the
ingredient labels of new meat substitute products. Nutritionally, the carbohydrate content is
generally higher in cereal ingredients and protein content is much lower when compared with
soy (Bohrer 2019). Interestingly, protein digestibility scores of cereal ingredients are usually
lower when compared to other protein sources, due to the low protein digestibility and
suboptimal profile of amino acids. Cereal proteins have shown to have lower values of amino
acids when compared to other sources of protein. Lysine is one of those amino acids which is
limited in cereal proteins (Mota, Santos, Mauro, Samman, Matos, Torres & Castanheira 2016).
Cereal proteins have very useful functional and structural properties and is used by
manufacturers of meat substitutes. The structural network of these proteins can be described
as visco-elastic, which can assist with successful binding and necessary consistency in meat
substitutes. Cereal proteins can further provide the fibrous-like texture that is present in ground
meat substitute products (Kumar et al 2017; Malav et al 2015).
2.6.2.1.3 Legume proteins and mycoproteins
In recent years, legume proteins from pea, mung bean, lentil, chickpea, lupine and other sources,
are increasing in popularity among meat substitute manufactures (Bohrer 2019). Nutritionally,
legume proteins are typically low in methionine and digestibility is the main challenge
(Nosworthy & House 2017). Although, it is assumed that processing improves the digestibility
and availability of proteins, the protein digestibility-corrected amino acid scores (PDCAAS) of
legume products which are unprocessed is generally in the 0.40 to 0.70, and is not comparable
to animal derived proteins or proteins from soy (Huang, Wang, Sivendiran & Bohrer 2018).
The functional properties of legume proteins provide optimal complimentary function to other
protein ingredients, with distinctive processing characteristics (Kyriakopoulou, Dekkers & van
der Goot 2019).
According to Derbyshire & Ayoob (2019), mycoprotein is a fungus type product, first described
in the 1960’s as an eco-friendly protein substitute. The formulation of mycoprotein involves
various techniques of processing and fermentation. Mycoprotein can be compared to animal-
derived protein sources with a PDCAAS of 1.00 (Huang et al 2018). Functionally, mycoprotein

51
is usually combined with other ingredients, such as egg albumin, so processing characteristics
can be improved (Malav et al 2015).
2.6.2.1.4 Fat ingredients
The fat content is usually low in meat substitutes (Kumar et al 2017), however, modern meat
substitute products contain a considerably higher fat content compared to traditional meat
substitute products. In fact, the content of fat in modern meat substitutes is almost equivalent
to traditional meat products. Similar to proteins, a variety of fat ingredients is used to formulate
meat substitutes. In modern meat substitutes, fat ingredients may include sunflower oil, canola
(rapeseed oil), corn oil, coconut oil, sesame oil, cocoa butter and other sources of plant and
vegetable oils (Bohrer 2019). As discussed in a review conducted by Kyriakopoulou et al
(2019), the main role of oils and fats added to meat substitute formulations, is to contribute to
release of flavour, tenderness, juiciness and mouthfeel of the product. However, careful
consideration should be centred on the effect of these fat during the processing and preparation
in order to avoid excessive stickiness and lubrication.
Nutritionally, dietary fats and oil intake in the human diet is highly debated. Generally,
dietitians, nutritionists and government organisations (like the American Heart Association)
have recommended dietary patterns and guidelines that limit the intake of trans fats and
saturated fats and promote unsaturated fat consumption (Appel, Brands, Daniels, Karanja,
Elmer, Sacks & American Heart Association 2006). The composition of fatty acids in fats and
oils varies between manufacturing methods and sources. It is possible, that various refinement
techniques such as isomerization, pressing and fractionation can adjust the fatty acid content of
the plant-based fats and oil which are used in modern meat substitutes. Therefore,
manufacturers should be aware about the general composition of the fats and oils in modern
meat substitutes and the fatty acid breakdown in terms of saturated and unsaturated in these
products (Bohrer 2019). The comparison of fat content in meat substitutes and meat products
can be seen in Table 2.7.
2.6.2.1.5 Carbohydrate ingredients
Animal meat products do not comprise of carbohydrates, except when carbohydrates are added
during the processing of the meat product. This is common in the manufacturing of meat,
specifically emulsified processed meat products (Topping 2007). On the other hand, meat
substitutes most often contain carbohydrates. These carbohydrates can be obtained from a
variety of ingredients and can assist in different purposes during processing. Carbohydrate

52
ingredients can be characterised as flours or starches which are used to enhance and improve
the consistency and texture of the product or gums or binding ingredients, such as acacia gum,
methylcellulose, xantan gum and others, that are used to improve the form and stability of
products (Kyriakopoulou et al 2019; Kumar et al 2017; Topping 2007).
The functional purposes of these carbohydrate ingredients is to improve the interaction between
water, protein and lipid components of the processed food product in order to form a stable
structure. Nutritionally, carbohydrates can be beneficial to health with providing the body with
greater amounts of dietary fibre or unfavourable to health by consisting of more refined sugars
or starches (Viuda-Martos, Lopez-Marcos, Fernandez-Lopez, Sendra, Lopez-Vargas & Perez-
Alvarez 2010; Topping 2007). A combination of sugars, starches and dietary fibre is generally
included in the production of meat substitutes and meat products which are processed (Kumar
et al 2017). Therefore, it is challenging to know if there are actually health benefits of
carbohydrate ingredients when added to meat substitutes (Biswas, Kumar, Bhosle, Sahoo &
Chatli 2011). It is important that consumers request that food processors provide clear labelling
on these food products (Watson 2007).
Presently, most of the meat-substitute food products are based on soy [Textured vegetable
protein (TVP), Tempeh and Tofu], mycoprotein (Quorn) and wheat protein (Seitan), and all suit
the standard of effective production of protein and are highly beneficial to reducing carbon
footprints from food (Hoek et al 2004). The success of meat substitutes in the market largely
depend on their ability to be included into daily meals and that products are easily recognised
and accepted by consumers. Some meat substitutes produced from vegetable origin contain
texturing agents and undergo a shearing method to give the product a texture that is fibrous.
However, some customers report the texture to be rubbery and elastic resulting in an unpleasant
mouthfeel (Kim, Choi, Lee, Lee, Kwon, Oh & Kim 2011).
In the last few years, companies manufacturing meat substitutes had many successful attempts
in improving the sensory profiles of their products (Kumar et al 2017). There has also been an
increase in vegetable proteins being used in meat products as a binding agent, filler or extender,
such as skim milk powder, defatted soy flour and refined wheat flour. Meat substitutes continue
to be a suitable alternative for vegans, vegetarians, lactose intolerant individuals, those
following strict religious rules and health conscious non-vegetarians (Kumar et al 2017).

53
2.6.3 Plant-based milk alternatives
Vegetarian and vegan diets are increasing around the world, with concerns regarding the
environment and health as major influencing factors (Messina & Mangels 2001; Van Winckel,
Vande Velde, De Bruyne & Van Biervliet 2011). Therefore, over the past few decades, there
has been a rise in the demand for alternatives to cow’s or bovine milk. These alternatives
include mainly soy milk, rice milk, almond milk, coconut milk and cashew milk. A variety of
other sources such as oats, hemp, flax, hazelnuts and macadamia, in relatively minor quantities
have also been used to produce these milks (Vanga & Raghavan 2018). While the consumption
of cow’s milk is reducing, the intake of alternative milks is increasing, research on these
products is quite limited, with soy milk being an exception (Murugkar 2014). This could be
due to other soy products including soy beans being used in different parts of the world for
centuries (Vanga & Raghavan 2018).
While there are no detailed definitions and classification of milk alternatives in literature, plant-
based or vegetable milk alternatives can be categorised into five groups which can be seen in
Table 2.9.
Table 2.9: Type of plant-based and vegetable-based milk alternative (Sethi, Tyagi &
Anurag 2016)
Category Types of milk
Cereal-based Rice milk, oat milk, corn milk and spelt milk.
Legume-based Peanut milk, soy milk, cowpea milk and lupen
milk.
Nut-based Almond milk, hazelnut milk, walnut milk,
coconut milk and pistachio milk.
Seed-based Sunflower milk. Hemp milk, flax milk and
sesame milk.
Pseudo-cereal based Teff milk, amaranth milk and quinoa milk.
As research indicates, vegans focus their nutritional decisions around the benefit of the
environment and saving the earth’s resources; ethical reasons about caring for animals; the use
of growth hormones and antibiotics used for producing animals; the danger of animal-borne
viruses and the benefits of a plant-based diet on human health (Craig 2009). Vegans are known
to be health conscious consumers. A “health conscious” consumer can be described as an

54
individual who is concerned and aware about their well-being and is strongly driven to maintain
their health, prevent illnesses and improve their overall quality of life by following healthy
eating behaviours and exercising regularly (Newsom, McFarland, Kaplan, Huguet & Zani
2005).
Plant-based milk alternatives (PBMA) are a popular functional beverage of choice among these
groups because of their common health benefits of being low in energy, and free of cholesterol
and lactose (Sethi et al 2016). Although PBMA are not the exact nutritional equivalent to
cow’s milk as seen in Table 2.10, these products can be fortified with specific nutrients such as
vitamin B12, calcium and vitamin D to become more comparable to cow’s milk (Singhal, Baker
& Baker 2017). Table 2.10 shows the consumption of 100 g of cow’s milk can provide about
64 kilocalories (kCal) of energy, while 4.65 g of carbohydrates provides 29% of energy, 3.66 g
of fat providing 46% of energy and 3.28 g of protein yielding 21% of energy. Therefore, in
order for PBMA to be used as an alternative source of cow’s milk, the selected food should
have a similar distribution of energy. The energy distribution is more balanced when compared
to rice, almonds and coconuts which are used to produce alternative milks. From the table, it
can be calculated that 69% of total energy from almonds and 76% of total energy from coconut
come from fats, while 89% of total energy in rice comes from carbohydrates (Vanga &
Raghavan 2018).
The total amount of calcium in 100 g of almonds and soy beans is significantly higher when
compared to milk (Vanga & Raghavan 2018). However, the total number of calories from 100
g of almonds and soy beans is higher than that of milk, therefore it would be an improper way
to compare these values. In order to rectify this information, a novel term was introduced
‘weight of nutrient per kCal of energy’, which is defined as the density of nutrients for
appropriate comparing of the nutrient constituents with regard to the energy yield instead of the
mass of food (Newmark 1987). Table 2.10 also shows the total energy found in 240 ml of
cow’s milk compared to the energy values of PBMA. Cow’s milk had a total energy yield of
158 kCal, while the average yield for the same amount of coconut milk, rice milk, soy milk and
almond milk was calculated to be 48.75 ± 7.5, 133 ± 13.04, 95 ± 15.16, 36.43 ± 6.9 kCal
respectively. The significantly lower energy values that are present in PBMA is one of the main
attractions for the increase in demand for the product. This is due to the cow’s milk having an
increased amount of sugars, which is usually lower in PBMA, rice milk is an exception (Vanga
& Raghavan 2018).

55
In fact, many PBMA are promoted as having either equivalent or greater quantities of vitamin
D and calcium contents compared to dairy milk once these products are fortified. However, it
is essential to emphasise that the bioavailability of these nutrients varies considerably among
products and is not accurately known (Singhal, Baker & Baker 2017).
For example, many of the PBMA are supplemented with calcium. By adding calcium to a
product, it does not guarantee that the nutritional composition is equivalent to other products
which contain similar quantities of calcium. This is because the bioavailability of calcium
differs in each type of PBMA (Heaney, Rafferty, Dowell & Bierman 2005).
Table 2.10: Nutritional composition of cow’s milk and various plant milks (Vanga &
Raghavan 2018)
a. Gram (g) b. Milligram (mg) c. Microgram (μg) d. Kilocalorie (kCal)
2.6.3.1 Soy milk
The most widely available and consumed PBMA is soy milk. Soy is a unique dietary source
which is a good source of fat and protein. The seeds contain about 35 - 45% of protein and
20% of fat and serves as an important protein source especially in vegetarian diets (Friedman
Nutrients EAR Almond
(100g)
Soy bean
(100g)
Rice
(100g)
Coconut
(100g)
Cow milk
(100 g)
240 ml
Carbohydrates
(g)aSugars
Fibre
130
35
21.55
4.35
12.5
30.16
7.33
9.3
81.68
-
2.8
15.23
6.23
9
4.5
-
0.0
11.5
-
0.0
Fats (g)
Saturated
MUFA
PUFA
Cholesterol (mg)b
35 49.93
3.8
31.55
12.33
0
19.94
2.88
4.40
11.25
0
0.55
0.11
0.2
0.2
0
33.49
29.67
1.42
0.37
0
3.66
2.28
1.06
0.14
14
9.05
5.64
2.62
0.35
34.1
Protein (g) 55 21.15 36.49 6.81 3.33 3.28 8.11
Minerals (mg)
Calcium
Iron
Magnesium
Phosphorous
Potassium
Sodium
Zinc
1100
6.5
350
600
4700
1500
9.4
269
3.71
270
481
733
1
3.12
277
15.7
280
704
1797
2
4.89
11
1.6
23
71
77
7
1.2
14
2.43
32
113
356
20
1.1
119
0.05
13
93
151
49
0.38
294.2
0.12
32
230
373
121
0.94
Vitamins
Vitamin C (mg)
Thiamine (mg)
Riboflavin (mg)
Niacin (mg)
Vitamin B6 (mg)
Folate (μg)c
Vitamin B12 (μg)
Vitamin A (μg)
Vitamin E (μg)
Vitamin D (μg)
75
1
1.1
11
1.2
320
2
600
12
10
0
0.20
1.14
3.62
0.14
44
0
0
25.63
0
6
0.87
0.87
1.62
0.38
375
0
1
0.85
0
0
0.18
0.06
2.15
0.11
7
0
0
-
0
3.3
0.07
0.02
0.54
0.05
26
0
0
0.24
0
1.5
0.04
0.16
0.08
0.04
5
0.36
33
-
-
3.7
0.1
0.4
0.2
0.1
12.36
0.89
82
-
-
Energy (kCal)d 579 446 370 354 64 158

56
& Brandon 2001). Soy milk is also consumed by populations who have lactose intolerance and
milk allergies (Vanga & Raghavan 2018). This plant-based beverage, which was first produced
in Asia and continued its journey to supermarket shelves in United States and Europe (Mäkinen,
Wanhalinna, Zannini & Arendt 2016). Soy milk is also consumed for its health benefits due to
the presence of isoflavones, which is related to anti-cancer properties (Omoni & Aluko 2005).
In the Western world, soy products are still leading the market but the development of
alternative products from other plant sources such as almond, oat and coconut have reduced its
popularity. Many new soy milks and other related plant-based products now have an enhanced
sensory quality; however, these products carry a stigma because of previous less accepted
products in the market (Wansink, Sonka, Goldsmith, Chiriboga & Eren 2005). Milk made from
legumes tend to retain a “beany” and “paint-like” flavour, this is due to the activity of
lipoxygenase. The intensity of this flavour depends on the storage and processing
environments. Another concern is a “chalky” feeling in the mouth due to the insoluble
constituents (Durand, Franks & Hosken 2003). This has caused regular complaints among
consumers of soy milk. Furthermore, the presence of non-nutritive factors in various soy
products and soy beans was also a concern (Vagadia, Vanga, Singh & Raghavan 2016). The
contribution of these factors caused a decline in the consumption of soy milk and almond milk
raised in popularity among the masses (Dhakal, Liu, Zhang, Roux, Sathe & Balasubramaniam
2014). Despite the concerns surrounding the consumption, it is still widely purchased and
consumed as an alternate source of protein in a variety of diets and cuisines with a number of
local and international brands (Vanga & Raghavan 2018).
2.6.3.2 Almond milk
Almond beverages have been commonly consumed for a long period of time because of its taste
and flavour profiles. However, in recent years almond milk has also became one of the most
popular PBMA in the North America, Australian and European Union beverage market (Dhakal
et al 2014). The consumption of almonds have many health advantages, which is one of the
main factors that increased the demand for beverages made from almonds. Almonds are rich
in MUFA, which are considered helpful in managing and losing weight (Vanga & Raghavan
2018). Almonds also provide an important source of a variety of nutrients such as protein,
vitamin E, manganese and fibre (Chen, Lapsley & Blumberg 2006).
Almond milk is produced using a colloidal dispersion which is the result after mixing pasted or
powdered almonds with water. The solids are filtered, and a milky white liquid is produced.

57
The content of the solid is determined by the almond to water ratio. Generally, the milky white
liquid is homogenised by using high pressure during commercial processing techniques. This
is followed by pasteurisation processes to improve the stability of the milk and to increase the
shelf life (Bernat, Chafer, Chiralt & Gonzalez-Martinez 2014). Almond milk is generally low
in calories. It is important to consider the calcium content before selecting a particular brand
of product, as the higher content of calcium is mainly due to the addition of calcium prior to the
processing in order to imitate cow’s milk calcium content. A good level of antioxidants are
found in almonds, which is also seen in almond milk. Vitamin A content contributes about 10-
50% of the EAR, while vitamin E contributes 10 - 30% of the EAR (Vanga & Raghavan 2018).
2.6.3.3 Rice milk and coconut milk
Rice milk is a common type of grain milk which is usually prepared by combining milled brown
rice with water. Generally, rice is known to be a rich source of carbohydrates in the diet and
similarly, rice milk has an increased content of carbohydrates compared to cow’s milk as seen
in Table 2.10. The processing of rice milk results in sugars being formed due to the breakdown
of carbohydrates. The process provides rice milk with its distinctive sweet taste without adding
sugars. This is usually done through the use of enzymes (Vanga & Raghavan 2018). Rice milk
is a good alternative for patients who are lactose intolerant as the milk is lactose free (Lomer,
Parkes & Sanderson 2008). According to Craig (2009), rice milk which is unfortified, more
especially homemade milk, has a decreased content of vitamins and minerals such as vitamin
B12 and calcium. Therefore, fortified commercial rice milk provides a better source of
nutrients.
Coconut milk is a liquid which is extracted from grating the white meat of the coconut. Coconut
milk is high in saturated fats and is commonly consumed in various parts of South America and
Asia. Coconuts are usually cultivated in tropical climates and the canned products are exported
to Europe and North America (Tinchan, Lorjaroenphon, Cadwallader & Chaiseri 2015). Many
researchers have also found evidence that coconut milk contains lauric acid which can raise
high-density lipoprotein (HDL) cholesterol levels, which assists in decreasing the detrimental
low-density lipoprotein (LDL) cholesterol levels in the blood (Ekanayaka, Ekanayaka, Perera
& De Silva 2013; Mensink, Zock, Kester & Katan 2003). The health advantages linked to
coconut milk consumption have contributed to the increased demand in different countries.
Coconut milk is different when compared to the other PBMA, as the overall amount of calories
is quite low, and most of the calories are obtained from fats which are saturated as coconut milk

58
contains no protein and a reduced amount of carbohydrates as seen in Table 2.10 (Vanga &
Raghavan 2018).
2.6.3.4 Consumer acceptance of PBMA
Although the popularity and demand for PBMA is increasing, consumers’ unwillingness to
purchase and consume unfamiliar food that are previously known to be unappealing, may be a
contributing factor (Mäkinen et al 2016). There are many technological concerns which need
to be revised with the purpose of producing a PBMA similar to that of cow’s milk in nutrient
value, taste, stability, appearance and most especially flavour (Sethi et al 2016). McCarthy,
Parker, Ameerally, Drake & Drake (2017) in North Carolina, conducted an online survey
consisting of consumers of fluid milk (n = 999). These consumers included cow’s milk
consumers (n = 702), non-dairy milk consumers (n = 172) and consumers of both types of milk
(n = 125). According to the study results, consumers were more likely to purchase cow’s milk
based on the fat content of the product, label claims and packaging size.
Consumers preferred 1 or 2% fat content, a gallon (± 3.78 litres) or half a gallon (± 1.9 litres)
packaging and a store-brand milk which is conventionally pasteurised. The sugar content is
one of the main attributes for the purchase of PBMA, followed by the plant source of the milk
and size of packaging. Almond milk was the most preferred plant source and half a gallon
packaging of milk was the most preferred packaging size (McCarthy et al 2017). Another
distinctive characteristic of consumers is that the purchasing of PBMA contributes to the goal
of consuming less or no animal products; beliefs about preventing animal abuse and the
perceived reduction of the effect on the environment (McCarthy et al 2017).
A large scale study by Palacios, Badran, Drake, Reisner & Moskowitz (2009) compared the
acceptance of soy milk and lactose free cow’s milk among adult consumers in America (n =
893). It was found that lactose free cow’s milk was favoured over soy milk, with no influence
on dairy intolerance, gender or ethnicity. A study involving American school children found a
similar result (n = 425) (Palacios, Badran, Spence, Drake, Reisner & Moskowitz 2010). A
review by Diarra, Nong & Jie (2005), showed that the acceptance of peanut milk depends on
the absence of peanut flavour, mouthfeel and colour of the milk and its similarity to cow’s milk.
By providing additional nutritional information to consumers, it can increase the readiness and
willingness to try and purchase new food products, especially health benefits and health
information. The main purchasing decision for food is predominantly based on the taste of that

59
particular food item, the information provided about the product and if it is familiar to the
consumer (Magnusson, Arvola, Hursti, Aberg & Sjödén 2001).
2.7 Plant-based diets and veganism in South Africa
South Africa is recognised as a low to middle income developing country, in the midst of a
nutrition transition which is characterised by a quadruple burden of communicable diseases,
NCDs, perinatal, maternal and injury-associated disorders (Pillay-van Wyk, Msemburi,
Laubscher, Dorrington, Groenewald, Glass, Nojilana, Joubert, Matzopoulos, Prinsloo, Nannan,
Gwebush, Vos, Somdyala, Sithole, Neethling, Nicol, Rossouw & Bradshaw 2013). The
nutrition transition that exists in South Africa, is accompanied by the co-existence of both
under- and over nutrition in the population (Wentzel-Viljoen, Lee, Laubscher & Vorster 2018),
as both have negative outcomes on health (Maunder & Meaker 2007). Undernutrition is related
to thinness, underweight and stunting while over nutrition relates mainly to overweight and
obesity among the population (WHO 2018). Undernutrition in South Africa is mainly due to
the physical and economic lack of accessibility to food, the knowledge of how to use food that
is available and proper access to information on preventative and curative health services. The
accessibility to clean water, proper hygiene and sanitation and shelter also contributes to an
individual’s nutritional status (Benson & Shekar2006).
A South African study by Sartorius, Veerman, Manyema, Chola & Hofman (2015), analysed
three national cross sectional surveys to assess the determining factors of obesity and attributes
associated with the population in South Africa over five years (2008 - 2012), found that the
prevalence of obesity increased considerably from 23.5% in 2008 to 27.2% in 2012 (p < 0.001)
and was more prevalent among females (37.9% in 2012) when compared to males (13.3% in
2012). Many studies have indicated the advantage of using plant-based diets for promoting the
loss of weight and preventing overweight and obesity (Turner-McGrievy et al 2017; Dewell &
Ornish 2007; Barnard et al 2005). However, there is a limited number of studies conducted in
South Africa regarding the role of PBDs to combat obesity. In South Africa, the nutrition
transition is multifaceted and is reinforced by the dietary changes in urban areas and challenges
associated with undernutrition, which lead to massive rural to urban migration and rapid
urbanisation (Harpham 2009).
This shift causes major public health threats which impacts on the poorer communities in South
Africa which are the most food insecure (Sverdlik 2011). Food insecurity is defined as “the
lack of physical, social and economic access to sufficient, safe and nutritious food that meets

60
the dietary needs and food preferences of an active and healthy lifestyle” (Food and Agriculture
Organization 2009). Generally, the population in South Africa consumes a diet with limited
variation (United Nations 2010) and therefore the population is nutritionally vulnerable
(Drimie, Faber, Vearey & Nunez 2013), mainly due to food insecurity and the consumption of
staple plant foods (Labadarios, Steyn, Maunder, Macintyre, Gericke, Swart, Huskisson,
Dannhauser, Vorster, Nesamvuni & Nel 2005).
The most frequently consumed staple foods include bread, maize, sugar and tea and these food
items are not good sources of micronutrients (Steyn, Nel, Nantel, Kennedy & Labadarios 2006).
The South African Department of Health introduced a compulsory fortification of nutrients in
staple foods including bread flour and maize meal in the year 2003, with the aim of addressing
micronutrient deficiencies (South African Department of Health 2013), which came into effect
in 2004 (Wentzel-Viljoen et al 2018). On the other hand, vegans choose to follow a vegan diet,
primarily consisting of food of plant-based origins; in order to exclude all animal products from
their diet mainly due to the ethical concern for animals (Gray, Sellon & Freeman 2004) and not
because they are from a low economic status. Therefore, individuals who decide to follow a
vegan diet are more popular in developed economic countries (Newport 2012).
Vegan products can be seen as a “luxury” to some and the purchasing of these products is
synonymous to having wealth and attaining products of high quality. These products are
expensive mainly due to their limited availability, and veganism is accompanied by the desire
to belong to a specific group that highlights individuality (Palka & Newerli-Guz 2018). Taking
this into consideration, veganism may only apply to those of middle to high socio-economic
status who can afford such a lifestyle. Lower-economic communities in South Africa spend
most of their money on food and it becomes difficult to afford other necessities such as prepaid
electricity, school fees and medication (Statistics South Africa 2012).
Individuals in South Africa belong to diverse ethnic cultures and thus a single culture does not
exist, but rather a multitude of ethnic values (Abratt & Penman 2002). Currently, there are four
main population or ethnic groups in South Africa; namely Black African [Nguni (Zulu, Xhosa,
Ndebele and Swai), Sotho-Tswanam Tsong and Venda], Coloured [people of mixed lineage
(Africans, whites, former African slaves and indigenous Khoisan)], Indian/Asian and White
[(Afrikaners (German, Dutch and French Huguenot descendants), English-speakers (British
descendants) and other European descendants of immigrants] (Statistics South Africa 2016).
The total population in 2016 was 55.6 million, where 44.9 million were Black African, 4.9

61
million Coloured, 1.4 million Indian or Asian and 4.5 million were White (Statistics South
Africa 2016).
Therefore, it is necessary to take into consideration that diverse ethnic groups have their own
traditions and customs, and factors such as age, religion and income play an essential part in
the consumption of meat. The consumption of meat forms a fundamental part of South African
cuisine, and for most South Africans when meat is not included in a meal it is not considered a
meal at all (Erasmus & Hoffman 2017). Among the majority of the population (which is Black
African), cultural practices are associated with the consumption of meat products. Meat
consumption plays a pivotal role at many gatherings such as initiation ceremonies, certain
holidays and visits by significant guests (Kifleyesus 2007).
The sharing of meat in these traditional gatherings is closely related to a lifestyle as one is
associated with having wealth and a strong belief in religion (Seleshe, Jo & Lee 2014). These
social values and norms contribute to unhealthy eating habits. For example, Black African men
preferred to consume meat on a daily basis; the meat served should also be “fatty” as it is a sign
of generosity and “lean” meat is associated with stinginess. The Black African population are
faced with other difficulties as being overweight is seen as desirable and is a sign of affluence.
Individuals who migrated to the city are often envied and complimented when they visit rural
communities. In addition, there is still a strong belief that “thinness” is related to having
HIV/AIDS and therefore, the majority of the population, especially women found it difficult to
maintain a normal body weight (Puoane & Tsolekile 2008).
A study by Peltzer (2004), conducted in South Africa, investigated the understanding of
nutrition knowledge among a sample of urban Black African (n = 90) and urban White (n = 90)
South Africans. This study found that both Black African and White respondents had practical
knowledge on nutrient recommendations and the source of nutrients in food, but a reduced
amount of knowledge on the relationship between diet and disease. Whites had more general
knowledge on nutrition than Black Africans, while Black African females had a significantly
lower knowledge on nutrition than White females. This study is similar to other international
studies, whereby more females and Whites were more likely to follow restrictive diets or be
practicing vegans (Cruwys, Norwood, Chachay, Ntontis & Sheffield 2020; Radnitz et al 2015;
Clarys et al 2014; Blanco & Enrione 2012).
Due to the massive burden of diet-related diseases, South Africa developed and released its first
set of Food Based Dietary Guidelines (FBDG) in the year 2001. The FBDGs consist of ten

62
simple messages to assist all South Africans over five years of age and from diverse ethnic
backgrounds in both urban and rural communities to follow healthy diets and lifestyles. The
guidelines emphasised the consumption of food that is available locally and aimed to address
public health concerns which are nutrition-related (Gibney & Vorster 2001).
However, when the cost of a typical South African diet was compared to a healthy diet, the
healthier diet costed around 69% more than the traditional diet, depending greatly on the food
choices. Healthy diets have low energy density and are nutrient dense. A study by Temple &
Steyn (2011) found that the cost of these diets were determined by comparing commonly
consumed foods in a typical diet such as a hamburger (high fat), full-cream milk, cornflakes,
brick margarine, white rice and brown bread to a healthier diet which included a lean
hamburger, low-fat milk, bran flakes, margarine rich in polyunsaturated fats, brown rice and
white bread. The prices were then recorded from eight different supermarkets. It was estimated
that for a family of five this extra cost would amount to R 36.00 per day more than a typical
diet. Therefore, for most South Africans, a healthy diet is unaffordable. In a developing country
like South Africa, individuals should be provided with education on the advantages of a healthy
diet and how to make the diet affordable with appropriate food choices. The government should
also implement strategies to manipulate food prices in the country (Temple & Steyn 2011).
Therefore considering the multicultural diversity among the South African population, it was
expected that a vegan diet would be followed by a food secure population who practised a
restrictive diet out of choice and not necessity.
2.8 Conclusion
In the past few years, there has been a significant increase in the number of people who are
following a vegan diet. This may indicate that a share of the population are approaching a
notable transition motivated by creating awareness about the harm and abuse towards animals,
the accumulated data on the health advantages of following a vegan diet and the rise in
availability of dairy and meat plant-based alternatives (Radnitz et al 2015). From the literature,
it can also be seen that becoming a vegan and following a vegan diet involves a process that is
continuous. This process is sometimes inhibiting and stimulating by both negative and positive
motives and perceived concerns (Larsson et al 2003). Vegans are motivated for different
reasons; however, it is essential to note that individual’s dietary motivations have a tendency to
modify over time (Ruby 2012). The diet also largely depends on the motive behind following
the diet. Those individuals following a vegan diet for health reasons had the tendency to choose

63
foods that are more nutritious and make healthier food related decisions, whereas ethically
motivated individuals consumed more supplements and high fat foods (Radnitz et al 2015).
According to Waldmann et al (2003), overall vegans consumed a diet that is well-balanced with
a high amount of nutrients and followed a beyond average healthy lifestyle. Although the
consumption of vitamin B12, iodine and calcium should be improved in the diet. As literature
suggests, strict vegans should add supplements of minerals and vitamins to their plant-based
diet to meet nutritional requirements. Radnitz et al (2015) states that in future, vegan consumers
will soon influence omnivore consumers to change dietary patterns.
Both the food industry and agricultural segment should increase the consumer concerns that
surround animal welfare (Grunert & Aachmann 2016). The stigma that is attached to following
a vegan diet should be reduced by public awareness about the benefits to health and the
environment. Family and friends should support vegans so that the diet could become a
normative pattern of eating (Markowski & Roxburgh 2019).
Over the years, there has been much focus on the vegetarian diet, although currently there is an
evident shift to a stricter vegetarian diet. The vegan diet is a topic that has not been researched
in South Africa to date. Veganism and the vegan diet is becoming a growing trend in South
Africa as more individuals are choosing to adopt the lifestyle for a variety of reasons.
Therefore, data from this research will be beneficial, as it has determined the demographic
characteristics of vegans in South Africa and whether the diet is more likely to be followed by
a particular gender, race, education level and socio-economic group. Many international studies
have focused on numerous factors that influence an individual to follow a vegan diet. As
previous literature presents, the main motivation is the prevention of animal abuse, however,
sustaining the environment and better health outcomes are also contributing factors that
influence individuals to transition into the diet.
According to the literature presented, it was important that this study objectives were based on
the findings of international research. It was important to investigate the demographics and
factors influencing South African vegans and whether these factors were different or similar to
international studies.
The literature has shown that it is important to further investigate the challenges that vegans
face in South Africa, including the social stigma attached to avoiding animal food and products,
the availability of vegan food products, vegan meals in restaurants and financial implications

64
associated with the transition. The different ways that these challenges were overcome were
also investigated as it will assist other vegans who might face similar challenges in the future.
Based on the literature surrounding the nutritional composition of vegan diets, it was important
to investigate the nutritional quality of the vegan diet followed by South Africans, the variety
of different food groups and types of processed food consumed by vegans in South Africa. It
was anticipated that this would show how South African vegans plan and follow the diet in
comparison with international vegans.
The next chapter will address the methodology used in order to accomplish the objectives of
the study.

65
CHAPTER 3: METHODOLOGY
This chapter will outline the methodology of the study. The following sections will be covered:
the study design, type of study, study population and sample section. The chapter will further
elaborate on the development of the survey questionnaire and data quality control tools used to
ensure reliability and validity of the questionnaire. The pilot study, statistical analysis and
ethical considerations of the study will also be discussed.
3.1 Study design
A cross-sectional study design using quantitative research was chosen for this study to
determine the motives and challenges facing South Africa vegans and the nutritional quality of
their diet. This was conducted using an online questionnaire.
3.2 Study setting
An online questionnaire was published on the South African Vegan Society (SAVS) group on
their Facebook page with the following link: https://www.surveymonkey.com/r/3N52ZRP and
was open to all vegans living in South Africa. The SAVS group was chosen as the best vegan
group to use as it had the most number of members compared to other researched vegan groups..
SAVS is known as the primary vegan outreach organisation in South Africa. At the point of
data collection, in August 2019, this page consisted of a total of 9 819 members from all
provinces in South Africa. The SAVS Facebook group was also the best method of targeting
South African vegans as the majority of individuals of all age groups use the internet and join
popular social media sites such as Facebook. This group is open to the public providing updated
information on vegan diet trends and the latest veganism practices in South Africa (South
African Vegan Society 2015).
3.3 Type of study
3.3.1 Cross sectional study
A cross-sectional study design has a purpose of discovering the occurrence of the result of
concern seen in a population or subpopulation at any point in time (Levin 2006). These studies
are usually conducted by using survey formats. These studies have the advantage of being
quick and inexpensive. Another advantage is that a reduced number of resources are required
to conduct the study and there is no follow up of respondents (Mann 2003). A non-random
convenience sampling method was used for this study.

66
3.3.2 The use of an online questionnaire
Surveys in the form of questionnaires are mainly used to evaluate the behaviour, knowledge
and attitudes of respondents in a study (Rubenfeld 2004). Structured multiple-choice questions
are used to assess knowledge in usual types of surveys. Surveys that assess attitudes generally
do not have correct answers and are formulated to prompt the respondents’ feelings about a
particular topic (Rubenfeld 2004). On the other hand, surveys that measure behaviour are
commonly self-reported surveys which have limitations. Respondents may be hesitant to
confess to certain behaviours and often forget other behaviours they normally practice (Groves
2005). Researchers expect that the results of their survey will show attitudes, behaviour and
true knowledge from the surveyed respondents (Rubenfeld 2004). Therefore, the main purpose
of a survey is to collect unbiased, consistent and reliable data (McColl, Jacoby, Thomas,
Soutter, Bamford, Steen, Thomas, Harvey, Garratt & Bond 2001).
There are two important forms used for the collection of data: self-administered questionnaires
and standardised interviews. However, variations can exist within each of these forms. For
example, standardised interviews can be done over the telephone or through a face-to-face
interview in person. Self-administered questionnaires can be used in an individual or a group
setting. Email and internet self-administered questionnaires are becoming increasingly popular
(De Leeuw, Hox & Dillman 2008, pp313 - 314). Table 3.1 shows the advantages and
disadvantages of self-administered questionnaires and structured interviews.
Table 3.1: Advantages and disadvantages of self-administered questionnaires and structured
interviews (Brace 2008, pp26 - 34; Meadows 2003; Bourque & Fielder 2003, pp2,
pp9 - 19)
Type of data
collection tool
Definition Advantages Disadvantages
Self-administered
questionnaires
Questionnaires used to collect
data from respondents who
complete the tool by themselves.
Reduced cost when compared to
other methods.
Wider geographical coverage.
Coverage to a larger sample
population.
Easier to implement compared
to other methods.
Poor response rates due to
barriers of language and
literacy.
Lack of control of
respondents who complete the
questionnaire.
Some questionnaires are
completed poorly.
Structured interviews Each subject under study is
asked a sequence of questions
according to an arranged interview schedule.
Any queries about questions can
be discussed.
Questions can be corrected if
misunderstood.
Respondents are motivated to
provide longer answers to open-
ended questions.
More complex questions can be
asked.
The cost involved with
finding a representative sample of the survey
under study.
The communication
between the interviewer
and participant can
influence the accuracy of the data and introduce
bias.

67
After careful consideration regarding the advantages and disadvantages of the two types of
questionnaires listed in Table 3.1, a self-administered online questionnaire was chosen for this
study. According to Brace (2008), a self-administered questionnaire can either be on paper or
online. Paper-based questionnaires have the advantage of allowing the respondent time for
completion, where they are able to answer open-ended questions fully with minimal time
pressure. A major disadvantage is that paper-based questionnaires allow the respondent to read
through the questions before answering them in the required sequence according to the stated
instructions. By constructing questions using a specific sequence, there is a logical flow to the
survey. Respondents should start with the easier questions before progressing on to the more
complex questions. However, this can lead to questionnaires being incomplete or completed
incorrectly, causing the researcher to be uncertain regarding its validity. The researcher may
have spent time carefully entering data only to discover the questionnaire is incomplete (Jones,
Murphy, Edwards & James 2008).
According to Jones et al (2008), web-based or online questionnaires have more advantages than
those that are presented in hard copy and have unique attributes that decrease the disadvantages
of online questionnaires. For example, the researcher has a number of methods to provide
personal contact with the respondent. This can be done by using movie clips and images
providing instructions. The researcher can also provide their email address by use of
hyperlinks, should the respondent require additional information about the questionnaire.
Online questionnaires should be designed to be eye-catching and appealing (Denscombe 2003)
and the entry of data can be monitored at any point by “real time error checking and correction”
(Solomon 2001) so that respondents are guided during the process. This is done to ensure that
questionnaires are completed correctly before submission. Survey fatigue, also known as
respondent fatigue, is a common concern when collecting data for surveys. There are many
factors that influence survey fatigue such as the topic of the survey, length of the survey,
complexity of questions and type questions especially open-ended questions. Survey fatigue
often increases the possibility of attaining data which is incomplete and respondents tend to
terminate study participation in the middle of the survey (O’Reilly-Shah 2017).
There are three main disadvantages of online questionnaires. The first disadvantage is that
adapting a questionnaire to be delivered via the internet involves expertise and skill from
researchers when compared to a paper-based questionnaire. The second disadvantage is that
response rates are generally lower in email and internet questionnaires when compared to postal
questionnaires (Solomon 2001; Couper 2000; Couper, Blair & Triplett 1999). Similarly, a

68
study by Sinclair, O’Toole, Malawaraarachchi & Leder (2012), found that online response rates
were considerably lower than other modes. The third disadvantage is associated with sampling.
A questionnaire delivered via the internet automatically disregards those respondents who lack
computer literacy skills or access to a computer (Jones et al 2008). Therefore, attaining a
representative sample from a population, may completely or partly exclude specific groups,
such as the elderly (Denscombe 2003).
In order to overcome these challenges, the researcher constructed the questionnaire and
included mostly closed-ended questions which were fairly easy to answer and analyse.
Questions were constructed to provide as much information as possible and were designed to
address the four objectives of the study. The sequence of questions in the questionnaire were
according to the objectives, this was done to make it easier for grouping and data analysis. The
questionnaire consisted of 32 questions including the food frequency questionnaire (FFQ) and
24-hour recall. The advantages of a 24-hour recall include an elevated response rate, multiple
recalls can estimate the usual intake of individuals, the administration of recalls do not require
much time or cost, there is high precision if the recall is administrated in the same study subjects
(2-3 times) and it is considered a valid instrument for the assessment of energy and nutrients.
The disadvantages or limitations of a 24-hour includes the extensive dependence on the recent
memory of the study subjects, the capability of the interviewer for describing ingredients, food
preparation and dishes and the administration of recalls require well-trained interviewers.
There is often difficulty in precisely estimating food consumption and in general 24-hour recalls
tend to underestimate intake. One single 24-hour recall does not estimate usual intake and the
planning of 2 or more 24-hour recalls complicates field work (Castell, Serra-Majem & Ribas-
Barba 2015).
The advantages of FFQs include that is relatively easy and inexpensive to administer, the
questionnaire is able to target a specific nutrient or all food and nutrient groups, it is effective
at ranking individuals within a group and results of a FFQ can be scanned and entered into a
software program. The disadvantages and limitations include that the respondents require a
certain degree of literacy, a FFQ relies on long-term recall ability, the tool is generally not as
effective at determining absolute intake of nutrients and it may not include foods that are unique
to the culture or important for the health condition of interest (Ralph, Ah, Scheett, Hoverson &
Anderson 2011).

69
The questionnaire was easy to follow and read as large front was used (≥ 12 - point), making it
visible to all age groups (Rubenfeld 2004). A pilot test was conducted online to make certain
the questionnaire was acceptable to the population and to recognise issues with formatting,
language and length (Monroe & Adams 2012) as well as questions requiring skip logic
functions, when subsequent questions are not applicable to respondents (Manski & Molinari
2008).
Burns, Duffett, Kho, Meade, Adhikari, Sinuff & Cook (2008), stated that constructing a well-
defined questionnaire requires a clear objective. The development stage of the questionnaire
involves careful attention given to both the layout and design. This is important as the
appearance of the questionnaire can influence a participant’s decision to respond or not
(Meadows 2003).
When designing web-based questionnaires the following guidelines should be considered:
Questionnaires should be presented on a “single-scrolling page” or multiple linked
pages and this should be supplemented with links and electronic instructions to assist
the participant with effective completion (Burns et al 2008).
Questions should be well organised and numbered correctly and options to respond
should be presented on different lines (Burns et al 2008).
Questions should be categorised according to the content (McColl et al 2001) and
questions should possibly be ordered from easy to challenging (Meadows 2003).
3.3.2.1 The use of social media to administer an online questionnaire
The online questionnaire link was posted on Facebook a popular social network site where
many individuals spend most of their time (Hei-man 2008). In general, social media is where
people are allowed to exchange opinions and concepts, have content discussions on pages and
have online contacts. Social media is unlike other media platforms, whereby everybody is able
to comment and contribute to the available content. The content may be in the format of a text,
photograph, audio or video and other visual formats that assist individuals to connect with one
another and to combine communities (Drahošováa & Balco 2017).
The term “social media” is superior to “social network” and includes numerous media to create
social interaction in the form of online communication such as blogs, videos and photo sharing
sites (Drahošováa & Balco 2017). A social network falls under social media and it is a term

70
used to describe the interaction between people by creating personal profiles with the aim of
becoming a “community” of friends. Examples of social networks include MySpace, LinkedIn
and Facebook. The advantages of using social media is that there is constant communication
and exchange of information, one is able to communicate at leisure, services are provided and
there are educational advantages by sharing of resourceful information. The major
disadvantages include the lack of confidentiality felt by users and information overload on
particular platforms (Drahošováa & Balco 2017).
According to Nayak & Narayan (2019), online surveys have various advantages and are useful
in collecting data, questionnaire preparation, storage of data, visualisation of data and
collaborating of work. Online surveys can also be conducted at a reduced cost and in a short
period of time. The researcher is able to begin the survey, pause at any time and restart the
survey whenever he or she chooses to. Some of the disadvantages or challenges related to
online surveys are related to sampling, response rates, non-respondent characteristics,
confidentiality maintenance and ethical issues.
Currently, software packages have been developed to assist with conducting online surveys
which makes online survey research faster and easier (Wright 2005). Thousands of
organisations and groups have shifted online, many of which are constantly conducting
promotions through the use of advertisements, list of emails and popular search engines. These
online organisations not only provide information to users, but also offer researchers the
opportunity to access a range of individuals who are associated with these organisations or
groups (Wright 2005).
One of the main advantages of online survey research is the ability of the internet to provide
accessibility to individuals and groups who would be difficult or sometimes impossible to
contact when using other channels (Garton, Haythornthwaite, & Wellman, 1999). According
to Wright (2000), the benefit of using virtual community sites for research, is that these sites
are a platform that provides assistance to the researcher to reach out to individuals who share
particular beliefs, attitudes, values and interests with regards to an activity, concern or particular
issue in society. In contrast to other forms of traditional methods of survey research, it can be
further complicated to reach a larger population of a comparable nature.
Llieva, Baron & Healey (2002), mentioned that online surveys save time and allows researchers
to work on other tasks while collecting data. Once an invite is sent to respondents to take part
in the survey which is either posted on the website of a particular community, emailed to

71
individuals or circulated through an internet-based survey research service, researchers can
continue the data collection process while completing other tasks (Andrews, Nonnecke &
Preece 2003). Online survey responses are usually sent immediately to the researcher via a
database file or email. Therefore, while waiting to collect the required number of responses,
the researcher can carry out primary analysis on the composed data (Llieva et al 2002).
The final advantage is that researchers can reduce costs by transitioning from a paper-based
format to a format which is electronic (Llieva et al 2002; Couper 2000; Yun & Trumbo 2000).
According to Llieva et al (2002), the need for paper and other costs incurred such as printing,
posting and entry of data are eliminated when online surveys are used. Also, conducting
interviews online, in the format of “chat “or by emails, results in saving of costs. Costs for the
use of telephones, travel and equipment can be excluded. Moreover, since online responses are
documented automatically, transcription costs can be eliminated. The latest online survey
development software and service costs can differ from a small amount to large sums of money
depending on the services selected and specific types of features required; however, when
compared to traditional paper-based surveys, it is relatively inexpensive (Wright 2005).
The main disadvantage of online surveys that researchers encounter, is issues with sampling
(Andrews et al 2003). For example, there is a limited amount of information known about
people who are part of online communities, apart from some basic demographic characteristics
and could possibly be uncertain (Dillman 2000). Some web survey services offer accessibility
to populations. These population groups are generated from email lists of those who previously
participated in online surveys Therefore, there is no guarantee that self-reported data from
respondents of prior surveys provided correct characteristic and demographic details (Wright
2005).
Another disadvantage is generating samples from online organisations and virtual communities.
However, some of these groups provide email lists of those who are part of the membership
and this can assist researchers to develop a sampling frame. Although, all members of online
organisations and virtual groups may not agree to list their email addresses, and many may
forbid administrators to allow researchers access to their email addresses. Therefore, is it
important to comply with the Protection of Personal Information (PoPI) Act especially while
on social media platforms and be aware of cyber security (Botha, Eloff & Swart 2015). This
also makes it challenging for researchers to accurately estimate the size of the online population.
If the researcher obtains an email list, it can be possible to email the survey invite and web link

72
for participation in the online survey to each member on the list. This could ideally provide the
researcher with a sampling frame. However, issues such as multiple responses from
respondents, multiple email address for each respondent and inactive or invalid email address
could make online random sampling a problematic process (Andrews et al 2003; Couper 2000).
It should be noted that some people in these virtual communities are “regulars” who contribute
regularly to the discussions, while other people contribute intermittently. Moreover, people
who read and acknowledge posts and do not send messages otherwise known colloquially as
“lurkers”, may complete an online survey despite the fact that they are invisible to others in the
community. The occurrence of “lurkers” in these communities are greatly variable (Preece,
Nonnecke, & Andrews, 2004). Studies have shown that some communities online have a
greater percentage of lurkers, between 45% and 99%, while others have just a few (Preece et al
2004). This is because “lurkers” do not make themselves known on these online groups,
researchers may find it challenging to acquire a precise sampling size or correct estimation of
the sample population (Wright 2005).
The researchers may have a solution to this by proposing that respondents contact them for a
distinct number or code and indicate this on the online questionnaire before completion.
However, this extra detail might reduce the number of responses. An alternate solution is that
some advanced online survey programs provide tracking of responses. In order to complete the
surveys, email addresses of the respondents must be submitted. Once the survey is completed,
the online survey program stores the respondents email address and permits anyone who uses
the same email address to access that particular survey. This feature can assist with reducing
multiple responses, however, there is a risk that someone can possibly complete an additional
survey using an alternate email address (Konstan, Rosser, Ross, Stanton, & Edwards 2005).
The final disadvantage is issues with access. Many researchers access prospective respondents
by posting survey invitations on chatrooms and on discussion and community groups.
However, some members of these groups many find this to be disrespectful or unpleasant
(Hudson & Bruckman 2004) or consider these posts to be a form of “spam” (Andrews et al
2003). The representative of that community may remove the post, or incensed community
members may send emails to the researcher. However, many individuals from web
communities are willing to accept invitations to participate in studies by researchers,
particularly if these members are interested in how other people perceive their community (Reid
1996). Often it is challenging to access some online communities, and obtaining permission

73
takes time. Therefore, it is important to clarify the purpose, benefits, aims and objectives of the
study and this may assist the researcher to be allowed to use that community (Andrews et al
2003). Wright (2000) suggests that researchers form a good relationship with community
respondents and provide information about the study and the results to the community. This
can be done by compiling a study report, posting it on an online page or posting a link on the
community online page.
3.3.2.2 The use of an online survey software package
Currently, there are many online survey software packages to choose from as well as other web
survey services that are obtainable to researchers who are prepared to incur the costs (Wright
2005). For the purpose of this study the SurveyMonkey software package was used. The
features of SurveyMonkey were standard and the user was able to create an unlimited number
of surveys. According to Symonds (2011), when compared to other software programs,
SurveyMonkey does not require the installation of other programs. The program provides
permission to researchers to export, save and correlate data in different formats, this assists with
reducing human error as subsequent statistical analysis can be facilitated (McPeake, Bateson &
O’Neill 2014). The program can also randomly organise questions and hide irrelevant follow-
up questions. The program also improves the quality of data by including alarms, checks and
notifies respondents when incomplete answers are entered (Van Gelder, Bretveld & Roeleveld
2010). SurveyMonkey generates an automatic response when a participant leaves a survey
question empty and has an optional box to avoid questions that are unanswered. Surveys posted
online are returned more quickly that those sent via post, as there are more respondents each
day. This also allows for instantaneous administration, whereby many respondents are able to
answer the survey simultaneously (Van Gelder et al 2010).
The program offers illustrations, which indicate the number of completed surveys per month.
If the researcher needs to find out when a particular respondent had completed the survey, this
information can be accessed via the “Individual Answers” section. SurveyMonkey archives the
date and day as well as the start and finishing time and the total time the survey questions were
completed by the respondent (Symonds 2011). The program has a wide assortment of default
formats of question types, which assist in creating both understandable and simple survey
designs. SurveyMonkey creates an individual web link to directly access and answer the
survey. The dominant sources of distribution of surveys is through social networks and email
(McPeake et al 2014). Researchers can use data management systems to send invitations and

74
email reminders automatically to all study respondents. Regular reminders may be a solution
if there are low response rates (Aerny-Perreten, Domínguez-Berjón, Esteban-Vasallo, García-
Riolobos 2015; McPeake et al 2014).
Overall, SurveyMonkey provides many benefits to a study. Using the program provides easy
access and distribution of surveys, so that individuals could complete the surveys at home
without an instructor (McPeake, et al 2014). The quicker response rates and feedback allows
for an increased number of replies within a shorter space of time and the automatic compiling
of data reduces the amount of coding and entry errors (McPeake et al 2014; Symonds 2011;
Van Gelder et al 2010). The fact that the survey is online, respondents have a sense of
anonymity so that they could respond truthfully in the survey (Ekman & Litton 2007). Despite
some limitations, online surveys are a good substitute to other data collection methods (Varela,
Ruiz, Andres, Roy, Fuste & Saldana 2016).
3.3.2.2 The types of questions used in the questionnaire
This study made use of multiple choice questions (MCQs) as well as questions using a Likert
scale. A Likert scale is comprised of a sequence of four or more items that are joined into a
single score during the data analysing process (Boone & Boone 2012). This scale provides
quantitative information on an individual’s personality or character (Boone & Boone 2012).
MCQs are known to be a reliable source of evaluation. These questions are quick to complete
and can address any topic (MCCoubrie 2004). A well-formulated MCQ will be able to assist
respondents with applying knowledge rather than recalling facts that are isolated (Case &
Swanson 2001).
3.3.2.3 Method of data collection
This study involved individuals who follow a vegan diet in South Africa and using an online
questionnaire was selected an effective tool to cover the wide geographical area. The
questionnaire was published on the SAVS social media sites as it provided a country wide
coverage for vegans to respond. Using telephonic interviews or sending questionnaires via
email would have not been feasible due to the busy schedules of the respondents as well as
locating the vegan community within each province. Nowadays, most individuals have access
to the internet via cell phones and computer technology and this provides an influential platform
for communication and research (Keshav, Chawathe, Chen, Zhang & Wolman 2007).

75
3.4 Study population and sample selection
3.4.1 Study population
The SAVS is a volunteer organisation that focuses on outreach to the public, resource
distribution, product endorsement as well as the provision of guidance and support for those
who decide to follow a vegan lifestyle (South African Vegan Society 2015). The SAVS
Facebook national group had approximately 9 819 members currently from all the provinces in
South Africa (August 2019) (South African Vegan Society Facebook Page 2019). A non-
random convenience sampling method was used in this study.
3.4.2 Sample selection
The online self-administered questionnaire was published in August 2019 on the SAVS
Facebook page available for all South African vegans to complete.
3.5 Questionnaire development
To date, no study has been conducted in South Africa on the motives and challenges that face
South African vegans and the nutritional quality of their diet. Therefore, the online
questionnaire was developed from other similar studies conducted internationally (Janssen et
al 2016; Kerschke-Risch 2015; Radnitz et al 2015; Dyett et al 2013; Rothgerber 2013;
Greenebaum 2012; Timko et al 2012; Izmirli & Phillips 2011; Waldmann et al 2003; Larsson
et al 2003).
The questionnaire consisted of four sections with MCQ and Likert scale type questions,
followed by 24-hour recall and a food frequency questionnaire (FFQ) to measure dietary intake
analysis. Household food measurement photographs were developed to assist respondents in
answering the 24-hour recall. Section A of the questionnaire covered the demographic
characteristics of the respondents. Section B of the questionnaire addressed the motives for
following a vegan diet. Section C of the questionnaire covered the challenges faced by
individuals following a vegan diet. Section D of the questionnaire investigated the nutritional
quality of the vegan diet. Closed-ended questions were also used which were less time
consuming and easier to complete by the participant. A copy of the questionnaire can be found
in Appendix A, p199 and household food measurements provided to the respondents when
completing Section D can be found in Appendix B, p217.
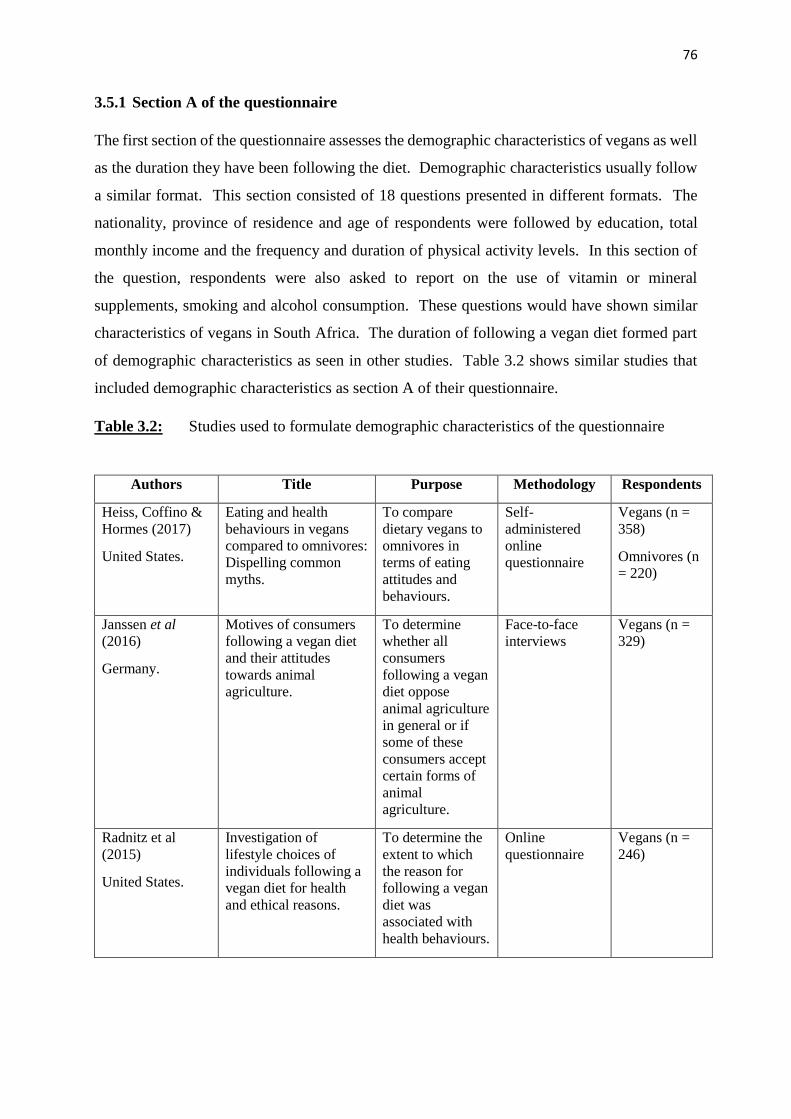
76
3.5.1 Section A of the questionnaire
The first section of the questionnaire assesses the demographic characteristics of vegans as well
as the duration they have been following the diet. Demographic characteristics usually follow
a similar format. This section consisted of 18 questions presented in different formats. The
nationality, province of residence and age of respondents were followed by education, total
monthly income and the frequency and duration of physical activity levels. In this section of
the question, respondents were also asked to report on the use of vitamin or mineral
supplements, smoking and alcohol consumption. These questions would have shown similar
characteristics of vegans in South Africa. The duration of following a vegan diet formed part
of demographic characteristics as seen in other studies. Table 3.2 shows similar studies that
included demographic characteristics as section A of their questionnaire.
Table 3.2: Studies used to formulate demographic characteristics of the questionnaire
Authors Title Purpose Methodology Respondents
Heiss, Coffino &
Hormes (2017)
United States.
Eating and health
behaviours in vegans
compared to omnivores:
Dispelling common
myths.
To compare
dietary vegans to
omnivores in
terms of eating
attitudes and
behaviours.
Self-
administered
online
questionnaire
Vegans (n =
358)
Omnivores (n
= 220)
Janssen et al
(2016)
Germany.
Motives of consumers
following a vegan diet
and their attitudes
towards animal
agriculture.
To determine
whether all
consumers
following a vegan
diet oppose
animal agriculture
in general or if
some of these
consumers accept
certain forms of
animal
agriculture.
Face-to-face
interviews
Vegans (n =
329)
Radnitz et al
(2015)
United States.
Investigation of
lifestyle choices of
individuals following a
vegan diet for health
and ethical reasons.
To determine the
extent to which
the reason for
following a vegan
diet was
associated with
health behaviours.
Online
questionnaire
Vegans (n =
246)

77
3.5.2 Section B of the questionnaire
This section of the questionnaire addressed the motives for following a vegan diet and what
influenced the respondents when transitioning to this diet. There are currently no published
studies done in South Africa that have addressed this topic. Section B of the questionnaire
consisted of three questions which included two Likert scale type questions and one closed-
ended question. The first Likert scale question directly addressed the motives of following a
vegan diet, whereby the respondent had to use a Likert scale to answer 16 different statements.
The second question was to find out if the respondent’s motivation had changed since the
beginning of their diet. The final question addressed what assisted the respondents during their
transition into the vegan diet, whereby the respondents had to use a Likert scale to answer 13
different statements. However, the studies in Table 3.3 were used to formulate questions for
this section of the questionnaire as they addressed similar objectives to the present study.
Table 3.3: Studies used to assess the motives for following a vegan diet
Authors Title Purpose Methodology Main motive
Janssen et al
(2016)
Germany.
Motives of
consumers following
a vegan diet and
their attitudes
towards animal
agriculture.
To identify different
segments of
consumers according
to their motivation
for following a vegan
diet.
Face-to-face
interviews
Ethical reasons
Kerschke-Risch
(2015)
Germany.
Vegan diet: motives,
approach and
duration.
To determine the
motives, approach
and duration of a
vegan diet.
Web-based
questionnaire
Environmental
reasons
Radnitz et al
(2015)
United Sates.
Investigation of
lifestyle choices of
individuals
following a vegan
diet for health and
ethical reasons.
To determine the
extent to which the
reason for following
a vegan diet was
associated with
health behaviours.
Online
questionnaire
Ethical reasons
Dyett et al (2013)
United states.
Vegan lifestyle
behaviours. An
exploration of
congruence with
health-related beliefs
and assessed health
indices.
To investigate health
belief as a major
motive for diet and
lifestyle behaviours
and determine the
congruence with
selected health and
nutrition outcomes.
Written self-
administered
questionnaire
Health- related
reasons

78
Table 3.3: Studies used to assess the motives for following a vegan diet continued
Authors Title Purpose Methodology Main motive
Rothgerber (2013)
United States.
A meaty matter. Pet
diet and the
vegetarian’s
dilemma.
To examine pet
ownership and
current pet diet of
non-meat eaters.
Online
questionnaire
Ethical reasons
Greenebaum
(2012)
United States.
Veganism, identity
and the
quest for
authenticity.
To examine how
vegans negotiate the
difficulties of living
in an animal-based
consumer-driven
society.
Face-to-face
interviews
Ethical reasons
Timko et al
(2012)
United States.
Will the real
vegetarian please
stand up? An
investigation of
dietary restraint
and eating disorder
symptoms in
vegetarians versus
non-vegetarians.
To determine
whether or not
differences existed
between vegans,
vegetarians, semi-
vegetarians and
omnivores.
Web-based
questionnaire
Ethical reasons
Izmirli & Phillips
(2011)
Turkey and
Australia.
The relationship
between student
consumption of
animal products
and attitudes to
animals in Europe
and Asia.
To determine the
relationship between
the consumption of
animal products and
attitudes towards
animals among
university students in
Eurasia.
Web survey Health-related
reasons
Waldmann et al
(2003)
Germany.
Dietary intakes and
lifestyle factors of a
vegan
population in
Germany: results
from the German
Vegan Study.
To evaluate the
dietary intakes and
lifestyle factors of
German vegans.
Paper-based
questionnaire
Health-related
reasons
Larsson et al
(2003)
Sweden.
Veganism as status
passage: The
process of becoming
a vegan among
youths in Sweden.
The process of
becoming a vegan
among adolescents.
Group
interview
Ethical reasons
3.5.3 Section C of the questionnaire
This section of the study looked at the challenges that vegans experienced during their transition
into following the vegan diet. The questions also addressed what assisted respondents in
overcoming these challenges. This section of the questionnaire consisted of seven questions.
The format of these questions included three Likert scale type questions and four multiple

79
choice questions. The questions in the first part of this section addressed the feelings and
emotions experienced by the respondents during their transition into a vegan diet. This was
followed by determining if the respondents faced any financial challenges and where most of
their vegan food products were purchased from. The section ended with a Likert scale question
addressing the challenges faced during their transition, how these challenges were overcome
and their agreement or disagreement to three common statements about a vegan diet. Table 3.4
shows the studies used to formulate questions for this section of the questionnaire.
Table 3.4: Studies used to assess the challenges associated with following a vegan diet
Authors Title Purpose Methodology Respondents
Emre (2016)
Germany.
No Milk Today?
Challenges of
Maintaining a Vegan
Diet in Germany.
To identify the
variables
influencing the
maintenance of a
vegan diet in
Germany.
Online
questionnaire
Vegans (n =
2847)
Hirschler (2011)
United States.
“What Pushed Me over
the Edge Was a Deer
Hunter”: Being Vegan
in North America.
To examine the
interpersonal and
intrapersonal
impact of the diet
and associated
practises.
Semi-structured
interviews
Vegans (n =
32)
McDonald (2000)
Europe.
“Once you know
something, you can’t
not know it”: An
empirical look at
becoming vegan.
To investigate
how vegans learn
to adopt a vegan
lifestyle.
Unstructured
interviews
Vegans (n =
12)
3.5.4 Section D of the questionnaire
This section of the questionnaire assessed that nutritional quality of the vegan diet. This section
included a 24-hour recall for one day of the week and a quantitative FFQ which included a
variety of different food groups consumed by South African vegans. Both measures were used
for dietary intake analysis. The study by Dyett et al (2014) was especially important in assisting
the development of the FFQ specifically for vegan respondents. This section of the
questionnaire consisted of four questions. The first question was a Likert scale type question
consisting of five statements about the nutritional quality of the vegan diet, this was followed
by a question on the frequency of visiting restaurants to consume vegan meals.

80
The 24-hour recall and FFQ were designed in order to gather as much nutritional information
as possible from the respondents. For the 24-hour recall, respondents were asked to indicate
all food, beverages and condiments they have consumed in the last 24 hours and to also include
the time and place of consumption, preparation method and portion size of that particular meal.
An example of a 24-hour recall was provided to assist respondents with completing the recall.
The FFQ consisted of 291 vegan food items. The respondents were asked to indicate by
selecting how much of the item they used per meal or snack and how often they consumed
meals or snacks containing this particular food item. The respondents were given three quantity
options to choose from and five frequency options. For both the 24-hour recall and FFQ, clear
instructions were indicated above each question, providing assistance to the respondents. The
researcher’s personal details were also included at the beginning of the questionnaire for the
respondents to use should they encounter any difficulty during the questionnaire or required
additional information. Similar studies that used this format can be seen in Table 3.5.
Table 3.5: Studies used to assess 24-hour recalls and food frequency questionnaires
Authors Title Purpose Methodology Respondents
Dyett et al (2014)
United States.
Evaluation of a
Validated Food
Frequency
Questionnaire for Self-
Defined Vegans in the
United States.
To develop and
validate a de novo
food frequency
questionnaire for
self-defined
vegans in the
United States.
Three 24-hour
recalls (Two
weekday and
one weekend
day)
Food frequency
questionnaire
Vegans living
in the United
States (n =
100)
Elorinne et al
(2016)
Finland.
Food and Nutrient
Intake and Nutritional
Status of Finnish
Vegans and Non-
Vegetarians.
To investigate the
nutritional status
of vegans, who
may be at risk of
nutritional
deficiencies.
Three-day diet
records
Finnish
vegans (n =
22)
Kristensen,
Madsen, Hansen,
Allin, Hoppe,
Fagt, Lausten,
Gøbel,
Vestergaard,
Hansen &
Pedersen (2015)
Denmark.
Intake of macro- and
micronutrients in
Danish vegans.
To determine and
evaluate the
dietary and
supplementary
intake of vegans.
Four-day
weighed food
record
Danish vegans
(n = 70)

81
Table 3.5: Studies used to assess 24-hour recalls and food frequency questionnaires
continued
Authors Title Purpose Methodology Respondents
Clarys et al
(2014)
Belgium.
Comparison of
Nutritional Quality of
the Vegan, Vegetarian,
Semi-Vegetarian,
Pesco-Vegetarian and
Omnivorous Diet.
To compare the
quality and the
contributing
components of
vegan, vegetarian,
semi-vegetarian,
pesco-vegetarian
and omnivorous
diets.
Food frequency
questionnaire
Healthy Eating
Index 2010
(HEI-2010)
Mediterranean
Diet Score
(MDS)
Vegans living
in Belgium (n
= 104)
Waldmann et al
(2004)
Germany.
Dietary Iron Intake and
Iron Status of German
Female Vegans: Results
of the German Vegan
Study.
To determine the
iron status in
German vegan
women using
dietary intake
data, information
on menstrual
cycle, and
biochemical
parameters.
Two 9-day food
frequency
questionnaires
German vegan
women (n =
75)
Waldmann et al
(2003)
Germany.
Dietary intakes and
lifestyle factors of a
vegan population in
Germany: results from
the German Vegan
Study.
To evaluate the
dietary intakes
and lifestyle
factors of German
vegans.
Two 9-day food
frequency
questionnaires
German
vegans (n =
154)
Larsson &
Johansson (2002)
Germany.
Dietary intake and
nutritional status of
young vegans and
omnivores in Sweden.
To assess the
dietary intake and
nutritional status
of a group of
Swedish vegans
aged 16–20 years
living in Umeå,
Sweden.
Diet history Swedish
vegans (n =
30)
Thorogood, Roe,
McPherson &
Mann (1990)
United Kingdom.
Dietary intake and
plasma lipid levels:
lessons from a study of
the diet of health
conscious groups.
To re-examine the
contentious
relation between
diet and plasma
lipids within a
population.
Four-day diet
record
British vegans
(n = 52)

82
3.6 Pilot study
The pilot study consisted of five individuals following a strict vegan diet and who were part of
the SAVS Facebook group online. The researcher sent personal emails to each of the
respondents of the pilot study, detailing the purpose of the pilot study and the attached Survey
Monkey link to the questionnaire.
Each participant was advised to reply to the email with both positive and negative feedback on
the content and questions, as well as comment on the length and flow of the questionnaire.
Once feedback from the pilot study was received, the following alterations were made:
Section A: If respondents selected “No” to being a South African citizen living in South
Africa, the questionnaire would proceed to the next question. A disqualification page
with a message was then added so that only South African citizens participate in this
study.
Skip logic or skip sequencing was added to questions that respondents were not required
to answer. According to Manski & Molinari (2008), skip sequencing is a common
survey practice where the answer to an opening question determines whether subsequent
questions should be answered by the respondent. The main objective is to remove
questions that are inapplicable to the respondent and this will decrease both interviewing
costs and respondent burden. However, adding skip sequencing can also cause data
quality concerns.
“Requires an answer” was inserted for those questions that required an answer from
respondents. This was done to prevent respondents from not answering the questions
completely.
The 24-hour recall question could not be answered due to formatting issues. This was
changed into easy to fill text boxes.
The FFQ was very long and consisted of fourteen pages. The options were then reduced
and instructions were added below the question so that respondents knew what was
required from them when answering. This was done by consulting with the professional
statistician on different formats to reduce the number of household quantities and
frequency options and only the most commonly consumed items were included. It was

83
decided that food items be categorised according to food groups in order to make it
easier for respondents to understand and answer. The final FFQ consisted of nine pages.
After the changes were completed, the responses were cleared from the website and a new
link was formed with the final questionnaire.
3.7 Data capturing and analyses
Once the online questionnaire was validated by a professional statistician, the director of the
SAVS group was contacted and the link was emailed to be posted on the relevant Facebook
pages. The director consented to posting the link on the main SAVS page as well as smaller
sub-groups which were created to cover specific provinces in South Africa. The link was posted
on the following groups:
1. South African Vegan Society Facebook main page (Pinned post and announcement).
2. Vegan Society South Africa National Facebook page (Pinned post).
3. South African Vegan Society – Gauteng Facebook page.
4. South African Vegan Society – KwaZulu-Natal Facebook page.
5. South African Vegan Society – Western Cape Facebook page.
6. South African Vegan Society – East London Facebook page.
Data from the final responses were tabulated by the Survey Monkey programme, saved and
downloaded and sent to the statistician for further analyses. The incomplete surveys were
excluded and only the completed surveys were used for the data analyses. Incomplete surveys
were those surveys which the respondents did not complete and pressed the exit button at any
section of the questionnaire. The MRC Food Finder programme was used to analyse the 24-
hour recall. This programme was used for the analysis and conversion of food items to
nutrients. The analysis can be done for individuals or groups of individuals. The programme
requests the user to choose the type of food consumed from a list of foods or beverages and the
quantity of food or beverage consumed in household measures or portion sizes in order to create
a nutrient analysis. The nutrient analysis can be calculated for a single meal or meals consumed
for an entire day. Standard recipes can be broken down into the food items and these items can
be entered into the programme in a raw or cooked form. The data was entered on two separate
occasions into the programme, to ensure that no errors were made.
In order to analyse the data, the Statistical Package for the Social Sciences (SPSS), version 23
database was used. The following tests were used in the analysis:

84
Descriptive statistics which included means and standard deviations, where used when
applicable. This type of test uses graphs and tables to provide data. This test was used
for Likert scale type responses. There were a total of six Likert scale type questions with
six response options. Six response options were provided, so that respondents were able
to quantify more on how much they agree or disagree about a particular statement. The
Likert scale type questions were asked for those questions directly addressing the
objectives of the study.
Chi-square goodness-of-fit-test: A univariate test, used on a categorical variable to test
if any of the response options were selected significantly more or less frequently than
other options. It is assumed that all responses were selected equally under the null
hypothesis. This test was used mainly for questions from Section A of the questionnaire.
Chi-square test of independence: Used on cross-tabulations to see whether a significant
relationship existed among two variables presented in the cross-tabulation. A Fisher’s
exact test was used if conditions were not met. Cross-tabulations usually test the
relationship among variables of gender, level of education and following a strict vegan
diet.
Binomial test: Tests whether a significant proportion of respondents selected one of two
possible responses. This can be extended when data with more than two response
options was split into two distinct groups. For example, those type of questions that had
“yes” or “no” responses.
One sample t-test: Tests whether a mean score is significantly different from a scalar
value. This test was used to find significant agreement of factors, particularly in Section
B of the questionnaire
Bartlett’s Test of Sphericity and Kaiser-Meyer-Olkin Measure of Sampling Adequacy
was used to indicate the suitability of the data for structure detection. This test was used
in Section B regarding the factors that assisted the respondents’ transition into
veganism.
Table 3.6 shows the objectives of the study, each variable which required analyses and the
statistical tests that were applied to each of the objectives. The confidence interval was 95%
and the measured statistical significance was p < 0.0005.

85
Table 3.6: Data analysis of objectives
Objective Variables required for the analysis Statistical tests applied
To determine the
demographic
characteristics of
vegans.
Gender
Age
Race group
Level of education
Income bracket (working or unemployed)
Duration for following the vegan diet
Descriptive statistics
Fishers exact
Chi-square tests
Chi-square goodness-
of-fit test
Binomial test
To determine the
factors that
influenced an
individual to
become a vegan.
Factors include:
o Ethical, health, environmental,
and other.
The factors influencing the decision:
o Magazines, social media,
dietitians, friends and family
Who assisted the transition into
veganism?
Descriptive statistics
One-sample t-test
Bartlett’s Test of
Sphericity
Kaiser-Meyer-Olkin
Measure of Sampling
Adequacy
To determine the
challenges
associated with
becoming a vegan
and how these
challenges were
overcome.
Social challenges (fitting in with family
and friends, work colleagues).
Financial challenges (affording vegan
products vs meat products).
Psychological challenges (replacing meat
and fear about being isolated).
Who provided the most support in the
decision to become a vegan: family/
friends/ dietitian/ media/ vegan support
groups?
Descriptive statistics
One-sample t-test
Chi-square goodness-
of-fit test
To determine the
nutritional quality
of dietary intake
compared to
recommendations
(EARs) and to
identify the variety
of food groups and
types of processed
food consumed in
the vegan diet.
24-hour recall (1 day)
Food frequency questionnaire with main
food groups.
Types of vegan processed food added to
the diet (vegan milk, vegan meat
products, vegan butter).
Descriptive statistics
3.8 Data quality control
3.8.1 Validity and reliability

86
According to Joppe (2000), validity and reliability are relevant concepts in research. Reliability
is the degree to which results are constant at all times and provides a detailed interpretation of
the study population. The research instrument may be considered reliable if the study results
can be repeated when a similar methodology is used. Validity is used to determine if the
research actually measures what it was proposed to measure or the accuracy of the research
results (Joppe 2000). The FFQ was constructed in line with a validated FFQ from a similar
study (Dyett et al 2014), before being validated by a professional South African statistician for
the present study. The respondents were instructed to provide a valid email address before
commencing with the questionnaire. These email addresses were saved to identify the
respondents and ensure that no respondent filled out the question more than once.
The respondents were provided with clear and concise instructions before answering each
question. The online service package, SurveyMonkey, used for the questionnaire was available
online 24-hours a day for the period of data collection. The questionnaire link was first posted
on the 14th of August 2019 and remained on the online group until the 14th of October 2019,
approximately 8.5 weeks (60 days). The link was posted twice more after the initial posting on
the 2nd of September 2019 (after 3 weeks online) and 26th of September (after 6 weeks online).
In the first month of August 2019, 162 vegans responded to the questionnaire. This number
reduced in September 2019, where 66 vegans responded to the questionnaire and 5 vegans
responded in October 2019. The last response was received on the 10th of October 2019.
Despite the reposting of the questionnaire, twice after the initial posting date, respondents
continued to decrease substantially. The researcher and statistician decided to close the online
questionnaire at the 60 day mark (14th of October 2019), due to the lack of further responses.
3.8.2 Content validity
Content validity is a measurement tool that provides an assessment of whether information is
comprehensive and effectively reflects the perceptions for the population under study.
Moreover, content validity ensures that response options; instructions and formatting are
applicable, by providing evidence to allow acceptability and understanding of the measure
(Brod, Tesler & Christensen 2009). Content validity was ensured by using previous and current
literature to formulate questions for the questionnaire. The questions were guided by studies
conducted in other countries around the world and foodstuffs were modified according to local
availability in South Africa. This was done by researching vegan food products in

87
supermarkets and online stores. The questions were formulated based on addressing the study
objectives.
The researcher obtained face validity from a statistician and content validity from a vegan
expert. A professional South African statistician edited and revised the questionnaire numerous
times to identify any bias and repetition. Both the 24-hour recall and FFQ were reduced in
length to make it less time consuming for respondents to complete. More answer options were
added to the Likert scale type questions to improve analysis. The director of the SAVS group
who is a South African expert in veganism also reviewed the questionnaire by ensuring the
questions did not cause misconceptions among the vegan respondents. The word “veganism
“was replaced by “following a vegan diet” throughout the questionnaire as this study focused
on the vegan diet and not the vegan lifestyle. The pilot study was then conducted to test the
online questionnaire.
3.8.3 Reliability
Questions that were required to be answered had an asterisk next to the questionnaire and
respondents could not proceed to the next page until all required questions were answered.
According to Chang & Vowles (2013), once responses are obtained online by clicking to the
next question, they are recorded instantly. Therefore, the questionnaire must be designed so
that respondents do not input invalid responses. In this way input and processing errors could
be averted and results were more reliable.
3.9 Reduction of bias
Bias was reduced during the design of the questionnaire by developing questions that were
neutral, multiple questions were asked to sufficiently cover each topic, the order of the questions
were addressed so that one question did not influence the next question and instructions were
clear and unbiased (Kitchenham & Pfleeger 2002).
3.10 Ethical consideration
Ethical approval was received from the Biomedical Research Ethics Committee (BREC). The
gatekeepers’ permission letter was attained from the director of SAVS, to allow the
questionnaire to be published on the group’s Facebook pages (Appendix C, p234). The
reference number for the approval was BE712/18 (Appendix D, p235).
Respondents were notified that any personal information provided would not be disclosed to
the public and was to be used only for the study (Appendix E, p236). This was done to ensure

88
confidentiality. Respondents were able to withdraw from participation at any given time by
pressing the exit button on the questionnaire. The letter of informed consent appeared at the
beginning of the questionnaire when the respondents clicked on the link posted online. Once
the respondents clicked “okay” after reading the informed consent where they able to proceed
to answering the questionnaire. The data set was anonymised after data were extracted from
the researcher’s personal SurveyMonkey account and the questionnaire and account was
deleted. Therefore, data cannot be associated with any of the respondents.
3.11 Summary
This chapter addressed the methodology used to determine the motives and challenges facing
South African vegans and the nutritional quality of their diet. The design of the questionnaire
and supporting literature were outlined. The results of the data analysis will be presented in the
next chapter.

89
CHAPTER 4: RESULTS
This chapter presents the results of the study in accordance to the objectives. For each objective,
a number of statistical tests were used and data analysis was conducted. The chapter is
sectioned into the response rate and results obtained from the demographic characteristics of
the respondents, the motives for following a vegan diet and challenges that respondents found
whilst following a vegan diet and how these challenges were overcome. The chapter concludes
with the nutritional quality of the respondent’s diet by presenting results from the 24-hour recall
and food frequency questionnaire (FFQ).
4.1 The response rate and demographic characteristics of the respondents
A total of 222 responses were collected, however in the final analysis only 205 of these
responses were included. Five respondents had submitted two questionnaires each and only
one completed questionnaire was retained. Three respondents only entered their email address
and did not answer anything further, while nine respondents provided only demographic
characteristics and did not complete anything further than section A. These questionnaires were
also excluded from the study.
The sample population consisted of 9 819 members, however the study sample consisted of
205 respondents, of which 17.6% (n = 36) were male and 82.4% (n = 169) were female. The
study was comprised of predominately of White respondents (82.4%, n = 169), followed by
Indian/Asian respondents (9.3%, n = 19), Coloured respondents (3.4%, n = 7), Black African
respondents (2.4%, n = 5) and the remainder of the respondents were from other race groups
(2.4%, n = 5).
Most respondents resided in Gauteng province (43.9%, n = 90), followed by Western Cape
(29.3%, n = 60), KwaZulu-Natal (19.0%, n = 39), Eastern Cape (5.4%, n = 11) and North West
province (1.5%, n = 3). The two provinces with the least number of respondents were
Mpumalanga (0.5%, n = 1) and Free State (0.5%, n = 1). No respondents in the study resided
in Limpopo and the Northern Cape.
Table 4.1 shows the marital status and age category among the respondents in the study,
followed by the level of education and current monthly income. Most respondents were single
(53.2%, n = 109) or married (37.6%, n = 77). Most of the respondents belonged to the 18-29
year category (29.3%, n = 60) followed by the 40-49 year category (22.0%, n = 45). Two
respondents belonged to the <18 years category and while it is not known exactly how old they

90
were, the Facebook age account age restriction is 13 years and older and it was assumed that
no parental consent was required for the respondent to participate. In South Africa, currently
there is no age specified in law for research (Strode, Slack & Essack 2010), however
adolescents can provide individual consent for low-risk research (National Health Research
Ethics Council 2004). Parental consent is required depending on the type of research, for
example, research involving clinical trials require parental consent and agreement from the
child (South African Department of Health 2006). The highest level of education was a
diploma/degree (37.1%, n = 76), followed by a post-graduate degree (30.2%, n = 62). The total
current monthly income in this sample population was between the R25 601 – R51 200 category
(23.4%, n = 48), followed by the R12 801 – R25 600 category (20.5%, n = 42) per month.
Table 4.1: Marital status, age category, level of education and monthly income of the
sample population (n = 205)
n %
Marital status Single 109 53.2
Married 77 37.6
Divorced/separated 15 7.3
Widowed 4 2.0
Age <18 2 1.0
18 – 29 60 29.3
30 – 39 44 21.5
40 – 49 45 22.0
50 – 59 36 17.6
60+ 18 8.8
Level of education Some schooling 1 0.5
Matric 45 22.0
Certificate 20 9.8
Diploma/Degree 76 37.1
Post graduate degree 62 30.2
Other* 1 0.5
Monthly income No income 32 15.6
Up to R400 2 1.0
R 801 – R 1 600 5 2.4
R1 601 – R 3 200 7 3.4
R 3 201 – R 6 400 10 4.9
R 6 401 – R 12 800 32 15.6
R 12 801 – R 25 600 42 20.5
R 25 601 – R 51 200 48 23.4
R 51 201 – R 102 400 16 7.8
R 102 401 – R204 800 3 1.5
R204 801 or more 18 3.9
*Training programmes

91
A binomial test revealed that a significant number of respondents 81.5% (n = 167) (p < 0.0005)
responded ‘yes’ to following a strict vegan diet and 18.5% (n = 38) responded ‘no’.
A Fisher’s exact test found a significant relationship between gender and education amongst
those who followed a strict vegan diet, (Fisher’s exact 163.954, p = 0.002). A significant
number of male respondents with either some schooling, a post graduate degree/diploma or
‘other’ qualification followed a vegan diet.
Table 4.2 shows the results of the length of time that the respondents had been following a
vegan diet. A chi-square goodness-of-fit test showed a significant number of the respondents
had been following a vegan diet from one to less than 5 years (χ2 (7) = 143.449, p < 0.0005).
Table 4.2: Respondent length of following the vegan diet (n = 205)
Time period n %
<6 months 24 11.7
6 months - <1 year 19 9.3
1 - <3 years 79 38.5
3 - <5 years 29 14.1
5 - <7 years 16 7.8
7 - <9 years 10 4.9
9 - 10 years 5 2.4
>10 years 23 11.2
Lifestyle factors including smoking, consumption of alcoholic beverages, supplementation use
and physical activity was tested among the population. Most of the respondents did not smoke
83.9% (n = 172) while 16.1% (n = 33) did. Alcoholic beverages were consumed by 60.0% (n
= 123) of the population and 40.0% (n = 82) did not consume these beverages. A chi-square
goodness-of-fit test showed a significant number of the respondents consumed alcoholic
beverages ‘less than once a week’ (56%, n = 27.3), followed by ‘once a week’ (13.2%, n = 27)
(χ2 (6) =117.902, p<0.0005). With regards to supplementation use, 72.7% (n = 149) consumed
supplements, whilst (27.3%, n = 56) did not consume supplements.
A binomial test indicated a significant number of respondents (84.9%, n = 174) participated in
physical activity (p=<0.0005) whilst 15.1% (n = 31) did not. Table 4.3 shows reports on the
duration and type of physical activity.

92
Table 4.3: Reported analyses of physical activity (n = 174)
Low Intensity: Casual
walking or bike
riding, yoga,
stretching , walking
up the stairs
Moderate Intensity:
Weight training,
jogging, cycling,
swimming, brisk
walking, aerobics
High intensity:
Circuit training,
vigorous forms of
weight training,
running, cardio
workouts
Frequency of physical
activity
n % n % n %
Never 4 2.0 26 12.7 78 38.0
Once a week 12 5.9 37 18.0 27 13.2
Twice a week 20 9.8 26 12.7 27 13.2
Three times a week 32 15.6 37 18.0 20 9.8
Four times a week 24 11.7 23 11.2 11 5.4
Five times a week 15 7.3 7 3.4 7 3.4
Six times a week 5 2.4 8 3.9 4 2.0
Every day 48 23.4 10 4.9 0 0
More than once a day 14 6.8 0 0 0 0
Descriptive statistics were conducted and a significant number of the population who exercised,
participated in low intensity physical activity ‘everyday’ (n = 48), ‘three times a week” (n = 32)
or ‘four times a week’ (n = 24) (p < 0.0005) Moderate intensity physical activity was done by
a significant number of the population at most ‘4 times a week’ (p < 0.0005). In this study,
moderate physical activity was mostly done ‘once a week’ (n = 37), ‘three times a week’ (n =
37), ‘twice a week” (n = 26), and ‘four times a week’ (n = 23). High intensity physical activity
is done at most ‘twice a week’ (n = 27), followed by ‘once a week’ (n = 27). Most of the
population (n = 78), never participated in high intensity physical activity. A chi-square
goodness-of-fit test found that a significant number of respondents participated in physical
activity which was ‘low intensity’ (χ2 (8) =79.966, p < 0.0005), followed by ‘moderate
intensity’ (χ2 (7) =48.161, p < 0.0005) and then ‘high intensity’ (χ2 (6) =152.989, p < 0.0005).
The duration of participating in physical activity on average in a day is presented in Table 4.4.

93
Table 4.4: Duration of participating in physical activity on average in a day (n = 174)
Duration n %
<30 minutes 28 13.7
30 minutes - <1 hour 85* 41.5
1 - <2 hours 49* 23.9
2 - <3 hours 9 4.4
At least 3 hours 3 1.5
*Indicates a significant number according to the chi-square goodness of fit test.
A chi-square goodness-of-fit test showed that a significant number of the respondents (χ2 (4)
=127.724, p < 0.0005) participated in physical activity on average between 30 minutes to < 1
hour (n = 85), followed by between 1 hour and < 2 hours (n = 49) in a day.
4.2 The motives for following a vegan diet
One sample t-tests were conducted to test the motives of following a vegan diet among the
sample population. The results of these tests are presented in Table 4.5.
Table 4.5: Reported analyses of motives for following a vegan diet (n = 205)
Strongly
disagree
Disagree Slightly
disagree
Slightly
Agree
Agree Strongly
agree
n % n % n % n % n % n %
1. Ethical concern for animals
(preventing cruelty, animal
rights and welfare).
3 1.5 3 1.5 1 0.5 6 2.9 20 9.8 172 83.9
2. To improve health. 6 2.9 16 7.8 7 3.4 36 17.6 55 26.8 85 41.5
3. Protecting the environment. 1 0.5 3 1.5 5 2.4 15 7.3 59 28.8 122 59.5
4. Family tradition and/or
friends following the diet.
115 56.1 47 22.9 13 6.3 12 5.9 14 6.8 4 2.0
5. Influence of social media. 72 35.1 50 24.4 13 6.3 35 17.1 22 10.7 13 6.3
6. Personal well-being. 10 4.9 9 4.4 3 1.5 32 15.6 64 31.2 87 42.4
7. To reduce the carbon
footprint/impact on the
environment.
3 1.5 6 2.9 5 2.4 33 16.1 56 27.3 102 49.8
8. The effect of animal product
consumption on climate change.
1 0.5 6 2.9 6 2.9 25 12.2 58 28.3 109 53.2
9. Religious beliefs (Jains,
Buddhists).
116 56.6 42 20.5 5 2.4 15 7.3 14 6.8 13 6.3
10. To prevent diseases and
illnesses.
20 9.8 21 10.2 4 2.0 46 22.4 52 25.4 62 30.2

94
Table 4.5: Reported analyses of motives for following a vegan diet (n = 205) continued
Strongly
disagree
Disagree Slightly
disagree
Slightly
Agree
Agree Strongly
agree
n % n % n % n % n % n %
11. Taste aversion to meat. 39 19.0 41 20.0 19 9.3 47 22.9 39 19.0 20 9.8
12. Social justice (world hunger
could be reduced by feeding
nutritious grains to the
underprivileged instead of to
farm animals).
12 5.9 8 3.9 14 6.8 34 16.6 53 25.9 84 41.0
13. Protect endangered species. 7 3.4 9 4.4 8 3.9 30 14.6 59 28.8 92 44.9
14. Less water usage. 5 2.4 9 4.4 2 1.0 40 19.5 55 26.8 94 45.9
15. Prevent pollution. 5 2.4 10 4.9 10 4.9 32 15.6 61 29.8 87 42.4
16. Protect factory and farm
workers from unsafe conditions.
24 11.7 25 12.2 25 12.2 50 24.4 40 19.5 41 20.0
Table 4.6 shows the mean motivating factors of respondents who follow a vegan diet. There
was a significant agreement using one-sample t-tests, that motivating factors included: ethical
concern for animals (M = 5.7, t (204) = 35.838, p < 0.0005); followed by protecting the
environment, (M = 5.41, t (204) = 30.350, p < 0.0005); and the effect of animal product
consumption on climate change (M = 5.24, t (204) = 24.276, p < 0.0005). There was neither a
significant agreement nor significant disagreement for motivating factors such as family
tradition and/or friends following the diet (M = 1.90, t (204) = -17.123, p < 0.0005); religious
beliefs, (M = 2.06, t (204) = -12.956, p < 0.0005); and influence of social media (M = 2.63, t
(204) = - 7.594, p < 0.0005).
Table 4.6: The mean motivating factors for following a vegan diet (n = 204)
Mean SD p Value t Df
1. Ethical concerns for animals
(preventing cruelty, animal rights and
welfare).
5.70 0.878 0.000* 35.838 204
2. To improve health. 4.82 1.369 0.000* 13.800 204
3. Protecting the environment. 5.41 0.901 0.000* 30.350 204
4. Family tradition and/or friends
following the diet.
1.90 1.336 0.000* -17.123 204
5. Influence of social media. 2.63 1.642 0.000* -7.594 204
6. Personal-wellbeing. 4.91 1.348 0.000* 15.005 204

95
Table 4.6: The mean motivating factors for following a vegan diet (n = 204) continued
Mean SD p Value t Df
7. To reduce the carbon footprint/impact
on the environment.
5.14 1.113 0.000* 21.108 204
8. The effect of animal product
consumption on climate change.
5.24 1.029 0.000* 24.276 204
9. Religious beliefs (Jains, Buddhists). 2.06 1.588 0.000* -12.956 204
10. To prevent diseases and illnesses. 4.34 1.633 0.000* 7.377 204
11. Taste aversions to meat. 3.32 1.655 0.125 -1.540 204
12. Social justice (world hunger could be
reduced by feeding nutritious grains to
the underprivileged instead of to farm
animals).
4.76 1.445 0.000* 12.448 204
13. Protection of endangered species. 4.96 1.303 0.000* 15.994 204
14. Saving of water. 5.01 1.219 0.000* 17.795 204
15. Preventing pollution. 4.93 1.268 0.000* 16.114 204
16. Protecting factory and farm workers
from unsafe conditions.
3.88 1.630 0.001* 3.321 204
* Represents a significant agreement according to one sample t-tests
A Kaiser Meyer Olkin measure of sampling adequacy test (KMO) and a Bartlett’s test for
sphericity was conducted on the data. The KMO test of 0.842 indicated that data was adequate
for successful and reliable extraction. The Bartlett’s test (p < 0.05) indicated that correlations
between items were not too low. Three factors were extracted which account for 67.17% of the
variance in the data. The factors can be interpreted as environment, health and social factors.
A one-sample t-test showed that there was a significant agreement with environmental
motivating factors (M = 5.1124, t (204) = 23.947, p < 0.0005) and health motivating factors (M
= 4.6911, t 9204) = 13.049, p < 0.0005). There was neither a significant agreement nor
significant disagreement with social motivating factors (M = 2.6183, t (204) = -12.523, p <
0.0005). Table 4.7 shows the mean of grouped motivating factors.

96
Table 4.7: The mean of grouped motivating factors (n = 204)
Mean SD p Value* t Df
Environmental factors 5.1154
0.96547
0.000 23.957
204
Health factors 4.6911
1.30691
0.000 13.049
204
Social factors 2.6183 1.00810 0.000 -12.523 204
*All factors grouped together where significant.
A binomial test revealed that a significant number of respondents (71%, n = 146) (p = <0.0005)
indicated that their motivation had not changed since they began following the diet. The one-
sample t-test was used to determine what factors assisted a respondent during the transition to
following a vegan diet. Table 4.8 shows there was a significant agreement among respondents
that reading ingredient lists on products assisted them the most in following a vegan diet (M =
4.77, t (204) = 12.034, p < 0.0005); followed by experimenting with vegan recipes (M = 4.75,
t (204) = 12.278, p < 0.0005) and becoming vegetarian first prior to becoming a vegan (M =
4.32, t (204) = 6.252, p < 0.0005). There was neither a significant agreement nor significant
disagreement that visiting a dietitian assisted a respondent during their transition into the diet
(M = 1.91, t (204) = -17.547, p < 0.0005); this was followed by following a 30 day vegan
challenge (M = 2.58, t (204) = -7.589, p < 0.0005) and family and/or friends assisting
respondents in following the diet (M = 2.73, t (204) = -6.350, p < 0.0005).
A KMO and Bartlett’s test was conducted on the data. The KMO test of 0.809 data was
adequate for successful and reliable extraction. The Bartlett’s test (p < 0.05) indicated that
correlations between items are not too low.
Table 4.8: The mean factors for transition into following a vegan diet (n = 204)
Mean SD p Value t Df
1. Social media and/or the internet 4.17 1.702 0.000* 5.642 204
2. Family and/or friends 2.73 1.732 0.000* -6.350 204
3. Vegan groups 3.75 1.646 0.033 2.143 204
4. Vegan cook books/magazines
/newspaper
3.45 1.643 0.656 -0.446 204
5. Vegan shops 3.38 1.639 0.279 -1.087 204
6. Health stores 3.34 1.559 0.135 -1.501 204
7. Becoming vegetarian first – prior
to becoming a vegan
4.32 1.871 0.000* 6.252 204

97
Table 4.8: The mean factors for transition into following a vegan diet (n = 204) continued
Mean SD p Value t Df
8. Experimenting with replacing
dairy and meat products with plant-
based alternatives
4.10 1.759 0.000* 4.905 204
9. Reading ingredient lists on
products
4.77 1.506 0.000* 12.034 204
10. Experimenting with vegan
recipes
4.75 1.459 0.000* 12.278 204
11. Visiting a vegan restaurant 3.93 1.788 0.001* 3.419 204
12. Following a 30 day vegan
challenge
2.58 1.735 0.000* -7.589 204
13. Visiting a Dietitian 1.91 1.296 0.000* -17.547 204
* Represents a significant agreement according to one sample t-tests
Three factors were extracted from the data. These factors include: vegan places and/or books,
experimenting with vegan food and social associations that may have assisted the respondents
to following a vegan diet. One-sample t-test showed that there was a significant agreement that
experimenting with food (M = 4.5398, t (204) = 11.061, p < 0.0005) and social support (M =
3.9585, t (204) = 4.347, p < 0.0005) assisted with the transition into a vegan diet according to
the respondents. There was neither a significant agreement nor significant disagreement that
vegan places and books assisted with the transition (M = 3.5220, t (204) = 0.228, p < 0.820).
Table 4.9 shows the mean of groups for transitioning factors.
Table 4.9: The mean of grouped transitioning factors (n = 204)
Mean SD p Value t Df
Vegan places/ books 3.5220 1.37872 0.820 0.228 204
Experimenting with food 4.5398 1.34600 0.000* 11.061 204
Social factors 3.9585 1.51042 0.000* 4.347 204
* Represents grouped factors that are significant
4.3 The challenges associated with following a vegan diet
A one sample t-test found that it was significantly easy (35.1%, n = 72) to transition into the
diet (p < 0.0005). A t-value of 3.5 was used in this test. Table 4.10 shows the other statement
selected to best describe the respondents’ transition into following a vegan diet.

98
Table 4.10: The statement chosen to best describe the transition into following a vegan diet
(n = 197)
Statement used to
describe the transition
n %
“Very easy” 36 17.6
“Easy” 53 25.9
“Moderately easy” 72 35.1
“Moderately difficult” 26 12.7
“Difficult” 9 4.4
“Very difficult” 1 0.5
A chi-square goodness-of-fit test showed a significant number of respondents felt excitement
and enthusiasm (29.3%, n = 60) as the emotion that best described the beginning of their
transition, followed by determined (22%, n = 45) and optimistic (20%, n = 41) (χ2 (9) =
206.299, p < 0.0005). Table 4.11 shows the emotions that respondents’ experienced at the
beginning of their transition into the diet.
Table 4.11: The emotions experienced at the beginning of following a vegan diet (n = 197)
Emotions n %
Excitement and enthusiasm 60 29.3*
Determined 45 22.0*
Optimistic 41 20.0*
Contentment 19 9.3
Confident 13 6.3
Confusion 9 4.4
Anxious 3 1.5
Resentful 3 1.5
Depressed 3 1.5
Fear 1 0.5 * Represents grouped factors that are significant
A binomial t-test found that a significant number of respondents 74.6% (n = 153) (p < 0.0005)
responded “no” to financial challenges whilst 21.5% (n = 44) (p < 0.0005) responded “yes” to
financial challenges experienced following a vegan diet. Therefore, following a vegan diet was
not a financial challenge among majority of the respondents.
Respondents were asked to indicate where most of their vegan food items were purchased. A
chi-square goodness-of-fit test showed that a significant number of respondents purchased their
food from the supermarket 86.3% (n = 177), followed by a health food store 7.8% (n = 16) and
online 2.0% (n = 4) (χ2 (2) = 284.234, p < 0.0005).

99
One sample t-tests were to determine what was most challenging during the time of
transitioning to a vegan diet according to the respondents. The results of these tests are
presented in Table 4.11.
Table 4.12: Reported analyses of challenges faced during the transition into the vegan diet
(n = 197)
Strongly
disagree
Disagree Slightly
disagree
Slightly
Agree
Agree Strongly
agree
n % n % n % n % n % n %
1. Communicating the decision
to family and friends.
19 9.3 26 12.7 11 5.4 46 22.4 55 26.8 40 19.5
2 .Associating yourself with
meat-eaters in a social setting
15 7.3 22 10.7 20 9.8 43 21.0 58 28.3 39 19.0
3 .Gathering information on
veganism
46 22.4 61 29.8 25 12.2 29 14.1 18 8.8 18 8.8
4. Avoiding meat and meat
products
67 32.7 46 22.4 13 6.3 17 8.3 22 10.7 32 15.6
5. Planning a suitable vegan diet 30 14.6 33 16.1 25 12.2 41 20.0 42 20.5 26 12.7
6. Finding vegan supermarkets 9 4.4 33 16.1 26 12.7 34 16.6 42 20.5 53 25.9
7. Finding vegan meal options
in restaurants
9 4.4 11 5.4 9 4.4 29 14.1 56 27.3 83 40.5
Table 4.13 shows the mean challenging factors to following a vegan diet according to the
respondents. There was a significant agreement among the respondents that finding vegan meal
options in restaurants (M = 4.83, t (196) = 13.336, p < 0.0005), was the main challenge to
following the vegan diet, followed by finding vegan supermarkets (M = 4.15, t (196) = 5.753,
p < 0.0005). There was neither a significant agreement nor significant disagreement that
gathering information on veganism (M = 2.83, t (196) = -5.898, p < 0.0005) as this was the least
challenge faced among the respondents, followed by avoiding meat and meat products (M =
2.88, t (196) =-4.567, p < 0.0005).

100
Table 4.13: The mean challenges faced while following a vegan diet (n = 197)
Mean SD p Value t Df
1. Communicating the decision to
friends and family.
4.08 1.597 0.000* 5.064 196
2. Associating yourself with meat-
eaters in a social setting.
4.14 1.521 0.000* 5.880 196
3. Gathering information on
veganism.
2.83 1.601 0.000* -5.898 196
4. Avoiding meat and meat
products.
2.88 1.896 0.000* -4.567 196
5. Planning a suitable vegan diet. 3.56 1.651 0.620 0.496 196
6. Finding vegan shops. 4.15 1.579 0.000* 5.753 196
7. Finding vegan meal options in
restaurants.
4.83 1.402 0.000*
13.336 196
* Represents a significant agreement according to one sample t-tests
The respondents were asked how they overcame the challenges that they faced at the beginning
of their transition into the vegan diet. A one sample t-test (t-value of 3.5) was used and the
mean factors of overcoming the challenges can be seen in Table 4.14. There was a significant
agreement among respondents that research on the internet (M = 5.16, t (196) = 20.592, p <
0.0005), followed by joining a vegan group on social media or attending meetings (M = 4.43, t
(196) = 9.036, p < 0.0005), assisted them in overcoming challenges that they faced during the
transition into following a vegan diet. There was neither a significant agreement nor significant
disagreement about visiting a dietitian (M = 2.04, t (196) = -15.728, p < 0.0005) as seen in
Table 4.15.
Table 4.14: Reported analyses of how challenges were overcome following a vegan diet (n
= 197)
Strongly
disagree
Disagree Slightly
disagree
Slightly
Agree
Agree Strongly
agree
n % n % n % n % n % n %
1. Research on the Internet. 5 2.4 4 2.0 5 2.4 23 11.2 64 31.2 96 46.8
2. Talking to/ educating friends
and family about veganism.
18 8.8 25 12.2 21 10.2 47 22.9 59 28.8 27 13.2
3. Visiting a Dietitian. 86 42.0 69 33.7 12 5.9 15 7.3 9 4.4 6 2.9
4. Reading vegan books and
other literature.
20 9.8 15 7.3 15 7.3 49 23.9 48 23.4 50 24.4
5. Joining a vegan group on
social media or attending
meetings.
11 5.4 14 6.8 18 8.8 45 22.0 54 26.3 55 26.8

101
Table 4.15: The mean factors that assisted in overcoming challenges following a vegan
diet (n = 197)
Mean SD p Value t Df
1. Research on the Internet. 5.16 1.130 0.000* 20.592 196
2. Talking to/ educating friends
and family about veganism.
3.94 1.514 0.000* 4.071 196
3. Visiting a Dietitian. 2.04 1.307 0.000* -15.728 196
4. Reading vegan books and other
literature.
4.22 1.587 0.000* 6.353 196
5. Joining a vegan group on social
media or attending meetings.
4.43 1.447 0.000* 9.036 196
* Represents a significant agreement according to one sample t-tests
Respondents were asked about their agreement to statements about what further challenges they
faced following a vegan diet. Table 4.16 shows the t-tests results regarding the agreement and
disagreement towards these statements. According to one-sample t-tests (t-value of 3.5) there
was a strong agreement among respondents that vegan recipes are easily accessible (M = 5.47,
t (196) = 33.018, p < 0.0005). There was neither a significant agreement nor significant
disagreement that it cost more to follow a vegan diet than a diet which included animal products
(M = 2.48, t (196) = -9.024, p < 0.0005). These results can be seen in Table 4.17.
Table 4.16: Reported analyses of statements regarding following a vegan diet (n = 197)
Strongly
disagree
Disagree Slightly
disagree
Slightly
Agree
Agree Strongly
agree
n % n % n % n % n % n %
1. Vegan recipes are easily
accessible.
4 2.0 4 2.0 8 3.9 61 29.8 120 58.5 197 96.1
2. There is an adequate range of
vegan products at your
nearest supermarket or retail
store.
26 12.7 24 11.7 21 10.2 47 22.9 54 26.3 25 12.2
3. It costs more to follow a
vegan diet than a diet which
includes animal products
73 35.6 49 23.9 24 11.7 22 10.7 16 7.8 13 6.3

102
Table 4.17: The mean statements regarding following a vegan diet (n = 197)
Mean SD p Value t Df
1. Vegan recipes are easily
accessible.
5.47 0.836 0.000* 33.018 196
2. There is an adequate range of
vegan products at your nearest
supermarket or retail store.
3.78 1.590 0.014 2.487 196
3. It costs more to follow a vegan
diet than a diet which includes
animal products.
2.48 1.583 0.000* -9.024 196
* Represents a significant agreement according to one sample t-tests
4.4 The nutritional quality of a vegan diet
T-tests were conducted to determine the nutritional quality of a vegan diet. The respondents
were asked about their agreement and disagreement with statements about the nutritional
quality of the vegan diet that they follow. Table 4.18 shows the results of these tests.
Table 4.18: Reported analyses of statements about nutritional quality of a vegan diet (n =
197)
Strongly
disagree
Disagree Slightly
disagree
Slightly
Agree
Agree Strongly
agree
n % n % n % n % n % n %
1. A vegan diet is nutritionally
complete and adequate for a
healthy lifestyle.
0 0 2 1.0 7 3.4 9 4.4 44 21.5 135 65.9
2. Meat alternatives are
healthier than meat products.
6 2.9 9 4.4 15 7.3 53 25.9 52 25.4 62 30.2
3. Milk alternatives provide
adequate calcium for the body.
7 3.4 15 7.3 20 9.8 38 18.5 66 32.2 51 24.9
4. Vegan food is bland and
requires many added
ingredients in order to be
appetizing.
114 55.6 43 21.0 12 5.9 15 7.3 10 4.9 3 1.5
5. Vegan food does not provide
a feeling of satiety.
130 63.4 45 22.0 3 1.5 12 5.9 4 2.0 3 1.5
One-sample t-tests showed (t-value of 3.5) a significant agreement among the respondents that
a vegan diet was nutritionally complete and adequate for a healthy lifestyle (M = 5.54, t (196)
= 34.731, p < 0.0005). There was a strong disagreement among the respondents that vegan
food does not provide a feeling of satiety (M = 1.60, t (196) = -24.455, p < 0.0005). The results
of these tests can be seen in Table 4.19.

103
Table 4.19: The mean statements about nutritional quality of a vegan diet (n = 197)
Mean SD p Value t Df
1. A vegan diet is nutritionally
complete and adequate for a healthy
lifestyle.
5.54 0.824
0.000* 34.731 196
2. Meat alternatives are healthier
than meat products.
4.631 1.289 0.000* 12.353 196
3. Milk alternatives provide
adequate calcium for the body.
4.49 1.365 0.000* 10.204 196
4. Vegan food is bland and requires
many added ingredients in order to
be appetizing.
1.85 1.277 0.000* -18.166 196
5. Vegan food does not provide a
feeling of satiety.
1.60 1.091 0.000* -24.455 196
* Represents a significant agreement according to one sample t-tests
A chi-square goodness-of-fit test was used to find out how often the respondents visit a
restaurant and order a vegan meal. The analysis showed that most of the respondents visited a
restaurant once a month (37.6%, n = 77), followed by less than once a month (27.8%, n = 57),
several times a month (26.3%, n = 54) and several times a week (4.4%, n = 9) (χ2 (3) =50.208,
p < 0.0005).
4.4.1 The food and beverage consumption of the respondents from the FFQ
The food frequency questionnaire was completed by (n = 113) respondents in the study. The
frequency of food items and beverages consumed by the respondents can be seen in Table 4.20.
The number of respondents who more frequently and least frequently consumed a particular
food item or beverage was grouped and listed below. Table 4.21 shows the amount of foods
consumed by the respondents.
Starches:
According to the analysis, the respondents most frequently used bread loaf was whole-wheat
bread, consumed weekly (1 - 2 slices) (18.0%, n = 37) and the least consumed was French bread
(<1 slice) (43.4%, n = 89) which was consumed never or rarely by most of the respondents. In
the bread – other category, white bread rolls were most frequently consumed weekly (½ – 1
small item) (19.0%, n = 39) and cornbread least frequently consumed (<½ small item) (52.7%,
n = 108) among the respondents. Pasta plain and eggless, was reported to be most commonly
consumed weekly (½ – 1 cup) (21.0%, n = 43), while the pasta never or rarely consumed was
organic black noodles (<½ cup) (52.7%, n = 108).

104
Grains and Cereals:
White or brown basmati rice was the most commonly consumed grain consumed once a month
by the respondents (½ - 1 cup) (20.0%, n = 41). The least consumed grain was barley flakes
(<½ cup) (53.7%, n = 110). Muesli was the most frequently consumed cereal among the
respondents (<½ cup) (8.3%, n = 17), while Special K cereal was least consumed (<½ cup)
(52.7%, n = 108).
Meat and milk substitutes:
Soya products were most commonly consumed by the respondents, at least once a week (½ –
cup) (28.8%, n = 59) while, tofu silken/soft was least frequently consumed (<½ cup) (29.3%, n
= 60). The most frequently consumed milk substitute, consumed at least once a day by the
respondents was soy milk (½ – 1 cup) (21.0%, n = 43). Flax milk (53.7%, n = 110) and quinoa
milk (53.7%, n = 110) was least consumed (<½ cup). Vegan cheese was consumed at least
once a month (1 - 2 slices) (22.0%, n = 45) by the respondents whereas an egg replacer was
never or rarely consumed (<1 tsp) (42.0%, n = 86).
Mixed food:
Vegan pizza was consumed at least once a month by the respondents (>3 slices) (32.7%, n =
67) while vegan lasagne was consumed less frequently (<1 - 3 slices) (36.1%, n = 74).
Vegetables:
The most frequently consumed leafy vegetable was cooked spinach consumed at least once a
week by the respondents (>1 cup) (24.9%, n = 51) and the least frequently consumed was
mustard greens (<½ cup) (45.4%, n = 93). With regards to non-leafy vegetables, cooked
broccoli was most frequently consumed at least once a week (½ – 1 cup) (36.1%, n = 74), while
cassava was least consumed by the respondents (<½ cup) (52.2%, n = 107). The vegetable
condiment most frequently consumed were tomato sauces, pasta and salsa at least once a week
(<½ cup) (24.9%, n = 51) and tomato juice was least frequently consumed (<½ cup) (48.8%, n
= 100).
Peas and Beans:
Among this food group, chickpeas was the most frequently consumed, at least once a week by
the respondents (½ - 1 cup) (32.2%, n = 66) while navy/haricot beans was the least consumed
(<½ cup) (48.8%, n = 100).

105
Baked beans (<½ cup) (17.6%, n = 36) were the most frequently consumed bean product at
least once a month by the respondents. Refried beans were least consumed (<½ cup) (46.8%,
n = 96).
Fruit:
The most frequently consumed fruit were bananas (½ - 1 medium item/ cup) (22.4%. n = 46) at
least once a day, while persimmons were the least consumed fruit (<½ medium item/cup)
(49.3%, n = 101) among the respondents. Dried raisins (<½ cup) (14.1%, n = 29) were the
frequently consumed dried fruit at least once a month, as well as dried pomegranates (<½ cup)
(52.2%, n = 107). Freshly prepared orange juice was the most frequently consumed fruit juice,
which was consumed at least once a month (<1 cup) (12.7, n = 26), while the least frequently
consumed beverage was coconut water (<1 cup) (43.9%, n = 90).
Fats:
The most frequently consumed fat was olive oil which is used by respondents at least once a
day (1 - 2 tsp) (20.5%, n = 42) and soybean oil was the least frequently used (<½ cup) (51.7%,
n = 106). Peanut butter was the most frequently used nut butter among the respondents (>2 tsp)
(19.0%, n = 39), consumed at least once a week. Hazelnut butter was least frequently consumed
(<1 tsp) (51.7%, n = 106). Almonds were the most frequently consumed nuts and were
consumed at least once a month by the respondents (<½ cup) (12.7%, n = 26). The most
frequently consumed fat spread was dairy free margarine, which was consumed at least once a
week (1 - 2 tsp) (15.6%, n = 32), while organic coconut butter was least consumed (<1 tsp)
(47.3%, n = 97). Hummus was the most frequently consumed dressing, at least once a week
(>2 tsp) (22.4%, n = 46) and peri – peri vegan mayonnaise was the least consumed dressing (<1
tsp) (46.3%, n = 95).
Snacks:
Potato chips were the most frequently consumed snack among the respondents at least once a
month (1 packet, 125g) (19.0%, n = 39), while coconut chips were least consumed (<1 packet
(<125g) (51.2%, n = 105). The most frequently consumed biscuit were wheat-free biscuits (1
- 2 items) (11.7%, n = 24) and least consumed was biscotti (<1 item) (52.2%, n = 107). In the
group of chocolate bars and sweets, organic dark chocolate bars were more frequently
consumed by the respondents (<1 item) (17.1%, n = 35) at least once a month. Peanut clusters
were never or rarely consumed (<1 item) (48.3%, n = 99).

106
Desserts:
The most frequently consumed dessert among the respondents was non-dairy yoghurt (<½ cup)
(10.7%, n = 22), while the least frequently consumed dessert was soy ice cream (<½ cup)
(45.9%, n = 94). Egg-less cake was most frequently consumed at least once a month by the
respondents (1 - 2 slices) (17.1%, n = 35), while fruit pie was least frequently consumed (<1
slice) (51.2%, n = 105).
Spreads and sweeteners:
Different flavours of jam were the most frequently consumed spreads, used at least once a
month by the respondents (1 - 2 tsp) (13.2%, n = 27), while organic chocolate spread was least
frequently consumed (<1 tsp) (49.3%, n = 101). Brown sugar was the most frequently
consumed sweetener used at least once a day by the respondents (1 - 2 tsp) (17.1%, n = 35),
and coconut syrup was the least frequently consumed sweetener (<1 tsp) (52.7%, n = 108).
Beverages:
Decaffeinated or regular coffee were the most commonly consumed beverage among the
respondents, consumed at least once a day (1 - 2 cup) (29.3%, n = 60), and fruit flavoured juice
was least frequently consumed by the respondents (<1 cup) (45.9%, n = 94). In the list of other
beverages, sugar-sweetened soft drinks were most frequently consumed (<1 cup) (11.2%, n =
23), consumed at least once a month. Non-alcoholic wine was least frequently consumed
among the respondents (<1 cup) (48.8%, n = 100).

107
Table 4.20: The frequency and consumption of food items from the FFQ (n = 113)
Frequency of food items consumed
Never/rarely At least once a
month
At least once a week At least once a day
n % n % n % n %
Milk substitutes
Almond milk 43 21.0 26 12.7 20 9.8 24 11.7
Cashew milk 103 50.2 6 2.9 1 0.5 0 0
Coconut milk 44 21.5 44 21.5 19 9.3 2 1.0
Flax milk 110 53.7 0 0 0 0 0 0
Hemp milk 109 53.2 0 0 1 0.5 1 0.5
Homemade soy milk 107 52.2 1 0.5 2 1.0 0 0
Macadamia milk 108 52.7 1 0.5 0 0 1 0.5
Oat milk 98 47.8 8 3.9 2 1.0 3 1.5
Quinoa 110 53.7 0 0 0 0 0 0
Rice milk 94 45.9 8 3.9 6 2.9 3 1.5
Soy milk 39 19.0 13 6.3 16 7.8 43 21.0
Bread Loaves
Brown bread 50 24.4 18 8.8 28 13.7 7 3.4
French bread 89 43.4 13 6.3 3 1.5 1 0.5
Rye bread 58 28.3 30 14.6 16 7.8 3 1.5
Sour dough bread 65 31.7 24 11.7 15 7.3 2 1.0
White bread 60 29.3 21 10.2 17 8.3 9 4.4
Whole-wheat bread 35 17.1 23 11.2 37 18.0 14 6.8
Bread Other
Cornbread 108 52.7 2 1.0 0 0 0 0
English muffin 98 47.8 8 3.9 3 1.5 0 0
Muffin – bran/oat 87 42.4 17 8.3 7 3.4 0 0
Pita 65 31.7 43 21.0 1 0.5 0 0
Rolls – brown 87 42.4 19 9.3 2 1.0 1 0.5
Rolls – white 56 27.3 39 19.0 15 7.3 1 0.5
Rolls – whole-wheat / seeded 68 33.2 33 16.1 6 2.9 3 1.5
Tortilla 75 36.6 27 13.2 8 3.9 0 0
Waffles 101 49.3 9 4.4 0 0 1 0.5
Pasta
Brown rice noodles 102 49.8 6 2.9 2 1.0 0 0
Buckwheat pasta 100 48.8 7 3.4 1 0.5 0 0
Chick pea pasta 97 47.3 9 4.4 2 1.0 1 0.5
Corn and quinoa pasta 107 52.2 1 0.5 1 0.5 1 0.5
Green pea pasta 106 51.7 4 2.0 0 0 1 0.5
Maize and rice pasta 100 48.8 8 3.9 3 1.5 0 0
Organic black noodles 108 52.7 1 0.5 0 0 0 0
Organic brown rice pasta 99 48.3 8 3.9 2 1.0 0 0
Organic lasagna sheets 99 48.3 9 4.4 2 1.0 0 0
Organic spelt pasta 108 52.7 2 1.0 0 0 0 0
Pasta – plain , egg 103 50.2 4 2.0 1 0.5 0 0
Pasta – plain , eggless 28 13.7 42 20.5 43 21.0 0 0
Pure rice pasta 97 47.3 10 4.9 3 1.5 0 0
Red lentil pasta 99 48.3 6 2.9 3 1.5 1 0.5
Rice and corn pasta 105 51.2 2 1.0 2 1.0 0 0
Wholegrain pasta 75 36.6 17 8.3 18 8.8 0 0
Grains
Amaranth 107 52.2 1 0.5 1 0.5 0 0
Barley flakes 110 53.7 0 0 0 0 0 0
Brown rice koji 109 53.2 1 0.5 0 0 0 0
Buckwheat 94 45.9 11 5.4 3 1.5 2 1.0
Bulgar wheat 81 39.5 22 10.7 6 2.9 1 0.5
Cornmeal 108 52.7 1 0.5 0 0 0 0
Couscous 50 24.4 39 19.0 19 9.3 1 0.5

108
Table 4.20: The frequency and consumption of food items from the FFQ (n = 113) continued
Frequency of food items consumed
Never/rarely At least once a
month
At least once a week At least once a day
n % n % n % n %
Flax meal 90 43.9 5 2.4 10 4.9 4 2.0
Maize meal 91 44.4 11 5.4 8 3.9 0 0
Millet 102 49.8 6 2.9 1 0.5 0 0
Oat bran 98 47.8 8 3.9 4 2.0 1 0.5
Oatmeal 81 39.5 11 5.4 10 4.9 6 2.9
Organic black rice 106 51.7 3 1.5 1 0.5 0 0
Organic wild rice 89 43.4 16 7.8 5 2.4 1 0.5
Organic wheat kennels 108 52.7 1 0.5 0 0 0 0
Pearled barley 86 42.0 18 8.8 4 2.0 1 0.5
Polenta 95 46.3 12 5.9 2 1.0 0 0
Puffed rice 103 50.2 3 1.5 3 1.5 0 0
Rice – brown 41 20.0 31 15.1 36 17.6 1 0.5
Rice – white 53 25.9 30 14.6 26 12.7 0 0
Rolled oats 39 19.0 31 15.1 23 11.2 17 8.3
Sorghum 106 51.7 3 1.5 1 0.5 0 0
Sushi rice 72 35.1 27 13.2 7 3.4 0 0
Teff grain 108 52.7 2 1.0 0 0 0 0
White / brown Basmati rice 44 21.5 41 20.0 22 10.7 2 1.0
White / red / black quinoa 65 31.7 30 14.6 11 5.4 2 1.0
Cereals
All Bran flakes 94 45.9 9 4.4 3 1.5 3 1.5
Cheerios 107 52.2 3 1.5 0 0 0 0
Cornflakes 99 48.3 4 2.0 7 3.4 0 0
Muesli 77 37.6 11 5.4 17 8.3 5 2.4
Oat bran flakes 99 48.3 6 2.9 3 1.5 1 0.5
Rice Krispies, Milo cereal 105 51.2 5 2.4 1 0.5 0 0
Special K 108 52.7 1 0.5 1 0.5 0 0
Weet-bix 85 41.5 8 3.9 10 4.9 7 3.4
Vegan Meats
Gluten (Seitan) 59 28.8 35 17.1 15 7.3 3 1.5
Textured vegetable protein
(from dry)
65 31.7 21 10.2 20 9.8 4 2.0
Soya products 12 5.9 31 15.1 59 28.8 9 4.4
Tofu – firm 41 20.0 47 22.9 19 9.3 2 1.0
Tofu – silken / soft 60 29.3 35 17.1 10 4.9 3 1.5
Egg / Cheese substitutes
Egg replacer 86 42.0 17 8.3 5 2.4 1 0.5
Vegan cheese 36 17.6 45 22.0 25 12.2 6 2.9
Mixed Food
Vegan lasagna 74 36.1 33 16.1 3 1.5 1 0.5
Vegan pizza 33 16.1 67 32.7 11 5.4 0 0
Peas and Beans
Adzuki beans 98 47.8 6 2.9 3 1.5 1 0.5
Black beans 29 14.1 39 19.0 37 18.0 3 1.5
Black-eye beans 67 32.7 30 14.6 9 4.4 1 1.5
Brown lentils 15 7.3 47 22.9 43 21.0 6 2.9
Butter beans 32 15.6 37 18.0 39 19.0 1 0.5
Cannellini beans 63 30.7 29 14.1 16 7.8 0 0
Chick peas 6 2.9 30 14.6 66 32.2 9 4.4
Green soybean 98 47.8 7 3.4 2 1.0 0 0
Kidney beans 32 15.6 32 15.6 42 20.5 3 1.5

109
Table 4.20: The frequency and consumption of food items from the FFQ (n = 113) continued
Frequency of food items consumed
Never/rarely At least once a
month
At least once a week At least once a day
n % n % n % n %
Lima beans 98 47.8 8 3.9 2 1.0 0 0
Mature soybean 99 48.3 6 2.9 2 1.0 1 0.5
Mung beans 76 37.1 22 10.7 9 4.4 2 1.0
Navy/haricot beans 100 48.8 7 3.4 1 0.5 0 0
Pinto beans 90 43.9 11 5.4 7 3.4 0 0
Red split lentils 44 21.5 33 16.1 29 14.1 3 1.0
Split green peas 66 32.2 27 13.2 16 7.8 0 0
Sugar beans 54 26.3 25 12.2 27 13.2 1 0.5
White beans 61 29.8 29 14.1 19 9.3 0 0
Bean products:
Baked beans 51 24.9 36 17.6 24 11.7 0 0
Refried beans 96 46.8 7 3.4 2 1.0 1 0.5
Nuts
Almonds 26 12.7 42 20.5 32 15.6 12 5.9
Brazil nuts 78 38.0 17 8.3 11 5.4 1 0.5
Cashew nuts 25 12.2 50 24.4 28 13.7 7 3.4
Coconut 69 33.7 24 11.7 17 8.3 1 0.5
Peanuts 44 21.5 27 13.2 30 14.6 7 3.4
Pecan nuts 74 36.1 21 10.2 12 5.9 3 1.5
Pistachio nuts 88 42.9 13 6.3 5 2.4 1 0.5
Soy nuts 104 50.7 2 1.0 1 0.5 0 0
Walnuts 58 28.3 32 15.6 14 6.8 7 3.4
Seeds/Nut Butters:
Almond nut butter 87 42.4 12 5.9 6 2.9 3 1.5
Cashew butter 99 48.3 5 2.4 4 2.0 0 0
Coconut butter 100 48.8 2 1.0 4 2.0 2 1.0
Flax seeds 43 21.0 26 12.7 19 9.3 21 10.2
Hazelnut butter 106 51.7 2 1.0 0 0 0 0
Macadamia nut butter 100 48.8 6 2.9 2 1.0 0 0
Peanut butter 22 10.7 23 11.2 39 19.0 26 12.7
Pumpkin seeds 46 22.4 35 17.1 19 9.3 11 5.4
Roasted sunflower/ pumpkin
seed butter
105 51.2 2 1.0 1 0.5 0 0
Sesame seeds 49 23.9 38 18.5 17 8.3 6 2.9
Sesame Tahini 59 28.8 29 14.1 21 10.2 2 1.0
Sunflower seeds 47 22.9 33 16.1 19 9.3 10 4.9
Fats/Oils:
Almond oil 107 52.2 1 0.5 0 0 0 0
Canola oil 61 29.8 13 6.3 25 12.2 8 3.9
Coconut oil 39 19.0 25 12.2 31 15.1 15 7.3
Flax seed oil 98 47.8 7 3.4 2 1.0 0 0
Ghee (clarified butter) 103 50.2 3 1.5 0 0 1 0.5
Grapeseed oil 100 48.8 2 1.0 6 2.9 0 0
Hemp seed oil 104 50.7 1 0.5 1 0.5 2 1.0
Macadamia oil 103 50.2 3 1.5 0 0 1 0.5
Olive oil 21 10.2 18 8.8 31 15.1 42 20.5
Pine nut oil 106 51.7 2 1.0 0 0 0 0
Sesame oil 84 41.0 20 9.8 5 2.4 0 0
Soybean oil 106 51.7 0 0 0 0 0 0
Sunflower oil 61 29.8 14 6.8 27 13.2 7 3.4
Butter and Margarine:
Dairy-free margarine 38 18.5 13 6.3 32 15.6 29 14.1
Organic Coconut butter 97 47.3 2 1.0 7 3.4 1 0.5
Salad dressings:
French dressing 94 45.9 8 3.9 5 2.4 2 1.0
Hummus 23 11.2 36 17.6 46 22.4 7 3.4

110
Table 4.20: The frequency and consumption of food items from the FFQ (n = 113) continued
Frequency of food items consumed
Never/rarely At least once a
month
At least once a week At least once a day
n % n % n % n %
Italian dressing 90 43.9 10 4.9 10 4.9 0 0
Peri- peri vegan mayonnaise 95 46.3 9 4.4 5 2.4 0 0
1000 island style vegan
mayonnaise
85 41.5 12 5.9 10 4.9 1 0.5
Leafy vegetables:
Bok choy 72 35.1 22 10.7 11 5.4 3 1.5
Cabbage – green 41 20.0 40 19.5 22 10.7 4 2.0
Cabbage – red 48 23.4 38 18.5 14 6.8 5 2.4
Chinese/ Lapa cabbage 95 46.3 7 3.4 4 2.0 1 0.5
Collard greens 76 37.1 13 6.3 12 5.9 5 2.4
Green leaf lettuce 34 16.6 24 11.7 41 20.0 10 4.9
Iceberg lettuce 55 26.8 17 8.3 31 15.1 6 2.9
Kale 56 27.3 25 12.2 20 9.8 7 3.4
Mustard greens 93 45.4 11 5.4 3 1.5 0 0
Romaine lettuce 56 27.3 20 9.8 23 11.2 7 3.4
Spinach – cooked 20 9.8 36 17.6 51 24.9 2 1.0
Spinach- raw 38 18.5 23 11.2 38 18.5 9 4.4
Swiss chard 73 35.6 16 7.8 19 9.3 1 0.5
Non-Leafy Vegetables:
Artichoke 87 42.4 18 8.8 4 2.0 0 0
Asparagus 76 37.1 26 12.7 8 3.9 0 0
Beetroot 31 15.1 43 21.0 29 14.1 5 2.4
Broccoli – raw 60 29.3 19 9.3 27 13.2 2 1.0
Broccoli – cooked 6 2.9 28 13.7 74 36.1 4 2.0
Butternut 19 9.3 38 18.5 52 25.4 1 0.5
Carrots – cooked 11 5.4 28 13.7 60 29.3 9 4.4
Carrots – raw 25 12.2 28 13.7 44 21.5 11 5.4
Cassava 107 52.2 1 0.5 1 0.5 0 0
Cauliflower – raw 73 35.6 27 13.2 9 4.4 1 0.5
Cauliflower- cooked 15 7.3 37 18.0 58 28.3 1 0.5
Corn on the cob 44 21.5 44 21.5 22 10.7 0 0
Gem squash 56 27.3 36 17.6 18 8.8 0 0
Green beans 29 14.1 34 16.6 47 22.9 0 0
Green peas 26 12.7 34 16.6 48 23.4 2 1.0
Mushrooms 14 6.8 22 10.7 59 28.8 15 7.3
Okra 99 48.3 8 3.9 2 1.0 0 0
Olives – black/ green 39 19.0 39 19.0 28 13.7 4 2.0
Potato – white/red 18 8.8 22 10.7 62 30.2 8 3.9
Pumpkin 57 27.8 30 14.6 20 9.8 1 0.5
Sweetcorn 36 17.6 36 17.6 36 17.6 0 0
Sweet potato 21 10.2 34 16.6 51 24.9 2 1.0
Zucchini / Baby marrow 16 7.8 47 22.9 44 21.5 3 1.5
Other vegetable condiments:
Carrot juice 92 44.9 14 6.8 2 1.0 2 1.0
Packet vegetable soups or
broths
75 36.6 23 11.2 11 5.4 2 1.0
Tomato juice 100 48.8 6 2.9 3 1.5 1 0.5
Tomato sauces, paste & salsa 25 12.2 27 13.2 51 24.9 6 2.9
Fresh/ Frozen Fruit
Apple 17 8.3 27 13.2 42 20.5 24 11.7
Avocado 7 3.4 22 10.7 63 30.7 19 9.3
Banana 16 7.8 14 6.8 33 16.1 46 22.4
Blueberries 43 21.0 36 17.6 19 9.3 9 4.4
Cantaloupe 89 43.4 16 7.8 3 1.5 0 0
Cherries 86 42.0 14 6.8 5 2.4 2 1.0
Dragon fruit 101 49.3 4 2.0 5 2.4 0 0

111
Table 4.20: The frequency and consumption of food items from the FFQ (n = 113) continued
Frequency of food items consumed
Never/rarely At least once a
month
At least once a week At least once a day
n % n % n % n %
Figs 90 43.9 14 9.8 4 2.0 0 0
Grapes 39 19.0 47 22.9 17 8.3 6 2.9
Jack fruit 97 47.3 11 5.4 1 0.5 0 0
Litchis 86 42.0 15 7.3 5 2.4 1 0.5
Mango 48 23.4 44 21.5 17 8.3 0 0
Nectarine 54 26.3 32 15.6 20 9.8 1 0.5
Orange 27 13.2 31 15.1 37 18.0 12 5.9
Papaya 56 27.3 31 15.1 18 8.8 3 1.5
Peaches 67 32.7 32 15.6 9 4.4 0 0
Pear 68 33.2 24 11.7 13 6.3 4 2.0
Persimmons 101 49.3 4 2.0 4 2.0 0 0
Pineapple 39 19.0 48 23.4 20 9.8 2 1.0
Plums 75 36.6 21 10.2 12 5.9 0 0
Strawberries 34 16.6 43 21.0 25 12.2 6 2.9
Watermelon 63 30.7 37 18.0 8 3.9 1 0.5
Dried & Canned Fruit:
Apple sauce 99 48.3 10 4.9 0 0 0 0
Dried apricots 81 39.5 23 11.2 4 2.0 1 0.5
Dried berries 88 42.9 12 5.9 7 3.4 2 1.0
Dried figs 96 46.8 9 4.4 3 1.5 1 0.5
Dried mangoes 74 36.1 25 12.2 7 3.4 3 1.5
Dried mixed fruit 81 39.5 23 11.2 3 1.5 3 1.5
Dried peaches 88 42.9 19 9.3 2 1.0 0 0
Dried pomegranates 107 52.2 2 1.0 0 0 0 0
Dried prunes 92 44.9 10 4.9 4 2.0 3 1.5
Dried raisins 45 22.0 29 14.1 27 13.2 9 4.4
Peaches –canned 100 48.8 9 4.4 0 0 0 0
Pineapple- canned 96 46.8 12 5.9 0 0 0 0
Fruit juices:
Apple juice 90 43.9 11 5.4 8 3.9 0 0
Coconut water 90 43.9 15 7.3 3 1.5 0 0
Grape juice 90 43.9 10 4.9 7 3.4 0 0
Mixed fruit juice 88 42.9 9 4.4 10 4.9 0 0
Orange juice 72 35.1 22 10.7 12 5.9 1 0.5
Orange juice – freshly prepared 65 31.7 26 12.7 15 7 1 0.5
Jams/Marmalade/ Sweetened
spreads
Jam e.g. strawberry, apricot,
raspberry and plum, mixed
fruit, mixed berry
57 27.8 27 13.2 18 8.8 7 3.4
Marmalade e.g. citrus fruits,
olive, berries, ginger, fig,
mixed Fruit
90 43.9 11 5.4 7 3.4 0 0
Organic chocolate spreads 101 49.3 7 3.4 1 0.5 0 0
Papaya chutney 103 50.2 3 1.5 2 1.0 1 0.5
Beverages:
Coffee – decaffeinated/regular 26 12.7 8 3.9 14 6.8 60 29.3
Coffee substitutes 96 46.8 1 0.5 3 1.5 7 3.4
Five roses tea 67 32.7 6 2.9 17 8.3 19 9.3
Flavored tea 80 39.0 14 6.8 8 3.9 5 2.4
Fruit cordials 91 44.4 9 4.4 5 2.4 2 1.0
Fruit flavored juice 94 45.9 6 2.9 7 3.4 1 0.5
Green tea 56 27.3 19 9.3 13 6.3 18 8.8
Herbal tea 43 21.0 13 6.3 32 15.6 19 9.3

112
Table 4.20: The frequency and consumption of food items from the FFQ (n = 113) continued
Frequency of food items consumed
Never/rarely At least once a
month
At least once a week At least once a day
n % n % n % n %
Rooibos tea 31 15.1 15 7.3 25 12.2 38 18.5
Other beverages:
Artificially sweetened diet soft
drinks
90 43.9 9 4.4 4 2.0 6 2.9
Beer 73 35.6 24 11.7 8 3.9 3 1.5
Kombucha 81 39.5 12 5.9 8 3.9 7 3.4
Liquor/Rum 90 43.9 13 6.3 4 2.0 1 0.5
Sugar- sweetened soft drinks 69 33.7 23 11.2 11 5.4 6 2.9
Sweetened - Iced tea 95 46.3 13 6.3 1 0.5 0 0
Wine- Non-alcoholic 100 48.8 4 2.0 3 1.5 1 0.5
Wine- Red 69 33.7 25 12.2 10 4.9 3 1.5
Wine – White 79 38.5 19 9.3 8 3.9 2 1.0
Snacks:
Chips – potato 35 17.1 39 19.0 32 15.6 2 1.0
Coconut chips 105 51.2 4 2.0 0 0 0 0
Fruit crisps 103 50.2 4 2.0 1 0.5 0 0
Oyster mushroom biltong 102 49.8 6 2.9 0 0 0 0
Packet chips – tortilla/corn 49 23.9 38 18.5 20 9.8 1 0.5
Pretzel (hard) 88 42.9 15 7.3 6 2.9 0 0
Rice / oat cakes 68 33.2 23 11.2 13 6.3 5 2.4
Salted peanuts 62 30.2 33 16.1 13 6.3 1 0.5
Vegan Droëwors 102 49.8 5 2.4 1 0.5 0 0
Vegetable crisps 68 33.2 34 16.6 7 3.4 0 0
Biscuits:
Biscuits (wheat free) e.g. choc
chip, vanilla
71 34.6 24 11.7 13 6.3 1 0.5
Biscotti 107 52.2 1 0.5 1 0.5 0 0
Buttermilk/ bran rusks 92 44.9 8 3.9 8 3.9 1 0.5
Grain-free crackers 97 47.3 8 3.9 4 2.0 0 0
Muesli rusks 81 39.5 15 7.3 9 4.4 4 2.0
Bars and candy:
Granola bar 84 41.0 17 8.3 7 3.4 0 0
Organic dark chocolate bar 57 27.8 35 17.1 15 7.3 2 1.0
Organic fruit gums 98 47.8 8 3.9 2 1.0 1 0.5
Organic white/ brown
chocolate bars
97 47.3 8 3.9 4 2.0 0 0
Peanut clusters 99 48.3 7 3.4 3 1.5 0 0
Trail mix bar 94 45.9 12 5.9 3 1.5 0 0
Desserts:
Coconut cream 77 37.6 22 10.7 10 4.9 0 0
Non-dairy cream 97 47.3 7 3.4 4 2.0 0 0
Non-dairy custard 100 48.8 7 3.4 1 0.5 0 0
Non-dairy yoghurt 72 35.1 22 10.7 10 4.9 4 2.0
Soy ice cream 94 45.9 11 5.4 2 1.0 0 0
Pies/ Puddings:
Egg-less cake 69 33.7 35 17.1 6 2.9 0 0
Fruit pie 105 51.2 4 2.0 0 0 0 0
Vegan cheesecake 99 48.3 10 4.9 0 0 0 0
Sweeteners:
Agave 93 45.4 12 5.9 3 1.5 0 0
Coconut sugar 99 48.3 5 2.4 4 2.0 0 0
Coconut syrup 108 52.7 0 0 0 0 0 0
Jaggery powder 105 51.2 1 0.5 2 1.0 0 0

113
Table 4.20: The frequency and consumption of food items from the FFQ (n = 113) continued
Frequency of food items consumed
Never/rarely At least once a
month
At least once a week At least once a day
n % n % n % n %
Molasses 96 46.8 7 3.4 2 1.0 3 1.5
Non- nutritive sweeteners e.g.
Xylitol, Sucralose, Saccharin,
Aspartame, Acelfame K
84 41.0 5 2.4 9 4.4 10 4.9
Organic date syrup 99 48.3 7 3.4 2 1.0 1 0.5
Organic rice syrup 108 52.7 1 0.5 0 0 0 0
Raw bee honey 89 43.4 8 3.9 6 2.9 6 2.9
Real maple syrup 86 42.0 13 6.3 9 4.4 0 0
Stevia 99 48.3 2 1.0 4 2.0 5 2.4
Sugar, brown 55 26.8 9 4.4 10 4.9 35 17.1
Sugar, white 85 41.5 5 2.4 9 4.4 11 5.4
Table 4.21: The amount of food items consumed from the FFQ (n = 113)
Frequency of food items consumed
n % n % n %
Milk substitutes <½ cup ½ - 1 cup >1 cup
Almond milk 34 16.6 28 13.7 13 6.3
Cashew milk 25 12.2 0 0 4 2.0
Coconut milk 28 13.7 16 7.8 17 8.3
Flax milk 26 12.7 0 0 1 0.5
Hemp milk 26 12.7 0 0 1 0.5
Homemade soy milk 27 13.2 0 0 2 1.0
Macadamia milk 25 12.2 0 0 2 1.0
Oat milk 30 14.6 1 0.5 3 1.5
Quinoa 27 13.2 0 0 1 0.5
Rice milk 25 12.2 4 2.0 8 3.9
Soy milk 23 11.2 28 13.7 21 10.2
Bread Loaves <1 slice 1-2 slices >2 slices
Brown bread 7 3.4 33 16.1 12 5.9
French bread 18 8.8 8 3.9 7 3.4
Rye bread 13 6.3 29 14.1 13 6.3
Sour dough bread 14 6.8 21 10.2 11 5.4
White bread 17 8.3 28 13.7 11 5.4
Whole-wheat bread 13 6.3 39 19.0 20 9.8
Bread Other <½ small item ½ - 1 small item >1 small item
Cornbread 24 11.7 0 0 1 0.5
English muffin 22 10.7 7 3.4 4 2.0
Muffin – bran/oat 19 9.3 12 5.9 7 3.4
Pita 15 7.3 24 11.7 13 6.3
Rolls – brown 14 6.8 14 6.8 5 2.4
Rolls – white 11 5.4 30 14.6 18 8.8
Rolls – whole-wheat / seeded 18 8.8 16 7.8 17 8.3
Tortilla 20 9.8 13 6.3 13 6.3
Waffles 23 11.2 5 2.4 1 0.5
Pasta <½ cup ½ - 1 cup >1 cup
Brown rice noodles 19 9.3 2 1.0 6 2.9
Buckwheat pasta 19 9.3 1 0.5 4 2.0
Chick pea pasta 17 8.3 7 3.4 6 2.9
Corn and quinoa pasta 17 8.3 0 0 4 2.0
Green pea pasta 17 8.3 1 0.5 3 1.5
Maize and rice pasta 20 9.8 3 1.5 6 2.9

114
Table 4.21: The amount of food items consumed from the FFQ (n = 113) continued
Frequency of food items consumed
n % n % n %
Organic black noodles 17 8.3 4 2.0 21 10.2
Organic brown rice pasta 19 9.3 5 2.4 6 2.9
Organic lasagna sheets 18 8.8 4 2.0 8 3.9
Organic spelt pasta 18 8.8 2 1.0 2 1.0
Pasta – plain , egg 17 8.3 2 1.0 4 2.0
Pasta – plain , eggless 10 4.9 28 13.7 38 18.5
Pure rice pasta 19 9.3 3 1.5 7 3.4
Red lentil pasta 20 9.8 4 2.0 6 2.9
Rice and corn pasta 16 7.8 2 1.0 4 2.0
Wholegrain pasta 16 7.8 11 5.4 18 8.8
Grains <½ cup ½ - 1 cup >1 cup
Amaranth 21 10.2 0 0 1 0.5
Barley flakes 19 9.8 0 0 0 0
Brown rice koji 20 9.8 0 0 0 0
Buckwheat 26 12.7 7 3.4 2 1.0
Bulgar wheat 21 10.2 17 8.3 7 3.4
Cornmeal 18 8.8 0 0 0 0
Couscous 21 10.2 27 13.2 9 4.4
Flax meal 32 15.6 1 0.5 0 0
Maize meal 21 10.2 8 3.9 5 2.4
Millet 22 10.7 3 1.5 2 1.0
Oat bran 21 10.2 7 3.4 0 0
Oatmeal 18 8.8 18 8.8 2 1.0
Organic black rice 21 10.2 0 0 4 2.0
Organic wild rice 22 10.7 9 4.4 6 2.9
Organic wheat kennels 20 9.8 1 0.5 1 0.5
Pearled barley 20 9.8 9 4.4 7 3.4
Polenta 24 11.7 5 2.4 3 1.5
Puffed rice 23 11.2 2 1.0 1 0.5
Rice – brown 17 8.3 33 16.1 20 9.8
Rice – white 13 6.3 27 13.2 17 8.3
Rolled oats 26 12.7 38 18.5 10 4.9
Sorghum 20 9.8 0 0 2 1.0
Sushi rice 23 11.2 14 6.8 10 4.9
Teff grain 22 10.7 1 0.5 0 0
White / brown Basmati rice 22 10.7 30 14.6 16 7.8
White / red / black quinoa 20 9.8 23 11.2 4 2.0
Cereals <½ cup ½ - 1 cup >1 cup
Oat bran flakes 17 8.3 11 5.4 0 0
All Bran flakes 19 9.3 9 4.4 4 2.0
Cheerios 19 9.3 3 1.5 0 0
Cornflakes 17 8.3 7 3.4 4 2.0
Muesli 26 12.7 13 6.3 3 1.5
Rice Krispies, Milo cereal 19 9.3 4 2.0 1 0.5
Special K 20 9.8 3 1.5 0 0
Weet-bix 19 9.3 11 5.4 7 3.4
Vegan Meats <½ cup ½ - 1 cup >1 cup
Gluten (Seitan) 18 8.8 24 11.7 9 4.4
Soya products 15 7.3 45 22.0 23 11.2

115
Table 4.21: The amount of food items consumed from the FFQ (n = 113) continued
Frequency of food items consumed
n % n % n %
Textured vegetable protein
(from dry)
15 7.3 17 8.3 12 5.9
Tofu – firm 20 9.8 31 15.1 10 4.9
Tofu – silken / soft 24 11.7 18 8.8 6 2.9
Egg / Cheese substitutes <1 slice 1-2 slices >2 slices
Egg replacer 20 9.8 9 4.4 5 2.4
Vegan cheese 17 8.3 33 16.1 17 8.3
Mixed Food <1 slice, <1 tsp 1-2 slices, 1-2 tsp >2 slices, >2 tsp
Vegan lasagna 20 9.8 9 4.4 5 2.4
Vegan pizza 17 8.3 33 16.1 17 8.3
Peas and Beans <½ cup ½ - 1 cup >1 cup
Adzuki beans 22 10.7 4 2.0 3 1.5
Black beans 29 14.1 36 17.6 9 4.4
Black-eye beans 29 14.1 15 7.3 7 3.4
Brown lentils 22 10.7 38 18.7 23 11.2
Butter beans 28 13.7 33 16.1 12 5.9
Cannellini beans 27 13.2 14 6.8 9 4.4
Chickpeas 16 7.8 49 23.9 25 12.2
Green soybean 20 9.8 2 1.0 4 2.0
Kidney beans 31 15.1 29 14.1 12 5.9
Lima beans 22 10.7 4 2.0 3 1.5
Mature soybean 20 9.8 3 1.5 6 2.9
Mung beans 21 10.2 17 8.3 6 2.9
Navy/haricot beans 20 9.8 1 0.5 3 1.5
Pinto beans 20 9.8 9 4.4 2 1.0
Red split lentils 20 9.8 30 14.6 12 5.9
Split green peas 26 12.7 18 8.8 6 2.9
Sugar beans 25 12.2 20 9.8 10 4.9
White beans 23 11.2 20 9.8 8 3.9
Bean products: <½ cup ½ - 1 cup >1 cup
Baked beans 27 13.2 25 12.2 7 3.4
Refried beans 22 10.7 3 1.5 3 1.5
Nuts
Almonds 59 28.8 17 8.3 0 0
Brazil nuts 38 18.5 3 1.5 1 0.5
Cashew nuts 58 28.3 15 7.3 2 1.0
Coconut 38 18.5 8 3.9 1 0.5
Peanuts 39 19.0 16 7.8 4 2.0
Pecan nuts 38 18.5 5 2.4 0 0
Pistachio nuts 27 13.2 9 4.4 0 0
Soy nuts 21 10.2 3 1.5 0 0
Walnuts 49 23.9 6 2.9 0 0
Seeds/Nut Butters: <1 tsp 1-2 tsp >2 tsp
Almond nut butter 18 8.8 8 3.9 9 4.4
Cashew butter 16 7.8 6 2.9 5 2.4
Coconut butter 18 8.8 3 1.5 5 2.4
Flax seeds 19 9.3 28 13.7 17 8.3
Hazelnut butter 21 10.2 2 1.0 2 1.0
Macadamia nut butter 20 9.8 3 1.5 5 2.4
Peanut butter 5 2.4 37 18.0 40 19.5
Pumpkin seeds 19 9.3 23 11.2 20 9.8
Roasted sunflower/ pumpkin
seed butter
20 9.8 1 0.5 4 2.0
Sesame seeds 26 12.7 20 9.8 15 7.3

116
Table 4.21: The amount of food items consumed from the FFQ (n = 113) continued
Frequency of food items consumed
n % n % n %
Sesame Tahini 23 11.2 16 7.8 18 8.8
Sunflower seeds 15 7.3 23 11.2 23 11.2
Fats/Oils: <1 tsp 1-2 tsp >2 tsp
Almond oil 20 9.8 0 0 1 0.5
Canola oil 19 9.3 21 10.2 13 6.3
Coconut oil 21 10.2 33 16.1 14 6.8
Flax seed oil 19 9.3 4 2.0 3 1.5
Ghee (clarified butter) 19 9.3 0 0 3 1.5
Grapeseed oil 19 9.3 4 2.0 2 1.0
Hemp seed oil 18 8.8 2 1.0 3 1.5
Macadamia oil 20 9.8 1 0.5 1 0.5
Olive oil 21 10.2 38 18.5 23 11.2
Pine nut oil 21 10.2 0 0 1 0.5
Sesame oil 23 11.2 9 4.4 5 2.4
Soybean oil 18 8.8 1 0.5 1 0.5
Sunflower oil 19 9.3 19 9.3 16 7.8
Butter and Margarine: <1 tsp 1-2 tsp >2 tsp
Dairy-free margarine 19 9.3 35 17.1 14 6.8
Organic Coconut butter 19 9.3 6 2.9 2 1.0
Salad dressings: <1 tsp 1-2 tsp >2 tsp
1000 island style vegan
mayonnaise
15 7.3 9 4.4 8 3.9
French dressing 21 10.2 2 1.0 3 1.5
Hummus 6 2.9 21 10.2 52 25.4
Italian dressing 17 8.3 6 2.9 7 3.4
Peri- peri vegan mayonnaise 17 8.3 3 1.5 5 2.4
Leafy vegetables: <½ cup ½ - 1 cup >1 cup
Bok choy 21 10.2 11 5.4 16 7.8
Cabbage – green 20 9.8 29 14.1 20 9.8
Cabbage – red 24 11.7 24 11.7 14 6.8
Chinese/ Lapa cabbage 21 10.2 3 1.5 6 2.9
Collard greens 20 9.8 7 3.4 15 7.3
Green leaf lettuce 17 8.3 26 12.7 30 14.6
Iceberg lettuce 19 9.3 18 8.8 21 10.2
Kale 17 8.3 17 8.3 24 11.7
Mustard greens 22 10.7 6 2.9 6 2.9
Romaine lettuce 16 7.8 18 8.8 17 8.3
Spinach – cooked 10 4.9 29 14.1 41 20.0
Spinach- raw 19 9.3 23 11.2 30 14.6
Swiss chard 14 6.8 10 4.9 23 11.2
Non-Leafy Vegetables: <½ cup ½ - 1 cup >1 cup
Artichoke 25 12.2 8 3.9 5 2.4
Asparagus 25 12.2 16 7.8 5 2.4
Beetroot 32 15.6 33 16.1 13 6.3
Broccoli – cooked 10 4.9 46 22.4 38 18.5
Broccoli – raw 24 11.7 22 10.7 12 5.9
Butternut 22 10.7 36 17.6 28 13.7
Carrots – cooked 23 11.2 40 19.5 22 10.7
Carrots – raw 32 15.6 30 14.6 17 8.3
Cassava 21 10.2 0 0 1 0.5
Cauliflower- cooked 15 7.3 34 16.6 39 19.0
Cauliflower – raw 29 14.1 13 6.3 6 2.9
Corn on the cob 16 7.8 35 17.1 12 5.9
Gem squash 20 9.8 29 14.1 10 4.9
Green beans 20 9.8 35 17.1 24 11.7

117
Table 4.21: The amount of food items consumed from the FFQ (n = 113) continued
Frequency of food items consumed
n % n % n %
Green peas 18 8.8 39 19.0 18 8.8
Mushrooms 10 4.9 46 22.4 28 13.7
Olives – black/ green 47 22.9 18 8.8 4 2.0
Okra 20 9.8 6 2.9 2 1.0
Potato – white/red 10 4.9 41 20.0 32 15.6
Pumpkin 22 10.7 19 9.3 14 6.8
Sweetcorn 25 12.2 33 16.1 11 5.4
Sweet potato 20 9.8 36 17.6 23 11.2
Zucchini / Baby marrow 22 10.7 42 20.5 21 10.2
Other vegetable
condiments:
<½ cup ½ - 1 cup >1 cup
Carrot juice 17 8.3 5 2.4 6 2.9
Packet vegetable soups or
broths
18 8.8 14 6.8 9 4.4
Tomato juice 19 9.3 1 0.5 6 2.9
Tomato sauces, paste & salsa 36 17.6 30 14.6 8 3.9
Fresh/ Frozen Fruit <½ med item/cup ½ - 1 med item/cup >1 med item’/cup
Apple 17 8.3 38 18.5 27 13.2
Avocado 22 10.7 35 17.1 31 15.1
Banana 11 5.4 41 20.0 30 14.6
Blueberries 27 13.2 22 10.7 13 6.3
Cantaloupe 20 9.8 9 4.4 4 2.0
Cherries 21 10.2 8 3.9 7 3.4
Dragon fruit 21 10.2 3 1.5 4 2.0
Figs 17 8.3 7 3.4 8 3.9
Grapes 21 10.2 21 10.2 25 12.2
Jack fruit 18 8.8 8 3.9 5 2.4
Litchis 21 10.2 7 3.4 7 3.4
Mango 21 10.2 19 9.3 19 9.3
Nectarine 16 7.8 16 7.8 21 10.2
Orange 12 5.9 27 13.2 32 15.6
Papaya 20 9.8 15 7.3 23 11.2
Pear 19 9.3 17 8.3 13 6.3
Peaches 20 9.8 14 6.8 14 6.8
Persimmons 20 9.8 3 1.5 5 2.4
Pineapple 21 10.2 24 11.7 20 9.8
Plums 23 11.2 10 4.9 8 3.9
Strawberries 22 10.7 27 13.2 18 8.8
Watermelon 19 9.3 18 8.8 13 6.3
Dried & Canned Fruit: <½ cup ½ - 1 cup >1 cup
Apple sauce 22 10.7 4 2.0 0 0
Dried apricots 33 16.1 4 2.0 1 0.5
Dried berries 24 11.7 6 2.9 3 1.5
Dried figs 26 12.7 1 0.5 0 0
Dried mangoes 28 13.7 13 6.3 5 2.4
Dried mixed fruit 28 13.7 8 3.9 3 1.5
Dried peaches 28 13.7 6 2.9 1 0.5
Dried pomegranates 19 9.3 0 0 0 0
Dried prunes 27 13.2 3 1.5 1 0.5
Dried raisins 47 22.9 13 6.3 4 2.0
Peaches –canned 20 9.8 3 1.5 2 1.0
Pineapple- canned 24 11.7 2 1.0 3 1.5
Fruit juices: <1 cup 1-2 cup >2 cups
Apple juice 16 7.8 11 5.4 7 3.4
Coconut water 18 8.8 13 6.3 2 1.0

118
Table 4.21: The amount of food items consumed from the FFQ (n = 113) continued
Frequency of food items consumed
n % n % n %
Grape juice 15 7.3 8 3.9 6 2.9
Mixed fruit juice 14 6.8 10 4.9 5 2.4
Orange juice 12 5.9 20 9.8 6 2.9
Orange juice – freshly
prepared
20 9.8 17 8.3 13 6.3
Jams/Marmalade/
Sweetened spreads
<1 tsp 1-2 tsp >2 tsp
Jam e.g. strawberry, apricot,
raspberry and plum, mixed
fruit, mixed berry
13 6.3 29 14.1 14 6.8
Marmalade e.g. citrus fruits,
olive, berries, ginger, fig,
mixed Fruit
18 8.8 8 3.9 4 2.0
Organic chocolate spreads 17 8.3 3 1.5 1 0.5
Papaya chutney 17 8.3 4 2.0 2 1.0
Beverages: <1 cup 1-2 cup >2 cups
Coffee –
decaffeinated/regular
12 5.9 43 21.0 30 14.6
Coffee substitutes 18 8.8 5 2.4 3 1.5
Flavored tea 17 8.3 13 6.3 4 2.0
Five roses tea 15 7.3 17 8.3 17 8.3
Fruit cordials 17 8.3 8 3.9 3 1.5
Fruit flavored juice 16 7.8 9 4.4 1 0.5
Green tea 16 7.8 24 11.7 9 4.4
Herbal tea 16 7.8 29 14.1 16 7.8
Rooibos tea 17 8.3 38 18.5 17 8.3
Other beverages : <1 cup 1-2 cup >2 cups
Artificially sweetened diet
soft drinks
18 8.8 11 5.4 2 1.0
Beer 21 10.2 14 6.8 9 4.4
Kombucha 22 10.7 9 4.4 5 2.4
Liquor/Rum 23 11.2 6 2.9 3 1.5
Sweetened - Iced tea 26 12.7 7 3.4 0 0
Sugar- sweetened soft drinks 25 12.2 19 9.3 2 1.0
Wine- non-alcoholic 22 10.7 1 0.5 2 1.0
Wine- Red 30 14.6 14 6.8 8 3.9
Wine – White 25 12.2 9 4.4 9 4.4
Snacks: < 1 pkt (<125g) 1 pkt (125g) >1 pkt (>125g)
Chips – potato 22 10.7 24 11.7 21 10.2
Coconut chips 21 10.2 1 0.5 1 0.5
Fruit crisps 19 9.3 3 1.5 2 1.0
Packet chips – tortilla/corn 20 9.8 24 11.7 15 7.3
Pretzel (hard) 27 13.2 7 3.4 6 2.9
Oyster mushroom biltong 19 9.3 4 2.0 1 0.5
Rice / oat cakes 32 15.6 13 6.3 7 3.4
Salted peanuts 27 13.2 19 9.3 5 2.4
Vegetable crisps 26 12.7 15 7.3 8 3.9
Vegan Droëwors 15 7.3 3 1.5 2 1.0
Biscuits: < 1item 1-2 items >1 items
Biscotti 16 7.8 3 1.5 2 1.0
Biscuits (wheat free) e.g.
choc chip, vanilla
12 5.9 18 8.8 14 6.8
Buttermilk/ bran rusks 13 6.3 10 4.9 7 3.4
Grain-free crackers 18 8.8 4 2.0 7 3.4
Muesli rusks 14 6.8 10 4.9 15 7.3
Bars and candy: < 1item 1-2 items >1 items

119
Table 4.21: The amount of food items consumed from the FFQ (n = 113) continued
Frequency of food items consumed
n % n % n %
Granola bar 17 8.3 13 6.3 4 2.0
Peanut clusters 19 9.3 5 2.4 3 1.5
Organic dark chocolate bar 30 14.6 23 11.2 6 2.9
Organic fruit gums 20 9.8 4 2.0 5 2.4
Organic white/ brown
chocolate bars
20 9.8 7 3.4 2 1.0
Trail mix bar 19 9.3 6 2.9 2 1.0
Desserts: <½ cup ½ - 1 cup >1 cup
Coconut cream 26 12.7 10 4.9 8 3.9
Non-dairy cream 21 10.2 5 2.4 2 1.0
Non-dairy custard 23 11.2 2 1.0 1 0.5
Non-dairy yoghurt 21 10.2 13 6.3 10 4.9
Soy ice cream 18 8.8 6 2.9 6 2.9
Pies/ Puddings: <1 slice 1-2 slices >2 slices
Egg-less cake 20 9.8 24 11.7 7 3.4
Fruit pie 18 8.8 2 1.0 1 0.5
Vegan cheesecake 18 8.8 4 2.0 2 1.0
Sweeteners: <1 tsp 1-2 tsp >2 tsp
Agave 19 9.3 4 2.0 6 2.9
Coconut sugar 16 7.8 6 2.9 2 1.0
Coconut syrup 18 8.8 2 1.0 0 0
Jaggery powder 18 8.8 4 2.0 0 0
Molasses 22 10.7 6 2.9 1 0.5
Non- nutritive sweeteners
e.g. Xylitol, Sucralose,
Saccharin, Aspartame,
Acelfame K
20 9.8 15 7.3 4 2.0
Organic date syrup 19 9.3 5 2.4 3 1.5
Organic rice syrup 18 8.8 2 1.0 1 0.5
Real maple syrup 19 9.3 12 5.9 7 3.4
Raw bee honey 20 9.8 13 6.3 1 0.5
Stevia 22 10.7 6 2.9 2 1.0
Sugar, brown 21 10.2 29 14.1 12 5.9
Sugar, white 16 7.8 13 6.3 8 3.9
4.4.2 Dietary consumption from the 24-hour recall
The 24-hour recall was completed by n = 134 of the respondents in this study. Descriptive
analysis was conducted on all variables. Independent sample t-tests and Mann-Whitney tests
were conducted to test for significant differences across gender. Table 4.21 to Table 4.27 shows
the mean nutritional intake of macronutrients and micronutrients of meals consumed by the
respondents from the 24-hour recalls. Table 4.28 shows the estimated average requirement
(EAR) for adults.

120
Macronutrients:
From the 24-hour dietary recall results, independent sample t-tests showed that the amount of
added sugar intake was significantly more for females (M = 20.5138 g) than for males (M =
13.184 g), t (73.109) = -2.063, p = 0.043.
This was the only significant difference across gender for this category regarding normally
distributed variables. Mann-Whitney test showed that compared to females, males had a
significantly higher intake of starch (Z = -2.122, p = 0.034), fructose (Z = -2.130, p = 0.033)
and maltose (Z = -2.352, p = 0.019).
Minerals:
According to minerals, significantly higher intakes of silicon (Si) was consumed by males (M
= 8394.4 μg) than females (5349.42 μg), t (31.845) = 2.589, p = 0.014. Mann-Whitney test
showed that compared to males, females consumed significantly greater amounts of sodium
(Na) (Z = -2.036, p = 0.042). Males consumed greater amounts of fluorine (F) than females (Z
= -2.873, p = 0.004).
Vitamins:
Based on the results, a Mann-Whitney test showed that males consumed significantly higher
intakes of vitamin A (carotene) (Z = -2.162, p = 0.031), vitamin A (tocotrienol) (Z = -2.637, p
= 0.008), vitamin C (Z = -2.262, p = 0.024), vitamin D (tocopherol) (Z = -2.095, p = 0.036),
vitamin G (tocopherol) (Z = -2.362, p = 0.018), vitamin G (tocotrienol) (Z = -2.777, p = 0.005)
and lycopene (Z = -3.153, p = 0.002), compared to females.
Fatty acids and cholesterol:
The Mann-Whitney test showed that males consumed significantly more amounts of the fatty
acid Myristic (C14: 1) (Z = -2.073, p = 0.038) compared to females.
Amino acids:
Independent sample tests showed that significantly more males (M = 0.4426 g) had higher
intakes of serine than females (M = 0.3312 g), t (132) = 2.281, p = 0.024. According to Mann-
Whitney tests, males consumed significantly higher intakes of arginine (Z = -2.022, p = 0.043),
cystine (Z = -2.807, p = 0.005), glutamic acid (Z = -2.930, p = 0.003) and proline (Z = -2.393,
p = 0.017) compared to females.

121
Other:
Mann-Whitney tests showed than males consumed significantly greater intakes of phytate (Z =
-2.088, p = 0.037), malic acid (Z = -2.039, p = 0.041) and oxalic acid (Z = -2.505, p = 0.012).
Table 4.22: Dietary intake of macronutrients from the 24-hour recall (n = 134)
Macronutrients: Unit: Male:
(n = 25)*
Female:
(n = 109)*
Mean:
(n = 134)*
Standard
deviation (SD)*:
Energy kJ 7893.76 7374.22 7471.15 3093.39
Moisture g 1235.88 1092.31 1119.10 446.45
Carbohydrate g 204.20 187.23 190.40 72.30
Added sugar g 13.18 20.51 19.14 23.78
Fructose g 20.19 15.66 16.50 14.67
Galactose g 0.00 0.00 0.00 0.00
Glucose g 14.35 12.37 12.74 12.25
Lactose g 0.00 0.02 0.02 0.16
Maltose g 0.40 0.15 0.19 0.46
Starch g 20.92 16.41 17.25 18.85
Sucrose g 18.94 17.08 17.42 18.53
Total sugars g 55.08 46.09 47.77 40.65
Total protein g 74.34 74.82 74.73 52.28
Animal protein g 0.21 0.18 0.19 0.36
Nitrogen g 2.38 2.05 2.11 1.23
Plant protein g 73.40 73.78 73.71 52.18
Total fat g 65.85 61.53 62.34 45.09
Total dietary fibre g 42.41 36.35 37.48 18.73
Insoluble dietary fibre g 10.27 8.59 8.90 5.81
Soluble dietary fibre g 7.31 6.16 6.37 3.73
Ash g 6.91 6.12 6.27 4.20
Lignin g 1.16 1.68 1.16 1.41
Insoluble NSP g 8.77 7.35 7.61 4.79
Non-starch
polysaccharides (NSP)
g 16.30 13.57 14.08 8.43
Soluble NSP g 7.24 6.13 6.34 3.73
* Represents mean intake by males, mean intake by females, mean intake of total population and standard deviation
Table 4.23: Dietary intake of minerals from the 24-hour recall (n = 134)
Minerals: Unit: Male:
(n = 25)*
Female:
(n = 109)*
Mean:
(n = 134)*
Standard
deviation (SD)*:
Boron μg 1899.64 2395.84 2303.26 2580.30
Calcium mg 630.88 612.51 615.94 392.51
Chlorine mg 499.88 378.00 400.73 339.14
Chromium μg 47.31 37.93 39.68 39.55
Copper mg 4.25 4.65 4.58 4.25
Fluoride μg 128.68 91.66 98.57 90.55
Haem iron mg 0.00 0.00 0.00 0.00
Iodine μg 16.12 14.15 14.52 9.70
Iron mg 23.28 22.95 23.01 13.39
Manganese μg 6623.00 6088.88 6188.52 3591.09

122
Table 4.23: Dietary intake of minerals from the 24-hour recall (n = 134) continued
Minerals: Unit: Male:
(n = 25)*
Female:
(n = 109)*
Mean:
(n = 134)*
Standard
deviation (SD)*:
Magnesium mg 558.04 530.64 535.75 336.31
Non- haem iron mg 9.32 8.73 8.84 7.26
Phosphorous mg 1211.24 1179.89 1184.74 656.51
Potassium mg 4359.20 4532.31 4500.01 2938.40
Selenium μg 15.94 12.33 13.00 12.21
Silicon μg 8394.40 5349.42 5917.51 4822.23
Sodium mg 675.72 1078.53 1003.38 937.41
Zinc mg 9.82 8.84 9.02 5.37
* Represents mean intake by males, mean intake by females, mean intake of total population and standard deviation
Table 4.24: Dietary intake of vitamins from the 24-hour recall (n = 134)
Vitamins: Unit: Male:
(n = 25)*
Female:
(n = 109)*
Mean:
(n = 134)*
Standard
deviation (SD)*:
A-Carotene μg 3098.20 1417.70 1731.23 2520.48
A-Tocopherol mg 3.98 2.65 2.90 3.61
A-Tocotrienol mg 0.12 0.07 0.08 0.09
B-Carotene μg 9187.40 6183.69 6744.08 9956.73
Biotin μg 130.87 123.57 124.93 129.93
B-Tocopherol mg 0.14 0.08 0.98 0.14
B-Tocotrienol mg 0.11 0.27 0.24 0.43
Cryptoxanthin μg 281.76 192.31 209.00 440.39
D-Tocopherol mg 0.14 0.05 0.70 0.45
D-Tocotrienol mg 0.00 0.00 0.00 0.00
Folate μg 480.60 432.32 441.32 268.59
G-Tocopherol mg 0.42 0.27 0.29 0.36
G-Tocotrienol mg 0.10 0.05 0.06 0.09
Lutein μg 4722.44 3598.32 3808.04 7346.48
Lycopene μg 1441.76 660.64 806.37 1091.61
Niacin mg 15.59 15.32 15.37 9.68
Pantothenate mg 6.15 5.87 5.92 4.66
Retinol μg 4.84 6.11 5.88 17.88
Riboflavin mg 1.32 1.26 1.27 0.99
Thiamine mg 1.59 1.49 1.51 0.88
Total carotenoids μg 10898.84 7037.93 7758.25 10772.24
Vitamin A μg 2316.80 1722.90 1833.70 1905.82
Vitamin B6 mg 1.91 1.90 1.90 1.19
Vitamin B12 μg 1.06 1.06 1.06 1.44
Vitamin C mg 172.52 131.89 139.47 102.71
Vitamin D μg 3.30 3.44 3.42 4.41
Vitamin E mg 20.32 13.56 14.82 15.51
Vitamin K μg 265.57 209.02 219.57 296.12
* Represents mean intake by males, mean intake by females, mean intake of total population and standard deviation

123
Table 4.25: Dietary intake of fatty acids (FA) and cholesterol from the 24-hour recall (n =
134)
Fatty Acids and
Cholesterol:
Unit: Male:
(n = 25)*
Female:
(n = 109)*
Mean:
(n = 134)*
Standard
deviation (SD)*:
Cholesterol mg 4.84 3.80 4.00 8.94
C4:0 g 0.00 0.00 0.00 0.02
C6:0 g 0.01 0.02 0.02 0.05
C8:0 g 0.13 0.27 0.24 0.60
C10:0 g 0.10 0.22 0.19 0.48
C12:0 g 0.83 1.70 1.54 3.74
C13:0 g 0.00 0.00 0.00 0.00
C14:0 g 0.63 0.93 0.87 1.49
C15:0 g 0.00 0.00 0.00 0.00
C16:0 g 5.92 6.60 6.48 4.59
C17:0 g 0.00 0.00 0.00 0.00
C18:0 g 2.4 2.1 2.17 1.80
C20:0 g 0.16 0.12 0.13 0.15
C21:0 g 0.00 0.00 0.00 0.00
C22:0 g 0.33 0.23 0.25 0.33
C23:0 g 0.00 0.00 0.00 0.00
C24:0 g 0.12 0.08 0.09 0.12
C10:1 g 0.00 0.00 0.00 0.00
C12:1 g 0.00 0.00 0.00 0.00
C14:1 g 0.00 0.00 0.00 0.00
C15:1 g 0.00 0.00 0.00 0.00
C16:1 g 0.42 0.84 0.76 1.17
C17:1 g 0.00 0.00 0.00 0.00
C18:1 g 19.50 20.03 19.93 18.75
C20:1 g 0.14 0.10 0.11 0.16
C22:1 g 0.02 0.02 0.02 0.04
C23:1 g 0.00 0.00 0.00 0.00
C24:1 g 0.00 0.00 0.00 0.00
C18:2 g 22.60 18.79 19.50 18.02
C18:3 g 0.72 0.72 0.72 0.82
C18:4 g 0.00 0.00 0.00 0.00
C20:2 g 0.00 0.00 0.00 0.00
C20:4 g 0.00 0.00 0.00 0.01
C20:5 g 0.00 0.00 0.00 0.00
C22:2 g 0.00 0.00 0.00 0.01
C22:3 g 0.00 0.00 0.00 0.00
C22:4 g 0.00 0.00 0.00 0.00
C22:5 g 0.00 0.00 0.00 0.03
C22:6 g 0.00 0.00 0.00 0.00
C24:6 g 0.00 0.00 0.00 0.00
C20:3 g 0.00 0.00 0.00 0.01
Double trans FA g 0.00 0.00 0.00 0.00
Mono-unsaturated FA g 20.34 21.24 21.07 19.69
Polyunsaturated FA g 23.58 19.60 20.34 18.50
Saturated FA g 10.91 12.72 12.38 9.52
Single trans FA g 0.00 0.00 0.00 0.00
Total trans FA g 0.65 1.12 1.03 2.66
* Represents mean intake by males, mean intake by females, mean intake of total population and standard deviation

124
Table 4.26: Dietary intake of amino acids from the 24-hour recall (n = 134)
Amino Acids: Unit: Male:
(n = 25)*
Female:
(n = 109)*
Mean:
(n = 134)*
Standard
deviation (SD)*:
Alanine g 0.44 0.36 0.37 0.23
Arginine g 3.34 2.63 2.76 1.96
Aspartic acid g 1.16 1.02 1.04 0.71
Cystine g 0.12 0.09 0.09 0.06
Glutamic acid g 1.90 1.37 1.47 1.25
Glycine g 0.39 0.31 0.32 0.22
Histidine g 2.38 2.52 2.50 2.41
Hydroxyproline g 0.00 0.00 0.00 0.00
Isoleucine g 4.33 4.71 4.64 4.72
Leucine g 7.34 7.93 7.82 7.95
Lysine g 5.48 6.03 5.93 6.23
Methionine g 1.36 1.44 1.42 1.31
Phenylalanine g 4.87 5.25 5.18 5.24
Proline g 0.51 0.36 0.39 0.26
Serine g 0.44 0.33 0.35 0.22
Threonine g 3.81 4.14 4.08 4.22
Tryptophan g 2.07 2.39 2.33 2.83
Tyrosine g 0.27 0.21 0.22 0.16
Valine g 4.82 5.14 5.08 4.93
* Represents mean intake by males, mean intake by females, mean intake of total population and standard deviation
Table 4.27: Dietary intake of other nutrients from the 24-hour recall (n = 134)
Other nutrients: Unit: Male:
(n = 25)*
Female:
(n = 109)*
Mean:
(n = 134)*
Standard
deviation (SD)*:
Alcohol g 0.00 0.82 0.66 3.79
Caffeine mg 0.00 0.00 0.00 0.00
Citric acid mg 1526.00 1477.42 1486.48 1788.95
Malic acid mg 1813.32 1439.02 1508.85 1321.45
Oxalic acid mg 297.44 184.45 205.53 253.33
Phytate mg 155.44 106.59 115.70 104.14
Tannins mg 0.00 0.00 0.00 0.00
Tartaric acid mg 184.24 129.13 139.41 516.70
* Represents mean intake by males, mean intake by females, mean intake of total population and standard deviation

125
Table 4.28: Estimated average requirement (EAR) for adults
Nutrients EAR (per day):
Male Female
Energy (kJ) NA* NA
Carbohydrate (g) 130 g (45-65% of total energyb) 130 g (45-65% of total energyb)
Added Sugar (g) 25ga 25ga
Protein (g) 56g (10-35% of total energyb) 46g (10-35% of total energyb)
Total fat (g) 20-35% of total energyb 20-35% of total energyb
Saturated fat (g) < 10% b < 10 % b
Monounsaturated fat (g) ± 10% of Energy from fat ± 10% of Energy from fat
Polyunsaturated fat (g) 6 - < 10% b 6 - < 10% b
Trans fat (g) NA NA
Cholesterol (mg) < 300 mg < 300 mg
Total fibre (g) 38 g 25 g
Insoluble fibre (g) NA NA
Soluble fibre (g) NA NA
Total Vitamin A Activity (μg retinol
equivalents)
900 μg 700 μg
Vitamin B6 (mg) 19-50years – 1.3 mg
51->70 years – 1.7 mg
19- 50 years – 1.3 mg
51- >70 years – 1.5 mg
Vitamin B12 (μg) 2.4 μg 2.4 μg
Vitamin C (mg) 90 mg 75 mg
Vitamin D (μg) 15 μg 15 μg
Vitamin E (mg) 15 mg 15 mg
Vitamin K (μg) 120 μg 90 μg
Biotin (μg) 30 μg 30 μg
Folate (μg) 400 μg 400 μg
Pantothenic acid (mg) 5 mg 5mg
Riboflavin 1.3 mg 1.1 mg
Thiamine (mg) 1.2 mg 1.1 mg
Calcium (mg) 19-70 years -1000 mg
>70 years – 1200 mg
19- 50 years – 1000mg
50->70 years – 1200mg
Chloride (g) 19-50 years – 2.3 g
51 – 70 years – 2.0 g
>70 years – 1.8 g
19-50 years – 2.3 g
51 – 70 years – 2.0 g
>70 years – 1.8 g
Chlorine (mg) 550 mg 425 mg
Chromium (μg) 19-50 years – 35 μg
51- > 70 years – 30 μg
19-50 years – 25 μg
51- > 70 years – 20 μg
Copper (μg) 900 μg 900 μg
Fluoride (mg) 4 mg 3mg
Iodine (μg) 150 μg 150 μg
Iron (mg) 8mg 19 – 50 years – 18mg
51 - > 70 years – 8mg
Manganese (mg) 2.3 mg 1.8 mg
Magnesium (mg) 19-30 years – 400mg
31 ->70 years – 420mg
19-30 years – 310mg
31- >70 years – 320mg
Phosphorus (mg) 700 mg 700 mg
Potassium (mg) 3400 mg 2600 mg
Niacin (mg) 16 mg 14 mg
Selenium (μg) 55 μg 55 μg
Sodium (mg) 1500 mg 1500 mg
Zinc (mg) 11 mg 8 mg
*NA – Not Applicable a. WHO recommendation b. Institute of Medicine recommendation


128
number of respondents felt that their transition was “moderately easy” (35.1%, n = 53) and felt
“excitement and enthusiasm” at the beginning of the transition (29.3%, n = 60).
The third objective was to determine the challenges associated with following a vegan diet and
how these challenges are overcome. Most respondents did not experience any financial
challenges while following the vegan diet (74.6%, n = 153) and purchased most of their vegan
food items from a supermarket (86.3%, n = 177). A significant number of respondents strongly
agreed indicated that finding vegan meal options in restaurants was the main challenge faced
while following the diet (40.5%, n = 83) and research on the internet assisted in overcoming
challenges (46.8%, n = 96). Most of the respondents strongly agreed that vegan recipes are
easily accessible (58.5%, n = 120).
The fourth objective was to determine the nutritional quality of dietary intake compared to
recommendations (EARs) and to identify the variety of food groups and types of processed
food consumed in the vegan diet. According to results from the FFQ, a variety of food groups
were consumed by the respondents with bananas (22.4%, n = 46), cooked broccoli (36.1%, n =
76) , whole-wheat bread (18.0%, n = 37), white or brown basmati rice (20.0%, n = 41),
chickpeas (32.2%, n = 66), olive oil (20.5%, n = 42), potato chips (19.0%, n = 39), egg-less
cake (17.1%, n = 35), brown sugar (17.1%, n = 35) and coffee decaffeinated or regular (29.3%,
n = 60) being the most commonly consumed food items. Soy milk was the most commonly
consumed PBMA, at least once a day (21.0%, n = 43) and soy products were most commonly
consumed meat alternative, consumed at least once a week (28.8%, n = 59).
The 24-hour recall showed that the respondents in the study met their EARs daily requirements
for protein, fat and carbohydrates were within the range percentages of total energy. The EARs
for fibre, iron, vitamin C, vitamin B6, vitamin A, thiamine, riboflavin, folate and vitamin K
were also met by the respondents. Females (M = 20.51g) consumed higher amounts of added
sugar than males (M = 13.18g), t (73.109) = -2.063, p = 0.043. The respondents had a low
intake of cholesterol, saturated fat and mono-unsaturated fatty acids (MUFA) and higher intakes
of poly-unsaturated fatty acids (PUFA). Females met their EARs for zinc and niacin, 9.02 mg
and 15.32 mg respectively, while males were below their EAR, 9.8 mg and 15.59 mg
respectively. Overall the respondents were lacking in calcium, sodium, vitamin D, vitamin B12
and vitamin E, as EARs were not met.
The next chapter will discuss the results in comparison with previous findings reported in
Chapter 2.

129
CHAPTER 5: DISCUSSION
The purpose of the study was to determine the motives and challenges facing South African
vegans and the nutritional quality of their diet. This chapter will discuss the results of each
objective presented in Chapter 4 and compare these results to previous literature presented in
Chapter 2.
5.1 The response rate and demographic characteristics of the study population
The study was completed by 233 respondents who answered an online questionnaire posted on
the South African Vegan Society (SAVS) Facebook page. However, due to 28 of the
questionnaires not being filled in correctly, the data analysis consisted of only 205
questionnaires. Although the page had 9 819 members at the time, only South African
respondents were allowed to complete the questionnaire. The questionnaire was initially posted
on the SAVS page on the 14th of August 2019 and re-posted twice thereafter. According to Van
Mol (2017), reminders may have an influence on response rates, as it can increase response
rates after the initial invitation for participation. After consulting with the statistician regarding
the reduced responses despite posting reminders, a decision was made to close the questionnaire
after it had been online for two full months.
The sample population comprised predominantly of female (n = 169, 82.4%) and White
respondents (n = 169, 82.4%). This finding is similar to the study by Radnitz et al (2015),
where an international sample of 246 vegans comprised of predominantly female respondents
(n = 146) with the most being White or Caucasian decent (n = 168). Another study by Dyett et
al (2013), conducted in the United States with 100 vegan respondents, reported more female (n
= 76) than male vegans (n = 24) respondents. A large cohort observational study by Alles et al
(2017), conducted in France with 93 823 respondents of which 789 followed the vegan diet,
found that females (n = 595) were more likely to follow the vegan diet than males (n = 194).
This result was expected, as females tend to follow vegetarian diets and diets that promote
weight control (Tam, Yassa, Parker, O’Connor & Allman-Farinelli 2017).
Previous literature also reported that females were more likely to omit specific food groups
from their diet (especially meat) due to motives such as health benefits (Jun, Arendt & Kang
2016), animal welfare or environment preservation (Ruby 2012). Therefore, females are more
inclined to follow vegetarian or vegan diet to decrease their consumption of meat (Hartmann &
Siegrist 2017). According to race groups, Dyett et al (2014) found that more Caucasian or
White respondents (n = 71) answered and completed the online survey compared to other race

130
groups such as Black (n = 13), Asian (n = 10) and other races (n = 6) (Dyett et al 2013). A
research review by Ruby (2012), showed that ethnicity is significantly related with meat
consumption, where Caucasian respondents consumed less meat when compared to Black and
Asian respondents. In South Africa, the consumption of meat is also associated with ethnicity,
as there is an increased growth of meat as a protein source especially among Black African
consumers (Bisschoff & Liebenberg 2017). This is because meat is of significance in most
Black African traditional and cultural ceremonies such as weddings and funerals (Liebenberg
2016). Indians or Asians in South Africa are more likely to consume a reduced quantity of
meat, as Muslims consume only Halaal animal products and Hindus avoid consuming beef
(Mohd-Any, Mahdzan & Cher 2014).
In terms of demographics, most of the respondents resided in Gauteng Province (n = 90, 43.9%)
and their marital status was single (n = 109, 53.2%). This could be possibly due to the majority
of respondents being in the 18 - 29 year age category. This finding was in line with other studies
were vegans were more likely to be single (Davey et al 2003) or to live alone without any
children (Alles et al 2017) in comparison to omnivores. Most of the respondents formed part
of the 18 - 29 year age category (n = 60, 29.3%), had a diploma/degree as their highest level of
education (n = 76, 37.1%) and had a total monthly income between R25 601 – R51 200 (n =
48, 23.4%). In the study by Dyett et al (2013), most of the vegan respondents were between
the 25 - 39 year age category (n = 44) and had a tertiary level of education (n = 47). However,
in the study by Alles et al (2017), most of the vegans were in the 30 - 50 year age category (n
= 378), with higher levels of education (n = 267) compared to the sample in this study. As
reported previously, non-meat eaters are usually younger than meat-eaters (Sobiecki, Appleby,
Bradbury & Key 2016; Rizzo et al 2013; Bedford & Barr 2005). The study showed a significant
relationship between gender and education level. However, the hypothesis that females with a
higher level of education were more likely to follow a vegan diet is rejected. Interestingly, the
findings showed males with some schooling or other qualifications were more likely to follow
the diet, even though males formed the minority of the sample.
A strict vegan diet was followed by bulk of the respondents (81.5%, n = 167), and most of the
respondents indicated following the vegan diet for between 1 - 3 years (38.5%, n = 79) followed
by 3 - <5 years (14.1%, n = 29). A similar study by Kerschke-Risch (2015), which included
852 vegans, reported that most of the study respondents followed the vegan diet for 1 to < 2
years (27.6%, n = 234), followed by 2 to < 5 years (24.4%, n = 207). However, according to
another study by Janssen et al (2016), conducted in Germany, based on one-on-one interviews

131
with 329 vegans following the diet, on average the respondents of the study were following the
diet for 3.8 years. In the study, 22% of the respondents followed the diet for 3 - 4 years, while
22.7% followed the diet for 5 years and more. When compared to the study by Kerschke-Risch
(2015), this study showed that a greater percentage of individuals were following the vegan diet
for a relatively longer period of time (Janssen et al 2016). This shows that following a vegan
diet may become a long-term diet and lifestyle change, rather than a passing trend.
Smoking was not common among the respondents as the majority did not smoke (n = 172,
83.9%), however, alcoholic beverages were consumed by most of the respondents in this study
(n = 123, 60.0%) with the most common frequency being “less than once a week” (n = 56,
27.3%). Similar to another study, it was found that vegans in general smoked less and
consumed alcohol less frequently in comparison to omnivores and vegetarians (Orlich et al
2013). It was found that in certain studies, smoking was associated with the motivation for
following a vegan diet. A study by Heiss et al (2017) conducted in the United States with a
sample of 358 vegan respondents, found that “ideological” or “ethical” vegans were more likely
to indicate that they smoked either regularly or socially. However, “health motivated” and
“other” vegans were more likely to indicate that they did not smoke. This is similar to findings
by Radnitz et al (2015), where “ethically motivated” vegans were more likely to smoke than
“health motivated” vegans. Health motivated vegans consider themselves more “health
conscious” and are therefore less likely to smoke. According to Dyett et al (2013), health
motivated vegans often practise healthier lifestyle behaviours such as exercising regularly,
minimal consumption of alcohol and not engaging in smoking.
Vitamin and mineral supplements were taken by most of the respondents (n = 149, 72.7%). The
most commonly consumed supplement indicated by the respondents was individual vitamin
B12 supplements or a multivitamin supplement. If respondents did not understand the term
“supplements”, respondents were able to contact the researcher for further information on how
to answer this question. According to Haddad et al (1999a), vegans are more likely to consume
supplements of single nutrients in comparison to non-vegan individuals. The increased
incidence of vitamin B12 deficiency is found in both vegetarians and vegans as plant foods do
not contain vitamin B12 unless fortified, such as breakfast cereals (Pawlak, Parrott, Raj,
Cullum-Dugan & Lucus 2013). It is suggested by Baroni, Goggi, Battaglino, Berveglieri,
Fasan, Filippin, Griffith, Rizzo, Tomasini, Tosatti, Battino (2019), that through
supplementation, all vegans should meet their vitamin B12 requirements. A recent Spanish
study by Gallego-Narbón, Zapatera, Barrios & Vaquero (2019), investigated the vitamin B12

132
and folate status of healthy vegans (n = 54) and lacto-ovo vegetarians (n = 49), and found that
72.8% of the vegan respondents supplemented with vitamin B12. This shows that vegans are
aware of the increased risk of subclinical deficiencies in non-users of supplements, and health
professionals should emphasise the need for vitamin and mineral supplements in all vegetarian
diets (Gallego-Narbón et al 2019).
Physical activity was performed by the majority of respondents (n = 174, 84.9%), whereby low
intensity physical activity was done “everyday” (n = 48, 23.4%), moderate physical activity
was done “once a week” (n = 37, 18.0) and high intensity physical activity was done “twice a
week” (n = 27, 13.2). The duration of physical activity conducted by respondents on an average
day was 30 minutes to less than 1 hour (n = 85, 41.5%). A cross sectional German study
conducted by Menzel, Biemann, Longree, Isermann, Mai, Schulze, Abraham & Weikert
(2020), found that vegans (n = 36) participated in more hours of physical activity a week (2.8
hours per week) compared to omnivores (n = 36) (2.3 hours per week). Menal-Puey et al
(2018), conducted a Spanish consumption and lifestyle cross-sectional study with a total of 102
respondents who were vegan (n = 40) and vegetarians (n = 62). It was found that there were
no significant differences in the number of minutes of physical activity per week among vegans
(261.8 ± 191.7) and vegetarians (247.7 ± 238.7). An internet-based survey, conducted in
Germany by Vollmer, Keller & Kroke (2018) investigated the vegan diet followed by 1924
respondents. Of the sample, 1344 reported on their physical activity, more than half of the
respondents reported that they performed some physical activity for 3 or more days a week
(58.1%, n = 780). This indicates that most respondents followed a strict vegan diet and engaged
in healthy lifestyle activities in line with findings from international studies.
5.2 The motives for following a vegan diet
A list of 16 possible motives were listed in a Likert scale type question to be answered by the
respondents. The majority of respondents strongly agreed (83.9%, n = 172) that the ethical
concern for animals (preventing cruelty, animal rights and welfare) including protecting
endangered species (44.9%, n = 92) was their main motivation for following a vegan diet.
Therefore, the hypothesis that ethical reasons would be the main motive for becoming a vegan
is accepted. The second main motivation was protecting the environment (59.5%, n = 122) and
the effect of animal product consumption on climate change (49.8%, n = 102) including
reducing the carbon footprint (49.8%, n = 102), saving water (45.9%, n = 94) and preventing
pollution (42.4%, n = 87). The respondents strongly agreed that the third main motive were

133
health reasons such as following the diet to improve health (41.5%, n = 85), personal well-being
(42.4%, n = 87) and to prevent diseases and illnesses (30.2%, n = 62). This is in line with the
international model of motives for following a vegan diet presented in Figure 2.1 in Chapter 2.
The three main motives for following a vegan diet were also similar to the study by Janssen et
al (2016), this included motives associated with animal agriculture, animal rights and welfare
(summarised into “animal related motives”) (89.4%), this is was followed by health and
personal well-being (summarised into “self-related motives) (69.3%) and lastly concerns
related to protecting the environment, climate change and sustainability of the ecosystems
(summarised into “environment-related motives) (46.8%). However, the respondents in this
study showed a greater motivation towards protecting the environment rather than the health
benefits received from following the diet.
According to Kerschke-Risch (2015) conducted in Germany, both males (n = 174) and females
(n = 679) overall indicated that reports on factory farming (SD = 4.4) followed by climate
protection (SD = 3.8) than health which came third as major motives (SD = 3.2). However, in
the study by Dyett et al (2013), contrasting results were discovered. Out of one hundred vegans
who participated in the study, 47% indicated health beliefs as the main vegan motive, 40%
mentioned animal welfare while religious and other motives were indicated by 13% of the
respondents. Some individuals do choose to follow plant-based diets for health promotion and
the prevention of diseases (Sticher, Smith, & Davidson 2010). These diets may also be used
for disease treatment and management (Trapp, Barnard & Katcher 2010).
Motives such as preventing the exploitation of humans, human rights and world hunger are
categorised as “social justice” (Janssen et al 2016). A lower percentage of respondents in this
study strongly agreed that social justice such as world hunger could be reduced by feeding
nutritious grains to the underprivileged instead of to farm animals (41.0%, n = 84), as a
motivating reason for following the diet. The respondents slightly agreed that protecting factory
and farm workers from unsafe conditions (24.4%, n = 50) contributed to their motives. These
motives differ from the international model of motives found in Figure 2.1 in Chapter 2.
In the present study, respondents indicated that religious beliefs (56.6%, n = 116) and family
tradition and/or friends following the diet (56.1%, n = 115) were their least motivating factors
to follow the diet. These motives were found in the international model of motives in Figure
2.1 in Chapter 2. This is similar to the study by Janssen et al (2016), as 5% of the respondents
indicated having motives related to the food industry and the aversion to capitalism and less

134
than 3% of the respondents indicated being motivated by “other” motives such as family
members following the diet and spirituality. Social factors also played a minor role in the study
by Waldman et al (2003).
As literature suggests, there are numerous factors that impact and motivate an individual to
begin following a vegan diet. These reasons range from the concern of animals, personal health
and well-being, religious beliefs and dislike toward meat (Ruby 2012). Other reported reasons
included following the diet for losing weight, political reasons, taste profiles and reducing costs
(Hoffman et al 2013).
A further question related to motivations was presented to the study respondents as to whether
their initial motivation had changed after following the vegan diet. The results showed that a
significant number of respondents (71%, n = 146) had not changed their initial motivation for
following a vegan diet. According to Timko et al (2012) and Beardsworth & Keil (1992),
projected motivations for following a specific diet might transform over a period of time. In an
American study by Timko et al (2012), with 486 respondents following different diets, it was
found that most respondents were more likely to continue with their chosen diet for the same
reasons that they started following a particular diet. Individuals who followed plant-based diets
(inclusive of vegans, vegetarians and semi-vegetarians) in the study specified that they either
sustained the diet due to habit or a dislike for meat. However, ethical reasons followed by health
reasons, provoked the change of diet from an initial omnivore diet to a plant-based diet
according to the study.
Many factors may assist an individual to transition into a vegan diet. In this study, 13 possible
assisting factors were proposed to the respondents in a Likert scale question. Most of the
respondents “strongly agreed” that reading ingredient lists on products (42.4%, n = 87) assisted
their transition, this was followed by experimenting with vegan recipes (37.6%, n = 77). The
respondents “strongly disagreed” that visiting a dietitian (50.2%, n = 103) assisted them during
their transition. Ten of the assisting factors were further categorised into 3 groups namely:
factors associated with vegan places/ books (vegan shops, health stores, vegan cookbooks/
magazines/ newspapers, visiting a vegan restaurant), factors involving food experimentation
(experimenting with replacing dairy and meat products with plant-based alternatives,
experimenting with vegan recipes, reading ingredient lists on products, becoming vegetarian
first prior to becoming vegan) and social factors (social media and/or the internet, vegan

135
groups). Respondents showed a significant agreement that experimenting with food assisted
them the most during their transition into the diet.
Steele (2013), mentioned that there are a number of influences that assist an individual to follow
a vegan diet, besides initial motivations. These influences include conversations and
relationships with other vegans, media influences such vegan propaganda which includes vegan
books, DVD’s and documentaries, health concerns or PETA (People for the Ethical Treatment
of Animals) events.
5.3 The challenges associated with following a vegan diet
The present study reported on the challenges faced by the vegan respondents. Transitioning
into a vegan diet can either be an easy or difficult process depending on the individual. The
respondents in this study (n = 197) were given six words to describe their transition into the
diet. These words were arranged in a Likert scale type question ranging from “very easy”,
“easy”, “moderately easy”, and “moderately difficult”, “difficult” and “very difficult”. Most
of the respondents described the transitioning process to be “moderately easy” (35.1%, n = 72),
followed by “easy” (25.9%, n = 53). The respondents further stated that they felt “excitement
and enthusiasm” (29.3%, n = 60), followed by being “determined” (22.0%, n = 45) and
“optimistic” (20.0%, n = 41). McDonald (2000) stated that vegans experience emotions such
as “grief, sadness and guilt” before transitioning into a vegan diet. These emotions may be
sparked by people (friend or partner becoming vegan), books such as The Face on Your Plate,
certain documentaries such as Earthlings, events (PETA event on vivisection) or a health issue
(family member or individual diagnosed with heart condition) (Steele 2013).
The book titled The Face on Your Plate, contains interesting views on the abuse and injustice
done to farm animals that are raised for human consumption. This book highlights becoming
a vegan or vegetarian and how to consume less meat. The 2005 American documentary named
Earthlings, exposes animals at factory farms that endure suffering, research labs, puppy mills
and other places which exploit animals for human needs and economic purposes. This
documentary includes footage attained through the use of hidden camera’s showing the daily
practices of some of the largest industries in the world that involve animals. The organisation
PETA follows the simple principle that animals should not be experimented on, be eaten, be
worn, used for entertainment or abused in any other way. PETA provides education to policy
makers and public awareness about animal abuse and promotes the kind treatment of animals.

136
Overall from the responses, it can be noted that vegans felt positive emotions at the beginning
of their transition. Fear was the least felt emotion among the respondents (0.5%, n = 1). Most
of the respondents in this study reported that they do not incur any financial challenges by
following a vegan diet (74.6%, n = 176) and purchase most of their food from a supermarket
(86.3%, n = 177). Seven other challenges were listed using a Likert scale type question. The
respondents “strongly agreed” that finding vegan options in a restaurant was the main challenge
(40.5%, n = 83). Therefore the hypothesis that the respondents’ main challenge would be would
be to find suitable vegan menu items when eating out is accepted. A study by Steele (2013)
conducted in the United States, where 17 vegans were interviewed, also found that the biggest
obstacles for the respondents were deciding what food to order from a restaurant as well as
other social situations. For example, it was mentioned that going to a restaurant with friends
was difficult, as the word “vegan” was misunderstood by many waitrons. Respondents in the
study also indicated that although giving up specific foods was a challenge, discovering new
vegan foods in the market assisted in overcoming the challenges; this is similar to the findings
of the present study. Respondents in the present study “strongly disagreed” that avoiding meat
and meat products was a challenge while following the diet (32.7%, n = 67).
The respondents “strongly agreed” that research on the internet (46.8%, n = 96) was the best
way to overcome any challenges experienced while following the diet. A cross-sectional study
by Cramer, Kessler, Sundberg, Leach, Schumann, Adams & Lauche (2017), conducted in the
United States showed similar findings. The study involved a national representative sample (n
= 35 525), to examine the prevalence of following vegetarian and vegan diets for health reasons.
According to the respondents, research on vegan and vegetarian diets was more often obtained
from the internet (44.6%), this was followed by books, magazines or newspapers (41.2%) and
health food stores (27.6%). Although, it can be noted that individuals should be aware that not
all information on the internet is based on scientific evidence (Alnemer, Alhuzaim, Alnemer,
Alharbi, Bawazir, Barayyan & Balaraj 2015).
Most of the respondents “strongly disagreed” that visiting a dietitian (42.0%, n = 86) could
assist in overcoming challenges. Although, visiting a dietitian was unlikely done by the present
study respondents, vegans are recommended to consult a dietitian (Fields et al 2016). A
dietitian consult is especially essential if vegan diets are being followed by the elderly, children
or pregnant women, as careful meal and menu planning should be done to ensure the individual
meets their nutritional requirements (Britton 2003). A study by Van Rensburg & Wiles (2019),
conducted in South Africa consisting of 101 dieticians in the KwaZulu-Natal province, found

137
that although dieticians received inadequate training about a whole-food plant-based diet at
university level; a significant sample of the respondents were confident in prescribing the diet.
Respondents were asked about their agreement to statements regarding the vegan diet. From
the three statements, most of the respondents “strongly agreed” that vegan recipes are easily
accessible (96.1%, n = 197) and “agreed” that there is an adequate range of vegan products at
their nearest supermarket or retail store (26.3%, n = 54). According to Dhont & Hodson (2020),
vegan product availability has grown extensively in supermarkets, and well-known brands and
companies have launched vegan alternatives to their popular meals. Most of the respondents
“strongly disagreed” that it costs more to follow a vegan diet than a diet that includes animal
food products (35.6%, n = 73%). Recently, a number of vegan cookbooks, magazines and blogs
with vegan recipes have been published on the internet. The recipes that use traditional meat
products can now be substituted for plant-based products in order to prepare vegan meals (Hart
2018). Furthermore, supermarkets offer exclusively vegan products, which can be seen as proof
of a corresponding increase in a large group of consumers (Kerschke-Risch 2015). The study
by Katcher et al (2010), conducted in the United States, investigated two groups of people
following a vegan nutrition programme at a worksite. The first group were given instructions
on how a low-fat vegan diet should be followed (n = 68) and the second group received no
instructions about their diet (n = 45) for 22 weeks. Respondents following the vegan diet
reported overall contentment with the diet, as well as a significant reduction in the expense of
purchasing food products. Major supermarkets and health stores in South Africa have increased
their range of plant-based products available to vegans due to the rise in demand of constructing
meat-free meals (Independent Online 2020a). Local online shopping stores have a wide range
of vegan-specific products which offers delivery services in South Africa (Faithful to Nature
2020). Therefore, the results of the present study relate similarly to research.
5.4 The nutritional quality of a vegan diet
Although, there are numerous favourable health benefits related to the consumption of a vegan
diet, concerns still remain about the nutritional quality of this strict dietary pattern (Craig 2009).
Perceptions remain that the vegetarian diet, particularly the vegan diet, is lacking in important
nutrients including protein, iron, vitamin B12 and calcium (Rizzo et al 2013; Farmer et al 2011;
McEvoy, Temple & Woodside 2012; Deriemaeker et al 2010; Gilsing et al 2010; Appleby,
Roddam, Allen & Key 2007). At the beginning of the questionnaire, the respondents were
questioned about their agreement to five statements regarding the nutritional quality of the

138
vegan diet. Most of the respondents “strongly agreed” that a vegan diet is nutritionally complete
and adequate for a healthy lifestyle (65.9%, n = 136). The respondents also “strongly
disagreed” that the vegan diet does not provide a feeling of satiety (63.4%, n = 130). Due to
the high fibre content in many vegan diets, individuals could reach a feeling of satiety much
quicker than those following an omnivorous diet (Marlett, McBurney & Slavin 2002).
Respondents indicated that they visited a restaurant and ordered a vegan meal “once a month”
(37.6%, n = 77) followed by “less than once a month” (27.8%, n = 57). According to the study
by Steele (2013), conducted in the United States, vegans visited restaurants less often due to
difficulty finding suitable vegan options on the menu. Several vegans stated that they consumed
mainly salad, baked potato or potato fries when going out to eat and the variety of meals were
limited compared to eating at home. However, recently the number of exclusively vegan
restaurants are increasing (Crimarco, Turner-McGrievy, Botchway, Macauda, Adams, Blake &
Younginer 2019) and a number of major chain restaurants have added vegan options to their
menus (Dhont & Hodson 2020).
This rise is similar in South Africa as many retailers and restaurants say that there is an increase
in demand by consumers who request plant-based food options. South Africa was also
identified as the only African country with a fairly large vegan group. This was according to
Goole trends data (Independent Online 2020b). One of South Africa’s most popular restaurants,
Spur Steak Ranches, has introduced its first vegan-friendly and plant-based menu across the
country. The chief operating officer said that “they have included options on their menu that
makes it possible for a group of diverse people to get together and enjoy a variety of meal
options, and that it is therefore important that the addition of the plant-based options is well-
thought-out and has mouth-watering items to excite everyone” (Independent Online 2019b).
According to HappyCow’s online healthy eating guide restaurant listings, there are currently
29 vegan-specific restaurants, 75 vegetarian-specific restaurants and 287 restaurants with
vegetarian options in South Africa (HappyCow 2020). The vegan South African directory, is
an online vegan-friendly website to find restaurants, shops, food and drinks, recipes, products
and accommodation. The website also offers an option to become a volunteer to manage vegan
listings in your particular province. According to this website, there are currently also 29
vegan-specific restaurants listed nationwide (Vegan South Africa 2020).
In the present study, both a FFQ and 24-hour recall was conducted to gather dietary data from
the respondents. Out of a total of n = 205 respondents completing Section A to Section D of
the questionnaire, only n = 134 respondents completed the 24-hour recall and n = 113 completed

139
the FFQ. Both of these dietary tools were at the end of the questionnaire, and possibly due to
respondent fatigue, half of the respondents submitted the questionnaire without completing the
section. Although, 24-hour recalls require a low respondent burden (Arab, Wesseling-Perry,
Jardack, Hendry & Winter 2010), it does still require respondents to remember what they had
consumed during the previous 24-hours therefore an online self-administered 24-hour recall
may become tedious and time consuming, especially if the respondents were completing the
questionnaire during work or any other daily activity.
The FFQ consisted of 291 food items and this was done to include a wide variety of food
products and food categories to provide an indication of frequency and amount of common
foods consumed in the vegan diet. However, online respondents may have felt that due to the
length of this section, it would be time consuming to complete and this led to many respondents
failing to complete this section of the questionnaire. The respondents also required a device
with adequate Internet signal. The cost of using the Internet for longer periods of time may also
have played a role in the decrease in respondents. Completing these sections required reading
and computer literacy and it is a possibility that for many of the respondents, it was their first
time completing a 24-hour recall and FFQ, therefore the results should be interpreted with
caution.
Hu (2002) mentioned that the assessment of nutritional quality of a diet requires the use of
different indices to analyse a dietary pattern rather than a more reductive nutrient method.
Carroll, Midthune, Subar, Shumakovich, Freedman, Thompson & Kipnis (2012), suggested the
combination of 24-hour recalls and a FFQ, as it has shown to improve a wider range of dietary
components. The convenience of web-based 24-hour recalls and FFQ tools allows a possibility
to reach a wider sample population. However, it is important to understand that these dietary
assessment tools are subject to errors of measurement, and it is assumed that respondents are
unbiased with their usual food intake. Taking this into account, a one day, 24-hour recall and
FFQ were methods used to obtain dietary information and assess the nutritional intake of the
study population respectively.
A number of studies have used FFQ’s to analyse the dietary intake of vegan populations
(Sobiecki et al 2016; Clarys et al 2014; Dyett et al 2014; Waldmann, Dorr, Koschizke,
Leitzmann & Hahn 2006; Waldmann, Koschizke, Leitzmann & Hahn 2005; Waldmann et al
2003). In the present study, a vegan-specific FFQ which consisted of 291 food items was used,
and categorised into food groups to identify the food products and variety within food group.

140
The FFQ was constructed in line with the FFQ done by Dyett et al (2014) which was conducted
in the United States and consisted of a 252 item FFQ also listed in food categories.
5.4.1 The food frequency questionnaire
According to the findings of the present study, from the starches food group category, the most
frequently consumed items were whole-wheat bread “once a week” (18.0%, n = 37) (1 - 2
slices), white bread rolls “once a week” (½ – 1 small item) and pasta plain and eggless (21.0%,
n = 43) (½ - 1 cup). The starches consumed “never/rarely” were French bread (43.4%, n = 89)
(<1 slice), cornbread (52.7%, n = 108) (<½ small item) and organic black noodles (52.7%, n =
108) (<½ cup). This could be due to the unavailability of these items in the nearest
supermarkets or the taste and texture of these items are not palatable by the respondents. In the
category of grains, white or brown basmati rice was most commonly consumed by the
respondents (20.0%, n = 41) (½ - 1 cup) “at least once a month” and muesli was the most
consumed breakfast cereal (8.3%, n = 17) (<½ cup) “at least once a week”. According to Hever
(2016), meals should include whole-grains as it increases energy, provides a feeling of fullness
and assists with the flexibility in planning meals and menus for those who follow plant-based
diets. Clarys et al (2014), also found that the intake of starch was highest in vegans and lowest
in omnivores.
Under the vegan meat and milk substitute category, ½ to 1 cup of soy products were most
frequently consumed by the respondents “at least once a week” (28.8%, n = 59). According to
Radnitz et al (2015), soya products are most frequently consumed for the health benefits,
especially if these products are minimally processed (D’Adamo & Sahin 2014). The most
frequently consumed milk substitute was soy milk “at least once a day” (½ – 1 cup) (21.0%, n
= 43). This finding is similar to the study by Elorinne et al (2016) which investigated the
nutritional status as well as food and nutrient consumption of vegans in Finland (n = 22) and
non-vegans (n = 19). It was found that most vegan respondents consumed soy milk drinks on
a daily basis. The study by Elorinne et al (2016), mentioned that most vegan respondents
consumed enriched soy and oat milk daily. Soy milk is known for having a good source of
high-quality proteins, iron and B vitamins. The acceptability of soy milk is increasing, despite
its previously perceived “beany” flavour profile. Manufacturers of soy milk are finding
different processing techniques to alter flavour and odour of the milk, thus making it more
acceptable to consumers (Yu, Liu, Hu & Xu 2017).

141
Vegan cheese was consumed “at least once a month” by the respondents (1 - 2 slices) (22.0%,
n = 45), while an egg replacer was “never/rarely” used (< 1tsp) (42.0%, n = 86). According to
the Mail & Guardian (2018), although vegan and plant-based conventional foods are becoming
increasingly popular in the South African market, the costs of these products are more than the
animal versions. For the example, in a popular supermarket in South Africa, the cost of 200 g
of dairy free cheddar cheese is R77.99 compared to 240 g dairy cheddar cheese which costs
R44.99 (Woolworths Online 2020). Most vegan cheese can be found at major grocery stores
in South Africa, however the types may vary (Independent Online 2019a). Due to the
availability and cost of vegan cheese, home-made versions may be encouraged. Egg replacers
are commonly used as a forming and emulsifying agent, especially during baking. Egg
replacers are common in vegan diets or among individuals who suffer from egg allergies as it
assists in making food items such as mayonnaise, cheese and cakes (Meurer, de Souza &
Marczak 2020). Commonly used examples of egg replacers in baking include mashed banana,
applesauce, silken tofu, ground flax seeds mixed with water and dairy-free yoghurt (Bigger
Bolder Baking 2019).
A high frequency of consumption was seen for leafy vegetables most especially spinach which
was consumed “at least once a week” (>1 cup) (24.9%, n = 51) by the respondents. Mustard
greens were least frequently consumed (<½ cup) (45.4%, n = 93). Mustard greens are a type
of spinach. Seeds for mustard greens can be purchased online in South Africa and it is usually
used in fresh snacks and salads. The plant is originally from the USA (Seeds for Africa 2020).
Broccoli was most commonly consumed by the respondents under the non-leafy vegetable
category “at least once a week” (½ - 1 cup) (36.1%, n = 74). Cassava was least consumed by
the respondents (<½ cup) (52.2%, n = 107). Due to increased poverty and food insecurity in
Africa, including South Africa, a cassava starch extraction factory has been in operation ever
since the late 1990’s in South Africa (Allemann 2003). This root vegetable is cultivated in
warmer regions in Limpopo, Mpumalanga and Kwa-Zulu Natal in South Africa (Allemann &
Dugmore 2003). Therefore, due to the increase in its popularity in the country, cassava was
included in the list of non-leafy vegetables.
Tomato sauce, pasta sauce and salsa was the most frequently consumed vegetable condiment
“at least once a week” (<½ cup) (24.9%, n = 51), while tomato juice was least consumed (<½
cup) (48.8%, n = 100). The mixed food category consisted of two food items. Respondents
consumed vegan pizza (>3 slices) (32.7%, n = 67) more frequently than vegan lasagne (<1 - 3
slices) (36.1%, n = 74). The study by Larsson & Johansson (2002), conducted in Sweden,

142
investigated the nutritional status and dietary intake of young vegans and omnivores. The study
found that both groups had similar intakes of mixed foods such as pizza and pies and young
“ethical” vegans were different from vegetarians who were more health conscious in previous
studies (Freeland-Graves, Greninger, Graves & Young 1986). Vegans consumed a
significantly less amount of pizza compared to those following other diets (Papier, Tong,
Appleby, Bradbury, Fensom, Knuppel, Perez-Cornago, Schmidt, Travis & Key 2019), this may
be due to consumer willingness to try and acceptability of vegan mixed food products.
In the peas and beans category, chickpeas was consumed “at least once a week” by the
respondents (½ – 1 cup) (32.2%, n = 66). Chickpeas or garbanzo beans, are well-known in the
family of legumes. Traditionally, chickpeas have been part of many meals due to its nut-like
flavour in food and sensory profiles (Deosthale 1982). Respondents indicated “never/rarely”
consuming navy beans (<½ cup) (48.8%, n = 100). Navy bean, also known as haricot beans
can be purchased in retail shops in South Africa. The beans can be purchased in the dry form
as well as canned in brine (Woolworths Online 2020). At the time of the study, it is possible
that South African vegans did not relate to the term “navy beans”. The most commonly
consumed bean product was baked beans “at least once a month” (<½ cup) (17.6%, n = 36),
while refried beans was least commonly consumed (<½ cup) (46.8%, n = 96). Refried beans is
a common Mexican food product that can either be homemade or purchased in canned form
online in South Africa (Manicaa Online 2020). Different type of legumes form an integral part
of vegetarian and vegan diets, mainly due to its numerous health benefits such as the
management of weight, diabetes, hyperlipidaemia and hypertension. Legumes provide the
body with carbohydrates, B vitamins, phosphorous, iron, copper, magnesium, manganese, zinc
and fibre. They are naturally lower in fat, free of saturated fat and cholesterol (Polak, Phillips
and Campbell 2015). It is important to note that legumes have a comparable nutritional profile
to both protein and vegetable food categories. Legumes are also known as a good source of
dietary protein and may be used to achieve nutrient requirements of both food categories
(Wallace, Murray & Zelma 2016; Baloch & Zubair 2010; Sandberg 2002). Therefore, due to
these benefits, vegans are encouraged to continue consuming a wide variety of legumes.
In the fruit category, banana was most commonly consumed by the respondents “at least once
a day” (½ - 1 medium item/ cup) (22.4%. n = 46). The least consumed fruit was persimmons
(<½ medium item/cup) (49.3%, n = 101). Dried raisins were consumed “at least once a month”
(<½ cup) (14.1%, n = 29) and dried pomegranates was least commonly consumed (<½ cup)
(52.2%, n = 107). Orange juice freshly prepared was most frequently consumed by the

143
respondents “at least once a month” (<1 cup) (12.7, n = 26). Coconut water was least consumed
(<1 cup) (43.9%, n = 90). Higher intakes of fruit are typical vegan and vegetarian diets. Fruit
is known as a main contributor to carbohydrates and sugars (Craig 2009). Higher fruit intake
is commonly consumed by vegans that are motivated by improving their health (Radnitz et al
2015). Fruit is encouraged in the vegan diet as it is rich in fibre, folic acid, antioxidants and
phytochemicals and it is believed to reduce cholesterol levels (Mann 2014).
Under the fats category, olive oil was consumed “at least once a day” (1 - 2 tsp) (20.5%, n =
42) by the respondents, followed by peanut butter consumed at least once a week (>2 tsp)
(19.0%, n = 39) and almonds was the most consumed nut “at least once a month” (<½ cup)
(12.7%, n = 26). The least consumed fats were soybean oil (<½ cup) (51.7%, n = 106) and
hazel nut butter (<1 tsp) (51.7%, n = 106). The fat spread most frequently consumed is dairy
free margarine “at least once a week” (1 - 2 tsp) (15.6%, n = 32), while organic coconut butter
is least consumed (<1 tsp) (47.3%, n = 97).
The most frequently consumed dressing was hummus consumed “at least once a week” (>2 tsp)
(22.4%, n = 46) and least consumed is peri – peri vegan mayonnaise (<1 tsp) (46.3%, n = 95).
In the Western culture, hummus is made by cooking and mashing chickpeas to be used as a dip
or spread. This spread is usually blended with olive oil, juice from a lemon, tahini and a variety
of spices. Although there is a comparable nutrient profile between chickpeas and hummus,
they cannot be compared nutritionally. For example, when hummus is commercially prepared,
the bioavailability and profile of nutrients found in chickpeas may be altered. The chickpeas
in hummus makes it a good source of protein, resistant starch, poly-unsaturated fatty acids,
fibre, vitamins and minerals such as folate, potassium, calcium and magnesium. This may be
especially essential to vegans and those following plant-based diets, to replace common spreads
and dips to hummus to increase diet quality (Wallace et al 2016).
In the snacks category, potato chips were more frequently consumed “at least once a month”
by the respondents (1 packet, 125 g) (19.0%, n=39), wheat-free biscuits (1-2 items) (11.7%, n
= 24) and organic dark chocolate bars (<1 item) (17.1%, n = 35). The least frequently consumed
snacks were coconut chips (<1 packet (<125g) (51.2%, n = 105), biscotti (<1 item) (52.2%, n
= 107) and peanut clusters (<1 item) (48.3%, n = 99). Vegan peanut clusters can be homemade
or purchased online (Karibaa Online 2019). The most frequently consumed in the dessert
category was non-dairy yoghurt (<½ cup) (10.7%, n = 22) and egg-less cake “at least once a
month” (1-2 slices) (17.1%, n = 35). The least commonly consumed dessert was soy ice cream

144
(<½ cup) (45.9%, n = 94) and fruit pie (<1 slice) (51.2%, n = 105). The vegetarian resource
group suggests that it is easy to meet protein requirements if the calorie intake is adequate and
this can be achieved by consuming calorie dense foods or multiple meals or snacks during the
day. The consumption of vegan snacks are very similar to non-vegans. These snacks include
vegetable chips, popcorn and pretzels. It is a common myth that the vegan diet is characterised
by excluding sugar and sweets from the diet, however, this is hardly true as vegans consumed
various vegan-friendly desserts and snacks (Mann 2014). According to Radnitz et al (2015),
the consumption of sweets also depends on whether vegans are following the diet for health or
ethical reasons, as ethical motivated vegans in the study consumed significantly more sweets
per day (p < 0.01). Ice-cream is known as an innovative, “luxury” product and although dairy-
free vegan ice-creams are a growing trend in the market, the cost is more than traditional dairy
ice-creams. These ice-creams are made of fruit and vegetable juices as well as PBMAs,
especially coconut milk. Frozen fruit and vegetable pieces are also used, which increases the
cost of manufacturing vegan ice-cream (Palka & Newerli-Guz 2018). Similarly in South Africa,
vegan ice-cream can only be found in big retail supermarkets which stock a variety of vegan
products and vegan-specific restaurants and stores or be homemade.
Under the category of spreads and sweeteners, respondents indicated that jam in different
flavours is the most commonly consumed spread “at least once a month” (1 - 2 tsp) (13.2%, n
= 27), while brown sugar is the most consumed sweetener “at least once a day” (1 - 2 tsp)
(17.1%, n = 35). Due to the dependence of white sugar, there is a vast development of white
sugar substitutes (Abdullah, Rianse, Iswandi, Taridala, Rianse, Zulfikar, Baka, Abdi, Cahyono,
Widayah & Baka 2015). One of these substitutes widely consumed is brown sugar which was
able to take over from white sugar in the market as a substitute sweetener that provides health
benefits (Kim & Han 2013). In South Africa, sugar is manufactured from crushing and refining
sugar cane. This is done in a sugar cane mill, to produce raw sugar by extracting cane juice
from sugar cane, however this raw sugar cannot be consumed by humans until foreign particles,
molasses and impurities are extracted. Granular brown sugar is formed when the remaining
juice is crystallised and further refining procedures form white sugar. Both white and brown
sugar is used by household consumers (direct consumption), industries involved in food
processing (industrial consumption) and manufactures involved in beverage, baking and
confectionery (Chisanga, Gathiaka, Nguruse, Onyancha & Vilakazi 2014).
Organic chocolate spread (<1 tsp) (49.3%, n = 101) and coconut syrup (<1 tsp) (52.7%, n =
108) were least frequently consumed by the respondents. In the beverages category, the

145
respondents indicated frequently consuming decaffeinated or regular coffee “at least once a
day” (1 - 2 cup) (29.3%, n = 60) and sugar-sweetened beverages “at least once a month” (<1
cup) (11.2%, n = 23). The least consumed beverages was fruit flavoured juice (<1 cup) (45.9%,
n = 94) and non-alcoholic wine (<1 cup) (48.8%, n = 100). Mchiza, Steyn, Hill, Kruger,
Schönfeldt, Nel & Wentzel-Viljoen (2015), conducted a study in South Africa, reviewing
dietary surveys among the adult population from year 2000 to 2015. The findings show that
South Africans frequently consumed an average of two cups of tea per day. The increased
intake of sugar is mainly due to the consumption of sugar-sweetened beverages (SSB) and
studies have confirmed that SSB is a frequently reported beverage among South Africans
(Tydeman-Edwards 2012).
Vorster, Kruger, Wentzel-Viljoen, Kruger & Margetts 2014), stated that the proportion of adults
consuming SSB has doubled over five years. The overconsumption of sugar intake promotes
weight gain and increases the risk for NCD’s. According to the study by Radnitz et al (2015)
conducted in Germany, vegans who were motived by ethical reasons, consumed a greater
amount of high polyphenol beverages (p < 0.01), while fruit juice was more frequently
consumed per month (p = 0.03) by those who followed the diet for health reasons. High-
polyphenol beverages are of plant-origin and include beverages such as coffee, tea, cocoa
drinks, fruit juice, wine, cider and beer (Ito, Gonthier, Manach, Morand, Mennen, Remesy &
Scalbert 2005). Most of the respondents in the present study, also followed the vegan diet for
ethical reasons and consumed higher amounts of coffee and fruit juices, therefore this study
findings are similar to the study findings of Radnitz et al (2015).
The VegPlate is a common tool used by vegans and vegetarians to plan healthy diets to meet
nutritional requirements. The number of recommended serving sizes in the VegPlate guidelines
are based on the kilocalories (kCal) of the diet. In the present study, the respondents consumed
a mean energy intake of 1785.65 kCal, therefore the 1800 kCal VegPlate serving size
recommendations will be used. Table 5.1 shows the VegPlate model serving size
recommendations compared to the results extracted from the 24-hour recall and FFQ of the
present study.
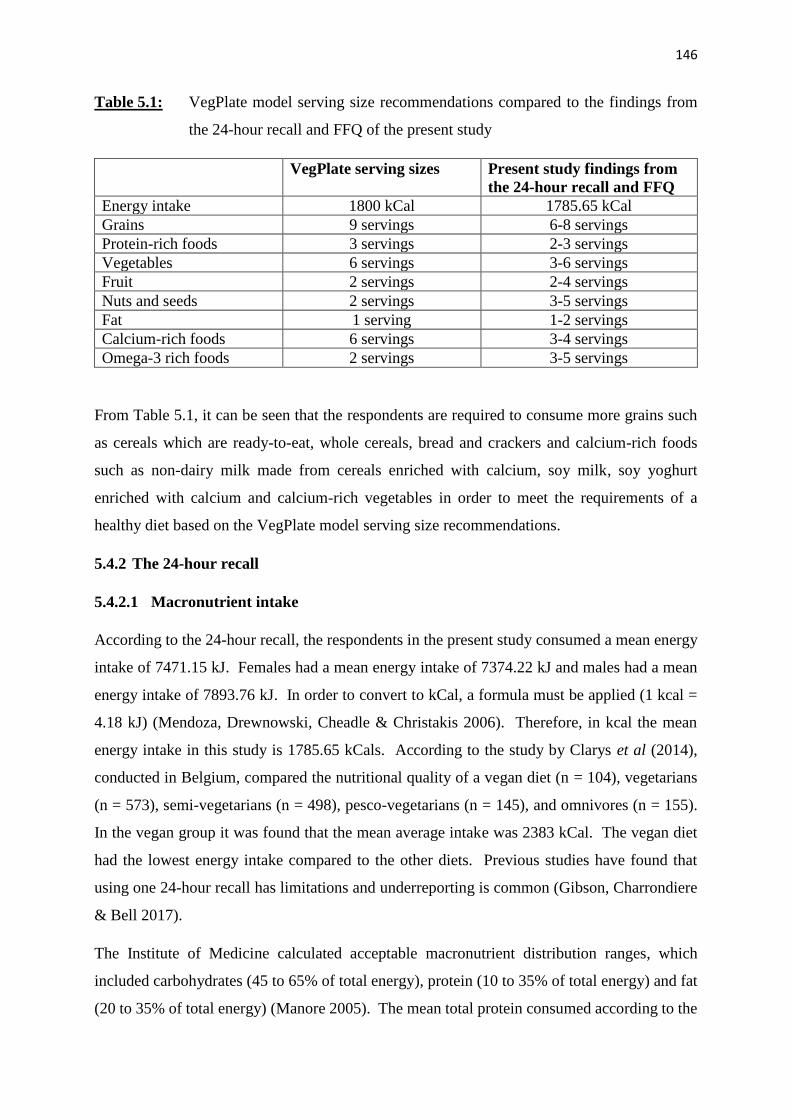
146
Table 5.1: VegPlate model serving size recommendations compared to the findings from
the 24-hour recall and FFQ of the present study
VegPlate serving sizes Present study findings from
the 24-hour recall and FFQ
Energy intake 1800 kCal 1785.65 kCal
Grains 9 servings 6-8 servings
Protein-rich foods 3 servings 2-3 servings
Vegetables 6 servings 3-6 servings
Fruit 2 servings 2-4 servings
Nuts and seeds 2 servings 3-5 servings
Fat 1 serving 1-2 servings
Calcium-rich foods 6 servings 3-4 servings
Omega-3 rich foods 2 servings 3-5 servings
From Table 5.1, it can be seen that the respondents are required to consume more grains such
as cereals which are ready-to-eat, whole cereals, bread and crackers and calcium-rich foods
such as non-dairy milk made from cereals enriched with calcium, soy milk, soy yoghurt
enriched with calcium and calcium-rich vegetables in order to meet the requirements of a
healthy diet based on the VegPlate model serving size recommendations.
5.4.2 The 24-hour recall
5.4.2.1 Macronutrient intake
According to the 24-hour recall, the respondents in the present study consumed a mean energy
intake of 7471.15 kJ. Females had a mean energy intake of 7374.22 kJ and males had a mean
energy intake of 7893.76 kJ. In order to convert to kCal, a formula must be applied (1 kcal =
4.18 kJ) (Mendoza, Drewnowski, Cheadle & Christakis 2006). Therefore, in kcal the mean
energy intake in this study is 1785.65 kCals. According to the study by Clarys et al (2014),
conducted in Belgium, compared the nutritional quality of a vegan diet (n = 104), vegetarians
(n = 573), semi-vegetarians (n = 498), pesco-vegetarians (n = 145), and omnivores (n = 155).
In the vegan group it was found that the mean average intake was 2383 kCal. The vegan diet
had the lowest energy intake compared to the other diets. Previous studies have found that
using one 24-hour recall has limitations and underreporting is common (Gibson, Charrondiere
& Bell 2017).
The Institute of Medicine calculated acceptable macronutrient distribution ranges, which
included carbohydrates (45 to 65% of total energy), protein (10 to 35% of total energy) and fat
(20 to 35% of total energy) (Manore 2005). The mean total protein consumed according to the

147
present study respondents was 74.73 g (18.5% of total energy from protein), whereby females
consumed a mean total protein intake of 74.82 g and males 74.34 g. This value is slightly lower
when compared to the mean total protein consumption of 82 g in the study by Clarys et al
(2014). The EAR for protein for males is 56 g and females is 46 g (based on 0.8 grams protein
per kilogram of body weight for the reference body weight) (Institute of Medicine, Food and
Nutrition Board & Committee to Review Dietary Reference Intakes for Vitamin D and Calcium
2011). Taking into account the age group of the respondents in the present study, the
respondents are over the EAR following a vegan diet as seen in Figure 4.1.
The mean total fat consumption was 62.34 g (33.7% of total energy from fat), with females
consuming a mean of 61.53 g and males 65.85 g. This is in line with the study by Clarys et al
(2014), which found that the average total fat among the respondents was 68 g. However, other
studies found mean total fat consumption is much higher among vegan respondents, for
example in the study by Kristensen et al (2015), conducted in Denmark with seventy vegan
respondents, the mean total fat was 86.7 g for men and 74.0 g for women.
In the present study, females consumed a mean intake of 187.23 g of carbohydrates and males
204.20 g. Although the respondents in the study consumed relatively lower mean intakes of
carbohydrates (190.40 g) (47.36% of total energy from carbohydrates) compared to other
studies (Kristensen et al 2015; Clays et al 2014), the value is more than the EAR for
carbohydrates for males and females which is 130 g per day (Institute of Medicine et al 2011)
as seen in Figure 4.1. In the study by Kristensen et al (2015); vegan respondents consumed a
mean carbohydrate value of 336 g, while in the study by Clarys et al 2014, men consumed 339
g while females consumed 221.7 g.
The mean fibre intake consumed by the respondents is 37.48 g. Male respondents consumed a
mean of 42.41 g and females 36.35 g. These values are greater than the EAR intakes, of 38 g
for males and 25 g for females (Institute of Medicine et al 2011) as seen in Figure 4.1.
Vegetarian and vegan diets are known to be high in dietary fibre (Key et al 2006), therefore this
was expected in the present study. Furthermore, the vegan diet is widely promoted due to its
high dietary fibre content which assists with metabolic and gastrointestinal functions (Clarys et
al 2014).
5.4.2.2 Micronutrient intake
According to micronutrients from the 24-hour recall, females consumed a mean intake of 8.84
mg of zinc, while males consumed 9.82 mg. The mean intake of zinc was 9.02 mg. The EAR

148
for zinc is 11 mg per day for males and 8 mg a day for females (Institute of Medicine et al
2011). In the present study, females consumed more than the EAR (8.84 mg), while males did
not reach their recommended intake for zinc (9.82 mg) as seen in Figure 4.2. Similarly, the
study by Kristensen et al (2015), showed that females consumed 8.6 mg of zinc and males
consumed 10.5 mg, below the EAR for zinc for males. The low intake of zinc in vegetarian
and vegans diets is mainly due to phytate or other inhibitors typically found in these diets that
decrease the absorption of zinc (King 2011). Therefore, well-planned diets are encouraged
which include legumes, nuts, seeds, fruit, vegetables and whole-grain products to enhance
absorption (Saunders, Craig & Baines 2013).
The mean calcium intake for males was 630.88 mg and female respondents was 612.51 mg,
while the overall mean intake was 615.94 mg. These mean intakes are far below the
recommended EAR of 1000 mg (Institute of Medicine et al 2011) as seen in Figure 4.2. This
finding is similar to a cross-sectional, German vegan study (GVS) by Ströhle et al (2011), which
included 154 vegan respondents. In the study, mean daily calcium intakes were below the EAR
for all vegans (839.8 ± 296.1). Other studies have also shown that calcium intakes for vegans
are below the recommended intakes (Kristensen et al 2015; Clarys et al 2014; Craig & Mangels
2009; Davey, Spencer, Appleby, Allen, Knox & Key 2003).
The mean iron intake was 23.01 mg, with females consuming a mean intake of 22.95 mg and
males 23.28 mg. These values are above the EAR for all aged groups of men and
postmenopausal women is 8 mg per day and premenopausal women is 18 mg per day (Institute
of Medicine et al 2011) as seen in Figure 4.2. This finding is similar to the study by Clarys et
al (2014), where the mean iron intake was 23 g. Although this finding is favourable, it will not
automatically result in the iron status being optimal, since non-haem iron absorption is less
efficient in vegans (McEvoy et al 2012; Craig 2009). Iron is known to have a reduced
bioavailability in plant-based foods (Kristensen et al 2015).
The respondents mean intake of sodium was 1003.38 mg, with females consumed a mean intake
of 1078.53 mg and males 675.72 mg. However, in the study by Kristensen et al (2015), males
(2068 mg) consumed higher amounts of sodium compared to females (1589 mg). This could
be due to the fact that the present study consisted of a significantly higher amount of females
(82.4 %). WHO (2012) recommends that adults have a sodium intake of less than 2000 g per
day. The EAR for sodium is less than WHO guidelines, with 1500 mg a day for males and

149
females (Institute of Medicine et al 2011). The respondents in the present study were
consuming less than the recommended intake for sodium as seen in Figure 4.2.
The mean intake of vitamin D in the present study was 3.42 μg, with females having a mean
intake of 3.44 μg and males 3.30 μg. The EAR for vitamin D for both males and females is 15
μg (Institute of Medicine et al 2011) as seen in Figure 4.3. The consequence of reduced vitamin
D consumption leads to lower absorption of phosphorous and calcium, which may affect bone
metabolism (Kristensen et al 2015). In the present study, vegans consumed a very low vitamin
D intake compared to what previous studies have found (Davey et al 2003; Haddad et al 1999a).
This may be due to low availability of vitamin D fortified foods, which needs to be produced
on a wider scale (Kristensen et al 2015). Turner-McGrievy et al (2008) suggested that vegans
consume fortified products in their vegan diet, while Larsson & Johansson (2002) advised that
if sun exposure is insufficient, vitamin D supplements can be used.
The respondents in the study had a mean vitamin B12 intake of 1.06 μg, with males and females
having a mean intake of 1.06 μg. This value is lower than the EAR for males and females of
2.4 μg (Institute of Medicine et al 2011) as seen in Figure 4.3. This finding is similar to other
studies conducted (Elorinne et al 2016; Kristensen et al 2015; Larsson & Johansson 2002).
These findings are expected as the presence of vitamin B12 or vitamin B12 in plant-based diets
depends on the inclusion or exclusion of foods of animal origin (milk, dairy and eggs), the
consumption of foods fortified with vitamin B12 or the use of vitamin B12 supplements.
Therefore, vegans have higher rates of deficiency compared to vegetarians and omnivores
(Pawlak et al 2013). Supplements are cost effective, when consumed in adequate doses, are
highly effective in preventing and treating vitamin B12 deficiency (Donaldson 2000).
However, many people following plant-based diets refuse to use vitamin B12 for a number of
reasons (Antony 2003). The largest misconception is the belief that people have adequate
vitamin B12 stores and the deficiency takes a number of years to develop (Allen 2009), however
this is unlikely especially in long-term vegans and vegetarians (Pawlak et al 2013).
5.4.2.3 Fatty acids and cholesterol intake
The vegan diet is known to be lower in cholesterol and saturated fat compared to other diets
(Craig 2009). According to the present study findings, the mean cholesterol intake was 4.0 mg,
with females having a mean intake of 3.80 mg and males 4.84 mg. The EAR for cholesterol is
less than 300 mg (Mann & Truswell 2002) as seen in Figure 4.1. This finding is similar to other
studies (Elorinne et al 2016, Kristensen et al 2015, Clarys et al 2014). One of the main benefits

150
of plant-based diets is the low amounts of cholesterol, as the diet contains plenty of nuts, seeds,
legumes and cereals and are rich in plant sterols (Ågren, Tvrzicka, Nenonen, Helve & Hänninen
2001). Compared to omnivores, vegans also consumed very low amounts of saturated fatty
acids (Kornsteiner, Singer & Elmadfa 2008). In the present study, the mean intake of saturated
fat consumed by the respondents was 12.39 g, with females consuming a mean of 12.72 g and
males 10.91 mg. This finding is relatively low compared to the Dietary Guidelines for
Americans 2015 – 2020, which recommended a limitation on the consumption of saturated fat
to be <10% of energy (United States Department of Health and Human Services 2015).
The present study showed the mean intake of mono-unsaturated fatty acids (MUFA) was 21.07
g, females consumed a mean intake of 21.24 g and males 20.34 g. The mean intake of poly-
unsaturated fatty acids (PUFA) was 20.34 g, with females consuming a mean intake of 19.60 g
and males 23.58 g. PUFA should contribute 6 - <10% of total energy and MUFA should make
up the remainder of energy from total fat, typically ± 10% (Smuts & Wolmarans 2013).
According to the present study, the respondents consumed 10.7% of energy from MUFA and
10 - 35% of energy from PUFA. These findings are in line with other studies as the vegan diet
is lower in MUFA and cholesterol and higher in PUFA when compared to other diets
(Kristensen et al 2015; Clarys et al 2014). Therefore, similar to the study by Elorinne et al
(2016), the present study showed a favourable fatty acid profile.
5.4.2.4 Other micronutrient intake
According to the present study, respondents met the EAR for many other micronutrients. The
average intake of vitamin B6 among the respondents in the present study is 1.90 mg, while
females consumed a mean intake of 1.90 mg and males 1.91 mg. The respondents met the EAR
for vitamin B6 which is 1.3 mg for males and females between the ages of 19 and 50 years, 1.7
mg for males above the age of 51 years and 1.5 mg for females over the age of 51 years (Institute
of Medicine et al 2011) as seen in Figure 4.3. The respondents consumed a mean intake of
vitamin A was 1833.70 μg, which was above the EAR for men (900 μg) and women (700 μg)
(Institute of Medicine et al 2011) as seen in Figure 4.3.
In the present study, females consumed a mean vitamin A intake of 1722.90 μg and males
2316.80 μg. The respondents also consumed mean intakes of thiamine (1.51 mg) and riboflavin
(1.28 mg), above the EAR as seen in Figure 4.3. Females in the study consumed mean intake
of 1.49 mg of thiamine and 1.26 mg of riboflavin, while males had a mean intake of 1.59 mg
of thiamine and 1.32 mg of riboflavin. The EAR for thiamine is 1.2 mg for adult males and 1.1

151
mg for adult females and the EAR for riboflavin is 1.3 mg for adult males and 1.1 mg for adult
females (Institute of Medicine et al 2011). The mean intake of folate in the present study is
441.33 μg, whereby females has a mean intake of 432.32 μg and males 480.60 μg. This intake
exceeds the EAR for folate which is 400 μg (Institute of Medicine et al 2011) as seen in Figure
4.3. The respondents consumed a mean intake of 219.70 μg of vitamin K, with females having
an intake of 209.02 μg and males 265.57 μg. This exceeds the EAR of 120 μg for adult males
and 90 μg for adult females (Institute of Medicine et al 2011) as seen in Figure 4.3. These
nutritional outcomes are similar to other studies (Elorinne et al 2016; Clarys et al 2014;
Waldmann et al 2003; Larsson & Johansson 2002). The hypothesis that South African vegans
would not meet their EARs for vitamin B12, vitamin D and calcium, which was based on the
findings of international studies, is accepted. The EAR for sodium was also not met by the
respondents. The EAE for zinc and niacin was only met by females and the EAR for vitamin
E was only met by males. Vitamin B12, vitamin D, calcium and sodium were lacking in the
vegan diet consumed by the respondents in the present study.
5.5 Summary
The demographic characteristics of the present study were similar to that of the demographics
from international studies. A greater percentage of the respondents were female and were
White. The age group, education level and level of physical activity of the respondents were
also consistent with vegans from different countries. A significant portion of the population
consumed supplements to assist in improving their nutritional status while following a vegan
diet. The ethical concerns for animals surrounding animal rights and welfare and preventing
cruelty was found to be the strongest motivation among the respondents for following a vegan
diet. The main challenges of following a vegan diet faced by the respondents in society was
finding vegan options in a restaurant. However, avoiding meat and meat products was not seen
as a challenge by the respondents. There was a significant agreement that that research on the
internet was the best way to overcome any challenges that they experienced while following
the diet.
The findings from the FFQ revealed that there were a variety of intake from different food
groups. The groups with the most intake included that from typical vegan diets internationally,
whereby whole-wheat products, fruit and vegetables and dairy-free alternatives made up most
of the respondents diet. The most frequently consumed PBMA was soy milk, while soya
products were the most favoured meat substitute. Soy milk remains as one of the most popular

152
PBMA consumed by vegans, while varieties of soya products are increasing. The 24-hour recall
revealed that although respondents met their EARs for most nutrients, the diet showed to be
lacking in calcium, sodium, vitamin D and vitamin B12, similar to the findings from
international studies. Therefore, strategies to prevent or reduce nutritional deficiencies in the
vegan diet need to be established. The conclusion and recommendations based on the study
findings will be presented in the following chapter.

153
CHAPTER 6: CONCLUSION
6.1 Introduction
Vegetarian diets particularly the vegan diet, are becoming increasingly popular mainly due to
an increase in awareness of preventing cruelty towards animals, protecting the environment and
its resources, as well as several health benefits associated with following the diet. Interest in
the vegan diet has risen in South Africa over the past few years with social movements being
established to focus on reaching out to the public and providing support to those who choose to
follow a vegan diet or lifestyle. Moreover, there is a growing rate of vegan-friendly restaurants
in South Africa and many restaurants are including vegan options to cater for this group of
patrons. However, following a vegan diet does have nutritional concerns, as research has shown
that the diet can be deficient in many essential nutrients. Therefore, correct supplementation,
choosing fortified food products and planning a healthy diet is important to meet the daily
requirements of nutrients and ensure adequate functioning of the body.
The decision to follow a vegan diet involves individuals having either single or multi-factored
motivations that influence the initial transition. Along with transitioning from a vegetarian or
omnivorous diet to a vegan diet, many individuals will face challenges socially and personally.
This study aimed to determine the challenges associated with becoming a vegan and how these
challenges were overcome. Many valid questions arose regarding the nutritional intake of
South African vegans and whether the diet was nutritionally complete and sustainable.
Although following a vegan diet is a growing trend worldwide, there is still a paucity of data
especially in South Africa compared to the growth in international research. Therefore, the
main purpose of this study was to determine the motives and challenges facing South African
vegans and the nutritional quality of their diet.
This chapter will conclude with discussing the results of the study in line with the objectives.
It will address the limitations of the study and recommendations for future research.
6.2 Conclusions of the study
6.2.1 The demographics of the study sample
The study population consisted of more female than male respondents and the White race group
made up majority of the population. A significant number of respondents resided in the
Gauteng Province, were single and were in the age category of 18 to 29 years and 40 to 49

154
years. Most of the respondents had either a degree or post-graduate education level and earned
an income of R25 601 to R51 200 per month.
A significant number of respondents followed a vegan diet for a duration of 1 to < 3 years.
According to lifestyle factors, most of the respondents consumed alcoholic beverages,
participated in physical activity with different intensities and varying durations and did not
consume cigarettes.
6.2.2 The motives regarding the vegan diet
The motives for following a vegan diet were measured using a variety of possible options
including ethical, environmental and health related motives. The study findings showed that
most of the respondents agreed that the ethical concern for animals (preventing cruelty, animal
rights and welfare) was the main motive for following a vegan diet. This was followed by
environmental concerns and the effect of animal product consumption on climate change, and
lastly, improving health. This provided a good understanding as to what motivates South
Africans to follow a vegan diet. Once the motives of the study population were established, the
factors that assisted the transition to a vegan diet were investigated. Based on the findings, the
study population indicated that experimenting with vegan food such as reading ingredient lists
on products and experimenting with vegan recipes assisted them more than social factors and
vegan books, magazines, newspapers or places such as vegan shops and health stores.
6.2.3 The challenges associated with following a vegan diet
The analysis showed that a significant number of respondents specified that it was “easy” to
transition into a vegan diet and excitement and enthusiasm was the main emotions that were
felt during the process. Most of the respondents agreed that there were no financial challenges
to following a vegan diet and the vegan diet did not cost more than a diet that included animal
products. This may have contributed to the financial accessibility of being able to follow the
vegan diet. Most respondents purchased their food from a supermarket rather than health food
shops and online websites. According to the respondents, the main challenge with following a
vegan diet was finding vegan meal options in restaurants. Research on the internet assisted the
majority of respondents to overcome challenges while following the vegan diet as opposed to
visiting a dietitian or talking to or educating friends and family regarding their choice of diet.

155
6.2.4 The nutritional quality of the vegan diet
The findings from this section of the study showed that most of the respondents agreed that
following a vegan diet was nutritionally complete and adequate for a healthy lifestyle. The
FFQ, was analysed to find which foods were most commonly consumed by the respondents.
The food items such as whole-wheat bread, white bread-rolls, pasta plain and eggless, white or
brown basmati rice, and muesli were most commonly consumed in the starches, cereals and
grains categories. In the categories of meat and milk substitutes and mixed foods; soya
products, soy milk and vegan pizza was most commonly consumed. In the categories of
vegetables, fruit, peas and beans; spinach, broccoli and vegetable condiments such as tomato
sauces, pasta and salsa; banana, dried raisins, freshly prepared orange juice, followed by chick
peas and baked beans as a bean product was most commonly consumed by the respondents. In
the category of fats and dressings; olive oil, peanut butter, almonds, dairy-free margarine and
hummus was most commonly consumed by the study population. The most commonly
consumed snacks and desserts included potato chips, wheat-free biscuits, organic dark
chocolate bars, non-dairy yoghurt and egg-less cakes. Different flavours of jam and brown
sugar was most commonly consumed in the spreads and sweeteners categories. The most
commonly consumed beverages included decaffeinated or regular coffee and sugar-sweetened
beverages.
The finding of the 24-hour recall showed that the respondents met some of the estimated
average requirement (EAR) of certain macronutrients and micronutrients. Overall, the mean
energy intake was slightly below energy intakes from international studies conducted on adults.
The respondents showed a favourable fat intake, and protein and carbohydrates were within the
percentage range of total energy contributions according to EAR guidelines for macronutrients.
Based on the analysis, respondents met their EARs for fibre, iron, vitamin C, vitamin B6,
vitamin A, thiamine, riboflavin, folate and vitamin K. However, the respondents did not meet
their EARs for calcium, sodium, vitamin D, vitamin B12. Males met their EAR for vitamin E,
while females did not meet the daily requirement. Females met their requirements for niacin
and zinc, while males did not meet the daily requirement. Females also consumed more added
sugar than males. Overall the respondents had a reduced consumption of cholesterol, saturated
fat and MUFA intake and an increased consumption of PUFA. Overall the findings of this
study was similar to international research.

156
6.3 Study limitations
Due to cost and time limitations, the study could not be conducted for an extended time to allow
a greater number of respondents to participate. However, the questionnaire was released online
and overtime the number of responses decreased. Increased responses can be obtained by
sending reminders or emailing potential respondents prior to the study, explaining the value of
the study, content of questions and average time taken to complete those questions. One of the
limitations of the study is that the sample population was representative of the South African
vegan community. A possible bias could be presented between vegans using the SAVS
platform on Facebook when compared to other vegan society members. It is also important to
note that there could be a number of vegans who do not belong to any society. SurveyMonkey
estimated the average completion time of the questionnaire to be between 25 to 30 minutes, and
this may be the reason why the attrition rate was increased during the completion of section C
and D of the questionnaire. Researchers should consider the actual time spent on completing
the questionnaire and if the study requires respondents to collect relevant information such as
24-hour recall records for the questionnaire, this should be communicated to the respondents
prior to the study. During the study, weekly reminders should also be sent to potential
respondents. However, compared to other studies, the present study population seemed
adequate for the time frame that was provided in collecting respondents’ data. The study was
limited to South African vegans who had access to Facebook and the internet, therefore it was
a small sample population as some individuals may not have access to social media sites or the
internet. Respondents were also provided with the researchers personal contact details if they
had any queries or questions regarding the questionnaire.
Carefully planned FFQ and 24-hour recalls have great potential to assess the nutritional intake
of any study population. The FFQ which was based on the work of others, was long, as it
included all possible foods included in a vegan diet and therefore required time to complete.
This had to be done to increase the variety of food items presented in the FFQ, as selecting food
groups would not have been a true reflection of foods frequently consumed by the study
population. A 24 - hour recall was the other dietary assessment tool used in the study. The 24
- hour recall could only be conducted for 1 day due to the time frame for completing the study
and the nature of the study being on an online group. The respondents were requested to
indicate the time and place they consumed a meal, preparation method and ingredients as well
as the quantity of food consumed in the previous 24 - hours. The respondents had to also
indicate any condiments and beverages consumed in the previous 24 - hours. The survey

157
programme that was used in the study, allowed only a single submission per respondent at the
time of completing the questionnaire and respondents could not save and complete the
questionnaire at another time. Therefore, only one 24 - hour recall could be requested in the
questionnaire. An example of a 24 - hour recall was provided in the questionnaire. Although
SurveyMonkey was an excellent platform to conduct this study, unfortunately it had a few flaws
in hindsight, as it did not allow the researcher to upload a large attachment with food
photographs. This meant that the researcher had to email the food photographs to each subject.
Therefore, the results of the 24 - hour recall should be interpreted with caution. Ideally, if time
allowed, the researcher would have phoned each respondent to guide them through the process
of the 24 - hour recall and FFQ, but this would have been a lengthy and costly process. This
may be the reason why the attrition rate was high in the second part of the questionnaire which
included the FFQ and 24 - hour recall as these sections were lengthy to complete. The
respondents did have the researchers contact details if they needed any clarity on the
questionnaire. Although an example and tool was provided, respondents could have over- or
underestimated individual food items and whole meals consumed. Future research should focus
on ways to reduce attrition rates especially in questionnaires that involve dietary assessment
measures.
The nutritional analysis focused on the nutrients acquired from the diet and did not take into
account the impact of the different supplements consumed by the individuals in the study
population. Another limitation was that the vegan diet may be considered non-conventional
and not all foods were available on the Food Finder programme database. However, this was
overcome, as the researcher used recipes and online shopping to find the ingredients of these
vegan food items.
6.4 Recommendations based on the results of the study
6.4.1 Recommendations for dietetic practice
The interest surrounding plant-based diets especially vegan diets is increasing both
internationally and in South Africa, as more individuals are concerned about animal ethics,
protecting the environment and general public health benefits. International research on how
the vegan diet is now being practiced by different age and race groups has increased. The
majority of dietitians agree that the vegan diet can be nutritionally adequate. Therefore,
dietitians should stay updated on the findings of vegan diets including the nutritional quality of
the diet and its role in preventing and treating NCD’s. Dietitians are more likely to be

158
associated with clients from middle to higher income categories in private practice, therefore
there is a greater possibility that these clients will show more interest in the vegan diet. They
should be able to provide additional information in the form of pamphlets, sample meal plans,
recipes, and one-on-one counselling sessions, cooking classes or providing links to peer
reviewed scientific articles on the internet. In the government setting, dietitians can encourage
and motivate clients to reduce or limit the consumption of animal products and increase the
intake of plant-based foods to follow a more sustainable and cost-effective diet and improve
health and well-being.
The vegan diet is less economically taxing in that it saves the environment and its resources
which are needed for future generations. Dietitians should therefore be aware of the names of
vegan food products on the market, the ingredients, cost and nutritional quality of these
products, as well as general healthy eating guidelines in order to assist individuals to reach their
daily requirements of macro and micronutrients, including the use of supplementation. Food
insecurity in South Africa is still on the rise in many parts of the country and many individuals
cannot afford to include meat and meat products in their usual dietary patterns. These
individuals who do not have sufficient income for food on a daily basis, may find it difficult to
begin following a restrictive diet with selective food products. Other individuals who consume
meat as part of their tradition and culture, may not want to omit meat from their diet, despite
the advice given by health professionals to reduce the intake of meat and processed meat
products to benefit their health.
6.4.2 Recommendations for consumers, food companies and restaurants
The market for meat and milk substitutes has recently increased and many more companies
have begun to manufacture both vegan and vegetarian substitutes to meat, including well-
known meat producing companies. Many meat substitutes are not enjoyed by the overall plant-
based diet population and companies who manufacture these products should work to improve
the appearance, taste and texture of these products, without compromising the cost. The
companies should market and target their products not only to existing vegans, those following
a plant based diet and vegetarians but also the segment of meat-eating consumers. Companies
should also provide clear instructions on how to prepare these meat substitutes and possibly
include recipes to assist consumers. Packaging and labelling should be appealing and the cost
of these products should be in line with other competitors.

159
The market for PBMA is increasing in demand as individuals are replacing cow’s milk for
medical or lifestyle reasons such as following a plant-based and vegan diet. It is important that
companies are able to fortify these PBMA with the adequate nutrients so that individuals can
reach their daily requirements for what they are losing by not consuming cow’s milk.
Consumers should be aware of the brands that are fortified in order to maintain a healthy diet.
Companies should also try to improve the taste and texture of some PBMA as some plant milks
are stigmatised for their unpalatable profiles and high cost compared to cow’s milk.
The number of vegan only restaurants is increasing around South Africa. Non-vegan
restaurants should be able to imitate traditional dishes or beverages using meat or milk
substitutes, to accommodate vegan consumers. Restaurant staff should be trained to understand
the term “vegan” and how ingredients in certain meals can be changed to suit the vegan
consumer. Restaurants should also follow the necessary practises to ensure that vegan meals
are prepared separately without mixing cutlery or ingredients, and ensure that vegan ingredients
are of the highest quality and meals are presented with a high standard.
6.5 Recommendations for future research
Most of the international studies have compared the nutritional intake of individuals following
a vegan diet and an omnivorous diet matched with age, BMI and race group. Therefore, there
is a need for studies similar to compare the nutritional quality of different diets in South Africa.
Blood analysis could be conducted to determine if the nutritional quality is improved between
vegans who consume nutritional supplements and those who do not. Studies can also be
conducted with vegans from South Africa compared to those from another country, to compare
the motives, meals and dietary patterns as well as views on the lifestyle as a whole. Further
studies using Black South Africans can be done to understand their opinions surrounding
veganism, especially when consuming animals is a major part of traditional ceremonies and are
seen as a form of wealth. Studies can also be conducted in lower socio-economic and food
insecure settings in South Africa were the majority of plant-based food is already consumed,
not necessarily out of choice, and to investigate whether these groups reach their nutritional
requirements.
Longitudinal studies should be conducted to examine developing trends and the sustainability
of a vegan diet in South Africa. Vegans who follow different memberships or societies,
including those who do not follow any social groups should be used for further research.
Studies should have at least 3 days of 24-hour recalls with clear instructions via telephonic or

160
face to face interviews with the researcher or field workers. This will assist with improving
findings regarding the nutritional quality of the diet.
The opinions of omnivorous respondents on the vegan diet including their opinions on plant-
based milk alternatives and meat substitutes, should also be investigated to determine any
stigma attached and possible resistance to following a vegan diet or reducing meat in the diet.
Vegans and vegetarians perceptions on substitutes’ should be investigated and focus groups
conducted regarding how they would like their food flavour to be improved. A study on cost
analysis following both the omnivorous and vegan diet, prices of meat and milk substitutes and
dining in restaurants will assist with knowing which of the diets is more cost effective.
Currently, the number of members on the South African Vegan Society (SAVS) Facebook
group has risen to 11 237 since the beginning of this study (April 2020). According to the
director of the SAVS, veganism should not be seen as a lifestyle choice or “arbitrary” diet, it
involves showing the most basic respect towards animals instead of treating them as “property”
and without feelings. Individuals need to be aware of the original intention behind veganism
and that is about reducing the harm and exploitation done to animals. Therefore, the transition
into veganism is quite a “radical” decision.
It would be interesting to investigate how the majority of South Africans feel about this lifestyle
particularly when consuming meat is part of their culture and heritage. This should take into
account that South Africa celebrates a national public holiday (Heritage day on the 24th
September) to honour the heritage of the country, which involves social gatherings with braaing
of meat and other forms entertainment. Many tourists visit the country due to its diversity and
culture as well indulging in traditional South African cuisine, including exotic meat options
such as various types of game, biltong and droe-wors which is an attraction for tourists visiting
the country.
Currently, more and more South Africans are experimenting with international food trends and
changing their way of life for the betterment of health and the environment. South Africans are
part of a true shift of global consciousness and even though veganism is followed by a minority
of the population, it has the potential to grow and develop interest among more individuals in
the future. In so saying, the popular phrase, “we are what we eat” provides a keen insight that
only we, as individuals, can decide what is best for our health and well-being.

161
REFERENCES
Abdullah WG, Rianse U, Iswandi RM, Taridala SAA, Rianse IS, Zulfikar ZL, Baka LR, Abdi
AL, Cahyono E, Widayah W, Baka WK (2015). Potency of Natural Sweetener: Brown
Sugar. WSEAS Transactions on Business and Economics 12: 99-110.
Abratt R, Penman N (2002). Understanding factors affecting salespeople’s perceptions of
ethical behaviour in South Africa. Journal of Business Ethics 35: 269-280.
Adigbo EC, Maddah CK (2011). A complete course in food and nutrition. Accra, Ghana:
Kwadwoan Publishing.
Aerny-Perreten N, Domínguez-Berjón MF, Esteban-Vasallo MD, García-Riolobos C (2015).
Participation and factors associated with late or non-response to an online survey in
primary care. Journal of Evaluation in Clinical Practice 21(4): 688-693.
Ågren JJ, Tvrzicka E, Nenonen MT, Helve T, Hänninen O (2001). Divergent changes in
serum sterols during a strict uncooked vegan diet in patients with rheumatoid arthritis.
British Journal of Nutrition 85(2): 137-139.
Alexandratos N, Bruinsma J, Boedeker G, Schmidhuber J, Broca S, Shetty B, Ottaviani MG
(2006). World agriculture: towards 2030/2050. Rome: FAO, Global perspective
studies unit .
Allemann J (2003). Production and marketing of fresh cassava products in South Africa.
Paper prepared for the workshop on cassava production, processing and marketing in the
Southern African Development Community (SADC) region, Johannesburg.
Allemann J, Dugmore N (2003). Potential of cassava production in the Bathurst region of
the Eastern Cape province of South Africa. 2nd Southern Africa Root Crops Research
Network (SARRNET) Scientific Symposium, Lusaka, Zambia.
Allen LH (2009). How common is Vitamin B12 deficiency?. The American Journal of
Clinical Nutrition 89(2): 6935-6965.
Allès B, Baudry J, Méjean C, Touvier M, Péneau S, Hercberg S, Kesse-Guyot E (2017).
comparison of sociodemographic and nutritional characteristics between self-reported
vegetarians, vegans and meat-eaters from the NutriNet-Santé Study. Nutrients 9 (1023):
1-18.

162
Alnemer KA, Alhuzaim WM, Alnemer AA, Alharbi BB, Bawazir AS, Barayyan OR, Balaraj
FK (2015). Are health-related tweets evidence based? Review and analysis of health-
related tweets on Twitter. Journal of Medical Internet Research 17(10): e246.
Amazon (2020). Amazon Online Bookstore.
https://www.amazon.com/s?k=vegan+books+south+africa&i=stripbooks-intl-
ship&ref=nb sb noss (Accessed: 10/04/2020).
Amazon (2019). Amazon Online Bookstore.
https://www.amazon.com/vegetables-Vegetarian-Books/b?ie=UTF8&node=4336
(Accessed: 23/02/2019).
Andrews D, Nonnecke B, Preece J (2003). Electronic survey methodology: A case study in
reaching hard-to-involve Internet users. International Journal of Human-computer
Interaction 16(2): 185-210.
Antony AC (2003). Vegetarianism and Vitamin B12 deficiency. The American Journal of
Clinical Nutrition 78(1): 3-6.
Appleby P, Roddam A, Allen N, Key T (2007). Comparative fracture risk in vegetarians and
nonvegetarians in EPIC-Oxford. European Journal of Clinical Journal 61: 1400-1406.
Apostolidis C, McLeay F (2016). Should we stop meating like this? Reducing meat
consumption through substitution. Food Policy 65: 74-89.
Appel LJ, Brands MW, Daniels SR, Karanja N, Elmer PJ, Sacks FM, American Heart
Association (2006). Dietary approaches to prevent and treat hypertension: A scientific
statement from the American Heart Association. Hypertension 47(2): 296-308.
Appiah S, Boateng A, Darko DA, Boateng DK (2017). Journal of Emerging Trends in
Engineering and Applied Sciences - Production of vegans shito using soya beans (glycine
max). Journal of Emerging Trends in Engineering and Applied Sciences 8(3): 117-
122.
Arab L, Wesseling-Perry K, Jardack P, Hendry J, Winter A (2010). Eight self-administered
24-hour dietary recalls using the internet are feasible in African Americans and
Caucasians: the energetics study. Journal of the American Dietetic Association 110(6):
857-864.

163
Baloch MS, Zubair M (2010). Effect of nipping on growth and yield of chickpea. The
Journal of Animal and Plant Sciences 20(3): 208-210.
Barnard ND, Scialli AR, Turner-McGrievy GM, Lanou AJ, Glass J (2005). The effects of a
low-fat, plant-based dietary intervention on body weight, metabolism, and insulin
sensitivity. The American journal of Medicine 118(9): 991-997.
Baroni L, Cenci L, Tettamanti M, Berati M (2006). Evaluating the environmental impact of
various dietary patterns combined with different food production systems. European
Journal of Clinical Nutrition 61(2): 279-286.
Baroni L, Goggi S, Battaglino R, Berveglieri M, Fasan H, Filippin D, Griffith P, Rizzo G,
Tomasini C, Tosatti MA, Battino MA (2019). Vegan nutrition for mothers and
children: Practical tools for healthcare providers. Nutrients 11(5): 1-16.
Baroni L, Goggi S, Battino M (2018). VegPlate: A Mediterranean-based food guide for
Italian adult, pregnant, and lactating vegetarians. Journal of the Academy of
Nutrition and Dietetics 118(12): 2235-2243.
Bazzano LA, He J, Ogden LG, Loria CM, Vupputuri S, Myers L, Whelton PK (2002). Fruit
and vegetable intake and risk of cardiovascular disease in US adults: The first National
Health and Nutrition Examination Survey Epidemiologic Follow-up Study. The
American Journal of Clinical Nutrition 76(1): 93-99.
Beardsworth AD, Keil ET (1991). Vegetarianism, veganism, and meat avoidance: Recent
trends and findings. British Food Journal 93(4): 19-24.
Beardsworth A, Keil T (1992). The Vegetarian option: Varieties, conversions, motives and
careers. The Sociological Review 40(2): 253-293.
Bedford JL, Barr SI (2005). Diets and selected lifestyle practices of self-defined adult
vegetarians from a population-based sample suggest they are more ‘health conscious’.
International Journal of Behavioral Nutrition and Physical Activity 2(4):1-11.
Beeton R (2003). Sustainably managing food production resources to maximise human
nutritional benefit. Asia Pacific Journal of Clinical Nutrition 12 (Suppl): 50.

164
Benson T, Shekar M (2006). Trends and issues in child undernutrition. In: Jamison DT,
Feachem RG, Makgoba MW, Bos ER, Baingana, FK, Hofman KJ, Rogo KO, eds.
Disease and Mortality in Sub-Saharan Africa, 2nd ed. World Bank: Washington, DC,
USA.
Bernat N, Chafer M, Chiralt A, Gonzalez-Martinez C (2014). Vegetable milks and their
fermented derivative products. International Journal of Food Studies 3(1): 93-124.
Bigger Bolder Baking (2019). 7 Best Egg Substitutes for Baking Recipes & How to Use
Them. https://www.biggerbolderbaking.com/egg-substitutes-for-baking/ (Accessed:
10/04/2020).
Bisschoff CA, Liebenberg CL (2017). An analysis of consumer preferences of meat in a
typical South African township. Journal of Contemporary Management 14: 554-
594.
Biswas AK, Kumar V, Bhosle S, Sahoo J, Chatli MK (2011). Dietary fibers as functional
ingredients in meat products and their role in human health. International Journal of
Livestock Production 2(4): 45-54.
Blanco K, Enrione EB (2012). Intake of vitamin D, calcium and phosphorous in vegans.
Journal of Academy of Nutrition and Dietetics 112(9): A92.
Boeing H, Bechthold A, Bub A, Ellinger S, Haller D, Kroke A, Leschik-Bonnet E, Muller MJ,
Oberritter H, Schulze M, Stehle P, Watzl B (2012). Critical review: vegetables and fruit
in the prevention of chronic diseases. European Journal of Nutrition 51(6): 637-663.
Bohrer BM (2019). An investigation of the formulation and nutritional composition of
modern meat analogue products. Food Science and Human Wellness 8(4): 320-329.
Boone HN, Boone DA (2012). Analysing likert data. Journal of Extension 50(2): 1-5.
Botha JG, Eloff MM, Swart I (2015). The effects of the PoPI Act on small and medium
enterprises in South Africa. In: Information Security for South Africa (ISSA). United
Kingdom: Academic Conferences and Publishing International Limited.
Bourque L, Fielder EP (2003). How to conduct self-administered and main surveys, 2nd ed.
Thousand Oaks, CA: SAGE Publications Inc.

165
Boutté AK, Turner-McGrievy GM, Wilcox S, Hutto B, Muth E, Hoover A (2018).
Comparing changes in diet quality between two technology-based diet tracking devices.
Journal of Technology in Behavioral Science 4:25-32.
Brace I (2008). Questionnaire design: how to plan, structure and write survey (Market
Research in Practice, 2nd ed. London: Kogan Page.
Bradbury KE, Crowe FL, Appleby PN, Schmidt JA, Travis RC, Key TJ (2014). Serum
concentrations of cholesterol, apolipoprotein A-I, and apolipoprotein B in a total of 1 694
meat-eaters, fish-eaters, vegetarians, and vegans. European Journal of Clinical
Nutrition 68(2): 178-183.
Bradbury KE, Tong TYN, Key TJ (2017). Dietary intake of high-protein foods and other major
foods in meat-eaters, poultry-eaters, fish-eaters, vegetarians, and vegans in UK Biobank.
Nutrients 9(12): 1-17.
Bredahl L, Grunert KG, Fertin C (1998). Relating consumer perceptions of pork quality to
physical product characteristics. Food Quality and Preference 9(4): 273-281.
Bresnahan M, Zhuang J, Zhu X (2016). “Why is the vegan line in the dining hall always the
shortest? Understanding vegan stigma”. Stigma and Health 1 (1): 3-15.
Britton A (2003). Staying healthy when you become a vegetarian; it takes more than
eliminating meat. Network Journal 10(7): 28.
Brod M, Tesler LE, Christensen TL (2009). Qualitative research and content validity:
developing best practices based on science and experience. Quality of Life Research
18(9): 1263.
Burns KEA, Duffett M, Kho ME, Meade MO, Adhikari NKJ, Sinuff T, Cook DJ (2008). A
guide for the design and conduct of self-administered surveys of clinicians. Canadian
Medical Association Journal 179(3): 245-252.
Carroll R, Midthune D, Subar AF, Shumakovich M, Freedman LS, Thompson FE, Kipnis V
(2012). Taking advantages of the strengths of 2 different dietary assessment
instruments to improve intake estimates for nutritional epidemiology. American
Journal of Epidemiology 175(4): 340-347.
Case SM, Swanson DB (2001). Constructing Written Test Questions for the Basic and
Clinical Sciences, 3rd ed. Philadelphia: National Board of Medical Examiners.

166
Castell GS, Serra-Majem L, Ribas-Barba L (2015). What and how much do we eat? 24-hour
dietary recall method. Nutricion Hospitalaria 31(Supl 3): 46-48.
Chang T, Vowles N (2013). Strategies for Improving Data Reliability for Online Surveys: A
Case Study. International Journal of Electronic Commerce Studies 4(1): 121-
130.
Chen C, Lapsley K, Blumberg J (2006). A nutrition and health perspective on almonds.
Journal pf the Science of Food and Agriculture 86(14): 2245-2250.
Cherry E (2015). I was a teenage vegan: Motivation and maintenance of lifestyle
movements. Sociological Inquiry 85(1): 55-74.
Cherry E (2010). Shifting symbolic boundaries: Cultural strategies of the animal rights
movement. Sociological Forum 25: 450-474.
Cherry E (2006). Veganism as a Cultural Movement: A Relational Approach. Social
Movement Studies 5(2): 155-170.
Chisanga B, Gathiaka J, Nguruse G, Onyancha S & Vilakazi T (2014). Competition in the
regional sugar sector: the case of Kenya, South African Tanzania and Zambia. Draft
paper for presentation at pre-ICN conference.
Cialdini RB, Goldstein NJ (2004). Social influence: Compliance and conformity. Annual
Review of Psychology 55:591-621.
Clarys P, Deliens T, Huybrechts I, Deriemaeker P, Vanaelst B, De Keyzer W, Hebbelinck M,
Mullie P (2014). Comparison of nutritional quality of the vegan, vegetarian, semi-
vegetarian, pesco-vegetarian and omnivorous. Nutrients 6: 1318-1332.
Clarys P, Deriemaeker P, Huybrechts I, Hebbelinck M, Mullie P (2013). Dietary patterns
analysis: a comparison between matched vegetarian and omnivorous respondents.
Nutrition Journal 12(82): 1-6.
Cofnas N (2018). Is vegetarianism healthy for children?. Critical Reviews in Food Science
and Nutrition 1:1-9.
Cole M (2008). Asceticism and hedonism in research discourses of veg*aism. British Food
Journal 110(7): 706-16.

167
Cole M, Morgan K (2011). Vegaphobia: derogatory discourses of veganism and the
reproduction of speciesism in UK national newspapers. The British Journal of
Sociology 62(1): 134-153.
Couper MP (2000). Web surveys: A review of issues and approaches. The Public Opinion
Quarterly 64(4):464-494.
Couper MP, Blair J, Triplett T (1999). A comparison of mail and e-mail for a survey of
employees in U.S. statistical agencies. Journal of Official Statistics 15:39-56.
Craig WJ (2010). Nutrition concerns and health effects of vegetarian diets. Nutrition in
Clinical Practice 25(6): 613-620.
Craig WJ (2009). Health effects of vegan diets. American Journal of Clinical Nutrition 89:
1627-1633.
Craig WJ, Mangels AR, American Dietetic Association (2009). Position of the American
Dietetic Association: vegetarian diets. Journal of the American Dietetic Association
109(7): 1266-1282.
Cramer H, Kessler CS, Sundberg T, Leach MJ, Schumann D, Adams J, Lauche R (2017).
Characteristics of Americans choosing vegetarian and vegan diets. Journal of
Nutrition Education and Behavior 49(7): 561-567.
Crimarco A, Turner-McGrievy GM, Botchway M, Macauda M, Adams SA, Blake CE,
Younginer N (2019). “We’re not meat shamers. We’re plant pushers.”: How owners of
local vegan soul food restaurants promote healthy eating in the African American
community. Journal of Black Studies 51(2): 168-193.
Cruwys T, Norwood R, Chachay VS, Ntontis E, Sheffield J (2020). “An important part of who
I am”: The predictors of dietary adherence among weight-loss, vegetarian, vegan, paleo,
and gluten-free dietary groups. Nutrients 12(4): 1-17.
D’Adamo CR, Sahin A (2014). Soy foods and supplementation: A review of commonly
perceived health benefits and risks. Alternative Therapies in Health and Medicine
20(1): 39-51.
Daglia M (2012). Polyphenols as antimicrobial agents. Current Opinion in
Biotechnology 23(2): 174-181.

168
Davey GK, Spencer EA, Appleby PN, Allen NE, Knox KH, Key TJ (2003). EPIC-Oxford:
lifestyle characteristics and nutrient intakes in a cohort of 33 883 meat-eaters and
31 546 non-meat-eaters. The Nutrition Society 6(3): 259-268.
Davis B, Melina V (2014). Becoming Vegan: Comprehensive Edition. Summertown, TN:
Book Publishing Company.
De Backer CJS, Hudders L (2014). From meatless Mondays to meatless Sundays: motivations
for meat reduction among vegetarians and semi-vegetarians who mildly or significantly
reduce their meat intake. Ecology of Food and Nutrition 53(6): 639-657.
De Bakker E, Dagevos H (2012). Reducing meat consumption in today's consumer society:
questioning the citizen-consumer gap. Journal of Agricultural and Environmental
Ethics 25(6): 877-894.
De Leeuw ED, Hox JJ, Dillman DA (2008). International handbook of survey methodology.
Washington, DC: Taylor & Francis Group/Lawrence Erlbaum Associates.
Delormier T, Frohlich KL, Potvin L (2009). Food and eating as social practice - understanding
eating patterns as social phenomena and implications for public health. Sociology of
Health & Illness 31(2): 215-228.
Denscombe M (2003). The Good Research Guide: For Small-Scale Social Research
Projects, 2nd ed. Buckingham: Open University Press.
Deosthale YG (1982). Food processing and nutritive value of legumes. New Delhi: Oxford
& IBH Publishing Co.
Derbyshire E, Ayoob K (2019). Mycoprotein - Nutritional and health properties. Nutrition
Today 54(1): 7-15.
Deriemaeker P, Alewaeters K, Hebbelinck M, Lefevere J, Phillipaerts R, Clarys P (2010).
Nutritional status of Flemish vegetarians compared with non-vegetarians: A matched
samples study. Nutrients 2(7): 770-780.
Dewell A, Ornish D (2007). Plant-based dietary patterns in the control of obesity and
cardiovascular risk. Current Cardiovascular Risk Reports 1: 9-15.

169
Dhakal S, Liu C, Zhang Y, Roux KH, Sathe SK, Balasubramaniam VM (2014). Effect of high
pressure processing on the immunoreactivity of almond milk. Food Research Journal
62: 215-222.
Dhont K, Hodson G (2020). Dreaming of a Vegan Christmas? The Vegan Society- The
Expert Series 2020. https://www.vegansociety.com/getinvolved/research/research-
news/expert-series-2020-jan-dreaming-vegan-christmas (Accessed: 23/03/2020).
Diarra K, Nong ZG, Jie C (2005). Peanut milk and peanut milk based products production: A
review. Critical Reviews in Food Science and Nutrition 45(5): 405-423.
Dillman DA (2000). The role of behavioral survey methodologists in national statistical.
International Statistical Review 68(2): 200-213.
Dinu M, Abbate R, Gensini GF, Casini A, Sofi F (2017). Vegetarian, vegan diets and
multiple health outcomes: A systematic review with meta-analysis of observational
studies. Critical Reviews in Food Science and Nutrition 57(17): 3640-3649.
Donaldson MS (2000). Metabolic vitamin B12 status on a mostly raw vegan diet with
follow-up using tablets, nutritional yeast, or probiotic supplements. Annals of
Nutrition and Metabolism 44(5): 229-234.
Drahošováa M, Balco P (2017). The analysis of advantages and disadvantages of use of social
media in European Union. Procedia Computer Science 109:1005-1009.
Drimie S, Faber M, Vearey J, Nunez L (2013). Dietary diversity of formal and informal
residents in Johannesburg, South Africa. BMC Public Health 13(911): 1-9.
Dunn-Emke SR, Weidner G, Pettengill EB, Marlin RO, Chi C, Ornish DM (2005). Nutrient
adequacy of a very low-fat vegan diet. Journal of the Academy of Nutrition and
Dietetics 105(9): 1442-1446.
Durand A, Franks GV, Hosken RW (2003). Particle sizes and stability of UHT bovine, cereal
and grain milks. Food Hydrocolloids 17(5): 671-678.
Dwyer J (1999). Convergence of plant-rich and plant-only diets. The American Journal of
Clinical Nutrition 70(3): 620-622.

170
Dyett PA, Sabaté J, Haddad E, Rajaram S, Shavlik D (2013). Vegan lifestyle behaviors - An
exploration of congruence with health-related beliefs and assessed health indices.
Appetite 67: 119-124.
Dyett P, Rajaram S, Haddad EH, Sabaté J (2014). Evaluation of a validated food frequency
questionnaire for self-defined vegans in the United States. Nutrients 6(7): 2523-2539.
Ekanayaka RAI, Ekanayaka NK, Perera B, De Silva P (2013). Impact of a traditional dietary
supplement with coconut milk and soya milk on the lipid profile in normal free living
respondents. Journal of Nutrition and Metabolism 2013: 1-11.
Ekman A, Litton J (2007). New times, new needs; e-epidemiology. European Journal of
Epidemiology 22(5): 285-292.
Elorinne A, Alfthan G, Erlund I, Kivimäki H, Paju A, Salminen I, Turpeinen U, Voutilainen S,
Laakso J (2016). Food and nutrient intake and nutritional status of Finnish vegans and
non-vegetarians. Public Library of Science ONE 11(2): 1-14.
Elzerman JE, Hoek AC, van Boekel MAJS, Luning PA (2011). Consumer acceptance and
appropriateness of meat substitutes in a meal context. Food Quality and Preference 22:
233-240.
Emre Y (2016). No Milk Today? Challenges of maintaining a vegan diet in Germany.
Masters Thesis. Department of Social Sciences, Faculty of Social Sciences, Uppsala
Univeristy, Uppsala.
Erasmus SW, Hoffman LC (2017). What is meat in South Africa?. American Society of
Animal Science 7(4): 71-75.
Faithful to Nature (2020). Online Health Shop for Sustainable Living. https://www.faithful-
to-nature.co.za/ (Accessed: 10/04/2020).
Farmer B, Larson BT, Fulgoni VL, Rainville AJ, Liepa GU (2011). A Vegetarian dietary
pattern as a nutrient-dense approach to weight management: An analysis of the National
Health and Nutrition Examination Survey 1999-2004. Journal of the American Dietetic
Association 111(6): 819-827.
Freeland-Graves JH, Greninger SA, Graves GR, Young RK (1986). Health practices,
attitudes, and beliefs of vegetarians and nonvegetarians. Journal of the American
Dietetic Association 86(7): 913-918

171
Fields H, Ruddy B, Wallace MR, Shah A, Millstine D, Marks L (2016). How to monitor and
advise vegans to ensure adequate nutrient intake. The Journal of the American
Osteopathic Association 116(2): 96-99.
Food and Agriculture Organization (2009). Food and Agriculture Organization:
Declaration of the World Food Summit on Food Security. Rome: FAO.
http://www.fao.org/fileadmin/templates/wsfs/Summit/Docs/Final_Declaration/WSFS09
Declaration.pdf (Accessed: 10/04/2020).
Fontana L, Meyer TE, Klein S, Holloszy JO (2007). Long-term low-calorie low-protein vegan
diet and endurance exercise are associated with low cardio metabolic risk. Rejuvenation
Research (10)2: 225-234.
Fox MA (1999). The contribution of vegetarianism to ecosystem health. Ecosystem Health
5:70-74.
Fox N, Ward K (2008). Health, ethics and environment: A qualitative study of vegetarian
motivations. Appetite 50(2-3): 422-429.
Frawley ES (2017). Veganism as a Cultural Phenomenon. Honours Thesis. Bucknell
University, Pennsylvania.
Friedman M, Brandon DL (2001). Nutritional and health benefits of soy proteins. Journal
of Agricultural and Food Chemistry 49(3): 1069-1086.
Gallego-Narbón A, Zapatera B, Barrios L, Vaquero MP (2019). Vitamin B12 and folate
status in Spanish lacto-ovo vegetarians and vegans. Journal of Nutritional Science
8(7): 1-8.
Gamez-Gutierrez J, Saiz-Alvarez JM (2019). Senior Entrepreneurship and Aging in
Modern Business, 1ST ed. USA: IGI Global.
Garton L, Haythornthwaite C, Wellman B (1999). Studying online social networks. Journal
of Computer-mediated Communication 3(1): 313.
Gibney M, Vorster H (2001). South African food-based dietary guidelines. South African
Journal of Clinical Nutrition 14(3): 1-77.

172
Gibson RS (2005). Principles of Nutritional Assessment, 2nd ed. New York: Oxford
University Press, Inc.
Gibson RS, Charrondiere UR, Bell W (2017). Measurement errors in dietary assessment using
self-reported 24-hour recalls in low-income countries and strategies for their prevention.
Advances in Nutrition 8(6): 980-991.
Gibson RS, Perlas L, Hotz C (2006). Improving the bioavailability of nutrients in plant foods
at the household level. The Nutrition Society 65(2): 160-168.
Gilsing AMJ, Crowe FL, Lloyd-Wright Z, Sanders TAB, Appleby PN, Allen NE, Key TJ
(2010). Serum concentrations of vitamin B12 and folate in British male omnivores,
vegetarians and vegans: results from a cross-sectional analysis of the EPIC-Oxford
cohort study. European Journal of Clinical Nutrition 64: 933-939.
Glick-Bauer M, Yeh MC (2014). The health advantage of a vegan diet: Exploring the gut
microbiota connection. Nutrients 6: 4822-4838.
Global Burden of Disease Study 2017 Causes of Death Collaborators (2018). Global, regional,
and national age-sex-specific mortality for 282 causes of death in 195 countries and
territories, 1980–2017: a systematic analysis for the Global Burden of Disease Study
2017. Lancet 392(10159):1736-88.
Goff LM, Bell JD, So PW, Dornhorst A, Frost GS (2005). Veganism and its relationship with
insulin resistance and intramyocellular lipid. European Journal of Clinical Nutrition
59 (2): 291-298.
Goodland R (1997). Environmental sustainability in agriculture: diet matters. Ecological
Economics 23: 189-200.
González-García, Green, Scheelbeek, Harris & Dangour (2020). Dietary recommendations in
Spain –affordability and environmental sustainability?. Journal of Cleaner Production
254: 1-14.
Graca J, Calheiros MM, Oliveira A (2015). Attached to meat? (Un)Willingness and intentions
to adopt a more plant-based diet. Appetite 95: 113-125.
Graca J, Godinho CA, Truninger M (2019). Reducing meat consumption and following plant-
based diets: Current evidence and future directions to inform integrated transitions.
Trends in Food Science & Technology 91: 380-390.

173
Gray CM, Sellon RK, Freeman LM (2004). Nutritional adequacy of two vegan diets for cats.
Journal of the American Veterinary Medical Association 225(11): 1670-1675.
Greenebaum J (2012). Veganism, identity and quest for authenticity. Food, Culture & Society
15(1): 129-144.
Greenway O (2010). “No-meat eats”. Caterer & Hotelkeeper 200(4628): 34-36.
Groves RM (2005). Survey Errors and Survey Costs. The University of Michigan: John
Wiles & Sons Inc Publication.
Grunert KG (1997). What's in a steak? A cross-cultural study on the quality perception of beef.
Food Quality and Preference 8(3): 157-174.
Grunert KG, Aachmann K (2016). Consumer reactions to the use of EU quality labels on food
products: A review of the literature. Food Control 59: 178-187.
Gussow JD (1994). Ecology and vegetarian considerations: does environmental responsibility
demand the elimination of livestock? The American Journal of Clinical Nutrition
59(5): 1110-1116.
Haddad EH, Berk LS, Kettering JD, Hubbard RW, Peters WR (1999a). Dietary intake and
biochemical, hematologic, and immune status of vegans compared with non-vegetarians.
The American Journal of Clinical Nutrition 70(suppl): 586-593.
Haddad EH, Sabaté J, Whitten CG (1999b). Vegetarian food guide pyramid: A conceptual
framework. The American Journal of Clinical Nutrition 70(3): 615-619.
Haenfler R, Johnson B, Jones E (2005). Lifestyle movements: Exploring the intersection of
lifestyle and social movements. Social Movement Studies 11(21): 1-20.
Hallberg L, Hulthen L (2000). Prediction of dietary iron absorption: an algorithm for
calculating absorption and bioavailability of dietary iron. The American Journal of
Clinical Nutrition 71(5): 1147-1160.
HappyCow (2020). Find Vegan Restaurants Nearby. https://www.happycow.net/
(Accessed: 10/04/2020).
Harpham T (2009). Urban health in developing countries: What do we know and where do we
go?. Health and Place 15(1): 107-116.

174
Hartmann C, Siegrist M (2017). Consumer perception and behaviour regarding sustainable
protein consumption: A systematic review. Trends in Food Science and
Technology 61: 11-25.
Hauner H (2015). Vegan diet - the ultimate hype. MMW Fortschritte der Medizin 157(10):
40.
Hart D (2018). Faux-meat and masculinity: The gendering of food on three vegan blogs.
Canadian Food Studies 5(1): 133-155.
Heale R, Twycross A (2015). Validity and reliability in quantitative studies. British Medical
Journal 18(3): 66-67.
Heaney RP, Rafferty K, Dowell S, Bierman J (2005). Calcium fortification systems differ in
bioavailability. Journal of the American Dietetic Association 105(5): 807-809.
Hei-man TSE (2008). An ethnography of social network in cyberspace: the Facebook
phenomenon. The Hong Kong Anthropologist 2: 53-77.
Heiss S, Coffino JA, Hormes JM (2017). Eating and health behaviors in vegans compared to
omnivores: Dispelling common myths. Appetite 118:129-135.
Heitschmidt RK, Short RE, Grings EE (1996). Ecosystems, sustainability, and animal
agriculture. Journal of Animal Science 74: 1395-1405.
Hever J (2016). Plant-based diets: A physicians guide. The Permanente Journal 20(3):
15-82.
Hirschler CA (2011). “What pushed me over the edge was a deer hunter”: Being vegan in
North America. Society & Animals 19: 156-174.
Hoek AC, Luning PA, Stafleu A, de Graaf C (2004). Food related lifestyle and health attitudes
of Dutch vegetarians, non-vegetarian consumers of meat substitutes, and meat consumers.
Appetite 42: 265-272.
Hoffman JR, Falvo MJ (2004). Protein – Which is best?. Journal of Sports Science and
Medicine 3(3): 118-130.
Hoffman SR, Stallings SF, Bessinger RC, Brooks GT (2013). Differences between health and
ethical vegetarians: Strength of conviction, nutrition knowledge, dietary restriction, and
duration of adherence. Appetite 65: 139- 144.

175
Howie N (2018). ‘It’s oxymoronic for vets to be activist vegans’. Veterinary Record 183:
358.
Huang S, Wang LM, Sivendiran T, Bohrer BM (2018). Review: Amino acid concentration of
high protein food products and an overview of the current methods used to determine
protein quality. Critical Reviews in Food Science and Nutrition 58(15): 2673-2678.
Hudson JM, Bruckman A (2004). “Go Away”: Participant objections to being studied and the
ethics of chatroom research. The Information Society 20(2): 127-139.
Hu FB (2009). Diet and lifestyle influences on risk of coronary heart disease. Current
Atherosclerosis Reports 11(4): 257-263.
Hu FB (2003). Plant-based foods and prevention of cardiovascular disease: an overview. The
American Journal of Clinical Nutrition 78(3): 544-551.
Hu FB (2002). Dietary pattern analysis: a new direction nutritional epidemiology. Current
Opinion in Lipidology 13(1): 3-9.
Huston K (1993). Heritability and diagnosis of congenital abnormalities in food animals. The
Veterinary Clinics of North America. Food Animal Practice 9(1): 1-9.
Independent Online (2020a). More eateries, supermarkets catering to vegans as demand in
SA grows. https://www.iol.co.za/capeargus/news/more-eateries-supermarkets-catering-
to-vegans-as-demand-in-sa-grows-40645161 (Accessed: 10/04/2020).
Independent Online (2020b). Veganism on the rise as more South Africans opt for meat-
free meals. https://www.iol.co.za/lifestyle/food-drink/veganism-on-the-rise-as-more-
south-africans-opt-for-meat-free-meals-40621143 (Accessed: 10/04/2020).
Independent Online (2019a). How vegan cheese became popular.
https://www.iol.co.za/lifestyle/food-drink/how-vegan-cheese-became-popular-
34270065 (Accessed: 10/04/2020).
Independent Online (2019b). Spur launches plant-based and vegan-friendly menu.
https://www.iol.co.za/lifestyle/food-drink/restaurants/spur-launches-plant-based-and-
vegan-friendly-menu-37517413 (Accessed: 10/04/2020).
Institute of Medicine, Food and Nutrition Board, Committee to Review Dietary Reference
Intakes for Vitamin D and Calcium (2011). In: Del Valle HB, Yaktine AL, Taylor CL,

176
Ross AC, eds. Dietary Reference Intakes for Calcium and Vitamin D. Washington,
DC: National Academies Press.
Ito H, Gonthier M, Manach C, Morand C, Mennen L, Remesy C, Scalbert A (2005).
Polyphenol levels in human urine after intake of six different polyphenol-rich
beverages. British Journal of Nutrition 94(4): 500-509.
Izmirli S, Phillips CJC (2011). The relationship between student consumption of animal
products and attitudes to animals in Europe and Asia. British Food Journal 113(3): 436-
450.
Jallinoja P, Vinnari M, Niva M (2018). Veganism and plant based eating: analysis of
interplay between discursive strategies and lifestyle political consumerism. In:
Bostrom M,Micheletti M, Oosterveer P, eds. The Oxford Handbook of Political
Consumerism. Oxford: The Oxford University Press.
Janssen M, Busch C, Rödiger M, Hamm U (2016). Motives of consumers following a vegan
diet and their attitudes towards animal agriculture. Appetite 105: 643-651.
Johnson JMF, Franzluebbers AJ, Weyers SL, Reicosky DC (2007). Agricultural opportunities
to mitigate greenhouse gas emissions. Environmental Pollution 150: 107-124.
Johnston L (2002). Behavioral mimicry and stigmatization. Social Cognition 20:18-35.
Jones S, Murphy F, Edwards M, James J (2008). Doing things differently: advantages and
disadvantages of web questionnaires. Nurse Researcher 15(4): 15-26.
Joppe M (2000). The research process, as quoted in understanding reliability and validity in
qualitative research Nahid Golafshani. The Qualitative Report 8.
Joshi VK, Kumar S (2015). Meat Analogues: Plant based alternatives to meat products- A
review. International Journal of Food and Fermentation Technology 5(2): 107-
119.
Joy M (2009). Why we love dogs, eat pigs and wear cows: An introduction to carnism.
San Francisco, CA: Conari Press.
Jun J, Arendt SW, Kang J (2016). Understanding customers’ healthful food selection at
restaurants: Roles of attitude, gender, and past experience. Journal of Foodservice
Business Research 19(2): 197-212.

177
Kaartinen NE, Similä ME, Kanerva N, Valsta LM, Harald K, Männistö S (2017). Naturally
occurring and added sugar in relation to macronutrient intake and food consumption:
results from a population-based study in adults. Journal of Nutritional Science 6(e7):
1-11.
Kahlon TS (2006). The new food guide pyramid: recommendations on grains, fruits and
vegetables. Cereal Foods World 51(3): 104-107.
Kaimowitz D, Mertens B, Wunder S, Pacheco P (2003). Hamburger Connection Fuels
Amazon Destruction. Research paper. Center for International Forestry Research
(CIFOR).
Katcher HI, Ferdowsian HR, Hoover VJ, Cohen JL, Barnard ND (2010). A worksite vegan
nutrition program is well-accepted and improves health-related quality of life and work
productivity. Annals of Nutrition and Metabolism 56(4): 245-252.
Kennedy ET, Ohls J, Ma SC, Fleming K (1995). The healthy eating index: Design and
applications. Journal of the American Dietetic Association 95(10): 1103-1108.
Kerschke-Risch P (2015). Vegan diet: motives, approach and duration. Ernaehrungs
Umschau International 6: 98-103.
Key TJ, Appleby PN, Davey GK, Allen NE, Spencer EA, Travis RC (2003). Mortality in
British vegetarians: review and preliminary results from EPIC-Oxford. The American
Journal of Clinical Nutrition 78(3): 533-538.
Key TJ, Appleby PN, Rosell MS (2006). Health effects of vegetarian and vegan diets.
Proceedings of the Nutrition Society 65: 35-41.
Key TJ, Appleby PN, Spencer EA, Travis RC, Roddam AW, Allen NE (2009). Mortality in
British vegetarians: results from the European Prospective Investigation into Cancer and
Nutrition (EPIC-Oxford). The American Journal of Clinical Nutrition 89(5): 1613-
1619.
Keshav S, Chawathe Y, Chen M, Zhang Y, Wolman A (2007). Cell phones as a research
platform. In: MobiSys Panel.
Kifleyesus A (2007). The construction of Ethiopian national cuisine. http://
www.google.com (Accessed: 10/04/2020).

178
Kitchenham B, Pfleeger SL (2002). Principles of survey research - Part 4: Questionnaire
evaluation. Software engineering Notes 27(3): 20-23.
Kim K, Choi B, Lee I, Lee H, Kwon S, Oh K, Kim YA (2011). Bioproduction of mushroom
mycelium of Agaricus bisporus by commercial submerged fermentation for the
production of meat analogue. Journal of the Science of Food and Agriculture 91:
1561-1568.
Kim P, Han JH (2013). ‘Effects of job satisfaction on service quality, customer satisfaction,
and customer loyalty: the case of a local state-owned enterprise’. WSEAS Transactions
on Business and Economics 10(1):49–68.
Klopp SA, Heiss CJ, Smith HS (2003). Self-reported vegetarianism may be a marker for
college women at risk for disordered eating. Journal of the American Dietetic
Association 103: 745-747.
Kolahdooz F, Spearing K, Sharma S (2013). Dietary adequacies among South African adults
in rural KwaZulu-Natal. Public Library of Science ONE 8(6): 1-6.
Konstan JA, Rosser BRS, Ross MW, Stanton J, Edwards WM (2005). The story of subject
naught: A cautionary but optimistic tale of Internet survey research. Journal of
Computer-mediated Communication 10(2):00-00.
Köpke U, Krämer J, Leifert C (2007). 19 - Pre-harvest strategies to ensure the
microbiological safety of fruit and vegetables from manure-based production
systems. In: Cooper J, Niggli U, Leifert C, eds. Handbook of Organic Food Safety and
Quality. Madison: Woodhead Publishing Limited.
Kornsteiner M, Singer I, Elmadfa I (2008). Very low n-3 long-chain polysaturated fatty acid
status in Austrian vegetarians and vegans. Annals of Nutrition and Metabolism
52(1): 37-47.
Kristensen NB, Madsen ML, Hansen TH, Allin KH, Hoppe C, Fagt S, Lausten MS, Gøbel RJ,
Vestergaard H, Hansen T, Pedersen O (2015). Intake of macro-and micronutrients in
Danish vegans. Nutrition Journal 14(1): 115.
Kumar P, Chatli MK, Mehta N, Singh P, Malav OP, Verma AK (2017). Meat analogues: Health
promising sustainable meat substitutes. Critical reviews in Food Science and Nutrition
57(5): 923-932.

179
Kyriakopoulou K, Dekkers B, van der Goot AJ (2019). Chapter 6 - Plant-based meat analogues.
Sustainable Meat Production and Processing 103-126.
Labadarios D, Steyn NP, Maunder E, Macintyre U, Gericke G, Swart R, Huskisson J,
Dannhauser A, Vorster HH, Nesamvuni AE, Nel JH (2005). The National Food
Consumption Survey (NFCS): South Africa, 1999. Public Health Nutrition 8(5): 533-
543.
Larsson CL, Johansson GK (2002). Dietary intake and nutritional status of young vegans and
omnivores in Sweden. The American Journal of Clinical Nutrition 76: 100-106.
Larsson CL, Ronnlund U, Johansson G, Dahlgren L (2003). Veganism as status passage: The
process of becoming a vegan among youths in Sweden. Appetite 41(1): 61-67.
Lea EJ, Crawford D, Worsley A (2006). Public views of the benefits and barriers to the
consumption of a plant-based diet. European Journal of Clinical Nutrition 60: 828-
837.
Lea E, Worsley A (2003a). The factors associated with the belief that vegetarian diets provide
health benefits. Asia Pacific journal of clinical nutrition 12(3): 296-303.
Lea E, Worsley A (2003b). Benefits and barriers to the consumption of a vegetarian diet in
Australia. Public Health Nutrition 6(5): 505-511.
Leitzmann C (2003). Nutrition ecology: the contribution of vegetarian diets. The American
Journal of Clinical Nutrition 78 (3): 657-659.
Leneman L (1999). No Animal Food: The road to veganism in Britain, 1909-1944. Society
and Animals 7(3): 219-228.
Levin KA (2006). Study design III: Cross-sectional studies. Evidence-Based Dentistry 7: 24-
25.
Licata E (2009). “Healthy menu options can help eliminate veto votes from guests”. Nation’s
Restaurant News 43(11): 29.
Li D, Sinclair A, Mann N, Turner A, Ball M, Kelly F, Abedin L, Wilson A (1999). The
association of diet and thrombotic risk factors in healthy male vegetarians and meat-
eaters. European Journal of Clinical Nutrition 53: 612-619.

180
Liebenberg C (2016). An analysis of consumer preferences of meat in townships.
Unpublished Masters Mini-dissertation, North-West University.
Linderman M, Stark K (1999). Pleasure, pursuit of health or negotiation of identity? Personality
correlates of food choice motives among young and middle-aged women. Appetite
33(1): 141-161.
Link BG, Phelan JC (2001). Conceptualizing stigma. Annual Review of Sociology 27: 363-
385.
Llieva J, Baron S, Healey NM (2002). Online surveys in marketing research. International
Journal of Market Research 44(3): 1-14.
Lomer MCE, Parkes GC, Sanderson JD (2008). Review article: lactose intolerance in clinical
practice- myths and realities. Alimentary Pharmacology and Therapeutics 27(2):
93-103.
Loughnan S, Bastian B, Haslam N (2014). The psychology of eating animals. Current
Directions in Psychological Science 23(2): 104 -108.
Lund TB, McKeegan DEF, Cribbin C, Sandoe P (2016). Animal ethics profiling of vegetarians,
vegans and meat-eaters. Anthrozoös 29(1): 89-106.
Magnusson MK, Arvola A, Koivisto HU, Aberg L, Sjödén P (2001). Attitudes towards organic
foods among Swedish consumers. British Food Journal 103(3): 209-227.
Mail & Guardian (2018). Vegan trends put pressure on mainstream marketplace.
https://mg.co.za/article/2018-10-19-00-vegan-trends-put-pressure-on-mainstream-
marketplace/ (Accessed: 10/04/2020).
Mäkinen OE, Wanhalinna V, Zannini E, Arendt EK (2016). Foods for special dietary needs:
Non-dairy plant based milk substitutes and fermented dairy type products. Critical
Reviews in Food Science and Nutrition 56(3): 339-349.
Malav OP, Talukder S, Gokulakrishnan P, Chand S (2015). Meat analog: A review. Critial
Reviews in Food Science and Nutrition 55(9): 1241-1245.
Mandry E, Lisowska A, Grevowiec P, Walkowiak J (2012). The impact of vegan diet on B-12
status in healthy omnivores: five-year prospective study. Acta Scientiarum Polonorum
Technologia Alimentaria 11(2): 209-212.

181
Manicaa (2020). Online Shopping. https://www.manicaa.com/ (Accessed: 10/04/2020).
Mann CJ (2003). Observational research methods. Research design II: cohort, cross sectional
and case-control studies. Emergency Medical Journal 20(1): 54-60.
Mann J, Truswell S (2017). Essentials of human nutrition, 2nd ed. New York: Oxford
University Press Inc.
Mann SE (2014). More Than Just A Diet: An Inquiry Into Veganism. Anthropology Senior
Theses. University of Pennsylvania, United States.
Manore MM (2005). Exercise and the Institute of Medicine recommendations for nutrition.
Current Sports Medicine Reports 4(4): 193-198.
Manski CF, Molinari F (2008). Skip sequencing: A decision problem in questionnaire design.
The Annals of Applied Statistics 2(1): 264.
Maunder EMW, Meaker JL (2007). The current and potential contribution of home-grown
vegetables to diets in South Africa. African Journals Online 33(3): 401-406.
Maurer D (2002). Vegetarianism: Movement or Moment?. Philadelphia, PA: Temple
University Press.
Margetts BM, Nelson M (1997). Design Concepts in Nutritional Epidemiology, 2nd ed.
New York: Oxford University Press Inc.
Markowski KL, Roxburgh S (2019). “If I became a vegan, my family and friends would hate
me:” Anticipating vegan stigma as a barrier to plant-based diets. Appetite 135: 1-9.
Marlett JA, McBurney MI, Slavin JL (2002). Position of the American Dietetic Association:
Health implication of dietary fiber. Journal of the American Dietetic Association
102(7): 993-1000.
McCarthy KS, Parker M, Ameerally A, Drake SL, Drake MA (2017). Drivers of choice for
fluid milk versus plant-based alternatives: What are consumer perceptions of fluid
milk?. Journal of Dairy Science 100(8): 6125-6138.
McColl E, Jacoby A, Thomas L, Soutter J, Bamford C, Steen N, Thomas R, Harvey E, Garratt
A, Bond J (2001). Design and use of questionnaires: a review of best practice applicable
to surveys of health service staff and patients. Core Research 5(31): 1-6.

182
McCoubrie P (2004). Improving the fairness of multiple-choice questions: a literature review.
Medical Teacher 26(8): 709-712.
McCullough ML, Feskanich D, Stampfer MJ, Giovannucci EL, Rimm EB, Hu FB,
Spiegelman D, Hunter DJ, Colditz GA, Willett WC (2002). Diet quality and major
chronic disease risk in men and women: Moving toward improved dietary guidance.
The American Journal of Clinical Nutrition 76(6): 1261-1271.
McDonald B (2000). Once you know something, you can’t not know it: An empirical look at
becoming vegan. Society and Animals 8(1): 1-23.
McEvoy CT, Temple N, Woodside JV (2012). Vegetarian diets, low-meat diets and health: a
review. Public Health Nutrition 15(12): 2287-2294.
Mchiza ZJ, Steyn NP, Hill J, Kruger A, Schönfeldt H, Nel J, Wentzel-Viljoen E (2015). A
Review of Dietary Surveys in the Adult South African Population from 2000 to 2015.
Nutrients 7(9): 8227-8250.
McPeake J, Bateson M, O’Neill A (2014). Electronic surveys: how to maximise success.
Nurse Researcher 21(3): 24-26.
Meadows KA (2003). So you want to do research? 5: Questionnaire design. British Journal
of Community Nursing 8(12): 562-570.
Melina V, Craig W, Levin S (2016). Position of the Academy of Nutrition and Dietetics:
Vegetarian diets. Journal of the Academy of Nutrition and Dietetics 116(12):
1970-1980.
Menal-Puey S, del Ruste MM, Marques-Lopes I (2018). Food and nutrient intake in Spanish
vegetarians and vegans. Progress in Nutrition 20(2): 189: 196.
Mendoza JA, Drewnowski A, Cheadle A, Christakis DA (2006). Dietary energy density is
associated with selected predictors of obesity in U.S. children. The Journal of Nutrition
136(5): 1318-1322.
Mensink RP, Zock PL, Kester ADM, Katan MB (2003). Effects of dietary fatty acids and
carbohydrates on the ratio of serum total to HDL cholesterol and on serum lipids and
apolipoproteins: A meta-analysis of 60 controlled trials. The American Journal of
Clinical Nutrition 77(5): 1146-1155.

183
Menzel J, Biemann R, Longree A, Isermann B, Mai K, Schulze MB, Abraham K, Weikert C
(2020). Associations of a vegan diet with inflammatory biomarkers. Scientific
Reports 10(1933): 1-8.
Messina MJ (1999). Legumes and soybeans: overview of their nutritional profiles and health
effects. The American Journal of Clinical Nutrition 70(3): 459-470.
Messina V (2014). Nutritional and health benefits of dried beans. American Journal of
Clinical Nutrition 100 (1):437-442.
Messina V, Mangels AR (2001). Considerations in planning vegan diets: Children. Journal
of the American Dietetic Association 101(6): 661-669.
Messina V, Melina V, Mangels AR (2003). A new food guide for North American vegetarians.
Canadian Journal of Dietetic Practice and Research 64(2): 82-86.
Meurer MC, de Souza D, Marczak LDF (2020). Effects of ultrasound on technological
properties of chickpea cooking water (aquafaba). Journal of Food Engineering 265:
109688.
Mittal, Sullivan, Chekuri, Allee, Corrigan (2012). Empirical studies of self-stigma reduction
strategies: A critical review of the literature. Psychiatric Services 63(10): 974-981.
Mohd-Any AA, Mahdzan SN, Cher SC (2014). Food choice motives of different ethnics and
the foodies segment in Kuala Lumpur. British Food Journal 116(12): 1879-1896.
Montonen J, Knekt P, Järvinen R, Aromaa A, Reunanen A (2003). Whole-grain and fiber intake
and the incidence of type 2 diabetes. The American Journal of Clinical Nutrition
77(3): 622-629.
Monroe MC, Adams DC (2012). Increasing response rates to web-based surveys. Journal of
Extension 50(6): 6-7.
Moriconi E (2001). Le fabbriche degli animali: ‘mucca pazza’ e dintorni (Animal
factories: ‘mad cow’ and neighbouring). Cosmopolis: Torino.
Mota C, Santos M, Mauro R, Samman N, Matos AS, Torres D, Castanheira I (2016). Protein
content and amino acids profile of pseudocereals. Food Chemistry 193:55-61.
Munro L (2005). Strategies, action repertoires and DIY activism in the animal rights
movement. Social Movement Studies 4(1): 75-94.

184
Murphy SP, Poos MI (2002). Dietary Reference Intakes: summary of applications in dietary
assessment. Public Health Nutrition 5(6A): 843-849.
Murugkar DA (2014). Effect of sprouting of soybean on the chemical composition and
quality of soymilk and tofu. Journal of Food Science and technology 51: 915-921.
National Health Research Ethics Council (2004). Ethics in Health Research: Principles,
Structures and Processes. Pretoria: Department of Health.
Nayak MSPD, Narayan KA (2019). Strengths and Weakness of Online Surveys. Journal of
Humanities and Social Science 24(5): 31-38.
Newmark HL (1987). Nutrient density: an important and useful tool for laboratory animal
studies. Carcinogenesis 8(7): 871-873.
Newport F (2012). In U.S., 5% consider themselves vegetarians, even smaller 2% say they
are vegans. http://www.gallup.com/poll/156215/consider-themselves-vegetarians.aspx
(Accessed: 10/01/2020).
Newsom JT, McFarland BH, Kaplan MS, Huguet N, Zani B (2005). The health consciousness
myth: implications of the near independence of major health behaviours in the North
American population. Social Science & Medicine 20(2): 433-437.
Nosworthy MG, House JD (2017). Factors influencing the quality of dietary proteins:
implications for pulses. Cereal Chemistry 94(1): 49-57.
Nuttall FQ (2015). Body mass index- Obesity, BMI, and health: A critical review.
Nutrition Research 50(3): 1-12.
Ochs E, Shohet M (2006). The cultural structuring of mealtime socialization. New Directions
for Child and Adolescent Development 2006(111): 35-49.
Omoni AO, Aluko RE (2005). Soybean foods and their benefits: Potential mechanisms of
action. Nutrition Reviews 63(8): 272-283.
O’Reilly-Shah VN (2017). Factors influencing healthcare provider respondent fatigue
answering a globally administered in-app survey. Peer-reviewed Journal 5(e3785): 1-
17.

185
Orlich MJ, Jaceldo-Siegl K, Sabate´ J, Fan J, Singh PN, Fraser GE (2014). Patterns of food
consumption among vegetarian and non-vegetarians. British Journal of Nutrition
112(10): 1644-1653.
Orlich MJ, Singh PN, Sabaté J, Jaceldo-Siegl K, Fan J, Knutsen S, Beeson L, Fraser GE (2013).
Vegetarian dietary patterns and mortality in Adventist Health Study 2. Journal of the
American Medical Association Internal Medicine 173(13): 1230-1238.
Ornish D, Scherwitz LW, Billings JH, Gould L, Merritt TA, Sparler S, Armstrong WT, Ports
TA, Kirkeeide RL, Hogeboom C, Brand RJ (1998). Intensive lifestyle changes for
reversal of coronary heart disease. The Journal of the American Medical Association
280 (23): 2001-2007.
Palacios OM, Badran J, Drake MA, Reisner M, Moskowitz HR (2009). Consumer
acceptance of cows milk versus soy beverages: Impact of ethnicity, lactose tolerance
and sensory preference segmentation. Journal of Sensory Studies 24(5): 731-748.
Palacios OM, Badran J, Spence L, Drake MA, Reisner M, Moskowitz HR (2010). Measuring
acceptance of milk and milk substitutes among younger and older Children. Journal of
Food Science 75(9): S522-S526.
Palka A, Newerli-Guz J (2018). Ice cream as innovative luxury products. Handel
Wewnętrzny 2(373): 331-342.
Papier K, Tong TYN, Appleby PN, Bradbury KE, Fenson GK, Knuppel A, Perez-Cornago A,
Schmidt JA, Travis RC, Key TJ (2019). Comparison of major protein-sources foods
and other food groups in meat-eaters and non-meat-eaters in the EPIC-Oxford Cohort.
Nutrients 11(4): 824.
Parsons TJ, van Dusseldorp M, van der Vliet M, van de Werken K, Schaafsma G, van Staveren
WA (1997). Reduced bone mass in Dutch adolescents fed a macrobiotic diet in early life.
The American Society for Bone and Mineral Research 12(9): 1486: 1494.
Pawlak R, Parrott SJ, Raj S, Cullum-Dugan D, Lucus D (2013). How prevalent is vitamin
B12 deficiency among vegetarians?. Nutrition Reviews 71(2): 110-117.
Peltzer K (2004). Nutrition knowledge among a sample of urban black and white South
Africans. South African Journal of Clinical Nutrition 17(1): 24-31.

186
Pettersen BJ, Anousheh R, Fan J, Jaceldo-Siegl K, Fraser GE (2012). Vegetarian diets and
blood pressure among white respondents: results from the Adventist Health Study-2
(AHS-2). Public Health Nutrition 15(10): 1909-1916.
Phillips F (2005). Vegetarian nutrition. British Nutrition Foundation Nutrition Bulletin 30:
132–167.
Pillay-van Wyk V, Msemburi W, Laubscher R, Dorrington RE, Groenewald P, Matzopoulos
R, Prinsloo M, Nojilana B, Nannan N, Gwebushe N, Vos T, Somdyala N, Sithole N,
Neethling I, Nicol E, Joubert J, Rossouw A, Bradshaw D (2013). Second National
Burden of Disease Study South Africa: National and subnational mortality trends,
1997-2009. The Lancet 381:113.
Pimentel D, Pimentel M (2003). Sustainability of meat-based and plant-based diets and the
environment. The American Journal of Clinical Nutrition 78(suppl): 660-663.
Pinstrup-Andersen P, Pandya-Lorch, R (1998). Food security and sustainable use of natural
resources: a 2020 vision. Ecological Economics 26(1): 1-10.
Plous S (1993). Psychological mechanisms in the human use of animals. Journal of Social
Issues 49(1): 11-52.
Pohjolainen P, Vinnari M, Jokinen P (2015). Consumers perceived barriers to following a
plant based diet. British Food Journal 117(3): 1150-1167.
Polak R, Phillips EM, Campbell A (2015). Legumes: Health benefits and culinary approaches
to increase intake. American Diabetes Association 33(4): 198-205.
Popkin BM (2016). Nutrition transition and the global diabetes epidemic. Current Diabetes
Reports 15(9): 1-14.
Post MJ (2012). Cultured meat from stem cells: Challenges and prospects. Meat Science
92(3): 297-301.
Poti JM, Mendez MA, Ng SW, Popkin BM (2015). Is the degree of food processing and
convenience linked with the nutritional quality of foods purchased by US households?.
American Journal of Clinical Nutrition 101(6): 1251-1262.
Potts A, Parry J (2010). Vegan sexuality: Challenging heteronormative masculinity through
meat-free sex. Feminism & Psychology 20(1): 53-72.

187
Preece J, Nonnecke B, Andrews D (2004). The top five reasons for lurking: improving
community experiences for everyone. Computers in Human Behavior 20(2): 201-223.
Puoane T, Tsolekile L (2008). Challenges faced by the urban Black South Africans in the
prevention of Non-Communicable Diseases. Tribes and Tribals, Special Volume 2:
9-14.
Quinn, Chaudoir (2009). Living with a concealable stigmatized identity: The impact of
anticipated stigma, centrality, salience, and cultural stigma on psychological distress and
health. Journal of Personality and Social Psychology 97(4): 634-651.
Radnitz C, Beezhold B, DiMatteo J (2015). Investigation of lifestyle choices of individuals
following a vegan diet for health and ethical reasons. Appetite 90: 31-36.
Ralph JL, Ah DV, Scheett AJ, Hoverson BS, Anderson CM (2011). Diet assessment methods:
A guide for oncology nurses. Clinical Journal of Oncology Nursing 15(6): E114-21.
Rao M, Afshin A, Singh G, Mozaffarian D (2013). Do healthier foods and diet patterns cost
more than less healthy options? A systematic review and meta-analysis. British Medical
Journal Open 3(12): 1-16.
Reid E (1996). Informed consent in the study of on-line communities: A reflection on the
effects of computer-mediated social research. The Information Society 12(2):169-174.
Rejinders L, Soret S (2003). Quantification of the environmental impact of different dietary
protein choices. The American Journal of Clinical Nutrition 78(3): 664-668.
Richter M, Boeing H, Grunewald-Funk D, Heseker H, Kroke A, Leschik-Bonnet E, Oberritter
H, Strohm D, Watzl B (2016). Vegan diet: Position of the German Nutrition Society
(DGE). Ernahrungs Umschau 63(4): 92-102.
Rizzo NS, Jaceldo-Siegl K, Sabate´ J, Fraser GE (2013). Nutrient profiles of vegetarian and
nonvegetarian dietary patterns. Journal of the Academy of Nutrition and Dietetics
113(12): 1610-1619.
Rose D, Heller MC, Willits-Smith AM, Meyer RJ (2019). Carbon footprint of self-selected
US diets: nutritional, demographic, and behavioral correlates. The American Journal
of Clinical Nutrition 109(3): 526-534.

188
Rothgerber H (2015). Underlying differences between conscientious omnivores and
vegetarians in the evaluation of meat and animals. Appetite 87: 251-258.
Rothgerber H (2014). A comparison of attitudes toward meat and animals among strict and
semi-vegetarians. Appetite 72: 98-105.
Rothgerber H (2013). A meaty matter - Pet diet and the vegetarian’s dilemma. Appetite 68:
76-82.
Rottka H (1990). Health and vegetarian life style. Bibliotheca Nutritio et Dieta 45: 176-194.
Rozin P, Markwith M, Stoess C (1997). Moralization and becoming a vegetarian: the
transformation of preferences into values and the recruitment of disgust. American
Psychological Society 8(2): 67-73.
Rubenfeld GD (2004). Surveys: an introduction. Respiratory Care 49(10): 1181-1185.
Ruby MB (2012). Vegetarianism. A blossoming field of study. Appetite 58: 141-150.
Sabate´ J, Soret S (2014). Sustainability of plant-based diets: back to the future. The American
Journal of Clinical Nutrition 100(1): 476-482.
Sabate´ J, Wien M (2010). Vegetarian diets and childhood obesity prevention. American
Journal of Clinical Nutrition 9(suppl): 1525-1529.
Sanchez-Sabate R, Sabate´ J (2019). Consumer attitudes towards environmental concerns of
meat consumption: A systematic review. International Journal of Environmental
Research and Public Health 16(1220): 1-37.
Sandberg A (2002). Bioavailability of minerals in legumes. British Journal of Nutrition 88
(3): 281-285.
Sandoe P, Christiansen SB, Holst B (2008). Management and use of wild animals. In: Ethics
of animal use. Chichester: Blackwell Publishing.
Sans P, Combris P (2019). World meat consumption patterns: An overview of the last fifty
years (1961–2011). Meat Science 109: 106-111.
Santarelli RL, Pierre F, Corpet DE (2008). Processed meat and colorectal cancer: a review of
epidemiologic and experimental evidence. Nutrition and Cancer 60(2): 131-144.

189
Sartorius B, Veerman LJ, Manyema M, Chola L, Hofman K (2015). Determinants of obesity
and associated population attributability, South Africa: Empirical evidence from a
National Panel Survey, 2008-2012. Public Library of Science ONE 10(6): 1-20.
Satija A, Hu FB (2018). Plant-based diets and cardiovascular health. Trends in
Cardiovascular Medicine 28(7): 437-441.
Saunders AV, Craig WJ, Baines SK (2013). Zinc and vegetarian diets. Medical Journal of
Australia 199(4): 17-21.
Schutte AE, van Rooyen JM, Huisman HW, Kruger HS, Malan NT, De Ridder JH (2003).
Dietary risk markers that contribute to the aetiology of hypertension in black South
African children: The THUSA BANA study. Journal of Human Hypertension 17: 29-
35
Sebeková K, Boor P, Valachovicová M, Blazícek P, Parrák V, Babinská K, Heidland A,
Krajcovicová-Kudlácková M (2006). Association of metabolic syndrome risk factors
with selected markers of oxidative status and micro inflammation in healthy omnivores
and vegetarians. Molecular Nutrition and Food Research 50: 858-868.
Seeds for Africa (2020). Tendergreen Mustard Greens.
https://www.seedsforafrica.co.za/products/tendergreen-mustard-greens-organic-
brassica-juncea-200-seeds (Accessed: 19/04/2020)
Seleshe S, Jo C, Lee M (2014). Meat consumption culture in Ethiopia. Korean Journal for
Food Science of Animal Resources 34(1): 7-13.
Sethi S, Tyagi SK, Anurag RK (2016). Plant-based milk alternatives an emerging segment of
functional beverages: a review. Journal of Food Science and Technology 53(9): 3408-
342.
Shani A, DiPietro R (2007). “Vegetarians: A typology for foodservice menu development”.
FIU Hospitality and Tourism Review 25(2): 66-73.
Shimasaki C (2014). Biotechnology Entrepreneurship, 1st ed. USA: Academic Press.
Sinclair M, O’Toole J, Malawaraarachchi M, Leder K (2012). Comparison of response rates
and cost-effectiveness of a community-based survey: postal, internet and telephone
modes with generic or personalised recruitment approaches. BMC Medical Research
Methodology 12(1):132.

190
Singhal S, Baker RD, Baker SS (2017). A Comparison of the Nutritional Value of Cow's Milk
and Non-dairy Beverages. Journal of Pediatric Gastroenterology and Nutrition 65(5):
799-805.
Sisay E, Edriss A (2012). Determinants of food insecurity in Addis Ababa City, Ethiopia.
Journal of Economics and Sustainable Development 3(3): 2222-2855.
Smith VH, Schindler DW (2009). Eutrophication science: Where do we go from here?.
Trends in Ecology and Evolution 24(4): 201-207.
Smolinske SC (2017). Dietary supplements in children. Pediatric Clinics of North
America 64(6): 1243-1255.
Smuts CM, Wolmarans P (2013). The importance of the quality or type of fat in the diet: A
food-based dietary guideline for South Africa. South African Journal of Clinical
Nutrition 26(3): 87-99.
Sobiecki JG, Appleby PN, Bradbury KE, Key TJ (2016). High compliance with dietary
recommendations in a cohort of meat eaters, vegetarians, and vegans: Results from the
European Prospective Investigation into Cancer and Nutrition-Oxford study,
Nutrition Research 36(5): 464-477.
Solomon DJ (2001). Conducting wed-based surveys. Practical Assessment, Research &
Evaluation 7(19): 1-4.
Solomon MR, Bamossy G, Askegaard S, Hogg MK (2006). Consumer behaviour. A
European perspective, 3rd ed. Harlow, England, New York: Financial Times/Prentice
Hall.
South African Department of Health (2013). South African Department of Health.
Foodstuffs, Cosmetics and Disinfectants ACT, 1972 (ACT NO. 54 OF 1972).
Regulations relating to the reduction of sodium in certain foodstuffs and related matters.
Government Gazette, Republic of South Africa
http://www.heartfoundation.co.za/sites/default/files/articles/South%20Africa%20salt%2
0legislation.pdf (Accessed: 25/03/2020).

191
South African Department of Health (2006). Guidelines for Good Practice in the Conduct
of Clinical Trials with Human Participants in South Africa. Pretoria: Department of
Health.
South African Vegan Society (2015). What is Veganism?
https://vegansociety.org.za/ (Accessed: 27/10/2019).
South African Vegan Society Facebook (2019). South African Vegan Society.
https://m.facebook.com/vegansocietySA/ (Accessed: 10/04/2020).
Spencer EA, Appleby PN, Davey GK, Key TJ (2002). Validity of self-reported height and
weight in 4808 EPIC-Oxford respondents. Public Health and Nutrition 5: 561-565.
Statistics South Africa (2016). Census 016 statistical release.
http://cs2016.statssa.gov.za/wp-content/uploads/2016/07/NT-30-06-2016-RELEASE-
for-CS-2016-_Statistical-releas_1-July-2016.pdf (Accessed: 12/04/2020).
Statistics South Africa (2012). Measuring poverty in South Africa. Pretoria: Government
Printers.
Steele K (2013). The Vegan Journey: An Exploration of Vegan Experiences with Vegans
from Burlington, Vermont. Undergraduate Thesis. University of Vermont,
Burlington, United States.
Steinfeld H, Gerber P, Wassenaar TD, Food and Agriculture Organization of the United
Nations, Castel V, Rosales M, de Haan C (2006). Livestock's Long Shadow:
Environmental Issues and Options. Italy: Food and Agriculture Organization of the
United Nations.
Steyn NP, Nel JH, Nantel G, Kennedy G, Labadarios D (2006). Food variety and dietary
diversity scores in children: are they good indicators of dietary adequacy?. Public Health
Nutrition 9(5): 644-650.
Sticher MA, Smith CB, Davidson S (2010). Reducing heart disease through the vegetarian diet
using primary prevention. Journal of the American Academy of Nurse Practitioners
22(3): 134-139.

192
Stoll-Kleemann S, Schmidt UJ (2017). Reducing meat consumption in developed and
transition countries to counter climate change and biodiversity loss: a review of influence
factors. Regional Environmental Change 17:1261–1277.
Strode A, Slack C, Essack Z (2010). Child consent in South African law: Implications for
researchers, service providers and policy-makers. South African Medical Journal
100(4): 247-249.
Ströhle A, Ströhle A, Waldmann A, Koschizke J, Leitzmann C, Hahn A (2011). Diet-
dependent net endogenous acid load of vegan diets in relation to food groups and bone
health-related nutrients: Results from the German Vegan Study. Annals of Nutrition
and Metabolism 59: 117-126.
Sverdlik A (2011). Ill-health and poverty: A literature review on health in informal
settlements. SAGE Journals 23(1): 123-155.
Symonds E (2011). A practical application of SurveyMonkey as a remote usability-testing tool.
Library Hi Tech 29(3):436-445.
Tam R, Yassa B, Parker H, O’Connor H, Allman-Farinelli M (2017). University students on-
campus food purchasing behaviors, preferences, and opinions on food availability.
Nutrition 37: 7-13.
Tapsell LC, Neale EP, Satija A, Hu FB (2016). Foods, nutrients, and dietary patterns:
Interconnections and implications for dietary guidelines. Advances in Nutrition 7(3):
445-454.
Taylor DR (2000). Developing powerful learning communities using technology. American
Association of Colleges for Teacher Education Briefs 21(14): 4-5.
Temple NJ, Steyn NP (2011). The cost of a healthy diet: A South African perspective.
Nutrition 27(5): 505-508.
Teucher B, Olivares M, Cori H (2004). Enhancers of iron absorption: Ascorbic acid and other
organic acids. International Journal for Vitamin and Nutrition Research 74(6): 403-
419.
The Vegan Society (1946). The Vegan (Official organ of the Society). Leicester & St-
Leonards on Sea: The Vegan Society.

193
Thorogood M, Roe L, McPherson K, Mann J (1990). Dietary intake and plasma lipid levels:
lessons from a study of the diet of health conscious groups British Medical Journal
300(6735): 1297-1301.
Tilman D, Cassman KG, Matson PA, Naylor R, Polasky S (2002). Agricultural sustainability
and intensive production practices. Nature 418(6898): 671-677.
Tilman D, Clark M (2014). Global diets link environmental sustainability and human health.
Nature 515: 518-522.
Timko CA, Hormes JM, Janice, Chubski J (2012). Will the real vegetarian please stand up?
An investigation of dietary restraint and eating disorder symptoms in vegetarians versus
non-vegetarians. Appetite 58: 982-990.
Tinchan P, Lorjaroenphon Y, Cadwallader KR, Chalseri S (2015). Changes in the profile of
volatiles of canned coconut milk during storage. Journal of Food Science 80(1): 49-
54.
Tonstad S, Butler T, Yan R, Fraser GE (2009). Type of vegetarian diet, body weight, and
prevalence of type 2 diabetes. Diabetes Care 32(5): 791-796.
Tonstad S, Stewart K, Oda K, Batech M, Herring RP, Fraser GE (2013). Vegetarian diets and
incidence of diabetes in the Adventist Health Study-2. Nutrition, Metabolism and
Cardiovascular Diseases 23(4): 292-299.
Topping D (2007). Cereal complex carbohydrates and their contribution to human health.
Journal of Cereal Science 46(3): 220-229.
Trapp C, Barnard N, Katcher H (2010). A Plant-based for type 2 diabetes. Sage Journals
36(1): 33-48.
Trimble SW, Crosson P (2000). U.S. Soil erosion rates-myth and reality. Science 289(5477):
248-250.
Turner-McGrievy G, Mandes T, Crimarco A (2017). A plant-based diet for overweight and
obesity prevention and treatment. Journal of Geriatric Cardiology 14(5): 369-374.
Turner-McGrievy GM, Barnard ND, Scialli AR (2007). A two‐year randomized weight loss
trial comparing a vegan diet to a more moderate low‐fat diet. Obesity Society 15(9):
2276-2281.

194
Turner-McGrievy GM, Leach AM, Wilcox S, Frongillo EA (2016). Differences in
environmental impact and food expenditures of four different plant-based diets and an
omnivorous diet: Results of a randomized, controlled intervention. Journal of Hunger
& Environmental Nutrition 11(3): 382-395.
Tuso PJ, Ismail MH, Ha BP, Bartolotto C (2013). Nutritional update for physicians: Plant-
based diets. The Permanente Journal 17(2): 61-66.
Twigg J (1982). The vegetarian movement in England 1847-1981. Unpublished doctoral
dissertation, York University.
Twine R (2014). Vegan killjoys at the table- Contesting happiness and negotiating relationships
with food practices. Societies 4: 623-639.
Tydeman-Edwards R (2012). Obesity, Under-Nutrition and Double Burden of Disease in
the Free State. Master’s Thesis. University of Free State, Bloemfontein, South Africa.
Ulusoy E (2015). I think, therefore I am vegan: Veganism, ethics, and social justice. In:
Proceedings of the 40th Annual MacroMarketing Conference 420-424.
United Nations (2010). Department of Economic and Social Affairs. In: World Urbanization
Prospects, The 2009 Revision, Highlights. New York: United Nations.
United States Department of Health and Human Services (2015). 2015-2020 Dietary
Guidelines for Americans. https://www.dietaryguidelines.gov/current-dietary-
guidelines/2015-2020-dietary- guidelines (Accessed: 19/03/2020).
Vanga SK, Raghavan V (2018). How well do plant based alternatives fare nutritionally
compared to cow’s milk?. Journal of Food Science and Technology 55: 10-20.
Vagadia BH, Vanga SK, Singh A, Raghavan V (2016). Effects of thermal and electric fields
on soybean trypsin inhibitor protein: A molecular modelling study. Innovative Food
Science and Emerging Technologies 35: 9-20.
Van Gelder MMHJ, Bretveld RW, Roeleveld N (2010). Web-based questionnaires: the future
in epidemiology? American Journal of Epidemiology 172(11): 1292-1298.
Van Mol C (2017). Improving web survey efficiency: the impact of an extra reminder and
reminder content on web survey response. International Journal of Social
Research Methodology 20(4): 317-327.

195
Van Rensburg, Wiles NL (2019). The opinion of KwaZulu-Natal Dietitians regarding the use
of a whole-foods plant-based diet in the management of non-communicable diseases.
South African Journal of Clinical Nutrition 1-5.
Van Winckel M, Vande Velde S, De Bruyne R, Van Biervliet S (2011). Vegetarian infant
and child nutrition. European Journal of Pediatrics 170: 1489-149.
Varela C, Ruiz J, Andres A, Roy R, Fuste A, Saldana C (2016). Advantages and disadvantages
of using the website SurveyMonkey in the real study: Psychopathological profile in
people with normal-weight, overweight and obesity in a community sample. E-
methodology 77.
Vegetarier Bund Deutschland (2014). Number of vegetarians in Germany.
https://vebu.de/themen/lifestyle/anzahl-der-vegetarierinnen (Accessed: 18/12/2019).
Vegan South Africa (2020). The South African vegan directory.
https://www.vegansa.com (Accessed: 21/04/2020).
Vegetarian Resource Group (2016). How many adults in the U.S are vegetarian and vegan?.
https://www.vrg.org/nutshell/Polls/2016_adults_veg.htm (Accessed: 06/11/2019).
Vegetarian Resource Group (2006). How many adults are vegetarian?
http://www.vrg.org/journal/vj2003issue3/vj2003issue3poll.htm (Accessed: 12/11/2019).
Viuda-Martos M, Lopez-Marcos MC, Fernandez-Lopez J, Sendra E, Lopez-Vargas JH, Perez-
Alvarez JA (2010). Role of fiber in cardiovascular diseases: A review. Comprehensive
Reviews in in Food Science and Food Safety 9(2): 240-258.
Vollmer I, Keller M, Kroke A (2018). Vegan diet: utilization of dietary supplements and
fortified foods. Science and Research 65(9): 144-153.
Vorster HH (2002). The emergence of cardiovascular disease during urbanisation of
Africans. The Nutrition Society 5(1): 239-243.
Vorster HH, Kruger A, Wentzel-Viljoen E, Kruger HS, Margetts BM (2014). Added sugar
intake in South Africa: Findings from the Adult Prospective Urban and Rural

196
Epidemiology cohort study. American Journal of Clinical Nutrition 99(6): 1479-
1486.
Waldmann A, Dorr B, Koschizke, Leitzmann C, Hahn A (2006). Dietary intake of vitamin B6
and concentration of vitamin B6 in blood samples of German vegans. Public Health
Nutrition 9(6): 779-784.
Waldmann A, Koschizke JW, Leitzmann C, Hahn A (2005). German Vegan Study: Diet, life-
style factors, and cardiovascular risk profile. Annals of Nutrition and Metabolism
49(6): 366-372.
Waldmann A, Koschizke JW, Leitzmann C, Hahn A (2004). Dietary iron intake and iron
status of German female vegans: Results of the German Vegan Study. Annals of
Nutrition and Metabolism 48: 103-108.
Waldmann A, Koschizke JW, Leitzmann C, Hahn A (2003). Dietary intakes and lifestyle
factors of a vegan population in Germany: results from the German Vegan Society.
European Journal of Clinical Nutrition 57: 947-955.
Wallace TC, Murray R, Zelman KM (2016). The nutritional value and health benefits of
chickpeas and hummus. Nutrients 8(12): 766.
Wansink B, Sonka S, Goldsmith P, Chiriboga J, Eren N (2005). Increasing the acceptance of
soy-based foods. Journal of International Food & Agribusiness Marketing 17(1): 35-
55.
Wardlaw GM, Kessel MW (2002). Perspectives in Nutrition, 5th ed. New York: McGraw
Hill Education.
Watson M (2007). Trade Justice and individual consumption choices: Adam Smith's spectator
theory and the moral constitution of the fair trade consumer. European Journal of
International Relations 13(2): 263-288.
Wentzel-Viljoen E, Lee S, Laubscher R, Vorster HH (2018). Accelerated nutrition transition
in the North West Province of South Africa: results from the Prospective Urban and
Rural Epidemiology (PURE-NWP-SA) cohort study, 2005 to 2010. The Nutrition
Society 21(14): 2630-2641.
White R, Frank E (1994). Health effects and prevalence of vegetarianism. The Western
Journal of Medicine 160 (5): 465-471.

197
Williams H (1896. The Ethics of Diet, 2nd ed. London: Swan Sonnenscheim & Co Ltd and
The Ideal Publishing Union Ltd.
Wolk A (2016). Potential health hazards of eating red meat. Journal of Internal Medicine
281(2): 106-122.
World Cancer Research Fund and American Institute for Cancer Research (1997). Colon,
rectum: Food, nutrition and the prevention of cancer: a global perspective. American
Institute for Cancer Research 216-251.
WHO (2018). World Health Organisation. Malnutrition.
https://www.who.int/news-room/fact-sheets/detail/malnutrition (Accessed: 12/04/2020).
WHO (2015). World Health Organisation. Healthy Eating.
http://www.who.int/mediacentre/factsheets/fs394/en/ (Accessed: 20/03/2020).
WHO (2012). World Health Organisation. Sodium Reduction.
https://www.who.int/news-room/fact-sheets/detail/salt-reduction
(Accessed:18/03/2020).
WHO (2010). World Health Organisation. Strategies to monitor and evaluate population
sodium consumption and sources of sodium in the diet.
https://www.who.int/dietphysicalactivity/reducingsalt/en/ (Accessed: 20/03/2020).
Woolworths (2020). Online Shopping. https://www.woolworths.co.za/ (Accessed:
10/04/2020).
World Watch Institute (2004). State of the World 2004: Special Focus: The Consumer Society
(State of the World) (Paperback). In: Assadourian E, Gardner G, ed. World Watch
Intitute Report. New York: W. W. Norton & Company.
Wrenn CL (2017). Trump veganism: A political survey of American vegans in the era of
identity politics. Societies 7(32): 1-13.
Wright K (2000). Computer-mediated social support, older adults and coping. Journal of
Communication 50(3): 100-118.

198
Wright KB (2005). Researching internet-based populations: Advantages and disadvantages of
online survey research, online questionnaire authoring software packages and web survey
service. Journal of Computer-mediated Communication 10(3): 1034.
Wright L (2015). The Vegan Studies Project: Food, Animals, and Gender in the Age of
Terror. Athens, Georgia: University of Georgia Press.
Yang S, Zhang H, Sun S, Wang L, Yan B, Liu C, Zhang W, Li X (2011). Relationship of
carotid intima-media thickness and duration of vegetarian diet in Chinese male
vegetarians. Nutrition & Metabolism 8(63): 1-7.
Yeh, H (2014). Voice with every bite. Food, Culture and Society 17: 591-613.
Yu H, Liu R, Hu Y, Xu B (2017). Flavor profiles of soymilk processed with four different
processing technologies and 26 soybean cultivars grown in China. International
Journal of Food Properties 20(3): 2887-2898.
Yun GW, Trumbo CW (2000). Comparative response to a survey executed by post, e-mail &
web form. Journal of Computed-mediated Communication 6(1):613.
Zhang, Wang, Chen, Wei, Li, Zhao, Lu (2014). Comparison of vegetarian diets and
omnivorous diets on plasma level of HDL-c: A meta-analysis. Public Library of Science
ONE 9(3): 1- 7.
Zhao Y, Martin BR, Weaver CM (2005). Calcium bioavailability of calcium carbonate fortified
soymilk is equivalent to cow's milk in young women. The Journal of Nutrition 135(10):
2379-2382.
Zunft HF, Friebe Z, Seppelt B, Widhalm K, de Winter AR, de Almeida MDV, Kearney JM,
Gibney M (1999). Perceived benefits and barriers to physical activity in a nationally
representative sample in the European Union. Public Health Nutrition 2(1): 153-160.

199
APPENDIX A: Questionnaire
SECTION A: DEMOGRAPHIC CHRACTERISTICS
1. Are you a South African citizen currently living in South Africa?
Yes No
2. Indicate the province in South Africa you reside in.
Eastern Cape
Gauteng
Western Cape
KwaZulu-Natal
Limpopo
Mpumalanga
Northern Cape
North West
Free State
3. Do you follow a STRICT vegan diet?
Yes No
4. For how long have you been following a Vegan diet?
< 6 months
6 months - <1 year
1 - <3 years
3 - <5 years
5 - <7 years
7 - <9 years
9 - 10 years
>10 years
5. Please indicate your gender.
Male Female

200
6. Please indicate your race group.
Black White Coloured Indian Other: Please
Indicate -
7. Please indicate your current relationship status.
Single Married Divorced or Separated Widowed
8. Into which age category do you fall?
<18 years 18- 29 years 30- 39 years 40- 49 years 50-59 years 60+ years
9. Please indicate your highest academic level.
Some
School Matric Certificate Diploma Degree
Post-
graduate
Degree
Other
10. What is your TOTAL current monthly income?
I do not have an income R 6 401 – R 12 800
Up to R400 R 12 801 – R 25 600
R 401 – R 800 R 25 601 – R 51 200
R 801 – R 1 600 R 51 201 – R 102 400
R1 601 – R 3 200 R 102 401 – R204 800
R 3 201 – R 6 400 R204 801 or more
11. Do you smoke?
Yes No
12. Do you consume alcoholic beverages?
12.1 If YES to question 12, how often, on average, do you consume alcoholic beverages in a
week?
Yes No

201
13. Do you consume any mineral or vitamin supplement?
Yes No
13.1 If YES to question 13, specify the mineral or vitamin supplement that you consume.
___________________________________
14. Do you participate in any physical activity?
Yes No
14.1 If YES to question 14, indicate the frequency with which you participate in each type
of physical activity shown below.
Activity Nev
er
On
ce a
wee
k
Tw
ice
a w
eek
Th
ree
tim
es a
wee
k
Fou
r ti
mes
a w
eek
Fiv
e t
imes
a w
eek
Six
tim
es a
wee
k
Ever
yd
ay
More
th
an
on
ce a
day, P
lease
sp
ecif
y
the
nu
mb
er o
f
tim
es a
day
14.1.1 Low Intensity: Casual walking
or bike riding, yoga, stretching, walking
up the stairs
14.1.2 Moderate Intensity: Weight
training, jogging, cycling, swimming,
brisk walking, aerobics
14.1.3 High intensity: Circuit training,
vigorous forms of weight training,
running, cardio workouts
14.2 If YES to question 14, for how long do you participate in physical activity, ON AVERAGE,
in a day?
Less than 30
minutes
30 minutes -
<1 hour 1 - <2 hours 2 - <3 hours At least 3 hours
Less than
once a
week
Once a
week
Two times
a week
Three times
a week
Four times
a week
Five times a
week
More than
five times a
week

202
SECTION B: MOTIVES TOWARDS FOLLOWING A VEGAN DIET
1. Indicate your agreement that the following factors motivated or influenced you into following a
vegan diet
2. Since you began following a vegan diet, has your motivation behind your choice changed?
Yes No
3. Indicate your agreement that the following assisted you in your transition into veganism
Factors Strongly
disagree Disagree
Slightly
disagree
Slightly
agree Agree
Strongly
agree
1.1 Ethical concern for animals
(e.g. preventing cruelty; animal
rights and welfare)
1.2 To improve health
1.3 Protecting the environment
1.4 Family tradition and/or friends
following the diet
1.5 Influence of social media
1.6 Personal well-being
1.7 To reduce the carbon
footprint/impact on the
environment
1.8 The effect of animal product
consumption on climate change
1.9 Religious beliefs (e.g. Jains,
Buddhists)
1.10 To prevent diseases and
illnesses
1.11 Taste preferences
1.12 Social justice (e.g. world
hunger could be reduced by
feeding nutritious grains to the
underprivileged instead of to farm
animals)
1.13 Protect endangered species
1.14 Save water
1.15 Prevent pollution
1.16 Protect factory and farm
workers from unsafe conditions
Strongly
disagree Disagree
Slightly
disagree
Slightly
agree Agree
Strongly
agree

203
SECTION C: CHALLENGES ASSOCIATED WITH VEGANISM
1. Which word best describes your transition to veganism?
Very easy Easy Moderately
easy
Moderately
difficult Difficult Very difficult
2. Which of the following emotions best describes the beginning of your transition?
Fear Excitement and
enthusiasm Confusion Contentment
3. Do you experience any financial challenges following veganism?
4. Where do you purchase MOST of your vegan food items? (Select ONE option only)
Online Health food store Supermarket
3.1 Social media and/or the
Internet
3.2 Family and/or friends
3.3 Vegan groups
3.4 Vegan cook books/magazines
/newspapers
3.5 Vegan shops
3.6 Health stores
3.7 Becoming vegetarian first –
prior to becoming a vegan
3.8 Experimenting with replacing
dairy and meat products with
plant- based alternatives
3.9 Reading ingredient lists on
products
3.10 Experimenting with vegan
recipes
3.11 Visiting a vegan restaurant
3.12 Following a 30 day vegan
challenge
3.13 Visiting a Dietitian
Yes No

204
5. Indicate your agreement that you have experienced the following challenges during the
time of transition
Strongly
disagree Disagree
Slightly
disagree
Slightly
agree Agree
Strongly
agree
5.1 Communicating the decision to
family and friends
5.2 Associating yourself with meat-
eaters in a social setting
5.3 Gathering information on
veganism
5.4 Avoiding meat and meat
products
5.5 Planning a suitable vegan diet
5.6 Finding vegan stores
5.7 Finding vegan meal options in
restaurants
6. Indicate your agreement that the following practices helped you to overcome the challenges you
experienced
Strongly
disagree Disagree
Slightly
disagree
Slightly
agree Agree
Strongly
agree
6.1 Research on the Internet
6.2 Talking to /educating friends and
family about veganism
6.3 Visiting a DietitianDietitian
6.4 Reading vegan books and other
literature
6.5 Joining a vegan group on social
media or attending meetings
7. Indicate your agreement with the following statements:
SECTION D: NUTRITIONAL QUALITY OF FOOD IN A VEGAN DIET
1. Indicate your agreement with the following statements:
Statements Strongly
disagree Disagree
Slightly
disagree
Slightly
agree Agree
Strongly
agree
7.1 Vegan recipes are easily
accessible
7.2 There is an adequate range of
vegan products at your nearest
supermarket or retail store
7.3 It costs more to follow a vegan
diet than a diet which includes
animal products.
Statements Strongly
disagree Disagree
Slightly
disagree
Slightly
agree Agree
Strongly
agree

205
2. How often do you visit a restaurant and order a vegan meal?
Less than once a
month Once a month
Several times a
month Once a week
Several times a
week
24-HOUR RECALL
Please complete a 24-hour recall indicating all food, beverages and condiments you have consumed in
the last 24 hours also include the time and place that the meal had been eaten at and the portion size.
The example below will help assist you.
Time Place Meal Food item/ beverage Preparation details Amount
8.00am Home Breakfast Oats Cooked ½ cup
Almond milk ¼ cup
Sugar, white 2 teaspoons
Tea, Rooibos Mixed with boiling water ¾ cup
Almond milk ¼ cup
Sugar, white 2 teaspoons
10.00am Work Snack Apple Raw 1 medium
Strawberry soya
yoghurt 100ml tub
Fruit juice 125ml
13.00pm Work Lunch Roll, brown 1 roll
Sausage, soya Fried whole 1 medium
Sauce, tomato 2 teaspoons
Margarine 1 teaspoon
Coke, can 330ml can
1.1 A vegan diet is nutritionally
complete and adequate for a healthy
lifestyle
1.2 Meat alternatives are healthier
than meat products
1.3 Milk alternatives provide
adequate calcium for the body
1.4 Vegan food is bland and requires
many added ingredients in order to
be appetizing
1.5 Vegan food does not provide a
feeling of satiety


217
1 slice 2 slices 3 slices
Mashed Potato:
1/4 cup ½ cup 1 cup
Potato and Chickpea salad:
¼ cup ½ cup 1 cup
Muesli with mixed fruit:

218
¼ cup ½ cup 1 cup
Samp with beans:
1/4 cup ½ cup 1 cup
Pasta:
¼ cup ½ cup 1 cup
Baked beans:

219
¼ cup ½ cup 1 cup
Pizza:
1 slice 2 slices 3 slices
Salad:
¼ cup ½ cup 1 cup
Vegetable stew:

220
½ cup 1 cup 2 cup
Juice/Cooldrink:
¼ glass ½ glass 1 glass
Plant-based Milk:
¼ glass ½ glass 1 glass
Medium Fruit:

221
1 medium apple 1 medium orange 1 medium nectarine
Commercial Popcorn:
¼ cup ½ cup 1 cup
Cooked Rice:
1 rice ladle spoon 2 rice ladle spoons 3 rice ladle spoons
Commercial Vegan Crackers:

222
2 crackers 3 crackers 4 crackers
Peanuts and Raisins:
1 tablespoon 2 tablespoons 3 tablespoons
Bran Muffin:
½ Muffin 1 Muffin
Nut Butter:

223
Vegan Margarine:
Tomato Sauce:
Oil:
Salad dressing:
1 teaspoon
1 tablespoon
1 teaspoon
½ teaspoon
1/4 teaspoon
1 teaspoon
1 tablespoon
1 teaspoon
1 tablespoon

224
Banana and Oat Milk Smoothie:
1/4 glass ½ glass 1 glass
Roti:
1/2 medium roti 1 medium roti 2 medium roti’s
Paneer:
2 cubes 3 cubes 4 cubes
1 teaspoon
1 tablespoon

225
Cake:
1 Slice 2 Slices 3 Slices
Oven-baked Potato Chips:
½ cup 1 cup
Mixed Fruit Salad:
¼ bowl ½ bowl 1 bowl

226
Samoosa’s:
1 medium samoosa 2 medium samoosa’s 3 medium samoosa’
Chocolate pieces:
Vegetable crisps:
1/4 cup ½ cup 1 cup
Drinking Oats:
½ cup 1 cup
1 piece
2 pieces
3 pieces

227
Ice-cream:
1 scoop 2 scoops 3 scoops
Mixed boiled vegetable:
¼ cup ½ cup 1 cup
Vegan Feta Cheese:
½ block 1 block

228
Vegan Cheese:
¼ cup ½ cup 1 cup
Soya Products:
1 soya sausage (47.5g), 1 soya burger (85g)
Quinoa:
½ cup 1 cup

229
Couscous:
½ cup 1 cup
Wholegrain Wheat Biscuits:
1 biscuit 2 biscuits 3 biscuits
Sauerkraut:
1 tsp 2 tsp 3 tsp
Flaxseed:
¼ cup ½ cup 1 cup

230
Hummus:
1 tsp 2 tsp 3 tsp
Cashew Nuts:
1 Tablespoon 2 Tablespoons 3 Tablespoons
Almonds:
1 Tablespoon 2 Tablespoons 3 Tablespoons
Macadamia Nuts:
1 Tablespoon 2 Tablespoons 3 Tablespoons

231
Brazil Nuts:
1 Tablespoon 2 Tablespoons 3 Tablespoons
Pecan Nuts:
1 Tablespoon 2 Tablespoons 3 Tablespoons
Mixed Nuts:
1 Tablespoon 2 Tablespoons 3 Tablespoons
Dried Fruit:
½ cup 1 cup

232
Tahini:
Vegan Mayonnaise:
Vegan Sushi:
1 teaspoon
1 tablespoon
1 tablespoon
1 teaspoon
1 piece 4 pieces

233
Alcoholic Beverages:
500ml beer 330ml cider 1 glass red wine
Beverages:
500ml bottle 250ml carton 300ml can

234
APPENDIX C: Gatekeepers permission
To: Sansha Kohidh RD (SA)
Dear Sansha,
Thank you for reaching out to us.
This is to confirm that SAVS has reviewed your Master of Science
(Dietetics) topic: "The motives and challenges facing South African
vegans and the nutritional diversity of their diet" and that we’re
happy for you to use our social media platforms to collect your data
by means of an online questionnaire. We request that you let us have
a look at your copy before posting.
Please let me know if you need anything
else. Looking forward to it!
Kind regards, Dylan Barsby
M: +44 773 666 9757


236
APPENDIX E: Informed consent
Discipline of Dietetics and Human Nutrition
University of KwaZulu- Natal
Pietermaritzburg Campus
06 August 2019
Good day Participant,
My name is Sansha Kohidh and I am currently registered as a Masters Student at the University
of KwaZulu-Natal Pietermaritzburg, South Africa. My contact number is 0795652546 and my
email address is [email protected]
You are being invited to consider participating in a study that involves research study to
investigate the motives and challenges facing South African vegans and the nutritional diversity
of their diet.
The objectives of the study are as follows:
• To determine the socio-demographic characteristics of vegans
• To determine the factors that influence an individual to become a vegan
• To determine the challenges associated with becoming a vegan and how these
challenges were overcome
• To determine the nutritional quality of the foods consumed in a vegan diet
This study involves an online questionnaire that will be available on the South African Vegan
Society Facebook page for all South African vegans to voluntarily complete. Each participant
should complete the questionnaire once. All information obtained from the questionnaires will
be kept confidential.
It is predicted that there are millions of individuals following veganism in different countries
around the world. Therefore, sound knowledge is needed to understand the progression into
the vegan diet and nutritional quality of the diet. This topic is yet to be explored in South African
literature and this research will assist in expanding individuals’ knowledge on veganism in
South Africa.
This study has been ethically reviewed and approved by the UKZN Biomedical research Ethics
Committee (approval number BE712/18).
In the event of any problems or concerns/questions you may contact my research supervisor Dr
Nicola Wiles or the Biomedical Research Ethics Committee.
CONTACT DETAILS:
Research Supervisor: Dr Nicola Wiles Researcher: Sansha Kohidh
Email: [email protected] Email:[email protected]
Contact: 033 260 5430 Contact: 079 5652 546

237
BIOMEDICAL RESEARCH ETHICS ADMINISTRATION:
Research Office, Westville Campus
Govan Mbeki Building
Private Bag X 54001
Durban
4000
KwaZulu-Natal, SOUTH AFRICA
Tel: 27 31 2604769 - Fax: 27 31 2604609
Email: [email protected]
Participation in this research is voluntary and you may withdraw participation at any point. The
event of refusal/withdrawal of participation will not have any negative effect on you. All
answers will be kept anonymous and will not be shared with any third party without your signed
consent.
In order to maintain confidentiality, all personal data will be used solely for the purpose of the
study and will not be disclosed to the public. No names will be used when drawing conclusions
and/or writing up results. The results of the study will be submitted for publication in a journal.
Kind Regards,
Sansha Kohidh RD (SA)