an analysis of the challenges and opportunities facing the
251
AN ANALYSIS OF THE CHALLENGES AND OPPORTUNITIES FACING THE HONG KONG LOGISTICS INDUSTRY by LAU, Anthony Siu Wing A Thesis Submitted in Partial Fulfillment of the Requirements of Edinburgh Napier University for the award of Doctor of Philosophy JULY 2010
-
Upload
khangminh22 -
Category
Documents
-
view
4 -
download
0
Transcript of an analysis of the challenges and opportunities facing the

AN ANALYSIS OF THE CHALLENGES AND OPPORTUNITIES FACING THE
HONG KONG LOGISTICS INDUSTRY
by
LAU, Anthony Siu Wing
A Thesis Submitted in Partial Fulfillment
of the Requirements of Edinburgh Napier University
for the award of
Doctor of Philosophy
JULY 2010

ABSTRACT
Hong Kong freight forwarding services have flourished along with China's economic
development. Manufacturing activities in the Pearl River Delta (PRD) have provided
the Hong Kong logistics sector with many business opportunities. However, due to the
changes in the business environment, the industry is facing many challenges:
competition from other local logistics companies in China, a shrinking market share on
the shipping side, and increasing operating costs. The study aims to answer two
questions: will the PRD continue to serve as the manufacturing powerhouse of the
world and will exporters in the PRD continue to use Hong Kong:5 airport and port?
The findings of this research will help academia and practitioners better understand the
opportunities and challenges facing the Hong Kong logistics industry. This research was
carried out in two phases. First, the author conducted exploratory interviews with
manufacturers, logistics service providers, and government officials. Second, two
questionnaires (one for manufacturers and one for logistics service providers) were
designed based on the interviews and the literature review. The results of this two-stage
analysis indicate that manufacturing in the PRD will continue to demand forwarding
logistics support from Hong Kong because the latter continues to offer competitive
advantage in several aspects compared with competitors in China. The Hong Kong
government's pro-business attitude has helped to maintain Hong Kong's competitive
advantage as a logistics hub; thus, the integration of Hong Kong and PRD logistics
service providers has further enhanced this advantage in the PRD. Finally, based on
these findings, a number of recommendations are offered. The empirical part of the
research was completed before the onset of the 2008/9 recession; hence, no reference to
its effect has been included in this thesis. The work also excludes any specific reference
to the issues of carbon footprints and related environmental concerns because these are
not primary issues for the industry as seen by the governments of the PRD region.
II

ACKNOWLEDGEMENTS
I would like to thank Professor John Adams of the School of Accounting, Economics
and Statistics, Edinburgh Napier University and Professor Jeff Yeung, Department of
Supply Chain Management of the Chinese University of Hong Kong, my supervisors,
for their dedication, patience and sincere guidance throughout this thesis. Without
their support, this research would not have been possible.
I would like to thank my colleagues in the Hong Kong Logistics Development Council
and the industry leaders in Hong Kong for their valuable advice and support. I am
indebted to the assistance of the Chartered Institute of Logistics and Transport, Hong
Kong.
My deep thanks go to my wife Winifred and daughter Angelina for their patience and
support during the last four years.
I dedicate this work to my late mother who inspired me to set a long term vision even at
very difficult times when I was young and showed so much faith in my ability, attitude
and determination to excel in life.
III
TABLE OF CONTENTS
ABSTRACT ..................................................................................................................... II
ACKNOWLEDGEMENTS ............................................................................................ III
TABLE OF CONTENTS ................................................................................................ IV
LIST OF FIGURES ........................................................................................................ VI
LIST OF TABLES .............................................................................. VIII
Chapter One Introduction ............................................................................................ 1
1.1 Background to the Research ............................................................................. 1
1.2 Justification for and Objectives of the Research ............................................... 2
1.3 Structure of the Thesis ...................................................................................... 9
1.4 Contribution to Kno,w1edge ............................................................................. 10
Chapter Two Theoretical Background ....................................................................... 12
2.1 Definition of logistics ...................................................................................... 12
2.1.1 Second-party logistics service (2PL) providers (Asset-based logistics industry)
................................................................................................................................. 17
2.1.2 Third-party (3PL) service providers ............................................................... 19
2.1.3 Fourth-party logistics (4PL) service providers .............................................. 27
2.1.4 Fifth-party logistics (5PL) service providers ................................................ 28
2.2 Theories and Models ....................................................................................... 30
2.2.1 Transaction cost economics (TCE) ................................................................ 30
2.2.2 Resource based view (RBV) ......................................................................... 34
2.2.3 Location-Specific Advantages Theory (LSA) ............................................... 37
Chapter Three The Logistics Industry in the PRD and Hong Kong - Past and
Present. ................................................................................................................. 41
3.1 Economic and Logistics Development in the PRD ........................................ .41
3.2 Development of the Forwarding Industry in Hong Kong ............................... 43
3.2.1 Before the open-door policy .......................................................................... 44
3.2.2 After the open-door policy ........................................................................... .47
3.3 Business Environment for the Forwarding Industry ....................................... 51
3.4 Drivers of the Logistics Industry in China ...................................................... 52
3.4.1 Outsourcing ......................................................................... , .......................... 52
3.4.2 Globalization .................................................................................................. 54
3.4.3 Freeport .......................................................................................................... 57
3.5 Manufacturing in the PRD .............................................................................. 61
3.6 Logistics and Forwarding Support for the Manufacturers in the PRD ........... 62
3.6.1 Logistics Infrastructural Development in the PRD ........................................ 62
3.6.2 Joint Logistics Infrastructural Development between Hong Kong and the
PRD ......................................................................................................................... 62
3.7 Impact of Mainland Government on manufacturers operating in the PRD .... 65 IV

3.7.1 Relatively Stable Political Conditions ........................................................... 66
3.7.2 Government Policies ...................................................................................... 66
3.7.3 New Labour Laws .......................................................................................... 67
3.7.4 Corporate Tax Policy ...................................................................................... 69
3.7.5 Appreciation of the RMB ............................................................................... 70
3.8 Impact of the Hong Kong Government on Forwarding Services Providers ... 72
3.8.1 Hong Kong Airport ........................................................................................ 72
3.8.2 Port Governance in Hong Kong ..................................................................... 73
3.8.3 Hong Kong Logistics Development Council (LOGS COUNCIL) ................. 74
3.8.4 Creating a Pro Business Environment ........................................................... 75
3.9 Local Mainland Logistics and Forwarding Services Providers ...................... 78
3.10 Analogy from the Shipbuilding Industry ........................................................ 83
Chapter Four Regional Comparison ........................................................................ 91
4.1 Shanghai Logistics Industry ............................................................................ 91
4.2 Taiwan Logistics Industry ............................................................................... 95
4.3 Singapore Logistics Industry ........................................................................ 101
4.4 India Logistics Industry ................................................................................. 107
Chapter Five Research Method ................................................................................ 115
5.1 Research Philosophy ..................................................................................... 115
5.2 Research Design ............................................................................................ 117
5.2.1 First stage: exploratory interviews ............................................................... 121
5.2.2 Second stage: survey and statistical analysis ............................................... 122
Chapter Six Analysis and Results ........................................................................... 133
6.1 Qualitative analysis of interviews ................................................................. 133
6.2 Measurement validation ................................................................................ 143
6.3 Analysis of the surveys ................................................................................. 152
Chapter Seven Discussions of Key Results ............................................................. 175
7.1 Interpretation of the results with interviewees .............................................. 175
7. 2 Interpretation of the results of the surveys .................................................... 182
Chapter Eight Conclusion and Recommendations ............................................... 192
8.1 Conclusion .................................................................................................... 192
8.2 Contributions ................................................................................................ 194
8.3 Recommendations ......................................................................................... 197
8.4 Limitations and future research ..................................................................... 199
References ..................................................................................................................... 201
Appendix I
Appendix II
Semi -structure interview protocol ........................................................ 225
Questionnaires sent to Manufacturer .................................................... 227
Appendix III Questionnaires sent to Logistics Service Providers .............................. 233
v

LIST OF FIGURES
Figure 1.1 Land crossings between Hong Kong and Shenzhen .............................. 5
Figure 1.2 Train link: between Hong Kong and Shenzhen .................................... 6
Figure 1.3 The express train system .............................................................. 7
Figure 2.1 Supply chain management and logistics .......................................... 13
Figure 2.2 Hierarchy of the logistics industry ................................................. 15
Figure 2.3 Rise of freight forwarder share of international trade ........................... 21
Figure 2.4 ROCE by industry segment. ........................................................ 23
Figure 2.5 Relationships between 2PL, 3PL and 4PL. ...................................... .29
Figure 3.1 Air Cargo Throughput of Hong Kong ............................................ .48
Figure 3.2 Container throughputs in Hong Kong and Shenzhen ........................... .49
Figure 3.3 The Smile curve ...................................................................... 52
Figure 4.1 Ranking of container ports of the world .......................................... 112
Figure 5.1 The Research Cycle ................................................................. 117
Figure 5.2 Operational framework ............................................................. 119
Figure 5.3 Research design ..................................................................... 121
Figure 6.1 Profile of the respondents--- manufacturing Industry .......................... 154
Figure 6.2 Profile of the respondents--- manufacturing Number of employee .......... 155
Figure 6.3 Profile of the respondents--- manufacturing Ownership ....................... 156
Figure 6.4 Profile of the respondents--- manufacturing Annual sales turnover in
HK$ million in 2007 ............................................................................... 157
Figure 6.5 Profile of the respondents---logistics service provider's profile ............. 158
Figure 6.6 Profile of the respondents---logistics service provider's ownership ......... 159
Figure 6.7 Profile of the respondents--- logistics service provider's Annual sales in
HK$ million in 2007 ............................................................................. 160
Figure 6.8 Profile of the respondents--- logistics service provider's Locations of
Operations ......................................................................................... 161
VI

Figure 6.9 Profile of the respondents---Iogistics service provider's Locations of
Customers ......................................................................................... 162
Figure 6.10 Reasons to export through Hong Kong by air. ................................ 168
Figure 6.11 Reasons to import through Hong Kong by air. ................................ 170
Figure 6.12 Reasons for customers to export goods directly from Southern China to
Overseas by air. .................................................................................. 171
Figure 6.13 Reasons for customers to import goods directly from Southern China to
Overseas by air. .................................................................................. 172
Figure 6.14 Policies and actions that should be taken by Hong Kong government.. ... 173
VII

LIST OF TABLES
Table 1.1 China's GOP in 2008 ................................................................... 3
Table 1.2 Travelling time from Hong Kong to main cities by express train ................ 8
Table 2.1 An example of how IFFs achieve lower costs ..................................... 26
Table 3.1 Air Cargo Throughput of Hong Kong .............................................. .48
Table 3.2 Container throughput in Hong Kong and Shenzhen ............................. .49
Table 3.3 Labour Productivity in Shipbuilding ................................................ 85
Table 3.4 Percentage Shares of the World Export Market .................................... 86
Table 4.1 Container and Air Cargo Throughput of Shanghai ................................ 95
Table 4.2 Container throughputs of the port of Hong Kong and Singapore .............. 102
Table 4.3 Air cargo throughput of Hong Kong and Singapore in million kgs ........... 105
Table 6.1 SWOT analysis ....................................................................... 138
Table 6.2 Factor analysis of the logistics service provider's performance, Just-in-time
Supply chain, and legal system ................................................................. 146
Table 6.3 Factor analysis of the manufacturer service provider's integration, Hong Kong
and mainland customs satisfaction ............................................................ 148
Table 6.4 Factor analysis of the future direction, government policies and
Regulations ....................................................................................... 149
Table 6.5 Factor analysis of the logistics service provider's operating cost, Competition
and industry shifting ............................................................................. 150
Table 6.6 Reliability analysis of manufacturer's responses ................................. 152
Table 6.7 Reliability analysis of logistics service provider's responses .................. 152
Table 6.8 Profile of the respondents--- manufacturing Industry ........................... 153
Table 6.9 Profile of the respondents--- manufacturing Number of employee ............ 154
Table 6.10 Profile of the respondents--- manufacturing Ownership ...................... 155
Table 6.11 Profile of the respondents--- manufacturing Annual sales turnover in
HK$ million in 2007 ............................................................................. 156 VIII

Table 6.12 Profile of the respondents--- logistics service provider'S service
profile .............................................................................................. 157
Table 6.13 Profile of the respondents---Iogistics service provider's Ownership ........ 158
Table 6.14 Profile of the respondents--- logistics service provider's Annual sales in
HK$ million in 2007 .............................................................................. 159
Table 6.15 Profile of the respondents--- logistics service provider's Locations of
Operations ......................................................................................... 160
Table 6.16 Profile of the respondents--- logistics service provider's Locations of
Customers ......................................................................................... 161
Table 6.17 Mean, standard deviations and correlations--- manufacturing ................ 162
Table 6.18 The result of cluster analysis--- manufacturing ................................. 163
Table 6.19 The result ofANOVA--- manufacturing ......................................... 163
Table 6.20 Mean, standard deviations and correlations---Iogistics service provider....165
Table 6.21 The result of cluster analysis---logistics service provider. .................... 165
Table 6.22 The result of ANOVA ---logistics service provider ............................ 166
Table 6.23 The reasons to export through Hong Kong by air. ............................. 168
Table 6.24 The reasons to import through Hong Kong by air ............................. 169
Table 6.25 The reasons for customers to export goods directly from Southern China to
Overseas by air ................................................................................... 170
Table 6.26 The reasons for customers to import goods directly from Southern China to
Overseas by air. .................................................................................. 171
Table 6.27 Policies and actions should be taken by the Hong Kong government. ..... 173
IX

Chapter One Introduction
1.1 Background to the Research
Since the beginning of the 1960s, Hong Kong has become the manufacturing centre
of light industries, producing goods such as textiles and apparel, plastics, flowers, wigs,
and electronic and electrical goods. Hong Kong did not have any natural resources then;
raw materials had to be imported from China and neighbouring countries. Finished
products were shipped to the world's markets mainly by ocean-going vessels, and a
small part was shipped by air. To cope with the increasing importation of raw materials
and exportation of finished products, international freight forwarders (IFFS) emerged in
the market, initially by a couple of local companies. Later, several multinational
freight forwarders (FFs) from the US and Europe also branched to the emerging
market of Hong Kong.
Freight forwarding services flourished fWiher when China adopted an 'open door'
policy in 1978, enabling many Hong Kong manufacturers to shift their manufacturing
activities to China, particularly to the Pearl River Delta (PRD), with its advantages of
cheaper labour and land costs. There were 11 million workers (Mei, 2004) in the PRD
working for Hong Kong manufacturers. Due to insufficient logistics infrastructural
facilities in the PRD, most of the finished products were trucked back to Hong Kong to
be forwarded by ocean and air to the world's markets. From 1992 to 2004, with the
exception of 1998, Hong Kong led the world as the top container port. Presently, it is
the third largest in terms of total container throughput after Singapore and Shanghai
(Containerization International, 2008). Since 1998, Hong Kong has also led the world as
the top air cargo centre (Air Cargo Statistics, 2006).
However, there have been major infrastructurallogistics improvements both in the
ports and airports in the PRD in recent years. The participation of port operators, such
1

as Hong Kong International Terminal Ltd. (HIT) and Modern Terminal Ltd., have
helped narrow the service gap between Hong Kong and the PRD ports, both in terms of
port facilities and quality of service. Since the late 1990s, the PRD ports have enjoyed
double-digit growth (Zhang et aI., 2005). The Guangzhou Baiyun International Airport
in PRD started operations in 2003, and currently has an operating capacity of 4 million
tons per annum for air cargo (Xu and Zhang, 2007). Many reputable airlines, including
United Airlines, Japan Airlines, and Air France, have started servicing Guangzhou's
airport.
1.2 Justification for and Objectives of the Research
China is one of the major beneficiaries of globalised manufacturing. Numerous
manufacturing activities have shifted to China, taking advantage of its cheap land and
labour cost. As a result, there has been a strong demand for freight forwarding services,
particularl y from the export sector. Due to its close proximity to the PRD and the poor
logistics infrastructural facilities of PRD ports and airports, Hong Kong handles the
shipment by ocean and air of approximately 80% of PRD imports and exports (Fung et
aI., 2005). Since the 1990s, however, more and more ocean freight for export have
started shipping through Yantian and Shekou/Chiwan ports in the PRD. In contrast, the
Port of Hong Kong has only shown low, single-digit growth in the last 10 years (Hong
Kong Port Statistics, 2010). The port is expected to fall into the 4th place among the
largest container ports in the world in the near future, after Shanghai, Singapore, and
Shenzhen. Government officials and logistics service providers, particularly FFs, are
very concerned whether the rise of the PRD ports will continue to erode Hong Kong
POli's competitiveness. Clearly, there are challenges and 0ppOliunities for Hong Kong's
forwarding industry in the face of China's rise as the world's manufacturing
powerhouse and of the PRO's improved ports and airpoli facilities. as well as human
resources availability, for the forwarding industry. The over-arching purpose of this 2

study is to examine the challenges and opportunities faced by the forwarding sector of
the Hong Kong logistics industry.
There are more than 200,000 people or approximately 30% of Hong Kong's total
work force directly or indirectly engaged in the city's logistics industry (Yeung et al.,
2009). The catchment area of Hong Kong's logistics industry has been enlarged from
the the PRD to the Pan-PRO, with the blessing of China's central government. The
Pan-PRD consists of the provinces of Guangdong, Fujian, Jiangxi, Hunan, Guangxi,
Guizhou, Sichuan, Yunnan, and Hainan, plus the Hong Kong Special Administrative
Region (SAR) and Macau SAR. In 2008, the area contributed 35.4% in exports and
31 % in industrial output to the national total (Table 1.1).
Table 1.1 China's GOP in 2008
GDP (USD in BN) Export (USD in BN)
China $4,498 $1.429
PanPRD $1,298 $ 502
Guangdong Province $ 523 $ 404
Hong Kong $ 215 $ 302
Source: Hong Kong Trade Development Council
Approximately 70% of the cargo handled by Hong Kong's port and airport caters
to South China (Hong Kong Logistics Development Council, 2009). With rapid
economic growth and urban development in the last two decades, and with 6.8 million
people in Hong Kong and 19 million in the PRD region, their combined area can be
developed into a greater megalopolis (Yeh et ai., 2002). The region has been changing
very rapidly since 1978, with one year of development in the region approximately
equivalent to at least two to three years of development in most parts of the world.
Competitiveness is a key factor of success in the future global economy. However,
better cooperation, coordination, and planning between Hong Kong and other parts of
the PRD are needed in order to reduce unnecessary competition and duplication.
Furthermore, synergy needs to be developed in order to build a more competitive PRD
3

region for meeting challenges from competitors, as well as economic, social, and
environmental challenges, for the benefit all the people and businesses in the region
(Yeh et aI., 2002).
To achieve these goals, a number of obstacles need to be resolved. First, Hong
Kong cannot be considered as a separate entity, and should be included in China's
regional, social, and economic plans. Second, there needs to be greater and more
effective interaction between the Hong Kong government and local governments in the
PRD. Fortunately, there have been interactions between the Hong Kong government
and Guangdong provincial government, and between the Hong Kong government and
Shenzhen city government, have increased in recent years. One issue that has prevented
the closer integration of Hong Kong with the PRD is the significant difference in wages
and its effect on social and economic issues. However, with stagnating or decreasing
wages, particularly in the blue-collar sectors, in Hong Kong, coupled with the fast-rising
living standards in the PRD, the difficulties in the integration of Hong Kong into the
Greater PRD are bound to be reduced.
Hong Kong and Shenzhen share the world's largest land boundary, with 23,304
goods and passenger vehicles crossing the Hong KongiShenzhen border daily. To ease
the border crossing in this area, in addition to the land boundary crossings at Lok Ma
Chau, Man Kam To, Sha Tau Kok, and Shenzhen Bay Bridge, a fifth land boundary
crossing is currently being built at LiantanglHeung Yuet Wai, and is scheduled to be
operational by 2018 (Figure. 1.1).
4

Figure 1.1 Land crossings between Hong Kong and Shenzhen
After the completion of this new border crossing, immigration and customs
authorities on both side of the border can handle approximately one-third more than
their current capability. Hong Kong's business sector has urged the Hong Kong SAR
government to work with the Shenzhen government to introduce common checkpoints
for immigration and customs formality in order to speed up the transport of goods and
people.
Increased frequency ill direct train services to major cities ill the PRD would
facilitate closer integration of Hong Kong into the Greater PRO. The 'Coordinated
Development of the PRO Townships' launched in 2003 jointly formulated by the
Guangdong provincial government and the National Ministry of Construction and
endorsed by the Provincial People's Congress included signiticant attributes of Hong
Kong and Macao. Furthermore, the governments of the PRD plan to build a
transportation network by 2015. When these plans have been implemented, nine cities
in the PRD, with Guangzhou as the centre, will be linked by transportation network;
travel between Guangzhou and any of these cities will only take one hour. Thus, in
order to prevent marginalisation, Hong Kong has to connect with the PRD
transportation system. Apart from building the Hong Kong-Macau-Zhuhai Bridge,
expected to be operational by 2015, the Executive Council of Hong Kong SAR's
5

government approved on October 21,2009 the building of a high-speed railway, with a
budget of HK$ 65 billion. This railway will link Kowloon Station in Kowloon West to
Shenzhen and with Shibi Guangzhou; travel from Kowloon Station to Shenzhen will
take 14 minutes, travel to Shibi Guangzhou will take 42 minutes. The Secretary for
Transport and Housing of Hong Kong has claimed that the government does not plan to
make a profit from this line. The objective of the high-speed railway link is to link up
the 16,000 km national rail network of China, which serves as a very important step in
integrating Hong Kong into Greater China. The link can bring 116,400 passengers and
10% more Mainland visitors to Hong Kong (South China Morning Post, 2009).
Government officials expect that, initially, there will be a train to Shenzhen every 15
minutes and one to Guangzhou every 30 minutes, and this will be ultimately increased
to every 3 minutes during peak hours. Moreover, train frequency to Shenzhen could be
increased to 5-10 minutes interval during peak hours (Figure. 1.2). The Hong Kong
General Chamber of Commerce, quoting the Railway Authority of China, has stated
that the four horizontal and four vertical railway systems will be operational by 2012
(Figure. 1.3) .
.. """" Figure 1.2 The Train link between Hong Kong and Shenzhen
6

I
Figure 1.3 The express train system
When the Hong Kong-Shenzhen high-speed train becomes operational, travellers
from Hong Kong can reach important cities of the PRD in shorter periods (Table 1.2).
Passengers from 150 airports in China can take the high-speed train from Shenzhen's
airport to Hong Kong; from there, passengers can travel to 110 cities around the world
via Hong Kong's outbound flights. Similarly, passengers from 110 cities around the
world can reach 150 airports in China through the Hong Kong and Shenzhen airports.
7

Table 1.2 Travelling time from Hong Kong to main cities by express train
City Journey
Futian Shenzhen 14 minutes
Shekbai Guangzhou 42minutes
Sheungsha Hunan 4 hours
Fuzhou Fujian/Wuhan Hubei 5 hours
Shanghai 8 hours
Beijing 10 hours
Source: Hong Kong Government 2010
Apart from investing in the Hangzhou Xiaoshan International Airport and forming
a joint venture management company at the Zhuhai Sanzao International Airport, the
Airport Authority Hong Kong will also team up with the Shanghai Hongqiao
International Airport through a 49% stake in a joint venture with the Shanghai city
government. Hongqiao Airport, which has been operational for 88 years, is one of two
airports in Shanghai with a focus on domestic routes. Due to its proximity to the city,
Hongqiao Airport is very popular among passengers who wish to fly to/from Shanghai.
This is another important step to deepen the integration of Hong Kong with Mainland
China.
With considerable transport infrastructural developments, Hong Kong will be gradually
integrated into the GPRD, the PPRD, and with the major cities of China. Manufactured
goods from the provinces in the PPRD, as well as imported goods from abroad, can be
shipped through Hong Kong's port and airport with enhanced efficiency and reduced
logistics costs.
The focus of this research is to examine the challenges faced by and opportunities
available to the forwarding sector of Hong Kong's logistics industry. This research can
thus offer theoretical explanations behind the trend that show increasing outgoing ocean
freight from the PRD ports. Moreover, the research findings will identify the specific
challenges faced by the forwarding sector and shed light on new opportunities for the
8

Hong Kong forwarding sector. To be specific, this research is designed to, answer the
following questions:
1. Will the P RD continue to relv on Hong Kol1':(,\ logistics industrv? I(not. 11'l1v not?
2. Will PRD eXDorters continue to lise Hong Kon,?:\' airport and nort? J{not whv not?
The motivation for this study comes from the author's experience within the
industry in the PRD and Hong Kong for the past thirty five years. However, ad hoc
experience is not a sufficient basis for developing useful recommendations for the
industry's future. For this, we require sound research that is both theoretically valid and
evidence-based.
1.3 Structure of the Thesis
The current chapter introduces the rationale for and the objectives of the research.
In Chapter Two, different logistics services are defined. This chapter also critically
reviews the theories and models that explain the rise of the PRD as a manufacturing
powerhouse and the strong logistics demand for Hong Kong logistics service providers.
Chapter Three presents the development of Hong Kong's logistics industry,
including its past, present, and future trends. In particular, this chapter also traces the
historical development of the industry, its growth in terms of scale and diversification,
and its branching out to the PRD. Through an analysis of the industry's development in
Hong Kong, why the two key research questions need to be asked is made clear.
In Chapter Four, the author introduces the logistics industry development m
Shanghai, Taiwan, Singapore and India. By comparing the industry in these four areas
with Hong Kong's, the author otfers insights that can be applied to the Hong Kong
logistics industry.
Chapter Five explains the research design and the reasons for the choice of research
approach. The research methodology is discussed, and the choice for the combined
interview and survey methods is explained. The specific methods are then discussed in
9

detail, with an analysis of the effectiveness of the methods adopted in helping to answer
the research questions.
Chapters Six presents an analysis and the results of the data linking the analysis to
both the research questions and the literature review presented in Chapter Two.
In Chapter Seven, the key findings of the research are discussed and linked to the
historical development of the industry in Hong Kong, to the theoretical models
discussed in Chapter Two, and again to the two research questions. Particular focus is
given to future of the industry in Hong Kong in the context of the PRD and
globalisation. The contribution to knowledge from this research is discussed in detail.
Chapter Eight summarises and offers a number of recommendations based on the
conclusions of this research. The limitations of the research are then discussed, and
pointers to future research required are provided.
1.4 Contribution to Knowledge
The inspiration and key driver to undertake this research arose from the author's
attempt to examine the challenges facing and opportunities available to the Hong Kong
forwarding sector of the logistics industry. Significant changes appeared to have
occurred in a very short period: however, no systematic study of Hong Kong's logistics
industry could be sourced. This was the case for both industry and academic sources,
and continues to hold true, apart from the present research. This research is the first
such study to address the two research questions that, in one form or another, have been
posed over the years by industry players and the government. Hence, this study
represents the following specific contributions:
• The first ever detailed analysis of the views of manufacturers, logistics companies,
and governments on the industry
• The first ever detailed statistical analysis of the future implications for the industry
• An analysis of the extent to which current theory can help to explain logistics
10

developments in this part of the world
• An assessment of the limitations of current theory in the context of the PRD region
• The development of a more useful conceptual tool for understanding the industry in
the PRD region
• A critical analysis ofthe Hong Kong forwarding industry's future direction
These are further elaborated on in the concluding chapter of this thesis.
11

Chapter Two Theoretical Background
2.1 Definition of logistics
Logistics refers to the process of planning, implementing, and controlling the
forward and reverse flow and storage of goods, services, and related information from
point of origin to point of consumption while conforming to customer requirements
(Council of Supply Chain Management, 2005). Logistics activities can be broadly
divided into asset-based and non-asset-based logistics. The forwarding industry sector is
a subset of the logistics industry (Markides and Holweg, 2006).
Most logistics practitioners agree that logistics is a subset of supply chain
management (SCM). However, the distinction between supply chain management and
logistics literature is unclear. Mills et aI., (2004) agree that logistics literature essentially
presumes rational co-operation between buyers, suppliers, and service providers and on
this basis, strives to find optimal solutions for inventory, transportation, and information
flow.
In contrast, SCM also considers the behavioural and political dimensions of trust
and power, conflict, and dependence between suppliers and buyers. Lamey (1996)
argues that the field of logistics research focuses on minimising total cost, whereas
supply chain management is concerned with long-term profitability of serving
customers and customers' customers. By analysing developments in the logistics and
supply chain management literature, Hallorsson and Larson (2004) conclude that there
are four different perceptions on the relationship between supply chain management and
logistics (Figure 2.1):
12

Figure 2.1 Supply chain management and logistics
Source: Halldorsson and Larson, 2004
• Traditionalist - The traditionalist positions SCM within logistics and tends to view
SCM as 'logistics outside the firm'.
• Re-labelling - The re-Iabelling approach simply renames logistics; what logistics
before in the past is now considered supply chain management. 'Supply chain' and
'logistics network' are synonymous.
• Unionist - This perspective treats logistics as a part of SCM: SCM completely
subsumes logistics. Lambert (2001) suggests that supply chain management is the
management of eight key business processes: (1) customer relationship
management, (2) customer service management, (3) demand management, (4) order
fulfilment, (5) manufacturing flow management, (6) procurement, (7) product
development and commercialisation, and (8) returns. These processes subsume or
include majority of logistics, purchasing, marketing, and operations management.
• Intersectionist - The intersectionist approach considers supply chain management as
not a subset of logistics, but as a broad strategy that cuts across business processes,
both within the firm and through supply chain channels.
One of the key components of supply chain management is the manufacturing
process. Thus, supply chain management cannot be a subset of logistics activities. This
13

logic also applies to the view of the re-Iabelling approach. Supply chain management is
not a new name for logistics. Clearly, there are strong logistics components in supply
chain management. Logistics links a number of supply chain management functions by
its support of physical and information flow. The intersectionist view cannot offer
satisfactory answers on logistics activities if they are not considered part of supply chain
management. In this thesis, the author agrees that the unionist approach (see Lambert,
op. cit) is the most logical system for understanding logistics. This is because the
function of logistics (as defined above) is clearly part of suppl y chain management. This
is also empirically sound; for example, evidently, physical and information flows (the
core of the logistics function) link a number of supply chain management functions.
Hence, the unionist view of logistics as a key component of supply chain management
is the view adopted in this study. Moreover, the other 'views' listed above are only
partial in that they cannot conceptually (or empirically) represent the more
comprehensive picture provided by the unionist approach.
Figure 2.2 shows the hierarchy in the logistics industry presented in a pyramid
structure that reflects the flows of both goods and information, beginning with the
source of demand for logistics services: the manufacturer. The goods from the
manufacturer are then transmitted via different logistics service providers that offer
different types of services, all of which are required by the manufacturer. This hierarchy
is explained as follows.
14

4PL
3PL
orwardingiContract Logistic
2PL Asset-based logistics
IPL producer
Figure 2.2 Hierarchy of the logistics industry
At the base of the hierarchy is the producer, which is called the first-party logistics
service (lPL provider). The producer owns and operates the facilities. Under this
situation, the logistics service is in-house and in combination with manufacturing. From
a theoretical point of view, the IPL provider, who is also a manufacturer, can be placed
within the context of traditional location-specific advantage (LSA) theory. This is
because proximity to low-cost labour and other inputs is of primary concern to these
manufacturers. The latter is also true of 2PL providers because they enjoy the
consequent derived demand for their services from the manufacturers in the PRD.
However, the ideas to be found in transaction cost economics (TeE) and resource-based
value theory (RBV) are more applicable to the nature of operations of third-party
15

logistics service (3PL) providers and to a lesser extent, second-party logistics service
(2PL) providers. The 2PL provider refers to the transactional transport and warehouse
management (the second part of the pyramid). These service providers own the facilities
(airlines, shipping lines, trucking firms, and terminal operations). The manufacturers
and/or other logistics service providers [i.e., 3PL both freight forwarding and contract
logistics service providers] can outsource their logistics functions to the 2PL providers.
Together, the 2PL and 3PL providers represent the majority of firms in the logistics
industry in both the PRD and in Hong Kong, whereas the more complex service
"bundle· is represented further up in the pyramid of the logistics structure. The 3PL
providers include both those in the contract and forwarding logistics. Although 2PL and
3PL represent the largest components of the industry, they are in fact quite different
from a conceptual point of view. In the pyramid diagram in Figure 2.2, 3PL providers
can be located within the context of TCE because these providers enable manufacturers
to distribute their products at the lowest landed costs. In addition, 3PL providers can
also be located within the concepts of RBV because they have developed substitutable
competitive advantage through the creation of rare, inimitable, and non-substitutable
communication technologies. To a lesser extent, this is also true of 2PL providers
because they do not possess the communication technologies that are typical of 3PL
providers. This is why the RBV theory is mostly represented by the 3PL part of the
pyramid. However, the 2PL providers cannot be conceptually located within the theory
of transaction cost economics because they do not directly reduce the total landed costs
for the manufacturer. Placing the 3PL providers in the context of TCE and RBV in the
pyramid is not specific to Hong Kong or the PRD; it is rather a conceptual
development from the existing theory put forward in this thesis. This is explained
further in the concluding chapter of the thesis. The 4PL providers focus on the supply
chain integration management. The fifth-party logistics service (5PL) providers are in
16

the e-business area, and manage all parts of the supply chain integration. Since 1PL
does not include outsourced logistics functions to a service provider, the author only
covers 2PL, 3PL, 4PL, and 5PL in detail. The conceptual differences between each
'level' of provider and the value added to the manufacturer from each type of provider
are explained in detail in the following pages. Notably, over time, the structure of
production in the PRD will change toward higher value-added products; therefore, the
role of 3PL providers will become more cruciaL However, predicting what structural
changes the future will bring with any sensible accuracy is impossible. At this stage,
noting that these changes will certainly affect the logistics industry is sufficient.
However, the issue of the possible effects of these changes is very much an area for
further research beyond this thesis, and has therefore not been included here.
The conceptualisation of the logistics industry given in Fig. 2.2 enables a clearer
understanding of which parts of economic theory can be used to place the industry
within a more formal analytical framework. Current SCM theory simply does not
address the key elements provided by TCE, REV, or LSA theories. This refinement of
the simple conceptual structure of the industry is a key contribution to knowledge of
this thesis. This contribution is introduced early in the thesis to emphasise the important
role that these ideas play in the context of the data analysis, and will be discussed in
greater detail in Chapter Six.
2.1.1 Second-party logistics service (2PL) providers (Asset-based logistics industry)
Second-party logistics service providers, or asset-based logistics service providers,
invest heavily in fixed assets such as aircraft, ships, trucking fleets, and terminals.
• Airlines
The airline industry in Hong Kong started immediately after the Second World War
in 1946 when two Australian pilots established Cathay Pacific Airways. Cathay Pacific
Airways began with a DC-3 in 1946, and gradually modernised its fleet by replacing
17

them with newer units such as Catalina, DC-4, DC-6, Lockheed L-188 Electra, General
Dynamics Convair 880, Boeing 707-300, Lockheed L-1011 TriStar, Boeing 747, Airbus
A330, Boeing 777, and Airbus A340. Today, Cathay Pacific Airways operates a fleet of
100 modern aircraft. After 60 years of development, Hong Kong is now served by more
than 88 international airlines, offering 150 destinations with 5,400 flights per week. The
airlines include Dragon Air, Air Hong Kong (a pure cargo airline), Hong Kong Express,
Hong Kong Airlines, and CR Airways. More than half of the world's population is
within five hours flying distance from Hong Kong. Hong Kong Airport Authority is
committed to linking Hong Kong with more than 180 cities in the world by direct air
services.
• Shipping lines
Four hundred shipping lines operate in Hong Kong, offering services to five
hundred destinations. Out of these, many are Hong Kong-based. Two of the largest lines
are Worldwide Shipping and Oriental Overseas Container Lines.
• Shipping terminal and trucking operators
Second-party logistics services operators or asset-based operators include shipping
terminal operators offering terminal operations to shipping lines and/or trucking
operators that offer trucking services to FFs and contract logistics service providers. In
Hong Kong, the largest shipping terminal operators are HIT, Modern Terminals,
HIT-Cosco, and DP World (which have acquired interests in Sea Land Terminals).
• Air cargo terminal operators
Second-party logistics services providers also include air cargo terminal operators.
Before 1976, airline companies handled air cargo operations such as acceptance and
delivery of air cargo, palletisation, and loading and unloading aircrafts. The first air
cargo terminal operator, Hong Kong Air Cargo Terminals Ltd. (HACTL), was
franchised by the Hong Kong Government and started operations in 1976. Before Hong
18

Kong Airport was relocated to Chek Lap Kok in 1998, HACTL offered services to all
airline companies operating in Hong Kong. While operating at the old airport at Kai Tak,
HACTL had the exclusive rights to franchise operations and a 100% market share. After
the opening of the new airport at Chek Lap Kok, a second air cargo terminal operations
license was franchised by the Hong Kong Airport Authority to Asia Airfreight Terminals
Ltd. (AAT), a consortium led by Chiangi International Air Cargo Service (CIAS). AAT
now has approximately 20% market share and has reduced HACTL's market share to
approximately 80%.
Second-party logistics services providers offer space to manufacturers, traders, and
or LSPs for their transportation and warehousing needs. However, the space offered by
2PL is rather basic with less value added. The trend is for manufacturers and traders to
use LSPs that can offer complex service chains.
2.1.2 Third-party (3PL) services providers
Africk and Calkins (1994) refer to 3PL as 'a relationship between a shipper and a
third party which, compared with basic services, has more customised offerings,
encompasses a broader number of service functions and is characterised by a
longer-term, more mutually beneficial relationship'. Fung et aI., (2005) defined 3PL
service providers wherein 'a Third Party handles and integrates different logistics
functions, involving some management capacity of supply chain integration, e.g.,
freight forwarders'. Third-party logistics service providers are generally asset-light or
non-asset based. Third-party logistics services providers include contract logistics (CL)
service providers and FFs.
• Contract logistics (CL) service providers
Beginning 1980, a new class of non-asset-based services providers has emerged in
the market. The core activities of CL service providers include managing inventory for
third parties and offering other value-added activities such as pick-and-pack, assembly, 19

labelling, quality control, reconditioning, and reverse logistics.
• Freight forwarders (FFs)
The freight forwarder (FF) is one of two service providers under the banner of 3PL.
A person or company would normally contact a travel agent if they plan to travel and
FFs if they wish to send a shipment to another party. The companies who offer services
to senders or receivers by shipping goods from the place of origin to the place of
destination are called FFs. FFs are broadly divided into domestic freight forwarders and
international freight forwarders (IFFs). As Hong Kong has very little domestic freight
forwarding, most of the FFs are engaged in international freight forwarding (Yeung et
aI., 2009).
Shippers and consignees would not normally contact airlines or shipping lines to
ship their cargo because airlines and shipping lines normally only offer basic cargo
space from airports or ports of origin to airports or ports of destination. Under normal
circumstances, airlines and shipping lines would not offer ancillary services such as
collection and/or delivery of shipments, preparation of related documents for
transportation, and customs clearance. In contrast, IFFs offer one-stop service from
collection of the shipments, preparation of export documents, booking the required
space from airlines or shipping lines, to clearing the goods at destinations and delivering
to final consignees. MergerGlobal (2008) states that the global supply network has
changed considerably with trade liberalisation. Sourcing and manufacturing have been
progressively shifting from high labour cost markets such as the United States and
Western Europe to low labour cost markets such as China. The shift started 30 years ago
with low-value consumer products and is moving up the product value spectrum. As
sourcing patterns have shifted, manufacturers and retailers have increasingly relied on
FFs to be the network managers of their intercontinental supply chains. The reliance of
end users on forwarders has created a US$ 115 billion industry (MergerGlobal, 2008).
20

The customer base of a typical FF is comprised of large, medium, and small
manufacturers, as well as retailers. Services provided include transportation
(international and intercontinental destination delivery), customs brokerage, ongm
consolidation, destination deconsolidation, and warehouse CL services.
Most service types are priced on a transactional basis per shipment or on total
weight or volume. FFs are both competitors and customers of asset-based logistics
providers, container sea freight carriers, and airlines. They compete with asset-based
carriers for bigger shipments, and for purchase capacity from the same carriers or from
carriers who would entrust wholesale most, if not all, their space to FFs. In 2007, FFs
controlled an estimated 46% of combined air and containerised sea freight (Figure 2.3).
Figure,
Rise of freight forwarder share of intercontinental trade
1997 Total market: S96 billion
Air freightl'
570
FCLsea freight
S5
LCL sea freight
2007 (Estimated) Total market: $250 billion
$44
Air freight '
S187
FCLsea freigtlt
Carner • Forwarder
LCL sea freight
Revenue Sbillions Revenue Sbillions
11 Excludes express package market controlled by the Big -l global integrated carriers.
Figure 2.3 Rise of freight forwarder share of international trade
Source: MergeGlobal 2008
FFs dominate the airfreight sector with 85% revenue share of heavy freight
shipments. This estimate excludes the express small package sector where the big four
integrated carriers, namely, DHL, UPS, FedEx, and TNT, control 90% of this market
21

segment in terms of market share. Over the last ten years, forwarders have increased
their share of the airfreight market by 9% in terms of market share because airlines have
progressively reduced direct sales efforts to shippers and or consignees (MergerGlobal,
2008).
FF share of the sea freight market is lower at 34% revenue share of full container
load (FCL) shipments and 74% revenue share of less-than-full container load (LCL)
shipments. FF share of FCL has increased by 6% in terms of market share since 1997.
The high share of FFs in the LCL segment is because of their expertise in handling
smaller, complex transactions similar to airfreight. For the same reason, certain
integrated ocean carriers are targeting LCL flows as well. Forwarders are able to
generate attractive returns on capital employed by focusing on activities that require
professional skills, instead of physical assets. Figure 2.4 presents the historical returns
by industry segment, with the worst performing on the far left and the best performing
on the far right. FFs' return on capital employed (ROCE) is the highest among all
segments of the freight and logistics industry, reaching a peak of 64%, a trough of 53%,
and an average of 57% throughout the industry cycle (Figure. 2.4). These results reflect
the quality of forwarding services and their contribution in value creation for their
services.
22

Figure 2
segment:
70%
60% Average 51 Trough
SOu; • ----
.101;,'0
26
201~:,~
19
10% 12
O~{f.!
Scheduled Container Contract Freight air freight shipping logistics forwarding
Return on capital employed (ROCE) is defined as earnings before interest tax and amon!ization (EBITAI divided by capital olus net property. plant equipment.
Figure 2.4 ROCE by industry segment
Source: MergeGlobal Inc 2008
Scheduled airfreight airlines and container carriers have significantly lower average
ROCE and a high variability between peak: and trough returns. Their lower returns can
be explained by the need for significant investments in transportation assets and the
daily exposure to capacity utilisation risk. Although entry barriers exist, availability of
low-cost capital, often government-subsidised, allows new entrants to add physical
capacity more easily, even in poor industry conditions. Passenger-oriented airlines, often
subsidised by governments to increase capacity to support the tourism business, also
add physical capacity.
There are several structural factors in the forwarding industry. In addition, its
business model design allows forwarders to generate superior fmancial returns
compared to air and container carriers. These factors include the following:
• Control of the end-user, the party who eventually pays the bills, or the customers
• Ability to provide better supply chain information to customers
23

• Flexibility of services across modes and different carriers within each mode
• Ability to attract and retain high-calibre staff
• Better understanding of costs due to less complexity
However, contrary to conventional wisdom, there is also a level of fixed costs and
commitments that forwarders have to maintain, including the following:
• Information systems
• Physical facilities
• Minimum volume commitments, with alI and container carriers III front-haul
markets with tight supply
Forwarders are able to control the end-customers relationship because asset-based
air and container carriers have increasingly relied on forwarders' wholesale capacity
instead of by direct marketing to end customers, especially to medium- and small-sized
customers. These carriers provide additional capacity to fulfil long -term market share
objectives and are not constrained by quarterly earning expectation of shareholders.
Capital for asset-intensive transport activities is shifting to emerging markets,
particularly in the form of local companies investing in capacity for market share
growth. These carriers are not equipped to build the intellectual capital and customer
relationships that asset-based companies located in developed markets have established.
As a result, as market share shifts to these entities, forwarders take greater share of retail
control of end-customers.
Examples of this trend can be seen with Emirates Airlines in the airfreight sector
and China Shipping in the container sea freight sector. Emirates Airlines is building
substantial capacity in the Asia-Europe trade as part of the United Arab Emirates'
long-term vision to build Dubai as a global air logistics hub. Emirates Airlines has ten
747-8 and eight 777 freighters on order (http://www.emirates.com. 2008). Among
non-integrated airfreight carriers, Emirates Airlines is one of the largest freighter orders
24

on the books. China Shipping is a young, government-controlled container carner
founded in 1997. The company has embarked on an aggressive expansion strategy to
build up its position in the China market. To support its growth goal, China Shipping
continues to add container ship capacity, especially with eight 13,296 TEU vessels to be
delivered over the next five years, and will aggressively use FFs to fill its new ships
(http://www.cscl.com.cn. 2008). In both case cases, wholesaling of capacity to FFs is
their key sales strategy to fill their new capacity.
Globalisation is driving sustained growth in long-haul trade. As a percentage of
world growth of gross domestic product, the value of intercontinental trade has nearly
tripled from 5.2% in 1962 to slightly more than 15% in 2006 (MergerGlobal, 2008). The
trend is for long-haul trade to continue to rise. This trend directly benefits the FFs upon
whom most manufacturers and retailers rely to organise and supervise door-to-door
movement of goods. This unique positioning has allowed forwarders to not only
participate in the expansion of global freight flow, but also to control the most complex
and valuable activities of this flow.
One of the major contributions of IFFs is their role as service consolidation
provider to the business community and shipping public. Through consolidation
services, IFFs are in a position to offer rates that are more competitive to shippers
and/or consignees than the shippers and/or consignees can obtain from airlines and
shipping lines directly. Table 2.1 shows an example of how IFFs achieve lower costs
and are therefore in a position to offer lower air cargo rates to shippers and or
consignees.
25

Table 2.1 An example of how IFFs achieve lower costs
Actual Weight Volume Weight
Shipper A ships a 2,000 kilos 3,000 kilos
shipment of shirts with
Destination X at HK$20
per kilo
Shipper B ships a 2,000 kilos 1,000 kilos
shipment of watches with
Destination X at HK$20
per kilo
By consolidating 4,000 kilos 4,000 kilos
shipment A + B
IFFs pay airlines based on actual weight by kilogram or by volume weight of 6,000
cm3, whichever is higher. By consolidating Shipments A and B, IFFs pay for 4,000 kg at
HK$ 20 per kg, that is, HK$ 80,000 to airlines. On the other hand, they charge Shipper
A for a volume weight of 3,000 kg at HK$ 60,000 and Shipper B for an actual weight of
2,000 kg at HK$ 40,000. Through the consolidation process, IFFs manage to achieve a
cost of HK$ 16/kg, making a gross profit of HK$ 20,000. Due to the huge volumes of
shipments that IFFs handle, there are frequent opportunities for IFFs to mix and
combine volumetric shipments and dense shipments to achieve lower buying costs.
FFs have gradually evolved into the domain of contract logistics service providers
by offering simple value-added services such as sorting, labelling, and warehousing
services. Indeed the boundary between FFs and CLs service providers has become
increasingly blurred. A 3PL is regarded by the industry and the general public as more
up-to-date and fashionable. Many one-man truck drivers call their trucking businesses a
logistics company. On the other hand, FFs are regarded as outdated and lagging behind
in development. The irony is that the financial market offers a higher valuation to the
freight forwarding industry than the CL industry because the former is regarded as more
profitable. In the logistics arena, the Hong Kong forwarding industry has been leading
the world in air forwarding. In terms of total air cargo throughput, it has led the world
26

since 1998. In terms of total container throughput, Hong Kong has been in the top
leagues in ocean forwarding for many years, including several years in the top position.
A consensus definition does not seem to exist, even in academia. In the last few years,
many global FFs have started identifying themselves as forwarding logistics service
providers. In the logistics market in Western Europe, the terms 'freight forwarder' and
'forwarding logistics service provider' are used interchangeably. In Hong Kong, the
term 'freight forwarder' is commonly used. Unsurprisingly, the public, and even people
in the freight forwarding industry, do not realise that freight forwarding or the
forwarding logistics service is a subset of 3PL. The 3PLs, both CLs and FFs, cater to
numerous clients and enjoy tremendous economies of scale. They are in a position to
offer cost efficiency for their customers and attractive returns for their shareholders.
They playa very important role in supporting 2PL in terms of business. They take over
the role of logistics functions at lower costs for manufacturers, which can minimise or
make investments in the logistics areas unnecessary, enabling them to concentrate on
their core competence such as research and development, manufacturing processes, and
sales and marketing of their manufactured products. These characteristics are typical of
the underlying concepts identified under transaction cost economics and, to some extent,
under resource-based value theory. Currently, 3PL has developed into a strategic tool for
creating competitive advantage to manufacturers by offering cost-efficient and flexible
logistics services. Their services are widely used in the business community around the
world.
2.1.3 Fourth-party logistics (4PL) service providers
The term 'fourth-party logistics provider' (4PL service providers) is a trademarked
term owned by Anderson Consulting (Li et aI., 2008). The term refers to the evolution in
logistics of suppliers formerly focused on warehousing and transportation (third-party
27

logistics providers) into suppliers offering a more integrated serVlce. Among other
servIces, 4PL services include supply chain integration and solutions, change
management capabilities, and value-added services. Basically, 4PL companies are 3PL
providers that either have added these capabilities to their services or have formed
alliances to provide these services. Thus, a 4PL provider is a supply chain integrator that
assembles and manages the resources, capabilities, and technology of its own
organisation with those of complementary service providers to deliver a comprehensive
supply chain solution. The providers leverage the competencies of 3PL providers and
business process managers to deliver a supply chain solution through a centralised point
of contact. As the 4PL provider caters to multiple clients, the investment is spread
across clients, thereby taking advantage of economies of scale. The 4PL cycle includes
three phases of work: reinvention, transformation, and execution. In carrying out supply
chain integration, the 4PL service provider needs to innovate the provision of integrated
services, which means that they have to reinvent offerings that are customised to
individualised demands. The supply chain integration includes several parties (e.g.,
supplier, manufacturer, and customer); therefore, the reinvented service demands that
these parties transform their own systems and practices into a new centralised way that
they deem acceptable. After the transformation, how to execute the centralised supply
chain integration and solve emerging problems are very important considerations in
order to realise the potentials of 4PL supply chain integration. The 4PLs tend to focus
on selective major logistics services users who can achieve substantial cost savings by
the innovation and transformation of logistics services offered by 4PLs. However, 4PL
service is not yet well developed in Hong Kong and the PRD. Consequently, 4PL
service has less impact on the business community in these areas.
2.1.4 Fifth-party logistics (5PL) services providers
Fifth-party logistics service providers are e-business operators that manage all of
28
the supply chain. Thus, "5 PL service provider' is more of an academic term and is not
common! y used in Hong Kong.
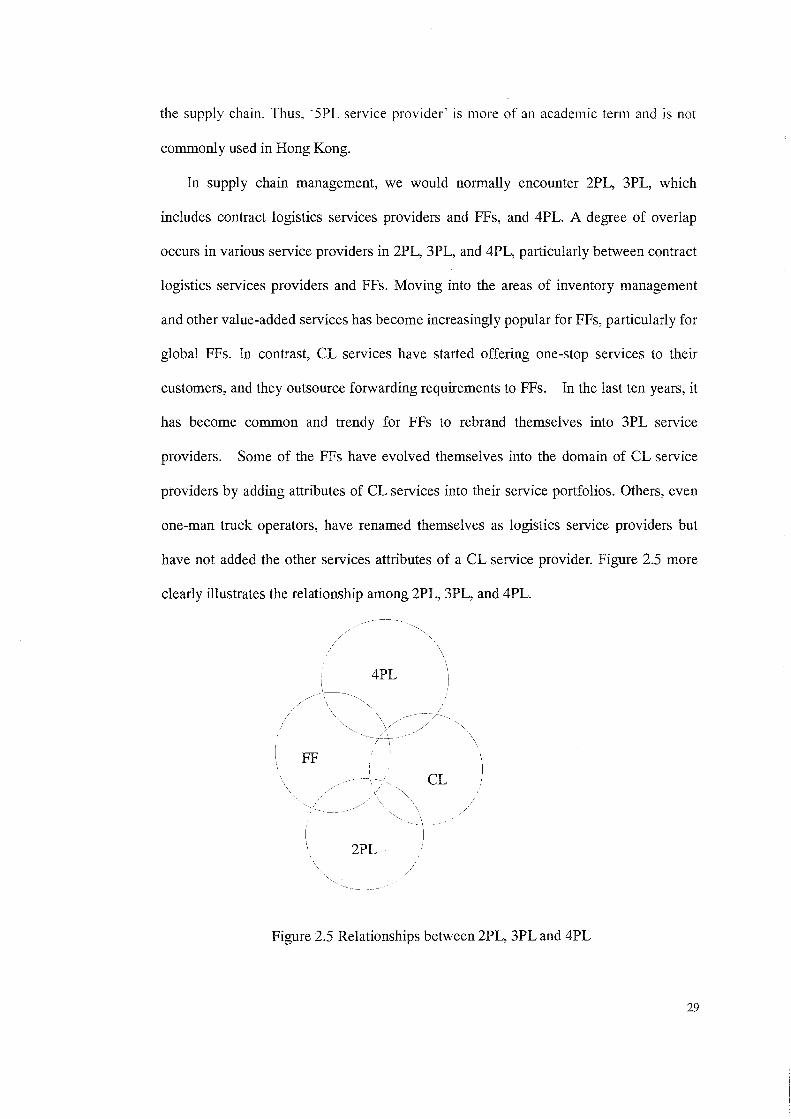
In supply chain management, we would normally encounter 2PL, 3PL, which
includes contract logistics services providers and FFs, and 4PL. A degree of overlap
occurs in various service providers in 2PL, 3PL, and 4PL, particularly between contract
logistics services providers and FFs. Moving into the areas of inventory management
and other value-added services has become increasingly popular for FFs, particularly for
global FFs. In contrast, CL services have started offering one-stop services to their
customers, and they outsource forwarding requirements to FFs. In the last ten years, it
has become common and trendy for FFs to rebrand themselves into 3PL service
providers. Some of the FFs have evolved themselves into the domain of CL service
providers by adding attributes of CL services into their service portfolios. Others, even
one-man truck operators, have renamed themselves as logistics service providers but
have not added the other services attributes of a CL service provider. Figure 2.5 more
clearly illustrates the relationship among 2PL, 3PL, and 4PL.
4PL
FF
CL
2PL
Figure 2.5 Relationships between 2PL, 3PL and 4PL
29

As we can see from Figure 2.5, there are overlapping areas between FFs and CLs.
However, 4PLs do not offer physical handling services. They outsource their
requirements to FFs and CLs. Although CL service providers, 4PL services providers,
and FFs are active in the supply chain, Hong Kong is strongest in its forwarding
capability in terms of air cargo throughput. Members of the Hong Kong Association of
Forwarding and Logistics Agents Ltd. (RAFFA), the most powerful trade association in
the Hong Kong logistics industry, handle more than 90% of air cargo and 50% of
ocean-going cargo out of Hong Kong"s airport and port. Members of HAFFA, including
small and medium enterprises (SMEs), have increasingly evolved themselves into the
CL domain. Many RAFFA members have rebranded themselves as logistics service
providers and indeed have incorporated CL services attributes (Lai et ai., 2004a).
2.2 Theories and Models
The 3PLs or more precisely, CLs, only emerged in the market in the 1980s. Since
then, many best practices have been created; however, no theories have been developed
that focus upon the forwarding and CL industries per se. The closest we can currently
obtain a better theoretical understanding of these issues is through economic theory.
Hence, the author has borrowed economic theories in an attempt to better understand the
nature of the industry and the related data collected in the pursuit of this research.
Literature search revealed three theories from economics, which separately contain
elements that significantly aid our understanding of the logistics industry. These were
briefly introduced earlier as an enhancement to the basic conceptual view of the
industry and presented in Figure 2.2. The salient elements of these (in terms of the
industry) are presented below.
2.2.1 Transaction cost economics (TCE)
TCE takes an economic perspective on how to minimise transaction costs.
30

Transaction costs are the costs associated with negotiations, implementation,
coordination, monitoring, adjustment, enforcement, and termination exchange
agreements, and include two major components: coordination cost and transaction risk
(Clemons et ai., 1993). Oliver Williamson1 has built on Coase's initial insight, using
theories from the disciplines of (1) contract law, (2) institutional economics, and (3)
organisational behaviour. Williamson's formulation of TCE suggests that three variables
are crucial to the decision: (1) the level of asset specificity associated with the
transaction, (2) the degree and type of uncertainty surrounding the transaction, and (3)
the frequency of the transaction (Williamson, 1975). One key assumption of TCE is
opportunism, which suggests that under the condition of information asymmetry, agents
in a relationship are likely to take unfair advantage of a bargaining situation. Another
important construct in TCE is asset specificity, which refers to the transferability of
assets that supports a given transaction, with high asset-specific investment representing
costs that have little value outside the exchange relationship (Grover and Malhotra,
2003). Uncertainty refers to the level of predictability associated with future events. If
there is significant uncertainty surrounding the transaction; TCE predicts that the buyer
will move to protect itself through stronger contractual arrangements. If asset specificity
and uncertainty are sufficiently high, the buyer may choose to perform the service itself.
Frequency refers to the number of times a transaction is executed. or the 'volume' of a
particular transaction. As frequency increases, fixed costs can be spread over more
transactions, lowering the fixed cost per transaction. TCE argues that the make-or-buy
decision of a firm is solely a function of asset specificity, uncertainty. and a firm's
risk-taking level. These elements are based on the premises that the cost of economic
exchange could be too high under certain conditions, and that the decision -making
environment is characterised by bounded rationality and opportunism. The above
1 Nobel Prize winner in Economics 2009 31

explanation of the key concepts under TCE fits very well with the advantages provided
by the 3PL companies (see Figure 2.2).
At present customers are increasingly interested in 'one-stop shopping' for logistics
services. A successful response to these customer demands is critical to the long-term
survival of carriers. Carriers face two important decisions: 1) additional services to offer;
and 2) how to supply the new services. Hanna and Maltz (1998) have investigated the
specific decision by Less-than-container load (LCL) carriers to expand into
warehousing. More specifically, TCE has been applied to logistics outsourcing in
general, and warehouse outsourcing III particular, with some success, and
transaction-specific assets play very important roles III vertical integration,
distributor-customer relationships, and co-marketing alliances. Relying on TCE,
Bienstock and Mentzer (1999) attempt to answer three questions:
1) Is the relative efficiency of outsourced transportation versus transportation by
private fleet affected by the type of carrier equipment required for the transportation
activities?
2) Is the relative efficiency of outsourced transportation versus transportation by
private fleet affected by operational uncertainty (e.g., delays among transportation
routes due to weather, road conditions, or labour unrest)?
3) Is the relative efficiency of outsourced transportation versus transportation by
private fleet affected by the volume of products that is transported?
The results of the analysis suggest that, when making transportation decisions, an
evaluation should be undertaken to determine the status of factors, such as volume of
shipments, degree of operational uncertainty, and availability and cost of requisite assets.
Managers should attempt to evaluate total production and transaction costs, and should
be accompanied by the realisation that certain factors (i.e., specific asset requirements
and uncertainty) could increase transaction costs when transportation tasks are
32

outsourced, rather than performed by a private fleet. However, the decision ultimately
depends on ascertaining the most efficient alternative when the total of production and
transaction costs is considered. Commonly, higher total land costs will result if a
logistics manager uses a less dependable mode of transportation on the logistics chain.
This is often due to the shipment being delayed by unpredictable customs inspection or
becoming delayed at transhipment points. This is a common mistake of the
less-knowledgeable manager of a logistics company who strives to generate more profit
for the company but who in fact incurs more costs for the company. In other words, the
transaction cost element in the chain rise because the expertise of 3PL companies has
not been used.
In a framework based on TCE, Gonzalez-Benito (2000) propose that the success of
logistics-related just-in-time (JIT) purchasing practices that fundamentally transform the
physical exchange process depends on the implementation of additional practices,
which transform the way of governing and controlling the relationships and which
support and rely on a climate of cooperation. Skjoett-Larsen (2000) has studied the
adoption of third-party logistics based on TCE and has found that this explains the
conditions under which third-party agreements become preferable to the classical choice
between the market and hierarchy. The author concluded that third-party logistics are
not merely a means to cost efficiency, but also as a strategic tool for creating
competitive advantage through increased service and flexibility. Halldorsson and
Skjott-Larsen (2006) have analysed the preparation, implementation, and operation of a
particular case of 3PL arrangements to understand further the inter-organisational
dynamics of dyadic relationships between a buyer and provider of logistics services.
According to their study, dyads are subject to both controllable and non-controllable
forces of change. Inter-organisational dynamics relate to how the dyadic relationships
are governed. As the dyad accumulates experience over time, changes will occur in the
33

balance between the two parties in terms of goal congruence and risk preferences.
Rabinovich et al., (2007) have studied the logistics services in outbound distribution
channels. A low level of asset specificity, for example, has caused one of the 2PL
logistics firms in Hong Kong to be less attractive to investors because its facility is used
to handle general air cargo that could easily be handled by a general warehouse with
much lower investment. In contrast, based on TeE, low levels of asset specificity and
uncertainty drive Internet commerce firms, for example, to establish relationships, while
logistics service providers make these services available across new and existing
relationships between Internet commerce firms, their customers, and their vendors.
2.2.2 Resource based view (REV)
RBV looks at economic units in terms of their resource endowments, which leads to
different immediate insights compared with the traditional product perspective, and the
diversified firms are seen in a new light (Wernerfelt, 1984). Firm resources including all
assets, capabilities, organisational processes, firm attributes, information, and
knowledge are controlled by a firm, enabling it to conceive of and implement strategies
that improve its efficiency and effectiveness (Daft, 1983). Thus, resources, capabilities,
and strategic assets are key concepts in the RBV. Resources are firm attributes that may
enable firms to conceive of and implement value-creating strategies. Firm resources can
be tangible or intangible, and they may have been developed inside the firm or acquired
in the market. Capabilities refer to a firm's capacity to deploy resources in order to
affect desired ends. Assets are stocks of available factors that are owned or controlled
by the firm. Assets can only be generated through a process of accumulation, consisting
of a path of 'flows' or investments over time and have the characteristic of being
'visible' resources. Barney (1991) notes that two assumptions are elemental to the RBV:
1) resources are distributed heterogeneously across firms, and 2) these productive
resource cannot be transferred from firm to firm without cost (i.e., resources are
34

'sticki)· Based on these, Barney (1991) also makes two fundamental arguments. First,
resources that are both rare (i.e., not widely held) and valuable (i.e., contribute to firm
efficiency or effectiveness) can produce competitive advantage. Second, when such
resources are also simultaneously not imitable (i.e., they cannot easily be replicated by
competitors), not substitutable (i.e., other resources cannot fulfil the same function), and
not transferable (i.e., they cannot be purchased in resource markets), these resources
may produce a competitive advantage that is long lived (sustainable). Thus, to gain
competitive advantages, one can identify types of resources that lead to high profits, a
balance between the exploitation of existing resources, and the development of new
ones. One can then purchase a bundle of resources in a highly imperfect market.
Therefore, RBV highlights the importance of key resources in achieving competitive
advantage. Such resources possess particular attributes that enable the provision of
value to customers (Barney, 1991), resist duplication by competitors, and whose value
can be appropriated by the organisation, leading to the attainment of supernormal
profits.
Logistics competence is becoming an important source of sustainable competitive
advantage for many companies (Skjoett-Larsen, 1999). This involves a complex
interaction of physical and human resources, including resources and capabilities
developed in relations with interacting companies. For example, logistics-related input
factors include raw factors (e.g., forklift trucks, warehouse racking, packaging materials,
and inventory) and raw skills (e.g., loading skills, driving skills, picking skills, and
computer-operating skills). Logistics-related assets are warehouses, plants, fleets,
railroad systems, satellite-based trucking communication technologies, and EDI
computerised networks. Logistics capabilities consist of the ability to work in teams, the
ability to manage supplier relationships, technological abilities, new product
development, service delivery, and order fulfillment. Drawing on the RBV of the firm,
35

Lai et aI., (2004a) have empirically investigated the existence of different types of
logistics service providers (LSPs), and whether the types differ in service performance.
Results suggest that there are four discernable types of LSPs, according to the service
capability displayed by each type, and that differences in service performance exist
between the types. Panayides (2004) suggests that both product-market and
resource-based strategies may account for variations in performance among LSPs.
Specifically, service differentiation, market segmentation, and inter-functional
coordination exert a positive impact on various measures of company performance,
unlike cost advantage, which does not seem to be a significant predictor of performance
in this context. Using a survey of 1,200 manufacturers in Taiwan, Shang and Sun (2004)
examine taxonomy in logistics management based on RBV and cluster analysis. Results
show that intensive a logistics competence cluster with excellent logistics competencies
in all four owners had better logistics, market, and financial performance. This
demonstrates that logistics competencies should leverage one another to create sustained
competitive advantages. Wu et aI., (2006) use data collected from a survey of supply
chain and logistics managers in various industries to demonstrate that IT-enabled supply
chain capabilities are firm-specific and hard to copy across organisations. These
capabilities can serve as a catalyst in transforming IT -related resources into having
higher value for a firm. Cheng and Yeh (2007) adopt the RBV of the firm to examine
the cause and effect relationships of internal dimensions, such as resources, capabilities,
and logistics services on sustainable competitive advantage (SCA) in the air-cargo
forwarding industry. Results indicate that capabilities are considered the most essential
internal dimension influencing the SCA of air-cargo forwarders. In terms of the
capabilities dimension, staff capability to provide better customer service is the critical
factor. In addition, strategy alliances are regarded as the essential source of external
assistance in achieving SCA. Markley and Davis (2007) outline the potential
36

competitive advantage that firms can create through the creation of a sustainable supply
chain and described the potential measures for managers to use. They argue that firms
can increase their competitive advantage as a result of a stronger triple bottom line, and
propositions are created from a natural RBV of firm. Relying on the RBV, Carter and
Rogers (2008) introduce the concept of sustainability to the logistics literature, which
they define as the integration of environmental, social, and economic criteria that allow
an organisation to achieve long-term economic viability. They place sustainability
within the broader rubric of sustainable supply chain management. Vaidyanathan and
Devaraj (2008) postulate that online information and process act as resources that result
in logistics fulfillment capabilities. These capabilities in turn lead to satisfactory
e-procurement. Using survey data collected from 131 purchasing and procurement
managers, the results indicate strong support for the relationships between information
flow process quality, logistics fulfillment quality processes, and e-procurement
satisfaction performance.
2.2.3 Location-Specific Advantages Theory (LSA)
Unsurprisingly, Hong Kong has accounted for three-fifths of China's foreign direct
investment (FDI) and fourth-fifths of outward investment to China since 1979, as China has
offered and is still offering location-specific advantages (LSAs) to Hong Kong investors.
Dunning (1981) suggests that multinational enterprises (MNEs) will invest in a foreign
location only if the latter offers certain LSAs in terms of resources and facilities that make it
possible for MNEs to explore their firm-specific ownership advantage. Root and Ahmed
(1979), Frey and Schneider (1986), as well as Dunning (1993), all suggest that market growth,
availability of materials suppliers, physical infrastructure, and efficient administration are the
most frequently cited LSAs in host countries. Given the very unevenly distributed pattern of
FD I in China's coastal provinces, this confirms that there are ample location advantages at
Guangdong Province or the PRD, which absorbs more than one-fourth of China's FD I. 37

Zhang (1994) points out that Guangdong Province has enjoyed three important LSAs
compared with the rest of China: geographical proximity to Hong Kong and Macao,
historical and ethnic connections with overseas Chinese, and experience in dealing with the
outside world. Luo (1998) also argues that foreign partners are mainly motivated by the lower
production costs in China, whereas political risk does not seem to be a concern. Using a liner
regression model and time series data, Wang and Swain (1997) have found that the size of the
host country market, the relatively lower costs of labour, and cost of capital play a very
important role in FD I inflow in China.
According to Zhang et aI., (2007), the members of the Hong Kong Federation of
Industries believe that the important determinants of FDI in China include low labour costs,
proximity to Hong Kong, and low land cost. In addition, Hong Kong's manufacturing
investments in Guangdong Province are concentrated in two cities: Shenzhen and Dongguan.
The distance between these two cities and Hong Kong is approximately 100 km by land. The
manufacturing labour costs in these two cities are only one-tenth to one-fifth and factory
rental only one-tenth to one-quarter of those in Hong Kong in the early 1990s (OECD, 1995).
Aside from Shenzhen and Dongguan, other Hong Kong manufacturers have chosen Huizhou,
Guangzhou, Zhongshan, Chaozhou, Zhuhai, and Foshan to set up their operations.
Although LSAs are available to all firms in a host country (Pinho, 2007; Dunning, 1998),
not every firm is able to maximise its return equally. Pinho (2007) hypothesised that LSAs
depend on the following four factors: 1) the expectation in market sales/growth potential; 2)
the perceived risk associated with the host country; 3) the operating costs associated with
performing marketing activities; and 4) the perceived low distance in terms of culture and
business practices within the host country. Mao and Chen (2001) argue that the elements of
LSAs, such as labour, energy source and raw materials, and the condition of communication
and transportation facilities, differ greatly from country to country. They attribute the size
of China's market. as given by the level of GDP, as the most important determinant of LSAs.
38

They also infer that cheap labour resources are another important location-based factor
determining FDI inflow. In addition, continued growth of China's economy is also an
important location-specific determinant of FDI.
In his dissertation, Deichmann (1999) cites a 'laundry list' of location factors by
Laulajainen and Stafford (1995) that have been identified from corporate behaviour over the
past several decades. The list includes factors dealing with friction of distance and those
measuring the attributes of areas. Friction of distance variables include proximity to markets
and materials and labour inputs. Site characteristics include labour characteristics,
infrastructure, governmental influences (subsidies, taxes, regulations, and risks) and quality
of life. According to Laulajainen and Stafford (1995) proximity to market is the priority for
retailers and other service providers, whereas manufacturers' considerations are more
complex, favouring labour availability and accessibility to inputs (Laulajainen and Stafford
1995).
Not all theories cited by the above scholars explain the rationale of Hong Kong investors
in favouring China and PRD in terms of LSAs. Hong Kong started with light manufacturing
industries in the 1950s; by the 1970s, it had become renowned as a manufacturing centre for
light industries. In the 1980s, Hong Kong's light industry manufacturing faced many
unfavourable political, social, and economic challenges, such as global trade restrictions,
rising protectionism, shortage of labour, and increasing land/labour costs. Many other
developing counties had definite cost advantages over Hong Kong, especially in the
high-volume, low valued-added items. At approximately the same time, China adopted its
economic reforms and open door policy. Since its economic reform, China has completely
reoriented its development policy toward growth by export-oriented light manufacturing
industries financed by foreign direct investment. Special Economic Zones (SEZ) were
developed in Southern China, which is adjacent to Hong Kong, to attract Hong Kong
investment. With China's limited capital and technical expel1ise, and the heavy investment
39

and technology transfer from Hong Kong, light industries in the PRD of Southern China were
established and prospered in the late 1980s. Most of Hong Kong's labour-intensive activities
have now been relocated to the PRD because the reform of China has provided good
opportunities for Hong Kong manufacturers to not only survive, but also even to grow and
expand.
To a large extent, TCE and RBV explain why exporters and manufacturers in the PRD
continue to LIse Hong Kong's logistics industry. LSA goes a significant way to explain both
the location decisions of Hong Kong-based manufacturers (who have moved to the PRD),
and their strong 2PL logistics needs (as explained in Fig. 2.2). As argued above, these three
economic theories now present us with a much clearer conceptual understanding of this
industry, and therefore can be of use in examining the challenges and opportunities faced by
Hong Kong's logistics industry within the PRO and Hong Kong itself. This, as explained, is
precisely the overall aim of this research.
40

Chapter Three
Present
The Logistics Industry in the PRD and Hong Kong - Past and
The purpose of this chapter is to set out the historical and present contexts of the
industry in both the PRD and Hong Kong. This enables a better understanding of the
development of the industry and allows us to put this development in the context of
globalisation, which has been a key factor in the industry for the past twenty years. In
addition, the chapter presents political and economic developments, which are centrally
relevant to the industry in both locations. These developments have been primarily the
initiatives of the PRC Government. As an aid to understanding to these contexts, the
author has also included in this chapter a very apt analogy of an industry that definitely
faced similar issues 40 years ago in the United Kingdom (i.e., the UK shipbuilding
industry.) This helps to shed light on some of the current issues of the PRD/Hong Kong
logistics industry while also enabling us to understand better the key differences
between the problems of 40 years ago and those currently faced by the PRD/Hong Kong
logistics industry.
3.1 Economic and Logistics Development in the PRD
Since the introduction of economic reforms and an open door policy by the 'strong
man' Deng Xiaoping in 1978, China has enjoyed very impressive and unprecedented
growth, with nearly 10% annual growth in GDP (Bergsten, 2008). China has emerged as
an economic powerhouse in the global trade, and is now the third economic power, after
the US and Japan, with an export value of more than US$ 1,218 billion. Merchandise
imports already reached US$ 955 billion in 2007 (National Bureau of Statistics of China,
2009). During the last three decades, China's rapid growth in foreign trade has been
accompanied by a large influx of foreign capital. With cheap production costs and huge
41
domestic market potential, China has attracted a maSSIve influx of FDI. FDI in
Mainland China increased dramatically in the 1980s and early 1990s. In the period
1985-1990, the amount of realised FDI inflows increased at an average rate of 30% per
annum (Zhang, 2006). The growth of FDI in China has been dominated by capital
originating from Hong Kong, which accounts for approximately three-fifths of the
nations' total FOI. Hong Kong has been China's largest external investor since 1979.
Approximately four-fifths of Hong Kong's outward FOI goes to China (World
Investment Report, 2006), whereas over a third of the outward FDI has flowed into
Guangdong Province, where a large part of the PRD lies.
By 2007, China had attracted a total of US$327 billion in FDI inflows (World
Investment Report, 2008). This high level of FDI inflows has transformed China into
the world's largest centre of manufacturing, not only in labour-intensive industries such
as footwear, clothing and textiles, but also in technology-intensive industries such as
electronics, computers, and telecommunication equipment. With its fast-growing
foreign trade and investment, China's economy has become much more integrated into
the world economy (Zhao et aI., 2006). In December 2001, after 15 years of
negotiations, China finally joined the World Trade Organization (WTO). Undoubtedly,
the country's GOP growth has benefited from its membership into the WTO (Lai and
Cheng, 2004; Fung et aI., 2005; Zhao et aI., 2006; Zhao et aI., 2007). China's accession
to the WTO has led to a switch in comparative advantage among various exporting
countries. Indeed, to a large extent China's exports have replaced similar exports from
other Asian and developing countries due to very low labour cost (the lowest in Asia
after Indonesia as of the last decade of the previous century) and efficient production.
Furthermore. trade diversion has strengthened China's labour-intensive exports because
operating costs in other developing countries such as Malaysia and Indonesia have
become comparatively higher (Tait and Li, 1997). However, with increased production
42

costs 111 coastal areas, China's cheap labour cost advantage of the early days has
graduall y diminished. Nevertheless, factor productivity continues to grow at a fast pace
due to technology transfer (Ma and Wang, 2001).
China's tremendous GDP growth, particularly 111 the manufacturing sectors,
requires raw materials to be brought to production centres and finished products to be
forwarded to world's markets, and thus offers tremendous opportunities for the logistics
sectors. Thus, China's logistics industry has also entered a stage of fast growth.
Tremendous opportunities exist, albeit together with intense competition, especially
since China entered the WTO in December 2001. Between 1992 and 2004, China's
logistics industry grew an average of 22.2%, and logistics expenditures accounted for
approximately 21.8% of GDP (Wang, 2006).
3.2 Development of the Forwarding Industry in Hong Kong
The forwarding industry supports international trade. Raw materials, components,
and semi-finished goods are imported by importers and manufacturers. Through the
manufacturing process, these same materials are converted into finished goods. These
finished products are then shipped to the world's markets to meet the demand of
consumers around the world. In the late 1950s and the beginning of 1960s, shippers of
raw materials and finished products in Hong Kong attempted to handle the shipping
procedures themselves. Later on, shippers discovered that they could outsource the
shipping process to an intermediary who would, in most cases, ship it more efficiently
and at less cost. Truckers initially performed the role of intermediary for shipping
services, delivering the goods to and from the ports. Later on, these truckers added more
attributes to their services, such as preparing documents for the shippers. Thus, the role
of the intermediary had changed, and from truckers, they became FFs, which now form
the backbone of the non-asset-based LSPs in Hong Kong.
43

3.2.1 Before the open-door policy
After the Second World War Hong Kong was a small village with approximately
600,000 inhabitants. To counter the US-led blockade immediately after the start of the
Korean War in 1951, China started sourcing essential war supplies such as
pharmaceuticals, rubber, and batteries through Hong Kong, which was transformed
from a small village into an entrepot. Many refugees, mostly Shanghaiese, had fled to
Hong Kong to escape communist rule in China. They brought their capital and skills to
Hong Kong, and started shipping lines and textiles businesses (Lu and Lu, 2002).
Hundreds of thousands of refugees were smuggled into Hong Kong following the
failures of the 'Great Leap Forward' plan introduced in China in 1958, which resulted in
the starvation of millions of Mainlanders. In the late 1950s and the beginning of the
sixties, refugees from China provided Hong Kong with an abundant supply of human
resources and capital for industrialisation (Lu and Lu, 2002). Through these refugees
and their capital, together with the relatively cheap land cost in Hong Kong,
entrepreneurs in Hong Kong quickly developed a number of low-end manufacturing
activities, producing goods such as plastic flowers, wigs, textiles, and lower-end
garments. In the beginning of the 1970s, Hong Kong started to manufacture electronics.
Famous manufacturers such as Fairchild and National Semiconductors had by then set
up their factories in Hong Kong.
Hong Kong is lacking in natural resources, and manufacturers at the time needed to
import raw materials such as plastic materials, rubber, cotton, and fabrics.
Manufacturers also needed to export their finished goods. Therefore, forwarding
services were needed for the importation of raw materials and exportation of finished
products. In the late 60s and early 70s, shipping lines did not work with forwarding
agents; rather, they worked with shippers and consignees directly. There was very little
room for forwarding companies engaged specifically in ocean transportation. Ocean 44

lines such as OCL, P & 0, ScanDutch, and Hapag Lloyd dominated the Far East-Europe
trade, whereas American President Lines dominated the trans-Pacific trade. Japanese
shipping lines such as NYK and MOSK had also emerged in the Hong Kong market. On
surface transportation, importers and exporters normally used shipping lines directly;
however, many of them also used truckers to receive and deliver their goods from and to
the shipping lines (Shen and Yeung, 2004).
In the meantime, airline companies, most of them members of the International Air
Transport Association (lATA), distributed their cargo space through their appointed
agents, who were also mostly lATA agents. With lower cost through consolidation
service and 5% sales commission from lATA airlines, lATA agents would be in a
position to offer cheaper rates to freight service users. British Overseas Airways
Corporation (BOAC), Air France, and Lufthansa dominated the European trade,
whereas Pan American Airways dominated the trans-Pacific trade. The first airfreight
agent emerged in the market when Charlie Lee set up Hecny Transportation Ltd. at the
Peninsula Hotel in 1951 and started offering airfreight services for unaccompanied
baggage and samples. At more or less at the same time, Flying Cargo Ltd. was
established by Roselle Henwood, an American woman. However, the demand for air
cargo space could not be met by the storage space of passenger airlines. During the
Korean War (1951-1953), to serve the Korean market, Hong Kong airfreight agents
seized the opportunity to introduce charter flights using the retired Second World War
plane C-46, which had 4 tons of capacity (Lu and Lu, 2002).
Two years after the establishment of Hecny Transportation Ltd. and Flying Cargo
Ltd., two more local companies in Hong Kong, namely, General Travel Services Ltd.
and Everett Air Cargo Ltd. established their airfreight operations. In the late 1950s and
in the beginning of 1960s, other international air forwarders such as Air Express
International Ltd. (sold in 2005 to Danzas, a wholly owned subsidiary company of
45

Deutsche Post), Airborne Express Ltd. (sold in 2008 to DHL, another wholly owned
subsidiary company of Deutsche Post), and Schenker, a subsidiary company of German
Railways, emerged in the Hong Kong forwarding market.
lATA air lines offered 5% sales commission to lATA agents. However, it was be
very difficult for IATA agents to survive on 5% commission. In 1958, lATA airlines
introduced a consolidation service, enabling lATA shipments bound for the same
destination to be consolidated. This practice of combining shipments optimally, as
described under IFF, enabled IATA agents to reach reduce costs. The introduction of
consolidation enhanced the profitability of the airfreight industry, and subsequently
attracted more entrepreneurs to join the industry. Airfreight forwarders such as Hecny
Transportation Ltd., Flying Cargo Ltd., and Air Express International Ltd. first made
their fortune from airfreight consolidation services introduced in late 1958 (Kwong,
1988).
From the late 1960s to the mid-1970s, the American government was sending its
military supplies to Vietnam during the Vietnam War. Pan American Airways (Pan Am)
B707 cargo flights were chartered, each carrying 40 tons of military supplies. On their
return flights, the airplanes were empty. Thus, airfreight forwarders, mainly Hecny
Transportation Ltd., chartered B707F cargo flights from Pan Am. Each flight initially
cost US$ 10,000 each; however, Hecny Transportation Ltd. could sell the space to retail
customers at 200% profit (Lu and Lu, 2002). In 1968, Hecny Transportation chartered
300 flights from Pan American Airways (Kwong, 1988). The huge profit margins on
these chartered operations further attracted local entrepreneurs and international FFs to
participate in the forwarding industry in Hong Kong. Under the protection of the quota
system, and with the growing electronics industries in Hong Kong, Hong Kong FFs
enjoyed a steady flow of outbound cargo destined mainly for the US and Western
Europe.
46
3.2.2 After the open-door policy
Deng Xiaoping, the late 'strong man of China' introduced a reform and open door
policy in 1978, releasing the potential productivity of 1.3 billion Chinese workers to the
world's market. The first group of people to take advantage of China's huge labour
force was Hong Kong's business sectors. They had gradually switched their
manufacturing process to the PRD since the early 1980s. According to location theory
(Dunning, 1993), capital flows from areas with high operating cost to areas with low
operating cost. With labour cost as low as US$ 1 per hour in China (compared to almost
US$ 30 in the United States in urban areas) and cheap land costs, China has benefited
from the globalisation of manufacturing. Apart from Hong Kong businesses, companies
from the US, Japan, Germany, Korea, Taiwan, and Singapore have also shifted their
manufacturing base to China in order to take full advantage of its cheap labour costs and
efficient production. The PRD is one of two major manufacturing bases in China and
the catchment area for the Hong Kong forwarding sector. Since the 1980s, Hong Kong
has become a very important air cargo centre and container port in the world. The
following tables demonstrate the importance of Hong Kong air cargo (Table 3.1 and
Figure. 3.1) and container throughputs (Table 3.2 and Figure. 3.2).
47

Table 3.1 Air Cargo Throughput of Hong Kong
Year In Million Kgs
1999 1,974
2000 2,241
2001 2,074
2002 2,479
2003 2,641
2004 3,094
2005 3,402
2006 3,580
2007 3,742
2008 3,627
Source: Civil Aviation Department 2009.
4,000
3,500 -------3,000
2,500 III tl.O ::.: c 2,000 ~ - aircargo
~ 1,500
1,000
500
0
1999 2000 2001 2002 2003 2004 2005 2006 2007 2008
Figure 3.1 Air Cargo Throughput of Hong Kong
Source: Civil Aviation Department (2009)
48

Table 3.2 Container throughput in Hong Kong and Shenzhen
Hong Kong Shenzhen
Period '000 TEUs Growth Rate '000 TEUs Growth Rate
1998 14,582 1.4% 1,952 69.8%
1999 16,211 11.2% 2,986 53 .0%
2000 18,098 11.6% 3,994 33.7%
2001 17,826 - 1.5% 5,079 27.2%
2002 19,144 7.4% 7,614 49.9%
2003 20,449 6.8% 10,61 5 39.3%
2004 21 ,984 7.5% 13,615 28 .2%
2005 22,602 2.8% 16,197 18.6%
2006 23,539 4.1% 18,469 14.0%
2007 23,998 2.0% 21,099 14.2%
2008 24,325 1.4% 21 ,400 1.5%
Source: Hong Kong port development council and Shenzhen port.
30,000
25,000
III 20,000 ::;) UI ~
"tl 15,000 c:
III - Hong Kong III :::l 0
..c: 10,000 ~
- Shenzhen
5,000
0
1998 1999 2000 2001 2002 2003 2004 2005 2006 2007 2008
Figure 3.2 Container throughput in Hong Kong and Shenzhen
Source: Hong Kong port development council and Shenzhen port (2009)
The forwarding industry in Hong Kong has grown and prospered from a small
number of players of less than 10 in the 1950s to its current 3,000 players, with
approximately 1,000 companies specialising in airfreight forwarding and approximately
2,000 companies specialising in ocean forwarding. The Association of Hong Kong
Airfreight Agents Ltd. (AHAFA), an airfreight trade organisation, was established in
49

1966 with eight founding corporate members: Hecny Transportation Ltd., Air Express
International, Flying Cargo Ltd., General Travel Services Ltd., Everett Air Cargo Ltd.,
Airborne Freight Corp., WTC Ltd, and Dietrich Ltd. AHAFA aims to set industry
standards, raise professional standards through training, recommend handling tariffs for
the members, and interface with government and other trade associations. Airfreight
forwarding agents are driven by market forces not only to provide airfreight services but
also to provide ocean freight forwarding services. The articles of association of AHAFA
was renamed as Hong Kong Association of Freight Forwarding and Logistics Ltd.
(HAFFA) in 1989 in order to accept new memberships from other FFs that were
primarily engaged in ocean freight forwarding services. The new members accepted into
AHAFA/HAFFA since the 1970s have included a number of prominent European
players, including Schenker Ltd., Kuhne and Nagel Ltd., ASG Ltd., Panalpina Ltd., and
Meadows Ltd. As of 2009, HAFFA has a membership of 360 companies, including
prominent local, European, and American corporate members in Hong Kong. It is the
only official voice of the forwarding industry practitioners.
Globalisation and outsourcing trends in the manufacturing sectors have offered
tremendous opportunities for the logistics and forwarding industries. Globalisation has
also accelerated the consolidation in the forwarding industry. In the last ten years, many
prominent logistics companies disappeared from the market due to mergers and
acquisitions (e.g., Associated Freight was acquired by Thyssen Haniel; Fritz Ltd was
acquired by UPS, ASG was acquired by Danzas; Air Express International Ltd was
acquired by Danzas, which was acquired by Deutsch Pos; DHL was acquired by
Deutsch Post; Wilson was acquired by TNT; Emery Airfreight was acquired by Meno;
Jardine Logistics was acquired by BALtrans Logistics; Meno was acquired by UPS;
Exel was acquired by Deutsch Post; Star Airfreight was acquired by Schenker; BAX
Global was acquired by Schenker; BALtrans Logistics was acquired by Toll; and
50

ABX Logistics was acquired by DSV ).
3.3 Business Environment for the Forwarding Industry
Despite a major consolidation in the forwarding industry taking place in other parts
of the world, the majority of freight forwarding companies in Hong Kong have been
doing well, thanks to the strong manufacturing activities in the PRD. Thus far, few
freight forwarding companies, including the small ones, have been driven out of the
market. However, the external environment has changed. The tremendous ocean freight
throughput growth in the PRO has come at the expense of Hong Kong's ocean freight
throughout growth because the PRD and Hong Kong share the same catchment area. On
the other hand, consolidation in the forwarding industry in North America and Europe
will inevitably affect FFs in Hong Kong that rely on the sales support of overseas agents,
whose number has been diminishing in the consolidation process.
Although Hong Kong has 27 berths altogether operated by HIT, Modern Terminals
Ltd, HIT, Cosco, and D Port Ltd., it lost its top container port status in 2005 to
Singapore, reflecting the threat and the dilution effect of the PRD ports. Indeed, the
growth of the container total throughput in Hong Kong has slowed down in recent years.
Arguably, achieving double-digit growth rates on a very large base is difficult for Hong
Kong. However, the PRD ports have experienced high, double-digit compounded
growth rates in recent years. Observers in the logistics industry predict that the PRD
ports will soon overtake Hong Kong as the third largest in the world after Shanghai and
Singapore.
Freight forwarding forms a very important role in the logistics industry, which in
turn plays a very important part in the value chain. The Smile Curve was first proposed
by Stan Shih, Chairman of Acer Computer Taiwan, to depict the importance of
distribution services in the value chain (Fig. 3.3). According to the smile curve theory
(J ason et al., 1999), the manufacturing part is the lowest in the division of value creation. 51

Research and development and branding on one hand, sales and marketing and logistics
on the other, play much more important parts in value creation. Logistics costs
accounted for as much as 18.1 % of China's GDP in 2008, compared with 8.2% GDP
share in the US and 9.3% GDP share average in the world (Research Center of Logistics,
NanKai University, 2009).
HIG~ER THE STAN SHIH SMILE CURVE
1
! LOWEll
CONCEPT/R&D SALESlAfTER SERVICE
DESIGN DISTRIBUTION
MAJlUFAClURING Under this model manufacturing
is the lowest value input
PRODUCTION CHAIN mLE -------+)
Figure 3.3 The Smile Curve
3.4 Drivers of the Logistics Industry in China
Since the 1990s, global trade has expanded significantly, and there appears to be a
consensus on the three most important drivers: outsourcing, globalisation, and freeport
development (Nolan and McFarlan, 1995; Earl, 1996). Undoubtedly, the same processes
have been major contributors in driving the growth of the logistics industry in China
and Hong Kong.
3.4.1 Outsourcing
Outsourcing, defmed as the 'turning over to a supplier those activities outside the
organisation's chosen core competencies' (Sharpe, 1997), has seen a clear increase in
the last few decades (Christopher, 1992; Rao and Young, 1994). There are many reasons
enterprises should outsource their products; however, the most compelling reasons are
'to stay competitive' while maintaining a world-class level of quality. To stay 52

competitive and maximise profit potentials, large companies position themselves to
adopt greater market discipline by reducing their product range and reducing their
vertical links in the production process (Grant, 1995; Domberger, 1998). The search for
greater efficiency in turn has led to increased specialisation. As such, outsourcing is
seen by certain authors as a manifestation of this trend (Domberger, 1998). Outsourcing
by original equipment manufacturers (OEMs) to contract manufacturers (CM) helps
OEMs manufacture products cheaper, faster, and in better quality. CM can take over all
aspects of production, from packaging to manufacturing, to actual design of products.
This enables OEMs to focus on sales, marketing, and business development. Contract
manufacturing thrives when high volumes of goods have to be made according to tight
deadlines, using standardised processes, to enable CM to leverage economies of scale to
produce each unit at a lower price than the OEM could. Outsourcing manufacturing to
China is critical to many American companies in order to maximise productivity.
Logistics is one of the particularly popular functions for outsourcing, with specialist
service providers taking over part or all of the material movement and storage (Walters,
2007). The use of 3PL has the benefits of lower fixed costs, expert services, combined
work to give economies of scale, flexible capacity, lower exposure to risk, increased
geographical coverage, and guaranteed service levels (Walters, 2007). Kakabadse and
Kakabadse (2002) summarise further achieved benefits of outsourcing such as shared
risk and benefits (Willcocks and Fitzgerald, 1994; Quinn, 1999), the reduction of transit
periods and transportation costs (Aichlmayr, 2002), greater capacity for flexibility
(especially in the purchase of rapidly developing new technologies, fashion goods, or
the myriad components of complex systems) (Carlson, 1989, Harrison, 1994), decreased
product/process design cycle time, and improved quality (Quinn and Hilmer, 1994).
After all, the greatest advantage of outsourcing is the full utilisation of external
suppliers' investments, innovations, and specialised professional capabilities that would
53

otherwise be prohibitively expensive for one enterprise to replicate (Kakabadse and
Kakabadse, 2000). As such, outsourcing decisions seem to be beyond considerations of
scale and costs and should be integral to an organisation's overall strategy formulation
(Quinn and Hilomer, 1994; Venkatraman, 1997; Di Romualdo and Gurbaxani, 1998,
Domberger, 1998; Quinn, 1999).
Outsourcing may create undesirable outcomes, such as the creation of additional
competitors. The classic example was the outsourcing by Ford for some gasoline
engines to Dodge Brothers, which became a division of Chrysler. By 1914, Dodge
Brothers was in head-to-head competition with Ford, following their forward integration
to produce entire automobiles (Welch and Nayak, 1992).
3.4.2 Globalisation
The increase in outsourcing activities and the opening up of global markets have
contributed to supply networks becoming more globalised (Harland et al., 2003). This is
mainly attributed to trans-national mobility of capital, information, people, products,
and services, leading to 'global entanglements' (Fombrun and Wally, 1992). Strategic
intent, global brands, economies of scale and scope, management of the value chain,
comparative advantage, market access, the growth of free trade, and improved
communication by information technologies (most recently e-business), improved
logistics services, and convergence of market demands have all been cited by various
authors as additional contributory reasons for globalisation (Harland, 1995; Walters,
2007). According to Meixell and Gargeya (2005), international sourcing has, in recent
years, been mainly sought out by managers because of reduced costs, increased
revenues, and improved reliability. Manufacturers typically set up overseas factories to
benefit from tariff and trade concessions, low labour cost, capital subsidies, and reduced
logistics costs in foreign markets (Ferdows, 1997). Further benefits are achieved from
access to overseas markets, organisational learning through close proximity to
54

customers, and improved reliability because of close proximity to suppliers
(MacCormack et aI., 1994).
The new international economic order is the subject of research and discussions in
recent years, as referred to by Bhagwati (2004), Bhalla and Bhalla (1997), Dicken
(1998), and Sachs (1998). Apart from the split of the Soviet Union and the rise of China,
another main force shaping the world is globalisation. Many researchers have shown
that the world is no longer a collection of relatively autonomous countries only
marginally connected by trade and generally immune to events in other parts of the
world. Globalisation has significant implications for the manufacturing activities m
China, particularly in the PRD, which presents tremendous logistics demands.
Globalisation can be defined in several different ways, depending on the level of
focus. At a worldwide level, the attributes of economic globalisation are related mainly
with the growing economic interdependence among countries, reflected in increasing
cross border flows of goods, capital, and knowledge. According to Lubbers (1995)
'globalisation is a process in which geographic distance becomes less a factor in the
establishment and sustenance of border crossing, long distance economic, political, and
socio cultural relations·. The growth of international trade is one of the most apparent
aspects of globalisation. According to a study undertaken by the Federal Reserve Bank
of Atlanta (Becsi and Wang, 1997), over the last quarter of a century, imports from
high-income nations grew by 39%, imports from low and middle-income regions
increased by 61%, and the overall market shares of many developing countries have
grown faster than those of advanced economics. The reductions in barriers to
international trade have opened the door for export-led growth. Deregulation in the
aviation industry introduced by President Reagan at the beginning of the 1980s and the
evolution of the Internet have significantly reduced the transportation and
communication costs, which have certainly played a major role in the growth of
55

international trade.
Chong (2007) states that trade is one of the four important features of globalisation.
Another important feature of globalisation is capital movement, which travel around the
world in the pursuit of profit. In the tide of increasing liberalisation of world trade in
goods and services, increased international trades and capital movement cannot be
achieved without a greater determination to reduce and eventually eliminate tariff and
non tariff barriers. The establishment of the WTO at the conclusion of the Uruguay
Round negotiations in 1995 marked a significant development profoundly influencing
the globalisation process.
A new global division of labour has changed the pattern of geographical
specialisation among countries. International trade and capital flows are among the most
important channels of global integration. The movement of goods and services across
borders has grown tremendously, accounting for over 45% of world GDP in 1990, up
from 25% in 1970 (prokopenko, 1998). This is evident in the deliberate policy change
in most developing countries; developing countries are integrating into the world
markets. Globalisation gives developing countries an unprecedented opportunity to
catch up with the more advanced countries. Sachs (1996) notes that openness alone
cannot constitute an engine of growth. Evidence suggests that, by far, the most
important area of government action is the adoption of an open trade policy. If China
had not adopted an open door policy in 1978, China could not have benefitted from
this unprecedented opportunity. China's low land and labour costs, particularly in the
early stage of adopting open-door and reform policies, attracted massive influx of FDIs,
most of which were concentrated in manufacturing sectors. However, global companies
constantly shift their industry operations in pursuit of more profit, and the opening up of
China in the late 1970s and beginning of the 1980s offered irresistible opportunities for
their investments. China' s export-led trade and manufacturing activities depend on an
56

efficient logistics industry to bring in the raw materials and semi finished components
and to deliver the finished products to the world markets.
3.4.3 Freeport
Strategic Access Ltd., the consultant commissioned by Hong Kong Logistics
Development Council and Hong Kong Trade Development Council in November 2007,
pointed out in its report that there was a kernel of confidence based on distinctive
competitive advantages inspired by Hong Kong's unique 'freeport' status, abiding
competitive strength in air cargo activity, and ongoing strength of the Pearl River Delta
economy. Hong Kong's 'freeport' status also supports the views of optimistic industry
players to develop Hong Kong as a significant regional distribution centre. As a
regional distribution centre, goods bound for Hong Kong and China can be stored in
Hong Kong's logistics facilities. As a freeport, no duties (with the exception of a few
items such as tobacco and automobiles) are to be paid when goods are brought into
Hong Kong. When the goods are required by consumers in China, goods are imported
into China, and the importing company pays the required import duties. Other goods
are bought by millions of tourists from China who visit Hong Kong every year. When
Mainland Chinese tourists return to China together with their purchases, they do not
normally pay duties. Hong Kong's role as a regional distribution centre was inherited
from its Freeport status, established by the British togetheer with Aden and Singapore in
the 19th century.
A freeport is a complex and difficult concept to define (Schulze, 1997). Due to its
widespread usage over a long period, the term freeport tends to have a slightly different
meanings and significance from country to country. Various discussions have been
made on the advantages and disadvantages of customs-free territories since the
establishment of freeports and free trade zones in Northwest Europe, specifically in
Germany and Scandinavia, toward the end of the 19th century. The discussions peaked
57

in the 1930s when a number of new free trade zones were established in the US
(Kaufmann, 1995). Freeports are important components of the general transportation
system sector and are linked to the expanding world economy because they represent a
means of integration into the global economic system. The concept of a freeport dates
back at least to the Roman Empire (Cornell, 1989). There was a need then for
transhipment of goods from non-local traders, and freedom from mistreatment was the
most pressing issue. The freeport concept has been developed and used extensively by
leading European countries in the commercial fields in the past centuries.
Cornell (1989) argues that the first known freeports were the special stockades in
the Greek port of Challis and Piracus. Chong (2007) cites that the oldest freeport
established expressly to promote trade was the Roman freeport on the Aegean island of
Delos. This freeport acted as a customs-free centre for the promotion of trade between
Egypt, Greece, North Africa, Asia, and Rome. Later on, Genoa, Venice, and Gibraltar
followed suit. Da Ponte (1997) asserts that the historic cities that adopted the freeport
strategy to promote trade were mindful of the negative consequences of excessive tax
imposed on trade and the importance of a cost-effective business environment. In the
last four centuries, the primary focus of seaborne shipping completed its shift from the
Mediterranean to the Baltic, and subsequently to the North Sea and its adjacent
waters. Shipping routes in Northwest Europe are still the most active today, serving
important ports such as Hamburg, Bremen, and Copenhagen. The true forerunner of the
free trade zone was the Freeport of Hamburg, which was established as early as 1888
(Chong 2007). Since the 15th century, the German ports of Hamburg, Bremen, and
Luebeck have undergone transition from the tight commercial restrictions of the
Hanseatic League to independently functioning, commercially competitive city-states
that were essentially free from import and export duties. By 1835, all three cities had
reached this status. Goss (1990) explains that, shortly after this period, these cities were
58

forced into a customs union in 1888. Hamburg agreed to reduce the entire custom-free
area of the city-state to an isolated, fenced-in zone in the harbour. This zone termed a
freeport did not fall under the customs jurisdiction of the customs union, it enjoyed
unrestricted freedom of impOlt, export transit, warehousing. and ships' provisions of
supplies. Freeports were granted the special privilege of manufacturing within this area.
Goods imported from any country in the world could be brought in without the usual
customs formalities and could be stored for an unlimited time in the free trade zone or
freeport.
In 1979, the PRD initiated a new international economIC policy under which it
established four special economic zones (SEZs) in Shenzhen, Zuhai, and Shantou in
Guangdong Province and Xiamen in Fujian Province. The zones are designed to provide
foreign enterprises with lower taxes, reduced tariffs, more modern infrastructure,
flexible labour and wage policies, and less bureaucracy (Crane 1990). By the mid-1980s,
the basis for a comprehensive legal structure had been laid out for the Shenzhen SEZ. In
the SEZs, industrial and commercial tax exemptions were applied to imported
equipment and machinery, raw materials, components and parts, and transportation
equipment used for production. For items under state control, such as motor vehicles
and consumer durables, the rates were reduced 50% of the standard rates for the SEZs.
Industrial and commercial consolidated taxes were waived if the goods produced in the
SEZs were either sold within the zones or were exported. However, the duty-free
preferential treatment did not apply when goods that were either produced in the SEZs
or imported from abroad were shipped to the rest of the domestic market (Ge, 1999).
Thus, the benefit and convenience offered by the SEZs cannot be compared with those
of the freeport. Consumer products particularly luxury items would not be imported to
the SEZs duty-free. which would be the case when they are imported into a 'freeport'
such as Hong Kong.
59
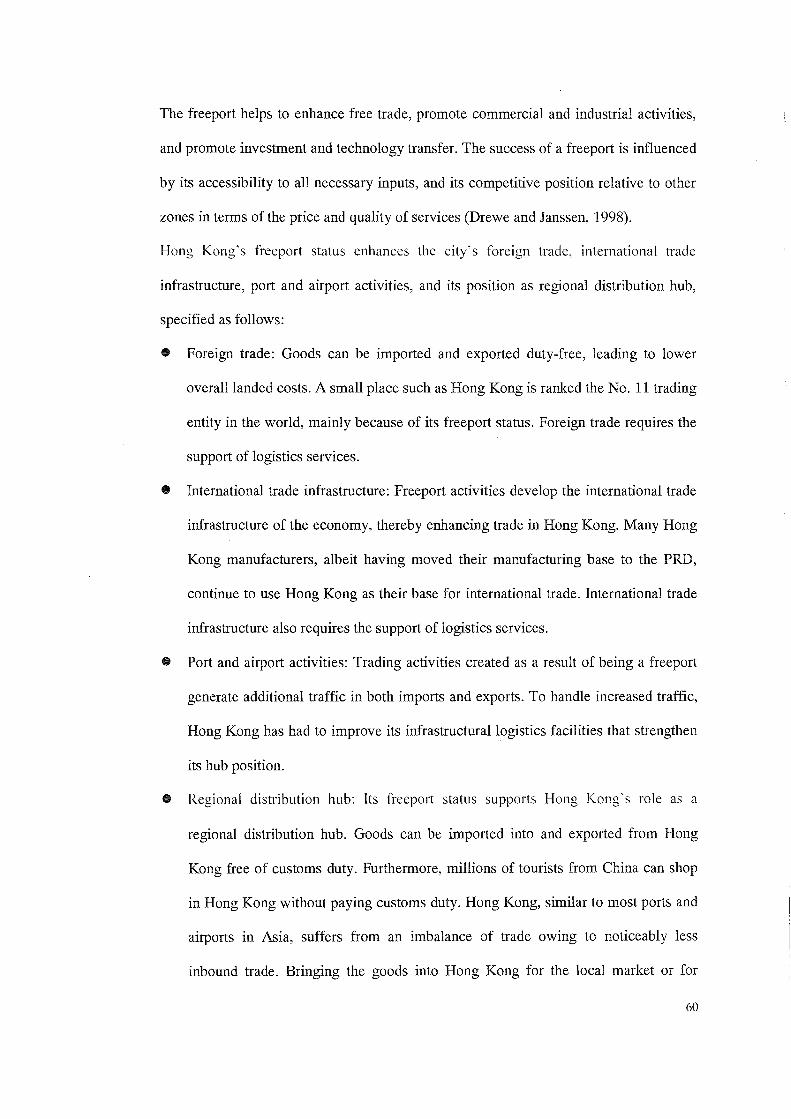
The freeport helps to enhance free trade, promote commercial and industrial activities,
and promote investment and technology transfer. The success of a freeport is influenced
by its accessibility to all necessary inputs, and its competitive position relative to other
zones in terms of the price and quality of services (Drewe and Janssen, 1998).
Hong Kong's freeport status enhances the city's foreign trade, international trade
infrastructure, port and airport activities, and its position as regional distribution hub,
specified as follows:
• Foreign trade: Goods can be imported and exported duty-free, leading to lower
overall landed costs. A small place such as Hong Kong is ranked the No. 11 trading
entity in the world, mainly because of its freeport status. Foreign trade requires the
support of logistics services.
• International trade infrastructure: Freeport activities develop the international trade
infrastructure of the economy, thereby enhancing trade in Hong Kong. Many Hong
Kong manufacturers, albeit having moved their manufacturing base to the PRD,
continue to use Hong Kong as their base for international trade. International trade
infrastructure also requires the support of logistics services.
• Port and airport activities: Trading activities created as a result of being a freeport
generate additional traffic in both imports and exports. To handle increased traffic,
Hong Kong has had to improve its infrastructurallogistics facilities that strengthen
its hub position.
• Regional distribution hub: Its freeport status supports Hong Kong's role as a
regional distribution hub. Goods can be imported into and exported from Hong
Kong free of customs duty. Furthermore, millions of tourists from China can shop
in Hong Kong without paying customs duty. Hong Kong, similar to most ports and
airports in Asia, suffers from an imbalance of trade owing to noticeably less
inbound trade. Bringing the goods into Hong Kong for the local market or for
60

re-export will fill the much-needed inbound trade. After discharging inbound goods,
the much needed empty containers can be used for the outbound trade.
3.5 Manufacturing in the PRD
Not only the Hong Kong investors have relocated their labour-intensive industries
to the PRD but the foreign investors including Fortune 500 companies have also
followed suit. This growth, low labour costs, and a fast-developing domestic market
(Chan et aI., 1997) have all led to significant foreign investments in China.
Consequently, more than a hundred Fortune 500 companies have operations in China,
and many other businesses have made similar investments (Luo, 1996). Low-cost
manufacturing and the vast domestic market potential have attracted many MNCs to
come. The country's accession into the WTO came with even greater market access. In
addition, with a burgeoning middle class, more Chinese now have greater purchasing
power both for local and imported goods (Einhorn, 2001). Indeed, China has overtaken
the US as the most attractive location for FDIs (Kearney, 2002). By 1995, more than 14
million Chinese were employed in enterprises created or supported by foreign
investments (Yu, 1996), and many of these enterprises were international joint ventures
in the manufacturing sector (Schroath et aI., 1993).
The PRD is now one of the most important manufacturing powerhouses in the
world (Zhao et aI., 2006). Hong Kong's airport and Guangzhou's airport on the air cargo
front and Hong Kong's port and Shenzhen ports, including Shekow. Yantian.
Guangzhou and Chiwan on the ocean front, share the same catchment area in PRD. To a
lesser extent, manufactured goods from Fujian Province and the provinces adjacent to
the PRD also use the airports and ports in the PRD. On the other hand, manufactured
goods in Shanghai and its neighbouring areas, such as Ningbo, Hangzhou, Suzhou, and
other satellite cities normally use Shanghai's airports for air cargo shipments, and
Shanghai and Ningbo ports for ocean shipments. Due to its proximity to the PRD, both
61

asset-based and non-asset-based Hong Kong logistics sectors have enjoyed tremendous
growth.
3.6 Logistics and Forwarding Support for the Manufacturers in the PRD
3.6.1 Logistics Infrastructural Development in the PRD
The Baiyun International Airport in Guangzhou, which became operational with
three runways in 2003, caters to domestic, as well as international traffic. This airport,
which is linked with 90 airports outside China, will be in head-to-head competition with
the Hong Kong International Airport (HKIA). The Baiyun international airport will
inevitably dilute Hong Kong's air cargo traffic. Air Southern, the Guangzhou-based
airline and one of the three major international aiilines in China, is an influential airline
based at Baiyun Airport.
The Shenzhen Bao'an International Airport, which commenced operations in the
1990s. focuses on domestic passenger traffic and does not dilute Hong Kong's total air
cargo throughput. Discussions on areas of cooperation between the airports of Hong
Kong and Shenzhen are underway (Yeung et aI., 2009).
Modern port facilities at Shekow, Yantian and Chiwan ports (Tam, 2004; Sit, 2003)
were jointly developed and are jointly managed by Hong Kong ocean terminal operators
who have enhanced the operational efficiency of the PRD ports. Given the lower port
handling charges and freight rates than Hong Kong, these facilities now attract more
cargo shipping out from the PRD, so as to dilute Hong Kong's total ocean throughput.
3.6.2 Joint Logistics Infrastructural Development between Hong Kong and the PRD
Since 2000, HACTL has implemented the SuperLink China Direct service,
enabling cargo flown into Hong Kong to be transhipped into Mainland China by land.
SuperLink China Direct allows both import and export customs clearance and
inspection to be done at a dedicated facility at HKIA. A flight number is assigned after
62

the cargo is loaded onto a truck, and a physical seal is placed on the truck by Hong
Kong Customs. The improvements are mainly on the Hong Kong side: advance notice is
no longer required, and any needed cargo inspection is done at the airport. Very little is
done on the Mainland China side. Trucks are still required to queue up at the
Huanggang border. Passing through customs usually takes an hour. If the final
destination of the cargo is not in Shenzhen, and if port transfer has been previously
approved, only a paper manifest is submitted to Huanggang customs for data-collection
purposes. The truck is then bonded and permitted to continue to its destination, where
import customs clearance and inspection are performed.
The airport express lane is an improvement over SuperLink China Direct and has
been in service since May 2007. The express lane connects HKIA and the Shenzhen
Bao'an International Airport. Currently, three freight forwarding companies appointed
by three airport terminal operators (i.e., HACTL, Asia Airfreight Terminal Company
(AAT), and Shenzhen Terminal) provide services for the express lane. The import and
export procedures are the same as those for SuperLink Direct. A traditional seal is still
needed. Forwarding companies are required to submit pre-declaration information to
Shenzhen's airport customs office. Neither HACTL nor AAT have access to China's
H2000 clearance system; thus, they have to submit digital truck manifests through their
counterparts in Shenzhen. The cargo truck leaves HKIA once confirmation is received.
Substantial improvements have been made on the Mainland China side. While a paper
manifest is still needed. a bonded truck can go straight to Shenzhen's airport through the
border at Huanggang. No cargo inspection is needed at the border as long as the data on
the truck manifest matches and the e-seal is intact. A green lane with an automatic drop
arm was created for the service at the Huanggang border. As the truck arrives at the
green lane, an e-seal with global positioning (GPS) capability is installed and activated
by a unique password. The routing of the e-sealed truck is then tracked and traced by
63

GPS. An alarm is sounded if the seal is broken. The final clearance process takes place
at the airport in Shenzhen. The express lane effectively reduces the inspection time at
the Huanggang border from over an hour down to several minutes.
To speed up customs clearance and reduce the bottleneck at Huanggang, express
port transfer between Guangzhou Baiyun International Airport and Hong Kong has
recently been introduced. This truck-expressway for cross-border quick customs
clearance between Hong Kong and Guangzhou has been in a test run since August 10,
2007. Two companies, Northwest and Sinotrans, are the pilot users. Container trucks
marked "Quick-Customs-Clearance' can use the quick-customs clearance driveway of
Guangzhou's airport Customs House. The express port transfer driveway is similar to
the Mainland China Port of the airport express lane. Cargo trucks coming from Hong
Kong are simply sealed by the customs officer with an e-seallock with a GPS function
at Huanggang, and then are directly transited to Guangzhou Baiyun International
Airport for customs declaration. The declaration processes at Huanggang can be
significantly reduced from one hour to two minutes. The sealed truck can be tracked and
traced by the GPS system, enabling Guangzhou customs to quickly locate the trucks.
The declaration process is automated, which saves labour costs. This passage can also
facilitate the trade of goods in the air-land-air mode and speeds up the passage of goods
between Hong Kong and Guangzhou's airport.
Super Link China Direct Service and Airport Express Lane are important initiatives
to integrate Hong Kong and the PRD logistics infrastructural facilities. In addition, the
central government has also approved the construction of the Hong
Kong-Macau-Zhuhai Bridge. Construction will start next year, and the bridge is
scheduled to be operational in 2015. Between the governments of Hong Kong and
Shenzhen, plans are being studied to build a direct railway service linking the airports of
the two cities, which will reduce the transit time to 30 minutes. When these two gigantic
64

logistics infrastructural projects are completed, the forwarding logistics markets
between Hong Kong and Shenzhen will be integrated more closely, paving the way for
Hong Kong's forwarding logistics industry, not only to expand into the PRO market at a
faster pace, but also for it to be strongly exposed to local competitor in the PRD.
3.7 Impact of Mainland Government on manufacturers operating in the PRD
There are a number of factors the Mainland China government has impacted
manufacturers operating in the PRD. In his analysis, Jiang (2005) reveals that four
factors have been the major motivations in attracting international pharmaceutical firms'
direct investment into China during the period 1980-1998: China's market size and
potentiaL rapid economic development and growth, China's open door policy, and
relatively stable political conditions. Among these four factors, the author argues that
relative political stability is the most crucial in attracting FDI. In the 11 th Five-Year Plan,
China's central government has decided to upgrade manufacturing industries from being
labour-intensive to capital- and technology-intensive. Low-value-added industries will
be relocated to the east, west, and north of Guangdong Province. Instead, automobiles,
petrochemicals, and the higher end of the apparel industries will be developed (Chan,
2008). Additional budget will be allocated to research and development to upgrade these
industries and their product development. Sales and marketing efforts will also be
intensified by creating Chinese brands and selling directly to the world's markets (Yu.
2008), instead of simply manufacturing products for foreign brands. This new strategy,
combined with efforts to raise domestic consumption, will impact on the logistics sector
because such services are very likely to re-focus their logistics and forwarding activities
toward the domestic market. This also increases opportunities for Chinese brands and
Hong Kong services in the future. This particular 'opportunity' is investigated in this
thesis as part of the overall SWOT analysis in Chapter Six.
65

3.7.1 Relatively Stable Political Conditions
Investment flows are influenced by political as well as economic factors (Floyd and
Summan, 2008). During the Cultural Revolution from 1968 to 1977, China's economic
development was very slow or stagnant (Zhao et al., 2006). The Hong Kong business
community has invested approximately US$ 4 billion, which ranks it as the number one
among all FDI sources in the PRD and other parts of China (MOFCOM, 2009). China
has attracted substantial FDI since it adopted the reform and open-door policy in 1978.
The Hong Kong business community would have never invested in China if the country
had not enjoyed a relatively stable political environment. Indeed, Taiwan manufacturers
considered political stability as the number one consideration in their FD I decisions in
international logistics (Lu and Yang, 2006).
3.7.2 Government Policies
In 1978, China decided to adopt a reform and open-door policy. However, foreign
investment from 1979 to 1991 had been relatively slow. The turning point was in 1992,
when Deng Xiaoping toured Shenzhen and called for acceleration of economic reforms
and the opening up of the economy to the outside world (Zhao et aI., 2007). The central
government adjusted its economic policy to speed up economic reform and to open
further the economy to foreign investment by starting to build a legal framework to
standardise market operations. New regulations covered corporation law, bankruptcy
law, stock trading law, and many other commercial regulations (Jiang, 2005). During the
period 1992-1998, China received almost 10% of total world FDI inflow and absorbed
over 28% of the total FDI inflow to developing countries and over 46% of total FDI
inflow to Asian countries. The Southeast Asian region attracted approximately US$ 480
billion FDI flows in the period 1992-1998; approximately 50% of this amount went to
China (UN Conference on Trade and Development, 1999).
66

In an attempt to attract FDI, one of China's strategies was to open more SEZs. As of the
end of 2002, five SEZs had been established: three in Guangdong, one in Fujian and one
in Hainan Province. In 1984, 14 coastal cities, known as open coastal cities (OCCs),
were opened up for FDI. SEZs and OCCs were the two most important policy initiatives
for attracting FDI to China. China's Foreign Economic Statistical Yearbook 2002
revealed that the largest sources of FDI were Hong Kong and Taiwan, particularly
during the period from the late 1980s to the early 1990s. Kang et ai., (2006) has inferred
that investment in China is largely concentrated in the manufacturing sector, a sector
that creates tremendous demand for logistics and forwarding services.
Guangdong Province, which contains three SEZs and the PRD, has attracted ample
inward FDI from other Asian economies, especially from Hong Kong and Taiwan, and
has remained the largest FDI recipient, sharing at least one-third of the national total
FDI as of 2000 and more than a quarter of the national total in 2003. The continuous
high influx of manufacturing FDI during the last two decades has made the PRD in
Guangdong the 'world's largest manufacturing base' (Ng and Tuan, 2006).
3.7.3 New Labour Laws
New labour laws were introduced in January 2008; however, as a result, many
events were blamed on these regulations. Huawei, the electronic giant, experienced the
mass resignation of 10,000 employees. Wal-Mart reduced 40% of its sourcing from
China and abruptly laid off staff. Many shoe factories in the PRD closed down, and
more than 10,000 Hong Kong enterprises operating in China were on the verge of
closure as of June 2009. Some employers are not prepared to sign contracts with their
employees and are not keen to cover their health insurance. Both employers and
employees are searching for answers to these problems (Wang, 2008). Critics regard the
new labour laws as 'too forward-thinking' and not realistic under China's present
economic environment. The new labour laws tend to over-protect the interests of
67

employees and neglect the interests of employers; they do not create a win-win situation.
They also create conflict and worsen the relationship between employees and employers
(Ho, 2008).
Geor, a labour law expert states in . Magazine Workers 2008.3' that the new labour
laws are too restrictive to the employers because they cannot layoff staff. Even if staff
members make unreasonable requests, employers cannot terminate their contracts.
Wang, a professor of economic management at Tsinghua University, argues that
employee benefits cannot be achieved through legislation. Low-level employees who
require more protection will not obtain what they want under the new labour law; on the
contrary, their interests will be damaged the most (Workers, 2008). Ho, a professor of
politics at the Legal University of China, shares his views in 'Workers.2008.3', stating
that he did not foresee the serious repercussions of the new labour laws. Increasing
labour costs has caused the closure of thousands of shoe factories. Moreover, more than
10,000 Hong Kong enterprises are in danger of closure. A huge number of SMEs are
planning to relocate in order to survive. For example, in a recent interview, David
Leung of Cheung Yuen International (Hong Kong) Paper Ltd. was quoted as stating that
social insurance for 2,000 workers of a factory will cost the company an extra RMB 8
million, which does not include housing, pension, medical insurance, and
unemployment funds. He commented that the company has not been able to adjust to
the new costs resulting from the new labour laws (Workers, 2008). It appears that the
new labour laws introduced in January 2008 have not received much support from
employers. On top of the competition from a country such as Vietnam in
labour-intensive industries and EU quota restrictions on shoe exports from China, the
additional costs of meeting new labour requirements will increase operating costs. The
purpose of new the labour laws introduced in January 2008 was to protect the welfare of
workers and the legislation is on the right direction. In reality, it will create short-term
68

disadvantages for investors.
3.7.4 Corporate Tax Policy
Scholes et aI., (1992) argue that tax rules influence investment decisions by
affecting the rate of return on assets. They assert that rates of return on assets can vary
because (1) returns on similar assets are taxed differently if they are located in varying
tax jurisdictions, and (2) those located in the same jurisdiction are taxed differently if
they are classified under different legal entities (Tung and Cho, 2000). Tax incentives
play a major role in attracting business and influencing business investment decisions.
Developing countries often use various tax incentives to attract foreign investments and
new technologies (Hadari, 1990; Usher, 1997). China uses corporate income tax rates to
regulate national business activities. The central government offers a favourable tax rate
of 15 % to companies operating in the 5 special economic zones (Shenzhen, Zhuhai,
Shantou, Xiamen, and Hainan), 32 economic and technology development zones, 13
free-trade zones, and 52 high-tech development zones (Wu et aI., 2007).
Tung and Cho (2001) have examined whether (1) concessionary tax rates and tax
incentives are effective in attracting FDI into designated investment incentive zones and
cities and (2) whether more favourable tax incentives provided by the new tax law in
1991 were effective in increasing the amount of FDI. Consistent with their hypotheses,
the zones and cities with lower tax rates and greater tax incentives attract more FDI than
other areas. In addition, more favourable tax incentives provided by the 1991 tax law
were more effective in increasing FDI during the 1992-1994 period compared with the
1988-1991 period. Their findings are consistent with those of Sony (1975), Root and
Ahmed (1978), and Hartman (1984). Since 1979, the institution of tax laws and the use
of tax incentives have stood out to be the most important policies in attracting FDI. As
foreign firms look for more cost-effective locations to do their business, zones and cities
with lower tax burdens have benefited from more FDI. Shenzhen, Zuhai, and Shantou
69

are three of the five designated SEZs in the PRD that have benefited most from the
favourable 15% tax rate offered by the central government.
To take advantage of this low tax rate, many companies moved their registration
locations to those areas. The main requirements for registration location change in
China are if (1) two-thirds of shareholders agrees to the change and (2) registration
location must be one of the main office locations (not necessarily the headquarters).
Once these requirements are met, a firm can change the registration location by
submitting a notification change to the appropriate authority. Wu et aI., (2007) cites the
example of China Vision Holdings Ltd., which announced in its 2002 annual report that
it had changed its registration location to Pudong District in order to take advantage of
the low tax rate of 15%. Foreign investors investing in manufacturing activities in the
Dongguan area, another very important manufacturing base in the PRD, have also taken
advantage of the favourable tax by registering their operations in one of the SEZs. There
is no evidence that all manufacturers in the PRD who provide high logistrics demands to
the 3PL and forwarding service providers have benefited from the 15% tax rate.
However, as the PRD is the world's top manufacturing base, manufacturers operating in
Shenzhen, Zhuhai, and Shantou and those who do not operate in these three SEZs can
change their registration office so that they can benefit from the low tax rate.
3.7.5 Appreciation of the RMB
For a number of years, China has been under pressure from the US and EU to
revalue its currencies. On July 21, 2005, China introduced a mechanism to benchmark
the RMB with a basket of foreign currencies. The basket of foreign currencies is wi del y
believed to include the currencies of its active trading partners such as the US dollar,
Euro, Japanese yen, and the Korean won. The RMB appreciated 2% against the US
dollar from 8.27 to 8.11 to a dollar (Shao, 2009). The appreciation of the RMB has
created both short-term and long-term, negative and positive, impact on manufacturing
70

activities in the PRD and the rest of the Guangdong Province. Guangdong Province has
been the show-window of China's reform and open-door policy and has successfully
developed very strong export-led manufacturing activities. Manufacturing activities
took up 49.5% or RMB 1.074.725 billion out of the total GDP worth RMB 2,170.128
billion in 2005 (Shao, 2009). In Guangdong Province, 40% of total manufacturing
activities are for export; this creates tremendous logistics demand. Although Guangdong
is a large manufacturing and exporting province in China, most of its manufactured
products are at the lower end, labour-intensive, and with low value contribution to the
value chain. On the other hand, manufacturers and exporters find little room to improve
their export prices due to competition in the competitive global markets. Those who
have opted to stay in labour-intensive industries have chosen to relocate their factories
to Hunan and Jiangxi Provinces, or outside China to countries such as Vietnam or
Cambodia. It will be more efficient and cost effective to ship the finished products
made in Hunan and Jiangxi Provinces through other ports such as Ningbo or Shanghai.
Those who have relocated to Vietnam and Cambodia will most likely use global and or
local logistics service providers. In contrast, there are manufacturers who have decided
to close their operations. Tong (2008) argues that 2,789 out of 6,000 porcelain
manufacturers had withdrawn from the export market from January to September 2007.
Shoe and toy manufacturers in Guangdong have been badly hit by the appreciation of
the RMB. In the PRD alone, according to the statistics released by Chinese customs, the
number of shoe manufacturers was reduced from 4,759 in 2007 to 2,428 in 2008. The
profit margin of textile, apparel, and handicrafts manufacturers who stayed in the export
markets has also dropped by 5% to 15% (Shao, 2009).
The appreciation of the RMB has, in the short term, weakened the competitive
advantage of manufacturers in the PRD and Guangdong Province and subsequently
dampened logistics demand.
71

3.8 Impact of Hong Kong Government on Forwarding Services Providers
FFs and LSPs need to ship their goods entrusted by their customers through airlines
and shipping lines for international traffic. Airlines and shipping lines cannot serve
Hong Kong without an airport, in the case of air transportation, and shipping terminals,
in the case of ocean transportation. Without airlines and shipping lines, the logistics
industry could not have prospered in Hong Kong in the last three decades. The impact
of the Hong Kong government on 3PL and FFs can be direct, such as building the
world-class HKIA and the creation of the Hong Kong Logistics Development Council,
and indirect, such as creating a pro-business environment and enhancing the
competitiveness of logistics in Hong Kong. The impact of the Hong Kong government,
whether direct or indirect, has helped Hong Kong build a world-class logistics industry,
which serves the logistics needs of the PRD well.
3.8.1 Hong Kong Airport
The Hong Kong International Airport is managed by the Hong Kong Airport
Authority (HKAA), which is a statutory corporation wholly owned by the Hong Kong
SAR government. The HKAA was formally established on December 1, 1995 when the
Airport Authority Ordinance was brought into effect as a continuation of the 1990
Provisional Airport Authority. The HKAA provides, operates, develops, and maintains
Hong Kong's airport at Chek Lap Kok in order to maintain Hong Kong's status as a
centre of international and regional aviation (Hong Kong Internatinal Airport Annual
Report 2007/2008). Under the land grant signed on December 1, 1955, the government
granted the HKAA up to year 2047 legal rights to run the entire airport site at Chek Lap
Kok, together with the rights necessary to develop such site for the purpose of its
business.
As at March 2008, the airport is served by 88 airlines linking Hong Kong to 157
72

major cities around the world (Hong Kong International Airport Annual Report 2007/
2008). In 2008, Pan-PRD (provinces of Guangdong, Fujian, Jiangxi, Hunan, Guangxi,
Guizhou, Sichuan, Yunan, and Hainan in south and southwest China) used Hong Kong
for their trading activities (Hong Kong Trade Development Council, 2009). To be
specific, Hong Kong handled US$ 66.7 billion in exports or 13.2% of total Pan-PRD
exports and US$ 210.6 billion in imports or 61.7% of total Pan-PRD imports.
Hong Kong used to handle a greater volume of imports than exports for Pan-PRD
due to its freeport status. Import goods ultimately bound for Pan-PRD were brought in
and warehoused in Hong Kong without import duty and pending further transportation
into the Pan-PRD area. The statistics also indicate that many exports from Pan-PRD
were shipped through other channels other than Hong Kong.
In 2008, Hong Kong's airport handled 3.6 million tons of air cargo throughput.
Hong Kong accounted for 59.53% in 2006, 56.57% in 2007, and 57.2% in 2008 of
China's national total in terms of air cargo throughput. In 2008, 35.5% of Hong Kong's
external trade, including re-export, were shipped by air. Without a world-class airport
built by the government, the logistics industry could not have made a contribution of
20% to Hong Kong's GDP (2008) (Hong Kong Port Development Council, 2010).
3.8.2 Port Governance in Hong Kong
Re-export and outward processing are the two notable forms of trade between Hong
Kong and Mainland China (Sung, 1998). Raw materials and semi-manufactured goods
are exported to China for further processing. Finished products from Mainland China,
particularly from the PRD, are shipped to the world's markets via Hong Kong. In
1990s and early 2000, Hong Kong's external trade was carried predominantly by sea
transport; however, the trend has changed due to the PRD ports' cost advantage and
service improvement.
The Marine Department of Hong Kong SAR is responsible for administration of
73

port and marine time affairs. It has responsibility for vessel traffic management, the
safety standards of all classes and types of vessels, and other regulatory matters. It is
also involved in the strategic planning of port developments (Cullinane and Song, 2007).
However. neither the government nor the Marine Department (the de facto 'port
authority' with respect to many aspects of port operations) owns or operates container
terminal facilities. The private sector finances, develops, and operates terminal facilities.
There are four privately owned terminal operators: Modem Terminals Ltd., DPI
Terminals, Hong Kong International (HIT) Ltd., and COSCO-HIT Terminals (HK) Ltd.
In the past, a high level of operational efficiency enabled the terminals to handle
throughput at capacity levels higher than the designed capacity. The port is served by
approximately 80 international shipping lines providing over 400 container liner
services per week to over 500 destinations worldwide (Cullinane and Song, 2007). It
has experienced a remarkable growth in throughput over time, reaching approximately
22 million TEUs in 2004 (Containerization International, 2005). Hong Kong is expected
to be able to cope with forecast cargo of approximately 30 million TEUs by 2010 (Ip,
2003). The figures seem to indicate an impressive absolute amount; however, in terms
of annual growth, it is a low, single-digit growth compared with a double-digit annual
growth in the PRD ports.
3.8.3 Hong Kong Logistics Development Council (LOGSCOUNCIL)
Hong Kong's airport was relocated from Kai Tai in Kowloon to Chek Lap Kok in 1998.
During the first few days immediately after the relocation of the Hong Kong International
Airport, HACT and AAT, the franchised cargo terminal operators at the new airport were
unable to locate outbound cargo, and inbound cargo was not stored in the designated areas.
As a result, many passenger and dedicated cargo flights left Hong Kong without filling up
with their pre-planned loadings. Exporters could not ship out their cargo in a timely manner.
FFs and importers were unable to collect their incoming cargo within a reasonable timeframe.
74

Many perishable items that arrived by air during that period were stuck at the airport and
were delayed in delivery, and finally had to be disposed of. Local media estimated that Hong
Kong lost HK$ 4.6 billion daily in external trade during this chaotic period. Thus,
government officials and the business community began to realise the important contribution
of aviation and related industries. The logistics industry players also voiced their desire to
obtain access to a platform into where they can input their ideas relating to the industry. The
Hong Kong Logistics Development Council (LOGSCOUNCIL) was formed in December
2001 as a result.
The terms of reference of the Council state support for the development and promotion
of the "Logistics Hong Kong' initiative, which aims to strengthen Hong Kong's role as the
preferred international and regional transportation and logistics hub. More specifically,
LOGS COUNCIL aims to do the following:
• Implement directives from the Steering Committee on Logistics Development
(LOGSCOM) chaired by the Financial Secretary
• Provide a forum for the public and private sectors to discuss and coordinate matters
concerning "Logistics Hong Kong'
• Carry out joint projects (between the public and private sectors) for "Logistics Hong
Kong' (LOGISCOUNCIL 2001)
The LOGSCOUNCIL is another major form of support the Hong Kong government offers to
the Hong Kong logistics industry.
3.8.4 Creating a Pro Business Environment
• Low corporate/personal tax
Hong Kong taxes are among the lowest in the world, and the tax regime is simple
and predictable. The profits tax is the same for foreign and local companies: a low
16.5%. The actual tax bill is often even less after various deductions and depreciation
allowance. There is also no capital gains tax in Hong Kong. Salary tax rates come at a
75
maximum rate of 15%, and are imposed only on all salary incomes of individuals
derived in or from Hong Kong (Invest HK, 2009). Thus, low personal taxes motivate
decision-makers to choose Hong Kong as a regional office.
• Zero-tolerance of corruption
Corruption involves hidden cost that leads to less competitive products and services.
Under a corrupt environment, companies are not free to pursue their business interests
on a level playing field (Invest HK, 2006) and incur hidden costs in doing business.
Prior to 1974, Hong Kong had the characteristics of a typical developing country in
Southeast Asia, easily nurturing corruption when its economy changes rapidly (Liao
2008). Since it was founded in 1974, the Independent Commission Against Corruption
(ICAC), a highly authorised and independent anti-corruption agency reporting directly
to the Chief Executive of Hong Kong SAR government, properly redesigned incentive
structures and a fundamental change in constitutional design that would uphold the rule
of law (Ding et aI., 2007; Liao, 2008). As a result, Hong Kong is one of the most
corruption-free economies in the world where cronyism, influence-peddling, and
bribery are met with zero-tolerance. Zero-tolerance of corruption eliminates hidden
costs in doing business. Furthermore, after its successful transformation to build a clean
government in a pervasively corrupt environment, Hong Kong has become one of the
cleanest cities in the world to do business (Liao, 2008).
• Efficient customs services
Every day, many vehicles cross the Hong Kong-Shenzhen borders, bringing in
finished products from Pan-PRO to be shipped via Hong Kong's airport and/or port to
the world's markets, and returning loads of raw materials and components to the
factories in Pan-PRO. Without transparent, efficient, and predictable customs services,
Hong Kong logistics service providers cannot offer a time-definite physical flow of
service.
76

• Transparent legal system
Hong Kong's fair, transparent, and efficient legal system is one of the cornerstones
of its economic development. The practice of Western law underpins the Hong Kong
free market, with a legal system characterised by a level playing field, due process,
protection of property rights, and enforcement of legal contracts (Lee, 1995). The legal
system is guaranteed by the 1984 Sino-British Joint Declaration and Hong Kong Basic
Law (Invest HK, 2009). Hong Kong's legal system keeps investments safe in spite of
regular upheavals in the mainland (Lee, 1995). A November 1994 survey of 500
corporate executives in 32 countries, published by Fortune Magazine, rated Hong Kong
above New York and London as the world's best city for doing business (Lee. 1995).
• World-class financial services
Fund flow is one of the three dimensions in supply chain management. Hong Kong
is a world-class financial centre without any foreign exchange control, and this ensures
efficient transfer of payment for transaction-fund flow. The last phase of a business
transaction can be handled in a split of a second. Investors around the world regard
Hong Kong as a world-class financial centre and the best way to access China's
booming market (Lee, 1995). There is a growing trend for the larger logistics companies
to become involved in the fund flow through factoring arrangements.
• World-class IT service support
With rising customer expectations, many LSPs have searched for ways to improve
their services (Lai et ai., 2004b). Timely and easily accessible information that
facilitates the flow of goods should be made readily available to facilitate decision
making (Kumar, 2001). Increasingly, many Hong Kong-based LSPs are counting on the
leverage offered by information technology (IT) to attain a competitive edge through
reduced costs, increased productivity, and improved customer services (Lai et al.,
2004b). Undoubtedly, IT plays an important enabling role in logistics. Several surveys
77

have been conducted to investigate the use and importance of IT in supporting logistics
operations (Hardaker et aI., 1994; Gutierrez and Duran, 1997; Piplani et aI., 2004).
Closs et aI., (1997) has shown that IT capabilities significantly influence the overall
competence of logistics. IT not only improves the effectiveness and efficiency of
logistics processes, the successful implementation of IT can also have a significant
impact on the practice of logistics strategies and on choices of organisational structure
(Bowersox and Daugherty, 1995). The implementation of IT to support logistics process
can lead to a wide range of potential benefits, such as reducing errors from data entry
and improvements in customer services.
In a study conducted by Lai and Cheng (2004). respondents to a survey rate 'quick
response and access to information', 'improves customer service', 'enhances
competitiveness', and 'reduces data re-entry (and data may be used immediately) and
errors' as major benefits, receiving more than 4 points in a 1 to 5 scale. The study shows
that data communication technologies (e-mail, Internet, EDI, intranet) are widely used
in logistics. This is because communication technology is one of the key factors in the
use of IT to support logistics operations among all of the parties in a supply chain
(Hammant, 1995). IT is one of the main enablers of improved efficiency and service for
many LSPs in Hong Kong (Lai and Cheng, 2004). This is, of course, supported by the
theoretical arguments underpinning TCE and RBV, as explained in Chapter Two, where
IT is seen as fundamental to competitive advantage.
3.9 Local Mainland Logistics and Forwarding Services Providers
Prior to 1978, under a centrally planned economy, only state-owned logistics
companies were licensed to offer traditional logistics services (Hong and Liu, 2007).
Jiang and Prater (2002) identified underdeveloped infrastructure, government
regulations, and lack of professionalism as the weaknesses of China's traditional
distribution system. According to Goh and Ling (2003), the logistics infrastructure
78

curtails the ability of multinational companies to leverage China's full potential. From
early 1980 to 200 I, before China's accession into the WTO, foreign logistics companies
were allowed to form joint-venture companies with Sinotrans and other state-owned
companies, with state-owned companies having the controlling interest. During this
period, local LSPs in China only offered basic transportation and warehousing services
with very little value added (Hong and liu, 2007; Tam, 2004). During the same period,
global and Hong Kong-based logistics companies that dominated the free on board
(FOB) export traffic from China, both for air and ocean, could only handle their
controlled traffic in China, with their liaison offices offering information and technical
advice. However, these companies outsourced the physical handling of the traffic to
Sinotrans and other licensed, state-owned logistics service providers. In the process,
most of the profits were retained by global and Hong Kong-based LSPs. Local licensed
logistics companies, including those operating in the PRD, had to be satisfied with
low handling fees.
After China's accession into the WTO in 2001, foreign companies, including Hong
Kong-based logistics companies and private companies in China, have been able to
obtain a license from the Ministry of Foreign Trade and Economic Cooperation
(MOFTEC) to trade as logistics and freight forwarding service providers. Prominent
global logistics players such as DHL, UPS, and FedEx started trading in China (Hong et
aI., 2004). Despite the logistics barriers and challenges, however, China's booming
economy, its accession to WTO, and e-commerce development are the factors driving
the improvement of China's logistics system and infrastructure. Based on Korea's
experience with manufacturing investments of 93.2% and 85.5% for the periods
1989-1993 and 1999-2003, respectively, Kang et aI., (2006) has inferred that
investments in China are also largely concentrated in the manufacturing sectors.
Manufacturing sectors create greater logistics demand than other sectors such as finance
79

and retail. Indeed, logistics is one of the fastest growing industries in China (Yu, 2007).
In 2004, logistics contributed RMB 845.9 billion in added value, which is 6% of GDP
and 19.5% of the service sector's added value (Ou, 2006). China's accession into the
WTO has accelerated and driven the growth and development of the logistics sector.
However, logistics expenditures accounted for an annual average of 21.8% of China's
GDP for the period 1992-2004 (Logistics Information Centre of the China Federation of
Logistics and Purchasing, 2005) compared to only 10% in developed countries (Goh
and Ling, 2003). This shows a huge room for improvement and has hence created
opportunities for professional global and Hong Kong-based LSPs in their China
operations. Tremendous opportunities exist, together with intense competition,
especially since China entered the WTO in 2001 (Hong and Liu, 2007). The average
growth rate of the logistics industry in China was 23% for the period 2001-2005
(Badham and Sense, 2006), 24% in 2006, and 26.2% in 2007 (Logistics Information
Centre of the China Federation of Logistics and Purchasing, 2008). In 2007, China's
logistics industry already contributed about RMB1.7 trillion in added value or 17.6% of
the added value of the service industry (Logistics Information Centre of the China
Federation of Logistics and Purchasing, 2008). With the logistics industry being
gradually opened up after 2001, foreign logistics companies, including Hong
Kong-based companies with proper logistics and forwarding licenses, began to trade
directly with shipping lines, airlines, and other asset-based LSPs. Local logistics
services that were no longer protected by licensing requirements lost their competitive
edge had to concentrate on asset-based logistics activities, providing local transportation
and warehousing services. Currently, no study is available on the issue of segmenting
the forwarding sector from the logistics industry in China. Thus far, local forwarders
involved in international freight forwarding were believed to have been merely involved
in local transportation and warehousing activities. This research is intended to fill this
80

gap in current knowledge. The analysis of these issues is provided in Chapter Six.
With regards to asset-based logistics development in China, transportation
infrastructure variables have been shown to be prohibitive and significant by many
empirical studies in terms of attracting FDI, even though they use non-uniform sets of
variables (Broadman, 1996; Coughlin and Segev, 2000; Cassidy and
Andreosso-O'Callaghan. 2006). The Chinese Government has invested heavily in
railways, inland waterways, and highways. Beijing, Shanghai, Guangdong, and Hainan
are the highest ranked cities/provinces (Kang et aI., 2006) in terms of highway length to
province size (total highway length compared with size of the province/region/city). In
the case of Shanghai and Guangdong, extensive highways to the ports and airports
would indeed reduce transportation costs and help reduce overall supply chain costs.
The cost of operations and the quality of infrastructure are the factors frequently
considered by FDI investors. A well-developed transportation system reduces
production costs by reducing the costs of importing components and machinery and of
exporting outputs (Kang et aI., 2006)
Logistics infrastructure and company management of logistics activities greatly
influence operational efficiency and competitiveness (Zhao et aI., 2007). In terms of
logistics infrastructural developments, Guangdong has caught up quickly with Hong
Kong by upgrading and investing in its airports and ports in the PRD. The new,
three-runway Guangzhou Baiyun International Airport, located in Guangzhou, the
capital of Guangdong Province, was completed in 2006 and has since attracted several
international airlines such as United Airlines, Norwest Orient, Lufthansa, and Air France.
Furthermore, additional berthing spaces were added to Yantian Port in its third stage of
development; five additional berthing spaces were added to Shekow Port in its second
stage of development (Yantian and Shekow are two large ports on the Mainland China
side of the PRD) and; a sea freight terminal in Tai Charm Wan is being built by Modern
81

Terminal, a Hong Kong sea freight terminal operator (Tam, 2004). In the Eleventh
Five-Year Plan, the central governmeni is pushing through the second-stage
development of the Baiyun (Guangzhou) airport and the expansion of Shenzhen's
airport. The logistics infrastructural development in the PRD in the last 10 years, with or
without Hong Kong investments, has indeed placed the Baiyun airport and the seaports
in Yantian and Shekow in the world-class league of infrastructure development and
enhanced operational efficiency, particularly for ocean-going traffic. In the ten years
prior to 2008, Shenzhen ports enjoyed enviable double-digit growth in total ocean
traffic throughput, from 70% in 1998 to 14% 2007 (Shenzhen Ports, 2008). Such
tremendous growth (70%) is unsurprising given the small base to begin with. However,
the 14% growth in 2007 was, in absolute terms, much more significant. In the past
several years, many global and the bigger Hong Kong-based LSPs have secured the
required licenses and established their offices in Shenzhen, which enlarged the base of
the industry. Hence, although Hong Kong's ocean traffic throughput growth has slowed
down in the last ten years, global and Hong Kong-based LSPs, through their
international sales network, have held a dominant share of Shenzhen's ocean traffic
throughput. The smaller Hong Kong-based LSPs that do not have Shenzhen facilities
normally outsource their physical handling to local LSPs in the PRD. In terms of air
cargo development Shenzhen's airport caters mainly to domestic air cargo and poses no
threat to Hong Kong's airpoli. In 2005, the Baiyun airport carried 506,988 tons of cargo,
whereas Hong Kong's airport carried 3,154,289 tons (Fling et al.. 2005). With massive
expansion plans, the Baiyun airport has the capacity to handle more international air
cargo traffic. However, the cream of the profit from international air traffic going
through the Baiyuen and Shenzhen airport has been generally retained by global and
Hong Kong-based LSPs that handle cargo traffic either through their own setups or
through local subcontractors in the PRD. Local LSPs make their revenues in local
82
handling fees. These local players previously contributed a low value to the supply
chain; however, the situation has changed gradually. This is because concerned PRD
governments have made various efforts to improve the professionalism of local LSPs by
aiding in hardware and software development. Clearly, from a SWOT analysis
perspective, this presents one of the threats to the predominant position of Hong Kong
logistics companies. This (and other threats and opportunities to be identified later in the
thesis) is analysed in Chapter Six.
3.10 Analogy from the Shipbuilding Industry
The loss of Hong Kong's top container port status and the rapid growth of the PRD
ports in terms of container throughput have led the government officials' and the
business community in Hong Kong to question whether Hong Kong will become
another port of Venice in the future. After an introduction of the past and present
development of the logistics industry in Hong Kong and the PRD areas, the author has
conducted research in an effort to forecast the development of the Hong Kong logistics
industry. The research shows similarities between the Hong Kong logistics industry and
the British shipbuilding industry in its early days when the British shipbuilding industry
had a lion share of the world market. The challenges from new competitors abroad and
the lack of trust between management and workers led to the downfall of the British
shipbuilding industry. Since the Hong Kong logistics industry is facing a similar
situation as the early British shipbuilders, a brief review of their experiences and lessons
of the past can shed light on the future of the Hong Kong logistics industry and provide
hints on how to keep the PRD exporters to continue using Hong Kong as their preferred
airport and port.
Britain's shipping industry enjoyed undisputed international supremacy between
1890 and 1914. However, this was followed by a gradual loss in world market share
during the interwar years, and Britain sustained an absolute decline in output between
83

1948 and 1970. In contrast, European shipbuilding expanded at an unprecedent rate
after World War II (Lorenz, 1991). Shipbuilding was one of the few heavy industries in
which Britain maintained a position of international supremacy in one or two decades
before World War I. Britain accounted for 60% of the world's output of ships as late as
1913, producing an export tonnage that exceeded the total production of Germany and
the United States put together, Britain's two major competitors at that time. By the
mid-1960s, British shipbuilding had been reduced to comparative insignificance,
accounting for less than 10% of world output. Over 70% of addition to the UK fleet was
produced abroad during the period between 1965 and 1970. The same trend is
developing in Hong Kong's total ocean traffic throughput versus the total throughput in
the PRO ports (including Hong Kong's pOft). In 1998, Hong Kong accounted for 88%
or 14.582 million TEUs of the total ocean traffic throughput in the PRD ports, including
Hong Kong port. By 2008, Hong Kong share was reduced to 53%, or 24.325 million
TEUs, out of total ocean throughput in the PRD of 45.725 million TEUs.
Lorenz (1991) states that, at that time, the rapid growth in world demand for ships
and increasing acceptance of standardised vessels in international markets conferred the
competitive advantage on foreign shipbuilders employing bureaucratic methods suitable
for 'mass' production. Elbaum and Lazonick (1986) agree that British business
decision-makers, though rational. were constrained by 'institutional rigidities' from
adopting the corporate forms of management required for competing in mass markets.
Lorenz (1991) argues that the decline of the UK shipbuilding industry is due to
'bounded rationality' or the limitations in the ability of humans to process the mass of
information required for making optimal decisions. This failure due to bounded
rationality was demonstrated by the British management's uncertainty over the need for
organisational change during the decade or so following World War II, as well as in the
lack of trust between labour and management that resulted in a failure of cooperation
84

over proposed institutional reforms between 1958 and 1965.
On average, the British shipbuilding industry produced 75% of the world's market
between 1892 and 1899; however, the share fell to approximately 60% between 1900
and 1949 (Lorenz, 1991). This 15% share decline resulted as shipbuilding capacity
expanded on the Continent and the United States, generally behind protective barriers.
However, Britain's control of the unprotected parts of the export market remained
uncontested. Britain also enjoyed a considerable advantage in labour productivity as
shown in Table 3.3.
Table 3.3 Labour Productivity in Shipbuilding
Number Employed Tons Constructed Output per Head (Tons)
U.K. 85,000 1,290,369 15.2 (average for 64 firms
U.S.A 33,340 385,511 11.6 (average for 11 firms)
Germany 31,310 198,097 6.3 (average for 14 firms)
France 28,650 134,037 4.7 (average for 11 firms)
Sources: Lorenz, 1991
Britain's share of world production dropped dramatically during World War I. Britain
quickly re-established its dominant position during the post-war reconstruction, producing an
average of 45% of the world's output between 1920 and 1929. British shipbuilders sustained
a further loss of the world market share during the 1930s, accounting for an average of only
35% of the world market share due to protectionist policies and government subsidies abroad.
Post-1935, Germany, Sweden, and Holland made inroads into neutral third-country markets
formerly controlled by Britain. For the first time, they also attracted significant orders from
British fleet operators. Britain's share of the world export market declined from over 40% in
the period 1927-1930 to 21% in the period 1936-1938. Supply-side factors further worsened
the decline of Britain's world market share because its major Continental competitors offered
comparatively quick delivery. Although there was a more than twofold increase in world
output in the 1950s, the proportion of ships built in Britain was cut from 40% to 15%. World
demand expanded at an unprecedent rate in the 1960s; however, British shipbuilding industry 85

sustained an absolute decline and accounted for only 5% of world output by the end of the
1960s behind Japan, Sweden, and West Germany (Table 3.4).
Table 3.4 Percentage Shares of the World Export Market'"
Year Britain Japan Germany Sweden France
1948-1950 35.0 2.2 0.3 18.3 0.1
1951-1955 22.0 10.6 14.9 12.9 2.1
1956-1960 6.9 31.6 20.7 12.0 5.8
1961-1965 4.5 38.8 13.0 15.7 5.5
Source: Lorzen, 1991
*in terms of tons launched
By the 1960s, there was a considerable shortfall in labour productivity, once the
strength of the British shipbuilding industry. Labour costs were approximately 20% of
total shipbuilding costs. Steel and capital, the other two most important components of
costs, were roughly the same for the British and Continental shipyards. During the early
1960s, the average British shipyard processed approximately 15 tons of steel annually
per 1,000 square feet of fabrication area, compared with 36 tons in a Continental
shipyard. Lorenz (1991) attributes the poor outcome of the British shipyard and the
dramatic competitive reversal of this once successful industry to the following reasons:
• Success and decline, 1890-1939
British shipbuilders captured both their expanding domestic market and much of the
foreign market from 1860 to 1880. Competing foreign maritime nations lacked
developed iron, steel, and engineering industries, as well as sufficient skilled labour to
supply shipyards. Capturing the home and foreign markets gave British shipyards a
greater continuity of demand for different classes of vessels. This allowed British
shipbuilders to achieve a degree of specialisation among shipyards that were impossible
in other maritime nations. British shipyards, on the average, showed a preference for
more labour-intensive methods in order to layoff labour during cyclical downturns.
86

Foreign shipyards pursued a different strategy of greater mechanisation, although
eliminate skilled labour from the production process was impossible. However, as a
group, British ship producers offered high continuity of employment, which contributed
in building up and maintaining regional pools of skilled labour. By the end of the
nineteenth century, the skilled trades were highly unionised. Unions imposed
restrictions that clearly constrained the ability of employers to reorganise the division of
labour and introduce new machinery. However, unionism conferred important benefits
in terms of cyclical flexibility in hiring and firing, the organisation of work, and the
acquisition of skills. The unions provided variety of forms of insurance, including
unemployment, sick, and superannuation pay. These benefits contributed to maintaining
the attachment of skilled workers to the shipbuilding area.
• Competitive decline, 1948-1970
After 1930, a number of significant changes in market conditions and technology
progressively shifted the competitive advantage toward yards using more systematic
management methods. As world energy use shifted from coal to oil, demand for tankers
grew. Tankers are relative simple vessels, with long flat surfaces that can easily be built
with standard components. The rise of large-scale and capital-intensive shipbuilding
diminished the importance of flexible access to a highly skilled and mobile work force.
British shipbuilders had experienced periodic and severe depression in demand, which
made it reasonable for them to form cautious expectations concerning any future growth
in demand for standard or similar vessels that might shift the competitive advantage
toward bureaucratic methods. After World War II, foreign producers experienced
unanticipated benefits from a system that past labour market constraints had compelled
them to adopt. British builders witnessed equally unanticipated declining fortunes.
• Enterprise organisation as compromise
The legacy of distrust between labour and management engendered by conflicts
87

proved inimical to the industry's performance when its continued success depended on
organisational reform. In 1958, prompted by declining profitability and the loss of
domestic markets to foreign shipbuilders, the Shipbuilding Employers Federation
initiated internal discussions concerning a comprehensive reform of working practices
to improve productivity. The discussions resulted in the 1962 Plan that the employers
presented to the unions at the national level to offer in exchange for the relaxation of
demarcation rules among the skilled trades and the acceptance of training provisions
providing the upgrade of non-apprenticed semiskilled workers to skilled positions. The
plan did not receive the support of the unions. which were sceptical of management's
claim that the changes were needed to ensure the industry's survival. Productivity
bargaining was reasonably successful in securing flexibility among the hull construction
trades organised by the Amalgamated Society of Boilermakers. Although productivity
bargaining was a notable success in shipbuilding industry relationship, this was only
applied in the local modification of the craft system of production. This neither led to a
radical departure in the direction of bureaucratisation of work administration, nor was it
accompanied by a substantial improvement in the industry's competitive performance.
According to a 1973 report by Booz Allen Hamilton, the shipbuilding industry sustained
losses with no increase in labour productivity between 1967 and 1971.
• Evolutionary economics and competitive decline
Lorenz (1991) asserts that British shipbuilders during the decade or so following
World War II were uncertain whether changing market conditions would undermine the
profitability of their established routines; however, they were certain that if they
attempted to alter the terms of the compromise, they would run into trouble with a
labour force that would view the proposed reform as a trap. Under these conditions, for
British producers not to change was reasonable. British management attempted to build
up trust concerning proposed institutional changes, triggered by bankruptcy and closure
88

of shipyards between 1962 and 1965. The political constraint of finding a set of changes
that both management and labour perceived as mutually beneficial provides plausible
reasons why organisation reform after 1965 only amounted to local modification of the
craft system. By the early 1960s, British shipbuilders were well aware that their
increasingly successful competitors were using fundamentally different management
techniques. The failure of the British to change, however, should not be understood
solely in terms of British management's 'blindness', much less of their incompetency.
British businessmen may have been lucky when they succeeded; however, they were not
stupid when they failed. According to Lorenz (1991), they were simply constrained by
the lack of trust.
• Decline of British shipbuilding industry and the trend of the Hong Kong forwarding
logistics industry
The Hong Kong forwarding logistics industry has benefited from the logistics needs
of the manufacturers in the PRD in an environment where there was very little
competition from the Guangzhou airport and the PRD ports. The forwarding industry in
the PRD had not taken off before 2000. Since the beginning of the 21 st century, however,
Hong Kong's shipping industry has recorded much lower throughput growth due to
competition from the PRD ports. Herein, the downfall of the British shipbuilding
industry cannot be used as an exact analogy of the Hong Kong logistics industry due to
two main reasons:
1) In contrast with the condition of the British shipbuilding industry,
management and workers in the Hong Kong forwarding logistics sector
have enjoyed an amicable relationship, which has not stopped employers
from expanding or retaining their market shares in the PRD.
2) Then, the major market of the British shipbuilding industry was abroad.
The British shipbuilding industry failed to adjust in facing the uncertain
89

market environment. Fortunately, the catchment area for Hong Kong's
logistics industry since the 1980s has been the PRD, which is only
one-hour driving distance from Hong Kong.
The Hong Kong forwarding logistics operators can choose to do nothing and stay in
Hong Kong, or they can expand their operations to China, particularly in the PRD
market. History will confirm that the latter strategy will best serve the interests of the
Hong Kong forwarding logistics industry.
In this part, the author first reviewed the economic and logistics development in
China and the three drivers for the logistics industries (outsourcing, globalisation, and
freeport status) as defined and explained above. The author then reviewed the literature
on manufacturing in the PRD, government influence on manufacturing operations in
terms of political conditions, government policies, new labour laws, corporate tax
policies, and appreciation of the RMB. Since the Hong Kong government also plays
very important roles in the forwarding services sector, Hong Kong's airport port
governance, LOGSCOUNCIL, and the pro-business environment are also discussed.
Finally, the competition from the local Mainland service providers is introduced.
In the next section, the author examines the logistics development in Shanghai,
Taiwan, Singapore, and India, which are perceived to be competing with Hong Kong's
logistics industry in various ways. These four have been selected for comparison
because, to some extent, their recent throughput growth trends in the Asia region follow
those of the PRD and Hong Kong. This comparison will help the reader gain a more
holistic view when analysing the challenges and opportunities faced by the Hong Kong
logistics industry.
90
Chapter Four Regional Comparison
4.1 Shanghai Logistics Industry
Shanghai is now China's biggest industrial city and is the economic and financial
centre of China. Whereas Hong Kong has retained its dominant role as a logistics
gateway for Southern China, and Beijing serves as the logistics gateway for Northern
China, Shanghai serves as logistics gateway for Eastern and Central China, particularly
for the Yangtze River Delta (YRD) area and 200 inland ports along the Yangtze River.
In 2007, Shanghai's import and export trade reached US$ 520.91 billion, an
increase of 21.5% from the previous year and the third consecutive year of more than
20% growth rate (Yiu and Lau, 2008).
Despite the high growth in China's logistics industry, before China accession into
WTO in 2001, many characterised the logistics industry in China as underdeveloped,
fragmented, and hampered by local protectionism that resulted from the dominance of
state-owned enterprises enjoying the privileges of monopolistic regulations (Baldinger,
1998; Mann, 2001; Powers, 2001; Jiang and Prater, 2002). Sinotrans, the state-owned
logistics enterprise, dominated the nation's logistics markets, including Shanghai.
Foreign logistics companies had to cooperate with Sinotrans by either appointing it
as an agent or setting up a joint venture with it as minority shareholder. Very strong air
cargo throughput growth was recorded, from 127 tons in 1990 to 1,936 million tons in
2004 or a 1,527 percent growth (Fung et aI., 2005). Following China's accession into
the WTO, the logistics market has been opened up to foreign logistics companies. As a
result, foreign logistics companies, particularly global logistics companies, have set up
their own operations in Shanghai by offering their own services, instead of going
through their joint venture companies or their agents in Shanghai. The logistics industry
91

has been transformed from an industry dominated by Sinotrans and a few smaller
state-owned enterprises, to an industry consisting of many privately owned and foreign
logistics providers (Hong, 2007). All these changes have raised the quality of logistics
services and integrated Shanghai's logistics industry into the global supply chain. From
2004 to 2009, total air cargo throughput has continued to show double-digit growth
most of the time.
Air cargo in Shanghai is handled by two airports, namely, the Shanghai Honqqiao
International Airport, which was transformed from a military to a civilian airport in
1972, and the Shanghai Pudong International Airport, which became operational in
1991, with a second runway added in 2005. Hong Kong's airport has a capacity of 9
million tons in total air cargo throughput (Hong Kong Airport Authority, 2008). The
combined designed capacity of Shanghai's two airports is 6 million tons of total air
cargo throughput (Shanghai Airport Authority, 2010). With a total air cargo throughput
of 2.982 million in 2009. Even at a growth rate of 15% per annum, the designed
capacity of the Shanghai airports will be able to cope with capacity demand till 2014,
while the Shanghai government is working to expand the handling capacity of both
airports.
On the shipping side, up to end of 2007, there were 35 shipping lines offering 2,183
trips per month to foreign destinations. Two hundred direct trips have been established
from Shanghai to the US, Europe, Australia, Africa, East Asia and South Asia (Xu,
2009). In 2007, 35% of Shanghai's total container throughput came from 200 ports
along the Yangtze River (Xu, 2009). Container traffic in Shanghai largely relies on
Waigaoqiao and Yangshan ports. The Waigaoqiao Port became operational in 1993 and
continues to undergo expansion. Yangshan Port, a deep-water port built into a reclaimed
island connected to Shanghai by a 32.5 km bridge (http://www.donghai-bridge.com.cn).
started operations in 2005. Although ocean traffic in Shanghai has developed rapidly in
92

the last few years, logistics infrastructural development has been lagging behind. Sea
and land transportation have not been integrated. Furthermore, logistics soft skills have
been negatively affected by bureaucratic procedures, lengthy customs formality, poor
logistics services, and unclear rule of law (Gao, 2009; Yiu and Lau, 2008).
Qualified logistics professional support is a bottleneck in Shanghai's logistics
development (Yao, 2009; Yiu and Lau, 2008; Gao, 2009; Zuo, 2009). High value-added
3PL logistics has been lagging behind (Yiu and Lau, 2008; Gao, 2009; Zuo, 2009) and
needs to be refocused to enhance the overall logistics development in Shanghai.
Many best practices in physical flow are less imitable. However, technologies on
information flow are difficult to imitate and, on some cases, non-substitutable. In this
area, sustainable competitive advantage can be created. Many studies have identified the
upgrade of information technology as the way to raise the professionalism of the
logistics industry standard in Shanghai (Yiu and Lau, 2008; Gao, 2009). From 1992 to
2003, Shanghai had enjoyed more than 11.9% GDP growth on average, and GDP per
capita reached US$ 4,909 in 2003 (Ding et ai., 2005). As part of the plan to achieve
sustainable development for Shanghai. "information harbour" was conceptualised by
economists, industries, and the government in 1994. The 'Digital City Shanghai"
strategy was announced by the Shanghai Municipal Government in 2002. The Shanghai
Municipal Government had added the modern logistics project to the Tenth Five-Year
Plan. A Shanghai City logistics information platform was created with four parts: (1)
strategies of Shanghai logistics information platform technologies and businesses; (2)
standards of modern logistics information technologies; (3) key technologies of
construction of modern logistics information systems; and (4) a pilot system for the
Shanghai logistics information platform (Ding et at.. 2005). The "Digital City Shanghai"
strategy reflects the vision of the city leaders in Shanghai in moving toward a
knowledge-based economy. Building the Shanghai City logistics information platform
93

can be explained by the RBV theory on the creation of sustainable competitive
advantage. However, the poor soft skills of logistics industry practitioners in Shanghai
is a reflection of the poor implementation of the vision of Shanghai leaders.
Ningbao, another major port in the YRD, competes with Shanghai in container
traffic; however, the dilution effect of Shanghai's total container throughput is nothing
like the dilution effect of the PRD ports on Hong Kong. This is because the PRD ports
almost took half of the total 45 million TEUs in the PRD catchment area in 2009.
Table 4.1 illustrates Shanghai's tremendous growth both in terms of air cargo and
container total throughput. In terms of container throughput, in 2007, Shanghai overtook
Hong Kong as the world's second largest container port after Singapore. Judging from
its rapid growth, Shanghai will soon overtake Singapore as the top container port in the
world. Shanghai airports have enjoyed high growth rates and are expected to overtake
Hong Kong as the top airport in terms of air cargo throughput within 5 to 10 years.
Indeed, Shanghai will compete with Hong Kong as top air cargo centre; however, it will
not compete with Hong Kong for air traffic because the catchments areas for the
Shanghai logistics industry are the Yangtze River Delta (YRD) and the cities along the
Yangtze River. For this reason, Shanghai's logistics industry competes with Hong
Kong's in a very small way. In a more macro perspective, the YRD and the PRD are
competing with each other in attracting investments from other provinces in China and
abroad. In this respect, the logistics industries of Shanghai and Hong Kong are
competing with each other on an indirect basis.
94

Table 4.1 Container and Air Cargo Throughput of Shanghai
Container Air cargo Throughput (Million
Throughput(Million TEUs) tons)
2000 5.6 0.878
2001 6.3 0.804
2002 8.6 1,075
2003 11.3 1,397
2004 14.6 1,936
2005 18.8 2,217
2006 21.7 2,532
2007 26.2 2,948
2008 28.0 3,019
2009 nla 2,982
Sources: Shanghai statistical year book 2009 and statistical data on CAAC
4.2 Taiwan Logistics Industry
Taiwan's logistics market scale is rapidly expanding, with estimates of GDP growth
to reach 90% and of 66% growth for the logistics market from 2000 to 2011 (The
Republic of China Yearbook, 2009). Taiwan's logistics industry is now at a rapid growth
stage (Tsai et aI., 2007). Taiwan is an island-based economic entity at the centre of the
Asia-Pacific region, and its prosperity is highly dependent on export trade. Its location
puts it at an advantageous position to make use of global production resources and
marketplace. In a report by the United Nations Conference on Trade and Development
(2007), Taiwan's deadweight of vessels was ranked as the 11th largest in the world as of
January 1, 2007, accounting for 2.54% of total world fleet. In container port traffic,
Taiwan was ranked as the world's seventh largest, and the Port of Kaohsiung in
particular has remained in the top six positions since 1980. The country has three
international container ports: Kaohsiung Harbour, Keelung Harbour (near Taipei), and
Taichung Harbour. Kaohsiung Harbour is the largest container port in Taiwan,
accounting for 75% of total container traffic, whereas Keelung and Taichung account
95

for 16% and 9% of total container traffi respectively (The Republic of China Yearbook,
2009). Located at the heart of the Asia-Pacific region, Kaohsiung Harbour offers an
average shipping time of 53 hours to five major ports in the region, making it the ideal
location for an international company's Asian distribution centre. With facilities
sufficient to serve as a large-scale port for commercial ships, Kaohsiung Harbour has a
tide range of 0.75 meters and an average temperature of 25°,C, making it one of Asia's
best ports. In addition, the Port of Kaohsiung is slated to start construction of an
Overseas Container Centre, which will be able to accommodate 10,000 ton ships. The
Logistics DistriPark (Kaohsiung) is one of the major DistriParks in Asia, including
Keppel DistriPark (Singapore), Alexandra DistriPark (Singapore), Pasir Panjan
DistriPark (Singapore), Hong Kong International Distribution Centre (Hong Kong), and
Yokohama Port Cargo Centre (Japan) (Lu, 2004). As of March 2008, among the major
container shipping companies, Taiwan's Evergreen Marine Corp. was ranked the fourth
largest container carrier in the world, whereas Yang Ming Lines and Wan Hai Line were
ranked 16th and 20th respectively (Yang et aI., 2009).
Taiwan's production model for the IT industry is in step with world trends because
production methods lean toward developing logistics management. Taiwan industries
are closely linked with the global supply chain because many major international IT
companies consider Taiwan a central purchasing location. Compared with other
Southeast Asian countries providing transportation services, Taiwan offers competitive
advantages with its free trade ports, R&D, and comprehensive processing services, all
of which bring added value to products. Furthermore, as a result of the significant
growth in foreign trade, the container shipping service industry in Taiwan has become
highly competitive, and the percentage of foreign maritime firms entering this market
has remained consistently high (Lu, 2007). Foreign container shipping companies that
have established Taiwan operations include Maersk SeaLand, Hanjin/DSR-Senator,
96

MSC, NOL/APL, K-Line, MOL, CMNCGM, Hapag-Lloyd, COS CO, and OOCL.
Increasing competition is likely to continue in the future, and will consequently force
container shipping service firms to build logistics service capabilities that are inimitable
and durable to reduce cost and increase service satisfaction in the global market (Lai,
2004). Container shipping is an international industry; findings from a study of
container shipping service in Taiwan could apply to liner shipping in other countries.
Taiwan's ODM/OEM industry has played an important role in system product
manufacturing since the 1980s. It has good, cooperative relationships with well-known
European and American brands, and is a key part of the international supply chain of the
high-tech industry. Taiwan also has top-quality human resources. With entrepreneurial
spirit, its employees are capable and experienced with state-of-the-art corporate
management. Taiwan's ODM/OEM manufacturers have played the roles of 'Total
Service/Solution Supplier' with strong design and manufacturing capabilities, flexibility,
and logistic capability. They are important partners of leading brand manufacturers and
are influential in the global industry. Taiwan has been the OEM and ODM centre of the
world for high-tech products, especially in the IT and electronic products manufacturing.
According to the statistics released by the Institute for Information Industry in 2008,
Taiwan's products make up 85% and 80% of installed Windows PC-related products
and network communication equipment in the global market respectively (The Republic
of China Yearbook, 2009). Since Taiwan is closely adjacent to Mainland China, it has
geographical and language advantages. At the same time, Taiwan demonstrates high
acceptability toward new technologies. Hence, it is in a position to become the R&D
and test centre for products aimed at the global ethnic Chinese markets. Taiwan
enterprises are not only the first-class suppliers of the world's leading companies; they
are also capable of developing subsystems. In addition, Taiwan businesses have close
connections with international brands, which enable the establishment of strategic
97

alliance for R&D and innovation. Furthermore, Taiwan businesses in Mainland China
enjoy the language and cultural advantages, which help multinational companies invest
and set up production facilities in Mainland China. Through the linkage with
international markets, Taiwan's industries have become the development test-bed for the
Asian market or the Greater China market, paving the way for entry to the emerging
markets in East Asia. After the opening of 'cross-Strait' direct links, Taipei has become
the hub of the dual golden routes in the Asia-Pacific region. The routes from Taipei go
north to Tokyo and Seoul, west to Shanghai, and south to Hong Kong, Singapore and
the capitals of the ASEAN countries. Furthermore, Taiwan's location is of economic and
military importance. It is the gateway between Europe, America, Japan, and the
booming Asia-Pacific markets. It is also the first choice for multinational company
headquarters in the Asia-Pacific region. Taiwan and Mainland China have signed six
agreements since the cross-Strait contact channels were re-established in May 2008
(The Republic of China Yearbook 2009). Cross-Strait negotiations have stepped up into
the normal phase, which help Taiwan continue its role as a stepping-stone for global
multinational companies to enter Chinese market and help local companies deploy their
business globally.
The global economic centre is moving from the West to the East. The marketplace
in focus is also moving from mature markets to emerging and developing markets.
Goldman Sachs uses three indices (workforce growth, capital reserves, and technology
growth) to forecast GDP growth rates of many countries, and selects countries for its
N-ll (next eleven) list, of which seven are Asian countries. This list indicates that the
Asia-Pacific region is becoming the centre of global economy. China and India are at
the centre of the Asia-Pacific region (The Republic of China Yearbook, 2009). Their
strong economies have made them the new driving force of the world economy. Thus,
Taiwan is geographically and culturally close to the centre of the world's biggest
98

growing economies.
With such advantages, Taiwan businesses can set up overseas production bases in
Mainland China. Taiwan's modularisation and mass production capabilities and many
key technologies make it the important supporting force for East Asia to become the
largest production base in the world. In 2006, Mainland China accounted for 82.15% of
Taiwan's outward investment, the highest. followed by the six ASEAN countries and the
US, accounting for 21.98% and 16.44% respectively, of Taiwan investments (The
Republic of China Yearbook 2009). The proportion of overseas production in total
orders received increased to 32.97% from 20.11% in 2001 (it was 10.65% in 1998).
Mainland China is the major OEM region for overseas production, accounting for
28.01 % of total orders received (The Republic of China Yearbook 2009).
Taiwan is actively promoting the normalisation of cross-Strait trade and lifting
unnecessary restrictions so that it can completely link to the international value chain
and create a three-win situation for Taiwan, foreign companies, and China. With
cross-Strait industrial cooperation, Taiwan industries will be integrated into the Greater
China economic circle, creating new investment opportunities for Taiwan and the
foreign companies in Taiwan. Taiwan businesses can further become the best partners
for multinational companies operating in the Asia-Pacific region. With the normalisation
of cross-Strait trade, both local and foreign companies can completely make use of
Taiwan's potential advantages. These companies can establish cooperative patiner
relationships with multinational companies through the 'platform' of Taiwan, enhance
their cross-strait industrial deployment, and increase their competitiveness in the global
market.
Currently, Taiwan has two international airports (i.e., Taoyuan and Kaohsiung) and
six international harbours (i.e., Kaohsiung, Keelung, Taichung, Hwalian, Anping and
Suaou, in the order of their business volume). Taiwan has complete international
99

transportation facilities and logistics capability. Furthermore, Taiwan has passenger
transportation systems, railways, highways, and domestic airports for domestic
long-distance transportation. Taiwan also has complete railway networks throughout the
island. The high-speed railways started operations in 2005, which has tremendously
reduced the travel time between North and South Taiwan. Domestic airports are
available in Taipei, Taichung, Hwalian, Taitung, Chiayi, Tainan, Pingtung, Kinmen, and
Machu. The metropolitan areas are being developed with MRT systems, including the
Taipei MRT and the Kaohsiung MRT systems, making metropolitan life more
convenient.
In a study comparing Hong Kong and Kaohsiung, Lu and Yang (2006) find that the
Port of Hong Kong's competitive advantage is related to factors with regard to resources,
port activity, political risk, policy, and economic activities (specifically, among these
factors are labour quality and skilled labour force, communication facility, information
system, simplified customs procedures, efficiency of port operations, frequency of
sailings and flights, guarantee of foreign investment policy, relaxation on foreign
exchange, political stability, local regulatory environment, government administration
efficiency, transparency of foreign labour policy, and per capita income). In contrast,
Kaohsiung is better than Hong Kong in terms of the support of relevant firms, proximity
to raw material sources, and transport linkage.
Before 2000, the Taiwan logistics industry had lost, and the Hong Kong and
Shanghai logistics industry had gained, in terms of total throughput due to the shift of
manufacturing industry from Taiwan to the PRD and the YRD. Since the beginning of
2000, Taiwanese shipping companies have been allowed to solicit ocean traffic from the
Mainland China ports. Direct links on air services between Mainland airports and
Taiwan airports were also established in 2009 when the Taiwanese airlines, China
Airlines and Eva Airlines, started aggressively soliciting air cargo traffic in the
100

Mainland, transhipping via Taiwan. Both Taiwanese shipping lines and airlines have
successfully solicited container and air traffic in the PRD, transhipping via Taiwan at
the expense of 2PL operators in Hong Kong.
4.3 Singapore Logistics Industry
Its port, airpolt, and industrial estates have been central to Singapore's economic
success. Singapore's international competitiveness 111 transport IS under increasing
threat from its regional neighbours, particularly in sea and air transport. Its
neighbouring countries are in the process of improving their infrastructure and pursuing
policies to promote themselves as alternative hubs for sea and air traffic in the region.
Singapore's regional hub position is increasingly challenged.
• The Port of Singapore as a regional hub
The Port of Singapore is clearly ahead of its regional competitors. It has been
competing with Hong Kong as the world's top container port since 1992. and has
become the world's top container POlt since 2005. Table 4.2 illustrates the container
throughputs of the ports of Hong Kong and Singapore in the last ten years.
101

Table 4.2 Container throughputs of the port of Hong Kong and Singapore
Year Hong Kong (Million TEUs) Singapore(Million TEUs)
1999 16.2 15.9
2000 18.1 17.1
2001 17.8 15.6
2002 19.1 16.9
2003 20.4 18.4
2004 21.9 21.3
2005 22.6 23.2
2006 23.5 24.8
2007 23.9 27.0
2008 24.3 29.0
Source: Hong Kong Shipper's Council & Singapore Port Authority
The Port of Singapore is located along the Straits of Maiacca, which is the main
shipping route between East and West. Oil Companies' International Marine Forum
estimates that over 600 ships transit the Straits every day (The Business Times, 1997).
The importance of this shipping route has not diminished over time. With deeper
draughts, large ships have been able to serve Singapore, which is blessed by nature
without typhoons and other natural calamities that create chaos for port operations and
freight movement.
Port efficiency and quality
Murphy et aI., (1992) find port charges an important determinant of port choice.
Singapore's direct port charges are much higher than other ports in the region. The
neighbouring countries are constantly trying to develop their ports in order to attract
more cargo and shipping lines to use their port facilities. Malaysia, in particular, has
been trying to reduce the volume of cargo transhipping to the Port of Singapore by
lowering its port charges, improving infrastructure and efficiency, and using other
measures, including the imposition of additional levies for cargo coming out of and
entering into Singapore.
102

A number of distribution parks and the latest information systems are operated with
advanced equipment in 37 berths at the Port of Singapore Authority-run port and 5
berths at Jurong Port. The efficiency of the Port of Singapore, both in terms of the
utilisation of the port's assets, such as cranes, berths, terminal areas, labour and tug, and
operational efficiency reflected in port charges, places it in the same league as other top
ports of Hong Kong, Rotterdam, and Kaohsiung.
Competition from neighbouring ports
Singapore is the world's busiest container port, served by 200 shipping lines that
connect it to 600 ports in 123 countries (Maurno, 2006). In 1994, none of the cargo
from Penang was transhipped through Port Klang. In the first nine months of 1996,
60,000 TEUs from Penang were shipped through Port Klang, reducing the cargo
transhipped through the Port of Singapore to 57%. In 1990, approximately 70% of its
four million TEU s were accounted by containers transhipped from neighbouring ports
(Airriess, 1993). On October 16, 1997, Business Times reported that 50% of Malaysia's
sea cargo was shipped via the Port of Singapore. The Malaysian transhipment Port of
Tanjung Pelepas, which was hardly known in international shipping as of the year 2000,
has transformed itself into the largest container port in Malaysia by 2005, weathering
the increasingly tough competition from Singapore.
The Thai Transport Ministry also announced plans to cut dependency on
transhipments through Singapore in light of its high port tariffs. Incentives have been
offered to shipping lines, such as lower handling charges for master vessels in return for
loading their cargo directly at Laem Chabang in Eastern Thailand. The Philippines has
also been seriously marketing the location, good infrastructure, and natural harbours of
Subic Bay as a regional port hub since the expiry of the lease agreement between the US
and the Philippines. Although these ports are currently way behind Singapore in terms
of throughput and infrastructure, they are also geographically well located to service
103

Asia; with adequate investments in technology and infrastructure, in time, they can
become a real threat to Singapore as a regional port hub.
Based on the determinants of hub port choice, the Port of Singapore has fared much
better than its regional counterparts. However, other countries in the region are exerting
efforts to divert cargo from Singapore and promote their ports as transhipment ports
through various incentives. As 80% of throughput of the Port of Singapore relies on
transhipments, the port has to continue attracting transhipments by its high level of
efficiency, reliability, and lower total supply chain costs.
Airport and air cargo traffic
Globalisation and the liberalisation of international trade remam the pnme
motivation forces behind the tremendous change that is taking place in the airport
transport industry. Singapore Airlines is one of the main proponents of liberalisation
and greater deregulation of air services. Singapore's Changi Airport has served as a
major regional hub and was the best airport for many years before Hong Kong's airport
was relocated to Chek Lap Kok in 1998. However, in the light of intense competition
among airlines and airports within the ASEAN countries, whether this comparative
advantage is maintained remains to be seen.
In the early 1970s, the facilities of the old airport at Paya Lebar Air Base could not
cope with the rapid increase in passenger demand after the introduction of wide-body
aircrafts such as Boeing 747 and the McDonnell Douglas DC-lO. The new airport at
Changi became operational with two runways and three terminals in 1981. Airfreight
tonnage increased more than 16-fold between 1975 and 1995. The existing facility is
capable of handling 4.28 million of air cargo until 2012.
Transhipments account for 50% of Singapore's total air cargo throughput. As
displayed in Table 4.3, Singapore's total cargo throughput has lagged behind Hong
Kong's by a substantial margin.
104

Table 4.3 Air cargo throughput of Hong Kong and Singapore in million kgs
Year Hong Kong's
Throughput
1999 1.974
2000 2.241
2001 2.074
2002 2.479
2003 2.641
2004 3.094
2005 3.402
2006 3.580
2007 3.742
2008 3.627
Source: Hong Kong Airport Authority
(http://www.Changiairportgroup.com.sg/cag/html)
Singapore's
Throughput
1.50
1.68
1.51
1.64
1.600
1.780
1.830
1.910
1.890
1.850
Local traffic contributes 50% to Singapore's total aIr cargo throughput.
Manufacturing activities have been and will continue to be the backbone of the
international and intercontinental traffic. Thus, the shift of electronic manufacturing
activities to low-cost locations such as China and Brazil has weakened Singapore's total
air cargo throughput. Transhipments from neighbouring countries contribute the other
50% of Singapore's total air cargo throughput; however, this cargo traffic is under
pressure from neighbouring countries such as Malaysia and Thailand, which are
catching up very fast by improving their air cargo infrastructure and narrowing the gap
in service quality.
105

Third-party logistics support
In the area of 3PL development, Maumo (2006) states that Singapore offers the
world's best logistics capability and performance. In a survey conducted by the World
Bank in November 2007, Singapore came on top among 150 countries using a
"Logistics Performance Index' that measured customs procedures, logistics costs,
infrastructure quality, the ability to track and trace shipments, timeliness in reaching
destination, and competence of the domestic logistics industry. According to Brian Lutt,
president of Singapore-based APL Logistics, a subsidiary company of Tamasak, the
investment arm of Singapore Government, the connectivity that Singapore offers from
sea, air, land, to flow of information, flow of finances, flow of physical documents, flow
of physical cargo is unique in the world.
Twenty of the world's twenty-five leading 3PLs have established a presence in
Singapore, whereas 6,000 multinational corporations use the hub for logistics.
Approximately 3,600 of those multinationals have located their regional headquarters in
Singapore, including Boeing, Citigroup, ConocoPhillips, Exxon Mobil, Lockheed
Martin, Raytheon, IBM, and Lenovo. Many of these multinationals use Singapore for
transportation and distribution alone. Louis Vuitton, Moet and Hennessy (L VMH)
established a regional distribution centre in Singapore, and from there they distribute
more than 50 brands of luxury goods, such as Christian Dior and Givenchy, to the
Asia-Pacific region, the US and Canada. Clearly, 3PL logistics development III
Singapore is ahead of its neighbouring countries, including Hong Kong.
Statistically, in terms of total air cargo throughput, Singapore's forwarding industry
has a lower market share than its counterpart in Hong Kong. As airfreight forwarders
gradually dominate the airfreight sector with their market share up from 76% in 1997 to
85% in 2007 (MergeGlobal, 2008), Singapore's forw"arding industry appears unable to 106
manage the relationship with its end customers as closely as its counterpart in Hong
Kong.
While Hong Kong and Singapore are competing to be the leading regional CL hub,
the Singapore's freight forwarding industry has posed a very low threat to Hong Kong's
as they serve different catchment areas.
4.4 India Logistics Industry
International cargo traffic is mainly sent by sea and air. However, approximately
90% of global cargo is moved by ships. In 2005, the Jawaharal Nehru Port Trust
(JNPT)-run port in Mumbai handled 3 million TEUs or 60% of India's total cargo value.
In contrast, Singapore handled 24.8 million TEUs, and Hong Kong handled 23.2 million
TEUs (Ray, 2005).
Together with Brazil, Russia, and China, India has been grouped together by
economic analysts as the BRICs. Plentiful natural resources, relatively young population
(except for Russia), and large land areas are the common characteristics of BRIC
members (Wu and Lin, 2008). Economists suggest they will assume major roles in the
energy, natural resource, and capital resource markets, and in the future will become the
world's leaders in manufacturing and consumption. Another set of developing countries,
the N-11, are viewed as having great economic development potential that could rival or
surpass the BRICs (O'Neill et aL 2005). The N-11 consists of South Korea, Indonesia,
Vietnam, the Philippines, Pakistan, and Bangladesh in Asia, Nigeria and Egypt in Africa,
Mexico in North America, Iran in the Middle East, and Turkey. Many multinational
companies have eyed these emerging markets among the BRICs and N -11 members as
primary investment destinations (Zhang, 2007) to save on labour cost and gain decisive
competitive advantage. In this regard, logistics is an important component of a nation's
economy since it affects productivity, distribution efficiency, interest costs, and energy 107

costs (Razzaque. 1997). Following China's rise, India is set to emerge as a new
economic power, and the scale of its logistics sector will inevitably expand as a result.
Ujjainwala (2008) finds that India spends 14% of its US$ 691 billion GDP on
logistics, and transportation accounts for 35% of logistics costs. In the last decade, total
transport demand in India has grown by 10% annually. India's domestic transport system,
however, has serious service deficiencies that are, by international standards, highly
inefficient, and this deficient system has become a major barrier to economic growth
(Langley et aI., 2007). According to the Indian Ports Association (IPA), the turnaround
time at Indian ports improved from 8.5 days in 1996-1997 to approximately 3.5 days in
2006-2007. However, this is still slow if compared to the turnaround time of 1-1.5 days
at the major international ports. For example, the turnaround time at Hong Kong's port is
only 10 hours (CILT Institute of Logistics). Efficient port handling can lead to lower
tariffs on export, which, in turn, improves the competitiveness of a country's product in
international markets (Gonzalez and Trujillo, 2007). India has already shown its
exceptional ability in the service sector, and it intends to become a global
techno-manufacturing hub (Johnson, 2005). India has experienced massive output
increase in recent years, with its economic growth rate estimated at around 8.5% per
year in 2006; GDP per capita is rising 7.5% annually, a rate set to be doubled in a
decade's time. Accordingly. the government's target of reaching GOP growth of 10% in
2010 is achievable (ISCC, 2007). With GDP growing at over 9% per year and the
manufacturing sector enjoying double-digit growth rates, India's logistics industry is at a
turning point and is expected to reach a market size of over US$ 125 billion a year in
2010 (OECD. 2007). However. India's performance in several aspects, compared with
other leading nations and its BRIC counterparts, is clearly lagging behind, suggesting
there is a long way to go for India (Pillania, 2007).
Using a revealed comparative advantage (RCA) model introduced by Balassa (1965)
108

to assess the competitiveness of the transportation service sector, India was in decline
between 2000 and 200 I but rebounded in 2002 and 2003. India's transportation services
sector is the most competitive among the BRICs and trails only France and Japan among
the G7 countries, and Egypt and Korea among the N-ll countries (Wu and Lin, 2008).
Using RCA, in the period 2000-2003, India's freight service sector interestingly was
more competitive than those of any of the other BRIC countries and trailed only Japan
among the G7, and Egypt and Korea among the N-ll countries (Wu and Lin, 2008).
Although India's transportation and freight services were at a level similar to those
found in G7, JNPT 's container ports were found to be inefficient between 2000 and
2005, indicating a need for an overhaul of equipment (Ray, 2005). The port's
management needs to upgrade the facility's equipment and machinery if they hope to
accommodate the growing volume of imports and exports expected to be shipped
through the port in the future. At the same time, the port must also rapidly expand its
overall capacity to avoid bottlenecks because India's exports are growing at 20% a year.
Infrastructure congestion is another key challenge that India needs to deal with (Langley
et aI., 2007). The logistics industry in India is hampered by poor infrastructure in roads,
communication and ports, and complex regulatory structures.
Langley et aI., (2007)'s findings on India's insufficient logistics infrastructure are
echoed by Kenneth Glenn, president of APL for South Asia, who states that the lack of
world-class infrastructure and high port and inland costs are continuous factors that will
limit India's economic progress. According to Glenn, as global sourcing and
manufacturing continue to shift to Asian locations, foreign investors would choose to
invest near ports with world-class efficiency in port infrastructure.
By late 2008, approximately 25% of world container ship capacity is comprised of
vessels with at least 6,000 TEUs. India does not yet have a port that can handle this class
of ships. Glenn attributes the acute congestion to the imbalance of container trade toward
109

Mumbai's .lawai Nehru Port Trust (NPT), which accounts for approximately 60% of
India's total volume.
India's pOltS handle over 80% of the country's merchandise trade; however, the
performance of India's ports has never been satisfactory (De, 2003; De and Ghosh, 2002;
Gosh and De, 2000). Currently, port infrastructure in India is managed by the concerned
ministry or regulatory agency or government-appointed trustees and autonomous bodies.
The objective of having ports under the public sector is to have benefits for service
seekers. However, experience shows that ports under the public domain are not
adaptable to the changing needs of users, and that the services offered suffer due to
bureaucratic delay (De Maton, 1997). This archaic organisational structure is not only
incapable of broad reforms, but also deters private sector initiatives and inhibits
operational effectiveness in terms of capacity expansion and performance of ports
(Sajikumar, 2008).
Public sector ports largely fail due to factors such as rigidity in the hierarchy in
making decisions, labour's political affiliations (which lead to slowness and work
stoppage, poorly trained labour, and low equipment handling), inability to raise
resources on time (as it requires budgetary allocation), slowness in adopting modem
technology, and failure in providing choices of services and in fostering competition.
Sajikumr (2008) argues that ports in India can be better served by the private sector
because decisions are flexible, and the private sector is better equipped to meet changing
market requirements.
The current capacity available at Indian major ports for container traffic 1S
approximately 4 million TEUs, which will be increased by 2010 when traffic is
estimated to reach 8.66 million TEUs (Jose, 2005). An ESCAP study on port
development strategies has concluded that in order to handle the anticipated port
container traffic in 2011, the South Asian region alone will require approximately 40
110

new berths (Paul, 2005).
Drewry Shipping Consultants reports that a 10,000 TEU capacity ship results in
37% operating cost savings compared with a 4,000 TEU capacity ship. With significant
technological development in container shipping, single engine vessels of 10,000 TEU
capacity and above can now be built. The Chinese shipping line casco ordered from
Hyundai Heavy Industries four super-post-Panamax ships of 10,000 TEU capacity, each
costing approximately US$ 127 million, which were delivered last year. An ESCAP
study also revealed that by 2011, of the 490 large container vessels that will be in service
globally, approximately 130 ships will be of 10,000 TEU capacity and above. Thus,
India will need a mega-container transhipment terminal in order to capture this
transhipment business.
With existing ports and terminals in need of deeper channels, alongside depths, and
many new ports being set up, dredgers are in huge demand. Thus, India is taking to task
the various agencies responsible for expanding transport infrastructure and services to
draw up long-term plans to cope with the rapid growth in demand (CILT World, 2006)
(See Figure 4.1).
111

Chart 3: Ranking of Container Ports of the World, 2006 ('000 ~)
25.0 ,-"" ~ r-
<'l ~ -.....
20.0 ;::i
1.5.0
10.0
.5.0
Sou=: ]oumaJ of CoII'tIm/a, 2006
Figure 4.1 Ranking of container port of the world
The choice in 3PL services reveals positive and significant impact on business
performance; however, 3PL practices are still at a nascent stage in India. A growing
awareness that competitive advantage comes from the delivery process as much as
from the product has been instrumental in upgrading logistics from its traditional
backroom function to a strategic boardroom function (Razzaque and Sheng, 1998). A
company may consider providing the function in-house, or it can outsource the
function and pay for the service. According to a number of studies, 3PL services are
widely used in North America (Lieb, 1992; Lieb and Randall, 1996) and Europe (Lieb
et aI., 1993). Similar studies have focused on logistics issues in the Asia-Pacific region
(Millen and Sohal, 1996), Singapore (Bhatnagar et aI., 1999), and Indochina (Goh and
Ang, 2000). Over the last few years, these areas have benefited from the use of 3PL
services. However, currently, there has been no comprehensive study reported in the
literature that has focused on 3PL services in India (Sahay and Mohan, 2006). A study
by Sahay and Mohan (2006) has revealed poor roads, low-quality trucking services,
112
limited access and connectivity to rural markets, slow speed and low load factors in the
rail transport system, poor utilisation of air cargo space, and poor, inefficient seaports
and shipping facilities and infrastructure.
All the above-mentioned factors have adversely affected the logistics performance
of India both in terms of lead-time and costs (Korgaonker, 1990a, 1990b). However, a
host of policy changes currently underway, including the introduction of an 'open sk.y"
policy, introduction of integrated cargo management system at four metro airports,
granting of infrastructural status to the shipping industry, and tax benefits for the
development of transport mode, are expected to bring about a positive change in the
Indian transportation environment. These will provide vast opportunities for companies
offering logistics services in the country and hence augurs good news for Indian
organisations to reduce logistics costs by using 3PL services to enhance supply chain
efficiency.
Limited research has been done on CL activities. The author has found no research
work on forwarding logistics. Further research should focus on managing 3PL
relationships, selection, and contract management of 3PL services providers,
particularly on forwardi.ng logistics for building collaborative supply chain partnership;
future studies should also focus on identifying critical success factors for 3PL
implementation and establishing performance measures or long-term 3PL relationships.
India's logistics industry does not directly compete with that of Hong Kong.
However, the growth of manufacturing industry in India may have an indirect negative
impact on the Hong Kong logistics industry. Many economic journals have
hypothesised on the challenge posed by the India's manufacturing industry to China's
because of the sheer size of India's population. The opening of China since 1978 has
captured the opportunities in manufacturing industry created by the globalisation
process. Thus, it requires twice the effort of India to catch the same of the opportunities
113

captured by China. Furthermore, without the support of an efficient logistics industry,
India will find it more difficult to compete with China in the manufacturing industry.
Little evidence exists that the India's logistics industry poses any significant threat to
Hong Kong.
114

Chapter Five Research Method
5.1 Research Philosophy
Researchers may use different methodologies to investigate similar types of
problem around the world because there is no absolute method of exploring a particular
research problem (Adams et ai., 2007). Research work consists of diligent search,
studious inquiry, and investigation or experimentation aimed at the discovery of new
facts and findings. Broadly, it may relate to any subject inquiry with regard to collection
of information, interpretation of facts, and revision of existing theories or laws in the
light of new facts or evidence. Research is undertaken to enhance our knowledge of
what we already know and to extend our knowledge regarding aspects of the world of
which we know either very little or nothing at all, enabling us to understand better the
world we live in. In the business arena, research is generally undertaken in' order to
make sound business decisions.
Broadly speaking, there are two main domains of research frequently observed in
the literature: the empirical and the theoretical. 'Empirical", in this context, means
'based on evidence from the real world'. This is in contrast to 'theoretical", which refers
to ideas that are abstract or purely analytical. Both methods are used in business
research. Sound evidence is superior to arguments based on false evidence, limited
evidence, or no evidence. Evidence has to be collected from the social world around us,
and this requires doing empirical research. In this thesis, the author uses the empirical
research approach but placed within the context of the TeE, RBV, and LSA theoretical
frameworks. To be specific, there are two streams of empirical studies: qualitative and
quantitative research. The qualitative method investigates the 'why' and 'how' of
115

decision making, not simply the 'what', 'where', and 'when'. Therefore, smaller but
focused samples, rather than large samples, are more often needed. Qualitative methods
produce information only on the particular cases studied, and any more general
conclusions are only hypotheses (informative guesses). Quantitative research refers to
the systematic empirical investigation of quantitative properties and phenomena, and
their relationships. Quantitative research aims to develop and employ statistical models,
theories, and/or hypotheses pertaining to phenomena. The process of measurement is
central to quantitative research because it provides the fundamental connection between
empirical observation, theory, and expressions of quantitative relationships. This
research adopts a combination of these two streams of thinking to gain a better
resolution to the research questions. In particular, in the first stage, the author used the
qualitative approach and conducted focused interviews in order to gain a deep
contextual understanding of the research questions. Based on this, the author then
conducted a large-scale survey to generate data that would enable the research questions
to be answered more fully. The philosophical approach is therefore a combination of the
tenets of normative and positive economics. This overall approach therefore determined
the design of the research in its various stages.
Distinguishing the research method from the research methodology is of vital
importance. A research method is a way of conducting and implementing research,
whereas research methodology is the science and philosophy behind the research. The
latter goes into the heart of how we know what we know and allows understanding of
the very strict constraints placed upon our concept of what knowledge actually is.
Furthermore, this allows us to understand the different ways in which knowledge can be
created, and what might be right or wrong. The whole purpose of research is to extend
and deepen our knowledge of the world.
A suitable approach for a research study is to go through the process of organising,
116

planning, and conducting research and then analysing, and reporting research findings
(Popper, 1979). Possibly, this can be conceived as a research cycle (Fig. 5.1). This is
drawn from Popper's (1979) original exposition of this systematic procedure. Adams et
aI., (2007) also summarise the stages of research, which includes the following: 1)
specify the real problems; 2) set up a model (from theory); 3) formalise the model; 4)
solve the problem; 5) interpret the results; 6) validate the model; and 7) generalisation.
Formulate
problem Sell solution
Generate Hypothesis
on research questions implement/monitor
Collect Data ---.
Explore Data Model
Figure 5.1 The Research Cycle
The cyclical nature of this is to be found in the component 'implement/monitor'
because it is at this stage that we know if our model is actually valid and working as
theoretically as expected. If this is not the case, we need then to re-think the problem
itself, and more than likely, it will be necessary to re-formulate the problem. At this
point 'selling the solution' needs to be bypassed since the 'solution' has not worked
5.2 Research Design
Based from the research questions and the theories, an operational framework was
developed to guide the research design (see Fig. 5.2). The first research question is 117

whether the Hong Kong logistics industry will continue to serve the manufacturers in
the PRO. To answer this question, the author evaluated the manufacturers' perception of
the logistics performance, which is used as a proxy for the desire of using Hong Kong
logistics service. The author relies on TCE and RBV to explore factors that influence
logistics performance. RBV argues that a firm's performance is determined by its
resources, which are the capabilities and procedures. In this research, the author uses the
practice of JIT supply chain as a proxy for logistics resources. This is because JIT
supply chain includes very advanced operations and cannot be easily copied by
competitors. Therefore, it meets the VRIN requirement (valuable, rare, inimitable, and
non-substitutable). In addition to resources, the TCE argues that competitive advantage
is also influenced by transaction cost, which is determined by asset specificity and
uncertainty.
In this research, asset specificity is represented by the integration between
manufacturer and logistics service provider, and uncertainty is represented by the legal
system and customs. The integration means that the manufacturer and logistics service
provider need to develop procedures and make investment jointly, which are not shared
by others. Therefore, it is a relationship-specified asset. Business in China is
characterised by unpredictability in the efficiency and effectiveness of legal system and
customs. Therefore, the legal system and customs are critical sources of uncertainty that
managers must consider. The second research question is whether the PRO will
continue using Hong Kong as the airport and seaport for their products. To answer this
question, the author investigated the logistics service providers' anticipation of the
market as a proxy.
If the logistics service providers have a very optimistic expectation for the future,
this means that the airport and seaport of Hong Kong will continue to serve the PRO
area. LSA theory is used to determine the factors that influence logistics service
118
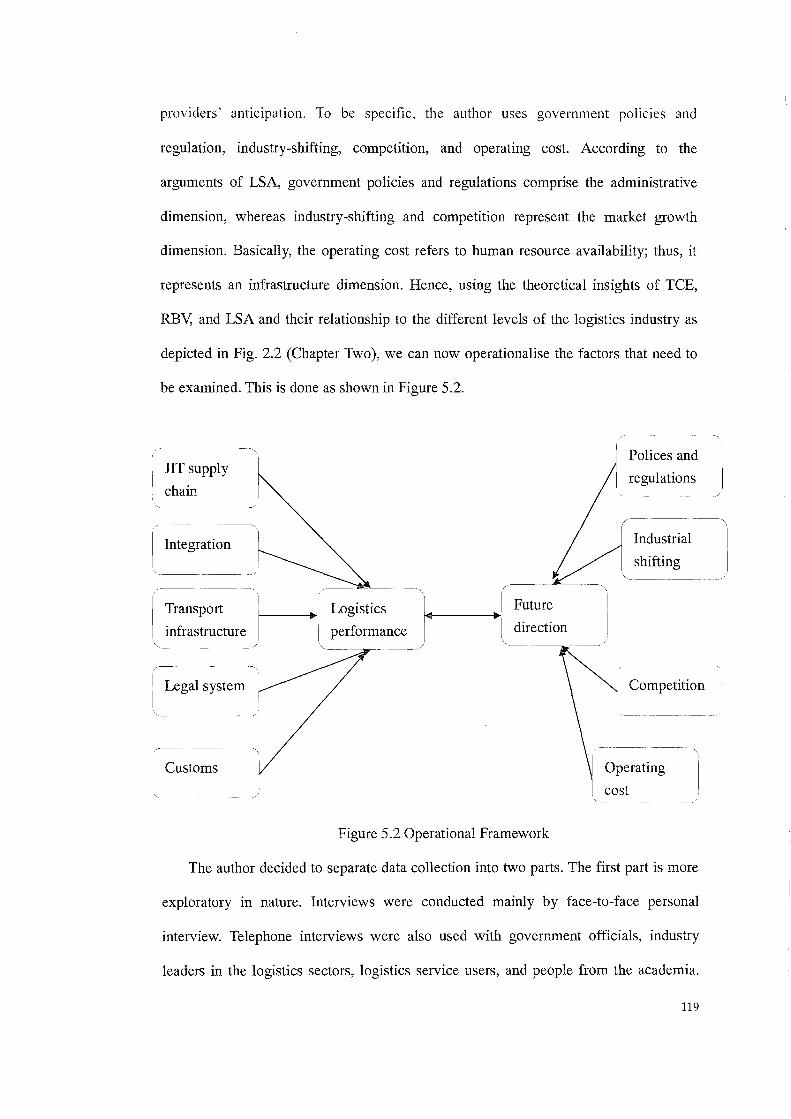
providers' anticipation. To be specific, the author uses government policies and
regulation, industry-shifting, competition, and operating cost. According to the
arguments of LSA, government policies and regulations comprise the administrative
dimension, whereas industry-shifting and competition represent the market growth
dimension. Basically, the operating cost refers to human resource availability; thus, it
represents an infrastructure dimension. Hence, using the theoretical insights of TCE,
RBV, and LSA and their relationship to the different levels of the logistics industry as
depicted in Fig. 2.2 (Chapter Two), we can now operationalise the factors that need to
be examined. This is done as shown in Figure 5.2.
JIT supply
chain
I Integration k ~
~~-= __ "i ~ ___ _
Transport L--..[ Logistics
infrastructure I - I performance ~/ \
Legal system
Customs
Polices and
regulations
-----_ .. _-
/----
/ J' Industrial
L 1\ shifting
'1~ .. ----+'.J, Future I I direction
'--
I Competition I
Operating
cost
Figure 5.2 Operational Framework
The author decided to separate data collection into two parts. The first part is more
exploratory in nature. Interviews were conducted mainly by face-to-face personal
interview. Telephone interviews were also used with government officials, industry
leaders in the logistics sectors, logistics service users, and people from the academia.
119

The interviews were guided by semi-structural protocols, which are based on the
literature and the author's personal experiences (see Appendix I). Then, based on the
results of these exploratory interviews, the author designed a large sample survey to
explore further the competitiveness and challenges faced by the Hong Kong logistics
industry. The questionnaire was sent to both manufacturers and LSPs, who were also
both the suppliers and customers of logistics services. This design could gather the
opinion of the main players in the market, which helped the author gain a more holistic
understanding of the industry. The following chart illustrates the design of this research
(Figure 5.3).
120

I n-depth literature
review
Semi-structured
interview protocol
Personal interviews with government
officials and industry leaders
Survey questionnaire
design
Sampling and data
collection
Statistical data
analysis
Figure 5.3 Research design
5.2.1 First stage: exploratory interviews
A study (Converse and Presser, 1986) has found that personal interviews refer most
often to a one-to-one situation where a single interviewer administers an interview
schedule to a single respondent. Interviews can be structured and unstructured.
Structured interviews are designed to collect either quantitative or qualitative
information from a small to mid-size sample. Structured interviews assume that there is
a common language for all potential respondents; question formats have equal meaning 121
to all. In contrast, unstructured interviews are designed to collect qualitative information
from a small-sized sample. This is cdled intensive interviewing or in-depth
interviewing. These interviews assume that the respondents have a particular knowledge
and experience on which they can elaborate (Chong, 2007). Foddy (1992) explains that
in these interviews the situation. has been analysed before the interview, and the
researcher is seeking additional information. The interview guide specifies the topics on
which information is sought Such interview focuses on the respondent's subjective
experiences, and it allows respondents to describe in detail the situation as it is
meaningful to them and allows the interviewer to freely probe and ask follow-up
questions (Chong, 2007).
Personal interviews are viewed as the most effective in terms of response rates,
whereas questionnaires by mail/email surveys tend to display low response rates (De
Vaus, 1996). Personal interviews generally provide the greatest flexibility in terms of
question design, and are viewed as an effective method when dealing with complex
research topics (Foddy, 1992). The greatest challenge in interviewing is to minimise the
interviewer's influence on the respondent Beed and Stimson (1985) explain that the
most important concerns in an interview are the following: interviewer recruitment and
training, scheduling the interviews, preparing the materials needed, organisation and
supervision of field work, follow-ups for missed interviews, coding and transcribing
interviews, and last, analysis and interpretation of findings.
5.2.2 Second stage: survey and statistical analysis
Expert opinion from personal interviews has been used as the basis of
questionnaire design. The questions asked in a survey must be clear and unambiguous.
The person being surveyed may not understand the intention if the questions are unclear.
Moreover, the meaning of the questions must be absolutely clear, especially if the
researchers are not present while the respondents are taking the survey (Adams et al.,
122

2007). Research by Sudman and Bradburn (1982) shows that a questionnaire is the
product of the research problem, the theory, method of administration, and methods of
data analysis. Babbie (1983) and De Vaus (1996) cite three basic steps in the design of
the questionnaire. In the case of this research to ascertain the challenges and
opportunities of the Hong Kong logistics industry, three basic steps were followed. First,
a conceptual model was created. This includes outlines of the research problem, the
purpose of the research, research design, variables, and hypotheses. Second, the
questionnaires were designed and produced. Third, questions were constructed to collect
data to be measured at the designed level and to answer the research questions by means
of adequate responses.
• Questionnaire design
The author designed two kinds of questionnaires that were sent to manufacturers
and logistics service providers based on the results of the personal interviews. The
anchor questions asked are variations of 'Please indicate whether you agree or disagree
with each statement'. The Likert scale (from 1 = strongly disagree to 7 = strongly agree)
is used to capture respondent opinion on the surveyed questions. In each questionnaire,
a short paragraph introduces the background and objectives of the research. The
manufacturer questionnaire includes four sections. Section A features the company
profile, which aims at gaining the demographic information, such as name of the
company, contact information of the informant, size of the company (number of
employees and annual sales), industry, and ownership. Section B measures the
performance of logistics service providers. To be specific, the author evaluated the cost,
quality, "flexibility, and satisfaction of logistics services from the buyers' perspective.
Section C measures two supply chain practices used by the manufacturer. The first part
is on the degree of JIT operations in the supply chain. The other practice is on the
degree of manufacturing logistics integration. Integration refers to the degree to which
123

the manufacturer can strategically collaborate with their logistics service providers and
collaboratively manage the intra- and inter-organisation processes to achieve effective
and efficient flow of products and services, information, money, and decisions with the
objective of providing maximum value to the customer at low cost and high speed. To
capture the tenets of the integration, the author measured manufacturer-service provider
integration by the degree of information sharing between the two parties, working
together, and joint decision making. Section 0 is about the role of Mainland China's
government. In this part, the author tried to assess the impact of the legal system and the
efficiency of the customs system.
For the logistics service provider questionnaire, the first part is also used to capture
demographic information, such as company name, information on the informant,
services provided, ownership, annual sales, and locations of operations and customers.
Section B evaluates the impact of policies and regulations, such as industry upgrading,
appreciation of RMB, tax regulations, and the new labour law, on logistics operations.
Section C explores the operating cost of service providers, mainly the human' resource
cost. Section 0 relates to the competition environment, which is measured by the
appreciation of RMB and globalisation. Section E focuses on the effects of industrial
shifting. Through the literature review, the author suggests that several factors, such as
the new labour law, corporate tax policies, government policies, and appreciation of
RMB, are pushing manufacturers from the core the PRD areas to the Pan-PRD area
(Guangxi, Guizhou, Jiangxi, and Fujian), which has a cost advantage. Whether this
provides an opportunity for Hong Kong logistics service providers to expand business
or a threat for losing LSA has yet to be established. Logistics service is closely tied to
manufacturing operations; thus, the purpose of this section is to gain an insight on how
this trend in manufacturing affects the Hong Kong logistics industry. Section F asks for
possible actions and policies that might increase the competitiveness of the industry,
124

such as 24-hour cross-border customs, lower land cost, and 'open sky' policy. In Section
G, the author asks respondents about why they import/export through/not through Hong
Kong. The factors include customs, tax, and land cost. Finally, the author asks whether
the service provider will expand their business. In the case of both survey questionnaires,
a pre-test was undertaken to ensure that all questions were being properly understood by
respondents and also that they were being understood in the same way as the author
defined the items.
• Sampling
This thesis is an exploratory study, and there is no existing database containing the
information that can help the author analyse the challenges and opportunities for the
Hong Kong logistics industry. Moreover, the perceived subjective data is more suitable
in capturing how managers make real decisions. Thus, instead of using a database, the
author collected first-hand information. To explore the research questions, the author
collected data from manufacturing companies and logistics service providers in the
Pearl River Delta (PRD) and Hong Kong. The author used random sampling to collect
the data. In Hong Kong, there is hardly any manufacturing activity per se. Instead, most
Hong Kong companies keep their manufacturing facilities in China, but use Hong Kong
as a hub to control and direct the flow of materials, finished goods, information,
logistics, and finances. In contrast, the PRD area has very close connections with the
Hong Kong logistics industry. Manufacturers in the PRD forms the main customers for
Hong Kong's logistics service and the LSPs in the PRD are the main competitors. To
gain a representative sample frame for manufacturers, the author used the membership
directory of the Federation of Hong Kong Industries (FHKI) as the sampling pool.
FHIK was established in 1960 under Ordinance Chapter 321 of the Laws of Hong Kong.
Its objectives are the following: to promote and foster the interests of Hong Kong's
industrial and business communities; to promote trade, investment, technological
125

advancement, manpower development, and business opportunities in Hong Kong; and
to represent business views and to advise the government on policies and legislation that
affect business. Out of the four large trade associations in Hong Kong, the General
Chamber of Commerce Hong Kong and the Chinese Chamber of Commerce Hong
Kong represent traders who are not generally engaged in manufacturing activities that
require logistics services. Due to the cross-memberships between FHKI and the Chinese
Manufacturers Associations and the dominant position of FHKI as a trade association
for manufacturers, FHKI is more representative of the manufacturers in Hong Kong
who require the support of the logistics industry in Hong Kong and the PRD. FHKI
includes 27 groups covering different industries, among which are chemical and
pharmaceutical industries; building materials; electrical and optical products; electronics;
metal and machinery; food, beverages, and tobacco; jewellery, leather and
miscellaneous textiles; mould and die; plastics industry; toys; printing, bookbinding,
and paper products; watches and clocks; information technology; environmental
industries; and automobile components. Questionnaires to manufacturers were sent out
by email to 2,000 members in March 2009. Questionnaires for logistics service
providers were sent out by Shipping Gazette, a popular shipping guide publisher in
Hong Kong, to its 1,000 members in its first weekly magazine edition in March and
April 2009. This magazine is published every Monday and Wednesday. Furthermore, it
provides the following information: import/export shipping schedules; carrier's sailing
services; shipping news; directories of logistics service providers; real shipping tools
dedicated to shippers; and service providers in Hong Kong, Macau, and the PRD region.
Shipping Gazette offers free subscription to LSPs in Hong Kong and the PRD.
Questionnaires sent out by Shipping Gazette ensured that that the sample will cover all
kinds of LSPs randomly.
• Pilot study
126

After the sampling frame was decided, the e-mail survey method was used to
collect the data. Before the author launched the full-scale study, the author pilot-tested
the questionnaire using a sample of a few manufacturers and logistics service providers
to make sure that the questions were understandable. Very little change was required
because of the pre-tests.
• Data collection
Recommendations by Dillman (1999) to use e-mail and Internet survey were
adopted wherever possible. To ensure a high valid response rate, guidelines
recommended by Adams et ai., (2008) were observed. One challenge for this research
was collecting reliable data on the challenges and opportunities in the logistics service
industry. After consulting with logistics service providers, the author decided that the
best method was to obtain one key informant who is knowledgeable about the SCM
within the manufacturing companies and the executive of the logistics service company.
This person usually comes with such titles as supply chain manager, logistics manager,
vice-president or director, and is supposed to be knowledgeable about the firm's
logistics decisions. The use of a single informant is not uncommon in this line of
research or, generally speaking, in empirical research. The author's pre-test of the
survey proved that such an informant existed in each company contacted; the author
needed to identify these people before the questionnaires were sent. Therefore, the
author called each of the selected companies to identify the right contact person. For
this research, closed questions were asked to restrict the choice available to the
respondents; often, the respondents find these questions easy to deal with. Closed
questions on checklist and ranks and attitude statements were designed to collect data
on product/service lines, sales turnover, and attitude statements of the respondents.
After the telephone call, questionnaires were sent out bye-mail with a covering
note highlighting the objectives and the potential contributions of the study to the
127

identified informants. Both follow-up telephone calls and follow-up e-mails were used
to improve the response rate. Follow-up e-mails were also sent if the respondents could
not find the questionnaire that was sent to them earlier. If there were excessively
missing data, respondents were contacted by phone to clarify missing data in their
responses.
Some non-sampling errors can arise from design, reporting, and processing errors,
as well as from errors due to faulty response or non-response. The questionnaire was
designed and checked carefully to ensure that it was as clear as possible for the
respondents. Respondents were encouraged to give true information with a promise to
keep the information confidential. Questionnaire was sent out again in order to
eliminate non-response bias.
Out of 2,000 questionnaires sent out to the FHKI, 100 responded by emails. Out of
1,000 questionnaires sent out by Shipping Gazette in its first weekly magazine in March
and April 2009, 60 responded by fax. The response rate of the manufacturer
questionnaire is 5% and the logistics service provider is 6%. In this regard, open
questions asking respondents to describe issues or state their views and feelings attract
low response rates because respondents are too busy and will not find time to respond to
the questionnaires even if they find writing prose no difficulty. Another phenomenon in
Hong Kong is that too many surveys are carried out by students, commercial
organisations, and educational institutions. Response rates to surveys in Hong Kong are
very low. Even very reputable universities in Hong Kong find it hard to obtain desirable
response rates and often use coffee coupons and other similar tools to induce higher
response rates. This is no different or worse than the results of surveys in other markets
because surveys are over-used, and people and organisations are tired of surveys; as a
result, response rates are poor (Adams. et ai., 2007). Non-response bias should also be
checked by comparing the responses from the early respondents and late respondents.
128

Respondents who respond early are those who are interested in the survey topic.
Respondents who respond late are those who do not and will only respond after being
followed up by the researcher. The author found that the response by the early
respondents and late respondents in the questionnaires were similar. The author
evaluated non-response bias by comparing the early and late replies to all variables
using t-test (Handfield and Bechtel, 2002; Stank et al., 2001). No significant differences
were found, which suggests that non-response bias is not a big problem in this study.
• Statistical methods
In this analysis, four main statistical techniques (e.g., exploratory factor analysis,
Cronbach's alpha, cluster analysis, and analysis of variance) are used. Factor analysis is
a statistical method used to describe variability among observed variables in terms of
fewer unobserved variables called factors. The observed variables are modelled as linear
combinations of the factors, plus 'error' terms. The information gained regarding the
interdependencies can be used later to reduce the set of variables in a dataset. The
analysis will isolate the underlying factors that explain the data. It is an interdependence
technique, and the complete set of interdependent relationships is examined. There is no
specification of dependent variables, independent variables, or causality. Factor analysis
assumes that all the rating data on different attributes can be reduced to a few important
dimensions. This reduction is possible because the attributes are related. The rating
given to anyone attribute is partially the result of the influence of other attributes. The
statistical algorithm deconstructs the rating (called a raw score) into its various
components and reconstructs the partial scores into underlying factor scores. The degree
of correlation between the initial raw score and the final factor score is called a factor
loading. It is a statistic commonly used as a measure of the internal consistency
reliability of a psychometric instrument and how well a set of variables or items
measures a single, unidimensional latent construct. Exploratory factor analysis can be
129

used to reduce the number of variables by combining two or more variables into a single
factor. For example, performance at running, ball-throwing, batting, jumping, and
weightlifting could be combined into a single factor such as general athletic ability.
Usually, factors are selected by grouping related items. In the Q factor analysis
technique, the matrix is transposed and factors are created by grouping related people.
For example, liberals, libertarians, conservatives and socialists, could form separate
groups. It is also used in the identification of groups of inter-related variables to see how
they are related to one another.
Cronbach's a (alpha) is a statistic commonly used as a measure of the internal
consistency reliability of a psychometric instrument. It was first named as alpha by Lee
Cronbach in 1951, as he had intended to continue with further instruments. Cronbach's
alpha can be written as a function of the number of test items and the average
inter-correlation among the items. Alpha can take values between negative infinity and
1, although only positive values make sense. Some professionals, as a rule of thumb,
require a reliability of 0.70 or higher (obtained on a substantial sample) before they will
use an instrument. Obviously, this rule should be applied with caution when a has been
computed from items that systematically violate its assumptions. Furthermore, the
appropriate degree of reliability depends upon the use of the instrument. For example,
an instrument designed to be used as part of a battery may be intentionally designed to
be as short as possible, and thus be somewhat less reliable. Other situations may require
extremely precise measures, with very high reliability. It will generally increase when
the correlations between the items increase. For this reason, the coefficient is also called
the internal consistency or the internal consistency reliability of the test. Cronbach's
alpha measures how well a set of items (or variables) measures a single unidimensional
latent construct. When data have a multidimensional structure, Cronbach's alpha will
usually be low.
130

Cluster analysis or clustering is the assignment of a set of observations into subsets
( called clusters) so that observations in the same cluster are similar in some sense. The
k-means algorithm assigns each point to the cluster whose centre (also called centroid)
is nearest. The centre is the average of all the points in the cluster, that is, its coordinates
are the arithmetic mean for each dimension separately over all the points in the cluster.
Hair et aL, (1998) suggest that researchers should use both hierarchical and
non-hierarchical methods. Hierarchical procedures are used to examine the number of
clusters that should be formed, and the non-hierarchical method is applied to produce
clusters. Both hierarchical and non-hierarchical cluster procedures are used in the study.
The author used the analysis of the agglomeration coefficient and the dendrogram to
decide the number of the clusters. The agglomeration coefficient is the squared
Euclidean distance between the two clusters being combined. A small coefficient
indicates that homogenous clusters are merging. The joining of two very different
clusters results in a large coefficient (Hair et aI., 1998). A large percentage change in the
agglomeration coefficient indicates that two non-homogeneous groups will be combined
in the further agglomeration. A dendrogram is a visual representation of the steps in
hierarchical cluster analysis. It identifies the clusters being combined and the values of
the coefficients at each step.
Analysis of variance (ANOVA) IS a statistical model in which the observed
variance is partitioned into components due to different explanatory variables. It is used
to test hypotheses about differences between two or more means. The t-test based on the
standard error of the difference between two mean values can only be used to test
differences between two mean values. When there are more than two mean values,
comparing each mean with each other mean value using t-tests becomes possible.
However, conducting multiple t-tests can lead to severe inflation of the Type I error rate.
Analysis of variance can be used to test differences among several mean values for
131

significance without increasing the Type I error rate. The ANOVA tests the null
hypothesis in which samples in two or more groups are drawn from the same population.
To do this, two estimates are made from the population variance. These estimates rely
on various assumptions. The ANOVA produces an F statistic, which is the ratio of the
variance calculated among the means to the variance within the samples. If the group
mean values are drawn from the same population, the variance between the group mean
values should be lower than the variance of the samples, following central limit theorem.
A higher ratio therefore implies that the samples were drawn from different populations.
The degree of freedom for the numerator is 1-1, where I is the number of groups. The
degree of freedom for the denominator is N - I, where N is the total of all the sample
sizes.
After the introduction of the conceptual framework and the research design for both
exploratory interviews and scurvies, the next section focuses on the analysis of both the
qualitative and quantitative data. To be specific, SWOT is used to analyse the
information gained from the interviews. The first -hand data collected from the survey is
first validated, and then analysed using the statistical techniques introduced in this
section. The results of the analysis are also presented.
132

Chapter Six Analysis and Results
6.1 Qualitative analysis of interviews
Qualitative data are required to understand the in-depth motivations for people's
behaviour and feelings (Adams et aI., 2007). Face-to-face interviews are frequently used
in business research. In order to answer the research question on the challenges and
opportunities of Hong Kong logistics industry and how this is related to the
manufacturers in the PRD area, the author conducted interviews with 5 government
officials, 10 manufacturers/shippers, and 10 logistics service providers (LSPs) in Hong
Kong. The literature review indicates that the development of the logistics industry is
determined by location-specific advantages, which can be understood from transaction
cost economics and resource-based view of the firm. To be specific, the literature shows
that China's economic development is based on its manufacturing capability, which
provides many business opportunities for logistics service providers. This is because the
foreign manufacturers have outsourced their production activities, and there are many
OEM factories in the PRD. These OEM firms need to import raw materials and export
the finished goods to overseas markets. The globalisation trend also increases the
demand for logistics services. Manufacturers/shippers require logistics services from the
LSPs mainly in the PRD and, to a lesser extent, from the Hong Kong market as well.
Therefore, the author interviewed manufacturers/shippers to ask their opinion on the
threats and opportunities for LSPs. The literature review also indicates the policies and
regulations of both the PRD and Hong Kong government, such as labour law, tax policy,
appreciation of the RMB, customs, legal system, and financial and IT support. Since
government officials in the Hong Kong Logistics Development Council and the
Transport Bureau are responsible for creating the pro-business environment that attracts
133

private sectors to build the necessary logistics infrastructure to facilitate the needs of the
LSP's, the author interviewed them to gain the insights into the government's impact.
LSPs are the real players in the market, and their opinion can help to gain a more
holistic understanding of the impact of business environment and operating costs on the
logistics industry and what they expect for future business. Most LSPs have set up their
head/regional offices in Hong Kong and their subsidiary companies in the PRD. To sum
up, the interviewees are the representative of government, manufacturers, and LSPs.
When asked regarding the opportunity for Hong Kong LSPs' participation in the
China market, the Chairman of Hong Kong Terminal Operators Association opined that
the container terminals in the PRD are as efficient and as productive as the Hong Kong
container terminals because they are all managed by the same team of professionals. All
stakeholders want to make as much money as possible in both Hong Kong and the PRD
terminals. Therefore, Hong Kong LSPs have already contributed a lot in the
development of the domestic logistics market in the PRD. Benefited by the outsourcing
and globalisation trend, the development of the manufacturing activities in the PRD
provides tremendous opportunities to the Hong Kong-based LSPs. However, Hong
Kong-based LSPs are less competitive than their counterparts in the PRD and in the rest
of China because of the latter's close proximity to the manufacturing centres. The
Chairman of HAFFA was more optimistic about the future of Hong Kong forwarding
logistics sector because it is asset-light, more mobile, and responds to market changes
much quickly, which enable the players to meet business opportunities. The General
Manager of CMA and former Chairman of the Hong Kong Liner Shipping Association
agreed that its freeport status strengthens Hong Kong's role as a regional distribution
centre. This greatly improves the inbound traffic to Hong Kong, which positions the
much-needed empty containers to Hong Kong for the outbound traffic. Most
interviewees voiced their confidence in Hong Kong logistics industry because of its
134

world-class logistics infrastructure and superior supply chain capabilities. The proposed
third runway for HKIA will enhance Hong Kong's air connectivity. Government
officials and business leaders are optimistic that the integration between Hong Kong and
the PRD, accelerated by the construction of high-speed railways links and the Hong
Kong-Zuhai-Macau Bridge, will bring about new opportunities to the logistics industry,
particularly in the forwarding sector. In 2008, a consultant was commissioned by the
Hong Kong Logistics Development Council and the Hong Kong Trade Development
Council to evaluate the competitiveness of the city's logistics industry. Consequently,
the shortage of logistics professionals who have been attracted into the Mainland China
market was identified by the consultant as a threat to Hong Kong's logistics industry. In
contrast, the Chartered Institute of Logistics and Transport in Hong Kong argues that the
manpower shortage is an opportunity for the young and up-coming logistics
practitioners to undergo training and retraining. Some industry practitioners have
expressed pessimism regarding Hong Kong's total container throughput growth because
of the dilution effect of the PRD ports. However, optimistic practitioners with strong
overseas sales network in the forwarding logistics subsector state that the 2008 record of
over 45 million TEUs throughput in the PRD catchment area including Hong Kong is an
opportunity.
The approaches by the Hong Kong government and the PRD governments to
support their logistics industry are different. The Hong Kong government has created a
pro-business environment, whereas the PRD governments support their logistics
industry by the introduction of protectionism measures. Hong Kong authorities
emphasise the city's efficient customs services and its role as a regional office because
of its world-class legal, financial, and IT services. The interviewed business leaders
expressed concern about the increasingly tense Sino-American relations, high operating
costs, new labour laws introduced in 2008, and the appreciation of the RMB, but they
135

are relaxed about China's relatively stable political environment and the opportunities
brought about by China's accession into the WTO, which enhances the logistics industry
development in the PRD and rest of China.
The SWOT analysis is used to evaluate all interviews (Table 6.1). SWOT is a
strategic planning method used to evaluate the strengths (attributes of the person or
company that are helpful in achieving objectives), weaknesses (attributes of the person
or company that are harmful in achieving objectives), opportunities (external conditions
that are helpful in achieving objectives), and threats (external conditions which could do
damage to objectives) involved in a project or in a business venture. This technique is
very useful in analysing qualitative data because it can assist researchers to integrate
fragmented evidence in gaining fundamental insights. As SWOT is a qualitative analysis,
the author used his experience to summarise the findings and draw conclusions from the
interviewees on the strengths, weaknesses, opportunities, and threats on the Hong Kong
logistics industry that cannot be quantified. This is, of course, a key weakness of SWOT
analysis; however, it still provides researchers with a tool for analysing qualitative
information provided by industry experts. This is in fact very similar to the procedure
used in Delphi forecasting, which is a purely subjective method. Both SWOT and
Delphi share the same weaknesses, but also similar strengths. Without these methods,
researchers simply have no way of assigning a reasonably logical meaning to qualitative
judgments. However, Delphi forecasting is not being applied in this thesis. The SWOT
analysis undertaken in this research is provided below.
In the table we define 'strong support' to mean that the Hong Kong government has
identified the logistics industry as one of the four pillars of the Hong Kong economy by
creating the Hong Kong Logistics Development Council to underpin this. The
organisation represents industry leaders, government, and other stakeholders, and
regularly advises the government on key issues facing the industry. Extremely strong
136

support means that the Hong Kong logistics industry relies on the sales effort of its
overseas sales network, without which Hong Kong logistics companies would have a
hard time to survive. Industry experts in the qualitative interviews strongly emphasise
this particular feature as a key success factor for the industry.
137

Table 6.1 SWOT analysis
Strengths
Hong Kong ThePRD
Infra. Facilities World class Improving
Logistics professional Increasingly drawn by the PRD Lagging behind & attract
arket logistics professionals
from Hong Kong
Government support Strong support Strong support through
regulations
Customs services Transparent & efficient Unpredictable
Regional office status World class Lagging behind
Overseas sales network Extremely strong Trying to catch up with
HKG
Legal system Transparent Needs improvement
Tax system Simple and low tax system Attractive in SEZs
IT Ifinancial support Strong support for SCM Needs improvement
Weaknesses
Hong Kong ThePRD
Operating costs High Low
Location from M centJ Less favourable than the PRD Very favourable
Opportunities
Hong Kong The PRD
Political stability Very stable Stable
Air & ocean Excellent Catch up very fast on ocean
connectivity
WTO Increase logistics demand Increase logistics demand
Threats
Hong Kong ThePRD
Sino-US relationshir Amicable Cautious
Competition from oth Not immediate Not immediate
production centre
RMB appreciation Weakening logistics deman Weakening logistics dema
New labour laws Not significant Not significant
Labour supply Getting difficult Getting difficult
138

The result of the SWOT analysis gives many insights on whether the PRD
manufacturers will continue to use Hong Kong's airpOli, seaport and logistics industry.
According to the LSA, the decision of manufacturers to choose Hong Kong's port and
logistics service providers over competitors in Mainland China is determined by
competitive advantages. The SWOT analysis suggests that the strengths of Hong Kong
include infrastructure, logistics professionals, government support, customs service,
regional office status, overseas sales network, legal system, tax system, and IT/financial
support. The opportunities include political stability, as well as air and ocean
connectivity. The strengths give Hong Kong many LSAs in terms of market growth,
infrastructure, and administration. To be specific, Hong Kong has built world-class
logistics infrastructural facilities capable of handling up to 9 million tons of total air
cargo throughput compared to a high of 3.74 million tons of total air cargo throughput
in 2007. The Hong Kong Airport Authority is planning to add a third runway in HKIA.
Furthermore, the Hong Kong seaport has a designed capacity of 30 million TEUs to
meet the forecast growth up to 2010 (Ip, 2003). Hong Kong and Shenzhen are
connected by roads with four 24-hour border crossings that bring in truck and container
loads of finished products for shipping out in Hong Kong's airpoli and port. However,
logistics infrastructural facilities in the PRD are also improving very fast. Hong Kong
ocean cargo terminal operators are investing and managing the ports at the PRD. The
Guangzhou Airport is set to have a fifth runway. Hong Kong has trained and developed
world-class freight logistics professionals. The PRD is lagging behind and offers
financial incentives to attract Hong Kong logistics professionals to work in the PRD to
support its fast development. In response, the Hong Kong government has given its
strong support by creating a pro-business environment. The PRD government has given
strong support to local players through protectionist measures. Local protectionism is a
widely documented problem in China that is manifested in many ways. One
139

manifestation is provincial, wherein local government regulate economic activities that
disfavours non-local entities. Examples include vehicle licensing requirements and
highway usage regulations that discriminate against vehicles with operation bases
outside of the locality.
Apart from the LSAs, the RBV suggests that these VRIN resources are the main
reasons for manufacturers to select Hong Kong instead of local port and service
providers. Hong Kong customs is a very important resource due to its extremely
efficient and predictable service. In contrast, the PRD customs is unpredictable. Hong
Kong is a desirable location for regional offices; however, facilities in the PRD are
catching up to attract enterprises to set up their regional offices there although they
lagged behind for quite a long time. The PRD government has taken several measures to
attract foreign firms. For example, it might allocate money to build business parks. It
has also built top-notch office buildings, with or without private sector's participation.
The local government might also provide financial support, such as preferential tax rates
and investment subsidies, to encourage companies from home and abroad to establish
their headquarters in the PRD. The government will also invest to improve local human
resources by building training centres and by inviting educational agencies to train
professionals for the service sectors. Hong Kong"s forwarding industry, in comparison,
has built a very powerful international sales network; however, the local forwarding
industry in the PRD has started to catch up. Both Hong Kong and the PRD enjoy a
stable political environment, which provides confidence to investors to continue
investing in the PRD. Hong Kong has built excellent air and ocean connectivity in order
to attract goods from/to the PRD and transhipments via Hong Kong whereas the PRD is
catching up in its air and ocean connectivity. To some extent, the entire province of
Guangdong used to depend on Hong Kong"s overseas sales network to produce much of
its business revenues.
140

Hong Kong's legal system is another important resource and is the cornerstone of
its success, whereas the legal system in the PRD has a lot of catching up to do. There is
a warning of the need to distinguish between what is stated in the legal system and what
actually happens under China' legal system. In drafting new laws, the PRe has declined
to copy any other legal system wholesale, and the general pattern has been to issue laws
for a specific issue or location. Often, laws are drafted on a trial basis and redrafted after
several years. This process of creating piecemeal laws has led to many missed,
confusing, and contradictory situations. These have led to more judicial decisions
setting commercially precedent values than in most civil cases. In formulating laws, the
PRC has been influenced by a number of sources, including traditional Chinese views
toward the role of law, the PRes socialist background, the German-based law of the
Republic of China in Taiwan, and the English-based common law used in Hong Kong.
In comparison, Hong Kong has an easy and low tax rate system. In this respect,
Shenzhen is one of the four SEZs enjoying a 15% corporate tax; however, the rest of the
PRD, with the exception of Huizhou, does not enjoy the same tax benefit. Hong Kong
has advanced IT support to the logistics industry and supply chain management,
enabling funds to be transferred in seconds, whereas the PRD has to catch up in IT
system development. In this regard, the PRD has also been actively promoting the
development of digital content and animation industries in recent years. With its
strength in the provision of information services, Hong Kong is well placed to support
the development of these industries in the PRD. Moreover, as Mainland enterprises are
gradually implementing the 'Go Global' policy, Hong Kong can act as the launching
pad for these enterprises to expand overseas markets.
The SWOT analysis further indicates the weakness of Hong Kong ports and
logistics service providers, including operating costs and distance from manufacturing
centre. The TCE states that the economic exchange is determined by the transaction cost,
141

which refers to the total cost incurred during the exchange. Both the operating cost and
distance from manufacturing centre increase the transaction cost between the
manufacturer and logistics service providers. To be specific, because of high land and
labour costs, operating cost for the logistics industry in Hong Kong is high. There is
constant pressure from freight users to ship goods out from the PRD to reduce freight
and related costs. The distance from manufacturing centres is another component for the
transaction cost. Hong Kong's port is relatively far from the manufacturing base
compared with the local competitors; this means higher transaction cost for
transportation. The threats to Hong Kong ports and logistics service providers are also
related to the transaction cost. For one, the Sino-US relationship creates a great deal of
uncertainty for the logistics service providers. Managing an amicable Sino-US
relationship IS a challenge for Chinese leaders, and the US administration needs to
reorient itself m the face of a nsmg China. The competitiveness and scale of
manufacturing capacity of China cannot be replaced by other nations in the foreseeable
future. The nearest competitor is India; however, India has a number of weaknesses,
such as poor logistics infrastructural facilities, that prevent it from competing with
China in the current, and perhaps the next, decade. This also constitutes other kinds of
uncertainties for the LSPs. These uncertainties greatly increase the transaction cost for
using Hong Kong's port and LSPs. Moreover, the appreciation of the RMB in recent
years will likely continue for a number of years, weakening the PRD export
competitiveness and subsequently reducing its outbound forwarding logistics demand.
Both the new labour laws introduced in January 2009 in China and labour supply will
inevitably increase the manufacturing costs in the PRD, and thus result in a higher
transaction cost.
Through the interview and the SWOT analysis, the author determined that Hong
Kong's pOli and logistics industry'S strength lie on their LSAs and resources, which also
142

form their opportunities for future development. However, their weaknesses and threats
lie on the increase in transaction cost compared with the competitors. Therefore, the
results of the interview suggest that the manufacturers in the PRD will continue to use
Hong Kong ports and logistics industry because of their LSAs and resources. However,
the Hong Kong logistics industry also needs to find out ways to reduce their transaction
cost, which might compromise its competitive position.
6.2 Measurement validation
Before presenting the statistical data analysis results, emphasising the importance of
data validity is essential. This is because data collected by surveys and other empirical
means is of little use unless their reliability and validity can be demonstrated (Flynn et
aL \990). According to O'Leary-Kelly and Vokurka (1998), the methodological issue of
construct is generally ignored in most empirical research in the operations management
area. Therefore, before the validation of the statistical analysis, the author needs to
assess the reliability and validity of constructs proposed in this study for otherwise, the
results of the analysis will have no meaning. In this section, the measurement properties
of each construct are evaluated in a rigorous way.
Content validity means that there is a consensus among the subjects and researchers
that the items used in the study cover all the important dimensions of the latent
constructs to be measured. The content validity depends on how well the researchers
design the measurement items to cover the domain of the constructs to be measured
(Nunnally, 1978). According to Kerlinger and Lee (2000), content validation is a wholly
rational judgment process and cannot be numerically tested. The common method of
ensuring content validity is to select appropriate measurement items from an extensive
literature review and as evaluated by practitioners and knowledgeable researchers. In
this study, all of the items were extracted from the previous studies and based on the
results of the first-stage interviews with logistics service providers and government 143

officials. Suggestions from academics and practitioners in the stage of questionnaire
design and pilot test helped the author improve the measurement items further.
Therefore, content validity is ensured in this study.
Unidimensionality indicates that all of the items are measuring a single theoretical
construct (Li et aI., 2005). There are two reasons for the author to purify the
measurement items used in this study before the rigorous validation of proposed model.
First, this study is exploratory in nature because it is the first study to investigate the
threats and opportunities faced by the Hong Kong freight forwarding industry by a
researcher with strong logistics background. Second, the respondents of this study are
Hong Kong manufacturers and logistics service providers who are to some extent
different from Western manufacturers in management behaviour. However, the majority
of measurement items used in this study is extracted from studies in which Western
manufacturers are the major target respondents. Therefore, the author needs to use
rigorous methods to filter the measurement items before further study.
As suggested by Narasimhan and Jayaram (1998), the author did an exploratory
factor analysis (EFA) for each construct to ensure the unidimensionality of the scales.
Factor analysis is particularly useful for survey data because it enables the researcher to
reduce a large number of dependent variables (such as the responses to 30 questions) to
a smaller number of 'factors' that include all the variables. The key assumption of the
method is that each variable is strongly correlated with one another (but not necessarily
perfectly correlated) such that they are essentially measuring a different aspect of the
same idea (or construct). A related assumption includes normality in the distribution of
the errors from the observations. To this extent, the method contains the same statistical
assumptions as multiple regression, but without the problem of multicollinearity, which
is often present when the number of dependent variables is high (Norusis, 2005). This
present study applies factor analysis for the following reasons: it is manageable given
144

the number of questions 'tested' in the surveys, it enables a reduction of these questions
to a set of constructs that are easily interpreted, and Cronbach's alpha factor is produced
automatically within SPSS to measure the reliability of the factors.
The indicator items are deleted if they are loaded on more than two factors or if
their factor loadings are smaller than 0.5. Such a threshold value is suggested by
Johnson and Wichern (1998). Moreover, the items that did not load on the factor they
were intended to measure but on the factors they were not intended to measure were
also deleted, following Chen and Paul raj (2004). After items purification, the author
again conducted EFA again to ensure unidimensionality. Eigenvalues and percentage of
explained variances for each construct are provided in Tables 6.2, 6.3, 6.4, and 6.5. As
evident from these tables, all of the items loaded on one factor they intend to measure,
and the factor loadings are all greater than 0.5.
145

Table 6.2 Factor analysis of the logistics service provider's performance,
Just-in-time supply chain, and Legal system
Logistics Legal system Just-in-time
service provider supply chain
performance Eigenvalue=2.81 Eigenvalue=2.4
Eigenvalue=5.78 5 24
5
Our services provider offers a high level .907 .162 .013
of responsiveness to our needs
Our services provider offers a wide range .865 -.009 -.055
of services
Our servIces provider offers reliable .850 .261 .121
services
Our services provider is user friendly .822 .227 .134
Our services provider offers fast pick ur .759 .173 .199
and delivery
Our services provider offers the lowes .718 -.078 .195
total logistics costs
It is difficult to take legal actions to get a .086 .893 .002
fair judgment
The judicial system IS difficult to be .187 .816 .156
executed smoothly
The costs (fee and time) of settling .156 .816 .155
disputes among companies through
legal action is high
Legal services in China such a~ .105 .810 .002
arbitration system and law firms need to
be improved
Relevant laws (such as contract laws and .030 .769 .245
intellectual proper laws dealing witt
disputes need improvement
146

Table 6.2 (CONTD.) Factor analysis of the logistics service provider"s
performance, Just-in-time supply chain, and Legal system
Our suppliers are linked with us by a pul .119 .065 .801
system
We use lIT production and Kanban -.114 -.002 .793
system
Our suppliers deliver to l.l:'; on a .171 .124 .763
just-in-time basis
We receive daily shipments from mos .085 .195 .754
suppliers
Our customers receive just-in-time .271 .133 .687
deliveries from us
Total variance explained 36.155% 17.595% 15.151 %
147

Table 6.3 Factor analysis of the manufacturer service provider's integration, Hong Kong and
mainland customs satisfaction
Manufacturer Hong Kong Mainland
service customs customs
provider satisfaction satisfaction
integration Eigenvalue=1. Eigenvalue=1.
Eigenvalue= 7. 937 515
001
We share our service demand forecast .848 .084 -.050
with our services provider
Our major services provider helps us .841 .179 -.096
to improve processes
We and our serVIces provider .840 .302 .081
informally work as a team together
There is a high level of information .829 .122 -.006
exchange with our service
Our services provider offers fast pick .820 .086 .102
up and delivery service
We hold meetings with our service .809 .372 .127
providers on a regular basis to solve
problems
We develop a mutual understanding .800 .414 .047
of responsibilities with ou
services provider
We make joint decisions with our .771 .101 .263
services provider about ways to
improve overall logistics cost
efficiency
We conduct joint planning to .771 .094 .389
anticipate and resolve operational
problems with our service provider
Overall, we are satisfied with the .233 .954 -.008
current services provided by Hong
Kong customs
148

Table 6.3 (CONTD.) Factor analysis of the manufacturer service provider's integration,
Hong Kong and mainland customs satisfaction
Overall, we are satisfied with the .218 .940 .092
current systems and procedures
provided by Hong Kong customs
Overall, we are satisfied with the .066 .016 .952
current systems and procedures
provided by Mainland China customs
Overall, we are satisfied with the .081 .061 .951
current serVIces provided by
Mainland China customs
Total variance explained 53.851% 14.901% 11.655%
Table 6.4 Factor analysis of the future direction, government policies and Regulations
Government Future direction
policies&
regulations
Eigenvalue=3.616 Eigenvalue=1.56
9
State enterprises III China observe the .834 .049
regulations and new labour laws
The new labour laws introduced in January .761 .161
increase your operating costs substantially
You always observe the tax regulations and .702 .322
labour laws
Upgrading the industries in PRD .646 .000
The taxes in PRD are too high that affect .609 .419
bottom-line
You will expand your operations in other par .230 .890
China and Asia
You will expand your operations in other par1 .096 .862
China
Your business will continue to grow .107 .843
Total variance explained 45.204% 19.613%
149

Table 6.5 Factor analysis of the logistics service provider's operating cost, competition and
industry shifting
Industry Competition Operating
shifting Eigenvalue=2. cost
Eigenvalue=2. 191 Eigenvalue=l
985 .671
If our customers branch out to other .871 -.132 .004
parts of Asia, we will also branch
out there to serve them
If our customers branch out to YRD .851 -.013 .182
and Buhai area, we you will also
branch out there to serve them
If our customers branch out to the .788 .233 -.002
areas adjacent to PRD you will also
branch out your operations there to
service your customers
Appreciation of RMB has reduced .111 .864 -.111
the volumes of business from your
existing customers
As a result of appreciation of RMB, -.026 .845 .063
you have lost market shares
As a result of appreciation of RMB, .322 .699 .076
your customers have put pressure on
you to reduce your rates
Despite of very competitive -.189 .555 .138
environment, your business has
continued to grow
It is difficult to recruit staff in Hong .067 .167 .781
Kong
You need to increase the salaries 0 .273 -.146 .710
your staff III Hong Kong and
China substantially in the last fe~
years to keep your staff
It is difficult to recruit staff in China -.250 .011 .657
It is difficult to find managerial staf .384 .201 .510
in Hong Kong who are prepared to
move to China
Total variance explained 27.135% 19.922% 15.192
150

Reliability is defined as the stability and consistency of the measurement items, which
means the degree to which the items are free from random errors. Flynn et aI., (1990) suggest
that the most accepted measure of a measure's internal consistency is Cronbach's alpha.
Cronbach's alpha is a test for a model or survey's internal consistency. It is designed to assess
the reliability of a rating that summarises a group of survey answers, which measure some
underlying factor such as 'agreement' or 'disagreement' with a statement across a sample of
individuals. A score is computed from each test item, and the overall rating is the sum of
these scores over all the test items. The reliability is defined as the square of correlation
between the scale that is measured and the underlying 'construct' this scale is measuring. The
'rule of thumb' often applied for a good value of the alpha coefficient is equal to or greater
than 0.7 (see Schmitt, 1996). The key assumption of this procedure is that all the items being
measured are unidimensional, which simply means they cannot have any other meaning. For
example a response of 'Yes' or 'No' cannot be interpreted as anything else other than Yes or
No. In this current study, any survey instrument must be carefully pilot tested to ensure that
respondents cannot misinterpret survey questions. The surveys for this study were all
pilot-tested to ensure the removal of any ambiguity in the questions, and further ensure that
the items being referred to would have a single dimensional meaning.
Table 6.6 and Table 6.7 show the Cronbach's alpha results. The alpha values are larger
than 0.70, with the threshold value recommended by Nunnally (1978) and Flynn et aI., (1990).
Therefore, the reliability of the constructs used in the study is ensured.
151

Table 6.6 Reliability analysis of manufacturer·s responses
Construct Number of items Cronbach's alpha
Logistics service pro' 6 0.900
performance
Legal system 5 0.891
Just-in-time supply chain 5 0.835
Manufacturer service pro 9 0.947
integration
Hong Kong customs satisfacti 2 0.957
Mainland customs satisfactiOl 2 0.929
Table 6.7 Reliability analysis of logistics service provider's responses
Construct Number of items Cronbach's alpha
Future direction 3 0.860
Government policies 5 0.779
regulations
Industry shifting 3 0.826
Competition 4 0.742
Operating cost 4 0.621
6.3 Analysis of the surveys
After data-cleaning, 78 of the returned manufacturer and 49 logistics service
provider questionnaires were found to be usable, resulting in a 5% response rate. The
profiles of the surveyed manufacturers are listed in Tables 6.8, 6.9, 6.10, and 6.11 and
shown in Figs. 6.1, 6.2, 6.3, and 6.4. The responses of logistics service providers are
listed in Tables 6.12, 6.13, 6.14, 6.15 and 6.16 and shown in Figs. 6.5, 6.6, 6.7, 6.8, and
6.9. Nearly one in five (17.9%) were from the electronics and communication
equipment industry. The textile and apparel industry constituted 15.4% of the
respondents. To validate the sample, the author calculated the percentage of added value
of each industry in the whole manufacturing sector in Guangdong Province, which is
used as a proxy for the industry distribution of the sample shown in Table 6.8 (Statistics
152

Bureau of Guangdong Province, 2009). Since the value-added method does not count
the real number of the firms, some discrepancies are evident. Considering this
measurement error, the sample has similar industry distribution as in Guangdong
Province, which indicates the representativeness and the validity of the sample.
Table 6.8 Profile of the respondents--- manufacturing industry
No. of % of the % m Industry
Responses sample Guangdong
Electronics & communication 20 14 17.9
equipments
Textile & apparel 12 15.4 13
Electrical equipments 6 7.7 11
Transportation equip 2 2.6 6
Machinery 3 3.8 3
Chemical & petrochemical 1 1.3 1
Rubber & plastics 3 3.9 4
Metal 1 1.3 2
Wood & furniture 2 2.6 2
Publishing & printing 3 3.8 3.2
Toys 5 6.4 n.a.
Watches & clocks 3 3.8 n.a.
Others 23 29.5 n.a
Total 78 100.0
153

Industry
Others
toys
Publ ishing& printing
Wood & furni ture
Metal
Watches & clocks
Ru bber & plastics
Plastics
Chemical & petrochemical
Machinery
Transportation equ ip
Electrical equipments
Textile & apparel
Electronics & communication equ ipments ~~~~~~~~~1--+--J--~
o 5 10 15 20 25 30 35
Figure 6.1 Profile of the respondents--- manufacturing industry
The percentage of small and medium enterprises with less 100 employees is 84.6%,
and small companies with less than 50 employees comprises 71.8% of the respondents.
Table 6.9 Profile of the respondents--- manufacturing Number of employees
No. of Number of employees %
Responses
Less than 50 56 71.8
51-100 10 12.8
101-200 1 1.3
201 - 300 4 5.1
301- 500 0 0
501 - 1000 2 2.6
1001 - 2000 1 1.3
2001- 5000 1 1.3
over 5000 2 2.6
Not specified 1 1.3
Total 78 100.0
154

Not specified
over 5000
2001-5000
1001-2000
501-1000
301-500
201-300
101-200
51-100
Less than 50
• • • • • .. • o
Number of employees
, ,
10 20 30 40 50 60 70 80
Figure 6.2 Profile of the respondents--- manufacturing Number of employee
Half of the surveyed manufacturers are owned by Hong Kong interests. Most of the
other respondents are either state-owned (17.9%) or owned by foreign interests (19.2%).
Table 6.10 Profile of the respondents--- manufacturing Ownership
No. of Ownership %
Responses
State owned 14 17.9
100% owned by Hong Kong 39 50.0
interest
100% owned by foreign 15 19.2
interest
J oint venture between Hong
Kong interests and other 7 9.0
interests
Not specified 3 3.8
Total 78 100.0
155

Ownership
Not specified
Jointventure between Hong Kong interests and other interests
100% owned by foreign interest
100% owned by Hong Kong interest
State owned
o 10 20 30 40 50 60
Figure 6.3 Profile of the respondents--- manufacturing Ownership
For the 2007 annual sales, 60.2% of the manufacturers recorded below HK$ 100
million. On average, respondents have been in the industry for 20 years. This indicates
that they are all experienced manufacturers, and their opinion is very valuable for
evaluating the development of the industry.
Table 6.11 Profile of the respondents--- manufacturing Annual sales turnover in
HK$ million in 2007
Annual sales turnover III No. of %
HK$ million in 2007 Responses
5 and less 3 3.8
5.1 - 10 11 14.1
10.1 - 15 14 17.9
15.1 - 25 4 5.1
25.1 - 30 1 1.3
30.1- 50 6 7.7
50.1 - 100 8 10.3
100.1 -250 9 11 .5
250.1- 500 2 2.6
500.1 - 1000 3 3.8
Over 1000 2 2.6
Not specified 15 19.2
Total 78 100.0
156

Annual sales turnover in HK$ million in 2007
Not specified
Over 1000
500.1-1000
250.1-500
100.1-250
50.1-100
30.1- 50
25.1-30
15.1-25
10.1-15
5.1-10
Less than 5
... o 5 10 15 20 25
Figure 6.4 Profile of the respondents--- manufacturing Annual sales turnover in
HK$ million in 2007
Logistics service providers normally offer one or several types of logistics service
functions, such as freight forwarding, 3PL, warehousing, trucking, and 4PL. More than
80% of the logistics service provider respondents provide freight forwarding services.
The same respondents offer 3PL (40.8%), warehousing (42.9%), trucking (44.9%), and
4PL services (10%).
Table 6.12 Profile of the respondents--- logistics service provider service profile
No. of Service profile %
Responses
Freight forwarding 40 81.6
Third party logistics 20 40.8
Four party logistics 5 10.2
Warehousing 21 42.9
Trucking services 22 44.9
Other 10 20.4
157

Service profile
Other I
1 Trucki ng services
Warehousing
Fou r party logistics r-Third party logistics
Freight forwarding
o 20 40 60 80 100
Figure 6.5 Profile of the respondents--- logistics service provider service profile
Approximately half of the surveyed logistics service providers are owned by Hong
Kong interests. Majority of the remaining companies are owned by foreign interests
(40.8%).
Table 6.13 Profile of the respondents--- Iogistics service provider Ownership
No. of Ownership %
Responses
100% owned by Hong Kong 25 51.0
interest
100% owned by foreign 20 40.8
interest
Joint venture between Hong
Kong interests and foreign 4 8.2
interests
Total 49 100.0
158

Ownership
Joint venture between Hong Kong interests and foreign interests
100% owned by foreign interests
100% owned by Hong Kong interests
o 5 10 15 20 25
Figure 6.6 Proftle of the respondents--- Iogistics service provider's Ownership
30
For the 2007 annual sales turnover, 53% of the logistics service providers gamer
below HK$ 100 million. This is typical in the PRD area because the majority offtrms
are SMEs.
Table 6.14 Proftle of the respondents--- Iogistics service provider Annual sales in
HK$ million in 2007
Annual sales in HK$ million No. of %
in 2007 Responses
Less than 5 4 8.2
5. 1 - 10 1 2.0
10.1 - 15 3 6.1
15.1 - 25 3 6.1
25.1 - 30 2 4.1
30.1 - 50 5 10.2
50.1 - 100 8 16.3
100.1 - 250 2 4.1
250.1- 500 8 16.3
500.1-1000 3 6.1
Over 1000 2 4.1
Not specifted 8 16.3
Total 49 100.0
159

Not specified
Over 1000
500.1-1000
250.1-500
100.1-250
50.1-100
30.1- 50
25 .1- 30
15.1- 25
10.1-15
5 .1-10
Less than 5
o
Annual sa les in HK$ million in 2007 I I I I I
I I
2 4 6 8 10 12 14 16 18
Figure 6.7 Profile of the respondents--- Iogistics service provider's Annual sales in
HK$ million in 2007
Approximately one-third of the respondents have operations around the world, and
26.5% have operations in other parts of Asia. The rest of the respondents are Greater
China-based operators.
Table 6.15 Profile of the respondents--- logistics service provider Locations of
Operations
No. of Locations of operations %
Responses
Hong Kong 5 10.2
Hong Kong & PRD 5 10.2
Hong Kong, PRD and other 10 20.4
parts of China
Hong Kong, mainland China 13 26.5
and other parts of Asia
Hong Kong, rest of Asia, 16 32.7
Europe & Americas
Total 49 100.0
160

Locations of operations
Hong Kong, rest of Asia , Europe & Americas I I 1 1 1 I
1 1 Hong Kong, mainland China and other parts ..
I I Hong Kong, PRD and other parts of China
I I Hong I(ong & PRD
1 J Hong Kong
,
o 5 10 15 20 25 30 35
Figure 6.8 Profile of the respondents---Iogistics service provider's Locations of
Operations
In terms of customers, 42.9% of the respondents servIce customers around the
world, and 36.7% focus on Asia customers. The rest of the respondents only focus on
China customers. Hong Kong logistics service providers have very good ocean and sea
connectivity; this may be the reason the majority of their customers are located overseas.
Moreover, since the Hong Kong logistics industries have started penetrating the
Mainland market, they also serve many China customers. Therefore, the survey results
on customer locations are typical for the Hong Kong logistics service providers.
Table 6.16 Profile of the respondents--- logistics service provider Locations of
Customers
No. of Locations of customers %
Responses
Hong Kong & PRD 4 8.2
Hong Kong, PRD and other 6 12.2
parts of China
Hong Kong, mainland China 18 36.7
and other parts of Asia
Hong Kong, rest of Asia, 21 42.9
Europe & Americas
Total 49 100.0
161

Location of customers
Hong Kong, rest of Asia, Europe & Americas
Hong Kong, ma inland China and other parts of Asia
Hong Kong, PRD and other parts of China
Hong Kong & PRD
o 5 10 15 20 25 30 35 40 45 50
Figure 6.9 Profile of the respondents--- logistics service provider's Locations of
Customers
The analysis was conducted by initially calculating the mean, standard deviations,
and correlations among all constructs (Table 6.17), which was performed based on the
theories and literature review and validated in the previous section. The results indicate
that the main constructs are moderately correlated with one another. The highest
correlation is between MSPI and LSPP (0.681), and the MSC does not correlate with
other variables except for LS, which is reasonable. This is because the MSC is under the
control of China LS.
Table 6.17 Mean, standard deviations and correlation--- manufacturing
LSPpa LS JSC MSPI HKSC MSC
legal system (LS) .296**
Just-in-time supply chain(JSC) .273* .277*
Manufacturer service provider .681** .243** .373**
integration (MSPI)
Hong Kong customs .517** .414** .059 .449**
satisfaction (HKSC)
Mainland customs satisfaction .090 .177 .283** .191 .092
(MSC)
Mean 2.838 3.240 4.211 3.254 2.636 3.993
Sd. 1.023 1.097 1.261 1.143 1.158 1.255
a LSSP stands for logistics service provider performance; **: p<O.OI, *: p<0.05 162
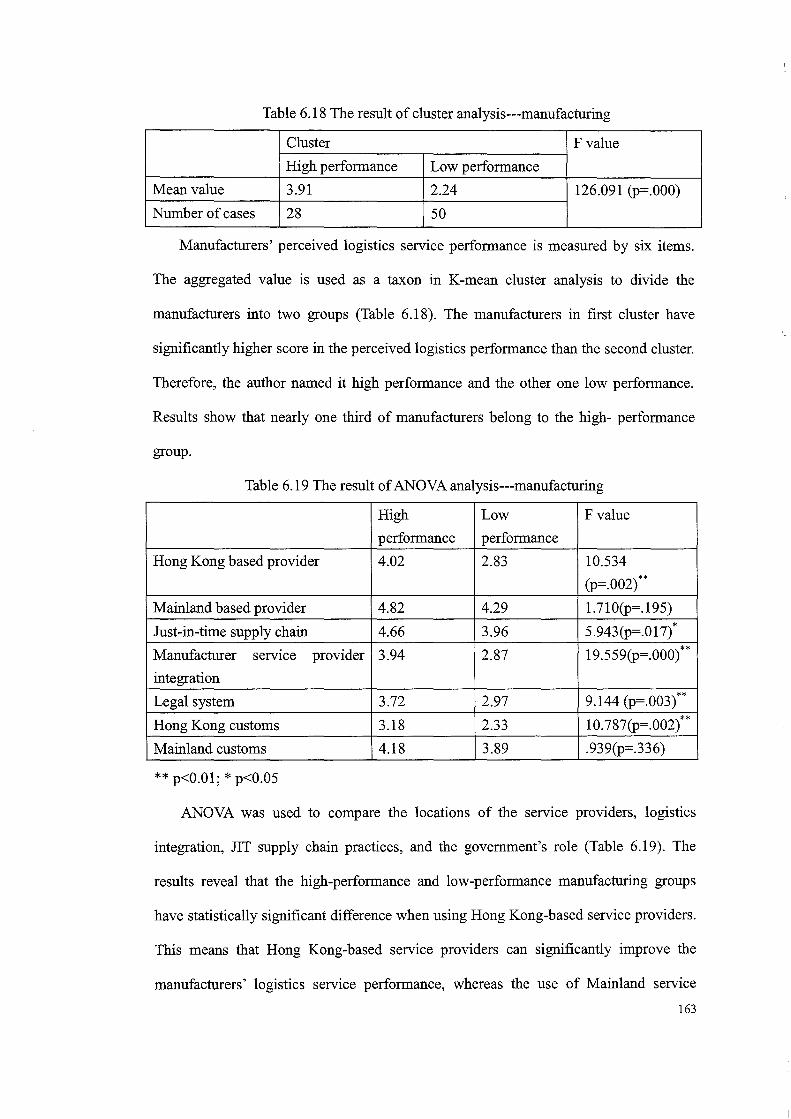
Table 6.18 The result of cluster analysis---manufacturing
Cluster F value
High performance Low performance
Mean value 3.91 2.24 126.091 (p=.000)
Number of cases 28 50
Manufacturers' perceived logistics service performance is measured by six items.
The aggregated value is used as a taxon in K-mean cluster analysis to divide the
manufacturers into two groups (Table 6.18). The manufacturers in first cluster have
significantly higher score in the perceived logistics performance than the second cluster.
Therefore, the author named it high performance and the other one low performance.
Results show that nearly one third of manufacturers belong to the high- performance
group.
Table 6.19 The result of ANOVA analysis---manufacturing
High Low F value
performance performance
Hong Kong based provider 4.02 2.83 10.534
(p=.002)**
Mainland based provider 4.82 4.29 1.710(p=.195)
Just-in-time supply chain 4.66 3.96 5.943(p=.017)*
Manufacturer servIce provider 3.94 2.87 19.559(p=.000) **
integration
Legal system 3.72 2.97 9.144 (p=.003)**
Hong Kong customs 3.18 2.33 1O.787(p=.002)**
Mainland customs 4.18 3.89 .939(p=.336)
** p<0.01; * p<0.05
ANOVA was used to compare the locations of the service providers, logistics
integration, TIT supply chain practices, and the government's role (Table 6.19). The
results reveal that the high-performance and low-performance manufacturing groups
have statistically significant difference when using Hong Kong-based service providers.
This means that Hong Kong-based service providers can significantly improve the
manufacturers' logistics service performance, whereas the use of Mainland service
163

providers will not improve logistics performance. The JIT supply chain was measured
by five items. The results reveal that the high-performance group uses significantly
higher level of JIT supply chain than the low-performance group. This is consistent with
the argument of RBV, which states that JIT supply chain is a very important resource for
improving the performance. Manufacturer and service provider integration was
measured by nine items. Statistically, the high-performance group achieves higher level
of integration than the low-performance group. These results indicate that application
logistics integration can really improve a manufacturer's logistics performance. The
explanation can be provided by TeE, which argues that the relationship-specific asset
(e.g., integration) can reduce the transactional cost and then improve the performance.
The Mainland's legal system was measured by five items. The results show that the
high-performance group more firmly believes that the Mainland's legal systems need
more improvement in comparison to the low-performance group. This indicates that the
role of government is very important in improving logistics performance. Based on the
arguments of LSA, the legal system does bring advantages to Hong Kong. The
measurement of the satisfaction toward the customs system of Hong Kong and of the
Mainland is listed in Appendix II. The analysis shows that there are significant
differences in the satisfaction of Hong Kong customs between the high-performance
and low-performance groups, but not on the satisfaction of Mainland customs. This also
reveals that Hong Kong customs is associated with logistics performance improvement,
whereas Mainland customs is not related to the logistics performance. This is also
consistent with the arguments of LSA, wherein Hong Kong has the advantages over
Mainland competitors. This analysis shows that the resources, LSA, and transactional
cost of Hong Kong logistics industry are all important for improving logistics
perfoll11ance. Therefore. the answer for our first research question is -Yes'.
164

Table 6.20 Mean, standard deviations and correlation--- logistics service provider
FDa GPR IS CO OC
Government policies and .416**
regulations (GPR)
Industry shifting (IS) .538** .226
Competition (CO) .444** .586** .111
Operating cost (OC) .047 .098 .234 .140
Mean 3.027 2.829 3.582 3.260 4.175
Sd. 1.211 1.052 1.309 .951 1.077
a FD stands for future direction; **: p<O.Ol, *: p<0.05
For the logistics service providers, the analysis was conducted by initially
calculating the mean, standard deviations, and correlations among all constructs, as
shown in Table 6.20. The results indicate that only the FD is moderately correlated with
other variables. The highest correlation is between FD and IS (0.538), and the OC does
not correlate with other variables, which is reasonable. This is because the cost is not
the main concern for logistics service providers when they make decisions.
Table 6.21 The result of cluster analysis---logistics service provider
Cluster Fvalue
Optimistic group Pessimistic group
Mean value 4.62 2.45 81.375 (p=.OOO)
Number of cases 13 36
The author evaluated future directions of these companies by asking whether they
planned to continue their business in China. The aggregated value is used in the K-mean
cluster analysis to divide the respondents into two groups (Table 6.21). The logistics
service providers in the first cluster have significantly higher confidence in the market
than those in the second cluster. Therefore, the first group was named the optimistic
group, while the second was called the pessimistic group. The results show that nearly
one-fourth of the logistics service providers are optimistic about the future. The results
shows that nearly one-fourth of the manufacturers belong to the high-performance
group.
165

Table 6.22 The result of ANOVA ---logistics service provider
Optimistic Pessimistic Fvalue
group group
Government Policies and 3.31 2.65 3.891 (p=.054)
Regulations
Operating cost 4.00 4.24 .464(p=.499)
Competition 3.65 3.11 3. 168(p=.082)
Industry shifting 4.69 3.18 16.958(p=.000)**
** p<O.Ol; * p<0.05
ANOVA was used to examine the effects of government policies and regulations,
operating costs, competition environment, and industry-shifting on future market
expectations (Table 6.22). Government policies and regulations were measured by five
items, and industry-shifting was measured by three items. Marginally, the optimistic
group believes that policies, regulations, and industry shifts are more important than
does the pessimistic group. This indicates that the government policies and regulations
are impOliant determinants for logistics providers' expectations for the market. This is
consistent with the arguments of LSA, which suggests that the administration is an
important dimension for competitive advantage. The analysis shows that Hong Kong is
better than the PRD in terms of police and regulation. Moreover, the analysis also
indicates that industrial shifting is another important determinant. This can be explained
by LSA theory, which states that market growth is another source of advantage. The
operating cost of the logistics service providers is measured by four items. However, the
author does not find significant difference between the optimistic group and the
pessimistic group in their opinion on operating cost. The same picture can be seen on
competition environment, which as measured by four items. The result indicates that
there is no statistically significant difference between the optimistic group and
pessimistic group in perception on the competitiveness of the environment. This
indicates that integration between Hong Kong and PRD makes the LSPs compete in the
166

same business environment, As a consequence, the impact of competition and operating
cost has similar effects on both the PRD and Hong Kong players. Therefore, integration
will not influence the expectation for the future and whether to shift to Hong Kong from
the PRD. In the questionnaire response, a number of LSPs seem to think that cost is not
an issue. However, they made the comments in the context of competing with other
LSPs that have more or less the same cost structures in terms of labour cost, rental for
office and warehouse, trucking cost, and others. This shows that in this research context,
the competition and operating cost are not LSA. To summarise, the results reveal that
government policies and regulations and industry-shifting have significant effects on
future market expectations in the logistics industry, whereas operating cost and
competition environment do not affect such expectations. Since Hong Kong has more
LSAs over the PRO, the answer to our second research question should be 'Yes'.
The author also investigated the main reasons for customers to export/import goods
from/to Southern China to/from overseas via Hong Kong by air. The main reasons are
due to the policies and actions taken by the Hong Kong government to enhance the
competitiveness of the Hong Kong forwarding industry from the service provider'S
perspective. The results are listed in Tables 6.23, 6.24, 6.25, and 6.26 and Figs. 6.10,
6.11,6.12, and 6.13.
167

Table 6.23 The reasons to export through Hong Kong by air
No. of %
Responses
Efficient and predictable
customs clearance in Hong 38 77.6
Kong
More direct flights from Hong
Kong to [mal destinations 38 77.6
Predictable transit handling in 38 77.6
Hong Kong
More reliable forwarding 37 75.5
services
Tax or duty advantages 16 32.7
Better flight connections 36 73.5
Lower total transportation 9 18.4
costs
Customers' requests (eg. FOB 26 53 .1
HK)
Quality control in Hong Kong 32 65.3
Consolidation of shipments in 26 53.1
Hong Kong
Others 3 6.1
The reasons to export through Hong Kong by air
Others Consolidation of shipments in Hong Kong
Quality control in Hong Kong Customers' requests (eg. FOB HK)
Lower total transportation costs Better flight connections
Tax or duty advantages More reliable forwarding services
Predictable transit handling in Hong Kong More direct flights from Hong Kon g to final ..
Efficient and predictable customs clearance in ..
~ I I I I I
I
I I I
I
I I
I
o ]0 20 30 40 50 60 70 80 90
Figure 6.10 The reasons to export through Hong Kong by air
The analysis indicates that the main reasons for exporting goods from South China
168

to overseas via Hong Kong include Hong Kong's efficient and predictable customs
clearance, more direct flights to final destinations, predictable transit handling, and
reliable forwarding service. This suggests that Hong Kong's administration is its main
LSA, and the transaction cost is lower because of low uncertainty.
Table 6.24 The reasons to import through Hong Kong by air
No. of %
Responses
Efficient and predictable
customs clearance in Hong 36 73.5
Kong
More direct flights from Hong 38 77.6
Kong to final destinations
Predictable transit handling in 29 59.2
Hong Kong
More reliable delivery 31 63.3
Tax or duty advantages 22 42.9
Better flight connections 31 63.3
Lower total transportation 5 10.2
costs
Customers' requests (eg. FOB 24 49
HK)
Quality control in Hong Kong 25 51
Profit from the lower
consolidation rates to Hong 16 32.7
Kong
Others 3 6.1
169

The reasons to import through Hong Kong by air
Others
Profit from the lower consolidation rates to ..
Quality control in Hong Kong
Customers' requests leg. FOB HK)
Lower tota l transportation costs
Better flight connections
Tax or duty advantages
More reliable delivery
Predictable transit handling in Hong I(ong
More direct flights from Hong Kong to final ..
Efficient and predictable customs clearance ..
- \
....
,
\
I
I I
I I I I
,
o 10 20 30 40 50 60 70 80 90
Figure 6.11 The reasons to import through Hong Kong by air
The main reasons for importing goods to Southern China from overseas via Hong
Kong by air is similar to the reasons for exporting. The efficient and predictable
customs clearance in Hong Kong reduces the uncertainty and leads to lower transaction
cost. More direct flights from overseas to Hong Kong is an important intangible
resource that Hong Kong has over its PRD competitors.
Table 6.25 The reasons for customers to export goods directly from Southern China
to overseas by air
No. of %
Responses
Low costs in S. China 40 81.6
Customers' request (e.g. 28 57.1
FOB China)
Customs requirement 21 42.9
Faster delivery 6 12.2
Others 5 10.2
170

The reasons for customers to export goods directly from Southern China to overseas by
air
Others
Faster delivery
Customs requirement
Customers' request (e.g. FOB China)
Low costs in 5. China
0 10 20 30 40 SO 60 70 80 90
Figure 6.12 The reasons for customers to export goods directly from Southern
China to overseas by air
Table 6.26 The reasons for customers to import goods directly from Southern China
to overseas by air
No. of %
Responses
Low costs in S. China 29 59.2
Customers' request (e.g. 32 65.3
FOB China)
Customs requirement 16 32.7
Faster delivery 13 26.5
Others 2 4.1
171

The reasons for customers to import goods directly from Southern China to
overseas by air
Others .. I
I Faster del ivery
I Customs requirem ent
I Customers' request (e.g. FOB China)
I Low costs in S. China
,
o 5 10 15 20 25 30 35
Figure 6.13 The reasons for our customers to import goods directly from Southern
China to overseas by air
Low cost and high customer demand are the main reasons goods are directly
exported/imported from/to Southern China to overseas by air. This shows that the LSAs
of the PRD over Hong Kong are cost and distance from the manufacturing centre, which
is consistent with Hong Kong's weakness, as shown in the SWOT analysis. Since the
core competence of Hong Kong's port and logistics industry is not cost but the quality
of service, this result indicates that because of weaknesses at present, the PRD LSPs are
unable to compete with Hong Kong LSPs directly, hinder the LSAs of Hong Kong, and
attract customers that originally use Hong Kong services. This is because cost is not
their concern, and they want high service quality. Therefore, the ones using Hong Kong
logistics services and port will remain loyal and will not turn to the PRD.
172

Table 6.27 Policies and actions that should be taken by Hong Kong government
No. of Response %
24-hour cross-border custor 43
clearance policy 87.8
Lower land cost for logistic 45 9l.8
industry
Improved air cargo facilities 23 46.9
Hong Kong Airport
Accelerated open sky polic 18 36.7
Improved ocean freight faciliti 30 6l.2
Hong Kong port
More subsidized training 27 55. 1
programme for logistics indu
Other 8 16.3
Policies and actions that should be taken by Hong Kong government
Other
More subsidized training program me for ..
Improved ocea n freight fac ili ties at Hong ..
Accelerated open sky policy
Improved air cargo facilities at Hong I(ong ..
Lower land cost for logistics industry
24-hourcross-border customs clearance ..
- I
I
,
o 20
I I
40 60 80 100
Figure 6.14 Policies and actions should be taken by Hong Kong government
The policies of 24-hour cross-border customs clearance and lower land cost for the
logistics industry are believed to be the most important by the logistics service providers
(Table 6.27 and Fig. 6.14). The literature indicates that the government plays very
important roles in the competitiveness of the logistics industry. The RBV views
government's policies as important resources, the LSA posits that the government's
173

administration and improvement in infrastructure are sources of comparative advantage,
and TeE also hints that government regulation reduces opportunism and then decreases
transaction cost. As the author mentioned before, the PRD's LSAs lies in operating cost
and being near the manufacturing centre. However, through the policies of 24-hour
cross-border customs clearance and lower land cost, the Hong Kong port and logistics
industry can greatly reduce the disadvantage over PRD competitors. Moreover,
improved facilities at HKlA and port, 'open sky' policies, and the training program can
improve the resources of Hong Kong port and logistics industry and enhance their core
competence and bring more competitive advantage. Therefore, customers will continue
to use Hong Kong ports and logistics industry because of this capability improvement.
174

Chapter Seven Discussions of Key Results
In this chapter, the key findings of the interviews and survey are discussed. In
particular, the first part includes the challenges faced by the Hong Kong logistics
industry branching into the domestic market in China and the limitations of the asset
based logistics branching out from Hong Kong. Challenges and opportunities for the
Hong Kong logistics industry in generaL including Hong Kong's freeport status are also
discussed. The second part covers the interpretation of survey results. The key findings
including the factors associated with logistics performance and future expectations are
discussed. The results are interpreted within the context of the theoretical concepts
presented in Figure 2.2, Chapter Two.
7.1 Interpretation ofthe results with interviewees
All interviewees considered it very difficult, if not impossible, for the Hong Kong
LSPs to become involved in the growing domestic markets in Mainland China. Even
currently, most of the importers buy from the manufacturers in China, including the PRD,
on FOB Hong Kong terms. Most of the finished goods in the PRD are trucked to Hong
Kong to be forwarded to the world's markets by ocean and by air. Increasingly, more and
more finished goods manufactured in the PRD are shipped out from the PRD ports and
Guangzhou airport. The HKIA will be able to maintain its top air cargo status in terms
of total throughput for a few more years because of its efficiency and connectivity with
the major airports around the world. Manufactured goods from the PRD are generally
trucked to the terminals of the Hong Kong LSPs by the manufacturers in the PRD.
Forwarding logistics operators do not become involved in the trucking from the PRD to
Hong Kong and have not developed working relationships with the manufacturers in
terms of trucking services. This pattern also applies to the process management for the
175

goods manufactured and shipped out from the Yangtze River Delta (YRD) area. The
more ambitious and forward thinking Hong Kong LSPs branching out to the PRD have
not been involved in the domestic trucking market. The domestic logistics market has
stayed at the basic stage, providing domestic trucking and offering basic warehousing
services. Due to low profit margins, Hong Kong LSPs have not been exposed to the
logistics users, nor are they interested in the domestic logistics market.
Asset-based infrastructural logistics operators will be less fortunate than their
non-asset-based counterparts in branching out and participating in the fast-growing
domestic logistics markets in Mainland China. Asset-based operators such as airport and
port operators cannot move their fixed infrastructure to China, and can only handle the
traffic brought in from the PRD and other parts of China by the truckers or feeder
services. This is a classical example of asset specificity, an important construct in TCE,
which has little value outside the exchange relationship (Grover and Malhotra, 2003).
Nevertheless, asset-based infrastructural firms such as HIT and the Hong Kong Airport
Authority have been successfully branching out to the China market by setting up joint
ventures with local operators. HIT has set up joint ventures in the Yantian Port of the
PRD and Shanghai, whereas the Hong Kong Airport Authority has acquired a 49% stake
of the Hangzhou Airport Authority and a management contract at Zhuhai Airport. The
Hangzhou and Zhuhai Airports were not interested in the capital injection; rather, they
were interested in the service capabilities brought by the Hong Kong Airport Authority
to upgrade their service standards and ultimately to generate profit. Admittedly, the
return on investment as minority shareholders and the benefit to Hong Kong as a whole
will be less significant than their own operations in Hong Kong. In contrast,
non-asset-based logistics operators, including CL, freight forwarding logistics and 4PL
operators, are at the forefront in managing the relationship with logistics service users
and tend to offer one-stop solutions. They will not only continue to handle the logistics
176

requirements from the logistics services users ill the PRD, they also pick up new
business opportunities as their customers outsource their products from other parts of
China outside the PRD. China is committed to increasing its domestic consumption.
People in China, particularly the fast-growing middle class, will consume more and
increase their appetite for imported luxurious items, which will offer tremendous
additional logistics opportunities, a source of revenue with exponential potential.
Hong Kong LSPs have less exposure with importers in China and may not benefit
from the fast-growing consumer market in China, at least in the short term. Progressively,
as Hong Kong LSPs employ more local sales and marketing personnel and become more
integrated into China's economy, they will be able to offer their 3PL skills and
participate in the fast-growing consumer market in Mainland China. Their logistics
experience and skill will assist their customers reducing coordination cost.
The Hong Kong logistics industry has been very successful in building up its
international sales network through which they manage the relationship with importers
in the US and Western Europe. The same importers that source manufactured goods in
the PRD may also source the manufactured goods in the other parts of China.
Traditionally, a majority of the ocean going shipments were transhipped via Hong
Kong's port. With improved ports in the PRO and with the participation of the
management of Hong Kong expertise, total throughput shipping out/in of the PRD ports
has increased and has become almost at par with that of Hong Kong's POlt in 2008.
Since 2005, four years after China joined the WTO, Hong Kong forwarding logistics
operators were able to obtain their forwarding license and started trading in the PRD
under their own names. The total PRD market was 45 million TEUs in 2008. Thus, there
is a tremendous opportunity for Hong Kong forwarding logistics operators to increase
their market shares in the PRD, a market that they were unable to handle or had handled
previously through local licensed forwarding logistics companies.
177

As a freeport, Hong Kong does not levy import duties on goods brought in to its
territory. Raw materials and semi-finished products are brought into Hong Kong, and
kept and managed in the port mainly by logistics operators. Most of the inventory
managed is for the manufacturing activities in the PRD. Due to predictable and efficient
customs services, raw materials and semi-finished goods can be delivered to the
manufacturers in the PRD on a time-definite basis to eliminate or reduce unpredictability
and changeability, which affect market conditions and, subsequently, profit (Klein 1989;
Klein, Frazier, and Roth 1990).
Indeed, Hong Kong's logistics industry can take advantage of its freeport status to
strengthen Hong Kong's position as a preferred regional distribution centre. Goods can
be kept in Hong Kong, not only to satisfy Hong Kong shoppers, but also to cut short the
lead-time in order to support different commercial activities in China and in this region.
Buyer consolidators receive finished goods from different suppliers, such as from the
Philippines, Thailand, and China, and consolidate all goods and ship them as one single
shipment to the buyers in the US and Western Europe.
The Secretary for Transport and Housing Bureau of the Hong Kong SAR
government points out that the Hong Kong logistics sectors cannot compete with their
Mainland counterparts on cost but have to move up gradually in the value chain toward
high-end services. The Legislative Councillor representing the transport and logistics
constituency states that value-adding is the way forward for the Hong Kong logistics
industry to stay ahead of the competition at all times. She also adds that the industry
needs to enhance the quality of logistics services through adoption of technology and by
manpower training. Transparency in governance, the pro-business environment,
user-friendly rules and regulations, and hassle-free customs have to be maintained. She
has responded positively to the question of whether FFs should actively expand into the
PRD by taking advantages of CEPA arrangements. Both top government official and
178

legislator relating to the logistics industry advocate value-creating strategies, a key
concept under RBV that applies to 2PL and 3PL referred to in Fig. 2.2.
The general manager of CMA and former Chairman of Liners Association Hong
Kong also advocates strengthening the role of Hong Kong as a regional distribution
centre. His rationale is that since Hong Kong is a regional distribution centre,
containers packed with imported goods can be used to fill the much-needed outbound
cargo shipping out of Hong Kong. Additional popular take-off/landing time slots at
Chek Lap Kok have been taken up by well-established airlines. A number of airlines
operating in Hong Kong have to accept less convenient departure/arrival times. Many
airlines have to take-off after midnight and arrive before six in the morning. Currently,
Hong Kong is linked to more than 150 cities around the world by air; however, the
Hong Kong Airport Authority has committed to offering air connectivity to 180 cities
around the world. The consultant commissioned by Hong Kong Logistics Development
Council and Hong Kong Trade Development Council in 2007 has told the author that
increased air connectivity will increase air cargo capacity offered to the logistics
industry to cope with the capacity demand by the logistics services users. The rationale
is to spread the operating costs by increasing transaction frequency. Moreover, another
LSP manager emphasised that the improved air connectivity between Hong Kong and
China will speed up the movements of goods between 110 cities outside China and 40
airports inside China. Goods shipped out of 11 0 airports outside China can be
transhipped via Hong Kong to 40 airports inside China and vice versa in a time-definite
manner. This efficiency is due to predictable customs formality and world-class ground
handling efficiency in Hong Kong. Elimination of uncertainty in these elements will
reduce transaction costs (Klein, 1989, Klein, Frazin, and Roth 1990).
The Chairman of Hong Kong Terminal Operators Association has stated that the
Hong Kong-Zuhai-Macau Bridge, which is expected to be completed by 2015, will
179

facilitate the movement of goods from the provinces in Southwestern China, such as
the Guangxi and Sichuan Provinces. Logistics service users from these provinces have
the options to use Shekou or Hong Kong for ocean freight, Guangzhou Airport or
HKIA for airfreight, or Shanghai both for ocean and airfreight. He also adds that the
ports in the PRD are jointly invested and managed by Hong Kong interests, and that
this represents a horizontal inter-organisational cooperation to reduce transaction costs
(see Rindfleisch and Heide, 1997). Therefore, the author predicts that Hong Kong"s
port and airport will excel in the competition with their counterparts in China, in terms
of total transit time and supply chain management. Part of the traffic originating from
Sichuan Province traditionally 'fed' into Shanghai may be rerouted via Hong Kong
after the completion of the Hong Kong-Zuhai-Macau Bridge. This point is also echoed
by other government officials.
The Chairman of HAFFA has opined that with a non-asset or asset-light business
model, forwarding logistics operators can easily branch out to China, particularly in the
PRD, which is a fast expanding market with tremendous potentials. According to an
interviewed manufacturer, the move to Mainland China of many experienced Hong
Kong logistics practitioners to pursue better career opportunities is a reflection of the
quality and professional knowledge of Hong Kong logistics practitioners. From the
logistics operators" point of view. they need to train up qualified logistics professionals
to ensure their quality services. However, additional job opportunities have been
created to fill the vacancies left by those Hong Kong logistics professionals who have
moved to China. According to the President of CILTHK, Hong Kong has the
opportunity to build itself as a logistics human resources centre that supports the
logistics industry in China.
A number of logistics service users agree that forwarding logistics operators are at
the forefront of logistics businesses by managing customer relationships and doing a
180

good job with importers in the major markets such as North America, Western Europe,
and Japan through their own offices, or through working with agents around the world.
Several shippers state that they not only source from the PRD but also from the YRD
and other parts of China. The Chairman of Sea Freight Association Hong Kong has told
the author that, after China relaxed the control of forwarding logistics licensing
requirements in China, Hong Kong forwarding logistics operators can easily branch out
to the PRD. They have a good chance of capturing part of the 23 million TEUs that are
shipped out of PRD ports. Other LSP managers also agree that their international sales
network stands a very good chance of getting part of the forwarding logistics business
in fast-growing markets such as the YRD and Bohai areas. The sooner Hong Kong
forwarding logistics operators branch out to the PRD, the YRD, and Bohai areas, the
higher the probability for them to share a slice of the fast growing logistics markets in
these areas.
Government officials have emphasised the importance of integrating Hong Kong
into the PRD and GPRD markets. They state that the Hong Kong government's role is
to create the business environment to motivate the private sector to integrate with the
PRD logistics industry at a faster pace. Through Hong Kong government's effort, Hong
Kong has been included into the master planning of the GPRD planning commission
since March 2009. Several LSPs opine that it is Hong Kong government's
forward-looking dynamism that drives several mega transportation projects. The Hong
Kong-Zhuhai-Macau Bridge started construction in the beginning of 2010.
Furthermore, the Guangzhou-Shenzhen-Hong Kong Express Rail Link has been
approved by the Hong Kong government pending budget approval by the Finance
Committee of Legislative Council. The Express Rail Link will cement Hong Kong's
position as the business gateway to China, and will open up a wealth of new business
opportunities. It will make commercial activities between Hong Kong and the
181

Mainland smoother and attract more foreign investors who will see Hong Kong as the
portal to the China market. With a one-hour business circle created by the Express Rail
Link, Hong Kong logistics sectors will be able to penetrate into the logistics markets in
the major cities in the PRD. More and more Hong Kong logistics operators are
anticipated to branch out into the PRD markets.
Ambitious local LSPs emphasised that due to the non-asset-based flexible structure,
Hong Kong's forwarding logistics operators will be in a better position to be integrated
into the PRD manufacturing logistics industry. They will continue to manage the
relationship with importers and gain their confidence. The same decision-makers who
decide the choice of LSPs for shipments going out via Hong Kong's port also decide
the choice of LSPs for shipments going out of PRD ports. The international sales
network established by Hong Kong's forwarding logistics industry will put them in a
more advantageous position in their competition with their counterparts in the PRD.
7.2 Interpretation ofthe results ofthe surveys
Electronic and communication equipment (17.9%) and textile and apparel
(15.45%) manufacturers are the main industry players in the PRD. The sample also
covers a wide scope of industry types. This indicates that manufacturers in the PRD are
expanding their business. Increasingly, they have developed more sophisticated
industrial clusters that help them not only to keep their existing competitive advantage,
but also to move up the global value chain. Approximately 80% of the sample of
manufacturers comprises SME companies with less than 100 employees, and 40% of
them have sales turnover of less than HK$ 15 million. This also reflects that,
collectively, SMEs are the main economic power in the PRD area and rely on imports
and exports. They are highly connected to the global economy. Since the SMEs lack
experience and resources to develop overseas markets, Hong Kong LSPs can help them
expand their overseas markets. These characteristics of the manufacturers in the PRD
182

explain why the economic growth in the PRD brings many business opportunities for
Hong Kong LSPs. This finding suggests that the Hong Kong government and business
community should pay much more attention to SMEs. Concerning ownership, the
author finds that many of the manufacturers are owned by Hong Kong interests. They
share a similar culture with Hong Kong LSPs, which will reduce the transaction cost
during collaboration. This is because that there are fewer conflicts if two parties have
common beliefs and expectations of behaviours that result from having a similar culture.
Consequently, the uncertainty and the opportunism are reduced, which leads to lower
transaction cost. This also provides an opportunity for Hong Kong LSPs to participate in
the Mainland market and share the benefits of economic growth.
The author finds that the main service provided by Hong Kong LSPs is freight
forwarding (81.6%). During the survey, the author ascertained that one of the distinct
competitive advantages of Hong Kong LSPs versus Mainland LSPs is their international
sales network, followed by their professional skills and Hong Kong's freeport status.
Furthermore, a majority of the respondents identified themselves as globally based
(Hong Kong, China, rest of Asia, Europe, and America). This indicates that Hong Kong
is a regional distribution centre, and that the main responsibility of LSPs is to ship
finished goods and raw materials between China and the overseas markets. As Hong
Kong's aviation industry continues to prosper and as the connectivity between Hong
Kong and the PRD improves, LSPs' intangible assets (e.g., overseas experiences and
connections) become more and more important in creating value. Therefore, the
non-asset-based forwarding logistics business is one of the best ways to utilise soft
skills fully. Half of the LSPs are owed by Hong Kong interests, which means that, in
terms of infrastructure and culture, they are more familiar with doing business locally.
Combining with the fact that many manufacturers are also owned by Hong Kong
interests, this "match' provides 0ppOliunities for LSPs to expand their businesses into
183
the PRD areas. Annual sales show that Hong Kong LSPs are evenly distributed in size.
This indicates different LSPs might have their specialised markets. For the big ones,
they may focus on serving a wide range of customer types to gain economies of scale,
whereas for the small ones, they may be very flexible in providing customised services
to some niche markets. In this way, the industry keeps a very good mix so that every
customer can find a suitable supplier for its needs. This will lead to a very competitive
environment and offers opportunities to the players.
The results indicate that the use of Hong Kong-based logistics providers is
significantly differentiated between high-performance and low-performance
manufacturers. However, there are no significant differences in terms of the choice of
Mainland logistics providers. This indicates that Hong Kong logistics service providers
are more capable in improving manufacturers' logistics perf0l111ance. The literature
review suggests that Hong Kong has a relatively pro-business environment compared
with the PRD market, especially in financial services and IT service support. The
interviews also reveal that Hong Kong logistics operators have been very successful in
building up the international sales network through which they manage the relationship
with importers in the US and Western Europe. Based on RBV, there are valuable
resources that determine the capability and competitive advantage. Since Hong
Kong-based LSPs have more resources than their PRD competitors, they playa more
impOliant role in determining the manufacturers' logistics performance. Although there
is empirical evidence indicating that the PRD LSPs are catching up, the existing
competitive advantages are important opportunities for Hong Kong LSPs to expand
their business because the PRD LSPs have a long way to go before this can be
accomplished. This is also echoed by the interviewees that many experienced Hong
Kong logistics practitioners have been attracted into the Mainland market.
The results suggest that the applications of JIT supply chain and
184
manufacturing-logistics integration are also positively associated with logistics
performance. The manufacturing activities in PRO areas, associated with China's high
speed of economic growth, have been viewed as important drivers of the development
of the LSPs. However, according to RBV, whether the advanced logistics infrastructure
can contribute to the overall performance is also determined by the manufacturers' own
resources. The interviews suggest that, currently, for Hong Kong LSPs, increasing
exposure with importers in China is relatively difficult, and they may not benefit from
the fast-growing consumer market in China at least in the short term. The reason might
be related to the application of manufacturing practices. The TCE argument emphasises
total cost in transactions. In this context, if the manufacturers have tedious internal
operations, it would be very costly for manufacturers to coordinate the logistics
operations with LSPs. This might lead to higher transaction costs. However, the
implementation of JIT supply chain and integration greatly reduce the transaction cost
between manufacturer and LSP. The application level of advanced manufacturing
practices constitutes a great challenge for Hong Kong LSPs if the Mainland
manufacturers have not developed suitable resources in terms of processes and
procedures. Becoming involved directly with the PRO's manufacturers' everyday
operations would become very difficult for the Hong Kong LSPs. Therefore, the author
suggests that Hong Kong LSPs take appropriate actions to help PRD manufacturers to
develop their manufacturing practices that help them to fit in better with LSPs
operations. These activities might demand resources; however, in the long run, it might
help Hong Kong LSPs to penetrate PRO markets and partake in the benefits of China's
economic development.
The legal system and efficient customs service in Hong Kong can explain the
difference between high-performance and low-performance manufacturers. However,
the efficiency of China customs does not affect performance. This can also be explained
185

by TCE. To be specific, an inefficient legal system will cost companies more during a
transaction. Without a transparent legal system to enforce contracts, cooperation
between two companies would be difficult and sometimes impossible, and companies
would incur extra expenses to protect their interests by weeding out undesirable
outcomes. This leads to higher transaction costs. In contrast, under a transparent legal
system, companies incur lower transaction costs, leading to better financial performance.
Customs also plays a similar role. However, interestingly, only Hong Kong customs
significantly affect performance positively. The author attributes the efficient customs
service in Hong Kong to its more professional orientation compared to their
counterparts in China. If the LSPs and manufacturers are familiar with Hong Kong
customs services, they will conduct their business with predictable outcomes and
achieve better returns on their investments. However, China customs is not well
developed, which prevents LSPs from delivering predictable outcomes, no matter how
hard they try. Under this situation, LSPs ability to deliver is constrained by the
uncertainty of China customs services. Thus, Hong Kong customs is associated with
efficient logistics performance, whereas China's customs is not. Therefore, LSPs should
study the regulations of Hong Kong customs to improve logistics performance. The
same effort mayor may not bring the desired results from China's customs.
In exploring the future directions of LSPs, the author has found that government
policies and regulations significantly affect LSPs' future decisions. The interviews and
literature review reveal that the Hong Kong government affects the performance of the
LSPs through several ways, such as the construction of the third runway at Chek Lap
Kok Airport, building the Hong Kong-Zhuhai-Macau Bridge, introducing a simple and
low corporate/personal tax system, zero-tolerance of corruption; transparent legal
system, and world-class financial and IT service support. The pro-business environment
gives Hong Kong LSPs a competitive edge compared with their counterparts in the PRD.
186

Based on RBY, the pro-business environment creates competitive advantages for Hong
Kong LSPs. Therefore, a more favourable business environment will encourage the
LSPs to expand their business.
The author also finds that industry-shifting also plays its role in determining LSPs'
future decisions. The development of the Chinese economy is unbalanced; the PRD area
is much more advanced than the other areas, such as Guangxi, Yunnan, and Guizhou
provinces. Along with increasing labour and land costs, some manufacturers are
considering moving out of the core areas of the PRD, such as Dongguan, Shenzhen, and
Zhongshan, to the surrounding areas. This is also facilitated by the government policies
and regulations since the PRO government plans to 'upgrade' its industries, whereas the
surrounding areas are keen to take over the lower-end assembly industries in order to
drive their economic growth. Operating costs will drive manufacturers to the areas
where competitive advantages are created. To some manufacturers, moving out of the
PRD into other areas becomes a good option. Relocation of industries into the hinterlnd
or outside China will create logistics demand. LSPs will find it easier to enter a new
market along with the manufacturers. Therefore, industry-shifting provides a great
opportunity for Hong Kong-based LSPs to expand their business to other areas inside
and outside China.
Interestingly, the competition does not significantly affect LSPs' future decisions.
China's high-speed economic growth creates many business opportunities for the LSPs.
While operating in a very competitive environment, Hong Kong LSPs are still able to
find new business, which can be credited to a well-developed international network and
the focus on different market niches compared with local LSPs. However, the literature
review indicates that local LSPs are improving their capabilities and 'catching up' on
some aspects. Hong Kong LSPs have to stay ahead and find ways to maintain their
competitive advantage. One possible way is to invest more in external networks, which
187

will help them to further differentiate themselves from local LSPs in China. The other
way is to cooperate with local LSPs by developing their capabilities.
Surprisingly, operating cost does not significantly affect decisions on future
directions. According to TCE and LSA, cost is an important determinant of business
decision. The plausible explanation may come from the author's focus on human capital
to measure cost. Thus, this result indicates that the cost for human resources in the PRD
area will not become a constraint for LSPs because competitors have more or less
cost structure in human resources. The new labour law introduced in 2008 also increases
the labour cost in PRD, which reduces its cost advantage compared with Hong Kong.
Moreover, in recent years, the PRD government has not only attracted capable workers
from the whole country, it has also supported the local educational institutes to train
logistics workers. In addition, China's high-growth economic development has also
attracted a good supply of expatriate logistics professionals to work in China. Thus,
PRD will have less competitive disadvantages compared with Hong Kong in terms of
human resources support. Hiring suitable staff in the PRD is not a problem for Hong
Kong LSPs who do not view operating cost as an important factor for their future
development in China because their competitors will have the same burden. This
finding shows that human resource is no longer a location-specific advantage for Hong
Kong. However, this is still an opportunity instead of a challenge for Hong Kong LSPs
because they can opt to improve their human resources, which will support them when
they expand their business in the PRD.
The survey shows that the most import reasons for PRO's export/import shipping
through Hong Kong by air are dependable logistics services, which include efficient
customs service, direct flight to final destinations, predictable transit handling, reliable
forwarding services, better flight connections, consolidation, and quality control in
Hong Kong; lower line-haul is not the main reason. These indicate the location-specific
188

advantages of Hong Kong in the form of the soft skills and intangible resources of its
LSPs, but not on the lower line-haul cost reduction. To be specific. Hong Kong customs'
significance is related to logistics performance. Thus, the efficiency and effectiveness of
the customs will attract the customers to go directly through Hong Kong. The interviews
reveal that the development in the aviation industry, such as the third runway in HKIA,
has been viewed as an important way to improve the competitiveness of Hong Kong
LSPs. Furthermore, Hong Kong LSPs offer better supply chain solutions in terms of
more direct air connectivity with overseas markets. These intangible resources,
combined with tangible infrastructure benefits, provide Hong Kong a unique position in
this area and drive customers to ship directly from Hong Kong to overseas markets. The
survey also indicates that Hong Kong LSPs are good at providing world-class
forwarding logistics services. Coupled with predicable transit handling and quality
service, Hong Kong LSPs offer value-added services and greatly reduced transaction
cost by controlling for the risk during transportation. Therefore, shipping through Hong
Kong incur greater direct shipping cost; however, the service quality is much better,
resulting in a lower overall transaction cost. According to RBV and LSA, Hong Kong
LSPs should focus more on their knowledge and other intangible resources (such as air
connectivity with overseas markets, knowledge on quality control and consolidation,
and freight forwarding service) because these are the source of their competitive
advantages. The Hong Kong government's role is to assist Hong Kong-based LSPs to
differentiate themselves by offering high-quality value-added services.
The main reasons for shipments going out from PRD port/airports are requests
from customers for lower shipping costs. This suggests that Hong Kong and the PRD
complement each other and have their own separate, market niches. Manufacturers that
focus on a cost leadership strategy will ship directly from the PRD ports to reduce cost.
In contrast, manufacturers that focus on a differentiation strategy and that demand high
189

service quality will ship through Hong Kong. Based on the arguments of LSA, this
result indicates that Hong Kong's advantage lies in its service quality, whereas South
China's advantage depends on its low-cost position. At the same time, these
characteristics also provide both opportunities and challenges for Hong Kong LSPs.
With the development of China's economy and upgrading of industry focus, some
manufacturers in the PRD demand high-quality and value-added logistics services.
These demands cannot be satisfied by local LSPs. Quality LSPs are more dedicated to
high-end customers but they might lose market share from customers who require
low-cost services unless they have a different strategy to deal with this market segment.
Since SMEs are more interested in cheaper shipping costs, the author suggests that
Hong Kong LSPs apply differentiation and cost leadership strategies in order to
maintain their market shares both in the high- and low-end segments of the market in
order to partake fully in the benefits of market developments in PRD logistics services.
From the LSPs' perspective, the 24-hour cross-border customs service, low land
cost for logistics industry, and improved ocean freight facilities are the necessary
policies and actions for improving competitiveness. These activities are evidently highly
related to operating costs. As evident from the previous analysis, the location-specific
disadvantage of Hong Kong LSPs compared with PRD competitors lies in high
operating costs. To compete with the PRD logistics service providers, Hong Kong LSPs
need to reduce their operating costs dramatically. Some of the costs are out of the
control of LSPs and require government assistance (e.g., infrastructure development,
land and labour cost, and regulations). To be specific, the 24-hour cross-border policy
enables LSPs to deliver goods from South China to Hong Kong without delay. This not
only greatly reduces inventory and transportation cost, it also decreases total lead-time.
However, Hong Kong's land cost is much higher than that of the PRD. This greatly
increases Hong Kong LSP's operating cost. Affordable land exclusive for logistics use
190

offered by the Hong Kong Government will greatly enhance Hong Kong LSPs'
competitive advantages. Developments in logistics infrastructure will also help Hong
Kong LSPs reduce transaction cost and enable them to offer more competitive pricing to
customers. Hong Kong LSPs have captured, and will continue to capture, the high-end
of the market by offering dependable quality logistics services. Although local LSPs in
the PRD still have the low-cost advantage over Hong Kong, with the help of the Hong
Kong Government, LSPs can trim their operating costs and reduce the gap.
191

Chapter Eight Conclusion and Recommendations
8.1 Conclusion
The Hong Kong forwarding logistics industry has benefited from the strong
logistics demand of manufacturers operating in the PRD. If the operating environment
in the PRD does not motivate the manufacturers to stay, demand for forwarding logistics
services will weaken. With China's relatively stable political environment, low wages,
and affordable land cost, the PRD will continue to attract foreign direct investment
particularly in the manufacturing sectors. In turn, manufacturing industries in the PRD
will continue to demand forwarding logistics support.
The author argues that manufacturing activities in the PRD will continue to benefit
from the trends in outsourcing practice and globalisation in manufacturing. For the
foreseeable future, there does not seem to be a viable substitute anywhere in the world
for China, where large and competitive manufacturing facilities can be set up to satisfy
the needs of consumers around the world. This substitute cannot be found in India, in
Vietnam, or elsewhere, because China's opening has enabled it to capture just in time
the opportunity given by globalisation in manufacturing, an opportunity that arrives
once in a century. This has also enabled China to build clusters in the manufacturing
sector that generate very large economies of scale.
If the competitive advantages of the manufacturing sector III the PRD can be
established, the question to be answered is whether Hong Kong's forwarding logistics
industry can maintain and expand its market shares in the PRD market. The Managing
Director of Hong Kong Air Cargo Terminal Ltd. (HACTL) has predicted that in the next
six to eight years, the Hong Kong air cargo industry will continue to lead the world in
terms of total air cargo throughput. However, with the dramatic infrastructure
192

improvements on Guangzhou Airport and the active participation of global and, to a
lesser degree, of Hong Kong-based forwarding logistics groups in the PRD logistics
market, the scene will gradually change as more air cargo will be shipped out from
Guangzhou Airport. With Hong Kong gradually integrated into the PRD economy,
global or Hong Kong-based forwarding logistics groups will also take advantage of
Guangzhou Airport to maximise their profit opportunity by managing the expectations
of their customer accordingly. The PRD area has also made significant investments to
improve its airport and seaport facilities. The developments of modern port facilities at
Shekow, Yantian and Chiwan ports, the construction of the Hong Kong-Macau- Zhuhai
Bridge, and the building of direct railway service linking Hong Kong Airport and
Shenzhen Airport will all greatly improve the logistics infrastructures. Moreover, the
SuperLink China Direct service, the airport express lane, and Quick-Customs-Clearance
closely tie Hong Kong and the PRD together. All these logistics infrastructural
developments will facilitate the quality Hong Kong logistics operators to penetrate into
the PRD logistics market in a more integrated manner.
In terms of ocean freight, there has been clear evidence that more and more
shipments have been and will be shipped through the PRD ports. In this respect,
asset-based operators such as the terminal operators at Hong Kong's port and, to a lesser
degree, the trucking operators moving cargo between the PRD and Hong Kong, will see
their market shares stagnate or become gradually reduced. Nevertheless, there is less
negative impact on forwarding logistics operators that operate with an asset-light
business model and can move or adjust their operations to avail themselves of better
business opportunities. They handle the entire processing of shipments and manage the
relationship with most of importers who pay freight charges. The forwarding logistics
industry does not have asset specificity issues, which are a key element in transaction
cost economics. Its market is not limited to Hong Kong, but the whole of the PRD and
193

the rest of China including Shanghai, Ningbo, Qingdao, Xiamen, and Tianjin.
This thesis has developed a conceptual framework based on three theories:
transaction cost economics; resource-based value; and location-specific advantages.
TCE focuses on the cost of economic exchange between two parties, RBV analyses the
resources and competences of the firm, LSA explores the impact of the business
environment. Therefore, combining these three theories can provide a holistic view of
the challenges and opportunities faced by the Hong Kong logistics industry. The author
conducted several interviews and survey to test this model. Empirical evidence shows
that the strengths of the Hong Kong logistic industry lie in infrastructure facilities,
professional logistics personnel, government support, customs services, regional office
status, overseas sales network, legal system, tax system, and IT/financial support,
whereas its weaknesses are operating costs and location from the manufacturing centre.
The business environment creates not only opportunities in terms of political stability,
air and ocean connectivity, and WTO membership but also threats in terms of the
Sino-US relationship, competition from other production centres, RMB appreciation,
new labour laws, and shortage in labour supply. Moreover, the analysis also indicates
that the PRD will continue to use the Hong Kong logistics industry, particularly for
high-end products. Compared with the PRD logistics operators, Hong Kong LSPs have
developed and accumulated more resources (e.g., JIT supply chain, legal system, and
customs system) that are important for improving manufacturers' logistics performance
and reducing associated transaction cost. Moreover, PRD exporters will also continue to
use Hong Kong's airport and seaport because they enjoy more LSAs (e.g .. government
policies, rule of law, predictable customs service, fair competition, and industrial
shifting). These are important determinants for LSPs to plan their future directions.
8.2 Contributions
In Chapter One of this thesis, a number of contributions were identified, and these 194
are expanded upon below. This thesis represents the following:
• The first detailed analysis of the views of manufacturers, logistics companies, and
governments in the industry: a number of detailed and in-depth interviews with key
players were undertaken to ascertain their views on the current state and future
challenges and opportunities facing the logistics industry in Hong Kong. These
provide clear insights into the thoughts at the official level, as well as those of the
industry and manufacturers, and represent a very rich source of information that can
be built upon in future research. These interviews also highlight key issues that
have clearly been in the minds of the key players but have not been aired until now.
• The first detailed statistical analysis of the future implications for the industry: the
surveys undertaken for this research are the first, to the author's knowledge, to
focus upon a wide range of issues and variables that directly relate to the challenges
and opportunities facing the logistics industry. The factor analysis results are
strongly robust and indicate that many of the 'fears' expressed by the key players
(interviews), as well as the industry itself, are unjustified. However, this does not
mean that the industry has a 'rosy' future if no strategic action is taken. The SWOT
analysis, derived largely from statistical analysis results, suggests that there are still
a number of issues facing the industry that need to be addressed.
• An analysis of the extent to which current theory can help to explain logistics
developments in this part of the world: the standard theories represented in
transaction cost economics, resource-based value, and location-specific advantage,
all from economics, are in themselves insufficient to explain the historical
development or the likely future path of the industry in the PRD region. This is
largely because of the limitations these theories contain in relation to the specific
case of the logistics industry in a specific regional context.
• An assessment of the limitations of current theory in the context of the PRD region:
195

The theories focused upon in this research have a number of limitations. This is
largely because of these theories are mainly Western in origin and do not fully take
account of cultural issues specific to the region, the dramatic impact of
globalisation on the region, and the very rapid growth rates in many of the PRD
regional economies. This is unsurprising; however, these limitations do allow for
future research to start building upon on how these theoretical models can be better
developed to deal with the specifics of regional economic development.
• The development of a more useful conceptual tool for understanding the industry in
the PRD region: the academic literature on the logistics industry in general tends to
be rather descriptive in terms of classifications of the various components that make
up the industry. However, this research has been able to show that, in fact, very
strong insights provided by TeE, RBV, and LSA theories enable us to understand
better the industry and its role in economic development. However, these do not
suffice for all kinds of classifications in the industry; we have been able to show
that different levels of the logistics industry (2PL, 3PL, and 4PL, for example) are
more attuned in their functions to different elements within these theories. Hence,
only some elements of the three theories are actually useful in analysis of different
sectors within the industry as a whole. This is very important because it allows
future research to focus upon these key elements and possibly to build better and
more insightful models that can be used to develop a more comprehensive
theoretical framework.
• A critical analysis of the Hong Kong forwarding industry'S future direction:
overall results show that the industry in Hong Kong is unlikely to suffer terminal
decline. Its future appears reasonably bright, but only if the industry can better
integrate its activities with the PRD manufacturers and the PRD logistics service
providers. A 'do nothing' strategy is simply not an option because investments by
196

the PRD-based providers continues apace, and thus, the Hong Kong industry will
need to invest in order to maintain its market share in the future. Other actions
required are discussed in the following section.
8.3 Recommendations
The Hong Kong logistics industry cannot compete with its counterpart in the PRD on
prices. The strengths of the Hong Kong logistics industry are its efficiency and overall supply
chain management effectiveness. The industry needs to strengthen and invest in high
value-added consolidation and deconsolidation services to attract buyers and retain its
customers from around the world. The industry has to move up on the value creation chain by
specialising in high-value products such as wine and pharmaceutical logistics, which require
profound professional knowledge, in addition to the general merchandise such as apparels
and electronics.
By leveraging on Hong Kong's freeport status, logistics operators can build on and
strengthen Hong Kong as a regional distribution centre. Luxury items can be kept in Hong
Kong and re-forwarded to Mainland China consumers only if and when the goods are
required. By carrying imported goods into the distribution centres in Hong Kong, the
much-needed empty containers will be positioned in Hong Kong for the export of
manufactured goods.
Hong Kong's experienced and knowledgeable logistics professionals have been drawn into
the Mainland logistics markets. Government and academic institutions should make an extra
effort to train and develop logistics professionals to meet the needs of the logistics sector, not
only for Hong Kong, but also for the fast-expanding Mainland market. Indeed, the Institute of
Chartered Logistics and Transport in Hong Kong and the Hong Kong Association of Freight
Forwarding and Logistics Limited have jointly offered a training course designed for logistics
professionals at the entry/intermediary levels, with financial support from the Hong Kong
Logistics Development Council. The human resources pool built in Hong Kong through
197

continuous training and development will not only support the Hong Kong logistics industry
in Hong Kong, but also the head office functions of logistics companies who have branched
out into Mainland China.
With the financial assistance of Hong Kong Logistics Development Council, a Digital
Trade and Transport Network (DTTN) has been established and is being operated by Trade
Link Ltd. and other IT service providers specialising in trade and service sectors. The
logistics industry should work very closely together with Trade Link Ltd. or similar IT
service providers to add attributes to the industry-wide electronic platform for the continuous
improvement of logistics services efficiency.
Hong Kong will continue to lead the world in total air cargo throughput for the
foreseeable future. However, there are signs of saturation on the operations at HKlA. Many
airline operators have to accept less-favourable take-off/landing times very early in the
morning or after midnight. The author recommends that the Hong Kong government
introduce measures that will support Hong Kong-based LSPs in their efforts to strengthen the
Hong Kong market share and to penetrate the Mainland market. Such measures would
include subsidised training for logistics professionals, arbitration services, and advocacy for a
level playing field in licensing requirements for Hong Kong logistics companies operating at
the PRD and other parts of China. The author suggests that the LSPs work very closely with
manufacturers when they consider shifting their manufacturing to other areas and take
logistics costs into consideration. Holding aviation exhibitions, expanding air connectivity,
and facilitating LSPs expansion into the China market particularly in the PRD will provide
opportunities for Hong Kong LSPs. To be specific, the Hong Kong government can do its
part to support further air cargo throughput growth by doing the following:
1) Building the third runway that would enable Hong Kong Airport Authority to
accommodate more flights operating out of HKlA
2) Increasing the take-off/landing frequencies within the given operating hour by upgrading
198

the technology at the airport control tower and staff capability by continuous training
3) High-level liaison with the Mainland government in an effort to improve utilisation of
airspace time. At the moment, utilisation of airspace in eastern China, a very important
passage for East Asia and trans-Pacific routes, is constrained by military controL
Take-off and landing during the day cannot be done at an optimal level because of
certain restrictions.
The strength of the non-asset-based logistics industry in Hong Kong is in forwarding
logistics, which manages the relationship with customers in major markets such as North
America and Western Europe, either through its own network or agency relationship. Both
assets-based and non-asset-based air-related logistics operators, will hold on to their leading
positions at least for a few more years to come. On the shipping side, the throughput at the
PRD ports has almost caught up with that of Hong Kong's port. However, most the
forwarding logistics part of the ocean traffic on the other side of the border is still in the
hands of Hong Kong-based logistics operators. Fortunately, for Hong Kong logistics
operators, the PRD market is one of the most important logistics markets in the world and is
close to Hong Kong. While they still maintain their excellent relationship with the ultimate
customers overseas, they should make a major effort to branch out at least to the PRD market
or to the other major logistics markets in China such as Shanghai, Xiamen, Qingdao, Tianjin,
and Ningbo. If they do not take steps to do this major transformation to turn themselves into
China logistics players, their position will be replaced by strong local logistics operators
emerging in the PRD or other parts China. Non-asset or asset-light logistics operators such as
forwarding logistics operators, unlike non-mobile asset-based logistics operators, are
sufficiently mobile to geographically adapt and expand their operations to meet the needs of
their customers.
8.4 Limitations and future research
This research is an attempt to provide an analysis of the prospects for the Hong
199
Kong-based forwarding logistics industry. This study does not provide a very detailed
discussion of the division of works within various sectors of the logistics industry.
In-depth knowledge is required in the logistics industry to understand the importance of
relationships between forwarding LSPs and the ultimate freight-paying parties that
decide whom to use and where to ship their goods from the PRD and other parts of
China.
The shipbuilding industry has shifted from the UK to the European continent, Japan,
Korea, and China. The forwarding logistics industry has shifted from Japan to Hong
Kong, Taiwan, Korea, and China. Fortunately, for the forwarding logistics operators in
Hong Kong, one of the world's most important catchment areas for the forwarding
logistics business is within one-hour driving distance from Hong Kong.
Apparently, the forwarding logistics practitioners in Hong Kong logistics industry
have an optimistic view on their future role in the PRD and the Great PRD market. This
is because the core competence of non-asset-based LSP is intangible knowledge and
experience, and not tangible investments. This means that they can move together with
customers to enter new markets without much sunk cost at a specific location. In
contrast, the core competencies of asset-based LSPs are tangible facilities, a classic
example of the issue of asset specificity. Further research is required to establish
whether home-grown forwarding logistics operators in the PRD can replace Hong
Kong-based forwarding logistics operators in the PRD market. Such research could
benefit from utilising the conceptual framework developed in Chapter Two of this
thesis.
200

References
Adams J, Khan, R.T.A, Raeside R. and While D., 2007. Research Methods for
Graduate Business and Social Science Students. SAGE Publications Pvt. Ltd, UK
Airriess, c., 1993. Export-orient Manufacturing and Container Transport. Geography,
Vo1.78 , No.1, pp.31-42
Aichlmayr, M., 2002. Design your distributed center inside out. Transportation &
Distribution, Vo1.43, No.11, pg.30
Babbie, E., 1983. The Practice of Social Research, 3rd. Ed. Belmont, CA: Wadsworth
Baldinger, P., 1998. Secrets of the supply chain, The China Business Review, 25(5):8-15
Balassa, B., 1965. Trade liberalization and revealed comparative advantage. The
Manchester School of Economic and Social Studies, Vol. 33 No.2, pp.99-123
Barney, J., 1991. The resource-based model of the firm: Origins, implications, and
prospects. lournal of Management, VoLl7, Np.l, pg.97
Becsi, Z., and Wang, P., 1997. Financial development and growth. Economic Review,
Vo1.40, pp.42-62
Beed, T. and Stimson, R. 1985. Survey interviewing: theory and techniques. Allen and
Unwin: London
Bergsten, C.F., 2008. A Partnership of Equals: Row Washington Should Respond to
China's Economic Challenge. ForeignAjfairs, Vol.87, No.4, pg.57
Bienstock, C.C., and Mentzer, J.T., 1999. An experimental investigation of the
outsourcing decision for motor carrier transportation. Transportation lournal,
Vo1.39, No.1, pp.42-59
Bhagwati, J., 2004. In defense of globalization. Oxford University Press: New York.
Bhalla, A.S. and Bhalla, P., 1997. Regional Blocs Building Blocks or Stumbling Blocs,
St. Martin's Press, Inc., New York
201

Bhatnagar, R., Sohal, AS. and Millen, R., 1999. Third party logistics services: a
Singapore perspective. International Journal of Physical Distribution& Logistics
Management, Vo1.29 No.9, pp.569-87.
Broadman, R., 1996. Policy Options for Reform of Chinese State Owned Enterprises,
The World Bank, Washington, De.
Cassidy, J.F., and Andresso-O'Callaghan, B., 2006. Spatial determinants of Japanese
FDI in China. Japan & World Economy, VoLl8, No.4, pp.512-527
Carter, e.R., and Rogers, D.S., 2008. A framework of sustainable supply chain
management: Moving toward new theory. International Journal of Physical
Distribution & Logistics Management, VoL38, No.5, pp.360-387
Carlson, J.G., 1989. JIT applications to warehousing operations. Engineering costs &
Production Economics, Vol. 17, No.4, pp. 315-322
Chan, W., Perez, J., Perkins, A, and Shu, M., 1997. China's retail markets are evolving
more quickly than companies anticipate. McKinsey Quarterly, 1997 No.2,
pp.206-211
Chan, B., 2008. Demystifying the Chinese guanxi network. Business Information
Review, VoL25, No.3, pp.183-189
Christopher, J., 1992. Logistics and Supply Chain Management: Strategies for Reducing
Cost and Improving Cost and Improving Services, Pitman Publishing, Boston, M.A
Closs, DJ., Goldsby, TJ., Clinton, S.R., 1997. Information technology influences on
world class logistics capability. International Journal of Physical Distribution &
Logistics Management. Vol. 27 , No.1, pp.4-17.
Clemons, E.K., Reddi, S.P., and Row, M.e., 1993. The impact of information
technology on the organization of economic activity: The "move to the middle"
hypothesis. Journal of Management Information Systems, VoLlO, No.2, pp.9---35
202

Chen, U. and Paulraj, A., 2004. Towards a theory of supply chain management: the
constructs and measurements. Journal of Operations Management, Vol. 22, No.2,
pp.119-150
Cheng, Y., and Yeh, C., 2007. Core competencies and sustainable competitive
advantage in air-cargo forwarding: Evidence from Taiwan. Transportation lournal,
Vo1.46, No.3, pp.5-21
Chong, W.c., 2007. An Examination of Free Port Development in Mauritius. Phd
dissertation
Containerization International Yearbook 2005. Access from http:Uwww.ci-online.co.uk/
on 1/12/2009
Containerization International Yearbook 2008. Access from http:Uwww.ci-online.co.ukl
on 1/12/2009
Council of Supply Chain Management 2005. Access from http://www.cscmp.org/ on
1/12/2009
Cornell, T. B., 1989. Foreign Trade Zones in the United States: a longitudinal
management perspective. International Marketing Review, VoL6, No.6, pg.42
CIL T World 2006, A passage through India. Accessed from
http:Uwww.cilt-international.com/on 1/2/2010
CILT World 2007, POli infrastructure and high costs hamper India's progress. Access
from http:Uwww.cilt-international.com/on 1/2/2010
Converse, 1.M. and Presser, S., 1986. Survey Questions: Handcrafting the Standardised
Questionnaire. Sage University Paper series on Quantitative Applications in the
Social Sciences, 07-1063. Sage: Beverly Hills.
Coughlin, C.c., and Segv, E., 2000. Foreign direct investment in China: A spatial
economic study. World Economy, Vol.23, No.1, pg. 23
203

Cullinane, K., and Song, D.K., 2007. Asian container ports: Development, competition,
and co-operation. New York: Palgrave Macmillan
Da Ponte, J.J., 1997. The forting-trade zones act: Keeping up with changing times.
Business America, VoLl18, No. 12, pg. 22
Daft, R.L., 1983. Learning the craft of organizational research. Academy of
Management Review, Vol.8, NoA, pp.539-546
Deichmann, J.I., 1999. The origins, industrial composition, and spatial distribution of
foreign direct investment in Poland, 1989-1998. Ph.D dissertation State University
of New York at Buffalo
De, P., 2003. Indian ports in the era of globalization. World Port Development Vol.3, pp.
37-48
De. P. and Ghosh, B., 2002. Productivity, efficiency and technological change in Indian
ports. International Journal of Maritime Economics VolA, pp. 348 -368
De Vaus, D.A., 1996. Surveys in Social Research.3 rd edition, UCL Press, London.
Drewe, P and Janssen, B., 1998. "What port for the future? From mainports to ports as
modes of logistics networks. In A. Reggiani (ed.) Accessibility, trade and locational
behaviour, Ashgate, Aldershort, pp.224-264
Ding, P., Lin, D., and Sheng, H., 2005. Digital city Shanghai: Concepts, foundations,
and current state, P. van den Besselaar and S. Koizumi (Eds): Digital Cities 2003
pp.141-165
Ding, H. Wang, H., and Chen, L., 2007. Thinking on the operation of juristic institution
of the anti-corruption bureau: Through the analysis of ICIC and its features of
operation, Zheng Fa Lun Cong, Nol. pp. 61-67
DiRomualdo, A. and Gurbaxani, V., 1998. Strategic Intent for IT Outsourcing. Sloan
Management Review, Summer, pp. 67--80.
204

Dicken, P. 1998. Global shift: The internationalization of economic activity, London:
Paul Chapman.
Dillman, D. 1999. E-Mail and Internet Surveys: The Tailored Design Method.
Chichester: Wiley.
Domberger, S., 1998. The Contracting Organization: A Strategic Guide to Outsourcing,
Oxford University Press, Oxford
Dunning, lR., 1981. Explaining the international direct investment position of countries:
Towards a dynamic or developmental approach. Review of World Economics,
Vol.117, No.1, pp.30-64
Dunning, J.R., 1993. The globalization of business: The challenge of the 1990s,
Routledge, London
Dunning, J.R., 1998. American investment in British manufacturing industry, Routledge,
London
Earl, MJ., 1996. The risks of outsourcing IT. Sloan Management Review, Vo1.37, No.3,
pp.26-32
Einhorn, J., 2001. The World Bank"s mission creep. Foreign Affairs, Vol.80, No.5,
pp.22-35
Elbaum, B., and Lazonick W., 1986. The Decline of the British Economy, Oxford
Ferdows, K., 1997. Making the most of foreign factories. Harvard Business Review, vol.
75, pp.73-88
Flynn, B.B., Sakakibara, S., Schroeder, R.G., Bates, K.A., & Flynn, EJ., 1990.
Empirical research methods in operations management. Journal of Operations
Management, Vol .9, No.2, pp.250-273
Floyd, D., and Summan, S., 2008. Understanding the main motives for foreign direct
investment, an East-West country contrast: Is the host country legislation an
important factor? Corporate Governance, Vol8. No.5, pp.661-668
205

Frohlich, M.T., & Westbrook, R., 2001. Arcs of integration: An international study of
supply chain strategies. Journal of Operations Management, Vo1.19, No.2,
pp.185-200
Foddy, W.H., 1992. Constructing Questions for Interview and Questionnaires.
Cambridge University Press: Melbourne
Fombrun, C. and Wally, S., 1992. Global Entanglements: The Structure of Corporate
Transnationalisation, in Pucik, v., Tichy, N. and Barnett,C. (Eds) Globalising
Management: Creating and Leading the Competitive Organisation
Fung, M.K., Zhang, A., Leung, L.C., and Law, F.S., 2005. The Air Cargo Industry in
China: Implications of Globalization and WTO Accession. Transportation Journal,
Fall, 2005, pp. 44-62.
Frey, B.S., and Schneider, F., 1986. Competing models of international lending activity,
Journal of Development Economics, VoL20, No.2, pg.225
Gao, X., 2009. International comparison of air import clearance, Logistics Sci-Tech,
Vo1.6,pp.22-25
Ghosh, B. and De, P., 2000. Impact of performance indicator and labour endowment on
traffic: Empirical evidence from Indian ports. International Journal of Maritime
Economics VoL 2 pp. 259 - 282
Goh, M. and Ang, A., 2000. Some logistics realities in Indochina. International Journal
of Physical Distribution & Logistics Management, Vol. 30 No. 10, pp. 887-911
Goh, M., and Ling, c., 2003. Logistics development in China. International Journal of
Physical Distribution & Logistics Management, Vo1.33, No.9/10, pg. 886
Gonza1ez-Benito, J., 2000. JIT purchasing in the Spanish auto components industry:
Implementation patterns and perceived benefits. International Journal of
Operations & Production Management, Vol.20, No.9/10, pp.1038-1061
206

Gonzalez, M.M. and Trujillo, L., 2008. Reforms and infrastructure efficiency in Spain's
container ports. Transportation Research Part A, Vol. 42 No. a, pp 243-57
Goss, R.O., 1990. Economic policies and seaports: Are port authorities necessary?
Maritime Policy & Management, VoLl7, Issue 4, pp 257 - 271
De Maton G.J. 1997. Public Port Administration and Private Sector Intervention in
Ports and the Port Industry. World Bank
Grant, V., 1995. Total quality challenges the management accountant, Management
Accounting: Magazine for Chartered Management Accountants, Vol. 73, No.6, pg.
40
Grover, V., and Malhotra, M.K., 2003. Transaction cost framework in operations and
suppl y chain management research: Theory and measurement, Journal of
Operations Management, Vol.21, pp.457---473
Gutierrez, G., and Duran, A, 1997. Information technology in logistics: A Spanish
perspective. Logistics Information Managemen~ VoLlO, No.2, pg,73
Hammant, J., 1995. Information technology trends in logistics. Logistics Information
Management, Vol.8, No.6, pg. 32
Handfield, R.B., & Bechtel C., 2002. The role of trust and relationship structure in
improving supply chain responsiveness. Industrial Marketing Management, Vo1.31,
No.4, pp.367-382.
Hair, J.F., Anderson, R.E., Tatham, R.L., & Black, W.e., 1998. Multivariate data
analysis. New Jersey, Prentice Hall.
Hanna, J.B., and Maltz, A, 1998, LTL expansion into warehousing: A transaction cost
analysis. Transportation Journal, Vo1.38, No.2, pp.5-17
Halldorsson A and Larson P., 2004. Logistics versus supply chain management: An
international survey,!nternationalJournal of Logistics, Vo1.7, No.1, pp. 17-31
207

Halldorsson, A, and Skjott-Larsen, T., 2006. Dynamics of relationship governance in
TPL arrangements: A dyadic perspective. International Journal of Physical
Distribution & Logistics Management, VoL36, No.7, pp.490-506
Handari, y., 1990. The role of tax incentives in attracting foreign investments m
selected developing countries and the desirable policy. International Lawyer,
Vol.24, Np.1, pp.121-152
Hardaker, G., Trick, R.T., and Sabki, AA, 1994. The use of IT in freight forwarding in
the UK. Logistics Information Managemen~ Vol.7, No.4, pg. 19
Harland, c., 1995. Networks and Globalisation: A Review of research. Warwick
Business School, University of Warwick, Coventry, UK
Harland, C., Brenchley, R. and Walker, H., 2003. Risk in Supply Networks. Journal of
Purchasing & Supply Management, vol.9, pp.51-62
Harrison, B., 1994. The small firms myth. California Management Review, Vol. 36,
No.3, pp.142-158
Hartman, D.G., 1984. Tax policy and foreign direct investment in the United States.
National Tax Journal, Vol.37, No.4, pp.475-487
Ho, L.S., Wei, X., and Wong, W.C., 2005. The effect of outward processing trade on
wage inequality: the Hong Kong case. International Journal of Production
Economics, VoL 67, No.1, pp. 241-257
Ho. S., 2008. Extracting the information, espionage with double crossing. Journal of
Economics, Vol.93, No.1, pp.31-58
Hong Kong Automobile Association, 2007. Annual report. Access from
http://www.hkaa.com.hk!on 1/3/2009
Hong Kong Automobile Association, 2008. Annual report, Access from
http://www.hkaa.com.hk!on 1/3/2009
208
Hong Kong Airport Authority, 2009. Air cargo throughput of Hong Kong and
Singapore. Access from http:Uwww.Changiairportgroup.com.sg/caglhtml on
1/12/2009
Hong Kong Port Development Council, 2010. Hong Kong Port Statistics. Access from
http://www.pdc.gov.hk/eng/statistics/hongkong.htm on 1/4/2010
Hong Kong Trade Development Council, 2006. Air Cargo Statistics. Access from
http:Uwww.hktdc.com/on 1/12/2009
Hong Kong Trade Development Council, 2009. China GDP Statistics, Access from
http:Uwww.hktdc.com/on 1/3/2010
Hong, J., Chin, A.T.H., and Liu, B., 2004. Logistics outsourcing by manufacturing in
China: A survey of the industry. Transportation] ournal, Vo1.43, No.1, pp.17 -25
Hong, J., 2007. Location determinants and patterns of foreign logistics in Shanghai,
China, The Service Industries] ournal, 27(4):339-354
Hong, J., and Liu, B., 2007. Logistics development in China: A provider perspective.
Transportation]ournal, Vo1.46, No.2, pg. 55
ISCC, 2007. India logistics industry: $125 billion goldmine. Access from
www.supplychains.in on 1/12/2009
Ip, P., 2003. A corporation for the "World": The vantone group of China. Business and
Society Review, Vo1.108, No.1, pg.33
Invest HK, 2006. Access from http://www.investhk.gov.hk on 1/12/2009
Invest HK, 2009. Access from http://www.investhk.gov.hk on 1/12/2009
Jason, K. L. Kraemer, and Tony Tsai., 1999. ACER: an IT Company Learning to Use
Information Technology to Compete. Center for Research on Information
Technology and Organization, University of California, Irvine
209

Jiang, B. and Prater, E., 2002. Distribution and logistics development in China: The
revolution has begun. International Journal of Physical Distribution & Logistics
Management, Vol.32, No.9/10, pp.783-798
Jiang, RJ., 2005. Entry strategies and subsequent foreign expansion path. Academy of
Management Proceedings, Pg.k1-k6
Johnson, J., 2005. India gains credibility as an emergent export titan. Financial Times,
29, November 2005
Johnson, R.A. and Wichern, D.W., 1998. Applied Multivariate Statistical Analysis,
Prentice-Hall International, Inc.
Jose, P., 2005. India and the Global Container Ports. Maritime Economic & Logistics,
Vol.7, pp.189-192
Kakabadse, A., and Kakabadse, N., 2002. Trends in outsourcing: Contrasting USA and
Europe. European Management Journal, Vol.20, No.2, pg.189
Kang, J., Kim, J., Liu, W., and Yi. S., 2006. Post-takeover restructuring and the sources
of gains in foreign takeovers: Evidences from U.S. targets. Journal of Business,
Vo1.79, No.5, pp.2503-2537
Kang, S., Kumar, P., and Lee, H., 2006. Agency and corporate investment: The role of
executive compensation and corporate government. The Journal of Business, Vol.
79, No.3, pg.1127
Kaufmann, R.K., 1995. A model of the world oil market for project LINK: Integrating
economics, geology, and politics. Economic Modeling, Vo1.12, No.2, pp. 165-178
Kerlinger, F. N., & Lee, H. B., 2000. Foundation of behavioral research, 4thed.,
Orlando, FL: Harcourt, Inc
Klein, S. 1989. A transaction cost explanation of vertical control III international
markets, Journal of Academy of Marketing Science, 17(3):253-261
210

Klein, S., Frazier, G.L., and Roth, V.J., 1990. The transaction cost analysis model of
channel integration in international markets, Journal of Marketing Research,
XXVII: 196-208
Korgaonker, M.G., 1990a. Integrated supply chain management - part I. MM The
Industry Magazine, February, pp. 73-82.
Korgaonker, M.G., 1990b. Integrated supply chain management -pat II. MM - The
Industry Magazine, March, pp. 73-82.
Kearney, H., 2002. Global Bonanza. Best's Review, Vo1.103, No.1, pg.96
Kwong, K, 1988. Towards open skies and un congested airports: An opportunity for
Hong Kong, Hong Kong Center for Economic Research by the Chinese University
Press: Hong Kong
Kumar, K, 2001. Technology for supporting supply chain management.
Communications of the ACM, Vo1.44, No.6, pp.58-61
Lai, KH., 2004. Service capability and performance of logistics service providers.
Transportation Research Part E 40 (5),385-399.
Lai, K, and Cheng, T.e.E. 2004, A study of the freight forwarding industry in Hong
Kong. International Journal of Logistics: Research & Applications, Vol.7, No.2,
pp.71-84
Lai, K Cheng, T.e. E. and Yeung, A.C.L., 2004a. An Empirical Taxonomy for
Logistics Service Providers. Maritime Economics & Logistics, Vo1.6, No.3,
pp.199-219
Lai K, Ngai, E.W.T., and Cheng, T.e.E., 2004b. Information technology adoption in
the Hong Kong Logistics Industry. Transportation Journal, Vo1.44, No.4, pp. 1-9
Lamey, J., 1996. Supply Chain Management: Best Practice and the Impact of New
Partnerships. Financial Times Retail and Consumer Publishing, London
211

Lambert, D.M., 2001. The supply chain management and logistics controversy, in
Brewer, A. Button, K and Hensher D. (ed.) Handbook of logistics and supply chain
management,
Langley, C.J., Hoemrnken, S., Dort, E.V., Morton, J., Strata, R. and Riegler, M., 2007.
The state of logistics outsourcing: 2007 third party logistics, Capgemini, the
Georgia Institute of Technology
Laulajainen, R., and Stafford, H., 1995. Corporate Geography: Business Location
Principles and Cases, Kluwer Academic Publishers, Dordecht
Lee, M.Q.C., 1995. Business and the rule of law in Hong Kong. Columbia Journal of
World Business, Vol.30, No.2, pp.28-32
Li, S., Rao, S.S., Ragu-Nathan, T.S., and Ragu-Nathan, B., 2005. Development and
validation of a measurement instrument for studying supply chain management
practices. Journal of Operations Management, Vol. 23, No.6, pp. 618-641
Li, K, Sivakumar, A. I., and Ganesan, V.K, 2008. Analysis and algorithms for
coordinated scheduling of parallel machine manufacturing and 3PL transportation.
International Journal of Production Economics, Vol. 115, No.2, pg. 482
Liao, D., 2008. A review of Corruption by design: Building clean government in
mainland China and Hong Kong by Melanie Manion. International Public
ManagementJournal, Voll1. No.2, pp.235-239
Lieb, R.C., 1992. The use of third party logistics servIces by large American
manufacturers. Journal of Business Logistics, Vo1.13 No.2 pp. 29-42.
Lieb, R.C., Miller, R.A. and Wassenhove, L.N.V., 1993. Third party logistics services: a
comparison of experienced American and European manufacturers. International
Journal of Physical Distribution & Logistics Management, VoL 23 No.6, pp.35-44.
212

Lieb, R.C. and Randall, H.L., 1996. A comparison of the use of third party logistics
services by large American Manufacturers, 1991, 1994 and 1995. Journal of
Business Logistics, VoLl7 No.1, pp.305-20.
Lorenz, E.H., 1991. An evolutionary explanation for competitive decline: The British
shipbuilding industry 1890-1970. The Journal of Economic History, Vol. 51, No.4,
pp.911-935
Logistics Information Centre of China Federation of Logistics and Purchasing, 2005.
Access from http://www.chinawuliu.com.cn/on 1/7/2009
Logistics Information Centre of China Federation of Logistics and Purchasing, 2008.
Access from http://www.chinawuliu.com.cn/on 1/7/2009
Lu, S., and Lu, D., 2002. A History of Hong Kong Economy, Sanlianshudian: Hong
Kong
Lu, C.S., 2004. An evaluation of logistics services' requirements of international
distribution centers in Taiwan. TransportationJournal, Vo1.43, No.4, pp.53-66
Lu, C.S. and Yang, C.c., 2006. Comparison of investment preferences for international
logistics zones in Kaohsiung, Hong Kong, and Shanghai ports from a Taiwanese
manufacturer's perspective. Transportation Journal, Vo1.45, No.1, pp30-51
Lubbers, R., 1995. Globalization: A New Look at Political Economy, Inaugural Lecture.
Lu, c., and Yang, c., 2006. Evaluating key logistics capabilities for international
distribution center operations in Taiwan. Transportation Journal, Vo1.45, No.4,
pp.9-27
Lu, C.S., 2007. Evaluating key resources and capabilities for liner shipping services.
Transport Reviews, Vol.27 ,No.3, pp: 285-310.
Luo, Y., 1996. Evaluating the performance of strategic alliances in China. Long Range
Planning, Vo1.29, No.4, pp.534-542
213

Luo, Y., 1998. Joint venture success in China: How should we select a good partner?
Journal of World Business, VoL33, No.2, pg.14S,
Ma, J., and Wang, Z., 2001. Winners and losers ofChina's WTO Entry. China Business
Review, Vol.28, No.2, pg.22
Mao, H. and Chen, L.S., 2001. Quantitative and dynamic analysis of the oil variables
determining FDI in China. Review of Urban & Regional Development Studies,
Vo1.13, No.2, pg.161
MacCormack, A.D., Newmann, LJ.I. and Rosenfield, D.E., 1994. The new dynamics of
global manufacturing site location. Sloan Management Review, vo1.3S, pp.69-84
Mann, S., 2001. Dry packaged goods: Overcoming logistical hurdles. The China
Business Review, 28(4):24-29
Markley, MJ., and Davis, L., 2007. Exploring future competitive advantage through
sustainable supply chains. International Journal of Physical Distribution &
Logistics Managemen~ Vo1.39, No.9, pp.763-774
Markides, V. and Holweg, M. 2006. On the diversification of international freight
forwarders; A UK perspective. International Journal of Physical Distribution &
Logistics Management, Vo1.36, No.S. pg. 336
Maurno D.A. ,2006. Singapore Connects, World Trade March
Mei, W., 2004. Relocation and agglomeration of Chinese industry. Journal of
Development Economics, Vo1.73, No.1, pg. 329
Meixell, M. and Gargeya, V., 200S. Global supply Chain Design: A Literature Review
and Critique. Transportation Research Part E, vol.41, pp.S31-SS0.
Mergeglobal, 2008. Access from http:Uwww.mergeglobal.com/on 1/7/2009
Mills, J., Schmitz, J., and Frizelle, G., 2004. A strategic view of "supply net\lvorks'".
International Journal of Operations and Production Management, Vo1.24, No.9/10
pg.1012
214

Millen, R. and Sohal, A., 1996. Current logistics practices in the Asia Pacific region.
International Journal of Physical Distribution & Logistics Management, Vol. 26
No.10
MOFCOM, 2009. Access from h1tp://english.mofcom.gov.cn on 31/3/1010
Murphy, P., Daley, J. and Dalenberg, D., 1992. Port Selection Criteria: An Application
of a Transport Research Framework. Logistics and Transportation Review, Vol. 28
No.3, pp. 237-255.
National Bureau of Statistics of China, 2009. Access from http://www.stats.gov.cn on
31/3/2010
Narasimhan, R. and Jayaram, J., 1998. An empirical investigation of the antecedence
and consequences of manufacturing goal achievement in North American,
European and Pan Pacific firms. Journal of Operations Managemen~ Vol. 16, pp.
159-176
Ng. L.F., and Tuan, C., 2006. Spatial agglomeration, FDI, and regional growth in China:
Locality of local and foreign manufacturing investments. Journal of Asian
Economics, VoLl7, No.4, pp.691-713
Nolan, R.L., and McFarlan, F.W., 1995. Outsourcing. Harvard Business Review, Vo1.73,
No.4, pp.160
Norusis. Marija J. (2005). SPSS 13.0 Statistical Procedures Companion. Chicago: SPSS,
Inc
Nunnally, J. 1978. Psychometric methods. New York, McGraw-Hill.
Powers, P., 2001. Distribution in China: The end of the beginning, The China Business
Review, 28(4):8-12
OECD, 1995. Foreign Direct Investment: OECD Countries and Dynamic Economies of
Asian and Latin America, Organization for Economic Cooperation & Development,
Paris
215

OEeD, 2007. Policy brief-economic survey of India. Access from
www.oecd.org/publications/Policybriefs on 1/12/2009
O'Leary-Kelly, S.W., & Vokurka, R.J. (1998). "The empirical assessment of construct
validity". Journal of Operations Management, 16(4),387-405.
O'Neill J., Wilson, D., Purushothaman, R. and Stupnytska, A, 2005. Global economics
paper no.134 - how solid are the ERICs. Access from www.gs.com on 1/12/2009
Ou, X., 2006. Accelerating the development of logistics industry in China, Access from
http://www.ndrc.gov.cn/mtbd/t20060322 _ 63806.htm on 1/12/2009
Panayides, P.M., 2004. Logistics service providers: An empirical study of marketing
strategies and company performance. International Journal of Logistics: Research
&Applications, Vol.7, No.1, pp.1-15
Pillania R.K., 2007. Global competitiveness in knowledge economy: where India stands.
International lournal of Knowledge and Systems Science, Vol. 4, pp 1-6.
Piplani, R., Shaligram, P., and Tan, A, 2004. Perspectives on the use of information
technology at third party logistics service providers in Singapore, Asia Pacific
lournal of Marketing and Logistics, Vo1.16, No.1, pg. 27
Pinho, J.c., 2007. The impact of ownership. International Marketing Review, Vol.24,
No.6, pp.715-734
Prokopenko, J., 1998. Globalization, competitiveness and productivity strategies.
Enterprise and Co-operative Development, International Labour Office Geneva.
Popper, K.R., 1979. Objective Knowledge: An Evolutionary Approach (Revised edition).
Oxford: Oxford University Press.
Quinn, J. B. and Hilmer, F. G., 1994. Strategic Outsourcing. Sloan Management Review,
Vol. 35, No.4, pp. 43--55.
Quinn, J. B., 1999. Strategic Outsourcing: Leveraging Knowledge Capabilities. Sloan
ManagementReview, Summer 1999, pp. 9-21
216

Rabinovich, E., Knemeyer, AM., and Mayer, C.M., 2007. Why do Internet commerce
firms incorporate logistics service providers in their distribution channels? The role
of transaction costs and network strength. lournal of Operations Management,
Vol.25, No.3, pp.661-681
Rao, K., and Young, R.R., 1994. Global Supply Chain, International Journal of
Physical Distribution & Logistics Management, Vol. 24, No.6, pg.ll
Ray, AS., 2005. Managing port reforms in India: Case study of lawaharlal Nehru Port
Trust (lNPT) Mumbai, Background paper prepared for the World Development
Report 2005
Razzaque, M.A, 1997. Challenges to logistics development: the case of a third world
country - Bangladesh. International lournal of Physical Distribution & Logistics
Management, Vol.27 No.1, pp.18-38
Razzaque, M.A and Sheng, Cc., 1998. Outsourcing of logistics function: a literature
survey. International lournal of Physical Distribution & Logistics Management,
Vol. 28 No.2, pp. 89-107
Research Center of Logistics NanKai University, 2009. Report of China Logistics
Development, China Goods and Materials Press, Beijing
Rindfleisch, A, and Heide, J.B., 1997. Transaction cost analysis: Past, present, and
future applications, lournal of Marketing, 61(4):30-55
Root, F.R., and Ahmed, A, 1978. The influence of policy instruments on manufacturing
direct foreign investment in developing countries. lournal of International Business
Studies, Vol.9, No.3, pp.81-93
Root, F.R., and Ahmed, A, 1979. Empirical determinants of manufacturing direct
foreign investment in developing counties. Economic Development & Culture
Change, Vol.27, No.4, pg.751
217

Sachs, J., 1996. Globalization and employment. International Institute For Labour
Studies, Geneva
Sachs, J., 1998. Growth in Africa Competitiveness Report 1998. World Economic
Forum, Geneva, Switzerland.
Sahay, B.S. and Mohan, R., 2006. 3PL practices: an Indian perspective. International
Journal of Physical Distribution & Logistics Management, VoL36 No.9,
pp.666-689
Sajikumar, 2008, The Icfai. Journal of Infrastructure, VoL VI, No.1,
Schmitt, N. (1996). Uses and abuses of coefficient alpha. Psychological Assessment, 8,
350-353
Schroath, F.W., Ru, M.Y, and Chen, R., 1993. Country-of-origin effects of foreign
investments in the People 's Republic of China. Journal of International Business
Studies, Vo1.24, No.2, pp.277-290
Scholes, M.S., Wilson, G.P, Wolfson, M.A., 1992. Firm's responses to anticipated
reductions in tax rates: The tax reform act of 1986. Journal of Accounting Research,
Vo1.30, No.3, pp.161-185
Schulze, R., 1997. International Tax-Free Trade Zones and Free Ports: A comparative
study of their principles and practices, Butterworths, Duran.
Sharpe, M., 1997. Outsourcing, organizational competitiveness and work. Journal of
Labor Research, Vo1.18, No.4, pp.535-549
Shang, K., and Sun, L., 2004. Taxonomy in logistics management: A resource-based
perspective. Internationallournal of Management, Vol.21, No.2, pp.149-165
Shao, C., 2009. Second board rules. International Financial Law Review, VoL28, No.5,
pg.8
Shenzhen Port, 2008. Accessed
http://www.sztb.gov.cn:8080/szport/engiInfo/index.htm on 1/3/2009
from
218

Shen, J., and Yeung, Y., 2004. Development and transformation of the free port of
Hong Kong, Hong Kong Institute of Asia-Pacific Studies: Hong Kong
Sit, V.F.S., 2003. Forging Asia's global transpark in the Pearl River Delta at Zhuhai.
Chinese Geographical Science, VoI13, No.4, pp/300-309
Skjoett-Larsen, T., 1999. Supply chain management: A new challenge for researchers
and managers in logistics. International Journal of Logistics Managemen~ VoLlO,
No.2, pp.41-53
Skjoett-Larsen, T., 2000. Third party logistics: From an inter-organizational point of
view. International Journal of Physical Distribution & Logistics Management,
Vo1.30, No.1/2, pg.112
Slack, N., Chambers, S., Harland, C, Harrsion, A., and Jonston, R., 1995. Operations
Management, Pitman Publishing, London
Sony, B., 1975. Taxes on direct investment in the E.E.C.: A legal and economic analysis,
New York
South China Morning Post, 2009, Access from www. SCMP.com on 1/12/2009
State Statistical Bureau of the People's Republic of China, 2002. China Foreign
Economic Statistical Yearbook, Beijing: State Statistical Bureau
Statistics Bureau of Guangdong Province, 2009. Added value of major industries.
Access from http://21O.76.64.38/tjsj/gylzyhygyzjz/t20091214 71621.htm on
3113/2010
Stank, T.P., Keller, S.B., & Daughery, PJ., 2001. Supply chain collaboration and
logistical service performance. Journal of Business Logistics, Vo1.22, No.1, 29-48.
Sudman, S. and Bradburn, N.M., 1983. Asking Questions: A Practical Guild to
Questionnaire design, Jossey-Bass Inc. San Francisco, CA
Sung, Y., 1998. Hong Kong and south China: The economic synergy, Kowloon: City
University of Hong Kong
219
Tam, H., 2004. Getting a foot in the door. Electronic Business, Vo1.30, No.12, pg.16
Tait, A., N., and Li, K.,W., 1997. Trade regimes and China's accession to the world
trade organization. Journal of World Trade, Vol.31, No.3, pg.93
Tong, J., 2008. RMB appreciation pushing PRO's industry shifting. Industrial and
Science Tribune, Vo1.7, No.4, pg.65
The Business Times, 16 Oct. 1997
The Republic of China Year book 2009, Access from http://www.gio.gov.tw on
31/3/2010.
Tsai, M.C., Wen, C.H., and Chen, C.S., 2007. Demand choices of high-tech industry for
logistics service providers: An empirical case of an offshore science park in Taiwan.
Industrial Marketing Management, Vo1.36. pp.617-626
Tung, S., and Cho, S., 2000. The impact of tax incentives on foreign direct investment
in China. Journal of International Accounting, Auditing & Taxation, VoL9, No.2,
pg.105
Tung, S., and Cho, S., 2001. Determinants of regional investment decisions in China:
An econometric model of tax incentive policy. Review of Quantitative Finance and
Accounting, VoLl7, No.2, pp. 167-185
UN Conference on Trade and Development, 1999. World investment report. Access
from http://www.unctad.orgon 31/12/2009
UN Conference on Trade and Development, 2006. World investment report. Access
from http://www.unctad.orgon 31/12/2009
UN Conference on Trade and Development, 2008. World investment report. Access
from http://www.unctad.orgon 31/12/2009
United Nations Conference on Trade and Development, 2007. Review of Maritime
Transport 2007 UNCTAD/RMT/2007. United Nations, New York.
220

Ujjainwala, K., 2008. India: logistics and supply chain market dynamics. Supply chain
Asia.
Usher, A.D., 1997. Dams as aid: A political anatomy of Nordic development thinking,
Routledge,London
Vaidyanathan, G., and Devaraj, S., 2008. The role of quality in e-procurement
performance: An empirical analysis. Journal of Operations Management, Vo1.26,
No.3, pp.407-425
Venkatraman, N., 1997. Beyond Outsourcing: Managing IT Resources as a Value
Center. Sloan Management Review, Vol. 38, No.3, pp. 51--64.
Walters, D., 2007. Global Logistics - New Direction in Supply Chain Managemen~
Kogan Page, London
Wang, Y., 2006. China in the WTO: A Chinese view. China Business Review, VoL33,
No.5, pp.42-48
Wang, Z.Q., and Swain, N., 1997. Determinants of inflow of foreign direct investment
in Hungary and China: Time-series approach. Journal of International
Development, Vo1.9, No.5, pp.695-726
Wang. Y., 2008. Emotional bonds with supervisor and co-workers: Relationship to
organizational C0111111 it111ent in China's foreign-invested companies. International
Journal of Human Resource Management, Vo1.19, No.5, pp.916-931
Welch, l.A., and Ranganath Nayak, P., 1992. Strategic outsourcing: A progressive
approach to the make-or-buy decision. Executive, Vo1.6, No., 1, pp.23-31
Wernerfelt, B., 1984. A resource-based view of the firm. Strategic Management Journal,
Vol.5, pp.171-180.
Willcocks, L. and Fitzgerald, G., 1994. A Business Guide to Outsourcing Information
Technology, London: Business Intelligence.
221

Williamson, O.E., 1975. Markets and Hierarchies: Analysis and Antitrust Implications,
The Free Press, New York
Workers. 2008. China Institute of Industrial Relations.
Wu, F., Sengun, Y., Kim, D., and Cavusgil, S.T., 2006. The impact of information
technology on supply chain capabilities and firm performance: A resource-based
view. Industrial Marketing Management, Vo1.35, NoA, ppA93-504
Wu, L., Wang, Y., Lin, B., Li, c., and Chen, S., 2007. Local tax rebates, corporate tax
burdens, and firm migration: Evidence from China. lournal of Accounting and
Public Policy, Vo1.26, pp.555-583
Wu YJ. and Lin, c., 2008. National port competitiveness: implications for India.
ManagementDecision, Vo1.46 No. 10, pp.1482-2008.
Xu, Y., 2009. The development of Shanghai port logistics industry, China Port, 9:26-29
Xu, M. and Zhang, T., 2007. Material flows and economic growth in developing China.
Journal of Industrial Ecology, VoLl1, No.1, pg.121
Yao, D. 2009. A study of Shanghai international logistics industry, Market
Modernization, 572:225-228
Yang c.c., Marlow, P.B., and Lu. C.S., 2009. Assessing resources, logistics service
capabilities, innovation capabilities and the performance of container shipping
services in Taiwan. International lournal of Production Economics, Vol. 122,
ppA-20
Yeh, A.G, Lee, Y.F., Lee, T., and Sze, N.D., 2002. Building a competitive Pearl River
Delta region: Cooperation, coordination, and planning, Hong Kong University
Press, Hong Kong
Yeung, J.H.Y, Zhang, M., Cheung, W., Fung, M, K. and Zhao, X., 2009. The air freight
and express industry in Hong Kong: Economic contribution and competitiveness,
International lournal of Shipping and Transport Logistics, Forthcoming
222

Yiu, D.W., and Lau, C.,M., 2008, Corporate entrepreneurship as resource capital
configuration in emerging market firms, Enterprise Theory and Practice,
Jan.2008:37-57
Yu, D. ' 1996. A study on foreign direct investment in China. Management World, Vol.
Vol. 8No.6, pg.88
Yu, X., 2007. Study on the over planning of Heilongjiang longyun logistics information
system. Logistics Sci-Tech, Vol.7, pp.64-68
Yu, c., 2008. Opening-up or institutional development? Evidence from China.
International Economic Journal, VoL22, No.4, pp.419-430
Zhang, J., 2006. Technological innovation of Chinese firms: Indigenous R&D, foreign
direct investments, and markets. Ph.D. Dissertation, Georgia Institute of
Technology
Zhang, Y., 2007. Choice of entry modes in sequential FDI in an emerging economy.
ManagementDecision, Vol. 45 No.4 pp. 749-72
Zhang, L., 1994. Location-specific advantage and manufacturing direct foreign
investment in South China. World Development, Vo1.22, No.1, pg.45
Zhang, X. Li, Q., and Lin, Z., 2005. E-commerce Education in China: Driving forces,
Status, and Strategies. Journal of Electronic commerce in Organizations, Vol.3,
No.3, ppl-18
Zhang, Y., Zhang, Z., and Liu, Z., 2007. Choice of entry modes in sequential FDI in
an emerging economy. Management Decision, Vol. 45, No.4, pp. 749-772
Zhao, X., Flynn, B.B., and Roth, A.v., 2006). Decision Sciences Research in China: A
critical review and research agenda-Foundations and overview. Decision Sciences,
Vol.37, No.4, pg.451
223

Zhao, X., Flynn, B.B., and Roth, A.V., 2007. Decision Sciences Research in China:
Current status, opportunities, and propositions for research in supply chain
management, logistics, and quality management. Decision Sciences, VoL38, No.1,
pg.39
Zuo, D., 2009. An analysis of Shanghai logistics industry, Coastal Enterprises and
Science & Technology, 105:119-121
224
Appendix I Semi-structured interview protocol
Following questions were posed to government officials in Hong Kong, logistics service
providers, logistics service users and academia:
Any chance for Hong Kong logistics industry to participate the fast growing domestic
logistics markets in Mainland China?
- Will Hong Kong logistics industry be marginalized in the fast-growing Mainland China
consumer market, they key driver for growth in the decade ahead?
What advantages do Hong Kong's Freeport status otfer to Hong Kong logistics industry?
In view of Hong Kong's free port status, is there an opportunity for Hong Kong logistics
industry to strengthen its role as a regional distribution centre?
- To what extent the third runway in Hong Kong will strengthen Hong Kong airport as the
top cargo airport in the world in the current and next decade?
- To what extent improved air connectivity between Hong Kong and China will strengthen
Hong Kong's top cargo airport positions?
To what extent will the Hong Kong-Zuhai -Macau Bridge bring new opportunity to Hog
Kong logistics industry?
Since many experienced Hong Kong logistics practitioners have been drawn into the
225

Mainland market, is that an opportunity other than a threat to Hong Kong logistics
practitioners and Hong Kong logistics industry?
- Should Hong Kong logistics industry aggressively branch out into PRD and the coastal
cities in China?
How can Hong Kong's logistics industry integrate with the PRD logistics industry with a
faster pace?
- Is the freight forwarding sector better placed than contract logistics sector in the integration
process between Hong Kong and the PRD logistics industry?
226

Appendix II Questionnaires sent to Manufacturers
Challenges and Opportunities of Hong Kong Logistics Industry
I. Background
Hong Kong logistics industry, particularly in the freight forwarding sector, has faced
increasing challenges and lost its top position on the container traffic. On the air cargo
front, although Hong Kong freight forwarding sector is still leading the world as top air
cargo centre, Hong Kong Government and private sectors are wondering the long term
substantiality of Hong Kong as the top air cargo centre in the world.
II. Survey Objectives
This exercise is part of the process to find out whether Hong Kong freight forwarding
sector has satisfied and played an indispensable role in the supply chain for the
manufacturers and other logistics services users in the Pearl River Delta.
Section A - Company profile
AI. yourcompanyname ____________________________________ __
Name of your department ________________________________ _
Your name ----------------------------------------------Your position in the company ______________________________ __
Email address __________________________________________ __
Telephone! Fax ______ -'-_____________ __
How long your company has been in business ____________________ _
227

A2. Number of employee of your company
] Less than 50 [] 51- 100 [] 101- 200 ] 201- 300
] 301 - 500 [] 501- 1000 [ ] 1001- 2000 ] 2001- 5000
] over 5000
A3. Types of manufacturing (please tick one box)
] Food & beverage ] Electronics & communication equipments
] Textile & apparel ] Electrical equipments
] Transportation equip ] Machinery
] Chemical & petrochemical [ ] Plastics
] Rubber & plastics ] Watches & clocks
] Precision instruments
] Metal
] Publishing & printing
] Toys
] Pharmacy
] Wood & furniture
] Jewellery
] Others ______ _
A4. Ownership structure of the company (please tick one box)
] State owned
] 100% owned by Hong Kong interest
] 100% owned by foreign interest
] Joint venture between Hong Kong interests and other interests
AS. Annual sales turnover in HK$ million in 2007 (please tick one box)
] Less than 5 [] 5.1-10 ] 10.1-15 [] 15.1- 25 [ ] 25.1- 30
] 30.1- 50 [] 50.1- 100 ] 100.1- 250 [ ] 250.1- 500
] 500.1 - 1000 ] Over 1000
228

Section B - Your logistics services provider
The following statements describe your forwarding services provider(s). Please indicate
whether you agree or disagree with each statement.
Please note that Strongly Agree = 1 and Strongly Disagree = 7
1. Our services provider offers the lowest total logistics costs 1 2 3 4 5 6 7
2. Our services provider is user friendly 1 2 3 4 5 6 7
3. Our services provider is flexible to meet our changing 1 2 3 4 5 6 7
needs
4. Our services provider offers a wide range of services 1 2 3 4 5 6 7
5. Our services provider offers high value added services 1 2 3 4 5 6 7
6. Our services provider offers reliable services 1 2 3 4 5 6 7
7. Our services provider offers a high level of responsiveness 1 2 3 4 5 6 7
to our needs
8. Our services provider offers fast pick up and delivery 1 2 3 4 5 6 7
9. We are satisfied with the service quality of our services 1 2 3 4 5 6 7
provider
10. We are satisfied with the rates offered by our services 1 2 3 4 5 6 7
provider
11. Overall, we are satisfied with our services provider 1 2 3 4 5 6 7
12. Our services provider is a Hong Kong based logistics 1 2 3 4 5 6 7
service provider
13. Our service provider is a Mainland China based logistics 1 2 3 4 5 6 7
Service provider
14. The existing service provider is our choice 1 2 3 4 5 6 7
15. We use the existing service provider(s) to comply the 1 2 3 4 5 6 7
requirements of our customers
16. We have minimized our logistics costs by usmg our 1 2 3 4 5 6 7
existing service provider
17. We have been able to refocus on our core business by 1 2 3 4 5 6 7
using our existing service provider
229

Section C - Your supply chain management practices and logistics operations
Cl. Please indicate to what extent you agree or disagree with each of the following
statements about your plant and organization.
Strong! y Agree = 1 and Strong! y Disagree = 7
l. We seek short lead time in designing our supply chains 1 2 3 4 5 6 7
2. We purchase in small lots to reduce supplier lead time 1 2 3 4 5 6 7
3. Our company strives to shorten supplier lead time to 1 2 3 4 5 6 7
avoid inventory and stock outs
4. Our suppliers deliver to us on a just-in-time basis 1 2 3 4 5 6 7
5. We receive daily shipments from most suppliers 1 2 3 4 5 6 7
6. We can depend upon on-time delivery from our 1 2 3 4 5 6 7
suppliers
7. Our suppliers are linked with us by a pull system 1 2 3 4 5 6 7
8. Our customers receive just-in-time deliveries from us 1 2 3 4 5 6 7
9. We can adapt our production schedule to meet sudden 1 2 3 4 5 6 7
changes of demand from our customers
10. Our customers have a pull type link with us 1 2 3 4 5 6 7
1l. We postpone the purchase of components that 1 2 3 4 5 6 7
differentiates final product configurations until the latest
possible moment
12. We rely on flexible suppliers for components that 1 2 3 4 5 6 7
differentiates final product configurations
13. We use lIT production and Kanban system 1 2 3 4 5 6 7
14. We work with suppliers to improve inter-organizational 1 2 3 4 5 6 7
processes
15. We work with customers to improve inter-organizational 1 2 3 4 5 6 7
processes
16. We try to reduce response time throughout the supply 1 2 3 4 5 6 7
chain processes
230

C2. Please indicate whether you agree or disagree with the following statements
concerning integration or information sharing between your organization and your
major logistics service providers.
Strongl y Agree = 1 and Strongly Disagree = 7
1. There is a high level of information exchange with our 1 2 3 4 5 6 7
service providers
2. We access to our service providers' system to tract our 1 2 3 4 5 6 7
shipments
3. Our service providers share its shipment schedule and 1 2 3 4 5 6 7
capacity with us
4. We share our service demand forecast with our service 1 2 3 4 5 6 7
providers
5. Our major service providers help us to improve processes 1 2 3 4 5 6 7
6. We hold meetings with our service providers on a regular 1 2 3 4 5 6 7
basis to solve problems
7. We and our service providers informally work as a team 1 2 3 4 5 6 7
together
8. We conduct joint planning to anticipate and resolve 1 2 3 4 5 6 7
operational issues
9. We develop a mutual understanding of responsibilities 1 2 3 4 5 6 7
with our service providers
10. We make joint decisions with our service providers about 1 2 3 4 5 6 7
ways to improve overall logistics cost efficiency
11. We and our service providers achieve goals on logistics 1 2 3 4 5 6 7
collectively
12. Our service providers work with us to design the 1 2 3 4 5 6 7
customized billing
231

Section D - The role of Mainland China Government
Dl. Please indicate whether you agree or disagree with the following statements.
Strongl y Agree = 1 and Strongly Disagree = 7
l. Relevant laws (such as contract laws and intellectual 1 2 3 4 5 6 7
proper laws dealing with disputes need improvement
2. The costs (fee and time) of settling disputes among 1 2 3 4 5 6 7
companies through legal action is high
3. It is difficult to take legal actions to get a fair judgment 1 2 3 4 5 6 7
4. The judicial system is difficult to be executed smoothly 1 2 3 4 5 6 7
5. Overall, litigation is an effective means to settle disputes 1 2 3 4 5 6 7
among compames
6. Legal services in China such as arbitration system and 1 2 3 4 5 6 7
law firms need to be improved
D2. Please indicate whether you agree or disagree with the following statements
concerning the customs used by your company most frequently in Hong Kong and
Mainland China.
Strongl y Agree = 1 and Strongly Disagree = 7
l. Overall, we are satisfied with the current servIces 1 2 3 4 5 6 7
provided by Hong Kong customs
2. Overall, we are satisfied with the current systems and 1 2 3 4 5 6 7
procedures provided by Hong Kong customs
3. Overall, we are satisfied with the current services 1 2 3 4 5 6 7
provided by Mainland China customs
4. Overall, we are satisfied with the current systems and 1 2 3 4 5 6 7
procedures provided by Mainland China customs
We appreciate your patience and assistance in responding to the above questionnaires. A
copy of the findings will be shared with you when the survey is completed.
232

Appendix III Questionnaire sent to Logistics Service Providers
Challenges and Opportunities of Hog Kong Logistics Industry
I. Background
Hong Kong logistics industry, particularly in the freight forwarding sector, has faced
increasing challenges and lost its top position on the container traffic. On the air cargo
front, although Hong Kong freight forwarding sector is still1eading the world as top air
cargo centre, Hong Kong Government and private sectors are wondering the long term
substantiality of Hong Kong as the top air cargo centre in the world and whether Hong
Kong freight forwarders will lose their market share gradually.
n. Survey Objectives
This exercise is part of the process to identify challenges faced by and opportunities
available to Hong Kong logistics industry particularly in freight forwarding sector. The
findings of this survey will be shared with other logistics players in Hong Kong.
Section A - Company Profile
A 1. Your Company's Name: __________________ _
Name of your department: _________________ _
You"re Name: -------------------------
Your position in the company: ________________ _
Email address: _______________________ _
Telephone Fax: _______________________ _
233

A2. Your Service Portfolios (please tick)
Freight forwarding
Third party logistics
Four party logistics
Warehousing
Trucking services
Other
How long has your company been in business:
[ ]
[ ]
[ ]
[ ]
---
A3. Ownership structure of the company (please tick one box)
Years
100% owned by Hong Kong interests [ ]
100% owned by foreign interests [ ]
J oint venture between Hong Kong interests and foreign interests [ ]
A4. Annual sales in HK$ million in 2007 (please tick one box):
] Less than 5 [] 5.1 - 10 [ ] 10.1-15 [] 15.1-25
] 25.1- 30 [ ] 30.1- 50 [ ] 50.1- 100 [ ] 100.1- 200
] 200.1- 500 [] 500.1 - 1,000 [ ] More than 1,000
234

AS. Locations of operations (please tick one box):
We have operations in
Hong Kong
Hong Kong & the PRD
Hong Kong, the PRD and other parts of China
Hong Kong, mainland China and other parts of Asia
Hong Kong, rest of Asia, Europe & Americas
A6. Locations of your customers (please tick one box)
[ ]
[ ]
[ ]
Located in Hong Kong only [ ]
Located in Hong Kong & the PRD only [ ]
Located in Hong Kong, the PRD and other parts of China ]
Located in Hong Kong, China and other parts of Asia [ ]
Located outside Hong Kong and China as we rely
on our international sales network to get FOB traffic originating from
Hong Kong and China
235

Section B - Impact of Government Policies and Regulations on your Operations
To what extent do you agree or disagree that the following policies and regulations are
helping your industry? Please put a circle around ONE of the numbers in the scale of
1 to 7:
Please note that Strongly Agree = 1 and Strongly Disagree = 7
If you circle 4 this means you do not agree or disagree with the statement
1. Upgrading the industries in the PRD 1 2 3 4 5 6 7
2. Relocating the assemble industry to the East/west/north 1 2 3 4 5 6 7
of the PRD
3. Appreciation of RMB 1 2 3 4 5 6 7
4. Clean environment 1 2 3 4 5 6 7
5. The taxes in the PRD are too high that affect your 1 2 3 4 5 6 7
bottom-line
6. The new labour laws introduced III January 2008 1 2 3 4 5 6 7
increase your operating costs substantially
7. State enterprises in China observe the tax regulations and 1 2 3 4 5 6 7
new labour laws
8. You always observe the tax regulations and new labour 1 2 3 4 5 6 7
laws
236

Section C - Operating Costs
To what extent do you agree or disagree that the following statements? Please put a
circle around ONE of the numbers in the scale of 1 to 7:
Please note that Strongly Agree = 1 and Strongly Disagree = 7
If you circle 4 this means you do not agree or disagree with the statement
1. The strong RMB has reduced your gross profit margin 1 2 3 4 5 6 7
2. It is difficult to recruit staff in Hong Kong 1 2 3 4 5 6 7
3. It is difficult to recruit staff in China 1 2 3 4 5 6 7
4. You need to increase the salaries of your staff in Hong 1 2 3 4 5 6 7
Kong and China substantially in the last few years to keep
your staff
5. You can absorb the extra costs relating to the new labour 1 2 3 4 5 6 7
laws
6. You need to transfer the managerial staff from Hong 1 2 3 4 5 6 7
Kong to support your operations in China
7. It is difficult to find managerial staff in Hong Kong who 1 2 3 4 5 6 7
are prepared to move to China
237

Section D - Competition
To what extent do you agree or disagree with the following statements? Please put a
circle around ONE of the numbers in the scale of 1 to 7:
Please note that Strongly Agree = 1 and Strongly Disagree= 7
If you circle 4 this means you do not agree or disagree with the statement
1. Appreciation of RMB has reduced the volumes of 1 2 3 4 5 6 7
business from your existing customers
2. As a result of appreciation of RMB, you have lost 1 2 3 4 5 6 7
market shares
3. As a result of appreciation of RMB, your customers 1 2 3 4 5 6 7
have put pressure on you to reduce your rates
4. As a local company, you are unable to compete with 1 2 3 4 5 6 7
global companies in terms of services
5. As a local company, you are unable to compete with 1 2 3 4 5 6 7
global companies in terms of rates
6. Despite of very competitive environment, your business 1 2 3 4 5 6 7
has continued to grow
238

Section E - Impact of the Industry Shifting
The following statements are descriptions of impact on your customers because of
industry shifting. To what extent do you agree or disagree with the following
statements?
Please put a circle around ONE of the numbers in the scale of 1 to 7:
Pease note that Strongly Agree = 1 and Strongly Disagree = 7
If you circle 4 this means you do not agree or disagree with the statement
1. If our customers branch out to the areas adjacent to the 1 2 3 4 5 6 7
PRD you will also branch out your operations there to service
your customers
2. If our customers branch out to the YRD and Buhai area, 1 2 3 4 5 6 7
we you will also branch out there to serve them
3. If our customers branch out to other parts of Asia, we 1 2 3 4 5 6 7
will also branch out there to serve them
4. Despite of industry shifting, our business continues to 1 2 3 4 5 6 7
grow
5. Because of industry shifting, our business has been 1 2 3 4 5 6 7
stagnant! decreased
6. Competition from local Chinese forwarders is 1 2 3 4 5 6 7
increasingly noticeable
7. Despite of difficult operating environment as a result of 1 2 3 4 5 6 7
industry shifting, we will continue to stay in the business
8. Because of difficult operating environment, we are 1 2 3 4 5 6 7
considering to merge our business with other forwarders
239

Section F - What policies and actions should be taken by Hong Kong government to
enhance competitiveness of Hong Kong forwarding industry (please tick)?
1. 24-hour cross-border customs clearance policy [ ]
2. Lower land cost for logistics industry
3. Improved air cargo facilities at Hong Kong Airport
4. Accelerated open sky policy
5. Improved ocean freight facilities at Hong Kong port
6. More subsidised training programme for logistics industry
7. Others ------
Section G 1 - What are the main reasons for your customers to export goods from
Southern China to overseas via Hong Kong by air (please tick)?
1. Efficient and predictable customs clearance in Hong Kong;
2. More direct flights from Hong Kong to final destinations;
3. Predictable transit handling in Hong Kong;
4. More reliable forwarding services;
5. Tax or duty advantages;
6. Better flight connections;
7. Lower total transportation costs;
8. Customers' requests (eg. FOB HK)
9. Quality control in Hong Kong;
10. Consolidation of shipments in Hong Kong;
11. Others (please specify) ____ _
[ ]
[ ]
[ ]
[ ]
[ ]
Are the above factors sustainable in the coming 1-5 years in view of better logistics
infrastructural development in S. China (please tick)?
Yes [ No [
240
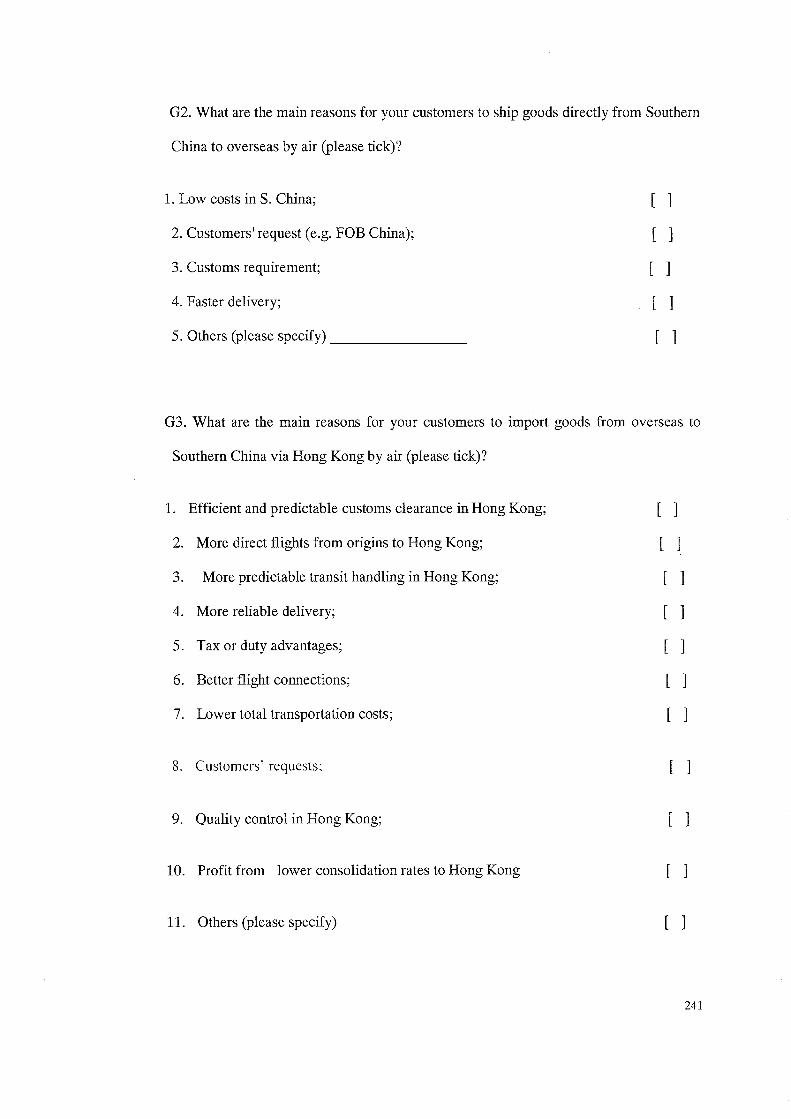
G2. What are the main reasons for your customers to ship goods directly from Southern
China to overseas by air (please tick)?
1. Low costs in S. China;
2. Customers' request (e.g. FOB China);
3. Customs requirement;
4. Faster delivery;
5. Others (please specify) _______ _
[ ]
[ ]
[ ]
[ ]
[ ]
G3. What are the main reasons for your customers to import goods from overseas to
Southern China via Hong Kong by air (please tick)?
1. Efficient and predictable customs clearance in Hong Kong;
2. More direct flights from origins to Hong Kong;
3. More predictable transit handling in Hong Kong;
4. More reliable delivery;
5. Tax or duty advantages;
6. Better flight connections;
7. Lower total transportation costs;
8. Customers' requests:
9. Quality control in Hong Kong;
10. Profit from lower consolidation rates to Hong Kong
11. Others (please specify)
[ ]
[ ]
[ ]
[ ]
[ ]
[ ]
[ ]
[ ]
[ ]
[ ]
[ ]
241

G4. What are the main reasons for your company to import goods from Oversea to Southern
China directly by air (please tick)?
1 Low costs in S. China; [ ]
2 Customers' requests; [ ]
3 Customs requirement; [ ]
4 Faster delivery; [ ]
5 Others(please specify) [ ]
Section H Future Direction
Please put a circle around ONE of the numbers in the scale 1 to 7:
Please note that Strongly Agree = 1 and Strongly Disagree = 7
If you circle 4 this means you do not agree or disagree with the statement
In view of the changing operating environment:
1. Your business will continue to grow 1 2 3 4 5 6 7
2. You will expand your operations in other parts of China 1 2 3 4 5 6 7
3. You will expand your operations in other parts of China 1 2 3 4 5 6 7
and Asia
4. You will close down your operations in Hong Kong and 1 2 3 4 5 6 7
the PRD and relocate to Vietnam and other parts of S East
Asia
5. You will merge your business with other logistics service 1 2 3 4 5 6 7
providers
We appreciate your patience and assistance in responding to the above questionnaires.
A copy of the findings will be shared with you when the survey is completed.
242