The Metropolitan Atlanta Congenital Defects Program: 35 years of birth defects surveillance at the...
124
1 Metropolitan Atlanta Congenital Defects Program 40 th Anniversary Edition Surveillance Report Reporting Birth Defects Surveillance Data 1968–2003 Adolfo Correa Janet D. Cragan James E. Kucik Clinton J. Alverson Suzanne M. Gilboa Renu Balakrishnan Matthew J. Strickland C. Wes Duke Leslie A. O’Leary Tiffany Riehle-Colarusso Csaba Siffel Don Gambrell Debra Thompson Michael Atkinson Jamuna Chitra The findings and conclusions in this report have not been formally disseminated by CDC and should not be construed to represent any agency determination or policy.
-
Upload
independent -
Category
Documents
-
view
3 -
download
0
Transcript of The Metropolitan Atlanta Congenital Defects Program: 35 years of birth defects surveillance at the...
1
Metropolitan Atlanta Congenital Defects Program
40th Anniversary Edition Surveillance Report
Reporting Birth Defects Surveillance Data
1968–2003
Adolfo Correa Janet D. Cragan James E. Kucik
Clinton J. Alverson Suzanne M. Gilboa Renu Balakrishnan
Matthew J. Strickland C. Wes Duke
Leslie A. O’Leary Tiffany Riehle-Colarusso
Csaba Siffel Don Gambrell
Debra Thompson Michael Atkinson
Jamuna Chitra
The findings and conclusions in this report have not been formally disseminated by CDC and should not be construed to represent any agency determination or policy.

2
CONTENTS Welcoming letter…………………………………………………………………………………………………..2 Executive Summary.................................................................................................................................................4 Introduction..............................................................................................................................................................4 Methods ...................................................................................................................................................................7 Defect definitions and classifications ....................................................................Error! Bookmark not defined. Estimation of defect prevalence.............................................................................................................................21 Issues related to specific variables included in this report.....................................................................................21 Geocoding of numerator and denominator data.....................................................................................................24 Monitoring techniques ...........................................................................................................................................24 Considerations for the interpretation and use of the data.......................................................................................27 Appendix A. Data tables and graphs ........................................................................................................................ Table 1: Denominator live births and fetal deaths by year…………………………… Table 2: Denominator live births stratified by descriptive characteristics…………….. Table 3: Annual prevalence of selected birth defects………………………….………. Table 4: Three-year prevalence of selected birth defects………..…………….……… Table 5: Total prevalence of selected birth defects…………………………….…… Tables 6-52: Defect prevalence stratified by descriptive characteristics……………… Figures 1-46: Graphs of three-year prevalences of selected defects Appendix B. Conditions not considered to be major congenital defects in this report............................................. Appendix C. Code list for diagnostic indices .....................................................................................................118 Appendix D. CUSUM statistical details ................................................................................................................... Acknowledgements ……………………………………………………………………………………………..120 References.............................................................................................................. Error! Bookmark not defined.

3
Welcoming Letter
It is with great pride that we introduce the 40th anniversary surveillance report of the Metropolitan Atlanta Congenital Defects Program (MACDP). Following the experi-ence with the teratogenic drug thalidomide, population-based birth defects surveillance arose in an effort to provide an early warning system for changes in defect prevalence that suggest environmental influences. MACDP was created in 1967 as a collaboration of the Centers for Disease Control and Prevention (CDC), Emory University, and the Geor-gia Mental Health Institute for just this purpose. Over the years, the role of MACDP has evolved to encompass serving as a data source for epidemiologic and etiologic studies such as the National Birth Defects Prevention Study, monitoring prevention efforts such as immunization against rubella infection and mandatory fortification of enriched grains with folic acid, and providing data for health policy decisions.
Despite these changes, the overall objective of MACDP to identify trends or un-usual patterns of birth defects has remained constant. The methods developed for this 5-county program in the late 1960s have served as a model for birth defects surveillance programs across the country and internationally. Such surveillance work is a tribute to the early MACDP efforts in Atlanta and to the ongoing need for sound current birth defect prevalence information.
Utilizing 36 years of MACDP surveillance data, this report describes the preva-lence of birth defects in metropolitan Atlanta and provides a unique and detailed account of ongoing MACDP activities. This information, we believe, will be of great value in sus-taining surveillance programs elsewhere and promoting the epidemiologic and genetic re-search arising from them.
We hope you will join us in congratulating MACDP on its accomplishments as we continue to work together to ensure the health of babies everywhere.
Larry D. Edmonds J. David Erickson Clark W. Heath, Jr. Godfrey P. Oakley, Jr.

4
EXECUTIVE SUMMARY About one out of every 33 babies is born with a
major birth defect in the United States each year (Mar-tin and Edmonds, 1991; Lary and Paulozzi, 2001). Birth defects are a major contributing factor to infant mortality and a major cause of childhood and adult disability (Hall et al., 1978; CDC, 1998; Petrini et al., 2002). They account for approximately 12% of admis-sions to pediatric hospitals each year (Yoon et al, 1997a). Birth defects can result from chromosomal abnormalities, in utero infections, and teratogenic ex-posures, among other causes. However, the causes of most birth defects are unknown. While birth defects as a whole are fairly common, individual defects can be quite rare and, therefore, difficult to study. For these reasons, surveillance programs play a key role in un-derstanding birth defects by collecting information about their occurrence in populations and monitoring for changes that suggest causes or associated risk fac-tors. Such programs can form the foundation for more focused epidemiologic and genetic research by gener-ating hypotheses and providing case registries for these studies. They also provide data to quantify the morbid-ity and mortality associated with birth defects, to evaluate the success of prevention efforts, and for use in education and health policy decisions.
The Metropolitan Atlanta Congenital Defects Pro-gram (MACDP) is a population-based surveillance system for birth defects that was established in 1967 by the Centers for Disease Control and Prevention (CDC), Emory University, and the Georgia Mental Health In-stitute. Since that time, the program has conducted on-going surveillance for birth defects among infants, fe-tuses, and children born to residents of the five central counties of metropolitan Atlanta through the use of active case-finding methods and multisource ascer-tainment.
This 40th anniversary surveillance report of the Metropolitan Atlanta Congenital Defects Program (MACDP) presents data on the prevalence and descrip-tive characteristics of birth defects, including 67 indi-vidual defects, in metropolitan Atlanta, Georgia, from 1968–2003. This report provides details about the mis-sion and objectives of MACDP, the public health util-ity of the program, its population basis, data sources and case ascertainment methods, case processing and review, methods for monitoring trends and for geocod-ing and spatial analysis, and the strengths and limita-tions of the surveillance data. The individual defects included in the report are defined, and a new approach to classification of congenital heart defects is reviewed. Data on the prevalence of 67 individual defects throughout the surveillance period are presented in
tabular and graphic form, and the descriptive character-istics of each are provided relative to maternal age, race and ethnicity, birthweight, gestational age, sex, parity, gravidity, plurality, birth outcome, age at diag-nosis, and socioeconomic status. Altogether, MACDP data provide a picture of birth defects in the Atlanta population for almost four decades.
Prevalence of birth defects in Atlanta
The total prevalence of defects monitored by MACDP among infants, fetuses, and children born from 1968–2003 to residents of the five central coun-ties of metropolitan Atlanta was 2.67%. The preva-lence was somewhat lower in the early years of sur-veillance, presumably because of incomplete ascer-tainment as the program was being developed and re-fined. However, since about 1973, the total defect prevalence has remained stable with only year-to-year variation. The prevalence of most of the individual de-fects presented also has remained stable throughout this time. However, the prevalence of some individual de-fects has changed over time. Perhaps foremost, the prevalence of anencephaly and spina bifida has de-clined throughout the years of MACDP surveillance. Factors that could have influenced this decline include the development of prenatal diagnosis and elective termination before 20 weeks gestation, and fortifica-tion of the U.S. grain supply with folic acid in 1998. However, these factors do not explain the observed decline in these defects in earlier decades. The preva-lence of clubfoot not associated with spina bifida and of cleft lip with or without cleft palate also have de-clined over the period of surveillance, although the reasons for these changes remain unclear.
In contrast, the prevalence of some individual de-fects has increased. This is perhaps most apparent for certain congenital heart defects, such as ventricular septal defect, atrial septal defect, and valvar pulmonic stenosis. The ability to diagnose heart defects through bedside echocardiography in the newborn improved dramatically during the period of MACDP surveil-lance. Presumably, this has resulted in an increase in the diagnosis of asymptomatic cardiac lesions prior to discharge from the newborn nursery, and a correspond-ing increase in MACDP’s ascertainment of these le-sions. Whether this change in the use of diagnostic technology fully explains the observed increase in these defects is not entirely clear.
The prevalence of Down syndrome and other auto-somal trisomies has also increased over time, pre-sumably because of changes in the underlying popula-tion of childbearing women (Appendix A, Tables 1 and 2). Because these conditions occur more frequently

5
among the offspring of mothers 35 years of age or older, their prevalence increased as the average age of childbearing women in metropolitan Atlanta increased over the period of surveillance.
The prevalence of some defects in MACDP also appears to occur in clusters, most notably congenital cataract, polydactyly, and gastroschisis. This could have occurred for a number of reasons. It is likely there was a true increase in the prevalence of congenital cataract in the late 1970s and early 1980s in Atlanta, but eradication of congenital rubella infection in the United States might explain why subsequent similar clusters have not been observed. In contrast, apparent clusters of defects can occur as an artifact of changes in ascertainment, classification, or other methods. This was probably the case for an increase in polydactyly observed in the early 1980s mostly among Black and African American infants. While it is not possible to verify the cause, it is likely that these lesions were mostly postaxial skin tags for which a full description of the defect was not obtained. Once more specific clinical information about this defect was regularly abstracted, the increase resolved and has not recurred. Some clusters, however, such as those seen for gastro-schisis in 1988 and again in 2000, cannot readily be explained by changes in known risk factors, surveil-lance methods, or other factors (Williams et al., 2005). They represent a challenge for public health surveil-lance to evaluate whether such increases are occurring randomly or represent true increases in defect preva-lence that warrant further investigation. Data from MACDP have enabled the conduct of descriptive epidemiologic studies of birth defects, evaluation of potential teratogens, examination of pos-sible etiologic factors, and monitoring of prevention efforts and the development of new diagnostic tech-nologies. New arenas for the use of MACDP data cur-rently being developed include assessing the survival of children with birth defects at different ages, tracking the prevalence of birth defects in relation to changes in environmental pollutants, linking with data on devel-opmental outcomes of children with birth defects, and contributing cases to the National Birth Defects Pre-vention Study to study genetic and environmental risk factors and gene-environment interactions.
INTRODUCTION
Background
The Metropolitan Atlanta Congenital Defects Pro-gram is a population-based surveillance system of birth defects founded in 1967 by the Centers for Disease Control and Prevention (CDC), Emory University, and the Georgia Mental Health Institute. Establishment of
the program was stimulated by the occurrence of an epidemic of limb deficiency defects associated with prenatal use of the drug thalidomide in other countries, a desire to monitor for similar increases related to pre-ventable exposures in the future, and the recognition of an association between Down syndrome and childhood leukemia. The program monitors the prevalence of all major birth defects among the offspring of women who reside within the five central counties of metropolitan Atlanta at the time of delivery.
Mission and objectives The purpose of MACDP initially was to provide an
early warning of increases in the prevalence of birth defects by monitoring trends over time. Over the years, the scope of the program’s objectives has evolved as a result of improved understanding of the epidemiology of birth defects, appreciation of the benefits offered by birth defects surveillance, and increased availability of new data linkages and collaborations. The current ob-jectives of MACDP are: • To monitor, regularly and systematically, the births
of infants, fetuses, and children with major birth defects for changes in prevalence or other unusual patterns suggestive of environmental influences;
• To develop and maintain a case registry for use in epidemiologic and genetic studies;
• To quantify the morbidity and mortality associated with birth defects;
• To provide data for education and health policy decisions leading to prevention; and
• To provide a training ground for public health sci-entists in surveillance and epidemiologic methods
Public health utility of the program and data
Surveillance. Since its inception, MACDP has been dedicated to the systematic collection and analy-sis of population-based birth defects surveillance data on an ongoing basis. In particular, MACDP has (1) defined procedures for birth defect case ascertainment and validation; (2) worked towards the development of a standard coding format for use by birth defects pro-grams in other locations (Lynberg et al., 1993; Oakley, 1986); (3) developed tools and methodologies to sup-port birth defects surveillance programs (Correa-Villasenor et al., 2003; Watkins et al., 1996); (4) served as a prototype for active case ascertainment for birth defects surveillance programs across the United States and in other countries; and (5) served as a model for surveillance of other adverse reproductive out-comes, including developmental disabilities (e.g., the Metropolitan Atlanta Developmental Disabilities Sur-veillance Program [MADDSP]) (Yeargin-Allsopp et

6
al., 1992), fetal alcohol syndrome (Hymbaugh et al., 2002), and stillbirths. The ongoing analysis of MACDP data has docu-mented long-term trends in the prevalence of certain defects, such as declines in the prevalence of neural tube defects (NTDs) before the widespread use of pre-natal diagnosis and folic acid supplementation (Yen et al., 1992) and increases in the prevalence of some heart defects (Botto et al., 2001). Surveillance data from MACDP have been used to address important public health issues, such as the decline in congenital rubella syndrome associated with the decreased occurrence of maternal rubella infection (Cochi et al., 1989) and the impact of prenatal diagnosis and new diagnostic tech-niques on the birth prevalence of certain defects (Correa-Villasenor et al., 2003; Roberts et al., 1995). MACDP data also have been essential in assisting state health departments in their response to public concerns about apparent clusters of birth defects by providing estimates of baseline prevalence in comparison studies of birth defects in special populations, such as pregnant women taking specific medications (Safra and Oakley, 1975; 1976) and Gulf War veterans (Araneta et al., 1997). In addition to analyzing its own data, MACDP has played a key role in supporting and serving as a model for the development of birth defects surveillance pro-grams across the United States and in other countries. MACDP also has contributed data to collaborative pro-jects sponsored by organizations of birth defects sur-veillance programs. In 1974, MACDP scientists pro-vided technical support for the establishment of the International Clearinghouse of Birth Defects Monitor-ing Systems, an international consortium of birth de-fects programs today known as the International Clear-inghouse for Birth Defects Surveillance and Research (ICBDSR) (Botto et al., 2006; Correa-Villasenor et al., 2003). Since then, MACDP has contributed birth de-fects surveillance data to collaborative projects with this organization and has continued to provide techni-cal support on an ongoing basis. In 1999, MACDP sci-entists also supported the establishment of the National Birth Defects Prevention Network (NBDPN), an or-ganization of state birth defects surveillance programs within the United States. MACDP methods have con-tributed to the development of procedures, guidelines, and standards for surveillance of birth defects by the NBDPN (NBDPN, June 2004). MACDP continues to contribute data to the annual reports for NBDPN (NBDPN, 2006) and ICBDSR (ICBDSR, 2004.) Epidemiology. MACDP data have enabled the conduct of descriptive epidemiologic studies of birth defects, evaluation of potential teratogenic exposures, and examination of possible etiologic factors contribut-
ing to the occurrence of birth defects. MACDP served as the source of data on infants and fetuses born with major structural birth defects from 1968–1980 for the Atlanta Birth Defects Case-Control (ABDCC) Study, a large-scale study undertaken to examine whether Viet-nam veterans had an increased risk of fathering babies with serious birth defects. Atlanta was chosen as the site for that study because of the long-standing exis-tence of MACDP data on birth defects. Results from that study led to the conclusion that there was no strong evidence to support the position that Vietnam veterans had a greater risk than other men of fathering babies with serious birth defects (Erickson et al. 1984). Other analyses from this large database have increased the understanding of a variety of risk factors associated with birth defects, such as maternal rubella infection during pregnancy (Cochi et al., 1989); maternal diabe-tes (Becerra et al., 1990); maternal obesity (Watkins et al., 2001); febrile illness during pregnancy (Botto et al., 2002; Lynberg et al., 1994); the use of vitamin A (Khoury et al., 1996), maternal alcohol use (Moore et al., 1997); and maternal smoking (Honein et al., 2000). From 1993–1997, MACDP served as a source of case data for the Birth Defects Risk Factors Surveil-lance project, a case-control study of birth defects that served as a precursor to the National Birth Defects Prevention Study (NBDPS) which began in 1997 (Yoon et al. 2001). The NBDPS is an ongoing, multi-center case-control study of genetic and environmental risk factors for birth defects that currently has collected maternal interview data on more than 18,000 case in-fants and more than 6,700 control infants (Dr. Marga-ret Honein, CDC, personal communication, 2007). MACDP also serves as a source of case data for an ongoing collaborative study of the genetics of Down syndrome with the Emory University School of Medi-cine, Department of Human Genetics (Yang et al., 1999). More recently, MACDP data have been linked with the National Death Index, vital statistics from the Georgia Department of Human Resources, and data on developmental disabilities from the CDC’s Metropoli-tan Atlanta Developmental Disabilities Surveillance Program (MADDSP). These linkages have allowed population-based studies of the survival experience of children with spina bifida (Wong and Paulozzi, 2001), encephalocele (Siffel et al., 2003), and Down syn-drome (Rasmussen et al., 2006), and of developmental uotcomes with various birth defects (CDC, 1997; De-Coufle, et al., 2001). Prevention. As well as being a foundation for epi-demiologic research, MACDP findings have informed policy decisions and evaluated prevention efforts. Findings from the ABDCCS (Mulinare et al., 1988)
7
corroborated initial studies (Smithells et al., 1980; 1981; 1983) that demonstrated a reduced risk for NTDs in the offspring of mothers who used pericon-ceptional multivitamins. This body of evidence and subsequent studies (Bower and Stanley, 1989; Milun-sky et al., 1989) supported the implementation of ran-domized controlled trials of folic acid use (MRC, 1991; Czeizel, 1992) that showed that folic acid was the component of multivitamins that reduced the oc-currence of NTDs. These findings ultimately led to the 1992 U.S. Public Health Service recommendation for folic acid consumption in women of childbearing age to prevent these defects (CDC, 1992) and to mandatory food fortification with folic acid in 1998 (FDA, 1996). Subsequent data from the Beijing Medical University–CDC community intervention project in China that used surveillance methodology adapted from MACDP confirmed that a dose of 400 micrograms of folic acid daily was sufficient to significantly reduce the risk for NTDs (Berry et al., 1999). Additional analyses using these data sets indicated that the risks for other birth defects might be reduced as well with use of multivi-tamins or folic acid (Botto et al., 1996; Itikala et al., 2001; Yang et al., 1997). Efforts to evaluate the effectiveness of folic acid prevention activities in the United States rely on the ability to document a decrease in the birth prevalence of NTDs with folic acid use. Ongoing surveillance data from MACDP, pooled with that from the NBDPN, have made it possible to demonstrate a significant de-crease in the prevalence of NTDs in the years follow-ing fortification of the U.S. grain supply with folic acid (Williams et al. 2002; Correa-Villasenor et al., 2003). MACDP-based studies of other risk factors also have led to recommendations to reduce the risk of birth de-fects. For example, a study using MACDP data along with that from six other state programs documented a sixfold increase in the risk for transverse digital defi-ciency after chorionic villus sampling (Olney et al., 1995). This led to recommendations for counseling women about the potential risk of this prenatal diag-nostic procedure (CDC, 1995). Training. MACDP has served as the model for many state-based and international birth defects sur-veillance programs and as a resource for training ab-stractors and surveillance staff, and for the develop-ment of uniform surveillance methods and approaches. MACDP also has served as a training ground for a large number of professionals active in birth defects surveillance and epidemiology, including CDC Epi-demic Intelligence Service officers, visiting scientists, fellows, preventive medicine residents, and medical and public health students. This training serves to build capacity in birth defects surveillance and epide-
miology among professionals in state health depart-ments, federal agencies, universities, and other entities in the private sector, as well as internationally. Reporting data from 1968-2003. The year 2007 marks the 40th anniversary of MACDP. While the goals and objectives of the program have remained largely unchanged through four decades, surveillance methodology has evolved over time and continues to do so. This report describes the current practices and presents data collected from 1968–2003. Changes in ascertainment, coding, categorization, and such, have resulted in updated birth prevalence for individual birth defects that might differ from those in previously pub-lished data reports (CDC, 1993).
METHODS
Authority for birth defects monitoring in Georgia Metropolitan Atlanta Congenital Defects Program. When MACDP was established in 1967, its ability to collect information about infants and fetuses with birth defects was based on verbal agreements be-tween participating hospitals and laboratories, and CDC. However, birth defects have been reportable in the state of Georgia for many years (Chapter 12 of the Official Code of Georgia). In the late 1990s, the Geor-gia Department of Human Resources (DHR) activated this reporting requirement by granting MACDP the authority to conduct active surveillance of birth defects in the five central counties of metropolitan Atlanta in collaboration with and on behalf of the Georgia Divi-sion of Public Health, DHR. This authority is renewed annually and permits MACDP access to data from sources that include, but are not limited to, hospitals, clinics, private practitioners’ offices, diagnostic imag-ing facilities, and laboratories, as well as to informa-tion on birth and fetal death certificates. The data are protected by the Privacy Act of 1974 and by an Assur-ance of Confidentiality that is granted by the Director of the CDC. Approval was granted to MACDP by CDC’s Institutional Review Board in 1998. Georgia Birth Defects Reporting and Information System). Before 2002, the reporting requirement for birth defects in Georgia had been implemented only for the five central counties of metropolitan Atlanta through MACDP. However, in 2002, birth defects were added to the Georgia List of Notifiable Condi-tions (OCGA 31-12-2; OCGA 31-1-3.2; DHR Rules 290-5-5.02; DHR Rules 290-5-24). The following year, the Georgia Birth Defects Reporting and Infor-mation System (GBDRIS) was initiated. GBDRIS is a statewide birth defects surveillance system maintained by the Maternal and Child Health Section of the Epi-demiology Branch, Division of Public Health, Georgia
8
Department of Human Resources, and is designed to provide information on the prevalence, trends, and epi-demiology of birth defects throughout Georgia. The system relies on hospitals, laboratories, and health care providers to report information about infants, fetuses, and children with birth defects. Hospitals do this on a monthly basis through an extract from their billing sys-tems using discharge codes. The initial pilot phase of the GBDRIS conducted in 2003 involved a total of 15 hospitals and medical centers. The surveillance system has expanded in recent years and now includes over 92% of birthing hospitals in the state. In addition to data reported by hospitals, GBDRIS also receives data collected by MACDP on a quarterly basis. The overlap of the two surveillance systems in the five-county area offers the opportunity to use MACDP data to measure the sensitivity of the passive GBDRIS program. In general, diagnoses of birth defects reported to the GBDRIS are not confirmed by medical record re-view. However, as part of increased efforts to prevent NTDs, record reviews are conducted for all reported NTDs in order to verify the diagnoses and collect addi-tional information for use in developing prevention strategies. In addition, the GBDRIS provides informa-tion about children with suspected birth defects to the district coordinators for the Children 1st program.
This program serves as the single point of entry to a statewide collaborative system of prevention-based programs and services for children and families. Chil-dren 1st coordinators provide follow-up information about children identified by the GBDRIS in order to assess patterns of referral for services. The potential for linking Children 1st data back with MACDP might allow for improved estimates of the ascertainment of birth defects beyond the newborn period and also could be used to conduct longitudinal studies to exam-ine the natural history of specific defects and their as-sociated secondary conditions.
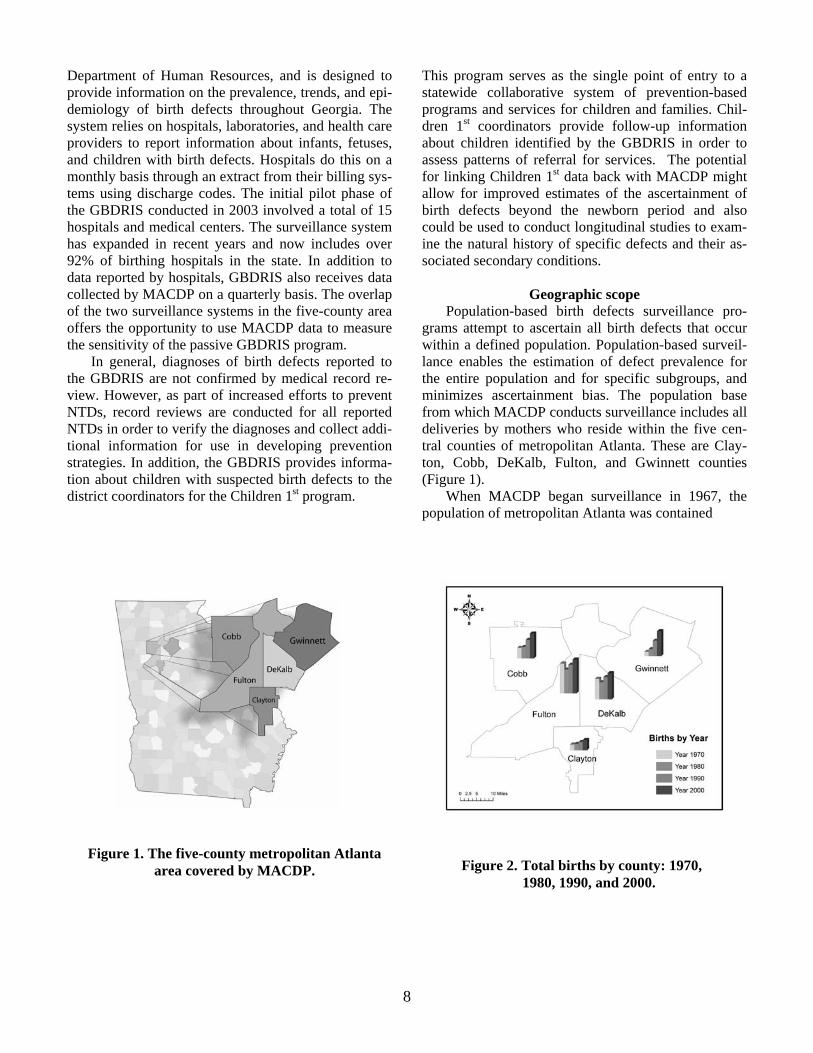
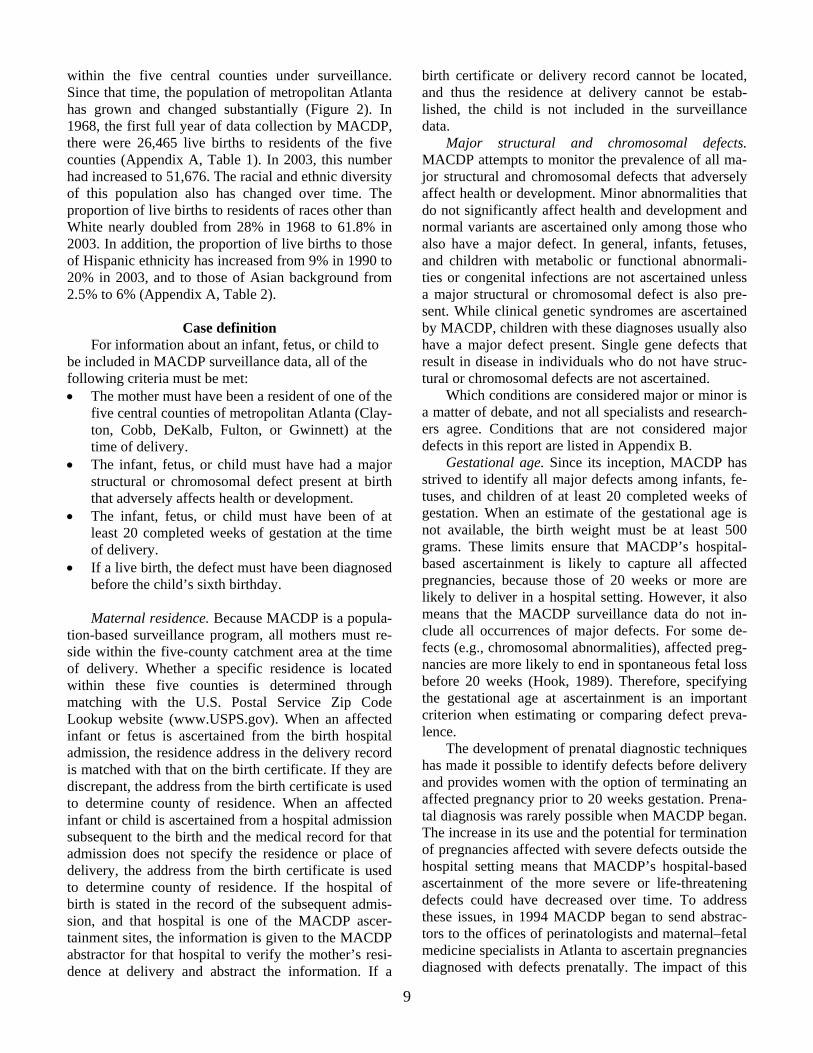
Geographic scope Population-based birth defects surveillance pro-grams attempt to ascertain all birth defects that occur within a defined population. Population-based surveil-lance enables the estimation of defect prevalence for the entire population and for specific subgroups, and minimizes ascertainment bias. The population base from which MACDP conducts surveillance includes all deliveries by mothers who reside within the five cen-tral counties of metropolitan Atlanta. These are Clay-ton, Cobb, DeKalb, Fulton, and Gwinnett counties (Figure 1). When MACDP began surveillance in 1967, the population of metropolitan Atlanta was contained
Figure 1. The five-county metropolitan Atlanta area covered by MACDP. Figure 2. Total births by county: 1970,
1980, 1990, and 2000.
9
within the five central counties under surveillance. Since that time, the population of metropolitan Atlanta has grown and changed substantially (Figure 2). In 1968, the first full year of data collection by MACDP, there were 26,465 live births to residents of the five counties (Appendix A, Table 1). In 2003, this number had increased to 51,676. The racial and ethnic diversity of this population also has changed over time. The proportion of live births to residents of races other than White nearly doubled from 28% in 1968 to 61.8% in 2003. In addition, the proportion of live births to those of Hispanic ethnicity has increased from 9% in 1990 to 20% in 2003, and to those of Asian background from 2.5% to 6% (Appendix A, Table 2).
Case definition For information about an infant, fetus, or child to be included in MACDP surveillance data, all of the following criteria must be met: • The mother must have been a resident of one of the
five central counties of metropolitan Atlanta (Clay-ton, Cobb, DeKalb, Fulton, or Gwinnett) at the time of delivery.
• The infant, fetus, or child must have had a major structural or chromosomal defect present at birth that adversely affects health or development.
• The infant, fetus, or child must have been of at least 20 completed weeks of gestation at the time of delivery.
• If a live birth, the defect must have been diagnosed before the child’s sixth birthday.
Maternal residence. Because MACDP is a popula-tion-based surveillance program, all mothers must re-side within the five-county catchment area at the time of delivery. Whether a specific residence is located within these five counties is determined through matching with the U.S. Postal Service Zip Code Lookup website (www.USPS.gov). When an affected infant or fetus is ascertained from the birth hospital admission, the residence address in the delivery record is matched with that on the birth certificate. If they are discrepant, the address from the birth certificate is used to determine county of residence. When an affected infant or child is ascertained from a hospital admission subsequent to the birth and the medical record for that admission does not specify the residence or place of delivery, the address from the birth certificate is used to determine county of residence. If the hospital of birth is stated in the record of the subsequent admis-sion, and that hospital is one of the MACDP ascer-tainment sites, the information is given to the MACDP abstractor for that hospital to verify the mother’s resi-dence at delivery and abstract the information. If a
birth certificate or delivery record cannot be located, and thus the residence at delivery cannot be estab-lished, the child is not included in the surveillance data.
Major structural and chromosomal defects. MACDP attempts to monitor the prevalence of all ma-jor structural and chromosomal defects that adversely affect health or development. Minor abnormalities that do not significantly affect health and development and normal variants are ascertained only among those who also have a major defect. In general, infants, fetuses, and children with metabolic or functional abnormali-ties or congenital infections are not ascertained unless a major structural or chromosomal defect is also pre-sent. While clinical genetic syndromes are ascertained by MACDP, children with these diagnoses usually also have a major defect present. Single gene defects that result in disease in individuals who do not have struc-tural or chromosomal defects are not ascertained. Which conditions are considered major or minor is a matter of debate, and not all specialists and research-ers agree. Conditions that are not considered major defects in this report are listed in Appendix B. Gestational age. Since its inception, MACDP has strived to identify all major defects among infants, fe-tuses, and children of at least 20 completed weeks of gestation. When an estimate of the gestational age is not available, the birth weight must be at least 500 grams. These limits ensure that MACDP’s hospital-based ascertainment is likely to capture all affected pregnancies, because those of 20 weeks or more are likely to deliver in a hospital setting. However, it also means that the MACDP surveillance data do not in-clude all occurrences of major defects. For some de-fects (e.g., chromosomal abnormalities), affected preg-nancies are more likely to end in spontaneous fetal loss before 20 weeks (Hook, 1989). Therefore, specifying the gestational age at ascertainment is an important criterion when estimating or comparing defect preva-lence. The development of prenatal diagnostic techniques has made it possible to identify defects before delivery and provides women with the option of terminating an affected pregnancy prior to 20 weeks gestation. Prena-tal diagnosis was rarely possible when MACDP began. The increase in its use and the potential for termination of pregnancies affected with severe defects outside the hospital setting means that MACDP’s hospital-based ascertainment of the more severe or life-threatening defects could have decreased over time. To address these issues, in 1994 MACDP began to send abstrac-tors to the offices of perinatologists and maternal–fetal medicine specialists in Atlanta to ascertain pregnancies diagnosed with defects prenatally. The impact of this

10
Newborn Hospital
AscertainmentProcedures
Abstractor Reviews:
Obstetric logsPediatric logsNursery logsICU, NICU logsCardiac catheter logsPostmortem labsSurgery logsDisease indicesStillbirths
Condition warranting chart
review
Do not review record
Review hospital record
Meets MACDP case definition?
Do not abstract record
Abstract record
Yes
No
No
Yes
Subsequent Hospitalization
& Clinic Ascertainment
Procedures
Abstractor Reviews:
Discharge summariesCardiac catheter logsPostmortem labsSurgery logsDisease indicesCytogenetic labsLaboratory logsCardiac clinicsPediatric logs
Condition warranting chart
review
Do not review record
Review hospital record
Meets MACDP case definition?
Do not abstract record
Abstract record
Yes
No
No
Yes
Vital Record & Laboratory
Ascertainment Procedures
Birth Defects Staff Reviews:
Birth certificatesDeath certificatesFetal death certificatesCytogenetics labs
Possible new cases?
Do not review record
Review hospital record
Meets MACDP case definition?
Do not abstract record
Abstract record
Yes
No
No
Yes
prenatal ascertainment on the prevalence of all defects is beyond the scope of this report. Its impact on the prevalence of certain defects has been the subject of several publications using MACDP data (Roberts, 1995, Siffel, 2004; Williams, 2005). Only live births and affected pregnancies that were electively termi-nated at 20 weeks or greater in a hospital setting are included in this report. Age at diagnosis. From the beginning, MACDP surveillance has focused on defects that were sympto-matic during the first year of life. For most of the pro-gram’s duration, having signs or symptoms of a defect during the first year of life was a requirement for in-clusion of infants, fetuses, or children in the MACDP data. These diagnoses could then be updated or revised until the child was 6 years of age. Because identifying the time of sign or symptom onset from in-patient hos-pital records can be difficult for older
children, and because a relatively small proportion of major defects do not have signs or symptoms in the first year of life, this criterion was changed in 1998 to require only that the diagnosis be made before the child’s sixth birthday. This change means that the es-timated prevalence of some defects in MACDP might be higher after 1998 than before. As with gestational age, specifying the maximum age at which defect di-agnoses are ascertained after birth is an important crite-rion when estimating or comparing defect prevalence.
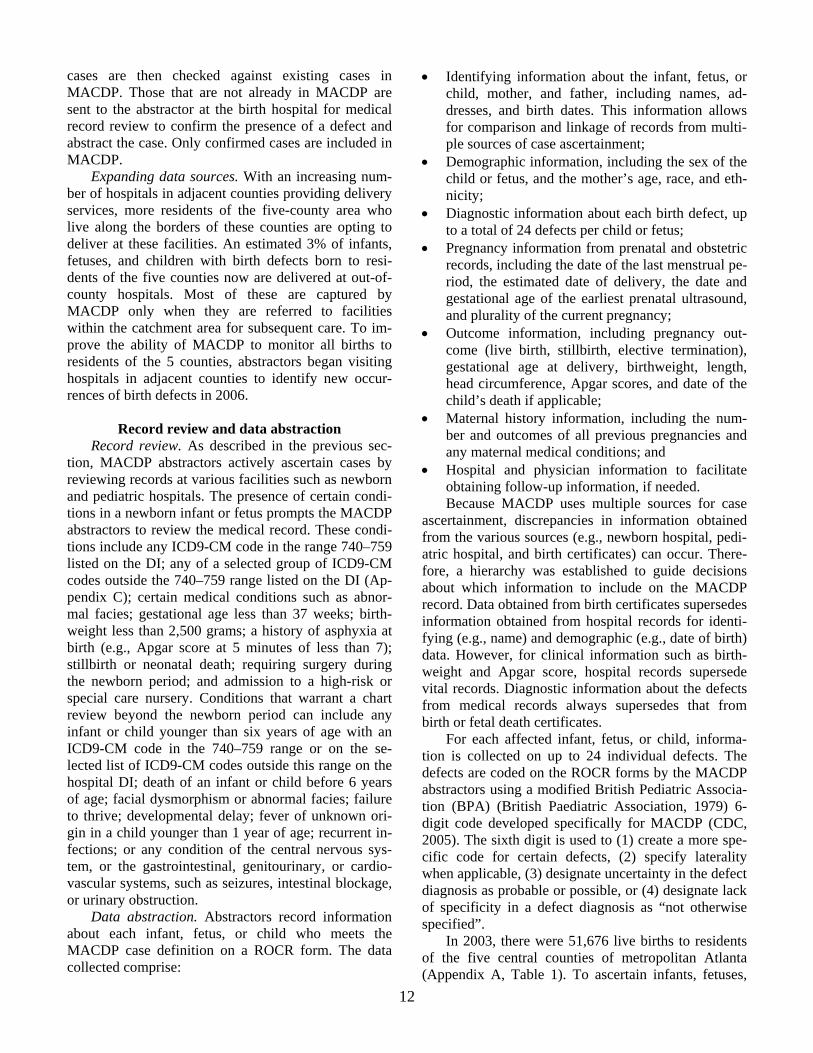
Data sources and case ascertainment Infants, fetuses, children with birth defects are identified for MACDP on an ongoing basis by trained abstractors who periodically visit birth hospitals, pedi-atric hospitals, specialty clinics, and perinatal offices to actively search available data sources (Figure 3). Data
Figure 3. MACDP case detection

11
received from cytogenetic laboratories are reviewed for abnormal results identified during the pre- and post-natal periods. Infants and fetuses with potential birth defects also are identified from vital records. Birth hospitals. The records systematically re-viewed by MACDP abstractors at these hospitals are labor and delivery logs, pediatric logs, nursery logs, intensive care unit (ICU) or neonatal intensive care unit (NICU) logs, postmortem or pathology logs, in-duction and miscarriage logs, stillbirth records, and disease indices (DIs). The frequency of an abstractor’s visits to each hospital depends on the number of births at that hospital per year. During these visits, abstrac-tors complete a Reproductive Outcomes Case Record (ROCR) form for each infant, fetus, or child that meets the case definition criteria described previously. The DI, which contains International Classifica-tion of Diseases, Ninth Revision, Clinical Modification (ICD9-CM) (CDC, 2007) diagnosis codes for dis-charged patients, is the source that provides the highest yield of infants, fetuses, and children with defects. These reports are received from medical records de-partments on a quarterly basis and are limited to live born children younger than 6 years of age and still-borns delivered to mothers who reside in the five-county area at the time of delivery. The DI is further restricted to a predetermined list of codes provided by MACDP. The list includes ICD9-CM codes in the 740–759 range (Congenital Anomalies), as well as ad-ditional codes that might indicate or be associated with the presence of a congenital anomaly. The list of codes outside the 740 to 759 range is provided in Appendix C. Pediatric hospitals. A second path for screening and abstracting information about children with birth defects involves hospitals that a child might visit after being discharged from the newborn nursery. Abstrac-tors review discharge summaries and disease indices, and information is abstracted in much the same way as in birth hospitals. When a new child with a birth defect is identified at a pediatric hospital, the hospital of birth is noted and the ROCR is sent to the abstractor at that hospital for completion. If the pediatric hospital record does not include the place of birth, the child’s informa-tion is matched with Georgia birth certificates to de-termine whether the child was born to a resident of one of the five MACDP counties and to identify the hospi-tal of birth. Specialty clinics. Since 1995, records at a local pediatric cardiology center are reviewed to supplement clinical information about existing MACDP cases. All children identified as having a congenital heart defect by MACDP are checked against the outpatient records at the center for updated diagnostic information. Prior
to 2006, new cases were not identified from this source. Perinatal offices. In response to the technological advances that have led to increased prenatal detection of anomalies and the potential for elective termination of affected pregnancies outside the hospital setting, MACDP abstractors began visiting outpatient perinatal offices and maternal–fetal medicine departments in 1994 to identify pregnancies diagnosed prenatally with birth defects. Staff at these offices maintain hand-written logs or perform computer searches of records to identify patients diagnosed with or suspected of car-rying a fetus with a congenital defect. A MACDP ab-stractor then reviews each record to determine whether the prenatal condition meets the MACDP case defini-tion. Because the sensitivity, specificity, and accuracy of prenatal diagnostic techniques vary for different de-fects and at different times during gestation, the effect of including defects ascertained only from prenatal sources on the prevalence of defects ascertained from hospital-based sources has not been fully assessed. Fi-nal inclusion criteria for individual defects ascertained only from prenatal sources are still under consideration by MACDP clinicians. For these reasons, only affected pregnancies that were electively terminated at 20 weeks or greater in a hospital setting are included in this report. Cytogenetic laboratories. MACDP currently re-ceives cytogenetic data from two laboratories, one lo-cal and one national. MACDP abstractors regularly visit the local laboratory to review abnormal results to identify new cases, and to complete information about existing MACDP cases for which cytogenetic testing was requested but for which no result was found in the medical record. These existing cases without a cytoge-netic result are also checked against the records from a national genetics laboratory, which MACDP receives on a quarterly basis. Additional abnormal cytogenetic results obtained from the local laboratory that do not link to an existing MACDP case are matched with Georgia vital records to identify the county and place of residence. If the mother was a resident of one of the five counties at delivery, the information is then sent to the MACDP abstractor at the hospital of birth for medical record review and abstraction. Vital records. Vital records are routinely used to identify infants and fetuses with birth defects for MACDP. Birth and fetal death certificates are identi-fied that meet the following criteria: (1) the mother was a resident of one of the five counties of ascertain-ment at the time of delivery; (2) the gestational age was 20 weeks or greater at delivery; and (3) a birth defect is noted on the birth certificate. These potential
12
cases are then checked against existing cases in MACDP. Those that are not already in MACDP are sent to the abstractor at the birth hospital for medical record review to confirm the presence of a defect and abstract the case. Only confirmed cases are included in MACDP. Expanding data sources. With an increasing num-ber of hospitals in adjacent counties providing delivery services, more residents of the five-county area who live along the borders of these counties are opting to deliver at these facilities. An estimated 3% of infants, fetuses, and children with birth defects born to resi-dents of the five counties now are delivered at out-of-county hospitals. Most of these are captured by MACDP only when they are referred to facilities within the catchment area for subsequent care. To im-prove the ability of MACDP to monitor all births to residents of the 5 counties, abstractors began visiting hospitals in adjacent counties to identify new occur-rences of birth defects in 2006.
Record review and data abstraction Record review. As described in the previous sec-tion, MACDP abstractors actively ascertain cases by reviewing records at various facilities such as newborn and pediatric hospitals. The presence of certain condi-tions in a newborn infant or fetus prompts the MACDP abstractors to review the medical record. These condi-tions include any ICD9-CM code in the range 740–759 listed on the DI; any of a selected group of ICD9-CM codes outside the 740–759 range listed on the DI (Ap-pendix C); certain medical conditions such as abnor-mal facies; gestational age less than 37 weeks; birth-weight less than 2,500 grams; a history of asphyxia at birth (e.g., Apgar score at 5 minutes of less than 7); stillbirth or neonatal death; requiring surgery during the newborn period; and admission to a high-risk or special care nursery. Conditions that warrant a chart review beyond the newborn period can include any infant or child younger than six years of age with an ICD9-CM code in the 740–759 range or on the se-lected list of ICD9-CM codes outside this range on the hospital DI; death of an infant or child before 6 years of age; facial dysmorphism or abnormal facies; failure to thrive; developmental delay; fever of unknown ori-gin in a child younger than 1 year of age; recurrent in-fections; or any condition of the central nervous sys-tem, or the gastrointestinal, genitourinary, or cardio-vascular systems, such as seizures, intestinal blockage, or urinary obstruction. Data abstraction. Abstractors record information about each infant, fetus, or child who meets the MACDP case definition on a ROCR form. The data collected comprise:
• Identifying information about the infant, fetus, or child, mother, and father, including names, ad-dresses, and birth dates. This information allows for comparison and linkage of records from multi-ple sources of case ascertainment;
• Demographic information, including the sex of the child or fetus, and the mother’s age, race, and eth-nicity;
• Diagnostic information about each birth defect, up to a total of 24 defects per child or fetus;
• Pregnancy information from prenatal and obstetric records, including the date of the last menstrual pe-riod, the estimated date of delivery, the date and gestational age of the earliest prenatal ultrasound, and plurality of the current pregnancy;
• Outcome information, including pregnancy out-come (live birth, stillbirth, elective termination), gestational age at delivery, birthweight, length, head circumference, Apgar scores, and date of the child’s death if applicable;
• Maternal history information, including the num-ber and outcomes of all previous pregnancies and any maternal medical conditions; and
• Hospital and physician information to facilitate obtaining follow-up information, if needed.
Because MACDP uses multiple sources for case ascertainment, discrepancies in information obtained from the various sources (e.g., newborn hospital, pedi-atric hospital, and birth certificates) can occur. There-fore, a hierarchy was established to guide decisions about which information to include on the MACDP record. Data obtained from birth certificates supersedes information obtained from hospital records for identi-fying (e.g., name) and demographic (e.g., date of birth) data. However, for clinical information such as birth-weight and Apgar score, hospital records supersede vital records. Diagnostic information about the defects from medical records always supersedes that from birth or fetal death certificates. For each affected infant, fetus, or child, informa-tion is collected on up to 24 individual defects. The defects are coded on the ROCR forms by the MACDP abstractors using a modified British Pediatric Associa-tion (BPA) (British Paediatric Association, 1979) 6-digit code developed specifically for MACDP (CDC, 2005). The sixth digit is used to (1) create a more spe-cific code for certain defects, (2) specify laterality when applicable, (3) designate uncertainty in the defect diagnosis as probable or possible, or (4) designate lack of specificity in a defect diagnosis as “not otherwise specified”. In 2003, there were 51,676 live births to residents of the five central counties of metropolitan Atlanta (Appendix A, Table 1). To ascertain infants, fetuses,
13
and children with birth defects in this catchment area, MACDP employs 10 full-time and 1 part-time abstrac-tors. The frequency of visits made by an abstractor to an individual ascertainment site to identify and abstract cases varies depending on the number of deliveries, pediatric admissions, or outpatient visits at that site. The frequency can vary from four to five visits per week at the busiest sites to one visit per month at the least busy sites.
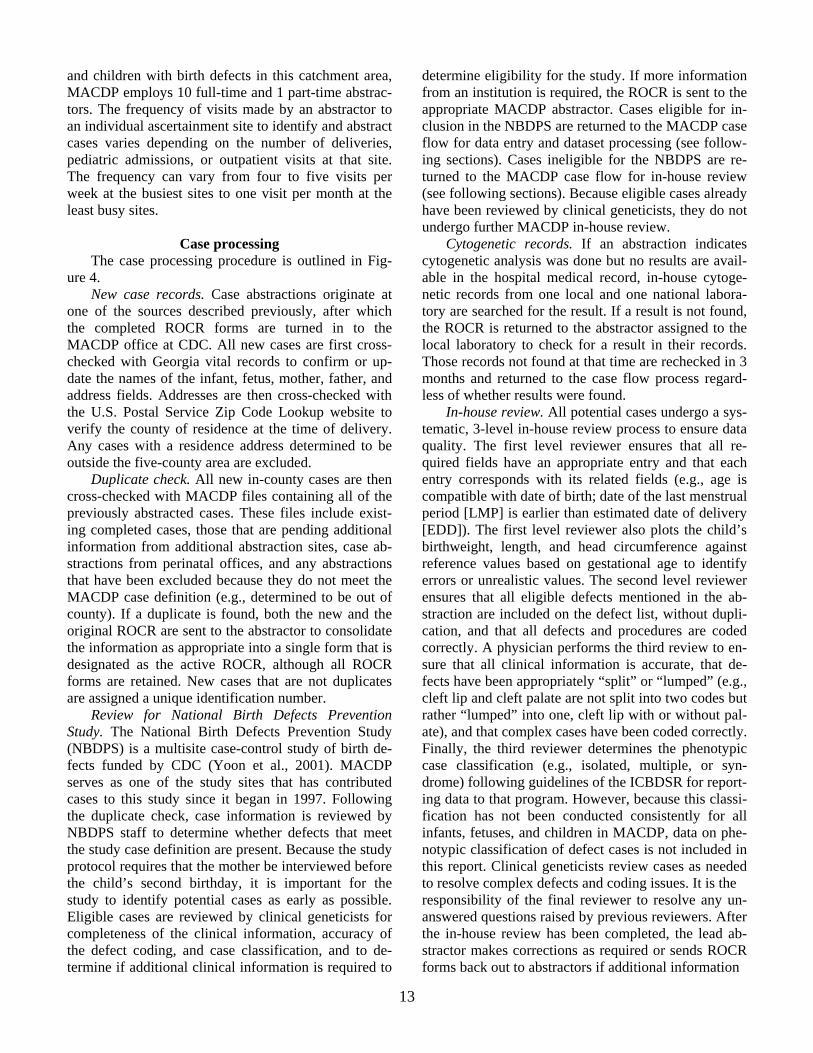
Case processing The case processing procedure is outlined in Fig-ure 4. New case records. Case abstractions originate at one of the sources described previously, after which the completed ROCR forms are turned in to the MACDP office at CDC. All new cases are first cross-checked with Georgia vital records to confirm or up-date the names of the infant, fetus, mother, father, and address fields. Addresses are then cross-checked with the U.S. Postal Service Zip Code Lookup website to verify the county of residence at the time of delivery. Any cases with a residence address determined to be outside the five-county area are excluded. Duplicate check. All new in-county cases are then cross-checked with MACDP files containing all of the previously abstracted cases. These files include exist-ing completed cases, those that are pending additional information from additional abstraction sites, case ab-stractions from perinatal offices, and any abstractions that have been excluded because they do not meet the MACDP case definition (e.g., determined to be out of county). If a duplicate is found, both the new and the original ROCR are sent to the abstractor to consolidate the information as appropriate into a single form that is designated as the active ROCR, although all ROCR forms are retained. New cases that are not duplicates are assigned a unique identification number. Review for National Birth Defects Prevention Study. The National Birth Defects Prevention Study (NBDPS) is a multisite case-control study of birth de-fects funded by CDC (Yoon et al., 2001). MACDP serves as one of the study sites that has contributed cases to this study since it began in 1997. Following the duplicate check, case information is reviewed by NBDPS staff to determine whether defects that meet the study case definition are present. Because the study protocol requires that the mother be interviewed before the child’s second birthday, it is important for the study to identify potential cases as early as possible. Eligible cases are reviewed by clinical geneticists for completeness of the clinical information, accuracy of the defect coding, and case classification, and to de-termine if additional clinical information is required to
determine eligibility for the study. If more information from an institution is required, the ROCR is sent to the appropriate MACDP abstractor. Cases eligible for in-clusion in the NBDPS are returned to the MACDP case flow for data entry and dataset processing (see follow-ing sections). Cases ineligible for the NBDPS are re-turned to the MACDP case flow for in-house review (see following sections). Because eligible cases already have been reviewed by clinical geneticists, they do not undergo further MACDP in-house review. Cytogenetic records. If an abstraction indicates cytogenetic analysis was done but no results are avail-able in the hospital medical record, in-house cytoge-netic records from one local and one national labora-tory are searched for the result. If a result is not found, the ROCR is returned to the abstractor assigned to the local laboratory to check for a result in their records. Those records not found at that time are rechecked in 3 months and returned to the case flow process regard-less of whether results were found. In-house review. All potential cases undergo a sys-tematic, 3-level in-house review process to ensure data quality. The first level reviewer ensures that all re-quired fields have an appropriate entry and that each entry corresponds with its related fields (e.g., age is compatible with date of birth; date of the last menstrual period [LMP] is earlier than estimated date of delivery [EDD]). The first level reviewer also plots the child’s birthweight, length, and head circumference against reference values based on gestational age to identify errors or unrealistic values. The second level reviewer ensures that all eligible defects mentioned in the ab-straction are included on the defect list, without dupli-cation, and that all defects and procedures are coded correctly. A physician performs the third review to en-sure that all clinical information is accurate, that de-fects have been appropriately “split” or “lumped” (e.g., cleft lip and cleft palate are not split into two codes but rather “lumped” into one, cleft lip with or without pal-ate), and that complex cases have been coded correctly. Finally, the third reviewer determines the phenotypic case classification (e.g., isolated, multiple, or syn-drome) following guidelines of the ICBDSR for report-ing data to that program. However, because this classi-fication has not been conducted consistently for all infants, fetuses, and children in MACDP, data on phe-notypic classification of defect cases is not included in this report. Clinical geneticists review cases as needed to resolve complex defects and coding issues. It is the responsibility of the final reviewer to resolve any un-answered questions raised by previous reviewers. After the in-house review has been completed, the lead ab-stractor makes corrections as required or sends ROCR forms back out to abstractors if additional information

14
Medical record abstractionROCR* form generated
(birth hospitals, pediatric hospitals, laboratories)
Case review (1st, 2nd, 3rd, clinical geneticist review)
Data entry
Duplicate check
ROCR form completed
(cytogenetics, birth hospital, vital
records, other)
Incorporate cases into master file
ROCR complete?
No
Yes
Additional information
needed?No
De-identified files generated for
monitoring prevalence and conducting epidemiologic
research
Vital records and in-county check
Yes
No Exclude
NBDPS** review
ROCR form completed
(cytogenetics, birth hospital, vital records,
other)
Yes Resolve
*Reproductive Outcomes Case Recoed**National Birth Defects Prevention Study
Yes
Figure 4. Current MACDP case flow
15
is needed. During the correction process, the lead ab-stractor drafts a short memorandum called “batch notes” that describes common problems in the batch and recurrent inaccuracies in defect coding that the reviewers identify. The batch notes are distributed to abstractors and in-house reviewers and are reviewed at MACDP staff meetings. Adoptions. When a child identified as having a birth defect is to be adopted, all identifying informa-tion about the child and the biological parents (e.g., names, addresses, dates of birth, telephone numbers, social security numbers) are removed from the ROCR and destroyed once the review process is complete and all information has been ascertained. Data entry and dataset processing. Once all cor-rections have been completed, the ROCR forms are sent for manual data entry. The resulting data are ed-ited for correctness and a history of alterations to each record is preserved. Data are then added to the master file. A series of programs generates data sets without identifying data for use in routine monitoring and analysis. Electronic data management system. MACDP ex-pects to implement a newly developed electronic data management system in 2007. All medical record ab-straction will be conducted on laptop computers and the case flow management process will be automated. The new system will increase data quality and the se-curity of confidential identifying information, as well as improve case flow efficiency. It will also facilitate monitoring, analysis, and reporting of MACDP data and its linkage with other data sources such as vital records. It is hoped that, once implemented, the avail-ability of this system in the public domain will be use-ful to state-based and other birth defects surveillance programs.
DEFECT DEFINITIONS AND CLASSIFICATIONS
Defect definitions
This section provides details of the conditions that are included, and those that are not included, in each of the defect categories in this report. In general, diagno-ses made prenatally that were not confirmed postna-tally are not included. The primary exception is for chromosomal abnormalities diagnosed by amniocente-sis or chorionic villus sampling. Prenatal diagnoses of some nonchromosomal defects, such as anencephaly or spina bifida, can be included if the prenatal ultrasound description of the defect was sufficient to be certain of the diagnosis. When more than one defect is present, the affected infant, fetus, or child is included in each relevant de-
fect category (e.g., ventricular septal defect and an-other unrelated congenital heart defect). However, in-dividual components of a single defect are not counted separately (e.g., ventricular septal defect occurring as part of tetralogy of Fallot). Selected publications of more detailed descriptive analyses using MACDP data are provided for each de-fect in the following paragraphs when available. Ap-pendix B lists conditions not considered to be major congenital defects in this report. The MACDP 6-digit code list of major congenital defects can be accessed from the CDC website (CDC, 2005). All defects. This category comprises all major de-fects ascertained by MACDP. Anencephalus. This category comprises anen-cephaly and acrania. While true acrania can result from failure of the bones of the skull to form, rather than failure of the neural tube to close, the terms are often used interchangeably in medical records, and true ac-rania is quite rare. If both anencephaly and spina bifida or both anencephaly and encephalocele are present, the infant or fetus is included in both defect categories. The data in this category do not include iniencephaly or craniorachischisis. For additional descriptive analy-ses of anencephaly using MACDP data, see Roberts et al. (1995). Spina bifida. This category comprises spina bifida at any level, with or without hydrocephalus or Arnold-Chiari malformation; specifically, meningocele, mye-locele, myelomeningocele, lipomeningocele, lipomye-locele, and lipomyelomeningocele. If both anencephaly and spina bifida or both spina bifida and encephalocele are present, the infant, fetus, or child is included in both defect categories. This category does not include spina bifida occulta. For additional descriptive analy-ses of spina bifida using MACDP data, see Roberts et al. (1995). Encephalocele. This category comprises encepha-locele and cranial meningocele present at any location on the skull. If both anencephaly and encephalocele, or both spina bifida and encephalocele, are present, the infant, fetus, or child is included in both defect catego-ries. For additional descriptive analyses of encephalo-cele using MACDP data, see Siffel et al. (2003) and Rowland et al. (2006). Hydrocephalus. This category comprises any type of hydrocephalus that is present at birth. The category does not include Dandy-Walker malformation, Dandy-Walker variant, hydranencephaly, or hydrocephalus that develops after birth due to a postnatal insult, such as intraventricular hemorrhage. Anophthalmia. This category comprises absence and agenesis of the eye globes. The category does not

16
include microphthalmia, or small, hypoplastic, or ru-dimentary eyes. Congenital cataract. This category comprises any type of cataract. For additional descriptive analyses of congenital cataract using MACDP data, see Bhatti et al. (2003). Conotruncal heart defects. This category is an ag-gregate group of defects related to conotruncal forma-tion. It comprises dextrotransposition of the great arter-ies and all its subtypes, tetralogy of Fallot and all its subtypes, truncus arteriosus, vascular ring and all its subtypes, double-outlet right ventricle, interrupted aor-tic arch (IAA) type B, unspecified IAA, hemitruncus (i.e., pulmonary artery originating from the ascending aorta), aortopulmonary window; and conoventricular (Type 1) ventricular septal defect. The category does not include IAA type A. Dextrotransposition of the great arteries. This category comprises all types of transposition of the great arteries with concordant atrioventricular connec-tions (dextrotransposition of the great arteries [d-TGA]) with or without ventricular septal defect or left ventricular outflow tract obstruction (pulmonary valve or infundibular stenosis), double-outlet right ventricle (DORV) with malposed great arteries, and unspecified d-TGA. The category does not include other types of DORV. Tetralogy of Fallot. This category comprises tetralogy of Fallot (TOF), TOF with absent pulmonary valve, pulmonary atresia with a VSD (including TOF-pulmonary atresia), pulmonary atresia with a VSD and multiple aortopulmonary collaterals (also known as pseudotruncus), double-outlet right ventricle of TOF type. Truncus arteriosus. This category comprises all truncus arteriosus. The category does not include hemitruncus or pseudotruncus. Atrioventricular septal defect. This category com-prises complete atrioventricular septal defect (AVSD), intermediate or transitional AVSD, primum-type atrial septal defect (ASD), inlet (type 3) ventricular septal defect (VSD), AVSD with tetralogy of Fallot, single ventricle of unbalanced AVSD type (right or left dominant), and AVSD of unspecified type. Complete atrioventricular septal defect. This cate-gory comprises complete AVSD, also known as com-plete endocardial cushion defect with primum-type ASD and inlet-type VSD. An additional muscular VSD can also be present. Valvar pulmonary stenosis. This category com-prises valvar and unspecified pulmonary stenosis, and dysplastic pulmonary valve. The category does not include subvalvar or supravalvar pulmonary stenosis.
Pulmonary atresia. This category comprises pul-monary atresia with intact ventricular septum. The category does not include pulmonary atresia with a VSD or pulmonary atresia for which the presence or absence of a VSD is not specified. Hypoplastic left heart syndrome. This category comprises hypoplastic left heart syndrome (HLHS) with or without an additional VSD. Aortic stenosis. This category comprises valvar aortic stenosis and aortic stenosis of unspecified site, aortic valve atresia, and dysplastic aortic valve. The category does not include aortic stenosis that coexists with coarctation of the aorta, or subvalvar or supraval-var aortic stenosis. Coarctation of the aorta. This category comprises coarctation of the aorta, aortic arch hypoplasia, and IAA type A. The category does not include other types of IAA. Atrial septal defect. This category is an aggregate group of all atrial septal defects (ASDs) greater than 4 millimeters in size. It comprises secundum ASDs, other specified types of ASDs, and ASDs of unspeci-fied type. The category does not include patent fora-men ovale and any atrial septal defect in infants, fe-tuses, or children of less than 36 weeks gestation at delivery. Secundum atrial septal defect. This category com-prises secundum-type ASDs only. The category does not include other types of ASDs, or ASDs of unspeci-fied type. Ventricular septal defect. This category comprises perimembranous (Type 2) VSD, muscular (Type 4) VSD, and unspecified VSD. The category does not include conoventricular (Type 1) VSD, inlet (Type 3) VSD, or VSD that occurs with IAA type B or unspeci-fied IAA. Perimembranous (Type 2) ventricular septal defect. This category comprises perimembranous VSD only. Muscular (Type 4) ventricular septal defect. This category comprises muscular VSD only. Levotransposition of the great arteries. This cate-gory comprises all types of atrioventricular discor-dance, including congenitally corrected TGA (l-TGA) with or without a VSD, l-TGA with left ventricular outflow tract obstruction (pulmonary valve or infun-dibular stenosis), and atrioventricular discordance without TGA. Single ventricle. This category comprises any of the following types of single ventricle: double inlet left ventricle with levomalposed or dextromalposed great vessels or with unspecified position of the great ves-sels, double inlet right ventricle, mitral atresia with aortic malposition, tricuspid atresia with aortic mal-

17
position, and other specified and unspecified single ventricle. The category does not include single ventri-cle with unbalanced AVSD, single ventricle associated with heterotaxy syndrome, hypoplastic left heart syn-drome, or tricuspid atresia without malposed great ves-sels. Vascular ring. This category comprises vascular ring, double aortic arch, pulmonary artery sling, and right aortic arch with aberrant left subclavian artery. The category does not include isolated right aortic arch or left aortic arch with aberrant right subclavian artery because these do not form a vascular ring. Partial and total anomalous pulmonary venous return. This category comprises all pulmonary venous return anomalies, including partial anomalous pulmo-nary venous return (PAPVR), PAPVR of scimitar type, and total anomalous pulmonary venous return of su-pracardiac, cardiac, intracardiac, mixed, and other types. Ebstein anomaly. This category comprises any oc-currence of Ebstein anomaly. The category does not include other types of right ventricular outflow tract obstruction. Choanal atresia or stenosis. This category com-prises any congenital obstruction of one or both of the posterior choanae (the openings of the nasal cavities into the nasopharynx on either side). Cleft lip with or without cleft palate. This category includes cleft lip with or without an associated cleft hard or soft palate, cleft alveolar ridge, and cleft gum. Cleft palate alone. This category comprises cleft hard or soft palate that is not associated with a cleft lip. The category does not include isolated cleft uvula that is not associated with cleft lip or other cleft palate. Pyloric stenosis. This category comprises pyloric stenosis diagnosed after birth that is not secondary to another condition. For additional descriptive analyses of pyloric stenosis using MACDP data, see Lammer et al. (1987). Esophageal atresia or stenosis. This category comprises esophageal atresia, esophageal stenosis or stricture, tracheoesophageal or bronchoesophageal fis-tula, and esophageal web. Duodenal atresia or stenosis. This category com-prises atresia or stenosis of the duodenum and duode-nal web, regardless of whether they occur secondary to another defect such as annular pancreas. For additional descriptive analyses of duodenal atresia or stenosis using MACDP data, see Cragan et al. (1993). Jejunal and/or ileal atresia or stenosis. This cate-gory comprises any atresia or stenosis of the jejunum, ileum, or unspecified small intestine. For additional descriptive analyses of jejunal and/or ileal atresia or stenosis using MACDP data, see Cragan et al. (1993).
Large intestinal atresia or stenosis. This category comprises any atresia or stenosis of the large intestine. Anal or rectal atresia or stenosis. This category comprises atresia or stenosis of the rectum or anus, including imperforate anus. Hirschsprung disease. This category comprises any type of Hirschsprung disease, including agan-glionosis confined to the anorectal area and agan-glionosis extending to all or part of the colon. The category does not include congenital megacolon in which Hirschsprung disease was not specifically diag-nosed. Biliary atresia. This category comprises all types of biliary atresia, both intrahepatic and extrahepatic. For additional descriptive analyses of biliary atresia using MACDP data, see Yoon et al. (1997b). Hypospadias. This category comprises all degrees of hypospadias, with or without associated chordee. The category does not include epispadias, or chordee without associated hypospadias. Bilateral renal agenesis or dysgenesis. This cate-gory comprises absence, agenesis, dysplasia, or hy-poplasia of both kidneys. The category does not in-clude absence, agenesis, dysplasia, or hypoplasia of only one kidney, or infants or fetuses with “Potter’s syndrome” for which bilateral renal agenesis or dys-genesis has not been diagnosed. Any cystic kidney disease. This category is an ag-gregate group of any type of cystic kidney disease. It comprises simple renal cysts, cystic changes secondary to ureteral obstruction, autosomal recessive and auto-somal dominant polycystic kidney disease, medullary cystic and multicystic kidney disease, and other types of inherited cystic kidney disease. Exstrophy of the bladder. This category comprises exstrophy of the bladder only. The category does not include exstrophy of the cloaca, or exstrophy associ-ated with imperforate anus or other abnormalities of the intestine. Posterior urethral valves. This category comprises obstruction of the posterior urethra regardless of se-verity. The category does not include atresia, stenosis, or obstruction of the anterior urethra, the urinary mea-tus, or the bladder neck. The category also does not include urethral obstruction sequence (formerly known as “prune belly”) for which posterior urtheral valves was not specifically diagnosed. Congenital dislocation or dysplasia of the hip. This category comprises developmental dysplasia of the hip, congenital dislocated or dislocatable hip, and hip dysplasia not secondary to a generalized skeletal abnormality. The category does not include hip clicks or unstable hips that are not dislocatable.

18
Clubfoot without a neural tube defect. This cate-gory comprises talipes equinovarus, talipes calcane-ovarus, talipes calcaneovalgus, and unspecified club-foot that does not coexist with an NTD (anencephaly, iniencephaly, craniorachischisis, spina bifida, or en-cephalocele). The category does not include metatarsus varus, metatarsus adductus, other complex varus or valgus deformities not diagnosed as clubfoot, or club-foot that coexists with an NTD. Polydactyly. This category comprises preaxial and postaxial fingers, toes, and skin tags in all racial and ethnic groups except Blacks or African Americans. In Blacks or African Americans, the category comprises preaxial fingers, toes, and skin tags, but only postaxial fingers and toes. Because they are more common among the Black or African American population, postaxial skin tags are not considered a major defect in Blacks or African Americans. Intercalary limb deficiency. This category com-prises: • Total or partial absence of the humerus, radius, and
ulna with all or part of the hand present; • Absence of the radius and ulna with the humerus
and all or part of the hand present; • Absence of the humerus with the radius, ulna, and
hand present; • Total or partial absence of the femur, tibia, and
fibula with all or part of the foot present; • Absence of the tibia and fibula with the femur and
all or part of the foot present; • Absence of the femur with the tibia, fibula, and
foot present; and • Unspecified phocomelia or intercalary deficiency
of an upper, lower, or unspecified limb. Infants, fetuses, or children with intercalary deficiency of more than one limb are included only once. The category does not include transverse limb deficiencies for which only rudimentary or nubbin fingers are at-tached to the stump of the humerus or femur. Longitudinal limb deficiency. This category is an aggregate group of preaxial, postaxial, and unspecified longitudinal limb deficiencies. Preaxial longitudinal limb deficiency comprises: • Total or partial absence of the radius or thumb, or
both, with or without total or partial absence of the second finger;
• Absence or hypoplasia of the thumb without other abnormalities of the limb;
• Total or partial absence of the tibia or the great toe, or both, with or without total or partial absence of the second toe; and
• Absence or hypoplasia of the great toe without other abnormalities of the limb.
Postaxial longitudinal limb deficiency comprises: • Total or partial absence of the ulna with or without
absence of the fifth finger and total or partial absence of the fourth finger; • Total or partial absence of the fifth metacarpal and
finger with or without total or partial absence of the fourth metacarpal and finger;
• Total or partial absence of the fibula with or with-out absence of the fifth toe and total or partial ab-sence of the fourth toe; and
• Total or partial absence of the fifth metatarsal and toe with or without total or partial absence of the 4th metatarsal and toe.
Unspecified longitudinal limb deficiency comprises: • Ulnar, radial, tibial, or fibular ray defects; • Unspecified absence of a long bone of the forearm
or leg with absence of associated fingers or toes; and
• Longitudinal deficiency of an unspecified limb. Infants, fetuses, or children with longitudinal defi-ciency of more than one limb are included only once. Transverse limb deficiency. This category com-prises: • Total or partial absence of the humerus, radius,
ulna, and hand; • Total or partial absence of the radius, ulna, and
hand; • Total or partial absence of the hand or fingers not
associated with a ray or longitudinal deficiency; • Total or partial absence of the femur, tibia, fibula,
and foot; • Total or partial absence of the tibia, fibula, and
foot; • Total or partial absence of the foot or toes not as-
sociated with a ray or longitudinal deficiency; • Rudimentary or nubbin fingers attached to the
stump of the shoulder girdle, humerus, forearm, or elbow, or occurring alone without other abnormali-ties of the limb;
• Rudimentary or nubbin toes attached to the stump of the pelvic girdle, femur, lower leg, or knee, or occurring alone without other abnormalities of the limb;
• Absence, amelia, congenital amputation, or un-specified transverse deficiency of an upper, lower, or unspecified limb; and
• Absent or missing individual phalanges, fingers, toes, or unspecified digits.
Infants, fetuses, or children with transverse deficiency of more than one limb are included only once. The category does not include absence or hypoplasia of the thumb or great toe without other abnormalities of the limb.
19
Split-hand and/or split-foot malformation. This category comprises: • Absence of the third finger, with or without ab-
sence of the second or fourth fingers, with total or partial absence of the associated metacarpals;
• Absence of the third toe, with or without absence of the second or fourth toes, with total or partial absence of the associated metatarsals;
• Monodactyly of the hand or foot; and • Lobster-claw hand or foot. Infants, fetuses, or children with split-hand and/or split-foot malformation of more than one limb are in-cluded only once. The category does not include total or partial absence of the second, third, or fourth fingers or toes without total or partial absence of the associ-ated metacarpals. Other and unspecified limb deficiency. This cate-gory comprises specified and unspecified deficiency of an upper, lower, or unspecified limb not included in the categories for intercalary, longitudinal, or trans-verse limb deficiency, or for split-hand and/or split-foot malformation. Craniosynostosis. This category comprises docu-mented synostosis of the coronal, metopic, lambdoid, saggital, and other or unspecified cranial sutures. In-fants, fetuses, or children with synostosis of more than one suture are counted only once. The category does not include those diagnosed with syndromes for which craniosynostosis can be a component if the diagnosis of craniosynostosis was not documented to have cra-niosynostosis. Skeletal dysplasia. This category comprises all specified and unspecified chondrodystrophies, osteo-dystrophies, dwarfisms, and generalized skeletal dys-plasias, regardless of cause or pattern of inheritance. Diaphragmatic hernia. This category comprises all types of congenital diaphragmatic hernias, including Bochdalek, Morgagni, and other specified or unspeci-fied diaphragmatic hernias. The category does not in-clude hemidiaphragm, absence or eventration of the diaphragm, or other abnormalities that are not speci-fied as diaphragmatic hernia. For additional descriptive analyses of diaphragmatic hernia using MACDP data, see Dott et al. (2003). Omphalocele. This category comprises omphalo-cele only. The category does not include gastroschisis, umbilical or epigastric hernia, or other specified and unspecified abdominal wall defects. Infants, fetuses, or children in whom the diagnosis of omphalocele could not reliably be distinguished from gastroschisis are not included. Gastroschisis. This category comprises gastroschi-sis only. The category does not include omphalocele, umbilical or epigastric hernia, limb—body wall com-
plex, or other specified and unspecified abdominal wall defects. Infants, fetuses, or children in whom the diagnosis of gastroschisis could not reliably be distin-guished from omphalocele are not included. For addi-tional descriptive analyses of gastroschisis data using MACDP data, see Williams et al. (2005). Urethral obstruction sequence. This category comprises the abdominal wall abnormality formerly known as “prune belly” regardless of the underlying cause. It includes abnormalities for which an underly-ing cause was not identified or sought. The category does not include omphalocele, gastroschisis, umbilical or epigastric hernia, limb—body wall complex, or other specified or unspecified abdominal wall defects. Down syndrome, maternal age 35 years or older and Down syndrome, maternal age younger than 35 years. These categories comprise karyotypes docu-menting full trisomy 21, translocation trisomy 21, or mosaic trisomy 21, and diagnoses of any of these trisomies 21 for which the karyotype is not stated in the medical record. The category does not include sus-pected trisomy 21 or features characteristic of Down syndrome for which the karyotype was not evaluated. For additional descriptive analyses of Down syndrome using MACDP data, see Krivchenia et al. (1993), Huether et al. (1998), Siffel et al. (2004), and Rasmussen at al. (2006). Trisomy 13, maternal age 35 years or older and Trisomy 13, maternal age younger than 35 years. These categories comprise karyotypes documenting full trisomy 13, translocation trisomy 13, or mosaic trisomy 13, and diagnoses of any of these trisomies 13 for which the karyotype is not stated in the medical record. The category does not include suspected trisomy 13 for which the karyotype was not evaluated. Trisomy 18, maternal age 35 years or older and Trisomy 18, maternal age younger than 35 years. These categories comprise karyotypes documenting full trisomy 18, translocation trisomy 18, or mosaic trisomy 18, and diagnoses of any of these trisomies 18 for which the karyotype is not stated in the medical record. The category does not include suspected trisomy 18 for which the karyotype was not evaluated. Any autosomal trisomy, maternal age 35 years or older and Any autosomal trisomy, maternal age younger than 35 years. These categories comprise karyotypes documenting full trisomy, translocation trisomy, or mosaic trisomy of any autosomal chromo-some, and diagnoses of any of these trisomies for which the karyotype is not stated in the medical record. The category does not include suspected trisomy of an autosomal chromosome for which the karyotype was not evaluated.
20
Turner syndrome. This category comprises karyo-type 45,X, Turner variant karyotypes, including mosaic XO, isochromosome X, ring chromosome X, and par-tial deletion of chromosome X, and diagnoses of Turner syndrome for which the karyotype is not stated in the medical record. The category does not include suspected Turner syndrome or features characteristic of Turner syndrome for which the karyotype was not evaluated. Conjoined twins. This category comprises any con-joined twins regardless of the site at which they are joined, including those for whom the site of joining is not specified.
Classification of heart defects Background. Various terms are used to describe pediatric cardiac birth defects, including cardiovascular malformations (CVMs) and congenital heart defects (CHDs). In this report, CHDs refer to birth defects of the heart and primary vessels connected to the heart. Certain other vascular abnormalities, such as renal ar-tery anomalies, are not included as CHDs. CHDs in-clude a broad spectrum of abnormalities ranging from benign and self-resolving lesions (e.g., small VSDs) to very complex lesions with multiple abnormalities (e.g. heterotaxia). Commonly occurring constellations of lesions are often described as a single named CHD. Examples include HLHS and TOF. HLHS usually in-cludes a small left ventricle, mitral or aortic atresia, or both, and coarctation of the aorta. TOF classically in-cludes a VSD; right ventricular hypertrophy; aortic override; pulmonary stenosis; and, frequently, pulmo-nary arterial stenosis. In the traditional coding system used by MACDP, each abnormality of structure or blood flow is coded separately, so that a single infant, fetus, or child can have several codes which, clinically, describe one ma-jor CHD. In the example of HLHS, the case can have three to six codes for various lesions but, in reality, have one primary defect. Use of this type of coding system for surveillance of CHDs can be misleading. When estimating the burden of CHDs on a population or evaluating outcomes related to certain CHDs, it would likely be more useful to consider each major defect rather than all of its component defects sepa-rately. For the data included in this report, the CHDs among infants, fetuses, or children delivered during the period 1982–2003 have been classified using guide-lines developed by a group of pediatric cardiologists based on their clinical understanding and the presumed underlying developmental mechanisms. The classifica-tion of all CHDs in MACDP is an ongoing effort and CHDs for all years will be completed in 2007. Detailed
guidelines for this classification are available on re-quest. The classification involves a detailed clinical review of information on the ROCR forms in an at-tempt to recognize the major CHDs rather than their separate component defects. Occasionally, a case has more than one major CHD that is counted separately since different CHDs are thought to develop through different morphogenetic mechanisms. Clinical review using these guidelines has several advantages: (1) the defect codes for an individual case can be described as major or minor, leading to improved detail and diag-nostic accuracy; (2) cases with different defects can be grouped according to their presumed morphogenetic mechanisms; (3) physiologic variants not considered major defects, such as patent ductus arteriosus (PDA) or patent foramen ovale (PFO) in a preterm or newborn infant, can be excluded from analyses; and (4) obliga-tory shunt lesions, such as ASD in the setting of tricus-pid atresia or PDA in the setting of critical coarctation, are not listed as independent lesions. Use of these guidelines should result in greater specificity in the groupings of CHDs, and could lead to improvements in surveillance and improved data for use in surveillance and epidemiological studies of CHD. Methods: designing a system. The goal of this classification was to use the fewest diagnostic catego-ries possible, yet describe the cardiac lesions accu-rately, with an emphasis on separating cardiac defects by their potentially different embryonic origins and morphometric mechanisms. The MACDP 6-digit code was not changed, but a cardiac classification system based on the International Paediatric and Congenital Cardiac Codes used by the Society of Thoracic Sur-geons (STS), and known as the “STS system” (Mav-roudis and Jacobs, 2000), was added. This system was chosen for its simplicity, specificity of diagnoses, use of a standard nomenclature, and wide use in many pe-diatric cardiology centers. The STS codes contain two to four digits and partially align with other coding sys-tems such as ICD9-CM. However, there are some dif-ferences. For example, the STS system separates the types of VSDs into perimembranous, muscular, subar-terial, and inlet. In the MACDP coding system, these are all encompassed in the single code 745.480. The existing STS system was modified for MACDP by adding codes, such as those for IAA subtypes and for not otherwise specified (NOS) defects, to enhance the specificity of certain CHDs for surveillance and epi-demiologic purposes. A second goal of this CHD classification was to facilitate the monitoring or analysis of CHDs by their related, rather than individual, defects. The STS codes were, therefore, aggregated automatically into morphogenetically similar groups. Two higher orders

21
of aggregation were created on the basis of presumed similar developmental mechanisms, following a previ-ously devised schema (Clark, 1996). For example, cases with STS codes for related defects of d-TGA with intact septum, d-TGA with VSD, DORV-TGA type, and d-TGA NOS can be grouped into a larger group of d-TGA and, ultimately, into a group of all conotruncal defects. Furthermore, the STS codes for different types of VSDs are at different aggregation levels based on their presumably different develop-mental mechanisms. For example, inlet type VSDs were included with AVSDs, and subarterial VSDs with conotruncal CHDs. However, because of their relative frequency, perimembranous VSDs and muscular VSDs were reported as distinct groups. Overall, each re-viewed case was assigned three levels of cardiac classi-fication: Level 1 (STS), Level 2 (Subgroup), and Level 3 (largest group). The version of the code used by MACDP is STS Database Collection Form v.2.30. The actual list of STS diagnostic codes is on the STS web-site: (http://www.sts.org/sections/stsnationaldatabase/datamanagers/congenitalheartsurgerydb/datacollection/). Although this framework was designed according to a developmental schema, it might need to change as knowledge about CHDs increases. Furthermore, the case classification might need to be considered differ-ently for studies with different objectives. Thus, the higher level classification can be altered as needed, while the original MACDP codes reported on the ROCR and the STS codes assigned through clinical review remain unchanged. Within this aggregation framework, there was a set of STS codes that were labeled “nonanalyzable” and were not assigned higher levels of grouping. Nonana-lyzable refers to conditions which are: (1) extremely rare defects; (2) cardiac arrhythmias; or (3) other con-ditions that might be important but are associated with CHDs of relatively little clinical significance, such as restrictive VSDs or right aortic arch. Cases with condi-tions in the latter category are usually included in a major CHD group (e.g., tetralogy of Fallot), so it is unnecessary to count them separately. It is important to note that these STS codes are permanently associated with the cases, so all cases with a particular nonana-lyzable code could easily be tracked, if desired.
ESTIMATION OF DEFECT PREVALENCE Incidence can be defined as the number of new cases of a condition that appear in a population over a specific period of time relative to the total size of the population at risk during that period. Prevalence can be defined as the total number of cases of a condition in a
population at a specified point in time or over a period of time divided by the total number of individuals in the population at that time (Mason et al. 2005). Be-cause MACDP does not ascertain all occurrences of defects, specifically not those that occur among preg-nancies that end before 20 weeks gestation, the surveil-lance data estimate defect prevalence at birth, not inci-dence. Estimates of defect prevalence using MACDP data have traditionally been calculated as the ratio of the number of infants, fetuses, and children of 20 weeks gestation or greater at delivery with birth de-fects born to residents of the five counties to the num-ber of live births to residents of the five counties. However, because some pregnancies without birth defects end in fetal loss at 20 weeks or greater, includ-ing only live births in the denominator is likely to overestimate true defect prevalence. Fetal death at any gestational age or birthweight is reportable by law in Georgia. Since 1994, MACDP has received fetal death certificates in addition to live birth certificates from the Georgia DHR. Because fetal death records were un-available prior to 1994, MACDP defect prevalence continues to be estimated using only live births of 20 weeks or greater as the denominator in order to main-tain consistency over time. For the most part, the dif-ference between prevalence estimates calculated using only live births versus live births plus fetal deaths in the denominator is small, because fetal deaths make up a small proportion of pregnancies of 20 weeks or greater. However, to facilitate calculation of true defect prevalence estimates and comparison of prevalence with those from other surveillance systems, the number of fetal deaths reported on vital records at 20 weeks or greater among residents of the five central counties of metropolitan Atlanta are provided for each year begin-ning in 1994 (Appendix A, Table 1). ISSUES RELATED TO SPECIFIC VARIABLES
INCLUDED IN THIS REPORT
The following summarizes issues related to each of the specific variables included in this report.
Maternal age For MACDP cases, maternal age at the time of delivery is calculated by subtracting the mother’s date of birth recorded in the delivery record from that of the infant or fetus. If the mother’s date of birth is not re-corded in the delivery record, her date of birth on the vital record of the infant or fetus is used. If the date of birth of the mother, infant, or fetus in the delivery re-cord differs from that on the vital record, the value from the delivery record is used. For denominator data, maternal age is calculated by subtracting the mother’s

22
date of birth on the vital record from that of the infant or fetus.
Maternal race and ethnicity
For MACDP cases, the designation of maternal race or ethnicity recorded in the delivery record is used. While race and ethnicity are not equivalent, they are recorded as a single variable with mutually exclu-sive categories in MACDP data. For the years 1968–1972, race was categorized as White, Black or African American, and All Other Races. Hispanic or Latino ethnicity was added in 1973. However, the ability to estimate defect prevalence for these subpopulations depends upon the availability of denominator data for each group. For the years 1968–1972, available vital records data categorized race as White and All Other Races. For these years, Blacks and African Americans were included in the category of All Other Races for estimating defect prevalence. MACDP cases of His-panic or Latino ethnicity born between 1973 and 1978 For the years 1973–1989, vital records categorized race as White, Black or African American, and All Other Races. The eight were included in the category of White race for estimating defect prevalence. For the years 1979–1989, MACDP data were linked with birth certificates, and cases of Hispanic or Latino ethnicity were included in the race category designated on the vital record. More than 95% of Hispanic cases were included in the category of White race for estimating defect prevalence during this period. For the years 1990–2003, ethnicity was available to MACDP as a
variable separate from that for race on vital records. For denominator data, these two variables were used together to create a single variable for maternal race or ethnicity with the mutually exclusive categories of White, Black or African American, Hispanic or Latino, and All Other Races. Because of these changes, MACDP estimates of defect prevalence among those of Hispanic or Latino ethnicity might be incomplete, which could have implications for interpreting preva-lence estimates for this subpopulation over time. These changes in data on race and ethnicity available for es-timating defect prevalence are summarized in Table 1.
Birthweight For MACDP cases, the value for birthweight re-corded in the delivery record is used. For denominator data, the value on the vital record is used. For the years 1974–1977, the values for birthweight on vital records appeared to be misclassified compared with those for the immediately surrounding years, probably reflecting the transition from reporting weight in pounds and ounces to reporting weight in grams. To estimate birthweights for these years (categorized as <2,500 grams and > 2,500 grams), the values for the five years before the period of misclassification (1968–1973) and the five years after (1978–1982) were used to fit a re-gression line for the proportion of infants with birth-weight < 2,500 grams by year. From this line, the val-ues for the categories of birthweight for the years in question (1974–1977) were estimated.
Table 1. Race and ethnicity by time period, Metropolitan Atlanta Congenital Defects Program
Period Race/Ethnicity Comments
White 1968–1972 All Other Races
Vital records aggregated all races other than White into a single category. Data on ethnicity were not available.
White Black or African American
1973–1978
All Other Races
Data on ethnicity were not available from vital records. Eight cases of Hispanic or Latino ethnicity were included in the category of White race for estimating defect prevalences.
White Black or African American
1979–1989
All Other Races
Data on ethnicity were not available from vital records. Cases of Hispanic or Latino ethnicity were included in the category of race designated on the vital record for estimating defect prevalences.
White Black or African American Hispanic or Latino
1990–2003
All Other Races
Four distinct categories of race or ethnicity were available for esti-mating defect prevalences.
23
Gestational age For MACDP cases, the value for the gestational age at delivery is taken from the delivery record. How-ever, which value is used depends on the availability of information in the record. If a standard newborn examination, such as a Dubowitz or Ballard exami-nation, is performed to assess gestational age, that value is used. If a standard examination is not avail-able, but the record states the gestational age, that value is used. When no value is stated in the medical record, the gestational age at delivery is calculated from that at the earliest available prenatal ultrasound performed before 28 weeks. If no prenatal ultra-sound is available before 28 weeks, the value for gestational age based on date of the mother’s LMP is used. For the denominator data, the value for gesta-tional age based on date of the mother’s LMP on the vital record is used. For the years 1984–1985, the values for gestational age on vital records were not available to MACDP, and those for the immediately surrounding years (1973–1983 and 1986–1987) ap-peared to be misclassified. To estimate gestational age for these years (categorized as 20–36 weeks and >37 weeks), the values for the five years before the period of misclassification (1968–1972) and the five years after (1988–1992) were used to fit a regression line from which the values for the categories of ges-tational age for the years in question (1973–1987) were estimated.
Sex For MACDP cases, the value for sex recorded in the delivery or newborn record is used. If the value in the medical record differs from that on the vital record, the value from the medical record is used. MACDP has four categories of sex: male, female, ambiguous, and not stated. Because of very small numbers in the ambiguous category, these cases are combined with those in the not stated category in the tables in this report. For denominator data, the value on the vital record is used.
Parity and gravidity For numerator data, the values for parity and gravidity recorded in the delivery record are used. If either value in the delivery record differs from that on the vital record, the value from the delivery re-cord is used. For denominator data, the values on the vital record are used.
Plurality
For numerator data, the value for plurality re-corded in the delivery record is used. If the value in the delivery record differs from that on the vital re-cord, the value from the delivery record is used. For denominator data, the value on the vital record is used.
Birth outcome For numerator data, the birth outcome (live birth, stillbirth, or elective termination) recorded in the delivery record is used. If the birth outcome in the delivery record differs from that on the vital re-cord, the value from the delivery record is used. For example, in some instances, a fetal death certificate is available but review of the labor and delivery re-cord might indicate that the pregnancy was elec-tively terminated after prenatal diagnosis of a defect. In this instance, the birth outcome would be re-corded as elective termination, not stillbirth.
Maternal socioeconomic status No individual level information about socioeco-nomic status (SES) is collected by MACDP, so a proxy variable is used based on census tract-level data. However, census tract-level aggregated data is relatively useful for generating proxy measures of individual SES (Krieger, 2003; Soobader et al., 2001). For the period 1979–2003, each census tract in the five-county area was given a poverty value based on the percentage of people in the census tract living below the federally defined poverty line as obtained by U.S. census data for the years 1980, 1990, and 2000. Three levels of SES were deter-mined by tertiles of the poverty value for census tracts within the five-counties. Each MACDP case was then assigned the SES value for the census tract of residence, which was based on geocoded data. Those living in a census tract with <5% of people below the poverty line were assigned SES = Upper; those living in a census tract with 5%–12% of peo-ple below the poverty line were assigned SES = Middle; and those living in a census tract with >12% of people living below the poverty line were as-signed SES = Lower.
Age at diagnosis While MACDP data can include multiple defect diagnoses per infant, fetus, or child, currently there is only a single field on the ROCR in which to re-cord the date of defect diagnosis. This is often the earliest date at which a defect was diagnosed. The age at diagnosis is then calculated by subtracting the birth date from the date of diagnosis. For infants,
24
fetuses, or children with only one birth defect, this is not a limitation. However, for those with more than one defect diagnosed at different times, the calcu-lated age at diagnosis is not always the age at which the defect of interest was diagnosed. For example, an infant with trisomy 21 diagnosed prenatally by am-niocentesis also could have a major heart defect di-agnosed after birth. The age at diagnosis, which for this child would be prenatally because of the amnio-centesis, would not accurately reflect the age at which the heart defect was identified. This should be kept in mind when interpreting the data on age at diagnosis in the tables of descriptive characteristics by defect (Appendix A, Tables 6–52).
GEOCODING OF NUMERATOR AND DENOMINATOR DATA
In recent years, it has become feasible to create spatially referenced birth defects datasets by geocod-ing the residential addresses of the mothers of in-fants, fetuses, or children with birth defects at the time of delivery. These geocodes correspond to the latitude and longitude of the address. Spatially refer-enced datasets can be linked to sociodemographic and environmental databases and used to explore spatial and temporal–spatial patterns in the distribu-tion of birth defects (Siffel et al., 2006). In 1997, MACDP began contracting the geocoding of its re-cords to a commercial vendor. After conducting a feasibility study and validating the results, approxi-mately 95% of MACDP records for 1968–2003 (nearly 40,000 addresses) were geocoded. Ideally, a population-based birth defects surveil-lance system would compile geocoded records for infants, fetuses, or children with birth defects and for the underlying birth cohort. In Georgia, the Office of Health Information and Policy (OHIP), Georgia Di-vision of Public Health, Georgia DHR, began geo-coding the maternal residence addresses on all birth certificates in 1994. When OHIP cannot determine the exact location for a given address, a geocode is generated using a spatial imputation algorithm (OHIP, 2007). MACDP routinely links its birth de-fects data with the geocoded birth data from OHIP. MACDP has updated the geocodes in the birth de-fects data with the geocoded birth data from OHIP for births from 1994 through 2003 and routinely links new birth defects data with OHIP geocoded birth data. When using geocoded data, it is important to recognize that the positional accuracy of geocoding can vary for several reasons, including the com-
pleteness and accuracy of the street reference files that are used to match addresses and the nature of the geocoding process itself (Siffel et al., 2006). However, while geographic information systems (GIS) tools can significantly improve geocoding ac-curacy, the accurate collection and maintenance of addresses remain the most critical first steps in the process (Yang et al., 2004). Some differences were discovered between the mother’s residential address at the time of delivery obtained by MACDP from the medical record and that recorded on the birth certifi-cate when the two datasets were linked. This could result from the fact that hospitals generally obtain addresses for billing purposes, and the billing ad-dress included in the medical record can differ from the residential address. In addition, errors can be made in data abstraction over time. Currently, birth addresses abstracted from medical records for MACDP are compared with addresses from vital records and discrepancies are resolved before the addresses are sent for geocoding. Additionally, the location based on the residence at the time of deliv-ery might not reflect where the mother resided at the time of or soon after conception, which is the period during which the developing fetus is particularly vulnerable to insults from environmental exposures. MACDP has recently begun to evaluate the impact of residential mobility during pregnancy.
MONITORING TECHNIQUES
Temporal monitoring MACDP surveillance data are regularly monitored by CDC staff to detect temporal changes in defect prevalence that could indicate changes in the occur-rence of defects or exposures with public health im-plications. While the results of this monitoring are not routinely published, they are used to generate hypotheses about factors that could lead to changes in defect prevalence and to monitor the need for fur-ther evaluation of these changes. This section de-scribes the methods used. In general, birth defects prevalence is thought to follow a Poisson distribution. An inherent character-istic of Poisson random variables is that the ob-served prevalence will fluctuate from year to year, even when the underlying birth defect risk remains constant. For example, if the risk of a given birth defect is 1 per 1,000 and that risk remains constant over time, one would expect to observe 50 cases of the birth defect in a cohort of 50,000 births. How-ever, because of random variation, more than 64 cases or fewer than 36 cases would be observed once

25
every 20 years. This apparently high or low preva-lence would not indicate a change in the occurrence of the birth defect, but a natural variation inherent to the process. Identifying birth defect clusters and trends is, therefore, challenging because one must judge whether the observed prevalence might be ex-plained by natural variation. In the 1980s, MACDP adopted the use of cumu-lative sum (CUSUM) models (Box and Luceno, 1997; Hawkins and Olwell, 1997; Lucas, 1976, 1985) to help identify birth defects clusters and trends. CUSUM is an established statistical method-ology designed to detect changes in the rate of oc-currence of an event over time. The technique has many desirable properties, including reasonable un-derlying statistical assumptions, good statistical power, and ease of use. CUSUM assumes an under-lying Poisson distribution of events, with a null hy-pothesis of no trend in the data. CUSUM is sensitive to temporal changes in prevalence that are gradual as well as those that are more abrupt, although detec-tion of seasonal patterns of very low amplitude is more problematic. The CUSUM method has excel-lent statistical power compared with other monitor-ing procedures. In MACDP, the CUSUM algorithm has been set so that, on average, one erroneous in-creasing flag is expected every 25 years for a par-ticular birth defect. Additional statistical and techni-cal details about how the CUSUM program detects departures of defect prevalence from the base preva-lence are provided in Appendix D. The CUSUM models help focus attention on specific birth defects that merit more careful moni-toring or investigation. The CUSUM technique can detect both increasing and decreasing changes in prevalence. An increase could signal the introduc-tion of a new teratogen, while decreases could result from preventive measures. However, such changes also can reflect changes in diagnostic and screening procedures, ascertainment methods, or case and de-fect definitions. For example, the increased use of newborn echocardiography over time has likely con-tributed to the observed increase in the prevalence of certain congenital heart defects, such as VSDs. Im-provements in MACDP infrastructure that translate into more complete case ascertainment also can cause increases in the observed prevalence of birth defects over time. And, even a very sharp increase in the observed prevalence can be due to chance. Also, when interpreting defect prevalence over time, one needs to consider how the population of the five cen-tral counties of metropolitan Atlanta have changed over time. Since 1968, such factors as the maternal
age distribution, prevalence of obesity and diabetes, and ethnic composition of this population have changed markedly. Crude comparisons of prevalence across multiple years can be problematic because the cases arise from changing populations. To the extent possible, the data in this repot have been stratified by key demographic variables to aid in the comparison of prevalence across time (Appendix A, Tables 6–52).
Spatial Monitoring The availability of geocoded data in recent years has allowed for some initial efforts at spatial moni-toring. To date, most of MACDP’s spatial monitor-ing activities have been in efforts to develop the methods to respond to community concerns. Crude and adjusted prevalence maps of the birth defect of interest are created using a GIS. These maps are generated from address-level geocodes of both the MACDP cases and the live birth cohort (Figure 5). A point-in-polygon routine is used to count the number of cases and total births within each census tract (or other geographic area), and census tracts are shaded according to the distribution of observed prevalence. If the prevalence maps suggest a birth defects cluster might be present, the Kulldorff scan statistic (Kulldorff, 1997) is used for statistical infer-ence. MACDP is currently developing methodologies for routine, proactive spatial monitoring of birth de-fects data. One such approach created by MACDP staff is the Automated Spatial Surveillance Program (ASSP). The intention is to use ASSP as a “first-step” exploratory surveillance tool for spatial moni-toring. ASSP is written in R, a language and envi-ronment for statistical computing. ASSP is not a new R package; it was created for MACDP by drawing from methods implemented in preexisting packages. An ASSP map simultaneously displays census tract-specific prevalence, smoothed prevalence contours, and locations of statistically elevated prevalence. The smoothed prevalence contours and the locations of possible clusters are generated from a two-dimensional kernel smoothing routine (Rowlingson and Diggle, 1993; Kelsall and Diggle, 1995). Monte Carlo simulations identify locations with statistically elevated prevalence under a random labeling null hypothesis.
The possibility of a Type 1 error (identifica-tion of false clusters) is an important issue affecting interpretation of ASSP maps, particularly when a large number of birth defects are examined across multiple time points. Because birth defects are rare,

26
missing or incorrect geocodes from the case series can substantially affect results. Furthermore, MACDP geocodes correspond to the maternal resi-dence at the time of delivery, whereas the pertinent time period of fetal exposure is often the first trimes-ter. Misclassification can, therefore, occur when mothers change residences during pregnancy.
Moving forward, we hope to further the de-velopment of ASSP and implement additional spa-tial surveillance techniques. The current version of ASSP uses a fixed bandwidth kernel; we intend to evaluate an adaptive bandwidth kernel in future ver-sions. An adaptive bandwidth kernel is superior to a fixed bandwidth kernel when population density is heterogeneously distributed throughout the surveil-lance area. Additional options for spatial surveil-lance include extension of CUSUM methods to spa-tial data (Rogerson, 2005) and multivariate ap-proaches for cluster identification (Sonesson and Frisen, 2005).
CONSIDERATIONS FOR THE
INTERPRETATION AND USE OF THE DATA The success of birth defects surveillance pro-grams depends on their ability to identify infants, fetuses, and children who definitely have a defect of interest (true cases) and to distinguish them from those who could have a defect of interest but, in real-ity, do not (false positives). This can be expressed in terms of the system’s sensitivity (the proportion of children who truly have the defect that are ascer-tained by the surveillance) and its specificity (the proportion of children who truly do not have the de-fect who are not ascertained by the surveillance). The number of cases of a birth defect that a surveil-lance system observes can be viewed as the number of true cases of the defect that a system ascertained plus the number of false positives ascertained, or: [(# births in the population) X (probability that the defect will occur) X (sensitivity of the surveillance)] + [(# births in the population) X (probability that the defect will not occur) X (1-specificity). Therefore, the accuracy of a surveillance system’s prevalence data depends on the system having a high sensitivity and high specificity for the defect of in-terest. It is helpful to keep these concepts in mind when interpreting and using surveillance data, and when considering the strengths and limitations of the data.
Figure 5. Changing spatial distribution of birth defects cases in five-county metropolitan Atlanta

27
Strengths of the Surveillance Data Population-based surveillance. As a population-based surveillance system, MACDP attempts to as-certain all defects that occur among births to women who reside within the five central counties of metro-politan Atlanta at the time of delivery. Advantages of conducting surveillance on a population basis in-clude the ability to estimate defect prevalence for the entire population and for specific subgroups, such as racial and ethnic subpopulations, that can provide clues to defect etiologies and that can have implica-tions for the provision of medical care and the focus of prevention efforts. In addition, conducting sur-veillance for the entire population can minimize as-certainment bias that can be present in hospital-based surveillance or voluntary reporting (Appelros et al., 2003). Multisource case ascertainment. MACDP uses multiple ascertainment sources to identify all infants, fetuses, or children with birth defects whose mothers reside within the five-county catchment area. These sources comprise birth hospitals, pediatric hospitals, specialty clinics, perinatal offices, cytogenetic labo-ratories, and vital records. Information about the same infants, fetuses, or children ascertained from more than one source is combined into a single re-cord to avoid duplication and to maximize the com-pleteness of information about each case. Use of this multisource ascertainment helps ensure that all af-fected infants, fetuses, or children are identified, and enhances the comprehensiveness, completeness, and sensitivity of MACDP data. Active case finding. Active surveillance is de-fined by the NBDPN as an “intensive level of case identification that involves staff finding cases at stra-tegic data sources. Ascertainment is usually very complete, and each diagnosis in the database is con-firmed” (NBDPN, June 2004). MACDP has con-ducted active surveillance since its inception. MACDP abstractors actively search multiple sources at each ascertainment site they visit to identify all infants, fetuses, or children with birth defects. These sources comprise disease indices, obstetric logs, pe-diatric logs, nursery logs, neonatal and other inten-sive care unit logs, postmortem and pathology logs, induction and miscarriage logs, and stillbirth re-cords. The medical record of each infant, fetus, or child with a potential defect is then reviewed to de-termine whether a defect is present that meets the MACDP case definition and to abstract a detailed description of the defect diagnosis and information about the method by which it was diagnosed. This active case finding helps ensure that all affected in-
fants, fetuses, or children are identified, and en-hances the comprehensiveness, sensitivity, and specificity of defect diagnoses included in the MACDP data. Surveillance for all major defects among chil-dren up to six years of age. MACDP actively ascer-tains all major structural and chromosomal defects diagnosed before age six years. In addition, when an infant, fetus, or child has one or more major defects, all major and minor defects, metabolic conditions, and congenital infections also are ascertained and coded. This information can be helpful in the recog-nition of defect etiologies, clinical syndromes, and patterns of congenital abnormalities. Casting such a wide net ensures that MACDP-based estimates of the prevalence of defects is all inclusive, and avoids a priori assumptions about which defects are of pri-mary medical or public health importance. This adds to the flexibility and utility of MACDP surveillance data by allowing the examination of individual de-fects when new or unexpected concerns arise about changes in their occurrence or the impact of envi-ronmental exposures. It also provides a foundation from which a variety of research hypotheses can be generated and tested, such as that related to military service in Vietnam and the risk of fathering babies with birth defects (Erickson et al. 1984). Data and clinical review. Another strength of MACDP methods is the emphasis on data accuracy and clinical validity. The multi-tiered review of case abstractions ensures that the data are accurate and correctly coded. The central role of pediatric and clinical genetic staff in reviewing each case to estab-lish diagnostic accuracy and standards for case in-clusion provides an added level of expertise and in-sight. When questions arise about the details of a potential case, the abstractor is asked to re-review the medical record and abstract additional informa-tion, if available, that can help resolve clinical uncer-tainties. These methods enhance the sensitivity and specificity of MACDP data and for monitoring prevalence by specifics as well as by well defined groups of defects. Longevity. MACDP has conducted uninterrupted surveillance for birth defects among the offspring of residents of the five central counties of metropolitan Atlanta for almost 40 years. The program began in 1967, with the first full year of data collection in 1968. This longevity has a number of advantages. Among birth defects surveillance programs in the United States, MACDP is somewhat unique in its ability to document and assist in the interpretation of trends in the prevalence of individual defects, liter-

28
ally over decades. This enhances the utility of MACDP by enabling it to monitor for the potential effects of environmental exposures, assess the im-pact of changes in medical diagnostic technology and care, and evaluate the success of prevention ef-forts (Williams et al., 2002).
Limitations of the Surveillance Data Gestational age. MACDP strives to identify all major defects among infants and fetuses of at least 20 completed weeks of gestation. This gestational age limit ensures that MACDP’s hospital-based as-certainment is likely to capture all affected pregnan-cies, since those of 20 weeks or more are likely to deliver in a hospital setting. However, it also means that the MACDP surveillance data do not include all occurrences of major defects. For some defects (e.g., chromosomal abnormalities), affected pregnancies are more likely to end in spontaneous fetal loss be-fore 20 weeks (Hook, 1989). Generalizability. Currently, the population of the five central counties of metropolitan Atlanta differs from that of the entire state of Georgia, and of the United States population as a whole, in a number of characteristics. Compared with the total Georgia and U.S. populations, the five-country area has become increasingly urban over time, with an increasingly higher proportion of residents of races other than White. Residents of the five counties also have a higher median income and a higher median educa-tion level compared with their state and national counterparts. Because characteristics such as these can be associated with different genetic factors and environmental exposures that have implications for the occurrence of birth defects, prevalence estimates based on MACDP data are not necessarily gener-alizable with those from other populations, including other cities, the rest of the state of Georgia, other regions of the United States, and other countries. In addition, the scope, case definition, inclusion and exclusion criteria, ascertainment methods, and case review process of the MACDP surveillance also can differ from those of other birth defects surveil-lance programs. While the internal validity of MACDP data is strong, its comparability to other programs can be limited. For these reasons, com-parisons of prevalence data from other surveillance systems with MADCP prevalence data need to keep in mind such methodological differences. Changes in the underlying population. The char-acteristics of the metropolitan Atlanta population have changed considerably since MACDP began surveillance in 1967. These changes in demograph-
ics have implications for the use and interpretation of MACDP surveillance data. Different racial and ethnic populations can differ in both genetic and en-vironmental factors that have implications for the occurrence of birth defects. These factors could in-clude such things as differences in diet, medication use, occupational and environmental exposures, and access to and use of obstetric, pediatric, and preven-tive medical services, as well as genetic variation and other factors. Differences such as these could lead to changes in defect prevalence over time and could limit the accuracy and comparability of MACDP data, particularly in interpreting trends dur-ing periods in which the composition of the underly-ing population is changing. In addition to changes in its characteristics, the population of metropolitan Atlanta has also ex-panded well beyond the five central counties. Ac-cording to the 2005 census estimate, metropolitan Atlanta now consists of 28 counties. As this popula-tion expands, and the availability of medical care in surrounding counties expands, some women who live within the five central counties are choosing to deliver in birth hospitals located in counties outside the immediate catchment area, to which MACDP does not send abstractors. This can affect the com-pleteness of MACDP prevalence estimates. Birth certificates have been used to estimate that 3% of children with birth defects born to residents of the five-county area are delivered at facilities outside the five counties, but it is expected that most infants and children with major defects would ultimately be seen for care at one of the pediatric hospitals or clinics that MACDP visits. However, this might not be true for those with defects that are not compatible with survival for more than a few hours, or those that are stillborn. In 2006, MACDP began to send abstrac-tors to the largest birth hospitals in counties immedi-ately surrounding the five-county catchment area to identify and abstract information about birth defects among infants and fetuses born in those hospitals to mothers who reside within the five central counties. However, information about deliveries in hospitals not located within the five counties is not included in this report. Migration and residential mobility. The MACDP case definition is based on the mother’s residence at the time of delivery. MACDP does not have information about residence at the time of con-ception, which is perhaps the more relevant resi-dence when considering some environmental factors that contribute to the risk for birth defects. Women who move away from the five-county catchment

29
area after the time of conception but before delivery are not eligible for inclusion in the MACDP surveil-lance if their infant, fetus, or child has a birth defect. This could affect the completeness of MACDP data, particularly in relation to the association of defect occurrence with risk factors or subpopulations if the women who move away have characteristics distinct from those who remain in the five-county area, The MACDP case definition also includes de-fects diagnosed up to 6 years of age. Because some defects are not recognized immediately at birth, some affected children who lived in the five-county area at the time of birth could move away from the area before the defect is recognized. This also could impact the completeness of MACDP prevalence es-timates, particularly if those who move away have characteristics distinct from those who remain in the five-county area. Based on data from the Atlanta Birth Defects Risk Factors Surveillance study, a case-control study conducted from 1993–1997 using MACDP cases with information on residential mobility during pregnancy, 22% of mothers changed residence be-tween conception and delivery. Of these, 25% moved into the five-county area, 25% moved to an-other county within the five-county area, and 50% moved but stayed within the same county of resi-dence. Those who moved away from the five-county area before delivery did not meet the MACDP case definition and, therefore, were not followed up. Changes in medical technology. Over the period during which MACDP has conducted surveillance, there have been some marked and rapid changes in the ability to diagnose structural and chromosomal abnormalities, and to manage affected pregnancies and affected children. These changes have implica-tions for the completeness, sensitivity, and specific-ity of MACDP data and the interpretation of trends in defect prevalence over time. One such change has been an increasing shift toward the provision of medical care in an outpatient setting. Diagnostic evaluations and procedures, such as magnetic reso-nance imaging (MRI), that once required hospitali-zation in the pediatric population are now performed in outpatient clinics or departments. Because MACDP abstractors primarily visit inpatient set-tings, the data do not always include the results of outpatient diagnostic evaluations. While most severe defects that affect health and development eventu-ally require hospitalization for surgical repair or other procedures, and thus do come to the attention of MACDP, outpatient evaluations that complete or further clarify diagnoses can be missed. This has
implications for changes in the sensitivity and speci-ficity of MACDP data for individual defects over time. Another important change has been the devel-opment of prenatal diagnostic techniques that can identify abnormalities early in pregnancy. This in-cludes such techniques as amniocentesis, chorionic villus sampling, cord blood sampling, high-resolution ultrasound fetal anomaly scans, fetal echocardiography, and fetal MRI, most of which were not widely used or had not yet been developed when MACDP began surveillance in 1967. The in-creased use of these technologies has implications for the completeness, sensitivity, and specificity of MACDP data, particularly for severe or life-threatening defects. Prenatal diagnosis now pro-vides women the option of terminating outside the hospital setting severely affected pregnancies before 20 weeks gestation. As a result, defects occurring in these pregnancies are missed by the traditional MACDP hospital-based ascertainment. In 1994, MACDP abstractors began visiting outpatient peri-natal offices and maternal–fetal medicine depart-ments to identify pregnancies diagnosed prenatally with birth defects to try to fill this gap in ascertain-ment. The development of new techniques for diagno-sis of conditions postnatally among infants and chil-dren also has implications for the sensitivity and specificity of MACDP surveillance data. An exam-ple is the development of bedside echocardiography, which enables physicians to definitively evaluate and diagnose cardiac findings, including heart mur-murs, before an infant is discharged from the new-born nursery. This has resulted in the ascertainment of asymptomatic cardiac lesions, such as muscular VSDs that subsequently close spontaneously, defects previously managed clinically without definitive diagnosis. Changes such as these can affect the abil-ity of MACDP to monitor and interpret changes in defect prevalence over time. Changes in clinical review and coding. Because of the longevity of the MACDP surveillance, a large number of staff has contributed medical, epidemi-ologic, management and administrative skills over the years. Inevitably, these individuals bring differ-ent expertise and professional perspective to the sur-veillance methods and data interpretation. This, cou-pled with increasing knowledge about and under-standing of morphogenetic mechanisms for birth defects, can result in changes in the details of defect inclusion and exclusion criteria, “lumping” and “splitting” of defect diagnoses, and coding practices

30
for individual defects, all of which can affect the completeness, sensitivity, and specificity of MACDP surveillance data.
Case classification. Since its beginning, MACDP primarily has monitored the prevalence of individual defects. However, a subset of affected infants, fetuses, and children have more than one defect. Classification of cases according to pheno-type (e.g., isolated or multiple defects) and known etiology (e.g., sequence or syndrome) can provide insight into the causes and pathogenetic mechanisms underlying birth defects. MACDP cases included in the NBDPS are classified as part of that study (Ras-mussen, 2003). MACDP cases with multiple defects and recognized syndromes are reported to the ICBDSR following that program’s classification guidelines. In addition, MACDP cases often are classified by phenotype and etiology for descriptive and epidemiologic studies. However, these classifi-cations have not been systematically captured to conduct population-based phenotypic surveillance, which limits the use of MACDP data to examine subsets of defects. Efforts are currently underway to classify MACDP cases from more recent years for this purpose. Because this continues to be a work-in-progress, information about phenotypic classifica-tion of MACDP cases is not included in this report. Timeliness. Because birth defect diagnoses can be ascertained and updated until a child’s sixth birthday, MACDP data constantly evolve over a 6-year period. In general, a time lag of 2 years is re-quired for the prevalence estimates for a particular birth year to be considered stable. Even with that, the estimates for some individual defects might not be complete for a considerably longer period. This can affect the utility and accuracy of MACDP data in addressing acute public health issues in a timely manner. For example, a period of at least 2 years is necessary for MACDP data to begin to reflect the effect of prevention efforts such as folic acid fortifi-cation of the grain supply. For these reasons, this report includes MACDP data only through 2003. Date of diagnosis. There is only one field on the ROCR for the date of diagnosis. For infants, fetuses, or children with only one birth defect, this is not a limitation. However, for those with several defects noted, the date of diagnosis is ambiguous regarding to which defect or defects it pertains.
DISCUSSION OF THE DATA
The total prevalence of all defects ascertained by MACDP among infants, fetuses, and children born
from 1968–2003 to residents of the five central counties of metropolitan Atlanta was 2.67 per 100 live births (Appendix A, Table 3). The prevalence was somewhat lower in the early years of surveil-lance, presumably because of incomplete ascertain-ment as methods and data sources were being devel-oped and refined. However, since about 1973, the total prevalence of defects has remained stable with only year-to-year variation (Appendix A, Figure 1). The prevalence of defects diagnosed before the sev-enth day of life was 2.09 per 100 live births. Live births accounted for 96% of the total prevalence; stillbirths and terminations accounted for 3% and 1%, respectively. Males had a higher prevalence (3.12 per 100 live births) than females (2.21 per 100 live births). 23.41% of all births with defects were premature and 23.86% were of low birth weight. The prevalence of most of the individual defects presented also has remained stable throughout this time. However, the prevalence of some individual defects has changed over time, suggesting changes in defect occurrence, diagnostic technology or prac-tices, ascertainment by the system, or other factors. Most notably, the prevalence of anencephaly and spina bifida has declined throughout the years of surveillance (Appendix A, Figures 2 and 3). Factors that could have influenced this decline include the development of prenatal diagnosis before 20 weeks gestation, which provides women with an affected pregnancy the option of elective termination outside the hospital setting. These pregnancies would not be ascertained through MACDP hospital-based sources, data for which are presented in this report. However, the decline in anencephaly and spina bifida was evi-dent in the early years of the program before prena-tal screening and diagnosis were widespread. Simi-larly, the U.S. Public Health Service recommenda-tion in 1992 that all women capable of becoming pregnant consume 400 micrograms of folic acid each day to prevent these defects and subsequent fortifi-cation of the U.S. grain supply with folic acid in 1998 do not explain the observed decline in these defects in earlier decades. A decline in prevalence is not limited to NTDs, however. The prevalence of clubfoot not associated with spina bifida also has declined over the period of MACDP surveillance (Appendix A, Figure 35). While clubfoot can occur simultaneously with, and presumably result from, spina bifida, its decline in the absence of this NTD suggests the influence of other factors or the possibility that clubfoot and spina bifida share risk factors even when they occur independently. The prevalence of cleft lip with or

31
without cleft palate also has declined over the period of surveillance, although the reasons for this change are not entirely clear (Appendix A, Figure 23).
In contrast, the prevalence of some individual defects has increased. This is perhaps most apparent for certain congenital heart defects, such as valvar pulmonic stenosis, atrial septal defect, and ventricu-lar septal defect (Appendix A, Figures 12, 16, 18, respectively). Wider use of bedside echocardiogra-phy in the newborn is most certainly an explanation for part of the observed increase in atrial septal de-fect and ventricular septal defect, a subset of which are known to occur as small, physiologically insig-nificant lesions that often resolve over time without treatment. Whether this change in the use of diag-nostic technology fully explains the observed in-crease in these defects, or the observed increase in valvar pulmonic stenosis, is not entirely clear.
The prevalence of Down syndrome and other autosomal trisomies has also increased over time, presumably because of changes in the underlying population of childbearing women. These conditions occur more frequently among the offspring of moth-ers 35 years of age or older. As the average age of childbearing women in metropolitan Atlanta in-creased over the period of MACDP surveillance, the prevalence of autosomal trisomies in the population also increased (Appendix A, Tables 2, 4, 45, and 46).
The prevalence of some defects in MACDP also appear to occur in clusters, most notably congenital cataract, polydactyly, and gastroschisis (Appendix A, Figures 6, 36 and 42, respectively). This could have occurred for a number of reasons. It is likely there was a true increase in the prevalence of con-genital cataract in the late 1970s and early 1980s in Atlanta. However, eradication of congenital rubella infection, one of the primary causes of congenital cataract, in the U.S. might explain why subsequent similar clusters of this defect have not been ob-served. In contrast, apparent clusters of defects can occur as an artifact of changes in defect ascertain-ment, classification, or other MACDP methods. This was probably true for the increase in polydactyly observed in 1981–1983 (Appendix A, Figure 36). Postaxial skin tags, a form of polydactyly, occur fre-quently among Black and African American infants and children and are not considered a major defect by MACDP in this population. The increase in poly-dactyly observed in 1981–1983 appears to consist largely of polydactyly among Black and African American infants and children with a description of the specific type was not recorded on the ROCR.
While it is not possible to verify, it is probable that these lesions are mostly postaxial skin tags which would have been excluded from the MACDP data if a sufficient description had been available. Collec-tion of more specific clinical information about this defect from the medical record presumably resolved the increase, which has not recurred in subsequent years. Some clusters, however, such as those seen for gastroschisis in 1989 and again in 2001, cannot readily be explained by changes in known risk fac-tors, surveillance methods, or other factors. It is a challenge for birth defects surveillance programs to determine whether such increases are occurring as part of random variations for rare events or represent true increases in defect prevalence that warrant fur-ther investigation. Additional considerations must be kept in mind when interpreting temporal trends in the prevalence of defects in surveillance data. As noted, defect prevalences in the earliest years of MACDP were sometimes lower than in subsequent years, presuma-bly due to incomplete ascertainment as the surveil-lance program was being implemented and refined. This can give the appearance of an increase in preva-lence over subsequent years, which might be an ex-planation for the increase in hypospadias seen prior to 1975 (Appendix A, Figure 31). Also, considerable variation in prevalence from year to year can give the impression of an increasing or decreasing trend over time, particularly for defects that occur very rarely. Interpretation of graphical representations of MACDP surveillance data must always be coupled with consideration of the actual prevalence estimates and their expected degree of random variation, as well as other potentially associated factors. In addi-tion, the accuracy and consistency of defect classifi-cation and coding can affect prevalence trends. For example, the observed prevalence of bilateral renal agenesis and dysgenesis appears to decrease in MACDP data at about the same time that the preva-lence of cystic kidney disease appears to increase (Appendix A, Figure 33). Because renal dysplasia can be associated with cystic changes, and because the understanding and classification of cystic renal disease and associated terminology has changed over time, it is unclear whether these represent true changes in defect prevalence or changes due to dif-ferences in defect diagnosis, classification, and cod-ing over the period of surveillance.
32
APPENDIX A: DATA TABLES AND FIGURES The following information can be helpful in under-standing the data in the following tables and graphs.
Data presentation In the following tables, annual prevalences are pre-sented for defects that have five or more cases in each year (Appendix A, Table 3). Prevalences for defects with fewer than five cases in some years are presented in three-year periods (Appendix A, Table 4). Preva-lences for defects with fewer than five cases in one or more three-year periods are presented as the total prevalence for all years combined (Appendix A, Table 5). Three-year prevalence are presented graphically for all defects except those with fewer than five cases in one or more three-year periods (Appendix A, Figures 1–46). Defect prevalence by descriptive characteristics (maternal age, maternal race and ethnicity, birth weight, gestational age, sex, parity, gravidity, and plu-rality) and the percentage of cases by different catego-ries of birth outcome, age at diagnosis, and socioeco-nomic status are presented in time periods that vary in length from four to six years for all defects except those with fewer than five cases in one or more three-year periods (Appendix A, Tables 6–51). These vary-ing intervals were chosen to correspond with changes in numerator and denominator categories of the charac-teristics so that all years within each interval contain data for the same categories for each characteristic (see the following section for changes in the categories for race and ethnicity). Prevalences and percentages by descriptive characteristics for defects with fewer than five cases in one or more three-year periods are pre-sented as the total for all years combined (Appendix A, Table 52). Prevalences for fewer than five cases are not pre-sented in Appendix A, Tables 3–5 because of the po-tential unreliability of estimates based on such small numbers. Similarly, the exact values for cells with fewer than five cases are not presented in Appendix A, Tables 6–52 because suppressing the actual number of cases in cells with small numbers can diminish the possibility that a specific individual could be identified through the data. Prevalences based on fewer than 5 cases in these tables are indicated as being less than the prevalence based on five cases. Percentages based on fewer than 5 cases also are not provided. For the categories of descriptive characteristics with unknown values in Appendix A, Tables 6–52, prevalences are not estimated because they do not have
inherent meaning. Only the number and percentage of cases is presented for these categories.
Race and ethnicity In MACDP data for the years 1968–1972, race was categorized as White, Black and African American, and All Other Races. However, available vital records data categorized race as White and All Other Races. For these years, Blacks and African Americans were included in the category of All Other Races for esti-mating defect prevalences. In order to better describe the distribution of defect cases by race, the number of cases of Black and African American race for these years is provided in a footnote to each of the tables of descriptive characteristics by defect (Appendix A, Ta-bles 6–52). Beginning in 1973, vital records included a category for Black or African American race, and prevalence estimates for this subpopulation are pre-sented. A category for Hispanic or Latino ethnicity was added to MACDP data in 1973. However, ethnicity was not recorded on vital records until 1990. Prior to that time, most infants, fetuses, and children of His-panic ethnicity were included in the category of White race for estimating defect prevalences. Therefore, MACDP estimates of defect prevalences among those of Hispanic or Latino ethnicity might be incomplete, which could have implications for interpreting preva-lence estimates for this subpopulation over time.
Maternal socioeconomic status U.S. census tract-level data about the percentage of people living below the federally defined poverty level currently are available to MACDP only from 1979–2001. The distribution of defect cases over different levels of socioeconomic status could not be estimated outside of these years.
Specific defects Hydrocephalus. Data for hydrocephalus are presented in the following tables and figures only for the years 1990–2003. Hydrocephalus had multiple causes. It can occur prenatally, during the immediate postnatal pe-riod, or later during infancy or early childhood. Rigor-ous and specific criteria for defining congenital hydro-cephalus were not consistently employed by MACDP prior to 1990. Congenital heart defects. MACDP data for CHDs from 1982–2003 have been classified according to guidelines developed by a group of pediatric cardiolo-gists. CHDs from the years prior to 1982 have not yet been classified in this manner. For consistency, preva-

33
lence data for CHDs are presented in Appendix A, Ta-bles 3 and 5 only for 1982–2003. Three-year preva-lences for CHDs are presented in Appendix A, Table 4 and each of the figures only for 1983–2003. Preva-
lences for CHDs by descriptive characteristics are pre-sented in Appendix A, Tables 12–27 and 52 for the years 1984–2003.
GUIDE TO THE DEFECTS IN APPENDIX A TABLES AND FIGURES Table 3. All defects together Spina bifida Conotruncal heart defects Dextrotransposition of the great arteries Tetralogy of Fallot Atrioventricular septal defect Coarctaion of the aorta Atrial septal defect Ventricular septal defect Perimembranous ventricular septal defect Cleft lip with or without cleft palate Cleft palate alone Pyloric stenosis Anal or rectal atresia or stenosis Hypospadias Congenital dislocation or dysplasia of the hip Clubfoot without a neural tube defect Polydactyly Transverse limb deficiency Tables 5 and 52. Anophthalmia Truncus arteriosus Pulmonary astresia Levotransposition of the great arteries Vascular ring Ebstein anomaly Choanal atresia or stenosis Large intenstinal atresia Biliary astresia Exstrophy of the bladder Posterior urethral valves Intercalary limb deficiency Longitudinal limb deficiency Split-hand and/or split-foot malformation Other and unspecified limb deficiency Urethral obstruction sequence Trisomies 13 and 18 Turner syndrome Conjoined twins
Table 4. Anencephalus Encephalocele Hydrocephalus Congenital cataract Complete atrioventricular septal defect Valvar pulmonary stenosis Hypoplastic left heart syndrome Aortic stenosis Secundum atrial septal defect Muscular ventricular septal defect Single ventricle Partial and total anomalous pulmonary venous return Esophageal atresia or stenosis Duodenal atresia or stenosis Jejunal and/or ileal atresia or stenosis Hirschsprung disease Bilateral renal agenesis or dysgenesis Any cystic kidney disease Craniosynostosis Skeletal dysplasia Diaphragmatic hernia Omphalocele Gastroschisis Down syndrome Any autosomal trsiomy Figures 1–46 and Tables 6–51. All defects in Tables 3 and 4

34
Year Live births Fetal deaths*Total 1,232,191 4,5361968 26,465 --1969 27,447 --1970 29,687 --1971 28,036 --1972 25,567 --1973 25,151 --1974 24,775 --1975 23,026 --1976 22,679 --1977 23,505 --1978 24,396 --1979 25,541 --1980 27,362 --1981 26,835 --1982 27,866 --1983 27,937 --1984 29,240 --1985 30,995 --1986 32,790 --1987 35,004 --1988 36,648 --1989 38,083 --1990 38,779 --1991 38,243 --1992 38,215 --1993 39,088 --1994 39,837 3791995 40,259 4061996 40,900 4061997 42,903 4371998 44,933 4261999 47,015 4902000 50,019 4212001 50,746 5062002 50,543 5652003 51,676 500 * Fetal death data were only available beginning in 1994.
Table 1 Number of live births and fetal deaths by year, five central counties of metropolitan Atlanta, 1968–2003

35
Count Percent Count Percent Count Percent Count Percent Count Percent Count Percent Count Percent Count PercentTotal 1,232,191 100.0 137,202 100.0 143,532 100.0 135,541 100.0 202,760 100.0 154,325 100.0 208,832 100.0 249,999 100.0Maternal age (years)
<25 491,355 39.9 78,224 57.0 73,143 51.0 60,535 44.7 78,616 38.8 54,662 35.4 67,334 32.2 78,841 31.525–29 352,867 28.6 37,218 27.1 44,345 30.9 42,068 31.0 63,417 31.3 44,992 29.2 55,300 26.5 65,527 26.2>30 386,904 31.4 21,742 15.8 25,383 17.7 32,871 24.3 60,599 29.9 54,616 35.4 86,117 41.2 105,576 42.2Unknown 1,065 0.1 18 0.0 661 0.5 67 0.0 128 0.1 55 0.0 81 0.0 55 0.0
Maternal race/ethnicity*White 670,150 54.4 98,496 71.8 92,965 64.8 83,024 61.3 122,593 60.5 79,415 51.5 98,060 47.0 95,597 38.2Black or African American 420,173 -- -- -- 49,088 34.2 50,566 37.3 75,764 37.4 64,215 41.6 84,293 40.4 96,247 38.5Hispanic or Latino 64,985 -- -- -- -- -- -- -- -- -- 5,906 3.8 16,587 7.9 42,492 17.0All Other Races 76,058 -- 38,706 28.2 1,479 1.0 1,918 1.4 4,355 2.1 4,728 3.1 9,596 4.6 15,276 6.1Unknown 81 0.0 -- -- -- -- 33 0.0 48 0.0 -- -- -- -- -- --
Birth weight (grams)<2500 105,498 8.6 12,059 8.8 12,341 8.6 11,721 8.6 16,264 8.0 13,379 8.7 17,882 8.6 21,852 8.7>2500 1,123,927 91.2 124,448 90.7 129,495 90.2 123,709 91.3 186,361 91.9 140,878 91.3 190,922 91.4 228,114 91.2Unknown 2,766 0.2 695 0.5 1,696 1.2 111 0.1 135 0.1 68 0.0 28 0.0 33 0.0
Gestational age (weeks)20–36 114,390 9.3 10,577 7.7 12,083 8.4 12,331 9.1 19,747 9.7 15,900 10.3 19,465 9.3 24,287 9.7>37 1,054,396 85.6 116,000 84.5 120,469 83.9 113,064 83.4 167,372 82.5 130,112 84.3 185,220 88.7 222,159 88.9Unknown 63,295 5.1 10,625 7.7 10,980 7.6 10,146 7.5 15,641 7.7 8,313 5.4 4,125 2.0 3,465 1.4
SexMale 629,847 51.1 70,191 51.2 73,831 51.4 69,444 51.2 103,904 51.2 78,794 51.1 106,516 51.0 127,167 50.9Female 602,311 48.9 67,011 48.8 69,682 48.5 66,096 48.8 98,852 48.8 75,528 48.9 102,312 49.0 122,830 49.1Ambiguous/Unknown 33 0.0 -- -- 19 0.0 <5 0.0 <5 0.0 <5 0.0 <5 0.0 <5 0.0
Parity1 Live birth 541,589 44.0 52,146 38.0 72,254 50.3 63,477 46.8 89,574 44.2 66,837 43.3 91,842 44.0 105,459 42.22 or more live births 671,253 54.5 71,973 52.5 71,278 49.7 72,064 53.2 109,484 54.0 87,050 56.4 116,183 55.6 143,221 57.3Unknown 19,349 1.6 13,083 9.5 -- -- -- -- 3,702 1.8 438 0.3 807 0.4 1,319 0.5
Gravidity1 Pregnancy 463,728 37.6 48,628 35.4 67,027 46.7 65,487 48.3 70,570 34.8 52,058 33.7 72,931 34.9 87,027 34.82 or more pregnancies 746,818 60.6 75,491 55.0 76,505 53.3 70,054 51.7 128,333 63.3 101,699 65.9 134,683 64.5 160,053 64.0Unknown 21,645 1.8 13,083 9.5 -- -- -- -- 3,857 1.9 568 0.4 1,218 0.6 2,919 1.2
PluralitySingleton 1,200,719 97.5 134,708 98.2 140,601 98.0 132,829 98.0 198,132 97.7 150,240 97.4 202,615 97.0 241,594 96.6Multiple 31,232 2.5 2,494 1.8 2,702 1.9 2,712 2.0 4,625 2.3 4,082 2.6 6,214 3.0 8,403 3.4Unknown 240 0.0 -- -- 229 0.2 -- -- <5 0.0 <5 0.0 <5 0.0 <5 0.0
PeriodCharacteristic 1984–1989 1990–1993 1994–1998 1999–2003Total 1968–1972 1973–1978 1979–1983
* Black or African American race is included in the All Other Races category for 1968-1972. Data on Hispanic or Latino ethnicity were available beginning in 1990. Therefore, percentages of the total are not calculated for these subgroups.
Race/ethnicity data for 1990-2003 were obtained from a vital records file with slightly fewer live births than that used for the other strata. Therefore, the sums of the race/ethnicity strata do not equal the total number of live births in the corre-sponding column.
Table 2 Number of live births stratified by descriptive characteristics, five central counties of metropolitan Atlanta, 1968–2003

36
Cases Prev* Cases Prev Cases Prev Cases Prev Cases Prev Cases Prev Cases Prev Cases PrevAll defects 32938 267.31 543 205.18 566 206.22 642 216.26 600 214.01 521 203.78 624 248.10 625 252.27Spina bifida 706 5.73 38 14.36 34 12.39 41 13.81 35 12.48 33 12.91 23 9.14 23 9.28Conotrucal heart defects‡ 849 9.74Dextrotransposition of the great arteries‡ 211 2.42Tetralogy of Fallot‡ 399 4.58Atrioventricular septal defect‡ 326 3.74Coarctation of the aorta‡ 338 3.88Atrial septal defect‡ 730 8.37Ventricular septal defect‡ 2490 28.56Perimembranous ventricular septal defect‡ 707 8.11Cleft lip with or without cleft palate 1177 9.55 28 10.58 24 8.74 36 12.13 26 9.27 37 14.47 25 9.94 33 13.32Cleft palate alone 672 5.45 8 3.02 10 3.64 15 5.05 24 8.56 15 5.87 14 5.57 18 7.27Pyloric stenosis 1,656 13.44 20 7.56 34 12.39 36 12.13 29 10.34 36 14.08 40 15.90 47 18.97Anal or rectal atresia or stenosis 457 3.71 9 3.40 12 4.37 18 6.06 12 4.28 7 2.74 8 3.18 13 5.25Hypospadias 3,730 30.27 44 16.63 50 18.22 63 21.22 62 22.11 52 20.34 70 27.83 65 26.24Congenital dislocation or dysplasia of the hip 959 7.78 19 7.18 20 7.29 24 8.08 20 7.13 14 5.48 30 11.93 26 10.49Clubfoot without a neural tube defect 2,099 17.03 70 26.45 65 23.68 92 30.99 64 22.83 53 20.73 70 27.83 69 27.85Polydactyly 1,913 15.53 28 10.58 38 13.84 22 7.41 34 12.13 33 12.91 28 11.13 24 9.69Transverse limb deficiency 377 3.06 12 4.53 12 4.37 13 4.38 11 3.92 6 2.35 9 3.58 10 4.04
1974Year
19711970 1972 1973Birth defect Total 1968 1969
* Prev = Prevalence. ‡ Numbers of cases and prevalence estimates are not provided for congenital heart defects prior to 1982 because not all of these cases have been reviewed by pediatric cardiologists.
Table 3 Annual prevalence (per 10,000 live births) of selected birth defects, MACDP, 1968-2003
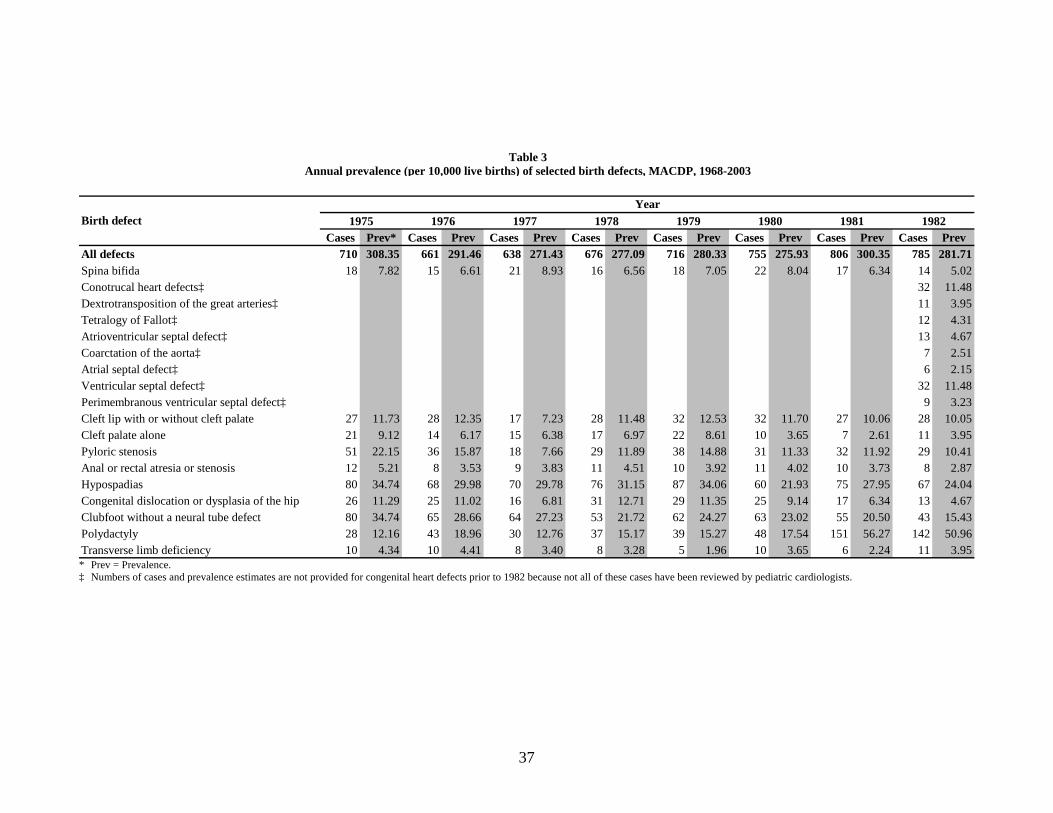
37
Cases Prev* Cases Prev Cases Prev Cases Prev Cases Prev Cases Prev Cases Prev Cases PrevAll defects 710 308.35 661 291.46 638 271.43 676 277.09 716 280.33 755 275.93 806 300.35 785 281.71Spina bifida 18 7.82 15 6.61 21 8.93 16 6.56 18 7.05 22 8.04 17 6.34 14 5.02Conotrucal heart defects‡ 32 11.48Dextrotransposition of the great arteries‡ 11 3.95Tetralogy of Fallot‡ 12 4.31Atrioventricular septal defect‡ 13 4.67Coarctation of the aorta‡ 7 2.51Atrial septal defect‡ 6 2.15Ventricular septal defect‡ 32 11.48Perimembranous ventricular septal defect‡ 9 3.23Cleft lip with or without cleft palate 27 11.73 28 12.35 17 7.23 28 11.48 32 12.53 32 11.70 27 10.06 28 10.05Cleft palate alone 21 9.12 14 6.17 15 6.38 17 6.97 22 8.61 10 3.65 7 2.61 11 3.95Pyloric stenosis 51 22.15 36 15.87 18 7.66 29 11.89 38 14.88 31 11.33 32 11.92 29 10.41Anal or rectal atresia or stenosis 12 5.21 8 3.53 9 3.83 11 4.51 10 3.92 11 4.02 10 3.73 8 2.87Hypospadias 80 34.74 68 29.98 70 29.78 76 31.15 87 34.06 60 21.93 75 27.95 67 24.04Congenital dislocation or dysplasia of the hip 26 11.29 25 11.02 16 6.81 31 12.71 29 11.35 25 9.14 17 6.34 13 4.67Clubfoot without a neural tube defect 80 34.74 65 28.66 64 27.23 53 21.72 62 24.27 63 23.02 55 20.50 43 15.43Polydactyly 28 12.16 43 18.96 30 12.76 37 15.17 39 15.27 48 17.54 151 56.27 142 50.96Transverse limb deficiency 10 4.34 10 4.41 8 3.40 8 3.28 5 1.96 10 3.65 6 2.24 11 3.95
1982Year
19791978 1980 1981Birth defect 1975 1976 1977
* Prev = Prevalence. ‡ Numbers of cases and prevalence estimates are not provided for congenital heart defects prior to 1982 because not all of these cases have been reviewed by pediatric cardiologists.
Table 3 Annual prevalence (per 10,000 live births) of selected birth defects, MACDP, 1968-2003
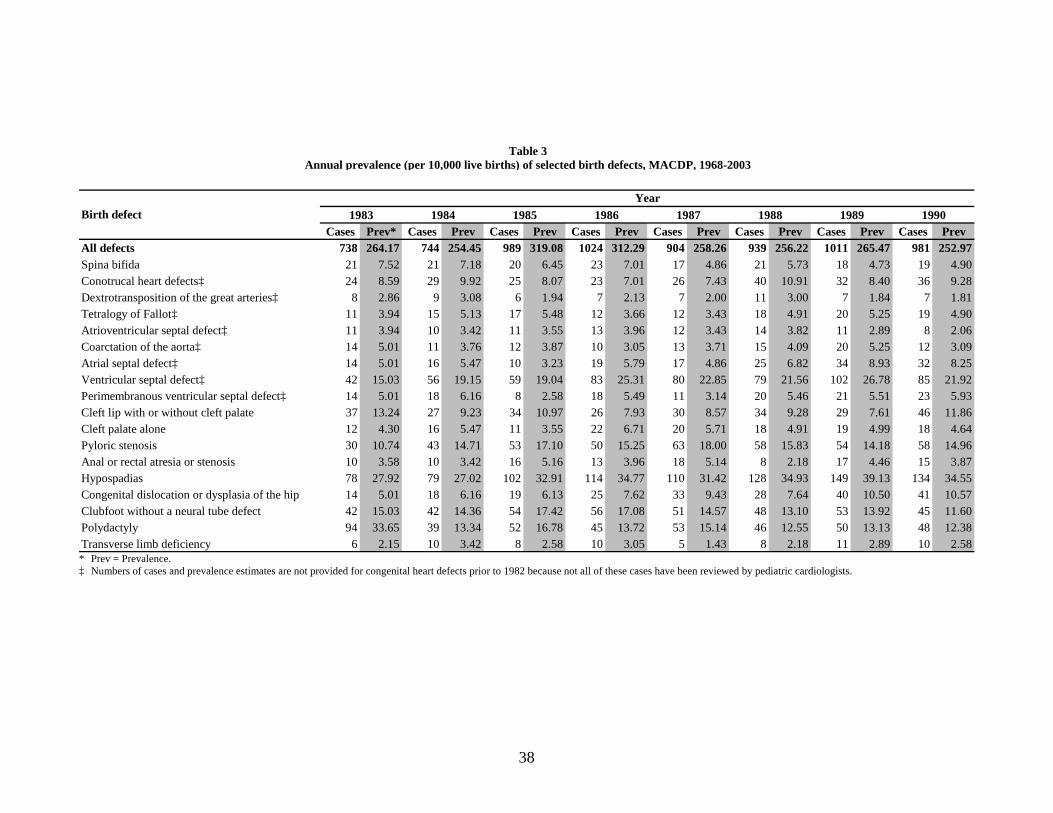
38
Cases Prev* Cases Prev Cases Prev Cases Prev Cases Prev Cases Prev Cases Prev Cases PrevAll defects 738 264.17 744 254.45 989 319.08 1024 312.29 904 258.26 939 256.22 1011 265.47 981 252.97Spina bifida 21 7.52 21 7.18 20 6.45 23 7.01 17 4.86 21 5.73 18 4.73 19 4.90Conotrucal heart defects‡ 24 8.59 29 9.92 25 8.07 23 7.01 26 7.43 40 10.91 32 8.40 36 9.28Dextrotransposition of the great arteries‡ 8 2.86 9 3.08 6 1.94 7 2.13 7 2.00 11 3.00 7 1.84 7 1.81Tetralogy of Fallot‡ 11 3.94 15 5.13 17 5.48 12 3.66 12 3.43 18 4.91 20 5.25 19 4.90Atrioventricular septal defect‡ 11 3.94 10 3.42 11 3.55 13 3.96 12 3.43 14 3.82 11 2.89 8 2.06Coarctation of the aorta‡ 14 5.01 11 3.76 12 3.87 10 3.05 13 3.71 15 4.09 20 5.25 12 3.09Atrial septal defect‡ 14 5.01 16 5.47 10 3.23 19 5.79 17 4.86 25 6.82 34 8.93 32 8.25Ventricular septal defect‡ 42 15.03 56 19.15 59 19.04 83 25.31 80 22.85 79 21.56 102 26.78 85 21.92Perimembranous ventricular septal defect‡ 14 5.01 18 6.16 8 2.58 18 5.49 11 3.14 20 5.46 21 5.51 23 5.93Cleft lip with or without cleft palate 37 13.24 27 9.23 34 10.97 26 7.93 30 8.57 34 9.28 29 7.61 46 11.86Cleft palate alone 12 4.30 16 5.47 11 3.55 22 6.71 20 5.71 18 4.91 19 4.99 18 4.64Pyloric stenosis 30 10.74 43 14.71 53 17.10 50 15.25 63 18.00 58 15.83 54 14.18 58 14.96Anal or rectal atresia or stenosis 10 3.58 10 3.42 16 5.16 13 3.96 18 5.14 8 2.18 17 4.46 15 3.87Hypospadias 78 27.92 79 27.02 102 32.91 114 34.77 110 31.42 128 34.93 149 39.13 134 34.55Congenital dislocation or dysplasia of the hip 14 5.01 18 6.16 19 6.13 25 7.62 33 9.43 28 7.64 40 10.50 41 10.57Clubfoot without a neural tube defect 42 15.03 42 14.36 54 17.42 56 17.08 51 14.57 48 13.10 53 13.92 45 11.60Polydactyly 94 33.65 39 13.34 52 16.78 45 13.72 53 15.14 46 12.55 50 13.13 48 12.38Transverse limb deficiency 6 2.15 10 3.42 8 2.58 10 3.05 5 1.43 8 2.18 11 2.89 10 2.58
1990Year
19871986 1988 1989Birth defect 1983 1984 1985
* Prev = Prevalence. ‡ Numbers of cases and prevalence estimates are not provided for congenital heart defects prior to 1982 because not all of these cases have been reviewed by pediatric cardiologists.
Table 3 Annual prevalence (per 10,000 live births) of selected birth defects, MACDP, 1968-2003

39
Cases Prev* Cases Prev Cases Prev Cases Prev Cases Prev Cases Prev Cases Prev Cases PrevAll defects 995 260.18 953 249.38 965 246.88 1070 268.59 1165 289.38 1188 290.46 1144 266.65 1315 292.66Spina bifida 12 3.14 14 3.66 12 3.07 19 4.77 7 1.74 12 2.93 17 3.96 21 4.67Conotrucal heart defects‡ 29 7.58 37 9.68 41 10.49 39 9.79 44 10.93 47 11.49 31 7.23 42 9.35Dextrotransposition of the great arteries‡ 9 2.35 10 2.62 8 2.05 12 3.01 15 3.73 9 2.20 6 1.40 7 1.56Tetralogy of Fallot‡ 17 4.45 16 4.19 19 4.86 14 3.51 18 4.47 23 5.62 17 3.96 21 4.67Atrioventricular septal defect‡ 18 4.71 12 3.14 10 2.56 15 3.77 19 4.72 24 5.87 12 2.80 17 3.78Coarctation of the aorta‡ 14 3.66 9 2.36 8 2.05 19 4.77 24 5.96 16 3.91 14 3.26 19 4.23Atrial septal defect‡ 33 8.63 23 6.02 36 9.21 28 7.03 43 10.68 28 6.85 38 8.86 34 7.57Ventricular septal defect‡ 99 25.89 90 23.55 85 21.75 120 30.12 120 29.81 119 29.10 129 30.07 139 30.93Perimembranous ventricular septal defect‡ 22 5.75 29 7.59 28 7.16 51 12.80 43 10.68 36 8.80 42 9.79 36 8.01Cleft lip with or without cleft palate 30 7.84 35 9.16 31 7.93 37 9.29 43 10.68 37 9.05 29 6.76 46 10.24Cleft palate alone 18 4.71 24 6.28 15 3.84 16 4.02 24 5.96 27 6.60 14 3.26 25 5.56Pyloric stenosis 62 16.21 55 14.39 49 12.54 38 9.54 62 15.40 60 14.67 63 14.68 58 12.91Anal or rectal atresia or stenosis 13 3.40 7 1.83 19 4.86 16 4.02 12 2.98 9 2.20 19 4.43 20 4.45Hypospadias 120 31.38 108 28.26 121 30.96 135 33.89 153 38.00 142 34.72 140 32.63 135 30.04Congenital dislocation or dysplasia of the hip 57 14.90 37 9.68 26 6.65 29 7.28 33 8.20 20 4.89 28 6.53 30 6.68Clubfoot without a neural tube defect 53 13.86 52 13.61 52 13.30 68 17.07 57 14.16 57 13.94 54 12.59 69 15.36Polydactyly 50 13.07 31 8.11 38 9.72 62 15.56 60 14.90 55 13.45 53 12.35 64 14.24Transverse limb deficiency 10 2.61 17 4.45 11 2.81 11 2.76 18 4.47 16 3.91 11 2.56 11 2.45
1998Year
19951994 1996 1997Birth defect 1991 1992 1993
* Prev = Prevalence. ‡ Numbers of cases and prevalence estimates are not provided for congenital heart defects prior to 1982 because not all of these cases have been reviewed by pediatric cardiologists.
Table 3 Annual prevalence (per 10,000 live births) of selected birth defects, MACDP, 1968-2003

40
Cases Prev* Cases Prev Cases Prev Cases Prev Cases PrevAll defects 1362 289.69 1385 276.89 1418 279.43 1473 291.44 1307 252.92Spina bifida 5 1.06 10 2.00 14 2.76 19 3.76 16 3.10Conotrucal heart defects‡ 45 9.57 55 11.00 62 12.22 63 12.46 47 9.10Dextrotransposition of the great arteries‡ 9 1.91 15 3.00 14 2.76 13 2.57 11 2.13Tetralogy of Fallot‡ 19 4.04 24 4.80 20 3.94 35 6.92 20 3.87Atrioventricular septal defect‡ 20 4.25 19 3.80 18 3.55 18 3.56 21 4.06Coarctation of the aorta‡ 21 4.47 17 3.40 20 3.94 23 4.55 20 3.87Atrial septal defect‡ 53 11.27 51 10.20 59 11.63 61 12.07 70 13.55Ventricular septal defect‡ 171 36.37 173 34.59 194 38.23 199 39.37 234 45.28Perimembranous ventricular septal defect‡ 54 11.49 48 9.60 68 13.40 52 10.29 56 10.84Cleft lip with or without cleft palate 39 8.30 42 8.40 36 7.09 45 8.90 36 6.97Cleft palate alone 33 7.02 41 8.20 32 6.31 25 4.95 21 4.06Pyloric stenosis 57 12.12 61 12.20 76 14.98 57 11.28 43 8.32Anal or rectal atresia or stenosis 13 2.77 19 3.80 18 3.55 16 3.17 11 2.13Hypospadias 174 37.01 159 31.79 143 28.18 180 35.61 137 26.51Congenital dislocation or dysplasia of the hip 19 4.04 30 6.00 33 6.50 31 6.13 33 6.39Clubfoot without a neural tube defect 68 14.46 46 9.20 55 10.84 58 11.48 51 9.87Polydactyly 68 14.46 63 12.60 80 15.76 78 15.43 59 11.42Transverse limb deficiency 6 1.28 18 3.60 18 3.55 11 2.18 10 1.94
Year20032002Birth defect 1999 2000 2001
* Prev = Prevalence. ‡ Numbers of cases and prevalence estimates are not provided for congenital heart defects prior to 1982 because not all of these cases have been reviewed by pediatric cardiologists.
Table 3 Annual prevalence (per 10,000 live births) of selected birth defects, MACDP, 1968-2003

41
Cases Prev* Cases Prev Cases Prev Cases Prev Cases Prev Cases Prev Cases PrevAnencephalus 446 3.62 81 9.69 64 8.13 35 4.97 42 5.72 33 4.02 31 3.52Encephalocele 190 1.54 14 1.67 12 1.52 11 1.56 17 2.31 24 2.92 18 2.04Hydrocephalus† 256 4.77Congenital cataract 265 2.15 6 0.72 8 1.02 16 2.27 37 5.04 21 2.56 17 1.93Complete atrioventricular septal defect‡ 196 2.32 22 2.5Valvar pulmonary stenosis‡ 353 4.18 26 2.95Hypoplastic left heart syndrome‡ 212 2.51 22 2.5Aortic stenosis‡ 93 1.10 9 1.02Secundum atrial septal defect‡ 499 5.91 21 2.38Muscular ventricular septal defect‡ 1167 13.83 6 0.68Single ventricle‡ 79 0.94 6 0.68Partial and total anomalous pulmonary venous return‡ 72 0.85 7 0.79Esophageal atresia or stenosis 266 2.16 17 2.03 15 1.9 18 2.55 14 1.91 25 3.05 23 2.61Duodenal atresia or stenosis 199 1.62 11 1.32 8 1.02 12 1.7 7 0.95 15 1.83 14 1.59Jejunal and/or ileal atresia or stenosis 201 1.63 12 1.44 13 1.65 12 1.7 8 1.09 14 1.71 14 1.59Hirschsprung disease 227 1.84 7 0.84 5 0.63 13 1.84 11 1.5 16 1.95 14 1.59Bilateral renal agenesis or dysgenesis 169 1.37 8 0.96 10 1.27 11 1.56 16 2.18 13 1.58 19 2.15Any cystic kidney disease 507 4.11 19 2.27 19 2.41 18 2.55 15 2.04 19 2.32 39 4.42Craniosynostosis 481 3.9 18 2.15 18 2.29 31 4.4 31 4.22 26 3.17 24 2.72Skeletal dysplasia 226 1.83 15 1.79 6 0.76 9 1.28 9 1.23 19 2.32 14 1.59Diaphragmatic hernia 280 2.27 18 2.15 15 1.9 19 2.7 12 1.63 17 2.07 11 1.25Omphalocele 337 2.73 25 2.99 32 4.06 30 4.26 26 3.54 31 3.78 25 2.84Gastroschisis 244 1.98 6 0.72 8 1.02 6 0.85 17 2.31 13 1.58 15 1.7Down syndrome, maternal age 35 years or older 419 3.4 19 2.27 19 2.41 11 1.56 10 1.36 14 1.71 12 1.36Down syndrome, maternal age younger than 35 years 874 7.09 44 5.26 65 8.25 48 6.81 43 5.85 68 8.29 70 7.94Any autosomal trisomy, maternal age 35 years or older 528 4.29 20 2.39 23 2.92 13 1.84 13 1.77 15 1.83 19 2.15Any autosomal trisomy, maternal age younger than 35 years 1156 9.38 58 6.94 71 9.02 59 8.37 51 6.94 83 10.11 96 10.89
1983–1985Three-year period
Birth defect 1977–1979 1980–1982Total 1968–1970 1971–1973 1974–1976
* Prev = Prevalence. † Numbers of cases and prevalence estimates are not provided for hydrocephalus prior to 1992 because a specific definition for this defect was not applied to all cases prior to that time. ‡ Numbers of cases and prevalence estimates are not provided for congenital heart defects prior to 1983 because not all of these cases have been reviewed by pediatric cardiologists.
Table 4 Three-year prevalence (per 10,000 live births) of selected birth defects, MACDP, 1968-2003
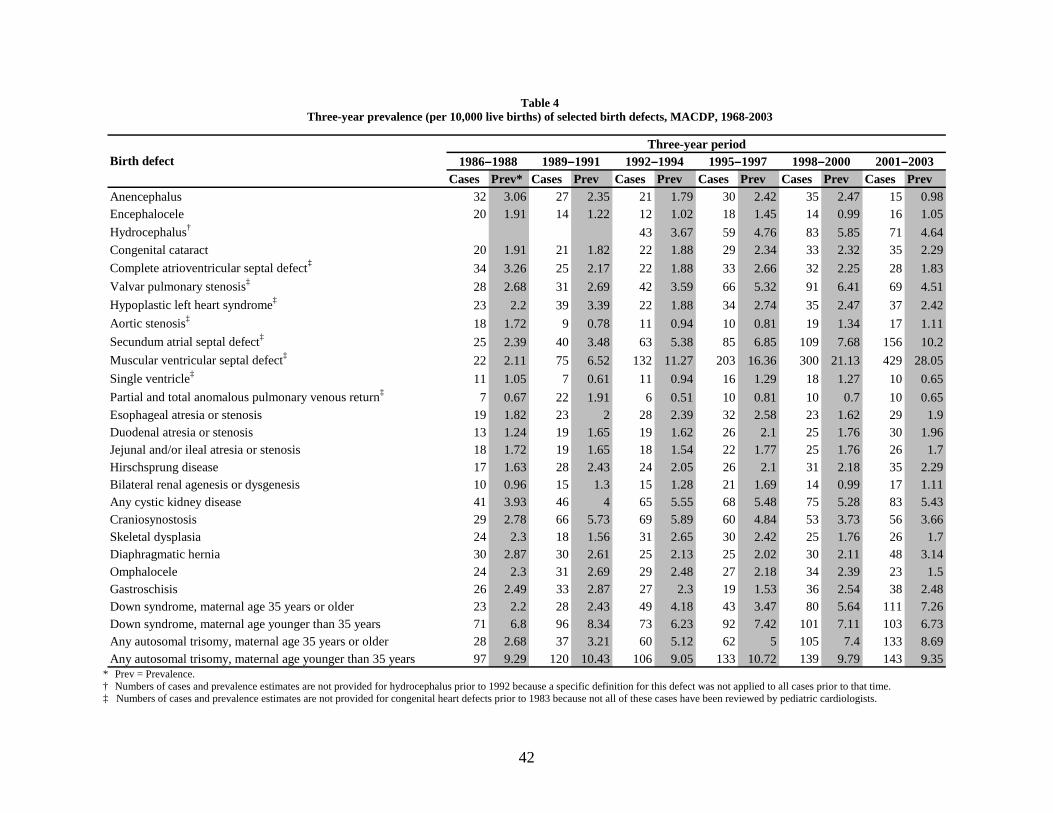
42
Cases Prev* Cases Prev Cases Prev Cases Prev Cases Prev Cases PrevAnencephalus 32 3.06 27 2.35 21 1.79 30 2.42 35 2.47 15 0.98Encephalocele 20 1.91 14 1.22 12 1.02 18 1.45 14 0.99 16 1.05Hydrocephalus† 43 3.67 59 4.76 83 5.85 71 4.64Congenital cataract 20 1.91 21 1.82 22 1.88 29 2.34 33 2.32 35 2.29Complete atrioventricular septal defect‡ 34 3.26 25 2.17 22 1.88 33 2.66 32 2.25 28 1.83Valvar pulmonary stenosis‡ 28 2.68 31 2.69 42 3.59 66 5.32 91 6.41 69 4.51Hypoplastic left heart syndrome‡ 23 2.2 39 3.39 22 1.88 34 2.74 35 2.47 37 2.42Aortic stenosis‡ 18 1.72 9 0.78 11 0.94 10 0.81 19 1.34 17 1.11Secundum atrial septal defect‡ 25 2.39 40 3.48 63 5.38 85 6.85 109 7.68 156 10.2Muscular ventricular septal defect‡ 22 2.11 75 6.52 132 11.27 203 16.36 300 21.13 429 28.05Single ventricle‡ 11 1.05 7 0.61 11 0.94 16 1.29 18 1.27 10 0.65Partial and total anomalous pulmonary venous return‡ 7 0.67 22 1.91 6 0.51 10 0.81 10 0.7 10 0.65Esophageal atresia or stenosis 19 1.82 23 2 28 2.39 32 2.58 23 1.62 29 1.9Duodenal atresia or stenosis 13 1.24 19 1.65 19 1.62 26 2.1 25 1.76 30 1.96Jejunal and/or ileal atresia or stenosis 18 1.72 19 1.65 18 1.54 22 1.77 25 1.76 26 1.7Hirschsprung disease 17 1.63 28 2.43 24 2.05 26 2.1 31 2.18 35 2.29Bilateral renal agenesis or dysgenesis 10 0.96 15 1.3 15 1.28 21 1.69 14 0.99 17 1.11Any cystic kidney disease 41 3.93 46 4 65 5.55 68 5.48 75 5.28 83 5.43Craniosynostosis 29 2.78 66 5.73 69 5.89 60 4.84 53 3.73 56 3.66Skeletal dysplasia 24 2.3 18 1.56 31 2.65 30 2.42 25 1.76 26 1.7Diaphragmatic hernia 30 2.87 30 2.61 25 2.13 25 2.02 30 2.11 48 3.14Omphalocele 24 2.3 31 2.69 29 2.48 27 2.18 34 2.39 23 1.5Gastroschisis 26 2.49 33 2.87 27 2.3 19 1.53 36 2.54 38 2.48Down syndrome, maternal age 35 years or older 23 2.2 28 2.43 49 4.18 43 3.47 80 5.64 111 7.26Down syndrome, maternal age younger than 35 years 71 6.8 96 8.34 73 6.23 92 7.42 101 7.11 103 6.73Any autosomal trisomy, maternal age 35 years or older 28 2.68 37 3.21 60 5.12 62 5 105 7.4 133 8.69Any autosomal trisomy, maternal age younger than 35 years 97 9.29 120 10.43 106 9.05 133 10.72 139 9.79 143 9.35
Birth defectThree-year period
1998–2000 2001–20031986–1988 1989–1991 1992–1994 1995–1997
* Prev = Prevalence. † Numbers of cases and prevalence estimates are not provided for hydrocephalus prior to 1992 because a specific definition for this defect was not applied to all cases prior to that time. ‡ Numbers of cases and prevalence estimates are not provided for congenital heart defects prior to 1983 because not all of these cases have been reviewed by pediatric cardiologists.
Table 4 Three-year prevalence (per 10,000 live births) of selected birth defects, MACDP, 1968-2003

43
Cases PrevalenceAnophthalmia 62 0.50Truncus arteriosus‡ 48 0.55Pulmonary atresia‡ 41 0.47Levotransposition of the great arteries‡ 29 0.33Vascular ring‡ 89 1.02Ebstein anomaly‡ 45 0.52Choanal atresia or stenosis 152 1.23Large intestinal atresia or stenosis 25 0.20Biliary atresia 98 0.80Exstrophy of the bladder 19 0.15Posterior urethral valves 137 1.11Intercalary limb deficiency 40 0.32Longitudinal limb deficiency 176 1.43Split-hand and/or split-foot malformation 49 0.40Other and unspecified limb deficiency 26 0.21Urethral obstruction sequence 50 0.41Trisomy 13, maternal age 35 years or older 27 0.22Trisomy 13, maternal age younger than 35 years 104 0.84Trisomy 18, maternal age 35 years or older 71 0.58Trisomy 18, maternal age younger than 35 years 150 1.22Turner syndrome 110 0.89Conjoined twins 15 0.12
TotalBirth defect
‡ Numbers of cases and prevalence estimates are not provided for congenital heart defects prior to 1982 because not all of these cases have been reviewed by pediatric cardiologists.
Table 5 Total prevalence (per 10,000 live births) of selected birth defects, MACDP, 1968-2003

44
0
50
100
150
200
250
300
350
1968-1970 1971-1973 1974-1976 1977-1979 1980-1982 1983-1985 1986-1988 1989-1991 1992-1994 1995-1997 1998-2000 2001-2003
Year
Prev
alen
ce p
er 1
0,00
0 liv
e bi
rths
0
1
2
3
4
5
6
7
8
9
10
1968-1970 1971-1973 1974-1976 1977-1979 1980-1982 1983-1985 1986-1988 1989-1991 1992-1994 1995-1997 1998-2000 2001-2003
Year
Prev
alen
ce p
er 1
0,00
0 liv
e bi
rths
Figure 1. All defects: Three-year prevalence, MACDP, 1968–2003
Figure 2. Anencephalus: Three-year prevalence, MACDP, 1968–2003
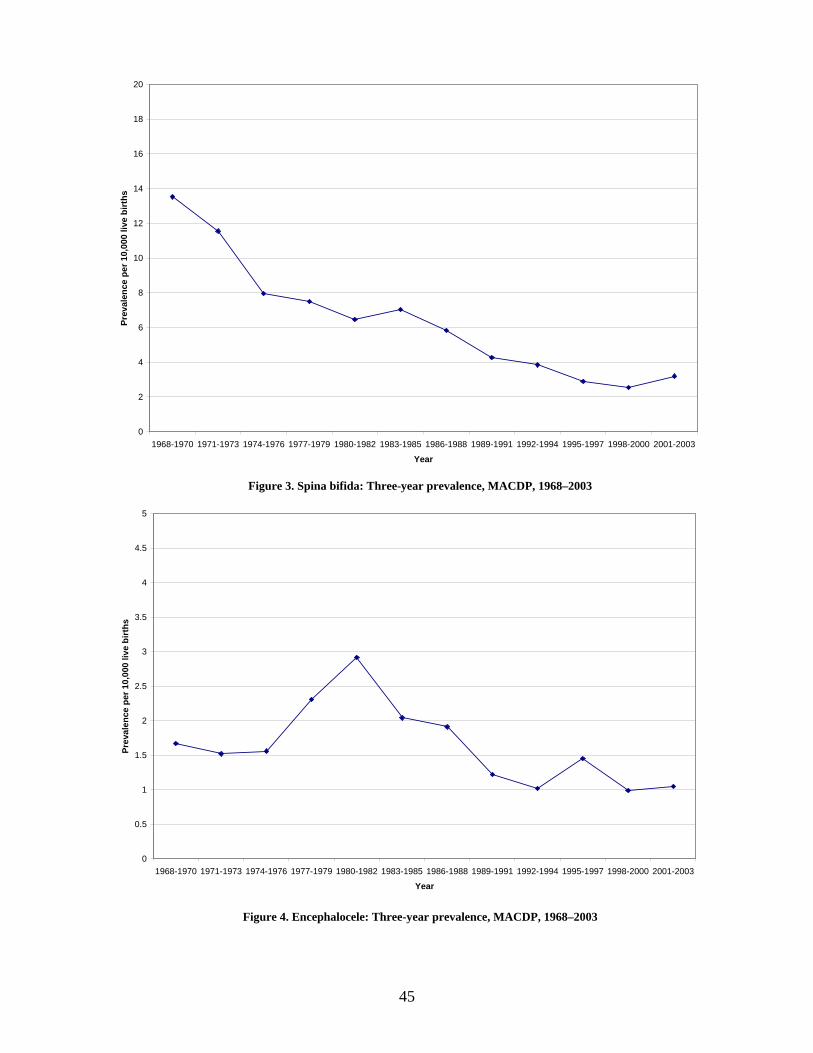
45
0
2
4
6
8
10
12
14
16
18
20
1968-1970 1971-1973 1974-1976 1977-1979 1980-1982 1983-1985 1986-1988 1989-1991 1992-1994 1995-1997 1998-2000 2001-2003
Year
Prev
alen
ce p
er 1
0,00
0 liv
e bi
rths
0
0.5
1
1.5
2
2.5
3
3.5
4
4.5
5
1968-1970 1971-1973 1974-1976 1977-1979 1980-1982 1983-1985 1986-1988 1989-1991 1992-1994 1995-1997 1998-2000 2001-2003
Year
Prev
alen
ce p
er 1
0,00
0 liv
e bi
rths
Figure 3. Spina bifida: Three-year prevalence, MACDP, 1968–2003
Figure 4. Encephalocele: Three-year prevalence, MACDP, 1968–2003

46
0
1
2
3
4
5
6
7
1968-1970 1971-1973 1974-1976 1977-1979 1980-1982 1983-1985 1986-1988 1989-1991 1992-1994 1995-1997 1998-2000 2001-2003
Year
Prev
alen
ce p
er 1
0,00
0 liv
e bi
rths
0
1
2
3
4
5
6
7
8
9
10
1968-1970 1971-1973 1974-1976 1977-1979 1980-1982 1983-1985 1986-1988 1989-1991 1992-1994 1995-1997 1998-2000 2001-2003
Year
Prev
alen
ce p
er 1
0,00
0 liv
e bi
rths
* Prevalence estimates are not provided for hydrocephalus prior to 1990 because a specific definition for this defect was not applied to all cases prior to that time.
Figure 5. Hydrocephalus: Three-year prevalence, MACDP, 1990–2003*
Figure 6. Congenital cataract: Three-year prevalence, MACDP, 1968–2003
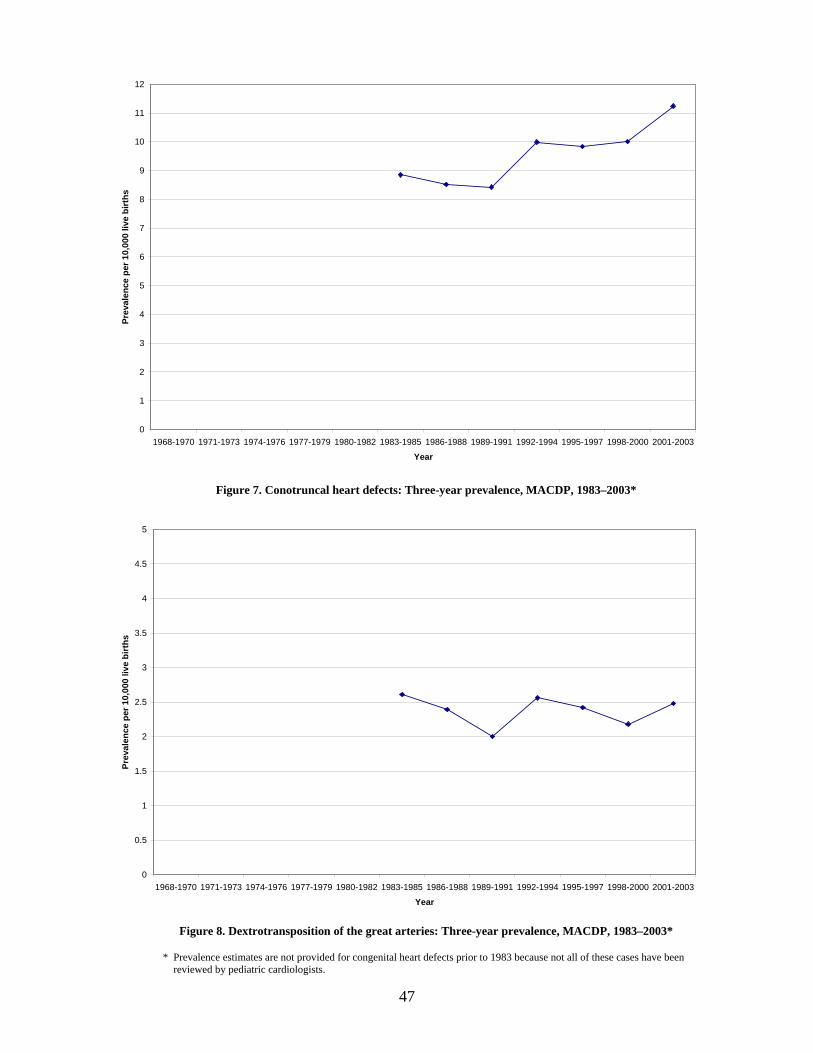
47
0
1
2
3
4
5
6
7
8
9
10
11
12
1968-1970 1971-1973 1974-1976 1977-1979 1980-1982 1983-1985 1986-1988 1989-1991 1992-1994 1995-1997 1998-2000 2001-2003
Year
Prev
alen
ce p
er 1
0,00
0 liv
e bi
rths
0
0.5
1
1.5
2
2.5
3
3.5
4
4.5
5
1968-1970 1971-1973 1974-1976 1977-1979 1980-1982 1983-1985 1986-1988 1989-1991 1992-1994 1995-1997 1998-2000 2001-2003
Year
Prev
alen
ce p
er 1
0,00
0 liv
e bi
rths
* Prevalence estimates are not provided for congenital heart defects prior to 1983 because not all of these cases have been reviewed by pediatric cardiologists.
Figure 7. Conotruncal heart defects: Three-year prevalence, MACDP, 1983–2003*
Figure 8. Dextrotransposition of the great arteries: Three-year prevalence, MACDP, 1983–2003*
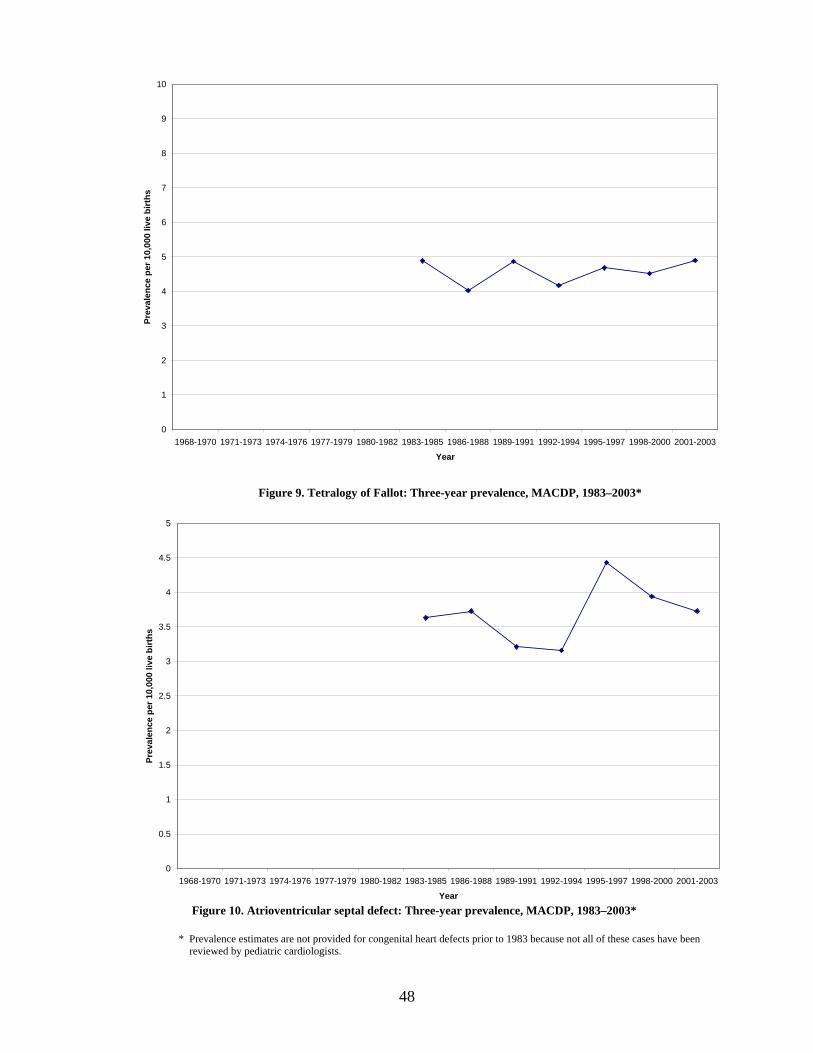
48
0
1
2
3
4
5
6
7
8
9
10
1968-1970 1971-1973 1974-1976 1977-1979 1980-1982 1983-1985 1986-1988 1989-1991 1992-1994 1995-1997 1998-2000 2001-2003
Year
Prev
alen
ce p
er 1
0,00
0 liv
e bi
rths
0
0.5
1
1.5
2
2.5
3
3.5
4
4.5
5
1968-1970 1971-1973 1974-1976 1977-1979 1980-1982 1983-1985 1986-1988 1989-1991 1992-1994 1995-1997 1998-2000 2001-2003
Year
Prev
alen
ce p
er 1
0,00
0 liv
e bi
rths
* Prevalence estimates are not provided for congenital heart defects prior to 1983 because not all of these cases have been reviewed by pediatric cardiologists.
Figure 9. Tetralogy of Fallot: Three-year prevalence, MACDP, 1983–2003*
Figure 10. Atrioventricular septal defect: Three-year prevalence, MACDP, 1983–2003*
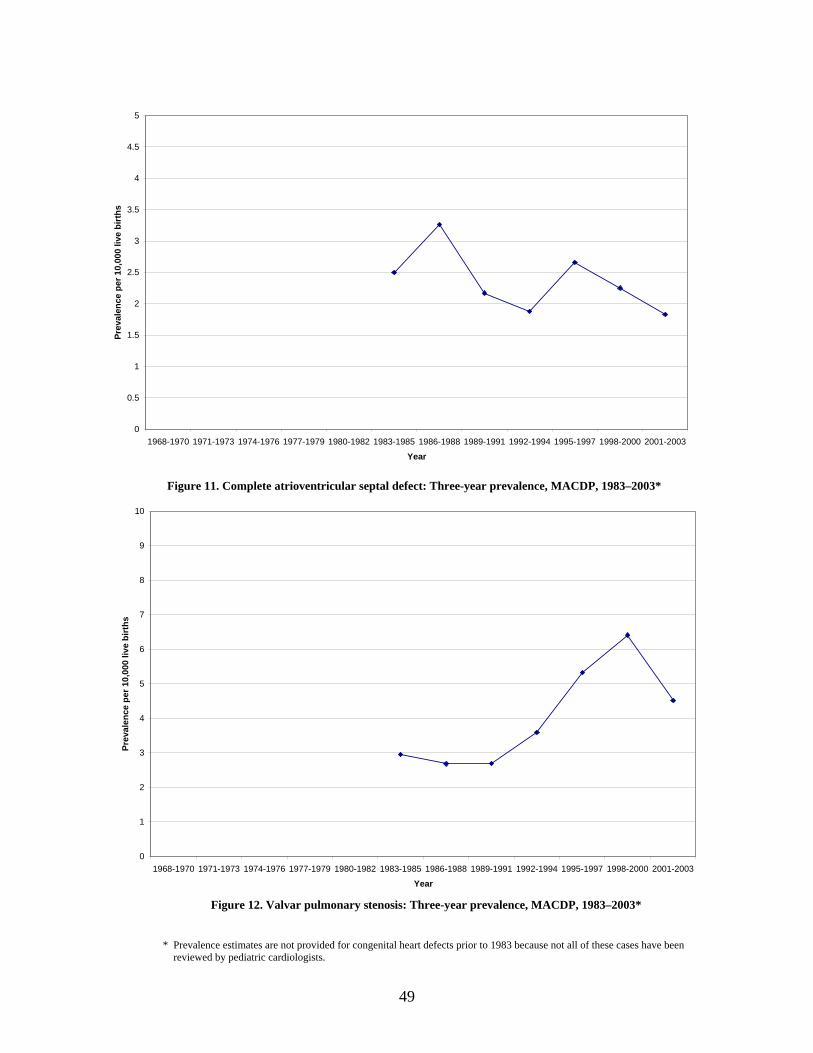
49
0
0.5
1
1.5
2
2.5
3
3.5
4
4.5
5
1968-1970 1971-1973 1974-1976 1977-1979 1980-1982 1983-1985 1986-1988 1989-1991 1992-1994 1995-1997 1998-2000 2001-2003
Year
Prev
alen
ce p
er 1
0,00
0 liv
e bi
rths
0
1
2
3
4
5
6
7
8
9
10
1968-1970 1971-1973 1974-1976 1977-1979 1980-1982 1983-1985 1986-1988 1989-1991 1992-1994 1995-1997 1998-2000 2001-2003
Year
Prev
alen
ce p
er 1
0,00
0 liv
e bi
rths
* Prevalence estimates are not provided for congenital heart defects prior to 1983 because not all of these cases have been reviewed by pediatric cardiologists.
Figure 11. Complete atrioventricular septal defect: Three-year prevalence, MACDP, 1983–2003*
Figure 12. Valvar pulmonary stenosis: Three-year prevalence, MACDP, 1983–2003*
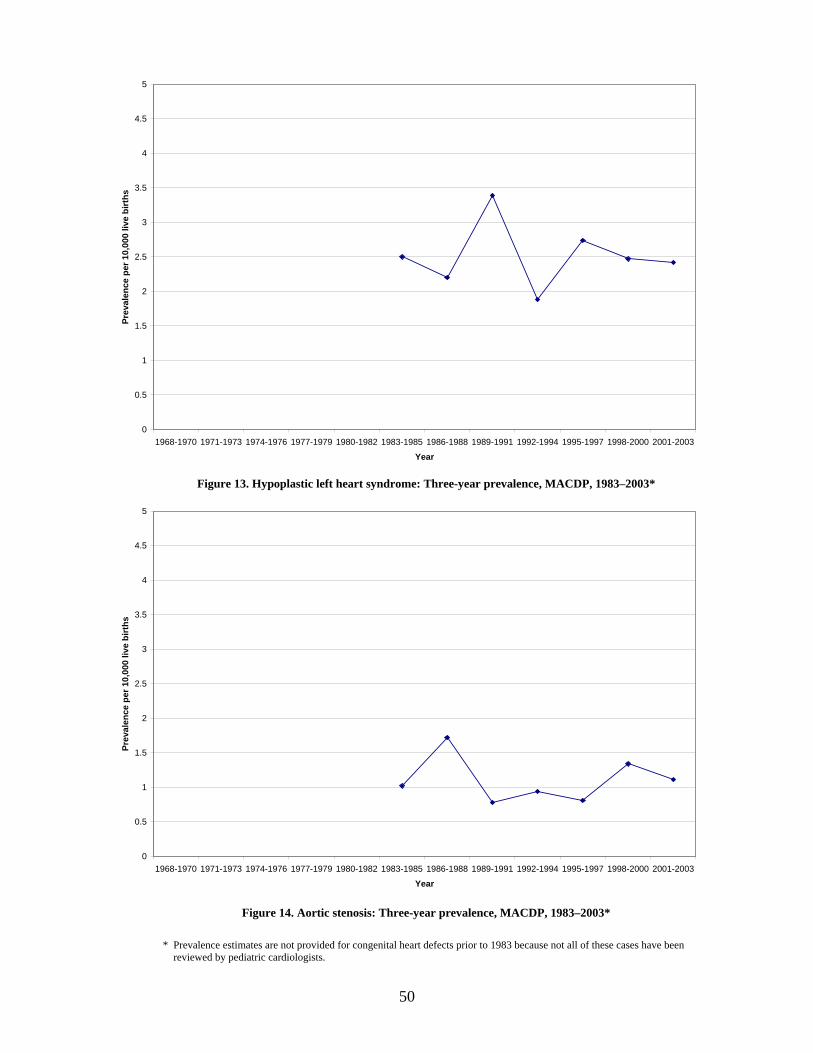
50
0
0.5
1
1.5
2
2.5
3
3.5
4
4.5
5
1968-1970 1971-1973 1974-1976 1977-1979 1980-1982 1983-1985 1986-1988 1989-1991 1992-1994 1995-1997 1998-2000 2001-2003
Year
Prev
alen
ce p
er 1
0,00
0 liv
e bi
rths
0
0.5
1
1.5
2
2.5
3
3.5
4
4.5
5
1968-1970 1971-1973 1974-1976 1977-1979 1980-1982 1983-1985 1986-1988 1989-1991 1992-1994 1995-1997 1998-2000 2001-2003
Year
Prev
alen
ce p
er 1
0,00
0 liv
e bi
rths
* Prevalence estimates are not provided for congenital heart defects prior to 1983 because not all of these cases have been reviewed by pediatric cardiologists.
Figure 13. Hypoplastic left heart syndrome: Three-year prevalence, MACDP, 1983–2003*
Figure 14. Aortic stenosis: Three-year prevalence, MACDP, 1983–2003*

51
0
0.5
1
1.5
2
2.5
3
3.5
4
4.5
5
1968-1970 1971-1973 1974-1976 1977-1979 1980-1982 1983-1985 1986-1988 1989-1991 1992-1994 1995-1997 1998-2000 2001-2003
Year
Prev
alen
ce p
er 1
0,00
0 liv
e bi
rths
0
2
4
6
8
10
12
14
16
18
20
1968-1970 1971-1973 1974-1976 1977-1979 1980-1982 1983-1985 1986-1988 1989-1991 1992-1994 1995-1997 1998-2000 2001-2003
Year
Prev
alen
ce p
er 1
0,00
0 liv
e bi
rths
* Prevalence estimates are not provided for congenital heart defects prior to 1983 because not all of these cases have been reviewed by pediatric cardiologists.
Figure 15. Coarctation of the aorta: Three-year prevalence, MACDP, 1983–2003*
Figure 16. Atrial septal defect: Three-year prevalence, MACDP, 1983–2003*

52
0
1
2
3
4
5
6
7
8
9
10
11
12
1968-1970 1971-1973 1974-1976 1977-1979 1980-1982 1983-1985 1986-1988 1989-1991 1992-1994 1995-1997 1998-2000 2001-2003
Year
Prev
alen
ce p
er 1
0,00
0 liv
e bi
rths
0
5
10
15
20
25
30
35
40
45
50
1968-1970 1971-1973 1974-1976 1977-1979 1980-1982 1983-1985 1986-1988 1989-1991 1992-1994 1995-1997 1998-2000 2001-2003
Year
Prev
alen
ce p
er 1
0,00
0 liv
e bi
rths
* Prevalence estimates are not provided for congenital heart defects prior to 1983 because not all of these cases have been reviewed by pediatric cardiologists.
Figure 17. Secundum atrial septal defect: Three-year prevalence, MACDP, 1983–2003*
Figure 18. Ventricular septal defect: Three-year prevalence, MACDP, 1983–2003*
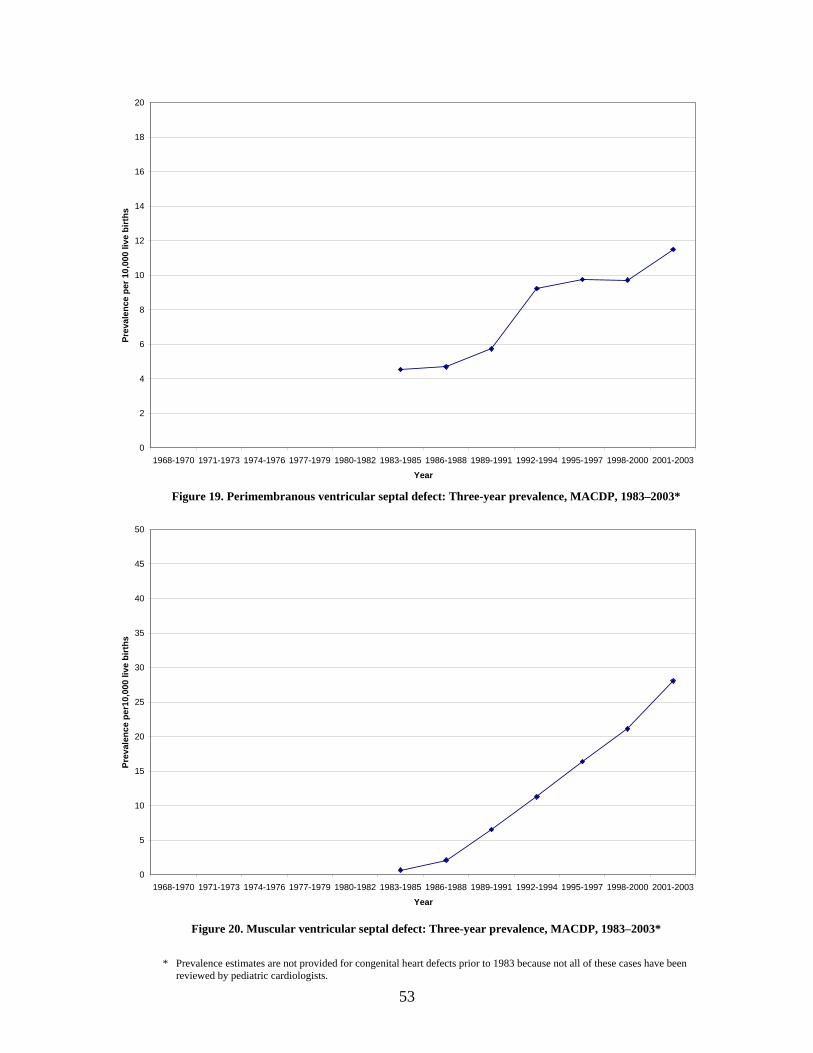
53
0
2
4
6
8
10
12
14
16
18
20
1968-1970 1971-1973 1974-1976 1977-1979 1980-1982 1983-1985 1986-1988 1989-1991 1992-1994 1995-1997 1998-2000 2001-2003
Year
Prev
alen
ce p
er 1
0,00
0 liv
e bi
rths
0
5
10
15
20
25
30
35
40
45
50
1968-1970 1971-1973 1974-1976 1977-1979 1980-1982 1983-1985 1986-1988 1989-1991 1992-1994 1995-1997 1998-2000 2001-2003
Year
Prev
alen
ce p
er10
,000
live
birt
hs
* Prevalence estimates are not provided for congenital heart defects prior to 1983 because not all of these cases have been reviewed by pediatric cardiologists.
Figure 19. Perimembranous ventricular septal defect: Three-year prevalence, MACDP, 1983–2003*
Figure 20. Muscular ventricular septal defect: Three-year prevalence, MACDP, 1983–2003*

54
0
0.5
1
1.5
2
2.5
3
3.5
4
4.5
5
1968-1970 1971-1973 1974-1976 1977-1979 1980-1982 1983-1985 1986-1988 1989-1991 1992-1994 1995-1997 1998-2000 2001-2003
Year
Prev
alen
ce p
er 1
0,00
0 liv
e bi
rths
0
0.5
1
1.5
2
2.5
3
3.5
4
4.5
5
1968-1970 1971-1973 1974-1976 1977-1979 1980-1982 1983-1985 1986-1988 1989-1991 1992-1994 1995-1997 1998-2000 2001-2003
Year
Prev
alen
ce p
er 1
0,00
0 liv
e bi
rths
* Prevalence estimates are not provided for congenital heart defects prior to 1983 because not all of these cases have been reviewed by pediatric cardiologists.
Figure 21. Single ventricle: Three-year prevalence, MACDP, 1983–2003*
Figure 22. Partial and total anomalous pulmonary venous return: Three-year prevalence, MACDP, 1983–2003*

55
0
2
4
6
8
10
12
14
16
18
20
1968-1970 1971-1973 1974-1976 1977-1979 1980-1982 1983-1985 1986-1988 1989-1991 1992-1994 1995-1997 1998-2000 2001-2003
Year
Prev
alen
ce p
er 1
0,00
0 liv
e bi
rths
0
2
4
6
8
10
12
14
16
18
20
1968-1970 1971-1973 1974-1976 1977-1979 1980-1982 1983-1985 1986-1988 1989-1991 1992-1994 1995-1997 1998-2000 2001-2003
Year
Prev
alen
ce p
er 1
0,00
0 liv
e bi
rths
Figure 23. Cleft lip with or without cleft palate: Three-year prevalence, MACDP, 1968–2003
Figure 24. Cleft palate alone: Three-year prevalence, MACDP, 1968–2003
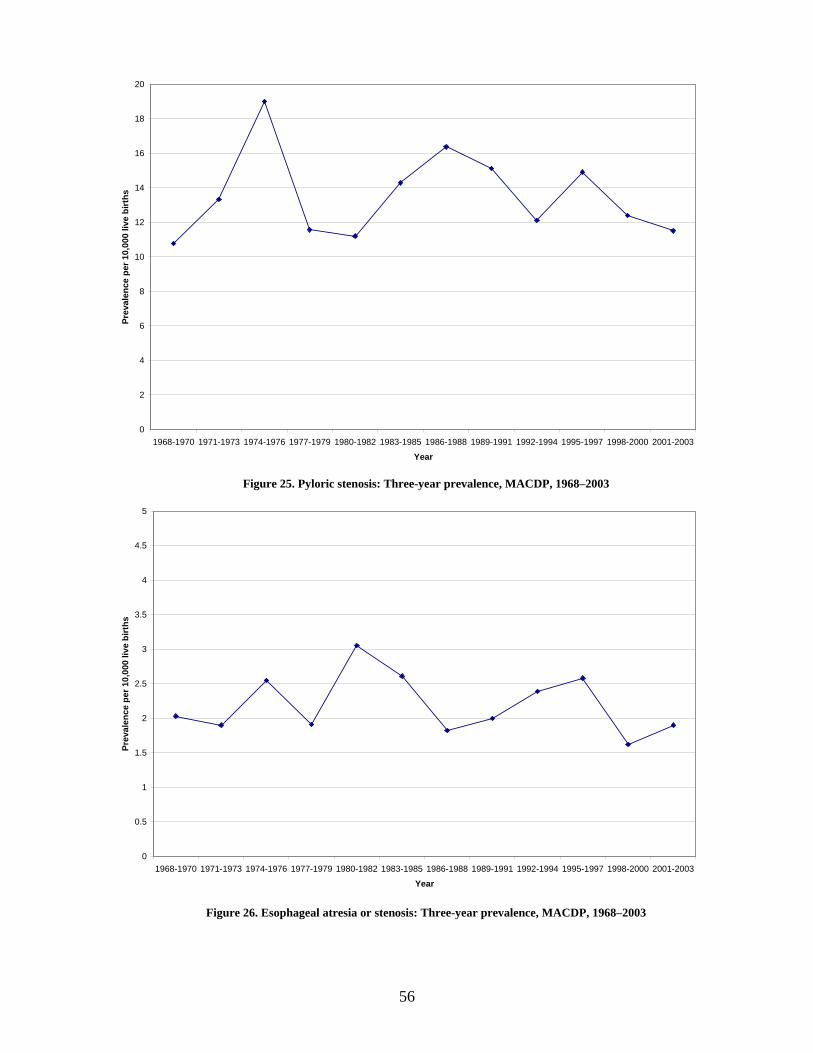
56
0
2
4
6
8
10
12
14
16
18
20
1968-1970 1971-1973 1974-1976 1977-1979 1980-1982 1983-1985 1986-1988 1989-1991 1992-1994 1995-1997 1998-2000 2001-2003
Year
Prev
alen
ce p
er 1
0,00
0 liv
e bi
rths
0
0.5
1
1.5
2
2.5
3
3.5
4
4.5
5
1968-1970 1971-1973 1974-1976 1977-1979 1980-1982 1983-1985 1986-1988 1989-1991 1992-1994 1995-1997 1998-2000 2001-2003
Year
Prev
alen
ce p
er 1
0,00
0 liv
e bi
rths
Figure 25. Pyloric stenosis: Three-year prevalence, MACDP, 1968–2003
Figure 26. Esophageal atresia or stenosis: Three-year prevalence, MACDP, 1968–2003
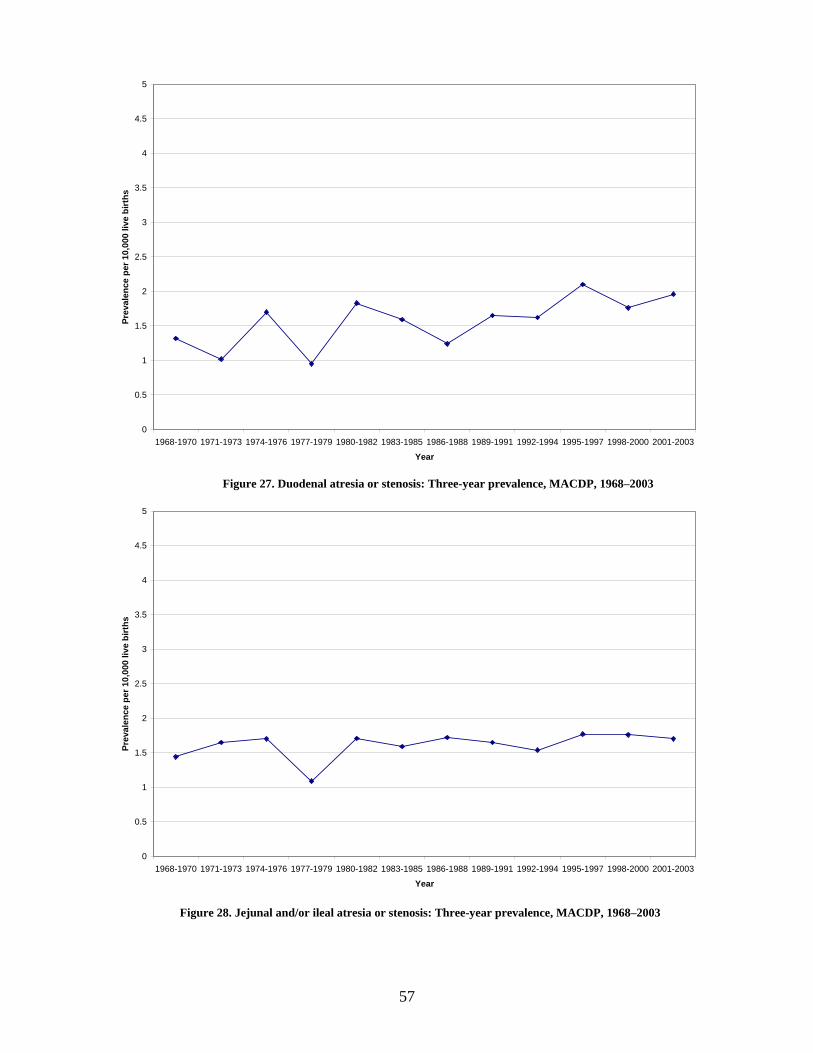
57
0
0.5
1
1.5
2
2.5
3
3.5
4
4.5
5
1968-1970 1971-1973 1974-1976 1977-1979 1980-1982 1983-1985 1986-1988 1989-1991 1992-1994 1995-1997 1998-2000 2001-2003
Year
Prev
alen
ce p
er 1
0,00
0 liv
e bi
rths
0
0.5
1
1.5
2
2.5
3
3.5
4
4.5
5
1968-1970 1971-1973 1974-1976 1977-1979 1980-1982 1983-1985 1986-1988 1989-1991 1992-1994 1995-1997 1998-2000 2001-2003
Year
Prev
alen
ce p
er 1
0,00
0 liv
e bi
rths
Figure 27. Duodenal atresia or stenosis: Three-year prevalence, MACDP, 1968–2003
Figure 28. Jejunal and/or ileal atresia or stenosis: Three-year prevalence, MACDP, 1968–2003

58
0
0.5
1
1.5
2
2.5
3
3.5
4
4.5
5
1968-1970 1971-1973 1974-1976 1977-1979 1980-1982 1983-1985 1986-1988 1989-1991 1992-1994 1995-1997 1998-2000 2001-2003
Year
Prev
alen
ce p
er 1
0,00
0 liv
e bi
rths
0
0.5
1
1.5
2
2.5
3
3.5
4
4.5
5
1968-1970 1971-1973 1974-1976 1977-1979 1980-1982 1983-1985 1986-1988 1989-1991 1992-1994 1995-1997 1998-2000 2001-2003
Year
Prev
alen
ce p
er 1
0,00
0 liv
e bi
rths
Figure 29. Anal or rectal atresia or stenosis: Three-year prevalence, MACDP, 1968–2003
Figure 30. Hirschsprung disease: Three-year prevalence, MACDP, 1968–2003

59
0
5
10
15
20
25
30
35
40
45
50
1968-1970 1971-1973 1974-1976 1977-1979 1980-1982 1983-1985 1986-1988 1989-1991 1992-1994 1995-1997 1998-2000 2001-2003
Year
Prev
alen
ce p
er 1
0,00
0 liv
e bi
rths
0
0.5
1
1.5
2
2.5
3
3.5
4
4.5
5
1968-1970 1971-1973 1974-1976 1977-1979 1980-1982 1983-1985 1986-1988 1989-1991 1992-1994 1995-1997 1998-2000 2001-2003
Year
Prev
alen
ce p
er 1
0,00
0 liv
e bi
rths
Figure 31. Hypospadias: Three-year prevalence, MACDP, 1968–2003
Figure 32. Bilateral renal agenesis or dysgenesis: Three-year prevalence, MACDP, 1968–2003
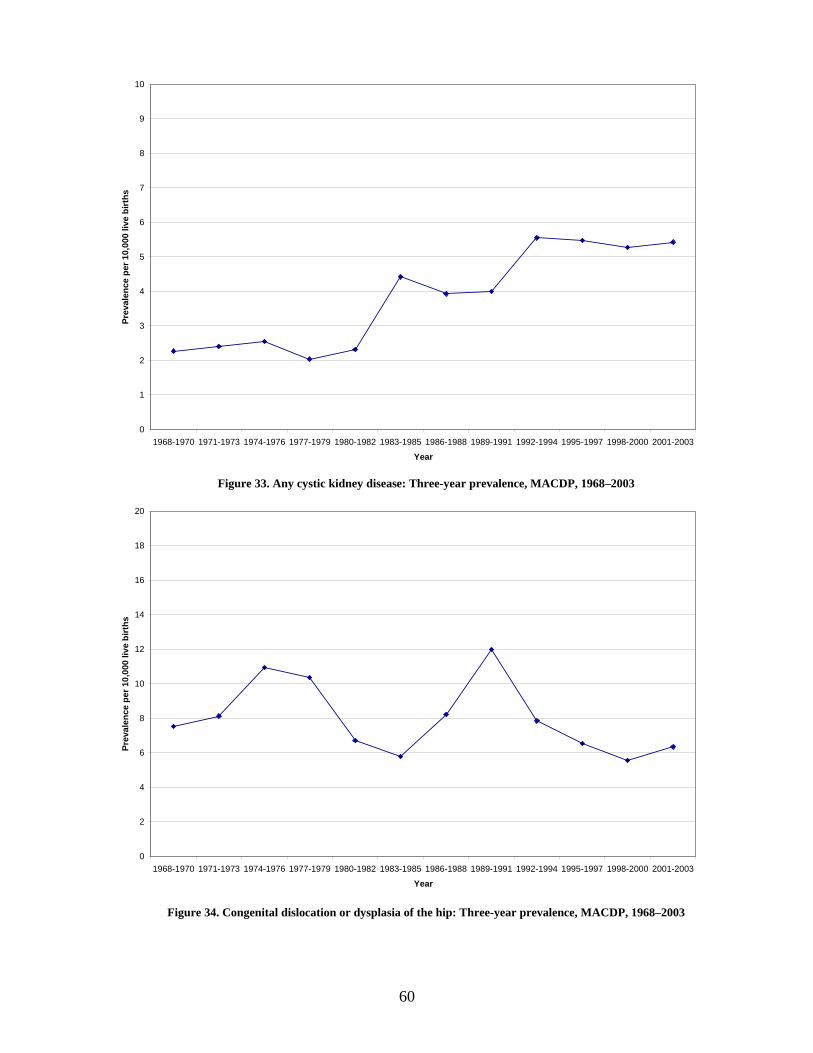
60
0
1
2
3
4
5
6
7
8
9
10
1968-1970 1971-1973 1974-1976 1977-1979 1980-1982 1983-1985 1986-1988 1989-1991 1992-1994 1995-1997 1998-2000 2001-2003
Year
Prev
alen
ce p
er 1
0,00
0 liv
e bi
rths
0
2
4
6
8
10
12
14
16
18
20
1968-1970 1971-1973 1974-1976 1977-1979 1980-1982 1983-1985 1986-1988 1989-1991 1992-1994 1995-1997 1998-2000 2001-2003
Year
Prev
alen
ce p
er 1
0,00
0 liv
e bi
rths
Figure 33. Any cystic kidney disease: Three-year prevalence, MACDP, 1968–2003
Figure 34. Congenital dislocation or dysplasia of the hip: Three-year prevalence, MACDP, 1968–2003

61
0
5
10
15
20
25
30
35
40
45
50
1968-1970 1971-1973 1974-1976 1977-1979 1980-1982 1983-1985 1986-1988 1989-1991 1992-1994 1995-1997 1998-2000 2001-2003
Year
Prev
alen
ce p
er 1
0,00
0 liv
e bi
rths
0
5
10
15
20
25
30
35
40
45
50
1968-1970 1971-1973 1974-1976 1977-1979 1980-1982 1983-1985 1986-1988 1989-1991 1992-1994 1995-1997 1998-2000 2001-2003
Year
Prev
alen
ce p
er 1
0,00
0 liv
e bi
rths
Figure 35. Clubfoot without a neural tube defect: Three-year prevalence, MACDP, 1968–2003
Figure 36. Polydactyly: Three-year prevalence, MACDP, 1968–2003
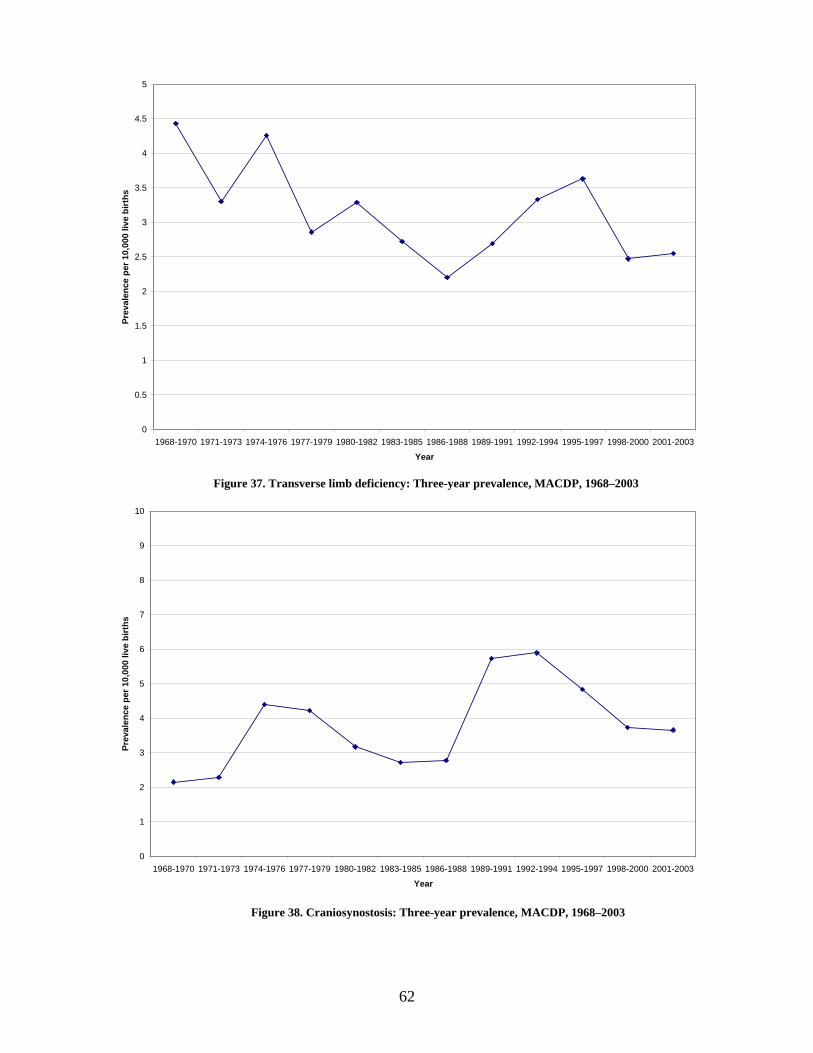
62
0
0.5
1
1.5
2
2.5
3
3.5
4
4.5
5
1968-1970 1971-1973 1974-1976 1977-1979 1980-1982 1983-1985 1986-1988 1989-1991 1992-1994 1995-1997 1998-2000 2001-2003
Year
Prev
alen
ce p
er 1
0,00
0 liv
e bi
rths
0
1
2
3
4
5
6
7
8
9
10
1968-1970 1971-1973 1974-1976 1977-1979 1980-1982 1983-1985 1986-1988 1989-1991 1992-1994 1995-1997 1998-2000 2001-2003
Year
Prev
alen
ce p
er 1
0,00
0 liv
e bi
rths
Figure 37. Transverse limb deficiency: Three-year prevalence, MACDP, 1968–2003
Figure 38. Craniosynostosis: Three-year prevalence, MACDP, 1968–2003

63
0
0.5
1
1.5
2
2.5
3
3.5
4
4.5
5
1968-1970 1971-1973 1974-1976 1977-1979 1980-1982 1983-1985 1986-1988 1989-1991 1992-1994 1995-1997 1998-2000 2001-2003
Year
Prev
alen
ce p
er 1
0,00
0 liv
e bi
rths
0
0.5
1
1.5
2
2.5
3
3.5
4
4.5
5
1968-1970 1971-1973 1974-1976 1977-1979 1980-1982 1983-1985 1986-1988 1989-1991 1992-1994 1995-1997 1998-2000 2001-2003
Year
Prev
alen
ce p
er 1
0,00
0 liv
e bi
rths
Figure 39. Skeletal dysplasia: Three-year prevalence, MACDP, 1968–2003
Figure 40. Diaphragmatic hernia: Three-year prevalence, MACDP, 1968–2003
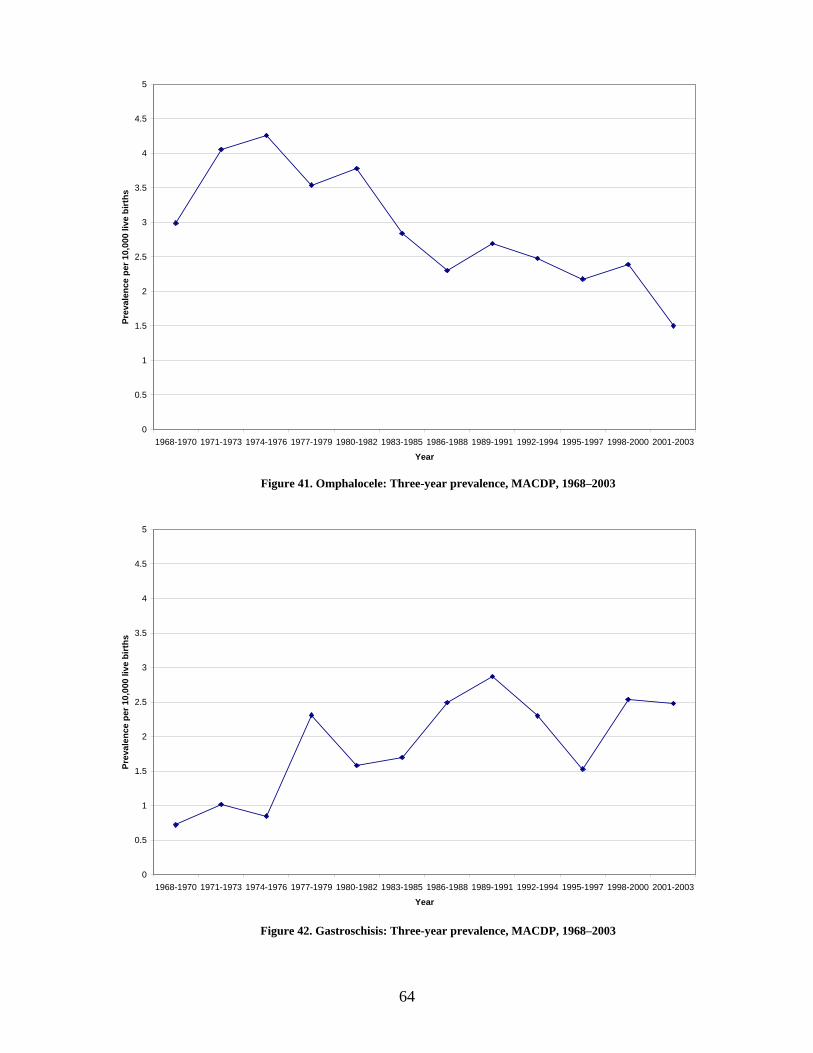
64
0
0.5
1
1.5
2
2.5
3
3.5
4
4.5
5
1968-1970 1971-1973 1974-1976 1977-1979 1980-1982 1983-1985 1986-1988 1989-1991 1992-1994 1995-1997 1998-2000 2001-2003
Year
Prev
alen
ce p
er 1
0,00
0 liv
e bi
rths
0
0.5
1
1.5
2
2.5
3
3.5
4
4.5
5
1968-1970 1971-1973 1974-1976 1977-1979 1980-1982 1983-1985 1986-1988 1989-1991 1992-1994 1995-1997 1998-2000 2001-2003
Year
Prev
alen
ce p
er 1
0,00
0 liv
e bi
rths
Figure 41. Omphalocele: Three-year prevalence, MACDP, 1968–2003
Figure 42. Gastroschisis: Three-year prevalence, MACDP, 1968–2003
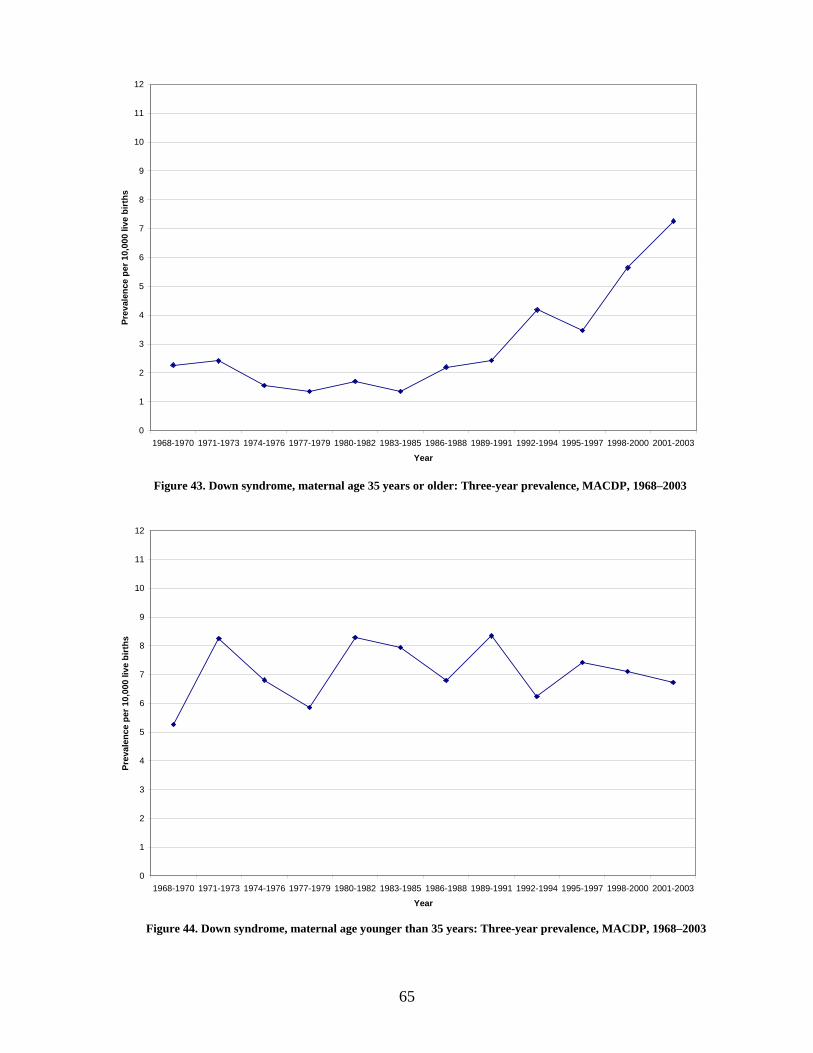
65
0
1
2
3
4
5
6
7
8
9
10
11
12
1968-1970 1971-1973 1974-1976 1977-1979 1980-1982 1983-1985 1986-1988 1989-1991 1992-1994 1995-1997 1998-2000 2001-2003
Year
Prev
alen
ce p
er 1
0,00
0 liv
e bi
rths
0
1
2
3
4
5
6
7
8
9
10
11
12
1968-1970 1971-1973 1974-1976 1977-1979 1980-1982 1983-1985 1986-1988 1989-1991 1992-1994 1995-1997 1998-2000 2001-2003
Year
Prev
alen
ce p
er 1
0,00
0 liv
e bi
rths
Figure 43. Down syndrome, maternal age 35 years or older: Three-year prevalence, MACDP, 1968–2003
Figure 44. Down syndrome, maternal age younger than 35 years: Three-year prevalence, MACDP, 1968–2003

66
0
1
2
3
4
5
6
7
8
9
10
11
12
1968-1970 1971-1973 1974-1976 1977-1979 1980-1982 1983-1985 1986-1988 1989-1991 1992-1994 1995-1997 1998-2000 2001-2003
Year
Prev
alen
ce p
er 1
0,00
0 liv
e bi
rths
0
1
2
3
4
5
6
7
8
9
10
11
12
1968-1970 1971-1973 1974-1976 1977-1979 1980-1982 1983-1985 1986-1988 1989-1991 1992-1994 1995-1997 1998-2000 2001-2003
Year
Prev
alen
ce p
er 1
0,00
0 liv
e bi
rths
Figure 45. Any autosomal trisomy, maternal age 35 years or older: Three-year prevalence, MACDP, 1968–2003
Figure 46. Any autosomal trisomy, maternal age younger than 35 years: Three-year prevalence, MACDP, 1968–2003

67
Period
Cases Prev** Cases Prev Cases Prev Cases Prev Cases Prev Cases Prev Cases Prev Cases PrevTotal 32,938 267.31 2,872 209.33 3,934 274.09 3,800 280.36 5,611 276.73 3,894 252.32 5,882 281.66 6,945 277.80Maternal age (years)
<25 12,632 257.08 1,521 194.44 2,020 276.17 1,853 306.10 2,231 283.78 1,278 233.80 1,729 256.78 2,000 253.6825–29 9,052 256.53 806 216.56 1,192 268.80 1,064 252.92 1,684 265.54 1,118 248.49 1,494 270.16 1,694 258.52>30 11,140 287.93 485 223.07 709 279.32 881 268.02 1,686 278.22 1,496 273.91 2,647 307.37 3,236 306.51Unknown 114 -- 60 -- 13 -- <5 -- 10 -- <5 -- 12 -- 15 --
Maternal race/ethnicity†
White 18,972 283.10 2,244 227.83 2,821 303.45 2,225 267.99 3,397 277.10 2,210 278.28 3,060 312.05 3,015 315.39Black or African American 10,838 257.94 -- -- 1,085 221.03 1,542 304.95 2,098 276.91 1,428 222.38 2,196 260.52 2,489 258.61Hispanic or Latino 1,628 250.52 -- -- -- -- -- -- -- -- 142 240.43 383 230.90 1,103 259.58All Other Races 1,391 182.89 628‡ 162.25 26 175.79 26 135.56 111 254.88 109 230.54 222 231.35 269 176.09Unknown 109 -- -- -- <5 -- 7 -- 5 -- 5 -- 21 -- 69 --
Birth weight (grams)<2500 7,858 744.85 686 568.87 872 706.59 905 772.12 1,277 785.17 947 707.83 1,493 834.92 1,678 767.89>2500 24,851 221.11 2,107 169.31 3,028 233.83 2,878 232.64 4,312 231.38 2,933 208.19 4,360 228.37 5,233 229.40Unknown 229 -- 79 -- 34 -- 17 -- 22 -- 14 -- 29 -- 34 --
Gestational age (weeks)20–36 7,379 645.07 498 470.83 730 604.15 803 651.20 1,156 585.41 932 586.16 1,489 764.96 1,771 729.20>37 25,227 239.26 2,360 203.45 3,189 264.72 2,984 263.92 4,340 259.30 2,934 225.50 4,335 234.05 5,085 228.89Unknown 332 -- 14 -- 15 -- 13 -- 115 -- 28 -- 58 -- 89 --
SexMale 19574 310.77 1677 238.92 2382 322.63 2219 319.54 3250 312.79 2334 296.22 3564 334.6 4148 326.19Female 13292 220.68 1193 178.03 1539 220.86 1573 237.99 2349 237.63 1543 204.3 2307 225.49 2788 226.98Ambiguous/Unknown 72 -- <5 -- 13 -- 8 -- 12 -- 17 -- 13 -- 8 --
Parity1 Live birth 14,794 273.16 1,212 232.42 1,820 251.89 1,780 280.42 2,357 263.13 1,825 273.05 2,705 294.53 3,095 293.482 or more live births 17,259 257.12 1,210 168.12 2,084 292.38 1,984 275.31 2,954 269.81 2,060 236.65 3,136 269.92 3,831 267.49Unknown 885 -- 450 -- 30 -- 36 -- 300 -- 9 -- 41 -- 19 --
Gravidity1 Pregnancy 10,789 232.66 1,109 228.06 1,490 222.30 1,342 204.93 1,753 248.41 1,169 224.56 1,778 243.79 2,148 246.822 or more pregnancies 21,978 294.29 1,732 229.43 2,412 315.27 2,441 348.45 3,832 298.60 2,717 267.16 4,065 301.82 4,779 298.59Unknown 171 -- 31 -- 32 -- 17 -- 26 -- 8 -- 39 -- 18 --
PluralitySingleton 31,580 263.01 2,793 207.34 3,793 269.77 3,675 276.67 5,389 271.99 3,719 247.54 5,603 276.53 6,608 273.52Multiple 1,336 427.77 79 316.76 141 521.84 123 453.54 203 438.92 175 428.71 279 448.99 336 399.86Unknown 22 -- -- -- -- -- <5 -- 19 -- -- -- -- -- <5 --
1999–20031979–1983 1984–1989 1990–1993 1994–1998Characteristic Total 1968–1972 1973–1978
Period
Cases Percent Cases Percent Cases Percent Cases Percent Cases Percent Cases Percent Cases Percent Cases PercentBirth outcome
Live birth 31,616 96.0 2,676 93.2 3,768 95.8 3,683 96.9 5,442 97.0 3,732 95.8 5,610 95.4 6,705 96.5Stillbirth 978 3.0 195 6.8 163 4.1 113 3.0 159 2.8 100 2.6 131 2.2 117 1.7Elective termination 341 1.0 -- -- <5 -- <5 -- 10 0.2 62 1.6 141 2.4 123 1.8Unknown <5 -- <5 -- -- -- <5 -- -- -- -- -- -- -- -- --
Age at diagnosisPrenatally or <7days 25,702 78.0 2,419 84.2 3,165 80.5 3,157 83.1 4,490 80.0 3,079 79.1 4,396 74.7 4,996 71.98 days–6 months 4,891 14.8 394 13.7 652 16.6 508 13.4 909 16.2 627 16.1 920 15.6 881 12.76 months–1 year 982 3.0 55 1.9 108 2.7 117 3.1 174 3.1 127 3.3 214 3.6 187 2.71–5 years 502 1.5 <5 -- <5 -- 8 0.2 11 0.2 32 0.8 157 2.7 289 4.2>5 years 38 0.1 -- -- -- -- -- -- <5 -- 7 0.2 17 0.3 13 0.2Unknown 823 2.5 <5 -- 7 0.2 10 0.3 26 0.5 22 0.6 178 3.0 579 8.3
Socioeconomic status§
Upper 7,615 23.1 -- -- -- -- 1,069 28.1 1,882 33.5 1,528 39.2 1,957 33.3 1,179 17.0Middle 7,371 22.4 -- -- -- -- 1,145 30.1 1,665 29.7 1,246 32.0 1,993 33.9 1,322 19.0Lower 7,172 21.8 -- -- -- -- 1,491 39.2 1,989 35.4 1,059 27.2 1,638 27.8 995 14.3Unknown 10,780 32.7 2,872 100.0 3,934 100.0 95 2.5 75 1.3 61 1.6 294 5.0 3,449 49.7
1999–2003Characteristic Total 1968–1972 1973–1978 1979–1983 1984–1989 1990–1993 1994–1998
* Cells containing fewer than 5 cases are indicated as “<5”. Prevalence estimates based on these cells are indicated as less than the prevalence based on 5 cases in Table a. Per-
centages based on these cells are not provided in Table b. Cells containing zero cases are indicated as "--". Counts are provided, but prevalences are not estimated, for strata with unknown values in Table a. Counts and percentages are provided for strata with unknown values in Table b.
** Prev = Prevalence. † Data on Hispanic or Latino ethnicity were available beginning in 1990. ‡ The category of All Other Races includes 619 cases of Black or African American race. § Information about socioeconomic status was available only for 1979-2001.
Table 6a All defects: Prevalence (per 10,000 live births) stratified by descriptive characteristics, MACDP, 1968–2003*
Table 6b All defects: Percentage of cases by descriptive characteristics, MACDP, 1968–2003*

68
Cases Prev** Cases Prev Cases Prev Cases Prev Cases Prev Cases Prev Cases Prev Cases PrevTotal 446 3.62 123 8.96 81 5.64 61 4.50 60 2.96 37 2.40 45 2.15 39 1.56Maternal age (years)
<25 215 4.38 71 9.08 44 6.02 32 5.29 25 3.18 15 2.74 19 2.82 9 1.1425–29 136 3.85 34 9.14 18 4.06 21 4.99 22 3.47 10 2.22 13 2.35 18 2.75>30 93 2.40 17 7.82 19 7.49 8 2.43 13 2.15 12 2.20 12 1.39 12 1.14Unknown <5 -- <5 -- -- -- -- -- -- -- -- -- <5 -- -- --
Maternal race/ethnicity†
White 317 4.73 111 11.27 61 6.56 51 6.14 39 3.18 17 2.14 23 2.35 15 1.57Black or African American 91 2.17 -- -- 19 3.87 9 1.78 19 2.51 17 2.65 15 1.78 12 1.25Hispanic or Latino 16 2.46 -- -- -- -- -- -- -- -- <5 <8.47 <5 <3.01 10 2.35All Other Races 20 2.63 12‡ 3.10 <5 <33.81 <5 <26.07 <5 <11.48 <5 <10.58 <5 <5.21 <5 <3.27Unknown <5 -- -- -- -- -- -- -- <5 -- -- -- <5 -- -- --
Birth weight (grams)<2500 341 32.32 91 75.46 60 48.62 47 40.10 49 30.13 27 20.18 37 20.69 30 13.73>2500 71 0.63 20 1.61 18 1.39 9 0.73 6 0.32 6 0.43 5 0.26 7 0.31Unknown 34 -- 12 -- <5 -- 5 -- 5 -- <5 -- <5 -- <5 --
Gestational age (weeks)20–36 277 24.22 69 65.24 42 34.76 32 25.95 46 23.29 25 15.72 36 18.49 27 11.12>37 164 1.56 53 4.57 39 3.24 28 2.48 11 0.66 12 0.92 9 0.49 12 0.54Unknown 5 -- <5 -- -- -- <5 -- <5 -- -- -- -- -- -- --
SexMale 154 2.45 39 5.56 26 3.52 18 2.59 19 1.83 15 1.90 20 1.88 17 1.34Female 286 4.75 84 12.54 53 7.61 42 6.35 40 4.05 21 2.78 24 2.35 22 1.79Ambiguous/Unknown 6 -- -- -- <5 -- <5 -- <5 -- <5 -- <5 -- -- --
Parity1 Live birth 186 3.43 54 10.36 42 5.81 28 4.41 23 2.57 12 1.80 13 1.42 14 1.332 or more live births 235 3.50 48 6.67 38 5.33 33 4.58 34 3.11 25 2.87 32 2.75 25 1.75Unknown 25 -- 21 -- <5 -- -- -- <5 -- -- -- -- -- -- --
Gravidity1 Pregnancy 150 3.23 48 9.87 37 5.52 20 3.05 17 2.41 9 1.73 9 1.23 10 1.152 or more pregnancies 294 3.94 75 9.93 43 5.62 40 5.71 43 3.35 28 2.75 36 2.67 29 1.81Unknown <5 -- -- -- <5 -- <5 -- -- -- -- -- -- -- -- --
PluralitySingleton 417 3.47 119 8.83 76 5.41 56 4.22 56 2.83 32 2.13 42 2.07 36 1.49Multiple 29 9.29 <5 <20.05 5 18.50 5 18.44 <5 <10.81 5 12.25 <5 <8.05 <5 <5.95Unknown -- -- -- -- -- -- -- -- -- -- -- -- -- -- -- --
Characteristic Total 1968–1972 1973–1978Period
1999–20031979–1983 1984–1989 1990–1993 1994–1998
Cases Percent Cases Percent Cases Percent Cases Percent Cases Percent Cases Percent Cases Percent Cases PercentBirth outcome
Live birth 166 37.2 34 27.6 30 37.0 33 54.1 29 48.3 13 35.1 14 31.1 13 33.3Stillbirth 230 51.6 88 71.5 50 61.7 27 44.3 28 46.7 13 35.1 11 24.4 13 33.3Elective termination 49 11.0 -- -- <5 -- <5 -- <5 -- 11 29.7 20 44.4 13 33.3Unknown <5 -- <5 -- -- -- -- -- -- -- -- -- -- -- -- --
Age at diagnosisPrenatally or <7days 432 96.9 123 100 81 100 60 98.4 58 96.7 35 94.6 43 95.6 32 82.18 days–6 months <5 -- -- -- -- -- <5 -- -- -- <5 -- -- -- -- --6 months–1 year <5 -- -- -- -- -- -- -- -- -- <5 -- -- -- -- --1–5 years -- -- -- -- -- -- -- -- -- -- -- -- -- -- -- -->5 years -- -- -- -- -- -- -- -- -- -- -- -- -- -- -- --Unknown 11 2.5 -- -- -- -- -- -- <5 -- -- -- <5 -- 7 17.9
Socioeconomic status§
Upper 73 16.4 -- -- -- -- 25 41.0 22 36.7 10 27.0 10 22.2 6 15.4Middle 75 16.8 -- -- -- -- 19 31.1 16 26.7 14 37.8 14 31.1 12 30.8Lower 79 17.7 -- -- -- -- 17 27.9 22 36.7 13 35.1 18 40.0 9 23.1Unknown 219 49.1 123 100.0 81 100.0 -- -- -- -- -- -- <5 -- 12 30.8
1999-2003Characteristic Total 1968-1972 1973-1978 1979-1983 1984-1989 1990-1993 1994-1998Period
* Cells containing fewer than 5 cases are indicated as “<5”. Prevalence estimates based on these cells are indicated as less than the prevalence based on 5 cases in Table a.
Percentages based on these cells are not provided in Table b. Cells containing zero cases are indicated as "--". Counts are provided, but prevalences are not estimated, for strata with unknown values in Table a. Counts and percentages are provided for strata with unknown values in Table b.
** Prev = Prevalence. † Data on Hispanic or Latino ethnicity were available beginning in 1990. ‡ The category of All Other Races includes 12 cases of Black or African American race. § Information about socioeconomic status was available only for 1979-2001.
Table 7a Anencephalus: Prevalence (per 10,000 live births) stratified by descriptive characteristics, MACDP, 1968–2003*
Table 7b Anencephalus: Percentage of cases by descriptive characteristics, MACDP, 1968–2003*

69
Period
Cases Prev** Cases Prev Cases Prev Cases Prev Cases Prev Cases Prev Cases Prev Cases PrevTotal 706 5.73 181 13.19 116 8.08 92 6.79 120 5.92 57 3.69 76 3.64 64 2.56Maternal age (years)
<25 301 6.13 97 12.40 58 7.93 35 5.78 53 6.74 21 3.84 20 2.97 17 2.1625–29 217 6.15 49 13.17 30 6.77 31 7.37 39 6.15 16 3.56 28 5.06 24 3.66>30 183 4.73 30 13.80 28 11.03 26 7.91 28 4.62 20 3.66 28 3.25 23 2.18Unknown 5 -- 5 -- -- -- -- -- -- -- -- -- -- -- -- --
Maternal race/ethnicity†
White 514 7.67 161 16.35 95 10.22 65 7.83 84 6.85 38 4.78 52 5.30 19 1.99Black or African American 138 3.28 -- -- 20 4.07 25 4.94 33 4.36 18 2.80 20 2.37 22 2.29Hispanic or Latino 27 4.15 -- -- -- -- -- -- -- -- <5 <8.47 <5 <3.01 22 5.18All Other Races 26 3.42 20‡ 5.17 <5 <33.81 <5 <26.07 <5 <11.48 -- -- -- -- -- --Unknown <5 -- -- -- -- -- -- -- -- -- -- -- -- -- <5 --
Birth weight (grams)<2500 205 19.43 49 40.63 29 23.50 19 16.21 36 22.13 20 14.95 34 19.01 18 8.24>2500 484 4.31 122 9.80 84 6.49 72 5.82 82 4.40 36 2.56 42 2.20 46 2.02Unknown 17 -- 10 -- <5 -- <5 -- <5 -- <5 -- -- -- -- --
Gestational age (weeks)20–36 192 16.78 31 29.31 28 23.17 19 15.41 33 16.71 23 14.47 37 19.01 21 8.65>37 506 4.80 149 12.84 86 7.14 73 6.46 83 4.96 33 2.54 39 2.11 43 1.94Unknown 8 -- <5 -- <5 -- -- -- <5 -- <5 -- -- -- -- --
SexMale 350 5.56 81 11.54 58 7.86 45 6.48 60 5.77 30 3.81 35 3.29 41 3.22Female 353 5.86 100 14.92 57 8.18 46 6.96 60 6.07 27 3.57 40 3.91 23 1.87Ambiguous/Unknown <5 -- -- -- <5 -- <5 -- -- -- -- -- <5 -- -- --
Parity1 Live birth 292 5.39 75 14.38 48 6.64 38 5.99 57 6.36 22 3.29 31 3.38 21 1.992 or more live births 366 5.45 69 9.59 66 9.26 52 7.22 56 5.11 35 4.02 45 3.87 43 3.00Unknown 48 -- 37 -- <5 -- <5 -- 7 -- -- -- -- -- -- --
Gravidity1 Pregnancy 223 4.81 71 14.60 36 5.37 25 3.82 37 5.24 15 2.88 21 2.88 18 2.072 or more pregnancies 474 6.35 106 14.04 77 10.06 65 9.28 83 6.47 42 4.13 55 4.08 46 2.87Unknown 9 -- <5 -- <5 -- <5 -- -- -- -- -- -- -- -- --
PluralitySingleton 695 5.79 181 13.44 112 7.97 91 6.85 115 5.80 56 3.73 76 3.75 64 2.65Multiple 11 3.52 -- -- <5 <18.50 <5 <18.44 5 10.81 <5 <12.25 -- -- -- --Unknown -- -- -- -- -- -- -- -- -- -- -- -- -- -- -- --
Characteristic Total 1968–1972 1973–1978 1999–20031979–1983 1984–1989 1990–1993 1994–1998
Cases Percent Cases Percent Cases Percent Cases Percent Cases Percent Cases Percent Cases Percent Cases PercentBirth outcome
Live birth 588 83.3 144 79.6 98 84.5 86 93.5 107 89.2 47 82.5 53 69.7 53 82.8Stillbirth 84 11.9 37 20.4 18 15.5 5 5.4 12 10.0 <5 -- 6 7.9 <5 --Elective termination 34 4.8 -- -- -- -- <5 -- <5 -- 8 14.0 17 22.4 7 10.9Unknown -- -- -- -- -- -- -- -- -- -- -- -- -- -- -- --
Age at diagnosisPrenatally or <7days 678 96.0 180 99.4 115 99.1 89 96.7 114 95.0 55 96.5 68 89.5 57 89.18 days–6 months 14 2.0 <5 -- -- -- <5 -- <5 -- <5 -- <5 -- <5 --6 months–1 year <5 -- -- -- <5 -- -- -- <5 -- -- -- -- -- -- --1–5 years <5 -- -- -- -- -- -- -- -- -- -- -- -- -- <5 -->5 years -- -- -- -- -- -- -- -- -- -- -- -- -- -- -- --Unknown 11 1.6 -- -- -- -- -- -- <5 -- -- -- 5 6.6 5 7.8
Socioeconomic status§
Upper 117 16.6 -- -- -- -- 29 31.5 45 37.5 16 28.1 22 28.9 5 7.8Middle 114 16.1 -- -- -- -- 31 33.7 32 26.7 19 33.3 22 28.9 10 15.6Lower 129 18.3 -- -- -- -- 28 30.4 41 34.2 22 38.6 26 34.2 12 18.8Unknown 346 49.0 181 100.0 116 100.0 <5 -- <5 -- -- -- 6 7.9 37 57.8
1999–2003Characteristic Total 1968–1972 1973–1978 1979–1983 1984–1989 1990–1993 1994–1998Period
* Cells containing fewer than 5 cases are indicated as “<5”. Prevalence estimates based on these cells are indicated as less than the prevalence based on 5 cases in Table a.
Percentages based on these cells are not provided in Table b. Cells containing zero cases are indicated as "--". Counts are provided, but prevalences are not estimated, for strata with unknown values in Table a. Counts and percentages are provided for strata with unknown values in Table b.
** Prev = Prevalence. † Data on Hispanic or Latino ethnicity were available beginning in 1990. ‡ The category of All Other Races includes 19 cases of Black or African American race. § Information about socioeconomic status was available only for 1979-2001.
Table 8a Spina bifida: Prevalence (per 10,000 live births) stratified by descriptive characteristics, MACDP, 1968–2003*
Table 8b Spina bifida: Percentage of cases by descriptive characteristics, MACDP, 1968–2003*

70
Cases Prev** Cases Prev Cases Prev Cases Prev Cases Prev Cases Prev Cases Prev Cases PrevTotal 190 1.54 20 1.46 31 2.16 32 2.36 36 1.78 21 1.36 24 1.15 26 1.04Maternal age (years)
<25 82 1.67 9 1.15 17 2.32 15 2.48 18 2.29 6 1.10 9 1.34 8 1.0125–29 55 1.56 7 1.88 10 2.26 11 2.61 9 1.42 5 1.11 6 1.08 7 1.07>30 53 1.37 <5 <2.30 <5 <1.97 6 1.83 9 1.49 10 1.83 9 1.05 11 1.04Unknown -- -- -- -- -- -- -- -- -- -- -- -- -- -- -- --
Maternal race/ethnicity†
White 98 1.46 16 1.62 25 2.69 12 1.45 21 1.71 6 0.76 11 1.12 7 0.73Black or African American 74 1.76 -- -- 6 1.22 19 3.76 14 1.85 13 2.02 10 1.19 12 1.25Hispanic or Latino 9 1.38 -- -- -- -- -- -- -- -- -- -- <5 <3.01 6 1.41All Other Races 9 1.18 <5‡ <1.29 -- -- <5 <26.07 <5 <11.48 <5 <10.58 -- -- <5 <3.27Unknown -- -- -- -- -- -- -- -- -- -- -- -- -- -- -- --
Birth weight (grams)<2500 78 7.39 8 6.63 11 8.91 13 11.09 15 9.22 11 8.22 11 6.15 9 4.12>2500 108 0.96 12 0.96 19 1.47 19 1.54 19 1.02 10 0.71 13 0.68 16 0.70Unknown <5 -- -- -- <5 -- -- -- <5 -- -- -- -- -- <5 --
Gestational age (weeks)20–36 74 6.47 <5 <4.73 10 8.28 12 9.73 18 9.12 11 6.92 9 4.62 10 4.12>37 115 1.09 16 1.38 21 1.74 20 1.77 17 1.02 10 0.77 15 0.81 16 0.72Unknown <5 -- -- -- -- -- -- -- <5 -- -- -- -- -- -- --
SexMale 84 1.33 6 0.85 17 2.30 17 2.45 12 1.15 8 1.02 13 1.22 11 0.87Female 103 1.71 14 2.09 13 1.87 15 2.27 23 2.33 12 1.59 11 1.08 15 1.22Ambiguous/Unknown <5 -- -- -- <5 -- -- -- <5 -- <5 -- -- -- -- --
Parity1 Live birth 82 1.51 6 1.15 13 1.80 16 2.52 15 1.67 7 1.05 15 1.63 10 0.952 or more live births 101 1.50 9 1.25 18 2.53 15 2.08 20 1.83 14 1.61 9 0.77 16 1.12Unknown 7 -- 5 -- -- -- <5 -- <5 -- -- -- -- -- -- --
Gravidity1 Pregnancy 56 1.21 6 1.23 9 1.34 10 1.53 9 1.28 <5 <0.96 10 1.37 8 0.922 or more pregnancies 134 1.79 14 1.85 22 2.88 22 3.14 27 2.10 17 1.67 14 1.04 18 1.12Unknown -- -- -- -- -- -- -- -- -- -- -- -- -- -- -- --
PluralitySingleton 182 1.52 19 1.41 31 2.20 30 2.26 33 1.67 20 1.33 23 1.14 26 1.08Multiple 8 2.56 <5 <20.05 -- -- <5 <18.44 <5 <10.81 <5 <12.25 <5 <8.05 -- --Unknown -- -- -- -- -- -- -- -- -- -- -- -- -- -- -- --
Characteristic 1999–20031990–19931984–1989 1994–1998Period
Total 1968–1972 1973–1978 1979–1983
Cases Percent Cases Percent Cases Percent Cases Percent Cases Percent Cases Percent Cases Percent Cases PercentBirth outcome
Live birth 148 77.9 17 85.0 23 74.2 28 87.5 28 77.8 15 71.4 19 79.2 18 69.2Stillbirth 28 14.7 <5 -- 6 19.4 <5 -- 7 19.4 <5 -- <5 -- <5 --Elective termination 14 7.4 -- -- <5 -- -- -- <5 -- <5 -- <5 -- 6 23.1Unknown -- -- -- -- -- -- -- -- -- -- -- -- -- -- -- --
Age at diagnosisPrenatally or <7days 179 94.2 20 100.0 30 96.8 31 96.9 35 97.2 18 85.7 23 95.8 22 84.68 days–6 months 7 3.7 -- -- <5 -- <5 -- <5 -- <5 -- <5 -- <5 --6 months–1 year <5 -- -- -- -- -- -- -- -- -- <5 -- -- -- -- --1–5 years -- -- -- -- -- -- -- -- -- -- -- -- -- -- -- -->5 years -- -- -- -- -- -- -- -- -- -- -- -- -- -- -- --Unknown <5 -- -- -- -- -- -- -- -- -- -- -- -- -- <5 --
Socioeconomic status§
Upper 41 21.6 -- -- -- -- 7 21.9 16 44.4 8 38.1 7 29.2 <5 --Middle 38 20.0 -- -- -- -- 11 34.4 9 25.0 7 33.3 5 20.8 6 23.1Lower 44 23.2 -- -- -- -- 14 43.8 11 30.6 6 28.6 11 45.8 <5 --Unknown 67 35.3 20 100.0 31 100.0 -- -- -- -- -- -- <5 -- 15 57.7
1999–2003Characteristic Total 1968–1972 1973–1978 1979–1983 1984–1989 1990–1993 1994–1998Period
* Cells containing fewer than 5 cases are indicated as “<5”. Prevalence estimates based on these cells are indicated as less than the prevalence based on 5 cases in Table a. Per-
centages based on these cells are not provided in Table b. Cells containing zero cases are indicated as "--". Counts are provided, but prevalences are not estimated, for strata with unknown values in Table a. Counts and percentages are provided for strata with unknown values in Table b.
** Prev = Prevalence. † Data on Hispanic or Latino ethnicity were available beginning in 1990. ‡ The category of All Other Races includes <5 cases of Black or African American race. § Information about socioeconomic status was available only for 1979-2001.
Table 9a Encephalocele: Prevalence (per 10,000 live births) stratified by descriptive characteristics, MACDP, 1968–2003*
Table 9b Encephalocele: Percentage of cases by descriptive characteristics, MACDP, 1968–2003*
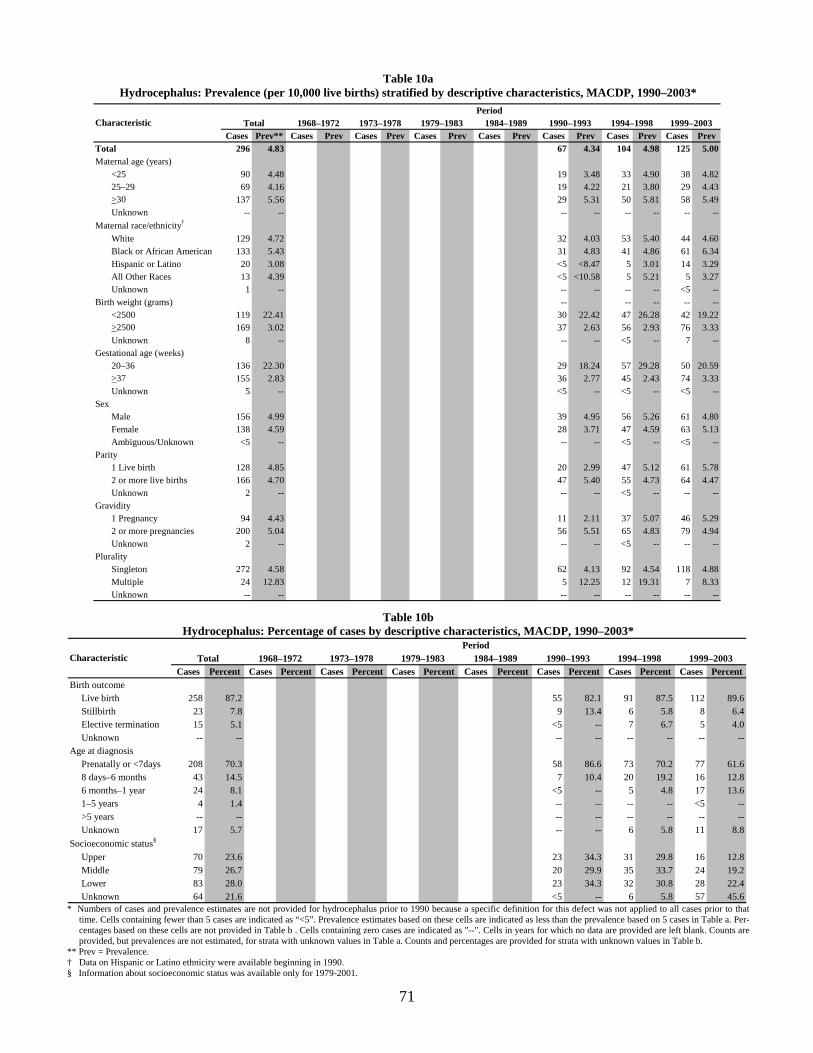
71
Period
Cases Prev** Cases Prev Cases Prev Cases Prev Cases Prev Cases Prev Cases Prev Cases PrevTotal 296 4.83 67 4.34 104 4.98 125 5.00Maternal age (years)
<25 90 4.48 19 3.48 33 4.90 38 4.8225–29 69 4.16 19 4.22 21 3.80 29 4.43>30 137 5.56 29 5.31 50 5.81 58 5.49Unknown -- -- -- -- -- -- -- --
Maternal race/ethnicity†
White 129 4.72 32 4.03 53 5.40 44 4.60Black or African American 133 5.43 31 4.83 41 4.86 61 6.34Hispanic or Latino 20 3.08 <5 <8.47 5 3.01 14 3.29All Other Races 13 4.39 <5 <10.58 5 5.21 5 3.27Unknown 1 -- -- -- -- -- <5 --
Birth weight (grams) -- -- -- -- --<2500 119 22.41 30 22.42 47 26.28 42 19.22>2500 169 3.02 37 2.63 56 2.93 76 3.33Unknown 8 -- -- -- <5 -- 7 --
Gestational age (weeks)20–36 136 22.30 29 18.24 57 29.28 50 20.59>37 155 2.83 36 2.77 45 2.43 74 3.33Unknown 5 -- <5 -- <5 -- <5 --
SexMale 156 4.99 39 4.95 56 5.26 61 4.80Female 138 4.59 28 3.71 47 4.59 63 5.13Ambiguous/Unknown <5 -- -- -- <5 -- <5 --
Parity1 Live birth 128 4.85 20 2.99 47 5.12 61 5.782 or more live births 166 4.70 47 5.40 55 4.73 64 4.47Unknown 2 -- -- -- <5 -- -- --
Gravidity1 Pregnancy 94 4.43 11 2.11 37 5.07 46 5.292 or more pregnancies 200 5.04 56 5.51 65 4.83 79 4.94Unknown 2 -- -- -- <5 -- -- --
PluralitySingleton 272 4.58 62 4.13 92 4.54 118 4.88Multiple 24 12.83 5 12.25 12 19.31 7 8.33Unknown -- -- -- -- -- -- -- --
Characteristic 1999–20031990–19931984–1989 1994–1998Total 1968–1972 1973–1978 1979–1983
Period
Cases Percent Cases Percent Cases Percent Cases Percent Cases Percent Cases Percent Cases Percent Cases PercentBirth outcome
Live birth 258 87.2 55 82.1 91 87.5 112 89.6Stillbirth 23 7.8 9 13.4 6 5.8 8 6.4Elective termination 15 5.1 <5 -- 7 6.7 5 4.0Unknown -- -- -- -- -- -- -- --
Age at diagnosisPrenatally or <7days 208 70.3 58 86.6 73 70.2 77 61.68 days–6 months 43 14.5 7 10.4 20 19.2 16 12.86 months–1 year 24 8.1 <5 -- 5 4.8 17 13.61–5 years 4 1.4 -- -- -- -- <5 -->5 years -- -- -- -- -- -- -- --Unknown 17 5.7 -- -- 6 5.8 11 8.8
Socioeconomic status§
Upper 70 23.6 23 34.3 31 29.8 16 12.8Middle 79 26.7 20 29.9 35 33.7 24 19.2Lower 83 28.0 23 34.3 32 30.8 28 22.4Unknown 64 21.6 <5 -- 6 5.8 57 45.6
1999–2003Characteristic Total 1968–1972 1973–1978 1979–1983 1984–1989 1990–1993 1994–1998
* Numbers of cases and prevalence estimates are not provided for hydrocephalus prior to 1990 because a specific definition for this defect was not applied to all cases prior to that
time. Cells containing fewer than 5 cases are indicated as “<5”. Prevalence estimates based on these cells are indicated as less than the prevalence based on 5 cases in Table a. Per-centages based on these cells are not provided in Table b . Cells containing zero cases are indicated as "--". Cells in years for which no data are provided are left blank. Counts are provided, but prevalences are not estimated, for strata with unknown values in Table a. Counts and percentages are provided for strata with unknown values in Table b.
** Prev = Prevalence. † Data on Hispanic or Latino ethnicity were available beginning in 1990. § Information about socioeconomic status was available only for 1979-2001.
Table 10a Hydrocephalus: Prevalence (per 10,000 live births) stratified by descriptive characteristics, MACDP, 1990–2003*
Table 10b Hydrocephalus: Percentage of cases by descriptive characteristics, MACDP, 1990–2003*

72
Cases Prev** Cases Prev Cases Prev Cases Prev Cases Prev Cases Prev Cases Prev Cases PrevTotal 265 2.15 12 0.87 38 2.65 41 3.02 41 2.02 28 1.81 44 2.11 61 2.44Maternal age (years)
<25 109 2.22 7 0.89 19 2.60 21 3.47 19 2.42 13 2.38 12 1.78 18 2.2825–29 64 1.81 <5 <1.34 11 2.48 10 2.38 12 1.89 5 1.11 8 1.45 15 2.29>30 92 2.38 <5 <2.30 8 3.15 10 3.04 10 1.65 10 1.83 24 2.79 28 2.65Unknown -- -- -- -- -- -- -- -- -- -- -- -- -- -- -- --
Maternal race/ethnicity†
White 141 2.10 9 0.91 22 2.37 19 2.29 22 1.79 16 2.01 24 2.45 29 3.03Black or African American 102 2.43 -- -- 16 3.26 22 4.35 17 2.24 10 1.56 17 2.02 20 2.08Hispanic or Latino 15 2.31 -- -- -- -- -- -- -- -- <5 <8.47 <5 <3.01 10 2.35All Other Races 7 0.92 <5‡ <1.29 -- -- -- -- <5 <11.48 -- -- -- -- <5 <3.27Unknown -- -- -- -- -- -- -- -- -- -- -- -- -- -- -- --
Birth weight (grams)<2500 68 6.45 5 4.15 13 10.53 13 11.09 6 3.69 5 3.74 11 6.15 15 6.86>2500 197 1.75 7 0.56 25 1.93 28 2.26 35 1.88 23 1.63 33 1.73 46 2.02Unknown -- -- -- -- -- -- -- -- -- -- -- -- -- -- -- --
Gestational age (weeks)20–36 60 5.25 <5 <4.73 7 5.79 11 8.92 6 3.04 6 3.77 10 5.14 16 6.59>37 201 1.91 7 0.60 31 2.57 30 2.65 33 1.97 22 1.69 33 1.78 45 2.03Unknown <5 -- <5 -- -- -- -- -- <5 -- -- -- <5 -- -- --
SexMale 128 2.03 <5 <0.71 17 2.30 20 2.88 16 1.54 16 2.03 27 2.53 28 2.20Female 135 2.24 7 1.04 21 3.01 21 3.18 24 2.43 12 1.59 17 1.66 33 2.69Ambiguous/Unknown <5 -- <5 -- -- -- -- -- <5 -- -- -- -- -- -- --
Parity1 Live birth 107 1.98 5 0.96 12 1.66 12 1.89 13 1.45 11 1.65 23 2.50 31 2.942 or more live births 149 2.22 <5 <0.69 25 3.51 27 3.75 26 2.37 17 1.95 21 1.81 30 2.09Unknown 9 -- <5 -- <5 -- <5 -- <5 -- -- -- -- -- -- --
Gravidity1 Pregnancy 81 1.75 <5 <1.03 11 1.64 10 1.53 14 1.98 8 1.54 11 1.51 23 2.642 or more pregnancies 183 2.45 8 1.06 26 3.40 31 4.43 27 2.10 20 1.97 33 2.45 38 2.37Unknown <5 -- -- -- <5 -- -- -- -- -- -- -- -- -- -- --
PluralitySingleton 256 2.13 12 0.89 36 2.56 39 2.94 40 2.02 28 1.86 44 2.17 57 2.36Multiple 9 2.88 -- -- <5 <18.50 <5 <18.44 <5 <10.81 -- -- -- -- <5 <5.95Unknown -- -- -- -- -- -- -- -- -- -- -- -- -- -- -- --
Characteristic 1999–20031990–19931984–1989 1994–1998Period
Total 1968–1972 1973–1978 1979–1983
Cases Percent Cases Percent Cases Percent Cases Percent Cases Percent Cases Percent Cases Percent Cases PercentBirth outcome
Live birth 262 98.9 10 83.3 38 100.0 41 100.0 41 100.0 28 100.0 43 97.7 61 100.0Stillbirth <5 -- <5 -- -- -- -- -- -- -- -- -- -- -- -- --Elective termination <5 -- -- -- -- -- -- -- -- -- -- -- <5 -- -- --Unknown -- -- -- -- -- -- -- -- -- -- -- -- -- -- -- --
Age at diagnosisPrenatally or <7days 162 61.1 11 91.7 24 63.2 27 65.9 26 63.4 19 67.9 26 59.1 29 47.58 days–6 months 67 25.3 <5 -- 9 23.7 6 14.6 12 29.3 8 28.6 13 29.5 18 29.56 months–1 year 19 7.2 -- -- <5 -- 8 19.5 <5 -- -- -- <5 -- <5 --1–5 years <5 -- -- -- -- -- -- -- -- -- <5 -- <5 -- <5 -->5 years <5 -- -- -- -- -- -- -- -- -- -- -- <5 -- -- --Unknown 13 4.9 -- -- <5 -- -- -- -- -- -- -- <5 -- 11 18.0
Socioeconomic status§
Upper 62 23.4 -- -- -- -- 14 34.1 13 31.7 13 46.4 13 29.5 9 14.8Middle 61 23.0 -- -- -- -- 7 17.1 12 29.3 6 21.4 20 45.5 16 26.2Lower 56 21.1 -- -- -- -- 20 48.8 15 36.6 8 28.6 9 20.5 <5 --Unknown 86 32.5 12 100.0 38 100.0 -- -- <5 -- <5 -- <5 -- 32 52.5
CharacteristicPeriod
Total 1968–1972 1973–1978 1979–1983 1984–1989 1990–1993 1994–1998 1999–2003
* Cells containing fewer than 5 cases are indicated as “<5”. Prevalence estimates based on these cells are indicated as less than the prevalence based on 5 cases in Table a.
Percentages based on these cells are not provided in Table b. Cells containing zero cases are indicated as "--". Counts are provided, but prevalences are not estimated, for strata with unknown values in Table a. Counts and percentages are provided for strata with unknown values in Table b.
** Prev = Prevalence. † Data on Hispanic or Latino ethnicity were available beginning in 1990. ‡ The category of All Other Races includes <5 cases of Black or African American race. § Information about socioeconomic status was available only for 1979-2001.
Table 11a Congenital cataract: Prevalence (per 10,000 live births) stratified by descriptive characteristics, MACDP, 1968–2003*
Table 11b Congenital cataract: Percentage of cases by descriptive characteristics, MACDP, 1968–2003*
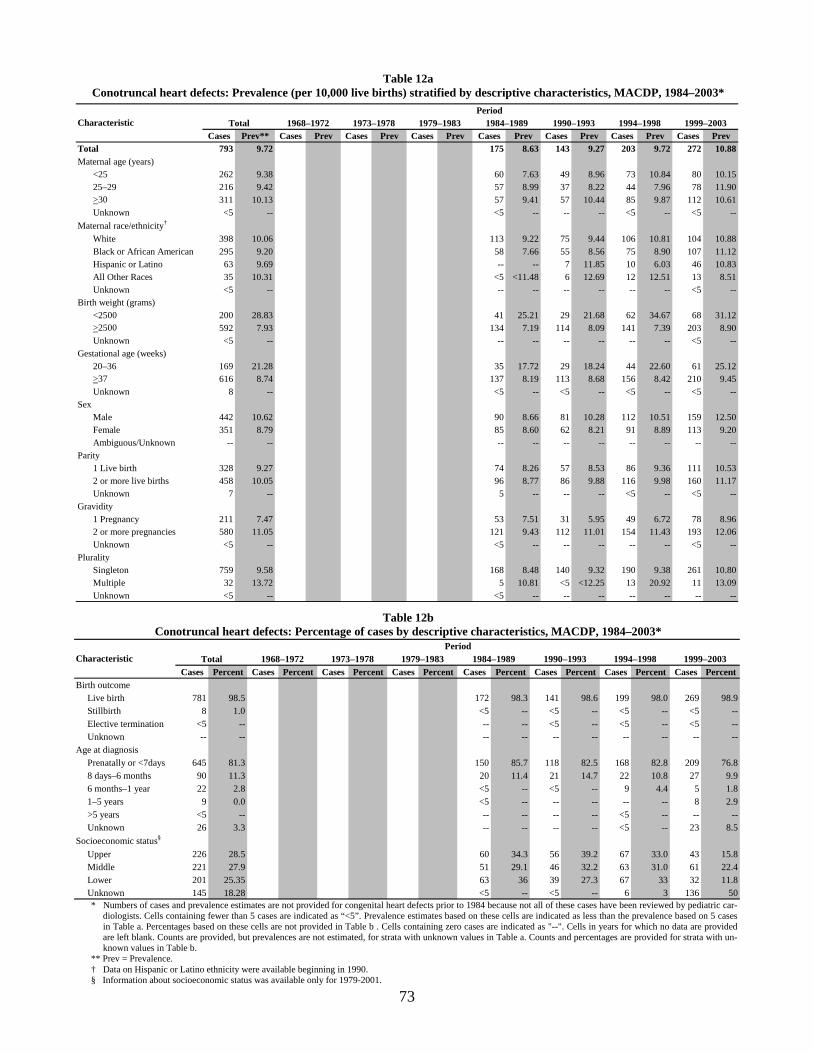
73
Period
Cases Prev** Cases Prev Cases Prev Cases Prev Cases Prev Cases Prev Cases Prev Cases PrevTotal 793 9.72 175 8.63 143 9.27 203 9.72 272 10.88Maternal age (years)
<25 262 9.38 60 7.63 49 8.96 73 10.84 80 10.1525–29 216 9.42 57 8.99 37 8.22 44 7.96 78 11.90>30 311 10.13 57 9.41 57 10.44 85 9.87 112 10.61Unknown <5 -- <5 -- -- -- <5 -- <5 --
Maternal race/ethnicity†
White 398 10.06 113 9.22 75 9.44 106 10.81 104 10.88Black or African American 295 9.20 58 7.66 55 8.56 75 8.90 107 11.12Hispanic or Latino 63 9.69 -- -- 7 11.85 10 6.03 46 10.83All Other Races 35 10.31 <5 <11.48 6 12.69 12 12.51 13 8.51Unknown <5 -- -- -- -- -- -- -- <5 --
Birth weight (grams)<2500 200 28.83 41 25.21 29 21.68 62 34.67 68 31.12>2500 592 7.93 134 7.19 114 8.09 141 7.39 203 8.90Unknown <5 -- -- -- -- -- -- -- <5 --
Gestational age (weeks)20–36 169 21.28 35 17.72 29 18.24 44 22.60 61 25.12>37 616 8.74 137 8.19 113 8.68 156 8.42 210 9.45Unknown 8 -- <5 -- <5 -- <5 -- <5 --
SexMale 442 10.62 90 8.66 81 10.28 112 10.51 159 12.50Female 351 8.79 85 8.60 62 8.21 91 8.89 113 9.20Ambiguous/Unknown -- -- -- -- -- -- -- -- -- --
Parity1 Live birth 328 9.27 74 8.26 57 8.53 86 9.36 111 10.532 or more live births 458 10.05 96 8.77 86 9.88 116 9.98 160 11.17Unknown 7 -- 5 -- -- -- <5 -- <5 --
Gravidity1 Pregnancy 211 7.47 53 7.51 31 5.95 49 6.72 78 8.962 or more pregnancies 580 11.05 121 9.43 112 11.01 154 11.43 193 12.06Unknown <5 -- <5 -- -- -- -- -- <5 --
PluralitySingleton 759 9.58 168 8.48 140 9.32 190 9.38 261 10.80Multiple 32 13.72 5 10.81 <5 <12.25 13 20.92 11 13.09Unknown <5 -- <5 -- -- -- -- -- -- --
Characteristic Total 1968–1972 1973–1978 1999–20031979–1983 1984–1989 1990–1993 1994–1998
Cases Percent Cases Percent Cases Percent Cases Percent Cases Percent Cases Percent Cases Percent Cases PercentBirth outcome
Live birth 781 98.5 172 98.3 141 98.6 199 98.0 269 98.9Stillbirth 8 1.0 <5 -- <5 -- <5 -- <5 --Elective termination <5 -- -- -- <5 -- <5 -- <5 --Unknown -- -- -- -- -- -- -- -- -- --
Age at diagnosisPrenatally or <7days 645 81.3 150 85.7 118 82.5 168 82.8 209 76.88 days–6 months 90 11.3 20 11.4 21 14.7 22 10.8 27 9.96 months–1 year 22 2.8 <5 -- <5 -- 9 4.4 5 1.81–5 years 9 0.0 <5 -- -- -- -- -- 8 2.9>5 years <5 -- -- -- -- -- <5 -- -- --Unknown 26 3.3 -- -- -- -- <5 -- 23 8.5
Socioeconomic status§
Upper 226 28.5 60 34.3 56 39.2 67 33.0 43 15.8Middle 221 27.9 51 29.1 46 32.2 63 31.0 61 22.4Lower 201 25.35 63 36 39 27.3 67 33 32 11.8Unknown 145 18.28 <5 -- <5 -- 6 3 136 50
1999–2003Characteristic Total 1968–1972 1973–1978 1979–1983 1984–1989 1990–1993 1994–1998Period
* Numbers of cases and prevalence estimates are not provided for congenital heart defects prior to 1984 because not all of these cases have been reviewed by pediatric car-
diologists. Cells containing fewer than 5 cases are indicated as “<5”. Prevalence estimates based on these cells are indicated as less than the prevalence based on 5 cases in Table a. Percentages based on these cells are not provided in Table b . Cells containing zero cases are indicated as "--". Cells in years for which no data are provided are left blank. Counts are provided, but prevalences are not estimated, for strata with unknown values in Table a. Counts and percentages are provided for strata with un-known values in Table b.
** Prev = Prevalence. † Data on Hispanic or Latino ethnicity were available beginning in 1990. § Information about socioeconomic status was available only for 1979-2001.
Table 12a Conotruncal heart defects: Prevalence (per 10,000 live births) stratified by descriptive characteristics, MACDP, 1984–2003*
Table 12b Conotruncal heart defects: Percentage of cases by descriptive characteristics, MACDP, 1984–2003*

74
Cases Prev** Cases Prev Cases Prev Cases Prev Cases Prev Cases Prev Cases Prev Cases PrevTotal 192 2.35 47 2.32 34 2.20 49 2.35 62 2.48Maternal age (years)
<25 61 2.18 15 1.91 12 2.20 14 2.08 20 2.5425–29 54 2.36 13 2.05 10 2.22 15 2.71 16 2.44>30 76 2.48 18 2.97 12 2.20 20 2.32 26 2.46Unknown <5 -- <5 -- -- -- -- -- -- --
Maternal race/ethnicity†
White 105 2.65 34 2.77 18 2.27 30 3.06 23 2.41Black or African American 61 1.90 12 1.58 14 2.18 15 1.78 20 2.08Hispanic or Latino 15 2.31 -- -- <5 <8.47 <5 <3.01 13 3.06All Other Races 10 2.95 <5 <11.48 <5 <10.58 <5 <5.21 5 3.27Unknown <5 -- -- -- -- -- -- -- <5 --
Birth weight (grams)<2500 23 3.32 8 4.92 <5 <3.74 10 5.59 <5 <2.29>2500 169 2.26 39 2.09 32 2.27 39 2.04 59 2.59Unknown -- -- -- -- -- -- -- -- -- --
Gestational age (weeks)20–36 22 2.77 6 3.04 <5 <3.14 7 3.60 5 2.06>37 166 2.36 41 2.45 29 2.23 40 2.16 56 2.52Unknown <5 -- -- -- <5 -- <5 -- <5 --
SexMale 116 2.79 23 2.21 23 2.92 31 2.91 39 3.07Female 76 1.90 24 2.43 11 1.46 18 1.76 23 1.87Ambiguous/Unknown -- -- -- -- -- -- -- -- -- --
Parity1 Live birth 75 2.12 18 2.01 17 2.54 17 1.85 23 2.182 or more live births 115 2.52 28 2.56 17 1.95 31 2.67 39 2.72Unknown <5 -- <5 -- -- -- <5 -- -- --
Gravidity1 Pregnancy 47 1.66 10 1.42 8 1.54 13 1.78 16 1.842 or more pregnancies 144 2.74 36 2.81 26 2.56 36 2.67 46 2.87Unknown <5 -- <5 -- -- -- -- -- -- --
PluralitySingleton 186 2.35 45 2.27 34 2.26 46 2.27 61 2.52Multiple 5 2.14 <5 <10.81 -- -- <5 <8.05 <5 <5.95Unknown <5 -- <5 -- -- -- -- -- -- --
Characteristic 1999–20031990–19931984–1989 1994–1998Period
Total 1968–1972 1973–1978 1979–1983
Period
Cases Percent Cases Percent Cases Percent Cases Percent Cases Percent Cases Percent Cases Percent Cases PercentBirth outcome
Live birth 191 99.5 46 97.9 34 100.0 49 100.0 62 100.0Stillbirth <5 -- <5 -- -- -- -- -- -- --Elective termination -- -- -- -- -- -- -- -- -- --Unknown -- -- -- -- -- -- -- -- -- --
Age at diagnosisPrenatally or <7days 170 88.5 43 91.5 29 85.3 45 91.8 53 85.58 days–6 months 17 8.9 <5 -- <5 -- <5 -- 5 8.16 months–1 year <5 0.5 -- -- <5 -- -- -- -- --1–5 years -- -- -- -- -- -- -- -- -- -->5 years -- -- -- -- -- -- -- -- -- --Unknown <5 -- -- -- -- -- -- -- <5 --
Socioeconomic status§
Upper 61 31.8 20 42.6 14 41.2 15 30.6 12 19.4Middle 52 27.1 12 25.5 10 29.4 15 30.6 15 24.2Lower 49 25.5 15 31.9 10 29.4 17 34.7 7 11.3Unknown 30 15.6 -- -- -- -- <5 -- 28 45.2
Characteristic Total 1968–1972 1973–1978 1999–20031979–1983 1984–1989 1990–1993 1994–1998
* Numbers of cases and prevalence estimates are not provided for congenital heart defects prior to 1984 because not all of these cases have been reviewed by pediatric cardi-
ologists. Cells containing fewer than 5 cases are indicated as “<5”. Prevalence estimates based on these cells are indicated as less than the prevalence based on 5 cases in Ta-ble a. Percentages based on these cells are not provided in Table b . Cells containing zero cases are indicated as "--". Cells in years for which no data are provided are left blank. Counts are provided, but prevalences are not estimated, for strata with unknown values in Table a. Counts and percentages are provided for strata with unknown val-ues in Table b.
** Prev = Prevalence. † Data on Hispanic or Latino ethnicity were available beginning in 1990. § Information about socioeconomic status was available only for 1979-2001.
Table 13a Dextrotransposition of the great arteries: Prevalence (per 10,000 live births) stratified
by descriptive characteristics, MACDP, 1984–2003*
Table 13b Dextrotransposition of the great arteries: Percentage of cases by descriptive characteristics, MACDP, 1984–2003*

75
Cases Prev** Cases Prev Cases Prev Cases Prev Cases Prev Cases Prev Cases Prev Cases PrevTotal 376 4.61 94 4.64 71 4.60 93 4.45 118 4.72Maternal age (years)
<25 116 4.15 31 3.94 22 4.02 35 5.20 28 3.5525–29 108 4.71 35 5.52 21 4.67 15 2.71 37 5.65>30 149 4.85 28 4.62 28 5.13 42 4.88 51 4.83Unknown <5 -- -- -- -- -- <5 -- <5 --
Maternal race/ethnicity†
White 184 4.65 56 4.57 35 4.41 45 4.59 48 5.02Black or African American 151 4.71 35 4.62 28 4.36 41 4.86 47 4.88Hispanic or Latino 24 3.69 -- -- 5 8.47 <5 <3.01 16 3.77All Other Races 16 4.71 <5 <11.48 <5 <10.58 <5 <5.21 6 3.93Unknown <5 -- -- -- -- -- -- -- <5 --
Birth weight (grams)<2500 114 16.43 26 15.99 16 11.96 36 20.13 36 16.47>2500 261 3.50 68 3.65 55 3.90 57 2.99 81 3.55Unknown <5 -- -- -- -- -- -- -- <5 --
Gestational age (weeks)20–36 89 10.96 25 12.66 12 7.55 23 11.82 29 11.94>37 283 3.99 66 3.94 59 4.53 69 3.73 89 4.01Unknown <5 -- <5 -- -- -- <5 -- -- --
SexMale 204 4.90 45 4.33 36 4.57 50 4.69 73 5.74Female 172 4.31 49 4.96 35 4.63 43 4.20 45 3.66Ambiguous/Unknown -- -- -- -- -- -- -- -- -- --
Parity1 Live birth 161 4.55 43 4.80 26 3.89 46 5.01 46 4.362 or more live births 212 4.65 49 4.48 45 5.17 47 4.05 71 4.96Unknown <5 -- <5 -- -- -- -- -- <5 --
Gravidity1 Pregnancy 108 3.82 33 4.68 14 2.69 25 3.43 36 4.142 or more pregnancies 267 5.09 61 4.75 57 5.60 68 5.05 81 5.06Unknown <5 -- -- -- -- -- -- -- <5 --
PluralitySingleton 360 4.54 89 4.49 70 4.66 87 4.29 114 4.72Multiple 15 6.43 <5 <10.81 <5 <12.25 6 9.66 <5 <5.95Unknown <5 -- <5 -- -- -- -- -- -- --
Characteristic 1999–20031990–19931984–1989 1994–1998Period
Total 1968–1972 1973–1978 1979–1983
Period
Cases Percent Cases Percent Cases Percent Cases Percent Cases Percent Cases Percent Cases Percent Cases PercentBirth outcome
Live birth 371 98.7 94 100.0 69 97.2 91 97.8 117 99.2Stillbirth <5 -- -- -- <5 -- <5 -- <5 --Elective termination <5 -- -- -- <5 -- -- -- -- --Unknown -- -- -- -- -- -- -- -- -- --
Age at diagnosisPrenatally or <7days 322 85.6 82 87.2 61 85.9 80 86.0 99 83.98 days–6 months 35 9.3 8 8.5 9 12.7 9 9.7 9 7.66 months–1 year 6 1.6 <5 -- <5 -- <5 -- -- --1–5 years <5 -- <5 -- -- -- -- -- -- -->5 years -- -- -- -- -- -- -- -- -- --Unknown 12 3.2 -- -- -- -- <5 -- 10 8.5
Socioeconomic status§
Upper 102 27.1 30 31.9 26 36.6 31 33.3 15 12.7Middle 109 29.0 27 28.7 24 33.8 30 32.3 28 23.7Lower 97 25.8 36 38.3 20 28.2 29 31.2 12 10.2Unknown 68 18.1 <5 -- <5 -- <5 -- 63 53.4
Characteristic Total 1968–1972 1973–1978 1999–20031979–1983 1984–1989 1990–1993 1994–1998
* Numbers of cases and prevalence estimates are not provided for congenital heart defects prior to 1984 because not all of these cases have been reviewed by pediatric cardi-
ologists. Cells containing fewer than 5 cases are indicated as “<5”. Prevalence estimates based on these cells are indicated as less than the prevalence based on 5 cases in Ta-ble a. Percentages based on these cells are not provided in Table b . Cells containing zero cases are indicated as "--". Cells in years for which no data are provided are left blank. Counts are provided, but prevalences are not estimated, for strata with unknown values in Table a. Counts and percentages are provided for strata with unknown val-ues in Table b.
** Prev = Prevalence. † Data on Hispanic or Latino ethnicity were available beginning in 1990. § Information about socioeconomic status was available only for 1979-2001.
Table 14a Tetralogy of Fallot: Prevalence (per 10,000 live births) stratified by descriptive characteristics, MACDP, 1984–2003*
Table 14b Tetralogy of Fallot: Percentage of cases by descriptive characteristics, MACDP, 1984–2003*

76
\
Cases Prev** Cases Prev Cases Prev Cases Prev Cases Prev Cases Prev Cases Prev Cases PrevTotal 302 3.70 71 3.50 48 3.11 87 4.17 96 3.84Maternal age (years)
<25 78 2.79 26 3.31 9 1.65 23 3.42 20 2.5425–29 61 2.66 18 2.84 12 2.67 12 2.17 19 2.90>30 161 5.25 26 4.29 27 4.94 51 5.92 57 5.40Unknown <5 -- <5 -- -- -- <5 -- -- --
Maternal race/ethnicity†
White 155 3.92 45 3.67 24 3.02 51 5.20 35 3.66Black or African American 123 3.84 25 3.30 21 3.27 31 3.68 46 4.78Hispanic or Latino 11 1.69 -- -- -- -- <5 <3.01 10 2.35All Other Races 12 3.53 <5 <11.48 <5 <10.58 <5 <5.21 5 3.27Unknown <5 -- -- -- -- -- <5 -- -- --
Birth weight (grams)<2500 93 13.41 19 11.68 15 11.21 25 13.98 34 15.56>2500 207 2.77 52 2.79 33 2.34 60 3.14 62 2.72Unknown <5 -- -- -- -- -- <5 -- -- --
Gestational age (weeks)20–36 85 10.20 17 8.61 13 8.18 25 12.84 30 12.35>37 211 2.97 49 2.93 34 2.61 62 3.35 66 2.97Unknown 6 -- 5 -- <5 -- -- -- -- --
SexMale 129 3.10 32 3.08 24 3.05 36 3.38 37 2.91Female 172 4.31 39 3.95 24 3.18 51 4.98 58 4.72Ambiguous/Unknown <5 -- -- -- -- -- -- -- <5 --
Parity1 Live birth 114 3.22 30 3.35 16 2.39 35 3.81 33 3.132 or more live births 184 4.04 38 3.47 32 3.68 52 4.48 62 4.33Unknown <5 -- <5 -- -- -- -- -- <5 --
Gravidity1 Pregnancy 74 2.62 21 2.98 8 1.54 24 3.29 21 2.412 or more pregnancies 226 4.31 49 3.82 40 3.93 63 4.68 74 4.62Unknown <5 -- <5 -- -- -- -- -- <5 --
PluralitySingleton 286 3.61 69 3.48 48 3.19 83 4.10 86 3.56Multiple 16 6.86 <5 <10.81 -- -- <5 <8.05 10 11.90Unknown -- -- -- -- -- -- -- -- -- --
Characteristic 1999–20031990–19931984–1989 1994–1998Period
Total 1968–1972 1973–1978 1979–1983
Cases Percent Cases Percent Cases Percent Cases Percent Cases Percent Cases Percent Cases Percent Cases PercentBirth outcome
Live birth 279 92.4 66 93.0 47 97.9 77 88.5 89 92.7Stillbirth 11 3.6 <5 -- <5 -- <5 -- <5 --Elective termination 12 4.0 <5 -- -- -- 6 6.9 5 5.2Unknown -- -- -- -- -- -- -- -- -- --
Age at diagnosisPrenatally or <7days 246 81.5 60 84.5 40 83.3 72 82.8 74 77.18 days–6 months 29 9.6 8 11.3 6 12.5 8 9.2 7 7.36 months–1 year 7 2.3 <5 -- <5 -- <5 -- -- --1–5 years <5 -- -- -- -- -- <5 -- -- -->5 years -- -- -- -- -- -- -- -- -- --Unknown 19 6.3 <5 -- -- -- <5 -- 15 15.6
Socioeconomic status§
Upper 98 32.5 33 46.5 19 39.6 31 35.6 15 15.6Middle 68 22.5 12 16.9 11 22.9 27 31.0 18 18.8Lower 92 30.5 26 36.6 17 35.4 27 31 22 22.9Unknown 44 14.6 -- -- <5 -- <5 -- 41 42.7
1999–2003Characteristic Total 1968–1972 1973–1978 1979–1983 1984–1989 1990–1993 1994–1998Period
* Numbers of cases and prevalence estimates are not provided for congenital heart defects prior to 1984 because not all of these cases have been reviewed by pediatric cardi-
ologists. Cells containing fewer than 5 cases are indicated as “<5”. Prevalence estimates based on these cells are indicated as less than the prevalence based on 5 cases in Table a. Percentages based on these cells are not provided in Table b . Cells containing zero cases are indicated as "--". Cells in years for which no data are provided are left blank. Counts are provided, but prevalences are not estimated, for strata with unknown values in Table a. Counts and percentages are provided for strata with unknown val-ues in Table b.
** Prev = Prevalence. † Data on Hispanic or Latino ethnicity were available beginning in 1990. § Information about socioeconomic status was available only for 1979-2001.
Table 15a Atrioventricular septal defect: Prevalence (per 10,000 live births) stratified
by descriptive characteristics, MACDP, 1984–2003*
Table 15b Atrioventricular septal defect: Percentage of cases by descriptive characteristics, MACDP, 1984–2003*

77
Cases Prev** Cases Prev Cases Prev Cases Prev Cases Prev Cases Prev Cases Prev Cases PrevTotal 186 2.28 54 2.66 32 2.07 49 2.35 51 2.04Maternal age (years)
<25 50 1.79 21 2.67 5 0.91 12 1.78 12 1.5225–29 31 1.35 15 2.37 8 1.78 <5 <0.90 6 0.92>30 104 3.39 18 2.97 19 3.48 34 3.95 33 3.13Unknown <5 -- -- -- -- -- <5 -- -- --
Maternal race/ethnicity†
White 90 2.27 29 2.37 17 2.14 27 2.75 17 1.78Black or African American 77 2.40 24 3.17 12 1.87 19 2.25 22 2.29Hispanic or Latino 9 1.38 -- -- <5 <8.47 <5 <3.01 7 1.65All Other Races 9 2.65 <5 <11.48 <5 <10.58 <5 <5.21 5 3.27Unknown <5 -- -- -- -- -- <5 -- -- --
Birth weight (grams)<2500 59 8.50 17 10.45 9 6.73 14 7.83 19 8.69>2500 125 1.67 37 1.99 23 1.63 33 1.73 32 1.40Unknown <5 -- -- -- -- -- <5 -- -- --
Gestational age (weeks)20–36 53 6.55 15 7.60 9 5.66 12 6.16 17 7.00>37 126 1.76 33 1.97 22 1.69 37 2.00 34 1.53Unknown 7 -- 6 -- <5 -- -- -- -- --
SexMale 84 2.02 24 2.31 19 2.41 22 2.07 19 1.49Female 102 2.55 30 3.03 13 1.72 27 2.64 32 2.61Ambiguous/Unknown -- -- -- -- -- -- -- -- -- --
Parity1 Live birth 69 1.95 18 2.01 12 1.80 18 1.96 21 1.992 or more live births 117 2.57 36 3.29 20 2.30 31 2.67 30 2.09Unknown -- -- -- -- -- -- -- -- -- --
Gravidity1 Pregnancy 40 1.42 11 1.56 6 1.15 10 1.37 13 1.492 or more pregnancies 146 2.78 43 3.35 26 2.56 39 2.90 38 2.37Unknown -- -- -- -- -- -- -- -- -- --
PluralitySingleton 176 2.22 52 2.62 32 2.13 47 2.32 45 1.86Multiple 10 4.29 <5 <10.81 -- -- <5 <8.05 6 7.14Unknown -- -- -- -- -- -- -- -- -- --
Characteristic 1999–20031990–19931984–1989 1994–1998Period
Total 1968–1972 1973–1978 1979–1983
Cases Percent Cases Percent Cases Percent Cases Percent Cases Percent Cases Percent Cases Percent Cases PercentBirth outcome
Live birth 170 91.4 49 90.7 32 100.0 43 87.8 46 90.2Stillbirth 9 4.8 <5 -- -- -- <5 -- <5 --Elective termination 7 3.8 <5 -- -- -- <5 -- <5 --Unknown -- -- -- -- -- -- -- -- -- --
Age at diagnosisPrenatally or <7days 157 84.4 47 87.0 30 93.8 41 83.7 39 76.58 days–6 months 14 7.5 6 11.1 <5 -- <5 -- <5 --6 months–1 year <5 -- <5 -- -- -- <5 -- -- --1–5 years -- -- -- -- -- -- -- -- -- -->5 years -- -- -- -- -- -- -- -- -- --Unknown 12 6.5 -- -- -- -- <5 -- 10 19.6
Socioeconomic status§
Upper 65 34.9 19 35.2 16 50.0 21 42.9 9 17.6Middle 38 20.4 11 20.4 6 18.8 11 22.4 10 19.6Lower 62 33.3 24 44.4 10 31.3 16 32.7 12 23.5Unknown 21 11.3 -- -- -- -- <5 -- 20 39.2
1999–2003Characteristic Total 1968–1972 1973–1978 1979–1983 1984–1989 1990–1993 1994–1998Period
* Numbers of cases and prevalence estimates are not provided for congenital heart defects prior to 1984 because not all of these cases have been reviewed by pediatric cardi-
ologists. Cells containing fewer than 5 cases are indicated as “<5”. Prevalence estimates based on these cells are indicated as less than the prevalence based on 5 cases in Ta-ble a. Percentages based on these cells are not provided in Table b . Cells containing zero cases are indicated as "--". Cells in years for which no data are provided are left blank. Counts are provided, but prevalences are not estimated, for strata with unknown values in Table a. Counts and percentages are provided for strata with unknown val-ues in Table b.
** Prev = Prevalence. † Data on Hispanic or Latino ethnicity were available beginning in 1990. § Information about socioeconomic status was available only for 1979-2001.
Table 16a Complete atrioventricular septal defect: Prevalence (per 10,000 live births) stratified
by descriptive characteristics, MACDP, 1984–2003*
Table 16b Complete atrioventricular septal defect: Percentage of cases by descriptive characteristics, MACDP, 1984–2003*

78
Cases Prev** Cases Prev Cases Prev Cases Prev Cases Prev Cases Prev Cases Prev Cases PrevTotal 346 4.24 56 2.76 45 2.92 116 5.55 129 5.16Maternal age (years)
<25 95 3.40 19 2.42 14 2.56 28 4.16 34 4.3125–29 101 4.41 19 3.00 11 2.44 31 5.61 40 6.10>30 149 4.85 18 2.97 20 3.66 56 6.50 55 5.21Unknown <1 -- -- -- -- -- <5 -- -- --
Maternal race/ethnicity†
White 164 4.14 32 2.61 25 3.15 54 5.51 53 5.54Black or African American 152 4.74 24 3.17 17 2.65 55 6.52 56 5.82Hispanic or Latino 21 3.23 -- -- <5 <8.47 <5 <3.01 15 3.53All Other Races 8 2.36 -- -- -- -- <5 <5.21 5 3.27Unknown <1 -- -- -- -- -- <5 -- -- --
Birth weight (grams)<2500 107 15.42 15 9.22 10 7.47 32 17.90 50 22.88>2500 239 3.20 41 2.20 35 2.48 84 4.40 79 3.46Unknown -- -- -- -- -- -- -- -- -- --
Gestational age (weeks)20–36 108 13.22 16 8.10 13 8.18 31 15.93 48 19.76>37 234 3.26 38 2.27 32 2.46 85 4.59 79 3.56Unknown <5 -- <5 -- -- -- -- -- <5 --
SexMale 155 3.72 30 2.89 18 2.28 48 4.51 59 4.64Female 191 4.78 26 2.63 27 3.57 68 6.65 70 5.70Ambiguous/Unknown -- -- -- -- -- -- -- -- -- --
Parity1 Live birth 129 3.65 21 2.34 16 2.39 45 4.90 47 4.462 or more live births 212 4.65 34 3.11 28 3.22 69 5.94 81 5.66Unknown 5 -- <5 -- <5 -- <5 -- <5 --
Gravidity1 Pregnancy 89 3.15 16 2.27 5 0.96 37 5.07 31 3.562 or more pregnancies 254 4.84 40 3.12 40 3.93 77 5.72 97 6.06Unknown <5 -- -- -- -- -- <5 -- <5 --
PluralitySingleton 317 4.00 54 2.73 41 2.73 105 5.18 117 4.84Multiple 29 12.43 <5 <10.81 <5 <12.25 11 17.70 12 14.28Unknown -- -- -- -- -- -- -- -- -- --
Characteristic 1999–20031990–19931984–1989 1994–1998Period
Total 1968–1972 1973–1978 1979–1983
Period
Cases Percent Cases Percent Cases Percent Cases Percent Cases Percent Cases Percent Cases Percent Cases PercentBirth outcome
Live birth 345 99.7 56 100.0 45 100.0 116 100.0 128 99.2Stillbirth -- -- -- -- -- -- -- -- -- --Elective termination <5 -- -- -- -- -- -- -- <5 --Unknown -- -- -- -- -- -- -- -- -- --
Age at diagnosisPrenatally or <7days 232 67.1 41 73.2 32 71.1 78 67.2 81 62.88 days–6 months 89 25.7 15 26.8 10 22.2 32 27.6 32 24.86 months–1 year 8 2.3 -- -- <5 -- <5 -- <5 --1–5 years 7 0.0 -- -- -- -- <5 -- 6 4.7>5 years -- -- -- -- -- -- -- -- -- --Unknown 10 2.9 -- -- -- -- <5 -- 8 6.2
Socioeconomic status§
Upper 100 28.9 22 39.3 16 35.6 40 34.5 22 17.1Middle 94 27.2 16 28.6 16 35.6 37 31.9 25 19.4Lower 88 25.4 18 32.1 11 24.4 31 26.7 28 21.7Unknown 64 18.5 -- -- <5 -- 8 6.9 54 41.9
Characteristic Total 1968–1972 1973–1978 1999–20031979–1983 1984–1989 1990–1993 1994–1998
* Numbers of cases and prevalence estimates are not provided for congenital heart defects prior to 1984 because not all of these cases have been reviewed by pediatric cardi-
ologists. Cells containing fewer than 5 cases are indicated as “<5”. Prevalence estimates based on these cells are indicated as less than the prevalence based on 5 cases in Ta-ble a. Percentages based on these cells are not provided in Table b . Cells containing zero cases are indicated as "--". Cells in years for which no data are provided are left blank. Counts are provided, but prevalences are not estimated, for strata with unknown values in Table a. Counts and percentages are provided for strata with unknown val-ues in Table b.
** Prev = Prevalence. † Data on Hispanic or Latino ethnicity were available beginning in 1990. § Information about socioeconomic status was available only for 1979-2001.
Table 17a Valvar pulmonary stenosis: Prevalence (per 10,000 live births) stratified
by descriptive characteristics, MACDP, 1984–2003*
Table 17b Valvar pulmonary stenosis: Percentage of cases by descriptive characteristics, MACDP, 1984–2003*
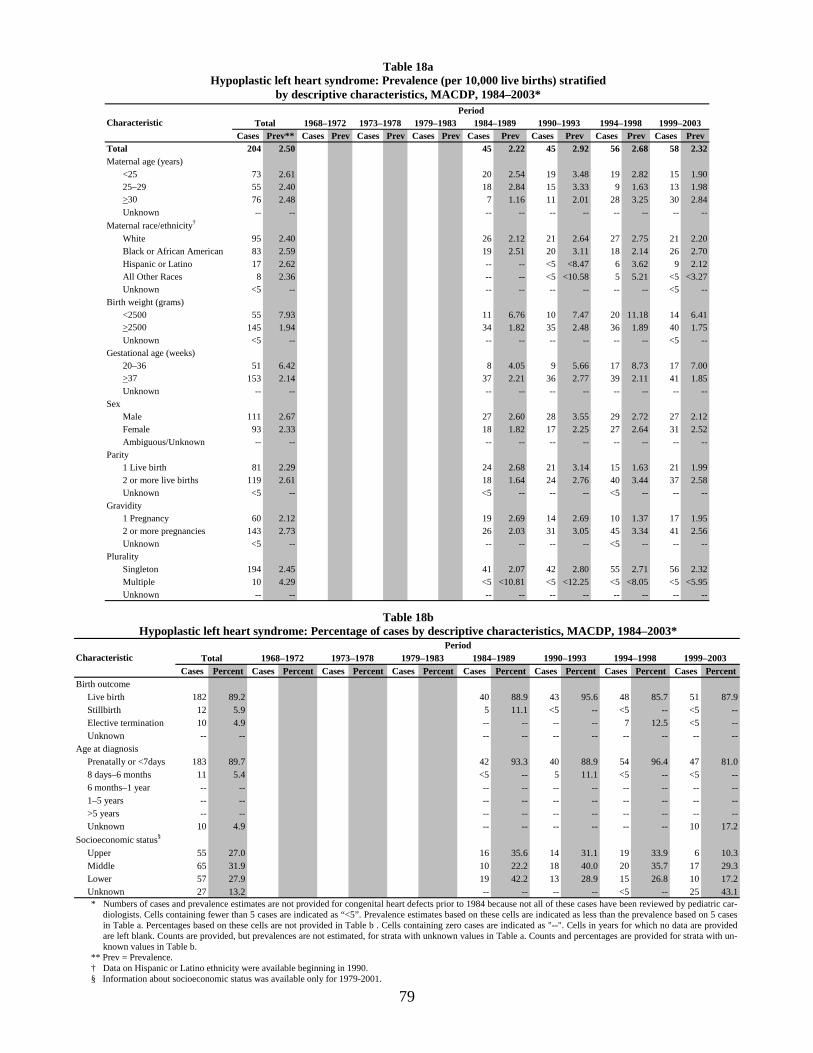
79
Cases Prev** Cases Prev Cases Prev Cases Prev Cases Prev Cases Prev Cases Prev Cases PrevTotal 204 2.50 45 2.22 45 2.92 56 2.68 58 2.32Maternal age (years)
<25 73 2.61 20 2.54 19 3.48 19 2.82 15 1.9025–29 55 2.40 18 2.84 15 3.33 9 1.63 13 1.98>30 76 2.48 7 1.16 11 2.01 28 3.25 30 2.84Unknown -- -- -- -- -- -- -- -- -- --
Maternal race/ethnicity†
White 95 2.40 26 2.12 21 2.64 27 2.75 21 2.20Black or African American 83 2.59 19 2.51 20 3.11 18 2.14 26 2.70Hispanic or Latino 17 2.62 -- -- <5 <8.47 6 3.62 9 2.12All Other Races 8 2.36 -- -- <5 <10.58 5 5.21 <5 <3.27Unknown <5 -- -- -- -- -- -- -- <5 --
Birth weight (grams)<2500 55 7.93 11 6.76 10 7.47 20 11.18 14 6.41>2500 145 1.94 34 1.82 35 2.48 36 1.89 40 1.75Unknown <5 -- -- -- -- -- -- -- <5 --
Gestational age (weeks)20–36 51 6.42 8 4.05 9 5.66 17 8.73 17 7.00>37 153 2.14 37 2.21 36 2.77 39 2.11 41 1.85Unknown -- -- -- -- -- -- -- -- -- --
SexMale 111 2.67 27 2.60 28 3.55 29 2.72 27 2.12Female 93 2.33 18 1.82 17 2.25 27 2.64 31 2.52Ambiguous/Unknown -- -- -- -- -- -- -- -- -- --
Parity1 Live birth 81 2.29 24 2.68 21 3.14 15 1.63 21 1.992 or more live births 119 2.61 18 1.64 24 2.76 40 3.44 37 2.58Unknown <5 -- <5 -- -- -- <5 -- -- --
Gravidity1 Pregnancy 60 2.12 19 2.69 14 2.69 10 1.37 17 1.952 or more pregnancies 143 2.73 26 2.03 31 3.05 45 3.34 41 2.56Unknown <5 -- -- -- -- -- <5 -- -- --
PluralitySingleton 194 2.45 41 2.07 42 2.80 55 2.71 56 2.32Multiple 10 4.29 <5 <10.81 <5 <12.25 <5 <8.05 <5 <5.95Unknown -- -- -- -- -- -- -- -- -- --
Characteristic 1999–20031990–19931984–1989 1994–1998Period
Total 1968–1972 1973–1978 1979–1983
Cases Percent Cases Percent Cases Percent Cases Percent Cases Percent Cases Percent Cases Percent Cases PercentBirth outcome
Live birth 182 89.2 40 88.9 43 95.6 48 85.7 51 87.9Stillbirth 12 5.9 5 11.1 <5 -- <5 -- <5 --Elective termination 10 4.9 -- -- -- -- 7 12.5 <5 --Unknown -- -- -- -- -- -- -- -- -- --
Age at diagnosisPrenatally or <7days 183 89.7 42 93.3 40 88.9 54 96.4 47 81.08 days–6 months 11 5.4 <5 -- 5 11.1 <5 -- <5 --6 months–1 year -- -- -- -- -- -- -- -- -- --1–5 years -- -- -- -- -- -- -- -- -- -->5 years -- -- -- -- -- -- -- -- -- --Unknown 10 4.9 -- -- -- -- -- -- 10 17.2
Socioeconomic status§
Upper 55 27.0 16 35.6 14 31.1 19 33.9 6 10.3Middle 65 31.9 10 22.2 18 40.0 20 35.7 17 29.3Lower 57 27.9 19 42.2 13 28.9 15 26.8 10 17.2Unknown 27 13.2 -- -- -- -- <5 -- 25 43.1
1999–2003Characteristic Total 1968–1972 1973–1978 1979–1983 1984–1989 1990–1993 1994–1998Period
* Numbers of cases and prevalence estimates are not provided for congenital heart defects prior to 1984 because not all of these cases have been reviewed by pediatric car-
diologists. Cells containing fewer than 5 cases are indicated as “<5”. Prevalence estimates based on these cells are indicated as less than the prevalence based on 5 cases in Table a. Percentages based on these cells are not provided in Table b . Cells containing zero cases are indicated as "--". Cells in years for which no data are provided are left blank. Counts are provided, but prevalences are not estimated, for strata with unknown values in Table a. Counts and percentages are provided for strata with un-known values in Table b.
** Prev = Prevalence. † Data on Hispanic or Latino ethnicity were available beginning in 1990. § Information about socioeconomic status was available only for 1979-2001.
Table 18a Hypoplastic left heart syndrome: Prevalence (per 10,000 live births) stratified
by descriptive characteristics, MACDP, 1984–2003*
Table 18b Hypoplastic left heart syndrome: Percentage of cases by descriptive characteristics, MACDP, 1984–2003*
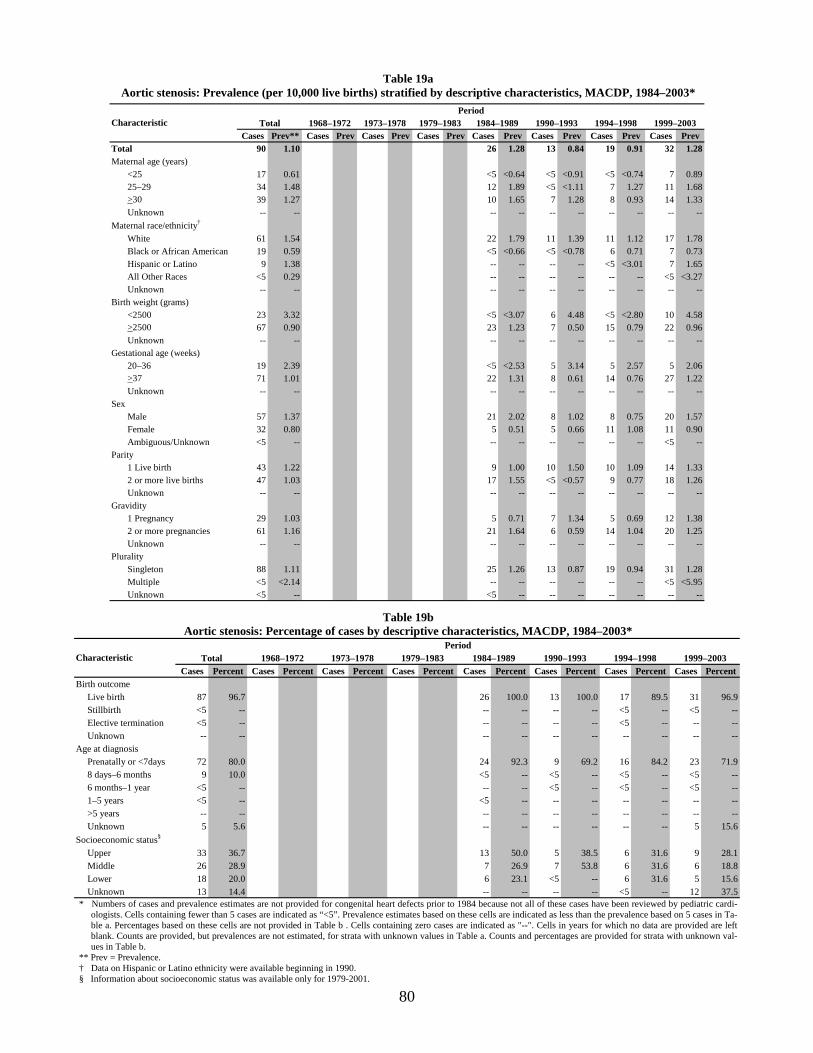
80
Cases Prev** Cases Prev Cases Prev Cases Prev Cases Prev Cases Prev Cases Prev Cases PrevTotal 90 1.10 26 1.28 13 0.84 19 0.91 32 1.28Maternal age (years)
<25 17 0.61 <5 <0.64 <5 <0.91 <5 <0.74 7 0.8925–29 34 1.48 12 1.89 <5 <1.11 7 1.27 11 1.68>30 39 1.27 10 1.65 7 1.28 8 0.93 14 1.33Unknown -- -- -- -- -- -- -- -- -- --
Maternal race/ethnicity†
White 61 1.54 22 1.79 11 1.39 11 1.12 17 1.78Black or African American 19 0.59 <5 <0.66 <5 <0.78 6 0.71 7 0.73Hispanic or Latino 9 1.38 -- -- -- -- <5 <3.01 7 1.65All Other Races <5 0.29 -- -- -- -- -- -- <5 <3.27Unknown -- -- -- -- -- -- -- -- -- --
Birth weight (grams)<2500 23 3.32 <5 <3.07 6 4.48 <5 <2.80 10 4.58>2500 67 0.90 23 1.23 7 0.50 15 0.79 22 0.96Unknown -- -- -- -- -- -- -- -- -- --
Gestational age (weeks)20–36 19 2.39 <5 <2.53 5 3.14 5 2.57 5 2.06>37 71 1.01 22 1.31 8 0.61 14 0.76 27 1.22Unknown -- -- -- -- -- -- -- -- -- --
SexMale 57 1.37 21 2.02 8 1.02 8 0.75 20 1.57Female 32 0.80 5 0.51 5 0.66 11 1.08 11 0.90Ambiguous/Unknown <5 -- -- -- -- -- -- -- <5 --
Parity1 Live birth 43 1.22 9 1.00 10 1.50 10 1.09 14 1.332 or more live births 47 1.03 17 1.55 <5 <0.57 9 0.77 18 1.26Unknown -- -- -- -- -- -- -- -- -- --
Gravidity1 Pregnancy 29 1.03 5 0.71 7 1.34 5 0.69 12 1.382 or more pregnancies 61 1.16 21 1.64 6 0.59 14 1.04 20 1.25Unknown -- -- -- -- -- -- -- -- -- --
PluralitySingleton 88 1.11 25 1.26 13 0.87 19 0.94 31 1.28Multiple <5 <2.14 -- -- -- -- -- -- <5 <5.95Unknown <5 -- <5 -- -- -- -- -- -- --
Characteristic 1999–20031990–19931984–1989 1994–1998Period
Total 1968–1972 1973–1978 1979–1983
Cases Percent Cases Percent Cases Percent Cases Percent Cases Percent Cases Percent Cases Percent Cases PercentBirth outcome
Live birth 87 96.7 26 100.0 13 100.0 17 89.5 31 96.9Stillbirth <5 -- -- -- -- -- <5 -- <5 --Elective termination <5 -- -- -- -- -- <5 -- -- --Unknown -- -- -- -- -- -- -- -- -- --
Age at diagnosisPrenatally or <7days 72 80.0 24 92.3 9 69.2 16 84.2 23 71.98 days–6 months 9 10.0 <5 -- <5 -- <5 -- <5 --6 months–1 year <5 -- -- -- <5 -- <5 -- <5 --1–5 years <5 -- <5 -- -- -- -- -- -- -->5 years -- -- -- -- -- -- -- -- -- --Unknown 5 5.6 -- -- -- -- -- -- 5 15.6
Socioeconomic status§
Upper 33 36.7 13 50.0 5 38.5 6 31.6 9 28.1Middle 26 28.9 7 26.9 7 53.8 6 31.6 6 18.8Lower 18 20.0 6 23.1 <5 -- 6 31.6 5 15.6Unknown 13 14.4 -- -- -- -- <5 -- 12 37.5
1999–2003Characteristic Total 1968–1972 1973–1978 1979–1983 1984–1989 1990–1993 1994–1998Period
* Numbers of cases and prevalence estimates are not provided for congenital heart defects prior to 1984 because not all of these cases have been reviewed by pediatric cardi-
ologists. Cells containing fewer than 5 cases are indicated as “<5”. Prevalence estimates based on these cells are indicated as less than the prevalence based on 5 cases in Ta-ble a. Percentages based on these cells are not provided in Table b . Cells containing zero cases are indicated as "--". Cells in years for which no data are provided are left blank. Counts are provided, but prevalences are not estimated, for strata with unknown values in Table a. Counts and percentages are provided for strata with unknown val-ues in Table b.
** Prev = Prevalence. † Data on Hispanic or Latino ethnicity were available beginning in 1990. § Information about socioeconomic status was available only for 1979-2001.
Table 19a Aortic stenosis: Prevalence (per 10,000 live births) stratified by descriptive characteristics, MACDP, 1984–2003*
Table 19b Aortic stenosis: Percentage of cases by descriptive characteristics, MACDP, 1984–2003*

81
Cases Prev** Cases Prev Cases Prev Cases Prev Cases Prev Cases Prev Cases Prev Cases PrevTotal 317 3.89 81 3.99 43 2.79 92 4.41 101 4.04Maternal age (years)
<25 79 2.83 25 3.18 <5 <0.91 21 3.12 29 3.6825–29 82 3.58 24 3.78 14 3.11 20 3.62 24 3.66>30 154 5.02 30 4.95 25 4.58 51 5.92 48 4.55Unknown <5 -- <5 -- -- -- -- -- -- --
Maternal race/ethnicity†
White 180 4.55 56 4.57 25 3.15 54 5.51 45 4.71Black or African American 102 3.18 24 3.17 14 2.18 31 3.68 33 3.43Hispanic or Latino 22 3.39 -- -- <5 <8.47 5 3.01 16 3.77All Other Races 9 2.65 <5 <11.48 <5 <10.58 <5 <5.21 <5 <3.27Unknown <5 -- -- -- <5 -- -- -- <5 --
Birth weight (grams)<2500 64 9.22 17 10.45 9 6.73 23 12.86 15 6.86>2500 253 3.39 64 3.43 34 2.41 69 3.61 86 3.77Unknown -- -- -- -- -- -- -- -- -- --
Gestational age (weeks)20–36 57 7.18 13 6.58 9 5.66 19 9.76 16 6.59>37 255 3.60 66 3.94 34 2.61 73 3.94 82 3.69Unknown 5 -- <5 -- -- -- -- -- <5 --
SexMale 180 4.32 41 3.95 28 3.55 53 4.98 58 4.56Female 137 3.43 40 4.05 15 1.99 39 3.81 43 3.50Ambiguous/Unknown -- -- -- -- -- -- -- -- -- --
Parity1 Live birth 119 3.36 29 3.24 13 1.95 36 3.92 41 3.892 or more live births 195 4.28 49 4.48 30 3.45 56 4.82 60 4.19Unknown <5 -- <5 -- -- -- -- -- -- --
Gravidity1 Pregnancy 76 2.69 24 3.40 7 1.34 22 3.02 23 2.642 or more pregnancies 240 4.57 56 4.36 36 3.54 70 5.20 78 4.87Unknown <5 -- <5 -- -- -- -- -- -- --
PluralitySingleton 295 3.72 75 3.79 41 2.73 85 4.20 94 3.89Multiple 21 9.00 5 10.81 <5 <12.25 7 11.26 7 8.33Unknown <5 -- <5 -- -- -- -- -- -- --
Characteristic 1999–20031990–19931984–1989 1994–1998Period
Total 1968–1972 1973–1978 1979–1983
Cases Percent Cases Percent Cases Percent Cases Percent Cases Percent Cases Percent Cases Percent Cases PercentBirth outcome
Live birth 315 99.4 81 100.0 42 97.7 92 100.0 100 99.0Stillbirth <5 -- -- -- <5 -- -- -- -- --Elective termination <5 -- -- -- -- -- -- -- <5 --Unknown -- -- -- -- -- -- -- -- -- --
Age at diagnosisPrenatally or <7days 203 64.0 56 69.1 25 58.1 65 70.7 57 56.48 days–6 months 87 27.4 21 25.9 15 34.9 25 27.2 26 25.76 months–1 year 7 2.2 <5 -- <5 -- <5 -- <5 --1–5 years 9 0.0 <5 -- <5 -- <5 -- 6 5.9>5 years -- -- -- -- -- -- -- -- -- --Unknown 11 3.5 <5 -- -- -- -- -- 10 9.9
Socioeconomic status§
Upper 110 34.7 37 45.7 16 37.2 35 38.0 22 21.8Middle 83 26.2 22 27.2 19 44.2 27 29.3 15 14.9Lower 68 21.5 20 24.7 8 18.6 28 30.4 12 11.9Unknown 56 17.7 <5 -- -- -- <5 -- 52 51.5
1999–2003Characteristic Total 1968–1972 1973–1978 1979–1983 1984–1989 1990–1993 1994–1998Period
* Numbers of cases and prevalence estimates are not provided for congenital heart defects prior to 1984 because not all of these cases have been reviewed by pediatric cardi-
ologists. Cells containing fewer than 5 cases are indicated as “<5”. Prevalence estimates based on these cells are indicated as less than the prevalence based on 5 cases in Ta-ble a. Percentages based on these cells are not provided in Table b . Cells containing zero cases are indicated as "--". Cells in years for which no data are provided are left blank. Counts are provided, but prevalences are not estimated, for strata with unknown values in Table a. Counts and percentages are provided for strata with unknown val-ues in Table b.
** Prev = Prevalence. † Data on Hispanic or Latino ethnicity were available beginning in 1990. § Information about socioeconomic status was available only for 1979-2001.
Table 20a Coarctation of the aorta: Prevalence (per 10,000 live births) stratified
by descriptive characteristics, MACDP, 1984–2003*
Table 20b Coarctation of the aorta: Percentage of cases by descriptive characteristics, MACDP, 1984–2003*

82
Cases Prev** Cases Prev Cases Prev Cases Prev Cases Prev Cases Prev Cases Prev Cases PrevTotal 710 8.70 121 5.97 124 8.03 171 8.19 294 11.76Maternal age (years)
<25 208 7.44 36 4.58 35 6.40 48 7.13 89 11.2925–29 181 7.90 40 6.31 36 8.00 43 7.78 62 9.46>30 320 10.43 45 7.43 52 9.52 80 9.29 143 13.54Unknown <5 -- -- -- <5 -- -- -- -- --
Maternal race/ethnicity†
White 320 8.09 81 6.61 60 7.56 83 8.46 96 10.04Black or African American 288 8.99 36 4.75 54 8.41 74 8.78 124 12.88Hispanic or Latino 73 11.23 -- -- 6 10.16 7 4.22 60 14.12All Other Races 23 6.77 <5 <11.48 <5 <10.58 5 5.21 10 6.55Unknown 6 -- -- -- -- -- <5 -- <5 --
Birth weight (grams)<2500 277 39.93 42 25.82 47 35.13 67 37.47 121 55.37>2500 433 5.80 79 4.24 77 5.47 104 5.45 173 7.58Unknown -- -- -- -- -- -- -- -- -- --
Gestational age (weeks)20–36 264 32.87 34 17.22 47 29.56 68 34.93 115 47.35>37 437 6.14 83 4.96 77 5.92 100 5.40 177 7.97Unknown 9 -- <5 -- -- -- <5 -- <5 --
SexMale 297 7.13 47 4.52 54 6.85 81 7.60 115 9.04Female 413 10.34 74 7.49 70 9.27 90 8.80 179 14.57Ambiguous/Unknown -- -- -- -- -- -- -- -- -- --
Parity1 Live birth 292 8.26 51 5.69 51 7.63 66 7.19 124 11.762 or more live births 410 8.99 64 5.85 73 8.39 105 9.04 168 11.73Unknown 8 -- 6 -- -- -- -- -- <5 --
Gravidity1 Pregnancy 198 7.01 38 5.38 32 6.15 40 5.48 88 10.112 or more pregnancies 509 9.70 82 6.39 92 9.05 131 9.73 204 12.75Unknown <5 -- <5 -- -- -- -- -- <5 --
PluralitySingleton 666 8.40 117 5.91 118 7.85 160 7.90 271 11.22Multiple 44 18.86 <5 <10.81 6 14.70 11 17.70 23 27.37Unknown -- -- -- -- -- -- -- -- -- --
Characteristic 1999–20031990–19931984–1989 1994–1998Period
Total 1968–1972 1973–1978 1979–1983
Cases Percent Cases Percent Cases Percent Cases Percent Cases Percent Cases Percent Cases Percent Cases PercentBirth outcome
Live birth 688 96.9 115 95.0 118 95.2 165 96.5 290 98.6Stillbirth 17 2.4 6 5.0 <5 -- <5 -- <5 --Elective termination 5 0.7 -- -- <5 -- <5 -- -- --Unknown -- -- -- -- -- -- -- -- -- --
Age at diagnosisPrenatally or <7days 455 64.1 88 72.7 78 62.9 107 62.6 182 61.98 days–6 months 172 24.2 27 22.3 29 23.4 46 26.9 70 23.86 months–1 year 34 4.8 6 5.0 12 9.7 10 5.8 6 2.01–5 years 22 0.0 -- -- <5 -- <5 -- 14 4.8>5 years <5 -- -- -- -- -- -- -- <5 --Unknown 26 3.7 -- -- <5 -- <5 -- 21 7.1
Socioeconomic status§
Upper 175 24.6 48 39.7 40 32.3 42 24.6 45 15.3Middle 164 23.1 32 26.4 38 30.6 55 32.2 39 13.3Lower 190 26.8 40 33.1 45 36.3 61 35.7 44 15Unknown 181 25.5 <5 -- <5 -- 13 7.6 166 56.5
1999–2003Characteristic Total 1968–1972 1973–1978 1979–1983 1984–1989 1990–1993 1994–1998Period
* Numbers of cases and prevalence estimates are not provided for congenital heart defects prior to 1984 because not all of these cases have been reviewed by pediatric cardi-
ologists. Cells containing fewer than 5 cases are indicated as “<5”. Prevalence estimates based on these cells are indicated as less than the prevalence based on 5 cases in Ta-ble a. Percentages based on these cells are not provided in Table b . Cells containing zero cases are indicated as "--". Cells in years for which no data are provided are left blank. Counts are provided, but prevalences are not estimated, for strata with unknown values in Table a. Counts and percentages are provided for strata with unknown val-ues in Table b.
** Prev = Prevalence. † Data on Hispanic or Latino ethnicity were available beginning in 1990. § Information about socioeconomic status was available only for 1979-2001.
Table 21a Atrial septal defect: Prevalence (per 10,000 live births) stratified by descriptive characteristics, MACDP, 1984–2003*
Table 21b Atrial septal defect: Percentage of cases by descriptive characteristics, MACDP, 1984–2003*

83
Cases Prev** Cases Prev Cases Prev Cases Prev Cases Prev Cases Prev Cases Prev Cases PrevTotal 489 5.99 45 2.22 73 4.73 133 6.37 238 9.52Maternal age (years)
<25 134 4.80 11 1.40 19 3.48 37 5.49 67 8.5025–29 121 5.28 17 2.68 20 4.45 32 5.79 52 7.94>30 233 7.59 17 2.81 33 6.04 64 7.43 119 11.27Unknown <5 -- -- -- <5 -- -- -- -- --
Maternal race/ethnicity†
White 213 5.38 33 2.69 35 4.41 64 6.53 81 8.47Black or African American 200 6.24 11 1.45 31 4.83 58 6.88 100 10.39Hispanic or Latino 55 8.46 -- -- 5 8.47 <5 <3.01 46 10.83All Other Races 16 4.71 <5 <11.48 <5 <10.58 5 5.21 8 5.24Unknown 5 -- -- -- -- -- <5 -- <5 --
Birth weight (grams)<2500 176 25.37 10 6.15 20 14.95 49 27.40 97 44.39>2500 313 4.19 35 1.88 53 3.76 84 4.40 141 6.18Unknown -- -- -- -- -- -- -- -- -- --
Gestational age (weeks)20–36 164 20.53 8 4.05 18 11.32 47 24.15 91 37.47>37 318 4.48 35 2.09 55 4.23 83 4.48 145 6.53Unknown 7 -- <5 -- -- -- <5 -- <5 --
SexMale 201 4.83 14 1.35 35 4.44 63 5.91 89 7.00Female 288 7.21 31 3.14 38 5.03 70 6.84 149 12.13Ambiguous/Unknown -- -- -- -- -- -- -- -- -- --
Parity1 Live birth 203 5.74 20 2.23 27 4.04 54 5.88 102 9.672 or more live births 281 6.16 22 2.01 46 5.28 79 6.80 134 9.36Unknown 5 -- <5 -- -- -- -- -- <5 --
Gravidity1 Pregnancy 141 4.99 16 2.27 20 3.84 33 4.52 72 8.272 or more pregnancies 346 6.59 29 2.26 53 5.21 100 7.42 164 10.25Unknown <5 -- -- -- -- -- -- -- <5 --
PluralitySingleton 456 5.75 44 2.22 71 4.73 123 6.07 218 9.02Multiple 33 14.15 <5 <10.81 <5 <12.25 10 16.09 20 23.80Unknown -- -- -- -- -- -- -- -- -- --
Characteristic 1999–20031990–19931984–1989 1994–1998Period
Total 1968–1972 1973–1978 1979–1983
Cases Percent Cases Percent Cases Percent Cases Percent Cases Percent Cases Percent Cases Percent Cases PercentBirth outcome
Live birth 482 98.6 44 97.8 72 98.6 131 98.5 235 98.7Stillbirth 6 1.2 <5 -- <5 -- <5 -- <5 --Elective termination <5 -- -- -- -- -- <5 -- -- --Unknown -- -- -- -- -- -- -- -- -- --
Age at diagnosisPrenatally or <7days 289 59.1 29 64.4 39 53.4 80 60.2 141 59.28 days–6 months 128 26.2 12 26.7 20 27.4 38 28.6 58 24.46 months–1 year 29 5.9 <5 -- 11 15.1 8 6.0 6 2.51–5 years 20 0.0 -- -- <5 -- <5 -- 13 5.5>5 years <5 -- -- -- -- -- -- -- <5 --Unknown 22 4.5 -- -- -- -- <5 -- 19 8.0
Socioeconomic status§
Upper 109 22.3 19 42.2 21 28.8 34 25.6 35 14.7Middle 110 22.5 14 31.1 24 32.9 43 32.3 29 12.2Lower 116 23.7 11 24.4 27 37 45 33.8 33 13.9Unknown 154 31.5 <5 -- <5 -- 11 8.3 141 59.2
1999–2003Characteristic Total 1968–1972 1973–1978 1979–1983 1984–1989 1990–1993 1994–1998Period
* Numbers of cases and prevalence estimates are not provided for congenital heart defects prior to 1984 because not all of these cases have been reviewed by pediatric cardi-
ologists. Cells containing fewer than 5 cases are indicated as “<5”. Prevalence estimates based on these cells are indicated as less than the prevalence based on 5 cases in Ta-ble a. Percentages based on these cells are not provided in Table b . Cells containing zero cases are indicated as "--". Cells in years for which no data are provided are left blank. Counts are provided, but prevalences are not estimated, for strata with unknown values in Table a. Counts and percentages are provided for strata with unknown val-ues in Table b.
** Prev = Prevalence. † Data on Hispanic or Latino ethnicity were available beginning in 1990. § Information about socioeconomic status was available only for 1979-2001.
Table 22a Secundum atrial septal defect: Prevalence (per 10,000 live births) stratified
by descriptive characteristics, MACDP, 1984–2003*
Table 22b Secundum atrial septal defect: Percentage of cases by descriptive characteristics, MACDP, 1984–2003*

84
Cases Prev** Cases Prev Cases Prev Cases Prev Cases Prev Cases Prev Cases Prev Cases PrevTotal 2,416 29.61 459 22.64 359 23.26 627 30.02 971 38.84Maternal age (years)
<25 686 24.55 168 21.37 105 19.21 172 25.54 241 30.5725–29 673 29.36 142 22.39 110 24.45 167 30.2 254 38.76>30 1,053 34.31 149 24.59 143 26.18 288 33.44 473 44.8Unknown <5 -- -- -- <5 -- -- -- <5 --
Maternal race/ethnicity†
White 1,282 32.40 294 23.98 205 25.81 337 34.37 446 46.65Black or African American 776 24.21 155 20.46 128 19.93 210 24.91 283 29.4Hispanic or Latino 264 40.62 -- -- 12 20.32 58 34.97 194 45.66All Other Races 77 22.68 10 22.96 14 29.61 21 21.88 32 20.95Unknown 17 -- -- -- -- -- <5 -- 16 --
Birth weight (grams) -- -- -- -- -- -- --<2500 625 90.09 120 73.78 113 84.46 172 96.19 220 100.68>2500 1,788 23.96 337 18.08 246 17.46 454 23.78 751 32.92Unknown <5 -- <5 -- -- -- <5 -- -- --
Gestational age (weeks)20–36 610 75.82 116 58.74 104 65.41 167 85.8 223 91.82>37 1,780 24.91 336 20.08 254 19.52 453 24.46 737 33.17Unknown 26 -- 7 -- <5 -- 7 -- 11 --
SexMale 1,143 27.45 224 21.56 162 20.56 305 28.63 452 35.54Female 1,271 31.81 235 23.77 196 25.95 322 31.47 518 42.17Ambiguous/Unknown <5 -- -- -- <5 -- -- -- <5 --
Parity1 Live birth 1,071 30.28 190 21.21 162 24.24 282 30.7 437 41.442 or more live births 1,317 28.89 248 22.65 197 22.63 340 29.26 532 37.15Unknown 28 -- 21 -- -- -- 5 -- <5 --
Gravidity1 Pregnancy 704 24.91 134 18.99 99 19.02 173 23.72 298 34.242 or more pregnancies 1,700 32.40 320 24.94 260 25.57 449 33.34 671 41.92Unknown 12 -- 5 -- -- -- 5 -- <5 --
PluralitySingleton 2,260 28.51 437 22.06 325 21.63 592 29.22 906 37.5Multiple 156 66.88 22 47.57 34 83.29 35 56.32 65 77.35Unknown -- -- -- -- -- -- -- -- -- --
CharacteristicPeriod
1984–1989 1990–1993 1994–1998 1999–2003Total 1968–1972 1973–1978 1979–1983
Cases Percent Cases Percent Cases Percent Cases Percent Cases Percent Cases Percent Cases Percent Cases PercentBirth outcome
Live birth 2,373 98.2 451 98.3 349 97.2 613 97.8 960 98.9Stillbirth 33 1.4 8 1.7 8 2.2 9 1.4 8 0.8Elective termination 10 0.4 -- -- <5 -- 5 0.8 <5 --Unknown <5 -- -- -- -- -- -- -- -- --
Age at diagnosisPrenatally or <7days 1,988 82.3 363 79.1 302 84.1 499 79.6 824 84.98 days–6 months 330 13.7 80 17.4 48 13.4 105 16.7 97 10.06 months–1 year 36 1.5 13 2.8 7 1.9 11 1.8 5 0.51–5 years 22 0.0 <5 -- <5 -- 8 1.3 11 1.1>5 years -- -- -- -- -- -- -- -- -- --Unknown 40 1.7 <5 -- <5 -- <5 -- 34 3.5
Socioeconomic status§
Upper 675 27.9 156 34.0 147 40.9 197 31.4 175 18.0Middle 642 26.6 145 31.6 120 33.4 212 33.8 165 17.0Lower 550 22.8 147 32 84 23.4 181 28.9 138 14.2Unknown 549 22.7 11 2.4 8 2.2 37 5.9 493 50.8
1999–2003Characteristic Total 1968–1972 1973–1978 1979–1983 1984–1989 1990–1993 1994–1998Period
* Numbers of cases and prevalence estimates are not provided for congenital heart defects prior to 1984 because not all of these cases have been reviewed by pediatric cardi-
ologists. Cells containing fewer than 5 cases are indicated as “<5”. Prevalence estimates based on these cells are indicated as less than the prevalence based on 5 cases in Ta-ble a. Percentages based on these cells are not provided in Table b . Cells containing zero cases are indicated as "--". Cells in years for which no data are provided are left blank. Counts are provided, but prevalences are not estimated, for strata with unknown values in Table a. Counts and percentages are provided for strata with unknown val-ues in Table b.
** Prev = Prevalence. † Data on Hispanic or Latino ethnicity were available beginning in 1990. § Information about socioeconomic status was available only for 1979-2001.
Table 23a Ventricular septal defect: Prevalence (per 10,000 live births) stratified
by descriptive characteristics, MACDP, 1984–2003*
Table 23b Ventricular septal defect: Percentage of cases by descriptive characteristics, MACDP, 1984–2003*

85
Cases Prev** Cases Prev Cases Prev Cases Prev Cases Prev Cases Prev Cases Prev Cases PrevTotal 684 8.38 96 4.73 102 6.61 208 9.96 278 11.12Maternal age (years)
<25 200 7.16 36 4.58 28 5.12 54 8.02 82 10.4025–29 186 8.11 38 5.99 29 6.45 54 9.76 65 9.92>30 298 9.71 22 3.63 45 8.24 100 11.61 131 12.41Unknown -- -- -- -- -- -- -- -- -- --
Maternal race/ethnicity†
White 306 7.73 53 4.32 49 6.17 102 10.40 102 10.67Black or African American 289 9.02 42 5.54 46 7.16 86 10.20 115 11.95Hispanic or Latino 53 8.16 -- -- <5 <8.47 12 7.23 38 8.94All Other Races 29 8.54 <5 <11.48 <5 <10.58 7 7.29 17 11.13Unknown 7 -- -- -- -- -- <5 -- 6 --
Birth weight (grams)<2500 195 28.11 22 13.53 34 25.41 60 33.55 79 36.15>2500 489 6.55 74 3.97 68 4.83 148 7.75 199 8.72Unknown -- -- -- -- -- -- -- -- -- --
Gestational age (weeks)20–36 168 21.16 19 9.62 29 18.24 49 25.17 71 29.23>37 507 7.09 76 4.54 72 5.53 157 8.48 202 9.09Unknown 9 -- <5 -- <5 -- <5 -- 5 --
SexMale 346 8.31 43 4.14 53 6.73 107 10.05 143 11.25Female 338 8.46 53 5.36 49 6.49 101 9.87 135 10.99Ambiguous/Unknown -- -- -- -- -- -- -- -- -- --
Parity1 Live birth 317 8.96 44 4.91 47 7.03 93 10.13 133 12.612 or more live births 358 7.85 45 4.11 55 6.32 114 9.81 144 10.05Unknown 9 -- 7 -- -- -- <5 -- <5 --
Gravidity1 Pregnancy 196 6.94 32 4.53 34 6.53 44 6.03 86 9.882 or more pregnancies 484 9.22 62 4.83 68 6.69 163 12.10 191 11.93Unknown <5 -- <5 -- -- -- <5 -- <5 --
PluralitySingleton 646 8.15 93 4.69 95 6.32 198 9.77 260 10.76Multiple 38 16.29 <5 <10.81 7 17.15 10 16.09 18 21.42Unknown -- -- -- -- -- -- -- -- -- --
CharacteristicPeriod
1984–1989 1990–1993 1994–1998 1999–2003Total 1968–1972 1973–1978 1979–1983
Cases Percent Cases Percent Cases Percent Cases Percent Cases Percent Cases Percent Cases Percent Cases PercentBirth outcome
Live birth 672 98.2 94 97.9 100 98.0 201 96.6 277 99.6Stillbirth 10 1.5 <5 -- <5 -- 5 2.4 <5 --Elective termination <5 -- -- -- -- -- <5 -- -- --Unknown -- --
Age at diagnosisPrenatally or <7days 478 69.9 62 64.6 75 73.5 133 63.9 208 74.88 days–6 months 166 24.3 30 31.3 23 22.5 63 30.3 50 18.06 months–1 year 16 2.3 <5 -- <5 -- 6 2.9 <5 --1–5 years 10 0.0 -- -- <5 -- <5 -- 6 2.2>5 years -- -- -- -- -- -- -- -- -- --Unknown 14 2.0 -- -- -- -- <5 -- 11 4.0
Socioeconomic status§
Upper 185 27.0 32 33.3 39 38.2 63 30.3 51 18.3Middle 183 26.8 29 30.2 38 37.3 65 31.3 51 18.3Lower 172 25.1 32 33.3 23 22.5 68 32.7 49 17.6Unknown 144 21.1 <5 -- <5 -- 12 5.8 127 45.7
1999–2003Characteristic Total 1968–1972 1973–1978 1979–1983 1984–1989 1990–1993 1994–1998Period
* Numbers of cases and prevalence estimates are not provided for congenital heart defects prior to 1984 because not all of these cases have been reviewed by pediatric cardi-
ologists. Cells containing fewer than 5 cases are indicated as “<5”. Prevalence estimates based on these cells are indicated as less than the prevalence based on 5 cases in Ta-ble a. Percentages based on these cells are not provided in Table b . Cells containing zero cases are indicated as "--". Cells in years for which no data are provided are left blank. Counts are provided, but prevalences are not estimated, for strata with unknown values in Table a. Counts and percentages are provided for strata with unknown val-ues in Table b.
** Prev = Prevalence. † Data on Hispanic or Latino ethnicity were available beginning in 1990. § Information about socioeconomic status was available only for 1979-2001.
Table 24a Perimembranous ventricular septal defect: Prevalence (per 10,000 live births) stratified
by descriptive characteristics, MACDP, 1984–2003*
Table 24b Perimembranous ventricular septal defect: Percentage of cases by descriptive characteristics, MACDP, 1984–2003*

86
Cases Prev** Cases Prev Cases Prev Cases Prev Cases Prev Cases Prev Cases Prev Cases PrevTotal 1,166 14.29 46 2.27 131 8.49 343 16.42 646 25.84Maternal age (years)
<25 298 10.66 15 1.91 43 7.87 96 14.26 144 18.2625–29 328 14.31 15 2.37 38 8.45 98 17.72 177 27.01>30 536 17.46 16 2.64 49 8.97 149 17.30 322 30.50Unknown <5 -- -- -- <5 -- -- -- <5 --
Maternal race/ethnicity†
White 658 16.63 34 2.77 82 10.33 203 20.70 339 35.46Black or African American 288 8.99 11 1.45 41 6.38 97 11.51 139 14.44Hispanic or Latino 182 28.01 -- -- <5 <8.47 33 19.90 145 34.12All Other Races 27 7.95 <5 <11.48 <5 <10.58 10 10.42 12 7.86Unknown 11 -- -- -- -- -- -- -- 11 --
Birth weight (grams)<2500 246 35.46 7 4.30 39 29.15 87 48.65 113 51.71>2500 919 12.31 39 2.09 92 6.53 255 13.36 533 23.37Unknown <5 -- -- -- -- -- <5 -- -- --
Gestational age (weeks)20–36 270 33.38 11 5.57 39 24.53 95 48.81 125 51.47>37 884 12.43 34 2.03 92 7.07 244 13.17 514 23.14Unknown 12 -- <5 -- -- -- <5 -- 7 --
SexMale 522 12.54 26 2.50 53 6.73 162 15.21 281 22.10Female 643 16.09 20 2.02 78 10.33 181 17.69 364 29.63Ambiguous/Unknown <5 -- -- -- -- -- -- <5 --
Parity1 Live birth 527 14.90 19 2.12 68 10.17 156 16.99 284 26.932 or more live births 633 13.88 26 2.37 63 7.24 183 15.75 361 25.21Unknown 6 -- <5 -- -- -- <5 -- <5 --
Gravidity1 Pregnancy 355 12.56 14 1.98 40 7.68 105 14.40 196 22.522 or more pregnancies 806 15.36 32 2.49 91 8.95 234 17.37 449 28.05Unknown 5 -- -- -- -- -- <5 -- <5 --
PluralitySingleton 1,081 13.64 44 2.22 116 7.72 321 15.84 600 24.84Multiple 85 36.44 <5 <10.81 15 36.75 22 35.40 46 54.74Unknown -- -- -- -- -- -- -- -- -- --
CharacteristicPeriod
1984–1989 1990–1993 1994–1998 1999–2003Total 1968–1972 1973–1978 1979–1983
Cases Percent Cases Percent Cases Percent Cases Percent Cases Percent Cases Percent Cases Percent Cases PercentBirth outcome
Live birth 1,166 100.0 46 100.0 131 100.0 343 100.0 646 100.0Stillbirth -- -- -- -- -- -- -- -- -- --Elective termination -- -- -- -- -- -- -- -- -- --Unknown -- -- -- -- -- -- -- -- -- --
Age at diagnosisPrenatally or <7days 1,024 87.8 32 69.6 114 87.0 296 86.3 582 90.18 days–6 months 104 8.9 11 23.9 12 9.2 40 11.7 41 6.36 months–1 year 12 1.0 <5 -- <5 -- <5 -- <5 --1–5 years 7 0.0 -- -- -- -- <5 -- <5 -->5 years -- -- -- -- -- -- -- -- -- --Unknown 19 1.6 -- -- <5 -- -- -- 18 2.8
Socioeconomic status§
Upper 308 26.4 20 43.5 53 40.5 116 33.8 119 18.4Middle 267 22.9 10 21.7 42 32.1 115 33.5 100 15.5Lower 218 18.7 14 30.4 32 24.4 91 26.5 81 12.5Unknown 373 32.0 <5 -- <5 -- 21 6.1 346 53.6
1999–2003Total 1968–1972 1973–1978 1979–1983 1984–1989 1990–1993 1994–1998Period
* Numbers of cases and prevalence estimates are not provided for congenital heart defects prior to 1984 because not all of these cases have been reviewed by pediatric
cardiologists. Cells containing fewer than 5 cases are indicated as “<5”. Prevalence estimates based on these cells are indicated as less than the prevalence based on 5 cases in Table a. Percentages based on these cells are not provided in Table b . Cells containing zero cases are indicated as "--". Cells in years for which no data are provided are left blank. Counts are provided, but prevalences are not estimated, for strata with unknown values in Table a. Counts and percentages are provided for strata with unknown values in Table b.
** Prev = Prevalence. † Data on Hispanic or Latino ethnicity were available beginning in 1990. § Information about socioeconomic status was available only for 1979-2001.
Table 25a Muscular ventricular septal defect: Prevalence (per 10,000 live births) stratified
by descriptive characteristics, MACDP, 1984–2003*
Table 25b Muscular ventricular septal defect: Percentage of cases by descriptive characteristics, MACDP, 1984–2003*

87
Cases Prev** Cases Prev Cases Prev Cases Prev Cases Prev Cases Prev Cases Prev Cases PrevTotal 79 0.97 18 0.89 16 1.04 24 1.15 21 0.84Maternal age (years)
<25 25 0.89 6 0.76 5 0.91 6 0.89 8 1.0125–29 20 0.87 <5 <0.79 <5 <1.11 6 1.08 6 0.92>30 34 1.11 8 1.32 7 1.28 12 1.39 7 0.66Unknown -- -- -- -- -- -- -- -- -- --
Maternal race/ethnicity†
White 45 1.14 14 1.14 8 1.01 17 1.73 6 0.63Black or African American 25 0.78 <5 <0.66 5 0.78 6 0.71 10 1.04Hispanic or Latino <5 <0.77 -- -- -- -- -- -- <5 <1.18All Other Races 5 1.47 -- -- <5 <10.58 <5 <5.21 <5 <3.27Unknown <5 -- -- -- -- -- -- -- <5 --
Birth weight (grams)<2500 26 3.75 5 3.07 8 5.98 6 3.36 7 3.20>2500 52 0.70 13 0.70 7 0.50 18 0.94 14 0.61Unknown <5 -- -- -- <5 -- -- -- -- --
Gestational age (weeks)20–36 22 2.77 <5 <2.53 5 3.14 7 3.60 7 2.88>37 56 0.79 14 0.84 11 0.85 17 0.92 14 0.63Unknown <5 -- <5 -- -- -- -- -- -- --
SexMale 48 1.15 11 1.06 8 1.02 15 1.41 14 1.10Female 30 0.75 7 0.71 7 0.93 9 0.88 7 0.57Ambiguous/Unknown <5 -- -- -- <5 -- -- -- -- --
Parity1 Live birth 31 0.88 <5 <0.56 8 1.20 13 1.42 6 0.572 or more live births 47 1.03 13 1.19 8 0.92 11 0.95 15 1.05Unknown <5 -- <5 -- -- -- -- -- -- --
Gravidity1 Pregnancy 22 0.78 5 0.71 6 1.15 7 0.96 <5 <0.572 or more pregnancies 57 1.09 13 1.01 10 0.98 17 1.26 17 1.06Unknown -- -- -- -- -- -- -- -- -- --
PluralitySingleton 75 0.95 17 0.86 14 0.93 24 1.18 20 0.83Multiple <5 2.14 <5 <10.81 <5 <12.25 -- -- <5 <5.95Unknown -- -- -- -- -- -- -- -- -- --
CharacteristicPeriod
1984–1989 1990–1993 1994–1998 1999–2003Total 1968–1972 1973–1978 1979–1983
Cases Percent Cases Percent Cases Percent Cases Percent Cases Percent Cases Percent Cases Percent Cases PercentBirth outcome
Live birth 69 87.3 18 100.0 13 81.3 19 79.2 19 90.5Stillbirth 8 10.1 -- -- <5 -- <5 -- <5 --Elective termination <5 -- -- -- -- -- <5 -- <5 --Unknown -- -- -- -- -- -- -- -- -- --
Age at diagnosisPrenatally or <7days 66 83.5 13 72.2 14 87.5 21 87.5 18 85.78 days–6 months 9 11.4 5 27.8 <5 -- <5 -- -- --6 months–1 year -- -- -- -- -- -- -- -- -- --1–5 years -- -- -- -- -- -- -- -- -- -->5 years -- -- -- -- -- -- -- -- -- --Unknown <5 -- -- -- -- -- <5 -- <5 --
Socioeconomic status§
Upper 27 34.2 7 38.9 7 43.8 10 41.7 <5 --Middle 22 27.8 6 33.3 6 37.5 7 29.2 <5 --Lower 20 25.3 5 27.8 <5 -- 5 20.8 7 33.3Unknown 10 12.7 -- -- -- -- <5 -- 8 38.1
1999–2003Characteristic Total 1968–1972 1973–1978 1979–1983 1984–1989 1990–1993 1994–1998Period
* Numbers of cases and prevalence estimates are not provided for congenital heart defects prior to 1984 because not all of these cases have been reviewed by pediatric cardi-
ologists. Cells containing fewer than 5 cases are indicated as “<5”. Prevalence estimates based on these cells are indicated as less than the prevalence based on 5 cases in Ta-ble a. Percentages based on these cells are not provided in Table b . Cells containing zero cases are indicated as "--". Cells in years for which no data are provided are left blank. Counts are provided, but prevalences are not estimated, for strata with unknown values in Table a. Counts and percentages are provided for strata with unknown val-ues in Table b.
** Prev = Prevalence. † Data on Hispanic or Latino ethnicity were available beginning in 1990. § Information about socioeconomic status was available only for 1979-2001.
Table 26a Single ventricle: Prevalence (per 10,000 live births) stratified by descriptive characteristics, MACDP, 1984–2003*
Table 26b Single ventricle: Percentage of cases by descriptive characteristics, MACDP, 1984–2003*
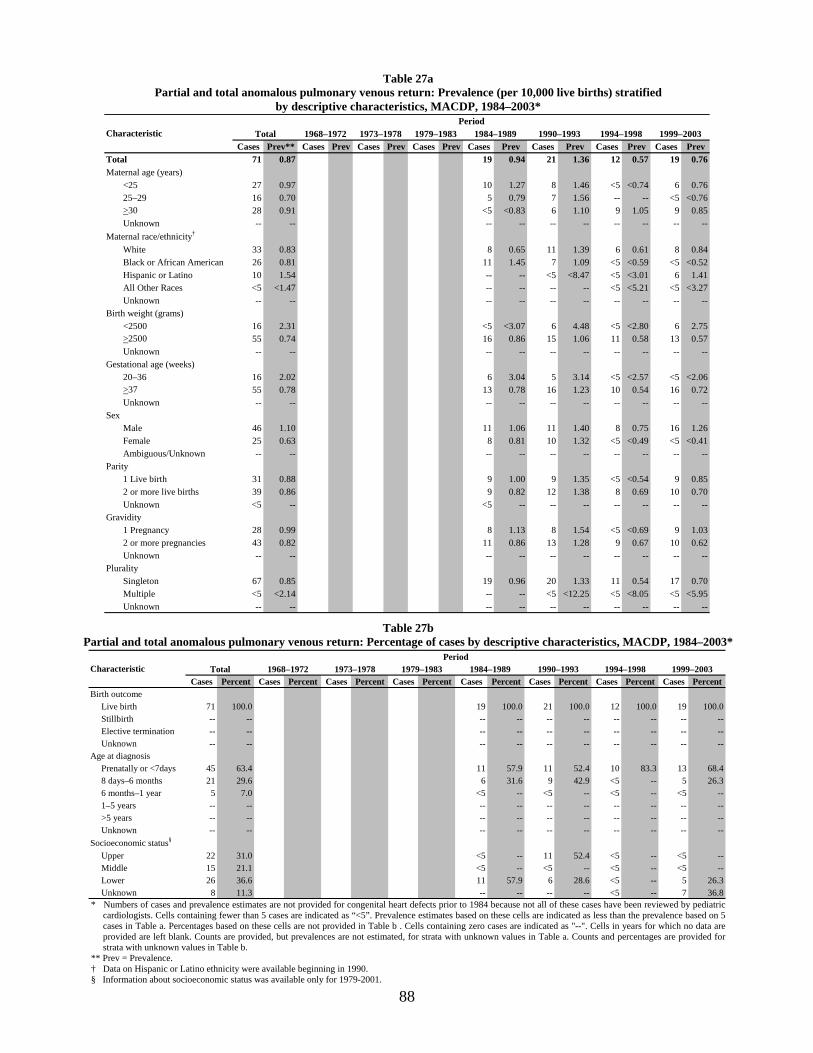
88
Cases Prev** Cases Prev Cases Prev Cases Prev Cases Prev Cases Prev Cases Prev Cases PrevTotal 71 0.87 19 0.94 21 1.36 12 0.57 19 0.76Maternal age (years)
<25 27 0.97 10 1.27 8 1.46 <5 <0.74 6 0.7625–29 16 0.70 5 0.79 7 1.56 -- -- <5 <0.76>30 28 0.91 <5 <0.83 6 1.10 9 1.05 9 0.85Unknown -- -- -- -- -- -- -- -- -- --
Maternal race/ethnicity†
White 33 0.83 8 0.65 11 1.39 6 0.61 8 0.84Black or African American 26 0.81 11 1.45 7 1.09 <5 <0.59 <5 <0.52Hispanic or Latino 10 1.54 -- -- <5 <8.47 <5 <3.01 6 1.41All Other Races <5 <1.47 -- -- -- -- <5 <5.21 <5 <3.27Unknown -- -- -- -- -- -- -- -- -- --
Birth weight (grams)<2500 16 2.31 <5 <3.07 6 4.48 <5 <2.80 6 2.75>2500 55 0.74 16 0.86 15 1.06 11 0.58 13 0.57Unknown -- -- -- -- -- -- -- -- -- --
Gestational age (weeks)20–36 16 2.02 6 3.04 5 3.14 <5 <2.57 <5 <2.06>37 55 0.78 13 0.78 16 1.23 10 0.54 16 0.72Unknown -- -- -- -- -- -- -- -- -- --
SexMale 46 1.10 11 1.06 11 1.40 8 0.75 16 1.26Female 25 0.63 8 0.81 10 1.32 <5 <0.49 <5 <0.41Ambiguous/Unknown -- -- -- -- -- -- -- -- -- --
Parity1 Live birth 31 0.88 9 1.00 9 1.35 <5 <0.54 9 0.852 or more live births 39 0.86 9 0.82 12 1.38 8 0.69 10 0.70Unknown <5 -- <5 -- -- -- -- -- -- --
Gravidity1 Pregnancy 28 0.99 8 1.13 8 1.54 <5 <0.69 9 1.032 or more pregnancies 43 0.82 11 0.86 13 1.28 9 0.67 10 0.62Unknown -- -- -- -- -- -- -- -- -- --
PluralitySingleton 67 0.85 19 0.96 20 1.33 11 0.54 17 0.70Multiple <5 <2.14 -- -- <5 <12.25 <5 <8.05 <5 <5.95Unknown -- -- -- -- -- -- -- -- -- --
CharacteristicPeriod
1984–1989 1990–1993 1994–1998 1999–2003Total 1968–1972 1973–1978 1979–1983
Cases Percent Cases Percent Cases Percent Cases Percent Cases Percent Cases Percent Cases Percent Cases PercentBirth outcome
Live birth 71 100.0 19 100.0 21 100.0 12 100.0 19 100.0Stillbirth -- -- -- -- -- -- -- -- -- --Elective termination -- -- -- -- -- -- -- -- -- --Unknown -- -- -- -- -- -- -- -- -- --
Age at diagnosisPrenatally or <7days 45 63.4 11 57.9 11 52.4 10 83.3 13 68.48 days–6 months 21 29.6 6 31.6 9 42.9 <5 -- 5 26.36 months–1 year 5 7.0 <5 -- <5 -- <5 -- <5 --1–5 years -- -- -- -- -- -- -- -- -- -->5 years -- -- -- -- -- -- -- -- -- --Unknown -- -- -- -- -- -- -- -- -- --
Socioeconomic status§
Upper 22 31.0 <5 -- 11 52.4 <5 -- <5 --Middle 15 21.1 <5 -- <5 -- <5 -- <5 --Lower 26 36.6 11 57.9 6 28.6 <5 -- 5 26.3Unknown 8 11.3 -- -- -- -- <5 -- 7 36.8
1999–2003Characteristic Total 1968–1972 1973–1978 1979–1983 1984–1989 1990–1993 1994–1998Period
* Numbers of cases and prevalence estimates are not provided for congenital heart defects prior to 1984 because not all of these cases have been reviewed by pediatric
cardiologists. Cells containing fewer than 5 cases are indicated as “<5”. Prevalence estimates based on these cells are indicated as less than the prevalence based on 5 cases in Table a. Percentages based on these cells are not provided in Table b . Cells containing zero cases are indicated as "--". Cells in years for which no data are provided are left blank. Counts are provided, but prevalences are not estimated, for strata with unknown values in Table a. Counts and percentages are provided for strata with unknown values in Table b.
** Prev = Prevalence. † Data on Hispanic or Latino ethnicity were available beginning in 1990. § Information about socioeconomic status was available only for 1979-2001.
Table 27a Partial and total anomalous pulmonary venous return: Prevalence (per 10,000 live births) stratified
by descriptive characteristics, MACDP, 1984–2003*
Table 27b Partial and total anomalous pulmonary venous return: Percentage of cases by descriptive characteristics, MACDP, 1984–2003*

89
Cases Prev** Cases Prev Cases Prev Cases Prev Cases Prev Cases Prev Cases Prev Cases PrevTotal 1,177 9.55 151 11.01 158 11.01 156 11.51 180 8.88 142 9.20 192 9.19 198 7.92Maternal age (years)
<25 512 10.42 88 11.25 78 10.66 81 13.38 75 9.54 44 8.05 71 10.54 75 9.5125–29 303 8.59 35 9.40 55 12.40 41 9.75 50 7.88 43 9.56 34 6.15 45 6.87>30 358 9.25 24 11.04 25 9.85 34 10.34 55 9.08 55 10.07 87 10.10 78 7.39Unknown <5 -- <5 -- -- -- -- -- -- -- -- -- -- -- -- --
Maternal race/ethnicity†
White 764 11.40 126 12.79 125 13.45 104 12.53 124 10.11 81 10.20 107 10.91 97 10.15Black or African American 279 6.64 -- -- 31 6.32 49 9.69 49 6.47 45 7.01 53 6.29 52 5.40Hispanic or Latino 71 10.93 -- -- -- -- -- -- -- -- 7 11.85 22 13.26 42 9.88All Other Races 62 8.15 25‡ 6.46 <5 <33.81 <5 <26.07 7 16.07 9 19.04 10 10.42 6 3.93Unknown <5 -- -- -- -- -- -- -- -- -- -- -- -- -- <5 --
Birth weight (grams)<2500 276 26.16 28 23.22 30 24.31 40 34.13 44 27.05 40 29.90 39 21.81 55 25.17>2500 896 7.97 121 9.72 127 9.81 116 9.38 135 7.24 102 7.24 152 7.96 143 6.27Unknown 5 -- <5 -- <5 -- -- -- <5 -- -- -- <5 -- -- --
Gestational age (weeks)20–36 233 20.37 19 17.96 21 17.38 31 25.14 33 16.71 41 25.79 39 20.04 49 20.18>37 933 8.85 132 11.38 137 11.37 124 10.97 143 8.54 98 7.53 152 8.21 147 6.62Unknown 11 -- -- -- -- -- <5 -- <5 -- <5 -- <5 -- <5 --
SexMale 682 10.83 91 12.96 95 12.87 82 11.81 102 9.82 71 9.01 117 10.98 124 9.75Female 487 8.09 60 8.95 63 9.04 72 10.89 77 7.79 68 9.00 74 7.23 73 5.94Ambiguous/Unknown 8 -- -- -- -- -- <5 -- <5 -- <5 -- <5 -- <5 --
Parity1 Live birth 523 9.66 63 12.08 83 11.49 63 9.92 70 7.81 59 8.83 86 9.36 99 9.392 or more live births 617 9.19 61 8.48 74 10.38 93 12.91 102 9.32 83 9.53 106 9.12 98 6.84Unknown 37 -- 27 -- <5 -- -- -- 8 -- -- -- -- -- <5 --
Gravidity1 Pregnancy 403 8.69 58 11.93 71 10.59 51 7.79 55 7.79 32 6.15 58 7.95 78 8.962 or more pregnancies 772 10.34 93 12.32 87 11.37 105 14.99 124 9.66 110 10.82 134 9.95 119 7.44Unknown <5 -- -- -- -- -- -- -- <5 -- -- -- -- -- <5 --
PluralitySingleton 1,146 9.54 147 10.91 152 10.81 155 11.67 175 8.83 137 9.12 187 9.23 193 7.99Multiple 31 9.93 <5 <20.05 6 22.21 <5 <18.44 5 10.81 5 12.25 5 8.05 5 5.95Unknown -- -- -- -- -- -- -- -- -- -- -- -- -- -- -- --
CharacteristicPeriod
1984–1989 1990–1993 1994–1998 1999–2003Total 1968–1972 1973–1978 1979–1983
Cases Percent Cases Percent Cases Percent Cases Percent Cases Percent Cases Percent Cases Percent Cases PercentBirth outcome
Live birth 1,099 93.4 143 94.7 147 93.0 150 96.2 167 92.8 129 90.8 180 93.8 183 92.4Stillbirth 64 5.4 8 5.3 11 7.0 6 3.8 13 7.2 11 7.7 8 4.2 7 3.5Elective termination 14 1.2 -- -- -- -- -- -- -- -- <5 -- <5 -- 8 4.0Unknown -- -- -- -- -- -- -- -- -- -- -- -- -- -- -- --
Age at diagnosisPrenatally or <7days 1,148 97.5 150 99.3 158 100.0 155 99.4 175 97.2 139 97.9 191 99.5 180 90.98 days–6 months 8 0.7 <5 -- -- -- <5 -- <5 -- <5 -- -- -- <5 --6 months–1 year <5 -- -- -- -- -- -- -- <5 -- <5 -- -- -- -- --1–5 years -- -- -- -- -- -- -- -- -- -- -- -- -- -- -- -->5 years -- -- -- -- -- -- -- -- -- -- -- -- -- -- -- --Unknown 19 1.6 -- -- -- -- -- -- <5 -- -- -- <5 -- 17 8.6
Socioeconomic status§
Upper 265 22.5 -- -- -- -- 44 28.2 67 37.2 52 36.6 61 31.8 41 20.7Middle 260 22.1 -- -- -- 54 34.6 51 28.3 50 35.2 63 32.8 42 21.2Lower 236 20.1 -- -- -- -- 55 35.3 57 31.7 39 27.5 59 30.7 26 13.1Unknown 416 35.3 151 100.0 158 100.0 <5 -- 5 2.8 <5 -- 9 4.7 89 44.9
1999–2003Characteristic Total 1968–1972 1973–1978 1979–1983 1984–1989 1990–1993 1994–1998Period
* Cells containing fewer than 5 cases are indicated as “<5”. Prevalence estimates based on these cells are indicated as less than the prevalence based on 5 cases in Table a.
Percentages based on these cells are not provided in Table b. Cells containing zero cases are indicated as "--". Counts are provided, but prevalences are not estimated, for strata with unknown values in Table a. Counts and percentages are provided for strata with unknown values in Table b.
** Prev = Prevalence. † Data on Hispanic or Latino ethnicity were available beginning in 1990. ‡ The category of All Other Races includes 25 cases of Black or African American race. § Information about socioeconomic status was available only for 1979-2001.
Table 28a Cleft lip with or without cleft palate: Prevalence (per 10,000 live births) stratified
by descriptive characteristics, MACDP, 1968–2003*
Table 28b Cleft lip with or without cleft palate: Percentage of cases by descriptive characteristics, MACDP, 1968–2003*

90
Cases Prev** Cases Prev Cases Prev Cases Prev Cases Prev Cases Prev Cases Prev Cases PrevTotal 672 5.45 72 5.25 99 6.90 62 4.57 106 5.23 75 4.86 106 5.08 152 6.08Maternal age (years)
<25 258 5.25 41 5.24 53 7.25 32 5.29 33 4.20 19 3.48 40 5.94 40 5.0725–29 185 5.24 19 5.11 24 5.41 18 4.28 40 6.31 27 6.00 22 3.98 35 5.34>30 227 5.87 12 5.52 21 8.27 12 3.65 33 5.45 29 5.31 44 5.11 76 7.20Unknown <5 -- -- -- <5 -- -- -- -- -- -- -- -- -- <5 --
Maternal race/ethnicity†
White 410 6.12 55 5.58 70 7.53 39 4.70 65 5.30 48 6.04 57 5.81 76 7.95Black or African American 194 4.62 -- -- 29 5.91 23 4.55 39 5.15 22 3.43 37 4.39 44 4.57Hispanic or Latino 29 4.46 -- -- -- -- -- -- -- -- -- -- 7 4.22 22 5.18All Other Races 36 4.73 17‡ 4.39 -- -- -- -- <5 <11.48 5 10.58 5 5.21 7 4.58Unknown <5 -- -- -- -- -- -- -- -- -- -- -- -- -- <5 --
Birth weight (grams)<2500 192 18.20 20 16.59 32 25.93 19 16.21 34 20.91 16 11.96 26 14.54 45 20.59>2500 477 4.24 51 4.10 66 5.10 43 3.48 72 3.86 58 4.12 80 4.19 107 4.69Unknown <5 -- <5 -- <5 -- -- -- -- -- <5 -- -- -- -- --
Gestational age (weeks)20–36 149 13.03 13 12.29 15 12.41 14 11.35 31 15.70 12 7.55 25 12.84 39 16.06>37 514 4.87 58 5.00 83 6.89 48 4.25 74 4.42 61 4.69 81 4.37 109 4.91Unknown 9 -- <5 -- <5 -- -- -- <5 -- <5 -- -- -- <5 --
SexMale 317 5.03 32 4.56 51 6.91 31 4.46 44 4.23 40 5.08 46 4.32 73 5.74Female 352 5.84 40 5.97 47 6.74 31 4.69 60 6.07 35 4.63 60 5.86 79 6.43Ambiguous/Unknown <5 -- -- -- <5 -- -- -- <5 -- -- -- -- -- -- --
Parity1 Live birth 284 5.24 32 6.14 41 5.67 33 5.20 35 3.91 27 4.04 53 5.77 63 5.972 or more live births 372 5.54 33 4.59 55 7.72 29 4.02 66 6.03 47 5.40 53 4.56 89 6.21Unknown 16 -- 7 -- <5 -- -- -- 5 -- <5 -- -- -- -- --
Gravidity1 Pregnancy 223 4.81 29 5.96 35 5.22 27 4.12 25 3.54 21 4.03 41 5.62 45 5.172 or more pregnancies 446 5.97 43 5.70 62 8.10 35 5.00 81 6.31 53 5.21 65 4.83 107 6.69Unknown <5 -- -- -- <5 -- -- -- -- -- <5 -- -- -- -- --
PluralitySingleton 652 5.43 70 5.20 97 6.90 61 4.59 104 5.25 73 4.86 101 4.98 146 6.04Multiple 20 6.40 <5 <20.05 <5 <18.50 <5 <18.44 <5 <10.81 <5 <12.25 5 8.05 6 7.14Unknown -- -- -- -- -- -- -- -- -- -- -- -- -- -- -- --
CharacteristicPeriod
1984–1989 1990–1993 1994–1998 1999–2003Total 1968–1972 1973–1978 1979–1983
Cases Percent Cases Percent Cases Percent Cases Percent Cases Percent Cases Percent Cases Percent Cases PercentBirth outcome
Live birth 650 96.7 69 95.8 96 97.0 58 93.5 102 96.2 74 98.7 101 95.3 150 98.7Stillbirth 17 2.5 <5 -- <5 -- <5 -- <5 -- <5 -- <5 -- -- --Elective termination 5 0.7 -- -- -- -- -- -- <5 -- -- -- <5 -- <5 --Unknown -- -- -- -- -- -- -- -- -- -- -- -- -- -- -- --
Age at diagnosisPrenatally or <7days 613 91.2 71 98.6 97 98.0 59 95.2 101 95.3 70 93.3 91 85.8 124 81.68 days–6 months 19 2.8 <5 -- <5 -- <5 -- <5 -- <5 -- <5 -- 5 3.36 months–1 year 8 1.2 -- -- <5 -- <5 -- <5 -- -- -- <5 -- <5 --1–5 years 10 1.5 -- -- -- -- -- -- -- -- -- -- <5 -- 6 3.9>5 years <5 -- -- -- -- -- -- -- -- -- <5 -- <5 -- -- --Unknown 20 3.0 -- -- -- -- -- -- -- -- -- -- 6 5.7 14 9.2
Socioeconomic status§
Upper 143 21.3 -- -- -- -- 19 30.6 28 26.4 34 45.3 27 25.5 35 23.0Middle 148 22.0 -- -- -- -- 19 30.6 31 29.2 22 29.3 39 36.8 37 24.3Lower 140 20.8 -- -- -- -- 22 35.5 44 41.5 18 24.0 35 33.0 21 13.8Unknown 241 35.9 72 100.0 99 100.0 <5 -- <5 -- <5 -- 5 4.7 59 38.8
1999–2003Characteristic Total 1968–1972 1973–1978 1979–1983 1984–1989 1990–1993 1994–1998Period
* Cells containing fewer than 5 cases are indicated as “<5”. Prevalence estimates based on these cells are indicated as less than the prevalence based on 5 cases in Table a Per-
centages based on these cells are not provided in Table b. Cells containing zero cases are indicated as "--". Counts are provided, but prevalences are not estimated, for strata with unknown values in Table a. Counts and percentages are provided for strata with unknown values in Table b.
** Prev = Prevalence. † Data on Hispanic or Latino ethnicity were available beginning in 1990. ‡ The category of All Other Races includes 15 cases of Black or African American race. § Information about socioeconomic status was available only for 1979-2001.
Table 29a Cleft palate alone: Prevalence (per 10,000 live births) stratified by descriptive characteristics, MACDP, 1968–2003*
Table 29b Cleft palate alone: Percentage of cases by descriptive characteristics, MACDP, 1968–2003*

91
Cases Prev** Cases Prev Cases Prev Cases Prev Cases Prev Cases Prev Cases Prev Cases PrevTotal 1,656 13.44 155 11.30 221 15.40 160 11.80 321 15.83 224 14.51 281 13.46 294 11.76Maternal age (years)
<25 629 12.80 78 9.97 102 13.95 67 11.07 110 13.99 71 12.99 95 14.11 106 13.4425–29 523 14.82 46 12.36 80 18.04 54 12.84 117 18.45 72 16.00 78 14.10 76 11.60>30 487 12.59 17 7.82 38 14.97 39 11.86 92 15.18 81 14.83 108 12.54 112 10.61Unknown 17 -- 14 -- <5 -- -- -- <5 -- -- -- -- -- -- --
Maternal race/ethnicity†
White 1,279 19.09 149 15.13 202 21.73 128 15.42 273 22.27 174 21.91 191 19.48 162 16.95Black or African American 252 6.00 -- -- 18 3.67 32 6.33 43 5.68 41 6.38 58 6.88 60 6.23Hispanic or Latino 95 14.62 -- -- -- -- -- -- -- -- 6 10.16 27 16.28 62 14.59All Other Races 27 3.55 6‡ 1.55 <5 <33.81 -- -- 5 11.48 <5 <10.58 <5 <5.21 8 5.24Unknown <5 -- -- -- -- -- -- -- -- -- -- -- <5 -- <5 --
Birth weight (grams)<2500 111 10.52 9 7.46 8 6.48 12 10.24 16 9.84 17 12.71 18 10.07 31 14.19>2500 1,531 13.62 137 11.01 211 16.29 148 11.96 304 16.31 207 14.69 261 13.67 263 11.53Unknown 14 -- 9 -- <5 -- -- -- <5 -- -- -- <5 -- -- --
Gestational age (weeks)20–36 151 13.20 11 10.40 12 9.93 16 12.98 15 7.60 24 15.09 19 9.76 54 22.23>37 1,492 14.15 144 12.41 208 17.27 144 12.74 303 18.10 199 15.29 259 13.98 235 10.58Unknown 13 -- -- -- <5 -- -- -- <5 -- <5 -- <5 -- 5 --
SexMale 1,377 21.86 128 18.24 183 24.79 132 19.01 263 25.31 184 23.35 238 22.34 249 19.58Female 279 4.63 27 4.03 38 5.45 28 4.24 58 5.87 40 5.30 43 4.20 45 3.66Ambiguous/Unknown -- -- -- -- -- -- -- -- -- -- -- -- -- -- -- --
Parity1 Live birth 781 14.42 66 12.66 102 14.12 71 11.19 152 16.97 104 15.56 157 17.09 129 12.232 or more live births 825 12.29 66 9.17 118 16.55 86 11.93 153 13.97 119 13.67 121 10.41 162 11.31Unknown 50 -- 23 -- <5 -- <5 -- 16 -- <5 -- <5 -- <5 --
Gravidity1 Pregnancy 593 12.79 60 12.34 87 12.98 56 8.55 115 16.30 71 13.64 114 15.63 90 10.342 or more pregnancies 1,049 14.05 91 12.05 132 17.25 104 14.85 204 15.90 153 15.04 164 12.18 201 12.56Unknown 14 -- <5 -- <5 -- -- -- <5 -- -- -- <5 -- <5 --
PluralitySingleton 1,616 13.46 155 11.51 219 15.58 157 11.82 312 15.75 219 14.58 273 13.47 281 11.63Multiple 38 12.17 -- -- <5 <18.50 <5 <18.44 7 15.14 5 12.25 8 12.87 13 15.47Unknown <5 -- -- -- -- -- -- -- <5 -- -- -- -- -- -- --
CharacteristicPeriod
1984–1989 1990–1993 1994–1998 1999–2003Total 1968–1972 1973–1978 1979–1983
Cases Percent Cases Percent Cases Percent Cases Percent Cases Percent Cases Percent Cases Percent Cases PercentBirth outcome
Live birth 1,656 100.0 155 100.0 221 100.0 160 100.0 321 100.0 224 100.0 281 100.0 294 100.0Stillbirth -- -- -- -- -- -- -- -- -- -- -- -- -- -- -- --Elective termination -- -- -- -- -- -- -- -- -- -- -- -- -- -- -- --Unknown -- -- -- -- -- -- -- -- -- -- -- -- -- -- -- --
Age at diagnosisPrenatally or <7days 118 7.1 15 9.7 27 12.2 15 9.4 17 5.3 16 7.1 11 3.9 17 5.88 days–6 months 1,525 92.1 140 90.3 194 87.8 142 88.8 301 93.8 208 92.9 269 95.7 271 92.26 months–1 year <5 -- -- -- -- -- <5 -- -- -- -- -- -- -- -- --1–5 years <5 -- -- -- -- -- -- -- -- -- -- -- <5 -- -- -->5 years -- -- -- -- -- -- -- -- -- -- -- -- -- -- -- --Unknown 10 0.6 -- -- -- -- <5 -- <5 -- -- -- -- -- 6 2.0
Socioeconomic status§
Upper 475 28.7 -- -- -- -- 61 38.1 146 45.5 98 43.8 108 38.4 62 21.1Middle 403 24.3 -- -- -- -- 46 28.8 110 34.3 80 35.7 100 35.6 67 22.8Lower 255 15.4 -- -- -- 48 30.0 57 17.8 45 20.1 58 20.6 47 16.0Unknown 523 31.6 155 100.0 221 100.0 5 3.1 8 2.5 <5 -- 15 5.3 118 40.1
1999–2003Characteristic Total 1968–1972 1973–1978 1979–1983 1984–1989 1990–1993 1994–1998Period
* Cells containing fewer than 5 cases are indicated as “<5”. Prevalence estimates based on these cells are indicated as less than the prevalence based on 5 cases in Table a.
Percentages based on these cells are not provided in Table b. Cells containing zero cases are indicated as "--". Counts are provided, but prevalences are not estimated, for strata with unknown values in Table a. Counts and percentages are provided for strata with unknown values in Table b.
** Prev = Prevalence. † Data on Hispanic or Latino ethnicity were available beginning in 1990. ‡ The category of All Other Races includes 6 cases of Black or African American race. § Information about socioeconomic status was available only for 1979-2001.
Table 30a Pyloric stenosis: Prevalence (per 10,000 live births) stratified by descriptive characteristics, MACDP, 1968–2003*
Table 30b Pyloric stenosis: Percentage of cases by descriptive characteristics, MACDP, 1968–2003*

92
Cases Prev** Cases Prev Cases Prev Cases Prev Cases Prev Cases Prev Cases Prev Cases PrevTotal 266 2.16 27 1.97 33 2.30 33 2.43 49 2.42 33 2.14 43 2.06 48 1.92Maternal age (years)
<25 99 2.01 22 2.81 14 1.91 16 2.64 21 2.67 7 1.28 10 1.49 9 1.1425-29 72 2.04 <5 <1.34 14 3.16 11 2.61 12 1.89 9 2.00 10 1.81 12 1.83>30 95 2.46 <5 <2.30 5 1.97 6 1.83 16 2.64 17 3.11 23 2.67 27 2.56Unknown -- -- -- -- -- -- -- -- -- -- -- -- -- -- -- --
Maternal race/ethnicity†
White 180 2.69 23 2.34 28 3.01 27 3.25 33 2.69 20 2.52 22 2.24 27 2.82Black or African American 66 1.57 -- -- 5 1.02 6 1.19 14 1.85 9 1.40 20 2.37 12 1.25Hispanic or Latino 10 1.54 -- -- -- -- -- -- -- -- <5 <8.47 <5 <3.01 8 1.88All Other Races 10 1.31 <5‡ <1.29 -- -- -- -- <5 <11.48 <5 <10.58 -- -- <5 <3.27Unknown -- -- -- -- -- -- -- -- -- -- -- -- -- -- -- --
Birth weight (grams)<2500 123 11.66 9 7.46 14 11.34 18 15.36 22 13.53 14 10.46 21 11.74 25 11.44>2500 142 1.26 18 1.45 19 1.47 15 1.21 26 1.40 19 1.35 22 1.15 23 1.01Unknown <5 -- -- -- -- -- -- -- <5 -- -- -- -- -- -- --
Gestational age (weeks)20-36 92 8.04 5 4.73 7 5.79 9 7.30 18 9.12 12 7.55 19 9.76 22 9.06>37 170 1.61 22 1.90 26 2.16 24 2.12 28 1.67 20 1.54 24 1.30 26 1.17Unknown <5 -- -- -- -- -- -- -- <5 -- <5 -- -- -- -- --
SexMale 153 2.43 15 2.14 22 2.98 16 2.30 27 2.60 18 2.28 28 2.63 27 2.12Female 112 1.86 12 1.79 11 1.58 17 2.57 21 2.12 15 1.99 15 1.47 21 1.71Ambiguous/Unknown <5 -- -- -- -- -- -- -- <5 -- -- -- -- -- -- --
Parity1 Live birth 135 2.49 14 2.68 15 2.08 18 2.84 26 2.90 12 1.80 23 2.50 27 2.562 or more live births 127 1.89 12 1.67 18 2.53 15 2.08 21 1.92 21 2.41 19 1.64 21 1.47Unknown <5 -- <5 -- -- -- -- -- <5 -- -- -- <5 -- -- --
Gravidity1 Pregnancy 94 2.03 13 2.67 9 1.34 12 1.83 18 2.55 8 1.54 15 2.06 19 2.182 or more pregnancies 170 2.28 14 1.85 24 3.14 21 3.00 30 2.34 25 2.46 27 2.00 29 1.81Unknown <5 -- -- -- -- -- -- -- <5 -- -- -- <5 -- -- --
PluralitySingleton 254 2.12 27 2.00 32 2.28 33 2.48 46 2.32 32 2.13 41 2.02 43 1.78Multiple 12 3.84 -- -- <5 <18.50 -- -- <5 <10.81 <5 <12.25 <5 <8.05 5 5.95Unknown -- -- -- -- -- -- -- -- -- -- -- -- -- -- -- --
CharacteristicPeriod
1984–1989 1990–1993 1994–1998 1999–2003Total 1968–1972 1973–1978 1979–1983
Cases Percent Cases Percent Cases Percent Cases Percent Cases Percent Cases Percent Cases Percent Cases PercentBirth outcome
Live birth 257 96.6 26 96.3 33 100.0 31 93.9 46 93.9 31 93.9 42 97.7 48 100.0Stillbirth 9 3.4 <5 -- -- -- <5 -- <5 -- <5 -- <5 -- -- --Elective termination -- -- -- -- -- -- -- -- -- -- -- -- -- -- -- --Unknown -- -- -- -- -- -- -- -- -- -- -- -- -- -- -- --
Age at diagnosisPrenatally or <7days 249 93.6 27 100.0 32 97.0 33 100.0 46 93.9 31 93.9 41 95.3 39 81.38 days–6 months 8 3.0 -- -- <5 -- -- -- <5 -- -- -- <5 -- <5 --6 months–1 year <5 -- -- -- -- -- -- -- <5 -- <5 -- -- -- -- --1–5 years -- -- -- -- -- -- -- -- -- -- -- -- -- -- -- -->5 years -- -- -- -- -- -- -- -- -- -- -- -- -- -- -- --Unknown 6 2.3 -- -- -- -- -- -- -- -- -- -- <5 -- 5 10.4
Socioeconomic status§
Upper 74 27.8 -- -- -- -- 18 54.5 15 30.6 18 54.5 13 30.2 10 20.8Middle 55 20.7 -- -- -- -- 8 24.2 13 26.5 6 18.2 12 27.9 16 33.3Lower 57 21.4 -- -- -- 7 21.2 20 40.8 9 27.3 17 39.5 <5 --Unknown 80 30.1 27 100.0 33 100.0 -- -- <5 -- -- -- <5 -- 18 37.5
1999–2003Characteristic Total 1968–1972 1973–1978 1979–1983 1984–1989 1990–1993 1994–1998Period
* Cells containing fewer than 5 cases are indicated as “<5”. Prevalence estimates based on these cells are indicated as less than the prevalence based on 5 cases in Table a.
Percentages based on these cells are not provided in Table b. Cells containing zero cases are indicated as "--". Counts are provided, but prevalences are not estimated, for strata with unknown values in Table a. Counts and percentages are provided for strata with unknown values in Table b.
** Prev = Prevalence. † Data on Hispanic or Latino ethnicity were available beginning in 1990. ‡ The category of All Other Races includes <5 cases of Black or African American race. § Information about socioeconomic status was available only for 1979-2001.
Table 31a Esophageal atresia or stenosis: Prevalence (per 10,000 live births) stratified by descriptive characteristics, MACDP, 1968–2003*
Table 31b Esophageal atresia or stenosis: Percentage of cases by descriptive characteristics, MACDP, 1968–2003*
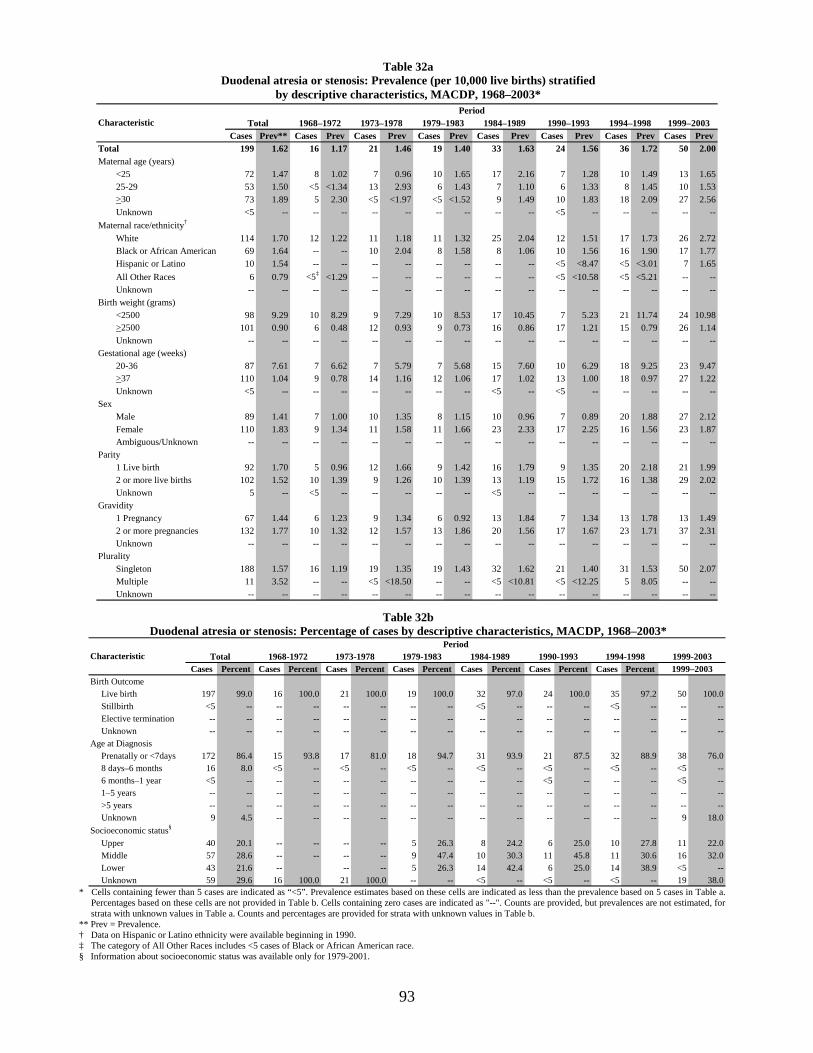
93
Cases Prev** Cases Prev Cases Prev Cases Prev Cases Prev Cases Prev Cases Prev Cases PrevTotal 199 1.62 16 1.17 21 1.46 19 1.40 33 1.63 24 1.56 36 1.72 50 2.00Maternal age (years)
<25 72 1.47 8 1.02 7 0.96 10 1.65 17 2.16 7 1.28 10 1.49 13 1.6525-29 53 1.50 <5 <1.34 13 2.93 6 1.43 7 1.10 6 1.33 8 1.45 10 1.53>30 73 1.89 5 2.30 <5 <1.97 <5 <1.52 9 1.49 10 1.83 18 2.09 27 2.56Unknown <5 -- -- -- -- -- -- -- -- -- <5 -- -- -- -- --
Maternal race/ethnicity†
White 114 1.70 12 1.22 11 1.18 11 1.32 25 2.04 12 1.51 17 1.73 26 2.72Black or African American 69 1.64 -- -- 10 2.04 8 1.58 8 1.06 10 1.56 16 1.90 17 1.77Hispanic or Latino 10 1.54 -- -- -- -- -- -- -- -- <5 <8.47 <5 <3.01 7 1.65All Other Races 6 0.79 <5‡ <1.29 -- -- -- -- -- -- <5 <10.58 <5 <5.21 -- --Unknown -- -- -- -- -- -- -- -- -- -- -- -- -- -- -- --
Birth weight (grams)<2500 98 9.29 10 8.29 9 7.29 10 8.53 17 10.45 7 5.23 21 11.74 24 10.98>2500 101 0.90 6 0.48 12 0.93 9 0.73 16 0.86 17 1.21 15 0.79 26 1.14Unknown -- -- -- -- -- -- -- -- -- -- -- -- -- -- -- --
Gestational age (weeks)20-36 87 7.61 7 6.62 7 5.79 7 5.68 15 7.60 10 6.29 18 9.25 23 9.47>37 110 1.04 9 0.78 14 1.16 12 1.06 17 1.02 13 1.00 18 0.97 27 1.22Unknown <5 -- -- -- -- -- -- -- <5 -- <5 -- -- -- -- --
SexMale 89 1.41 7 1.00 10 1.35 8 1.15 10 0.96 7 0.89 20 1.88 27 2.12Female 110 1.83 9 1.34 11 1.58 11 1.66 23 2.33 17 2.25 16 1.56 23 1.87Ambiguous/Unknown -- -- -- -- -- -- -- -- -- -- -- -- -- -- -- --
Parity1 Live birth 92 1.70 5 0.96 12 1.66 9 1.42 16 1.79 9 1.35 20 2.18 21 1.992 or more live births 102 1.52 10 1.39 9 1.26 10 1.39 13 1.19 15 1.72 16 1.38 29 2.02Unknown 5 -- <5 -- -- -- -- -- <5 -- -- -- -- -- -- --
Gravidity1 Pregnancy 67 1.44 6 1.23 9 1.34 6 0.92 13 1.84 7 1.34 13 1.78 13 1.492 or more pregnancies 132 1.77 10 1.32 12 1.57 13 1.86 20 1.56 17 1.67 23 1.71 37 2.31Unknown -- -- -- -- -- -- -- -- -- -- -- -- -- -- -- --
PluralitySingleton 188 1.57 16 1.19 19 1.35 19 1.43 32 1.62 21 1.40 31 1.53 50 2.07Multiple 11 3.52 -- -- <5 <18.50 -- -- <5 <10.81 <5 <12.25 5 8.05 -- --Unknown -- -- -- -- -- -- -- -- -- -- -- -- -- -- -- --
CharacteristicPeriod
1984–1989 1990–1993 1994–1998 1999–2003Total 1968–1972 1973–1978 1979–1983
Cases Percent Cases Percent Cases Percent Cases Percent Cases Percent Cases Percent Cases PercentBirth Outcome
Live birth 197 99.0 16 100.0 21 100.0 19 100.0 32 97.0 24 100.0 35 97.2 50 100.0Stillbirth <5 -- -- -- -- -- -- -- <5 -- -- -- <5 -- -- --Elective termination -- -- -- -- -- -- -- -- -- -- -- -- -- -- -- --Unknown -- -- -- -- -- -- -- -- -- -- -- -- -- -- -- --
Age at DiagnosisPrenatally or <7days 172 86.4 15 93.8 17 81.0 18 94.7 31 93.9 21 87.5 32 88.9 38 76.08 days–6 months 16 8.0 <5 -- <5 -- <5 -- <5 -- <5 -- <5 -- <5 --6 months–1 year <5 -- -- -- -- -- -- -- -- -- <5 -- -- -- <5 --1–5 years -- -- -- -- -- -- -- -- -- -- -- -- -- -- -- -->5 years -- -- -- -- -- -- -- -- -- -- -- -- -- -- -- --Unknown 9 4.5 -- -- -- -- -- -- -- -- -- -- -- -- 9 18.0
Socioeconomic status§
Upper 40 20.1 -- -- -- -- 5 26.3 8 24.2 6 25.0 10 27.8 11 22.0Middle 57 28.6 -- -- -- -- 9 47.4 10 30.3 11 45.8 11 30.6 16 32.0Lower 43 21.6 -- -- -- 5 26.3 14 42.4 6 25.0 14 38.9 <5 --Unknown 59 29.6 16 100.0 21 100.0 -- -- <5 -- <5 -- <5 -- 19 38.0
1999–20031999-2003Characteristic Total 1968-1972 1973-1978 1979-1983 1984-1989 1990-1993 1994-1998
Period
* Cells containing fewer than 5 cases are indicated as “<5”. Prevalence estimates based on these cells are indicated as less than the prevalence based on 5 cases in Table a.
Percentages based on these cells are not provided in Table b. Cells containing zero cases are indicated as "--". Counts are provided, but prevalences are not estimated, for strata with unknown values in Table a. Counts and percentages are provided for strata with unknown values in Table b.
** Prev = Prevalence. † Data on Hispanic or Latino ethnicity were available beginning in 1990. ‡ The category of All Other Races includes <5 cases of Black or African American race. § Information about socioeconomic status was available only for 1979-2001.
Table 32a Duodenal atresia or stenosis: Prevalence (per 10,000 live births) stratified
by descriptive characteristics, MACDP, 1968–2003*
Table 32b Duodenal atresia or stenosis: Percentage of cases by descriptive characteristics, MACDP, 1968–2003*
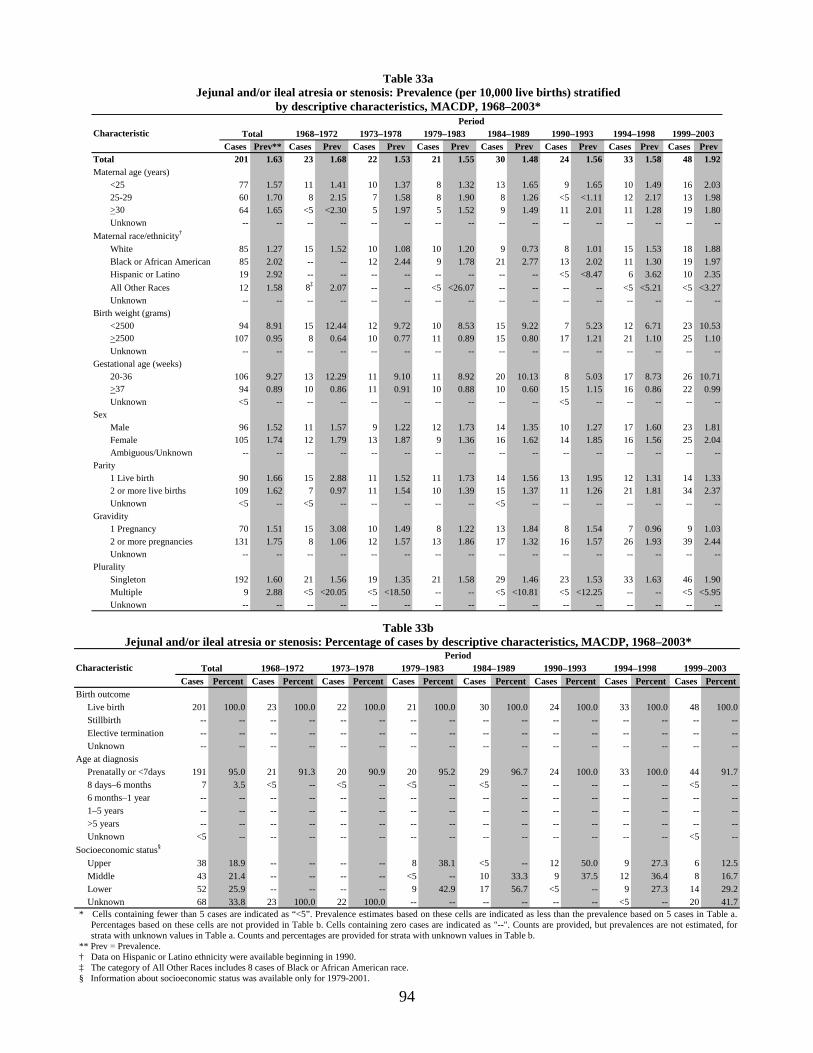
94
Cases Prev** Cases Prev Cases Prev Cases Prev Cases Prev Cases Prev Cases Prev Cases PrevTotal 201 1.63 23 1.68 22 1.53 21 1.55 30 1.48 24 1.56 33 1.58 48 1.92Maternal age (years)
<25 77 1.57 11 1.41 10 1.37 8 1.32 13 1.65 9 1.65 10 1.49 16 2.0325-29 60 1.70 8 2.15 7 1.58 8 1.90 8 1.26 <5 <1.11 12 2.17 13 1.98>30 64 1.65 <5 <2.30 5 1.97 5 1.52 9 1.49 11 2.01 11 1.28 19 1.80Unknown -- -- -- -- -- -- -- -- -- -- -- -- -- -- -- --
Maternal race/ethnicity†
White 85 1.27 15 1.52 10 1.08 10 1.20 9 0.73 8 1.01 15 1.53 18 1.88Black or African American 85 2.02 -- -- 12 2.44 9 1.78 21 2.77 13 2.02 11 1.30 19 1.97Hispanic or Latino 19 2.92 -- -- -- -- -- -- -- -- <5 <8.47 6 3.62 10 2.35All Other Races 12 1.58 8‡ 2.07 -- -- <5 <26.07 -- -- -- -- <5 <5.21 <5 <3.27Unknown -- -- -- -- -- -- -- -- -- -- -- -- -- -- -- --
Birth weight (grams)<2500 94 8.91 15 12.44 12 9.72 10 8.53 15 9.22 7 5.23 12 6.71 23 10.53>2500 107 0.95 8 0.64 10 0.77 11 0.89 15 0.80 17 1.21 21 1.10 25 1.10Unknown -- -- -- -- -- -- -- -- -- -- -- -- -- -- -- --
Gestational age (weeks)20-36 106 9.27 13 12.29 11 9.10 11 8.92 20 10.13 8 5.03 17 8.73 26 10.71>37 94 0.89 10 0.86 11 0.91 10 0.88 10 0.60 15 1.15 16 0.86 22 0.99Unknown <5 -- -- -- -- -- -- -- -- -- <5 -- -- -- -- --
SexMale 96 1.52 11 1.57 9 1.22 12 1.73 14 1.35 10 1.27 17 1.60 23 1.81Female 105 1.74 12 1.79 13 1.87 9 1.36 16 1.62 14 1.85 16 1.56 25 2.04Ambiguous/Unknown -- -- -- -- -- -- -- -- -- -- -- -- -- -- -- --
Parity1 Live birth 90 1.66 15 2.88 11 1.52 11 1.73 14 1.56 13 1.95 12 1.31 14 1.332 or more live births 109 1.62 7 0.97 11 1.54 10 1.39 15 1.37 11 1.26 21 1.81 34 2.37Unknown <5 -- <5 -- -- -- -- -- <5 -- -- -- -- -- -- --
Gravidity1 Pregnancy 70 1.51 15 3.08 10 1.49 8 1.22 13 1.84 8 1.54 7 0.96 9 1.032 or more pregnancies 131 1.75 8 1.06 12 1.57 13 1.86 17 1.32 16 1.57 26 1.93 39 2.44Unknown -- -- -- -- -- -- -- -- -- -- -- -- -- -- -- --
PluralitySingleton 192 1.60 21 1.56 19 1.35 21 1.58 29 1.46 23 1.53 33 1.63 46 1.90Multiple 9 2.88 <5 <20.05 <5 <18.50 -- -- <5 <10.81 <5 <12.25 -- -- <5 <5.95Unknown -- -- -- -- -- -- -- -- -- -- -- -- -- -- -- --
CharacteristicPeriod
1984–1989 1990–1993 1994–1998 1999–2003Total 1968–1972 1973–1978 1979–1983
Cases Percent Cases Percent Cases Percent Cases Percent Cases Percent Cases Percent Cases Percent Cases PercentBirth outcome
Live birth 201 100.0 23 100.0 22 100.0 21 100.0 30 100.0 24 100.0 33 100.0 48 100.0Stillbirth -- -- -- -- -- -- -- -- -- -- -- -- -- -- -- --Elective termination -- -- -- -- -- -- -- -- -- -- -- -- -- -- -- --Unknown -- -- -- -- -- -- -- -- -- -- -- -- -- -- -- --
Age at diagnosisPrenatally or <7days 191 95.0 21 91.3 20 90.9 20 95.2 29 96.7 24 100.0 33 100.0 44 91.78 days–6 months 7 3.5 <5 -- <5 -- <5 -- <5 -- -- -- -- -- <5 --6 months–1 year -- -- -- -- -- -- -- -- -- -- -- -- -- -- -- --1–5 years -- -- -- -- -- -- -- -- -- -- -- -- -- -- -- -->5 years -- -- -- -- -- -- -- -- -- -- -- -- -- -- -- --Unknown <5 -- -- -- -- -- -- -- -- -- -- -- -- -- <5 --
Socioeconomic status§
Upper 38 18.9 -- -- -- -- 8 38.1 <5 -- 12 50.0 9 27.3 6 12.5Middle 43 21.4 -- -- -- -- <5 -- 10 33.3 9 37.5 12 36.4 8 16.7Lower 52 25.9 -- -- -- -- 9 42.9 17 56.7 <5 -- 9 27.3 14 29.2Unknown 68 33.8 23 100.0 22 100.0 -- -- -- -- -- -- <5 -- 20 41.7
1999–2003Characteristic Total 1968–1972 1973–1978 1979–1983 1984–1989 1990–1993 1994–1998Period
* Cells containing fewer than 5 cases are indicated as “<5”. Prevalence estimates based on these cells are indicated as less than the prevalence based on 5 cases in Table a.
Percentages based on these cells are not provided in Table b. Cells containing zero cases are indicated as "--". Counts are provided, but prevalences are not estimated, for strata with unknown values in Table a. Counts and percentages are provided for strata with unknown values in Table b.
** Prev = Prevalence. † Data on Hispanic or Latino ethnicity were available beginning in 1990. ‡ The category of All Other Races includes 8 cases of Black or African American race. § Information about socioeconomic status was available only for 1979-2001.
Table 33a Jejunal and/or ileal atresia or stenosis: Prevalence (per 10,000 live births) stratified
by descriptive characteristics, MACDP, 1968–2003*
Table 33b Jejunal and/or ileal atresia or stenosis: Percentage of cases by descriptive characteristics, MACDP, 1968–2003*

95
Cases Prev** Cases Prev Cases Prev Cases Prev Cases Prev Cases Prev Cases Prev Cases PrevTotal 457 3.71 58 4.23 61 4.25 49 3.62 82 4.04 54 3.50 76 3.64 77 3.08Maternal age (years)
<25 183 3.72 31 3.96 33 4.51 21 3.47 35 4.45 17 3.11 23 3.42 23 2.9225-29 128 3.63 18 4.84 20 4.51 17 4.04 21 3.31 17 3.78 18 3.25 17 2.59>30 146 3.77 9 4.14 8 3.15 11 3.35 26 4.29 20 3.66 35 4.06 37 3.50Unknown -- -- -- -- -- -- -- -- -- -- -- -- -- -- -- --
Maternal race/ethnicity†
White 261 3.89 43 4.37 48 5.16 31 3.73 55 4.49 27 3.40 34 3.47 23 2.41Black or African American 142 3.38 -- -- 13 2.65 17 3.36 23 3.04 25 3.89 34 4.03 30 3.12Hispanic or Latino 20 3.08 -- -- -- -- -- -- -- -- <5 <8.47 <5 <3.01 15 3.53All Other Races 31 4.08 15‡ 3.88 -- -- <5 <26.07 <5 <11.48 -- -- 5 5.21 6 3.93Unknown <5 -- -- -- -- -- -- -- -- -- -- -- -- -- <5 --
Birth weight (grams)<2500 173 16.40 20 16.59 20 16.21 26 22.18 30 18.45 20 14.95 34 19.01 23 10.53>2500 280 2.49 36 2.89 41 3.17 23 1.86 51 2.74 34 2.41 41 2.15 54 2.37Unknown <5 -- <5 -- -- -- -- -- <5 -- -- -- <5 -- -- --
Gestational age (weeks)20-36 149 13.03 13 12.29 17 14.07 17 13.79 25 12.66 22 13.84 36 18.49 19 7.82>37 299 2.84 45 3.88 44 3.65 31 2.74 54 3.23 31 2.38 38 2.05 56 2.52Unknown 9 -- -- -- -- -- <5 -- <5 -- <5 -- <5 -- <5 --
SexMale 261 4.14 35 4.99 35 4.74 23 3.31 46 4.43 29 3.68 45 4.22 48 3.77Female 178 2.96 23 3.43 19 2.73 23 3.48 35 3.54 23 3.05 28 2.74 27 2.20Ambiguous/Unknown 18 -- -- -- 7 -- <5 -- <5 -- <5 -- <5 -- <5 --
Parity1 Live birth 211 3.90 28 5.37 24 3.32 23 3.62 37 4.13 29 4.34 34 3.70 36 3.412 or more live births 236 3.52 23 3.20 37 5.19 26 3.61 43 3.93 25 2.87 41 3.53 41 2.86Unknown 10 -- 7 -- -- -- -- -- <5 -- -- -- <5 -- -- --
Gravidity1 Pregnancy 145 3.13 26 5.35 21 3.13 15 2.29 24 3.40 19 3.65 20 2.74 20 2.302 or more pregnancies 311 4.16 32 4.24 40 5.23 34 4.85 58 4.52 35 3.44 55 4.08 57 3.56Unknown <5 -- -- -- -- -- -- -- -- -- -- -- <5 -- -- --
PluralitySingleton 431 3.59 56 4.16 58 4.13 45 3.39 77 3.89 52 3.46 69 3.41 74 3.06Multiple 26 8.32 <5 <20.05 <5 <18.50 <5 <18.44 5 10.81 <5 <12.25 7 11.26 <5 <5.95Unknown -- -- -- -- -- -- -- -- -- -- -- -- -- -- -- --
CharacteristicPeriod
1984–1989 1990–1993 1994–1998 1999–2003Total 1968–1972 1973–1978 1979–1983
Cases Percent Cases Percent Cases Percent Cases Percent Cases Percent Cases Percent Cases Percent Cases PercentBirth outcome
Live birth 429 93.9 55 94.8 57 93.4 48 98.0 77 93.9 49 90.7 70 92.1 73 94.8Stillbirth 22 4.8 <5 -- <5 -- <5 -- 5 6.1 <5 -- <5 -- <5 --Elective termination 6 1.3 -- -- -- -- -- -- -- -- <5 -- <5 -- <5 --Unknown -- -- -- -- -- -- -- -- -- -- -- -- -- -- -- --
Age at diagnosisPrenatally or <7days 435 95.2 57 98.3 57 93.4 48 98.0 80 97.6 49 90.7 72 94.7 72 93.58 days–6 months 15 3.3 <5 -- <5 -- -- -- <5 -- <5 -- <5 -- <5 --6 months–1 year <5 -- -- -- -- -- <5 -- <5 -- <5 -- <5 -- -- --1–5 years -- -- -- -- -- -- -- -- -- -- -- -- -- -- -- -->5 years -- -- -- -- -- -- -- -- -- -- -- -- -- -- -- --Unknown <5 -- -- -- -- -- -- -- -- -- -- -- <5 -- <5 --
Socioeconomic status§
Upper 102 22.3 -- -- -- -- 17 34.7 26 31.7 20 37.0 24 31.6 15 19.5Middle 102 22.3 -- -- -- 14 28.6 30 36.6 14 25.9 25 32.9 19 24.7Lower 95 20.8 -- -- -- -- 17 34.7 25 30.5 20 37.0 23 30.3 10 13.0Unknown 158 34.6 58 100.0 61 100.0 <5 -- <5 -- -- -- <5 -- 33 42.9
1999–2003Characteristic Total 1968–1972 1973–1978 1979–1983 1984–1989 1990–1993 1994–1998Period
* Cells containing fewer than 5 cases are indicated as “<5”. Prevalence estimates based on these cells are indicated as less than the prevalence based on 5 cases in Table a.
Percentages based on these cells are not provided in Table b. Cells containing zero cases are indicated as "--". Counts are provided, but prevalences are not estimated, for strata with unknown values in Table a. Counts and percentages are provided for strata with unknown values in Table b.
** Prev = Prevalence. † Data on Hispanic or Latino ethnicity were available beginning in 1990. ‡ The category of All Other Races includes 14 cases of Black or African American race. § Information about socioeconomic status was available only for 1979-2001.
Table 34a Anal or rectal atresia or stenosis: Prevalence (per 10,000 live births) stratified
by descriptive characteristics, MACDP, 1968–2003*
Table 34b Anal or rectal atresia or stenosis: Percentage of cases by descriptive characteristics, MACDP, 1968–2003*

96
Cases Prev** Cases Prev Cases Prev Cases Prev Cases Prev Cases Prev Cases Prev Cases PrevTotal 227 1.84 10 0.73 23 1.60 25 1.84 31 1.53 39 2.53 43 2.06 56 2.24Maternal age (years)
<25 72 1.47 <5 <0.64 12 1.64 8 1.32 8 1.02 13 2.38 10 1.49 18 2.2825-29 69 1.96 <5 <1.34 9 2.03 9 2.14 10 1.58 14 3.11 15 2.71 8 1.22>30 83 2.15 <5 <2.30 <5 <1.97 8 2.43 13 2.15 12 2.20 17 1.97 29 2.75Unknown <5 -- <5 -- -- -- -- -- -- -- -- -- <5 -- <5 --
Maternal race/ethnicity†
White 108 1.61 8 0.81 15 1.61 16 1.93 19 1.55 13 1.64 18 1.84 19 1.99Black or African American 97 2.31 -- -- 8 1.63 9 1.78 9 1.19 23 3.58 19 2.25 29 3.01Hispanic or Latino 9 1.38 -- -- -- -- -- -- -- -- <5 <8.47 <5 <3.01 7 1.65All Other Races 12 1.58 <5‡ <1.29 -- -- -- -- <5 <11.48 <5 <10.58 <5 <5.21 <5 <3.27Unknown <5 -- -- -- -- -- -- -- -- -- -- -- <5 -- -- --
Birth weight (grams)<2500 29 2.75 <5 <4.15 <5 <4.05 <5 <4.27 <5 <3.07 5 3.74 6 3.36 11 5.03>2500 194 1.73 6 0.48 22 1.70 23 1.86 29 1.56 34 2.41 36 1.89 44 1.93Unknown <5 -- <5 -- -- -- -- -- -- -- -- -- <5 -- <5 --
Gestational age (weeks)20-36 33 2.88 <5 <4.73 <5 <4.14 <5 <4.05 5 2.53 <5 <3.14 10 5.14 9 3.71>37 193 1.83 9 0.78 21 1.74 22 1.95 26 1.55 36 2.77 32 1.73 47 2.12Unknown <5 -- -- -- -- -- -- -- -- -- -- -- <5 -- -- --
SexMale 172 2.73 7 1.00 19 2.57 18 2.59 22 2.12 28 3.55 36 3.38 42 3.30Female 55 0.91 <5 <0.75 <5 <0.72 7 1.06 9 0.91 11 1.46 7 0.68 14 1.14Ambiguous/Unknown -- -- -- -- -- -- -- -- -- -- -- -- -- -- -- --
Parity1 Live birth 87 1.61 <5 <0.96 8 1.11 8 1.26 11 1.23 17 2.54 18 1.96 23 2.182 or more live births 133 1.98 <5 <0.69 15 2.10 16 2.22 20 1.83 22 2.53 24 2.07 32 2.23Unknown 7 -- <5 -- -- -- <5 -- -- -- -- -- <5 -- <5 --
Gravidity1 Pregnancy 55 1.19 <5 <1.03 7 1.04 6 0.92 5 0.71 12 2.31 10 1.37 13 1.492 or more pregnancies 169 2.26 7 0.93 16 2.09 19 2.71 26 2.03 27 2.65 32 2.38 42 2.62Unknown <5 -- <5 -- -- -- -- -- -- -- -- -- <5 -- <5 --
PluralitySingleton 216 1.80 10 0.74 23 1.64 23 1.73 30 1.51 37 2.46 40 1.97 53 2.19Multiple 11 3.52 -- -- -- -- <5 <18.44 <5 <10.81 <5 <12.25 <5 <8.05 <5 <5.95Unknown -- -- -- -- -- -- -- -- -- -- -- -- -- -- -- --
CharacteristicPeriod
1984–1989 1990–1993 1994–1998 1999–2003Total 1968–1972 1973–1978 1979–1983
Cases Percent Cases Percent Cases Percent Cases Percent Cases Percent Cases Percent Cases Percent Cases PercentBirth outcome
Live birth 227 100.0 10 100.0 23 100.0 25 100.0 31 100.0 39 100.0 43 100.0 56 100.0Stillbirth -- -- -- -- -- -- -- -- -- -- -- -- -- -- -- --Elective termination -- -- -- -- -- -- -- -- -- -- -- -- -- -- -- --Unknown -- -- -- -- -- -- -- -- -- -- -- -- -- -- -- --
Age at diagnosisPrenatally or <7days 144 63.4 7 70.0 12 52.2 16 64.0 22 71.0 18 46.2 27 62.8 42 75.08 days–6 months 72 31.7 <5 -- 11 47.8 7 28.0 7 22.6 19 48.7 11 25.6 14 25.06 months–1 year 9 4.0 -- -- -- -- <5 -- <5 -- <5 -- <5 -- -- --1–5 years <5 -- -- -- -- -- -- -- -- -- <5 -- <5 -- -- -->5 years -- -- -- -- -- -- -- -- -- -- -- -- -- -- -- --Unknown -- -- -- -- -- -- -- -- -- -- -- -- -- -- -- --
Socioeconomic status§
Upper 49 21.6 -- -- -- -- 5 20.0 10 32.3 11 28.2 14 32.6 9 16.1Middle 63 27.8 -- -- -- -- 8 32.0 13 41.9 11 28.2 18 41.9 13 23.2Lower 53 23.3 -- -- -- -- 11 44.0 7 22.6 16 41.0 11 25.6 8 14.3Unknown 62 27.3 10 100.0 23 100.0 <5 -- <5 -- <5 -- -- -- 26 46.4
1999–2003Characteristic Total 1968–1972 1973–1978 1979–1983 1984–1989 1990–1993 1994–1998Period
* Cells containing fewer than 5 cases are indicated as “<5”. Prevalence estimates based on these cells are indicated as less than the prevalence based on 5 cases in Table a.
Percentages based on these cells are not provided in Table b. Cells containing zero cases are indicated as "--". Counts are provided, but prevalences are not estimated, for strata with unknown values in Table a. Counts and percentages are provided for strata with unknown values in Table b.
** Prev = Prevalence. † Data on Hispanic or Latino ethnicity were available beginning in 1990. ‡ The category of All Other Races includes <5 cases of Black or African American race. § Information about socioeconomic status was available only for 1979-2001.
Table 35a Hirschsprung disease: Prevalence (per 10,000 live births) stratified by descriptive characteristics, MACDP, 1968–2003*
Table 35b Hirschsprung disease: Percentage of cases by descriptive characteristics, MACDP, 1968–2003*
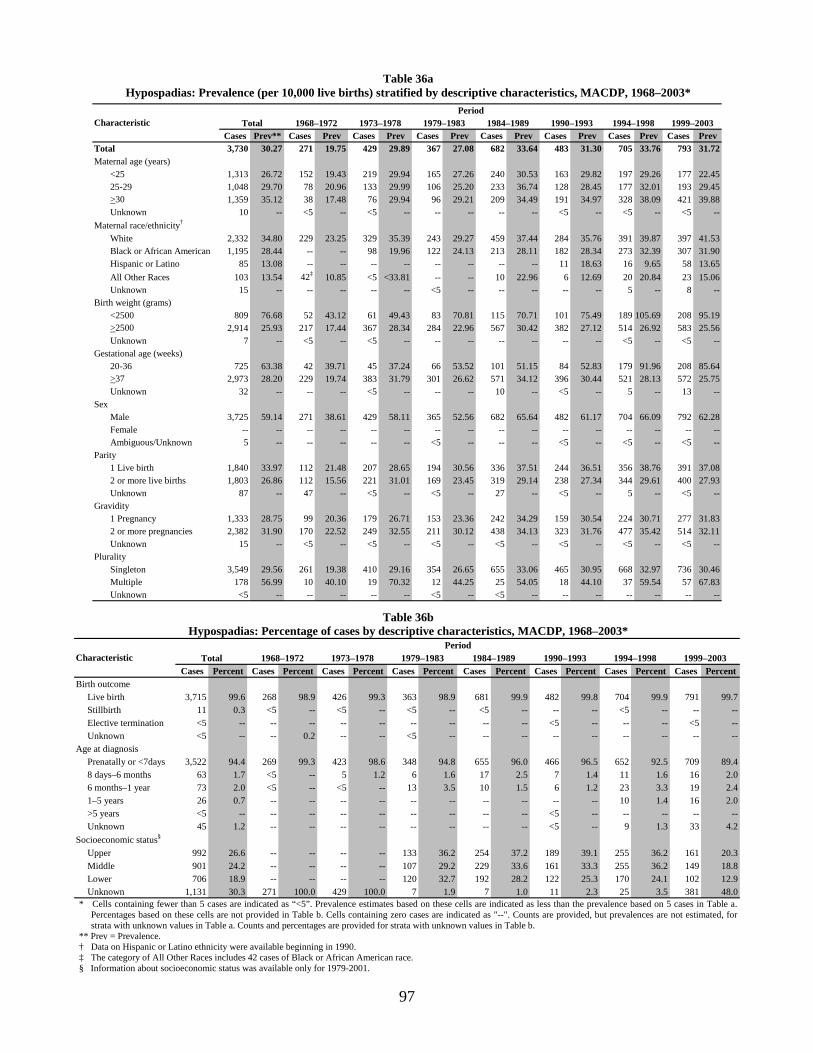
97
Cases Prev** Cases Prev Cases Prev Cases Prev Cases Prev Cases Prev Cases Prev Cases PrevTotal 3,730 30.27 271 19.75 429 29.89 367 27.08 682 33.64 483 31.30 705 33.76 793 31.72Maternal age (years)
<25 1,313 26.72 152 19.43 219 29.94 165 27.26 240 30.53 163 29.82 197 29.26 177 22.4525-29 1,048 29.70 78 20.96 133 29.99 106 25.20 233 36.74 128 28.45 177 32.01 193 29.45>30 1,359 35.12 38 17.48 76 29.94 96 29.21 209 34.49 191 34.97 328 38.09 421 39.88Unknown 10 -- <5 -- <5 -- -- -- -- -- <5 -- <5 -- <5 --
Maternal race/ethnicity†
White 2,332 34.80 229 23.25 329 35.39 243 29.27 459 37.44 284 35.76 391 39.87 397 41.53Black or African American 1,195 28.44 -- -- 98 19.96 122 24.13 213 28.11 182 28.34 273 32.39 307 31.90Hispanic or Latino 85 13.08 -- -- -- -- -- -- -- -- 11 18.63 16 9.65 58 13.65All Other Races 103 13.54 42‡ 10.85 <5 <33.81 -- -- 10 22.96 6 12.69 20 20.84 23 15.06Unknown 15 -- -- -- -- -- <5 -- -- -- -- -- 5 -- 8 --
Birth weight (grams)<2500 809 76.68 52 43.12 61 49.43 83 70.81 115 70.71 101 75.49 189 105.69 208 95.19>2500 2,914 25.93 217 17.44 367 28.34 284 22.96 567 30.42 382 27.12 514 26.92 583 25.56Unknown 7 -- <5 -- <5 -- -- -- -- -- -- -- <5 -- <5 --
Gestational age (weeks)20-36 725 63.38 42 39.71 45 37.24 66 53.52 101 51.15 84 52.83 179 91.96 208 85.64>37 2,973 28.20 229 19.74 383 31.79 301 26.62 571 34.12 396 30.44 521 28.13 572 25.75Unknown 32 -- -- -- <5 -- -- -- 10 -- <5 -- 5 -- 13 --
SexMale 3,725 59.14 271 38.61 429 58.11 365 52.56 682 65.64 482 61.17 704 66.09 792 62.28Female -- -- -- -- -- -- -- -- -- -- -- -- -- -- -- --Ambiguous/Unknown 5 -- -- -- -- -- <5 -- -- -- <5 -- <5 -- <5 --
Parity1 Live birth 1,840 33.97 112 21.48 207 28.65 194 30.56 336 37.51 244 36.51 356 38.76 391 37.082 or more live births 1,803 26.86 112 15.56 221 31.01 169 23.45 319 29.14 238 27.34 344 29.61 400 27.93Unknown 87 -- 47 -- <5 -- <5 -- 27 -- <5 -- 5 -- <5 --
Gravidity1 Pregnancy 1,333 28.75 99 20.36 179 26.71 153 23.36 242 34.29 159 30.54 224 30.71 277 31.832 or more pregnancies 2,382 31.90 170 22.52 249 32.55 211 30.12 438 34.13 323 31.76 477 35.42 514 32.11Unknown 15 -- <5 -- <5 -- <5 -- <5 -- <5 -- <5 -- <5 --
PluralitySingleton 3,549 29.56 261 19.38 410 29.16 354 26.65 655 33.06 465 30.95 668 32.97 736 30.46Multiple 178 56.99 10 40.10 19 70.32 12 44.25 25 54.05 18 44.10 37 59.54 57 67.83Unknown <5 -- -- -- -- -- <5 -- <5 -- -- -- -- -- -- --
CharacteristicPeriod
1984–1989 1990–1993 1994–1998 1999–2003Total 1968–1972 1973–1978 1979–1983
Cases Percent Cases Percent Cases Percent Cases Percent Cases Percent Cases Percent Cases Percent Cases PercentBirth outcome
Live birth 3,715 99.6 268 98.9 426 99.3 363 98.9 681 99.9 482 99.8 704 99.9 791 99.7Stillbirth 11 0.3 <5 -- <5 -- <5 -- <5 -- -- -- <5 -- -- --Elective termination <5 -- -- -- -- -- -- -- -- -- <5 -- -- -- <5 --Unknown <5 -- -- 0.2 -- -- <5 -- -- -- -- -- -- -- -- --
Age at diagnosisPrenatally or <7days 3,522 94.4 269 99.3 423 98.6 348 94.8 655 96.0 466 96.5 652 92.5 709 89.48 days–6 months 63 1.7 <5 -- 5 1.2 6 1.6 17 2.5 7 1.4 11 1.6 16 2.06 months–1 year 73 2.0 <5 -- <5 -- 13 3.5 10 1.5 6 1.2 23 3.3 19 2.41–5 years 26 0.7 -- -- -- -- -- -- -- -- -- -- 10 1.4 16 2.0>5 years <5 -- -- -- -- -- -- -- -- -- <5 -- -- -- -- --Unknown 45 1.2 -- -- -- -- -- -- -- -- <5 -- 9 1.3 33 4.2
Socioeconomic status§
Upper 992 26.6 -- -- -- -- 133 36.2 254 37.2 189 39.1 255 36.2 161 20.3Middle 901 24.2 -- -- -- -- 107 29.2 229 33.6 161 33.3 255 36.2 149 18.8Lower 706 18.9 -- -- -- -- 120 32.7 192 28.2 122 25.3 170 24.1 102 12.9Unknown 1,131 30.3 271 100.0 429 100.0 7 1.9 7 1.0 11 2.3 25 3.5 381 48.0
1999–2003Characteristic Total 1968–1972 1973–1978 1979–1983 1984–1989 1990–1993 1994–1998Period
* Cells containing fewer than 5 cases are indicated as “<5”. Prevalence estimates based on these cells are indicated as less than the prevalence based on 5 cases in Table a.
Percentages based on these cells are not provided in Table b. Cells containing zero cases are indicated as "--". Counts are provided, but prevalences are not estimated, for strata with unknown values in Table a. Counts and percentages are provided for strata with unknown values in Table b.
** Prev = Prevalence. † Data on Hispanic or Latino ethnicity were available beginning in 1990. ‡ The category of All Other Races includes 42 cases of Black or African American race. § Information about socioeconomic status was available only for 1979-2001.
Table 36a Hypospadias: Prevalence (per 10,000 live births) stratified by descriptive characteristics, MACDP, 1968–2003*
Table 36b Hypospadias: Percentage of cases by descriptive characteristics, MACDP, 1968–2003*

98
Cases Prev** Cases Prev Cases Prev Cases Prev Cases Prev Cases Prev Cases Prev Cases PrevTotal 169 1.37 12 0.87 26 1.81 26 1.92 26 1.28 23 1.49 31 1.48 25 1.00Maternal age (years)
<25 73 1.49 5 0.64 14 1.91 16 2.64 13 1.65 6 1.10 11 1.63 8 1.0125-29 44 1.25 <5 <1.34 5 1.13 <5 <1.19 7 1.10 8 1.78 10 1.81 6 0.92>30 51 1.32 <5 <2.30 7 2.76 6 1.83 6 0.99 9 1.65 10 1.16 11 1.04Unknown <5 -- <5 -- -- -- -- -- -- -- -- -- -- -- -- --
Maternal race/ethnicity†
White 97 1.45 10 1.02 18 1.94 18 2.17 18 1.47 10 1.26 12 1.22 11 1.15Black or African American 62 1.48 -- -- 8 1.63 8 1.58 8 1.06 12 1.87 17 2.02 9 0.94Hispanic or Latino <5 <0.77 -- -- -- -- -- -- -- -- -- -- -- -- <5 <1.18All Other Races 6 0.79 <5‡ <1.29 -- -- -- -- -- -- <5 <10.58 <5 <5.21 <5 <3.27Unknown <5 -- -- -- -- -- -- -- -- -- -- -- <5 -- -- --
Birth weight (grams)<2500 132 12.51 10 8.29 21 17.02 20 17.06 20 12.30 19 14.20 22 12.30 20 9.15>2500 36 0.32 <5 <0.40 5 0.39 6 0.49 5 0.27 <5 <0.35 9 0.47 5 0.22Unknown <5 -- -- -- -- -- -- -- <5 -- -- -- -- -- -- --
Gestational age (weeks)20-36 104 9.09 <5 <4.73 8 6.62 15 12.16 14 7.09 19 11.95 24 12.33 20 8.23>37 64 0.61 8 0.69 18 1.49 11 0.97 12 0.72 <5 <0.38 7 0.38 <5 <0.23Unknown <5 -- -- -- -- -- -- -- -- -- -- -- -- -- <5 --
SexMale 104 1.65 10 1.42 20 2.71 12 1.73 15 1.44 16 2.03 15 1.41 16 1.26Female 61 1.01 <5 <0.75 6 0.86 13 1.97 11 1.11 6 0.79 15 1.47 8 0.65Ambiguous/Unknown <5 -- -- -- -- -- <5 -- -- -- <5 -- <5 -- <5 --
Parity1 Live birth 72 1.33 6 1.15 15 2.08 12 1.89 10 1.12 10 1.50 10 1.09 9 0.852 or more live births 95 1.42 6 0.83 11 1.54 14 1.94 14 1.28 13 1.49 21 1.81 16 1.12Unknown <5 -- -- -- -- -- -- -- <5 -- -- -- -- -- -- --
Gravidity1 Pregnancy 54 1.16 5 1.03 12 1.79 9 1.37 8 1.13 5 0.96 6 0.82 9 1.032 or more pregnancies 115 1.54 7 0.93 14 1.83 17 2.43 18 1.40 18 1.77 25 1.86 16 1.00Unknown -- -- -- -- -- -- -- -- -- -- -- -- -- -- -- --
PluralitySingleton 163 1.36 12 0.89 25 1.78 24 1.81 26 1.31 23 1.53 30 1.48 23 0.95Multiple 6 1.92 -- -- <5 <18.50 <5 <18.44 -- -- -- -- <5 <8.05 <5 <5.95Unknown -- -- -- -- -- -- -- -- -- -- -- -- -- -- -- --
CharacteristicPeriod
1984–1989 1990–1993 1994–1998 1999–2003Total 1968–1972 1973–1978 1979–1983
Cases Percent Cases Percent Cases Percent Cases Percent Cases Percent Cases Percent Cases Percent Cases PercentBirth outcome
Live birth 132 78.1 10 83.3 23 88.5 24 92.3 21 80.8 17 73.9 23 74.2 14 56.0Stillbirth 22 13.0 <5 -- <5 -- <5 -- 5 19.2 <5 -- <5 -- 5 20.0Elective termination 15 8.9 -- -- -- -- -- -- -- -- <5 -- 6 19.4 6 24.0Unknown -- -- -- -- -- -- -- -- -- -- -- -- -- -- -- --
Age at diagnosisPrenatally or <7days 159 94.1 12 100.0 25 96.2 25 96.2 24 92.3 23 100.0 29 93.5 21 84.08 days–6 months 7 4.1 -- -- <5 -- <5 -- <5 -- -- -- <5 -- <5 --6 months–1 year -- -- -- -- -- -- -- -- -- -- -- -- -- -- -- --1–5 years <5 -- -- -- -- -- -- -- -- -- -- -- -- -- <5 -->5 years -- -- -- -- -- -- -- -- -- -- -- -- -- -- -- --Unknown <5 -- -- -- -- -- -- -- -- -- -- -- <5 -- <5 --
Socioeconomic status§
Upper 48 28.4 -- -- -- -- 11 42.3 13 50.0 5 21.7 12 38.7 7 28.0Middle 34 20.1 -- -- -- 6 23.1 5 19.2 14 60.9 7 22.6 <5 --Lower 36 21.3 -- -- -- -- 9 34.6 8 30.8 <5 -- 12 38.7 <5 --Unknown 51 30.2 12 100.0 26 100.0 -- -- -- -- -- -- -- -- 13 52.0
1999–2003Characteristic Total 1968–1972 1973–1978 1979–1983 1984–1989 1990–1993 1994–1998Period
* Cells containing fewer than 5 cases are indicated as “<5”. Prevalence estimates based on these cells are indicated as less than the prevalence based on 5 cases in Table a.
Percentages based on these cells are not provided in Table b. Cells containing zero cases are indicated as "--". Counts are provided, but prevalences are not estimated, for strata with unknown values in Table a. Counts and percentages are provided for strata with unknown values in Table b.
** Prev = Prevalence. † Data on Hispanic or Latino ethnicity were available beginning in 1990. ‡ The category of All Other Races includes <5 cases of Black or African American race. § Information about socioeconomic status was available only for 1979-2001.
Table 37a Bilateral renal agenesis or dysgenesis: Prevalence (per 10,000 live births) stratified
by descriptive characteristics, MACDP, 1968–2003*
Table 37b Bilateral renal agenesis or dysgenesis: Percentage of cases by descriptive characteristics, MACDP, 1968–2003*
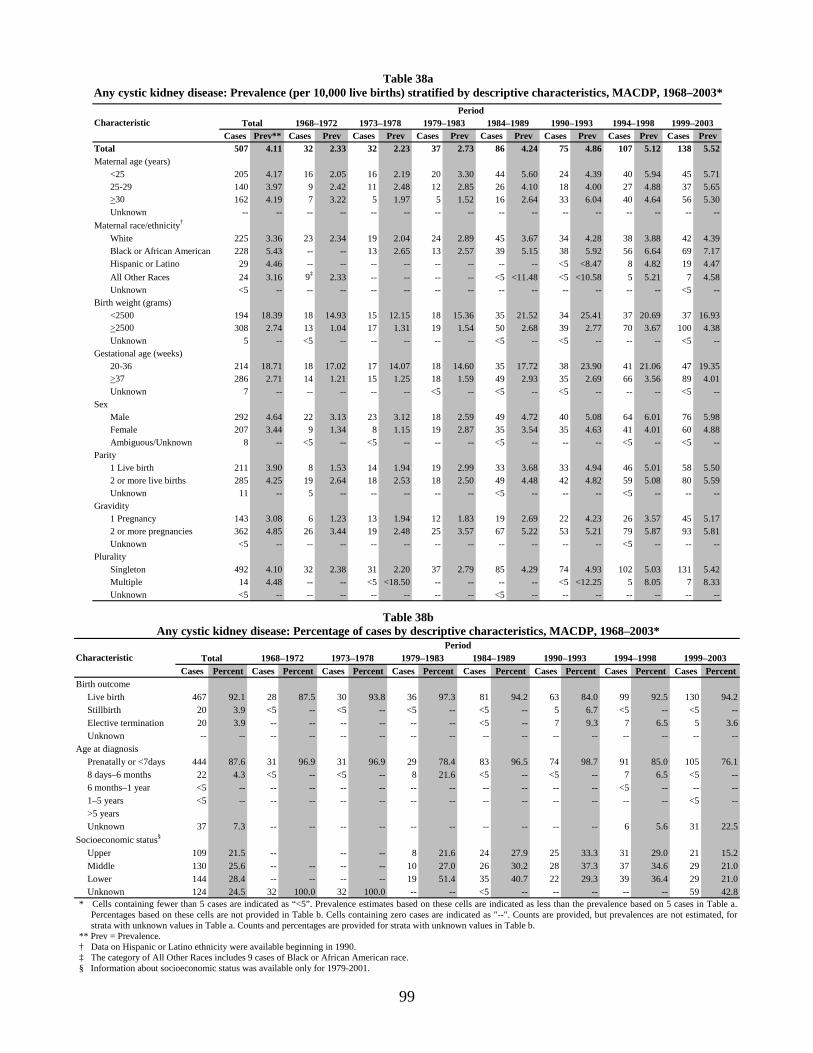
99
Cases Prev** Cases Prev Cases Prev Cases Prev Cases Prev Cases Prev Cases Prev Cases PrevTotal 507 4.11 32 2.33 32 2.23 37 2.73 86 4.24 75 4.86 107 5.12 138 5.52Maternal age (years)
<25 205 4.17 16 2.05 16 2.19 20 3.30 44 5.60 24 4.39 40 5.94 45 5.7125-29 140 3.97 9 2.42 11 2.48 12 2.85 26 4.10 18 4.00 27 4.88 37 5.65>30 162 4.19 7 3.22 5 1.97 5 1.52 16 2.64 33 6.04 40 4.64 56 5.30Unknown -- -- -- -- -- -- -- -- -- -- -- -- -- -- -- --
Maternal race/ethnicity†
White 225 3.36 23 2.34 19 2.04 24 2.89 45 3.67 34 4.28 38 3.88 42 4.39Black or African American 228 5.43 -- -- 13 2.65 13 2.57 39 5.15 38 5.92 56 6.64 69 7.17Hispanic or Latino 29 4.46 -- -- -- -- -- -- -- -- <5 <8.47 8 4.82 19 4.47All Other Races 24 3.16 9‡ 2.33 -- -- -- -- <5 <11.48 <5 <10.58 5 5.21 7 4.58Unknown <5 -- -- -- -- -- -- -- -- -- -- -- -- -- <5 --
Birth weight (grams)<2500 194 18.39 18 14.93 15 12.15 18 15.36 35 21.52 34 25.41 37 20.69 37 16.93>2500 308 2.74 13 1.04 17 1.31 19 1.54 50 2.68 39 2.77 70 3.67 100 4.38Unknown 5 -- <5 -- -- -- -- -- <5 -- <5 -- -- -- <5 --
Gestational age (weeks)20-36 214 18.71 18 17.02 17 14.07 18 14.60 35 17.72 38 23.90 41 21.06 47 19.35>37 286 2.71 14 1.21 15 1.25 18 1.59 49 2.93 35 2.69 66 3.56 89 4.01Unknown 7 -- -- -- -- -- <5 -- <5 -- <5 -- -- -- <5 --
SexMale 292 4.64 22 3.13 23 3.12 18 2.59 49 4.72 40 5.08 64 6.01 76 5.98Female 207 3.44 9 1.34 8 1.15 19 2.87 35 3.54 35 4.63 41 4.01 60 4.88Ambiguous/Unknown 8 -- <5 -- <5 -- -- -- <5 -- -- -- <5 -- <5 --
Parity1 Live birth 211 3.90 8 1.53 14 1.94 19 2.99 33 3.68 33 4.94 46 5.01 58 5.502 or more live births 285 4.25 19 2.64 18 2.53 18 2.50 49 4.48 42 4.82 59 5.08 80 5.59Unknown 11 -- 5 -- -- -- -- -- <5 -- -- -- <5 -- -- --
Gravidity1 Pregnancy 143 3.08 6 1.23 13 1.94 12 1.83 19 2.69 22 4.23 26 3.57 45 5.172 or more pregnancies 362 4.85 26 3.44 19 2.48 25 3.57 67 5.22 53 5.21 79 5.87 93 5.81Unknown <5 -- -- -- -- -- -- -- -- -- -- -- <5 -- -- --
PluralitySingleton 492 4.10 32 2.38 31 2.20 37 2.79 85 4.29 74 4.93 102 5.03 131 5.42Multiple 14 4.48 -- -- <5 <18.50 -- -- -- -- <5 <12.25 5 8.05 7 8.33Unknown <5 -- -- -- -- -- -- -- <5 -- -- -- -- -- -- --
CharacteristicPeriod
1984–1989 1990–1993 1994–1998 1999–2003Total 1968–1972 1973–1978 1979–1983
Cases Percent Cases Percent Cases Percent Cases Percent Cases Percent Cases Percent Cases Percent Cases PercentBirth outcome
Live birth 467 92.1 28 87.5 30 93.8 36 97.3 81 94.2 63 84.0 99 92.5 130 94.2Stillbirth 20 3.9 <5 -- <5 -- <5 -- <5 -- 5 6.7 <5 -- <5 --Elective termination 20 3.9 -- -- -- -- -- -- <5 -- 7 9.3 7 6.5 5 3.6Unknown -- -- -- -- -- -- -- -- -- -- -- -- -- -- -- --
Age at diagnosisPrenatally or <7days 444 87.6 31 96.9 31 96.9 29 78.4 83 96.5 74 98.7 91 85.0 105 76.18 days–6 months 22 4.3 <5 -- <5 -- 8 21.6 <5 -- <5 -- 7 6.5 <5 --6 months–1 year <5 -- -- -- -- -- -- -- -- -- -- -- <5 -- -- --1–5 years <5 -- -- -- -- -- -- -- -- -- -- -- -- -- <5 -->5 yearsUnknown 37 7.3 -- -- -- -- -- -- -- -- -- -- 6 5.6 31 22.5
Socioeconomic status§
Upper 109 21.5 -- -- -- 8 21.6 24 27.9 25 33.3 31 29.0 21 15.2Middle 130 25.6 -- -- -- -- 10 27.0 26 30.2 28 37.3 37 34.6 29 21.0Lower 144 28.4 -- -- -- -- 19 51.4 35 40.7 22 29.3 39 36.4 29 21.0Unknown 124 24.5 32 100.0 32 100.0 -- -- <5 -- -- -- -- -- 59 42.8
1999–2003Characteristic Total 1968–1972 1973–1978 1979–1983 1984–1989 1990–1993 1994–1998Period
* Cells containing fewer than 5 cases are indicated as “<5”. Prevalence estimates based on these cells are indicated as less than the prevalence based on 5 cases in Table a.
Percentages based on these cells are not provided in Table b. Cells containing zero cases are indicated as "--". Counts are provided, but prevalences are not estimated, for strata with unknown values in Table a. Counts and percentages are provided for strata with unknown values in Table b.
** Prev = Prevalence. † Data on Hispanic or Latino ethnicity were available beginning in 1990. ‡ The category of All Other Races includes 9 cases of Black or African American race. § Information about socioeconomic status was available only for 1979-2001.
Table 38a Any cystic kidney disease: Prevalence (per 10,000 live births) stratified by descriptive characteristics, MACDP, 1968–2003*
Table 38b Any cystic kidney disease: Percentage of cases by descriptive characteristics, MACDP, 1968–2003*
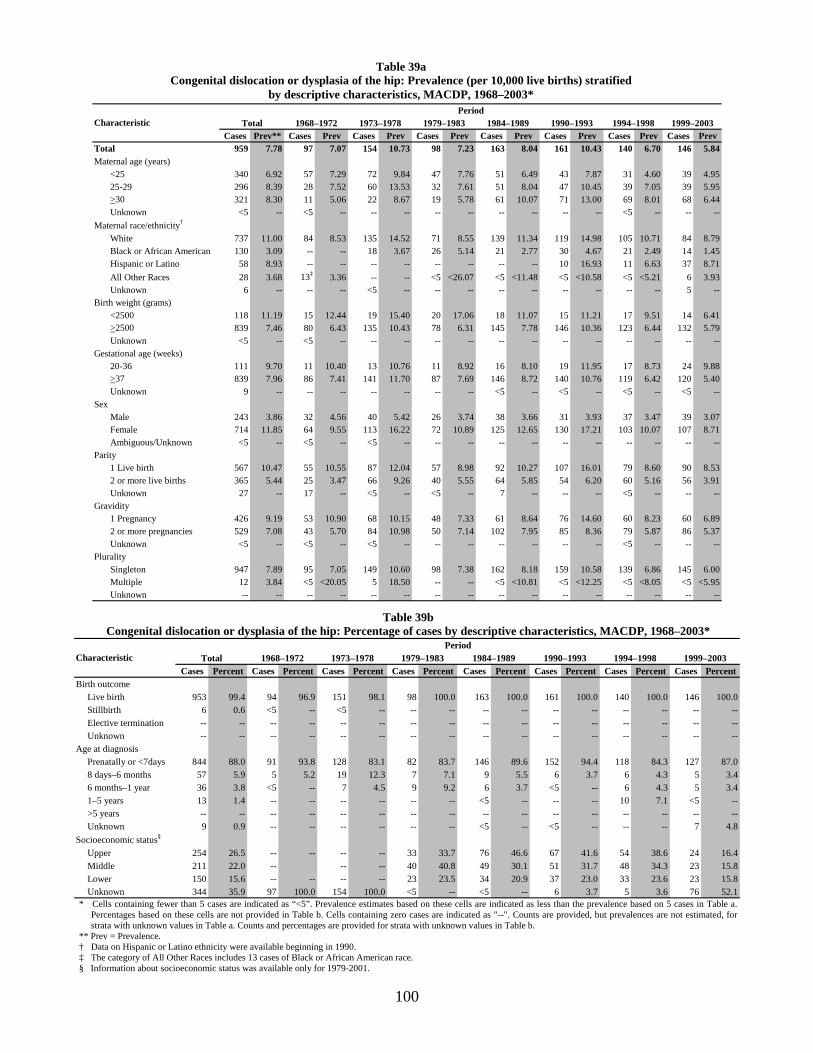
100
Cases Prev** Cases Prev Cases Prev Cases Prev Cases Prev Cases Prev Cases Prev Cases PrevTotal 959 7.78 97 7.07 154 10.73 98 7.23 163 8.04 161 10.43 140 6.70 146 5.84Maternal age (years)
<25 340 6.92 57 7.29 72 9.84 47 7.76 51 6.49 43 7.87 31 4.60 39 4.9525-29 296 8.39 28 7.52 60 13.53 32 7.61 51 8.04 47 10.45 39 7.05 39 5.95>30 321 8.30 11 5.06 22 8.67 19 5.78 61 10.07 71 13.00 69 8.01 68 6.44Unknown <5 -- <5 -- -- -- -- -- -- -- -- -- <5 -- -- --
Maternal race/ethnicity†
White 737 11.00 84 8.53 135 14.52 71 8.55 139 11.34 119 14.98 105 10.71 84 8.79Black or African American 130 3.09 -- -- 18 3.67 26 5.14 21 2.77 30 4.67 21 2.49 14 1.45Hispanic or Latino 58 8.93 -- -- -- -- -- -- -- -- 10 16.93 11 6.63 37 8.71All Other Races 28 3.68 13‡ 3.36 -- -- <5 <26.07 <5 <11.48 <5 <10.58 <5 <5.21 6 3.93Unknown 6 -- -- -- <5 -- -- -- -- -- -- -- -- -- 5 --
Birth weight (grams)<2500 118 11.19 15 12.44 19 15.40 20 17.06 18 11.07 15 11.21 17 9.51 14 6.41>2500 839 7.46 80 6.43 135 10.43 78 6.31 145 7.78 146 10.36 123 6.44 132 5.79Unknown <5 -- <5 -- -- -- -- -- -- -- -- -- -- -- -- --
Gestational age (weeks)20-36 111 9.70 11 10.40 13 10.76 11 8.92 16 8.10 19 11.95 17 8.73 24 9.88>37 839 7.96 86 7.41 141 11.70 87 7.69 146 8.72 140 10.76 119 6.42 120 5.40Unknown 9 -- -- -- -- -- -- -- <5 -- <5 -- <5 -- <5 --
SexMale 243 3.86 32 4.56 40 5.42 26 3.74 38 3.66 31 3.93 37 3.47 39 3.07Female 714 11.85 64 9.55 113 16.22 72 10.89 125 12.65 130 17.21 103 10.07 107 8.71Ambiguous/Unknown <5 -- <5 -- <5 -- -- -- -- -- -- -- -- -- -- --
Parity1 Live birth 567 10.47 55 10.55 87 12.04 57 8.98 92 10.27 107 16.01 79 8.60 90 8.532 or more live births 365 5.44 25 3.47 66 9.26 40 5.55 64 5.85 54 6.20 60 5.16 56 3.91Unknown 27 -- 17 -- <5 -- <5 -- 7 -- -- -- <5 -- -- --
Gravidity1 Pregnancy 426 9.19 53 10.90 68 10.15 48 7.33 61 8.64 76 14.60 60 8.23 60 6.892 or more pregnancies 529 7.08 43 5.70 84 10.98 50 7.14 102 7.95 85 8.36 79 5.87 86 5.37Unknown <5 -- <5 -- <5 -- -- -- -- -- -- -- <5 -- -- --
PluralitySingleton 947 7.89 95 7.05 149 10.60 98 7.38 162 8.18 159 10.58 139 6.86 145 6.00Multiple 12 3.84 <5 <20.05 5 18.50 -- -- <5 <10.81 <5 <12.25 <5 <8.05 <5 <5.95Unknown -- -- -- -- -- -- -- -- -- -- -- -- -- -- -- --
CharacteristicPeriod
1984–1989 1990–1993 1994–1998 1999–2003Total 1968–1972 1973–1978 1979–1983
Cases Percent Cases Percent Cases Percent Cases Percent Cases Percent Cases Percent Cases Percent Cases PercentBirth outcome
Live birth 953 99.4 94 96.9 151 98.1 98 100.0 163 100.0 161 100.0 140 100.0 146 100.0Stillbirth 6 0.6 <5 -- <5 -- -- -- -- -- -- -- -- -- -- --Elective termination -- -- -- -- -- -- -- -- -- -- -- -- -- -- -- --Unknown -- -- -- -- -- -- -- -- -- -- -- -- -- -- -- --
Age at diagnosisPrenatally or <7days 844 88.0 91 93.8 128 83.1 82 83.7 146 89.6 152 94.4 118 84.3 127 87.08 days–6 months 57 5.9 5 5.2 19 12.3 7 7.1 9 5.5 6 3.7 6 4.3 5 3.46 months–1 year 36 3.8 <5 -- 7 4.5 9 9.2 6 3.7 <5 -- 6 4.3 5 3.41–5 years 13 1.4 -- -- -- -- -- -- <5 -- -- -- 10 7.1 <5 -->5 years -- -- -- -- -- -- -- -- -- -- -- -- -- -- -- --Unknown 9 0.9 -- -- -- -- -- -- <5 -- <5 -- -- -- 7 4.8
Socioeconomic status§
Upper 254 26.5 -- -- -- -- 33 33.7 76 46.6 67 41.6 54 38.6 24 16.4Middle 211 22.0 -- -- -- 40 40.8 49 30.1 51 31.7 48 34.3 23 15.8Lower 150 15.6 -- -- -- -- 23 23.5 34 20.9 37 23.0 33 23.6 23 15.8Unknown 344 35.9 97 100.0 154 100.0 <5 -- <5 -- 6 3.7 5 3.6 76 52.1
1999–2003Characteristic Total 1968–1972 1973–1978 1979–1983 1984–1989 1990–1993 1994–1998Period
* Cells containing fewer than 5 cases are indicated as “<5”. Prevalence estimates based on these cells are indicated as less than the prevalence based on 5 cases in Table a.
Percentages based on these cells are not provided in Table b. Cells containing zero cases are indicated as "--". Counts are provided, but prevalences are not estimated, for strata with unknown values in Table a. Counts and percentages are provided for strata with unknown values in Table b.
** Prev = Prevalence. † Data on Hispanic or Latino ethnicity were available beginning in 1990. ‡ The category of All Other Races includes 13 cases of Black or African American race. § Information about socioeconomic status was available only for 1979-2001.
Table 39a Congenital dislocation or dysplasia of the hip: Prevalence (per 10,000 live births) stratified
by descriptive characteristics, MACDP, 1968–2003*
Table 39b Congenital dislocation or dysplasia of the hip: Percentage of cases by descriptive characteristics, MACDP, 1968–2003*

101
Cases Prev** Cases Prev Cases Prev Cases Prev Cases Prev Cases Prev Cases Prev Cases PrevTotal 2,099 17.03 344 25.07 401 27.94 265 19.55 304 14.99 202 13.09 305 14.61 278 11.12Maternal age (years)
<25 943 19.19 197 25.18 226 30.90 148 24.45 126 16.03 74 13.54 85 12.62 87 11.0325-29 604 17.12 100 26.87 111 25.03 78 18.54 94 14.82 58 12.89 89 16.09 74 11.29>30 549 14.19 44 20.24 64 25.21 39 11.86 84 13.86 70 12.82 131 15.21 117 11.08Unknown <5 -- <5 -- -- -- -- -- -- -- -- -- -- -- -- --
Maternal race/ethnicity†
White 1,386 20.68 283 28.73 308 33.13 185 22.28 204 16.64 116 14.61 155 15.81 135 14.12Black or African American 539 12.83 -- -- 88 17.93 79 15.62 95 12.54 75 11.68 118 14.00 84 8.73Hispanic or Latino 69 10.62 -- -- -- -- -- -- -- -- 7 11.85 16 9.65 46 10.83All Other Races 98 12.88 61‡ 15.76 <5 <33.81 -- -- 5 11.48 <5 <10.58 14 14.59 10 6.55Unknown 7 -- -- -- <5 -- <5 -- -- -- -- -- <5 -- <5 --
Birth weight (grams)<2500 442 41.90 59 48.93 70 56.72 61 52.04 60 36.89 51 38.12 77 43.06 64 29.29>2500 1,645 14.64 281 22.58 329 25.41 204 16.49 243 13.04 150 10.65 227 11.89 211 9.25Unknown 12 -- <5 -- <5 -- -- -- <5 -- <5 -- <5 -- <5 --
Gestational age (weeks)20-36 390 34.09 43 40.65 63 52.14 54 43.79 45 22.79 55 34.59 73 37.50 57 23.47>37 1,696 16.09 301 25.95 337 27.97 211 18.66 255 15.24 144 11.07 231 12.47 217 9.77Unknown 13 -- -- -- <5 -- -- -- <5 -- <5 -- <5 -- <5 --
SexMale 1,275 20.24 198 28.21 239 32.37 150 21.60 194 18.67 123 15.61 191 17.93 180 14.15Female 818 13.58 146 21.79 159 22.82 115 17.40 110 11.13 79 10.46 113 11.04 96 7.82Ambiguous/Unknown 6 -- -- -- <5 -- -- -- -- -- -- -- <5 -- <5 --
Parity1 Live birth 1,070 19.76 173 33.18 215 29.76 141 22.21 137 15.29 108 16.16 151 16.44 145 13.752 or more live births 958 14.27 118 16.40 186 26.10 123 17.07 151 13.79 94 10.80 153 13.17 133 9.29Unknown 71 -- 53 -- -- -- <5 -- 16 -- -- -- <5 -- -- --
Gravidity1 Pregnancy 833 17.96 161 33.11 182 27.15 103 15.73 106 15.02 66 12.68 105 14.40 110 12.642 or more pregnancies 1,260 16.87 183 24.24 218 28.49 161 22.98 195 15.19 136 13.37 199 14.78 168 10.50Unknown 6 -- -- -- <5 -- <5 -- <5 -- -- -- <5 -- -- --
PluralitySingleton 2,045 17.03 339 25.17 393 27.95 254 19.12 294 14.84 198 13.18 299 14.76 268 11.09Multiple 53 16.97 5 20.05 8 29.61 11 40.56 10 21.62 <5 <12.25 6 9.66 9 10.71Unknown <5 -- -- -- -- -- -- -- -- -- -- -- -- -- <5 --
CharacteristicPeriod
1984–1989 1990–1993 1994–1998 1999–2003Total 1968–1972 1973–1978 1979–1983
Cases Percent Cases Percent Cases Percent Cases Percent Cases Percent Cases Percent Cases Percent Cases PercentBirth outcome
Live birth 2,033 96.9 337 98.0 392 97.8 258 97.4 296 97.4 191 94.6 290 95.1 269 96.8Stillbirth 54 2.6 7 2.0 9 2.2 7 2.6 8 2.6 7 3.5 11 3.6 5 1.8Elective termination 12 0.6 -- -- -- -- -- -- -- -- <5 -- <5 -- <5 --Unknown -- -- -- -- -- -- -- -- -- -- -- -- -- -- -- --
Age at diagnosisPrenatally or <7days 2,041 97.2 341 99.1 394 98.3 264 99.6 292 96.1 197 97.5 295 96.7 258 92.88 days–6 months 28 1.3 <5 -- 7 1.7 <5 -- 7 2.3 <5 -- <5 -- <5 --6 months–1 year 10 0.5 -- -- -- -- -- -- 5 1.6 <5 -- <5 -- <5 --1–5 years <5 -- -- -- -- -- -- -- -- -- -- -- <5 -- <5 -->5 years -- -- -- -- -- -- -- -- -- -- -- -- -- -- -- --Unknown 18 0.9 -- -- -- -- -- -- -- -- -- -- <5 -- 14 5.0
Socioeconomic status§
Upper 399 19.0 -- -- -- -- 74 27.9 114 37.5 72 35.6 95 31.1 44 15.8Middle 437 20.8 -- -- -- 88 33.2 88 28.9 72 35.6 123 40.3 66 23.7Lower 356 17.0 -- -- -- -- 95 35.8 95 31.3 53 26.2 74 24.3 39 14.0Unknown 907 43.2 344 100.0 401 100.0 8 3.0 7 2.3 5 2.5 13 4.3 129 46.4
1999–2003Characteristic Total 1968–1972 1973–1978 1979–1983 1984–1989 1990–1993 1994–1998Period
* Cells containing fewer than 5 cases are indicated as “<5”. Prevalence estimates based on these cells are indicated as less than the prevalence based on 5 cases in Table a.
Percentages based on these cells are not provided in Table b. Cells containing zero cases are indicated as "--". Counts are provided, but prevalences are not estimated, for strata with unknown values in Table a. Counts and percentages are provided for strata with unknown values in Table b.
** Prev = Prevalence. † Data on Hispanic or Latino ethnicity were available beginning in 1990. ‡ The category of All Other Races includes 58 cases of Black or African American race. § Information about socioeconomic status was available only for 1979-2001.
Table 40a Clubfoot without a neural tube defect: Prevalence (per 10,000 live births) stratified
by descriptive characteristics, MACDP, 1968–2003*
Table 40b Clubfoot without a neural tube defect: Percentage of cases by descriptive characteristics, MACDP, 1968–2003*

102
Cases Prev** Cases Prev Cases Prev Cases Prev Cases Prev Cases Prev Cases Prev Cases PrevTotal 1,913 15.53 155 11.30 190 13.24 474 34.97 285 14.06 167 10.82 294 14.08 348 13.92Maternal age (years)
<25 884 17.99 80 10.23 110 15.04 268 44.27 132 16.79 62 11.34 107 15.89 125 15.8525-29 516 14.62 43 11.55 48 10.82 127 30.19 76 11.98 46 10.22 76 13.74 100 15.26>30 509 13.16 31 14.26 32 12.61 79 24.03 76 12.54 59 10.80 110 12.77 122 11.56Unknown <5 -- <5 -- -- -- -- -- <5 -- -- -- <5 -- <5 --
Maternal race/ethnicity†
White 778 11.61 119 12.08 118 12.69 98 11.80 139 11.34 88 11.08 117 11.93 99 10.36Black or African American 974 23.18 -- -- 71 14.46 373 73.76 143 18.87 61 9.50 146 17.32 180 18.70Hispanic or Latino 79 12.16 -- -- -- -- -- -- -- -- 7 11.85 20 12.06 52 12.24All Other Races 76 9.99 36‡ 9.30 <5 <33.81 <5 <26.07 <5 <11.48 10 21.15 10 10.42 15 9.82Unknown 6 -- -- -- -- -- <5 -- <5 -- <5 -- <5 -- <5 --
Birth weight (grams)<2500 339 32.13 29 24.05 31 25.12 70 59.72 55 33.82 35 26.16 50 27.96 69 31.58>2500 1,570 13.97 124 9.96 158 12.20 404 32.66 229 12.29 132 9.37 244 12.78 279 12.23Unknown <5 -- <5 -- <5 -- -- -- <5 -- -- -- -- -- -- --
Gestational age (weeks)20-36 319 27.89 23 21.75 30 24.83 73 59.20 50 25.32 30 18.87 43 22.09 70 28.82>37 1,569 14.88 132 11.38 160 13.28 399 35.29 231 13.80 134 10.30 246 13.28 267 12.02Unknown 25 -- -- -- -- -- <5 -- <5 -- <5 -- 5 -- 11 --
SexMale 1,118 17.75 92 13.11 107 14.49 268 38.59 171 16.46 99 12.56 173 16.24 208 16.36Female 792 13.15 62 9.25 83 11.91 206 31.17 114 11.53 66 8.74 121 11.83 140 11.40Ambiguous/Unknown <5 -- <5 -- -- -- -- -- -- -- <5 -- -- -- -- --
Parity1 Live birth 814 15.03 66 12.66 89 12.32 219 34.50 112 12.50 72 10.77 119 12.96 137 12.992 or more live births 1,051 15.66 61 8.48 100 14.03 255 35.39 155 14.16 95 10.91 175 15.06 210 14.66Unknown 48 -- 28 -- <5 -- -- -- 18 -- -- -- -- -- <5 --
Gravidity1 Pregnancy 606 13.07 61 12.54 73 10.89 154 23.52 94 13.32 51 9.80 78 10.70 95 10.922 or more pregnancies 1,301 17.42 93 12.32 117 15.29 317 45.25 190 14.81 116 11.41 216 16.04 252 15.74Unknown 6 -- <5 -- -- -- <5 -- <5 -- -- -- -- -- <5 --
PluralitySingleton 1,858 15.47 152 11.28 186 13.23 462 34.78 277 13.98 159 10.58 286 14.12 336 13.91Multiple 55 17.61 <5 <20.05 <5 <18.50 12 44.25 8 17.30 8 19.60 8 12.87 12 14.28Unknown -- -- -- -- -- -- -- -- -- -- -- -- -- -- -- --
CharacteristicPeriod
1984–1989 1990–1993 1994–1998 1999–2003Total 1968–1972 1973–1978 1979–1983
Cases Percent Cases Percent Cases Percent Cases Percent Cases Percent Cases Percent Cases Percent Cases PercentBirth outcome
Live birth 1,856 97.0 150 96.8 185 97.4 467 98.5 276 96.8 160 95.8 283 96.3 335 96.3Stillbirth 40 2.1 5 3.2 5 2.6 7 1.5 8 2.8 5 3.0 6 2.0 <5 --Elective termination 17 0.9 -- -- -- -- -- -- <5 -- <5 -- 5 1.7 9 2.6Unknown -- -- -- -- -- -- -- -- -- -- -- -- -- -- -- --
Age at diagnosisPrenatally or <7days 1,856 97.0 154 99.4 186 97.9 469 98.9 279 97.9 162 97.0 276 93.9 330 94.88 days–6 months 33 1.7 <5 -- <5 -- <5 -- 5 1.8 <5 -- 7 2.4 8 2.36 months–1 year 6 0.3 -- -- -- -- <5 -- <5 -- <5 -- <5 -- <5 --1–5 years <5 -- -- -- -- -- -- -- -- -- -- -- <5 -- -- -->5 years <5 -- -- -- -- -- -- -- -- -- -- -- <5 -- -- --Unknown 15 0.8 -- -- -- -- -- -- -- -- -- -- 7 2.4 8 2.3
Socioeconomic status§
Upper 347 18.1 -- -- -- -- 65 13.7 87 30.5 59 35.3 89 30.3 47 13.5Middle 425 22.2 -- -- -- -- 111 23.4 72 25.3 57 34.1 97 33.0 88 25.3Lower 603 31.5 -- -- -- -- 294 62.0 121 42.5 48 28.7 92 31.3 48 13.8Unknown 538 28.1 155 100.0 190 100.0 <5 -- 5 1.8 <5 -- 16 5.4 165 47.4
1999–2003Characteristic Total 1968–1972 1973–1978 1979–1983 1984–1989 1990–1993 1994–1998Period
* Cells containing fewer than 5 cases are indicated as “<5”. Prevalence estimates based on these cells are indicated as less than the prevalence based on 5 cases in Table a.
Percentages based on these cells are not provided in Table b. Cells containing zero cases are indicated as "--". Counts are provided, but prevalences are not estimated, for strata with unknown values in Table a. Counts and percentages are provided for strata with unknown values in Table b.
** Prev = Prevalence. † Data on Hispanic or Latino ethnicity were available beginning in 1990. ‡ The category of All Other Races includes 36 cases of Black or African American race. § Information about socioeconomic status was available only for 1979-2001.
Table 41a Polydactyly: Prevalence (per 10,000 live births) stratified by descriptive characteristics, MACDP, 1968–2003*
Table 41b Polydactyly: Percentage of cases by descriptive characteristics, MACDP, 1968–2003*

103
Cases Prev** Cases Prev Cases Prev Cases Prev Cases Prev Cases Prev Cases Prev Cases PrevTotal 377 3.06 54 3.94 55 3.83 38 2.80 52 2.56 48 3.11 67 3.21 63 2.52Maternal age (years)
<25 173 3.52 25 3.20 31 4.24 25 4.13 24 3.05 20 3.66 28 4.16 20 2.5425-29 105 2.98 19 5.11 17 3.83 7 1.66 13 2.05 17 3.78 23 4.16 9 1.37>30 98 2.53 9 4.14 7 2.76 6 1.83 15 2.48 11 2.01 16 1.86 34 3.22Unknown <5 -- <5 -- -- -- -- -- -- -- -- -- -- -- -- --
Maternal race/ethnicity†
White 212 3.16 37 3.76 38 4.09 21 2.53 36 2.94 23 2.90 35 3.57 22 2.30Black or African American 121 2.88 -- -- 17 3.46 17 3.36 14 1.85 24 3.74 24 2.85 25 2.60Hispanic or Latino 17 2.62 -- -- -- -- -- -- -- -- -- -- 5 3.01 12 2.82All Other Races 26 3.42 17‡ 4.39 -- -- -- -- <5 <11.48 <5 <10.58 <5 <5.21 <5 <3.27Unknown <5 -- -- -- -- -- -- -- -- -- -- -- <5 -- -- --
Birth weight (grams)<2500 138 13.08 22 18.24 16 12.96 13 11.09 19 11.68 16 11.96 29 16.22 23 10.53>2500 235 2.09 31 2.49 39 3.01 24 1.94 31 1.66 32 2.27 38 1.99 40 1.75Unknown <5 -- <5 -- -- -- <5 -- <5 -- -- -- -- -- -- --
Gestational age (weeks)20-36 118 10.32 11 10.40 17 14.07 7 5.68 17 8.61 15 9.43 29 14.90 22 9.06>37 255 2.42 42 3.62 38 3.15 31 2.74 32 1.91 33 2.54 38 2.05 41 1.85Unknown <5 -- <5 -- -- -- -- -- <5 -- -- -- -- -- -- --
SexMale 208 3.30 32 4.56 28 3.79 22 3.17 22 2.12 30 3.81 37 3.47 37 2.91Female 164 2.72 22 3.28 27 3.87 16 2.42 27 2.73 17 2.25 29 2.83 26 2.12Ambiguous/Unknown 5 -- -- -- -- -- -- -- <5 -- <5 -- <5 -- -- --
Parity1 Live birth 196 3.62 23 4.41 31 4.29 21 3.31 26 2.90 28 4.19 39 4.25 28 2.662 or more live births 170 2.53 23 3.20 24 3.37 17 2.36 23 2.10 20 2.30 28 2.41 35 2.44Unknown 11 -- 8 -- -- -- -- -- <5 -- -- -- -- -- -- --
Gravidity1 Pregnancy 162 3.49 18 3.70 30 4.48 18 2.75 22 3.12 23 4.42 29 3.98 22 2.532 or more pregnancies 215 2.88 36 4.77 25 3.27 20 2.85 30 2.34 25 2.46 38 2.82 41 2.56Unknown -- -- -- -- -- -- -- -- -- -- -- -- -- -- -- --
PluralitySingleton 361 3.01 53 3.93 55 3.91 36 2.71 47 2.37 46 3.06 63 3.11 61 2.52Multiple 16 5.12 <5 <20.05 -- -- <5 <18.44 5 10.81 <5 <12.25 <5 <8.05 <5 <5.95Unknown -- -- -- -- -- -- -- -- -- -- -- -- -- -- -- --
CharacteristicPeriod
1984–1989 1990–1993 1994–1998 1999–2003Total 1968–1972 1973–1978 1979–1983
Cases Percent Cases Percent Cases Percent Cases Percent Cases Percent Cases Percent Cases Percent Cases PercentBirth outcome
Live birth 344 91.2 52 96.3 52 94.5 34 89.5 47 90.4 43 89.6 60 89.6 56 88.9Stillbirth 25 6.6 <5 -- <5 -- <5 -- 5 9.6 <5 -- <5 -- <5 --Elective termination 8 2.1 -- -- -- -- -- -- -- -- <5 -- <5 -- <5 --Unknown -- -- -- -- -- -- -- -- -- -- -- -- -- -- -- --
Age at diagnosisPrenatally or <7days 375 99.5 54 100.0 55 100.0 38 100.0 51 98.1 48 100.0 67 100.0 62 98.48 days–6 months <5 -- -- -- -- -- -- -- <5 -- -- -- -- -- -- --6 months–1 year -- -- -- -- -- -- -- -- -- -- -- -- -- -- -- --1–5 years -- -- -- -- -- -- -- -- -- -- -- -- -- -- -- -->5 years -- -- -- -- -- -- -- -- -- -- -- -- -- -- -- --Unknown <5 -- -- -- -- -- -- -- -- -- -- -- -- -- <5 --
Socioeconomic status§
Upper 68 18.0 -- -- -- -- 8 21.1 15 28.8 14 29.2 19 28.4 12 19.0Middle 81 21.5 -- -- -- -- 11 28.9 14 26.9 15 31.3 27 40.3 14 22.2Lower 88 23.3 -- -- -- 16 42.1 22 42.3 19 39.6 19 28.4 12 19.0Unknown 140 37.1 54 100.0 55 100.0 <5 -- <5 -- -- -- <5 -- 25 39.7
1999–2003Characteristic Total 1968–1972 1973–1978 1979–1983 1984–1989 1990–1993 1994–1998Period
* Cells containing fewer than 5 cases are indicated as “<5”. Prevalence estimates based on these cells are indicated as less than the prevalence based on 5 cases in Table a.
Percentages based on these cells are not provided in Table b. Cells containing zero cases are indicated as "--". Counts are provided, but prevalences are not estimated, for strata with unknown values in Table a. Counts and percentages are provided for strata with unknown values in Table b.
** Prev = Prevalence. † Data on Hispanic or Latino ethnicity were available beginning in 1990. ‡ The category of All Other Races includes 16 cases of Black or African American race. § Information about socioeconomic status was available only for 1979-2001.
Table 42a Transverse limb deficiency: Prevalence (per 10,000 live births) stratified by descriptive characteristics, MACDP, 1968–2003*
Table 42b Transverse limb deficiency: Percentage of cases by descriptive characteristics, MACDP, 1968–2003*

104
Cases Prev** Cases Prev Cases Prev Cases Prev Cases Prev Cases Prev Cases Prev Cases PrevTotal 481 3.90 30 2.19 56 3.90 44 3.25 69 3.40 93 6.03 88 4.21 101 4.04Maternal age (years)
<25 129 2.63 13 1.66 23 3.14 13 2.15 21 2.67 23 4.21 19 2.82 17 2.1625-29 136 3.85 8 2.15 19 4.28 11 2.61 16 2.52 30 6.67 28 5.06 24 3.66>30 215 5.56 8 3.68 14 5.52 20 6.08 32 5.28 40 7.32 41 4.76 60 5.68Unknown <5 -- <5 -- -- -- -- -- -- -- -- -- -- -- -- --
Maternal race/ethnicity†
White 353 5.27 25 2.54 46 4.95 42 5.06 61 4.98 74 9.32 52 5.30 53 5.54Black or African American 82 1.95 -- -- 9 1.83 <5 <0.99 7 0.92 17 2.65 25 2.97 22 2.29Hispanic or Latino 30 4.62 -- -- -- -- -- -- -- -- -- -- 9 5.43 21 4.94All Other Races 14 1.84 5‡ 1.29 <5 <33.81 -- -- -- -- <5 <10.58 <5 <5.21 5 3.27Unknown <5 -- -- -- -- -- -- -- <5 -- <5 -- -- -- -- --
Birth weight (grams)<2500 78 7.39 <5 <4.15 10 8.10 5 4.27 12 7.38 16 11.96 13 7.27 19 8.69>2500 401 3.57 26 2.09 46 3.55 39 3.15 57 3.06 77 5.47 75 3.93 81 3.55Unknown <5 -- <5 -- -- -- -- -- -- -- -- -- -- -- <5 --
Gestational age (weeks)20-36 83 7.26 <5 <4.73 7 5.79 <5 <4.05 13 6.58 17 10.69 16 8.22 23 9.47>37 394 3.74 27 2.33 49 4.07 40 3.54 54 3.23 76 5.84 71 3.83 77 3.47Unknown <5 -- -- -- -- -- -- -- <5 -- -- -- <5 -- <5 --
SexMale 322 5.11 22 3.13 33 4.47 34 4.90 47 4.52 57 7.23 65 6.10 64 5.03Female 159 2.64 8 1.19 23 3.30 10 1.51 22 2.23 36 4.77 23 2.25 37 3.01Ambiguous/Unknown -- -- -- -- -- -- -- -- -- -- -- -- -- -- -- --
Parity1 Live birth 213 3.93 14 2.68 21 2.91 18 2.84 36 4.02 48 7.18 37 4.03 39 3.702 or more live births 263 3.92 13 1.81 35 4.91 26 3.61 32 2.92 45 5.17 50 4.30 62 4.33Unknown 5 -- <5 -- -- -- -- -- <5 -- -- -- <5 -- -- --
Gravidity1 Pregnancy 132 2.85 10 2.06 19 2.83 14 2.14 22 3.12 24 4.61 20 2.74 23 2.642 or more pregnancies 345 4.62 18 2.38 37 4.84 30 4.28 46 3.58 69 6.78 67 4.97 78 4.87Unknown <5 -- <5 -- -- -- -- -- <5 -- -- -- <5 -- -- --
PluralitySingleton 452 3.76 28 2.08 55 3.91 43 3.24 65 3.28 85 5.66 80 3.95 96 3.97Multiple 28 8.97 <5 <20.05 <5 <18.50 <5 <18.44 <5 <10.81 8 19.60 8 12.87 5 5.95Unknown <5 -- -- -- -- -- -- -- <5 -- -- -- -- -- -- --
CharacteristicPeriod
1984–1989 1990–1993 1994–1998 1999–2003Total 1968–1972 1973–1978 1979–1983
Cases Percent Cases Percent Cases Percent Cases Percent Cases Percent Cases Percent Cases Percent Cases PercentBirth outcome
Live birth 480 99.8 30 100.0 56 100.0 44 100.0 69 100.0 93 100.0 88 100.0 100 99.0Stillbirth <5 -- -- -- -- -- -- -- -- -- -- -- -- -- <5 --Elective termination -- -- -- -- -- -- -- -- -- -- -- -- -- -- -- --Unknown -- -- -- -- -- -- -- -- -- -- -- -- -- -- -- --
Age at diagnosisPrenatally or <7days 176 36.6 13 43.3 29 51.8 28 63.6 27 39.1 33 35.5 21 23.9 25 24.88 days–6 months 191 39.7 16 53.3 24 42.9 13 29.5 26 37.7 40 43.0 42 47.7 30 29.76 months–1 year 73 15.2 <5 -- <5 -- <5 -- 14 20.3 17 18.3 14 15.9 22 21.81–5 years 18 3.7 -- -- -- -- -- -- -- -- <5 -- 8 9.1 9 8.9>5 years <5 -- -- -- -- -- -- -- -- -- -- -- <5 -- -- --Unknown 22 4.6 -- -- -- -- <5 -- <5 -- <5 -- <5 -- 15 14.9
Socioeconomic status§
Upper 175 36.4 -- -- -- 19 43.2 36 52.2 60 64.5 36 40.9 24 23.8Middle 76 15.8 -- -- -- -- 12 27.3 16 23.2 14 15.1 22 25.0 12 11.9Lower 66 13.7 -- -- -- -- <5 -- 13 18.8 19 20.4 23 26.1 7 6.9Unknown 164 34.1 30 100.0 56 100.0 9 20.5 <5 -- -- -- 7 8.0 58 57.4
1999–2003Characteristic Total 1968–1972 1973–1978 1979–1983 1984–1989 1990–1993 1994–1998Period
* Cells containing fewer than 5 cases are indicated as “<5”. Prevalence estimates based on these cells are indicated as less than the prevalence based on 5 cases in Table a.
Percentages based on these cells are not provided in Table b. Cells containing zero cases are indicated as "--". Counts are provided, but prevalences are not estimated, for strata with unknown values in Table a. Counts and percentages are provided for strata with unknown values in Table b.
** Prev = Prevalence. † Data on Hispanic or Latino ethnicity were available beginning in 1990. ‡ The category of All Other Races includes 5 cases of Black or African American race. § Information about socioeconomic status was available only for 1979-2001.
Table 43a Craniosynostosis: Prevalence (per 10,000 live births) stratified by descriptive characteristics, MACDP, 1968–2003*
Table 43b Craniosynostosis: Percentage of cases by descriptive characteristics, MACDP, 1968–2003*

105
Cases Prev** Cases Prev Cases Prev Cases Prev Cases Prev Cases Prev Cases Prev Cases PrevTotal 226 1.83 19 1.38 17 1.18 26 1.92 38 1.87 38 2.46 47 2.25 41 1.64Maternal age (years)
<25 75 1.53 10 1.28 6 0.82 9 1.49 10 1.27 16 2.93 14 2.08 10 1.2725-29 71 2.01 6 1.61 8 1.80 11 2.61 12 1.89 13 2.89 14 2.53 7 1.07>30 80 2.07 <5 <2.30 <5 <1.97 6 1.83 16 2.64 9 1.65 19 2.21 24 2.27Unknown -- -- -- -- -- -- -- -- -- -- -- -- -- -- -- --
Maternal race/ethnicity†
White 122 1.82 9 0.91 14 1.51 12 1.45 20 1.63 17 2.14 30 3.06 20 2.09Black or African American 79 1.88 -- -- <5 <1.02 13 2.57 18 2.38 19 2.96 13 1.54 13 1.35Hispanic or Latino 12 1.85 -- -- -- -- -- -- -- -- <5 <8.47 <5 <3.01 6 1.41All Other Races 12 1.58 10‡ 2.58 -- -- <5 <26.07 -- -- -- -- -- -- <5 <3.27Unknown <5 -- -- -- -- -- -- -- -- -- -- -- -- -- <5 --
Birth weight (grams)<2500 95 9.00 7 5.80 6 4.86 12 10.24 17 10.45 13 9.72 24 13.42 16 7.32>2500 130 1.16 12 0.96 11 0.85 14 1.13 21 1.13 25 1.77 22 1.15 25 1.10Unknown <5 -- -- -- -- -- -- -- -- -- -- -- <5 -- -- --
Gestational age (weeks)20-36 80 6.99 6 5.67 <5 <4.14 7 5.68 13 6.58 16 10.06 22 11.30 12 4.94>37 143 1.36 13 1.12 13 1.08 19 1.68 23 1.37 22 1.69 25 1.35 28 1.26Unknown <5 -- -- -- -- -- -- -- <5 -- -- -- -- -- <5 --
SexMale 103 1.64 10 1.42 7 0.95 13 1.87 12 1.15 21 2.67 23 2.16 17 1.34Female 122 2.03 9 1.34 10 1.44 13 1.97 26 2.63 17 2.25 23 2.25 24 1.95Ambiguous/Unknown <5 -- -- -- -- -- -- -- -- -- -- -- <5 -- -- --
Parity1 Live birth 89 1.64 9 1.73 10 1.38 8 1.26 14 1.56 17 2.54 18 1.96 13 1.232 or more live births 133 1.98 8 1.11 7 0.98 18 2.50 22 2.01 21 2.41 29 2.50 28 1.96Unknown <5 -- <5 -- -- -- -- -- <5 -- -- -- -- -- -- --
Gravidity1 Pregnancy 58 1.25 8 1.65 7 1.04 <5 <0.76 8 1.13 11 2.11 13 1.78 7 0.802 or more pregnancies 167 2.24 11 1.46 10 1.31 22 3.14 29 2.26 27 2.65 34 2.52 34 2.12Unknown <5 -- -- -- -- -- -- -- <5 -- -- -- -- -- -- --
PluralitySingleton 219 1.82 19 1.41 17 1.21 25 1.88 36 1.82 37 2.46 45 2.22 40 1.66Multiple 6 1.92 -- -- -- -- <5 <18.44 <5 <10.81 <5 <12.25 <5 <8.05 <5 <5.95Unknown <5 -- -- -- -- -- -- -- <5 -- -- -- -- -- -- --
CharacteristicPeriod
1984–1989 1990–1993 1994–1998 1999–2003Total 1968–1972 1973–1978 1979–1983
Cases Percent Cases Percent Cases Percent Cases Percent Cases Percent Cases Percent Cases Percent Cases PercentBirth outcome
Live birth 193 85.4 18 94.7 16 94.1 23 88.5 32 84.2 32 84.2 37 78.7 35 85.4Stillbirth 16 7.1 <5 -- <5 -- <5 -- 5 13.2 <5 -- <5 -- <5 --Elective termination 17 7.5 -- -- -- -- -- -- <5 -- <5 -- 7 14.9 5 12.2Unknown
Age at diagnosisPrenatally or <7days 191 84.5 18 94.7 16 94.1 25 96.2 36 94.7 29 76.3 36 76.6 31 75.68 days–6 months 11 4.9 -- -- -- -- <5 -- <5 -- <5 -- <5 -- -- --6 months–1 year 9 4.0 <5 -- <5 -- -- -- -- -- <5 -- <5 -- <5 --1–5 years <5 -- -- -- -- -- -- -- -- -- -- -- -- -- <5 -->5 years -- -- -- -- -- -- -- -- -- -- -- -- -- -- -- --Unknown 13 5.8 -- -- -- -- -- -- -- -- <5 -- 5 10.6 6 14.6
Socioeconomic status§
Upper 50 22.1 -- -- -- 7 26.9 10 26.3 9 23.7 19 40.4 5 12.2Middle 51 22.6 -- -- -- -- 9 34.6 12 31.6 13 34.2 12 25.5 5 12.2Lower 58 25.7 -- -- -- -- 9 34.6 16 42.1 14 36.8 11 23.4 8 19.5Unknown 67 29.6 19 100.0 17 100.0 <5 -- -- -- <5 -- 5 10.6 23 56.1
1999–2003Characteristic Total 1968–1972 1973–1978 1979–1983 1984–1989 1990–1993 1994–1998Period
* Cells containing fewer than 5 cases are indicated as “<5”. Prevalence estimates based on these cells are indicated as less than the prevalence based on 5 cases in Table a.
Percentages based on these cells are not provided in Table b. Cells containing zero cases are indicated as "--". Counts are provided, but prevalences are not estimated, for strata with unknown values in Table a. Counts and percentages are provided for strata with unknown values in Table b.
** Prev = Prevalence. † Data on Hispanic or Latino ethnicity were available beginning in 1990. ‡ The category of All Other Races includes 10 cases of Black or African American race. § Information about socioeconomic status was available only for 1979-2001.
Table 44a Skeletal dysplasia: Prevalence (per 10,000 live births) stratified by descriptive characteristics, MACDP, 1968–2003*
Table 44b Skeletal dysplasia: Percentage of cases by descriptive characteristics, MACDP, 1968–2003*

106
Cases Prev** Cases Prev Cases Prev Cases Prev Cases Prev Cases Prev Cases Prev Cases PrevTotal 280 2.27 27 1.97 34 2.37 24 1.77 47 2.32 38 2.46 40 1.92 70 2.80Maternal age (years)
<25 104 2.12 10 1.28 19 2.60 12 1.98 16 2.04 11 2.01 12 1.78 24 3.0425-29 73 2.07 10 2.69 10 2.26 5 1.19 11 1.73 11 2.44 12 2.17 14 2.14>30 101 2.61 6 2.76 5 1.97 7 2.13 19 3.14 16 2.93 16 1.86 32 3.03Unknown <5 -- <5 -- -- -- -- -- <5 -- -- -- -- -- -- --
Maternal race/ethnicity†
White 158 2.36 19 1.93 21 2.26 17 2.05 32 2.61 19 2.39 17 1.73 33 3.45Black or African American 90 2.14 -- -- 13 2.65 6 1.19 15 1.98 18 2.80 14 1.66 24 2.49Hispanic or Latino 19 2.92 -- -- -- -- -- -- -- -- -- -- 8 4.82 11 2.59All Other Races 12 1.58 8‡ 2.07 -- -- <5 <26.07 -- -- <5 <10.58 <5 <5.21 <5 <3.27Unknown <5 -- -- -- -- -- -- -- -- -- -- -- -- -- <5 --
Birth weight (grams)<2500 76 7.20 8 6.63 9 7.29 5 4.27 12 7.38 15 11.21 14 7.83 13 5.95>2500 198 1.76 17 1.37 24 1.85 17 1.37 35 1.88 23 1.63 26 1.36 56 2.45Unknown 6 -- <5 -- <5 -- <5 -- -- -- -- -- -- -- <5 --
Gestational age (weeks)20-36 78 6.82 6 5.67 8 6.62 5 4.05 13 6.58 14 8.81 14 7.19 18 7.41>37 200 1.90 21 1.81 26 2.16 19 1.68 32 1.91 24 1.84 26 1.40 52 2.34Unknown <5 -- -- -- -- -- -- -- <5 -- -- -- -- -- -- --
SexMale 159 2.52 19 2.71 17 2.30 16 2.30 31 2.98 22 2.79 22 2.07 32 2.52Female 121 2.01 8 1.19 17 2.44 8 1.21 16 1.62 16 2.12 18 1.76 38 3.09Ambiguous/Unknown -- -- -- -- -- -- -- -- -- -- -- -- -- -- -- --
Parity1 Live birth 126 2.33 10 1.92 17 2.35 14 2.21 18 2.01 17 2.54 19 2.07 31 2.942 or more live births 145 2.16 11 1.53 17 2.39 10 1.39 26 2.37 21 2.41 21 1.81 39 2.72Unknown 9 -- 6 -- -- -- -- -- <5 -- -- -- -- -- -- --
Gravidity1 Pregnancy 92 1.98 10 2.06 12 1.79 13 1.99 15 2.13 8 1.54 14 1.92 20 2.302 or more pregnancies 186 2.49 17 2.25 22 2.88 11 1.57 30 2.34 30 2.95 26 1.93 50 3.12Unknown <5 -- -- -- -- -- -- -- <5 -- -- -- -- -- -- --
PluralitySingleton 273 2.27 26 1.93 34 2.42 23 1.73 46 2.32 36 2.40 40 1.97 68 2.81Multiple 7 2.24 <5 <20.05 -- -- <5 <18.44 <5 <10.81 <5 <12.25 -- -- <5 <5.95Unknown -- -- -- -- -- -- -- -- -- -- -- -- -- -- -- --
CharacteristicPeriod
1984–1989 1990–1993 1994–1998 1999–2003Total 1968–1972 1973–1978 1979–1983
Cases Percent Cases Percent Cases Percent Cases Percent Cases Percent Cases Percent Cases Percent Cases PercentBirth outcome
Live birth 262 93.6 26 96.3 33 97.1 23 95.8 45 95.7 35 92.1 34 85.0 66 94.3Stillbirth 9 3.2 <5 -- <5 -- <5 -- <5 -- <5 -- <5 -- <5 --Elective termination 9 3.2 -- -- -- -- -- -- -- -- <5 -- 5 12.5 <5 --Unknown
Age at diagnosisPrenatally or <7days 252 90.0 26 96.3 30 88.2 23 95.8 44 93.6 37 97.4 36 90.0 56 80.08 days–6 months 12 4.3 <5 -- <5 -- -- -- <5 -- <5 -- <5 -- <5 --6 months–1 year 6 2.1 -- -- <5 -- <5 -- <5 -- -- -- <5 -- <5 --1–5 years <5 -- -- -- -- -- -- -- -- -- -- -- <5 -- <5 -->5 years -- -- -- -- -- -- -- -- -- -- -- -- -- -- -- --Unknown 8 2.9 -- -- -- -- -- -- -- -- -- -- <5 -- 7 10.0
Socioeconomic status§
Upper 72 25.7 -- -- -- 10 41.7 21 44.7 18 47.4 13 32.5 10 14.3Middle 55 19.6 -- -- -- -- 7 29.2 14 29.8 9 23.7 10 25.0 15 21.4Lower 52 18.6 -- -- -- -- 7 29.2 11 23.4 10 26.3 14 35.0 10 14.3Unknown 101 36.1 27 100.0 34 100.0 -- -- <5 -- <5 -- <5 -- 35 50.0
1999–2003Characteristic Total 1968–1972 1973–1978 1979–1983 1984–1989 1990–1993 1994–1998Period
* Cells containing fewer than 5 cases are indicated as “<5”. Prevalence estimates based on these cells are indicated as less than the prevalence based on 5 cases in Table a.
Percentages based on these cells are not provided in Table b. Cells containing zero cases are indicated as "--". Counts are provided, but prevalences are not estimated, for strata with unknown values in Table a. Counts and percentages are provided for strata with unknown values in Table b.
** Prev = Prevalence. † Data on Hispanic or Latino ethnicity were available beginning in 1990. ‡ The category of All Other Races includes 8 cases of Black or African American race. § Information about socioeconomic status was available only for 1979-2001.
Table 45a Diaphragmatic hernia: Prevalence (per 10,000 live births) stratified by descriptive characteristics, MACDP, 1968–2003*
Table 45b Diaphragmatic hernia: Percentage of cases by descriptive characteristics, MACDP, 1968–2003*

107
Cases Prev** Cases Prev Cases Prev Cases Prev Cases Prev Cases Prev Cases Prev Cases PrevTotal 337 2.73 48 3.50 57 3.97 47 3.47 54 2.66 33 2.14 51 2.44 47 1.88Maternal age (years)
<25 148 3.01 27 3.45 35 4.79 19 3.14 25 3.18 11 2.01 16 2.38 15 1.9025-29 88 2.49 15 4.03 14 3.16 12 2.85 16 2.52 13 2.89 10 1.81 8 1.22>30 101 2.61 6 2.76 8 3.15 16 4.87 13 2.15 9 1.65 25 2.90 24 2.27Unknown -- -- -- -- -- -- -- -- -- -- -- -- -- -- -- --
Maternal race/ethnicity†
White 198 2.95 37 3.76 38 4.09 37 4.46 29 2.37 15 1.89 23 2.35 19 1.99Black or African American 110 2.62 -- -- 19 3.87 10 1.98 24 3.17 16 2.49 22 2.61 19 1.97Hispanic or Latino 10 1.54 -- -- -- -- -- -- -- -- <5 <8.47 <5 <3.01 5 1.18All Other Races 16 2.10 11‡ 2.84 -- -- -- -- -- -- -- -- <5 <5.21 <5 <3.27Unknown <5 -- -- -- -- -- -- -- <5 -- -- -- -- -- <5 --
Birth weight (grams)<2500 171 16.21 28 23.22 33 26.74 20 17.06 25 15.37 18 13.45 27 15.10 20 9.15>2500 149 1.33 17 1.37 21 1.62 23 1.86 26 1.40 14 0.99 23 1.20 25 1.10Unknown 17 -- <5 -- <5 -- <5 -- <5 -- <5 -- <5 -- <5 --
Gestational age (weeks)20-36 167 14.60 26 24.58 30 24.83 15 12.16 22 11.14 20 12.58 29 14.90 25 10.29>37 167 1.58 21 1.81 27 2.24 32 2.83 30 1.79 13 1.00 22 1.19 22 0.99Unknown <5 -- <5 -- -- -- -- -- <5 -- -- -- -- -- -- --
SexMale 171 2.71 21 2.99 25 3.39 30 4.32 22 2.12 18 2.28 27 2.53 28 2.20Female 157 2.61 27 4.03 27 3.87 17 2.57 30 3.03 14 1.85 24 2.35 18 1.47Ambiguous/Unknown 9 -- -- -- 5 -- -- -- <5 -- <5 -- -- -- <5 --
Parity1 Live birth 190 3.51 24 4.60 38 5.26 29 4.57 25 2.79 22 3.29 28 3.05 24 2.282 or more live births 136 2.03 16 2.22 19 2.67 18 2.50 26 2.37 11 1.26 23 1.98 23 1.61Unknown 11 -- 8 -- -- -- -- -- <5 -- -- -- -- -- -- --
Gravidity1 Pregnancy 134 2.89 20 4.11 32 4.77 18 2.75 16 2.27 17 3.27 14 1.92 17 1.952 or more pregnancies 203 2.72 28 3.71 25 3.27 29 4.14 38 2.96 16 1.57 37 2.75 30 1.87Unknown -- -- -- -- -- -- -- -- -- -- -- -- -- -- -- --
PluralitySingleton 312 2.60 45 3.34 53 3.77 44 3.31 49 2.47 29 1.93 48 2.37 44 1.82Multiple 25 8.00 <5 <20.05 <5 <18.50 <5 <18.44 5 10.81 <5 <12.25 <5 <8.05 <5 <5.95Unknown -- -- -- -- -- -- -- -- -- -- -- -- -- -- -- --
CharacteristicPeriod
1984–1989 1990–1993 1994–1998 1999–2003Total 1968–1972 1973–1978 1979–1983
Cases Percent Cases Percent Cases Percent Cases Percent Cases Percent Cases Percent Cases Percent Cases PercentBirth outcome
Live birth 246 73.0 34 70.8 36 63.2 36 76.6 41 75.9 25 75.8 36 70.6 38 80.9Stillbirth 80 23.7 14 29.2 20 35.1 11 23.4 13 24.1 6 18.2 10 19.6 6 12.8Elective termination 11 3.3 -- -- <5 -- -- -- -- -- <5 -- 5 9.8 <5 --Unknown -- -- -- -- -- -- -- -- -- -- -- -- -- -- -- --
Age at diagnosisPrenatally or <7days 325 96.4 48 100.0 57 100.0 47 100.0 54 100.0 33 100.0 47 92.2 39 83.08 days–6 months <5 -- -- -- -- -- -- -- -- -- -- -- <5 -- -- --6 months–1 year -- -- -- -- -- -- -- -- -- -- -- -- -- -- -- --1–5 years -- -- -- -- -- -- -- -- -- -- -- -- -- -- -- -->5 years -- -- -- -- -- -- -- -- -- -- -- -- -- -- -- --Unknown 11 3.3 -- -- -- -- -- -- -- -- -- -- <5 -- 8 17.0
Socioeconomic status§
Upper 75 22.3 -- -- -- -- 17 36.2 18 33.3 13 39.4 18 35.3 9 19.1Middle 71 21.1 -- -- -- -- 20 42.6 14 25.9 10 30.3 14 27.5 13 27.7Lower 63 18.7 -- -- -- 9 19.1 21 38.9 9 27.3 17 33.3 7 14.9Unknown 128 38.0 48 100.0 57 100.0 <5 -- <5 -- <5 -- <5 -- 18 38.3
1999–2003Characteristic Total 1968–1972 1973–1978 1979–1983 1984–1989 1990–1993 1994–1998Period
* Cells containing fewer than 5 cases are indicated as “<5”. Prevalence estimates based on these cells are indicated as less than the prevalence based on 5 cases in Table a.
Percentages based on these cells are not provided in Table b. Cells containing zero cases are indicated as "--". Counts are provided, but prevalences are not estimated, for strata with unknown values in Table a. Counts and percentages are provided for strata with unknown values in Table b.
** Prev = Prevalence. † Data on Hispanic or Latino ethnicity were available beginning in 1990. ‡ The category of All Other Races includes 10 cases of Black or African American race. § Information about socioeconomic status was available only for 1979-2001.
Table 46a Omphalocele: Prevalence (per 10,000 live births) stratified by descriptive characteristics, MACDP, 1968–2003*
Table 46b Omphalocele: Percentage of cases by descriptive characteristics, MACDP, 1968–2003*

108
Cases Prev** Cases Prev Cases Prev Cases Prev Cases Prev Cases Prev Cases Prev Cases PrevTotal 244 1.98 12 0.87 19 1.32 27 1.99 41 2.02 42 2.72 38 1.82 65 2.60Maternal age (years)
<25 175 3.56 9 1.15 14 1.91 20 3.30 29 3.69 30 5.49 25 3.71 48 6.0925-29 40 1.13 -- -- <5 <1.13 6 1.43 5 0.79 7 1.56 6 1.08 13 1.98>30 28 0.72 <5 <2.30 <5 <1.97 <5 <1.52 7 1.16 5 0.92 7 0.81 <5 <0.47Unknown <5 -- <5 -- -- -- -- -- -- -- -- -- -- -- -- --
Maternal race/ethnicity†
White 128 1.91 11 1.12 16 1.72 17 2.05 29 2.37 19 2.39 17 1.73 19 1.99Black or African American 85 2.02 -- -- <5 <1.02 10 1.98 11 1.45 21 3.27 18 2.14 22 2.29Hispanic or Latino 25 3.85 -- -- -- -- -- -- -- -- <5 <8.47 <5 <3.01 22 5.18All Other Races 6 0.79 <5‡ <1.29 -- -- -- -- <5 <11.48 -- -- <5 <5.21 <5 <3.27Unknown -- -- -- -- -- -- -- -- -- -- -- -- -- -- -- --
Birth weight (grams)<2500 152 14.41 9 7.46 15 12.15 19 16.21 19 11.68 24 17.94 24 13.42 42 19.22>2500 89 0.79 <5 <0.40 <5 <0.39 8 0.65 21 1.13 18 1.28 13 0.68 22 0.96Unknown <5 -- -- -- -- -- -- -- <5 -- -- -- <5 -- <5 --
Gestational age (weeks)20-36 141 12.33 6 5.67 9 7.45 14 11.35 20 10.13 25 15.72 23 11.82 44 18.12>37 97 0.92 6 0.52 10 0.83 13 1.15 18 1.08 17 1.31 13 0.70 20 0.90Unknown 6 -- -- -- -- -- -- -- <5 -- -- -- <5 -- <5 --
SexMale 111 1.76 9 1.28 13 1.76 10 1.44 15 1.44 16 2.03 17 1.60 31 2.44Female 133 2.21 <5 <0.75 6 0.86 17 2.57 26 2.63 26 3.44 21 2.05 34 2.77Ambiguous/Unknown -- -- -- -- -- -- -- -- -- -- -- -- -- -- -- --
Parity1 Live birth 158 2.92 10 1.92 13 1.80 19 2.99 24 2.68 26 3.89 24 2.61 42 3.982 or more live births 84 1.25 <5 <0.69 6 0.84 8 1.11 17 1.55 16 1.84 13 1.12 23 1.61Unknown <5 -- <5 -- -- -- -- -- -- -- -- -- <5 -- -- --
Gravidity1 Pregnancy 114 2.46 9 1.85 9 1.34 8 1.22 15 2.13 18 3.46 21 2.88 34 3.912 or more pregnancies 129 1.73 <5 <0.66 10 1.31 19 2.71 26 2.03 24 2.36 16 1.19 31 1.94Unknown <5 -- -- -- -- -- -- -- -- -- -- -- <5 -- -- --
PluralitySingleton 236 1.97 11 0.82 18 1.28 26 1.96 40 2.02 39 2.60 38 1.88 64 2.65Multiple 8 2.56 <5 <20.05 <5 <18.50 <5 <18.44 <5 <10.81 <5 <12.25 -- -- <5 <5.95Unknown -- -- -- -- -- -- -- -- -- -- -- -- -- -- -- --
CharacteristicPeriod
1984–1989 1990–1993 1994–1998 1999–2003Total 1968–1972 1973–1978 1979–1983
Cases Percent Cases Percent Cases Percent Cases Percent Cases Percent Cases Percent Cases Percent Cases PercentBirth outcome
Live birth 214 87.7 9 75.0 17 89.5 24 88.9 38 92.7 37 88.1 30 78.9 59 90.8Stillbirth 28 11.5 <5 -- <5 -- <5 -- <5 -- 5 11.9 8 21.1 5 7.7Elective termination <5 -- -- -- -- -- -- -- <5 -- -- -- -- -- <5 --Unknown -- -- -- -- -- -- -- -- -- -- -- -- -- -- -- --
Age at diagnosisPrenatally or <7days 235 96.3 12 100.0 19 100.0 27 100.0 40 97.6 42 100.0 38 100.0 57 87.78 days–6 months -- -- -- -- -- -- -- -- -- -- -- -- -- -- -- --6 months–1 year -- -- -- -- -- -- -- -- -- -- -- -- -- -- -- --1–5 years -- -- -- -- -- -- -- -- -- -- -- -- -- -- -- -->5 years -- -- -- -- -- -- -- -- -- -- -- -- -- -- -- --Unknown 9 3.7 -- -- -- -- -- -- <5 -- -- -- -- -- 8 12.3
Socioeconomic status§
Upper 42 17.2 -- -- -- -- <5 -- 11 26.8 11 26.2 10 26.3 6 9.2Middle 63 25.8 -- -- -- -- 12 44.4 16 39.0 12 28.6 10 26.3 13 20.0Lower 67 27.5 -- -- -- -- 10 37.0 12 29.3 17 40.5 16 42.1 12 18.5Unknown 72 29.5 12 19 100.0 <5 -- <5 -- <5 -- <5 -- 34 52.3
1999–2003Characteristic Total 1968–1972 1973–1978 1979–1983 1984–1989 1990–1993 1994–1998Period
* Cells containing fewer than 5 cases are indicated as “<5”. Prevalence estimates based on these cells are indicated as less than the prevalence based on 5 cases in Table a.
Percentages based on these cells are not provided in Table b. Cells containing zero cases are indicated as "--". Counts are provided, but prevalences are not estimated, for strata with unknown values in Table a. Counts and percentages are provided for strata with unknown values in Table b.
** Prev = Prevalence. † Data on Hispanic or Latino ethnicity were available beginning in 1990. ‡ The category of All Other Races includes <5 cases of Black or African American race. § Information about socioeconomic status was available only for 1979-2001.
Table 47a Gastroschisis: Prevalence (per 10,000 live births) stratified by descriptive characteristics, MACDP, 1968–2003*
Table 47b Gastroschisis: Percentage of cases by descriptive characteristics, MACDP, 1968–2003*

109
Cases Prev** Cases Prev Cases Prev Cases Prev Cases Prev Cases Prev Cases Prev Cases PrevTotal 419 3.40 31 2.26 26 1.81 19 1.40 43 2.12 43 2.79 95 4.55 162 6.48Maternal age (years)
<25 -- -- -- -- -- -- -- -- -- -- -- -- -- -- -- --25-29 -- -- -- -- -- -- -- -- -- -- -- -- -- -- -- -->30 419 10.83 31 14.26 26 10.24 19 5.78 43 7.10 43 7.87 95 11.03 162 15.34Unknown -- -- -- -- -- -- -- -- -- -- -- -- -- -- -- --
Maternal race/ethnicity†
White 235 3.51 22 2.23 16 1.72 13 1.57 25 2.04 26 3.27 56 5.71 77 8.05Black or African American 141 3.36 -- -- 10 2.04 6 1.19 16 2.11 17 2.65 30 3.56 62 6.44Hispanic or Latino 21 3.23 -- -- -- -- -- -- -- -- -- -- <5 <3.01 17 4.00All Other Races 22 2.89 9‡ 2.33 -- -- -- -- <5 <11.48 -- -- 5 5.21 6 3.93Unknown -- -- -- -- -- -- -- -- -- -- -- -- -- -- -- --
Birth weight (grams)<2500 119 11.28 9 7.46 5 4.05 <5 <4.27 10 6.15 17 12.71 28 15.66 46 21.05>2500 298 2.65 22 1.77 21 1.62 15 1.21 32 1.72 26 1.85 66 3.46 116 5.09Unknown <5 -- -- -- -- -- -- -- <5 -- -- -- <5 -- -- --
Gestational age (weeks)20-36 127 11.10 <5 <4.73 <5 <4.14 <5 <4.05 16 8.10 18 11.32 31 15.93 52 21.41>37 288 2.73 28 2.41 22 1.83 16 1.42 25 1.49 25 1.92 63 3.40 109 4.91Unknown <5 -- -- -- -- -- -- -- <5 -- -- -- <5 -- <5 --
SexMale 232 3.68 16 2.28 12 1.63 9 1.30 24 2.31 30 3.81 52 4.88 89 7.00Female 187 3.10 15 2.24 14 2.01 10 1.51 19 1.92 13 1.72 43 4.20 73 5.94Ambiguous/Unknown -- -- -- -- -- -- -- -- -- -- -- -- -- -- -- --
Parity1 Live birth 72 1.33 <5 <0.96 <5 <0.69 <5 <0.79 5 0.56 7 1.05 25 2.72 29 2.752 or more live births 335 4.99 20 2.78 23 3.23 16 2.22 38 3.47 36 4.14 69 5.94 133 9.29Unknown 12 -- 10 -- <5 -- -- -- -- -- -- -- <5 -- -- --
Gravidity1 Pregnancy 40 0.86 <5 <1.03 <5 <0.75 <5 <0.76 <5 <0.71 5 0.96 11 1.51 16 1.842 or more pregnancies 375 5.02 28 3.71 23 3.01 17 2.43 40 3.12 38 3.74 83 6.16 146 9.12Unknown <5 -- <5 -- <5 -- -- -- -- -- -- -- <5 -- -- --
PluralitySingleton 401 3.34 30 2.23 25 1.78 19 1.43 41 2.07 42 2.80 92 4.54 152 6.29Multiple 18 5.76 <5 <20.05 <5 <18.50 -- -- <5 <10.81 <5 <12.25 <5 <8.05 10 11.90Unknown -- -- -- -- -- -- -- -- -- -- -- -- -- -- -- --
CharacteristicPeriod
1984–1989 1990–1993 1994–1998 1999–2003Total 1968–1972 1973–1978 1979–1983
Cases Percent Cases Percent Cases Percent Cases Percent Cases Percent Cases Percent Cases Percent Cases PercentBirth outcome
Live birth 382 91.2 31 100.0 25 96.2 17 89.5 36 83.7 38 88.4 86 90.5 149 92.0Stillbirth 14 3.3 -- -- <5 -- <5 -- 5 11.6 -- -- <5 -- <5 --Elective termination 23 5.5 -- -- -- -- -- -- <5 -- 5 11.6 6 6.3 10 6.2Unknown -- -- -- -- -- -- -- -- -- -- -- -- -- -- -- --
Age at diagnosisPrenatally or <7days 397 94.7 30 96.8 26 100.0 17 89.5 42 97.7 43 100.0 92 96.8 147 90.78 days–6 months 9 2.1 <5 -- -- -- <5 -- <5 -- -- -- <5 -- <5 --6 months–1 year <5 -- -- -- -- -- -- -- -- -- -- -- -- -- <5 --1–5 years <5 -- -- -- -- -- -- -- -- -- -- -- -- -- <5 -->5 years -- -- -- -- -- -- -- -- -- -- -- -- -- -- -- --Unknown 11 2.6 -- -- -- -- -- -- -- -- -- -- <5 -- 9 5.6
Socioeconomic status§
Upper 115 27.4 -- -- -- 8 42.1 15 34.9 19 44.2 43 45.3 30 18.5Middle 94 22.4 -- -- -- -- 6 31.6 16 37.2 18 41.9 23 24.2 31 19.1Lower 71 16.9 -- -- -- -- 5 26.3 12 27.9 6 14.0 28 29.5 20 12.3Unknown 139 33.2 31 100.0 26 100.0 -- -- -- -- -- -- <5 -- 81 50.0
1999–2003Characteristic Total 1968–1972 1973–1978 1979–1983 1984–1989 1990–1993 1994–1998Period
* Cells containing fewer than 5 cases are indicated as “<5”. Prevalence estimates based on these cells are indicated as less than the prevalence based on 5 cases in Table a.
Percentages based on these cells are not provided in Table b. Cells containing zero cases are indicated as "--". Counts are provided, but prevalences are not estimated, for strata with unknown values in Table a. Counts and percentages are provided for strata with unknown values in Table b.
** Prev = Prevalence. † Data on Hispanic or Latino ethnicity were available beginning in 1990. ‡ The category of All Other Races includes 9 cases of Black or African American race. § Information about socioeconomic status was available only for 1979-2001.
Table 48a Down syndrome, maternal age 35 years or older: Prevalence (per 10,000 live births) stratified
by descriptive characteristics, MACDP, 1968–2003*
Table 48b Down syndrome, maternal age 35 years or older: Percentage of cases by descriptive characteristics, MACDP, 1968–2003*

110
Cases Prev** Cases Prev Cases Prev Cases Prev Cases Prev Cases Prev Cases Prev Cases PrevTotal 874 7.09 87 6.34 92 6.41 115 8.48 150 7.40 101 6.54 154 7.37 175 7.00Maternal age (years)
<25 314 6.39 42 5.37 44 6.02 40 6.61 52 6.61 34 6.22 50 7.43 52 6.6025-29 246 6.97 27 7.25 26 5.86 31 7.37 44 6.94 31 6.89 39 7.05 48 7.33>30 314 8.12 18 8.28 22 8.67 44 13.39 54 8.91 36 6.59 65 7.55 75 7.10Unknown -- -- -- -- -- -- -- -- -- -- -- -- -- -- -- --
Maternal race/ethnicity†
White 479 7.15 60 6.09 63 6.78 68 8.19 101 8.24 54 6.80 67 6.83 66 6.90Black or African American 278 6.62 -- -- 28 5.70 45 8.90 47 6.20 38 5.92 59 7.00 61 6.34Hispanic or Latino 57 8.77 -- -- -- -- -- -- -- -- <5 <8.47 16 9.65 40 9.41All Other Races 56 7.36 27‡ 6.98 <5 <33.81 <5 <26.07 <5 <11.48 8 16.92 9 9.38 7 4.58Unknown <5 -- -- -- -- -- -- -- -- -- -- -- <5 -- <5 --
Birth weight (grams)<2500 221 20.95 19 15.76 20 16.21 29 24.74 30 18.45 22 16.44 50 27.96 51 23.34>2500 644 5.73 67 5.38 70 5.41 86 6.95 120 6.44 79 5.61 101 5.29 121 5.30Unknown 9 -- <5 -- <5 -- -- -- -- -- -- -- <5 -- <5 --
Gestational age (weeks)20-36 185 16.17 10 9.45 15 12.41 16 12.98 23 11.65 20 12.58 45 23.12 56 23.06>37 683 6.48 77 6.64 77 6.39 99 8.76 125 7.47 78 5.99 109 5.88 118 5.31Unknown 6 -- -- -- -- -- -- -- <5 -- <5 -- -- -- <5 --
SexMale 477 7.57 51 7.27 48 6.50 71 10.22 68 6.54 60 7.61 85 7.98 94 7.39Female 397 6.59 36 5.37 44 6.31 44 6.66 82 8.30 41 5.43 69 6.74 81 6.59Ambiguous/Unknown -- -- -- -- -- -- -- -- -- -- -- -- -- -- -- --
Parity1 Live birth 366 6.76 36 6.90 35 4.84 45 7.09 57 6.36 45 6.73 65 7.08 83 7.872 or more live births 489 7.28 39 5.42 56 7.86 70 9.71 89 8.13 56 6.43 89 7.66 90 6.28Unknown 19 -- 12 -- <5 -- -- -- <5 -- -- -- -- -- <5 --
Gravidity1 Pregnancy 268 5.78 35 7.20 28 4.18 35 5.34 42 5.95 31 5.95 43 5.90 54 6.202 or more pregnancies 603 8.07 51 6.76 64 8.37 80 11.42 107 8.34 70 6.88 111 8.24 120 7.50Unknown <5 -- <5 -- -- -- -- -- <5 -- -- -- -- -- <5 --
PluralitySingleton 855 7.12 86 6.38 89 6.33 113 8.51 148 7.47 99 6.59 148 7.30 172 7.12Multiple 18 5.76 <5 <20.05 <5 <18.50 <5 <18.44 <5 <10.81 <5 <12.25 6 9.66 <5 <5.95Unknown <5 -- -- -- -- -- -- -- <5 -- -- -- -- -- -- --
CharacteristicPeriod
1984–1989 1990–1993 1994–1998 1999–2003Total 1968–1972 1973–1978 1979–1983
Cases Percent Cases Percent Cases Percent Cases Percent Cases Percent Cases Percent Cases Percent Cases PercentBirth outcome
Live birth 836 95.7 86 98.9 92 100.0 115 100.0 147 98.0 98 97.0 141 91.6 157 89.7Stillbirth 13 1.5 <5 -- -- -- -- -- <5 -- <5 -- <5 -- 5 2.9Elective termination 25 2.9 -- -- -- -- -- -- -- -- <5 -- 10 6.5 13 7.4Unknown -- -- -- -- -- -- -- -- -- -- -- -- -- -- -- --
Age at diagnosisPrenatally or <7days 813 93.0 81 93.1 83 90.2 109 94.8 145 96.7 95 94.1 143 92.9 157 89.78 days–6 months 37 4.2 5 5.7 7 7.6 5 4.3 <5 -- <5 -- 8 5.2 <5 --6 months–1 year 8 0.9 <5 -- <5 -- <5 -- <5 -- <5 -- <5 -- -- --1–5 years -- -- -- -- -- -- -- -- -- -- -- -- -- -- -- -->5 years -- -- -- -- -- -- -- -- -- -- -- -- -- -- -- --Unknown 16 1.8 -- -- -- -- -- -- -- -- -- -- <5 -- 14 8.0
Socioeconomic status§
Upper 199 22.8 -- -- -- -- 35 30.4 55 36.7 43 42.6 40 26.0 26 14.9Middle 213 24.3 -- -- -- 32 27.8 56 37.3 31 30.7 53 34.4 41 23.4Lower 197 22.5 -- -- -- -- 47 40.9 39 26.0 25 24.8 57 37.0 29 16.6Unknown 265 30.3 87 100.0 92 100.0 <5 -- -- -- <5 -- <5 -- 79 45.1
1999–2003Characteristic Total 1968–1972 1973–1978 1979–1983 1984–1989 1990–1993 1994–1998Period
* Cells containing fewer than 5 cases are indicated as “<5”. Prevalence estimates based on these cells are indicated as less than the prevalence based on 5 cases in Table a.
Percentages based on these cells are not provided in Table b. Cells containing zero cases are indicated as "--". Counts are provided, but prevalences are not estimated, for strata with unknown values in Table a. Counts and percentages are provided for strata with unknown values in Table b.
** Prev = Prevalence. † Data on Hispanic or Latino ethnicity were available beginning in 1990. ‡ The category of All Other Races includes 26 cases of Black or African American race. § Information about socioeconomic status was available only for 1979-2001.
Table 49a Down syndrome, maternal age younger than 35 years: Prevalence (per 10,000 live births) stratified
by descriptive characteristics, MACDP, 1968–2003*
Table 49b Down syndrome, maternal age younger than 35 years: Percentage of cases by descriptive characteristics, MACDP, 1968–2003*

111
Cases Prev** Cases Prev Cases Prev Cases Prev Cases Prev Cases Prev Cases Prev Cases PrevTotal 528 4.29 34 2.48 32 2.23 24 1.77 53 2.61 59 3.82 122 5.84 204 8.16Maternal age (years)
<25 -- -- -- -- -- -- -- -- -- -- -- -- -- -- -- --25-29 -- -- -- -- -- -- -- -- -- -- -- -- -- -- -- -->30 528 13.65 34 15.64 32 12.61 24 7.30 53 8.75 59 10.80 122 14.17 204 19.32Unknown -- -- -- -- -- -- -- -- -- -- -- -- -- -- -- --
Maternal race/ethnicity†
White 286 4.27 24 2.44 18 1.94 17 2.05 30 2.45 32 4.03 71 7.24 94 9.83Black or African American 189 4.50 -- -- 14 2.85 7 1.38 21 2.77 26 4.05 38 4.51 83 8.62Hispanic or Latino 26 4.00 -- -- -- -- -- -- -- -- -- -- 6 3.62 20 4.71All Other Races 27 3.55 10‡ 2.58 -- -- -- -- <5 <11.48 <5 <10.58 7 7.29 7 4.58Unknown -- -- -- -- -- -- -- -- -- -- -- -- -- -- -- --
Birth weight (grams)<2500 199 18.86 10 8.29 9 7.29 6 5.12 15 9.22 30 22.42 50 27.96 79 36.15>2500 320 2.85 24 1.93 22 1.70 17 1.37 36 1.93 29 2.06 69 3.61 123 5.39Unknown 9 -- -- -- <5 -- <5 -- <5 -- -- -- <5 -- <5 --
Gestational age (weeks)20-36 191 16.70 <5 <4.73 7 5.79 7 5.68 23 11.65 27 16.98 46 23.63 78 32.12>37 330 3.13 31 2.67 25 2.08 17 1.50 28 1.67 30 2.31 74 4.00 125 5.63Unknown 7 -- -- -- -- -- -- -- <5 -- <5 -- <5 -- <5 --
SexMale 275 4.37 18 2.56 13 1.76 10 1.44 27 2.60 39 4.95 63 5.91 105 8.26Female 253 4.20 16 2.39 19 2.73 14 2.12 26 2.63 20 2.65 59 5.77 99 8.06Ambiguous/Unknown -- -- -- -- -- -- -- -- -- -- -- -- -- -- -- --
Parity1 Live birth 88 1.62 <5 <0.96 <5 <0.69 <5 <0.79 5 0.56 11 1.65 31 3.38 35 3.322 or more live births 426 6.35 22 3.06 29 4.07 21 2.91 47 4.29 48 5.51 90 7.75 169 11.80Unknown 14 -- 11 -- <5 -- -- -- <5 -- -- -- <5 -- -- --
Gravidity1 Pregnancy 48 1.04 <5 <1.03 <5 <0.75 <5 <0.76 <5 <0.71 7 1.34 14 1.92 19 2.182 or more pregnancies 476 6.37 31 4.11 29 3.79 22 3.14 50 3.90 52 5.11 107 7.94 185 11.56Unknown <5 -- <5 -- <5 -- -- -- -- -- -- -- <5 -- -- --
PluralitySingleton 505 4.21 33 2.45 31 2.20 24 1.81 51 2.57 57 3.79 118 5.82 191 7.91Multiple 23 7.36 <5 <20.05 <5 <18.50 -- -- <5 <10.81 <5 <12.25 <5 <8.05 13 15.47Unknown -- -- -- -- -- -- -- -- -- -- -- -- -- -- -- --
CharacteristicPeriod
1984–1989 1990–1993 1994–1998 1999–2003Total 1968–1972 1973–1978 1979–1983
Cases Percent Cases Percent Cases Percent Cases Percent Cases Percent Cases Percent Cases Percent Cases PercentBirth outcome
Live birth 450 85.2 34 100.0 30 93.8 19 79.2 44 83.0 47 79.7 99 81.1 177 86.8Stillbirth 40 7.6 -- -- <5 -- 5 20.8 7 13.2 5 8.5 10 8.2 11 5.4Elective termination 38 7.2 -- -- -- -- -- -- <5 -- 7 11.9 13 10.7 16 7.8Unknown -- -- -- -- -- -- -- -- -- -- -- -- -- -- -- --
Age at diagnosisPrenatally or <7days 498 94.3 33 97.1 32 100.0 22 91.7 52 98.1 58 98.3 118 96.7 183 89.78 days–6 months 9 1.7 <5 -- -- -- <5 -- <5 -- -- -- <5 -- <5 --6 months–1 year <5 -- -- -- -- -- -- -- -- -- <5 -- <5 -- <5 --1–5 years <5 -- -- -- -- -- -- -- -- -- -- -- -- -- <5 -->5 years -- -- -- -- -- -- -- -- -- -- -- -- -- -- -- --Unknown 17 3.2 -- -- -- -- -- -- -- -- -- -- <5 -- 15 7.4
Socioeconomic status§
Upper 148 28.0 -- -- -- 12 50.0 19 35.8 23 39.0 54 44.3 40 19.6Middle 116 22.0 -- -- -- -- 6 25.0 18 34.0 24 40.7 29 23.8 39 19.1Lower 97 18.4 -- -- -- -- 6 25.0 16 30.2 11 18.6 38 31.1 26 12.7Unknown 167 31.6 34 100.0 32 100.0 -- -- -- -- <5 -- <5 -- 99 48.5
1999–2003Characteristic Total 1968–1972 1973–1978 1979–1983 1984–1989 1990–1993 1994–1998Period
* Cells containing fewer than 5 cases are indicated as “<5”. Prevalence estimates based on these cells are indicated as less than the prevalence based on 5 cases in Table a.
Percentages based on these cells are not provided in Table b. Cells containing zero cases are indicated as "--". Counts are provided, but prevalences are not estimated, for strata with unknown values in Table a. Counts and percentages are provided for strata with unknown values in Table b.
** Prev = Prevalence. † Data on Hispanic or Latino ethnicity were available beginning in 1990. ‡ The category of All Other Races includes 10 cases of Black or African American race. § Information about socioeconomic status was available only for 1979-2001.
Table 50a Any autosomal trisomy, maternal age 35 years or older: Prevalence (per 10,000 live births) stratified
by descriptive characteristics, MACDP, 1968–2003*
Table 50b Any autosomal trisomy, maternal age 35 years or older: Percentage of cases by descriptive characteristics, MACDP, 1968–2003*

112
Cases Prev** Cases Prev Cases Prev Cases Prev Cases Prev Cases Prev Cases Prev Cases PrevTotal 1,156 9.38 104 7.58 109 7.59 141 10.40 206 10.16 142 9.20 216 10.34 238 9.52Maternal age (years)
<25 426 8.67 55 7.03 53 7.25 53 8.76 75 9.54 46 8.42 72 10.69 72 9.1325-29 331 9.38 30 8.06 32 7.22 40 9.51 55 8.67 47 10.45 53 9.58 74 11.29>30 399 10.31 19 8.74 24 9.46 48 14.60 76 12.54 49 8.97 91 10.57 92 8.71Unknown -- -- -- -- -- -- -- -- -- -- -- -- -- -- -- --
Maternal race/ethnicity†
White 611 9.12 72 7.31 73 7.85 85 10.24 131 10.69 70 8.81 95 9.69 85 8.89Black or African American 397 9.45 -- -- 35 7.13 54 10.68 73 9.64 59 9.19 87 10.32 89 9.25Hispanic or Latino 80 12.31 -- -- -- -- -- -- -- -- <5 <8.47 22 13.26 54 12.71All Other Races 64 8.41 32‡ 8.27 <5 <33.81 <5 <26.07 <5 <11.48 9 19.04 9 9.38 9 5.89Unknown <5 -- -- -- -- -- -- -- -- -- -- -- <5 -- <5 --
Birth weight (grams)<2500 434 41.14 30 24.88 27 21.88 50 42.66 72 44.27 52 38.87 104 58.16 99 45.30>2500 704 6.26 72 5.79 79 6.10 91 7.36 134 7.19 90 6.39 107 5.60 131 5.74Unknown 18 -- <5 -- <5 -- -- -- -- -- -- -- 5 -- 8 --
Gestational age (weeks)20-36 311 27.19 12 11.35 17 14.07 25 20.27 46 23.29 44 27.67 78 40.07 89 36.65>37 835 7.92 91 7.84 91 7.55 116 10.26 157 9.38 95 7.30 137 7.40 148 6.66Unknown 10 -- <5 -- <5 -- -- -- <5 -- <5 -- <5 -- <5 --
SexMale 607 9.64 55 7.84 57 7.72 83 11.95 93 8.95 81 10.28 115 10.80 123 9.67Female 548 9.10 49 7.31 52 7.46 58 8.78 112 11.33 61 8.08 101 9.87 115 9.36Ambiguous/Unknown <5 -- -- -- -- -- -- -- <5 -- -- -- -- -- -- --
Parity1 Live birth 467 8.62 45 8.63 42 5.81 55 8.66 76 8.48 55 8.23 82 8.93 112 10.622 or more live births 661 9.85 43 5.97 65 9.12 86 11.93 122 11.14 87 9.99 134 11.53 124 8.66Unknown 28 -- 16 -- <5 -- -- -- 8 -- -- -- -- -- <5 --
Gravidity1 Pregnancy 344 7.42 44 9.05 35 5.22 44 6.72 54 7.65 37 7.11 54 7.40 76 8.732 or more pregnancies 807 10.81 59 7.82 73 9.54 97 13.85 150 11.69 105 10.32 162 12.03 161 10.06Unknown 5 -- <5 -- <5 -- -- -- <5 -- -- -- -- -- <5 --
PluralitySingleton 1,132 9.43 103 7.65 106 7.54 138 10.39 204 10.30 139 9.25 208 10.27 234 9.69Multiple 23 7.36 <5 <20.05 <5 <18.50 <5 <18.44 <5 <10.81 <5 <12.25 8 12.87 <5 <5.95Unknown <5 -- -- -- -- -- -- -- <5 -- -- -- -- -- -- --
CharacteristicPeriod
1984–1989 1990–1993 1994–1998 1999–2003Total 1968–1972 1973–1978 1979–1983
Cases Percent Cases Percent Cases Percent Cases Percent Cases Percent Cases Percent Cases Percent Cases PercentBirth outcome
Live birth 1,052 91.0 100 96.2 109 100.0 141 100.0 200 97.1 132 93.0 177 81.9 193 81.1Stillbirth 49 4.2 <5 -- -- -- -- -- 5 2.4 <5 -- 16 7.4 20 8.4Elective termination 55 4.8 -- -- -- -- -- -- <5 -- 6 4.2 23 10.6 25 10.5Unknown -- -- -- -- -- -- -- -- -- -- -- -- -- -- -- --
Age at diagnosisPrenatally or <7days 1,083 93.7 97 93.3 99 90.8 135 95.7 200 97.1 135 95.1 202 93.5 215 90.38 days–6 months 41 3.5 6 5.8 8 7.3 5 3.5 5 2.4 5 3.5 8 3.7 <5 --6 months–1 year 8 0.7 <5 -- <5 -- <5 -- <5 -- <5 -- <5 -- -- --1–5 years -- -- -- -- -- -- -- -- -- -- -- -- -- -- -- -->5 years -- -- -- -- -- -- -- -- -- -- -- -- -- -- -- --Unknown 24 2.1 -- -- -- -- -- -- -- -- -- -- 5 2.3 19 8.0
Socioeconomic status§
Upper 276 23.9 -- -- -- -- 47 33.3 78 37.9 58 40.8 58 26.9 35 14.7Middle 272 23.5 -- -- -- 36 25.5 68 33.0 44 31.0 71 32.9 53 22.3Lower 277 24.0 -- -- -- -- 56 39.7 60 29.1 38 26.8 81 37.5 42 17.6Unknown 331 28.6 104 100.0 109 100.0 <5 -- -- -- <5 -- 6 2.8 108 45.4
1999–2003Characteristic Total 1968–1972 1973–1978 1979–1983 1984–1989 1990–1993 1994–1998Period
* Cells containing fewer than 5 cases are indicated as “<5”. Prevalence estimates based on these cells are indicated as less than the prevalence based on 5 cases in Table a.
Percentages based on these cells are not provided in Table b. Cells containing zero cases are indicated as "--". Counts are provided, but prevalences are not estimated, for strata with unknown values in Table a. Counts and percentages are provided for strata with unknown values in Table b.
** Prev = Prevalence. † Data on Hispanic or Latino ethnicity were available beginning in 1990. ‡ The category of All Other Races includes 31 cases of Black or African American race. § Information about socioeconomic status was available only for 1979-2001.
Table 51a Any autosomal trisomy, maternal age younger than 35 years: Prevalence (per 10,000 live births) stratified
by descriptive characteristics, MACDP, 1968–2003*
Table 51b Any autosomal trisomy, maternal age younger than 35 years: Percentage of cases by descriptive characteristics, MACDP, 1968–2003*
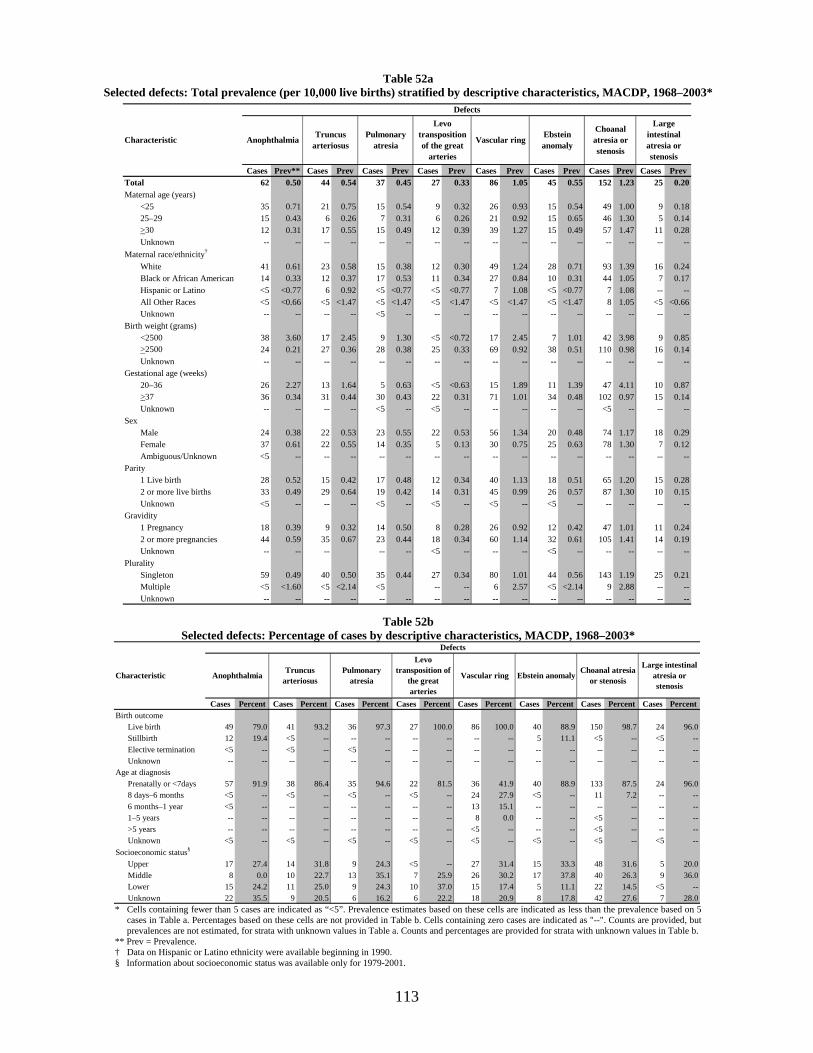
113
Cases Prev** Cases Prev Cases Prev Cases Prev Cases Prev Cases Prev Cases Prev Cases PrevTotal 62 0.50 44 0.54 37 0.45 27 0.33 86 1.05 45 0.55 152 1.23 25 0.20Maternal age (years)
<25 35 0.71 21 0.75 15 0.54 9 0.32 26 0.93 15 0.54 49 1.00 9 0.1825–29 15 0.43 6 0.26 7 0.31 6 0.26 21 0.92 15 0.65 46 1.30 5 0.14>30 12 0.31 17 0.55 15 0.49 12 0.39 39 1.27 15 0.49 57 1.47 11 0.28Unknown -- -- -- -- -- -- -- -- -- -- -- -- -- -- -- --
Maternal race/ethnicity†
White 41 0.61 23 0.58 15 0.38 12 0.30 49 1.24 28 0.71 93 1.39 16 0.24Black or African American 14 0.33 12 0.37 17 0.53 11 0.34 27 0.84 10 0.31 44 1.05 7 0.17Hispanic or Latino <5 <0.77 6 0.92 <5 <0.77 <5 <0.77 7 1.08 <5 <0.77 7 1.08 -- --All Other Races <5 <0.66 <5 <1.47 <5 <1.47 <5 <1.47 <5 <1.47 <5 <1.47 8 1.05 <5 <0.66Unknown -- -- -- -- <5 -- -- -- -- -- -- -- -- -- -- --
Birth weight (grams)<2500 38 3.60 17 2.45 9 1.30 <5 <0.72 17 2.45 7 1.01 42 3.98 9 0.85>2500 24 0.21 27 0.36 28 0.38 25 0.33 69 0.92 38 0.51 110 0.98 16 0.14Unknown -- -- -- -- -- -- -- -- -- -- -- -- -- -- -- --
Gestational age (weeks)20–36 26 2.27 13 1.64 5 0.63 <5 <0.63 15 1.89 11 1.39 47 4.11 10 0.87>37 36 0.34 31 0.44 30 0.43 22 0.31 71 1.01 34 0.48 102 0.97 15 0.14Unknown -- -- -- -- <5 -- <5 -- -- -- -- -- <5 -- -- --
SexMale 24 0.38 22 0.53 23 0.55 22 0.53 56 1.34 20 0.48 74 1.17 18 0.29Female 37 0.61 22 0.55 14 0.35 5 0.13 30 0.75 25 0.63 78 1.30 7 0.12Ambiguous/Unknown <5 -- -- -- -- -- -- -- -- -- -- -- -- -- -- --
Parity1 Live birth 28 0.52 15 0.42 17 0.48 12 0.34 40 1.13 18 0.51 65 1.20 15 0.282 or more live births 33 0.49 29 0.64 19 0.42 14 0.31 45 0.99 26 0.57 87 1.30 10 0.15Unknown <5 -- -- -- <5 -- <5 -- <5 -- <5 -- -- -- -- --
Gravidity1 Pregnancy 18 0.39 9 0.32 14 0.50 8 0.28 26 0.92 12 0.42 47 1.01 11 0.242 or more pregnancies 44 0.59 35 0.67 23 0.44 18 0.34 60 1.14 32 0.61 105 1.41 14 0.19Unknown -- -- -- -- -- <5 -- -- -- <5 -- -- -- -- --
PluralitySingleton 59 0.49 40 0.50 35 0.44 27 0.34 80 1.01 44 0.56 143 1.19 25 0.21Multiple <5 <1.60 <5 <2.14 <5 -- -- 6 2.57 <5 <2.14 9 2.88 -- --Unknown -- -- -- -- -- -- -- -- -- -- -- -- -- -- -- --
Ebstein anomaly
Choanal atresia or stenosis
Large intestinal atresia or stenosis
Defects
Characteristic Anophthalmia Truncus arteriosus
Pulmonary atresia
Levo transposition of the great
arteries
Vascular ring
Cases Percent Cases Percent Cases Percent Cases Percent Cases Percent Cases Percent Cases Percent Cases PercentBirth outcome
Live birth 49 79.0 41 93.2 36 97.3 27 100.0 86 100.0 40 88.9 150 98.7 24 96.0Stillbirth 12 19.4 <5 -- -- -- -- -- -- -- 5 11.1 <5 -- <5 --Elective termination <5 -- <5 -- <5 -- -- -- -- -- -- -- -- -- -- --Unknown -- -- -- -- -- -- -- -- -- -- -- -- -- -- -- --
Age at diagnosisPrenatally or <7days 57 91.9 38 86.4 35 94.6 22 81.5 36 41.9 40 88.9 133 87.5 24 96.08 days–6 months <5 -- <5 -- <5 -- <5 -- 24 27.9 <5 -- 11 7.2 -- --6 months–1 year <5 -- -- -- -- -- -- -- 13 15.1 -- -- -- -- -- --1–5 years -- -- -- -- -- -- -- -- 8 0.0 -- -- <5 -- -- -->5 years -- -- -- -- -- -- -- -- <5 -- -- -- <5 -- -- --Unknown <5 -- <5 -- <5 -- <5 -- <5 -- <5 -- <5 -- <5 --
Socioeconomic status§
Upper 17 27.4 14 31.8 9 24.3 <5 -- 27 31.4 15 33.3 48 31.6 5 20.0Middle 8 0.0 10 22.7 13 35.1 7 25.9 26 30.2 17 37.8 40 26.3 9 36.0Lower 15 24.2 11 25.0 9 24.3 10 37.0 15 17.4 5 11.1 22 14.5 <5 --Unknown 22 35.5 9 20.5 6 16.2 6 22.2 18 20.9 8 17.8 42 27.6 7 28.0
Large intestinal atresia or stenosis
DefectsLevo
transposition of the great arteries
Vascular ring Ebstein anomaly Choanal atresia or stenosisCharacteristic Anophthalmia Truncus
arteriosusPulmonary
atresia
* Cells containing fewer than 5 cases are indicated as “<5”. Prevalence estimates based on these cells are indicated as less than the prevalence based on 5
cases in Table a. Percentages based on these cells are not provided in Table b. Cells containing zero cases are indicated as "--". Counts are provided, but prevalences are not estimated, for strata with unknown values in Table a. Counts and percentages are provided for strata with unknown values in Table b.
** Prev = Prevalence. † Data on Hispanic or Latino ethnicity were available beginning in 1990. § Information about socioeconomic status was available only for 1979-2001.
Table 52a Selected defects: Total prevalence (per 10,000 live births) stratified by descriptive characteristics, MACDP, 1968–2003*
Table 52b Selected defects: Percentage of cases by descriptive characteristics, MACDP, 1968–2003*

114
Cases Prev** Cases Prev Cases Prev Cases Prev Cases Prev Cases Prev Cases Prev Cases PrevTotal 98 0.80 19 0.15 137 1.11 40 0.32 176 1.43 49 0.40 26 0.21 50 0.41Maternal age (years)
<25 46 0.94 8 0.16 59 1.20 15 0.31 83 1.69 18 0.37 11 0.22 22 0.4525–29 27 0.77 8 0.23 33 0.94 14 0.40 36 1.02 12 0.34 <5 <0.14 14 0.40>30 25 0.65 <5 <0.13 44 1.14 11 0.28 57 1.47 19 0.49 11 0.28 14 0.36Unknown -- -- -- -- <5 -- -- -- -- -- -- -- -- -- -- --
Maternal race/ethnicity†
White 42 0.63 15 0.22 52 0.78 27 0.40 93 1.39 27 0.40 14 0.21 26 0.39Black or African American 44 1.05 <5 <0.12 75 1.78 9 0.21 61 1.45 18 0.43 10 -- 18 0.43Hispanic or Latino <5 <0.77 -- -- <5 <0.77 -- -- 12 1.85 <5 <0.77 <5 <0.77 <5 <0.77All Other Races 9 1.18 <5 <0.66 6 0.79 <5 <0.66 10 1.31 -- -- -- -- 5 0.66Unknown -- -- -- -- <5 -- -- -- -- -- <5 -- <5 -- -- --
Birth weight (grams)<2500 23 2.18 <5 <0.47 38 3.60 24 2.27 72 6.82 20 1.90 13 1.23 22 2.09>2500 73 0.65 16 0.14 98 0.87 15 0.13 102 0.91 29 0.26 13 0.12 28 0.25Unknown <5 -- -- -- <5 -- <5 -- <5 -- -- -- -- -- -- --
Gestational age (weeks)20–36 20 1.75 <5 <0.44 48 4.20 16 1.40 58 5.07 16 1.40 11 0.96 24 2.10>37 75 0.71 16 0.15 89 0.84 21 0.20 116 1.10 33 0.31 14 0.13 26 0.25Unknown <5 -- -- -- -- -- <5 -- <5 -- -- -- <5 -- -- --
SexMale 51 0.81 10 0.16 137 2.18 21 0.33 97 1.54 23 0.37 14 0.22 45 0.71Female 47 0.78 8 0.13 -- -- 19 0.32 74 1.23 25 0.42 12 0.20 5 0.08Ambiguous/Unknown -- -- <5 -- -- -- -- -- 5 -- <5 -- -- -- -- --
Parity1 Live birth 48 0.89 5 0.09 58 1.07 13 0.24 80 1.48 22 0.41 11 0.20 23 0.422 or more live births 47 0.70 13 0.19 75 1.12 24 0.36 90 1.34 25 0.37 15 0.22 27 0.40Unknown <5 -- <5 -- <5 -- <5 -- 6 -- <5 -- -- -- -- --
Gravidity1 Pregnancy 37 0.80 <5 <0.11 40 0.86 9 0.19 55 1.19 13 0.28 10 0.22 16 0.352 or more pregnancies 60 0.80 15 0.20 95 1.27 30 0.40 121 1.62 36 0.48 16 0.21 34 0.46Unknown <5 -- -- -- <5 -- <5 -- -- -- -- -- -- -- -- --
PluralitySingleton 97 0.81 18 0.15 130 1.08 39 0.32 174 1.45 48 0.40 24 0.20 43 0.36Multiple <5 <1.60 <5 <1.60 7 2.24 <5 <1.60 <5 <1.60 <5 <1.60 <5 <1.60 7 2.24Unknown -- -- -- -- -- -- -- -- -- -- -- -- -- -- -- --
Other and unspecified
limb deficiency
Urethral obstruction
sequence
Birth defect
Characteristic Biliary atresia Exstrophy of the bladder
Posterior urethral valves
Split-hand and/or split-
foot malformation
Longitudinal limb
deficiency
Intercalary limb
deficiency
Cases Percent Cases Percent Cases Percent Cases Percent Cases Percent Cases Percent Cases Percent Cases PercentBirth outcome
Live birth 96 98.0 17 89.5 132 96.4 34 85.0 160 90.9 47 95.9 19 73.1 46 92.0Stillbirth <5 -- <5 -- <5 -- <5 -- 12 6.8 <5 -- <5 -- <5 --Elective termination -- -- -- -- <5 -- <5 -- <5 -- -- -- <5 -- <5 --Unknown -- -- -- -- -- -- -- -- -- -- -- -- -- -- -- --
Age at diagnosisPrenatally or <7days 21 21.4 19 100.0 94 68.6 39 97.5 172 97.7 47 95.9 23 88.5 47 94.08 days–6 months 73 74.5 -- -- 26 19.0 <5 -- -- -- <5 -- <5 -- <5 --6 months–1 year <5 -- -- -- <5 -- -- -- -- -- -- -- -- -- -- --1–5 years -- -- -- -- <5 -- -- -- -- -- -- -- <5 -- -- -->5 years -- -- -- -- -- -- -- -- -- -- -- -- -- -- -- --Unknown <5 -- -- -- 10 7.3 -- -- <5 -- -- -- <5 -- <5 --
Socioeconomic status§
Upper 19 19.4 <5 -- 19 13.9 5 12.5 36 20.5 9 18.4 <5 -- 9 18.0Middle 20 20.4 <5 -- 36 26.3 12 30.0 31 17.6 7 14.3 <5 -- 16 32.0Lower 24 24.5 <5 -- 42 30.7 5 12.5 45 25.6 16 32.7 <5 -- 9 18.0Unknown 35 35.7 9 47.4 40 29.2 18 45.0 64 36.4 17 34.7 16 61.5 16 32.0
Other and unspecified limb
deficiency
Urethral obstruction
sequence
Birth defect
Characteristic Biliary atresia Exstrophy of the bladder
Posterior urethral valves
Intercalary limb deficiency
Longitudinal limb deficiency
Split-hand and/or split-foot
malformation
* Cells containing fewer than 5 cases are indicated as “<5”. Prevalence estimates based on these cells are indicated as less than the prevalence based on 5
cases in Table a. Percentages based on these cells are not provided in Table b. Cells containing zero cases are indicated as "--". Counts are provided, but prevalences are not estimated, for strata with unknown values in Table a. Counts and percentages are provided for strata with unknown values in Table b.
** Prev = Prevalence. † Data on Hispanic or Latino ethnicity were available beginning in 1990. § Information about socioeconomic status was available only for 1979-2001.
Table 52a Selected defects: Total prevalence (per 10,000 live births) stratified by descriptive characteristics, MACDP, 1968–2003*
Table 52b Selected defects: Percentage of cases by descriptive characteristics, MACDP, 1968–2003*

115
.
Cases Prev** Cases Prev Cases Prev Cases Prev Cases Prev Cases PrevTotal 27 0.22 104 0.84 71 0.58 150 1.22 110 0.89 15 0.12Maternal age (years)
<25 -- -- 42 0.85 -- -- 59 1.20 36 0.73 5 0.1025–29 -- -- 33 0.94 -- -- 43 1.22 31 0.88 8 0.23>30 27 0.70 29 0.75 71 1.84 48 1.24 43 1.11 <5 <0.13Unknown -- -- -- -- -- -- -- -- -- -- -- --
Maternal race/ethnicity†
White 18 0.27 46 0.69 26 0.39 73 1.09 66 0.98 13 0.19Black or African American 7 0.17 47 1.12 38 0.90 59 1.40 28 0.67 <5 <0.12Hispanic or Latino <5 <0.77 8 1.23 <5 <0.77 13 2.00 11 1.69 -- --All Other Races -- -- <5 <0.66 <5 <0.66 5 0.66 <5 <0.66 <5 <0.66Unknown -- -- -- -- -- -- -- -- <5 -- -- --
Birth weight (grams)<2500 17 1.61 60 5.69 56 5.31 136 12.89 41 3.89 <5 <0.47>2500 8 0.07 40 0.36 10 0.09 11 0.10 67 0.60 11 0.10Unknown <5 -- <5 -- 5 -- <5 -- <5 -- -- --
Gestational age (weeks)20–36 18 1.57 44 3.85 40 3.50 66 5.77 46 4.02 8 0.70>37 8 0.08 57 0.54 29 0.28 83 0.79 63 0.60 7 0.07Unknown <5 -- <5 -- <5 -- <5 -- <5 -- -- --
SexMale 9 0.14 56 0.89 28 0.44 63 1.00 5 0.08 6 0.10Female 18 0.30 47 0.78 43 0.71 87 1.44 103 1.71 9 0.15Ambiguous/Unknown -- -- <5 -- -- -- -- -- <5 -- -- --
Parity1 Live birth <5 <0.09 38 0.70 9 0.17 52 0.96 54 1.00 <5 <0.092 or more live births 23 0.34 63 0.94 60 0.89 93 1.39 55 0.82 10 0.15Unknown -- -- <5 -- <5 -- 5 -- <5 -- <5 --
Gravidity1 Pregnancy <5 <0.11 26 0.56 <5 <0.11 44 0.95 39 0.84 <5 <0.112 or more pregnancies 24 0.32 77 1.03 67 0.90 105 1.41 71 0.95 11 0.15Unknown -- -- <5 -- -- -- <5 -- -- -- -- --
PluralitySingleton 26 0.22 103 0.86 67 0.56 146 1.22 107 0.89 <5 <0.04Multiple <5 <1.60 <5 <1.60 <5 <1.60 <5 <1.60 <5 <1.60 14 4.48Unknown -- -- -- -- -- -- -- -- <5 -- -- --
Characteristic
Trisomy 13, maternal age 35 years or
older
Trisomy 13, maternal age younger than
35 years
Trisomy 18, maternal age 35 years or
older
Conjoined twins
Birth defect
Turner syndrome
Trisomy 18, maternal age younger than
35 years
Cases Percent Cases Percent Cases Percent Cases Percent Cases Percent Cases PercentBirth outcome
Live birth 18 66.7 83 79.8 43 60.6 109 72.7 74 67.3 13 86.7Stillbirth 5 18.5 9 8.7 20 28.2 25 16.7 23 20.9 <5 --Elective termination <5 -- 12 11.5 8 11.3 16 10.7 13 11.8 <5 --Unknown -- -- -- -- -- -- -- -- -- -- -- --
Age at diagnosisPrenatally or <7days 26 96.3 97 93.3 66 93.0 147 98.0 101 91.8 15 100.08 days–6 months -- -- <5 -- <5 -- -- -- 5 4.5 -- --6 months–1 year -- -- -- -- -- -- -- -- <5 -- -- --1–5 years -- -- -- -- -- -- -- -- <5 -- -- -->5 years -- -- -- -- -- -- -- -- -- -- -- --Unknown <5 -- 5 4.8 <5 -- <5 -- <5 -- -- --
Socioeconomic status§
Upper 9 33.3 26 25.0 19 26.8 46 30.7 34 30.9 -- --Middle 8 29.6 26 25.0 12 16.9 27 18.0 31 28.2 <5 --Lower 6 22.2 26 25.0 18 25.3 42 28.0 22 20.0 <5 --Unknown <5 -- 26 25.0 22 31.0 35 23.3 23 20.9 10 66.7
Birth defectTrisomy 18, maternal age
younger than 35 years
Turner syndrome Conjoined twinsCharacteristic
Trisomy 13, maternal age 35 years or older
Trisomy 13, maternal age
younger than 35 years
Trisomy 18, maternal age 35 years or older
• Cells containing fewer than 5 cases are indicated as “<5”. Prevalence estimates based on these cells are indicated as less than the prevalence based on 5
cases in Table a Percentages based on these cells are not provided in Table b. Cells containing zero cases are indicated as "--". Counts are provided, but prevalences are not estimated, for strata with unknown values in Table a. Counts and percentages are provided for strata with unknown values in Table b.
** Prev = Prevalence. † Data on Hispanic or Latino ethnicity were available beginning in 1990. § Information about socioeconomic status was available only for 1979-2001.
Table 52a Selected defects: Total prevalence (per 10,000 live births) stratified by descriptive characteristics, MACDP, 1968–2003*
Table 52b Selected defects: Percentage of cases by descriptive characteristics, MACDP, 1968–2003*

116
APPENDIX B: CONDITIONS NOT CONSIDERED TO BE MAJOR
CONGENITAL DEFECTS IN THIS REPORT
Albinism Alpha1–antitrypsin deficiency Amniotic bands Anal fissure Aortic valve insufficiency or regurgitation Arginosuccinic aciduria Arrhythmias, including congenital heart block; Wolff-Parkinson-White syndrome; supraventricular tachycardia; premature atrial contractions; other and unspecified arrhythmias Ascites Atrial dilataton or enlargement of the heart without another cardiac defect Blue sclera Breast hypertrophy Bronchopulmonary dysplasia Brushfield spots Café au lait spots Cephalohematoma Central nervous system hemorrhage that occurs postnatally Chalasia (gastroesophageal reflux) Chest deformity (e.g., barrel or shield chest) Chordee Chylothorax and other disorders of lymphatics Cleft uvula Conjunctivitis Cerebral lipidoses (e.g., Tay-Sachs disease, gangliosidoses) Cervical rib Cystic fibrosis Dextrocardia without situs inversus Diastasis recti Dolichocephaly Ears that are large, small, or misshapen Ears that are low set or posteriorly rotated Elliptocytosis, hereditary Epibulbar dermoid cyst Epicanthal folds Epulis (inflammatory hyperplasia of the gum) Erb's palsy Esotropia Exophthalmos Exotropia External female genital anomalies Eyelid anomalies (e.g., absent or long eyelashes) Facial asymmetry Facial palsy
Facies abnormal or flattened Finger anomalies (excluding polydactyly and syndactyly) Fontanelle large or small Foreskin absent or hooded Gastroesophageal reflux Glucose-6-phosphate dehydrogenase deficiency Glycogen storage disease Gum cyst Head asymmetry Heart murmur with no other diagnosis of cardiac abnormality Hemophilia Hepatomegaly High arched palate Hip click with no other diagnosis of hip abnormality Hip subluxation with no other diagnosis of hip abnormality Hirsutism Hyaline membrane disease Hydrocele Hydrocephalus secondary to postnatal intraventricular hemorrhage or central nervous system bleed Hyperglycinemia Hypertelorism or hypotelorism Hypoglycemia Hypoparathyroidism Hypophosphatemic ricketts Hypoplastic lung in infants of 36 weeks or less gestation Hypothyroidism Imperforate hymen Infantile spasms Inguinal hernia in males of any gestational age and in females of 36 weeks or less gestation Intestinal obstruction Note: The medical record is reviewed to determine whether the cause of the obstruction is a major congenital defect Intussusception Note: The medical record is reviewed to determine whether the cause of the intussusception is a major congenital defect Inverted nipples Iris anomalies (e.g., iris coloboma, iris freckles) Jaw size abnormalities Lacrimal duct obstruction Lanugo Laryngeal stridor (congenital only) Laryngotracheomalacia Lip anomalies (excluding cleft lip) Macrocephaly Macrocheilia (large lips)
117
Macrognathia Maple syrup urine disease Meckel diverticulum Meconium–stained skin or nails Metatarsus varus or adductus Microcheilia (small lips) Micrognathia Midfacial hypoplasia Mitral valve insufficiency or regurgitation Mucocele Nails enlarged, hypertrophic, or hypoplastic Nasal bridge flat or wide Nasal septum deviated, perforated, or absent Natal teeth Neck short or webbed Neonatal acne Neoplasms of the skin or genital organs that are benign Nevus (birthmark) Nipples absent, small, or widely spaced Nipple, accessory Nose small Nystagmus Occiput flat or prominent Overriding or overlapping cranial sutures Palmar crease abnormal Palpebral fissures short, narrow, or slanted Patent ductus arteriosus in infants of 36 weeks or less gestation that does not persist beyond 6 weeks of age Patent foramen ovale Patent urachus Pericardial abnormalities Persistent fetal or transitional circulation Petechiae Phenylketonuria Phimosis Plagiocephaly Pneumothorax Postaxial polydactyly (skin tag only) in Blacks or African Americans Preauricular sinus, cyst, or pit Preuricular or auricular appendage, tag, or lobule; accessory auricle Primary pulmonary hypertension Pseudocholinesterase deficiency Ptosis Pulmonary valve insufficiency or regurgitation Pylorospasm Ranula (sublingual cyst of the mouth) Red cell aplasia Redundant foreskin
Retractile testes Rocker bottom foot Sacral dimple Scrotal hypoplasia Sickle cell anemia Single umbilical artery Skin cysts or tags Skull deformity without craniosynostosis (e.g., brachycephaly, scaphocephaly, trigonocephaly) Skull depression Spherocytosis, hereditary Splenomegaly Syphilis Testicular hypoplaia Toe anomalies (excluding polydactyly and syndactyly) Tongue large, small, or protruding Tongue tie Torsion of testes or spermatic cord Tracheomalacia Umbilical cord anomalies Umbilical hernia Undescened testicle Urachal cyst Ventricular hypertrophy, dilataton, or enlargement of the heart with no other diagnosis of a major cardiac defect Volvulus Note: The medical record is reviewed to determine whether the cause of the obstruction is a major congenital defect von Willebrand disease Wilson-Mikity syndrome (bronchopulmonary dysplasia)

118
APPENDIX C: INTERNATIONAL CLASSIFICATION OF DISEASES, NINTH REVISION, CLINICAL MODIFICATION
(ICD9-CM) CODES TO SELECT FOR DIAGNOSTIC INDICES (CDC, 2007)
Disease codes 155.0 Neoplasms of the liver; hepatoblastoma; hemangioepithelioma 159.8 Neoplasms of the abdomen 162.8 Neoplasms of the lung 171.8 Neoplasms of connective tissue; Ewing sarcoma; fibrosarcoma 186.0 Neoplasms of the testes 189.0 Wilms tumor; nephroblastoma 190.5 Retinoblastoma 191.0 Neoplasms of the central nervous system; glioma; medulloblastoma 194.0 Neuroblastoma 202.3 Histiocytosis, malignant 208.0 Leukemia, congenital, not otherwise specified 216.9 Hairy nevus 228.0 Hemangioma 228.1 Cystic hygroma; lymphangioma, any site 237.7 Neurofibromatosis 238.0 Teratoma, not otherwise specified 239.2 Neck cyst 253.2 Hypopituitarism, congenital 253.8 Diencephalic syndrome 255.2 Adrenogenital syndrome; adrenal hyperplasia 257.8 Testicular feminization syndrome 259.4 Dwarfism 277.4 Disorders of bilirubin excretion 277.5 Hurler syndrome; lipochondrodystrophy 279.11 DiGeorge syndrome 279.2 Combined immunodeficiency syndrome 331.3 Communicating hydrocephalus 331.4 Obstructive hydrocephalus 331.89 Familial degenerative central nervous system disease 335.0 Werdnig-Hoffman disease 336.0 Syringomyelia 345.6 Infantile spasms, congenital 348.0 Cerebral cysts 352.6 Moebius sequence 362.6 Retinal degeneration, peripheral 362.7 Retinitis pigmentosa 363.2 Chorioretinitis 365.14 Glaucoma of childhood 366.0 Infantile cataract 376.41 Hypertelorism
377.1 Optic atrophy 417.0 Fistula of pulmonary artery 417.1 Aneurysm of pulmonary artery 424.0 Mitral valve disorders 424.1 Aortic valve disorders 424.2 Tricuspid valve disorders 424.3 Pulmonary valve disorders 425 Cardiomyopathy 426.7 Congenital Wolfe-Parkinson-White syndrome 426.82 Long QT syndrome 427.9 Cardiac arrhythmias, not elsewhere specified 453.0 Budd-Chiari syndrome; occlusion of hepatic vein 524.0 Abnormalities of jaw size; micrognathia; macrognathia 530.84 Tracheoesophageal fistula 537.0 Acquired hypertrophic pyloric stenosis 537.3 Other obstruction of duodenum 550 Inguinal hernia in females of 36 weeks or more gestation 552.3 Diaphragmatic hernia with obstruction 553.2 Epigastric hernia 553.3 Diaphragmatic hernia 560.9 Unspecified intestinal obstruction 564.7 Megacolon , other than Hirschsprung disease 569.2 Stenosis of rectum or anus 576.8 Other specified disorder of biliary tract 588.0 Renal osteodystrophy 591 Hydronephrosis 593.5 Hydroureter 593.7 Vesicoureteral reflux 635 Induced abortion 651.3 Twin pregnancy with fetal loss and
retention of one fetus 651.4 Triplet pregnancy with fetal loss and
retention of one or more fetus(es) 651.5 Quadruplet pregnancy with fetal loss and
retention of one or more fetus(es) 651.6 Other multiple pregnancy with fetal loss
and retention of one or more fetus(es) 655.0 Central nervous system malformation in
fetus 655.1 Chromosomal abnormality in fetus 655.2 Hereditary disease in family possibly
affecting fetus 655.3 Suspected damage to fetus from viral
disease in the mother 655.5 Suspected damage to the fetus from drugs 655.6 Suspected damage to fetus from radiation 655.8 Other known or suspected fetal
119
abnormality, not elsewhere classified 655.9 Unspecified fetal abnormality affecting
management of mother 656.0 Fetal–maternal hemorrhage 656.4 Intrauterine death 656.7 Other placental conditions 685.1 Pilonidal, sacrodermal, or sacral sinus; sacral or pilonodal dimple 723.5 Torticollis 736.4 Genu valgum or varum (acquired) 736.5 Genu recurvatum (acquired) 738.4 Spondylolisthesis (acquired) 740–759 Congenital anomalies 760.71 Fetal alcohol syndrome (FAS) 760.79 Fetal hydantoin syndrome 768.0 Fetal death from asphyxia or anoxia
before onset of labor or at unspecified time
768.1 Fetal death from asphyxia or anoxia during labor 771.0 Rubella, congenital or in utero infection only 771.1 Cytomegalovirus (CMV) congenital infection 771.2 Other congenital infection 774.4 Hepatitis, neonatal 779.9 Stillbirth, not elsewhere classified V codes (optional) V27.1 Single stillborn V27.3 Twins, one liveborn and one stillborn V27.4 Twins, both stillborn V27.6 Other multiple birth, some liveborn V27.7 Other multiple birth, all stillborn V30 Single liveborn V31 Twin, mate liveborn V32 Twin, mate stillborn V33 Twin, unspecified V34 Other multiple, mates all liveborn V35 Other multiple, mates all stillborn V36 Other multiple, mates liveborn and stillborn V37 Other multiple, unspecified V39 Unspecified Procedure codes 69.01 Dilation and curettage for termination of
pregnancy 69.02 Dilation and curettage following delivery
or abortion 69.51 Aspiration curettage of uterus for
termination of pregnancy; therapeutic abortion not otherwise stated 69.52 Aspiration curettage following delivery or
abortion 74.91 Hysterotomy to terminate pregnancy;
therapeutic abortion by hysterotomy 75.0 Intraamniotic injection for abortion

120
APPENDIX D: CUMULATIVE SUM (CUSUM) STATISTICAL DETAILS
Cumulative sum methods (CUSUM) are
used to detect sudden changes in the observed birth defects prevalence from the baseline prevalence (Lucas, 1985; Rogerson, 2005). These methods provide a test statistic that evaluates the cumulated sum of differences between observed and expected counts for a birth defect across consecutive time periods (e.g., birth months). The CUSUM statistic can detect a succession of such differences quickly and is sensitive to small changes over short periods of time. When a significant deviation from the ex-pected prevalence occurs, an alert is signaled. In MACDP, it was desired to monitor for both in-creases and decreases in prevalence of birth defects.
MACDP uses a Poisson-based CUSUM model where the baseline prevalence is set accord-ing to the observed birth defects prevalence during the first 24 months of data collection (January 1968 through December 1969). If there were no occur-rences of a particular defect during this period, the referent value is set as if 0.5 cases were observed. Every month thereafter, the monthly count of birth defects and the monthly count of live births are tabulated. The computation of the CUSUM statistic Si is made separately for increases and decreases according to the following formulas: Increases: S0 = 0 (Initial value) Si = max(0, Si-1 + NCasei – ki) If Si > hi then a CUSUM increase (flag) is signaled, and Si is reset to 0. Decreases: S0 = 0 (Initial value) Si = max(0, Si-1 – NCasei + ki) If Si > hi then a CUSUM decrease (flag) is signaled, and Si is reset to 0. In these formulas:
• The subscript i refers to the current month of observation (e.g., i = 1 on January 1970).
• NCasei is the observed number of birth de-
fects during monthi.
• Calculation of the parameter ki involves the baseline prevalence, the observed number of live births, and requires the level of
change deemed “important” to be specified. MACDP set a 20% increase and a 30% de-crease as the levels of prevalence change deemed important for quick detection.
• Si-1 is the preceding CUSUM statistic.
To calculate Si, on each month the difference
between the observed and expected birth defect counts (NCasei – ki) is calculated, and this value is added to Si-1, the CUSUM statistic from the previ-ous month. Whether or not the observed birth defect count contributes to the CUSUM statistic is there-fore sensitive to the choice of k.
A “threshold” value, hi, is specified using the baseline prevalence and is adjusted every month according to the observed number of live births. Any value of Si > hi signals an alarm. The selection of hi involves a tradeoff between false alarms and timely detection of prevalence increases. MACDP selects a value of hi such that the average run length in between false alarm, under the null hypothesis of no change in the underlying prevalence, is 300 months (25 years). Computation of the distribution of h was performed by computer simulation, using random Poisson counts for a range of expected numbers of cases. The resulting h values were smoothed with fifth degree polynomial logistic re-gression equations so that hi could be easily com-puted for any given expected number of cases.
Whenever an alarm is signaled (Si > hi), the baseline prevalence rate is adjusted, and the CUSUM statistic is reset to zero. The new baseline prevalence is calculated using data from the 24 months prior to the month the alarm was signaled. The use of 24 months of data in the computation is based on a tradeoff between a sufficient number of cases for the prevalence calculation and providing the ability to update the baseline prevalence with reasonably recent data.
ACKNOWLEDGEMENTS The development and operation of MACDP has been made possible through the efforts of many people. We are indebted to: Arthur Falik, William Flynt, and Clark Heath, for their vision and pioneer-ing efforts in establishing MACDP; Dave Erickson and Godfrey Oakley for their leadership and sup-port; Lee James for his valuable contributions to the development and management of the monitoring database and software; Larry Edmonds, Louise Martin, and Leonard Paulozzi for their commitment

121
to management over many years; Debra Adams, Fran Baxter, Cynthia Bowker, Jo Anne Croghan, Joann Donaldson, Joan Garcia, Teri Hurlburt, Deb-bie Nurmi, Kitty Peecher, Charlie Peters, Wendy Sklenka, and all past abstractors for their dedication and efforts in identifying cases and abstracting case information; Joan Taylor, Karen Thornton and Ti-neka Yowe for their commitment and efforts in en-suring the completeness and accuracy of the ab-stracted information; Anne McClearn, and Elaine Rhodenhiser for their technical support with data management; Lorenzo Botto, José Cordero, Wil-liam Mahle, Cynthia Moore, Richard Olney, Mark Reller, Sonja Rasmussen, and Stuart Shapira for their review of clinical data, classification of de-fects, and further development of our coding sys-tem; Emily Kahn and others at the Georgia Depart-ment of Human Resources, Division of Public Health; staffs of participating hospitals, offices, and laboratories whose collaboration have made MACDP possible; and the many other individuals who over the past 40 years have contributed to MACDP. CDC is grateful to the Teratology Society and its Publications Committee for the opportunity to make these important prevalence data accessible to a wide audience.
REFERENCES Appelros P, Hogeras N, Terent A. 2003. Case ascer-
tainment in stroke studies: the risk of selec-tion bias. Acta Neurol Scand 107(2):145-149.
Araneta MR, Moore CA, Olney RS, et al. 1997. Goldenhar syndrome among infants born in military hospitals to Gulf War veterans. Teratology 56(4):244-251.
Becerra JE, Khoury MJ, Cordero JF, et al. 1990. Diabetes mellitus during pregnancy and the risks for specific birth defects: a popula-tion-based case-control study. Pediatrics 85(1):1-9.
Berry RJ, Li Z, Erickson JD, et al. 1999. Prevention of neural-tube defects with folic acid in China. China-U.S. Collaborative Project for Neural Tube Defect Prevention. N Engl J Med 341(20):1485-1490.
Bhatti TR, Dott M, Yoon PW, et al. 2003. Descrip-tive epidemiology of infantile cataracts in metropolitan Atlanta, GA, 1968-1998. Arch Pediatr Adolesc Med:157(4):341-7.
Botto, LD, Khoury MJ, Mulinare J, et al. 1996. Periconceptional multivitamin use and the occurrence of conotruncal heart defects: re-sults from a population-based, case-control study. Pediatrics 98(5): 911-7.
Botto, LD, Correa A, Erickson JD. 2001. Racial and temporal variations in the prevalence of heart defects. Pediatrics 107(3): E32.
Botto, LD, Erickson JD, Mulinare J, et al. 2002. Maternal fever, multivitamin use, and se-lected birth defects: evidence of interac-tion? Epidemiology 13(4): 485-8.
Botto LD, Robert-Gnansia E, Siffel C, et al. 2006. Fostering international collaboration in birth defects research and prevention: a per-spective from the International Clearing-house for Birth Defects Surveillance and Research. Am J Public Health 96(5):774-80.
Bower C, Stanley FJ. 1989. Dietary folate as a risk factor for neural-tube defects: evidence from a case-control study in Western Aus-tralia. Med J Aust 150(11):613-619.
Box G, Luceno A. 1997. Statistical Control by Monitoring and Feedback Adjustment. New York: Wiley.
British Paediatric Association. 1979. British Paedi-atric Association Classification of Diseases. London: British Paediatric Association.
CDC. 1992. Recommendations for the use of folic acid to reduce the number of cases of spina bifida and other neural tube defects. MMWR Recomm Rep 41(RR-14):1-7.
CDC. 1993. Congenital Malformatins Surveilance. Teratology 48(6):545-709.
CDC. 1995. Chorionic villus sampling and amnio-centesis: recommendations for prenatal counseling. Centers for Disease Control and Prevention. MMWR Recomm Rep 44(RR-9): 1-12.
CDC. 1997. Surveillance for fetal alcohol syndrome using multiple sources -- Atlanta, Georgia, 1981-1989. MMWR. 46(47):1118-20.
CDC. 1998. Trends in infant mortality attributed to birth defects—United States, 1980-1995. MMWR 47:773-778.
CDC. 2005. MACDP Defect Code List. [Cited 2007 Jan 04] Available at URL: http://www.cdc.gov/ncbddd/bd/macdp_resources.htm
CDC. 2007. International Classification of
122
Diseases, Ninth Revision, Clinical Modifi-cation (ICD-9-CM). [Cited 2007 Jan 04] Available from URL: http://www.cdc.gov/nchs/about/otheract/icd9/abticd9.htm
Clark EB. 1996. Pathogenetic mechanisms of con-genital cardiovascular malformations revis-ited. Semin Perinatol 20:465-72
Cochi SL, Edmonds LE, Dyer K, et al. 1989. Con-genital rubella syndrome in the United States, 1970-1985. On the verge of elimina-tion. Am J Epidemiol 129(2):349-361.
Correa-Villasenor A, Cragan J, Kucik J, et al. 2003. The Metropolitan Atlanta Congenital De-fects Program: 35 years of birth defects surveillance at the Centers for Disease Con-trol and Prevention. Birth Defects Res A Clin Mol Teratol 67(9):617-624.
Cragan JD, Martin ML, et al. 1993. Descriptive epidemiology of small intestinal atresia, Atlanta, Georgia. Teratology 8:441-450.
Czeizel AE, Dudas I. 1992. Prevention of the first occurrence of neural-tube defects by peri-conceptional vitamin supplementation.N Engl J Med 327(26):1832-5.
Decoufle P, Boyle CA, Paulozzi LJ, Lary JM. 2001. Increased risk for developmental disabili-ties in children who have major birth de-fects: a population-based study. Pediatrics 108(3):728-34.
Dott MM, Wong LY, Rasmussen SA. 2003. Popu-lation-based study of congenital diaphrag-matic hernia: risk factors and survival in Metropolitan Atlanta, 1968-1999. Birth De-fects Res A Clin Mol Teratol 67(4):261-7.
Erickson, JD, Mulinare J, McClean PW, et al. 1984. Vietnam veterans' risks for fathering babies with birth defects. JAMA 252(7): 903-12.
FDA. 1996. Food standards: Amendment of stan-dards of identity for enriched grain products to require addition of folic acid. Fed Regist 61:8781-8797.
Fretts RC, Elkin EB, Myers ER, et al. 2004. Should older women have antepartum testing to prevent unexplained stillbirth? Obstet Gy-necol 104(1):56-64.
Hall JG, Powers EK, McIlavaine. 1978. The frequency and financial burden of genetic disease in a pediatric hospital. Am J Med Genetic 1:417-436.
Hawkins D, Olwell D. 1997. Cumulative Sum Charts and Charting for Quality Improve-
ment. New York Berlin Heidelberg Springer-Verlag.
Honein MA, Paulozzi LJ, Moore CA. 2000. Family history, maternal smoking, and clubfoot: an indication of a gene-environment interac-tion. Am J Epidemiol 152(7):658-665.
Hook EB, Topol BB, Cross PK. 1989. The natural history of cytogenetically abnormal fetuses detected at midtrimester amniocentesis which are not terminated electively: new data and estimates of the excess and rela-tive risk of later fetal death associated with 47,+21 and some other abnormal karyo-types. Am J Hum Genet 45: 855-861.
Huether CA, Ivanovich J, Goodwin BS, et al. 1998. Maternal age specific risk rate estimates for Down syndrome among live births in whites and other races from Ohio and met-ropolitan Atlanta, 1970-1989. J Med Genet 35:482-490.
Hymbaugh K, Miller LA, Druschel CM, et al. 2002. A multiple source methodology for the sur-veillance of fetal alcohol syndrome--The Fetal Alcohol Syndrome Surveillance Net-work (FASSNet). Teratology 66 Suppl 1:S41-49.
International Clearinghouse for Birth Defects Moni-toring Systems. Annual Report 2004. Rome, Italy: International Centre for Birth Defects; 2004.
Itikala PR, Watkins ML, Mulinare J, et al. 2001. Maternal multivitamin use and orofacial clefts in offspring. Teratology 63(2):79-86.
Kelsall JE and Diggle PJ. 1995. Non-parametric estimation of spatial variation in relative risk. Statistics in Medicine 14(21-22):2335-2342.
Khoury M J, Moore CA, Mulinare J. 1996. Vitamin A and birth defects. Lancet 347(8997): 322.
Krieger N, Chen JT, Waterman PD, et al. 2003. Choosing area based socioeconomic meas-ures to monitor social inequalities in low birth weight and childhood lead poisoning: The Public Health Disparities Geocoding Project (US). J Epidemiol Community Health 57:186-199.
Krivchenia E, Huether CA, Edmonds LD, et al. 1993. Comparative epidemiology of Down syndrome in two United States populations, 1970-1989. Am J Epidemiol 137:815-828.
Kulldorff M. 1997. A spatial scan statistic.
123
Communications in Statistics: Theory and Methods, 26:1481-1496
Lammer EJ and Edmonds LD. 1987. Trends in pyloric stenosis incidence, Atlanta, 1968 to 1982. J Med Genet 24:482-487.
Lary JM, Paulozzi LJ. 2001. Sex differences in the prevalence of human birth defects: a popu-lation-based study. Teratology 64(5):237-51.
Lucas J. 1976. The Design and Use of V-Mask Control Schemes. Journal of Quality Tech-nology 8(1):1-12.
Lucas J. 1985. Counted Data CUSUM’s. Tech-nometrics 27:129-144.
Lynberg MC, Chavez GF, Edmonds LD, et al. 1993. Evaluation of the Birth Defects Monitoring Program, 1982-1985. Teratol-ogy 48(6):650-657.
Lynberg MC, Khoury MJ, Lu X, et al. 1994. Mater-nal flu, fever, and the risk of neural tube de-fects: a population-based case-control study. Am J Epidemiol 140(3):244-255.
Martin ML, Edmonds LD. 1991. Use of birth de-fects monitoring programs for assessing the effects of maternal substance abuse on pregnancy outcomes. NIDA Res Monogr 114:66-83.
Mason CA, Kirby RS, Sever LE, et al. 2005. Preva-lence is the preferred measure of frequency of birth defects. Birth Defects Research Part A 73:690-2.
Mavroudis C, Jacobs JP. 2000. Congenital heart surgery nomenclature and database project. Ann Thorac Surg 69(suppl):S1-S372.
Medical Research Council. 1991. Prevention of neural tube defects: results of the Medical Research Council Vitamin Study. MRC Vi-tamin Study Research Group. Lancet 338(8760):131-137.
Milunsky A, Jick H, Jick SS, et al. 1989. Multivi-tamin/folic acid supplementation in early pregnancy reduces the prevalence of neural tube defects. JAMA 262(20):2847-2852.
Moore CA, Khoury MJ, Liu Y. 1997. Does light-to-moderate alcohol consumption during pregnancy increase the risk for renal anomalies among offspring? Pediatrics 99(4):E11.
Mulinare J, Cordero JF, Erickson JD, et al. 1988. Periconceptional use of multivitamins and the occurrence of neural tube defects. JAMA 260(21): 3141-5.
National Birth Defects Prevention Network. 2004. Guidelines for Conducting Birth Defects Surveillance. Atlanta, GA, National Birth Defects Prevention Network, Inc.
National Birth Defects Prevention Network. 2006. Birth defects surveillance data from se-lected states, 1999-2003. Birth Defects Res A Clin Mol Teratol 76(12): 894-958.
Oakley GP, Jr. 1986. Frequency of human congeni-tal malformations. Clin Perinatol 13(3):545-554.
Office of Health Information and Policy, Georgia Division of Public Health. 2007. Spatial Imputation Algorithm [Cited 2007 Jan 04] Available from http://health.state.ga.us/pdfs/ohip/adgsi.60101.pdf
Olney RS, Khoury MJ, Alo CJ, et al. 1995. In-creased risk for transverse digital defi-ciency after chorionic villus sampling: re-sults of the United States Multistate Case-Control Study, 1988-1992. Teratology 51(1):20-29.
Petrini J, Damus, K, Russell R, et al. 2002. Contribution of birth defects to infant mor-tality in the United States. Teratology 66:S3-S6.
Rasmussen SA, Olney RS, Holmes LB, et al. 2003. Guidelines for case classification for the National Birth Defects Prevention Study. Birth Defects Res A Clin Mol Teratol 67(3):193-201.
Rasmussen SA, Wong LY, Correa A, et al. 2006. Survival in infants with Down syndrome, Metropolitan Atlanta, 1979-1998. J Pediatr 148(6):806-812.
Roberts HE, Moore CA, Cragan JD, et al. 1995. Impact of prenatal diagnosis on the birth prevalence of neural tube defects, Atlanta, 1990-1991. Pediatrics 96(5 Pt 1):880-883.
Rogerson PA. 2005. Spatial surveillance and cumulative sum methods. In Spatial and Syndromic Surveillance for Public Health. Edited by AB Lawson and K Kleinman. John Wiley & Sons: Chichester, England, pp 95-114.
Rowland, CA, Correa A, et al. 2006. Are encephaloceles neural tube defects? Pediat-rics 118(3):916-23.
Rowlingson B, Diggle P. 1993. SPLANCS: spatial point pattern analysis code in S-Plus. Com-puters and Geosciences 19:627-655.

124
Safra MJ, Oakley GP, Jr. 1975. Association be-tween cleft lip with or without cleft palate and prenatal exposure to diazepam. Lancet 2(7933):478-480.
Safra MJ, Oakley GP, Jr. 1976. Valium: an oral cleft teratogen? Cleft Palate J 13:198-200.
Siffel C, L. Y. Wong, Olney RS. et al. 2003. Sur-vival of infants diagnosed with encephalo-cele in Atlanta, 1979-98. Paediatr Perinat Epidemiol 17(1): 40-8.
Siffel C, A. Correa, Cragan J. 2004. Prenatal diag-nosis, pregnancy terminations and preva-lence of Down syndrome in Atlanta. Birth Defects Res A Clin Mol Teratol 70(9): 565-71.
Siffel C, Strickland MJ, Gardner BR, et al. 2006. Role of geographic information systems in birth defects surveillance and research. Birth Defects Res A Clin Mol Teratol 76(11): 825-33.
Smithells RW, Sheppard S, Schorah CJ, et al. 1980. Possible prevention of neural-tube defects by periconceptional vitamin supplementa-tion. Lancet 1(8164):339-340.
Smithells RW, Sheppard S, Schorah CJ, et al. 1981. Apparent prevention of neural tube defects by periconceptional vitamin supplementa-tion. Arch Dis Child 56(12):911-918.
Smithells RW, Nevin NC, Seller MJ, et al. 1983. Further experience of vitamin supplementa-tion for prevention of neural tube defect re-currences. Lancet 1(8332):1027-1031.
Sonesson C & Frisen M. 2005. Multivariate surveillance. In Spatial and Syndromic Sur-veillance for Public Health. Edited by AB Lawson and K Kleinman. John Wiley & Sons: Chichester, England, pp 153-166.
Soobader M, LeClere FB, et al. 2001. Using aggregate geographic data to proxy individual socioeconomic status: does size matter? Am J Public Health 91(4):632-6.
Watkins ML and Botto LD. 2001. Maternal pre-pregnancy weight and congenital heart de-fects in offspring. Epidemiology 12(4): 439-46.
Watkins ML, Edmonds L, McClearn A, et al. 1996. The surveillance of birth defects: The use-fulness of the revised US Standard Birth Certificate. AJPH 86(5):731-734.
Williams LJ, Mai CT, Edmonds LD, et al. 2002. Prevalence of spina bifida and anencephaly during the transition to mandatory folic acid fortification in the United States. Teratol-ogy 66(1):33-9
Williams L, Kucik J, Alverson C, et al. 2005. Epi-demiology of gastroschisis in metropolitan Atlanta, 1968 through 2000. Birth Defects Research Part A 73:177-183.
Wong LY and Paulozzi LJ. 2001. Survival of in-fants with spina bifida: a population study, 1979-94. Paediatr Perinat Epidemiol 15(4): 374-8.
Yang D, Bilaver L, Hayes O, et al. 2004. Improving geocoding practices: evaluation of geocod-ing tools. J Med Syst 28:361-370.
Yang Q, Khoury MJ, Olney RS, et al. 1997. Does periconceptional multivitamin use reduce the risk for limb deficiency in offspring? Epidemiology 8(2):157-161.
Yang Q, Sherman SL, Hassold TJ, et al. 1999. Risk factors for trisomy 21: maternal cigarette smoking and oral contraceptive use in a population-based case-control study. Genet Med 1(3):80-88.
Yeargin-Allsopp M, Murphy CC, Oakley GP, et al. 1992. A multiple-source method for study-ing the prevalence of developmental dis-abilities in children: the Metropolitan At-lanta Developmental Disabilities Study. Pediatrics 89(4 Pt 1):624-630.
Yen IH, Khoury MJ, Erickson JD, et al. 1992. The changing epidemiology of neural tube de-fects. United States, 1968-1989. Am J Dis Child 146(7):857-861.
Yoon PW, Olney RS, Khoury MJ, et al. 1997a. Contribution of birth defects and genetic diseases to pediatric hospitalizations. A population-based study. Arch Pediatr Ado-lesc Med 151(11):1096-103.
Yoon PW, Bresee JS, Olney RS, James LM, Khoury MJ. 1997b. Epidemiology of bil-iary atresia: a population-based study. Pediatrics 99(3):376-82.
Yoon PW, Rasmussen SA, Lynberg MC, et al. 2001. The National Birth Defects Preven-tion Study. Public Health Rep 116 Suppl 1:32-40.