The Martian Dust Cycle: Investigation of the Surface Lifting Component
11
NASA-CR-202433 -/i INTERCHANGE # NCC2-5076 (22 July 1994 - 21 July 1996) J_ FINAL REPORT The Martian Dust Cycle: Investigation of the Surface Lifting Component Dr. James R. Murphy, San Jose State University Foundation Dr. Alison F.C. Bridger, Department of Meteorology, San Jose State University Dr. Robert M. Haberle, Theoretical Studies Branch, NASA Ames Research Center We have investigated the nature of the annual cycle of suspended dust in the martian atmosphere. This has been undertaken to understand the dynamical processes responsible for lifting dust from the surface, locations where dust is preferentially lifted, and preferred sites for dust deposition upon the surface. Our efforts have involved carrying out a number of numerical simulations with the Ames Mars General Circulation Model (GCM) interactively coupled with an aerosol transport/ micorphysical model. The model generates an annual dust cycle similar to that observed. Various feedbacks are present in the atmosphere / surface system which enter into the generation of the cycle. Several locations are primary surface sources of dust, while much of the remaining planet's surface acts a sink for suspended dust. METHOD Our efforts began by incorporating into our coupled model system a self consistent determination of the rate of surface dust lifting based upon the GCM calculated atmospher-surface momentum transfer (accounted for in the surface stress term). The relationship between surface stress and the flux of dust (mass per area per time) from the surface into the atmosphere is based upon empirically derived values under terrestrial conditions which have been used in terrestrial numerical modelling (Westphal et al., 1987). We explored the parameter space surrounding our prescription for the functionality of the lifting rate, as well as the threshold stress value (0.0225 N m -2) below which no dust lifting occurs. (This threshold stress value chosen approximately corresponds to wind speeds of 40 m s1 at the model grid-point nearest to the surface.) These sensitivity studies indicated that our choices were valid, with neither excessive nor minimal dust lifting being a constant product of the model. Rather, varying the initial conditions (with or without preexisting
Transcript of The Martian Dust Cycle: Investigation of the Surface Lifting Component

NASA-CR-202433 -/i
INTERCHANGE # NCC2-5076
(22 July 1994 - 21 July 1996)
J_
FINAL REPORT
The Martian Dust Cycle: Investigation of the Surface Lifting Component
Dr. James R. Murphy, San Jose State University Foundation
Dr. Alison F.C. Bridger, Department of Meteorology, San Jose State University
Dr. Robert M. Haberle, Theoretical Studies Branch, NASA Ames Research Center
We have investigated the nature of the annual cycle of suspended dust in the martian atmosphere.
This has been undertaken to understand the dynamical processes responsible for lifting dust from
the surface, locations where dust is preferentially lifted, and preferred sites for dust deposition
upon the surface. Our efforts have involved carrying out a number of numerical simulations with
the Ames Mars General Circulation Model (GCM) interactively coupled with an aerosol transport/
micorphysical model. The model generates an annual dust cycle similar to that observed. Various
feedbacks are present in the atmosphere / surface system which enter into the generation of the
cycle. Several locations are primary surface sources of dust, while much of the remaining planet's
surface acts a sink for suspended dust.
METHOD
Our efforts began by incorporating into our coupled model system a self consistent determination
of the rate of surface dust lifting based upon the GCM calculated atmospher-surface momentum
transfer (accounted for in the surface stress term). The relationship between surface stress and the
flux of dust (mass per area per time) from the surface into the atmosphere is based upon
empirically derived values under terrestrial conditions which have been used in terrestrial numerical
modelling (Westphal et al., 1987). We explored the parameter space surrounding our prescription
for the functionality of the lifting rate, as well as the threshold stress value (0.0225 N m -2) below
which no dust lifting occurs. (This threshold stress value chosen approximately corresponds to
wind speeds of 40 m s 1 at the model grid-point nearest to the surface.) These sensitivity studies
indicated that our choices were valid, with neither excessive nor minimal dust lifting being a
constant product of the model. Rather, varying the initial conditions (with or without preexisting

suspendeddust,with or without topography)resultedin a rangeof resultingquantitiesof lifteddust.
Havingdemonstratedthestability of themodel,weproceededto carryouta numberof annualandmulti-annualsimulations.Thesesimulationshadastheir initial conditiontheGCM stateafter
running 1.25yearswith a fixed dustloadof opticaldepth0.3 overthe globe. Northernsummer
waschosenastheinitial pointsinceit hashistoricallybeentheleastdustytimeof theyear,andwedesiredthemodelto havedevelopedits own self consistentstate(to havebecomeindependentof
theinitial conditions)prior to entranceinto the'duststormseason',which beginsin earlynorthernautumn.
RESULTS
Ournominalsimulation,which extendedthroughtwo martian years,producedan annualdust
cycle similar to that inferred from observations. Two maxima of atmosphericdust loadingoccurredduruing northernautumnand winter (Figure 1). The first maximum, at Ls - 215,
coincidedin time with thefirst global duststorm observedby the Viking landersand orbiters
duringthefirst Viking year(July 1976- May 1978). [Ls is a seasonalindicatorfor Mars: Ls=0
correspondsto northernhemisphere(NH) springequinox,Ls=90to NH summersolstice,Ls=180to NH autumnequinox,andLs=270to NH wintersolsticel. Theprimarymodelsourceregionfor
the dust of this eventwas the northernand easternslopesof the Tharsisuplandsat northern
subtropicallatitudes,to thewestof theViking lander1site. Observationsindicatethat thefirst
Viking year1duststormhadits genesisregionat southernsubtropicallatitudessouthandeastofTharsis.Thesecondmodelledmaximum,atLs ~ 270,coincidedseasonallywith thesecond,more
intenseglobalduststormobservedby Viking in 1977. This secondmodelledmaximumhadits
primary dust sourceregion on the northern slopesof the Hellas impact basin at southernsubtropicallatitudes.This topographicfeaturehasbeenhistoricallynotedasadusty locale,and in
fact severalglobalduststormsarethoughtto haveoriginatedthere. Thesecond1977duststormwasinferredfrom orbitalimagingto havestartedin thesamelocationasthefirst observedstorm,southandeastof Tharsis.
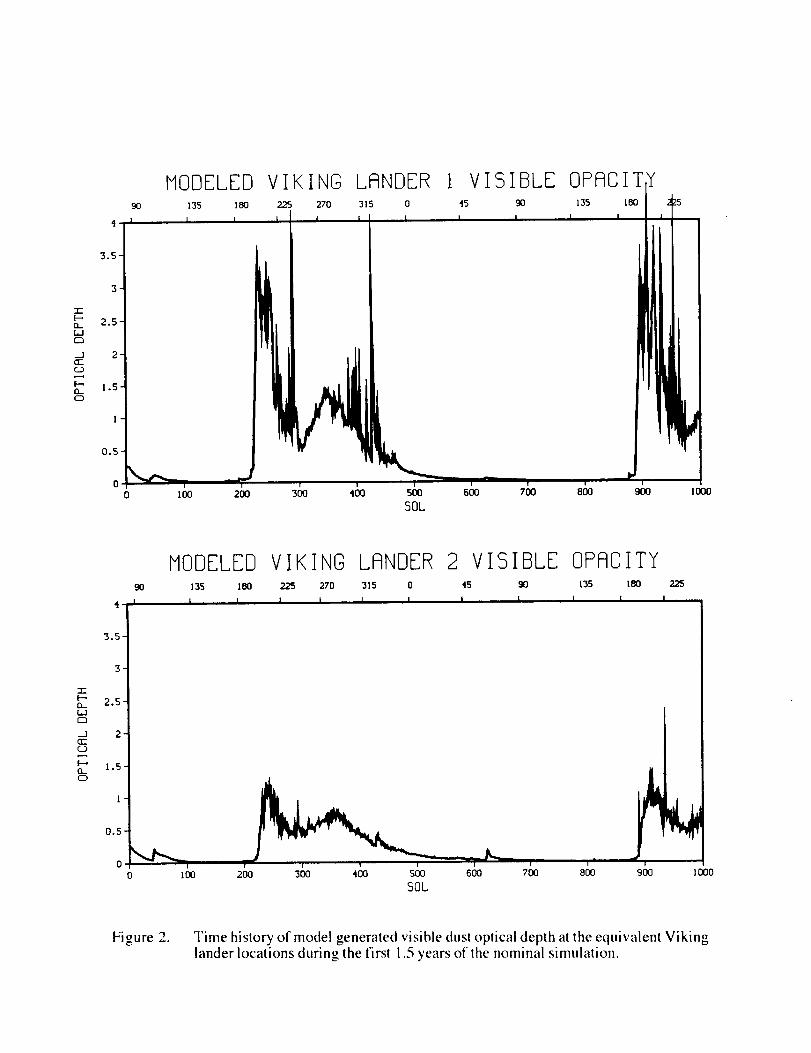
Followingthesecondmodelledatmosphericdustmaximum,theatmosphericdustloaddeclined
to nearlyzerobyearlynorthernspring(Ls=30) (Figure 1). Themodelleddustopticaldepthnear
the two landersite locations followed this samepattern (Figure 2). This retreat to a clear
atmosphereis at oddswith observations,which indicatedduringthe Viking missiontime period
thatduringnorthernsummertherewasa'background'opticaldepthof 0.2-0.4attheViking landersites(Figure3). SubsequentEarth-basedobservationshavesuggestedthat, at the present,the

aphelionseason(~ Ls=70)might in fact be lessdusty than wasseenby Viking (Clancy et al.,1995)
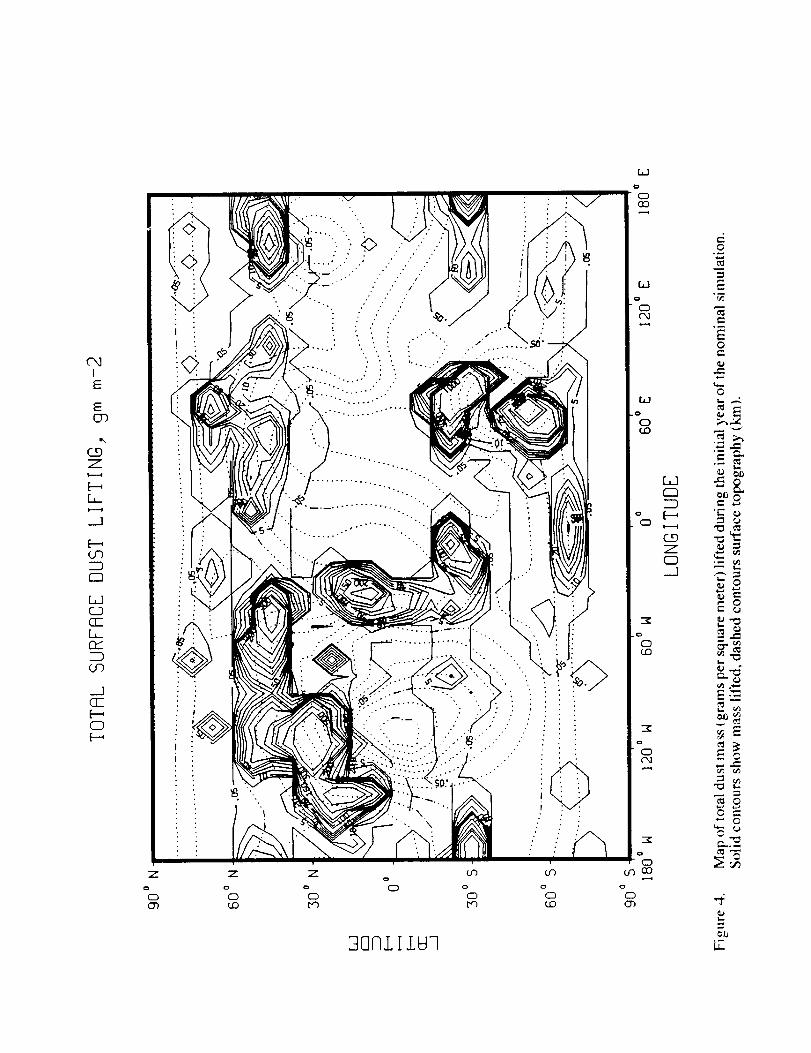
Over the courseof the simulatedannual dust cycle, more dust was lifted in the northern
hemispherethan in the southernhemisphere(Figure 4). This contrastswith the inferred
hemispheric lifting distribution, since all the observedglobal storms have had a southern
hemisphereorigin. In thenorthernhemisphere,activedynamicalprocessesinvolvedin dustliftingincludeeastwardtravellingbaroclinicwaves(cold andwarmfrontal systems)at middle latitudes
duringautumn,winter, andspring. Additionally, windsdown the north slopeof Tharsisare a
majorsourcemechanism,especiallyduringearlyautumn.At equatoriallatitudes,themostactivesourceregionwas in the lowlandseastof Tharsis. This
location is thesiteof thecross-equatoriallow level jet / western boundary current discussed by
Joshi et al. 11995,19961 and was most active during the second lifting maximum as the Hadley cell
accelerated due to the thermal drive provided by the suspended dust.
In the southern hemisphere, the predominant dust lifting sites were the northern and southern
flanks of the Hellas basin. These sites were active only from late northern summer through late
northern winter. Two additional sites, cenetred near 30S - 20W and 30S - 180W, were active
source regions during the second lifting maximum only. These locations coincide with zones of
enhanced low-level westerly jets resulting from the eatsward Coriolis turning of the strong
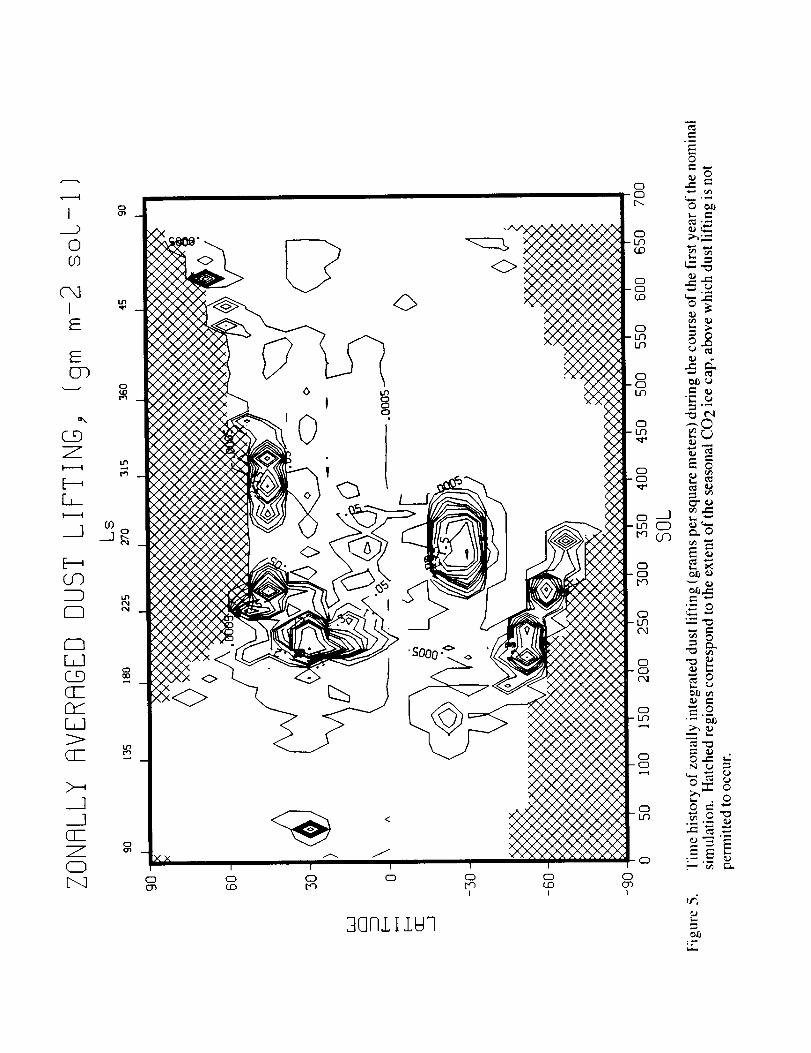
longitudinally confined cross-equatorial flow as discuseed by Joshi et al. | 1996]. At high southern
latitudes, dust lifting extends poleward as the seasonal CO2 cap retreats during southern spring,
but this lifting is confined to the southern extent of Hellas and to longitudes extending only ninety
degrees west from Hellas. Orbiter observations do indicate that the region near the retreating edge
of the south seasonal polar cap does experience dust lifting, as the model suggests. The model
also indicates a similar poleward expansion of northern hemisphere lifting in apparent conjunction
with the retreat of the seasonal cap (Figure 5). Orbiter observations at this location and time are not
suggestive of lifting then, the north cap generally shrouded by water ice clouds during this time
period.
Continuation of this simulation through a second martian year resulted in a dust cycle for year
two which differed very little from that of the first year.
To determine the nature of any feedbacks playing a role in producing the modelled dust cycle, a
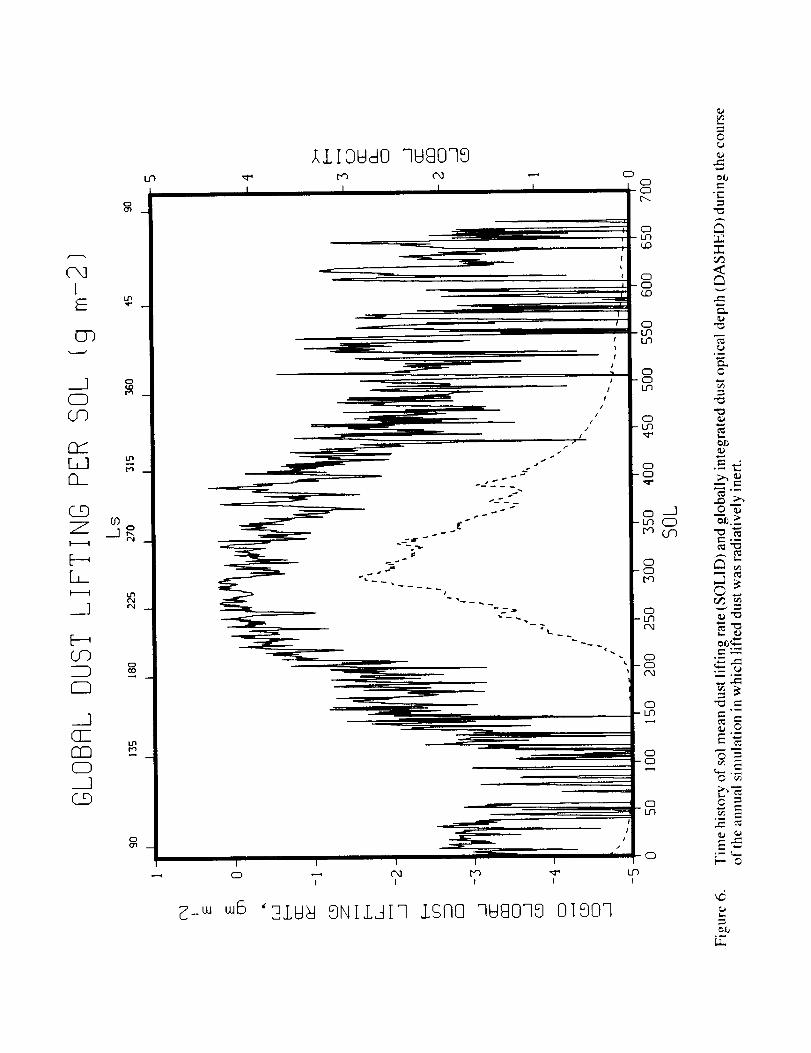
sereis of additional experiemnts was carded out. In one such experiment, the dust lifted into the
atmosphere was radiatively inert (i.e., did not absorb solar radiation nor emit or absorb infrared
radiation). In this case (Figure 6), substantial dust lifting commenced at the same season as in the
nominal, radiatively active dust simulation. However, this inert dust simulation produced only a
single dust lifting maximum, centered in time between the two maxima in the nominal experiment.
The total quantity of dust lifted in this 'clear atmosphere' case actually exceeded that from the

nominal simulation by a factor of two. Most of the dust lifting occurred at northern middle
latitudes during northern autumn, winter, and spring. The retreating cap edges played a more
important role, in both hemispheres, in generating dust lifting than was the case in the nominal
experiment. This is most likely due to the greater thermal contrast between the air above the cold
ice covered ground and neighboring bare ground, this difference being reduced when radiatively
active dust is present. This experiment, when compared to the nominal case, indicates that
suspended dust during early northern autumn apparently has a negative feedback upon continued
dust lifting into late autumn. The pattern of lifting indicates both positive and negative feedbacks
on a local scale. Hellas lifting is greatly reduced for clear conditions, while northern middle
latitude (baroclinic wave) lifting is enhanced.
Several other annual simulations indicate some dependence of the annual cycle upon the
availibility ofliftable dust, but without having explicitly incorporated a finite amount of dust, and
an initial spatial distribution, the results from these experiements are not quantitatively illuminating.
One simulation indicates that the surface atmospheric density variation engendered by the
atmospheric mass cycle, whereby twenty percent of the atmospheric (CO2) mass is condenses
upon and subsequently sublimes from the seasonal polar ice caps, does not under present
conditions play an important role in the current dust cycle. The horizontal mass flow to and from
the condensing/subliming caps may, however, be important.
The one major failing of our model was its inability to retain a background dust 'haze' during
northern late spring and summer. We have attempted to account for this by including in the model
an additional source mechanism: dust devils. Viking orbiter imaging and lander metorology data
indicate the presence on Mars of small (< 2 km diameter) vortices which contain moderate
quantities of suspended dust. These were seen from orbit to be common occurrences on northern
hemisphere plains during summer afternoons [Thomas and Gierasch, 1985]. The lander data
indicated the occurrence of vortices during all seasons [Ryan and Lucich, 19"¢,3], but these features
did not necessarily have suspended dust associated with them. Using the statistical occurrence of
such featrures in orbiter imaging, and estimates of the dust contained within them, we have
included a 'dust devil' dust lifting mechanism in our model which adds dust for only two hours per
sol (IPM to 3PM) at those latitudes within 15 degrees of the subsolar latitude. Inclusion of this
small additional, seasonally moving source produces optical depths at the model grid points
corresponding to the Viking lander sites which compare very well with observed optical depth
values during northern summer. Atmospheric temperatures also compare more favorably to middle
atmospheric temperatures obtained from orbiter data.

CONCLUSIONS
Wehavedevelopedanatmosphericdynamical/aerosolmodelof themartianatmospherewhich is
capable,with only moderatetuning,of qualitativley andquantitativelyreproducingthemartian
annualdustcycleasinferredfrom dataobtainedby theViking orbiters/landersmission. Observed
preferreddus _ourcelocations(Hellas basin, retreatingcap edge)are preferreddust sourcelocationsin themodel.Theoccurrenceof two lifting maximaduringnorthernautumn/winterarise
dueto anegativefeedbackbetweensuspendeddustduringearlynorthernautumnandtheability to
sustain,or increase,the lifting rate into late autumn. It is only when the early autumn dust
maximum hasdeclined(to a global optical depth of --0.8) that lifting can increaseagain and
producethesecondmaximumnearthetime of northernwinter solstice. The seasonalcycle of
CO2, as it affects surfacepressureand thus surfacedensity, is not an important factor in
determiningthepresentmartiandustcycle.
A paper describing this work is in final preparation, and will be submitted to either the Journal of
Geophysical Research or to the journal Icarus.
REFERENCES
Joshi, M. M., S.R. Lewis, P.L. Read, and D.C. Catling, 1995, Western boundary currents in
the martian atmosphere: numerical simulations and observational evidence, J. Geophys. Res., 100,
5485-5500.
Joshi, M.M., R.M. Haberle, J.R.Barnes, J.R. Murphy, and J. Schaeffer, 1996, Low level jets
in the NASA-Ames Mars GCM, submitted to J. Geophys. Res., in revision.
Ryan, J.A., and R.D. Lucich, 1983, Possible dust devils, vortices on Mars, Journ. Geophys.
Res., 88, 11005-11011.
Thomas, P., and P.J. Gierasch, 1985, Dust sevils on Mars, Science, 230, 175-177.
Westphal, D.L, O.B. Toon, and T.N. Carlson, 1987, A two-dimensional numerical
investigation of the dynamics and microphysocs of Saharan dust storms, Journ. Geophys. Res.,
92, 3027-3049.

Ck]IE
O-)
___]CD
rYr,10__
C___9ZI---I
[----,L_
___]
CO
___]tieEIO(ED
_g(__9
_$I3W80 qWS0q8O
0o
o . I
_u5 '3Ld_ 9NIL31q ISO0
i
qWSOq9
I
0IS0q
I
O
.r-
2_
O
O
e-
©
No
_.N
"_E
e_
_ bO _
E-
°_
MODELED V I K I NG LANDER 1 V I S I BLE OPtiCI TIT135 180 225 270 315 0 45 90 135 180
10130
4
3.5
MODELED VIKING LANDER 2 VISIBLE OPFICITY98 135 180 226 270 315 0 45 90 13S 180
I I I I I I I I I I I I
2.5
1
O-L,..]C_
__1 2-
C_)
E-, 1.6Cl
oI
0.5
0 I I "I I
0 I00 2(3(3 300 400 5(_3 60(] 700 800 90(3 1000
SOL
Figure 2. Time history of model generated visible dust optical depth at the equivalent Vikinglander locations during the first !.5 years of the nominal simulation.

V I K I NG LRNDER 1 V I S I BLE OPRCI T"/L S 135 180 225 270 315 0 45 90 1"35 180
4 I I I I A I I I I I I
12 !',•
oI I" .'VL1 50L
225 270
I I
1000
VIKING LFINDER 2 VISIBLE OPflCITYL S 135 180 225 270 315 0 45 90 135 180 2.25
I I I I I I I I i I I
270
I
"1-
f._
._I 2'
o
I o
/" /" o|_+t ,,"" ' ,- o• "110o • _qb
_ 01i_'<,. ".N_+,,• _ o °o •
& o _ oeDOo
VLI 50L
iooo
Figure 3. Time history of the observed visible optical depth at the the Viking lander sitesduring the initial 1.5 years of the mission.
IE
E
(_9Z
b_
0
W0OZb_n_
OZ
0
z
%
I
i
Z
%Z
%
>
% %
]ONLILW]
o°_
°_
E0
0
e_,- _._
'._
_ m
0
..f
I
0
IE
E
Z
L
_]
O0
WC_9
r_r,1>
..._.1]
CIZZ0L'---a o
(.o
.qOOLILUq
o
|
e-
E0
0
_ o_
0 o_
°_
m _
_ m
"_'_ 0
---,_
No
_ L
0 0
_"_ "_
,¢/
Cx]IE
O-)
._9EDCO
r'Y
El_
C_9ZF----H
[-_EL
__]
E-_CO
F-B
___]CEFT4CD__]C_9
L_
o
IZI
IN
O
I.n
OGI _
LU
I
ILIOUdO qUS0q9
I I I
f
r
1
t
!
t
f
I
__ I!
/
/
f]
i
f4
r _
%
I
o
uJ6
I
']ly_
Ji I
/-- I
I I I
I 1 I
ONI/Jlq LSNO qUS0qO 0190q
CDOO
LDI
OL_
(Z3O(O
ou_b0
oo
o.LF_
0-0
0
00
0
00Cx]
0bO
0
0
0
_.]0_-)
0
<m
r_o
o-_"_._
_o--
_.,.-
_E
P
.--