Gut microflora associated characteristics in children with celiac disease
Upload
independentCategory
view
0download
0
Chapter 8
The interferon gamma gene in coeliac disease:
augmented expression correlates with tissue
damage but no evidence for genetic susceptibility
MC Wapenaar, MJ van Belzen, JH Fransen, A Fariña Sarasqueta,
RHJ Houwen, JWR Meijer, CJJ Mulder, C Wijmenga
J Autoimmunity 2004; 23:183-190
(reproduced with permission from Elsevier)

Chapter 8 - IFNG in CD: gene expression and genetics
135
Chapter 8 - IFNG in CD: gene expression and genetics
135
The interferon gamma gene in celiac disease: augmentedexpression correlates with tissue damage but no evidence
for genetic susceptibility
Martin C. Wapenaara,),1, Martine J. van Belzena,b,1, Justin H. Fransena,Aranzazu Farina Sarasquetaa, Roderick H.J. Houwenb, Jos W.R. Meijerc,
Chris J.J. Mulderc,d, Cisca Wijmengaa
aDepartment of Biomedical Genetics, University Medical Center Utrecht, Utrecht, The NetherlandsbPediatric Gastroenterology, University Medical Center Utrecht, Utrecht, The Netherlands
cDepartment of Pathology, Rijnstate Hospital, Arnhem, The NetherlandsdDepartment of Gastroenterology, VU Medical Center, Amsterdam, The Netherlands
Received 21 January 2004; revised 12 May 2004; accepted 24 May 2004
Abstract
Celiac disease (CD) is a complex genetic disorder characterized by gluten intolerance. The Th1 immune response, with a key
position for interferon gamma (IFN-g), is an important determinant of intestinal remodeling in CD. We aimed at furtherascertaining the role of IFN-g, either as a genetic factor in the etiology, or as a facilitator of disease initiation/progression. Duodenalbiopsies were sampled across distinct histopathological stages of the disease, including refractory CD (RCD), and used to determineIFN-g gene (IFNG) expression by real-time RT-PCR. INFG expression correlated with the extent of tissue restructuring, reaching
a 240-fold higher expression in total villous atrophy compared to healthy tissue. CD and RCD patients with similar lesions hadcomparable expression levels. Interestingly, patients in complete remission still had 7.6-fold residual over-expression. An INFGmarker was tested in three cohorts of Dutch patients for both genetic linkage and association. Linkage analysis yielded no significant
scores for IFNG or its flanking markers. In addition, IFNG allele frequencies were not differently distributed between cases andcontrols. Likewise, all alleles were randomly transmitted to affected children in parents-case trios. There is no evidence for IFNG asa predisposing gene in CD, despite its enhanced expression in patients in complete remission.
� 2004 Elsevier Ltd. All rights reserved.
Keywords: Celiac disease; Gene expression; Genetics; Interferon gamma; Intestinal mucosa
1. Introduction
In celiac disease (CD; OMIM 212750), the ingestionof gluten provokes a combined Th1 and Th2 adaptiveimmune response [1]. The Th1 reaction is generallyconsidered responsible for the long-term tissue remodel-ing observed in the small intestine [2]. The Th2 response
is transient and results in the circulation of serumantibodies that are particularly useful in CD diagnosisand in monitoring compliance to a gluten-free diet[3,4]. The Th1 response is initiated by the binding ofgluten peptides to the HLA-DQ2 and -DQ8 moleculeson the surface of antigen presenting cells and sub-sequent recognition by CD4+ cells in the lamina pro-pria [5]. Details on how these gluten peptides cross theepithelial boundary, however, remain obscure. Epitopebinding to the DQ2 and DQ8 molecules is furtherenhanced by deamidation of gliadin by the enzymetissue-transglutaminase, yielding an increased immuneresponse [6,7].1 Both authors contributed equally.
) Corresponding author. Department of Biomedical Genetics,
Stratenum 2.106, University Medical Center Utrecht, P.O. Box
80030, 3508 TA Utrecht, The Netherlands. Tel.: +31-30-253-8790;
fax: +31-30-253-8479.
E-mail address: [email protected] (M.C. Wapenaar).
Journal of Autoimmunity 23 (2004) 183e190
www.elsevier.com/locate/issn/08968411
0896-8411/$ - see front matter � 2004 Elsevier Ltd. All rights reserved.doi:10.1016/j.jaut.2004.05.004
Section IV - Candidate gene and gene family studies
136
Chapter 8 - IFNG in CD: gene expression and genetics
137
The cytokine interferon gamma (IFN-g) playsa pivotal role in the subsequent T cell activation andconcomitant tissue restructuring. In patients, the level ofIFN-g gene (IFNG) expression as well as the number ofIFN-g producing cells are increased, as observed forboth the intestinal mucosa [8e11], and peripheral bloodlymphocytes [10,12]. The in vitro gluten challenge ofbiopsies from CD patients in complete remission ona gluten-free diet (GFD) yielded IFNG mRNA levelscomparable to that of untreated patients [9]. Organcultures of duodenal biopsies from normal controlsproduced damaged enterocytes when exposed to purifiedINF-g or culture supernatants from gluten-activated Tcell clones. This toxic effect of the supernatants could beblocked by pre-incubation with anti-INF-g antibodies[13]. In active CD there is a marked shift of the INFGexpression from the lamina propria towards theepithelium, which may further impair the integrity ofthe epithelial boundary [11,14]. Moreover, villousepithelial damage in mice can be induced in vivo byinjection of INF-g [15]. Taking into account the crucialposition of INF-g in the Th1 pathway, it is plausiblethat certain polymorphisms of the INFG gene may leadto altered expression levels, and thus confer susceptibil-ity for developing CD. Indeed, it was reported that anelevated level of in vitro IFN-g production wasassociated with a specific allelic variant of the IFNGgene [16]. Celiac disease is a complex genetic disorder inwhich the major contributing genesdHLA-DQ [17] anda recently identified locus on 19p13 in the Dutchpopulation [18]dattribute an estimated 60% of thetotal genetic risk. This implies that there must be otherpredisposing genes, although each of them will haveonly a limited effect. Considering its involvement inceliac disease, IFNG might be among those candidategenes that have not been identified yet.In this report we followed IFNG expression in
duodenal biopsies during successive stages of tissueremodeling in CD. To the best of our knowledge, this isthe first study that correlates the level of IFNGexpression with the extent of mucosal damage. We alsotested our hypothesis that IFNG is a candidate gene byperforming linkage and association studies in Dutchceliac disease patients.
2. Material and methods
2.1. Patient material for expression analysis
Patients visited the Rijnstate Hospital, Arnhem,which is a recognized center of expertise on celiacdisease. They came either for a first-time examination(n=7), or for a follow-up to monitor their response toa gluten-free diet (n=21). Over a period of two years,29 duodenal biopsies were sampled from 28 patients
using forceps-spike endoscopy (Table 1). All biopsieswere examined by the same pathologist (JWRM) andclassified according to Marsh [2], using the UEGWcriteria [19]. In parallel to the biopsies that were takenfor histological analysis, two additional biopsies weresampled during the same session and snap-frozen inliquid nitrogen for expression analysis. The pathologyreport that was based on multiple biopsy samples wasalso considered representative for the biopsies used forthe expression assays. Most patients were adults andthey had an average age of 47 years. Five females(average age 48 years) with normal histology (M0), whohad no history of CD, were used as controls. Sevenpatients were referred as new cases and had not startedtreatment. The 21 patients, who had been previouslydiagnosed with CD and initially presented with a MIIIlesion, were all on a gluten-free diet (GFD). All patientswho were on a GFD were negative for EmA antibodies,while patients not yet treated were EmA positive. Thefollow-up biopsies of the CD patients showed variouslevels of improvement from MIeMII up to completeremission (M0). A group of ten patients failed to recoverdespite strict adherence to a GFD. After exclusion of allfactors that may cause a celiac-like phenotype, thesepatients were diagnosed as having refractory celiacdisease (RCD) [20]. This latter group was subdividedinto those with normal T cells (type I) and those withaberrant T cells (type II) [19,20]. All patients whovolunteered for this study signed an informed consent.The study was approved by the Medical EthicsCommittee (METC) of the University Medical CenterUtrecht.
2.2. RNA isolation
Total RNA was isolated from two pooled snap-frozen biopsies (10e15 mg) in 500 ml TRIzol using themanufacturer’s instructions (Gibco/Life Technologies,Rockville, MD). The biopsies were homogenized in thepresence of TRIzol with 1 mm diameter glass beads byusing a Mini-BeadBeater (BioSpec Products, Inc,Bartlesville, OK). We assessed the integrity and quantityof the RNA samples with Lab-on-a-Chip technology onan Agilent 2100 Bioanalyzer (Agilent Technologies, PaloAlto, CA). Biopsies yielded on average 3.6 mg of totalRNA/mg of tissue.
2.3. Real-time reverse transcription PCR
Relative quantification of the IFNG gene transcrip-tion in biopsies was determined by real-time RT-PCR.All reagents and analytical equipment used for thisassay were purchased from Applied Biosystems (FosterCity, CA) and used according to their recommenda-tions. cDNA was synthesized from 1 mg total RNA ina 50 ml volume using the High Capacity Archive Kit on
Section IV - Candidate gene and gene family studies
136
Chapter 8 - IFNG in CD: gene expression and genetics
137
a GeneAmp PCR System 9700. IFNG transcripts weredetected with Assay-on-Demand Hs00174143m1, whichconsists of a fluorescent Taqman probe specific for exon2 and two flanking, exoneintron boundary-spanningprimers (sequences are proprietary information held bythe supplier). PCR cycling was performed on a 7900HTSequence Detection System using 30 ng of reversetranscribed total RNA in 25 ml Universal PCR MasterMix. All samples were tested in triplicate. Transcripts ofthe housekeeping gene GUSB (detected by PDAR4326320E) were used as an endogenous reference tocorrect for unwanted variability in total cDNA inputbetween samples. Real-time amplification plots from theIFNG and GUSB transcripts were then used to extractCt-values using SDS2.0 software. The 2�DDCt method[21] was applied for the conversion to relative expressionlevels by using the average DCt-value from the fivenormal controls as a calibrator.
2.4. Patients in this genetic study
Dutch Caucasian CD patients were collectedthroughout the Netherlands. The linkage study wasperformed on 84 affected sibpairs derived from 67families. Details on the families in this cohort have beendescribed elsewhere [18]. Genetic studies of the IFNGgene were performed on three cohorts. The first cohortconsisted of 207 independent CD cases and 210independent controls. The cases and controls both hada mean age of 39 years and a male-to-female ratio of35:65. The second cohort comprised 122 parents-casetrios and the patients in this cohort had a mean age of 17years and also a gender ratio of 35:65. The third cohortwas the same affected sibpair cohort as used in thelinkage analysis. To ensure that all patients met thesame strict clinical criteria, the histology on theirbiopsies was re-examined by the same pathologist
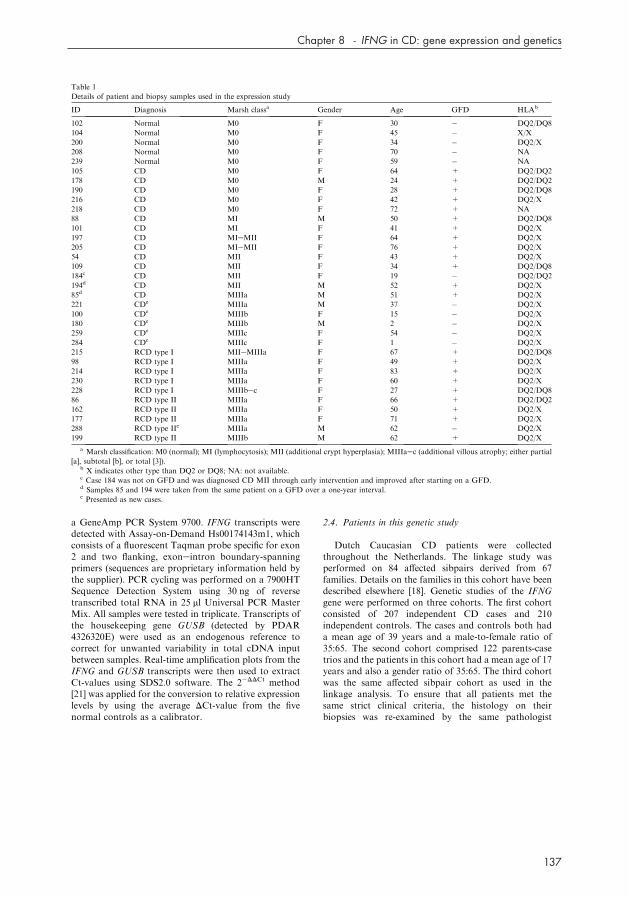
Table 1
Details of patient and biopsy samples used in the expression study
ID Diagnosis Marsh classa Gender Age GFD HLAb
102 Normal M0 F 30 � DQ2/DQ8
104 Normal M0 F 45 � X/X
200 Normal M0 F 34 � DQ2/X
208 Normal M0 F 70 � NA
239 Normal M0 F 59 � NA
105 CD M0 F 64 + DQ2/DQ2
178 CD M0 M 24 + DQ2/DQ2
190 CD M0 F 28 + DQ2/DQ8
216 CD M0 F 42 + DQ2/X
218 CD M0 F 72 + NA
88 CD MI M 50 + DQ2/DQ8
101 CD MI F 41 + DQ2/X
197 CD MIeMII F 64 + DQ2/X
205 CD MIeMII F 76 + DQ2/X
54 CD MII F 43 + DQ2/X
109 CD MII F 34 + DQ2/DQ8
184c CD MII F 19 � DQ2/DQ2
194d CD MII M 52 + DQ2/X
85d CD MIIIa M 51 + DQ2/X
221 CDe MIIIa M 37 � DQ2/X
100 CDe MIIIb F 15 � DQ2/X
180 CDe MIIIb M 2 � DQ2/X
259 CDe MIIIc F 54 � DQ2/X
284 CDe MIIIc F 1 � DQ2/X
215 RCD type I MIIeMIIIa F 67 + DQ2/DQ8
98 RCD type I MIIIa F 49 + DQ2/X
214 RCD type I MIIIa F 83 + DQ2/X
230 RCD type I MIIIa F 60 + DQ2/X
228 RCD type I MIIIbec F 27 + DQ2/DQ8
86 RCD type II MIIIa F 66 + DQ2/DQ2
162 RCD type II MIIIa F 50 + DQ2/X
177 RCD type II MIIIa F 71 + DQ2/X
288 RCD type IIe MIIIa M 62 � DQ2/X
199 RCD type II MIIIb M 62 + DQ2/X
a Marsh classification: M0 (normal); MI (lymphocytosis); MII (additional crypt hyperplasia); MIIIaec (additional villous atrophy; either partial
[a], subtotal [b], or total [3]).b X indicates other type than DQ2 or DQ8; NA: not available.c Case 184 was not on GFD and was diagnosed CD MII through early intervention and improved after starting on a GFD.d Samples 85 and 194 were taken from the same patient on a GFD over a one-year interval.e Presented as new cases.
Section IV - Candidate gene and gene family studies
138
Chapter 8 - IFNG in CD: gene expression and genetics
139
(JWRM). Only patients and affected siblings whomet the MIII criteria [2] were included in our study.Blood samples were collected and DNA was isolatedaccording to standard laboratory procedures [18]. Awritten informed consent was obtained from allparticipating patients and family members. The METCof the University Medical Center Utrecht approvedthis study.
2.5. The IFNG marker with flanking region
PCR fragments containing the CA-repeat polymor-phism in the first intron of the IFNG gene were obtainedin a reaction volume of 10 ml containing 25 ng of DNA,0.2 mM dNTPs, 2.5 mM MgCl2, 50 ng of forwardprimer 5#-TTA TTC TTA CAA CAC AAA ATCAAA TC-3#, 50 ng of reverse, fluorescence-labeledprimer 5#-ATA CAA AAA CAA AAA ACA GCAAAG C-3# and 0.4 U AmpliTaq Gold. The PCRproducts of 190e200 bp were separated on a 3700DNA sequencer and analyzed by Genescan 3.5 andGenotyper 2.0 software. Reagents, sequence detector,and software were from Applied Biosystems (FosterCity, CA). The nomenclature of the alleles is adoptedfrom Pravica et al. [16]; alleles 1e5 correspond to 11e15CA-repeats, respectively. In our sample, allele 1 was notpresent, and alleles 6 and 7 (16 and 17 CA-repeats,respectively) had frequencies below 0.5% and weretherefore not included in the analysis. In addition, thefollowing five IFNG flanking markers on 12q15 andspanning w27 cM were analyzed in the genetic study:D12S398, D12S1294, D12S375, D12S1052, D12S1064.All genotypes were checked independently by tworesearchers.
2.6. Genetic linkage analysis of the IFNG gene region
The IFNG CA-repeat and the five flanking markerswere tested for linkage to celiac disease by non-parametric linkage analysis. The analysis was performedusing the MAPMAKER/SIBS program [22], both singleand multipoint analyses were carried out. Markerpositions and order were based on the Marshfield andEnsembl genetic maps (http://research.marshfieldclinic.org/genetics/; http://www.ensembl.org). Allele frequen-cies were calculated from the entire dataset as describedpreviously [18].
2.7. Genetic association studies of the IFNG gene
Association analysis of the IFNG gene was per-formed on three cohorts. In the first cohort allele andgenotype frequencies were compared between cases andcontrols and P-values were obtained by c2 analysis. Thesecond (trios) and third cohorts (sibpairs) were sub-jected to transmission/disequilibrium tests (TDT).
Alleles transmitted and not-transmitted to affectedoffspring in the parent-case trios were compared usinga c2 test with 1 degree of freedom. In addition, the twomarkers flanking IFNG, D12S1294 and D12S375, werealso subjected to TDT analysis in the second and thirdcohorts.
3. Results
3.1. IFNG transcription profiling
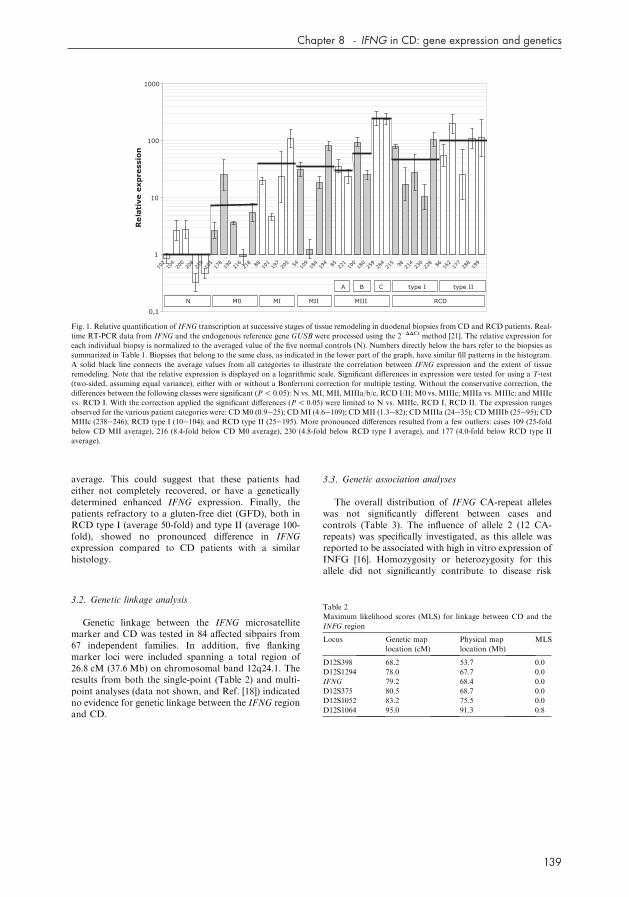
Information on the patients and controls used in thisIFNG expression study is summarized in Table 1. Theresults of the INFG-transcript quantification by real-time RT-PCR on the duodenal biopsies are presented inFig. 1. The relative expression in all individual biopsieswas obtained after normalization against the averagevalue of the five normal controls. Also indicated is thetrend line connecting the average expression of eachpatient’s category. All the patients’ categories, with theexception of the CD M0 group (P=0.07), had averageexpression levels that were significantly elevated com-pared to the average value for the normal controls(P! 0.05). Two features of the IFNG expression pro-filing stand out. First, there is considerable expressionvariability among samples within the same category, andsecond, superimposed on this variability there is a re-markable difference between the averages of eachcategory. This observed increase of the average IFNGtranscription correlates well with the extent of tissueremodeling in the duodenum. The variability among thesamples was not confined to just the patients but wasalso observed in the normal control group. Thesecontrol biopsies varied in IFNG transcription from0.3-fold (case 208) to 2.8-fold (case 200) the averagevalue in this class, indicating a maximum 9.3-folddifference in expression between these two extremes. Asimilar pattern was observed in the patient samples, be itwith some more pronounced differences that could beattributed to just a few patients (e.g. cases 109 and 216).In general, individual biopsy samples varied in IFNGtranscription within a range of two- to three-fold aboveor below the average expression value of their category.Despite this inter-individual variability, the averageIFNG expression of the various patient categoriesappeared to reflect the extent of the tissue lesion. Partialvillous atrophy (CD MIIIa) shows an average 30-foldover-expression that increases to 60-fold in sub-total(CD MIIIb), and to a 240-fold up-regulation in thetransition to complete atrophy of the villi (CD MIIIc).In the CD MII and MI classes this value fluctuatesbetween 35- and 40-fold, similar to that in CD MIIIa.Interestingly, although the CD-remission patients hada histology indistinguishable from the normal controlsthey still produced 7.6-fold more IFNG transcripts on
Section IV - Candidate gene and gene family studies
138
Chapter 8 - IFNG in CD: gene expression and genetics
139
average. This could suggest that these patients hadeither not completely recovered, or have a geneticallydetermined enhanced IFNG expression. Finally, thepatients refractory to a gluten-free diet (GFD), both inRCD type I (average 50-fold) and type II (average 100-fold), showed no pronounced difference in IFNGexpression compared to CD patients with a similarhistology.
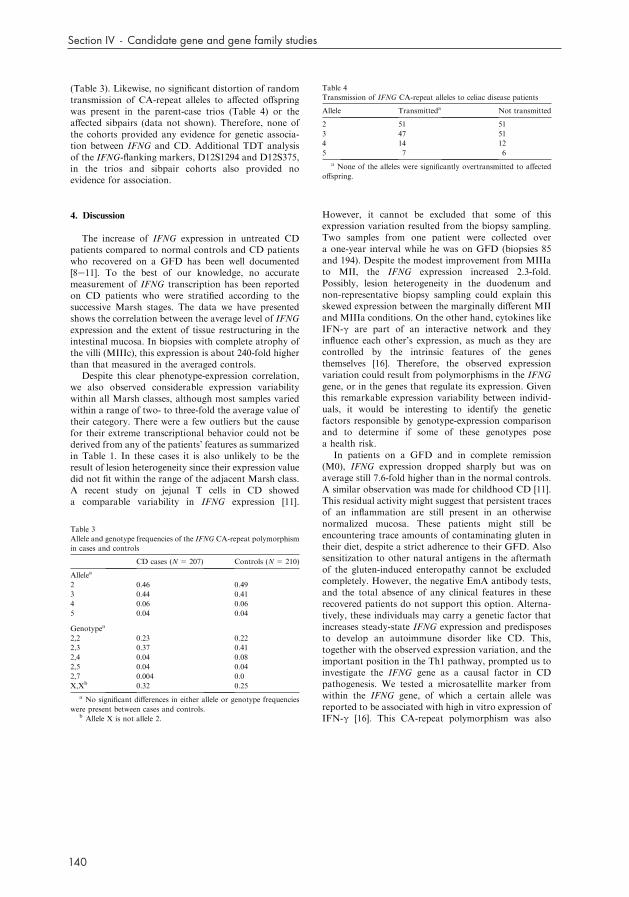
3.2. Genetic linkage analysis
Genetic linkage between the IFNG microsatellitemarker and CD was tested in 84 affected sibpairs from67 independent families. In addition, five flankingmarker loci were included spanning a total region of26.8 cM (37.6 Mb) on chromosomal band 12q24.1. Theresults from both the single-point (Table 2) and multi-point analyses (data not shown, and Ref. [18]) indicatedno evidence for genetic linkage between the IFNG regionand CD.
3.3. Genetic association analyses
The overall distribution of IFNG CA-repeat alleleswas not significantly different between cases andcontrols (Table 3). The influence of allele 2 (12 CA-repeats) was specifically investigated, as this allele wasreported to be associated with high in vitro expression ofINFG [16]. Homozygosity or heterozygosity for thisallele did not significantly contribute to disease risk
Fig. 1. Relative quantification of IFNG transcription at successive stages of tissue remodeling in duodenal biopsies from CD and RCD patients. Real-
time RT-PCR data from IFNG and the endogenous reference gene GUSB were processed using the 2�DDCt method [21]. The relative expression for
each individual biopsy is normalized to the averaged value of the five normal controls (N). Numbers directly below the bars refer to the biopsies as
summarized in Table 1. Biopsies that belong to the same class, as indicated in the lower part of the graph, have similar fill patterns in the histogram.
A solid black line connects the average values from all categories to illustrate the correlation between IFNG expression and the extent of tissue
remodeling. Note that the relative expression is displayed on a logarithmic scale. Significant differences in expression were tested for using a T-test
(two-sided, assuming equal variance), either with or without a Bonferroni correction for multiple testing. Without the conservative correction, the
differences between the following classes were significant (P! 0.05): N vs. MI, MII, MIIIa/b/c, RCD I/II; M0 vs. MIIIc; MIIIa vs. MIIIc; and MIIIc
vs. RCD I. With the correction applied the significant differences (P! 0.05) were limited to N vs. MIIIc, RCD I, RCD II. The expression ranges
observed for the various patient categories were: CDM0 (0.9e25); CDMI (4.6e109); CDMII (1.3e82); CDMIIIa (24e35); CDMIIIb (25e95); CD
MIIIc (238e246); RCD type I (10e104); and RCD type II (25e195). More pronounced differences resulted from a few outliers: cases 109 (25-fold
below CD MII average), 216 (8.4-fold below CD M0 average), 230 (4.8-fold below RCD type I average), and 177 (4.0-fold below RCD type II
average).
Table 2
Maximum likelihood scores (MLS) for linkage between CD and the
INFG region
Locus Genetic map
location (cM)
Physical map
location (Mb)
MLS
D12S398 68.2 53.7 0.0
D12S1294 78.0 67.7 0.0
IFNG 79.2 68.4 0.0
D12S375 80.5 68.7 0.0
D12S1052 83.2 75.5 0.0
D12S1064 95.0 91.3 0.8
Section IV - Candidate gene and gene family studies
140
Chapter 8 - IFNG in CD: gene expression and genetics
141
(Table 3). Likewise, no significant distortion of randomtransmission of CA-repeat alleles to affected offspringwas present in the parent-case trios (Table 4) or theaffected sibpairs (data not shown). Therefore, none ofthe cohorts provided any evidence for genetic associa-tion between IFNG and CD. Additional TDT analysisof the IFNG-flanking markers, D12S1294 and D12S375,in the trios and sibpair cohorts also provided noevidence for association.
4. Discussion
The increase of IFNG expression in untreated CDpatients compared to normal controls and CD patientswho recovered on a GFD has been well documented[8e11]. To the best of our knowledge, no accuratemeasurement of IFNG transcription has been reportedon CD patients who were stratified according to thesuccessive Marsh stages. The data we have presentedshows the correlation between the average level of IFNGexpression and the extent of tissue restructuring in theintestinal mucosa. In biopsies with complete atrophy ofthe villi (MIIIc), this expression is about 240-fold higherthan that measured in the averaged controls.Despite this clear phenotype-expression correlation,
we also observed considerable expression variabilitywithin all Marsh classes, although most samples variedwithin a range of two- to three-fold the average value oftheir category. There were a few outliers but the causefor their extreme transcriptional behavior could not bederived from any of the patients’ features as summarizedin Table 1. In these cases it is also unlikely to be theresult of lesion heterogeneity since their expression valuedid not fit within the range of the adjacent Marsh class.A recent study on jejunal T cells in CD showeda comparable variability in IFNG expression [11].
However, it cannot be excluded that some of thisexpression variation resulted from the biopsy sampling.Two samples from one patient were collected overa one-year interval while he was on GFD (biopsies 85and 194). Despite the modest improvement from MIIIato MII, the IFNG expression increased 2.3-fold.Possibly, lesion heterogeneity in the duodenum andnon-representative biopsy sampling could explain thisskewed expression between the marginally different MIIand MIIIa conditions. On the other hand, cytokines likeIFN-g are part of an interactive network and theyinfluence each other’s expression, as much as they arecontrolled by the intrinsic features of the genesthemselves [16]. Therefore, the observed expressionvariation could result from polymorphisms in the IFNGgene, or in the genes that regulate its expression. Giventhis remarkable expression variability between individ-uals, it would be interesting to identify the geneticfactors responsible by genotype-expression comparisonand to determine if some of these genotypes posea health risk.In patients on a GFD and in complete remission
(M0), IFNG expression dropped sharply but was onaverage still 7.6-fold higher than in the normal controls.A similar observation was made for childhood CD [11].This residual activity might suggest that persistent tracesof an inflammation are still present in an otherwisenormalized mucosa. These patients might still beencountering trace amounts of contaminating gluten intheir diet, despite a strict adherence to their GFD. Alsosensitization to other natural antigens in the aftermathof the gluten-induced enteropathy cannot be excludedcompletely. However, the negative EmA antibody tests,and the total absence of any clinical features in theserecovered patients do not support this option. Alterna-tively, these individuals may carry a genetic factor thatincreases steady-state IFNG expression and predisposesto develop an autoimmune disorder like CD. This,together with the observed expression variation, and theimportant position in the Th1 pathway, prompted us toinvestigate the IFNG gene as a causal factor in CDpathogenesis. We tested a microsatellite marker fromwithin the IFNG gene, of which a certain allele wasreported to be associated with high in vitro expression ofIFN-g [16]. This CA-repeat polymorphism was also
Table 3
Allele and genotype frequencies of the IFNG CA-repeat polymorphism
in cases and controls
CD cases (N= 207) Controls (N= 210)
Allelea
2 0.46 0.49
3 0.44 0.41
4 0.06 0.06
5 0.04 0.04
Genotypea
2,2 0.23 0.22
2,3 0.37 0.41
2,4 0.04 0.08
2,5 0.04 0.04
2,7 0.004 0.0
X,Xb 0.32 0.25
a No significant differences in either allele or genotype frequencies
were present between cases and controls.b Allele X is not allele 2.
Table 4
Transmission of IFNG CA-repeat alleles to celiac disease patients
Allele Transmitteda Not transmitted
2 51 51
3 47 51
4 14 12
5 7 6
a None of the alleles were significantly overtransmitted to affected
offspring.
Section IV - Candidate gene and gene family studies
140
Chapter 8 - IFNG in CD: gene expression and genetics
141
reported to be associated with several autoimmunedisorders such as type 1 diabetes mellitus [23,24],rheumatoid arthritis [25], and multiple sclerosis [26,27].However, neither our sibpair analysis nor the threeassociation studies provided any evidence that IFNG isa predisposing gene for CD. It is unlikely that IFNGmakes a strong contribution to CD in other populationssince no evidence for linkage to the 12q15 region wasfound in any of the other genome-wide screensperformed so far (reviewed by Van Belzen et al. [18]).Nevertheless, we cannot exclude the possibility thatenhanced IFNG transcription in treated celiac diseasepatients results from a polymorphic gene that regulatesthe expression of IFNG. Possible candidates like IL12Band IRF-1, however, failed to show association with CDin the Dutch population [28].When we compared IFNG expression between RCD
and CD patients with similar lesions, we found noobvious differences. This suggests that the level of IFNGtranscription reflects the extent of tissue remodelingregardless of any molecular changes that drive thetransition to the refractory condition. However, the two-fold average increase associated with the switch fromRCD type I to type II shown in Fig. 1 might beprovoked by the presence of the cryptic T-cell lympho-ma in the latter [29].We have demonstrated that the extent of mucosal
remodeling in CD is correlated with an enhanced level ofIFNG transcription that shows considerable fluctuationbetween individuals. Despite its crucial role in the Th1pathway, and the increased expression in recoveredpatients, there is no evidence that the IFNG gene itselfconfers susceptibility for developing CD. Based on theresults from our genome-wide expression study, werecently proposed a model that explains the pathologyof CD by an increased proliferation-without-differenti-ation [30]. In this model the elevated IFNG expressioncould induce or sustain the undifferentiated but highlyproliferative condition of the celiac mucosa, rather thancausing tissue damage by apoptosis and necrosis.
Acknowledgements
We wish to thank the celiac disease patients and theirfamilies for participating in this study. Results of theHLA-typing were kindly provided by Dr. B. Crusius(Laboratory of Immunogenetics, VU Medical Center,Amsterdam). Alfons Bardoel and Ineke Lavrijsenassisted in genotype ascertainment, and Lude Frankein the statistical analysis of the expression data(members of Department of Biomedical Genetics,UMC Utrecht). We thank Dr. F. Koning for criticallyreading this report and are indebted to Jackie Senior forediting the manuscript. This study was supported by
grants WS 00-13 and WS 97-44 from the DutchDigestive Diseases Foundation (MLDS).
References
[1] Schuppan D. Current concepts of celiac disease pathogenesis.
Gastroenterology 2000;119:234e42.
[2] Marsh MN. Gluten, major histocompatibility complex, and the
small intestine. A molecular and immunobiologic approach to the
spectrum of gluten sensitivity (‘celiac sprue’). Gastroenterology
1992;102:330e54.
[3] Fasano A, Catassi C. Current approaches to diagnosis and
treatment of celiac disease: an evolving spectrum. Gastroenterol-
ogy 2001;120:636e51.
[4] Green PH, Jabri B. Coeliac disease. Lancet 2003;362:383e91.[5] Sollid LM. Coeliac disease: dissecting a complex inflammatory
disorder. Nat Rev Immunol 2002;2:647e55.
[6] van de Wal Y, Kooy Y, van Veelen P, Pena S, Mearin L,
Papadopoulos G, et al. Selective deamidation by tissue trans-
glutaminase strongly enhances gliadin-specific T cell reactivity.
J Immunol 1998;161:1585e8.
[7] Molberg O, McAdam SN, Korner R, Quarsten H, Kristiansen C,
Madsen L, et al. Tissue transglutaminase selectively modifies
gliadin peptides that are recognized by gut-derived T cells in celiac
disease. Nat Med 1998;4:713e7.
[8] Kontakou M, Sturgess RP, Przemioslo RT, Limb GA, Nelufer
JM, Ciclitira PJ. Detection of interferon gamma mRNA in the
mucosa of patients with coeliac disease by in situ hybridisation.
Gut 1994;35:1037e41.
[9] Nilsen EM, Jahnsen FL, Lundin KE, Johansen FE, Fausa O,
Sollid LM, et al. Gluten induces an intestinal cytokine response
strongly dominated by interferon gamma in patients with celiac
disease. Gastroenterology 1998;115:551e63.
[10] Lahat N, Shapiro S, Karban A, Gerstein R, Kinarty A, Lerner A.
Cytokine profile in coeliac disease. Scand J Immunol 1999;49:
441e6.
[11] Forsberg G, Hernell O, Melgar S, Israelsson A, Hammarstrom S,
Hammarstrom ML. Paradoxical coexpression of proinflamma-
tory and down-regulatory cytokines in intestinal T cells in
childhood celiac disease. Gastroenterology 2002;123:667e78.
[12] Hansson T,Dannaeus A,Klareskog L. Cytokine-producing cells in
peripheral blood of children with coeliac disease secrete cytokines
with a type 1 profile. Clin Exp Immunol 1999;116:246e50.
[13] Przemioslo RT, Lundin KE, Sollid LM, Nelufer J, Ciclitira PJ.
Histological changes in small bowel mucosa induced by gliadin
sensitive T lymphocytes can be blocked by anti-interferon gamma
antibody. Gut 1995;36:874e9.
[14] Olaussen RW, Johansen FE, Lundin KE, Jahnsen J, Brandtzaeg
P, Farstad IN. Interferon-gamma-secreting T cells localize to the
epithelium in coeliac disease. Scand J Immunol 2002;56:652e64.
[15] Guy-Grand D, DiSanto JP, Henchoz P, Malassis-Seris M,
Vassalli P. Small bowel enteropathy: role of intraepithelial
lymphocytes and of cytokines (IL-12, IFN-gamma, TNF) in the
induction of epithelial cell death and renewal. Eur J Immunol
1998;28:730e44.
[16] Pravica V, Asderakis A, Perrey C, Hajeer A, Sinnott PJ,
Hutchinson IV. In vitro production of IFN-gamma correlates
with CA repeat polymorphism in the human IFN-gamma gene.
Eur J Immunogenet 1999;26:1e3.
[17] Pena AS, Wijmenga C. Genetic factors underlying gluten-sensitive
enteropathy. Curr Allergy Asthma Rep 2001;1:526e33.
[18] Van Belzen MJ, Meijer JW, Sandkuijl LA, Bardoel AF, Mulder
CJ, Pearson PL, et al. A major non-HLA locus in celiac disease
maps to chromosome 19. Gastroenterology 2003;125:1032e41.
Section IV - Candidate gene and gene family studies
142
[19] Report of a working group of the United European Gastroenter-
ology Week in Amsterdam. When is a coeliac a coeliac? Eur J
Gastroenterol Hepatol 2001;13:1123e8.
[20] Goerres MS, Meijer JW, Wahab PJ, Kerckhaert JA, Groenen PJ,
Van Krieken JH, et al. Azathioprine and prednisone combination
therapy in refractory coeliac disease. Aliment Pharmacol Ther
2003;18:487e94.
[21] Livak KJ, Schmittgen TD. Analysis of relative gene expression
data using real-time quantitative PCR and the 2(-Delta Delta
C(T)) method. Methods 2001;25:402e8.
[22] Kruglyak L, Lander ES. Complete multipoint sib-pair analysis of
qualitative and quantitative traits. Am J Hum Genet 1995;57:
439e54.
[23] Awata T, Matsumoto C, Urakami T, Hagura R, Amemiya S,
Kanazawa Y. Association of polymorphism in the interferon
gamma gene with IDDM. Diabetologia 1994;37:1159e62.
[24] Jahromi M, Millward A, Demaine A. A CA repeat polymorphism
of the IFN-gamma gene is associated with susceptibility to type 1
diabetes. J Interferon Cytokine Res 2000;20:187e90.[25] Khani-Hanjani A, Lacaille D, Hoar D, Chalmers A, Horsman D,
Anderson M, et al. Association between dinucleotide repeat
in non-coding region of interferon-gamma gene and suscepti-
bility to, and severity of rheumatoid arthritis. Lancet 2000;356:
820e5.
[26] Vandenbroeck K, Opdenakker G, Goris A, Murru R, Billiau A,
Marrosu MG. Interferon-gamma gene polymorphism-
associated risk for multiple sclerosis in Sardinia. Ann Neurol
1998;44:841e2.
[27] Goris A, Epplen C, Fiten P, Andersson M, Murru R, Sciacca FL,
et al. Analysis of an IFN-gamma gene (IFNG) polymorphism in
multiple sclerosis in Europe: effect of population structure on
association with disease. J Interferon Cytokine Res 1999;19:
1037e46.[28] Seegers D, Borm ME, van Belzen MJ, Mulder CJ, Bailing J,
Crusius JB, et al. IL12B and IRF1 gene polymorphisms
and susceptibility to celiac disease. Eur J Immunogenet 2003;30:
421e5.
[29] Ryan BM, Kelleher D. Refractory celiac disease. Gastroenterol-
ogy 2000;119:243e51.
[30] Diosdado B, Wapenaar MC, Franke L, Duran KJ, Goerres MJ,
Hadithi M, et al. A microarray screen for novel candidate genes in
coeliac disease pathogenesis. Gut 2004;53:944e51.
Copyright © 2022 FDOKUMEN