the integration of corporate social - RMIT Research Repository
493
THE INTEGRATION OF CORPORATE SOCIAL RESPONSIBILITY INTO BUSINESS STRATEGY AND ITS IMPACT ON COMPANY PERFORMANCE: AN INVESTIGATION OF THE INDONESIAN MANUFACTURING INDUSTRY A thesis submitted in fulfilment of the requirements for the degree of Doctor of Philosophy Esti Dwi Rinawiyanti Master of Business Administration, University of Nuertingen-Geislingen, Nuertingen, Germany Bachelor of Industrial Engineering, Institute of Technology Sepuluh Nopember, Surabaya, Indonesia School of Management College of Business and Law RMIT University June 2021
-
Upload
khangminh22 -
Category
Documents
-
view
5 -
download
0
Transcript of the integration of corporate social - RMIT Research Repository

THE INTEGRATION OF CORPORATE SOCIAL
RESPONSIBILITY INTO BUSINESS STRATEGY AND ITS
IMPACT ON COMPANY PERFORMANCE:
AN INVESTIGATION OF THE INDONESIAN
MANUFACTURING INDUSTRY
A thesis submitted in fulfilment of the requirements for the degree of
Doctor of Philosophy
Esti Dwi Rinawiyanti
Master of Business Administration, University of Nuertingen-Geislingen,
Nuertingen, Germany
Bachelor of Industrial Engineering, Institute of Technology Sepuluh Nopember,
Surabaya, Indonesia
School of Management
College of Business and Law
RMIT University
June 2021

i
DECLARATION
I certify that except where due acknowledgement has been made, the work is that of the author
alone; the work has not been submitted previously, in whole or in part, to qualify for any other
academic award; the content of the thesis is the result of work which has been carried out since
the official commencement date of the approved research program; any editorial work, paid or
unpaid, carried out by a third party is acknowledged; and, ethics procedures and guidelines
have been followed.
Esti Dwi Rinawiyanti
2 June 2021

ii
DEDICATION
This thesis is dedicated to:
My beloved parents,
Erudhito Sudjono (deceased)
Astiti Wardojo
AND
My loving husband,
Sahrum Beru
AND
My lovely children,
Syafero Neumarzello Beru
Rieny Gracierra Beru

iii
ACKNOWLEDGEMENTS
Praise God for all His blessings that have made my endeavor fruitful. I thank Him for giving
me patience, strength, and endurance throughout my PhD journey. The journey of working on
this thesis has been one of the most challenging but rewarding experiences of my life. By His
grace, I can finish this thesis well.
This thesis would not have the soul it has without valuable academic and moral support and
trust in me as a researcher, given by scholars, family, and friends. I am wholeheartedly thankful
to my main supervisor, Dr Xueli (Charlie) Huang, for his patience, supportive feedback,
valuable guidance, and inspiration. My heartfelt thanks go to Prof Sharif As-Saber, my
associate supervisor, for his concern, insightful comments, and encouragement. I regard both
of them not only as research supervisors, but also as mentors in the development of academic
skills needed to be a successful scholar and in improving my publication writing skills. They
comforted and strengthened me to keep on getting up and moving again when I fell and gave
up hope. I feel incredibly lucky and proud to be a student of them.
My sincere appreciation goes to Indonesia Endowment Fund for Education (LPDP) in
collaboration with Directorate General of Higher Education (DIKTI), who gave me the
opportunity to undertake my study with full financial support. I am so grateful that I was chosen
as one of the awardees of the Indonesian Lecturer Excellence Scholarships (BUDI).
I also thank the University of Surabaya for allowing me to further study and providing
support for my studies. Special thanks to the academic and administrative staff at the School
of Management, RMIT University and at the Study Program of Industrial Engineering as well
as at the Faculty of Engineering, University of Surabaya, for being supportive, helpful, and
pleasant. This thesis is also dedicated to my friends and PhD colleagues in RMIT University
whose names I cannot mention one by one. I would like to thank them for our friendship and
unforgettable wonderful times that we cherished together.

iv
Besides, I am grateful for my Indonesian friends and community in Melbourne. I thank them
for their help, gathering and prayer that made my life here colourful and joyful. Because of
them, I felt at home during my stay in Melbourne.
I am very grateful for the support provided by Sahrum, my husband. His immense love, care
and patience during this journey have enabled me to complete this thesis. I thank him for always
being with me physically and emotionally to share all the ups and downs. My deepest thanks
go to my lovely children, Syafero and Riri, who always comforted me and excited me.
Last but not least, to my dear parents, thank you for allowing me to go far for such a long
time to pursue my dreams. I am also deeply indebted to my brothers and sisters, for their
support, assistance, and understanding while I was away.

v
TABLE OF CONTENTS
DECLARATION....................................................................................................................... i
DEDICATION.......................................................................................................................... ii
ACKNOWLEDGEMENTS .................................................................................................. iii
TABLE OF CONTENTS ........................................................................................................ v
LIST OF TABLES .................................................................................................................. xi
LIST OF FIGURES ................................................................................................................ vi
LIST OF APPENDICES ....................................................................................................... vii
LIST OF ACRONYMS .......................................................................................................... xi
ABSTRACT .............................................................................................................................. 1
CHAPTER 1: INTRODUCTION ........................................................................................... 4
1.1 Research Background ...................................................................................................... 4
1.2 An Overview of CSR Practices in Indonesia .................................................................. 8
1.3 Research Questions and Research Objectives ............................................................... 10
1.4 Research Contributions and Implications ..................................................................... 11
1.5 Overview of Research Methodology ............................................................................ 13
1.6 Structure of Thesis ........................................................................................................ 15
1.7 Summary of Chapter 1 .................................................................................................. 17
CHAPTER 2: LITERATURE REVIEW ............................................................................ 19
2.1 Non-Market Strategies .................................................................................................. 19
2.2 Corporate Social Responsibility .................................................................................... 22
2.2.1 CSR Definitions .................................................................................................. 23
2.2.2 CSR Dimensions ................................................................................................. 26
2.2.3 CSR Strategies .................................................................................................... 27
2.2.4 Different Theories in CSR Studies ...................................................................... 30

vi
2.3. Business Strategy ......................................................................................................... 33
2.3.1 Porter’s Generic Strategy .................................................................................... 34
2.3.2 Business Strategy and Company Performance ................................................... 35
2.4. The Integration of CSR into Business Strategy ........................................................... 40
2.4.1 Findings from Prior Studies ................................................................................ 41
2.4.2 Dimensions of the Integration of CSR and Business Strategy ............................ 52
2.5 Company Performance .................................................................................................. 61
2.5.1 Financial Performance ........................................................................................ 61
2.5.2 Non-Financial Performance ................................................................................ 63
2.6 Research Gaps ............................................................................................................... 67
2.7 Indonesia as a Context for the Research ....................................................................... 69
2.7.1 An Overview of Indonesia .................................................................................. 69
2.7.2 The Indonesian Manufacturing Industry ............................................................. 72
2.7.3 CSR Implementation in Indonesia ...................................................................... 75
2.7.4 CSR Studies in the Indonesian Manufacturing Industry ..................................... 81
2.8 Summary of Chapter 2 .................................................................................................. 82
CHAPTER 3: RESEARCH FRAMEWORK ...................................................................... 83
3.1 Theoretical Framework ................................................................................................. 83
3.1.1 Strategy and Company Performance ................................................................... 83
3.1.2 Theoretical Underpinnings .................................................................................. 84
3.2 The Theoretical Framework of the Integration of CSR into Business strategy ............ 86
3.2.1 CSR Dimensions and Strategies.......................................................................... 87
3.2.2 Business Strategy Applied in This Thesis ........................................................... 88
3.2.3 The Integration of CSR into Business Strategy .................................................. 88
3.2.4 Essential Aspects of Company Performance ...................................................... 95

vii
3.3 Research Hypotheses .................................................................................................... 99
3.3.1 The Relationship between CSR Integration and Company Performance ........... 99
3.3.2 Mediating Effects in the Relationship between CSR Integration and Financial
Performance ............................................................................................................... 101
3.3.3 Moderating Effects in the Relationship between CSR Integration and Company
Performance ............................................................................................................... 104
3.4 Summary of Chapter 3 ............................................................................................... 108
CHAPTER 4: RESEARCH METHODOLOGY .............................................................. 109
4.1 Research Approach ..................................................................................................... 109
4.2 Research Paradigm ...................................................................................................... 110
4.3 Research Design .......................................................................................................... 111
4.4 Questionnaire Development ........................................................................................ 113
4.4.1 The Development of the Measurements and Their Scales ................................ 117
4.4.2 Pilot Study ......................................................................................................... 127
4.5 Sampling Process ........................................................................................................ 128
4.5.1 Population and Sample ...................................................................................... 128
4.5.2 Sampling Frame ................................................................................................ 129
4.5.3 Sample Size ....................................................................................................... 130
4.5.4 Sampling Technique.......................................................................................... 131
4.6 Data Collection ............................................................................................................ 131
4.6.1 Data Collection Methods .................................................................................. 131
4.6.2 Results of Data Collection ................................................................................ 135
4.7 Data Analysis Procedures ........................................................................................... 137
4.7.1 Data Coding ...................................................................................................... 137
4.7.2 Data Screening .................................................................................................. 138

viii
4.8 The Respondents’ Profiles and Characteristics ........................................................... 144
4.9 Partial Least Square with Structural Equation Modelling ........................................... 149
4.9.1 Model Specification .......................................................................................... 151
4.9.2 Reflective and Formative Constructs Specification .......................................... 152
4.9.3 Hierarchical Component Model ........................................................................ 153
4.9.4 Model Assessment ............................................................................................ 157
4.9.5 Mediating Effect................................................................................................ 167
4.9.6 Moderating Effect ............................................................................................. 170
4.10 Ethical Considerations .............................................................................................. 174
4.11 Summary of Chapter 4 .............................................................................................. 175
CHAPTER 5: STRATEGIC INTEGRATION-FINDINGS AND DISCUSSION ......... 176
5.1 Descriptive Statistical Analysis in Strategic Integration ............................................. 176
5.2 Model Specification of Strategic Integration .............................................................. 178
5.3 Model Assessment for Strategic Integration ............................................................... 179
5.3.1 Assessment of the Measurement Model in Strategic Integration ..................... 179
5.3.2 Assessment of the Structural Model in Strategic Integration............................ 185
5.4 Discussion of Strategic Integration ............................................................................. 197
5.4.1 Discussion of Strategic Integration and Company Performance ...................... 197
5.4.2 Discussion of Mediating Effect in Strategic Integration ................................... 202
5.5 The Moderating Effect in Strategic Integration .......................................................... 207
5.5.1 MGA Business Strategy in Strategic Integration .............................................. 208
5.5.2 MGA CSR Strategy in Strategic Integration ..................................................... 219
5.5.3 MGA Company Size in Strategic Integration ................................................... 233
5.5.4 MGA Industry Type in Strategic Integration .................................................... 237
5.5.5 Discussion of Moderating Effect in Strategic Integration................................. 243

ix
5.5.6 Results of all Tested Hypotheses in Strategic Integration ................................ 252
5.6 Summary of Chapter 5 ................................................................................................ 253
CHAPTER 6: FUNCTIONAL INTEGRATION AND COMBINED CSR
INTEGRATION-FINDINGS AND DISCUSSION ........................................................... 255
I. Functional Integration .................................................................................................... 255
6.1 Desriptive Statistical Analysis in Functional Integration ............................................ 255
6.2 Model Specification of Functional Integration ........................................................... 256
6.3 Model Assessment of Functional Integration ............................................................. 257
6.3.1 Assessment of the Outer Measurement Model in Functional Integration......... 257
6.3.2 Assessment of the Structural Model in Functional Integration ......................... 263
6.4 Discussion of Functional Integration .......................................................................... 270
6.4.1 Discussion of Functional Integration and Company Performance ................... 270
6.4.2 Discussion of Mediating Effects in Functional Integration .............................. 275
6.5 Multi-group Analysis in Functional Integration ......................................................... 279
6.5.1 MGA Business Strategy in Functional Integration ........................................... 279
6.5.2 MGA CSR Strategy in Functional Integration .................................................. 283
6.5.3 MGA Company Size in Functional Integration ................................................ 289
6.5.4 MGA Industry Type in Functional Integration ................................................. 292
6.5.5 Discussion of Multi-Group Analysis in Functional Integration ........................ 295
6.6 Results for all Tested Hypotheses in Functional integration ............................... 303
6.7 Conclusion of Functional Integration .......................................................................... 305
II. The Combined CSR Integration .................................................................................... 306
6.8 Model Assessment in The Combined CSR Integration .............................................. 306
6.8.1 Assessment of the Measurement Model in The Combined CSR Integration ... 307
6.8.2 Assessment of the Structural Model in The Combined CSR Integration ......... 312

x
6.9 Model Comparison ..................................................................................................... 316
6.10 Discussion of The Combined CSR Integration ......................................................... 319
6.11 Conclusion of Combined CSR Integration ............................................................... 320
6.12 Summary of Chapter 6 ............................................................................................... 321
CHAPTER 7: CONCLUSIONS AND IMPLICATIONS ................................................ 323
7.1 Introduction ................................................................................................................. 323
7.2 Thesis Summary .......................................................................................................... 325
7.3 Conclusions ................................................................................................................. 331
7.4 Theoretical Contributions ............................................................................................ 337
7.5 Methodological Contributions .................................................................................... 338
7.6 Managerial Implications .............................................................................................. 340
7.7 Research Limitations and Directions for Future Research ......................................... 344
7.8 Summary of Chapter 7 ................................................................................................ 345
REFERENCES ..................................................................................................................... 347
APPENDICES ...................................................................................................................... 385

xi
LIST OF TABLES
Table 2.1: Results of Previous Studies of Porter’s Generic Strategies .................................... 40
Table 2.2: Prior Studies of CSR Integration ............................................................................ 48
Table 2.3: CSR Impacts on Company Performance ................................................................ 67
Table 2.4: Indonesian Manufacturing Snapshot ...................................................................... 73
Table 4.1: Business Strategy Measurement Items ................................................................. 119
Table 4.2: CSR Strategy Measurement Items ........................................................................ 120
Table 4.3: Strategic Integration Measurement Items ............................................................. 121
Table 4.4: Functional Integration Measurement Items .......................................................... 122
Table 4.5: Company Performance Measurement Items ......................................................... 125
Table 4.6: Period of Data Collection ..................................................................................... 135
Table 4.7: Results of Data Collection .................................................................................... 137
Table 4.8: Skewness and Kurtosis ......................................................................................... 141
Table 4.9: Respondents’ Profiles ........................................................................................... 144
Table 4.10: Profiles of the Respondents’ Companies ............................................................ 147
Table 4.11: Construct Operationalisation in Strategic and Functional Integration ............... 155
Table 5.1: Reflective Construct Assessments of Model 1 ..................................................... 182
Table 5.2: Fornell-Larcker Testing of Model 1 ..................................................................... 183
Table 5.3: HTMT Values of Model 1 .................................................................................... 184
Table 5.4: Collinearity Test of Formative Measures of Model 1 .......................................... 185
Table 5.5: Indicator Validity of Formative Measurements in Model 1 ................................. 185
Table 5.6: Outer VIF Values of Model 1 ............................................................................... 186
Table 5.7: Inner VIF Values of Model 1................................................................................ 186
Table 5.8: Direct Effects of Model 1 ..................................................................................... 188
Table 5.9: Specific Indirect Effects of Model 1 ..................................................................... 189

ii
Table 5.10: Direct Effects, Indirect Effects and Total Effects of Model 1 ............................ 190
Table 5.11: VAF of Mediation Effect of Model 1 ................................................................. 192
Table 5.12: R2 and Q2 values of Model 1 .............................................................................. 193
Table 5.13: f2 Values of Model 1 ........................................................................................... 195
Table 5.14: q2 Values of Model 1 .......................................................................................... 196
Table 5.15: Factor and Items of Business Strategy ................................................................ 210
Table 5.16: K-means Business Strategy with Three Clusters ................................................ 212
Table 5.17: Respondents Characteristics in Each Cluster of Business Strategy.................... 214
Table 5.18: Step 2 MICOM of Business Strategy in Strategic Integration ........................... 216
Table 5.19: Step 3 MICOM of Business Strategy in Strategic Integration ........................... 216
Table 5.20: Permutation Test of Business Strategy in Strategic Integration ......................... 217
Table 5.21: PLS-MGA Results of Business Strategy in Strategic Integration ...................... 218
Table 5.22: Multi-group Results of Business Strategy in Strategic Integration .................... 218
Table 5.23: Parametric and Welch-Satterthwaite Tests of Business Strategy in Strategic
Integration .............................................................................................................................. 219
Table 5.24: PLS Multi-group Results of Business Strategy in Strategic Integration ............ 219
Table 5.25: Factor and Items of CSR Strategy ...................................................................... 221
Table 5.26: K-means CSR Strategy with Three Clusters ...................................................... 223
Table 5.27: Respondents Characteristics in Each Cluster of CSR Strategy .......................... 225
Table 5.28: PLS-MGA Proactive and Reactive in Strategic Integration ............................... 228
Table 5.29: PLS Multi-group Results of Proactive and Reactive in Strategic Integration .... 229
Table 5.30: MGA Proactive and Accommodative in Strategic Integration ........................... 230
Table 5.31: PLS-MGA Accommodative and Reactive in Strategic Integration .................... 232
Table 5.32: PLS Multi-group Results of Proactive and Reactive in Strategic Integration .... 232
Table 5.33: MGA Results of CSR Strategy in Strategic Integration ..................................... 233

iii
Table 5.34: Comparison of CSR Strategy in Strategic Integration ........................................ 234
Table 5.35: PLS-MGA Company Size in Strategic Integration ............................................ 236
Table 5.36: MGA Results of Company Size in Strategic Integration .................................... 236
Table 5.37: PLS Multi-group Results of Company Size in Strategic Integration ................. 237
Table 5.38: Industry Type Categories .................................................................................... 239
Table 5.39: Respondents Characteristics in Each Category of Industry Type ...................... 240
Table 5.40: PLS-MGA Industry Type in Strategic Integration ............................................. 242
Table 5.41: MGA Results of Industry Type in Strategic Integration .................................... 242
Table 5.42: PLS Multi-group Results of Industry Type in Strategic Integration .................. 243
Table 5.43: Final Results of Hypothesis in Strategic Integration .......................................... 253
Table 6.1: Reflective Construct Assessments of Model 2 ..................................................... 259
Table 6.2: Fornell-Larcker Testing of Model 2 ..................................................................... 261
Table 6.3: HTMT Values of Model 2 .................................................................................... 262
Table 6.4: Collinearity Test of Formative Measures of Model 2 .......................................... 262
Table 6.5: Indicator Validity of Formative Measurements of Model 2 ................................. 263
Table 6.6: Outer VIF values of Model 2 ................................................................................ 264
Table 6.7: Inner VIF values of Model 2 ................................................................................ 264
Table 6.8: Direct Effects of Model 2 ..................................................................................... 265
Table 6.9: Specific Indirect Effects of Model 2 ..................................................................... 266
Table 6.10: Direct Effects, Indirect Effects and Total Effects of Model 2 ............................ 267
Table 6.11: VAF for Mediation Effect of Model 2 ................................................................ 268
Table 6.12: R2 and Q2 values of Model 2 .............................................................................. 268
Table 6.13: f2 Values of Model 2 ........................................................................................... 269
Table 6.14: q2 Values of Model 2 .......................................................................................... 270
Table 6.15: PLS-MGA Business Strategy in Functional Integration .................................... 281

iv
Table 6.16: Multi-group Results Business Strategy in Functional Integration ...................... 282
Table 6.17: PLS Business Strategy in Functional Integration across Methods ..................... 282
Table 6.18: PLS-MGA Proactive and Reactive in Functional Integration ............................ 284
Table 6.19: PLS Proactive and Reactive in Functional Integration across Methods ............. 285
Table 6.20: PLS-MGA Proactive and Accommodative in Functional Integration ................ 286
Table 6.21: PLS Proactive and Accommodative in Functional Integration across Methods 287
Table 6.22: PLS-MGA Accommodative and Reactive in Functional Integration ................. 288
Table 6.23: MGA Results CSR Strategy in Functional Integration....................................... 289
Table 6.24: Comparison of CSR Strategy in Functional Integration ..................................... 289
Table 6.25: PLS-MGA Company Size in Functional Integration.......................................... 291
Table 6.26: MGA Results Company Size in Functional Integration ..................................... 291
Table 6.27: PLS Company Size in Functional Integration across Methods .......................... 292
Table 6.28: PLS-MGA Industry Type in Functional Integration .......................................... 294
Table 6.29: MGA Results Industry Type in Functional Integration ...................................... 294
Table 6.30: PLS Industry Type in Functional Integration across Methods ........................... 295
Table 6.31: Final Results of Hypothesis in Functional integration ....................................... 304
Table 6.32: Reflective construct assessments of Model 3 ..................................................... 308
Table 6.33: Fornell-Larcker Testing of Model 3 ................................................................... 311
Table 6.34: HTMT Values of Model 3 .................................................................................. 312
Table 6.35: Direct Effects of Model 3 ................................................................................... 314
Table 6.36: R2 and Q2 values of Model 3 .............................................................................. 315
Table 6.37: f2 Values of Model 3 ........................................................................................... 315
Table 6.38: q2 Values of Model 3 .......................................................................................... 316
Table 6.39: Direct Effects and Total Effect Comparison across Three Models .................... 317
Table 6.40: Specific Indirect Effects Comparison across Three Models ............................... 318

v
Table 6.41: MGA Results Model 1 and Model 2................................................................... 319
Table 7.1: Final Results of Hypothesis of CSR Integrtation ................................................. 329
Table 7.2: Summary of Hypotheses Verification .................................................................. 331

vi
LIST OF FIGURES
Figure 1.1 Thesis Outline ......................................................................................................... 16
Figure 2.1 The Biggest Economies in the World ..................................................................... 70
Figure 2.2 Indonesia’s Vision 2025 ......................................................................................... 71
Figure 3.1: The Conceptual Framework for the Integration of CSR into Business Strategy and
Its Impact on Company Performance ...................................................................................... 86
Figure 3.2: The Theoretical Framework for the Integration of CSR into Business Strategy with
the Hypotheses ....................................................................................................................... 108
Figure 4.1: Research Approach of This Thesis ...................................................................... 113
Figure 4.3: Main Products of Respondents’ Companies ....................................................... 148
Figure 4.4: The Four Types of Hierarchical Component Models .......................................... 154
Figure 4.5: A Conceptual Model of CSR Integration into Business Strategy ....................... 157
Figure 4.6: Repeated-Indicator Approach for Type II HCM ................................................. 159
Figure 4.7: (A) Illustration of a direct effect. X affects Y; (B) Illustration of a mediation design.
X is hypothesized to exert an indirect effect on Y through M. .............................................. 168
Figure 5.1: Model of Strategic Integration and Company Performance (Model 1) ............... 179
Figure 5.2: Results of PLS Algorithm of Model 1................................................................. 180
Figure 6.1: Model of Functional Integration and Company Performance (Model 2) ............ 257
Figure 6.2: Results of PLS Algorithm of Model 2................................................................. 258
Figure 6.3: Model of CSR Integration and Company Performance (Model 3) ..................... 307
Figure 6.4: Results of PLS Algorithm of Model 3................................................................. 313

vii
LIST OF APPENDICES
Appendix A.1: Concept Definition and Concept Measurement Used in This Thesis ........... 385
Appendix A.2: Questionnaire - English Version ................................................................... 390
Appendix A.3: Questionnaire – Indonesia Version ............................................................... 395
Appendix A.4: Mann-Whitney Test of Business Strategy..................................................... 400
Appendix A.5: Kruskal-Wallis Test of Strategic Integration ................................................ 401
Appendix A.6: Normality Test of Business Strategy ............................................................. 402
Appendix A.7: Skewness and Kurtosis for All Items ............................................................ 403
Appendix A.8: Kruskall-Wallis Test of Company Performance ........................................... 404
Appendix A.9: Mann-Whitney Test of Strategic Integration ................................................ 405
Appendix A.10: Mann-Whitney Test of Company Performance .......................................... 406
Appendix A.11: Ethics Approval ........................................................................................... 407
Appendix A.12: PCA Constructs of Strategic Integration ..................................................... 408
Appendix A.13: PCA Constructs of Functional Integration .................................................. 409
Appendix A.14: PCA Constructs of Company Performance ................................................ 410
Appendix B.1: Descriptive Analysis of Business Strategy .................................................... 411
Appendix B.2: Descriptive Analysis of CSR Strategy .......................................................... 412
Appendix B.3: Descriptive Analysis of Strategic Integration ............................................... 413
Appendix B.4: Descriptive Analysis of Company Performance ........................................... 414
Appendix B.5: Outer Model Loadings and Cross Loadings of Model 1 ............................... 415
Appendix B.6: Varimax-Rotated Common Factor Matrix of Business Strategy .................. 416
Appendix B.7: Collinearity of Business Strategy .................................................................. 417
Appendix B.8: Notification from SmartPLS about Small Sample Size ................................ 418
Appendix B.9: Varimax-Rotated Common Factor Matrix of CSR Strategy ......................... 419
Appendix B.10: Collinearity of CSR Strategy ....................................................................... 420

viii
Appendix B.11: Step 2 MICOM Proactive and Reactive of Strategic Integration ................ 421
Appendix B.12: Step 3 MICOM Proactive and Reactive of Strategic Integration ................ 422
Appendix B.13: Permutation Test Proactive versus Reactive of Strategic Integration ......... 423
Appendix B.14: Parametric and Welch-Satterthwaite Tests Proactive and Reactive of Strategic
Integration .............................................................................................................................. 424
Appendix B.15: Step 2 MICOM Proactive and Accommodative of Strategic Integration ... 425
Appendix B.16: Step 3 MICOM Proactive and Accommodative of Strategic Integration ... 426
Appendix B.17: Permutation Test Proactive and Accommodative of Strategic Integration . 427
Appendix B.18: Parametric and Welch-Satterthwaite Tests Proactive and Accommodative of
Strategic Integration ............................................................................................................... 428
Appendix B.19: Step 2 MICOM Accommodative and Reactive of Strategic Integration..... 429
Appendix B.20: Step 3 MICOM Accommodative and Reactive of Strategic Integration..... 430
Appendix B.21: Permutation Test Accommodative and Reactive of Strategic Integration .. 431
Appendix B.22: Parametric and Welch-Satterthwaite Tests Accommodative and Reactive of
Strategic Integration ............................................................................................................... 432
Appendix B.23: Step 2 MICOM Company Size of Strategic Integration ............................. 433
Appendix B.24: Step 3 MICOM Company Size of Strategic Integration ............................. 434
Appendix B.25: Permutation Test Company Size of Strategic Integration ........................... 435
Appendix B.26: Parametric and Welch-Satterthwaite Tests Company Size of Strategic
Integration .............................................................................................................................. 436
Appendix B.27: Step 2 MICOM Industry Type of Strategic Integration .............................. 437
Appendix B.28: Step 3 MICOM Industry Type of Strategic Integration .............................. 438
Appendix B.29: Permutation Test Industry Type of Strategic Integration ............................ 439
Appendix B.30: Parametric and Welch-Satterthwaite Tests Industry Type of Strategic
Integration .............................................................................................................................. 440

ix
Appendix C.1: Descriptive Analysis of Functional Integration............................................. 441
Appendix C.2: Outer Model Loadings and Cross Loadings of Model 2 ............................... 442
Appendix C.3: Step 2 MICOM Business Strategy of Functional Integration ....................... 443
Appendix C.4: Step 3 MICOM Business Strategy of Functional Integration ....................... 444
Appendix C.5: Permutation Test Business Strategy of Functional Integration ..................... 445
Appendix C.6: Parametric and Welch-Satterthwaite Tests Business Strategy of Functional
Integration .............................................................................................................................. 446
Appendix C.7: Step 2 MICOM Proactive and Reactive of Functional Integration ............... 447
Appendix C.8: Step 3 MICOM Proactive and Reactive of Functional Integration ............... 448
Appendix C.9: Permutation Test Proactive and Reactive of Functional Integration ............. 449
Appendix C.10: Parametric and Welch-Satterthwaite Tests Proactive and Reactive of
Functional Integration ............................................................................................................ 450
Appendix C.11: Step 2 MICOM Proactive and Accommodative of Functional Integration. 451
Appendix C.12: Step 3 MICOM Proactive and Accommodative of Functional Integration. 452
Appendix C.13: Permutation Test Proactive and Accommodative of Functional Integration
................................................................................................................................................ 453
Appendix C.14: Parametric and Welch-Satterthwaite Tests Proactive and Accommodative of
Functional Integration ............................................................................................................ 454
Appendix C.15: Step 2 MICOM Accommodative and Reactive of Functional Integration .. 455
Appendix C.16: Step 3 MICOM Accommodative and Reactive of Functional Integration .. 456
Appendix C.17: Permutation Test Accommodative and Reactive of Functional Integration 457
Appendix C.18: Parametric and Welch-Satterthwaite Tests Accommodative and Reactive of
Functional Integration ............................................................................................................ 458
Appendix C.19: Step 2 MICOM Company Size of Functional Integration .......................... 459
Appendix C.20: Step 3 MICOM Company Size of Functional Integration .......................... 460

x
Appendix C.21: Permutation Test Company Size of Functional Integration ........................ 461
Appendix C.22: Parametric and Welch-Satterthwaite Tests Company Size of Functional
Integration .............................................................................................................................. 462
Appendix C.23: Step 2 MICOM Industry Type of Functional Integration ........................... 463
Appendix C.24: Step 3 MICOM Industry Type of Functional Integration ........................... 464
Appendix C.25: Permutation Test Industry Type of Functional Integration ......................... 465
Appendix C.26: Parametric and Welch-Satterthwaite Tests Industry Type of Functional
Integration .............................................................................................................................. 466
Appendix D: Thesis Related Publications…………………………………………………..467

xi
LIST OF ACRONYMS
AVE Average Variance Extracted
BPS Biro Pusat Statistik (Central Bureau of Statistics)
CCP Company Customer Performance
CEO Chief Executive Officer
CEP Company Employee Performance
CFA Confirmatory Factor Analysis
CFP Company Financial Performance
CIVETS Colombia, Indonesia, Vietnam, Egypt, Turkey and South Africa
COP Company Operational Performance
CP Company Performance
CR Composite Reliability
CSP Company Social Performance
CSR Corporate Social Responsibility
EFA Exploratory Factor Analysis
ESI Environmentally Sensitive Industries
GDP Gross Domestic Product
GRI Global Reporting Initiative
HCM Hierarchical Component Model
HOC Higher-Order Component
HTMT Heterotrait-Monotrait Ratio of Correlations
IDR Indonesian Rupiah
IDX Indonesian Stock Exchange
ISIC Indonesian Standard Industrial Classification
ISO International Organisation for Standardisation

xii
ISRA Indonesian Sustainability Reporting Award
JIEP Jakarta Industrial Estate Pulogadung
LOC Lower-Order Component
KIW Kawasan Industri Wijayakusuma
KMO Kaiser-Meyer-Olkin Measure
MCAR Missing Completely At Random
MGA Multi-Group Analysis
MICOM Measurement Invariance of Composite Models
MP3EI Master Plan Acceleration and Expansion of Indonesia Economic Growth
NCF Net Cash Flow
NGO Non-Governmental Organisation
NMS Non-Market Strategy
PCA Principal Component Analysis
PKM Persuasion Knowledge Model
PLS Partial Least Squares
PLS-SEM Partial Least Squares-Structural Equation Modelling
R2 Coefficient of Determination
RBV Resource Based View
RDT Resource Dependency Theory
ROA Return On Assets
ROE Return On Equity
ROI Return On Investment
ROS Return On Sales
SDG Sustainable Development Goals
SEM Structural Equation Modelling

xiii
SME Small Medium Enterprises
SOE State-Owned Enterprise
SPSS Statistical Package for the Social Sciences
SRA Sustainability Reporting Awards
SRMR Standardized Root Mean Square Residual Value
TOL Tolerance
UNIDO United Nations Industrial Development Organisation
USD United States Dollar
UU Undang-Undang
VAF Variance Accounted For
VIF Variance of Inflation Factor

1
ABSTRACT
Although the extant literature pays considerable attention to whether corporate social
responsibility (CSR) should be integrated with business strategies to gain benefits, research on
how CSR and business strategies could be successfully integrated is scant. This thesis aims to
investigate how CSR and business strategies are integrated, strategically and functionally, and
to examine the impact of such integration on company performance. In addition to direct effect
analyses, this thesis also assesses the mediating effect of company social performance (CSP)
on the relationship between CSR and company financial performance (CFP) and analyses the
moderating effect of business and CSR strategies, company size, and industry type in this
relationship.
A theoretical framework for integration is developed based on a literature review and is
embedded in contingency and stakeholder theories. With a sample of 435 usable responses
from a survey of 1,055 manufacturing companies in Indonesia, this thesis employs Partial Least
Squares with Structural Equation Modelling (PLS-SEM) to analyse the data. Exploratory and
confirmatory factor analyses are conducted, and the hypotheses are verified by examining
direct, indirect, and total effects. The evaluation of measurement models is satisfactorily
achieved. Reflective and formative measures suggest that all constructs are reliable and valid
in the context of this thesis. The assessment of structural models reveals that both strategic and
functional integrations have a significant positive impact on company performance, including
customer, employee, operational and financial performance. More specifically, the empirical
results confirm that strategic and functional integration have an essential effect on customer,
employee, and operational performance, and that these performances can mediate the
relationship between the integrations and financial performance.
The findings also show a positive relationship between strategic and functional integrations.
Integration of CSR at the strategic level has an impact on integration of CSR at the next level,

2
such as at the functional level. Furthermore, the findings presented in this thesis indicate that
business and CSR strategies have a moderating effect on CSR integration. Notably, regarding
business strategy, the results suggest that differentiation strategy has a larger total effect on
customer and financial performance than cost leadership strategy in strategic CSR integration.
However, in functional CSR integration, the findings suggest that differentiation strategy has
a larger total effect than cost leadership strategy, on customer performance only.
With respect to CSR strategy, findings in this thesis highlight that CSR strategy has a
moderating effect on the relationship between CSR integration and company performance.
Proactive and accommodative strategies have a greater total effect on customer and financial
performance than reactive strategy in strategic CSR integration. Conversely, in functional CSR
integration, empirical evidence indicates that reactive strategy has a larger total effect on
employee and financial performance than proactive strategy. In functional integration,
accommodative strategy has a greater total effect on operational performance than proactive
strategy.
In terms of company size, the findings of strategic CSR integration show that large
companies have a greater total effect on customer, employee, operational and financial
performances than small and medium enterprises (SMEs). On the other hand, large companies
have better operational performance than SMEs. These results confirm that company size has
a moderating effect on the relationship between CSR integration and company performance.
Moreover, the results suggest that industry type moderates the relationship between CSR
integration and company performance. In particular, non-environmentally sensitive industries
(non-ESI) have a bigger total effect than ESI in the relationship between strategic CSR
integration and financial performance. In relation to functional CSR integration, findings
indicate that non-ESI groups have a higher total effect in customer and financial performances
than ESI groups.

3
From a theoretical perspective, this research contributes to the body of knowledge by
focusing on CSR integration to understand its impact on company performance. This thesis
contributes to the literature by developing a framework that enables researchers to identify the
different types of benefits provided by CSR integration, and the effect that these benefits have
on the stakeholder-company relationship. This research presents empirical evidence that, in
evaluating the mechanism between CSR integration and company performance, stakeholder
and contingency theories should be taken into account.
From a practical point of view, the findings of this thesis can encourage companies,
particularly Indonesian manufacturing companies, to implement CSR within their company.
Companies should treat primary stakeholders—those who interact with business operations
directly and daily including employees, suppliers, and customers—well, and act on their needs
related to CSR practices. These results could, especially, motivate manufacturing companies
to increase their level of CSR practice. In doing so, they will not conduct CSR merely as a
charity or philanthropy or only to comply with regulations (as many currently practice);
instead, they will strategically and effectively carry out CSR through a range of activities to
achieve superior performance, both socially and financially.
Keywords: CSR integration, company performance, mediating effect, manufacturing sector,
developing countries.

4
CHAPTER 1: INTRODUCTION
This chapter serves as the introduction to the thesis. It begins with a description of the
research background and research questions, and then moves on to the research contributions
and implications. It also contains an overview of research methodology and an explanation of
the thesis' structure as well. There is a summary at the end of this chapter.
1.1 Research Background
The research background for this thesis is discussed in this section. It explains corporate
social responsibility (CSR), CSR integration, and company performance briefly. It also
indicates the research gaps that this thesis will fill.
European Commission (2011) defines CSR as when companies integrate social and
environmental concerns on a voluntary basis into their business practices and relationships with
their stakeholders. This definition implies companies should embrace social, environmental,
ethical human rights and consumer concerns into their business activities and core strategies
when collaborating with their stakeholders. CSR signifies ‘the integration of an enterprise’s
social, environmental, ethical, and philanthropic responsibilities towards society into its
operations, processes and core business strategy in cooperation with relevant stakeholders’
(Rasche, Morsing & Moon 2017, p. 6). These two definitions emphasise the integration of CSR
into business activities and involvement of stakeholders. Because CSR is an organisational
activity that relies on several connections within an organisation’s management and operation
(Valdez-Juárez, Gallardo-Vázquez & Ramos-Escobar 2018), the development of CSR
practices depends on how they are integrated into current business practices (Marín, Rubio &
de Maya 2012; Marques-Mendes & Santos 2016).
Over the past two decades, the concept of CSR has become increasingly popular (Malik
2015). There is growing awareness that business activities create short- and long-term impacts
on society and the environment, as well as economics (Carroll & Shabana 2010). Therefore,

5
CSR has become a concern for all businesses (Martinuzzi & Krumay 2013), as they attempt to
comply and gain advantages from it (Razafindrambinina & Sabran 2014). Managers look for
ways to position their companies to take advantage of the business opportunities created by
CSR, while also trying to find solutions to address environmental and societal problems (Rosen
2001).
Although CSR is a common issue on the agenda of companies, it is not yet a strategic
priority. One reason for this is the lack of understanding of the benefits of CSR for
competitiveness (Porter & Kramer 2006). The relationship between companies’ activities and
their impact on competitive advantage has been extensively examined in recent research (Porter
& Siggelkow 2008), but it remains unclear whether and how CSR can impact company
competitiveness (Carroll & Shabana 2010).
To address this question, previous studies have demonstrated a positive correlation between
CSR and company performance, which leads to improved competitive advantage (Carroll &
Shabana 2010; Orlitzky, Schmidt & Rynes 2003). For example, some research has indicated
that CSR has a positive impact on financial performance (Ameer & Othman 2012; Beck, Frost
& Jones 2018; Sindhu & Arif 2017). Other studies also found that CSR significantly affects
employee performance (Bauman & Skitka 2012; Sprinkle & Maines 2010), customer
performance (García-Madariaga & Rodríguez-Rivera 2017; Park, Kim & Kwon 2017), and
operational performance (Sánchez & Benito-Hernández 2015; Sun & Yu 2015). Many studies
examine the relationship between CSR and company performance and confirm that CSR
provides several benefits to a company’s social and financial performance (Bauman & Skitka
2012; Beck, Frost & Jones 2018; García-Madariaga & Rodríguez-Rivera 2017; Kim, Kim &
Qian 2018; Malik 2015). However, it remains unclear under what mechanism this relationship
can occur.

6
Despite the fact that prior studies have demonstrated that CSR has a positive impact on
company performance, several authors have argued that CSR must be connected and integrated
into business strategy to benefit companies (Dey & Sircar 2012; Ganescu 2012b; Husted &
David 2011). Researchers have emphasised the importance of integration of CSR into business
strategy to enhance companies’ social and financial performance (Carroll & Shabana 2010;
Galbreath 2006; Ganescu 2012b; Hasan et al. 2018; Marín, Rubio & de Maya 2012; Porter &
Kramer 2011). Integration between CSR activities and core business functions is critical to
value creation by CSR and vital to the success of companies (Carroll & Shabana 2010; García-
Madariaga & Rodríguez-Rivera 2017). A common problem with the planning and
implementation of CSR strategies and practices, however, appears to be the lack of alignment
with business strategy (Rangan, Chase & Karim 2012). Many managers agree on a strategic
interest in CSR, but few fully incorporate CSR aspects into their business practices. Integrating
CSR into a business strategy decision is one of the most challenging tasks facing managers
(Carroll & Shabana 2010).
Because it is critical to have a better understanding of the relationship between CSR
integration and business strategy (Insight 2016), several studies on the integration of CSR into
business strategy have been carried out, either conceptually or empirically. For example, Maon,
Lindgreen and Swaen (2009) integrated top-down and bottom-up processes throughout the
integration process on the basis of the stakeholder theory. They also explained the roles of the
primary and secondary stakeholders and provided specific case studies to support their
interpretation. Notably, they highlighted the importance of integrating CSR into the objectives
and strategies of a company, identifying key stakeholders and their critical problems,
developing an integrated CSR, and engaging employees in implementation, monitoring and
evaluation. Asif et al. (2013) built the framework for integrating CSR into business processes
across all stages of business processes, suggesting top-down and bottom-up approaches to

7
integration. This study implied that CSR integration can be carried out through many activities,
including vertical and horizontal integration. Furthermore, Lindgreen et al. (2011) highlighted
that CSR integration involves cultural change led by top management and other change agents,
who drive CSR values throughout the company. Marques-Mendes and Santos (2016)
developed a more comprehensive framework and explained each stage in detail by providing
indicators and related concepts. Their studies demonstrated how integration can take place
thoroughly, beginning with strategic integration (ideological models), implementation
(procedural models), and then the effect of the integration (consequentialist models).
Nevertheless, there is scant empirical research on the integration of CSR into business
strategy and the resulting impact on organisational performance (Vitolla, Rubino & Garzoni
2017). It remains unclear how CSR and business strategies can be integrated, as well as how
such integration can affect company performance. Furthermore, the integration of CSR is an
important topic, but it is seldom considered in strategic management (Engert, Rauter &
Baumgartner 2016; Kiron et al. 2013). Since most of the relevant literature are prescriptive and
deal with theoretical frameworks and concepts, empirical studies on the integration of corporate
sustainability into strategic management and models that show how CSR can be integrated into
business strategy are needed (Engert, Rauter & Baumgartner 2016; Guadamillas-Gómez,
Donate-Manzanares & Škerlavaj 2010).
This thesis seeks to fill current research gaps by developing and testing a model that
describes CSR integration at the strategic and functional levels. It investigates how CSR and
business strategy are integrated, examines the impact of this integration on organisational
performance and analyses the mechanisms through which CSR integration affects company
performance.

8
1.2 An Overview of CSR Practices in Indonesia
This section describes currect CSR practices and regulations in Indonesia. It also explains
an overview of Indonesia and the impact of CSR rules on the manufacturing industry.
CSR practices are implemented at relatively higher and more intense levels in developed
countries than in developing countries (Bhattacharyya 2010). Most studies on CSR are
concerned with investigating the practices adopted by companies in developed countries (Zhu,
Liu & Lai 2016). CSR is emerging as a distinct area of management studies in developing
countries (Jamali & Karam 2018), and it is essential to identify significant information on the
contribution of CSR and the main factors affecting CSR performance (Blowfield 2007; Branco
& Rodrigues 2006; Crifo, Diaye & Pekovic 2016), including in Indonesia.
Indonesia is not only the world’s fourth most populous nation with more than 267 million
people, but also has the largest economy in Southeast Asia (Worldbank 2020). CSR has become
a major concern in Indonesia over the past two decades (Maris 2014). In particular, the
Indonesian government has released Law No. 40 2007 on Limited Liability Companies (or
Undang-Undang (UU) No. 40 Tahun 2007 tentang Perseroan Terbatas). With this law,
Indonesia is the world's first country to mandate that companies, especially those related to
natural resources, must implement CSR, and report their CSR activities (Maris 2014; Ridho
2018; Rosser & Edwin 2010; Sheehy & Damayanti 2019; Waagstein 2011). In practice,
however, this is problematic as it needs not only a specific definition of CSR, but also an
effective implementation process and tools to evaluate its impact (Waagstein 2011). Hence, the
government needs to develop policy regulation, clearly defining CSR and considering
stakeholders’ perceptions that companies should respond to and implement an appropriate
business practice for their survival. As CSR is a matter of good business practice, companies
should care for their stakeholders across a variety of interactions (Maris 2014).

9
Although there are laws regulating CSR, many Indonesian companies misinterpret it. CSR
is assumed to be a corporate social activity for the community and environment through profit
distribution to philanthropic programs (Radyati 2014). Prior studies show that most Indonesian
companies embrace CSR through charitable practices, corporate philanthropy, and community
development (Ambadar 2017; Joseph et al. 2016; Razafindrambinina & Sabran 2014; Widjaja
2011). Few activities refer to social and environmental concerns (Waagstein 2011), and many
companies enforce CSR through simple and instant activities, such as donations and
fundraising (Maulamin 2017; Ridho 2017).
Because manufacturing companies carry out activities related to natural resources, they have
been affected by this law, while also dealing with a growing number of environmental, labour
and human rights laws at both national and international levels (Bernal-Conesa, de Nieves-
Nieto & Briones-Peñalver 2017). Several studies have investigated CSR implementation in the
Indonesian manufacturing industry. For instance, based on a sample of 53 manufacturing
companies, Hasanudin and Budianto (2013) found that both employee CSR and corporate
reputation have a positive impact on company performance, but environmental CSR has a
negative impact. Purbowati and Mutiarni (2017) assessed the effect of corporate characteristics
on CSR disclosure, using a sample of 50 listed manufacturing companies. They claimed that
company size has a significant impact on CSR disclosure while the company's profile, the size
of the commissioner board, and ownership concentration have no significant impact on the
disclosure of CSR. Furthermore, with survey data from 173 manufacturing companies,
Handayani, Wahyudi and Suharnomo (2017) highlighted the significant influence of CSR on
company performance and emphasised the importance of integrating social and environmental
aspects in CSR implementation.
Even though several studies have examined CSR practices in the context of the Indonesian
manufacturing industry, limited research has comprehensively analysed the relationship

10
between CSR integration and company performance. In particular, the extent to which
manufacturing companies, after 13 years of CSR regulation in Indonesia, improve and enforce
their CSR practices needs to be investigated further.
1.3 Research Questions and Research Objectives
This section begins by determining research questions. It then goes on to research objectives
that this thesis will achieve.
The integration between CSR and business strategy has been discussed in the literature, but
substantial identifiable gaps remain, which lead to this thesis’s key research question (RQ):
what is the extent to which CSR and business strategy are integrated? This main research
question can be divided into several supplementary research questions:
RQ1: To what extent does CSR integrate into business at the strategic and functional levels?
RQ2: To what extent does CSR integration affect company performance?
RQ3: To what extent does social performance mediate the relationship between CSR
integration and financial performance?
RQ4: To what extent do business and CSR strategies moderate the impact of CSR
integration on company performance?
RQ5: To what extent do company size and industry type moderate impact of CSR
integration on company performance?
To address these research questions, this thesis investigates how CSR can be integrated into
business at strategic and functional levels. This thesis also aims to examine the impact of
strategic and functional CSR integrations on company performance, particularly in the
Indonesian manufacturing industry. As a result, six specific objectives were established:
▪ Investigate the essential dimensions of CSR integration at the strategic level;
▪ Examine the crucial dimensions of CSR integration at the functional level;

11
▪ Identify the relationship between CSR integration (strategic and functional integrations)
and company performance;
▪ Uncover the mediating effect of customer, employee, and operational performance in the
CSR integration-CFP relationship;
▪ Discover the moderating effect of business and CSR strategies in the CSR integration-
company performance relationship; and
▪ Identify the moderating effect of company size and industry type in the CSR integration-
company performance relationship.
1.4 Research Contributions and Implications
In this section, the contributions of this thesis to current knowledge about CSR are
presented. It also identifies the research implications of this thesis, not only for top managers
but also for policymakers.
From a theoretical perspective, this thesis is one of the first studies to propose a model that
comprehensively examines the relationship between CSR integration and company
performance. Thus, this thesis makes an essential contribution to the existing literature on CSR
integration and the impact of integration on company performance.
First, this thesis develops a conceptual framework by combining CSR integration and its
effect on company performance based on the strategy-context-performance relationship at
strategic and functional levels. Second, this thesis clarifies the relationship between the
proposed variables in the conceptual framework for strategic and functional integration to
demonstrate that the integration of CSR and business strategies has an impact on company
performance. Third, this thesis presents new empirical evidence on the relative impact of
various integration mechanisms on integration by suggesting that social performance can
mediate the impact of CSR integration on financial performance. By incorporating stakeholder
theory, the findings underline that the stakeholder relationship is a key mechanism through

12
which companies can benefit financially from the integration of CSR into their business
strategies. Specifically, this thesis provides new empirical evidence that the stakeholder
relationship should be considered when evaluating the relationship between CSR integration
and financial performance as such a relationship can be mediated by customer, employee and
operational performance. Fourth, this thesis offers new insights into the impact of CSR on
company performance from a contingency perspective. The results of the moderation analysis
show that the impact of CSR integration on company performance is contingent and dependent
on business and CSR strategies, company size and industry type. Finally, this thesis is one of
the first to empirically investigate the performance implications of integrating CSR into
business strategy and reveals new findings on how such integration can substantially improve
company performance.
From a practical perspective, the findings of this thesis have important implications for
executives and managers, particularly those working in manufacturing companies in
developing countries. First, executives and managers can be better motivated to integrate CSR
into their company strategies more strategically and to conduct business operations consistent
with CSR practices. In doing so, CSR should be incorporated from upstream to downstream or
along the value chain, covering all functions within the company and connecting to internal
activities of the company. Second, this thesis provides key findings that instead of undertaking
CSR as mere charity, philanthropy or compliance activities (as many currently practice),
companies integrating CSR with their business strategy can benefit from considerable, positive
impacts on their financial and non-financial performance, which in turn could enhance their
competitive advantage.
In addition, this thesis makes recommendations to decision makers, such as the Indonesian
government. First, they should not only make it mandatory for companies to engage in CSR,
but they should also establish clearer and more extensive guidelines. Companies could then

13
understand to what extent they can implement CSR and the scope of CSR that they can carry
out. Second, the government can communicate regulations and guidelines more frequently and
effectively on their official websites, at association conferences and annual gatherings, and
through awards. In this way, large companies and small and medium enterprises (SMEs) can
recognise the regulations and understand how to comply with them.
1.5 Overview of Research Methodology
This section presents an overview of research methodology applied in this thesis. It starts
with a research paradigm and a research framewok, followed by a research method, a survey,
as well as a data collection. Then, it describes a data analysis that will be conducted in this
thesis and research findings briefly.
This thesis adopts a positivist research paradigm and applies a deductive research design as
it seeks to develop and validate a theoretical model. The theoretical framework is based on
stakeholder and contingency theories. The framework describes the relationship between
strategic and functional integration and company performance, including customer, employee,
operational and financial performance. The theoretical framework contains 47 hypotheses. This
thesis examines several mediating and moderating effects in the relationship between CSR
integration and company performance.
This thesis conducts an explanatory study and uses quantitative research to address the
research questions proposed. It considers three essential dimensions of strategic CSR
integration: (1) aligning CSR with the company’s strategy, (2) gaining support from top
management, and (3) developing effective communication. Functional CSR integration
comprises six critical dimensions: (1) Cost, (2) Innovation, (3) Quality, (4) Supplier, (5)
Customer, and (6) Employee. To comprehensively analyse the impact of CSR integration,
company performance is assessed across four criteria: customer, employee, operational and
financial. The items for integration and company performance are adopted from previous

14
research on strategic management, CSR, and manufacturing. To examine the mediating effect
of the CSR integration-company performance relationship, this thesis uses business and CSR
strategies. Business strategy follows the most widely-used typology from Porter (1980a). The
measurement of CSR is borrowed from Maignan and Ferrell (2000, 2001), based on Carroll’s
four dimensions (Carroll 1979, 1991). In addition, this thesis uses company size and industry
type. Company size uses the number of employees to define small, medium, and large
companies. The criteria for company size follow the classification from Statistic Indonesia or
Badan Pusat Statistik (BPS 2017a). Industry type includes environmentally sensitive industries
(ESI) and non-ESI, and the criteria for industry type were based on the literature review and
prior studies.
To facilitate respondent understanding of the survey, the questionnaire developed was
translated from English to Indonesian using a back-translation method. Pre-tests were
conducted to ensure the survey questions were clear, concise, and specific to the context. Prior
to data collection, the questionnaire was submitted and approved by RMIT University’s Ethics
Committee. Before conducting the survey, a pilot test was undertaken with 30 respondents.
After the pilot test, the main survey with a non-probability purposive sampling method was
officially carried out across five regions in Java, Indonesia: East Java, Central Java,
Yogyakarta, West Java, and Jakarta.
From June to October 2018, the self-completion questionnaires were distributed through
post, e-mail, and personal delivery survey. In total, surveys were sent to 1,055 manufacturing
companies, and 514 surveys were returned. After data screening, 435 usable responses
remained, with a final response rate of 41.23%, which were used for data analysis.
To provide a plausible answer for each research question and research objective (Section
1.3), Statistical Product and Service Solutions (SPSS) 26 and partial least square structural
equation modelling (PLS-SEM) were employed for a series of comprehensive data analyses.

15
Specifically, SmartPLS 3, a professional software of PLS-SEM, was used to determine a model
specification that contained constructs and indicators, and to develop a model. Then, the
evaluation of the model was conducted in two steps: (1) the measurement model and (2) the
structural model. This thesis examined the direct effects, indirect effects, and total effects to
explore direct relationships and mediating effects. In addition, multi-group analysis (MGA)
was performed to assess the mediating effects.
The findings of this thesis demonstrate that structural and functional integrations have an
essential role in achieving better financial and non-financial performance. More specifically,
the findings show that customer, employee, and operational performance can significantly
mediate the impact of CSR integration on financial performance. Notably, the findings suggest
that business and CSR strategies can substantially moderate the effect of CSR integration on
company performance. Also, company size and industry type can significantly affect this
integration’s impact on company performance.
1.6 Structure of Thesis
This section describes the structure of the thesis, which is divided into seven chapters as
seen in Figure 1.1:
1. The first chapter has introduced the background of the research and the justification for this
thesis. This chapter briefly outlined the research questions and outlined the potential
contributions and implications of the research.
2. Chapter 2 presents the literature relevant to this thesis. This chapter provides a critical
review of existing literature about the integration of market and non-market strategies,
followed by CSR-related concepts, business strategy, CSR integration, and company
performance. This chapter also discusses the findings of prior studies regarding CSR
integration. Based on an extensive and critical literature review, this chapter explains the

16
research gaps that the thesis aims to address. Besides, this chapter offers an overview of the
Indonesian context around CSR implementation and the manufacturing industry.
Figure 1.1 Thesis Outline
3. Chapter 3 presents the research framework by explaining the theories used to underpin this
thesis. As a result, this chapter provides the theoretical framework that describes the extent
to which CSR integration has an impact on company performance in the context of the
Indonesian manufacturing industry. This theoretical framework is used as a guide to propose
47 hypotheses and analyse the findings of current empirical research on CSR integration.
4. Chapter 4 explains the research approach, the research paradigm and the research design
employed by this thesis. This chapter also presents the methodology that includes the
questionnaire development, sampling process and data collection. The data analysis
procedure is then explained, followed by a preliminary analysis of collected data which
included testing for nonresponse and common method bias, data screening, and identifying

17
respondents’ characteristics. Information of PLS-SEM is presented as a multivariate
analysis technique employed to analyse the data. Ethical considerations are also explored.
5. Chapter 5 presents the results related to strategic CSR integration. The conceptual model
proposed in Chapter 4 is tested and validated through rigorous steps of multivariate analysis.
The reflective and formative measurement models are explained, followed by the structural
model assessments. The mediation analysis is presented to examine the mediating effect of
business and CSR strategies. The following chapter provides MGA to investigate the
moderating effects of company size and industry type. The last section of this chapter
provides the results of the hypotheses testing.
6. Chapter 6 explains the results related to functional CSR integration. The descriptive
statistical analysis, model specification, model assessments, mediation and moderation
analyses of functional CSR integration are presented. To explain the results, a discussion is
provided, followed by the verification of hypotheses. The last section provides the results,
discussion, and hypotheses testing for the combined CSR integration.
7. Chapter 7 provides an overview of the entire thesis and highlights key findings in response
to the research questions. The conclusion of this thesis is then described in this chapter. The
final research model is presented to incorporate the research findings. Also, methodological
and theoretical contributions are explained, followed by practical implications for
executives and top managers as well as policymakers. This chapter finishes with limitations
of the study and recommendations for future research.
1.7 Summary of Chapter 1
This section provides a summary of this chapter. This introductory chapter presents an
overview of the thesis. It provides a discussion of the research background and explained the
research questions and objectives. This chapter also describes the theoretical and practical

18
research contributions of this thesis. An overview of research methodology is briefly discussed
and finally, the chapter outlines the structure of the remaining thesis.

19
CHAPTER 2: LITERATURE REVIEW
This chapter reviews the available literature by focusing on the theoretical background and
findings from previous research. The existing literatures are divided into the following sections:
(1) non-market strategies (NMS), (2) CSR, (3) business strategy, (4) the integration of CSR
and business strategy, and (5) company performance. Following these five sections are two
more subsections that (6) identify research gaps and (7) provide a brief description of Indonesia
as the context for this thesis.
2.1 Non-Market Strategies
This section explains NMS that underpin CSR. It identifies the distinction between NMS
and market strategies, followed by integrating NMS and market strategies.
The business environment consists of two inter-related components: market and the non-
market environments. The market environment includes activities governed by the market or
private agreements. In addition to the market environment, businesses are embedded in the
non-market environment, characterised by the social, political, and legal arrangements that
structure interactions beyond, but in conjunction with, the market and private agreements and
that restrict or facilitate the activities of companies (Baron 1995a, 1997; Yoo 2015). Efficient
management of the non-market environment shapes the operating climate in which businesses
compete but also enhances and promotes their competitive advantages (Baron 1995a).
The non-market environment differs from the market environment in several important
respects. First, the market environment includes suppliers, customers, and competitors. On the
contrary, non-market environments mainly consist of government, regulators, citizens, media,
activists, and non-governmental organisations (NGOs) (Bach & Allen 2010; Mellahi et al.
2015). Second, in the market environment, companies usually compete for resources, revenues,
and profits, while the non-market environment considers ethical behaviour, policy achievement
and social responsibility (Doh, Lawton & Rajwani 2012).

20
The inter-relationship between the market and non-market environments requires executives
to be responsible for performance in both environments. To achieve good performance,
companies operate and take strategic actions in both the market and non-market environment
(Rudy & Johnson 2013). They use a market strategy that consists of the suppliers, customers,
and competitors to handle the market environment (Doh, Lawton & Rajwani 2012) and focus
on creating value for customers, shareholders, and society.
As non-market forces are crucial, and the ‘rules of the game’ of market competition are
often influenced by various non-market players, including regulators and activist groups, in
addition to market strategy, companies also need NMS (Baron 1995b; Xie, Li & Xie 2014).
NMS is generally defined as a company’s efforts to arrange the institutional or social context
of economic competition to improve its performance (Baron 1995a). Similar to market strategy,
the goal of NMS is to achieve superior performance by creating and maintaining competitive
opportunities and advantage, creating a favourable climate for improving the performance of
companies and the industry in which they operate, and effectively resolving specific non-
market issues (Baron 1997; Xie, Li & Xie 2014). There is a need for long-term strategic
commitment to NMS and the variety of mechanisms across different levels through which
strategies are operationalised (i.e., individual companies, national alliances, and global
coalitions) (Lawton, Doh & Rajwani 2014).
NMS has two broad functions, namely buffering and bridging (Meznar & Nigh 1995).
Buffering techniques are used to protect an organisation from the external environment by
attempting to prevent the environment from interfering with internal activities and trying to
influence the external environment (Meznar & Nigh 1995). In contrast, bridging techniques are
used to meet and fulfil regulatory requirements by fostering organisational compliance with
changing social standards and focusing on integrating non-market issues with market strategy
(Meznar & Nigh 1995; Yoo 2015). Through bridging techniques, a company may actively

21
adapt to its external environment (environmental protection, public policy, social culture) in
the process of making strategic choices so as to meet and exceed stakeholder expectations (Yoo
2015). Either buffering or bridging may be used to enhance overall company performance,
rather than impact only economic performance (Yoo 2015).
CSR and corporate political activities (CPA) are two critical approaches that companies use
to strategically manage their non-market environment (Du, Bai & Chen 2019; Lawton, Doh &
Rajwani 2014; Mellahi et al. 2015). Increasingly, CSR is considered an essential element of
any NMS (Baron & Diermeier 2007) that needs to be effectively integrated with a company’s
market strategy (Yoo 2015).
Baron (1995a) used the term ‘integrating market and non-market strategies’ for the first
time. In this respect, integration means simply a combination (i.e., simultaneous use) of market
and non-market strategies. Baron (1997) affirms that synergies exist between market and non-
market strategies that can be achieved when these two strategies are integrated. Moreover, for
an effective business strategy, these two strategies should be tailored to a firm’s market and
non-market environment, as well as to a firm’s competencies (Baron 1997). In competitive
arenas, integration of those strategies are a primary determinant of advantage (Lawton, Doh &
Rajwani 2014).
Furthermore, Baron (1997) suggested three levels of integration. The first level is that of the
overall business structure (e.g., the defining of the company’s business lines), the company’s
boundaries (what it does and what others do with it), internal company governance and
compensation systems, and standards of conduct based on ethical principles and responsibility
concepts. At the second level, a company’s strategy explicitly competes against other
companies’ strategies. The second level is where the integration of market and NMS is most
productively considered. Last, integration at the third level involves coordination of several
functions, such as finance, production, and marketing.

22
As an emerging topic in the literature (Mellahi et al. 2015), the integration of market and
NMS is very important (Xie, Li & Xie 2014). With the progress of NMS research, increasing
attention has been given to empirical analysis of the relationship between integrated strategies
and company performance (Xie, Li & Xie 2014). Surveying journal articles across a 15-year
period from 2000 to 2014, Mellahi et al. (2015) provided a review on the link between NMS
and organisational performance and identified the mechanisms through which NMS influences
organisational performance. The logical response to the question why companies should
integrate market and NMS is that there is advantage from this alignment (Xie, Li & Xie 2014).
The benefit of integrating non-market and market strategies lies in the synergy between the
two. Only when the right content is incorporated and smoothly coordinated does high synergy
from the integration of non-market and market strategies result (Xie, Li & Xie 2014).
In conclusion, business should deal with its market and non-market environments and, as a
result, implement market and non-market strategies. Synergy can be achieved by integrating
both strategies. According to prior research, there are a number of benefits from such
integration.
2.2 Corporate Social Responsibility
Following on from the prior section, this section explains more about CSR, a critical element
of NMS. This section is divided into four subsections, each of which explains (i) CSR
definitions, (ii) CSR dimensions, (iii) CSR strategies, and (iv) different theories in CSR studies.
A broad variety of NMS includes CSR (Baron & Diermeier 2007), which has received much
attention in the managerial and organisational literature (Tuzzolino & Armandi 1981) and has
been the focus of intense debate and concern over the past three decades (Jamali 2008).
Business and society interdepend intensely and dynamically (Afrin 2013), and CSR is the most
frequently used term to suggest the correlation between the two (Branco & Rodrigues 2006)
for various literature and business practices (Carroll & Shabana 2010). CSR clarifies that

23
companies have an obligation to bear their social and environmental responsibilities, beyond
legislative compliance and individual liability demand (Blowfield & Frynas 2005).
Consequently, all companies, regardless of their size, sector, or location, must pay attention to
CSR (Martinuzzi & Krumay 2013). As CSR has become more popular (Campbell 2007; Carroll
& Shabana 2010; Malik 2015) and important to business organisations (Zatwarnicka-Madura
et al. 2019) over the past two decades, companies have attempted to comply with legislation
and seek advantages from it (Razafindrambinina & Sabran 2014).
2.2.1 CSR Definitions
In this subsection, a number of CSR definitions that have been used in previous studies are
provided. Specifically, the definitions are relevant to the topic of this thesis.
The extensive literature provides various definitions of CSR (Ağan et al. 2016). Bowen
(1953) described CSR as a manager's obligation to implement those policies, make certain
decisions or follow the lines of action that are appropriate in terms of our society's goals and
values. The World Business Council for Sustainable Development involved economic, ethical
and social considerations and declared CSR to be a continuous business agreement to have
ethical behaviour and to benefit from sustainable economic development; while at the same
time enhancing the quality of life of employees, their families, the local community and wider
society (Moir 2001). Kotler and Lee (2005) defined CSR as a commitment to improve
community well-being through discretionary business practices and the contributions of
corporate resources. Dahlsrud (2008) identified 37 definitions of CSR used in 27 studies from
1980 to 2003. Findings from this study suggested the five most frequently used dimensions of
CSR: economic, social, environmental, stakeholder and voluntary. Moreover, Turker (2009)
expressed CSR as the behaviours of a company that aim to have a positive impact on social
and non-social stakeholders and go beyond their economic interests.

24
The European Commission declared CSR to be ‘a concept where-by companies integrate
social and environmental concerns in their business operations and in their interaction with
their stakeholders on a voluntary basis’ (European Commission 2011, p. 3). From this
definition, compliance of a voluntary nature and to an extent beyond that required as the
minimum, are essential components. In 2011, this definition was expanded by declaring that
companies should embrace social, environmental, ethical human rights and consumer concerns
into their business operations and core strategies when collaborating with their stakeholders.
This definition underlines two objectives of CSR: (1) maximising the creation of value for
shareholders and the community, through a long-term strategic approach to CSR and the
development of products, services and innovative business models; and (2) identifying,
preventing and mitigating its possible negative impacts (European Commission 2011). CSR is
generally regarded as an approach that can make business processes more open and socially
accountable (Asif et al. 2013) and can be considered as the companies’ ability to be socially
responsible for the development and growth of the societies where they run their businesses
(Adeneye & Ahmed 2015). Furthermore, using a quantitative analysis of 110 definitions from
1953 to 2014, Sarkar and Searcy (2016) suggested six core dimensions underpinning the CSR
concept, namely economic, social, ethical, stakeholders, sustainability and voluntary.
Specifically regarding integration, Rasche, Morsing and Moon (2017, p. 6) emphasised that
CSR indicates ‘the integration of an enterprise’s social, environmental, ethical, and
philanthropic responsibilities towards society into its operations, processes and core business
strategy in cooperation with relevant stakeholders’. CSR is considered to be the way in which
a company transparently and accountably integrates social, environmental and economic issues
into their beliefs, culture, decision-making, strategy and operations, thereby creating best
practices within the company, generating wealth and improving society (Afrin 2013).

25
Indeed CSR can be defined using many terms, all of which express common sense with
regards to the activities, relationships and responsibilities of companies to and with society
(Branco & Rodrigues 2006). Based on the basic concept of CSR, business and society are not
separated into different entities; it connects them (Wood 1991). Nonetheless, the definition of
CSR depends in particular on the local context and understanding of the relevant stakeholders
(Welford, Chan & Man 2008). van Marrewijk (2003) suggested that effective CSR strategy
needs a specific context for each individual organisation, such as which CSR issues should be
monitored and how to embrace stakeholders. Similarly, Aguinis and Glavas (2012) highlighted
that institution-based policies and practices can affect how CSR is defined, because parties at
all levels of analysis (institutional, organisational and individual) have an effect on different
stakeholders.
The many attempts at defining CSR cannot provide a definitive description of CSR. Several
studies consider various terms as being interchangeable with CSR, such as corporate
citizenship (Dahlsrud 2008; Glavas & Piderit 2009; Matten & Crane 2005; Vidaver-Cohen &
BrØNn 2008), corporate social accountability (Aqueveque & Encina 2010; Laufer 2003) and
corporate sustainability (Eccles, Ioannou & Serafeim 2014; Grewatsch & Kleindienst 2015;
Lai, Lin & Wang 2015; Lourenço & Branco 2013; Salzmann, Ionescu-somers & Steger 2005;
Windolph, Harms & Schaltegger 2014).
Nonetheless, several definitions of CSR describe CSR as a multidimensional concept that
covers a number of areas, such as the community, employees, customers, the environment, and
human rights. Some of these areas refer to stakeholder needs, for instance, the needs of
employees and customers, whereas other areas relate to benefits to the community, such as the
environment and human rights (Yuan et al. 2020).
Overall, this subsection covers a variety of CSR definitions that are pertinent to this thesis’s
topic. The majority of CSR definitions describe the interaction between business and society

26
while considering the stakeholders' interests. Several definitions, in particular, emphasise the
need of integrating companies’ responsibilities into their business strategy and operations. This
subsection also mentions various terms that can be used interchangeably with CSR.
2.2.2 CSR Dimensions
This subsection explains the dimensions of CSR. Carroll (1979, 1991) proposed that CSR
could be viewed from four distinct and separate perspectives:
1. Economic responsibilities. Business has traditionally been conceptualised as an economic
entity with a responsibility to produce and provide goods and services as efficiently as
possible, while making an acceptable profit (Carroll 1979, 1991; Jamali 2006) and fulfilling
the consumer needs of society (Aupperle, Carroll & Hatfield 1985).
2. Legal responsibilities. Business is expected to comply with the laws and regulations
promulgated by federal, state, and local governments as the ground rules under which it
must operate (Carroll 1991).
3. Ethical responsibilities. Ethical responsibilities embody the standards, norms, or
expectations that reflect a concern for what customers, employees, shareholders and the
community regard as fair, just, or in keeping with the respect or protection of the
stakeholders' moral rights (Carroll 1991).
4. Philanthropic responsibilities or discretionary responsibilities (Carroll 1979). Philanthropy
encompasses corporate actions undertaken in response to society's expectations that
businesses be good corporate citizens. Philanthropy is discretionary or voluntary despite
societal expectations that businesses (Carroll 1979, 1991) give back to society with nothing
to expect in return (Galbreath 2006).
Carroll’s definition of CSR addresses the range of obligations that businesses have to society
(Garriga & Melé 2004). This definition has been one of the most accepted and widely used

27
definitions of CSR in academic research (Dhanesh 2014) and is recognised as comprehensive
and integrative by numerous theorists and empirical researchers (Wang & Berens 2015).
Overall, CSR contains four essential dimensions that describe the companies’ responsibility.
These four dimensions are seen to be comprehensive and integrative and have been employed
extensively in previous research.
2.2.3 CSR Strategies
This subsection opens with an explanation of why having a CSR strategy is crucial. The
four CSR strategies used in this thesis are then presented. This subsection also discusses the
link between CSR strategies and company performance.
A CSR strategy can be defined as ‘plans, investments and actions put into practice by a
company within the scope of attaining sustained competitive advantages and, simultaneously,
better social and economic performances’ (Husted & Allen 2001, p.3, cited in Marques-Mendes
& Santos 2016). A common, critical problem with CSR practice is that companies often
implement various CSR programs but do not align them with strategy (Rangan, Chase & Karim
2012). Consequently, it is important to have a CSR strategy that unifies a diverse range of the
company’s philanthropic giving, supply chain, and system-level initiatives all under one
umbrella (Rangan, Chase & Karim 2012). By selecting an appropriate CSR strategy, companies
benefit, such as through reducing their costs and risk, increasing their profits and competitive
advantage, improving their reputations and legitimacy, and creating synergistic values (Kurucz
et al., cited in Ganescu 2012b).
Galbreath (2006) highlighted that how companies respond to their responsibilities will have
an impact on how they practice shared value creation, which can be described by four types of
CSR strategy (Wood 2010):
1. Reactive. Companies implement reactive strategy if they apply CSR at the basic level
required to meet their regulatory compliance (Torugsa, O'Donohue & Hecker 2013).

28
Companies that apply reactive strategy reject social responsibility and do less than required
by societal standards (Maignan et al. 1999). They passively meet regulations, or react to
protect their corporate image after unethical behaviour has been reported (Wagner, Lutz &
Weitz 2009).
2. Defensive. Companies that apply a defensive strategy reject their ethical responsibilities and
protect their interests within the legal framework (Ganescu 2012b).
3. Accommodative. Companies adopt the accommodative strategy by supporting certain
ethical responsibilities, particularly those of their stakeholders, without initiating voluntary
actions for the common good (Ganescu 2012b).
4. Proactive. Companies that apply the proactive strategy aim at transforming their operational
activities to achieve eco-efficiency and develop environmental-friendly products/services
(Bos-Brouwers 2010). They can actively manage the sustainability of economic, social and
environment efforts, and support their CSR activities (Wagner, Lutz & Weitz 2009) beyond
the compliance (Torugsa, O'Donohue & Hecker 2013). They engage in CSR to avoid any
negative reports that could be received by their external stakeholders (i.e., customers) (Du,
Bhattacharya & Sen 2007).
These four types of CSR strategy describe that organisations can be seen to function across
a spectrum of CSR from reactive to proactive (Carroll 1979; Wartick & Cochran 1985).
However, most studies use only two of these strategies: reactive and proactive (Bocquet et al.
2013; Chang 2015; Goran & Greg 2004; Groza, Pronschinske & Walker 2011; Torugsa,
O'Donohue & Hecker 2013).
Several prior studies examined the relationship between CSR strategy and company
performance. For instance, Groza, Pronschinske and Walker (2011) conducted two
experiments to reveal consumer preferences for communicated CSR information using the
theory of attribution and persuasion knowledge model (PKM) as a theoretical basis. Study 1

29
analysed the mediating role of the attributions in explaining the relationship between CSR
strategy (i.e., proactive vs. reactive) and attitudes toward the company and purchasing
intentions. Study 2 examined how the source of knowledge (i.e., internally vs. externally
published) and the position of the CSR initiative (i.e., local vs. non-local) influenced the
attributed motivations of customers. Taken together, the findings indicated that the attributions
helped clarify how customers respond to the CSR initiatives and (as expected by the PKM)
these presumed motivations could be influenced by specific message characteristics.
Companies should take enhanced steps to disclose proactive CSR information from internal
sources to maximise the positive returns from CSR investments. Alternatively, companies
should rely on information from external sources to transmit any divisive information to reduce
any potential negative effects.
Torugsa, O'Donohue and Hecker (2012) empirically explored the relationship between three
specified capabilities (shared vision, stakeholder management and strategic proactivity),
proactive CSR and financial performance. Using quantitative data collected from a sample of
171 SMEs in the Australian machinery and equipment sectors, they found all specified
capabilities are positively correlated with SMEs' adoption of proactive CSR, and that proactive
CSR, in effect, is correlated with improving company financial performance (CFP). In addition,
Torugsa, O'Donohue and Hecker (2013) highlighted the economic dimension of proactive
CSR. Selectively focusing on proactive social and environmental aspects of CSR that drive and
maintain economic performance is crucial to sustainable, long-term financial SME
performance.
With a sample of 155 French SMEs, Vo, Delchet-Cochet and Akeb (2015) compared the
roles of economic, social, and environmental motives in driving SMEs to make CSR an integral
part of their strategic planning and daily operational performance. The results showed that the
economic motive had the highest effect in driving French SMEs to integrate CSR into their

30
business strategy. The social motive comes second, while there was no relation to the reactive
environmental motive. Specifically, regarding environmental measures, only proactive
environmental motives, which indicate the degree to which the organisation transforms its
business practices and operations to protect the environment, play a role. Reactive companies
could not gain competitive advantage from CSR because they only enforced CSR to comply
with regulations.
Moreover, Chang (2015) developed a framework to examine whether CSR plays a
mediation role between green organisational culture and green product innovation
performance. After dividing CSR into proactive CSR and reactive CSR, the empirical results
verify that green organisational culture positively impacts the performance of proactive CSR
and green product innovation. Proactive CSR mediates the positive relationship between green
organisational culture and green product innovation performance, but reactive CSR does not.
Green organisational culture is a driving force for proactive CSR and green product innovation
performance.
In summary, there are four CSR strategies explained in this subsection: reactive,
accommodative, defensive, and proactive. These four strategies represent how companies carry
out their responsibilities. Previous research examined the relationship between CSR strategies
and company performance. Most of them highlighted that adopting a proactive strategy
provides various benefits for companies.
2.2.4 Different Theories in CSR Studies
This section goes through various theories that have been employed in CSR studies. The
stakeholder theory, which is used in this thesis, is explained in further detail.
Previous studies on CSR apply different theories that refer to the links between company
and society, including stakeholder, institutional, legitimacy, resource-based view (RBV),
resource dependency theory (RDT), and agency theories. In particular, stakeholder,

31
institutional, legitimacy and RDT stress the role of external actors in terms of managerial
practices of a company and focus on nature correlation between the company and society as
well as the environment (Frynas & Yamahaki 2016). On the other hand, for studies focused on
companies’ internal processes, RBV and agency theories are more appropriate (Frynas &
Yamahaki 2016).
Institutional and stakeholder theories can be implemented to understand the essential
interconnections between business and society (Chen, Feldmann & Tang 2015). Frynas and
Yamahaki (2016) suggested that institutional or stakeholder theories can serve multilevel
analysis that includes macro-level (between the company with outside stakeholders), meso-
level (among company’s member), and micro-level (individual) factors. Stakeholder and social
exchange theories are the major theories used to explain the correlation between CSR and
company performance. Social exchange theory explains interconnections between business and
society. Because members of society buy a company’s products, the company gives back to
society through CSR activities (Adeneye & Ahmed 2015).
Stakeholders are groups and individuals who can affect, or are affected by, the achievement
of a company’s mission (Freeman 2010). As any business operation directly or indirectly
affects stakeholders (Shital 2014), stakeholder theory argues that companies have obligations
not only to shareholders but also to stakeholders (Freeman 2010). Internal stakeholders consist
of the owners, managers and employees of a company who stay within the company’s borders,
whereas external stakeholders include the suppliers, customers, communities and government
(Freeman 2010).
Furthermore, companies need to focus on primary and secondary stakeholders (Hult, cited
in Tore 2012). Primary stakeholders are essential for the company's continued life (Ihlen 2008)
and include investors, employees, customers, suppliers and public stakeholder groups, such as
governments and communities that include services and markets, whose laws and regulations

32
must be followed, and to whom taxes and other liabilities may be due (Clarkson 1995).
Secondary stakeholders are directly or indirectly affected by the decisions of a company (Ihlen
2008). However, they do not participate in transactions with them and are not necessary for
their survival. Examples of secondary stakeholders include the media and special interest
groups (Clarkson 1995).
CSR relates to how to manage internal and external stakeholders of the company ethically,
socially and responsibly to improve living standards while conserving the company
profitability for internal and external stakeholders (Hopkins 2005). Subsequently, CSR
practices can be complex and risky from a managerial perspective because they have to
consider how to respond to a variety of internal and external stakeholder pressures and how to
evaluate whether CSR practices will fit with existing business operations (Yuan, Bao &
Verbeke 2011). Accordingly, stakeholder theory can aid in understanding the CSR practices of
companies to address stakeholder interest. Company behaviours reacting to stakeholder
expectations of being a socially responsible corporate citizen in society can be demonstrated
by how they identify and implement CSR activities (Zhu, Liu & Lai 2016). Moreover,
stakeholder theory is capable of explaining part of the relationship between CSR and financial
performance. Most studies focused on the stakeholder theory's instrumental approach indicate
that adherence to values and practises in collaboration with stakeholders helps the company
meet its goals as well as or better than their rivals (Chtourou & Triki 2017).
As mentioned above, CSR studies employ a variety of theories. They can use stakeholder,
institutional, and legitimacy theories, as well as RDT, to manage the connection between the
company and society or the company and the environment. RBV and agency theories, on the
other hand, might be used when focusing on a company's internal processes. In light of the
research objectives determined in Chapter 1, stakeholder theory is considered to be appropriate
for use in this thesis.

33
2.3. Business Strategy
Following an explanation of CSR as a critical component of NMS, this section discusses
business strategy. There are two subsections in this section. First, the generic strategy of Porter
is explored. Second, it elucidates the link between business strategy and company performance
and provides several previous studies focusing on this topic.
Strategy is a collection of plans and policies through which an organisation tries to obtain
benefits over its rivals (Skinner 1969, p. 139). Usually a strategy involves product plans and
the marketing of goods to a particular group of customers (Skinner 1969). Business policy
theoretical literature has increasingly stressed the distinction between three levels of
organisational strategy: (1) corporate-level strategy, which deals with questions about what
business to compete in, (2) business-level strategy, concerned with questions about how to
succeed within a given business (Beard & Dess 1981) and (3) functional level-strategy (Hax &
Majluf 1984; Venkatraman 1989). Corporate-level strategy deals with domain selection, such
as the vertical, horizontal and market reach, relationship, and level of cooperation between the
different companies (Bourgeois 1980). Corporate strategy explains what an organisation does
and how the organisation interacts to achieve success (Weir et al. 2000). Business-level strategy
involves domain navigation, that is, how the organisation competes successfully in an industry
(Beard & Dess 1981; Weir et al. 2000). Business strategy defines the long-term plan of action
a company may pursue to achieve its goals (Zahra & Covin 1993). On the other hand,
functional-level strategy describes how functions will contribute towards a business strategy
(Weir et al. 2000) by optimising the productivity of resources within each particular function,
and is typically derived from the business strategy (Schendel & Hofer, 1979, cited in
Nandakumar, Ghobadian & O'Regan 2011). Traditionally, these three levels of strategy form
a hierarchy that implies a top-down approach to formulating a strategy (Weir et al. 2000).

34
Compared to other the two strategies, business strategy offers a focus for a vast majority of
the strategy research studies (Nandakumar, Ghobadian & O'Regan 2011). More specifically,
business or market strategy describes how to position companies in their competitive
environment and/or develop their strategic capabilities in a way that allows them to gain an
advantage against their competitors (Porter 1987). The concept of aligning companies’
resources with environmental challenges and opportunities is embedded in business strategy
(Lawton, Doh & Rajwani 2014).
2.3.1 Porter’s Generic Strategy
This subsection discusses Porter's generic strategy, which is one of the most extensively
used business strategy in management studies. Porter (1985) developed a framework that
outlines how firms might choose a generic strategy to compete effectively, namely either a cost
leadership strategy or a differentiation strategy. In the literature of business policy, this
framework is a dominant paradigm (Hill 1988) that tends to be most effective because it builds
on previous findings and is specific and unambiguous (Hambrick 1983).
The purpose of cost leadership strategy is to make the company’s products at the lowest cost
possible in the company’s industry. Reduced costs in manufacturing operations are critical for
the implementation of a cost leadership strategy (Porter 1985). As cost leadership emphasises
producing standardised products at a low per-unit cost for price-sensitive consumers (David &
David 2014; Ramachandran 2011), companies that adopt this strategy need to tightly control
their costs, refrain from incurring too many expenses from innovation or marketing and cut
their prices when selling the products (Porter 1985), as they see cost management as their
highest priority (Liu, Li & Li 2019). Nonetheless, lower cost, while not neglecting quality,
service and other areas, emphasises a company's ability to design, manufacture and sell a
standardised product or service more efficiently than its competitors, with a focus on cost
benefits from all sources (O'Farrell, Hitchens & Moffat 1992). In addition, cost leadership

35
means offering customers value at a lower cost equivalent to that provided by rivals (Spanos,
Zaralis & Lioukas 2004).
On the other hand, differentiation strategy requires the development of goods or unique
services that are unmatched, by relying on the customer’s loyalty to the brand. Companies can
provide a product or service that is of superior value to customers (O'Farrell, Hitchens & Moffat
1992; Ramachandran 2011), for instance, with higher quality, better performance or unique
features so that they can justify higher prices (Galbreath 2009; Hax & Majluf 1984; O'Farrell,
Hitchens & Moffat 1992; Porter 1985; Valipour, Birjandi & Honarbakhsh 2012).
To sum up, Porter developed two major types of business strategy. The cost leadership
strategy focuses on cost, whereas the differentiation strategy emphasises the distinctivenesss
of a company's products or services. In this thesis, these two strategies are used to show how
companies employ them to run their businesses.
2.3.2 Business Strategy and Company Performance
Following on from the preceding subsections, this one explains how business strategy
affects company performance. It begins by presenting several previous studies on this topic.
Then, it summarises their main points in a table.
Porter's framework also contains a theoretical proposition about the business strategy's
effect on business performance. Porter (1980a) contends that cost leadership and differentiation
strategies can lead to success. However, as each requires different resources and organisational
configurations, they are incompatible, and only those companies that can focus on one will
achieve excellent performance (Dess & Davis 1984; González-Benito & Suárez-González
2010).
Using the business strategy typology of Porter, several studies have investigated the
relationship between business strategy and company performance. For example, Dess and
Davis (1984) established a construct validity of Porter's typology and concluded that companies

36
following generic strategies performed very well. By introducing a game-theoretical model of
oligopoly competition, Karnani (1984) offered analytical support for differentiation strategies
and cost leadership. He concluded that a low cost or differentiated position would lead to
greater market share, which in effect would lead to higher profitability.
White (1986) analysed how cost leadership and differentiation strategies impact the business
unit performance. With organisational data obtained from 69 business units, the findings
showed how performance differences, such as sales growth and return on investment (ROI) for
business units, are related to organisational differences through Porter's generic strategies of
overall cost leadership and differentiation. Business units with pure cost strategies actually
achieve higher ROI when they have low autonomy.
Robinson and Pearce (1988) then examined the strategy-performance relationship in 97
manufacturing firms representing 60 different industries. They found significant performance
differences across selected groups. Strategic orientations emphasising product innovation or
those combining strategic behaviour patterns of 'efficiency' and 'differentiation' were correlated
with significantly higher levels of performance than other groups.
With a sample of service companies in Scotland and England, O'Farrell, Hitchens and
Moffat (1992) investigated whether companies pursuing a clear-cut strategy (focus
differentiation, differentiation or low cost leadership) achieved a superior performance. They
found that commitment to at least one of these three strategies would lead to better performance
than if companies failed to develop a generic strategy (that is, stuck-in-the-middle, in terms of
Porter’s model). Thus, their empirical evidence supports the idea of a strategy-performance
relationship.
Moreover, Kotha and Nair (1995) analysed the effect of environment and strategy on
performance with a sample of 25 Japanese machine tool companies, using longitudinal data
over the period 1979 to 1992. Their results showed cost leadership and differentiation strategies

37
and the environment play a significant role in influencing profitability and growth. More
specifically, whereas both strategy and environmental variables are significantly related to firm
profitability, only environmental variables are associated with firm growth.
Sharma (2002) examined the pattern of adoption of Porter's generic strategies in the
Australian Manufacturing Industry through contextual factors such as an industry category, a
type of goods, a product life cycle stage, a company size, a market type and a business unit's
growth trend relative to industry. The findings suggested that there is a statistically significant
relationship between the choice of generic strategy and firm size, product life cycle stage, and
business unit's growth trend relative to industry. The findings revealed that companies adopting
cost leadership strategy had the highest performance of labour productivity in terms of sales
per employee; substantially higher than those using focus strategy or those following
differentiation and focus strategy combined. Companies pursuing the differentiation strategy
were the largest in company size, both in terms of total annual sales and number of employees.
In domestic markets, the differentiators had the highest sales growth.
Furthermore, Spanos, Zaralis and Lioukas (2004) analysed the impact of strategy and
industry factors on profitability, using data on Greek manufacturing industries. They found that
the more generic strategy dimensions included in the strategy mix, the more profitable the
strategy, provided that one of the key components is low cost. Pure strategies generally appear
to produce below average results. Companies pursuing pure differentiation strategies are less
profitable compared with those having no clear strategy. Finally, stuck-in-the-middle,
conceptualised as a particular underdeveloped form of a hybrid strategy, appears to be more
profitable than hypothesised, yielding above average performance.
Then, González-Benito and Suárez-González (2010) integrated strategies, capabilities and
performance in a single model and proposed that both manufacturing competitive priorities and
capabilities, articulated in terms of cost and flexibility, are essential for explaining the link

38
between generic business strategies and business commercial and financial performance. Using
a sample of 148 Spanish manufacturers, they noted the significant and positive indirect paths
from generic business strategies to business performance variables. Their findings suggested
that business strategy based on cost leadership must be associated with manufacturing strategy
and capabilities focused on cost reduction to be effective. In contrast, manufacturing strategy
and capabilities focused on flexibility are necessary for an effective business strategy based on
differentiation.
Moreover, Nandakumar, Ghobadian and O'Regan (2011) examined the applicability of
Porter's generic strategies in describing discrepancies in company performance through
focusing on electrical and mechanical engineering companies in the United Kingdom. The
findings of this study suggested that companies that follow one of the strategies, namely cost-
leadership or differentiation, perform better than stuck-in-the-middle companies that do not
have a dominant strategic orientation. This study identified some of the gaps in the literature
through a systematic literature review.
Banker (2017) explored the relationship between the strategic positioning of companies and
sustainability of company performance. With 12,849 firm-year data from 1989 to 2003, this
study provided empirical evidence that in general, differentiation is a source of sustainable
performance, while cost leadership is not. They found that companies adopting differentiation
strategy can sustain their current performance in the future to a greater extent than those
following cost leadership.
In terms of the Indonesian context, Omsa (2017) conducted a survey on the owners of 305
small and medium-sized wooden furniture companies in East Java, Indonesia, to investigate
how generic strategies affect company performance in terms of profit and sales volume. The
findings of this study revealed that both differentiation strategy and focus strategy have a
significant impact on company performance, while cost leadership strategy has no significant

39
impact on company performance. In addition, Ridjal and Muhammadin (2018) examined the
influence of generic strategies on bank performance. With a sample of 101 banks in Indonesia,
they discovered that low cost and focus strategies have a significant influence on companies’
financial and organisational performance.
Table 2.1 summarises the main findings of previous studies examining the relationship
between Porter’s generic strategic and company performance. In conclusion, several studies
have investigated that business strategy has a significant impact on company performance. Despite
their distinctive findings, the majority of them argued that differentiation strategy benefits the
company more.

40
Table 2.1: Results of Previous Studies of Porter’s Generic Strategies
Author (s) Findings
Dess and Davis (1984) Organisations adopting one of the strategies perform better than stuck-in-the-
middle companies.
Karnani (1984) Organisations adopting either a cost-leadership or differentiation strategy were able
to increase their market share and profitability.
White (1986) Companies following a cost-leadership strategy performed well when they had low
autonomy and differentiators performed well in conditions of high autonomy.
Robinson and Pearce
(1988)
Strategic orientations emphasising product innovation or those combining strategic
behaviour patterns of 'efficiency' and 'differentiation' were correlated with
significantly higher levels of performance than other groups.
O'Farrell, Hitchens and
Moffat (1992)
Among service companies, those adopting a differentiation strategy performed
better than the ones which are stuck in the middle.
Kotha and Nair (1995) Strategy and environment significantly influence firm profitability.
Sharma (2002) Companies that followed the cost leadership strategy had the highest labour
productivity performance in terms of sales per employee, significantly higher than
those that used focus strategy or those that used the combined strategy of
differentiation and focus. Companies that adopted the differentiation strategy were
largest in company size, both in terms of total annual sales and number of
employees. In domestic market, the differentiators also had the highest sales
growth.
Kim, Nam and Stimpert
(2004)
Cost-leaders performed at the lowest level, and companies combining cost-
leadership and differentiation strategies performed at the highest level.
González-Benito and
Suárez-González (2010)
A business strategy based on cost leadership must be associated with manufacturing
strategy and capabilities focused on cost reduction to be effective. In contrast,
manufacturing strategy and capabilities focused on flexibility are necessary for an
effective business strategy based on differentiation.
Nandakumar,
Ghobadian and O'Regan
(2011)
Cost-leaders and differentiators performed better than stuck-in-the-middle
companies in terms of both the subjective and objective performance measures.
Banker (2014) The differentiation strategy helps a company to retain its current profitability to a
greater degree than the cost leadership strategy.
Omsa (2017) Both differentiation strategy and focus strategy affect company performance, while
cost leadership strategy does not significantly affect company performance.
Ridjal and Muhammadin
(2018)
Low-cost strategy and focus strategy have a significant influence on the financial
and organisational performance.
Source: Adopted and modified from Nandakumar, Ghobadian and O'Regan (2011).
2.4. The Integration of CSR into Business Strategy
This section explores literatures discussing the integration of CSR into business strategy. It
begins by explaining findings from previous studies that are relevant to this topic, followed by

41
summarising the key points in a table. Then, it delves into the dimensions of CSR integration
at strategic and functional levels.
NMS activity should be given a major role in a company’s operations and become an
integral part of strategic activity. Resources should be allocated and several employees should
be given responsibility for non-market activity (Xie, Li & Xie 2014). Consequently, companies
should give adequate consideration to their social responsibility and managers should not think
of CSR as an optional action, but an action that must be integrated with business strategy
(Kapoor & Sandhu 2010). Social responsibility and business strategy have been examined in
different ways, relating to the company’s social and economic priorities, respectively (Izzo
2014).
To survive in modern society, a company tends to pay attention to social responsibility as
an integral part of its strategy (Galbreath 2006). In recent decades, businesses have shown a
growing interest in incorporating social elements into their business strategies with the goal of
achieving sustainable development (Huang 2010). But, most companies that understand the
importance of CSR also carry out CSR practices irrelevant to their business strategy and
obviously beyond their core competencies (Dey & Sircar 2012).
2.4.1 Findings from Prior Studies
In this subsection, previous studies that investigated the integration of CSR into business
strategy are presented. There are both qualitative and quantitative studies available. A table is
created at the end of this subsection to list their critical findings.
Several studies have been conducted on the integration of CSR into business strategy, either
conceptually or empirically. Most of them propose a process of integration that may consist of
several stages or levels and may adopt different approaches. For example, Valente (2009)
developed four approaches (alter, absorb, align, and avoid) with respect to how NMS intersect
with market strategies in the strategic management process. His typology can give an

42
understanding of how market and non-market strategies can be integrated and how companies
implement this integration differently.
Maon, Lindgreen and Swaen (2009) introduced an integrative framework of CSR design
and implementation. They suggested four stages, namely sensitising, unfreezing, moving, and
refreezing, with a nine-step process. Using stakeholder theory, they combined top-down and
bottom-up processes in the integration process and describe the roles of each stakeholder, both
the primary and secondary stakeholders, throughout the integration phase as well as presenting
specific case studies to support their explanation. In their framework, they highlighted the
importance of aligning CSR with a company’s overall goals and strategies, identifying key
stakeholders and critical stakeholders’ issues, development of an integrated CSR, and engaging
employees in implementation, monitoring and evaluation. They also introduced critical success
factors in the CSR process at the corporate, organisation, and managerial levels. Some are used
in this study as indicators in the construct of strategic and functional integration, such as
connecting CSR vision and initiatives with an organisation’s core values and competencies,
gaining key people’s commitment (directors, owners, senior managers), and training
employees in CSR-related issues.
Specifically, Guadamillas-Gómez, Donate-Manzanares and Škerlavaj (2010) recommended
three stages for the integration of CSR into a company’s strategy: the introduction,
implementation, and generalisation of CSR. Their study described how organisational
functions are involved in integration and how each stage of integration interacts with each
other. Based on an exploratory case study within a Spanish technology-intensive firm, they
demonstrated how this company has developed and performed an explicit plan for the
integration of ethical values and CSR initiatives into its corporate and business strategies.
Dey and Sircar (2012) described how some Indian companies implemented the integration
between CSR initiatives and companies’ business strategies and proposed five stages of the

43
integration conceptually. They also explained the benefits of integration for society as well as
for the company. Their arguments supported findings from prior studies that integration is
possible if there is a clear purpose shown by managers by placing CSR at the heart of their
businesses. Nevertheless, this study did not mention specific indicators or defined activities for
each stage.
Martinuzzi and Krumay (2013) then presented a referential stage model to understand the
different stages of integrating CSR into existing business operations, leading to a competitive
advantage. They suggested four stages which should occur sequentially with the impacts on
social, environmental, and competitiveness following the sequence: project-oriented CSR,
quality-oriented CSR, strategic CSR, and transformational CSR. Based on the model, they
classified the CSR practiced by companies depending on their correlation to the business
operations. They provided a new insight that the quality of management can be assessed by its
CSR implementation.
Furthermore, Asif et al. (2013) developed the framework for incorporating CSR into all
levels of business processes. Using the Plan-Do-Check-Act (PDCA) cycle, they explained that
CSR integration is an iterative mechanism requiring continuous improvement. Extending the
prior study by Maon, Lindgreen and Swaen (2009), they considered two approaches of how to
integrate CSR into business processes, namely top-down and bottom-up approaches. A top-
down approach focuses on defining stakeholder expectations and combining CSR with internal
management systems. The 'top-down integration' strategy also involves the creation of internal
measures, such as those relating to the health and safety of employees, environmental effects
and equity concerns. A top-down approach implements the necessary processes at all levels of
the organisation, determines CSR roles, and allows more systematic communication and
information flow. Thus, this approach offers a structured framework for transforming strategic
CSR priorities into business processes and incorporating various stakeholder requirements. On

44
the other hand, a bottom-up approach focuses on discussion with stakeholders in the
community and the development of indicators linked to community needs, such as the
corporation’s role in providing an appropriate quality of life. More specifically, the bottom-up
approach offers a systematic framework where companies can engage with the community to
better understand how the community affects business activities, how the company can
contribute to improving their living conditions, and what types of measures can be used to
assess quality of life improvements. Although this study offered a conceptual framework with
no evidence as to whether the framework is applicable, it suggested that CSR integration can
be conducted with many activities including vertical and horizontal integration.
In addition, Lindgreen et al. (2011) analysed the change process undertaken by Dutch
organisations, with a specific emphasis on the role of high potentials, or those individuals who
are chosen to fast track into senior management. They suggested nine stages of how to
implement CSR to achieve integration. They stated, however, that an organisation may not pass
through every stage, and the stages may progress sequentially or simultaneously, and be
repeated. This study provided an essential insight that the integration of CSR requires cultural
change driven by top management and other agents of change who push CSR principles
throughout the organisation.
Similar to prior studies, Gazzola and Colombo (2014) emphasised the role of stakeholders
in integration. They developed a model that shows that socially responsible actions should be
designed into a corporate strategy because they could contribute significantly to the generation
of wealth through intangible assets, which are the foundation of the competitive advantage of
modern enterprises.
Vitolla, Rubino and Garzoni (2016) enhanced the findings of prior studies by identifying
the driving factors and means of CSR integration. By combining two distinct methods, semi-
structured interviews and content analysis of documents and websites, they identified that CSR

45
integration depends on three factors: the macro-environment, the competitive context and the
management philosophy. Management philosophy is the internal variable that depends on the
form of strategic or operational integration. There is complete integration of CSR into the
strategic management of the business in the presence of a socially-focused management
philosophy. This applies to governance, organisational structure, strategic management
processes, stakeholder relationships and systems of human resources management. In
comparison, partial integration requires an economically-driven management aspect. As a
result, external variables influence the expectation of CSR and its integration into the
company's management, but they are not essential for strategic CSR implementation. External
environment conditions clearly support the use of formalised and standardised methods and
processes for CSR management.
Moreover, Tonysheva and Chumlyakova (2016) recommended the integration of social
responsibility into the strategic management of organisations across eight steps, which include
management tools to identify strategic priorities for CSR development. The developed model
presented the main indicators connecting strategic objectives, quantitative indicators of their
accomplishments and tactical social responsibility actions.
A more comprehensive framework was proposed by Marques-Mendes and Santos (2016),
consisting of three models: (1) ideological models, (2) procedural models, and (3)
consequentialist models. Based on the literature review regarding the integration of society and
business, they explained each stage by providing some indicators and related concepts. Their
study expanded theoretical frameworks from previous studies by analysing how integration can
comprehensively occur, starting with its strategic integration (ideological models), its
implementation (procedural models), and impact of the integration (consequentialist models).
Although those proposed models developed the framework of how CSR is integrated into
business strategy, there is a lack of empirical studies to prove their claims. One of these

46
empirical studies was conducted by Ganescu (2012b) in the European automobile industry to
highlight the impact of CSR strategies on sustainable businesses. The findings suggested the
selection and implementation of appropriate CSR strategies are important to achieve added
value through the creation and strengthening of a sustainable business. These findings were
extended by Wei et al. (2016), who examined a simultaneous consideration of ‘non-market’
and ‘market’ factors. By adopting resource-based view theory, they conducted an empirical
analysis of the relationships between resources, strategies, and performance, focusing
specifically on Chinese enterprises. Results revealed that a non-market strategy correlates
positively with a market strategy, whereas a non-market strategy has a significant indirect
impact on market performance through non-market performance.
Furthermore, Ooi, Amran and Yeap (2017) defined and conceptualised strategic CSR based
on an extensive review of the literature. They proposed strategic CSR as a formative construct.
It was then demonstrated, based on research among Malaysian companies, that the combination
of three indicators, (1) CSR values embedded in corporate vision and missions, (2) presence of
the CSR committee and (3) collaboration with NGOs, explains the meaning of strategic CSR
from an integrated perspective. The findings of this study indicated how to determine and
measure strategic CSR. Moreover, in this research, two former measurement items were
included in the proposed model as two critical components for strategic-level CSR integration:
embedding CSR into the vision and mission of the organisation (as one indicator of aligning
CSR with the company’s strategy) and establishing CSR committee (as one indicator of
obtaining support from top management).
Cazeri et al. (2018) evaluated the integration between CSR practices and management
systems in companies in Brazil and identified the best and least integrated practices. Using the
integration model proposed by Asif et al. (2013), the results revealed that all CSR practices
evaluated by the respondents had means greater than three and less than five. This result

47
indicated that CSR practices are applied superficially by companies in Brazil and ample
opportunities exist for improvement. In a comparative analysis, two practices stood out in
relation to the others: reporting of CSR results to stakeholders and evaluation of the
performance of CSR activities using pre-established indicators. Practices associated with
planning of CSR activities are the most superficially implemented, adversely affecting CSR
performance.
Table 2.2 presents an overview of the major themes of research on CSR-business strategy
integration. It is clear that most studies were conceptual research, and only a few were
quantitative studies.
As previously stated, a number of studies examined CSR integration, including both
quantitative and qualitative investigations. They built conceptual frameworks for CSR
integration that could consist of numerous stages with distinctive approaches and theories. The
important findings from prior studies helped to shape the theoretical framework for this thesis.

48
Table 2.2: Prior Studies of CSR Integration
Stages of CSR Integration Orientation Findings and Limitations
Maon, Lindgreen and Swaen (2009)
1. Raising CSR awareness inside the organisation
2. Assessing corporate purpose in a societal context
3. Establishing a working definition and vision for CSR
4. Assessing current CSR status
5. Developing an integrated CSR strategic plan
6. Implementing the CSR integrated strategic plan
7. Maintaining internal and external communication
8. Evaluating CSR-related strategies and communication
9. Institutionalizing CSR policy
Empirical qualitative
using multiple case
studies
Using stakeholder theory, the authors involved top-
down and bottom-up process and explain a defined
action for each step by presenting a good example
(case study). However, the impacts of the integration
on company performance are not defined clearly.
Valente (2009)
1. Align: the companies unite market and non-market strategies yet employ separate
organisational mechanisms for implementation.
2. Absorb: the formulation of the NMS is disconnected from the market strategy, yet
companies draws on similar organisational mechanisms to implement both of them.
3. Alter: companies change existing market strategies to coincide with NMSs and use similar
organisational structures and processes for implementation
4. Avoid: the formulation of the NMS is disconnected from the market strategy and
companies employs very different organisational mechanisms in their implementation.
Empirical qualitative
using case studies of 30
companies
A typology is based on the degree to which market and
non-market strategies intersect in the strategy
formulation and strategy implementation processes;
although this study presented some case studies that
describe the four approaches in more detail, but it is
difficult to understand the indicators for each approach
and how to measure it.
Škerlavaj, Donate-Manzanares and Guadamillas-Gómez (2010)
1. Introduction: the transmission of ethical principles and their integration into the culture
which is shared by the organisational members.
2. Implementation: knowledge management systems and organisational culture are essential
aspects in this stage to adapt the organisational structure to the new situation.
3. Generalisation: it implies a global change for the company, since CSR will be
incorporated into firm’s culture, mission and values. This third stage is completed with
reports in order to measure advances in CSR and benefits for the stakeholders.
Empirical qualitative
using case study of one
company
Using stakeholder theory, the authors showed how the
company can integrate ethical values and CSR
initiatives into its corporate and business strategies.
However, the relationships between CSR actions and
company performance are difficult to found and to get
the generalization regarding results obtained.

49
Table 2.2 (continued)
Lindgreen et al. (2011)
1. Conduct zero-assessment
2. Develop CSR goals in organisation’s mission, vision, and strategy
3. Gain top management support
4. Gain employee support to ensure they own CSR as part of their work life activities
5. Gain support from external stakeholders
6. Prioritise change effort and focus on achieving it
Empirical qualitative
using case studies of 28
companies
The authors identified the integration stages with
focusing on the involvement of leaders (high
potentials) and their impacts on the CSR
implementation.
Dey and Sircar (2012)
1. Incorporating corporate citizenship into the company’s values and aspirations.
2. Stakeholder analysis integrating CSR initiatives with the company’s core competencies.
3. Forming strategic alliances with non-governmental organisations (NGOs).
4. Integrating CSR into the company’s supply chain.
Empirical qualitative
using case studies of
four companies
The authors suggested some ways of integrating CSR
initiatives with a company’s business strategy based
on its core competencies that benefit the company as
well as the society.
Ganescu (2012)
1. Rejection
2. Ignorance
3. Compliance
4. Efficiency
5. Proactive strategies
6. Corporate sustainability
Empirical quantitative
using case studies of 13
companies
The author showed that corporate sustainability
strategies can be significantly influenced by social
responsibility strategies.
Martinuzzi and Krumay (2013)
1. Project-oriented CSR: Many companies initiate a social or environmental project, and
thus aim at ‘doing good’.
2. Quality-oriented CSR: Most companies applied a quality-oriented approach to protect
their image, brand, and license to operate.
3. Strategic CSR: Companies include environment and society in strategic decisions and to
open up an innovation potential.
4. Transformational CSR: Organisations foster the abilities, which form the basis of these
advantages: the ability of an organisation to develop its capabilities for reacting in a
flexible way on social, ecological, and economical requirements and to continue with
progress.
Conceptual The authors created different stages of integrating
CSR into existing business operation that led to
competitive advantage. The authors described the
different organisational changes along this path, from
being slightly unchanged (project oriented CSR) to a
stage where recurring changes and learning are the
basis for success (transformational CSR). However,
there is no explanation whether each stage gives an
impact on the company performance in a different way
and how its relationship may occur.

50
Table 2.2 (continued)
Asif et al. (2013)
Two approaches of how to integrate CSR into business processes have been proposed, namely
the top-down and bottom up approach.
Conceptual CSR integration can be conducted through vertical and
horizontal integration.
Gazzola and Colombo (2014)
1. Informal and defensive CSR: the size of the enterprise and the nature of its operations
influence the complexity of the integration of the CSR in the strategy.
2. Charitable CSR: various social and environmental causes through donations and
sponsorships, for community groups or civil society organisations.
3. Systemic CSR: CSR is focused on the micro level, supporting social or environmental
issues that happen to align with its strategy, but without changing that strategy.
4. Innovative CSR: changing CSR strategy to optimize the outcomes for this larger human
and ecological system.
5. Dominant CSR: involving cycles of CSR policy development, goal and target setting,
programmed implementation, auditing and reporting.
Conceptual Using Greiner’s model the authors explained the CSR
development in each step based on the theoretical
framework by focusing on the development of CSR
determined by company culture; it is a conceptual
study, and there is only a short explanation of each
stage with a little of an applicable example.
Izzo (2014)
1. Decisions: determining the firm’s main CSR area of interest through the analysis of the
company value proposition, its environment, and stakeholders’ demand.
2. Design: defining the firm CSR priorities, shifting the focus toward planning,
implementation, communication, and control activities to integrate the social strategy into
the business activity.
3. Action: the implementation of CSR activities will produce a series of benefits and costs.
4. Results: if the benefits directly and indirectly created by CSR exceed the costs, the firm
will benefit from a value creation point of view.
Conceptual Defining a potential value creation path that a
responsible firm can take, assuming that it integrates a
social agenda into its competitive strategy and
considering that the market appreciates real and
effective social efforts of companies (conceptual
framework).
Tonysheva and Chumlyakova (2016)
1. Analysis of current state and dynamics of socially responsible business.
2. Defining social responsibility of business development level.
3. Establish the importance and social responsibility of the company by focus groups
priorities of the strategic partnership for the territory of the company's presence and its
charitable activities.
4. Determining the degree of involvement of stakeholders in the implementation of strategic
objectives.
Conceptual Although they suggested the specific activities in each
steps, there is no empirical evidence whether they are
applicable

51
Table 2.2 (continued)
5. Establish the degree of integration of social responsibility of business in strategic
management and the determination of its trajectory.
6. Adjusting the strategic goals of social responsibility, taking into account the interests of
stakeholders.
7. Develop key performance indicators in relation to CSR profile of strategic business value
to stakeholders.
8. Justification of strategic actions in the field of CSR.
Marques-Mendes and Santos (2016)
1. Ideological models: the analysis of the set of values, ideological profiles and cultural traits
underlying corporate decision-making which have a determinant role in the relationship
between companies and societies.
2. Procedural models: the types of processes, structures, and practices implemented by
companies, either regarding the responses to external stakeholders’ pressures, the
structure of the management practices in place or the exercise of corporate citizenship.
3. Consequentialist models: the identification of the types of benefits and impacts of actions
taken by organisations, aimed at creating or appropriating socially added value.
Conceptual The authors developed a conceptual framework
through summarising an extensive literature review,
characterizing the levels of CSR maturity, and
identifying the driving forces of CSR integration in a
firm.
Filippo, Michele and Antonello (2017)
1. The formulation of the intended strategy, which defines the modes of change indicated
by the top management.
2. The execution which identifies the managerial implementation of change based on the
intended strategy.
3. The bottom-up innovations, which determine a change of direction and/or the modes of
change compared to the strategic planned approach of the top management.
Empirical qualitative
using case studies of six
companies
By connecting management and CSR in a dynamic
perspective strategically, three circles of change can
describe the integration of CSR into strategic
management. The authors developed some research
propositions that need to be investigated further.
Ooi, Amran and Yeap (2017)
1. CSR values embedded in corporate vision and missions.
2. Presence of the CSR committee.
3. Collaboration with NGOs, explains the meaning of strategic CSR from an integrated
perspective.
Quantitative research
with a sample of 100
Malaysian companies
A strategic CSR is a formative construct, involving
these three indicators.
Cazeri et al. (2018)
All the CSR practices evaluated are implemented superficially by companies in Brazil, and
there are ample opportunities for improvement.
Quantitative research
involving 48 experts
Using the integration model developed by (Asif et al.
2013).

52
2.4.2 Dimensions of the Integration of CSR and Business Strategy
Following on from the preceding subsection, this subsection describes the dimensions of
CSR integration. It is separated into two subsections, each of them presents (i) strategic CSR
integration and (ii) functional CSR integration.
CSR practices are increasingly being implemented and legitimised in business and impact
the strategic and operational levels in various areas. The integration of these criteria and
practices into strategic management includes several aspects, and human resource management
is a crucial aspect for the accomplishment of such initiatives (Talita & Maria Laura Ferranty
2016). To have a significant effect, CSR should be effectively integrated into every level of a
company and in different directions, regarded as an imperative of organisation (Asif et al. 2013;
Ooi, Amran & Yeap 2017; Zatwarnicka-Madura et al. 2019). Thus, regarding the dimensions
of integration, two have several essential activities to be considered in the integration of CSR
into business strategy.
2.4.2.1 Strategic Integration of CSR
The strategic integration of CSR is discussed in this subsection. By presenting several prior
studies in this topic, this subsection shows what aspects can be covered when CSR and business
strategy are integrated at the strategic level.
A strategic process describes the managerial activity inherent in shaping expectations and
goals and facilitating the work of an organisation in achieving these goals (Simons 1990). CSR
reaches a strategic level in organisations as it contributes to the achievement of its strategic
objectives (Talita & Maria Laura Ferranty 2016), which describes how far the company’s
business strategy embraces CSR at its heart (Sousa Filho et al. 2010).
A growing number of companies develop their CSR in response to a variety of social,
environmental and economic pressures (Gazzola & Colombo 2014). At the moment, the scope
of CSR not only gives priority to the employee, the customer and the local community, but also

53
respects human rights and conducts business with integrity. Since alignment between CSR
programs and core business is essential to value creation by CSR and vital to the success of
companies (Carroll & Shabana 2010; García-Madariaga & Rodríguez-Rivera 2017), CSR
should be managed strategically in the context of what a company is trying to obtain (Jeremy
2009) and is started at a company’s business strategy level (Busaya, Kalayanee & Gary 2009).
Moreover, CSR represents a company's 'philosophy' that affects all of its major business
activities and is integral to corporate strategy (Zatwarnicka-Madura et al. 2019).
The strategic level of CSR includes the adaptation of strategic planning, which can be
described as a technique used to direct the activities of the organisation with a focus on its long-
term objectives, vision and mission and deployment (Chiarini 2015). Companies should match
their CSR priorities and decision-making with their overall objectives and strategies and need
to set new CSR criteria and principles (Maon, Lindgreen & Swaen 2009). Specifically, strategic
CSR integration signifies the existing level of interconnectedness between CSR and business
strategy. The existence of a CSR strategy that matches business strategy indicates its capability
to achieve expected outcomes for the company as well as for society (Marques-Mendes &
Santos 2016). CSR activities need to be aligned with the overall business objectives and
strategies, to create and capture the value intended (McWilliams & Siegel 2011). Usually
companies state their strategy in their mission statement, which should be derived and aligned
with the company vision (Wibisono 2011). The mission statement is a statement of justification
for an organisation (David & David 2014).
Some authors propose that the first important step in integrating CSR into a business strategy
is to include the idea of social responsibility in the company’s vision and mission
(Bhattacharyya 2010; Dey & Sircar 2012; Ganescu 2012b; Guadamillas-Gómez, Donate-
Manzanares & Škerlavaj 2010; Maon, Lindgreen & Swaen 2009). Companies should develop
CSR objectives within their mission and vision (Lindgreen et al. 2011). Organisations with

54
missions and values embedded with CSR are more likely to create a stakeholder-oriented
environment that will lead to sustainable competitive advantage (Ooi, Amran & Yeap 2017).
Accordingly, CSR activities should become an integral part of the vision and mission of
companies (Shital 2014) that reflects the actual importance of CSR to the company’s mission
(Burke & Logsdon 1996).
Furthermore, aligning the organisation’s strategic thrust with the principles of CSR needs
the support and encouragement of senior managers (Isabelle, Ferrell & Linda 2005; Lindgreen
et al. 2011; Mahmoud, Blankson & Hinson 2017). Top management are key stakeholders who
have a critical influence on CSR initiatives. Top management support ensures the success of
CSR programs (Mahmoud, Blankson & Hinson 2017). With more support from top
management, more focus would be paid to CSR programs compared to lower managerial
support (Aguinis & Glavas 2012). Despite this support, CSR programs can be difficult to devise
and enforce (Mahmoud, Blankson & Hinson 2017), which can act as critical barriers to CSR
implementation (Werre 2003).
To support CSR programs, top management can create a CSR committee, which ensures
CSR activities are part of the company’s strategic direction and can be translated into
substantial actions based on available experience, skills, and knowledge (Ooi, Amran & Yeap
2017). The CSR committee also serves as an instrument of governance to monitor CSR
performance. CSR committee members should promote the planning, implementation, and
reporting of CSR activities to ensure the organisation's mission and vision remain relevant
priorities. For strategic CSR, therefore, organisational structure that includes a CSR committee
is important (Ooi, Amran & Yeap 2017).
Another essential aspect of strategic integration is an effective communication plan to
promote CSR activities and generate a clear perception that CSR is an aspect of strategic
importance to the company (Dobele et al. 2014; Guadamillas-Gómez, Donate-Manzanares &

55
Škerlavaj 2010; Lindgreen et al. 2011; Putra 2015). There should be transparent
communication, both internally and externally, which contributes positively to the fulfilment
of the company’s objectives and is an essential part in the integration process of corporate
sustainability (Engert, Rauter & Baumgartner 2016). Effective communication of corporate
responsibility relies on a clear strategy for assessing both opportunities and risks for the
company, making it suitable for delivering messages to various stakeholder groups (Dawkins
2005).
Because CSR relates to the concerns of stakeholders, it is crucial that companies keep
internal and external stakeholders informed of the initiatives undertaken to address CSR issues
(Maignan & Ralston 2002; Maon, Lindgreen & Swaen 2009). Communication with
stakeholders is a major way to include them in a business's operations through collaboration,
cooperation and dialogue, (Maráková 2019). Employees, as key primary stakeholders, are
crucial to potential communication of companies’ CSR practices, as they have a wide reach to
other stakeholder groups and are considered as especially credible sources of information
(Dawkins 2005). For employees to understand CSR strategy and implementation, objectives
and measures must be communicated well, clearly and transparently (Engert, Rauter &
Baumgartner 2016; Maon, Lindgreen & Swaen 2009). Moreover, continuous internal contact
increases awareness of CSR, such as through newsletters, annual reports, meetings and training
(Maon, Lindgreen & Swaen 2009). Other internal communication channels (e.g., intranet,
email, seminars, presentations, folders) are also essential for the implementation of corporate
sustainability strategies (Engert, Rauter & Baumgartner 2016; Maráková 2019).
In addition to internal communications, companies should communicate externally with
their stakeholders about what they have learned, outcomes of their CSR activities, and what
they still expect to achieve (Asif et al. 2013; Maon, Lindgreen & Swaen 2009). Along with
increasing media coverage of CSR issues, companies themselves are also taking direct and

56
visible steps to communicate their CSR initiatives to various stakeholders, including customers,
who are among the most significant stakeholders and crucial for companies’ long-term survival
(Clarkson 1995; Luo & Bhattacharya 2006). Good and transparent communication can occur
through official documents, such as annual reports, corporate brochures, company websites and
online postings (Asif et al. 2013; Galbreath 2006; Huang 2010; Maignan & Ralston 2002;
Maon, Lindgreen & Swaen 2009; Maráková 2019; Widjaja 2011).
Previous studies examined the strategic integration of CSR and suggested what should be
included in this integration. Because the integration is carried out at the strategic level, they
discovered that aligning CSR with the company vision and mission is crucial. CSR should be
communicated to internal and external stakeholders, in addition to being incorporated into the
company's vision and mission. Furthermore, top management support is also strongly required
for strategic CSR integration. As previously explained, strategic CSR integration include a
variety of stakeholders, such as top managers, employees, and customers. What explained in
this subsection can be a guidance to develop a theoretical framework of strategic CSR
integration.
2.4.2.2 Functional Integration of CSR
Several prior studies that relate to functional CSR integration are presented in this
subsection. Because alignment between CSR initiatives and core business is a key element for
creating value through CSR (Luo & Bhattacharya 2006), companies must pursue CSR activities
relating to their core business (García-Madariaga & Rodríguez-Rivera 2017). By integrating
and strategically managing CSR into the overall operations of the companies, several
companies have expanded their use of CSR operational management approaches and strategies
(Vitolla, Rubino & Garzoni 2016).
CSR is an organisational activity that relies on several connections within its management
and operation (Valdez-Juárez, Gallardo-Vázquez & Ramos-Escobar 2018). Most CSR

57
practices in companies are handled by managers who are in positions below the executive
committee level (Rangan, Chase & Karim 2012), as they know their products and markets best
(Bach & Allen 2010). Practicing CSR activities can be complex and risky from a managerial
perspective because they have to consider how to respond to a variety of internal and external
stakeholder pressures and how to evaluate whether CSR practices actually fit within the
existing business operations (Yuan, Bao & Verbeke 2011). The development of CSR practices
depends on how they are integrated into the current business practices (Marín, Rubio & de
Maya 2012; Marques-Mendes & Santos 2016) so that they not only achieve significant social
benefits but also bring significant business-related benefits to the organisation (Bhattacharyya
2010).
Porter and Kramer (2006) argue that the mutual dependence between companies and society
must follow the principle of shared values with choices benefiting both sides. From a shared
value viewpoint, companies must integrate a social perspective into the core framework that
they use to understand competition and develop business strategies. The idea of shared value
can be seen from two perspectives. On society’s side, shared value relates to better quality of
the natural environment, nutrition, access to water and housing, health, education, and income.
On the organisation’s side, it relates to the profits it delivers (including increased sales, savings,
productivity), access to resources (including raw materials, employees), and improved
competitive position (Dembek, Singh & Bhakoo 2016). CSR can be considered a key factor
for success and a chance to generate shared value by combining social and environmental issues
and redefining companies’ strategies according to four questions: what, where, how, and for
whom are companies’ products (Martinuzzi & Krumay 2013).
With respect to business operations, CSR can be implemented through ‘built-in’ and ‘bolt-
on’ approaches. The former is strategic: incorporating socially responsible behaviours into
companies’ operations, processes, and decision-making. The latter relates more to potential:

58
embracing social activities that extend beyond current business operations (Insight 2016; Porter
& Kramer 2006). The former should involve mainstream functions (e.g., production, logistics,
and quality control) (Busaya, Kalayanee & Gary 2009). The production/operations function of
a business involves all activities that transform inputs into goods and services. It represents the
largest part of an organisation’s human and capital assets that consist of five functions: process,
capacity, inventory, workforce, and quality (David & David 2014). Concerning manufacturing
companies, prior studies note four competitive priorities: low cost, quality, delivery
performance (speed and reliability), and manufacturing flexibility (Chi 2015; Ward et al. 1995;
Weir et al. 2000).
Bhattacharyya (2010) suggests that CSR implementation improves the quality of products
and their production. Therefore, quality must be considered by integrating corporate
sustainability into strategic management (Engert, Rauter & Baumgartner 2016; Martinuzzi &
Krumay 2013). Another important dimension for manufacturing companies, is innovation
(Theodorou & Florou 2008), which is one of the main drivers in the strategic orientation of a
company (Paraschiv et al. 2012) and necessary for corporate sustainability as part of strategic
management (Baumgartner 2014).
Some authors highlight the necessity of incorporating CSR actions into the core activity of
the value chain (Rangan, Chase & Karim 2012; Vitolla, Rubino & Garzoni 2017; Witek-
Hajduk & Zaborek 2016). Companies should consider all social issues linked to the company’s
core activities, both the primary and supporting activities that are part of the value chain, so
that they can evaluate which need to be enhanced to broaden the social agreement (Vitolla,
Rubino & Garzoni 2017). The value chain dimension consists of its suppliers, customers and
specific tools (Witek-Hajduk & Zaborek 2016). The activities in the value chain improve
operational effectiveness (Rangan, Chase & Karim 2012) and enhance the social,
environmental, and economic capabilities of supply chain members (Crane et al. 2014). Hence,

59
the match between the CSR strategy and companies’ value chains is crucial for the survival
and success of companies, particularly when they understand the contingent existence of CSR
in a competitive context (Hasan et al. 2018).
Supply chain management encompasses the entire network of organising people, activities,
information, and resources engaged in moving a product/service from the supplier to end users.
The maintenance of an ethical supply chain would be beneficial to a company, as the reputation
of a company’s supply chain members has the potential to affect its own reputation. Monitoring
suppliers and influencing them to meet the required environmental and societal standards
specified in a company’s code of conduct might incorporate CSR strategy (Dey & Sircar 2012).
Thus, CSR will ensure that responsible and sustainable business practices are being
implemented across the supply chain (Sprinkle & Maines 2010). Socially responsible
companies broaden their activities of CSR to include managing their partners in the supply
chain (Quarshie, Salmi & Leuschner 2016), such as suppliers and customers. A key aspect of
many CSR programs is assuming responsibility for suppliers, as companies face many
obstacles in terms of their supply chain (Öberseder, Schlegelmilch & Murphy 2013).
In addition, Guadamillas-Gómez, Donate-Manzanares and Škerlavaj (2010) argue that
human resource management is another important component of the integration process. It
facilitates CSR implementation by providing employees with the willingness, training, and
motivation necessary to apply CSR actions and initiatives, which in turn allows companies to
attain their strategic goals and objectives (Waring & Lewer 2004). Engaging employees in CSR
implementation requires focusing on their awareness and ensuring they understand the context
and background of the organisation’s CSR approach, including its motivation, the reasons for
adopting a specific approach, its relevance to the organisation, how it fits with existing
organisational objectives, any changes made to the current approaches, and other implications
(Maon, Lindgreen & Swaen 2009).

60
Specifically, employees are key stakeholders, who are not only the beneficiaries of CSR
policies but also the primary instruments for enforcing the policies of a company (Dey & Sircar
2012). Employee involvement in CSR is crucial to effectively demonstrating to the public that
a company is committed to treating them equitably in the greater interest of the community. To
accomplish this, it is important that all employees are treated with respect and that there is a
comfortable work atmosphere free from all types of violence, whether physical, verbal or
psychological. Full support and active employee engagement is essential for the effective
implementation of a company's CSR agenda (Dey & Sircar 2012). Thus, CSR that focuses on
handling current business operations in a more responsible manner can be carried out through
paying fair salaries, safeguarding health and safety of employee (Halme & Laurila 2009). The
balance among social, environmental and economic values can only be achieved by a company
through its workforce involvement; hence, human resource departments are often part of CSR
strategy (Talita & Maria Laura Ferranty 2016).
As the functional CSR integration is conducted at the functional level, the crucial elements
of this integration relate to business operations. In terms of the manufacturing industry, they
connect to production (cost, innovation, and quality), suppy chain (suppliers and customers),
and employees. Like strategic CSR integration, most of key elements of CSR integration at the
functional level involve several stakeholders, namely suppliers and customers as external
stakeholders as well as employees as an internal stakeholder.
Because the functional CSR integration is conducted at the functional level, the most
important aspects of this integration are business operations. In terms of the manufacturing
industry, they are linked to production, the supply chain, and employees. CSR integration at
the functional level, like strategic CSR integration, comprise several stakeholders, including
external stakeholders such as suppliers and consumers, as well as internal stakeholders such as
employees.

61
2.5 Company Performance
Previous studies of company performance, particularly in relation to CSR, are presented in
this section. It starts with an explanation of financial performance. It then moves on to non-
financial performance, which includes employee, customer, and operational performances.
An increasing body of scholarly literature has grown around the relationship between CSR
and company performance (Beck, Frost & Jones 2018; Boesso, Favotto & Michelon 2015;
Chen, Feldmann & Tang 2015; Ridho 2018; Saeidi et al. 2015; Zhu, Liu & Lai 2016). Recent
research over the past two decades has shown different results about the relationship between
CSR and company performance, both for financial and non-financial performance, and has
suggested a positive or a negative relationship, or no relationship at all (Moczadlo 2015). A
research by Mellahi et al. (2015) identified that most empirical journal papers (102 out of 163)
reported a positive correlation between NMS (e.g., CSR) and company performance. However,
43 empirical studies (26%) showed mixed relationships, 12 studies (7%) showed negligible
correlations and 6 studies (4%) reported negative relationships between NMS and company
performance. Hence, due to a lack of agreement on measures for respective performance,
differences in determining responsibility, and measurement errors, findings remain contentious
(Linnenluecke & Griffiths 2010; Orlitzky, Schmidt & Rynes 2003).
2.5.1 Financial Performance
Previous research regarding the impact of CSR on financial performance are presented in
this subsection. Financial benefits are the primary driving force for profit-oriented
organisations (Zbuchea & Pînzaru 2017). Companies are concerned about the financial impact
of CSR (Bhardwaj et al. 2018) and it is difficult for managers to decide to engage in responsible
activities unless they see the possibility of enhancing financial performance (Chtourou & Triki
2017). A key and divisive debate in literature has long been about the relationship between
CSR and CFP. Although some studies argue that CSR has positive effects on CFP (Carroll &

62
Shabana 2010; Orlitzky, Schmidt & Rynes 2003), prior empirical research draws inconsistent
conclusions (Bhardwaj et al. 2018; Wang, Dou & Jia 2016). There are contradictory results in
the extant literature about the effect of CSR on the CFP.
For example, Kapoor and Sandhu (2010) conducted a content analysis of annual reports
among 93 Indian companies to examine the impact of CSR on CFP. The results indicated a
significant positive impact of CSR on company profitability measured in terms of return on
sales (ROS), return on assets (ROA), and return on equity (ROE). Using different measures,
Ameer and Othman (2012) affirmed that companies that engage with CSR show better financial
performance compared to other companies that have no commitment to CSR as measured by
higher sales growth, earnings before tax, ROA, and cash flows from operations.
Moreover, Tang, Hull and Rothenberg (2012) contended that companies can achieve better
profit from CSR practices if they engage in it consistently. Based on a sample of US companies
over a nine-year period, Boesso, Favotto and Michelon (2015) comprehensively analysed the
relationship between seven areas of CSR (environment, community, corporate governance,
diversity, employee relations, human rights, and product quality) and CFP in terms of short-
term accounting-based measures, long-term accounting-based measures, and market-based
measures. The results revealed that companies that prioritise CSR activities have superior
financial performance.
Similarly, with a sample of 116 large public companies, Beck, Frost and Jones (2018) found
a positive correlation between CSR and CFP after controlling for CSR results, industry-level
effects, country-level effects, company size, financial risk, type of insurer and investment
returns. In addition, using data from 113 U.S. software industry publicly-listed companies
between 2000 and 2005, Kim, Kim and Qian (2018) found that socially responsible activities
(positive CSR) boost CFP when the company's level of competitive action is high, while

63
socially irresponsible activities (negative CSR) actually improve company financial
performance when the level of competitive action is low.
In the Indonesian context, Sayekti (2015) conducted a content analysis on the annual reports
of 136 Indonesian-listed companies between 2005 and 2008. This study showed that strategic
CSR positively affects financial performance measured by ROA. Similarly, through a content
analysis on CSR reports and information on company websites of top 200 Indonesian-listed
companies between 2014 and 2015, Ridho (2018) found that CSR implementation has a
positive and significant influence on the financial performance of companies, measured by
ROE and ROA. On the other hand, using the annual reports of publicly-listed companies in the
Indonesian Stock Exchange (IDX) in 2008–2010, Razafindrambinina and Sabran (2014)
investigated that CSR has no significant effect on CFP, measured by ROA.
As mentioned above, many studies have examined the impact of CSR on financial
performance. Even though their findings are contradictory, they provide input to this thesis on
which indicator should be considered when measuring financial performance.
2.5.2 Non-Financial Performance
This subsection continues the explanation of company performance by discussing non-
financial performance. It is made up of three aspects: employee performance, customer
performance, and operational performance.
CSR includes assessing the economic, social and environmental impact of the company,
taking measures to enhance it in accordance with stakeholder needs and reporting on relevant
measurements (Katsoulakos & Katsoulacos 2007). A study by Aguinis and Glavas (2012)
reveals that CSR creates positive non-financial impacts at the institutional, organisational, and
individual levels. In addition, CSR can benefit stakeholders in various forms (Bhattacharya,
Korschun & Sen 2009), such as adding strategic advantage to a company and creating
synergistic value for stakeholders (Chang & Yeh 2016). As a result, along with financial

64
performance, several studies highlight a significant impact of CSR on non-financial
performance.
2.5.2.1 Employee Performance
This subsection outlines previous studies that discover how CSR can improve employee
performance. Employees are key stakeholders who directly contribute to company
performance, so that understanding the effects of CSR on employees can answer questions
about whether and how CSR impacts companies (Bauman & Skitka 2012). The current
empirical literature provides a small but growing body of evidence demonstrating that CSR
does indeed affect the perceptions of employees and prospective employees regarding
companies and behaviour in the workplace (Aguinis & Glavas 2012; Bauman & Skitka 2012).
For instance, Dawkins (2005) contended that CSR programs have the ability to increase
employee motivation and boost employer perception of their companies. Branco and Rodrigues
(2006) pointed out that CSR activities, such as fair salaries, a clean and safe working
atmosphere, training opportunities, health and education benefits for employees and their
families, childcare services, flexible working hours and job sharing, can bring direct benefits
to a company by increasing morale and productivity while minimising absenteeism and
employee turnover and saving on recruiting and training expenses for new employees. Sprinkle
and Maines (2010) claimed that CSR practices can provide companies with many benefits,
such as enhanced employee motivation and turnover reduction. Bauman and Skitka (2012)
identified four distinct paths through which CSR may affect employees’ relationship with their
companies that correspond to four universal psychological needs: security, self-esteem,
belongingness, and a meaningful existence. They indicated that by providing individuals with
opportunities to share their ideals, contribute to the community and society at large, and
potentially create or at least be part of a legacy, CSR can have a similar impact. Employees can
achieve greater life-satisfaction and enhanced emotional well-being by fulfilling their need for

65
a meaningful existence. Dey and Sircar (2012) also highlighted that employees who are
satisfied with their company's commitment to CSR tend to be more positive, more loyal, and
more productive than those who work for less committed employers.
In conclusion, prior studies indicated that CSR could improve employee performance. They
claimed that if the companies engage in CSR, their employees will perform better. As a result,
employee performance can be increased, including employee motivation and satisfaction.
2.5.2.2 Customer Performance
This subsection lists prior studies that address the effect of CSR on customer performance.
For example, using a survey of Spanish hotel consumers, Martínez and Rodríguez del Bosque
(2013) found that customers are more likely to trust responsible companies that operate
honestly and reflect the interests of all parties when making decisions. In addition, customers
are more willing to engage with companies that carry out socially responsible initiatives. Their
results indicate that customers are likely to support and reward the companies that spend most
in socially responsible programs by showing the greatest loyalty to them. Exploring the
automobile industry as a single industry spanning eight years, García-Madariaga and
Rodríguez-Rivera (2017) investigated the relationship between CSR and customer
performance, particularly customer satisfaction measured through the American Customer
Satisfaction Index (ACSI) which ranges from 0 to 100. Their findings show that CSR has a
positive impact on customer satisfaction. Moreover, Park, Kim and Kwon (2017) identified the
fit between consumer values and the objectives of CSR activities and corporate ethical
standards as two main determinants of CSR quality and commitment. Working with collected
data from 931 retail consumers in South Korea, the results reveal that higher ethical standards
direct consumers to perceive that the company is committed to its CSR activities. A company's
CSR commitment encourages greater satisfaction and trust in the company and its services,
which in turn encourages consumers to remain loyal.

66
In summary, several studies found that CSR can boost customer performance, such as
customer satisfaction and loyalty. Their findings support this thesis by recommending which
indicators should be considered when evaluating customer performance.
2.5.2.3 Operational performance
Completing the discussion of non-financial performance, operational performance is
explained in this subsection. Although very little is known about whether or how CSR affects
operational efficiency, prior studies show that CSR has a positive impact on operating
performance. For instance, Sun and Yu (2015) used Kinder, Lydenberg and Domini (KLD)
data to identify a positive relationship between CSR and operational performance, suggesting
that employees in socially responsible companies generate better operational performance than
their peers in less socially responsible companies. Consequently, employees work more
productively in socially responsible companies in terms of sales per employee and net income
per employee. Sánchez and Benito-Hernández (2015) analysed the relationship between CSR
and operational performance measured by labour productivity. The results of a sample of 929
Spanish micro and small manufacturing companies revealed that CSR policies have a positive
relationship with labour productivity. Particularly, CSR actions related to internal aspects of
the company, such as a commitment to quality in internal operational processes, promotion of
innovation and employee care, contribute to a short-term increase in labour productivity.
Table 2.3 summarises the impacts of CSR on company performance. It can be seen that CSR
provides benefits not only on financial performance, but also non-financial performance, such
as employee, customer, and operational performance.

67
Table 2.3: CSR Impacts on Company Performance
Company
Performance Impacts of CSR
Financial performance company profitability, cost reduction, better stock market and accounting
performance, minimising financial problem in the long-term, increased ROA,
improved ROS and ROE.
Employee performance strengthening human resources, greater employee loyalty and retention, employee
engagement, high-quality connections, and creative involvement, enhanced
employee satisfaction.
Customer performance increased customer satisfaction, improved consumers response(Sen &
Bhattacharya 2001), customer loyalty and product evaluation.
Operational
performance
enhanced employee productivity, more efficient operation, improved management
operations, product quality, and process efficiencies.
Overall, prior studies have argued that CSR benefits companies both financially and non-
financially. To assess the impacts of CSR comprehensively, then four essential aspects should
be included: financial, employee, customer, and operational performances. The indicators
listed in Table 2.3 can be used to evaluate a company's financial and non-financial
performance.
2.6 Research Gaps
This section discusses several research gaps that can be identified based on the findings
from prior studies. Many CSR studies have focused on organisational responses to external
stakeholder’s demands, but less research has explored how companies attempt to integrate CSR
activities into their business (Yuan, Bao & Verbeke 2011). In the context of a company's
business strategy, shortcomings remain around particular concepts, mechanisms for integration
activities, and specific objectives in the field of social responsibility (Tonysheva &
Chumlyakova 2016).
Notably, most of the proposed models for integration are conceptual, and there is little
empirical evidence to test theoretical frameworks; research has not yet specified how such
integration can be implemented, nor what the likely impacts would be (Yuan, Bao & Verbeke
2011). Other studies are exploratory and descriptive so that it is difficult to generalise results.

68
In this present study, the integration of CSR into company strategy will be developed and tested
quantitatively, putting forward a preliminary model through which companies could make this
integration possible.
CSR becomes part of the business and adds long-term value for the company and society
(Rochlin et al. 2005, cited in Ganescu 2012b). Accordingly, business strategy and CSR should
be seen together as maximising both economic and social results (Husted & Allen 2001, cited
in Bhattacharyya 2010). When developing a framework for CSR integration into business
strategy, it should facilitate analysis of the integration’s impacts on company performance.
Despite the fact that current literature suggests that integrating market strategy and NMS is
critical, the empirical evidence available on the impact of the integration on company
performance is very limited (Mellahi et al. 2015). Because the strategic alignment of CSR and
business strategies has rarely been studied together, their causal relationship in promoting
company performance remains theoretically underdeveloped. In other words, the
understanding of how the integration of CSR and business strategy influences that company’s
performance is still lacking. Furthermore, there is a shortcoming of meaningful contributions
that investigate the systematic strategic integration of CSR, referred to as a socially oriented
management philosophy, recognising both economic and social aspects of the company
(Vitolla, Rubino & Garzoni 2017).
To sum up, several research gaps have been discovered in prior studies in relation to the
integration of CSR and business strategy. There is a scarcity of quantitative research in this
field, as well as an assessment of how this integration affects company performance. As, this
th a result, this thesis seeks to fulfil these research gaps by empirically investigating causal-
inferential links between CSR integration and company performance comprehensively.

69
2.7 Indonesia as a Context for the Research
NMS is largely dependent on the institutional context (Doh, Lawton & Rajwani 2012).
Although the alignment of a NMS with a competitive market strategy is essential in strategic
management, such a process remains opaque to practitioners and researchers, especially in
emerging countries (Yoo 2015).
This section provides background information about Indonesia as a context for this thesis.
It contains four subsections, each of which covers (i) an overview of Indonesia, (ii) the
Indonesian manufacturing industry, (iii) an overview of CSR implementation in Indonesia, and
(iv) CSR studies in the Indonesian manufacturing industry.
2.7.1 An Overview of Indonesia
An overview of Indonesia is presented in this subsection. As the world’s fourth most
populous nation (Worldbank 2020), with a population of more than 267 million, Indonesia is a
diverse archipelago nation of more than 300 ethnic groups and rich in all types of natural
resources as well as cultural diversity (OECD 2020; Worldbank 2020). Indonesia is a market
economy in which state-owned enterprises (SOEs) and large private business groups
(conglomerates) play a major role. Hundreds of diversified privately-owned company groups
in Indonesia (a small fraction of the total number of companies operating in Indonesia)
dominate the domestic economy along with SOEs (Investment 2020).
The Indonesian economy is the largest in Southeast Asian and one of the world's emerging
market economies (Worldbank 2020). Since overcoming the Asian financial crisis of the late
1990s, in 1997–1998, Indonesia has charted remarkable economic growth (Worldbank 2020).
Over the past two decades, GDP per capita has increased by 70% and it is now the 16th largest
economy in the world by nominal GDP. In fact, Indonesia was the 7th largest GDP in the world
in 2018 as displayed in Figure 2.1 (OECD 2020; Worldbank 2020). As a result, Indonesia has

70
a number of features that place it in a great position for newly advanced economic growth
(Investment 2020).
Figure 2.1 The Biggest Economies in the World
Source: International Monetary Fund, cited in https://www.statista.com/chart/19489/biggest-
economies-in-the-world/, viewed 7 April 2020.
The Indonesian government has established a long-term master plan, known as the Master
Plan Acceleration and Expansion of Indonesia Economic Growth 2011–2025 (MP3EI), to
accelerate the implementation of its national strategy to make Indonesia a self-sustaining,
advance, sound and wealthy country (Indonesia 2011). The plan includes guidance, framework,
steps, strategic initiatives, and the fundamental principles of intended economic growth.
Following this master plan, Indonesia aims to gain its position as one of the world's developed
countries by 2025 with projected per capita income of US Dollar (USD) 14,250–15,500 with a
total GDP of USD 4.0–4.5 trillion with the decline in the inflation rate to 3.0% in 2025, as
illustrated in Figure 2.2. The combined rates of growth and inflation reflect developed world
characteristics (Indonesia 2011).

71
Figure 2.2 Indonesia’s Vision 2025
Source: Master Plan Acceleration and Expansion of Indonesia Economic Development 2011–
2025 (Indonesia 2011).
Indonesia is also the only country representing Southeast Asia in the G20 (Salikha 2018)
and has often been listed as an appropriate candidate to enter the BRIC countries (Brazil,
Russia, India and China). Indonesia is a member of emerging economies-grouped under the
acronym CIVETS (Colombia, Indonesia, Vietnam, Egypt, Turkey and South Africa), which
have gained prominence because their members have relatively sophisticated financial
structures and fast-growing populations (Investment 2020).
As mentioned previously, Indonesia is a big country that has many advantages, such as a
good location, abundant natural resources, and a lot of workforces. Being one of the largest
developing countries, Indonesia has many opportunities to accelerate and expand its economy.
Therefore, the government has established a long-term strategic planning to support this.

72
2.7.2 The Indonesian Manufacturing Industry
This subsection provides information about the Indonesian manufacturing industry. The
manufacturing or processing industry is an economic activity that carries out the activity of
changing a basic item mechanically, chemically or by hand so that it becomes finished/semi-
finished goods with higher value (Statistik 2020). As part of the strategic concept that relates
the strengths and resources of a business to market opportunities (Skinner 1969), the aim of
manufacturing is to serve the business—to fulfil its survival, profit and growth needs.
Indonesia's manufacturing industry is extremely diverse and represents a vast array of
natural resources available to the region (GlobalBusinessGuide 2011). Previously, economic
development in Indonesia has been focused on agricultural and natural commodities, due to the
abundance of renewable and non-renewable resources, such as oil and other mining resources
(Republic of Indonesia, Master Plan 2011). As one of the long-term development goals is to
fundamentally change the structure of the Indonesian economy, industry outside of agriculture
becomes the backbone of the economy (Bappenas n.d.). Thus, after more than six decades of
Indonesian independence or in 2005, the government announced plans to change the economy
from an agricultural economy to a manufacturing- and service-oriented economy to boost the
country's economic growth (Indonesia 2011).
The revitalisation of the Indonesia manufacturing industry began in 2014. Despite the
economic challenges, the manufacturing industry shows no sign of slowing down and has been
critical in speeding up Indonesia's potential GDP growth and, at least, in sustaining long-term
stability (Gorbiano 2019) for the following reasons. First, manufacturing companies are a
significant contributor to the national economy (Stasiuk-Piekarska 2019). In Indonesia,
manufacturing continues to be the most successful sector in the economy
(GlobalBusinessGuide 2011). As shown in Table 2.4, the manufacturing industry contributes
20.5% of the Indonesia's GDP. The contribution is greater than the manufacturing sector's

73
global average GDP (Cekindo 2020). At present, there are only five countries whose
manufacturing industries contribute more than 20% to their GDP: China (28.8%), South Korea
(27%), Japan (21%), Germany (20.6%) and Indonesia (Cekindo 2020).
Second, as presented in Table 2.4, the Indonesian manufacturing sector employs 18.93
million people (14.8%) of the workforce, according to August 2018 data from BPS (Gorbiano
2019). Indonesia has the most attractive labour costs when compared with other Asian
countries (Cekindo 2020). Because of its cost-effective and abundant labour, Indonesia is a
desirable attractive destination for foreign investment in manufacturing (AsiaLinkBusiness
n.d.). In the next 15 years, the manufacturing sector is expected to absorb 30 million workers
(Kemenperin 2018). With its increasingly rising middle class and productive workforce, more
foreign investors benefit from Indonesia's strong manufacturing sector (AsiaLinkBusiness
n.d.).
Table 2.4: Indonesian Manufacturing Snapshot
Number of companies 4.41 million (2017)
Size (number of employees) 0.96% with more than 100 employees (large companies), 99.04% with 5-99
employees (SMEs)
Contribution to GDP 20.5% (2019)
Sector growth 3.8% (2019)
Number employed in the sector 18.93 million (2019)
Export turnover USD 126.57 billion or 75.5% of Indonesian total export (2019)
Main export products Food and beverages, metal products, chemicals, textile and garments, paper
products
Main export markets United States of America (13.64%), China (13.48%), Japan (8.7%),
Singapore (6.94%) and India (5.17%)
Third, the manufacturing industry consistently provides the largest contribution to national
exports. In January to December 2019, exports of processing industry products accounted for
USD 126.57 billion or 75.5% of Indonesia's total exports, which reached USD 167.53 billion
over the past year (2019) (Kemenperin 2020a) (see Table 2.4).

74
Fourth, Indonesia has been listed by the United Nations Industrial Development
Organisation (UNIDO) as one of the top 10 manufacturers worldwide (Indonesia 2016)
(Amindoni 2016). Indonesia's manufacturing sector accounts for approximately one quarter of
the country's GDP, according to UNIDO's 2016 International Yearbook of Industrial Statistics
(Indonesia 2016). Also, Indonesia’s manufacturing sector is now larger than the manufacturing
sectors of the United Kingdom, Russian and Mexico (AsiaLinkBusiness n.d.). Indonesia is
therefore poised to become a future global leader in manufacturing with a strong economic
backdrop and is expected to be one of the top 15 manufacturing hubs in the world by 2023
(Cekindo 2020; IndustryToday 2016).
For those reasons, the Indonesian government expects the manufacturing sector to be
Indonesia's next engine of economic growth, and will, therefore, focus on its development over
the next five years (Gorbiano 2019; Kemenperin 2020b). Automotive, textiles and clothing,
food and beverage, chemicals and electronics are the five main sectors chosen as the priority
for addressing industry revolution 4.0, as mentioned in the road map of Making Indonesia 4.0
(Indonesia 2019). Certain sectors are expected to expand rapidly including machinery, leather
goods and footwear as well as the metal and computer industries (Indonesia 2019; Kemenperin
2018). Specifically, automotive, chemicals and electronics industries are expected to contribute
to 25% of the Indonesian economy by 2025 (Salna 2019).
Last, manufacturing companies have more CSR practices, but are also responsible for
harming communities in which they operate (Adeneye & Ahmed 2015). They lead to pollution
of the environment and other social costs. For example, the industrial sector, which includes
mining, manufacturing, and construction, produced 21% of global carbon dioxide emissions in
2014. This is because the use and burning of fossil fuels are important for various steps of the
manufacturing and industrial processes (Cunanan 2018). Specialised manufacturing equipment
that uses a lot of drivers and motors covers 70% of that industry’s power consumption, and the

75
other 30% comes from heating and cooling equipment (Renewable Energy 2014). Industry and
production contribute to 22% of greenhouse emissions, referring to the fossil fuels burned to
convert raw materials into finished products (Etee 2019).
To conclude, the manufacturing industry clearly plays a significant role in the Indonesian
economy. As a result, the Indonesian government strongly supports the manufacturing sector,
which is predicted to grow substantially. Nonetheless, the manufacturing industry has a
potential to harm society and the environment in which it operates.
2.7.3 CSR Implementation in Indonesia
This subsection describes CSR implementation in Indonesia. It includes a list of several
CSR regulations that have been adopted in Indonesia and provides an overview of CSR
practices in Indonesia.
2.7.3.1 CSR Regulations in Indonesia
An effort to recognise CSR in Indonesia began over 18 years ago (Ridho 2018). On 28
September 1999, the Ministry of SOEs in Indonesia issued Ministry Decree No. Kep-216/M-
PBUMN/1999, followed by the enactment of Law No. 19 2003 regarding SOEs and the
issuance of SOE Ministry Regulation No. Per-05/MBU/2007 that considers cooperation
between SOEs and small businesses for the environmental protection program (Ridho 2018).
The Public Interest and Research Advocacy group in 2001 showed that the fund from CSR in
Indonesia was approximately $US 11.5 million from 180 organisations and supported 279 CSR
practices. Fund averages for each organisation was 640 million or approximately 413 million
rupiahs for each activity (PIRAC 2002). That study found that companies in Indonesia embrace
CSR in four ways: direct involvement, through a company foundation or social organisation,
partnering with others, and joining a consortium. The study argued that a consequence of late
76
adoption of CSR in Indonesia is the lack of a comprehensive legal instrument that regulates CSR
and fosters CSR actions.
This issue has been addressed by the Indonesian government releasing Law 40 2007 on
Limited Liability Company (UU No. 40 Tahun 2007 tentang Perseroan Terbatas), and Law
No. 25 2007 on Investment (UU No. 25 Tahun 2007 tentang Penanaman Modal di Indonesia),
which makes CSR in Indonesia compulsory (Maris 2014). These laws are supported by
Government Regulation 47 2012 concerning social and environmental responsibility of a
limited liability company (Radyati 2015; Supriyanto 2014).
Most CSR definitions are focused on the context of developed countries, especially with
regard to the relationship between CSR and company performance (Amran & Haniffa 2011).
Regulatory frameworks and perceptions about CSR also vary across developing countries
(Moisescu 2018). Therefore, this thesis deals with a definition capturing the uniqueness of such
a relationship from a developing country context. Notably, Law No. 40 2007 uses a term of
tanggung jawab sosial dan lingkungan (TJSL) or social and environmental responsibility and
defines CSR as the company's commitment to engage in sustainable economic development to
improve quality of life and the environment that is beneficial to the company itself, the local
community, and society in general (Erawaty 2019).
More specifically, four critical criteria were stated in Article 74 of Law No. 40 2007:
(Maulamin 2017; OJK 2016) as follows:
1. Companies that conduct their business activities in the field and/or related fields in the
natural resource sector shall be obliged to take on social and environmental responsibilities.
2. Social and environmental responsibilities referred to in paragraph (1) are compulsory for
companies and included in the cost of companies with due regard to propriety and fairness.
3. There will be penalties for companies that fail to fulfil these obligations under applicable
laws.

77
4. Further information on social and environmental responsibility regulations will be stipulated
in a government decree.
Such laws have therefore made Indonesia the first nation in the world that mandates
companies to practise CSR and to disclose their CSR activities (Maris 2014; Ridho 2018;
Rosser & Edwin 2010; Sustainablesquare 2017; Waagstein 2011), in particular those related to
natural resources, which often cause serious environmental degradation and negative social
impacts (Achda 2006). According to these laws, the mandatory nature of CSR is legitimate and
thus encouraged (Maris 2014; Waagstein 2011). In general, Indonesia has several rules
regulating CSR, in addition to the two laws discussed above (KlikLegal 2017).
2.7.3.2 Global Standards of CSR Practises in Indonesia
There are several global standards as guidance how to conduct CSR. This subsection
explains three of them that are widely implemented in Indonesia as follows:
▪ International Organisation for Standardisation (ISO) 26000
ISO 26000 is a standard for businesses and organisations committed to operating in a
socially responsible manner. It offers guidance to those who understand that societal and
environmental respect is a crucial success factor. ISO 26000 is increasingly seen as a
measure of assessing an organisation's commitment to sustainability and overall
performance, in addition to being the "right thing" to do (ISO n.d.). With ISO 26000,
organisations will add value to currently developing social responsibility activities by: 1)
developing a consensus on the meaning of social responsibility and its issues; 2) providing
guidance on translating principles into effective activities; and 3) selecting best practices
that have been developed and disseminated for the good of the society and international
community (Mahendra n.d.). There are seven core subjects in ISO 26000. Six of them,
namely human rights, labour practices, fair business practices, consumer, and environmental
issues, relate to major activities of business. Meanwhile, one other subject, community

78
involvement and development, puts more emphasis on CSR activities that are carried out
outside the main business activities (Radyati 2015).
▪ Global Reporting Initiative (GRI)
The GRI is an independent, multinational organisation that assists businesses and other
organisations in taking responsibility for their impacts by establishing a global standard
language through which they may communicate such impacts. The GRI Standards are the
world's most extensively used sustainability reporting standards (Globalreporting n.d.a).
The GRI Standards assist organisations in understanding their external impacts, such as on
the economy, environment, and society. This improves accountability and transparency in
terms of their contribution to sustainable development. Organisations can employ the GRI
Standards to generate a sustainability report that complies with the Standards. Alternatively,
they can use certain Standards, or parts of them, to disclose information to specific users or
purposes, such as reporting their climate change impacts to investors and customers
(Globalreporting n.d.b).
In 2017, there are 73 Indonesian companies whose Global Reporting Initiative (GRI) reports
are available in the GRI database, and 20 of them are manufacturing companies (GRI 2019).
They are medium and large companies and also listed in Manufacturing Directory 2017
(BPS 2017).
▪ Sustainable Development Goals (SDGs)
United Nations (UN) Member States endorsed the 2030 Agenda for Sustainable
Development in 2015, which provides a shared roadmap for peace and prosperity for people
and the planet today and in the future. The 17 SDGs are at the heart of it, and they represent
an urgent call to action for all countries, developed and developing, to work together in a
global partnership to achieve them (SDG n.d.). These 17 SDGs are integrated—that is, they
recognise that actions taken in one area have an impact on outcomes in others, and that

79
development must strike a balance between social, economic, and environmental
sustainability (UNDP n.d.). Notably, the achievement of the SDGs is the ultimate goal of
sustainability, while the process or activity is CSR itself. CSR thus helps to the
accomplishment of the SDGs by 2030 (Beritasatu 2020).
More specifically, the minister of SOEs has ratified PER-05/MBU/04/2021 concerning CSR
regulation for SOEs. The term of Program Kemitraan and Bina Lingkungan (PKBL) or
Partnership and Community Development Program) has been replaced with TJSL (CSR) in
this new regulation (Radyati 2021). Specifically, this presidential regulation aimed at
fulfilling the Indonesia's commitment to the UN Sustainable Development Goals (SDGs),
which is closely matched with its national development goal. The commitment of Indonesia
to meet the SDGs while also pursuing its own development strategy will benefit both
Indonesians and the global world (Sheany 2017). As a result, PER-05/MBU/04/2021 can
make Indonesian SOEs officially global citizens in order to achieve the SDGs through CSR,
integrate CSR into business strategies, and adhere to international standards such as ISO
26000 for social responsibility and ISO 31000 for risk management (Radyati 2021).
2.7.3.3 CSR Practises in Indonesia
This subsection provides an overview of CSR practises in Indonesia. As a result of several
CSR regulations, CSR has been increasingly a major concern in Indonesia and become a trend
over the last two decades (Achda 2006; Maris 2014). Growing recognition of CSR has yielded
progress in several sectors regarding programs and collaboration (Sustainablesquare 2017).
Consequently, appreciation is given to companies that perform CSR well. For example, the
Indonesia Sustainability Reporting Award (ISRA) was introduced in 2005 to honour companies
that released sustainability reports based on the GRI (NCSR 2020; Ridho 2018). The Indonesia
CSR Awards (ICA), renamed Sustainability Reporting Awards (SRA), has been held since
2006 to provide appreciation for organisations that carry out social responsibility well based

80
on Standar Nasional Indonesia (SNI) or ISO 26000:2013 (Guidelines for Social
Responsibility) (BSN 2019). The Centre for Entrepreneurship, Change and Third Sector
(CECT) Sustainability Awards (CSA) is granted to corporates and social entrepreneurs that
have holistic sustainability and good CSR performance, based on Sustainable Development
Goals and ISO 26000 (CECT). There are other similar awards, such as CSR Indonesia Award
(CSR Indonesia 2018), TOP CSR Award (Tempo 2018) and Indonesia's Best Corporate Social
Initiatives (Barlian 2018).
Interestingly, prior studies show that the majority of companies in Indonesia still embrace
CSR at the level of charitable practice (Joseph et al. 2016). Corporate philanthropy is the CSR
activity most frequently carried out by companies (Maulamin 2017; Radyati 2015;
Razafindrambinina & Sabran 2014) through community initiatives and involvement,
education, and donation (Ambadar 2017; Widjaja 2011). Sayekti (2015) identified that the
average level of strategic CSR among 397 listed companies in Indonesia from 2005 to 2008
remained very small. These findings strengthen an argument that CSR is practiced merely to
comply with regulations and meet society's demands, without linking it to the strategy of
companies as a whole (Porter & Kramer 2006). Some companies do not consider CSR an
obligation, and only enforce CSR through simple and instant activities, such as society
donations and fundraising (Maulamin 2017). Surprisingly, the perception of most CSR
managers in listed Indonesian companies with respect to CSR remains limited to donations and
community development activities (Ridho 2017). This phenomenon indicates the need to
further investigate how companies in Indonesia implement CSR, or more precisely, how they
integrate CSR into their business practices.
Overall, there are several regulations related to CSR in Indonesia. To comply with this rules,
prior studies found that most companies still conduct philanthropic activities, such as
donations, charity, and community developments. However, there is an increasing intention to

81
standardise CSR implementation using several global standards, such as ISO 26000, GRI, and
SDGs.
2.7.4 CSR Studies in the Indonesian Manufacturing Industry
This subsection presents a number of CSR studies with the Indonesia manufacturing study
as a context study. Using stakeholder theory and taking a sample study of three large
companies, Widjaja (2011) investigated that most companies have been active in a variety of
CSR programs focusing on three areas: helping natural disaster victims, education and
supporting SMEs. Then, based on a sample of 53 manufacturing companies, Hasanudin and
Budianto (2013) examined whether environmental and employee CSR have an impact on
corporate reputation or contribute to company performance. Results showed that employee
CSR and corporate reputation have positive impacts on company performance, but
environmental CSR has negative impacts. Also, the relationship between environmental CSR
and employee CSR and company efficiency is partially mediated by corporate reputation.
Presenting a case study of a large Indonesian company in the pulp and paper industry,
Mursitama, Fakhrudin and Hasan (2014) found that the company effectively transformed not
only its institution but also its substantial CSR value. Moreover, Patrisia and Dastgir (2017)
explored the relationship between business diversification and company social performance
(CSP) with a sample of 107 listed manufacturing companies in IDX. Their finding revealed
that diversification at the industry level does not impact CSP.
With a sample of 50 manufacturing companies listed in IDX in 2015, Purbowati and
Mutiarni (2017) evaluated the effect of corporate characteristics on CSR disclosure. They
found that company size had a significant impact on CSR disclosure, while the company's
profile, the size of the commissioner board and ownership concentration had no significant
impact on the disclosure of CSR. Nonetheless, the combined impact of these four variables is
important for the disclosure of CSR, with company size holding the dominant influence.

82
Furthermore, Maulamin (2017) distributed 25 questionnaires to factory managers to gather
opinions and understanding about CSR from plant managers. Results showed that 72% of
respondents reported CSR was compulsory, while the remaining 28% said CSR was a
voluntary initiative to support the society around them. This study indicated that CSR was
implemented using four approaches: coordinating their own social events; through their own
foundations; working with different partners such as social institutions, NGOs and universities;
and joining consortiums to undertake CSR practices.
Using a sample of 173 large manufacturing companies in Central Java, Indonesia,
Handayani, Wahyudi and Suharnomo (2017) examined the mediating role of green innovation
and community engagement in CSR implementation. They emphasised the importance of
involving social and environmental aspects in CSR ethical program implementation.
In summary, several studies have examined CSR practices in the Indonesian manufacturing
industry. However, little study has been done on the link between CSR integration and
company performance. There is a need, therefore, to explore further how manufacturing
companies in Indonesia integrate CSR into their business strategy and operations.
2.8 Summary of Chapter 2
This chapter presents an overview of existing literature on the topic of this thesis. It includes
NMS, CSR, and business strategy. It also covers the integration of CSR into business strategy,
as well as company performance as a result of that integration. Several research gaps are
presented in this chapter, as well as Indonesia as a context for this thesis.

83
CHAPTER 3: RESEARCH FRAMEWORK
Based on the literature review and theoretical underpinnings presented in previous chapter,
this chapter discusses the research framework developed in this thesis. It consist of three
sections: (1) theoretical framework, (2) the conceptual framework of the integration of CSR
into business strategy, and (3) research hypotheses. Each section is explained as follows.
3.1 Theoretical Framework
This section explains how the theoretical foundation is taken to build a theoretical
framework of CSR integration.
3.1.1 Strategy and Company Performance
The connection of strategy and company performance is presented in this subsection.
Strategic management is a company’s decision-making standard that ultimately determines the
objectives, policies, and plans to achieve its goals. Companies should decide on which strategic
choice to use to pursue their goals (Porter 1985). These strategies define which businesses the
companies run, the economic and non-economic nature of their actions and contributions, and
the relationship between shareholders, employees, clients and the community (Andrews 1987).
Strategic management is a way to ensure a sustainable competitive advantage by investing the
resources needed to develop critical capabilities that can lead to long-term superior
performance (Lin, Tsai & Wu 2014).
The relationship between strategies and company performance has been well documented
in the literature on strategic management. Many studies have examined the strategy-
performance relationship, both empirically and theoretically (Andrews, Boyne & Walker 2006;
Anwar, Shah & Hasnu 2016; Kotha & Nair 1995; White 1986). While the relationship between
strategy and company performance is widely recognised in the literature, a plethora of
mechanisms have been identified. In the area of CSR, how CSR integration into an

84
organisation’s strategy can contribute to company performance remains unclear, although an
increasing number of studies have been undertaken.
3.1.2 Theoretical Underpinnings
This subsection explains theoretical underpinnings of this thesis. Currently, companies are
under great pressure from stakeholders to incorporate social and environmental issues into their
business decisions and strategies (Latif et al. 2020). Stakeholder theory lays the groundwork
for a strategic view of the issue of corporate responsibility (Katsoulakos & Katsoulacos 2007).
A significant contribution of stakeholder theory is to evaluate a company's behaviour towards
its established stakeholders and its associated activities (e.g., CSR practices) to maintain its
relationship with them. CSR practices can therefore be a viable means for companies to direct
organisational resources with the aim of producing benefits for their stakeholders (Zhu, Liu &
Lai 2016). Hence, in addition to the importance of stakeholders in achieving organisations’
goals, stakeholders are a crucial motivating factor for CSR adoption by organisations (Dobele
et al. 2014; Lane & Devin 2018; Zhu, Liu & Lai 2016). Some authors emphasise that it is
essential to include the concerns and objectives of the stakeholders when taking a long-term
perspective (Bhattacharyya 2010; Gazzola & Colombo 2014; Guadamillas-Gómez, Donate-
Manzanares & Škerlavaj 2010; Maon, Lindgreen & Swaen 2009).
The essential dimensions and CSR definitions examined in Chapter 2 highlight that CSR is
a multidimensional concept involving different aspects relevant to a variety of organisational
stakeholders (Kleine & von Hauff 2009). In particular, CSR focuses on how to manage internal
and external stakeholders ethically, socially and responsibly to enhance the living conditions
of internal and external stakeholders, while conserving the organisation’s profitability
(Hopkins 2005). Managers have to consider how to respond to a variety of internal and external
stakeholder pressures and how to evaluate whether CSR practices will fit with the existing
business operations (Yuan, Bao & Verbeke 2011). Subsequently, in understanding the

85
relationship between CSR integration and company performance, this thesis involves
shareholders, managers, and employees (as a primary internal stakeholders), and also suppliers
and customers (as primary external stakeholders).
Contingency theory suggests that ‘organizational effectiveness results from fitting
characteristics of the organization, such as its structure, to contingencies that reflect the
situation of the organization’ (Donaldson 2001, p. 1). A contingency is ‘any variable that
moderates the effect of an organizational characteristic on organizational performance’
(Donaldson 2001, p. 7). A contingency variable is significant to the extent that companies that
differ on that variable also have significant differences in how performance is associated with
strategic attributes or actions (Hambrick & Lei 1985).
One example of a contingency variable is strategy (Donaldson 2001; Nicholas & Abby
2006). Contingency theory is distinguished by a particular approach to the strategic fit of
organisation (Parisi 2013). Every company has its specific goals, which are different from those
of other companies and develops a distinct strategy to achieve them. Thus, company
performance, as a result of its strategy implementation, is also different. Baron (2000)
emphasises that a company’s strategy affects its performance. Contingency theories note the
appropriateness of different strategies depends on the competitive business market settings.
These views vary from the universal view, which stress that strategies ‘depend on everything’
(Hambrick & Lei 1985).
This thesis focuses on the integration of CSR into business strategy as a crucial mechanism
that links an organisation’s strategy to its performance. Such integration is increasingly
essential for business competitiveness (Ooi, Amran & Yeap 2017). Strategic integration can be
regarded as being rooted in contingency theory, which argues that the concept of strategy is
universal, but should be fit into its context to improve company performance. Such a strategic
fit is fundamental to the enhancement of companies’ competitive strategies.

86
This conceptual framework is briefly outlined in Figure 3.1. In the following subsection, the
key concepts and relationships within the framework are discussed.
Figure 3.1: The Conceptual Framework for the Integration of CSR into Business Strategy
and Its Impact on Company Performance
3.2 The Theoretical Framework of the Integration of CSR into Business strategy
This section discusses the theoretical framework of CSR integration and business strategy
developed in this thesis. As discussed above, this thesis combines both strategic and functional
integration and performance aspects based on stakeholder and contingency theories to
empirically examine whether company performance depends on business and CSR strategies.
Companies implement CSR differently, and each adopts a specific business strategy. By
engaging in CSR, their company performance could be contingent on the CSR and business
strategy applied by companies, which is shaped by the mechanism of the integration between
CSR and its business strategy.
This thesis follows Baron’s statement (1997) that defines integration to be a synergy
between competitive strategies that seek superior performance in the marketplace and NMS
that shape the competitive environment. In this thesis, business strategy represents competitive
(market) strategy, and CSR refers to NMS. Many studies have examined whether either
business strategy or CSR strategy provides some benefits to a company; however, the impacts
will be greater if both strategies are integrated rather than being conducted separately
(Guadamillas-Gómez, Donate-Manzanares & Škerlavaj 2010; Porter & Kramer 2006;
Vilanova, Lozano & Arenas 2009). The broad theoretical framework will be strategy-context-
Business strategy
CSR strategy
Integration Company
performance

87
performance and thus cover the following significant concepts: CSR strategy, business
strategy, integration between CSR and the business strategy and company performance.
3.2.1 CSR Dimensions and Strategies
This subsection describes CSR dimensions and strategies used in this thesis’s theoretical
framework. Specifically, CSR is defined to be a company’s ability to be socially responsible
for the development and growth of the society where it runs its business (Adeneye & Ahmed
2015). The World Business Council for Sustainable Development (Moir 2001) supports this
definition by declaring that CSR is a continuous business agreement with ethical behaviour to
benefit sustainable economic development and at the same time to enhance the quality of life
of the employees, their families, and the local community as well as wider society. Moreover,
Rasche, Morsing and Moon (2017, p. 6) highlighted that CSR signifies ‘the integration of an
enterprise’s social, environmental, ethical, and philanthropic responsibilities towards society
into its operations, processes and core business strategy in cooperation with relevant
stakeholders’. These definitions are in accordance with the adopted definition of integration
(as above), that companies run their businesses not only economically, but also ethically so that
they benefit the company and society.
CSR practices adopt the CSR dimensions developed by Carroll (1979, 1991), including
economic, legal, ethical, and philanthropic responsibilities. The measurements for those
dimensions are borrowed from Maignan and Ferrell (2000, 2001) who assessed corporate
citizenship in the United States and France by involving three groups of primary stakeholders:
customers, employees, and public stakeholders. Accordingly, their framework can be a
reference to analyse the influence of CSR on company performance (Marín, Rubio & de Maya
2012). From these measurements, the CSR strategies applied by companies can be identified
and categorised into reactive and proactive strategies as the most commonly used terms in the

88
strategic CSR literature (Bocquet et al. 2013; Chang 2015; Goran & Greg 2004; Groza,
Pronschinske & Walker 2011; Torugsa, O'Donohue & Hecker 2013).
3.2.2 Business Strategy Applied in This Thesis
This subsection explains business strategy applied in this thesis. Business strategy refers to
how a company competes and positions itself successfully in the market (Bowman & Helfat
2001). In this thesis, business strategy follows the most widely used typology from (Porter
1985), namely cost leadership and the differentiation strategies (González-Benito & Suárez-
González 2010; O'Farrell, Hitchens & Moffat 1992). Porter's generic strategies tend to be
robust (Kotha & Vadlamani 1995), consistent (O'Farrell, Hitchens & Moffat 1992) and are
commonly used strategy dimensions in the literature (Dess & Davis 1984; Kotha & Vadlamani
1995). Moreover, Porter’s typology has driven the most theoretical refinement and empirical
studies (Dess et al. 1995, p. 375), and gained considerable empirical support over time
(Campbell-Hunt 2000; Danny & Peter 1986; Robinson & Pearce 1988).
3.2.3 The Integration of CSR into Business Strategy
The integration of CSR into business strategy is discussed in this subsection. Because CSR
implementation is very complex, choosing the right combination of activities is one of the key
challenges of implementation of CSR practices (Vidal, Kozak & Hansen 2015). Currently, CSR
issues are being integrated into all elements of business operations and clear commitment to
CSR is made in the visions, missions, and value statements of a growing number of companies
around the world. It should be relevant to the company’s goals and core competencies for
appropriate implementation (Ofori 2007). Based on the findings from the literature review, this
thesis considers that two dimensions for the integration of CSR into the business strategy are
critical to organisations’ performance. They are explored below.

89
3.2.3.1 Strategic CSR Integration
This subsection describes strategic CSR integration with its critical dimensions proposed in
this thesis. Because strategic CSR becomes tremendously relevant to companies, it is crucial
for companies to be strategically involved in CSR (Ooi, Amran & Yeap 2017). CSR is
integrated by triggering, maintaining, and sharing a set of principal core values (Marques-
Mendes & Santos 2016). Strategic integration is carried out through the inclusion of social
responsibility objectives in the business strategy (Ganescu 2012b). This integration also
reflects how companies engage CSR in their management systems in practice (Engert, Rauter
& Baumgartner 2016; Werre 2003) and how they manage CSR implementation in their
organisation. Furthermore, this integration identifies the critical factors to drive the integration
internally, including the tools and communication processes used (Engert, Rauter &
Baumgartner 2016). Most activities in this integration are carried out at the strategic level and
conducted by managers (top management); even though they also involve employees and
customers.
This thesis considers three crucial dimensions of integrating CSR into the company’s
strategy at the strategic level highlighted in the literature, as follows:
1. Aligning CSR with the company’s strategy. The integration is only possible by putting CSR
at the core of the business (Dey & Sircar 2012) and aligning CSR with the overall goals and
strategies of the company to create and capture value (McWilliams & Siegel 2011). In this
dimension, the company includes CSR on a mission statement and creates a CSR-shared
vision (Arjaliès & Mundy 2013; Laguir, Laguir & Tchemeni 2019). Mission statements
describe selected criteria and make use of socially desirable approaches designed to attract
and retain shareholders, employees and customers (Chenhall 2003). Some authors highlight
that embedding CSR in the company’s vision and mission is a critical step in integrating
CSR into the business strategy (Dey & Sircar 2012; Guadamillas-Gómez, Donate-

90
Manzanares & Škerlavaj 2010). This step can reflect CSR’s actual importance to the
company’s mission (Burke & Logsdon 1996) and will guide all subsequent decision making
in the implementation process (Guadamillas-Gómez, Donate-Manzanares & Škerlavaj
2010; Ooi, Amran & Yeap 2017). In addition, strategic integration can be carried out by
establishing CSR as one of long-term goals of the company (Werre 2003), defining
objectives on social and environmental issues, providing a proper mechanism to evaluate
the results of the objectives and applying this mechanism throughout all areas of business
(Bernal-Conesa, de Nieves-Nieto & Briones-Peñalver 2017).
2. Gaining support and encouragement from top management. Aligning the business strategy
with CSR principles requires the support and encouragement of senior managers (Lindgreen
et al. 2011). Without support from top management, CSR programs would be difficult to
devise and enforce (Mahmoud, Blankson & Hinson 2017), potentially becoming critical
barriers to CSR implementation (Werre 2003). Besides, top management’s support is
essential to determine strategic and organisational boundaries under which employees are
permitted to participate in CSR activities in an effort to ensure employee behaviour is
consistent with the goals of the organisation (Arjaliès & Mundy 2013). For example, a
company can provide interaction between top management and subordinates in an effort to
promote organisational learning and implementation of new strategic initiatives (Gond et al.
2012). A company can also organise CSR efforts and establish a CSR steering committee,
which has formal and periodic meetings with top management to discuss CSR as a key topic
(Guadamillas-Gómez, Donate-Manzanares & Škerlavaj 2010; Laguir, Laguir & Tchemeni
2019; Martinez-Conesa, Soto-Acosta & Palacios-Manzano 2017; Werre 2003). These
meetings allow for regular discussions with operational departments about CSR strategy,
providing senior executives with ideas for a CSR strategy from other areas of the business
to check the validity of the assumptions that underlie the strategic plans (Arjaliès & Mundy

91
2013). Moreover, the CSR committee can formulate the direction the company needs to
follow to address stakeholder needs related to social and environmental issues. This ensures
that CSR is institutionalised within the core business vision, mission, priorities and
objectives of the company. Mentoring and coaching are provided to develop decision-
making capabilities that incorporate CSR criteria in the assessment of alternatives to
facilitate CSR institutionalisation (Werre 2003). These activities can represent the purpose
of the company to carry out its activities responsibly (Ooi, Amran & Yeap 2017) and ensure
that the company remains responsive to CSR issues (Bernal-Conesa, de Nieves-Nieto &
Briones-Peñalver 2017).
3. Developing effective communication. The company should develop effective
communication to generate a clear perception that CSR is an aspect of its strategic
importance (Guadamillas-Gómez, Donate-Manzanares & Škerlavaj 2010). CSR
communication can help companies convey the alignment of the CSR strategy with external
objectives to their employees, thereby creating a cohesive program for their CSR strategy
(Arjaliès & Mundy 2013; Guadamillas-Gómez, Donate-Manzanares & Škerlavaj 2010;
Laguir, Laguir & Tchemeni 2019). In addition to generating awareness of CSR initiatives,
CSR communication can be a crucial bond between the company and its stakeholders. CSR
communication can be characterised as the company’s communication to internal and
external stakeholders about its contributions to social, environmental and economic
development of society (Rasche, Morsing & Moon 2017). The company cannot reap the
benefits from CSR if it does not communicate CSR to relevant stakeholders (Maignan &
Ferrell 2004). Internal and external communication, therefore, is one of the critical aspects
of CSR implementation (Dobele et al. 2014). Internal communication can be conducted
through newsletters, intranet, e-mail, seminars, presentations and folders (Engert, Rauter &
Baumgartner 2016; Maon, Lindgreen & Swaen 2009). In contrast, communication with

92
external stakeholders can be carried out using official documents, such as annual reports
and corporate brochures, and intensifying the company’s presence on the internet and social
networks to communicate about CSR approaches through the company website and online
postings (Arjaliès & Mundy 2013; Asif et al. 2013; Galbreath 2006; Guadamillas-Gómez,
Donate-Manzanares & Škerlavaj 2010; Huang 2010; Maon, Lindgreen & Swaen 2009;
Reverte, Gómez-Melero & Cegarra-Navarro 2016).
3.2.3.2 Functional Integration
Following the strategic CSR integration presented in the previous subsection, this subsection
discusses the functional CSR integration included in this thesis’s theoretical framework. As
suggested by Asif et al. (2013), vertical integration of CSR is conducted by transforming
organisational objectives into operational and tactical imperatives. Thus, after integrating CSR
at the strategic level, the next dimension is integrating the companies’ social concerns into their
business activities and operations (Guadamillas-Gómez, Donate-Manzanares & Škerlavaj
2010; Quairel-Lanoizelée 2011). Functional integration can be defined as the extent to which
a company makes use of interactions with other intra-organisational units to make its program
objectives and practices consistent with its internal and external requirements (Swink,
Narasimhan & Kim 2005). In this integration, the company identifies its position regarding
responsible business practices and establishes the effectiveness of its activities (Tonysheva &
Chumlyakova 2016).
Similar to strategic integration, stakeholders' interests and objectives must be addressed with
a view to integrating CSR into the company's business operations and activities (Guadamillas-
Gómez, Donate-Manzanares & Škerlavaj 2010). While strategic integration mainly involves
top management and employees, the functional integration of CSR reflects how they manage
employees, customers, and suppliers categorised as primary stakeholders (Famiyeh 2017;

93
Maignan & Ferrell 2004). Hence, this thesis proposes six significant dimensions to be involved
in functional integration as follows:
▪ Production. Regarding the literature on manufacturing companies (Chi 2015; Theodorou &
Florou 2008; Ward et al. 1995), this thesis selects two of the manufacturing competitive
priorities, namely low cost and quality, because these two priorities match the business
strategy and are applicable in CSR studies (Boubakary & Moskolaï 2016; Marín, Rubio &
de Maya 2012; Yuan, Bao & Verbeke 2011). Companies are concerned about quality for
the purpose of gaining an advantage by stabilising the quality of the product at a
predetermined level according to the competition. Product quality can be improved through
several activities, such as conducting the statistical control of supplies and production,
creating quality circles and adopting the formalisation and standardisation of processes
(quality manuals). (Indonesia 2011; Theodorou & Florou 2008). In addition to cost and
quality, (3) innovation is also included as an important aspect of manufacturing strategies
and CSR integration (Baumgartner 2014; Theodorou & Florou 2008) through product or
process innovation, such as developing environmentally friendly products and innovations
and improvements in production processes, logistics or distribution (Reverte, Gómez-
Melero & Cegarra-Navarro 2016).
▪ Productivity in the value chain. Activities in the value chain can improve operational
effectiveness (Rangan, Chase & Karim 2012) and enhance the social, environmental, and
economic capabilities of supply chain members (Crane et al. 2014). In addition, a company’s
decisions should be appropriate not only to its internal stakeholders but also to all external
parties, such as suppliers and customers (Huang 2010). Thus, this thesis focuses on suppliers
and customers in the value chain (Witek-Hajduk & Zaborek 2016) as the primary external
stakeholders for CSR practices in the functional integration.

94
▪ Strengthening human resources. This thesis includes employees as primary internal
stakeholders. In addition to representing a small society inside the company, employees can
reflect social intentions (European Commision, cited in Vo, Delchet-Cochet & Akeb 2015)
and are involved directly in conducting productive activities (Maignan & Ferrell 2004). CSR
activities aimed at employees (Witek-Hajduk & Zaborek 2016) expose how a company
treats its employees during its operations (Ganescu 2012b). The company can direct social
activities to employees related to internal social responsibility (Tonysheva & Chumlyakova
2016), such as treating employees fairly and respectfully, incorporating their interests in
business decisions, offering appropriate compensation, creating a safe and healthy working
environment, and providing training and advancement programs for employees (Bauman &
Skitka 2012; Bernal-Conesa, de Nieves-Nieto & Briones-Peñalver 2016; Bhattacharya,
Korschun & Sen 2009; Lindgreen et al. 2009; Reverte, Gómez-Melero & Cegarra-Navarro
2016; Werre 2003).
To sum up, strategic CSR integration into business strategies consists of three dimensions:
aligning CSR with the company’s strategy, gaining support from top management, and
developing CSR communication. Functional integration contains six dimensions: cost, quality,
innovation, suppliers, customers, and employees. It can be regarded as a horizontal integration
of CSR since it is applied across divisions, functions, and roles and throughout the supply chain
(Asif et al. 2013). Both strategic and functional integration reflect how companies implement
CSR by integrating social, environmental, ethical, human rights and consumer concerns in their
core businesses in close cooperation with their stakeholders (Raquel, María Victoria & Antonio
2018). Therefore, this thesis simplifies prior frameworks by proposing only two levels of CSR
integration with several significant dimensions.

95
3.2.4 Essential Aspects of Company Performance
This subsection explains four essential aspects of company performance employed in this
thesis. It covers financial, employee, customer, and operational performances. It opens by
presenting financial performance. Then, it goes on to social performance, including customer
and customer performances. Operational performance is presented at the end of this subsection.
Measuring the performance of a company in the current competitive environment is highly
complicated. Doing so does not only assess a company's performance but also reflects its
organisational culture and philosophy and explains how well the company performs in terms
of financial and non-financial indicators (Wibisono 2011). Combining both the financial and
nonfinancial aspects of performance is considered to be a multidimensional approach to
performance and presents a more accurate way to measure company performance (Chong 2008,
cited in Stoian & Gilman 2017). Particularly in manufacturing companies, there are five levels
proposed to manage performance: financial perspective, customer perspective, manufacturing
competitive priorities, internal process, and resource availability (Wibisono 2011).
Speficically, top management, situated at the strategic level, needs financial measures for
managerial-level decisions, while lower management, situated at the tactical and operational
levels, and workers need operational measures for daily business activities (Hwang et al. 2014).
From a CSR perspective, evaluations of businesses’ impacts on society have to consider
both the financial and social value created by companies (Marques-Mendes & Santos 2016).
Several studies have found that CSR has positive effects on financial performance (Carroll &
Shabana 2010; Orlitzky, Schmidt & Rynes 2003; Zhu, Liu & Lai 2016). Nonetheless, non-
financial effects of CSR (i.e., corporate reputation, improved employee motivation and
customer satisfaction) have been overlooked (Reverte, Gómez-Melero & Cegarra-Navarro
2016). With respect to CSR integration, it is wise and sensible for business decision makers to
initiate or carry out CSR activities and practices that address not only social and environmental

96
concerns, but also economic concerns for their organisations (Ooi, Amran & Yeap 2017). In
this thesis, company performance represents the result of integration between CSR and the
business strategy, and as such, will be measured across four aspects: financial performance at
the strategic level, operational performance, and social performance including customer and
employee performance at the tactical and operational level.
3.2.4.1 Financial Performance
Several indicators of financial performance used in this thesis is listed in this subsection.
The economic dimension is related to the effect of a company on its economic condition and
on the economic system in which it is embedded (Ferraz, António & Gallardo-Vázquez 2016).
In this thesis, financial performance reflects the economic dimension that indicates the impact
of CSR integration measured by monetary terms as follows:
1. Profit. Profit is a widely used measurement to identify the relationship between CSR and
company performance (Chi & Gursoy 2009; Marín, Rubio & de Maya 2012; Martinez-
Conesa, Soto-Acosta & Palacios-Manzano 2017; Torugsa, O'Donohue & Hecker 2012;
Ward et al. 1995).
2. Cash flow. Cash flow (CF) can be defined as an increase or decrease in the amount of money
a business, organisation, or individual has. This term refers to the amount of cash (currency)
that is generated or consumed in a given time period (CFI 2018). Net CF (NCF) refers to
the difference between a company’s cash inflows and outflows in a specific period, and
measures a company’s cash balance in terms of financial accounting (Brealey et al. 2012).
Managers usually use NCF to identify the changes in a company’s cash balance and to
ensure that the company is profitable and has enough capital on hand for its business
operation. A healthier financial condition is presented by a higher NCF (Kun, Nasrin &
Weiquan 2019).

97
3. Sales growth. Sales growth is an appropriate reflection of the value that companies create
and share with society that enables cross-company comparisons and implies an increase in
economic growth, as well as an increase in the value of the goods and services delivered to
consumers (Stoian & Gilman 2017). Sales growth reflects an increase in sales over a specific
time period (Chen, Feldmann & Tang 2015). It also captures both the financial and
nonfinancial aspects of performance since it indicates that companies have achieved
profitability in the past and have also delivered customer satisfaction (Chong 2008, cited in
Stoian & Gilman 2017). Sales growth is also used as financial performance indicator in CSR
studies (Reverte, Gómez-Melero & Cegarra-Navarro 2016)
4. Return on investment (ROI). ROI is the most used indicator to assess business success
(Ansoff 1965, cited in Dess & Robinson 1984) and is the most common measure in strategic
management and social responsibility research (Beard & Dess 1981; Chi & Gursoy 2009;
Hambrick & Lei 1985; Maignan & Ferrell 2001; Schniederjans & Cao 2009; Venkatraman
& Vasudevan 1987). ROI is likely to be more controllable by managers (Valipour, Birjandi
& Honarbakhsh 2012) and proposed for managing the performance of a manufacturing
company (Wibisono 2011).
3.2.4.2 Social Performance
This subsection describes social performance that covers customer, employee, and
operational performances. The social dimension refers to the impacts generated by a company
on the social systems within which it works (GRI 2013). In this thesis, social performance
indicates how CSR integration influences social values from the perspective of customers and
employees. Customers and employees are major stakeholders who directly affect and relate to
a company’s operations. Companies have a strong interest in protecting the interests of their
major stakeholders, which influences their own outcomes directly (Dupire & M’Zali 2018).
Subsequently, while several stakeholders are involved in strategic and functional integration,

98
only consumer and employee performances are measured in terms of social performance along
with their relationship to financial performance.
In the literature, the impact of CSR integration on customer performance is measured using
customer complaints, customer satisfaction, customer loyalty and increasing number of
consumers (Gallardo-Vázquez & Sanchez-Hernandez 2014; Reverte, Gómez-Melero &
Cegarra-Navarro 2016; Ridho 2018; Santos & Brito 2012; Wibisono 2011). On the other hand,
an understanding of the relationship between CSR and employee performance is crucial
because the success of a company depends very much on its employees (Sun & Yu 2015). CSR
also has the potential to improve employee motivation and boost their opinion of their employer
(Dawkins 2005). In this thesis, employee performance will be measured by employee training,
employee motivation, career opportunities and employee turnover (Bernal-Conesa, de Nieves-
Nieto & Briones-Peñalver 2016; Gallardo-Vázquez & Sanchez-Hernandez 2014; Reverte,
Gómez-Melero & Cegarra-Navarro 2016; Santos & Brito 2012).
3.2.4.3 Operational Performance
Following the financial and social performance subsections, this subsection explains
operational performance and the indicator used in this thesis. At the operational management
and the shop-floor level, non-financial performance measures are more relevant than financial
measures (Wibisono 2011). In addition to financial and social performances, this thesis also
measures operational performance in terms of timelines of customer service and productivity
(Ping-Ju Wu, Straub & Liang 2015; Reverte, Gómez-Melero & Cegarra-Navarro 2016),
delivery (Chi 2015; Ward et al. 1995), operating efficiency (Reimann, Schilke & Thomas 2010)
and on time delivery (Wibisono 2011).
At the heart of stakeholder theory is the belief that a company's long-term sustainability
relies on the support of several stakeholders (Donaldson & Preston 1995). Stakeholders are
critical to the success of a company because they provide the company with resources (e.g.,

99
customers, investors and employees), form an industrial structure (e.g., supply chain partners
and strategic alliances) and form a socio-political arena (e.g., communities and governments)
(Post, Preston & Sachs 2002). Accordingly, in general, this thesis involves several primary
stakeholders, such as managers, employees, and customers, in strategic integration. Functional
integration includes suppliers and customers as supply chain partners, in addition to managers
and employees. In terms of performance, this thesis covers employees, customers, managers
(operational performance) and shareholders (financial performance).
3.3 Research Hypotheses
Based on the theoretical framework, this section presents several hypotheses proposed in
this thesis as follows.
3.3.1 The Relationship between CSR Integration and Company Performance
The link between CSR integration and company performance is explained in this section. It
begins by reviewing previous studies on this topic before proposing hypothesis accordingly.
Several authors argue that CSR integration into business strategy enhances company
performance both on social (non-financial) and financial aspects (Galbreath 2006;
Guadamillas-Gómez, Donate-Manzanares & Škerlavaj 2010; Porter & Kramer 2011).
Michelon, Boesso and Kumar (2013) claimed that companies have superior financial
performance if they prioritise CSR activities based on strategic concerns. Besides, CSR is a
vital strategic tool, given its essential role in building customer satisfaction and loyalty (Pérez
& Rodríguez del Bosque 2015). CSR practices offer benefits to customers, such as reduced
customer complaints, improvements in customer service, improvements in the relationship
with customers, and increased customer loyalty (Chi 2015). Implementing appropriate CSR
plans and activities contribute to higher customer satisfaction with the company (Park, Kim &
Kwon 2017).

100
In addition to the impact on customers, one way of measuring the effect of social
responsibility strategies is evaluating their impact on employees; that is, whether it is sincere
or mere window dressing (Insight 2016). Employees who are satisfied with their company’s
commitment to society are expected to be more positive, loyal and productive than those
working for less committed employers (Dey & Sircar 2012). Prior studies argue that employees
work more productively in socially responsible companies (Sun & Yu 2015). Subsequently, I
suggest:
Hypothesis 1. Strategic CSR integration has a positive impact on (1a) customer
performance, (1b) employee performance, (1c) operational performance and (1d) financial
performance.
Functional integration reflects how the company integrates CSR with its current business
practices at the functional level (i.e., production, suppliers, customers, and employees).
Through integrating CSR into the management processes and core business activities,
economic and social objectives become easier to achieve, leading to an increase in the
company's social and financial performances (Galbreath 2006; Kapoor & Sandhu 2010). Prior
studies argue that socially responsible practices can increase employee commitment to their
company, morale (Porter & Kramer 2006) and productivity, and reduce absenteeism and
turnover (Chtourou & Triki 2017). If companies actively engage in CSR activities, they can
improve employee motivation to work effectively (Sun & Yu 2015). Moreover, CSR can
provide opportunities to reduce present and future costs to the business, thereby increasing
operational efficiency (Brine, Brown & Hackett 2007) and improving operational capabilities
and overall performance (Famiyeh 2017). Therefore, I suggest:
Hypothesis 2. Functional CSR integration has a positive impact on (2a) customer
performance, (2b) employee performance, (2c) operational performance and (2d) financial
performance.

101
Strategic integration describes how the company integrates CSR into its business strategy at
the strategic level. This integration is implemented for the long term and guides activities at
the functional level. From multiple case studies, Lindgreen et al. (2011) found that companies
started CSR integration by incorporating their mission and vision with CSR. This then
influences decisions on the development of CSR practices (Guadamillas-Gómez, Donate-
Manzanares & Škerlavaj 2010). The stages of CSR integration occur sequentially, and a further
stage can be conducted if the previous stage has been completed (Bhattacharyya 2010;
Guadamillas-Gómez, Donate-Manzanares & Škerlavaj 2010; Tonysheva & Chumlyakova
2016). Additionally, functional-level strategic planning should fit with and support business-
level strategies (Schniederjans & Cao 2009). The proposed model in this thesis first puts in
strategic integration and then functional integration. Therefore, I suggest:
Hypothesis 3. Strategic CSR integration has a positive relationship with functional CSR
integration.
3.3.2 Mediating Effects in the Relationship between CSR Integration and Financial
Performance
In the relationship between CSR integration and financial performance, this subsection
discusses mediating effects. It starts by presenting previous studies that have looked at this
topic, and then it presents several hypotheses about it.
The direct relationship between CSR and company performance does not ensure total
reliability, as this relationship can be affected by many factors (Khan et al. 2018; Saeidi et al.
2015), including mediators that help to understand this relationship and improve the reliability
of results (Ali, Danish & Asrar-ul-Haq 2020). With regards to the integration of CSR into the
business strategies and activities of companies, researchers highlight the necessity of
considering the concerns and objectives of stakeholders from a long-term perspective
(Bhattacharyya 2010; Gazzola & Colombo 2014; Guadamillas-Gómez, Donate-Manzanares &

102
Škerlavaj 2010; Maon, Lindgreen & Swaen 2009). Companies explicitly emphasise
responsibility, and in particular economic responsibility, towards their shareholders
(Öberseder, Schlegelmilch & Murphy 2013). However, shareholders’ needs cannot be fulfilled
and a company's financial performance cannot be maximised without meeting other
stakeholders’ requirements, such as customers, employees, suppliers and the public to some
extent (Sen & Cowley 2013). Therefore, there is increasing consensus that stakeholders should
be satisfied with a company's CSR implementation before any financial performance
improvements can be achieved (Galbreath & Shum 2012; Sen & Cowley 2013). By satisfying
stakeholder needs, companies encourage their support, which in turn leads to better levels of
performance (Clarkson 1995).
The current literature has examined mediators from the stakeholders’ perspective (Galbreath
& Shum 2012). For instance, previous studies demonstrate that the relationship between CSR
and financial performance can be mediated by customer performance. Using secondary data,
Luo and Bhattacharya (2006) investigated that customer satisfaction plays a significant role
and partially mediates the relationship between CSR and financial performance. García-
Madariaga and Rodríguez-Rivera (2017) confirmed that customer satisfaction mediates the
relationship between CSR and financial performance measured by market to book ratio.
Similarly, Saeidi et al. (2015) examined whether the relationship between CSR and company
performance is fully mediated using sample data from 205 Iranian manufacturing companies.
They used customer satisfaction as a mediator, which includes three dimensions: customer
satisfaction with product or service quality, customer satisfaction with value for price, and
meeting customer expectations. Company performance is measured financially through market
share growth, sales growth, ROE, ROS, ROA, ROI, and net profit margin of the company.
Findings show that customer satisfaction mediates the relationship between CSR and financial
performance.

103
Another study by Xie et al. (2017), with a sample of 238 companies in China and Vietnam,
revealed that CSR activities can help companies improve their financial performance by
improving customer satisfaction. Moreover, customer satisfaction will increase their loyalty,
so they are more likely to repeat purchases, which lead to increased demand, bigger sales
volume, and in turn, improved performance levels. Hence, greater customer loyalty will lead
to greater financial performance (Maignan et al. 1999).
Most studies aiming to determine the relationship between corporate social performance and
financial performance reveal a positive correlation between social and financial performance
(Bernal-Conesa, de Nieves-Nieto & Briones-Peñalver 2017; Ganescu 2012a; Lee 2008).
Chtourou and Triki (2017) argued that social performance can affect financial performance.
By responding to the expectations of various stakeholders, a company can enhance its
reputation, which positively influences its financial performance (Famiyeh 2017). Tang, Hull
and Rothenberg (2012) also identified that companies increase profits if they implement CSR
strategy consistently, including related dimensions of CSR, and start with those more internal
to the companies.
Subsequently, this thesis examines a mediating effect among company performances: that
the satisfaction of different stakeholders (including customers and employees) and operational
performance are vital for a company’s financial performance. Thus, I propose:
Hypothesis 4. The relationship between strategic CSR integration and financial
performance is mediated by (4a) customer performance, (4b) employee performance, and
(4c) operational performance.
Hypothesis 5. The relationship between functional CSR integration and financial
performance is mediated by (5a) customer performance, (5b) employee performance, and
(5c) operational performance.

104
3.3.3 Moderating Effects in the Relationship between CSR Integration and Company
Performance
The moderating effects in the relationship between CSR integration and financial
performance are explained in this section. It begins by presenting prior research that have
investigated this topic. Then, based on their findings, it proposes hypotheses.
CSR implementation in Indonesia is very complicated, due to related regulations and other
interests (see section 2.8.3 for detail). Because complex phenomena are usually subject to
contingencies, it is essential to consider moderating effects. The word contingency implies that
something is only true under specified conditions (Chenhall 2003). For this reason, this thesis
explores whether CSR integration’s impact on company performance is moderated by business
and CSR strategies adopted by the company and is dependent on company size and industry
type.
Several prior studies investigate the relationship between business strategy and company
performance (Banker, Mashruwala & Tripathy 2014; Dess & Davis 1984; Reverte, Gómez-
Melero & Cegarra-Navarro 2016; Sun & Pan 2011; Valipour, Birjandi & Honarbakhsh 2012).
Most of these studies found that companies adopting one of the business strategies have better
performance than companies implementing another strategy (Banker, Mashruwala & Tripathy
2014; Dess & Davis 1984; González-Benito & Suárez-González 2010; Sun & Pan 2011). Thus,
I suggest:
Hypothesis 6. Business strategy moderates the impact of strategic CSR integration on (6a)
customer performance, (6b) employee performance, (6c) operational performance and (6d)
financial performance.
Hypothesis 7. Business strategy moderates the impact of functional CSR integration on (7a)
customer performance, (7b) employee performance, (7c) operational performance and (7d)
financial performance.

105
The interactions among activities in companies, particularly those related to CSR, and the
extent to which these interactions can help create and sustain a competitive advantage require
thought. Companies have to decide which CSR strategies they adopt, because CSR strategy
impacts company performance based on how the company behaves and implements CSR
(Galbreath 2006). Some studies argue that different CSR strategies adopted by companies
influence company performance in different ways. The practices of proactive companies can
potentially lead to a competitive advantage (Orsato 2006), but those of reactive companies
cannot. By applying a proactive strategy, a company may reduce its costs and risk, increasing
its profits and competitive advantage, improving its reputation and legitimacy, and creating a
synergistic value (Kurucz et al., cited in Ganescu 2012b). Reactive companies, in merely
implementing CSR to fulfil regulations, cannot obtain a competitive advantage (Vo, Delchet-
Cochet & Akeb 2015). Therefore, I propose:
Hypothesis 8. CSR strategy moderates the impact of strategic CSR integration on (8a)
customer performance, (8b) employee performance, (8c) operational performance and (8d)
financial performance.
Hypothesis 9. CSR strategy moderates the impact of functional CSR integration on (9a)
customer performance, (9b) employee performance, (9c) operational performance and (9d)
financial performance.
A different contingency is size, which determines the structure that is required.
Organisational size reflects how many people are working in the organisation and is also an
internal organisational characteristic (Donaldson 2001). Traditionally, company size is related
to performance (Reverte, Gómez-Melero & Cegarra-Navarro 2016) and is likely to affect a
company’s non-market and market performance because larger companies have greater
incentives or capabilities to pursue non-market and market strategies (Chen 1996; Schuler et
al. 2002, cited in Wei et al. 2016). Previous studies reveal that company size is frequently

106
applied as a control variable that has an impact on how companies engage in CSR (Lorenz,
Gentile & Wehner 2013; Marín, Rubio & de Maya 2012; Vo, Delchet-Cochet & Akeb 2015).
In addition to being one of the strongest correlates of company profit performance (Beard &
Dess 1981), company size is also used in several studies of CSR-company performance
relationships (Chen & Wang 2010; Chtourou & Triki 2017; Hasan et al. 2018; Kim, Kim &
Qian 2018; Michelon, Boesso & Kumar 2013; Torugsa, O'Donohue & Hecker 2013; Wang &
Berens 2015) and manufacturing (Lao, Hong & Rao 2010; Swink, Narasimhan & Kim 2005;
Ward et al. 1995).
Some authors argue that larger companies are more likely to have more resources to employ
in their CSR activities (Hull & Rothenberg 2008; Marcel 2009; Waddock & Graves 1997, cited
in Jones 1999; Kiessling, Isaksson & Yasar 2016; Zbuchea & Pînzaru 2017), and this may
affect their financial performance (Chen & Wang 2010; Wang & Berens 2015). In particular,
company size is associated with the integration of CSR into business strategy (Vo, Delchet-
Cochet & Akeb 2015). Hence, I suggest:
Hypothesis 10. Company size moderates the impact of strategic CSR integration on (10a)
customer performance, (10b) employee performance, (10c) operational performance and
(10d) financial performance.
Hypothesis 11. Company size moderates the impact of functional CSR integration on (11a)
customer performance, (11b) employee performance, (11c) operational performance and
(11d) financial performance.
Since regulatory bodies enact legislation on CSR issues such as environmental
sustainability, corporate governance and human rights, such legislation is likely to create
variations in the social performance of companies in the industries affected over time (Short et
al. 2016). The industry in which a company operates can also affect the pressures it faces from
different stakeholder groups (Michelon, Boesso & Kumar 2013), and different types of

107
industries show varying tendencies to implement CSR (Kolk 2003). For example, consumer
product companies see their largest exposure and greatest pressure from customer groups
(Michelon, Boesso & Kumar 2013). On the other hand, companies in industries such as
utilities, oil and natural gas are under extensive scrutiny from a wide range of stakeholders (i.e.,
they face significant business exposure and the greatest pressure from stakeholders concerned
about environmental impacts), so they are more likely to engage in certain CSR activities than
companies in other industries. Companies in industrial sectors with relatively high impact on
the environment led other companies in CSR disclosure (Michelon, Boesso & Kumar 2013).
In his study, Kolk (2003) found that the industrial sector scores above average in sustainability
reporting; the chemical and pharmaceutical industries are leaders in sustainability reporting. In
contrast, most sectors that remain below average are non-industrial. Product differentiability
can be considered another significant contingency variable (Hambrick & Lei 1985). It has been
shown that CSR performance differences are obvious between industries (Waddock & Graves
1997). Accordingly, I propose:
Hypothesis 12. Industry type moderates the impact of strategic CSR integration on (12a)
customer performance, (12b) employee performance, (12c) operational performance and
(12d) financial performance.
Hypothesis 13. Industry type moderates the impact of functional CSR integration on (13a)
customer performance, (13b) employee performance, (13c) operational performance and
(13d) financial performance.
Figure 3.2 displays the theoretical framework for this thesis with its hypotheses. The
framework depicts how CSR can be integrated into business strategy at both strategic and
functional levels. Strategic integration covers three essential dimensions, and functional
integration contains six crucial dimensions.

108
Figure 3.2: The Theoretical Framework for the Integration of CSR into Business Strategy
with the Hypotheses
The relationship between integration and company performance will be measured across
four aspects of company performance (i.e., customer, employee, operating and financial
performance). In addition, a mediating effect will be investigated in the interaction among four
aspects of company performance. Moderating effects will also be evaluated based on business
strategy and CSR strategy, whereas company size and industry type will be used as control
variables in the relationship between integration and company performance.
3.4 Summary of Chapter 3
This chapter explores the conceptual framework of strategy and company performance. The
theoretical framework is presented in this chapter, which includes various key elements of the
theoretical framework, such as CSR strategy, business strategy, and CSR integration into
business strategy, as well as company performance. The relationship between CSR integration
and company performance are explained, followed by the mediating and moderating effects in
this relationship. This chapter also covers the development of research hypotheses.

109
CHAPTER 4: RESEARCH METHODOLOGY
This chapter presents the methodology used in this thesis. A research approach is explained
first, followed by the research paradigm and research design. Then, the questionnaire
development is discussed, and the sampling process is provided. The next section describes
data analysis procedures and identifies the respondents’ characteristics. Then, PLS-SEM for
data analysis conducted in this thesis is explained, as well as the ethical considerations for this
thesis.
4.1 Research Approach
Research approach employed in this thesis is explained in this section. An explanatory study
emphasises a situation or a problem to explain the relationships between variables (Saunders
2009). As stated in previous chapters, a key research gap is that most previous studies have
established a framework for investigating the integration of CSR into business strategies based
on conceptual or qualitative methods. Although they have contributed new insights to and
understanding of the integration of CSR, these studies have provided little empirical evidence to
explain the relationship between the indicated variables or assess the reliability and relevance of
the framework. Furthermore, empirical measurement of the impact of the integration on company
performance remains limited (Mellahi et al. 2015; Yuan, Bao & Verbeke 2011). Therefore, this
thesis conducts an explanatory study to address this research gap by investigating the relationship
between the integration of CSR into business strategies and company performance (Hair et al.
2011), especially among manufacturing companies in Indonesia. As a result, this thesis examines
‘how’, or the extent to which companies integrate CSR into their business strategy, and ‘what’,
or the impact of CSR integration on company performance.

110
4.2 Research Paradigm
This section describes a research paradigm used in this thesis. It includes ontology,
epistemology, and a deductive approach.
A research paradigm represents a set of beliefs, values, perceptions, and aesthetics that define
how a phenomenon of interest is investigated (Lincoln 2011). A research paradigm aims to
determine how the world operates, how information should be gained, which types of questions
should be asked, how data collected should be interpreted, and which criteria support sufficient
answers to research questions (Perri & Bellamy 2012).
With respect to ontology, which relates to the nature of reality (Saunders 2009), this thesis
applies an aspect of objectivism that depicts ‘the position that social entities exist in reality
external to social actors concerned with their existence’ (Saunders 2009, p. 110). Epistemology
connects to ‘what constitutes acceptable knowledge in a field of study’ (Saunders 2009, p. 112)
and refers to how to obtain the knowledge (Hirschheim 1992, cited in Myers 2009). In terms of
epistemology, this thesis implements positivism to build a hypothesis based on the theory
(Saunders 2009).
More specifically, to generate reasonable answers to research questions and elucidate causal
relationships between variables, this thesis employs deductive research by developing
measurements and testing hypotheses using current theories and analytical methods (Perri &
Bellamy 2012; Saunders 2009). To do so, two steps have been taken, namely conceptualisation
and operationalisation (Creswell 2014). Conceptualisation is achieved by formulating and
restricting the definition of the CSR concept through the study of applicable literature and
documents, while operationalisation is carried out by elaborating the definition into indicators and
constructs, later to be developed as instruments of analysis. Appendix A.1 presents the concept
definition and the concept measurement used in this thesis. The operationalisation of indicators
and constructs employed in this thesis is provided in the next section (see Table 4.10 for detail).

111
4.3 Research Design
This section outlines a research design conducted in this thesis. It covers quantitative research
and survey. It also provides the supporting and logical reasons for why this thesis chose them. At
the end of this section, there is a figure illustrating the research approach and design of this thesis.
A research design provides the researcher with a road map of the whole research project
(Myers 2009). A quantitative research design examines theories and concepts by assessing the
relationships between particular specified constructs (Creswell & Clark 2018; Perri & Bellamy
2012). In addition, quantitative research can summarise many characteristics (Hair et al. 2011),
and is characterised by deduction, confirmation, theory/hypothesis testing, explanation,
prediction, standardised data collection, and statistical analysis (Hair et al. 2011; Johnson &
Onwuegbuzie 2004; Saunders 2009). Because this thesis investigates CSR integration, which
covers many attributes such as CSR, business strategy and company performance, quantitative
research is considered appropriate to collect, analyse, and integrate research data to address the
research questions (Johnson & Onwuegbuzie 2004). This is consistent with the explanatory,
deductive approach taken in this thesis. Moreover, quantitative research embraces complex
structural equation models that combine causal paths and the identification of many variables
(Creswell 2014).
In this thesis, samples are used to replicate the characteristics of the population: the
Indonesian manufacturing industry. Results of hypothesis testing can serve to provide a deeper
understanding of CSR integration and company performance. The researcher is then able to
conclude the extent to which current theories and knowledge can reasonably explain the
relationship between CSR integration and company performance in the context of the
Indonesian manufacturing industry.
Approximately 568 companies are listed on the IDX; however, not all listed companies
make sustainability reports (Rofelawaty 2014). From 90 companies that participated in the

112
Indonesian Sustainability Report Award from 2008 to 2016, 27% or only 24 participants were
manufacturing companies. Besides, there are few websites owned by manufacturing
companies. As a result, this thesis could not obtain a description of CSR activities, business
strategy or company performance through secondary data. A quantitative analysis using a
survey was therefore chosen as the most appropriate method for collecting primary data.
A survey is a research instrument collecting important information by posing questions
(Ruane 2005), which produces ‘a quantitative description of trend, attitudes, or opinions of a
population by studying a sample of that population’ (Creswell 2014, p. 13). Hence, the survey
method chosen for data collection is useful for the researcher in gathering attitudes and
opinions of individuals concerning the phenomenon of interest, based on the intention of
finding empirical evidence (Bryman 2011). As results from the survey, ‘quantitative data refers
to measurements in which numbers are used directly to represent the characteristics of
something’ (Hair et al. 2011, p. 145). Surveys involve the collection of data from samples of a
large population with the purposes of generalising from a sample to a population (Fowler 2008,
cited in Creswell 2014) for explorative and explanatory research (Creswell, 2014) as well as
descriptive research (Saunders 2009). Surveys are consistent with a deductive approach
(Saunders 2009). In addition, surveys are a highly effective social and behavioural science
assessment tool (Ruel, Wagner & Gillespie 2016) because of their flexibility, considering the
many instruments and data collection options available (Ruel, Wagner & Gillespie 2016), and
are therefore useful in hypothesis testing (Huber & Power 1985).
Surveys are suitable for obtaining large amounts of data (Hair et al. 2011), which is useful
given the number of manufacturing companies and their widespread geographical dispersal
across Indonesia, especially in Java. The data gathered from the survey could be used to suggest
possible explanations for different relationships between variables explored in this thesis and
to establish a proposed theoretical model based on these relationships (Saunders 2009).

113
Furthermore, the purpose of providing an overview of the implementation of CSR among
Indonesian manufacturing companies at a certain time triggered the selection of a questionnaire
survey. In doing so, the researcher can have a clear snapshot of how companies manage CSR
and its integration into business strategy, as well as its impact on company performance, a
position that has been especially lacking in the preceding literature.
Figure 4.1 illustrates the complete research approach of this thesis.
Figure 4.1: Research Approach of This Thesis
4.4 Questionnaire Development
This section explains how a questionnaire in this thesis is developed that includes several
steps. Then, it is divided into two subsections: (i) the development of the measurements and
their scales and (ii) pilot study.
A questionnaire is a prepared set of questions (or measures) used by respondents to record
data (Hair et al. 2011; Ruel, Wagner & Gillespie 2016). A good questionnaire will ‘stand alone’
and allow a researcher to collect data without having to make any personal interactions with
the respondent, thus overcoming most time and space barriers (Ruane 2005). The survey in this
Philosophies
Positivism
Approaches
Deductive
Methodologies
Quantitative
Method/Strategy
Survey
Approach
Questionnaire

114
thesis therefore used the questionnaire for data collection (Fowler 2008, cited in Creswell 2014)
since it is appropriate for explanatory research (Saunders 2009) and used extensively in surveys
(Lewis-Beck, Bryman & Liao 2004).
The questionnaire was developed sequentially in several steps (Churchill 1979). First, a draft
of the questionnaire was designed based on the theoretical framework developed in the
previous chapter by borrowing several variables from the literature. Second, in the process of
developing the questionnaire, a brief discussion was held with 20 executives who have
adequate knowledge and working experience in the Indonesia manufacturing industry. They
were asked to choose five variables for business strategy, CSR strategy and strategic integration
and functional integration, which were the most commonly applicable and relevant to their
company’s situation and condition. In relation to company performance, they were also asked
to select four indicators for each performance (i.e., customer, employee, operating, and
financial performances), which were most frequently used to measure their company’s
performance. On obtaining input from the discussion, an initial version of the questionnaire
was developed. Third, three pre-test procedures were implemented to check the questionnaire
was understood by individuals (Hilton 2017; Ruel, Wagner & Gillespie 2016). Pre-test is a
critical way of minimising measurement error, decreasing respondent workload, and increasing
the response rate (Caspar 2016; Hilton 2017; Ruel, Wagner & Gillespie 2016). Results from
the pre-test determine how well each questionnaire item actually signifies the construct to be
measured; hence, suggest improvements for the instrument design (Ruel, Wagner & Gillespie
2016).
In this thesis, pre-tests were conducted in three stages. First, both supervisors of this thesis
initially systematically evaluated the pool of items for relevance to this thesis (Fowler 2014).
They then reviewed the resulting questionnaire several times, making some improvements to
the design of the instrument, specifically wording and spacing but not the meaning of the

115
question. Second, the draft of questionnaire was given to two Indonesian academics with CSR
expertise for expert-driven pre-testing, which is essential for evaluating the face and construct
validity of a measurement (Nunnaly 1994; Ruel, Wagner & Gillespie 2016). These academics
were asked to provide whether the questions were relevant to CSR in an Indonesian context.
Last, a respondent-driven pre-test (Ruel, Wagner & Gillespie 2016) was conducted with 10
respondents. The selected respondents were senior managers with adequate manufacturing
industry experience and had a high managerial position in their companies; for example,
directors or managers in functional areas, such as plant, production and logistics managers.
They evaluated whether the questions were relevant to the Indonesian manufacturing industry.
In these three pre-tests, the experts and respondents helped to verify if all survey questions
were appropriate and necessary and to determine whether the survey moved smoothly from
one question to the next (Ruel, Wagner & Gillespie 2016). Overall, 14 individuals participated
in the pre-tests, consistent with suggestions that surveys should be pre-tested with 12 to 50
people (Ruel, Wagner & Gillespie 2016). To avoid bias, different individuals were involved in
the initial discussion (before pre-tests) and pre-tests.
Two key suggestions emerged from the pre-tests. First, respondents noted that the
questionnaire needed to be translated into the Indonesian language to save time for reading and
to avoid misunderstanding. As a result, one bilingual and native Indonesian translator translated
the questionnaire into Indonesian (original translation), which was then back-translated into
English by one bilingual and native English translator to ensure accuracy (Brislin 1970;
Saunders 2009). This process took extensive refinements until the translated instruments had
conceptual and practical equivalence (Cavusgil & Das 1997). The few discrepancies observed
between the original questionnaire and its back-translated version was only minor and easily
addressed by the translators. Both the Indonesian and English translators also confirmed that

116
in each sentence, the two versions of the questionnaire (Indonesian and English) had
appropriate meaning corresponding to the content of the message.
Second, respondents suggested that questions should be put into shorter sentences. Thus,
the sentences in the questionnaire were simplified, particularly because they were translated
into Indonesian. Each statement was checked to ensure that its wording was as correct as
possible (Churchill 1979). This suggestion resulted in small adjustments to the content.
However, none of the items were removed in response to suggestions from the pre-test; all
items were used as they fulfilled the requirements for the item analysis.
Appendices A.2 and A.3 display the full questionnaire in English and Indonesian,
respectively. In total, the questionnaire consisted of 105 questions, covering the following
areas: 10 questions related to business strategy, 20 questions related to CSR strategy, 15
questions related to strategic integration, 30 questions related to functional integration, and 19
questions related to company performance. The remaining 11 questions related to
demographics. The questionnaire was designed so that the dependent variables (company
performance) followed the independent variables (business strategy, CSR strategy, strategic
integration and functional integration) to minimise the impact of consistency motif (Salancik
& Pfeffer 1977).
The questionnaire is an efficient way to collect responses from a large sample as each
respondent is required to answer the same set of questions (Saunders 2009). Because of cost
savings, restricted resources and the vast sample area, the survey questionnaire was self-
administered (Ruane 2005; Ruel, Wagner & Gillespie 2016), which provides the best access
and answer rates in anonymous surveys (Ruel, Wagner & Gillespie 2016). More specifically,
with self-report questionnaires, the degree to which individual items reflect the structure being
evaluated and cover the entire spectrum of the structure (content validity) can be determined
(Field 2009). In the questionnaire, closed-ended questions were provided as predefined

117
multiple choices available for each question, so respondents could simply click or circle the
appropriate answer (Fowler 2014). Since closed-ended questions indicate individual answers,
they are likely to be more consistent over time and offer greater reliability (Ruel, Wagner &
Gillespie 2016).
4.4.1 The Development of the Measurements and Their Scales
This section shows how the measurements and scales for each variable in this thesis are
developed. The questionnaire contains dependent and independent variables. The independent
variables (predictors) include business strategy, CSR strategy, strategic integration and
functional integration, while the dependent variables (outcomes) are company’s performances.
This section deals with the measurement items for each part (variable) of the questionnaire and
their scales. Scales include a collection of answers that represent ordered points on a continuum
of possible responses (Ruel, Wagner & Gillespie 2016). A measurement scale can be defined
as an instrument with a predefined number of closed-ended answers that can be used in
response to a question (Hair et al. 2017).
Objective performance assessment is generally difficult to predict, particularly how much
strategic planning affects this performance (Greenley & Foxall 1997). There is a large degree
of convergence between objective and subjective financial performance measures
(Venkatraman & Vasudevan 1987). The strategic management literature also supports the use
of subjective performance measurement (Dess & Robinson 1984; Kabadayi, Eyuboglu &
Thomas 2007; Lee & Miller 1996; Nandakumar, Ghobadian & O'Regan 2011; Pearce, Robbins
& Robinson 1987; Richard, Abdul & Andrew 1995; Wai-Kwong, Priem & Cycyota 2001).
In this thesis, the measurement of independent and dependent variables uses self-reported
data as subjective measures in the context of Indonesian manufacturing companies for three
reasons. First, measuring CSR objectively is not possible; thus, research in this field can focus
on perceptions of CSR (Cochran & Wood 1984). Second, due to limited company annual

118
reports which can be accessed publicly, and limited company websites, this thesis could access
descriptions of company performance through secondary data (i.e., objective measurements).
The latest data from GRI and IDX revealed that 109 sustainability reports were issued out of a
total of 629 listed companies (Kencana 2019), and only 59 organisations have employed GRI
as a way to report their CSR practices (GRI 2017). Third, Indonesian manufacturing companies
are mostly reluctant to reveal information concerning their performance, mainly financial
performance, as it is confidential. Consequently, poor accessibility served as a barrier to
objective performance data (Shields, Deng & Kato 2000). As a result, subjective measures,
which rely on respondents’ perceptions, were used as a substitute and viable alternative (Kim,
Nam & Stimpert 2004; Venkatraman & Ramanujam 1986).
4.4.1.1 Measurements of Business Strategy
This subsection explains the measurement of business strategy used in this thesis. As
previously stated, this thesis follows the most widely-used typology from Porter (1980a, 1985):
cost leadership and differentiation strategy. The measurement of these strategies is adopted
from prior studies, mainly Dess and Davis (1984). Other items of cost leadership were taken
from Luo and Zhao (2004), whereas other questions of differentiation were borrowed from
Robinson and Pearce (1988). The cost leadership and differentiation strategies are considered
as two strategic positioning dimensions along which companies may score high or low
(O'Farrell, Hitchens & Moffat 1992) rather than two opposite ends of a continuum. In this
thesis, therefore, the extent to which a company's strategy conforms to a particular strategic
type was assessed using a five-point scale designed to measure each strategic type, ranging
from 1=‘least important’ to 5=‘most important’ (Dess & Davis 1984). This approach allows
hybrid or mixed strategies to be considered. The details of measurement items for business
strategy and their codes are summarised in Table 4.1.
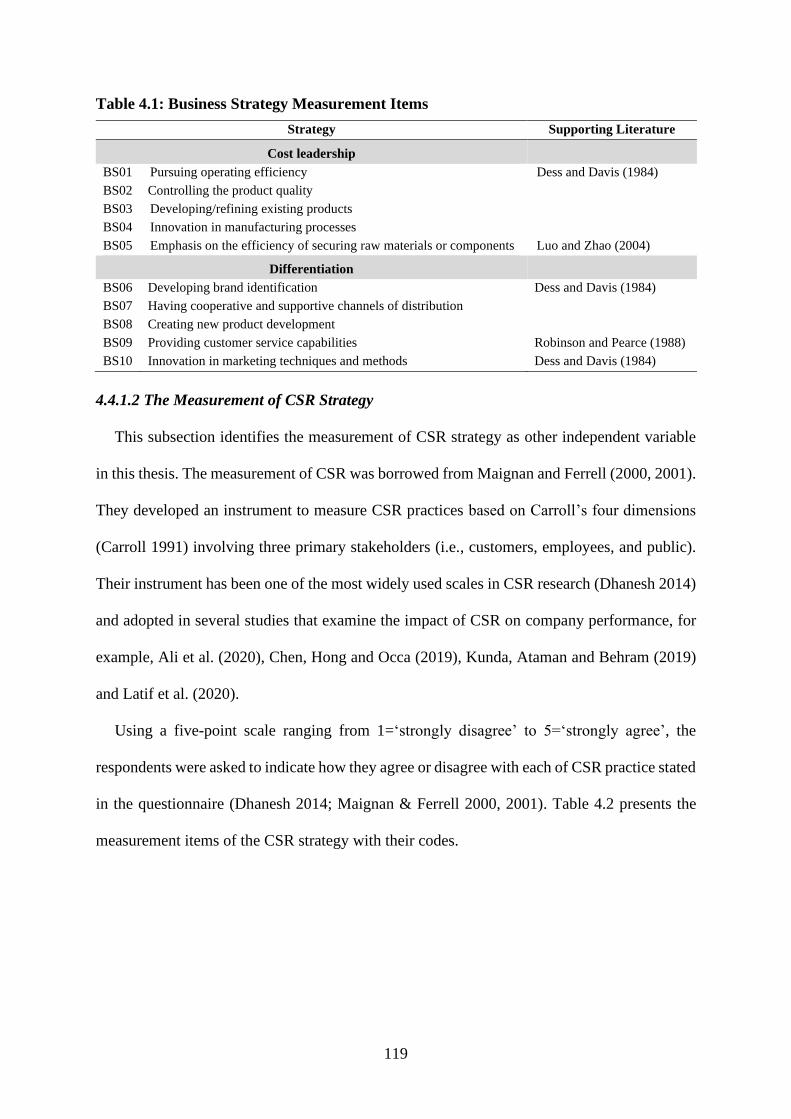
119
Table 4.1: Business Strategy Measurement Items
Strategy Supporting Literature
Cost leadership
BS01 Pursuing operating efficiency Dess and Davis (1984)
BS02 Controlling the product quality
BS03 Developing/refining existing products
BS04 Innovation in manufacturing processes
BS05 Emphasis on the efficiency of securing raw materials or components Luo and Zhao (2004)
Differentiation
BS06 Developing brand identification Dess and Davis (1984)
BS07 Having cooperative and supportive channels of distribution
BS08 Creating new product development
BS09 Providing customer service capabilities Robinson and Pearce (1988)
BS10 Innovation in marketing techniques and methods Dess and Davis (1984)
4.4.1.2 The Measurement of CSR Strategy
This subsection identifies the measurement of CSR strategy as other independent variable
in this thesis. The measurement of CSR was borrowed from Maignan and Ferrell (2000, 2001).
They developed an instrument to measure CSR practices based on Carroll’s four dimensions
(Carroll 1991) involving three primary stakeholders (i.e., customers, employees, and public).
Their instrument has been one of the most widely used scales in CSR research (Dhanesh 2014)
and adopted in several studies that examine the impact of CSR on company performance, for
example, Ali et al. (2020), Chen, Hong and Occa (2019), Kunda, Ataman and Behram (2019)
and Latif et al. (2020).
Using a five-point scale ranging from 1=‘strongly disagree’ to 5=‘strongly agree’, the
respondents were asked to indicate how they agree or disagree with each of CSR practice stated
in the questionnaire (Dhanesh 2014; Maignan & Ferrell 2000, 2001). Table 4.2 presents the
measurement items of the CSR strategy with their codes.

120
Table 4.2: CSR Strategy Measurement Items
CSR Dimension Supporting Literature
Economic responsibility
CS01 We strive to lower our operating costs. Maignan and Ferrell (2000)
CS02 We closely monitor employees’ productivity.
CS03 Top management establishes long-term strategies.
CS04 We have a procedure in place to respond to every customer complaint. Maignan and Ferrell (2001)
CS05 We continually improve the quality of our products.
Legal responsibility
CS06 Internal policies prevent discrimination in employee’s compensation
and promotion.
Maignan and Ferrell (2001)
CS07 We seek to comply with all laws regulating hiring and employee benefits. Maignan and Ferrell (2000)
CS08 All our products meet legal standards. Maignan and Ferrell (2001)
CS09 Our contractual obligations are always honoured.
CS10 Managers are informed about relevant environmental laws.
Ethical responsibility
CS11 We have a comprehensive code of conduct. Maignan and Ferrell (2000)
CS12 We are recognised as a trustworthy company.
CS13 Fairness toward co-workers and business partners is an integral part of
the employee evaluation process.
CS14 We have a proper procedure for employees to report any misconduct at
work.
CS15 Members of our company follow professional standards. Maignan and Ferrell (2001)
Discretionary/philanthropy responsibility
CS16 We give adequate contributions to charities. Maignan and Ferrell (2000)
CS17 We encourage partnerships with local businesses and schools.
CS18 We give a donation for sport and/or cultural activities. Maignan and Ferrell (2001)
CS19 A program is in place to reduce the amount of energy and materials
wasted in our business.
Maignan and Ferrell (2000)
CS20 We encourage employees to join civic organisations that support our
community.
Maignan and Ferrell (2001)
4.4.1.3 Measurement of Strategic Integration
This subsection lists the measurement of CSR integration at the strategic level. As stated
before, strategic integration is an independent variable, with three dimensions: (1) aligning
CSR with the company’s strategy, (2) gaining support from top management, and (3)
developing effective communication. Table 4.3 displays the operationalisation of these three
dimensions (constructs). Several items were adopted from empirical quantitative studies
(Bernal-Conesa, de Nieves-Nieto & Briones-Peñalver 2016; Maignan & Ferrell 2001; Reverte,
Gómez-Melero & Cegarra-Navarro 2016; Swink, Narasimhan & Kim 2005). Other items were

121
taken from either explorative, qualitative, or case studies (Busaya, Kalayanee & Gary 2009;
Dey & Sircar 2012; Guadamillas-Gómez, Donate-Manzanares & Škerlavaj 2010; Maon,
Lindgreen & Swaen 2009; Werre 2003). All items used a five-point scale with higher values
showing more positive responses to the item scaled (1=‘strongly disagree’ to 5=‘strongly
agree’).
Table 4.3: Strategic Integration Measurement Items
Dimension of CSR Strategic Integration Supporting Literature
Aligning CSR with the company’s strategy
SI01 We establish CSR as one of the main long-term goals
of our company.
Werre (2003)
SI02 Objectives have been established relating to social and
environmental aspects.
Bernal-Conesa, de Nieves-Nieto and
Briones-Peñalver (2017)
SI03 Mechanisms are available for evaluating the results of
the objectives.
SI04 CSR strategy is well aligned with corporate vision and
mission.
Dey and Sircar (2012); Guadamillas-
Gómez, Donate-Manzanares and Škerlavaj
(2010)
SI05 Continuous improvement and/or preventive actions
are made in the area of CSR.
Asif et al. (2013); Bernal-Conesa, de
Nieves-Nieto and Briones-Peñalver (2017)
Gaining support from top management
SI06 Top management formulates and shares a clear vision
and core corporate values with regards to CSR.
Dey and Sircar (2012); Guadamillas-
Gómez, Donate-Manzanares and Škerlavaj
(2010)
SI07 Top management remains responsive to the issues
related to CSR.
Bernal-Conesa, de Nieves-Nieto and
Briones-Peñalver (2017)
SI08 Top management provides mentoring and coaching to
managers to develop decision-making skills that
integrate CSR criteria in evaluating options.
Guadamillas-Gómez, Donate-Manzanares
and Škerlavaj (2010); Werre (2003)
SI09 We systematically organize CSR efforts.
SI10 We conduct team meeting regularly with top-
management with CSR as a fundamental topic.
Develop effective communication
SI11 CSR strategies and goals are clearly communicated to
all employees.
Maon, Lindgreen and Swaen (2009);
Swink, Narasimhan and Kim (2005)
SI12 We use IT by intensifying the company's presence on
the Internet and social networks to communicate CSR.
Reverte, Gómez-Melero and Cegarra-
Navarro (2016)
SI13 We communicate CSR activities within the company
through multiple channels, such as face-to-face
meetings, formal communications from senior
managers, and a company newsletter.
Maon, Lindgreen and Swaen (2009);
Werre (2003)
SI14 We create CSR report with detailed CSR activities
information.
Massimo et al. (2014)
Busaya, Kalayanee and Gary (2009);
Guadamillas-Gómez, Donate-Manzanares
and Škerlavaj (2010)
SI15 We provide CSR information on the company’s web.

122
4.4.1.4 The Measurement of Functional Integration
The measurement of functional integration as another independent variable in this thesis is
presented in this subsection. As explaind in Chapter 3, functional integration contains six
dimensions: (1) Cost, (2) Innovation, (3) Quality, (4) Supplier, (5) Customer and (6) Employee.
Table 4.4 presents the measurement items for these six dimensions, adopted from previous
studies on strategic management, CSR, and manufacturing. Using a five-point scale with higher
values implying more positive responses to the item scaled (1=’strongly disagree’ to
5=’strongly agree’), the respondents were required to show to what extent they agree or
disagree with each statement.
Table 4.4: Functional Integration Measurement Items
Dimensions of CSR Functional Integration Supporting Literature
Cost
FI01 We achieve/maintain the lowest production cost. Chi (2015)
FI02 We reduce material costs. Ward et al. (1995)
FI03 We reduce overhead costs.
FI04 We increase labour productivity. Chi (2015)
FI05 We increase capacity utilization.
Innovation
FI06 We actively conduct product innovation to improve the product
and service.
Reverte, Gómez-Melero and
Cegarra-Navarro (2016); Xie et al.
(2017); Kun, Nasrin and Weiquan
(2019)
FI07 We develop environmentally friendly products.
FI08 We use eco-friendly technologies and materials in our
processes, products, and packaging.
Witek-Hajduk and Zaborek (2016)
FI09 We produce high-quality products which use raw materials up
to standard and do not use hazardous materials.
Xie et al. (2017)
FI10 We have introduced innovations and improvements in
production processes, logistics or distribution.
Reverte, Gómez-Melero and
Cegarra-Navarro (2016)
Quality
FI11 We reduce defective rates. Ward et al. (1995)
FI12 We improve product performance and reliability.
FI13 We implement quality control circles. Ward et al. (1995)
FI14 Our products and/or services satisfy national and/or
international quality standards.
Gallardo-Vázquez and Sanchez-
Hernandez (2014); Reverte, Gómez-
Melero and Cegarra-Navarro (2016)
FI15 We enforce strict product quality control procedures. Kotha and Vadlamani (1995);
Robinson and Pearce (1988)

123
Table 4.4 (continued)
Suppliers
FI16 We treat suppliers, regardless of their size and location, fairly
and respectfully.
Lindgreen et al. (2009)
FI17 We seek to provide training to our suppliers and partners in
business activities.
Gallardo-Vázquez and Sanchez-
Hernandez (2014)
FI18 We incorporate the interests of our suppliers in our business
decisions.
Lindgreen et al. (2009); Martinez-
Conesa, Soto-Acosta and Palacios-
Manzano (2017)
FI19 We inform our suppliers about company changes affecting our
purchasing decisions.
FI20 We strive to enhance stable relationships of collaboration with
our suppliers.
Gallardo-Vázquez and Sanchez-
Hernandez (2014)
Customers
FI21 We provide our customers with accurate and complete
information about our products and/or services.
Gallardo-Vázquez and Sanchez-
Hernandez (2014)
FI22 We provide a prompt response to the complaints of our
customers about products and/or services.
Martinez-Conesa, Soto-Acosta and
Palacios-Manzano (2017)
FI23 We incorporate the interests of our customers in our business
decisions.
Lindgreen et al. (2009)
FI24 We provide responsive and fair after-sales service. Stoian and Gilman (2017)
FI25 Our company is honest with the customers in the sale or
promotion of products and services.
Xie et al. (2017)
Employees
FI26 We provide procedures to help to insure the health and safety
of our employees.
Bernal-Conesa, de Nieves-Nieto and
Briones-Peñalver (2016)
Lindgreen et al. (2009), Torugsa,
O'Donohue and Hecker (2013)
Reverte, Gómez-Melero and
Cegarra-Navarro (2016)
FI27 We treat our employees fairly and respectfully, regardless of
gender or ethnic background.
FI28 We incorporate the interests of our employees in our business
decisions.
FI29 We provide our employees with salaries that properly and fairly
reward them for their work.
FI30 We update the social and environmental knowledge through
the training of our employees.
Bernal-Conesa, de Nieves-Nieto and
Briones-Peñalver (2016); Torugsa,
O'Donohue and Hecker (2013);
Werre (2003)
4.4.1.5 Measurement of Company Performance
The measurement of company performance as a dependent variable is listed in this
subsection. Subjective measures were employed to obtain financial and non-financial
performance measurement through questionnaires that simultaneously elicit information on
practices (Wall et al. 2004). In this thesis, customers, employees, operating, and financial
performances are measured to comprehensively assess CP (CP). As presented in Table 4.5, the

124
measurement items were adopted from the strategic management, manufacturing, and CSR
literature. Respondents were asked to rate their company’s performance relative to their
competitors (Lindgreen et al. 2009; Wall et al. 2004; Wang, Dou & Jia 2016) over the most
recent three-year period (Bu¨ yu¨ kbalcı 2012; Effendi & Kusmantini 2015; Maignan & Ferrell
2001; Michelon, Boesso & Kumar 2013; Richard & Marilyn 2006).
Details on measurement scales of CP are shown in Table 4.5. A five-point-scale was used
to rate responses on 19 items, from 1=‘much longer/much worse/much lower’ to 5=‘much
shorter/ much better/much higher’. In addition, the respondents were requested to give their
opinion about overall CP with the scales ranging from 1=‘very unsatisfied’ to 5=‘very
satisfied’.

125
Table 4.5: Company Performance Measurement Items
Company Performance Supporting Literature
Operational performance
CP01 Compared to our competitors, our timeline of customer
service is
Ping-Ju Wu, Straub and Liang (2015)
CP02 Compared to our competitors, our delivery time is Chi (2015); Ward et al. (1995)
CP06 Compared to our competitors, our productivity is Ping-Ju Wu, Straub and Liang (2015);
Reverte, Gómez-Melero and Cegarra-
Navarro (2016)
CP07 Compared to our competitors, our operational efficiency is Reimann, Schilke and Thomas (2010);
Zahra and Covin (1993)
Financial performance
CP03 Compared to our competitors, our cash flow report is Wright, Proimos and Lau (2008)
CP08 Compared to our competitors, our profit is Bernal-Conesa, de Nieves-Nieto and
Briones-Peñalver (2016); Chi (2015);
Gallardo-Vázquez and Sanchez-
Hernandez (2014); Santos and Brito
(2012); Schniederjans and Cao (2009);
Venkatraman and Vasudevan (1987)
CP09 Compared to our competitors, our return on investment
(ROI) is
CP10 Compared to our competitors, our sales growth is
Customer performance
CP11 Compared to our competitors, our customer complaints are Gallardo-Vázquez and Sanchez-
Hernandez (2014); Santos and Brito
(2012)
CP12 Compared to our competitors, our customer satisfaction is
CP13 Compared to our competitors, our customer loyalty is
CP14 Compared to our competitors, our increasing number of
consumers is
Ferraz, António and Gallardo-Vázquez
(2016)
Employee performance
CP04 Compared to our competitors, our training of employee is Bernal-Conesa, de Nieves-Nieto and
Briones-Peñalver (2016); Gallardo-
Vázquez and Sanchez-Hernandez
(2014); Santos and Brito (2012),
Torugsa, O'Donohue and Hecker (2013)
CP05 Compared to our competitors, career opportunities in our
company are
CP15 Compared to our competitors, our employee motivation is Massimo et al. (2014)
Bernal-Conesa, de Nieves-Nieto and
Briones-Peñalver (2016); Reverte,
Gómez-Melero and Cegarra-Navarro
(2016); Santos and Brito (2012)
CP16 Compared to our competitors, our employee turnover is
Overall performance
CP17 Overall, with the operational excellence, we are Dess and Robinson (1984); Robinson
and Pearce (1988); Richard, Abdul and
Andrew (1995); Kim, Nam and
Stimpert (2004)
CP18 Overall, with the financial performance, we are
CP19 Overall, with the social performance, we are

126
4.4.1.6 Demographic Information
This subsection describes demographic information collected by the questionnaire.
Regarding the respondents and their organisations, the information relates to their position in
their organisations, their age, their educational level, and their working experience.
Control variables are a specific type of independent variable that potentially affect the
dependent variable (Creswell 2014). In this thesis, demographic variables (i.e., company size
and type of industry) are used as control variables to describe the variations between
companies. Two control variables were chosen because of their possible effect on CSR
practices and CP:
1. Company size. In this thesis, company size is measured by the number of employees (Ağan
et al. 2016; Chtourou & Triki 2017; Effendi & Kusmantini 2015; Lao, Hong & Rao 2010;
Marín, Rubio & de Maya 2012; Swink, Narasimhan & Kim 2005; Wei et al. 2016; Young
& Makhija 2014). Companies are classified as small (5–19 employees), medium (20–99
employees), and large companies (more than 100 employees) (BPS 2017a). Another
criterion of company size is the turnover: small companies with 300 million rupiahs up to
2.5 billion rupiahs, medium companies with 2.5 billion rupiahs up to 50 billion rupiahs, and
large companies with more than 50 billion rupiahs. Although both criteria were mentioned
in the questionnaire, several respondents gave a ‘not applicable’ answer for the latter
question. Therefore, the former criterion (number of employees) was used in the data
analysis to measure company size.
2. Type of industry. Industry type follows the 33 groups of manufacturers following the
Indonesian Standard Industrial Classification (ISIC) 2009 with two digits (BPS 2017b). The
standard code of business field of an industrial company (ISIC code) is determined based
on its main production, which is the type of commodity produced with the greatest value. If

127
an industrial company produces two or more types of commodities with the same value, the
main production is the commodity produced with the largest quantity (Statistik 2020).
4.4.2 Pilot Study
This subsection explains a pilot study conducted in this thesis. Prior to real data collection
and before questionnaires were launched, a pilot study was performed to assess the adequacy
of the research instrument regarding the content, wording, relevance of the questions, format,
and scales (Creswell 2014; Hair et al. 2010; Hulland, Baumgartner & Smith 2018). Through
the pilot study, the researcher could ensure that respondents could understand the questionnaire
appropriately (Gallardo-Vázquez & Sanchez-Hernandez 2014) and have no difficulty
answering the questions (Saunders 2009). In this thesis, the pilot study involved 30 respondents
(Ruel, Wagner & Gillespie 2016) selected based on the sample criteria. They reported that the
questionnaire could be understood obviously as the instructions and questions were brief and
unambiguous (Ruel, Wagner & Gillespie 2016), simple and easy to answer (Ruane 2005). They
also stated that the layout of the questionnaire was clear and attractive (Ruane 2005). Because
it was an anonymous survey, they could give natural and spontaneous answers and complete it
in approximately 15 minutes. The results of this pilot test indicated that most questions had a
wide range of responses, and in general, were related to the current situation and condition of
the manufacturing industry in Indonesia.
The pilot study is often known as a rehearsal of the entire study from start to finish, which
increases the possibility of the main study’s success. The raw data resulting from the pilot study
can be used to evaluate data entry and data processing procedures, including preliminary
coding and analysis (Caspar 2016; Ruel, Wagner & Gillespie 2016). After obtaining raw data
from the pilot study, the researcher developed data coding by creating tables for inputting data
and conducting preliminary analysis, such as descriptive analysis, validity and reliability tests.

128
As a result, the researcher could check whether initial data input and coding was correctly,
efficiently and accurately performed in a timely manner (Ruel, Wagner & Gillespie 2016).
4.5 Sampling Process
The sampling process used in this thesis is described in this section. It starts with a
discussion of the population and sample, then moves on to the sampling frame. The sample
size employed in this thesis is then presented.
4.5.1 Population and Sample
This subsection explains the population and sample used in this thesis. As explained in
Chapter 2, there are several reasons why this thesis was conducted in the manufacturing
industry, particularly in Indonesia. In addition to these reasons, the manufacturing industry is
more likely to provide variation in the variables of interest, such as product type and company
size. It is also easier to identify and measure some variables (such as cost, innovation, quality,
productivity, and operating efficiency), particularly at the functional level, and operational
performance among manufacturing companies than companies in service or financial sectors.
Therefore, the manufacturing industry provides an interesting case study that inspires the
researcher to explore something fresh in a specific field (Myers 2009).
The target population is large enough across a large geographic region, so a sample could
be taken that reflects the population as a whole (Field 2009) and describes the propensities of
the population to provide the researcher with a plausible explanation of research questions
(Saunders 2009). A unit of analysis is the entity whose data will be collected (Ruane 2005).
This thesis took a sample of manufacturing companies in Java with organisations as the unit
of analysis for two reasons. First, around 64.29% of 4.41 million Indonesian manufacturing
companies are located in Java (Agustinus 2017), and most the industrial estates are in Java
(IndustryToday 2016). Second, Java is the most significant contributor to the Indonesian

129
manufacturing industry, representing over 70% of its national GDP (BPS 2017a), and 47.62%
of national exports (Aisyah 2019). To be able to generalise, the sample study covered varying
company sizes, as explained in the previous subsection.
4.5.2 Sampling Frame
Following the description of population and sample, this subsection presents a sampling
frame used in this thesis. A sampling frame is ‘a comprehensive list of the elements from which
the sample is drawn’ (Hair et al. 2011, p. 166). The sampling frame of a study can be defined
as the set of people that has a possibility to be chosen as participants (Fowler 2014; Ruel,
Wagner & Gillespie 2016). The main sampling frame used in this thesis was the Manufacturing
Industrial Directory 2017 (BPS 2017b), which includes the list of manufacturing companies in
Indonesia. According to this sample frame, the sample study covered 33 manufacturing sector
of ISIC 2009 and encompassed five regions in Java, namely East Java, Central Java,
Yogyakarta, West Java, and Jakarta.
To facilitate data collection, this thesis selected several cities according to two criteria: (1)
high manufacturing industry density and (2) with industrial estates. East Java included
Surabaya, Sidoarjo, Gresik, Pasuruan and Mojokerto. Centre Java was represented by
Semarang, and Yogyakarta included the special region of Yogyakarta. West Java covered
Tangerang, Bekasi, and Bandung, while Jakarta represented the Jakarta metropolitan region.
In addition to industrial estates in selected cities, five economic centres in Java are Jakarta,
Bandung, Semarang, Yogyakarta and Surabaya (Indonesia 2011).
Since the Manufacturing Industrial Directory 2017 contains information about the
manufacturing industry throughout Indonesia, the information for the company (i.e., the
company name, address, product type, company size, and email address (if any)) were grouped
into cities in which the survey would be conducted. This grouping was supplemented by
information from additional sampling frames as follows:

130
1. The company list of the bonded zone in Pasuruan (53 companies).
2. The investor list of Kawasan Industri Wijayakusuma (KIW) Semarang (51 companies).
3. The tenant list of Jakarta Industrial Estate Pulogadung (JIEP) (253 companies).
4. The company list of internship and alumni from the Industrial Engineering Department,
University of Surabaya (300 companies).
To sum up, this thesis used main and supplementary sample frames to collect data as
expected. The survey would cover five regions in Java based on these sampling frames.
4.5.3 Sample Size
Sample size is described in this subsection. Given the large target population and the need
to obtain the estimation of its characteristics efficiently, an appropriate sample size is required.
As suggested by Cohen (1992), the minimum sample size needed for a medium size effect
(r=0.3) and a power of 0.8 with the standard alpha-level of 0.05 is 85 (Field 2009). Furthermore,
Hair et al. (2017, p. 24) recommend that the minimum sample size required for analysing data
using PLS-SEM is ‘ten times the largest number of structural paths directed at a particular
construct in the structural model’. As shown in the conceptual framework (see Figure 4.7 for
details), six is the largest number of structural paths directed at a particular construct in the
structural model, which reflects the connection from six exogenous constructs to functional
integration. Consequently, the minimum sample size required is 10 x 6 = 60. The largest
number was used (i.e., 85) as the required sample size in this thesis.
Every attempt was made to select organisations that had the means to maintain awareness
of CSR. There were three criteria to select appropriate samples: (1) companies must operate in
the manufacturing sector, (2) companies must be in Java, and (3) companies must have more
than five employees.
In summary, this section describes how to determine the sample size using specific formulas.
Three criteria are also established in order to identify the proper sample size for this thesis.

131
4.5.4 Sampling Technique
A sampling technique that would be conducted in this thesis is explained in this subsection.
Because there is a large number of samples spread over several geographical areas, it is difficult
to determine the probability that each case will be included in the sample, and it is costly, in
terms of time and resources, to access the units of analysis (Huber & Power 1985). Purposive
sampling techniques may be defined as unit selection (e.g., individuals, groups of individuals,
institutions) based on specific purposes related to answering the questions of a research study
(Teddlie & Yu 2007). Thus, purposive sampling (non-random sampling) is considered
appropriate to select units of the sample on the basis of subjective personal judgement and
convenience that enables the researcher to answer research questions (Saunders 2009; Zikmund
et al. 2017), such as conformity with the sample criteria.
4.6 Data Collection
This section discusses the data collection carried out in this thesis. It is divided into two
subsections: (i) data collection methods and (ii) results of data collection.
4.6.1 Data Collection Methods
Data collection methods used in this thesis are explained in this subsection. It contains
online, mail, and personal delivery surveys.
Methods of data collection refer to a procedure for capturing what is relevant from the data
generated to address the research question (Perri & Bellamy 2012). As explained in the
previous subsection, this thesis employed a survey to obtain large quantities of data. The survey
was cross-sectional as it was conducted at a single point in time (Ruane 2005; Ruel, Wagner &
Gillespie 2016; Saunders 2009). In addition to mail and electronical (e-mail and online)
distribution (Creswell 2014), the survey was also administered by delivering the questionnaire
by hand to the potential respondents and collecting later (Saunders 2009). This thesis employed

132
these three methods as self-completion methods (Hair et al. 2011) with the aim of minimising
survey nonresponse and reaching respondents who were inaccessible via a single mode alone
(Fowler 2014). Conducting three different types of survey methods also enabled the effective
use of a survey by adapting various data collection methods to the target sample (Ruel, Wagner
& Gillespie 2016).
Following the recommendation of Huber and Power (1985), a single informant was included
in the sample for each company. The questionnaire was then delivered to executives or
managers at the strategic or upper level of the company, including CEOs, directors, managers,
and team leaders to obtain their perceptions concerning each question (indicator). These
individuals are more likely to have a comprehensive view of their company strategy, activities
and implementation of CSR and would therefore be able to fill in the questionnaire (Huber &
Power 1985). Hence, they were considered key informants to minimise bias (Miller & Roth
1994).
4.6.1.1 Online Survey
Online surveys, delivered via e-mail and the internet, have now become a key medium for
the delivery of questionnaires (Ruel, Wagner & Gillespie 2016). Online surveys are popular,
attractive, and inexpensive, and provide quick responses and high-quality data (Hair et al. 2011;
Michaelidou & Dibb 2006). Advantages of online surveys include cost effectiveness, fast
transmission and response turnaround (Fowler 2014; Michaelidou & Dibb 2006; Ruel, Wagner
& Gillespie 2016), the distribution to a target population across a large geographic region and
greater reach of potential respondents (Schmidt 1997; Van Selm & Jankowski 2006).
The questionnaire was designed using SurveyMonkey, whereby the researcher was able to
quickly create a survey using custom templates and send it to respondents (Creswell 2014). To
encourage potential respondents, the layout of the questionnaire was carefully designed.
Closed-ended questions were provided using check boxes for response tags. To draw the

133
attention of potential respondents and make the questionnaire friendly and as appealing as
possible, the colour and font of the questionnaire were carefully chosen (Michaelidou & Dibb
2006; Ruel, Wagner & Gillespie 2016). Several tests were undertaken to ensure that responses
could be smoothly transmitted to the sender (the researcher). Once the questionnaire was
completed (in no more than 15 minutes) the answers were transmitted anonymously to the
sender.
After compiling information from the sampling frames, it was identified that approximately
600 companies had an e-mail address. Subsequently, a covering letter was e-mailed to these
companies explaining the purpose of the study and inviting them to access an complete the
questionnaire via a URL (Fowler 2014; Ruel, Wagner & Gillespie 2016; Saunders 2009; Van
Selm & Jankowski 2006). However, approximately 50 messages were not delivered because
the address could not be found or was unable to receive e-mail. Therefore, 550 messages could
be delivered to the potential respondents. An intensive follow-up process was undertaken via
e-mail (which is more efficient then telephone calls), as well as to increase the number of
questionnaires received (Ruane 2005).
4.6.1.2 Mail Survey
Not only being distributed online, but the questionnaires were also mailed to companies that
did not have an e-mail address. Mail is appropriate to use with a geographically dispersed
population (Ruel, Wagner & Gillespie 2016). To make this method effective, companies were
selected based on two requirements: (1) preferably large with more than 100 employees, and
(2) full address and telephone number accessible. Both regular mail and overnight delivery
(Hair et al. 2011) were used to deliver a survey package to 254 selected addresses. A cover
letter representing a formal invitation to participate in a research project (Ruel, Wagner &
Gillespie 2016) was attached to each questionnaire, which explained the research objectives
and assured respondents of the confidentiality of their responses and the voluntary nature of

134
participation (Hair et al. 2011; Ruel, Wagner & Gillespie 2016; Saunders 2009). A self-
addressed, postage-paid return envelope was also included in the survey package to increase
the likelihood of a response (Ruel, Wagner & Gillespie 2016).
Although the company address was carefully checked before sending the questionnaires,
eight questionnaires were returned due to wrong address or the company moving to another
location. Thus, only 246 questionnaires could reach potential respondents. A rigorous follow-
up via telephone call was undertaken to check whether they received the survey package and
to encourage them to complete the questionnaire and return it. If they said that they did not
receive the survey, the researcher asked their e-mail address and then e-mailed an invitation to
them with a link to the survey online.
4.6.1.3 Personal Delivery Survey
In addition to online and mail surveys, the questionnaires were also administered through
personal delivery and collection. This approach is cost-effective and has a higher response rate
compared to mail deliveries (Lovelock 1976). Using this method, 290 questionnaires were
distributed directly to the potential respondents, including small, medium, and large companies.
Nonetheless, only 259 questionnaires were distributed because 31 addresses could not be
identified. Similar to the mail survey, a self-addressed, postage-paid return envelope was
supplied, and an intensive follow-up via telephone call was conducted to remind the potential
respondents to fill and return it.
Across all methods, anonymity was guaranteed for all respondents as mentioned in the
covering letter, which enabled the respondents to give their answers openly and honestly
without worrying that others might know their identities. Self-identifiers were omitted during
data collection to ensure confidentiality (Ruane 2005). The respondents were assured that
analysis would be conducted at the aggregate level and that neither company nor personal
information could be identified.

135
4.6.2 Results of Data Collection
This subsection shows the results of data collection conducted from June to October 2018.
Approximately 1,055 questionnaires were distributed to manufacturing companies in several
selected cities in Java. Table 4.6 shows the period of data collection, indicating that most data
was collected in August 2018 (38.4%), followed by July 2018 (33.8%), then September–
October 2018 (14.5%), and last, June 2018 (13.3%). Since the survey covered a vast area and
employed three data collection methods, the responses could be collected at the same time.
Because the time of the data collection varied by mode, it should be noted that mail surveys
generally took two months to complete, and the online survey reduced collection time (Fowler
2014). The fastest data collection time was through personal surveys as the responses could be
collected immediately.
Table 4.6: Period of Data Collection
Time Frequency Percentage (%)
June 58 13.3
July 147 33.8
August 167 38.4
September–October 63 14.5
To check potential nonresponse bias in the data, the respondents were divided into
categories of early and late respondents (Armstrong & Overton 1977; Fowler 2014; Ghobadian,
O'Regan & Nandakumar 2010). The assumption behind this method is that respondents who
filled the survey in the last period of data collection have reacted because of the increased
stimuli and are supposed to be similar to non-respondents (Armstrong & Overton 1977). Data
collected in June and July (205 cases) were classified as early respondents, while late
respondents were data gathered in August, September and October (230 cases). Because the
data was not normal (see section 4.7.2), the Mann-Whitney test was then conducted as the non-
parametric test (Field 2009; Pallant 2005) to determine whether significant differences existed
across two groups in the means of business strategy, CSR strategy, strategic integration,
functional integration and CP. For example, Appendix A.4 shows the results of the Mann-

136
Whitney test of business strategy between early and late respondents. Eight of 10 items had p-
values of above 0.05, indicating no significant difference between the means of responses
received from early and late respondents at a confidence level of 95% (Field 2009; Pallant
2005). Thus, nonresponse bias was not a serious problem in the data set.
Table 4.7 presents the detail of questionnaire distribution for each sampling method. While
1,055 questionnaires were sent, they were not all returned. Several potential respondents
informed the researcher that they were unable to participate because either they were too busy,
or they could not provide the necessary data. Overall, 514 questionnaires were returned,
yielding a response rate of 48.72%. Since many social research studies use surveys and other
voluntary participation methods, the response rate is generally well below 100%. This response
rate of 48.72% is higher than the average response rate of 15 to 20% for surveys involving
senior managers (Menon, Bharadwaj & Howell 1996).
After data screening (explained in the next section), 435 responses remained in the sample
with a final response rate of 41.23%. The methods sampling to collect data (e.g., mail, online,
telephone) can influence the extent to which potential respondents are both able and willing to
engage in a study (Hulland, Baumgartner & Smith 2018). As displayed in Table 4.7, the result
demonstrates that the highest response rate was achieved through the personal survey
(64.86%), followed by the online survey (47.64%), while the mail survey got the lowest
response rate (34.15%). Nonetheless, the response rate of the mail survey was above 20%,
indicating a good result for the mail survey in Indonesia (Jogiyanto, cited in Ghozali &
Sulistyani 2016).
Having employed three survey methods: personal, mail, and online, the data from each
method should be compared to see the differences among them. The Kruskall-Wallis test was
employed as the non-parametric test to assess differences among several independent groups
(Field 2009; Pallant 2005). For instance, Appendix A.5 displays the results of Kruskal-Wallis

137
in 15 items of strategic integration. As 14 items had p-values of above 0.05, no statistically
significant differences across three survey methods were found (Pallant 2005).
Table 4.7: Results of Data Collection
Method Sent Returned Response Rate (%)
Personal 259 168 64.86
Mail 246 84 34.15
Online 550 262 47.64
Total 1,055 514 48.72
Given that the number of data collected was 435 responses (the final data set), the minimum
sample size required to conduct PLS-SEM (i.e., 60 responses) was fulfilled (see 4.5.3 for
details). Besides, 435 responses were more than required, mainly to obtain the medium effect
size suggested by Cohen (1992).
4.7 Data Analysis Procedures
Data analysis procedures employed in this thesis is provided in this section. It is broken
down into two subsections, each of which describes (i) data coding and (ii) data screening.
Data analysis methods are procedures for manipulating data so that the research question
can be answered, usually by identifying important patterns (Perri & Bellamy 2012). Data
analysis involves activities to assess, clean, transform and model data collected to obtain
research answers (Creswell & Clark 2018). In this thesis, data analysis comprised six steps:
data coding, data screening, identifying the characteristics of respondents, assessment of the
measurement model, assessment of the structural model, and MGA. Three former steps are
explained in the following subsections, while other three steps will be discussed in the next
chapters.
4.7.1 Data Coding
This section describes how data in this thesis is coded. Before entering data for statistical
analysis, data have been recorded using numerical codes which allows the researcher to input

138
the data quickly and to minimise errors (Saunders 2009). Coding is assigning numbers to
categories in a manner that simplifies measurement (Hair et al. 2017). A code, a set of rules
that translates answers into numbers, is essential for reliable data coding and proper data
interpretation (Fowler 2014). Codes or coding categories are a way of sorting or grouping
responses so that information on a given topic can be physically distinguished from other data
(Ruel, Wagner & Gillespie 2016). Thus, well-defined rules for numbering should be provided
for each and every answer (Fowler 2014).
This thesis followed several recommendations from literatures, such as the consistency in
assigning a number, building codes fit numbers when possible, and defining one code for each
answer. To have a clear understanding of each variable, a variable name and label have been
developed which make sense and which relate it to the questionnaire from which it originated
(Ruel, Wagner & Gillespie 2016). As presented in the previous subsection, each question (or
statement) has been considered as a variable which had a specific code (number), indicating its
name and label. Because of the five-point scale, every answer of measured items has a code
from 1 to 5, which indicates the response level from respondents. With regard to demographic
questions, there was a limited range of specified categories which could place the data into
(Saunders 2009). Hence, in order to know its modes and frequency, each category had a code
to simplify the data groupings.
4.7.2 Data Screening
This subsection discusses data screening which consist of several steps. The most essential
check after data coding and entry is to ensure the data files are complete and organised (Fowler
2014). The data screening process is a vital phase to eliminate observations that contain missing
data and outliers (Hair et al. 2010) and also includes the identification of common method bias
and normality. There are six steps undertaken in this thesis regarding the process of data
screening following the recommendations from Hair et al. (2010), Field (2009), and Hair et al.

139
(2017). In doing so, this thesis employed statistical technique software, SPSS 26. First, data
screening tested the conformity with the sample criteria. 16 responses from outside Java and
13 responses from nonmanufacturing industry were eliminated because they did not match the
sample criteria as explained in the previous subsection (see 4.5.1).
Second, data screening checked the presence of missing data. Missing data refers to item
values in the questionnaire that did not have any answers from the respondents who participated
in the surveys. Missing data can impact in two major ways: reduction of sample size or
inconclusive results of analysis due to biased outcomes (Hair et al. 2010). Especially on
quantitative research, the effect of missing data can be serious, resulting in skewed parameter
estimates, information loss, decreased statistical capacity, increased standard errors and
weakened generalisability of findings (Dong & Peng 2013). Missing data in this thesis was
identified as an item nonresponse element refers to incomplete information gathered from a
respondent because the respondent may skip one or two questions on a survey, but the rest have
been answered (Dong & Peng 2013). As recommended by Hair et al. (2017), primarily the
observation was eliminated from the data file if the amount of missing data on a questionnaire
exceeds 15%. Subsequently, incomplete 46 responses were removed from the data set to avoid
biases results emerging from the statistical analysis as they were derived from the measurement
section of the questionnaire and related to dependent variables (Hair et al. 2010). After deletion,
there were 23 cases with missing data for each variable (Hair et al. 2010) or per indicator (Hair
et al. 2017). Because they were less than 5%, they have been detected as missing completely
at random (MCAR) (Hair et al. 2010). When missing data follows the MCAR assumption, they
can be interpreted as a random sample of the entire data (Dong & Peng 2013). As responses
with 5% or less missing data in a random pattern were a less critical problem, they remained
in the dataset (Tabachnick & Fidell 2006). Mean substitution, a popular way to estimate
missing values (Hair et al. 2010; Tabachnick & Fidell 2006) is considered appropriate to apply

140
as mean replacement usually gives a little difference in PLS-SEM estimates (Hair et al. 2017).
Specifically, this method was employed by replacing the missing values of an indicator variable
with the mean of valid values of that indicator (Hair et al. 2017). Besides, there were four
responses which contained no data related to the demographic queries. Because the
demographic data, especially company size and industry type, were the control variables and
moderators in MGA, these four responses were eliminated to avoid bias in the statistical results.
Third, data were checked for suspicious response patterns. Since the survey was conducted
using questionnaires in this thesis, it frequently asked the same questions with a little
difference, mainly for several items using reflective measures (Hair et al. 2017). There were
three responses identified with straight lining (Hair et al. 2017), indicating the same answer for
all items measured with a five-point scale. Nevertheless, the results of PLS-SEM algorithm as
well as bootstrapping showed that there was a little impact in PLS estimations (Hair et al.
2017); therefore, they remained in the dataset.
Fourth, data screening involved outlier identification. Outliers refer to data with extreme
values that appear different from other data values (Hair et al. 2010). After identifying outliers,
the researcher must decide whether or not to include them in subsequent analyses (Leys et al.
2018). Two outliers were found due to a procedural error that may result from inaccuracies,
such as an error in data entry or an error in coding (Aguinis, Gottfredson & Joo 2013; Hair et
al. 2010; Ruel, Wagner & Gillespie 2016); thus, they were quickly corrected (Hair et al. 2017).
Additionally, 43 outliers were measured using the Mahalanobis distance (D2) as the most
frequently recommended outlier detection approach (Finch 2012). However, there was no
apparent explanation for those outliers which implied extraordinary observations (Hair et al.
2010). As all variables, both dependent and independent variables, were measured using a five-
point scale, those outliers contained observations which fall within the range of values on each
of the variables. Consequently, those outliers were not particularly high or low on the variables,

141
but were unique in their combination of values across the variables (Hair et al. 2010). To
examine the impacts of these outliers in the analysis, the results of PLS-SEM algorithm and
bootstrapping were evaluated between with and without outliers. The results showed that these
outliers did not influence the results substantially. Hence, these outliers were retained (Hair et
al. 2010; Hair et al. 2017) as the larger sample size always produce higher power for statistical
testing (Hair et al. 2010). Furthermore, this thesis uses PLS-SEM as a nonparametric
methodology which does not presume that the data are distributed in any particular way. This
flexibility allows researchers to obtain results which are reliable when outliers are present
(Aguinis, Gottfredson & Joo 2013).
Fifth, data were screened for normality by computing the kurtosis and skewness values. As
PLS-SEM is a nonparametric statistical method, it does not need the normal data distribution
(Hair et al. 2017). However, extremely abnormal data may cause problematic in the assessment
of the parameter’s significance; for instance, standard errors (Hair et al. 2017). This thesis
identified the kurtosis and skewness to check properly the distribution of data set. Kurtosis
refers to whether the distribution is more peaked than the normal distribution, while skewness
is to identify whether the distribution is centred or shifted to one side. Generally, values
between -1 and +1 are considered to be acceptable (Hair et al. 2017). Table 4.8 summarises the
skewness and kurtosis values of the dataset per group/construct, and skewness and kurtosis of
all items are presented in Appendix A.7. Overall, almost all data met the threshold value
indicating normal distribution, except the business strategy which its skewness was exceeding
-1, and its kurtosis was above 1. Hence, the data were considered non-normal (Hair et al. 2017).
Table 4.8: Skewness and Kurtosis
Part Skewness Kurtosis
Business strategy (10 items) -1.184 2.431
CSR strategy (20 items) -0.751 0.669
Strategic integration (15 items) -0.478 -0.067
Functional integration (30 items) -0.793 0.831
Company performance (19 items) -0.268 -0.033

142
Moreover, the Kolmogorov–Smirnov test was also employed to check the normality.
Appendix A.6 presents results of normality test of business strategy. Significant values both
Kolmogorov-Smirnov and Shapiro-Wilk test of 10 items of business strategy for three survey
methods were less than 0.05, suggesting a violation of the assumption of normality (Field 2009;
Pallant 2005). It should be noted that abnormal data distribution is one of the underlying
considerations of why this thesis conducted PLS-SEM for data analysis. The skewness and
kurtosis for all items can be seen in Appendix A.7.
Finally, an assessment of common method bias was undertaken. Because this thesis used
self-reported instruments for data collection, responses for all constructs, including the
predictor and criterion variable measurement were collected from a single respondent or a same
person (Hulland, Baumgartner & Smith 2018; Podsakoff et al. 2003). In typical survey studies,
data are likely to be susceptible to common method bias in which the same respondent answers
the items in a single questionnaire at the same time (Lindell & Whitney 2001). In this thesis,
common method bias has been diminished through methodological design and post-hoc
analysis suggested by Podsakoff et al. (2003). As explained in the previous subsections (see
4.4), the survey was developed for methodological design through pre-tests including expert-
and respondent-driven pre-tests to ensure that the survey questions were clear, concise, and
specific to the manufacturing industry in the Indonesian context. Moreover, by preserving the
respondent privacy, common method bias can be minimised (Podsakoff et al. 2003). As
explained in the previous section, the cover letter that accompanied the questionnaires
specifically stated that all answers would be handled in the strictest confidence and that no
names or identities of individual companies would be revealed or released to third parties. The
cover letter also explained the purpose of this thesis, which could help to minimise the potential
for common method bias (Hulland, Baumgartner & Smith 2018).

143
For a post-hoc (statistical) analysis, three methods were employed. First, as discussed on the
previous subsection, the means of variables between early respondents and late respondents
were compared using the Mann-Whitney test. The result indicated no significant difference
among two groups. Second, this thesis applied Harman’s one factor (or single-factor) test as
one of the most commonly used method by researchers to tackle the problem of common
method variance (Podsakoff et al. 2003). All the 94 measured variables included in the model
were inputted in an exploratory factor analysis (EFA) (Kock 2015) by conducting un-rotated
principal component analysis (PCA) in IBM SPSS 26. The eigenvalue of un-rotated EFA
solution produced the presence of 17 different factors rather than a single factor. These 17
factors together accounted for 66.45% of the total variance, and the highest portion of the
variance explained by a single factor was 31.94%, less than 50%. This result indicated that
common method bias was not present, and single-source bias was not a major concern for this
thesis. Third, this thesis checked the common method bias in the context of PLS-SEM.
Following the guidelines from Kock (2015), variance accounted for (VIF) was evaluated for all
eight constructs. The result showed that their inner VIF values were below 3.3, indicating that
the model could be considered free of common method bias (Kock 2015; Kock & Lynn 2012).
Overall, the results of three statistical analyses revealed that common method bias was not a
critical issue in this thesis.
In conclusion, this thesis employed six steps for data screening. It included checking sample
criteria conformity, indicating missing data, detecting suspicious response patterns, identifying
outlier, and evaluating data normality. Then, common method bias was assessed using
methodological design and statistical analysis. It was expected that data would be clean and
suitable for further data analysis.

144
4.8 The Respondents’ Profiles and Characteristics
This section shows the details on the characteristics of respondents as summarised in Table
4.9. Specifically, Figure 4.2 displays the breakdown of respondents’ position. Because most of
the questions in the questionnaire demanded information at the strategic and functional level,
regarding the business strategy, CSR practices, and company performance, the respondents’
position was considered to be an essential issue in this thesis. Largely fulfilling this
requirement, most respondents had a high position in their companies: 23.4% were in the top
management position (owner, CEO, and director) and 57.8% occupied the managerial position
(senior, middle and assistant manager).
Table 4.9: Respondents’ Profiles
Variable Indicator Frequency (n = 435) Percentage (per cent)
Position owner 73 16.8
CEO 8 1.8
director 21 4.8
senior manager 113 26.0
middle manager 76 17.5
assistant manager 62 14.3
team leader 52 12.0
others 30 6.9
Working
experience (years)
< 5 165 37.9
6-10 102 23.4
11-20 104 23.9
> 20 64 14.7
Age (years) < 25 47 10.8
25 - 30 66 15.2
31 - 40 98 22.5
41 - 50 140 32.2
51 - 60 77 17.7
> 60 7 1.6
Education high school 35 8.0
diploma 30 6.9
bachelor 279 64.1
postgraduate 91 20.9

145
Figure 4.2: Respondents’ Position
As presented in Table 4.9, more than one-third respondents had been working more than ten
years of (38.6%). Because there are a substantial proportion of the respondents (37.9%) with
less than five years of working experience in their current companies, a further statistical
analysis was employed by conducting t-tests on 14 items of CP between this group and others
in the sample (see Appendix A.8 for details). The results show that a majority of respondents
(61%) have held a managerial position and there is no statistical difference in the key variables
between this group of the respondents and others. As such, these respondents can answer
questions due to their managerial positions in the company.
A half of the respondents’ age was more than 40 years (51.5%). With regards to education,
most respondents were well educated and had a bachelor’s degree (64.1%) and post-graduate
(20.9%), whereas the remaining (14.9%) have diplomas (6.9%) or are high school graduates
(8%). It should be noted that the quality of human resources poses a problem for Indonesia. A
half of total workforce or 52.4 million workers have primary school education, and only 8% or
12.6 million of workers attain a formal diploma (Indonesia 2011; Kemenperin 2020b).
With reference to respondents with diplomas and high school certificates, further analyses
showed that a total of 88.9% are owners of small and medium-sized enterprises (SMEs) or hold
managerial positions in their company. Moreover, an overwhelming majority (82.7%) of the

146
respondents in this group have more than five-years’ experience in their organisation. A series
of t-tests were also conducted in several key variables between this group of respondents and
other groups (see Appendices A.9 and A.10 for the results of Mann-Whitney test for strategic
integration and CP). No statistical significance was identified. Thus, lack of knowledge
capacity in answering the questions is less a concern due to the managerial position held and
working experience.
The organisational characteristics are provided in Table 4.10. Most respondents’ companies
(68.3%) had more than 100 employees, consistent with the criterion of large companies. Nearly
half of respondents’ companies (49.2%) had been in operation between 21 and 50 years. In
terms of the ownership, they were mostly private companies (79.1%). Companies were more
frequently located in an industrial estate (54.3%) than outside an industrial estate (45.7%).
Three-quarters (74.5%) of respondents’ companies were in East Java. Most questionnaires
were distributed in East Java, for two reasons. First, this province has the most industrial zones,
spread across five cities (e.g., Surabaya, Sidoarjo, Gresik, Mojokerto and Pasuruan). Second,
the researcher lived in Surabaya because proximity helped with questionnaire distribution.

147
Table 4.10: Profiles of the Respondents’ Companies
Variable Indicator Frequency (n=435) Percentage (%)
Main product
food and beverage 115 26.4
tobacco 11 2.5
textile 29 6.7
leather and footwear 8 1.8
goods from wood, handicraft 5 1.1
paper 25 5.7
coke and refined petroleum products 4 0.9
chemicals and chemical products 48 11.0
pharmaceuticals and medicinal chemical 11 2.5
rubber and plastic products 35 8.0
non-metallic mineral products 21 4.8
basic metals 2 0.5
fabricated metal products, except machinery
and equipment
42 9.7
computers, electronic and optical products 10 2.3
machinery and electrical equipment 20 4.6
automotive 24 5.5
furniture 17 3.9
other manufacturing 6 1.4
repair and installation of machinery and
equipment
2 0.5
Number of
employees
small 44 10.1
medium 94 21.6
large 297 68.3
Turnover in
2017 (rupiahs)
< 2.5 billion 44 10.1
2.5 - 50 billion 86 19.8
> 50 billion 117 26.9
prefer not to answer 188 43.2
Company’s age
(years)
< 5 30 6.9
5-10 53 12.2
11-20 86 19.8
21-50 214 49.2
> 50 52 12.0
Company’s
ownership
state-ownership 13 3.0
private 344 79.1
multinational company 78 17.9
Company’s
location
East Java 324 74.5
Centre Java & Yogyakarta 29 6.7
West Java & Jakarta 82 18.8
In industrial
estate
yes 236 54.3
no 199 45.7
More specifically, Figure 4.3 provides a distribution of the main product of respondents’
companies. Accordingly, samples were selected from a variety of manufacturing companies
and indicated a good spread of representation across industries. The 19 main products can

148
represent the 33 classifications (ISIC code). Generally, the five most products of respondents’
companies are food and beverage (26.4%), chemicals and chemical products (11%), fabricated
metal products (9.7%), rubber and plastic products (8%) and textile (6.7%). These products can
represent the features of manufacturing industry as three of them (food and beverage, chemicals
and chemical products, and textile) are superior goods of the manufacturing industry (Indonesia
2019) and contributed the most to the achievement of the export value of the manufacturing
industry in 2019 (Kemenperin 2020a). Besides, the largest processing industry in Java is the
food and beverage manufacturers (33.57%) and the textile and apparel industry (19.81%)
(Agustinus 2017). These two industries, together with transportation equipment industry
(including automotive), are the main focus of the Java economic corridor development
(Indonesia 2011).
Figure 4.2: Main Products of Respondents’ Companies
2
2
4
5
6
8
10
11
11
17
20
21
24
25
29
35
42
48
115
0 20 40 60 80 100 120
basic metals
repair and installation of machinery and…
coke and refined petroleum products
goods from wood, handicraft
other manufacturing
leather and footwear
computers, electronic and optical products
tobacco
pharmaceuticals and medicinal chemical
furniture
machinery and electrical equipment
non-metallic mineral products
automotive
paper
textile
rubber and plastic products
fabricated metal products, except machinery…
chemicals and chemical products
food and beverage
Main Product

149
4.9 Partial Least Square with Structural Equation Modelling
This section explains PLS-SEM employed in this thesis for data analysis. It starts by
determining model specification. Then, it goes on to construct specification that is both
reflective and formative. Next, hierarchical component model is presented, followed by a
model assessment. This section also covers how to analyse mediating and moderating effects.
Structural equation modelling (SEM) is a statistical procedure for measuring the functional,
predictive and causal hypothesis, which is essential multivariate statistical tool for
understanding several research elements and performing basic or applied research in
behavioural sciences, management, health and social sciences (Bagozzi & Yi 2012). SEM uses
different types of models to describe relationships between variables observed, with the same
basic purpose to provide a quantitative evaluation of a theoretical model hypothesised by a
researcher. Practically speaking, different theoretical models can be evaluated in SEM which
hypothesises how sets of variables define constructs and how they interrelate (Schumacker &
Lomax 2004). SEM uses the empirical method of hypothesis testing to test theoretical models
to offer a deeper understanding of the complex relationships between constructs (Schumacker
& Lomax 2004).
Partial Least Square (PLS) is one of the methods in the variance-based SEM (Marin-Garcia
& Alfalla-Luque 2019). PLS with SEM approach (PLS-SEM) is now widely applied in many
social science disciplines, including organisational management, operations management, and
strategic management (Hair, Risher, et al. 2018; Sarstedt, Ringle, et al. 2019). PLS-SEM is
useful for testing complex models with many variables (Marin-Garcia & Alfalla-Luque 2019;
Sarstedt, Ringle & Hair 2017) and involving latent variables (Hair et al. 2019; Martinez-
Conesa, Soto-Acosta & Palacios-Manzano 2017). PLS-SEM is appropriate to predict and
explain measured constructs (Hair et al. 2017; Schwaiger & Festge 2007).

150
More specifically, this thesis analysed data using PLS-SEM with five reasons. First, as
mentioned in the previous section, this thesis was intended to explore the extent of CSR
integration and also to predict the impacts of this integration on CP, so that it involved complex
models with many relationships among the variables measured with multi-item measures
(Sarstedt, Ringle & Hair 2017). Consequently, the characteristics of PLS-SEM are appropriate
with these objectives (Hair 2017; Matthews, Hair & Matthews 2018) to predict and explain the
primary target construct and to identify its relevant antecedent constructs (Marin-Garcia &
Alfalla-Luque 2019; Sarstedt, Ringle & Hair 2017). In this thesis, CP is an endogenous
construct and a fundamental target construct, while strategic and functional integration are
antecedent constructs. PLS-SEM concentrates on measuring the variance in endogenous
constructs, thus emphasising on prediction (Hair, Sarstedt, Pieper, et al. 2012; Z. Jannoo 2014).
Second, because a priori knowledge of structural model relationships in the proposed
framework and the measurement characteristics of the constructs (latent variables) were
limited, this thesis concentrated on exploration and prediction rather than confirmation. In this
case, PLS-SEM was excellent to be employed (Hair 2017; Matthews, Hair & Matthews 2018)
due to its suitability for a predictive research purpose (Chin 2010; Hair et al. 2014; Sarstedt,
Ringle & Hair 2017).
Third, PLS-SEM incorporates both reflective and formative measures (Benitez et al. 2020;
Chin 2010; Hair, Sarstedt, Pieper, et al. 2012; Helm, Eggert & Garnefeld 2010). As explained
in the next chapter (see 5.2 and 6.2), the developed model used reflective and formative items.
Hence, PLS-SEM was appropriate to verify the model.
Fourth, PLS-SEM provides versatility in the simulation of molar and molecular higher order
structures and has a high complexity scale (Chin 2010). As can be seen in Figure 5.1, Figure
6.1 and Figure 6.2, this thesis developed models using a second order molar model of strategic
and functional integration.

151
Fifth, the last reason is the data requirement flexibility (Sarstedt, Ringle & Hair 2017). As
explained in 4.7.2, not all data gathered from the survey was normal (see Table 4.8 and
Appendix A.7 for details). It means that the abnormality of the distribution data was detected
in the data set. PLS-SEM could accommodate this issue because PLS-SEM makes no
distribution assumption (Chin 2010; Hair et al. 2017; Matthews, Hair & Matthews 2018).
This thesis employed PLS-SEM to define the explained variance in the endogenous
constructs by assessing the path relationships in the model; and to estimate the model’s
predictive power in defining the model’s goodness of fit (Hair et al. 2017; Hair, Sarstedt,
Pieper, et al. 2012; Hair, Ringle & Sarstedt 2013). With support from SmartPLS software
version 3 Professional to reinforce the statistical analysis and achieve these objectives, several
steps should be taken as explained in the following subsection and discussed in the next chapter.
4.9.1 Model Specification
This subsection describes how model specification is determined in this thesis. The model
specification manages the arrangement of the inner and outer models as two components of
PLS-SEM (Hair et al. 2014; Jörg et al. 2014). The initial step in employing PLS-SEM is
creating a path model which show connections among variables and constructs based on the
theory and logic (Hair et al. 2014). The PLS path model is a diagram which exhibits the
hypotheses and the variable relationship to be measured in SEM analysis (Bollen 2002, cited
in Hair et al. 2017; Sarstedt, Ringle & Hair 2017).
Constructs, also known as latent variables, are elements of statistical models, representing
conceptual variables identified by researchers in their theoretical models (Sarstedt, Ringle &
Hair 2017). Because latent variables are not directly observable or measured, they are thus
inferred from a set of variables measured using tests, surveys, etc. (Schumacker & Lomax
2004). In path models, constructs are represented as circles or ovals, connected via single-
headed arrows representing predictive relationships (Sarstedt, Ringle & Hair 2017). Latent

152
variables (constructs) which only predict other latent variables are defined as exogenous
variables (as independent variables) (Götz, Liehr-Gobbers & Krafft 2010), whereas an
endogenous variable is a dependent latent variable in at least one causal relationship (Hair et
al. 2017; Hair et al. 2014). Similarly with the location of the constructs, the relationships
between them should be clearly defined (Hair et al. 2014).
The indicators, often also called manifest variables or items, are directly measured or
observed variables representing the raw data (e.g., the answer to a questionnaire from the
respondents). They are used to define and operationalise or infer each construct (latent variable)
(Schumacker & Lomax 2004) in order to test the hypotheses (Yuen et al. 2018). In path models,
they are symbolised as rectangles and are connected by arrows to their corresponding
constructs (Sarstedt, Ringle & Hair 2017).
After defining constructs and indicators, the next step is specifying the outer (measurement)
model which requires the decision to use either reflective or formative model. This step is
important because the relationships assumed in the inner model are as valid and reliable as the
outer models (Hair et al. 2014). The outer model which is known as the measurement model
refers to the relationships between the latent variables (constructs) and their manifest variables
(measurable items) (i.e., their indicators). In contrast, the inner (structural) model shows the
hypothesized relationships (paths) between the latent variables (Hair et al. 2010; Hair et al.
2017; Hair, Ringle & Sarstedt 2011).
4.9.2 Reflective and Formative Constructs Specification
This section presents how to specify constructs, including reflective and formative
constructs. Reflective indicators are regarded as all indicator items that reflect the
characteristics of a construct. They represent all potential items that conceptually describe the
propensities of the construct (Hair et al. 2010). Indicators are known as latent variable functions
whereby changes in the latent variable are reflected (i.e., manifested) in the observed indicator

153
changes (Diamantopoulos & Siguaw 2006). Two criteria should be fulfilled regarding indicator
items: (1) there should be high correlations among the indicator items that measure the same
construct and (2) indicator items are interchangeable in the sense that they do not change the
meaning of the construct in case some items are dropped (Hair, Ringle & Sarstedt 2011;
Henseler & Fassott 2010; Jarvis et al. 2003). The single-headed arrows display the relationships
between the construct and the indicator items and suggest that any changes in the construct
attributes would automatically cause changes in all indicator items (Hair, Ringle & Sarstedt
2011). Reflective measurement models are based on the presumption that a latent variable
equals the common factor that underlies a set of observed variables (indicators) (Henseler,
Ringle & Sarstedt 2016).
Conversely, formative measurement models reverse the causality path as the indicators form
or represent the latent variable (Götz, Liehr-Gobbers & Krafft 2010), suggesting that the
causality is from the indicators to the construct (Jarvis et al. 2003). Formative measurements
assume that all indicator items cause or develop the construct (Hair et al. 2010; Hair, Ringle &
Sarstedt 2011).
4.9.3 Hierarchical Component Model
This subsection explains hierarchical component model developed in this thesis. A model
with multi-dimensional constructs is classified as hierarchical latent variable or a hierarchical
component model (HCM) (Becker, Klein & Wetzels 2012) which comprises two layered
structures of constructs (Hair, Sarstedt, et al. 2018). HCM provide researchers with a
framework for modelling a construct on a more abstract dimension (called a higher-order
component) and its more concrete sub-dimensions (called lower-order components)
(Matthews, Hair & Matthews 2018). As such, they expand conceptualizations of standard
constructs, which usually depend on a single layer of abstraction (Sarstedt, Hair, et al. 2019).
Figure 4.4 presents four types of HCM.

154
Figure 4.3: The Four Types of Hierarchical Component Models
Source: Becker, Klein and Wetzels (2012).
Higher-order modelling includes summarising the lower-order components (LOCs) into a
single multidimensional higher-order component (HOC) (Hair et al. 2017). HCM can increase
the model parsimony of the model and make it easier to understand it by reducing the number
of relationships in the structural model (Hair, Sarstedt, et al. 2018; Matthews, Hair & Matthews
2018). In addition, the use of HCM can minimise bias due to collinearity problems and
eliminate potential discriminant validity problems (Hair et al. 2017). Higher latent variables
are also useful if a researcher decides to model an abstraction level higher than those first order
constructs used in a simple model of PLS (Chin 2010).
Table 4.11 displays the operationalisation of constructs in the model of strategic and
functional integration. There are three exogenous constructs of strategic integration, namely

155
aligning CSR with company’s strategy (Aligning), support from top management (SuppTM),
and developing effective communication (EffCom). Functional integration contains of six
exogenous constructs: Cost, Innovation, Quality, Supplier, Customer and Employee. As this
thesis purposed to evaluate CP comprehensively, CP as an outcome from strategic integration
is measured in four endogenous constructs, i.e., company customer performance (CCP),
company employee performance (CEP), company operational performance (COP) and CFP.
Observed variables (indicators) were used to operationalise three constructs of strategic
integration, six constructs of functional integration, and four constructs of CP. Both exogenous
and endogenous constructs were measured with multiple indicators.
Table 4.11: Construct Operationalisation in Strategic and Functional Integration
Construct Type of
Constructs Code for Constructs Code for Indicators
Strategic integration Formative Strategic Integration
Aligning with company’s
strategy
Reflective Aligning SI01, SI02, SI03, SI04, SI05
Support from top management Reflective SuppTM SI06, SI07, SI08, SI09, SI10
Developing effective
communication
Reflective EffCom SI11, SI12, SI13, SI14, SI15
Functional integration Formative Functional Integration
Cost Reflective Cost FI01, FI02, FI03, FI04, FI05
Innovation Reflective Innovation FI06, FI07, FI08, FI09, FI10
Quality Reflective Quality FI11, FI12, FI13, FI14, FI15
Supplier Reflective Supplier FI16, FI17, FI18, FI19, FI20
Customer Reflective Customer FI21, FI22, FI23, FI24, FI25
Employee Reflective Employee FI26, FI27, FI28, FI29, FI30
Company performance
Operational performance Reflective COP CP01, CP02, CP06, CP07, CP17
Financial performance Reflective CFP CP03, CP08, CP09, CP10, CP18
Customer performance Reflective CCP CP04, CP05, CP15, CP16
Employee performance Reflective CEP CP11, CP12, CP13, CP14, CP19
Accordingly, there are 12 paths from strategic integration to CP, 24 paths from functional
integration to CP, and three paths of mediation from CCP, CEP, and COP to CFP. Totally,
there are 39 paths which cause quite complicated modelling and somewhat difficult to analyse.
In order to reduce the complexity and increase the model parsimony, this thesis applied a top-
down approach to HCM by reducing the number of relationships in the structural model (Hair,

156
Sarstedt, et al. 2018; Matthews, Hair & Matthews 2018). This approach allows the effect of
various components embedded in a specific construct to be analysed (Hair et al. 2018).
Because of the characteristics of the construct specification, this thesis adopted a Type II
HCM reflective-formative to understand to what extent the integration of CSR and business
strategy of Indonesian manufacturing industry. This form of HCM comes with reflectively
LOCs (Matthews, Hair & Matthews 2018), which do not reveal identical characteristics, yet
they still form the overall understanding that might impact or mediate the impact on an
endogenous variable (Chin 1998). HOC Strategic Integration and HOC Functional Integration
are formative second-order constructs that contain two-layered structures of constructs and
represent a more general construct of their reflective LOCs (Hair, Sarstedt, et al. 2018; Jarvis
et al. 2003). Neither construct of these two HOCs is identical. Omitting one of the constructs
could impede the conceptual meaning of SI as a second-order construct (Hair et al. 2017).
Because of the reflective-formative HCM, HOC Strategic Integration and HOC Functional
Integration may mediate its LOCs and the four constructs of CP (Hair, Sarstedt, et al. 2018).
Figure 4.5 illustrates the conceptual framework of CSR integration into business strategy using
Type II HCM.

157
Figure 4.4: A Conceptual Model of CSR Integration into Business Strategy
4.9.4 Model Assessment
After determining model spefications to develop a model, the following step is a model
assessment that is discussed in this subsection. A path model involves two components: (1) the
measurement model and (2) the structural model (Hair et al. 2017; Sarstedt, Ringle & Hair
2017). The empirical measurements allow the researcher to explain theoretically established
measurement and structural models in reality, which is depicted by the sample data (Hair et al.
2017). In PLS-SEM, measurement and structural models are implied as outer and inner models
(Sarstedt, Ringle & Hair 2017). The assessment of the model involves two phases as follows.
4.9.4.1 The Assessment of Measurement Model
The evalution of measurement model as the first phase of model assessment is presented in
this subsection. The measurement model involves the unidirectional predictive relationships
between each latent underlying construct and its related observed indicators (Götz, Liehr-
Gobbers & Krafft 2010; Hair et al. 2017; Hair, Ringle & Sarstedt 2011). Through the

158
measurement model, the researcher are able to assess the reliability and validity of the construct
measures (Chin 2010; Hair et al. 2017). Reliability means that a questionnaire represents the
construct that is assessed consistently (Field 2009). Reliability is a signal of the degree to which
measures are free from random error, and thus yield reliable results (Venkatraman 1989).
Validity determines that an instrument measures what it intends to measure (Field 2009). More
specifically, measurement validity refers to the extent that a survey item (or group of items)
gives its target concept an accurate description (DeVellis 2012). Measurement validity defines
the confidence of researchers that a measure operates the way they expect it to. Internal validity
refers to arguments by researchers that the data they analysed shows a casual method at work.
External validity indicates the representativeness or generalisability of research findings, which
relate the trends and relationships found in a restricted sample to a wider social environment
(Ruel, Wagner & Gillespie 2016).
There are three types of measurement validity as follows:
1. Face validity simply means that the measure appears to be a fair way to evaluate the targeted
construct which looks good at face value (Nunnaly 1994; Ruane 2005).
2. Content validity refers to the comprehensiveness, relevance, and representativeness of the
measurement (Ruel, Wagner & Gillespie 2016). Content validity is an important factor when
a researcher deals with complex, multidimensional concepts (Ruane 2005). Face and content
validity are the most common validity evaluation in survey research techniques, in part
because they are the simplest to build (Ruel, Wagner & Gillespie 2016).
3. Construct validity is the most precious measure of validity. The construct validity is shown
when the instrument measures the construct it was intended to measure, not any other
construct. To determine if the measure has construct validity, it is used to hypothesise the
various forms in which the measure should be correlated with other variables (DeVellis
2012). If, as the theory implies, the new measure is connected with these other variables the

159
measure has construct validity. A measurement must have convergent validity and
discriminant validity to establish construct validity (Ruel, Wagner & Gillespie 2016).
Convergent validity is an evaluation of the accuracy of measures through several
operationalization, while discriminant validity is established when a measure does not so
much correlate with another measure from which it would differ (Venkatraman 1989).
Measurement of face validity has been undertaken through pre-tests during questionnaire
development (see 4.4 for details). The result reveals that face validity was achieved
satisfactorily. Content and construct validity would be evaluated in the next chapter through
PLS-SEM assessment.
Because this thesis employed the reflective-formative Type II HCM, the repeated indicator
approach is used to measure the estimate parameters of formative constructs (see Figure 4.6)
(Becker, Klein & Wetzels 2012). As a result, two measurement models are conducted: (1) the
measurement model of the LOCs (reflective measures) and (2) the measurement model of the
HOC as a whole (formative measures), reflecting the relationship between the HOC and its
LOCs (Sarstedt, Hair, et al. 2019).
Figure 4.5: Repeated-Indicator Approach for Type II HCM
Source: Becker, Klein and Wetzels (2012).

160
As recommended by Götz, Liehr-Gobbers and Krafft (2010), Hair et al. (2017) and Sarstedt,
Ringle and Hair (2017), the assessment of the measurement models of reflective measures
includes five steps as the following:
1. Assessment of content validity
PCA is a suitable way of examining the underlying factor structure of the indicators (Vinzi,
cited in Götz, Liehr-Gobbers & Krafft 2010). In addition to content validity which has been
established before the data collection through the pre-tests (see 4.4 for detail), this thesis
employed PCA after data screening to evaluate the content validity. With respect to the
reflective latent variable, EFA was employed to expose the number of factors and variables
that are included as specific factors (Fabrigar et al. 1999; Sarstedt & Mooi 2014). To do so,
PCA with Varimax rotation (Hair et al. 2010) was conducted for each construct of strategic
integration, functional integration, and CP.
Appendix A.12 shows PCA results of strategic integration. Three constructs have a KMO
value of 0.87, 0.89 and 0.88, respectively, above the threshold value of 0.6 (Tabachnick &
Fidell 2006). One factor-solution resulted by PCA confirms the uni-dimensionality of each
construct of strategic integration and indicates a high content validity (Götz, Liehr-Gobbers
& Krafft 2010). The coefficient alpha as the first indicator of instrument quality assessment
(Churchill 1979) is more than 0.7.
PCA was also conducted to assess the content validity of functional integration using EFA
with Varimax rotation (Hair et al. 2010; Sarstedt & Mooi 2014). As shown in Appendix
A.13, KMO-value of six constructs are meritorious in the range of 0.80 and 0.89 (Sarstedt
& Mooi 2014), exceeding the threshold value of 0.6 (Tabachnick & Fidell 2006). PCA
revealed a one factor-solution, indicating the uni-dimensionality of each construct of
functional integration, which reflects a high content validity (Götz, Liehr-Gobbers & Krafft
2010).

161
PCA results of CP are displayed in Appendix A.14. Four constructs have KMO values above
0.6: 0.71 (CCP), 0.80 (CEP), 0.83 (CFP) and 0.76 (COP), respectively. PCA also yielded a
single factor for each construct with the coefficient alpha above 0.7. Based on the results,
content validity has been established for constructs of strategic integration and CP.
After the uni-dimensionality of construct’s indicator has been achieved, further evaluation
regarding reliability and validity is needed (Götz, Liehr-Gobbers & Krafft 2010). Following
the results from EFA, a confirmatory factor analysis (CFA) was conducted to assess the uni-
dimensionality of the measurement items of the constructs (Hair et al. 2010). A measure is
said to be uni-dimensional if it measures a single latent trait or construct by its items
(Tavakol & Dennick 2011). The uni-dimensionality evaluation ensures that all the items
assess the underlying theoretical construct of interest (Venkatraman 1989). Results of CFA
can inform how well the actual data fits the pre-specified structure (Sarstedt & Mooi 2014).
The results can also confirm if measurement items have sufficient variance to be claimed as
reliable measures of an intended single factor (Bagozzi & Yi 2012). Since CFA can provide
a strong check for the theoretically defined dimensionality (Venkatraman 1989), CFA
should be conducted before further data analysis (Schniederjans & Cao 2009) and performed
using PLS-SEM in the following steps.
2. Assessment of indicator reliability
Indicator reliability determines which part of the variance of an indicator can be described
by the latent variable that underlies it. A common threshold criterion is that the latent
construct should explain more than 50% of the variance of an indicator (Götz, Liehr-
Gobbers & Krafft 2010; Hair, Risher, et al. 2018; Sarstedt, Ringle & Hair 2017). This means
that values greater than 0.70 are appropriate for loadings of the latent constructs on an
indicator variable (Götz, Liehr-Gobbers & Krafft 2010; Hair et al. 2017; Hair, Ringle &

162
Sarstedt 2013). Consequently, loadings of all reflective indicators should analysed to
determine the indicator reliability (Bagozzi & Yi 2012).
3. Assessment of the internal consistency (construct) reliability
Internal consistency refers to the interrelationship of a sample of test items (Venkatraman
1989). Internal consistency reliability is used to check to what extent the indicators are
assessing the constructs (Gallardo-Vázquez & Sanchez-Hernandez 2014). The most widely
used criterion for internal consistency reliability is Cronbach’s alpha which estimates
reliability based on the inter-correlations of the observed indicator variable (Hair et al. 2010;
Hair et al. 2017; Tavakol & Dennick 2011). However, Cronbach's alpha results in lower
reliability estimates compared to CR (Hair et al. 2017). CR describes to what extent the
indicator items are reliable for measuring the latent construct (Götz, Liehr-Gobbers & Krafft
2010; Hair, Sarstedt, Pieper, et al. 2012). As measured from factor loadings, CR generates
more precise reliability estimates than those given by alpha (Geldhof, Preacher & Zyphur
2014). Thus, CR (ρc) was also used in this thesis to check internal consistency (Chin 2010;
Hair et al. 2017; Hair, Ringle & Sarstedt 2011; Sarstedt, Ringle & Hair 2017). Additionally,
the reliability coefficient ρA is recommended (Benitez et al. 2020), which typically returns
a value between Cronbach's alpha and the CR ρc (Sarstedt, Ringle & Hair 2017).
4. Assessment of the convergent validity
Convergent validity is defined when two or more measures designed to explain the same
complex structure are actually associated with one another in the same study (Ruel, Wagner
& Gillespie 2016). Convergent validity describes the extent to which a measure correlates
positively with alternative measures of the same construct (Hair et al. 2017). Convergent
validity is an evaluation of whether the various items designed to measure a construct
actually do measure it. If different items actually measure same constructs, their fit will be
significant, and they will be highly correlated with each other (Churchill 1979; Gallardo-

163
Vázquez & Sanchez-Hernandez 2014; Ruel, Wagner & Gillespie 2016). As it assesses how
high each of the loadings are and whether they are more or less similar (Chin 2010), the
outer loadings of the indicators should be measured to evaluate the convergent validity of
reflective constructs, which should be 0.708 or higher (Chin 2010; Hair et al. 2017).
Another common measure to assess convergent validity is Average Variance Extracted
(AVE) (Götz, Liehr-Gobbers & Krafft 2010). This criterion is defined as ‘the grand mean
value of the squared loadings of the indicators associated with the construct’ (Hair et al.
2017, p. 114). AVE contains the variance of the measures recorded by the construct
compared to the total sum of variance, including the variance due to measurement error
(Götz, Liehr-Gobbers & Krafft 2010). According to Fornell and Larcker (1981), convergent
validity occurs when AVE values are greater than 0.5. indicating that a construct explains
more than 50% of the variance of its indicators (Hair, Ringle & Sarstedt 2011).
5. Assessment of the discriminant validity
Discriminants reflect the degree to which construct indicators assess what they are supposed
to measure and focuses on both the degree of agreement of hypothesised indicators for
measuring a construct and the distinction between such indicators and indicators of distinct
constructs (Bagozzi & Yi 2012). Discriminant validity shows the extent to which the
measure is indeed novel and not merely a representation of any other variable (Churchill
1979). There are several conditions for a construct to have discriminatory validity: (1) a
construct should be different from the other constructs of a model by empirical standards
(Götz, Liehr-Gobbers & Krafft 2010; Hair et al. 2017; Hair et al. 2014), (2) a construct
matches the correct and estimated patterns of relationship with other constructs (Ruel,
Wagner & Gillespie 2016), (3) a construct should have weak correlations with other
constructs, implying each construct measures a different phenomenon (DeVellis 2012;
Gallardo-Vázquez & Sanchez-Hernandez 2014) and (4) a construct is more strongly related

164
its own measures than with any other construct by examining the overlap in variance (Chin
2010).
Specifically, assessing the discriminant validity of HOC requires further scrutiny in three
aspects. First, the measurement model of HOC is determined by the relation between the
HOC and its LOCs, not its repeated indicators (Sarstedt, Hair, et al. 2019). Second, HOCs
as a whole should demonstrate discriminant validity of all other constructs in the model,
except for the HOC of which they are a part (Sarstedt, Hair, et al. 2019). Last, the standard
structural model assessment criteria apply for the relationships of the HOC to constructs
other than its LOCs in the model. To put it another way, the LOCs are not considered part
of the structural model and only HOC should be assessed as part of the structural model
(Sarstedt, Hair, et al. 2019).
The cross-loadings are usually the first approach to test discriminant validity (Hair et al.
2017). The indicator’s outer loadings on the related construct must be higher than the cross-
loading with other constructs (Hair et al. 2017; Hair, Ringle & Sarstedt 2011).
The most widely used conservative approach to assess discriminant validity (Hamid 2017;
Wong 2016) is the Fornell-Larcker criterion (Fornell & Larcker 1981; Hair et al. 2017). The
Fornell-Larcker criterion assumes that ‘the square root of each construct’s AVE should be
greater than its highest correlation with any other construct’ (Hair et al. 2017, p. 116).
Discriminant validity can be established if the variance shared between each construct and
its indicator items is greater than the variance shared among other constructs (Fornell &
Larcker 1981; Götz, Liehr-Gobbers & Krafft 2010; Hair et al. 2017).
A new method for assessing discriminant validity in PLS modelling is the heterotrait-
monotrait ratio of correlations (HTMT) (Henseler, Ringle & Sarstedt 2015; SmartPLS
2014). HTMT can be defined as ‘the mean of all correlations of indicator across constructs
measuring different construct’ (Hair et al. 2017, p. 118). HTMT approach is an estimate of

165
what the true correlation between constructs would be, if they were perfectly measured (Hair
et al. 2017). HTMT can be measured in two ways: (1) by comparing it to a threshold value
and (2) by defining a confidence interval to test whether HTMT is significantly lower than
a given threshold value (Benitez et al. 2020). Discriminant validity problems occur when
HTMT value is high (Hair, Risher, et al. 2018; Sarstedt, Ringle & Hair 2017). The threshold
value for HTMT is 0.85 if the path model constructs are conceptually more different and
0.90 if the constructs are very similar in concept (Henseler, Ringle & Sarstedt 2015). The
confidence interval of HTMT can be obtained through bootstrapping procedure (Hair et al.
2017).
Next, because of the reflective-formative HCM, the measurement model of HOC should be
evaluated (Hair, Sarstedt, et al. 2018; Sarstedt, Hair, et al. 2019). Since the characteristics of
formative measures are considered independent, not interrelated, and error-free, the parameters
used to assess reflective measurements are not suitable for evaluating the reliability and validity
of formative measurement models (Diamantopoulos & Siguaw 2006). It is not recommended
to check the internal accuracy of the indicators, convergent and discriminant validity as the
weights of formative indicators are involved in the analysis (Chin 1998; Hair et al. 2017).
Subsequently, as suggested by Hair et al. (2017) and Sarstedt, Ringle and Hair (2017), there
are three steps to assess the formative measurements as the following:
1. Assessment of convergent validity
Convergent validity can be defined as ‘the extent to which a measure correlates positively
with other (e.g., reflective) measures of the same construct using different indicators’ (Hair
et al. 2017, p. 140). Because Model 1 HOC Strategic Integration does not include reflective
indicators, this step could be skipped.

166
2. Assessment of the collinearity
Two or more variables are said to be collinear when evaluating an object's same attribute,
which is known as a construct (Kock & Lynn 2012). Collinearity is generally evaluated as
a potential predictor-predictor consistency phenomenon in models with multiple variables
(Kock & Lynn 2012). Multicollinearity is not desirable and tends to be problematic when
evaluating formative constructs (Hairet al. 2017) because it can affect the bootstrapping
results and thus allow type II errors (i.e., the probability of arguing that there is no
meaningful relationship between constructs when there is one) to occur (Cenfetelli &
Bassellier 2009).
A related measure of collinearity is the variance inflation factor (VIF), known as ‘the
reciprocal tolerance’ (Hair et al. 2017, p. 143). VIF should be calculated to detect the
presence of collinearity (Götz, Liehr-Gobbers & Krafft 2010). Commonly suggested values
of VIF are 10, 5, and 3.3. If a VIF is equal to or greater than the threshold value, there is
collinearity between variables (i.e., multicollinearity) (Kock & Lynn 2012). Another
criterion of collinearity is the tolerance (TOL), which defines the extent of a formative
indicator's variance which is not affected by the other indicators measuring the same
construct. TOL can be computed as 1/VIF (Hair et al. 2017, p. 143).
3. Assessment of indicator validity
Indicator validity of formative constructs was assessed by checking the significance level,
signs and the magnitude of their relationship to their formative indicators (Hair et al. 2017).
To have a significant correspondence between the formative construct and its indicators, a
threshold value of exceeding 0.1 must be obtained together with a consistent sign which
meets the requirements determined by the underlying theory (Chin 1998). With regard to
HOC using repeated indicators, weights and loadings are defined by path coefficients

167
between HOC and its LOCs and not by manifest indicators repeated at the construct level
(Becker, Klein & Wetzels 2012).
4.9.4.1 The Assessment of Structural Model
This subsection explains the second phase of model assessment, that is the evaluation of
structural (inner) model. The structural model deals with the relationships between theoretical
concepts and their hypothesized relationships (Benitez et al. 2020; Götz, Liehr-Gobbers &
Krafft 2010). The structural model, the inner model in the PLS-SEM context, describes the
fundamental structural theories of the path model (Hair, Ringle & Sarstedt 2011) and the
relationships between the latent variables (Hair et al. 2017). Because PLS-SEM does not
establish a goodness-of-fit measure (Sarstedt, Ringle & Hair 2017), instead of testing the
overall goodness of the model fit, PLS-SEM evaluates the structural model based on the
heuristic criteria which are determined by the model’s predictive capabilities (Hair et al. 2017).
Assessing a structural model includes the determining of the model’s predictive capabilities
and the relationships between the constructs (Hair et al. 2017; Hair, Ringle & Sarstedt 2011).
In other words, the evaluation was aimed at determining the value of R2 for each endogenous
construct, the size and significance of path coefficients present in the model (Chin 2010, cited
in Götz, Liehr-Gobbers & Krafft 2010; Vinzi et al. 2010). Because PLS focuses on optimising
the prediction of endogenous constructs (Matthews, Hair & Matthews 2018), the quality of the
model is assessed in PLS-SEM from its ability to predict endogenous constructs which involve
four criteria: path coefficient, coefficient of determination (R2), cross-validated redundancy
(Q2) and effect size (f2) (Chin 2010; Hair et al. 2014).
4.9.5 Mediating Effect
This subsection discusses the mediation analysis that would be examined in this thesis. As
the relationships among constructs in PLS-SEM can be complex and not always

168
straightforward (Wong 2016), a mediating effect might occur when a third variable of
constructs intercedes between two other related constructs (Hair et al. 2017). The essence of
mediation analysis is that it presumes the sequence of relationships in which the antecedent
variable influences the mediators, which then affects the dependent variable (Nitzl, Roldan &
Cepeda 2016). A mediation analysis essentially aims to examine the extent to which the
intervening variables (M) mediate the relationship between the independent variables (X) and
a dependent variable (Y) (see Figure 4.7 B) (Preacher & Hayes 2008). Although the purpose
of mediation is to understand the progress of the process (Henseler, Ray & Hubona 2016),
mediation analysis may have an essential role in prediction (Shmueli et al. 2016).
Figure 4.6: (A) Illustration of a direct effect. X affects Y; (B) Illustration of a mediation
design. X is hypothesized to exert an indirect effect on Y through M.
Source: Preacher and Hayes (2008).
According to Baron and Kenny (1986), examining the mediating effect involves three types
of variables: independent variable (X), dependent variable (Y), and mediator (M). The impact
of the independent variable on the intervening variables/mediators (X → M) is symbolised by
a, while the effect of the intervening variable on the dependent variable (M → Y) is noted by
b (see Figure 4.7 B). When paths a and b are controlled, a previously significant relation
between the independent and dependent variables (X → Y), symbolised as c is no longer

169
significant (see Figure 4.7 A) (Baron & Kenny 1986). Total effect of X on Y (c') are estimates
of two partial effects; the first is the effect of the mediator on the outcome and the second is
the effect of the independent variable on the outcome (Judd 2010).
It is possible that exogenous constructs intervene in the relationships through more than one
mediating variables called multiple mediation (Hair et al. 2017). The multiple mediation
generates a specific indirect effect that can be assumed as the indirect effect of exogenous
constructs on endogenous constructs through a given mediator, including all other included
mediators (Hair et al. 2017). A more complete picture of the mechanism by which an
exogenous construction affects an endogenous structure can be obtained by simultaneously
considering all the mediators in one model (Hair et al. 2017).
This thesis employed PLS-SEM to assess the measurement model and the structural model
through the PLS algorithm and the bootstrapping procedure. Before running the PLS algorithm,
the algorithmic options and parameter settings must be set-up. The setting involves selecting
the structural model path weighting method, the data metric, initial values to start the PLS-
SEM algorithm, the stop criterion and the maximum number of iterations (Hair et al. 2017).
This thesis used the factor weighting scheme as strongly recommended for parameter
estimations in the reflective-formative HCM (Hair, Sarstedt, et al. 2018), maximum iterations
of 500 and stop criterion of seven (Hair et al. 2017).
Bootstrapping is a non-parametric technique of forming a resample from the original sample
by random replacement to obtain a statistical inference and to estimate the accuracy of the PLS
prediction (Chin 2010; Henseler, Ringle & Sinkovics 2009; Preacher, Rucker & Hayes 2007).
When conducting inferential tests, no assumptions are made about the shape of the statistical
sampling distribution using bootstrapping (Preacher, Rucker & Hayes 2007). Because the
bootstrapping technique treats the observed sample as a population, the word replacement
refers to drawing each observation randomly with returning it to the sampling population for

170
generating the next observation (Hair et al. 2017). Consequently, estimates of the expected
value and statistical variability can be calculated as taken from an empirical distribution of the
sampling (Aguinis, Gottfredson & Joo 2013). At least, the number of bootstrap samples must
be equal to the number of valid observations in the data set (Hair et al. 2017). Accordingly, this
thesis used 5,000 bootstrap sample and selected the complete bootstrapping option, bias-
corrected and accelerated (BCa) bootstrap for confidence interval method, and two-tailed
testing (Hair et al. 2017; Hair, Sarstedt, et al. 2018; Streukens & Leroi-Werelds 2016). A
significance (alpha) level of 0.05 was applied as it is appropriate for most research (Barlett,
Kotrlik & Higgins 2001).
4.9.6 Moderating Effect
How to examine the moderating effect is provided in this subsection. Moderating effects are
generated by variables whose variation affects the strength or direction of a relation between
an exogenous and an endogenous variable. The triggers of the moderating effects are called
"moderator factors" or simply "moderators” (Henseler & Fassott 2010). A moderator is a
‘…variable that affects the direction and/or strength of the connection between an independent
or predictor variable and a dependent or criterion variable’ (Baron & Kenny 1986, p. 1174; Bu¨
yu¨ kbalcı 2012). Moderation defines a condition where the strength of relationship between
two variables (constructs) is not constant but dependent on the values of a moderator (Hair et
al. 2017; Preacher, Rucker & Hayes 2007).
Moderator variables are of great relevance since complex relationships are usually subject
to contingencies. Moderators may be either metric or categorical variables. Group comparisons
can be considered as a special case of moderating effects (i.e., comparisons of model estimates
for different groups of observations). The grouping variable is nothing more than a categorical
moderator variable (Henseler & Fassott 2010). Group differences in the structural model should
be accounted for, using the group variable as a moderator (Henseler, Ringle & Sarstedt 2016).

171
Because of the complexity of the social and behavioral occurrences, heterogeneity probably
occurs in samples which are used to develop, examine, and refine models (Becker et al. 2013).
It is essential to identify, test, and treat heterogeneity in the data (Hair, Sarstedt, et al. 2018)
since heterogeneity can affect the structural model, the measurement model, or both (Becker
et al. 2013). Moderation can be used as a way of defining heterogeneity in the data (Hair et al.
2017). There are two types of heterogeneity in data: observed and unobserved. If differences
among groups refer to observable characteristics, it is observed heterogeneity (Hair et al. 2016).
Unobserved heterogeneity occurs when data subgroups involve considerably different
estimates of the model (Sarstedt, Ringle, et al. 2019).
MGA or between-group analysis makes it possible to assess differences between the same
models tested for different groups of respondents (Hair et al. 2017; Matthews, Hair & Matthews
2018). MGA can be conducted to check the moderating effect (moderation) based on the
observed and unobserved data. With respect to the observed data, MGA was appropriate to be
employed to examine the differences of the results among groups based on company size and
industry type as discrete moderator variables (Eberl 2010; Hair, Sarstedt, et al. 2018). The path
coefficients across the groups are compared, which provides an interpretation of the differences
in effects between groups (Eberl 2010). MGA allows testing whether differences between
group-specific path coefficients are statistically significant (Hair, Sarstedt, et al. 2018;
Matthews, Hair & Matthews 2018). Thus, MGA via PLS-SEM is an efficient method of
evaluating moderation across multiple relationships (Hair, Sarstedt, Ringle, et al. 2012).
Differences in the model parameters between the distinct data groups are perceived as
moderating effects (Henseler & Fassott 2010). To test the moderating effect, the influence of
the exogenous variable on the endogenous variable, the direct effect of the moderating
variables on the endogenous variable and the influence of the interaction variable on the
endogenous variable are estimated (Helm, Eggert & Garnefeld 2010).

172
As guided by Matthews (2017), there are several steps of MGA as follows:
1. Generating data groups
Before conducting MGA, data groups should be generated based on the categorical variable
of interest (Matthews 2017).
2. Analysing the measurement invariance of composite models (MICOM)
Before comparing group-specific parameter estimates for significant differences using
MGA, as recommended by Hair, Sarstedt, et al. (2018), measurement invariance was
conducted to provide confidence that group differences in model estimates are not caused
by the different content and/or meanings of the latent variables across groups. If there is no
measurement variance, it can decrease the statistical power, affect the estimator precision,
and give misleading results (Hair, Sarstedt, et al. 2018). Consequently, measurement
invariance is an essential consideration to be addressed in MGA (Henseler, Ringle &
Sarstedt 2016) to ensure the accuracy of results and conclusions (Hair, Sarstedt, et al. 2018).
As recommended by Henseler, Ringle and Sarstedt (2016), the MICOM consists of three
inter-related hierarchical steps as the following.
▪ Step 1. Configural Invariance. Step 1 addresses the establishment of configural
invariance to ensure that each latent variable in the PLS path model has been specified
equally across all the groups (Henseler, Ringle & Sarstedt 2016). Accordingly, three
procedures were carried out as follows:
a. Identical indicators per measurement model: each measuring model must use the same
indicators across the different groups (Henseler, Ringle & Sarstedt 2016). When
different languages were used in surveys, translation and back-translation is the key
factor in ascertaining the indicators’ equivalence (Hair, Sarstedt, et al. 2018; Henseler,
Ringle & Sarstedt 2016). As explained in the previous chapter (see 4.4 for details), the
questionnaire was translated into the Indonesian language and back-translated into

173
English (Brislin 1970). Indonesian and native English translators assured that both
versions of the questionnaire (Indonesian and English) had appropriate corresponding
meanings to the content of each sentence’s message.
b. Identical data treatment. The indicators’ data treatment is similar across all the groups,
including the coding and the data handling, such as reverse coding, missing value
treatment and outlier identification (Henseler, Ringle & Sarstedt 2016). This step has
been conducted through data screening and explained in previous chapter (see 4.7.2).
c. Identical algorithm settings or optimization criteria. Because the same model was
running separately in MGA, the algorithm settings have been set similarly to ensure
that differences in the group-specific model estimations do not result from dissimilar
algorithm settings (Henseler, Ringle & Sarstedt 2016). The permutation test was also
conducted using the similar setting of PLS algorithm and bootstrapping (see 5.3 for
details).
When all three procedures have been met, configural invariance as Step 1 in MICOM
can be established.
▪ Step 2. Compositional invariance. Compositional invariance ensures that the prescription
for composite condensation of the indicator variables is the same for all groups (Henseler,
Ringle & Sarstedt 2016). In other words, the composite score does not vary significantly
between groups (Hair et al. 2017). To check compositional invariance, the permutation
test as a non-parametric test (Henseler, Ringle & Sarstedt 2016) should be conducted by
setting a number of 1,000 permutations and a significance level of 0.05 (Hair, Sarstedt,
et al. 2018).
▪ Step 3. Equality of composite mean values and variances. The configural and
compositional invariance are preconditions for evaluating the equality of the composite
mean values and the variance. Evaluation of the equality of the composite mean values

174
and the variance is meaningless if there is no compositional invariance (Henseler, Ringle
& Sarstedt 2016). Because the compositional invariance has been established, Step 3 has
been carried out to evaluate the composite’s equality of mean values and variances across
groups (Henseler, Ringle & Sarstedt 2016). This final step of the MICOM method will
analyse how the mean values and variances between the first group’s composite scores
and second group’s composite score vary with respect to their means and variances (Hair,
Sarstedt, et al. 2018).
3. Analysing and Interpreting Permutation Results
Path coefficients generated from different samples are almost always numerically different,
but the question is whether the differences are statistically significant. MGA helps in
addressing this question by testing one-sided hypothesis (Hair, Sarstedt, et al. 2018).
4.10 Ethical Considerations
The final section in this chapter provides ethical considerations for this thesis. A prerequisite
of PhD candidature is that all research involving human participants receives ethical clearance
before data is collected. Ethical considerations relevant to this thesis have been acknowledged
and officially approved by the board of College Human Ethics Advisory Network (CHEAN),
RMIT University (Ethics approval number: 21372). The risk level was graded as ‘Low Risk’
for subjects involved in this thesis. A copy of the ethics approval is attached in Appendix A.11.
Data collection was carried out after receiving CHEAN approval. The cover letter indicated
that since participation was voluntary, potential participants could withdraw at any time. The
cover letter also stated that neither company nor personal information could be individually
identified to avoid any risks arising from providing information on behalf of the company. The
cover letter also indicated that since it was an anonymous survey, the respondents gave their
consent when they completed and returned the questionnaire to the researcher. As a result,
informed consent was obtained from all respondents included in the study. Like the

175
questionnaire, the cover letter was translated into the Indonesian language to make it easier for
the respondents to understand.
4.11 Summary of Chapter 4
In summary, this chapter discusses several important aspects of the research methodology
used in this thesis. This thesis employed a positivist research paradigm and a deductive research
approach. This thesis also conducted an explanatory study and quantitative research with a
survey to answer the research questions. Several items from strategic management, CSR, and
manufacturing studies have been incorporated into the questionnaire. Prior to data collection,
a pilot research was done.
The manufacturing industry in Indonesia is the population in this thesis, and manufacturing
companies from Java is the sample study. This thesis employed purposive sampling in data
collection, which took place in five regions of Java from June to October 2018. The main and
supplementary frames were used to collect data.
This thesis employs SPSS and SmartPLS 3 for data analysis to evaluate not only the
relationship between CSR integration and business strategy, but also the mediating and
moderating impacts on that relationship. Data screening was performed prior to data analysis
to ensure data validity and reliability. PLS-SEM for data analysis is also explained in this
chapter. Ethical considerations is presented, indicating that data collection took place only after
ethical approval.

176
CHAPTER 5: STRATEGIC INTEGRATION-FINDINGS AND DISCUSSION
This chapter presents the procedures and results for the statistical analysis, particularly in
relation to strategic integration. This chapter begins by explaining the descriptive statistical
analyses, followed by describing the model specification. Then, the model assessment and the
mediation analysis are presented. The next section explains the MGA in relation to strategic
integration. Last, a summary of this chapter is provided.
5.1 Descriptive Statistical Analysis in Strategic Integration
This section presents descriptive statistical analysis performed in this thesis, with a focus on
strategic integration. It contains a descriptive statistical analysis for each of the model's
constructs.
Descriptive statistics characterise the measured variables, including independent and
dependent variables, such as the mean, standard deviation, and correlation. The mean is
regarded as a statistical model of the data, while standard deviation is used to determine the fit
of the mean, and correlation is calculated to determine the relationship between variables (Field
2009). A correlation coefficient should be between -1 and +1. The coefficient of +1 means a
perfect positive relationship, while -1 indicates a perfect negative relationship. A coefficient of
zero suggests no linear relationship at all, when variables are completely independent (Ruel,
Wagner & Gillespie 2016; Saunders 2009). Because the correlation coefficient reflects the size
of an effect, values of ±0.1 represents a small effect, ±0.3 indicates a medium effect, and ±0.5
reflects a large effect (Field 2009).
In this thesis, SPSS 26 was employed for all variables (constructs) used in the model
measured with a five-point scale, including independent variables, namely business strategy,
CSR strategy, strategic integration and functional integration, and dependent variables—that
is, CP variables. Specifically, this thesis uses Spearman’s correlation coefficient to measure the

177
relationship among variables because data are non-parametric regarding non-normally
distributed data.
Appendix B.1 shows means, standard deviations, and correlations among the 10 items of
business strategy. Mean scores range from four to five. Items with the highest mean are:
‘Controlling the product quality’ (SI02, 4.68) and ‘Providing customer service capabilities’
(SI09, 4.54). This suggests that most manufacturing companies in Indonesia prioritise both
strategies: cost leadership and differentiation strategy. Standard deviations for all items are less
than one, representing a reasonable spread of opinions about business strategy across the
sample. As shown in Appendix B.1, 10 items of business strategy correlate to each other with
correlation coefficients between 0.12 and 0.43, implying small to medium effects.
Descriptive analysis of CSR strategy is presented in Appendix B.2, showing that 18 out of
20 items have a high mean score between 3 and 5. Three items with the greatest mean are: ‘We
continually improve the quality of our products’ (CS05, 4.52), ‘All our products meet legal
standards’ (CS08, 4.45) and ‘We are recognised as a trustworthy company’ (CS12, 4.45). The
results indicate most manufacturing companies emphasise the economic, the legal and ethical
responsibilities of CSR. Because four items related to the philanthropic responsibility have a
mean of less than four, the result suggests that respondents have a low perception of this
responsibility. Standard deviations for all items were below one, indicating a reasonable spread
of opinions about CSR strategy across the sample. The correlation coefficients of variables of
CSR strategy are significant and range from 0.09 to 0.59, implying that they correlate to each
other. In general, the results indicate that all surveyed companies have implemented CSR
strategy.
Appendix B.3 exhibits means, standard deviations, and correlations among 15 items of
strategic integration. High mean scores of these items show that respondents are aware of
strategic integration. Two items with the greatest mean are: ‘Mechanisms are available for

178
evaluating the results of the objectives’ (SI03, 4.06) and ‘CSR strategy is well aligned with
corporate vision and mission’ (SI04, 3.95). Additionally, 15 items correlate to each other with
significant medium to strong correlation coefficients between 0.36 and 0.68.
Appendix B.4 presents the descriptive analysis of CP. Almost 19 items of CP have high
mean scores. Two items with the highest mean are: ‘Customer satisfaction’ (CP12, 4.00) and
‘Customer loyalty’ (CP13, 3.99). However, not all the correlation coefficients are significant.
Seventeen items correlate to each other, with coefficient correlations ranging from 0.27 to 0.69.
Conversely, two items with the smallest means, CP11 (2.42) and CP16 (2.75), have
insignificant coefficients of correlation. In these two items, reverse coding was used to insert a
positive wording item into a negative wording item (Ruel, Wagner & Gillespie 2016), and their
mean score was already reversed from its original meaning (see Table 4.5). Respondents did
not know that these items were reverse coded (Podsakoff et al. 2003).
5.2 Model Specification of Strategic Integration
Model specification of strategic integration is determined in this section. As shown in Figure
5.1, Model 1 illustrates strategic integration and CP. HOC Strategic Integration consists of
three LOCs: Aligning, SuppTM, and EffCom. Each LOCs has five indicators, indicating a
similar number of indicators used for these LOCs (Matthews, Hair & Matthews 2018). There
are four constructs of CP: CCP with three indicators, CEP with four indicators, CFP, and COP
with five indicators, respectively. This model type refers to a molar model because it has the
arrow from its LOCs to the higher second order model (Chin 2010). This model also implies a
collect model, indicating formative relationships going from the LOCs to forming the HOC
with equal numbers across the LOCs (Hair, Sarstedt, et al. 2018) as suggested when the
repeated indicator approach was employed (Becker, Klein & Wetzels 2012). Similar to four
endogenous constructs of CP, three LOCs of HOC Strategic Integration represent Mode A
because they are reflectively measured constructs. The relationship from three LOCs to HOC

179
Strategic Integration refers to Mode B since this HOC is a formatively measured construct
(Hair, Sarstedt, et al. 2018; Sarstedt, Hair, et al. 2019; Sarstedt, Ringle & Hair 2017).
Figure 5.1: Model of Strategic Integration and Company Performance (Model 1)
5.3 Model Assessment for Strategic Integration
This section discusses model assessment, which is particularly employed in strategic
integration. It starts with an explanation of the measurement model evaluation. After that, it
describes the structural model evaluation.
5.3.1 Assessment of the Measurement Model in Strategic Integration
Because Model 1 used reflective-formative HCM, the measurement model assessment of
Model 1 includes the evaluation of reflective and formative measures. The following are the
explanations for each of them.
5.3.1.1 Assessment of Reflective Measurement Model in Strategic Integration
This subsection presents several procedures undertaken to assess the reflective measurement
model in strategic integration (Model 1). Since CFA can provide a strong check for the

180
theoretically defined dimensionality (Venkatraman 1989), CFA should be conducted before
further data analysis (Schniederjans & Cao 2009). As EFA for content validity assessment was
conducted in Chapter 4, the next section presents CFA performed using PLS-SEM.
1. Assessment of indicator reliability
Figure 5.2 presents the result of PLS algorithm of Model 1, and Table 5.1 summarises the
resulting assessment of the structural model of Model 1. The results suggest that indicator
reliability for all indicators, both of strategic integration and CP, are above the threshold
value of 0.50 and significant (Götz, Liehr-Gobbers & Krafft 2010; Hair, Risher, et al. 2018;
Sarstedt, Ringle & Hair 2017).
Figure 5.2: Results of PLS Algorithm of Model 1
2. Assessment of internal consistency (construct) reliability
This thesis uses these three criterion to assess internal consistency and reliability, namely
Cronbach’s alpha, ρA, and ρc, and higher values imply a higher level of reliability (Hair,
Risher, et al. 2018). As summarised in Table 5.1, all reflective measures of Model 1 have

181
Cronbach’s alphas between 0.817 and 0.911, indicating that they are well above the
threshold value of 0.70 and satisfactory (Bagozzi & Yi 2012; Hair et al. 2017; Hair, Ringle
& Sarstedt 2011). The CR for all constructs is between 0.88 and 0.94, and the reliability
coefficients ρA for all constructs are above 0.7 and do not exceed the 0.95 level (Bagozzi &
Yi 2012; Hair et al. 2017). These results show that the construct measures of all LOCs
exhibit high levels of internal consistency and reliability.
3. Assessment of convergent validity
Two indicators of CP have factor loadings less than 0.7 (CP11 and CP16). These indicators
also have low communalities and negative loadings in EFA (see Appendix A.14 for detail).
These two indicators were eliminated from their related constructs because their removal led
to an increase in the CR and AVE (Hair et al. 2017). After this elimination, the PLS
algorithm was re-run. Results in Table 5.1 show that indicators of strategic integration and
CP have outer loadings above the threshold value of 0.708 (Chin 2010; Hair et al. 2017).
Table 5.1 shows AVE values of above 0.50 for three LOCs of HOC Strategic Integration:
0.67 (Aligning), 0.74 (SuppTM), and 0.75 (EffCom). The four constructs of CP also have
AVE values greater than 0.50: 0.73 (CCP), 0.65 (CEP), 0.62 (CFP), and 0.59 (COP).
Subsequently, the results indicate that all reflective measures demonstrate convergent
validity because the indicators load strongly onto their corresponding constructs (Kock
2015).
4. Assessment of discriminant validity
In terms of cross loadings, the results in Appendix B.7 reveal that each indicator loads more
highly on their own construct than on others (Chin 2010).

182
Table 5.1: Reflective Construct Assessments of Model 1
Construct SD t-
value
p-
value
Indicator
reliability
Convergent
validity Internal consistency reliability
Loading AVE Cronbach’s
alpha
Composite
reliability ρA
Aligning CSR with company’s strategy (Aligning) 0.67 0.88 0.91 0.88
SI01 <- Aligning 0.02 33.88 0.00 0.65 0.80
SI02 <- Aligning 0.02 44.50 0.00 0.68 0.82
SI03 <- Aligning 0.03 25.03 0.00 0.53 0.73
SI04 <- Aligning 0.01 58.83 0.00 0.76 0.87
SI05 <- Aligning 0.02 51.20 0.00 0.72 0.85
Support from top management (SuppTM) 0.74 0.91 0.93 0.91
SI06 <- SuppTM 0.02 52.59 0.00 0.73 0.85
SI07 <- SuppTM 0.01 67.71 0.00 0.78 0.88
SI08 <- SuppTM 0.02 45.44 0.00 0.71 0.84
SI09 <- SuppTM 0.01 71.59 0.00 0.77 0.88
SI10 <- SuppTM 0.02 42.96 0.00 0.70 0.83
Developing effective communication (EffCom) 0.75 0.91 0.94 0.91
SI11 <- EffCom 0.02 40.60 0.00 0.70 0.83
SI12 <- EffCom 0.02 53.39 0.00 0.72 0.85
SI13 <- EffCom 0.01 59.38 0.00 0.77 0.88
SI14 <- EffCom 0.01 64.26 0.00 0.77 0.88
SI15 <- EffCom 0.01 64.00 0.00 0.76 0.87
Company customer performance (CCP) 0.73 0.82 0.89 0.81
CP12 <- CCP 0.01 60.99 0.00 0.76 0.87
CP13 <- CCP 0.02 51.20 0.00 0.72 0.85
CP14 <- CCP 0.02 53.72 0.00 0.71 0.84
Company employee performance (CEP) 0.65 0.82 0.88 0.82
CP04 <- CEP 0.02 41.46 0.00 0.66 0.81
CP05 <- CEP 0.02 45.06 0.00 0.71 0.84
CP15 <- CEP 0.02 40.66 0.00 0.66 0.81
CP19 <- CEP 0.03 29.86 0.00 0.58 0.76
Company financial performance (CFP) 0.62 0.84 0.89 0.84
CP03 <- CFP 0.02 32.37 0.00 0.58 0.76
CP08 <- CFP 0.02 39.43 0.00 0.69 0.83
CP09 <- CFP 0.02 47.35 0.00 0.71 0.84
CP10 <- CFP 0.03 26.79 0.00 0.58 0.76
CP18 <- CFP 0.03 25.66 0.00 0.53 0.73
Company operational performance (COP) 0.59 0.83 0.88 0.83
CP01 <- COP 0.03 20.63 0.00 0.52 0.72
CP02 <- COP 0.03 24.73 0.00 0.53 0.73
CP06 <- COP 0.02 36.41 0.00 0.66 0.81
CP07 <- COP 0.02 50.76 0.00 0.67 0.82
CP17 <- COP 0.02 30.11 0.00 0.56 0.75

183
In terms of Fornell-Larcker criterion, Table 5.2 displays the square root of AVE as the
diagonal elements and the correlations among constructs in off-diagonal rows and columns.
The results show that the square root of AVE (in a diagonal line in bold) is higher than the
cross-loadings with other constructs. However, for the Aligning-SuppTM, there is little
difference. Because the difference is so small (0.01), it can be ignored (Rahim & Magner 1995).
The result of Fornell-Larcker testing suggests that the discriminant validity has been
established.
Table 5.2: Fornell-Larcker Testing of Model 1
Code Construct AVE 1 2 3 4 5 6 7 8
1 Aligning 0.67 0.82
2 CCP 0.73 0.28 0.85
3 CEP 0.65 0.59 0.63 0.80
4 CFP 0.61 0.40 0.68 0.72 0.78
5 COP 0.59 0.43 0.66 0.72 0.74 0.77
6 EffCom 0.74 0.75 0.27 0.56 0.39 0.38 0.86
7 Strategic Integration 0.62 0.92 0.30 0.63 0.43 0.43 0.92 0.79
8 SuppTM 0.74 0.83 0.28 0.60 0.41 0.41 0.83 0.95 0.86
Note: The square root of AVE (on blue remark) is shown in diagonal while the correlations are off-diagonal.
Table 5.3 displays the HTMT values for all constructs. The results show discriminant
validity between EffCom and Aligning with the HTMT value of 0.83, below the conservative
threshold value of 0.85. Although the HTMT value between SuppTM and Aligning (0.92) and
between SuppTM and EffCom (0.91) are above 0.90, they are significantly different from one
(Sarstedt, Ringle & Hair 2017). The HTMT value between LOCs of HOC Strategic Integration
and other reflectively measured constructs (i.e., CCP, CEP, CFP and COP) range between 0.33
and 0.87. These results show that LOCs have discriminant validity between themselves and all
other constructs in Model 1 (Sarstedt, Hair, et al. 2019). The results also reveal that the
discriminant validity between the HOC Strategic Integration and other constructs in Model 1
have been achieved in the range of 0.34 to 0.71, less than 0.85. In addition, the results from the
bootstrapping procedure show that HTMT values are significantly lower than 1 (Hair, Sarstedt,
et al. 2018; Sarstedt, Ringle & Hair 2017) and below 0.9. Nevertheless, discriminant validity

184
cannot be established between HOC Strategic Integration and its LOCs (i.e., Aligning, EffCom,
and SuppTM) because the measurement model of this HOC repeats indicators of its LOCs
(Hair, Sarstedt, et al. 2018; Sarstedt, Hair, et al. 2019). Overall, the results of three criteria of
discriminant validity indicate that discriminant validity has been established for the reflective
measurement model of Model 1.
After having checked for discriminant validity, the reflective measurement model’s
validation process has been completed (Götz, Liehr-Gobbers & Krafft 2010). To conclude, the
reflective evaluation of the Model 1 measurement models has been achieved satisfactorily.
Table 5.3: HTMT Values of Model 1
Code Construct 1 2 3 4 5 6 7 8
1 Aligning
2 CCP 0.33
[0.22, 0.44]
3 CEP 0.69
[0.62, 0.76]
0.77
[0.69, 0.85]
4 CFP 0.46
[0.37. 0.55]
0.81
[0.74, 0.88]
0.86
[0.79, 0.93]
5 COP 0.5
[0.40, 0.59]
0.80
[0.73, 0.86]
0.86
[0.73, 0.92]
0.87
[0.81, 0.92]
6 EffCom 0.83
[0.77, 0.87]
0.31
[0.20, 0.41]
0.65
[0.57, 0.72]
0.44
[0.35, 0.53]
0.42
[0.31, 0.53]
7 Strategic
Integration 1.00
[0.98, 1.02]
0.34
[0.23, 0.43
0.71
[0.64, 0.77]
0.48
[0.39, 0.55]
0.48
[0.38, 0.57]
0.99
[0.97, 1.00]
8 SuppTM 0.92
[0.89, 0.95]
0.33
[0.22, 0.43]
0.70
[0.63, 0.76]
0.46
[0.37, 0.55]
0.46
[0.36, 0.56]
0.91
[0.86, 0.94]
1.02
[1.01, 1.03] 0.00
Note: The values in brackets represent the 95% bias-corrected and accelerated confidence interval of the HTMT
values obtained by running the bootstrapping routine with 5,000 samples in SmartPLS (Hair, Sarstedt, et al. 2018).
5.3.1.2 Assessment of Formative Measurement Model in Strategic Integration
Several steps to evaluate the formative measurement model in strategic integration is
presented in this subsection. Since Model 1 adopts reflective-formative HCM, the collinearity
and the significance and importance of the relations between the LOCs and their HOC should
be evaluated (Hair, Sarstedt, et al. 2018). Table 5.4 presents VIF and TOL values. VIF values
are less than five, and TOL values are above 0.2. Both values show that collinearity is not a
critical issue in Model 1 (Hair et al. 2017; Hair, Risher, et al. 2018).

185
Table 5.4: Collinearity Test of Formative Measures of Model 1
Exogenous Construct Endogenous Construct VIF value TOL value
Aligning Strategic Integration 3.28 0.30
SuppTM 4.65 0.22
EffCom 3.31 0.30
Table 5.5 presents results of bootstrapping procedure for Model 1. Three paths from LOC
to HOC get p-values above 0.1 and t-values exceeding 1.96. Because the confidence interval
do not include zero, they are significant (Hair, Risher, et al. 2018). Three LOCs have highly
similar effects on Strategic Integration, showing their slightly equivalent weight for developing
the HOC (Hair, Sarstedt, et al. 2018). SuppTM contribute most substantially to HOC Strategic
Integration (β=0.38), followed by EffCom (β=0.36), and Aligning (β=0.33).
To sum up, the assessment of the measurement model, including both reflective and
formative measures suggested that eight constructs used in Model 1 (seven LOCs and one HOC
Strategic Integration) were reliable and valid in the context of this thesis. Then, the model can
be used for further analysis.
Table 5.5: Indicator Validity of Formative Measurements in Model 1
Second-Order
Constructs Paths Path Coefficient SD t-value p-value*
Strategic
Integration
Aligning → Strategic Integration 0.33 [0.32; 0.35] 0.01 34.03 0.00
SuppTM → Strategic Integration 0.38 [0.36; 0.40] 0.01 45.30 0.00
EffCom → Strategic Integration 0.36 [0.34; 0.38] 0.01 35.73 0.00
Notes: *p < 0.05 (two-tailed t-test for significance testing above 1.96). The values in brackets represent the 95%
bias-corrected and accelerated confidence interval of the path coefficients obtained by running the bootstrapping
routine with 5,000 samples in SmartPLS.
5.3.2 Assessment of the Structural Model in Strategic Integration
Following the evaluation of the measurement model, the structural model of strategic
integration is assessed. This subsection shows how each step of the evaluation was conducted.
In this thesis, the purpose of the structural model assessment is to estimate the variance in
endogenous constructs (four constructs of CP) explained by exogenous constructs (i.e., HOC
Strategic Integration). As suggested by Hair et al. (2017), six steps are conducted.

186
5.3.2.1 Assessment of Collinearity in Strategic Integration
This subsection presents how collinearity in strategic integration is assessed. The results in
Tables 5.6 and 5.7 show that outer and inner VIF values are lower than five, indicating no
significant levels of collinearity were detected among the indicators and the constructs (Hair et
al. 2017).
Table 5.6: Outer VIF Values of Model 1
Indicator VIF Indicator VIF Indicator VIF Indicator VIF
SI01 1.91 SI09 2.79 CP02 2.01 CP10 1.59
SI02 2.07 SI10 2.22 CP03 1.61 CP12 1.95
SI03 1.61 SI11 2.21 CP04 1.77 CP13 1.94
SI04 2.68 SI12 2.49 CP05 2.01 CP14 1.62
SI05 2.37 SI13 2.91 CP06 2.09 CP15 1.74
SI06 2.53 SI14 2.98 CP07 2.17 CP17 1.48
SI07 2.99 SI15 2.93 CP08 2.43 CP18 1.47
SI08 2.36 CP01 1.96 CP09 2.57 CP19 1.46
Table 5.7: Inner VIF Values of Model 1
Construct 1 2 3 4 5 6 7 8
1 Aligning 3.28
2 CCP 2.02
3 CEP 3.14
4 CFP
5 COP 2.42
6 EffCom 3.31
7 Strategic Integration 1.00 1.00 1.70 1.00
8 SuppTM 4.65
5.3.2.2 Assessment of the Structural Model Relationships in Strategic Integration
This subsection discusses on how structural model relationship is evaluated in strategic
integration. Path coefficients reflect the strength of the relationships between latent variables
(Sarstedt, Ringle & Hair 2017). The strength and significance of the path coefficients are
assessed in relation to the hypothesised relationships (structural paths between the constructs)
(Sarstedt, Ringle & Hair 2017), which can be measured using a bootstrapping procedure (Hair
et al. 2017; Wong 2016). PLS path modelling employs a nonparametric bootstrap (Davison &
Hinkley 2003; Efron & Tibshirani 1993, cited in Henseler, Ringle & Sinkovics 2009) to

187
calculate t and p values of the path coefficient (Sarstedt, Ringle & Hair 2017) and present
confidence intervals for all parameter estimates, building the basis for statistical inference
(Henseler, Ringle & Sinkovics 2009). Critical t-values for a two-tailed test are 1.96 with a
significance level of 5% (Hair, Ringle & Sarstedt 2011). Thus, a path coefficient is significant
at the 5% probability of error level if zero does not fall within the 95% confidence interval
(bias-corrected and accelerated) (Götz, Liehr-Gobbers & Krafft 2010; Sarstedt, Ringle & Hair
2017). With regards to relevance, path coefficients generally range from -1 to +1. Coefficients
closer to +1 indicate strong positive relationships, and those closer to -1 suggest strong negative
relationships (Sarstedt, Ringle & Hair 2017).
To analyse the relationship between strategic integration and CP, direct effect and
moderating effect are tested as follows.
1. Direct Effect in Strategic Integration
A direct effects shows the relationship between two constructs with a single arrow (Hair et
al. 2017). To be considered meaningful, standarised paths are necessary to be at least 0.20
and ideally should be higher than 0.30 (Chin 1998). Table 5.8 presents seven positive direct
effects resulting from the bootstrapping procedure (see also Figure 5.2). Six expose
meaningful and significant relationships with path coefficients above 0.3, t-values
exceeding 1.96, and no zero in their confidence interval (Hair et al. 2017). Only one path
has a weak and insignificant direct effect with a path coefficient of less than 0.2 and t-value
below 1.96: Strategic Integration → CFP. The first three paths indicate that three LOCs of
Strategic Integration have a positive and significant direct effect on their HOC, and among
them, the path coefficient is almost identical. Three paths in the relationshp between HOC
Strategic Integration and endogenous constructs have positive and significant direct effects.
Specifically, the most substantial effect is on Strategic Integration → CEP (β=0.63,
t=21.43), then Strategic Integration → COP (β=0.43, t=10.12), and finally, Strategic

188
Integration → CCP (β=0.30, t=6.45). In constrast, Strategic Integration → CFP has the
weakest effect and is also insignificant (β=0.01, t=0.26).
Table 5.8: Direct Effects of Model 1
Path Direct Effect SD t-value p-value* Significant?
Strategic Integration → CCP 0.30 [0.21, 0.39] 0.05 6.45 0.00 Yes
Strategic Integration → CEP 0.63 [0.57, 0.69] 0.03 21.43 0.00 Yes
Strategic Integration → CFP 0.01 [-0.06, 0.08] 0.04 0.26 0.79 No
Strategic Integration → COP 0.43 [0.35, 0.52] 0.04 10.12 0.00 Yes
CCP → CFP 0.25 [0.15, 0.35] 0.05 4.85 0.00 Yes
CEP → CFP 0.30 [0.17, 0.44] 0.07 4.38 0.00 Yes
COP → CFP 0.35 [0.24, 0.46] 0.06 6.31 0.00 Yes
Note: *p < 0.05 (two-tailed t-test for significance testing above 1.96). The values in brackets represent the 95%
bias-corrected and accelerated confidence interval of the path coefficients obtained by running the bootstrapping
routine with 5,000 samples in SmartPLS.
2. Mediating Effect in Strategic Integration
To gain a comprehensive understanding of the role of stakeholders in CSR-CFP
relationships, there are new relationships among CP, which mediates the direct relationship
from Strategic Integration to CFP (see Figure 5.1). The effect of the independent variable,
Strategic Integration, on the dependent variable (CFP), is mediated by three mediators, CCP,
CEP, and COP (Nitzl, Roldan & Cepeda 2016).
The mediating effect testing covers two steps: (a) testing the strength of the indirect effect
and (b) determining the type of effect and/or of mediation (Nitzl, Roldan & Cepeda 2016).
A discussion of each step is presented below.
▪ Step a. Testing the strength of the indirect effect. In PLS-SEM analysis, particularly using
SmartPLS 3, bootstrapping can provide the indirect (mediating) and total effects based
on the bootstrap estimates for the direct relationships (Hair et al. 2017; Streukens &
Leroi-Werelds 2016). The benefits of SmartPLS for mediation are that bootstrapping
requires no assumptions about the distribution of the variables or sampling distribution,
and all mediated relationships are evaluated simultaneously rather than separately,
reducing bias (Hair et al. 2014).

189
As shown in Table 5.9, HOC Strategic Integration has a positive and significant direct
effect on three mediators (X → M or a), indicating that a differed from zero (Baron &
Kenny 1986). The result also shows that the three mediators have a positive and
significant direct effect on the dependent variable (i.e., CFP) (M → Y or b) (Baron &
Kenny 1986; Judd 2010). The most substantial path coefficient belongs to COP → CFP
(β=0.35, t=6.31), followed by CEP → CFP (β=0.30, t=4.38), and last, CCP → CFP
(β=0.25, t=4.85). The result indicates positive and significant b (Baron & Kenny 1986),
and both paths (a and b) have an indirect effect. For example, the indirect effect of CEP
(ab) was significant at 0.63*0.30 = 0.19 (t=4.38, p<0.05). Table 5.9 shows three specific
indirect effects. They satisfy the main criterion for determining mediation because they
are significantly different from zero (Baron & Kenny 1986; Nitzl, Roldan & Cepeda
2016) and their confidence interval does not include zero (Hair et al. 2017).
Table 5.9: Specific Indirect Effects of Model 1
Path Specific
indirect effect* SD t-value p-value Significant?
Strategic Integration → CCP → CFP 0.08 [0.04; 0.12] 0.02 3.94 0.00 Yes
Strategic Integration → CEP → CFP 0.19 [0.11; 0.28] 0.04 4.38 0.00 Yes
Strategic Integration → COP → CFP 0.15 [0.10; 0.20] 0.03 5.82 0.00 Yes
*Note: The values in brackets represent the 95% bias-corrected and accelerated confidence interval of the path
coefficients obtained by running the bootstrapping routine with 5,000 samples in SmartPLS.
Moreover, since Model 1 has multiple mediation, the total indirect effect may comprise
several specific indirect effects (Hair et al. 2017). The result reveals the total indirect
effects from Strategic Integration to CFP as the sum of three specific indirect effects
(β=0.42, t=10.62). The total effects refer to the sum of direct and indirect effects
(symbolised by c’) between constructs in the path model (Sarstedt, Ringle & Hair 2017).
The estimation of total effects offers a more comprehensive view of the structural model
relationships (Nitzl, Roldan & Cepeda 2016). The total effect of X on Y is equal to the

190
sum of the indirect and direct effects (Hair et al. 2017). Consequently, total effects for
the relationship between Strategic Integration and CFP are calculated as follows:
Direct effect of Strategic Integration → CFP (c) = 0.01
Total indirect effect of Strategic Integration → CFP (ab) = 0.42
Total effect (c’) = direct effet (c) + indirect effects (ab)
Thus, total effect of Strategic Integration → CFP = 0.01 + 0.42 = 0.43
Table 5.10 displays the direct, indirect and total effects of Model 1. The total effect is
different from the direct effect. More specifically, the direct effect from Strategic
Integration to CFP is small and insignificant (β=0.01, t=0.26). But, its total effect is
greater, positive and significant (β=0.43, t=10.12). The result reveals that three mediators
(CCP, CEP and COP) can affect the dependent variable (CFP) controlling independent
variables (HOC Strategic Integration) for direct effect (Baron & Kenny 1986).
Table 5.10: Direct Effects, Indirect Effects and Total Effects of Model 1
Path Direct Effect
(a)
Direct Effect
(b)
Indirect Effect
(ab)
Total Effect
(c’)
t-
value
p-
value
Strategic Integration → CCP → CFP 0.08
[0.04; 0.12] 3.94 0.00
Strategic Integration → CCP 0.30
[0.21, 0.39] 6.45 0.00
CCP → CFP 0.25
[0.15, 0.35] 4.85 0.00
Strategic Integration → CEP → CFP 0.19
[0.11; 0.28] 4.38 0.00
Strategic Integration → CEP 0.63
[0.57; 0.69] 21.17 0.00
CEP → CFP 0.30
[0.17, 0.44] 4.38 0.00
Strategic Integration → COP → CFP 0.15
[0.10; 0.20] 5.82 0.00
Strategic Integration → COP 0.43
[0.35; 0.52] 10.12 0.00
COP → CFP 0.35
[0.24, 0.46] 6.31 0.00
Strategic Integration → CFP 0.01
[-0.06, 0.08] 0.26 0.79
Strategic Integration → CFP 0.42
[0.38; 0.53] 10.62 0.00
Strategic Integration → CFP 0.43
[0.35; 0.50] 11.38 0.00

191
▪ Step b. Determining the type of effect and/or of mediation. The role of the mediator is to
expose the true relationship between exogenous and endogenous constructs (Hair et al.
2017). The result shows that mediators can make significant changes to the insignificant
relationship between Strategic Integration and CFP. Since the indirect effect is significant
but not the direct effect is not, it represents an indirect-only (full) mediation type (Hair
et al. 2017). In other words, the effect of Strategic Integration to CFP is completely
transmitted with help of the mediators (Nitzl, Roldan & Cepeda 2016). Strategic
Integration releases its influence only under certain conditions of CCP, CEP and COP,
on CFP. When CCP, CEP and COP do not mediate the relationship between two
constructs, Strategic Integration has no significant effect on CFP.
After calculating the mediating effects, the strengths of specific mediating effects should
be tested (Nitzl, Roldan & Cepeda 2016) by measuring variance accounted for (VAF)
(Nitzl, Roldan & Cepeda 2016; Wong 2016). VAF determines the extent to which the
mediation process explains the dependent variable’s variance (Nitzl, Roldan & Cepeda
2016) calculated by dividing indirect effect (axb) with the total effect (axbxc’). When
VAF is above the threshold level of 0.2, partial mediation is demonstrated, and full
mediation is expressed when it excedes 0.8 (Hair et al. 2017).
Table 5.11 presents the VAF values in the range from 0.19 to 0.44. As CCP has a VAF
value of 18.60%, the result implies that a part of the total effect of strategic integration
on CFP is explained by the indirect effect of CCP. CEP’s VAF value is 44.19%,
indicating that the indirect effect of CEP explains almost half of the total effect of
Strategic Integration on CFP. Similarly, COP has a VAF value of 34.88%, suggesting
that a part of the total effect of Strategic Integration on CFP is explained by COP’s
indirect effect. Specifically, these are complementary partial mediations, because the

192
total effect (c’) and indirect effect a×b point in the same (positive) direction (Baron &
Kenny 1986).
Table 5.11: VAF of Mediation Effect of Model 1
Path Direct Effect
(a)
Direct Effect
(b)
Indirect Effect
(a x b)
Total
Effect
VAF
(%)
Strategic Integration → CCP → CFP 0.30 0.25 0.08 0.43 18.60
Strategic Integration → CEP → CFP 0.63 0.30 0.19 0.43 44.19
Strategic Integration → COP → CFP 0.43 0.35 0.15 0.43 34.88
If a variable has a function as a partial mediation of the relationship between variables, there
is yet another mediator that can be investigated in the relationship (Baron & Kenny 1986).
The results confirm this statement, as there are three partial mediations in Model 1 (i.e., the
multiple mediations). They show that part of the effect of HOC Strategic Integration on CFP
is mediated through CCP (or CEP or COP), because this HOC explains part of CFP, which
is independent of CCP (and CEP as well as COP) (Nitzl, Roldan & Cepeda 2016). A total
VAF value of 97.67% indicates that almost all of the total effect of strategic integration onto
CFP is explained by the indirect effects from CCP, CEP and COP. Because of the multiple
mediation, these three mediators have an indirect-only and full mediation on the relationship
between HOC Strategic Integration and CFP.
To sum up, the results from the structural model assessment of Model 1 show that Strategic
Integration has a positive and significant impact on CP. More specifically, Strategic Integration
has a substantial impact on CCP, CEP and COP, while its impact on CFP is significantly
mediated by CCP, CEP and COP. Notably, among the three mediators, CEP has the greatest
mediating effect on the strategic CSR integration-CFP relationship, followed by COP and CCP.
3.2.3 Assessment of the Coefficient of Determination (R2) in Strategic Integration
This section explains how to check the coefficient of determination in strategic integration.
In addition to determining the significance of all path predictions, an important focus in the
PLS-SEM analysis is explained variance. As PLS-SEM attempts to find the greatest variance

193
explained by the dependent variables, the predictive power of the structural model is evaluated
by assessing the significance and magnitude of the coefficient of determination (R2) of the
endogenous constructs (Chin 2010; Hair et al. 2014; Peng & Lai 2012; Streukens & Leroi-
Werelds 2016). As the primary criterion structural (inner) model assessment (Henseler, Ringle
& Sinkovics 2009), the R2 is defined as ‘a measure of the model’s predictive power and is
calculated as the squared correlation between a specific endogenous construct’s actual and
predicted values’ (Hair et al. 2017, p. 198). The R2 can also be used to determine the goodness
of fit of a model (Gallardo-Vázquez & Sanchez-Hernandez 2014).
The range of R2 value is between zero and one, with higher values suggesting higher levels
of predictive accuracy (Hair et al. 2017) and indicating the greater the percentage of variance
explained (Götz, Liehr-Gobbers & Krafft 2010). The desirable values should be 0.1 or greater
(Falk & Miller 1992, cited in Bernal-Conesa, de Nieves-Nieto & Briones-Peñalver 2017). R2
values of 0.75, 0.50, or 0.25 are substantial, moderate or weak levels, respectively (Hair, Ringle
& Sarstedt 2011; Henseler, Ringle & Sinkovics 2009) or small, medium, or large effects,
respectively (Chin 2010) in relation to predictive accuracy.
Table 5.12 presents R2 values between 0.09 and 0.65, showing a predictive capability to
varying degrees. CFP is the largest predictor of the structural model with an R2 value of 0.65.
In other words, HOC Strategic Integration, CCP, CEP, and COP can jointly explain 65% of the
variance of the endogenous construct CFP. Therefore, CFP’s impact can be explained by HOC
Strategic Integration but also from three mediators (see Figure 5.1).
Table 5.12: R2 and Q2 values of Model 1
Endogenous Construct R2 value Q2 value
CCP 0.09 0.06
CEP 0.40 0.24
CFP 0.65 0.37
COP 0.19 0.10
Strategic Integration 1.00 0.58

194
Given the predictor specification forms the basis for PLS modelling (Chin 2010), and the
greater the number of predictor constructs, the higher the R2 (Hair, Risher, et al. 2018), this
construct has the highest R2 value. The same model estimation also reveals the R2 value for
another latent construct; Strategic Integration explains 40% of CEP, 19% of COP and nine%
of CCP. Hence, the R2 value for CEP can be considered moderate, whereas R2 values of COP
and CCP are rather weak. Notably, as LOCs Aligning, SuppTM, and EffCom form HOC
Strategic Integration, they explain 100% the variance of their HOC with R2 values of one
(Becker, Klein & Wetzels 2012; Hair et al. 2017; Hair, Sarstedt, et al. 2018).
5.3.2.4 Assessment of the Effect Size (f2) in Strategic Integration
This subsection presents the next step of structural model assessment in strategic integration,
checking the effect size. The effect size (f2) is measured to quantify significant effects
(Henseler, Ray & Hubona 2016). An f2 value of 0.02, 0.15, and 0.35 represent small, medium,
and large effects of the exogenous latent variable, respectively (Chin 2010; Cohen 1992), while
an f2 value of less than 0.02 indicates no effect (Hair et al. 2017).
Table 5.13 shows the range of f2 values from 0.00 to 0.65. The strongest effect size is
Strategic Integration → CEP (0.65). A medium-to-large effect is seen for Strategic Integration
→ COP (0.23), while a medium effect size occurs for COP → CFP (0.14). A weak effect size
relies on Strategic Integration → CCP, CCP → CFP, and CEP → CFP with an f2 value of 0.10,
0.09, and 0.08, respectively. Strategic Integration has no effect size on CFP as its f2 value is
less than 0.02 (Sarstedt, Ringle & Hair 2017). The rank order of the size of the path coefficients
and the f2 effect sizes is often the same (Hair, Risher, et al. 2018). As shown in Tables 5.10 and
5.13, the sequence of both parameters is Strategic Integration → CEP (β=0.63, f2=0.65),
followed by Strategic Integration → COP (β=0.43, f2=0.23), and Strategic Integration → CCP
(β=0.30, f2=0.10).

195
Table 5.13: f2 Values of Model 1
Path f2 value
Strategic Integration → CCP 0.10
Strategic Integration → CEP 0.65
Strategic Integration → CFP 0.00
Strategic Integration → COP 0.23
CCP → CFP 0.09
CEP → CFP 0.08
5.3.2.5 Assessment of the Predictive Relevance (Q2) in Strategic Integration
This subsection describes how predictive relevance is tested in strategic integration. The
structural model’s predictability can be further assessed using the cross-validated redundancy
measure Q2 (Stone 1974, Geisser 1974, cited in Henseler, Ringle & Sinkovics 2009; Shmueli
et al. 2016). A Q2 value is obtained by employing the blindfolding procedure applicable to
endogenous constructs, which have a reflective measurement (Hair et al. 2017; Henseler,
Ringle & Sinkovics 2009). A Q2 value above zero signifies the model has predictive relevance
for a particular endogenous construct (Hair et al. 2017), while a Q2 value below zero implies a
lack of predictive relevance (Chin 2010). As a rule of thumb, Q2 values of 0, 0.25 and 0.50
illustrate the small, medium and large predictive relevance of the PLS-path model (Hair,
Risher, et al. 2018).
Using an omission distance D=7 (Hair et al. 2017), the blindfolding procedure reveals the
Q2 values in Table 5.12. The resulting cross-validated redundancy positive Q2 values range
from 0.06 and 0.58. As the Q2 value above 0.5 is generally indicative of a predictive model
(Chin 2010), the result suggests that the exogenous construct (HOC Strategic Integration) has
excellent predictive relevance for all four endogenous constructs of CP.
5.3.2.6 Assessment of Effect Size (q2) in Strategic Integration
The final step of the structural model assessment, effect size evaluation, is explained in this
subsection. Another criterion of the structural model assessment is the effect size, q2, which
enables measurement of an exogenous construct’s contribution to an endogenous latent

196
variable’s Q2 value. A small, medium, or large predictive relevance for an exogenous construct
for a certain endogenous construct is reflected by q2 values of 0.02, 0.05, and 0.35, respectively
(Hair et al. 2017). As suggested by Hair et al. (2017) , q2 is determined manually by using the
Q2 values included and excluded after extracting a particular predecessor of the latent
endogenous variable estimated by the blindfolding procedure, with this formula:
q2 = [Q2 (included) – Q2 (excluded)] / 1 – Q2 (included) (Hair et al. 2017, p. 207)
Table 5.14 presents results for the q2 calculation, where the endogenous constructs are in
the first row, and the predictor constructs appear in the first column. Because Model 1 applies
HCM, and HOC Strategic Integration is the only predecessor for CP, q2 cannot be identified
between predictor constructs and the four endogenous constructs. These three LOCs have q2
values of 0.05, 0.06 and 0.05, respectively, indicating a small-to-medium predictive relevance
from LOCs to their HOC.
Table 5.14: q2 Values of Model 1
Endogenous Construct Aligning SuppTM EffCom
CCP 0.00 0.00 0.00
CEP 0.00 0.00 0.00
CFP 0.00 0.00 0.00
COP 0.00 0.00 0.00
Strategic Integration 0.05 0.06 0.05
Finally, the standardized root mean square residual value (SRMR) for the structural model
is less than 0.08 (0.07 for Model 1), suggesting a good model fit (Benitez et al. 2020; Hair et
al. 2017; Sarstedt, Ringle & Hair 2017). Therefore, in general, this result indicates that the
proposed Model 1 is well suited to exploring the integration of CSR into business strategy at
the strategic level and predicting the impact of the integration on CP among manufacturing
companies, particularly in Indonesia.

197
5.4 Discussion of Strategic Integration
The results of the strategic integration analysis are discussed in this section. The discussion
is based on theoretical framework and hypotheses explained in Chapter 3, as well as current
literature, prior research findings, and PLS-SEM data analysis. This section is divided into two
subsections, each of which describes (i) strategic integration and company performance
discussion and (ii) the mediating effect in strategic integration.
5.4.1 Discussion of Strategic Integration and Company Performance
This subsection explains the results of strategic integration and company performance
analysis. The empirical evidence provides support for the conceptualisation of strategic CSR
integration as a HOC consisting of the three correlated LOCs: aligning with the company’s
strategy, gaining support from top management, and developing effective communication. As
these three LOCs have almost equal weight for developing of the HOC Strategic Integration,
they should be implemented in the integration of CSR into business strategy at the strategic
level. The results of reflective and formative measurement model assessments show that the
alignment of these LOCs reflects a complete description of strategic CSR integration as each
LOC encompasses different aspects of such integration. The assessments of structural models
have been satisfactorily achieved and confirm the model’s good fit. Results show that the
proposed model is appropriate and applicable for exploring the integration of CSR at the
strategic level and predicting its impact on CP, especially in the Indonesian manufacturing
industry.
The relationship between strategic integration and CP was examined with some specific
hypotheses. The direction and strength of each hypothesised relationship is determined based
on the path coefficients and their corresponding t-values resulting from PLS-SEM data
analysis. If paths are significant and show the hypothesised direction, they empirically support
a prior hypothesis. In comparison, if the paths are insignificant and do not follow the

198
hypothesised direction, they do not support the relationship proposed (Götz, Liehr-Gobbers &
Krafft 2010).
▪ Hypothesis 1a (H1a): The strategic integration of CSR and business strategy has a
positive impact on customer performance.
The finding reveals that strategic integration has a significant impact on customer
performance (β=0.30, t=6.45, p<0.05), supporting H1a. Customer performance in Model 1
consists of customer satisfaction, customer loyalty, and increasing number of consumers. The
finding suggests that CSR integration into business strategy at the strategic level has a positive
and significant impact on customer performance by increasing customer satisfaction,
enhancing customer loyalty, and generating more consumers.
The finding is supported by previous studies, which indicates that CSR would have an
immense effect on the perceptions and attitudes of customers towards companies and the goods
they manufacture (Nguyen P-M 2020). CSR has a positive effect on customer satisfaction, as
such CSR activities help to boost customer satisfaction (García-Madariaga & Rodríguez-
Rivera 2017) and offer benefits to customers, such as decreased customer complaints, enhanced
customer service, strengthened customer relationships and improved customer loyalty (Chi
2015).
▪ Hypothesis 1b (H1b): The strategic integration of CSR and business strategy has a
positive impact on employee performance.
Findings reveal that strategic integration has a significant effect on employee performance
(β=0.63, t=21.43, p<0.05), supporting H1b. The result also shows that the effect of strategic
integration is primarily on employee performance. There are four indicators for measuring
employee performance: employee training, career opportunity, employee motivation and
overall social performance. By integrating CSR into business strategy at the strategic level,

199
companies can provide appropriate training for their employees, offering them good career
opportunities, and thus, increase employee motivation and improve overall social performance.
In Model 1, aligning CSR with a company’s strategy is a critical dimension of strategic
integration. Companies should incorporate their ethical CSR initiatives, such as commitment
to fair treatment of employees and environmentally friendly manufacturing procedures, into
their corporate mission, vision, and values (Chen, Hong & Occa 2019). Moreover, developing
effective communication is a critical dimension of strategic integration. Because appropriate
communication can boost employees’ understanding of CSR (Hadj 2020), a company’s
mission, vision and values should be effectively communicated to employees using various
corporate communications channels as well as through activities and initiatives during which
employees can contribute ideas and participate. Otherwise, CSR efforts could result in
employees’ scepticism (Chen, Hong & Occa 2019).
Previous studies argue that in addition to customers, employees also show their perception
to CSR practices by their companies. Employees are satisfied with and enjoy working for
companies with a high commitment to CSR. These employees tend to be more optimistic, loyal
and productive than those who work for employers with lower commitment to CSR (Dey &
Sircar 2012). CSR practices also have the ability to increase employee motivation and improve
employee perceptions of their companies (Dawkins 2005) and boost employee loyalty, which,
in turn, helps to maintain high quality employees (Shen, Au & Li 2019). Additionally, CSR
helps companies to promote their stakeholders (e.g., employees who give the company a 'good'
image) (Arjaliès & Mundy 2013).
Nonetheless, the findings are not supported by a prior study of Ridho (2018), which found
that CSR implementation has no significant effect on customer performance in terms of growth
in sales and employee performance, as measured by growth in the number of employees.

200
▪ Hypothesis 1c (H1c): The strategic integration of CSR and business strategy has a positive
impact on operational performance.
Strategic CSR integration is found to have a positive and significant impact on operational
performance (β=0.43, t=10.12, p<0.05), supporting H1c. Although the activities included in
the three dimensions of strategic CSR integration are not directly related to business operational
activities, they have an impact on operational performance, such as shortened timeline of
customer service (from order to receipt), faster delivery time, increased productivity and
improved operational efficiency.
There is a plausible explanation for this finding. As several related CSR activities have been
defined at the strategic level, they become a guide for implementation at the lower levels,
including the tactical level. In particular, they are incorporated with the vision and mission of
the company, have support from top management and are communicated throughout the
organisation. Moreover, several activities (indicators) in strategic CSR integration are related
to employees, such as ‘CSR strategies and goals are clearly communicated to all employees’
and ‘We communicate CSR activities within the company through multiple channels, such as
face-to-face meetings, formal communications from senior managers, and a company
newsletter’. These will indirectly impact operational performance because employees in
socially responsible companies can produce better operational performance than their peers in
less socially responsible companies (Sun & Yu 2015). Therefore, through integrating CSR into
business strategy at the strategic level, companies can improve productivity, increase
operational efficiency, and shorten timelines of customer service and delivery time.
Consequently, the overall operational performance should increase.
However, this finding is different from other studies. For example, in their survey of 197
CSR-practicing companies in Saudi Arabia, Al-Shuaibi (2016) found no significant
relationship between CSR and productivity.

201
▪ Hypothesis 1d (H1d): The strategic integration of CSR and business strategy has a
positive impact on financial performance.
Findings reveals that strategic integration has a significant impact on financial performance
(β=0.43, t=11.38, p<0.05), supporting H1d. In this thesis, financial performance was measured
through cash flow report, profit, sales growth, ROI and overall financial performance. In other
words, companies can have better cash flow reports, higher profits, increased sales growth and
ROI if they integrate CSR into business strategy at the strategic level. It should be noted that
strategic CSR integration has a positive effect on financial performance mediated by other
dimensions of CP, which will be explained in the next subsection (see 5.4.2).
Overall, this finding provides empirical evidence that strategic integration of CSR, non-
financially and financially, benefits companies. When CSR is highly integrated with
management operations, economic and social targets are easier to achieve thereby increasing a
company's social and financial performance (in terms of profitability) (Kapoor & Sandhu
2010). Companies have superior financial performance and sustain financial competitiveness
if they prioritise CSR activities based on strategic concerns and integrate them into business
strategy (Michelon, Boesso & Kumar 2013; Torugsa, O'Donohue & Hecker 2013).
In the Indonesian context, Sayekti (2015) investigated strategic CSR in terms of inside-out
linkages and outside-in linkages among 136 Indonesian-listed companies. Conducting a
content analysis on annual reports between 2005 and 2008, this study found that strategic CSR
positively affect financial performance, as measured by ROA. When CSR practices integrate
with companies operations and strategy, a positive impact on CFP occurs.
Nonetheless, the finding is in contrast with Razafindrambinina and Sabran (2014), who
found that companies in Indonesia do not believe that engaging in CSR will result in long-term
benefit or higher profit. They might be still deeply focused on financial gains rather than moral
obligations, which impede their own awareness of their impact on environment and society. In

202
addition, they may not believe engaging in strategic CSR will boost employee welfare,
strengthen ethics, or improve regulatory decisions.
Although the testing of the first four hypotheses gave rise to results similar to previous
studies, this research offers a comprehensive understanding that strategic CSR integration has
a positive impact on whole of CP. Rather than evaluating the effect of strategic CSR integration
on one performance, this thesis provides clear empirical evidence that this integration has a
simultaneous positive impact on all four aspects of CP (i.e., customer, employee, operating and
financial performance). Thus, companies will gain sustainable competitive advantage and
obtain long-term profitability if they practice CSR strategically (Ooi, Amran & Yeap 2017).
5.4.2 Discussion of Mediating Effect in Strategic Integration
In this section, the results of a mediating effect analysis in strategic integration are discussed.
There are three hypotheses of the mediation analysis in terms of strategic integration as follows.
▪ Hypothesis 4a (H4a): The relationship between strategic CSR integration and financial
performance is mediated by customer performance.
Findings reveal that customer performance has a mediation effect on the relationship
between strategic integration and financial performance (β=0.08, t=3.94, p<0.05), supporting
H4a. In other words, strategic CSR integration can improve financial performance through
customer performance.
There is a plausible explanation for this result. Several studies highlighted that customer
satisfaction (as one indicator of the customer performance in this thesis) can lead to higher
levels of financial performance. For example, Luo and Bhattacharya (2006) found CSR affects
financial performance partially through the mediator of customer satisfaction. Using secondary
data, they confirmed that customer satisfaction plays a significant role and partially mediates
the relationship between CSR and financial performance. With a sample of 205 Iranian

203
manufacturing and consumer product companies, Saeidi et al. (2015) examined whether the
link between CSR and company performance is a fully mediated relationship. They used
customer satisfaction as a mediator with three indicators: customer satisfaction with product or
service quality, customer satisfaction with value for price, and meeting customer expectations.
Company performance was measured financially through market share growth, sales growth,
ROE, ROS, ROA, ROI, and net profit margin of the company. Their findings show that
customer satisfaction mediates the relationship between CSR and financial performance.
Similarly, García-Madariaga and Rodríguez-Rivera (2017) emphasised that customer
satisfaction mediates the relationship between CSR and financial performance measured by
market to book ratio (MB). Taking 238 companies in China and Vietnam as a sample, Xie et
al. (2017) identified that customer satisfaction has a positive impact on financial performance.
Their findings suggest that customer satisfaction fully mediates the relationship between CSR
and financial performance. They found that CSR activities can help companies improve their
financial performance by improving customer satisfaction. Thus, companies can improve the
effect of CSR efforts on companies' financial performance by using the indirect role of
customer satisfaction.
Customer loyalty can also affect financial performance. Customer satisfaction will increase
customer loyalty, and they are more likely to repeat purchases that lead to higher demand,
greater sales volume, and in turn, improved performance levels (Maignan et al. 1999).
Repeating buying behaviour towards the products and services of a company can increase the
company’s profitability and sustainability performance (Aninkan & Oyewole 2014). As a
result, greater customer loyalty will lead to greater financial performance.
Nevertheless, this thesis extends the results of previous studies because this thesis used
multiple indicators of customer performance. In doing so, this thesis provides a deeper
understanding that customer performance can fully mediate the relationship between strategic

204
integration and financial performance through improving customer satisfaction, enhancing
customer loyalty, and increasing number of consumers.
Previous studies highlight that CSR affects financial performance through the mediator of
customer satisfaction (García-Madariaga & Rodríguez-Rivera 2017; Luo & Bhattacharya
2006; Saeidi et al. 2015; Xie et al. 2017). These studies found that CSR activities can help
companies boost their financial performance by enhancing customer satisfaction. Thus,
companies can improve the effect of CSR efforts on companies' financial performance by using
the indirect role of customer satisfaction. A company's CSR commitment encourages greater
satisfaction and trust in the company and its services, which in turn encourages consumers to
remain loyal (Park, Kim & Kwon 2017).
Besides, customer satisfaction can improve customer loyalty. Greater customer loyalty can
lead to greater financial performance as loyal customers tend to repeat buying, leading to
positive word-of-mouth, higher demand, and increased sales volume and in turn, improved
performance levels (Chi & Gursoy 2009; Maignan et al. 1999). Customer loyalty can also
influence customer buying decisions, such as an improving customers’ buying intention or
increasing customers’ willingness to pay higher prices for the companies’ products and services
(Bhardwaj et al. 2018; Goli ´nski 2019).
▪ Hypothesis 4b (H4b): The relationship between strategic CSR integration and financial
performance is mediated by employee performance.
The current finding indicates that the relationship between strategic integration and financial
performance can be mediated by employee performance (β=0.19, t=4.38, p<0.05), supporting
H4b. Among three mediators, employee performance has the largest mediating effect between
strategic CSR integration and financial performance. Accordingly, better financial
performance can be achieved by enhancing employee performance.

205
A high employee performance may indicate that employees have access to appropriate
training, a good career path is available in their companies, and they are motivated strongly in
their workplaces (Maignan et al. 1999). These benefits are useful to increase efficiencies and
productivity and thus in turn may improve performance levels. Hence, this finding strengthens
a claim that there is the positive relationship between social and economic performance (Lee
2008) as confirmed by Bernal-Conesa, de Nieves-Nieto and Briones-Peñalver (2017).
▪ Hypothesis 4c (H4c): The relationship between strategic CSR integration and financial
performance is mediated by operational performance.
Operational performance has a significant mediating effect on the relationship between
strategic operations and financial performance (β=0.15, t=5.82, p<0.05), supporting H4c. This
finding suggests that companies can achieve better financial performance through operational
performance as a result of integrating CSR into business strategy at the strategy level.
Investigation of the CRS impact in relation to social performance is relevant when analysing
the mechanism by which CSR affects financial performance. The findings of this thesis thus
enhance the CSR literature by identifying a new contingency, which explains the complex
relationship between CSR integration and financial performance. The satisfaction of various
stakeholder groups (including customers and employees) is critical to an organisation's
financial performance (Orlitzky, Schmidt & Rynes 2003). This thesis expands previous studies
on the mechanisms for the CSR-CFP relationship by integrating the mediating effect of
customer, employee and operational performance along the path from strategic CSR integration
to financial performance. Strategic CSR integration affects customer performance, and in turn
customer performance leads to financial performance. Similarly, strategic CSR integration has
a significant effect on employee performance, and then employee performance influences
financial performance. In addition, strategic CSR integration contributes to operational
performance, which in turn impacts financial performance.

206
Notably, strategic CSR integration can represent the commitment of companies to CSR by
aligning CSR with the strategy of the organisation, receiving support from top management
and maintaining effective communication. Many companies in Indonesia adopt CSR in
charitable activities and corporate philanthropy (Joseph et al. 2016; Maulamin 2017;
Razafindrambinina & Sabran 2014; Widjaja 2011), and the current findings show that they
implement CSR beyond these practices. They reflect that the integration of CSR into business
strategy should occur to achieve efficient corporate social strategies (Sousa Filho et al. 2010).
In addition, there is an increasing number of companies that display their CSR activities in
their official corporate websites or via mainstream media news, such as television and
newspapers (Widjaja 2011). They use these communication methods to inform their
stakeholders how they do CSR, which can inspire other companies to perform CSR. Because
of effective communication, the concept of CSR therefore becomes familiar, and companies’
awareness of CSR grows. In addition, CSR awards are becoming a trend that also motivates
companies to implement CSR more seriously and transparently.
The finding aligns with stakeholder theory, which suggests that stakeholders should be
satisfied with a company’s CSR before positive financial performance can be realised. The
findings also confirm that stakeholder theory supports positive CSR-CFP relationships (Wang,
Dou & Jia 2016). Maintaining good relationships with key stakeholders tends to lead to
increased financial returns for these stakeholders, because they help in the development of
valuable intangible assets in companies that can be a source of competitive advantage
(Chtourou & Triki 2017). When executives and managers use a company's CSR resources in a
strategic manner to pursue social goals favoured by the stakeholders of the company, CP
(evaluated in terms of profitability) is likely to improve (Michelon, Boesso & Kumar 2013).
Consequently, CSR activities incorporated as part of a company’s strategy will increase that
company’s financial performance, and at the same time, fulfil the company’s social

207
responsibility to its stakeholders (Sayekti 2015). Furthermore, effective management of
stakeholders not only helps a company achieve superior financial performance, but also helps
maintain it over time (Choi & Wang 2009; Michelon, Boesso & Kumar 2013). The company’s
ability to create sustainable shareholder value (financial performance) over the long term
depends on its interaction with its various stakeholders (Post, Preston & Sachs 2002).
The findings of this study are in line with a prior study by Yuen et al. (2018), which argued
that stakeholders (e.g., customers and employees) need to be satisfied with a company’s CSR
activities before positive financial performance can be achieved.
In general, the results provide empirical evidence for Baron's argument that a non-market
strategy (i.e., CSR) does not produce direct benefits but derives its return from the improvement
created by business strategy. While the return to a non-market strategy benefits from its effect
on a company's performance in the markets where it operates, the interrelationship between
market and non-market strategies is a key point in integrating the two components of the
strategy (Baron 1997).
5.5 The Moderating Effect in Strategic Integration
This section presents how to assess moderating effect in strategic integration. Specifically,
it explains the moderating effect analysis for business strategy, CSR strategy, company size,
and industry type.
After evaluating the direct and mediating effects, this thesis used MGA to examine a
moderating effect to gain a more complete picture of the relationship between strategic CSR
integration and CP. The information for segmenting variables was obtained from answers from
demographic questions in the questionnaire. In addition to the observed data, such as company
size and industry type as control variables, this thesis also used unobserved data to investigate
whether there are different effects on strategic integration. In doing so, this thesis used business
strategy and CSR strategy measured using a five-point scale. Because MGA of the unobserved

208
data (i.e., business and CSR strategy) is more complex and involves several steps, they are
explained first. Then, MGA of the observed data using company size and industry type is
presented.
5.5.1 MGA Business Strategy in Strategic Integration
How to conduct MGA for business strategy in strategic integration is described in this
subsection. It comprises factor analysis, cluster analysis, and MGA assessment of business
strategy. Business strategy is measured following the typology from Porter (1985), which
consists of cost leadership and differentiation. Business strategy can be considered a continuous
moderator measured with multiple items (Hair et al. 2017); thus, it should first be converted
into a categorical variable by performing factor analysis and cluster analysis.
5.5.1.1 Factor Analysis of Business Strategy
This subsection explains how to conduct a factor analysis for business strategy and how to
interpret the results. To ensure which items can be implemented in this thesis, particularly in
the context of the Indonesian manufacturing industry, factor analysis is employed for variables
of business strategy to determine if any underlying dimensions should be used in the following
analysis (Churchill 1979). Using a ratio 10:1 or 20:1 (Hair et al. 2010; Sarstedt & Mooi 2014),
there should be 100 or 200 observations for 10 variables. Accordingly, the 435 responses
collected in this thesis are appropriate for conducting factor analysis; 300 is typically viewed
as a large enough sample size for this purpose (Comrey & Lee 1992, cited in Field 2009;
Tabachnick & Fidell 2006).
Because 10 items of business strategy use the same scale, factor analysis is employed using
the original data without standardising across items (Hair et al. 2010). The commonly accepted
‘eigenvalues greater than one’ rule and comparing the scree plot are employed to determine the
number of factors to retain (Fabrigar et al. 1999; Field 2009; Hair et al. 2010; Sarstedt & Mooi

209
2014). The first run of PCA generates two factors with a total variance of 54.59% (see
Appendix B.6 for details). To enhance the interpretability of the results (Sarstedt & Mooi 2014)
as well as to clarify and reveal the presence of simple structure, Varimax rotation is conducted.
In addition to being the most common choice (Anna & Jason 2005), Varimax is generally
considered the best orthogonal rotation (Fabrigar et al. 1999).
Loading above 0.6 is usually considered high, and those below 0.4 are low (Kakkar & Narag
2007, cited in Moonsamy & Singh 2014). Ten items of business strategy have loading more
than 0.4. However, two cross-loading items, which load at 0.32 or higher on two factors
(Tabachnick & Fidell 2006), are eliminated (Hair et al. 2010): BS03 and BS09. The PCA is
rerun and reveals KMO of 0.84 and Bartlett’s Test of Sphericity of 883.35, significant at the
0.00 level. With eight items remaining, PCA results in two factors, yielding a cumulative total
variance of 56.72%. Table 5.15 exhibits the rotated factor loadings, communalities, and
percentage of variance explained by each factor. The communalities are between 0.47 and 0.72,
suggesting that the two factors explain an acceptable amount of the variance in each of the
items; and 56.72% of the total variance suggests there is little more information to be explained.
Although one item (BS04) has communality of 0.47, slightly less than 0.50, that item is retained
as its loading is above 0.50 (Hair et al. 2010).

210
Table 5.15: Factor and Items of Business Strategy
Code Item Factor loadinga
Communalities Factor 1 Factor 2
BS04 Innovation in manufacturing process 0.59 0.47
BS06 Developing brand identification 0.73 0.56
BS07 Having cooperative and supportive channels of distribution 0.61 0.53
BS08 Creating new product development 0.74 0.55
BS10 Innovation in marketing techniques and methods (e.g.,
public relations, sales promotion, direct marketing)
0.73 0.55
BS01 Pursuing operating efficiency 0.84 0.72
BS02 Controlling the product quality 0.76 0.62
BS05 Emphasis on the efficiency of securing raw materials or
components (e.g., bargaining down the purchase price)
0.70 0.53
Mean 4.18 4.51
Standard deviation 0.77 0.67
Cronbach’s alpha 0.76 0.70
Total
Sum of squared loadings (eigenvalue) 3.41 1.13 4.54
% of variance 42.59 14.13 56.72
Note: aFactor loadings less than 0.40 were excluded to improve readability.
Next, reliability of the items scale is checked to validate the questionnaire. Reliability
indicates that a questionnaire consistently reflects the construct that is being measured (Field
2009). The alpha coefficients from the summated scales suggested by the two factors are 0.76
(Factor 1) and 0.70 (Factor 2), which are above the recommended threshold of 0.70 (Hair et al.
2010), indicating that both factors are sufficiently reliable for further analysis. These two
factors have item loadings above 0.60, greater than 0.50, as considered necessary for practical
significance (Hair et al. 2010). However, one item (BS04) has a loading of 0.59, slightly below
0.6. There is no cross-loadings item, and no factors with fewer than three items, suggesting the
best fit to the data (Anna & Jason 2005). Accordingly, the two-factor solution is accepted. The
first factor is composed of items that refer to differentiation strategy, and the second factor
consists of items that relate to cost leadership strategy. Moreover, the two factors are
appropriate according to typology from Porter (1985).
As Varimax (orthogonal) rotation was used and factor scores represent all items loading on
the factor (Hair et al. 2010; Sarstedt & Mooi 2014), it is appropriate to use the scores obtained

211
for each respondent calculated against the two factors identified above. These factor scores are
used as a basis for the subsequent cluster analysis (Field 2009; Sarstedt & Mooi 2014).
5.5.1.2 Cluster Analysis of Business Strategy
How to conduct a cluster analysis for business strategy and how to interpret the results are
presented in this subsection. Clusters analysis is a convenient way to classify homogeneous
object groups known as clusters (Sarstedt & Mooi 2014), and it addresses the similarities or
differences among the examined object (Majerova 2017). Through cluster analysis,
respondents are classified into clusters so that respondents in the same cluster are more similar
to each other than respondents in other clusters (Hair et al. 2010).
Based on the factor scores obtained, the sample of respondents is clustered into different
meaningful groups, which were used as clustering variables. Prior to doing so, the different
variables used for clustering are confirmed not to have substantial collinearity, which would
bias the analysis (Hair et al. 2010). As displayed in Appendix B.7, the tolerance value of seven
items is above 0.10, and their VIF values are below 3.0, significantly less than the
recommended cut-off value of 10 (Hair et al. 2010). Thus, these results indicate the absence of
collinearity.
To gain the benefits of hierarchical and non-hierarchical clustering methods, this thesis
employs both methods sequentially (Hair et al. 2010). In the first step, hierarchical clustering
is used to determine the possible cluster solution and the appropriate number of clusters. An
agglomerative hierarchical clustering method with Ward’s algorithm and a squared Euclidean
distance measure is employed to generate the initial cluster subtypes. A commonly used
method in hierarchical clustering (Sarstedt & Mooi 2014), Ward’s method is considered
suitable because it relies on minimisation of heterogeneity to find the greatest similarity
(Majerova 2017) and is more likely to generate clusters with an approximately equal number
of responses (Hair et al. 2010; Sarstedt & Mooi 2014). The agglomeration coefficient was used

212
to determine the cluster number by examining incremental changes in the coefficient (Ketchen
& Shook 1996). The larger distances between elements in the data matrix should be associated
with points in different clusters (Milligan & Mahajan 1980). After checking the agglomeration
schedule, a greater coefficient difference (Hair et al. 2010) is found from two to three cluster
(49.82%) than from one to two clusters (37.87%). This suggestion for defining cluster numbers
is then used as initial seed points in the next step, non-hierarchical algorithms (K-means).
In the second step, the resulting outcomes from the hierarchical procedure are input into a
non-hierarchical algorithm (K-means). Table 5.16 displays the results from K-means using
three clusters. Two-factor scores have significant differences among three clusters. Cluster one
consists of 267 respondents with a slightly below-average score for cost leadership (Factor 2)
and an above-average score for the differentiation (factor 1). This implies the tendency for
differentiation strategy. Cluster two involves 154 respondents with an above-average score for
cost leadership, but well-below-average score for the differentiation; thus, it refers to cost
leadership strategy. Cluster three with 14 respondents has a below-average score for
differentiation and well-below-average score for cost leadership. Hence, it can be presumed to
be stuck-in-the-middle companies; that is, companies that do not rely on cost leadership or
differentiation strategies (Nandakumar, Ghobadian & O'Regan 2011).
Table 5.16: K-means Business Strategy with Three Clusters
Cluster Number of cases Regression Score
Factor 1 Factor 2
1 267 0.62 -0.02
2 154 -1.03 0.36
3 14 -0.53 -3.55
ANOVA F 353.75 178.69
5.5.1.3 Demography Characteristics of Business Strategy Clusters
Table 5.17 presents the characteristics of respondents in each cluster of business strategy.
Most respondents are in cluster one (differentiation), which dominate in most main products.
However, in several products, the amount in cluster one and cluster two is almost the same,

213
particularly in paper, coke and refined petroleum products, fabricated metal products,
automotive, and furniture. Because most involve mass production, the companies are more
likely to apply cost leadership strategy since the purpose of this strategy is low-cost products
(Valipour, Birjandi & Honarbakhsh 2012). Companies adopting cost leadership strategy
generally require a high relative market share and serve all major customer groups (Sun & Pan
2011). Interestingly, some of respondents’ companies implement differentiation strategy,
implying that they make some effort to fulfil customers’ needs by producing different or high-
quality products (Galbreath 2009; Porter 1985; Valipour, Birjandi & Honarbakhsh 2012). For
instance, an automotive company offers several types of cars to suit customer requests, such as
convertible, coupe, hatchback, minivan, SUV, and MPV.
As shown in Table 5.17, most respondents in clusters one and two are large manufacturing
companies. This indicates the number of large companies implementing cost leadership is
equivalent to those adopting differentiation. This result is different from other studies that
showed manufacturing companies favour combined strategies (Sharma 2002), and most large
companies use both strategies concurrently, rather than one at a time (Baroto 2012).
The majority of respondents have been operating between 21 and 50 years: 132 in cluster
one and 80 in cluster two, respectively. Private companies dominate the respondents in cluster
one (207 companies) and cluster two (125 companies). Most of respondents’ companies are in
East Java in cluster one (190 companies) and cluster two (122 companies). In cluster one, more
than half of respondents (146) are located inside the industrial area, and the rest (121) are
outside the industrial estate. In cluster two, most respondents (86) are located within the
industrial estate, and 68 respondents are outside the industrial area.

214
Table 5.17: Respondents Characteristics in Each Cluster of Business Strategy
Variable Cluster 1, n=267
(Differentiation)
Cluster 2, n=154
(Cost Leadership)
Cluster 3, n=14
(No Strategy) Total
Main product
food and beverage 71 38 6 115
tobacco 9 2 0 11
textile 17 11 1 29
leather and footwear 5 2 1 8
goods from wood, handicraft 4 1 0 5
paper 12 13 0 25
coke and refined petroleum products 2 2 0 4
chemicals and chemical products 32 15 1 48
pharmaceuticals and medicinal chemical 9 1 1 11
rubber and plastic products 20 15 0 35
non-metallic mineral products 14 7 0 21
basic metals 2 0 0 2
fabricated metal products, excepts machinery
and equipment
22 20 0 42
computers, electronic and optical products 10 0 0 10
machinery and electrical equipment 13 5 2 20
automotive 12 11 1 24
furniture 8 8 1 17
other manufacturing 5 1 0 6
repair and installation of machinery and
equipment
0 2 0 2
Number of employees
small 29 11 4 44
medium 51 37 6 94
large 187 106 4 297
Company’s age (years)
< 5 16 10 4 30
5-10 37 15 1 53
11-20 45 36 5 86
21-50 132 80 2 214
> 50 37 13 2 52
Company’s ownership
state-ownership 4 7 2 13
private 207 125 12 344
multinational company 56 22 0 78
Company’s location
East Java 190 122 12 324
Centre Java & Yogyakarta 17 11 1 29
West Java & Jakarta 60 21 1 82
In industrial estate
yes 146 86 4 236
no 121 68 10 199

215
5.5.1.4 MGA Assessment of Business Strategy in Strategic Integration
This subsection describes the MGA evaluation of business strategy. MGA is carried out
following the recommendations from Matthews (2017). First, the three clusters of business
strategy presented in the previous subsection are described as categorical variables in the
model. Accordingly, there are three pairwise comparisons: differentiation versus cost
leadership, differentiation versus no strategy, and cost leadership versus no strategy. However,
permutation and MGA cannot be conducted between the differentiation and no strategy group
or the cost leadership and no strategy group. This is because the three groups do not have the
equal (or comparable to) sample sizes (Matthews 2017). Besides, the result of SmartPLS 3
indicated that sample size for cluster three was too small (see Appendix B.8 for details). There
should be at least 16 cases or observations for estimating PLS path models regarding the
number of constructs and relationships in the model. Therefore, MGA is conducted for
comparison between the differentiation and cost leadership group.
Second, this thesis employs the MICOM procedure recommended by Henseler, Ringle and
Sarstedt (2016). Since all three procedures of Step 1 are met, configural invariance has been
established (see 4.9.6 for details). Because companies with differentiation strategy are assumed
to have better strategic integration impact on CP than companies adopting cost leadership
strategy, the permutation is run to compare the differentiation and cost leadership group using
one-tailed testing. Table 5.18 displays the results for Step 2 (compositional invariance).
Comparing the correlation between the composite score of the first and second group (original
correlations), the original correlations are equal to 5% quantile correlations (Henseler, Ringle
& Sarstedt 2016). This result is also supported by p-values exceeding 0.05, indicating they are
non-significantly different from 1 (Hair, Sarstedt, et al. 2018). Hence, compositional invariance
is established for all eight constructs.

216
Table 5.18: Step 2 MICOM of Business Strategy in Strategic Integration
Composite Original
Correlation
Correlation
Permutation
Mean
5.0% Permutation
p-Values
Compositional
invariance
established?
Aligning 1.00 1.00 1.00 0.30 Yes
EffCom 1.00 1.00 1.00 0.63 Yes
SuppTM 1.00 1.00 1.00 0.85 Yes
Strategic Integration 1.00 1.00 1.00 0.98 Yes
CCP 1.00 1.00 1.00 0.27 Yes
CEP 1.00 1.00 1.00 1.00 Yes
CFP 1.00 1.00 1.00 0.09 Yes
COP 1.00 1.00 1.00 0.67 Yes
Table 5.19 displays results for Step 3 MICOM of business strategy (equality of composite
mean values and variances). The confidence interval of differences in mean between the
construct score of the first group (differentiation) and second group (cost leadership) does not
include the original difference in mean values. This is supported by permutation p-values for
the mean, which are below 0.05, indicating that there are significant differences in the mean
values of latent variables across the two groups (Hair, Sarstedt, et al. 2018). In contrast, every
confidence interval includes the original difference in variance values. Permutation p-values
for variance for all constructs are also larger than 0.05, indicating that the composite variances
are equal. Accordingly, the results suggest a partial invariance (Matthews 2017) and show
significant differences in the mean values of latent variables across the two groups (Hair,
Sarstedt, et al. 2018).
Table 5.19: Step 3 MICOM of Business Strategy in Strategic Integration
Due to the mediating effect, the total effect is used in the comparison of path coefficients as
presented in Table 5.20. The first two columns show the total effects in group 1

217
(Differentiation) and group 2 (Cost) followed by their differences in the original data set and
permutation testing. Seven paths have different total effects between two groups. Two paths
have a significant difference in total effect: Strategic Integration → CFP and COP → CFP with
p-values of 0.02 and 0.04, respectively. With the confidence level of 10% commonly used in
an exploratory study (Hair et al. 2017), two other paths also indicate the total effect difference:
Strategic Integration → CCP (p=0.08) and CCP → CFP (p=0.10). These results suggest
substantial differences between the two groups, and that the structural model relationship varies
between the two groups (Hair, Sarstedt, et al. 2018).
Table 5.20: Permutation Test of Business Strategy in Strategic Integration
To further analyse group-specific effects, PLS-MGA is run on the data (Hair, Sarstedt, et al.
2018; Henseler, Ringle & Sarstedt 2016) using 5,000 bootstrap samples and the ‘no sign
change’ option (Hair, Sarstedt, et al. 2018). Table 5.21 presents the results for MGA business
strategy, showing several differences of total effects across differentiation and cost leadership
groups. The biggest significant differences rely on Strategic Integration → CFP (total effect
difference=0.18, p=0.02) and COP → CFP (total effect difference=0.21, p=0.03). At the 10%
confidence level, Strategic Integration → CCP (total effect difference=0.14) and CCP → CFP
(total effect difference=0.13) have a significant difference in total effects with p-values of 0.08
and 0.09, respectively.

218
Table 5.21: PLS-MGA Results of Business Strategy in Strategic Integration
Totally, Table 5.22 presents PLS path estimations for the complete sample and subsamples
of business strategy. The significant difference is indicated by the large difference of the total
effect across all samples and subsamples (shown using bold marks in Table 5.22).
Table 5.22: Multi-group Results of Business Strategy in Strategic Integration
Path
All Samples Group 1
(Differentiation)
Group 2
(Cost) Group 1
vs Group 2 N = 435 N = 267 N = 154
β CI β CI β CI p-value
Strategic Integration -> CCP 0.30 0.21-0.39 0.32 0.22-0.41 0.19 0.04-0.31 0.08
Strategic Integration -> CEP 0.63 0.57-0.69 0.62 0.55-0.68 0.57 0.46-0.65 0.21
Strategic Integration -> CFP 0.43 0.35-0.50 0.47 0.39-0.54 0.29 0.15-0.40 0.02
Strategic Integration -> COP 0.43 0.35-0.52 0.44 0.34-0.52 0.34 0.20-0.46 0.16
CCP -> CFP 0.25 0.15-0.35 0.33 0.23-0.42 0.19 0.06-0.32 0.09
CEP -> CFP 0.30 0.17-0.44 0.27 0.15-0.38 0.25 0.09-0.39 0.40
COP -> CFP 0.35 0.24-0.46 0.27 0.17-0.37 0.48 0.32-0.62 0.03
Note: β = path coefficient; CI = 95% confidence intervals.
Following recommendations from Hair, Sarstedt, et al. (2018), parametric and Welch-
Satterthwaite tests should be performed to give greater confidence in the final results obtained.
Table 5.23 presents the results of both tests. Similar to MGA, the results show significant
differences of total effect between the differentiation and cost leadership groups. More
specifically, at the 5% level, Strategic Integration → CFP and COP → CFP has a more
substantial total effect in the differentiation group than in the cost leadership group. At the 10%
confidence level, Strategic Integration → CCP and CCP → CFP has a bigger total effect in the
differentiation group than in the cost leadership group.

219
Table 5.23: Parametric and Welch-Satterthwaite Tests of Business Strategy in Strategic
Integration
To sum up, Table 5.24 displays the PLS multi-group results that indicate no different results
across methods. Permutation and PLS-MGA as non-parametric tests and parametric and
Welch-Satterthwaite tests show similar results.
Table 5.24: PLS Multi-group Results of Business Strategy in Strategic Integration
Path Coefficient Permutation
Test
PLS-MGA
Test
Parametric
Test
Welch-Satterthwaite
Test
Strategic Integration -> CCP X X X X
Strategic Integration -> CEP
Strategic Integration -> CFP X X X X
Strategic Integration -> COP
CCP -> CFP X X X X
CEP -> CFP
COP -> CFP X X X X
5.5.2 MGA CSR Strategy in Strategic Integration
How to conduct MGA for CSR strategy is discussed in this subsection. Similar to business
strategy, it consists of factor and cluster analysis as well as MGA assessment for CSR strategy.
CSR strategy is measured by 20 items adopted from previous studies (Maignan & Ferrell 2000,
2001) (see Table 4.2 for details). Like business strategy, CSR strategy is a continuous
moderator, in that it should be converted to a categorical variable by conducting factor and
cluster analyses.
5.5.2.1 Factor Analysis of CSR Strategy
This subsection shows how to perform a factor analysis of CSR strategy. Factor analysis is
employed to find any underlying dimensions to be used in the following analysis. With 435
responses collected, this sample size is acceptable for conducting factor analysis and there is

220
no need to standardise as the 20 items of CSR strategy are measured with the same scale (Hair
et al. 2010). Using SPSS 26, the first run of PCA generates a KMO value of 0.94, a Barlett’s
Test of Sphericity value of 3.880,25 and is significant at 0.00 (see Appendix B.9 for details).
The result indicates high correlations between items (Field 2009). A measure of sampling
adequacy (MSA) for 20 items is in the range of 0.88 and 0.96, exceeding the minimum
acceptable MSA level of 0.50 (Hair et al. 2010). Item communalities for all items of CSR
strategy are 0.396 to 0.741, considered low to moderate (Velicer & Fava 1998, cited in Anna
& Jason 2005). Although 20 items of CSR strategy have loading of more than 0.40 (Kakkar &
Narag 2007, cited in Moonsamy & Singh 2014), there are three cross-loading items
(Tabachnick & Fidell 2006): CS03, CS05, and CS19. Thus, they are deleted (Hair et al. 2010).
The PCA is rerun to produce a KMO of 0.93 and Bartlett’s Test of Sphericity of 3,163.26
with a significance of 0.00. One item, CS04, has loading less than 0.4 in three factors (cross-
loading); thus, this item is removed. With 16 items remaining, the PCA is rerun and reveals a
KMO of 0.92 and Bartlett’s Test of Sphericity of 2,973.83 with a significance of 0.00. As
shown in Table 5.25, three factors are produced with the cumulative of the total variance of
58.89%. Although the results are different from the previous arrangement that CSR strategy
consists of four dimensions (see 4.4.1.2), ethical and legal responsibilities may be grouped
under a common and specific dimension (Maignan & Ferrell 2000). The communalities range
from 0.40 to 0.79, suggesting that the three factors explain an acceptable amount of the variance
in each of the items, while the percentage of variance explained (58.89%) suggests that there
is little more information to be explained. Although one item (CS06) has a communality of
0.40, less than 0.50, that item remains as it is not a cross-loading item and has a loading above
0.50. All items in those three factors have loadings above 0.50 as considered necessary for
practical significance (Hair et al. 2010).

221
Table 5.25: Factor and Items of CSR Strategy
Code Item
Factor loadinga
Communalities Factor
1
Factor
2
Factor
3
CS06 Internal policies prevent discrimination in
employee’s compensation and promotion.
0.57 0.40
CS07 We seek to comply with all laws regulating hiring
and employee benefits.
0.74 0.59
CS08 All our products meet legal standards. 0.75 0.62
CS09 Our contractual obligations are always honoured. 0.71 0.57
CS10 Managers are informed about relevant
environmental laws.
0.70 0.52
CS11 We have a comprehensive code of conduct. 0.74 0.61
CS12 We are recognised as a trustworthy company. 0.70 0.52
CS13 Fairness toward co-workers and business partners
is an integral part of the employee evaluation
process.
0.66 0.50
CS14 We have a proper procedure for employees to
report any misconduct at work.
0.71 0.63
CS15 Members of our company follow professional
standards.
0.57 0.52
CS16 We give adequate contributions to charities. 0.67 0.56
CS17 We encourage partnerships with local businesses
and schools.
0.75 0.62
CS18 We give a donation for sport and/or cultural
activities.
0.85 0.74
CS20 We encourage employees to join civic
organisations that support our community.
0.77 0.62
CS01 We strive to lower our operating costs. 0.88 0.79
CS02 We closely monitor employees’ productivity. 0.68 0.61
Mean 4.23 3.68 4.24
Standard deviation 0.73 0.94 0.78
Cronbach;s alpha 0.90 0.81 0.56
Total
Sum of squared loadings (eigenvalue) 6.60 1.77 1.05 9.42
% of variance 41.26 11.06 6.57 58.89
Note: aFactor loadings less than 0.40 were excluded to improve readability.
Reliability of the items scale is tested to validate the questionnaire. Reliability measures the
degree of consistency between multiple measurements of a variable (Hair et al. 2010). The aim
is to ascertain that the responses are almost the same across all time periods and that
measurements used at any point in time are reliable (Hair et al. 2010). The alpha coefficients
from the summated scales suggested by the three factors are 0.90, 0.81, and 0.56, respectively,

222
indicating that all factors are sufficiently reliable for further analysis as they exceed the
threshold of 0.70 (Hair et al. 2010). The first factor relates to legal-ethical responsibility, the
second factor refers to philanthropic responsibility, and the third factor refers to economic
responsibility.
Table 5.25 shows that the mean score of economic responsibility is similar to legal ethical
responsibility, assuming that respondents are more aware of those two responsibilities than
philanthropic responsibility, which has the lowest mean score. Three dimensions of CSR
strategy emerging from the factor analysis reveal a multidimensional view of CSR. As a further
step, the scores obtained for each respondent are calculated against the three factors identified
above. These factor scores are used as a basis for the subsequent cluster analysis (Field 2009).
5.5.2.2 Cluster Analysis of CSR Strategy
Following an explanation of CSR strategy factor analysis, this subsection shows how to
conduct a cluster analysis of CSR strategy. Prior to cluster analysis, the different variables used
for clustering are confirmed not to have substantial collinearity to avoid biasing the analysis
(Hair et al. 2010). Appendix B.10 shows the tolerance value of 16 items between 0.44 and 0.81,
above 0.10. Also, their VIF values are between 1.24 and 2.30, below 3.0. Accordingly, the
result indicates the absence of collinearity (Hair et al. 2010).
Similar to business strategy, cluster analysis of CSR strategy is employed using hierarchical
and non-hierarchical clustering methods sequentially (Hair et al. 2010) through the same
procedure. Results of the hierarchical cluster from SPSS identified a larger jump from two to
three clusters (24.53%) than from one to two clusters (22.17%). Then, K-means clustering is
conducted using three clusters (Table 5.26). Cluster one consists of respondents with a below-
average score for legal responsibility (factor 1) philanthropy responsibility (factor 2) and an
above-average score for economic responsibility (factor 3). Cluster two involves a group of
respondents with an above-average score for all responsibilities (three factors), while the

223
largest score lies with philanthropic responsibility (factor 2). Cluster three is a group of
respondents with a below-average score for philanthropic responsibility (factor 2) and well-
below-average score for economic responsibility (factor 3). Cluster three has an above-average
score for legal ethical responsibility (factor 1).
Table 5.26: K-means CSR Strategy with Three Clusters
Cluster Number of cases Regression Score
Factor 1 Factor 2 Factor 3
1 145 -0.49 -0.86 0.35
2 180 0.18 0.76 0.47
3 110 0.35 -0.10 -1.23
ANOVA F 31.25 204.93 232.75
Sig 0.00 0.00 0.00
According to the results, cluster one, with 145 respondents, can be regarded as a ‘reactive’
group. Companies adopting a reactive strategy will fulfil their economic responsibilities but
ignore their legal, ethical and philanthropic responsibilities and reject any form of social or
ethical responsibility that falls outside their economic interest (Lee 2011). On the other hand,
cluster two consists of 180 respondents assumed to be the ‘proactive’ group, which has the
highest factor score for philanthropic responsibility, followed by economic responsibility, and
then legal ethical responsibility. Companies applying proactive strategy carry out their
philanthropic responsibilities actively, and also conduct some activities related to economic
responsibilities and do not ignore their legal ethical responsibilities. Companies with proactive
strategy fully recognise their social responsibilities and actively strive to meet stakeholder
needs and reduce negative effects of companies (Ganescu 2012b). At the same time, these
companies sustain economic, social and environmental development exceeding levels required
to comply with government regulations (Torugsa, O'Donohue & Hecker 2013; Wagner, Lutz
& Weitz 2009).
Cluster three involves 110 respondents whose businesses comply with legal and ethical
requirements, as this cluster has an above-average score for factor one. However, they do not
practice a great deal of philanthropic responsibility and have the lowest score for economic

224
responsibility. Hence, cluster three is the ‘accommodative’ group. Companies applying
accommodative strategy conduct specific ethical responsibilities, particularly those related to
stakeholders, and comply with legal requirements. However, most conduct passive and modest
approaches to stakeholder requests and rarely take voluntary initiatives (Ganescu 2012b; Lee
2011).
Both F value and ANOVA results indicate that all factor scores are significant for three
clusters. In sum, three clusters are considered appropriate to reflect which CSR strategy is
applied by respondents, i.e., defensive, proactive, and reactive.
5.5.2.3 Demography Characteristics of CSR Strategy Clusters
This subsection presents the characteristics of respondents in each cluster of CSR strategy.
For most products, the amount in cluster two (proactive) is more than other clusters, such as
food and beverage, chemicals and chemical products, rubber and plastic products, automotive,
non-metallic mineral products, and tobacco (see Table 5.27). In four other products, cluster one
(reactive) has the most respondents (e.g., fabricated metal products, paper, furniture, and goods
from wood). For textile products, most respondents are in cluster three (accommodative).
In terms of the company size, Table 5.27 shows a similar number of respondents in the three
clusters. A slight difference lies in large companies as most have proactive strategy (cluster
two), followed by reactive strategy (cluster one); and cluster three has the fewest number of
respondents. This result is similar to other evidence that the proactive CSR strategies of large
companies are substantially higher than those among SMEs (Chang 2015).
Regarding company age, most respondents who have been running their business for five to
20 years are in cluster one, while cluster two dominates in terms of respondents operating over
20 years. There is slight equal number for respondents in each cluster who have been
conducting their business for less than five years. This data reflects the ability of organisations

225
to function in a range of CSR from reactive to proactive (Carroll 1979; Wartick & Cochran
1985).
Table 5.27: Respondents Characteristics in Each Cluster of CSR Strategy
Variable Cluster 1, n=145
(Reactive)
Cluster 2, n=180
(Proactive)
Cluster 3, n=110
(Accommodative) Total
Main product
food and beverage 39 42 34 115
tobacco 1 6 4 11
textile 8 10 11 29
leather and footwear 2 4 2 8
goods from wood, handicraft 4 0 1 5
paper 14 8 3 25
coke and refined petroleum products 1 2 1 4
chemicals and chemical products 12 26 10 48
pharmaceuticals and medicinal chemical 4 3 4 11
rubber and plastic products 11 15 9 35
non-metallic mineral products 6 12 3 21
basic metals 0 2 0 2
fabricated metal products, excepts
machinery and equipment
17 15 10 42
computers, electronic and optical products 3 5 2 10
machinery and electrical equipment 6 8 6 20
automotive 7 13 4 24
furniture 8 5 4 17
other manufacturing 1 4 1 6
repair and installation of machinery and
equipment
1 0 1 2
Number of employees
small 15 13 16 44
medium 36 25 33 94
large 94 142 61 297
Company’s age (years)
< 5 11 11 8 30
5-10 20 15 18 53
11-20 36 32 18 86
21-50 68 91 55 214
> 50 10 31 11 52
Company’s ownership
state-ownership 2 8 3 13
private 125 129 90 344
multinational company 18 43 17 78
Company’s location
East Java 122 120 82 324
Centre Java & Yogyakarta 6 17 6 29
West Java & Jakarta 17 43 22 82
In industrial estate
yes 78 113 45 236
no 67 67 65 199

226
With respect to ownership, most respondents are in cluster two, regardless of whether they
are state-owned, private, or multinational companies. Similarly, related to region, most
respondents in Central Java and Yogyakarta, together with West Java and Jakarta, are in cluster
two. In East Java, there are equal numbers in clusters one and two. In terms of location, there
is almost the same number of respondents located outside the industrial estate in all three
clusters. However, there is a difference among respondents inside the industrial estate, since
most of them adopt proactive strategy (cluster two), followed by reactive strategy (cluster one),
and accommodative strategy (cluster three).
Overall, based on the results, it can be assumed that most manufacturing companies in
Indonesia apply proactive strategy rather than the other two strategies, reactive and
accommodative.
5.5.2.4. MGA Assessment of CSR Strategy in Strategic Integration
This subsection demonstrates how to evaluate MGA of CSR strategy. Like business
strategy, MGA of CSR strategy is conducted according to Matthews (2017). The three clusters
of CSR strategy are used as categorical variables for data grouping (Matthews 2017). With
three clusters, there are six comparisons of testing (Hair, Sarstedt, et al. 2018): proactive versus
reactive, proactive versus accommodative, and reactive versus accommodative. MGA CSR
strategy is carried out by first employing MICOM (Henseler, Ringle & Sarstedt 2016) with
three steps. As Step 1 of MICOM (configural invariance) has been established, Steps 2 and 3
of MICOM are conducted for each comparison.
1. Proactive versus Reactive in Strategic Integration
▪ Step 2. Compositional invariance. Because the proactive group is considered to have a
bigger impact of strategic integration on CP than the reactive group, one-tailed testing is
employed. Appendix B.11 presents results of Step 2 MICOM in comparing the proactive
and reactive groups. The results show that the value of the 5% quantile is equal to the value

227
of the correlation permutation for all constructs (Henseler, Ringle & Sarstedt 2016),
confirmed by most p-values exceeding 0.05. However, Aligning and CCP have p-values
below 0.05, indicating that compositional invariance has not been established.
▪ Step 3. Equality of composite mean values and variances. Appendix B.12 presents the
results of Step 3 of MICOM proactive versus reactive. The mean-original differences are
substantially above the upper level of the confidence interval. Because the confidence
interval of differences in mean between the construct scores of the proactive and reactive
groups does not include the original difference in mean values, there are significant
differences in the mean values of latent variables across the two groups (Hair, Sarstedt, et
al. 2018).
Appendix B.12 also shows that the confidence interval of differences in variance does not
include the original difference in variance values, particularly in six constructs: Aligning,
EffCom, SuppTM, Strategic Integration, CEP and CFP. The original differences in variance
values for those six construct are less than the lower level of the confidence interval, and
permutation p-values for variance of those five constructs are less than 0.05. These results
indicate significant differences in the variance values of latent variables across the two
groups (Hair, Sarstedt, et al. 2018). CCP and COP have p-values greater than 0.05 (0.16 and
0.15, respectively), and their original differences in variance values fall within the
confidence interval.
Because these results imply significant differences in the mean and variance values across
two groups, the comparison of the standardized path coefficient across the groups using
MGA can be conducted (Hair, Sarstedt, et al. 2018; Henseler, Ringle & Sarstedt 2016).
Appendix B.13 displays the total effects of MICOM in the proactive group versus the
reactive group. Significant differences are shown by Strategic Integration → CCP (p=0.03)
and Strategic Integration → CFP (p=0.00).

228
PLS-MGA was run with the results presented in Table 5.28. In most paths, the proactive
group has larger total effects than the reactive group. The largest differences rely on Strategic
Integration → CCP (total effect difference=0.20, p=0.04) and Strategic Integration → CFP
(total effect difference=0.22, p=0.01), indicating that total effects from Strategic Integration to
CCP and CFP are larger in the proactive group than in the reactive group.
Table 5.28: PLS-MGA Proactive and Reactive in Strategic Integration
The parametric and Welch-Satterthwaite tests are conducted to give additional confidence
in the final results obtained (Hair, Sarstedt, et al. 2018) with results in Appendix B.14. The
results reveal significant differences in the total effect between the proactive and cost reactive
groups. More specifically, Strategic Integration → CFP and COP → CFP have a more
substantial total effect in the proactive group than in the reactive group. At the 10% level,
Strategic Integration → CCP and CCP → CFP have bigger total effects in the proactive group
than in the reactive group.
Table 5.29 summarises the PLS multi-group results, showing the similar results across four
methods. Results from the permutation test and PLS-MGA are similar, while results from the
parametric test are similar to those from the Welch-Satterthwaite test. In total, there are similar
results among four tests in two paths, Strategic Integration → CCP and Strategic Integration
→ CFP.

229
Table 5.29: PLS Multi-group Results of Proactive and Reactive in Strategic Integration
Path Coefficient Permutatio
n Test
PLS-MGA
Test
Parametric
Test
Welch-Satterthwaite
Test
Strategic Integration -> CCP X X X X
Strategic Integration -> CEP
Strategic Integration -> CFP X X X X
Strategic Integration -> COP
CCP -> CFP
CEP -> CFP
COP -> CFP X X
2. Proactive versus Accommodative in Strategic Integration
▪ Step 2. Compositional invariance. One-tailed testing was employed as the proactive group
is assumed to have larger impacts than the accommodative group. Appendix B.15 shows the
results for the permutation test in relation to comparing these two groups. The value of the
5% quantile is smaller than (or equal to) the value of the correlation permutation for all
constructs (Henseler, Ringle & Sarstedt 2016). P-values for most constructs exceed 0.05,
except for Strategic Integration and the CFP construct, which have p-values below 0.05.
Accordingly, compositional invariance has not been established for eight constructs.
▪ Step 3. Equality of composite mean values and variances. Appendix B.16 presents the
results of Step 3 of MICOM, checking the composite’s equality of mean values and
variances across groups (Henseler, Ringle & Sarstedt 2016). The confidence interval for the
differences in means between the construct score of proactive and accommodative groups
does not include the original difference in mean values. The mean-original differences are
much higher than the upper level of the confidence interval, implying significant differences
in the mean values of latent variables across the two groups (Hair, Sarstedt, et al. 2018).
In contrast, the original difference in variance values fall within the confidence interval for
the differences in variance, and permutation p-values for variance are above 0.05.
Theoriginal differences in variance values for these two constructs are less than the lower
level of the confidence interval, and their p-values are less than 0.05, (apart from Aligning,
CFP and COP with p-values of 0.03, 0.04 and 0.05, respectively). These results indicate

230
significant differences in the variance values of latent variables across the two groups (Hair,
Sarstedt, et al. 2018).
As these results imply substantial differences in the mean and variance values across the
two groups, they support running PLS-MGA (Hair, Sarstedt, et al. 2018). Appendix B.17 shows
the MGA results for the proactive and accommodative groups. Seven paths have permutation
p-values exceeding 0.05, indicating insignificant differences. Therefore, these results suggest
that most structural model relationships between the two groups are not distinct (Hair, Sarstedt,
et al. 2018). To confirm this result, PLS-MGA is run with results presented in Table 5.30. In
most paths, the proactive group has slightly larger total effects than the accommodative group.
However, none of the differences are significant since they have p-values over 0.05.
Table 5.30: MGA Proactive and Accommodative in Strategic Integration
Appendix B.18 shows that the results of parametric and Welch-Satterthwaite tests are
consistent with the MGA results, indicating no significant differences across the two groups.
In total, the permutation test, PLS-MGA, and parametric and Welch-Satterthwaite tests reveal
similar results; that is, no significant differences between the proactive and accommodative
groups in the strategic integration-CP relationship.
3. Accommodative versus Reactive in Strategic Integration
▪ Step 2. Compositional invariance. Appendix B.19 presents the results of the permutation
run comparing the accommodative and reactive groups. The result shows that the value of
the 5% quantile is smaller than (or equal to) the value of the correlation permutation for all
constructs (Henseler, Ringle & Sarstedt 2016), supported by most p-values being above

231
0.05, apart from Strategic Integration and CCP (0.00 and 0.02, respectively). Subsequently,
compositional invariance has not been established.
▪ Step 3. Equality of composite mean values and variances. Appendix B.20 presents the
results for Step 3 MICOM (Henseler, Ringle & Sarstedt 2016). The confidence interval of
differences in mean between the construct score of the accommodative and reactive groups
does not include the original difference in mean values. However, the original difference in
mean values of CCP and COP falls within their confidence interval, implying significant
differences in the mean values across the two groups.
Likewise, the original difference in variance values do not fall within the confidence interval
for differences in variance, particularly in three constructs (EffCom, SuppTM and Strategic
Integration). These constructs have permutation p-values below 0.05, indicating no
significant differences in the variance values across the two groups (Hair, Sarstedt, et al.
2018). Nonetheless, five other constructs have original differences in variance values less
than the lower level of their confidence interval. As their p-values are less than 0.05, this
result implies substantial differences in variance values across the two groups.
Accordingly, these results support the need to compare the standardized path coefficient
across the groups using PLS-MGA (Hair, Sarstedt, et al. 2018; Henseler, Ringle & Sarstedt
2016). Appendix B.21 presents the total effects as results from the mediation effect. All 10
paths have different total effects between the two groups. Only one path has a permutation p-
value less than 0.05: Strategic Integration → CFP (p=0.04). At the confidence level of 10%,
the difference in path Strategic Integration → CCP is also significant (p=0.07). Thus, the results
signify differences in those two constructs across the two groups. To ensure this result, PLS-
MGA was run with the results (Table 5.31).

232
Table 5.31: PLS-MGA Accommodative and Reactive in Strategic Integration
Although there are differences of total effect across the two groups, not all differences are
significant (Hair, Sarstedt, et al. 2018). Two paths have significant differences: Strategic
Integration → CFP (total effect difference=0.20, p=0.03) and Strategic Integration → CCP
(total effect difference=0.19, p=0.07). These results indicate a larger total effect in the
accommodative group than in the reactive group.
To complete the MGA, parametric and Welch-Satterthwaite tests are conducted with results
in Appendix B.22. The results show two significant differences: Strategic Integration → CFP
(p=0.07) and Strategic Integration → CFP (p=0.06 and p=0.05, respectively). These results
indicate the accommodative group has a larger total effect than the reactive group.
Table 5.32 summarises the PLS multi-group results, showing similar results across the four
methods. The permutation, PLS-MGA, and parametric and Welch-Satterthwaite tests reveal
the same results; that is, there is a substantial difference in total effects between the two groups,
whereby the proactive group has a greater total effect than the reactive group.
Table 5.32: PLS Multi-group Results of Proactive and Reactive in Strategic Integration
Path Coefficient Permutation
Test
PLS-MGA
Test
Parametric
Test
Welch-Satterthwaite
Test
Strategic Integration -> CCP X X X X
Strategic Integration -> CEP
Strategic Integration -> CFP X X X X
Strategic Integration -> COP
CCP -> CFP
CEP -> CFP
COP -> CFP
In total, the results for the MGA of CSR strategy in strategic integration are presented in
Tables 5.33 and 5.34. Permutation and PLS-MGA, as a non-parametric test, as well as

233
parametric and Welch-Satterthwaite tests reveal the same results. In most of the seven paths,
the proactive group dominates, with the largest total effect. Specifically, the proactive group
has a significant bigger total effect in Strategic Integration → CCP and Strategic Integration
→ CFP. Consequently, the results suggest that CSR strategy moderates the impacts of strategic
integration on CP.
Table 5.33: MGA Results of CSR Strategy in Strategic Integration
Path
All Samples Group 1
(Reactive)
Group 2
(Proactive)
Group 3
(Accommodative)
N = 435 N = 145 N = 180 N = 110
β CI β CI β CI β CI
Strategic Integration -> CCP 0.30 0.21-0.39 0.10 -0.05-0.24 0.30 0.16-0.42 0.29 0.12-0.43
Strategic Integration -> CEP 0.63 0.57-0.69 0.52 0.40-0.61 0.53 0.44-0.61 0.48 0.33-0.59
Strategic Integration -> CFP 0.43 0.35-0.50 0.18 -0.24-0.00 0.40 0.28-0.50 0.38 -0.07-0.15
Strategic Integration -> COP 0.43 0.35-0.52 0.28 0.13-0.42 0.38 0.26-0.48 0.38 0.23-0.51
CCP -> CFP 0.25 0.15-0.35 0.22 0.06-0.38 0.33 0.21-0.45 0.24 0.08-0.40
CEP -> CFP 0.30 0.17-0.44 0.34 0.12-0.54 0.20 0.07-0.32 0.28 0.10-0.44
COP -> CFP 0.35 0.24-0.46 0.37 0.20-0.52 0.37 0.25-0.48 0.34 0.16-0.53
Note: β = path coefficient; CI = 95% confidence intervals.
5.5.3 MGA Company Size in Strategic Integration
This subsection explains how to conduct MGA for the company size. MGA company size
in strategic integration is undertaken as recommended by Matthews (2017). Having considered
observed heterogeneity and categorical variables, company size can be used without further
refinement (Henseler & Fassott 2010). As shown in Table 4.10 and Figure 4.4, 297
respondents’ companies have more than 100 employees; 44 respondents’ companies have
fewer than 20 employees (small companies) and 94 respondents’ companies have 20 to 99
employees (medium companies). To simplify the comparisons, data groups are generated
(Matthews 2017) by splitting the data set into two groups: large companies (297 respondents)
and SMEs (138 respondents). Then, the models are estimated separately for each group of data
(Hair et al. 2017).

234
Table 5.34: Comparison of CSR Strategy in Strategic Integration
Path
Proactive versus
Reactive
Proactive versus
Accommodative
Accommodative versus
Reactive
Proactive Reactive Proactive Accommodative Accommodative Reactive
Strategic Integration -> CCP 0.30 0.10 0.30 0.29 0.29 0.10
Strategic Integration -> CEP 0.53 0.52 0.53 0.48 0.48 0.52
Strategic Integration -> CFP 0.40 0.18 0.40 0.38 0.38 0.18
Strategic Integration -> COP 0.38 0.28 0.38 0.38 0.38 0.28
CCP -> CFP 0.33 0.22 0.33 0.24 0.24 0.22
CEP -> CFP 0.20 0.34 0.20 0.28 0.28 0.34
COP -> CFP 0.37 0.37 0.37 0.34 0.34 0.37
Note: the bold means the significant difference in each comparison.
Configural invariance has been established as three procedures of Step 1 of MICOM
(analysing the measurement invariance of composite models) have been achieved. Thus, the
following subsection presents Steps 2 and 3 of MICOM.
▪ Step 2. Compositional invariance. Because large companies are assumed to have better
strategic integration impact on CP than SMEs, one-tailed testing is undertaken (Appendix
B.23). The value of the 5% quantile is equal to the value of the correlation permutation for
all constructs (Henseler, Ringle & Sarstedt 2016), supported by p-values of above 0.05.
Effcom and CCP have p-values below 0.05, indicating the correlation is not significantly
below 1. Thus, compositional invariance has not been established.
▪ Step 3. Equality of composite mean values and variances. Appendix B.24 presents results
from Step 3 MICOM, suggesting different results among constructs. Most confidence
intervals of the eight constructs do not include their mean original value with p-values less
than 0.05. The mean value is beyond the upper level of the confidence interval, particularly
in Aligning, EffCom, SuppTM, Strategic Integration and CEP. Three other constructs, CCP,
CFP and COP, have the mean original value inside their confidence interval, with p-values
above 0.05.
By comparison, three other constructs, CCP, CFP and COP, have the original difference in
mean values inside the confidence interval and p-values over 0.05. These results imply no

235
significant differences in these three constructs across two groups. However, for one
construct (CEP), the variance original value falls outside the confidence interval, and its p-
value exceeds 0.05. Consequently, the full measurement variance has not been established,
and the standardized path coefficient across the groups using MGA can be compared with
confidence (Hair, Sarstedt, et al. 2018; Henseler, Ringle & Sarstedt 2016).
Because of the mediating effect, the total effect is used to compare path coefficients (see
Appendix B.25). The first two columns show the total effects for group 1 (large companies)
and group 2 (SMEs) followed by their differences in the original data set and the permutation
testing. Five paths have significant total effect differences with permutation p-values less
than 0.05: Strategic Integration → CCP (p=002), Strategic Integration → CEP (p=0.03),
Strategic Integration → CFP (p=0.00), Strategic Integration → COP (p=0.00) and CCP →
CFP (p=0.04). These results indicate significant differences across two groups in which
large groups have greater total effects than SME groups.
Based on these results, it can be assumed that there is a categorical moderator variable
(company size) that affects the relationships in the PLS path model (Hair, Sarstedt, et al. 2018).
Accordingly, to further analyse group-specific effects, PLS-MGA is run to disclose the effect
of this categorical moderator variable. Because PLS-MGA represents a one-tailed test, p-values
in Table 5.35 indicate the path coefficient is significantly larger in the large companies group
than in the SMEs group (Hair, Sarstedt, et al. 2018). Specifically, four paths have significant
differences with p-values below 0.05: Strategic Integration → CCP (total effect
difference=0.21, p=0.02), Strategic Integration → CFP (total effect difference=0.25, p=0.00)
and Strategic Integration → COP (total effect difference=0.32, p=0.00). Another path, CCP →
CFP, has a significant difference of total effects across two groups (total effect difference=0.19,
p=0.03). At the 10% confidence level, total effect from strategic CSR Integration to CEP is

236
significantly different across two groups (total effect difference=0.12, p=0.06), indicating a
stronger total effect in large companies than in SMEs.
Table 5.35: PLS-MGA Company Size in Strategic Integration
Path
Total Effects
Original
(Large)
Total Effect
Original
(SME)
Total Effects-
diff
(Large-SME)
p-Value original
1-tailed
(Large vs SME)
p-Value new
(Large vs SME)
Strategic Integration -> CCP 0.37 0.16 0.21 0.02 0.02
Strategic Integration -> CEP 0.66 0.54 0.12 0.06 0.06
Strategic Integration -> CFP 0.50 0.25 0.25 0.00 0.00
Strategic Integration -> COP 0.54 0.22 0.32 0.00 0.00
CCP -> CFP 0.34 0.15 0.19 0.03 0.03
CEP -> CFP 0.24 0.38 -0.14 0.85 0.15
COP -> CFP 0.30 0.41 -0.10 0.83 0.17
Table 5.36 presents PLS path estimations for the complete sample and subsamples of
company size. Total effects of all samples (pooled data) are different from total effects in
subsamples. The results confirm the assessment of total effects should be conducted across two
groups as they give more detailed analysis.
Table 5.36: MGA Results of Company Size in Strategic Integration
Path
All Samples Group 1 (Large) Group 2 (SME) Group 1 vs
Group 2 N = 435 N = 297 N = 138
β CI β CI β CI p-value
Strategic Integration -> CCP 0.30 0.21-0.39 0.37 0.27-0.46 0.16 0.03-0.30 0.02
Strategic Integration -> CEP 0.63 0.57-0.69 0.66 0.61-0.71 0.54 0.42-0.65 0.06
Strategic Integration -> CFP 0.43 0.35-0.50 0.50 0.43-0.56 0.25 0.11-0.37 0.00
Strategic Integration -> COP 0.43 0.35-0.52 0.54 0.46-0.61 0.22 0.06-0.36 0.00
CCP -> CFP 0.25 0.15-0.35 0.34 0.24-0.45 0.15 0.00-0.28 0.03
CEP -> CFP 0.30 0.17-0.44 0.24 0.11-0.37 0.38 0.20-0.55 0.15
COP -> CFP 0.35 0.24-0.46 0.30 0.19-0.41 0.41 0.25-0.45 0.17
Note: β = path coefficient; CI = 95% confidence intervals; bold marks = the significant difference in group
comparison
To support the MGA results, parametric and Welch-Satterthwaite tests are carried out
(Appendix B.26). The results support permutation test and MGA results, which indicate
significant differences in total effects in the relationship between strategic integration and CP

237
among two groups, at the 5% level (i.e., Strategic Integration → CCP, Strategic Integration →
CFP, Strategic Integration → COP) and the 10% level (Strategic Integration → CEP).
Table 5.37 summarises the PLS multi-group results, showing similar results across four
methods. It can be concluded that regarding company size, the total effect between large
companies and SMEs differs significantly in the relationship between strategic integration and
CP. Hence, the results from this multi-methods approach can provide confidence in the final
results obtained (Hair, Sarstedt, et al. 2018).
Table 5.37: PLS Multi-group Results of Company Size in Strategic Integration
Path Coefficient Permutation
Test
PLS-MGA
Test
Parametric
Test
Welch-Satterthwaite
Test
Strategic Integration -> CCP X X X X
Strategic Integration -> CEP X X X X
Strategic Integration -> CFP X X X X
Strategic Integration -> COP X X X X
CCP -> CFP X X X X
CEP -> CFP
COP -> CFP
5.5.4 MGA Industry Type in Strategic Integration
This subsection presents how to carry out MGA for the last moderator, that is the industry
type. As previously shown, the sample in this thesis represents a wide range of manufacturing
companies, with 19 different industry types (see Table 4.10 and Figure 4.3 for details). Previous
studies suggested two categories of manufacturing companies: high impact and other
manufacturing. The former represents the group of the most environmentally harmful
companies, such as mining, chemical, oil and gas, metal, paper and pulp, as well as energy
production /utilities. The latter are less environmentally harmful companies, such as food
processing, automobile industries, plastic, printing, heavy engineering and consumer goods
(Bowen 2000; Halme & Huse 1997). Boesso, Favotto and Michelon (2015) grouped companies
that operate primarily in environmentally sensitive industries (ESI) and those that do not (non-
ESI). Oil exploration, paper, chemical and allied products, petroleum refining, metals, mining
or utilities are categorised as ESI companies that could have a greater environment effect than

238
non-ESI companies. Other empirical literature considers metals, resources, paper and pulp,
power generation, water and chemicals industries as having high environmental impacts
(Bowen 2000; Hoffman 1999). In comparison, other industries, especially the newer
manufacturing and service industries, have significantly smaller environmental impacts and
fewer environmental problems (Reverte, Gómez-Melero & Cegarra-Navarro 2016).
Based on the extant literature, respondents’ companies would be simply categorized into
two industry types: ESI and non-ESI to examine their impact in the strategic integration as
follows:
1. Mining and ore processing. A number of industries rely on the mining and ore processing
industry for the supply of minerals, metals and gems. These products occur in nature in the
form of ore in rock and must be mined and concentrated before use. Those processes
generate large volumes of waste production that is often filled with pollutants, such as
mercury, lead, and cadmium (Nag 2018). Thus, mining and ore processing is a major
pollution source (Etee 2019).
2. Fashion. The fashion industry is considered as the second most polluting industry
(FabricoftheWorld n.d.; Hinsliff 2019), after the oil industry (Qutab 2016).
3. Chemical manufacturing. Chemical manufacturing includes the production of various
chemicals such as plastics, paints, explosives, dyes, pharmaceuticals and petrochemicals.
They have some advantages, but also produce significant volumes of poisonous waste and
by-products during their production (Nag 2018).
4. Tanneries. Tannery is a process of producing leather from raw animal skins. This involves
using various chemicals to remove meat, oil glands, and hair from raw skin. A large amount
of waste is generated in the process. Irresponsible industrial practices often cause
environmental contamination with hazardous chemicals used in tanning, such as chromium,
alum and tannins. (Nag 2018).

239
5. Automotive. Environmental management is perhaps the biggest challenge for the
automotive industry. Problems such as global warming or pollution are a critical issue and
are directly related to car use, production and disposal (García-Madariaga & Rodríguez-
Rivera 2017).
Table 5.38 presents the two groups of respondents’ companies. Group one consists of 10
industry types with 228 ESI-categorised companies, and group two comprises nine other types
of industry with 207 non-ESI-categorised companies.
Table 5.38: Industry Type Categories
Category Industry Type Number Percentage (per cent)
Environmentally
sensitive
industries
(ESI)
chemicals and chemical products 48 11.00
fabricated metal products, excepts machinery and
equipment
42 9.70
rubber and plastic products 35 8.00
textile 29 6.70
paper 25 5.70
automotive 24 5.50
pharmaceuticals and medicinal chemical 11 2.50
leather and footwear 8 1.80
coke and refined petroleum products 4 0.90
basic metals 2 0.50
Total of ESI 228 52.40
Environmentally
non-sensitive
industries
(non-ESI)
food and beverage 115 26.40
non-metallic mineral products 21 4.80
machinery and electrical equipment 20 4.60
furniture 17 3.90
tobacco 11 2.50
computers, electronic and optical products 10 2.30
other manufacturing 6 1.40
goods from wood, handicraft 5 1.10
repair and installation of machinery and equipment 2 0.50
Total of non-ESI 207 47.60
Table 5.39 presents the characteristics of the companies from each group. With respect to
size, category one (ESI) is dominated by medium and large companies. Conversely, most small
businesses are in group two (non-ESI). Most companies in category one have been working for
five to 50 years. Most companies in category two have been running for fewer than five years
or more than 50 years. In terms of ownership, there is almost equal numbers of state-owned,

240
private and multinational companies in the two groups. Most companies in East Java are in
group one, while most companies in Centre Java and Yogyakarta as well as in West Java and
Jakarta are in group two. Most companies in group one are inside industrial estates, and most
companies in group two are outside industrial estate.
Table 5.39: Respondents Characteristics in Each Category of Industry Type
Variable Category 1, n=228
(ESI)
Category 2, n=207
(non-ESI) Total
Number of employees
small 16 28 44
medium 51 43 94
large 161 136 297
Company’s age (years)
< 5 10 20 30
5-10 28 25 53
11-20 53 33 86
21-50 119 95 214
> 50 18 34 52
Company’s ownership
state-ownership 7 6 13
private 182 162 344
multinational company 39 39 78
Company’s location
East Java 178 146 324
Centre Java & Yogyakarta 11 18 29
West Java & Jakarta 39 43 82
In industrial estate
yes 144 92 236
no 84 115 199
Next, these two groups of industry type, ESI and non-ESI, are used as categorical variables
in the model to generate data groups (Matthews 2017). Because configural invariance has been
established since the three procedures in Step 1 have been met, the following subsection
presents Steps 2 and 3 of MICOM of the industry type.
▪ Step 2. Compositional invariance. Given the non-ESI group is supposed to have less
strategic integration impact on CP than the ESI group, this thesis employes permutation one-
tailed testing. As displayed in Appendix B.27, the 5% quantile value is equal to the
correlation permutation value for eight constructs (Henseler, Ringle & Sarstedt 2016),

241
confirmed by the p-values exceeding 0.05. Thus, the compositional invariance is achieved
for all eight constructs.
▪ Step 3. Equality of composite mean values and variances. Appendix B.28 presents the
results for Step 3 (Henseler, Ringle & Sarstedt 2016). Only one construct (SuppTM) has the
mean original values within the confidence interval with a p-value less than 0.05, implying
significant differences across the two groups. The confidence intervals of the other seven
constructs do not include their mean original values, and their p-values are above 0.05.
These results indicate insignificant differences across the two groups. Similarly, most
original differences in the variance values fall inside the confidence interval, with p-values
over 0.05. Only two constructs have p-values below 0.05 (CCP and CFP), showing
significant differences across the two groups. Hence, these results imply significant
differences in the mean and variance values across two groups and support the comparison
of the standardized path coefficient across the groups (Hair, Sarstedt, et al. 2018; Henseler,
Ringle & Sarstedt 2016).
Considering the results, the effects of MGA are evaluated by comparing the total effect from
permutation type based on industry type. As shown in Appendix B.29, at the 10% confidence
level, there is a significant total effect difference on Strategic Integration → CFP (-0.12,
p=0.07). To further analyse group-specific effects, PLS-MGA is run on the data (Hair, Sarstedt,
et al. 2018; Henseler, Ringle & Sarstedt 2016). Table 5.40 presents the results of PLS-MGA
industry type. Total effects in the non-ESI group are bigger than in the ESI group, particularly
in Strategic Integration → CFP (total effect difference=0.12, p=0.05). At the confidence level
of 10%, the ESI group has a larger total effect in COP → CFP (total effect difference=0.08,
p=0.08) than the non-ESI group.

242
Table 5.40: PLS-MGA Industry Type in Strategic Integration
Table 5.41 summarises PLS path estimations for the complete sample and subsamples of
industry type. Total effects in all samples (pooled data) are different from total effects in
subsamples of industry type.
Table 5.41: MGA Results of Industry Type in Strategic Integration
Path
All Samples Group 1
(ESI)
Group 2
(Non-ESI) Group 1 vs
Group 2 N = 435 N = 228 N = 107
β CI β CI β CI p-value
Strategic Integration -> CCP 0.30 0.21-0.39 0.29 0.18-0.39 0.30 0.18-0.41 0.49
Strategic Integration -> CEP 0.63 0.57-0.69 0.64 0.57-0.71 0.62 0.54-0.67 0.33
Strategic Integration -> CFP 0.43 0.35-0.50 0.37 -0.12-0.08 0.49 -0.03-0.12 0.05
Strategic Integration -> COP 0.43 0.35-0.52 0.41 0.30-0.51 0.46 0.36-0.54 0.30
CCP -> CFP 0.25 0.15-0.35 0.24 0.09-0.36 0.25 0.16-0.35 0.45
CEP -> CFP 0.30 0.17-0.44 0.23 0.05-0.42 0.39 0.28-0.51 0.11
COP -> CFP 0.35 0.24-0.46 0.41 0.28-0.53 0.27 0.17-0.38 0.08
Note: β = path coefficient; CI = 95% confidence intervals; bold marks = the significant difference in group
comparison
Appendix B.30 presents the result of parametric and Welch-Satterthwaite tests. The results
show that COP → CFP has significantly different total effects across the two groups (p=0.08).
The PLS multi-group results are presented in Table 5.42. The results of the permutation test
and PLS-MGA are similar, showing a significant difference across the two groups, particularly
in Strategic Integration → CFP. In contrast, the result of parametric and Welch-Satterthwaite
tests reveal a significant difference in COP → CFP, which also was identified in PLS-MGA.
However, the PLS-MGA results will be used for further analysis while it is a non-parametric
test that is more appropriate in PLS-SEM analysis.

243
Table 5.42: PLS Multi-group Results of Industry Type in Strategic Integration
Path Coefficient Permutation
Test
PLS-MGA
Test
Parametric
Test
Welch-Satterthwaite
Test
Strategic Integration -> CCP
Strategic Integration -> CEP
Strategic Integration -> CFP X X
Strategic Integration -> COP
CCP -> CFP
CEP -> CFP
COP -> CFP X X X
5.5.5 Discussion of Moderating Effect in Strategic Integration
This subsection discusses the results of moderating effect analysis in strategic integration.
The objectives are to answer the research questions and to verify the hypotheses related to the
moderating effect. The discussion is based on the conceptual framework and hypotheses
proposed in Chapter 3, the results from PLS-SEM analysis, existing literature, and research
findings from prior studies.
5.5.5.1 Moderating Effect of Business Strategy in Strategic Integration
This subsection explains the moderating effect analysis of business strategy in strategic
integration. Some of the hypotheses relate to whether business strategy has a moderating effect
on the relationship between strategic integration and CP:
▪ Hypothesis 6a (H6a): Business strategy moderates the impact of strategic CSR integration
on customer performance.
The evidence reveals that the relationship between strategic integration and customer
performance is significantly moderated by business strategy (total effect difference=0.14,
p=0.08), supporting H6a. The differentiation group has a larger total effect of strategic
integration on customer performance than the cost leadership group.
▪ Hypothesis 6b (H6b): Business strategy moderates the impact of strategic CSR integration
on employee performance.

244
The result suggests the impacts of strategic integration on employee performance is not
moderated by business strategy (total effect difference=0.06, p=0.21), not supporting H6b. In
other words, business strategy does not moderate the impact of strategic integration on
employee performance.
▪ Hypothesis 6c (H6c): Business strategy moderates the impact of strategic CSR integration
on operational performance.
The result indicates that there is no difference in the impact of strategic integration on
operational performance caused by business strategy (total effect difference=0.10, p=0.16), not
supporting H6c. Thus, business strategy does not moderate the impact of strategic integration
on operational performance.
▪ Hypothesis 6d (H6d): Business strategy moderates the impact of strategic CSR integration
on financial performance.
The finding confirms that the relationship between strategic integration and financial
performance differs by business strategy (total effect difference=0.18, p=0.02), supporting
H6d. This means that business strategy can moderate the impact of strategic integration on
financial performance. The result shows that the total effect of strategic CSR integration on
financial performance is more significant in the differentiation group than the cost leadership
group. This may be because the differentiation strategy has a bigger effect on CCP → CFP.
While CCP can partly mediate the relationship between strategic integration and CFP, the total
effect on Strategic Integration → CFP is higher in the differentiation group.
Generally, the findings reveal the differentiation group has a greater impact of strategic CSR
integration on customer and financial performance than the cost leadership group. There is a
plausible explanation for this finding. Differentiation strategy creates the development of goods
or unique services by offering higher quality, better performance or unique features (Galbreath

245
2009; Porter 1985; Valipour, Birjandi & Honarbakhsh 2012). Customers are more likely to
repeat purchase and pay a premium price when such unique products satisfy them (Tsiotsou
2006). Additionally, companies pursuing a differentiation strategy put emphasis on customer
need recognition and value adding (Sun & Pan 2011), which in turn increases customer
satisfaction and loyalty. Customer satisfaction has a positive impact on financial performance
(Xie et al. 2017), and higher levels of customer satisfaction lead to better financial performance
(Chi & Gursoy 2009). Thus, a differentiation strategy can increase customer satisfaction and
loyalty, which ultimately increases financial performance. As a result, companies adopting
differentiation strategy can have more sustainable financial performance than those following
the cost leadership strategy (Banker, Mashruwala & Tripathy 2014).
Conversely, another result implies that the total effect from operational performance on
financial performance is more substantial in the cost leadership group than the differentiation
group. Cost leadership strategy tends to be oriented more towards competitors than customers
(Frambach, Prabhu & Verhallen 2003), so that companies adopting this strategy aim to make
their products at the lowest cost by tightly controlling their costs, reducing expenses from
innovation or marketing, and cutting their prices when selling products (Liu, Li & Li 2019;
Porter 1985). By producing standardised products at a low per-unit cost for price-sensitive
consumers (David & David 2014; Liu, Li & Li 2019), companies will raise their profit margin
through increased internal efficiency (Liu, Li & Li 2019; Valipour, Birjandi & Honarbakhsh
2012). In addition, cost leadership strategy concentrates on cost reduction and efficiency by
seeking to optimise economies of scale, maintain operational efficiency, apply cost-cutting
techniques, and prioritise overhead and administrative cost reductions. As a result, companies
adopting this strategy can use their cost advantage to charge lower prices or enjoy greater profit
margins (Bu¨ yu¨ kbalcı 2012).

246
These findings offer a deeper understanding that business strategy typologies are an
effective tool for explaining performance heterogeneity in organisations (Nandakumar,
Ghobadian & O'Regan 2011). In terms of contingency theory, the findings prove there is a
distinctive CP based on the business strategy adopted.
5.5.5.2 Moderating Effect of CSR Strategy in Strategic Integration
The moderating effect analysis of CSR strategy in strategic integration is presented in this
subsection. In addition to business strategy, hypotheses also examine if the impact of strategic
CSR integration on CP is moderated by CSR strategy.
▪ Hypothesis 8a (H8a): CSR strategy moderates the impact of strategic CSR integration on
customer performance.
The findings reveal that the impact of strategic CSR integration on customer performance
is significantly different between the proactive and reactive groups (total effect
difference=0.20, p<0.05) as the proactive group has a bigger total effect. There is also a
substantial difference in the impact of strategic integration on customer performance between
the accommodative and reactive groups (total effect difference=0.19, p<0.10) where the
accommodative group has a greater total effect. In comparison, there is no total effect
difference between the proactive and accommodative groups (total effect difference=0.01,
p>0.05). These results suggest that proactive and accommodative groups have a greater total
effect than the reactive group. Therefore, the impact of strategic integration on customer
performance is moderated by the CSR strategy, supporting H8a.
Proactive companies handle customers with due regard. They are likely to closely monitor
customer satisfaction, respond to each customer complaint individually, abide by strict product
safety requirements and provide detailed information about their products. Costumers will then

247
show their trust in the companies and support their efforts by continuing to purchase their
products (Maignan et al. 1999).
▪ Hypothesis 8b (H8b): CSR strategy moderates the impact of strategic CSR integration on
employee performance.
The empirical evidence shows no significant differences in the total effect of strategic
integration on employee performance across the three groups of CSR strategy. Hence, the
impact of strategic CSR integration on employee performance is not likely to be influenced by
CSR strategy, not supporting H8b. Put another way, CSR strategy does not moderate the impact
of strategic integration on employee performance.
▪ Hypothesis 8c (H8c): CSR strategy moderates the impact of strategic CSR integration on
operational performance.
The result indicates that total effect differences in the relationship between strategic CSR
integration and operational performance are not significant across the three groups of CSR
strategy. The impact of strategic integration on operational performance is not moderated by
the CSR strategy; therefore, results do not support H8c.
▪ Hypothesis 8d (H8d): CSR strategy moderates the impact of strategic CSR integration on
financial performance.
The results show the proactive group has a significant and bigger total effect of strategic
CSR integration on financial performance than the reactive group (total effect difference=0.22,
p<0.05). Other results show the accommodative group has a stronger total effect than the
reactive group (total effect difference=0.20, p<0.05). However, there is no significant total
effect difference across the proactive and accommodative groups. Therefore, the results suggest
that CSR strategy moderates the impact of strategic CSR integration on financial performance,
supporting H8d.

248
Importantly, the findings reveal that CSR strategy moderates the relationship between
strategic CSR integration and CP, particularly customer and financial performance, whereby
the proactive group has the biggest total effect among the three groups of CSR strategy.
Reactive companies reject the obligations assigned by their stakeholder groups and do less than
is required by society’s standards (Maignan & Ferrell 2001; Maignan et al. 1999). Companies
following a proactive strategy, on the other hand, completely understand their social
obligations and actively fulfil and participate in meeting stakeholder needs and reducing
adverse effects (Ganescu 2012b; Maignan & Ferrell 2001). Companies that connect their CSR
initiatives to stakeholder expectations will therefore optimise their CSR efforts to enhance their
companies’ performance (Michelon, Boesso & Kumar 2013). In turn, proactive companies can
generate a better attitude response from customers (Groza, Pronschinske & Walker 2011) and
are associated with improved levels of employee commitment, customer loyalty and business
performance (Maignan et al. 1999). Because improving efficiency is a critical factor for
companies in determining whether to implement proactive management practices (Zhu, Liu &
Lai 2016), the findings provide empirical evidence that by adopting proactive strategy,
companies can gain better financial performance.
5.5.5.3 Moderating Effect of Company Size in Strategic Integration
This subsection provides the moderating effect analysis of company size in strategic
integration. Several proposed hypotheses are related to whether company size has a moderating
effect on the relationship between strategic CSR integration and CP.
▪ Hypothesis 10a (H10a): Company size affects the impact of strategic CSR integration on
customer performance.
Findings reveals that the impact of the strategic integration on customer performance differs
according to company size (total effect difference=0.21, p<0.05), supporting H10a. In other

249
words, company size moderates the impact of strategic CSR integration on customer
performance.
▪ Hypothesis 10b (H10b): Company size affects the impact of strategic CSR integration on
employee performance.
The relationship between strategic integration and employee performance is significantly
different between large companies and SMEs (total effect difference=0.12, p<0.10), supporting
H10b. Put another way, company size moderates the impact of strategic CSR integration on
employee performance.
▪ Hypothesis 10c (H10c): Company size affects the impact of strategic CSR integration on
operational performance.
This thesis finds that the relationship between strategic integration and operational
performance is significantly affected by company size (total effect difference=0.32, p<0.05),
supporting H10c. The result reveals that company size can moderate the relationship between
strategic CSR integration and operational performance.
▪ Hypothesis 10d (H10d): Company size affects the impact of strategic CSR integration on
financial performance.
Results confirm the effect of strategic integration on financial performance differs by
company size (total effect difference=0.25, p=0.00), supporting H10d. This result suggests that
company size can moderate the impact of strategic CSR integration on financial performance.
In general, company size can be a moderator and has a moderating effect on the relationship
between strategic integration and CP across four target constructs. The findings suggest that
large companies have better CP resulting from strategic CSR integration than do SMEs. The
findings are supported by previous studies that report a significant relationship between
company size and CSR (Aras, Aybars & Kutlu 2010). As companies grow larger, they become

250
motivated by social responsibilities (Ağan et al. 2016) and are more able to handle complicated
and fast CSR implementation strategies better, because they are more familiar with diverse
operations (Tang, Hull & Rothenberg 2012).
Nevertheless, this finding differs from a prior study that found company size, as a control
variable, does not affect the integration of CSR into business strategy (Vo, Delchet-Cochet &
Akeb 2015). This study reported that companies are homogeneous in terms of CSR behaviour
within the SMEs sector.
5.5.5.4 Moderating Effect of Industry Type in Strategic Integration
This thesis also examined whether industry type influences the relationship between
strategic CSR integration and CP. The moderating effect analysis of industry type is provided
in this subsection.
▪ Hypothesis 12a (H12a): Industry type affects the impact of strategic CSR integration on
customer performance.
Findings reveal that the relationship between strategic integration and customer
performance is not significantly moderated by the industry type (total effect difference=0.00,
p=0.49). Thus, H12a is not supported.
▪ Hypothesis 12b (H12b): Industry type affects the impact of strategic CSR integration on
employee performance.
The findings suggest that the relationship between strategic integration and employee
performance does not differ by industry type (total effect difference=0.03, p>0.05), thereby not
supporting H12b. Industry type does not moderate the impact of strategic CSR integration on
employee performance.

251
▪ Hypothesis 12c (H12c): Industry type affects the impact of strategic CSR integration on
operational performance.
The relationship between strategic integration and operational performance is not
significantly different based on industry type (total effect difference=0.04, p>0.05), thereby not
supporting H12c. In other words, industry type does not moderate the impact of strategic CSR
integration on operational performance.
▪ Hypothesis 12d (H12d): Industry type affects the impact of strategic CSR integration on
financial performance.
Results show a different impact of strategic integration on financial performance moderated
by industry type (total effect difference=0.12, p=0.05), supporting H12d. This result indicates
that the non-ESI group has a bigger total effect than the ESI group in the relationship between
strategic CSR integration and financial performance.
Overall, the finding suggests that industry type can moderate the impact of strategic CSR
integration on CP. Specifically, the finding reveals that the non-ESI group has a greater total
effect on financial performance than the ESI group. This complements the argument that heavy
industry and chemical companies (ESI group) tend to be motivated by regulation rather than
CSR, because they are far from the final supply chain customers (less visible) (Ağan et al.
2016).
When a moderator variable interrelates with a mediator variable, moderated mediation
appears so that the value of the indirect effect varies depending on the value of the moderator
variable (Hair et al. 2017). This situation is referred to as a conditional indirect effect because
the value of the indirect effect is conditional on the value of the moderator variable (Hair et al.
2017). In other words, mediation relationships depend on the moderator level (Preacher,
Rucker & Hayes 2007), which implies that if the mechanism connecting an exogenous

252
construct with an endogenous construct through a mediator is a function of another variable,
that variable can be said to be moderate (Hair et al. 2017).
Model 1 involves COP, CCP, and CEP as mediators. The mediation analysis result reveals
that these mediators significantly mediate the strategic CSR integration-CFP relationship.
MGA result also demonstrates that the impact of Strategic Integration → CFP differs by
business strategy. In other words, the total effect from strategic CSR integration to CFP as a
result of mediating effects from CCP, CEP, and COP is moderated by the business strategy.
Similarly, the overall results of MGA show that the strategic CSR integration-CFP relationship
can be mediated by CCP, CEP, and COP, and, at the same time, be moderated by CSR strategy,
company size and industry type.
In sum, this thesis provides new empirical evidence identifying new contingencies in the
CSR integration-CFP relationship. The mechanism of this relationship is not only mediated by
customer, employee, and operational performance, but also by business strategy, CSR strategy,
company size, and industry type.
5.5.6 Results of all Tested Hypotheses in Strategic Integration
Based on evidence derived from the findings, 15 hypotheses are significant and hence
supported, while the remaining eight hypotheses are unsupported. Table 5.43 summarises the
results of all hypothesised relationships. The hypotheses of the impact of strategic CSR
integration on CP as well as the mediating effects on strategic CSR integration-financial
performance relationship are supported. Several hypotheses of the moderating effects on this
relationship are also supported, while others are not.

253
Table 5.43: Final Results of Hypothesis in Strategic Integration
Hypothesis Propositions Results
H1a The strategic integration of CSR and business strategy has a positive impact on customer
performance.
Supported
H1b The strategic integration of CSR and business strategy has a positive impact on employee
performance.
Supported
H1c The strategic integration of CSR and business strategy has a positive impact on
operational performance.
Supported
H1d The strategic integration of CSR and business strategy has a positive impact on financial
performance.
Supported
H4a The relationship between strategic CSR integration and financial performance is
mediated by customer performance.
Supported
H4b The relationship between strategic CSR integration and financial performance is
mediated by employee performance.
Supported
H4c The relationship between strategic CSR integration and financial performance is
mediated by operational performance.
Supported
H6a Business strategy moderates the impact of strategic CSR integration on customer
performance.
Supported
H6b Business strategy moderates the impact of strategic CSR integration on employee
performance.
Not
supported
H6c Business strategy moderates the impact of strategic CSR integration on operational
performance.
Not
supported
H6d Business strategy moderates the impact of strategic CSR integration on financial
performance.
Supported
H8a CSR strategy moderates the impact of strategic CSR integration on customer
performance.
Supported
H8b CSR strategy moderates the impact of strategic CSR integration on employee
performance.
Not
supported
H8c CSR strategy moderates the impact of strategic CSR integration on operational
performance.
Not
supported
H8d CSR strategy moderates the impact of strategic CSR integration on financial
performance.
Supported
H10a Company size affects the impact of strategic CSR integration on customer performance. Supported
H10b Company size affects the impact of strategic CSR integration on employee performance. Supported
H10c Company size affects the impact of strategic CSR integration on operational
performance.
Supported
H10d Company size affects the impact of strategic CSR integration on financial performance. Supported
H12a Industry type affects the impact of strategic CSR integration on customer performance. Not
supported
H12b Industry type affects the impact of strategic CSR integration on employee performance. Not
supported
H12c Industry type affects the impact of strategic CSR integration on operational performance. Not
supported
H12d Industry type affects the impact of strategic CSR integration on financial performance. Supported
5.6 Summary of Chapter 5
This chapter provides results related to strategic integration, based on analysis undertaken
using SPSS 26 and SmartPLS 3. HCM, using a repeated-indicator approach, was employed,

254
producing reliable and robust results. Following the completion of the reflective and formative
measurement model assessments, the reliability and validity of structural models were tested.
The results showed that the measurement and structural models’ assessments of strategic
integration achieve satisfactory reliability and validity. Accordingly, the hypothesised model
of strategic integration of CSR into business strategy (Model 1) was confirmed. Then, the
mediating effect of Model 1 was evaluated. The results revealed that the significance and
relevance of direct and mediating effects were empirically established. MGA was also
conducted to examine the moderating effect of business strategy, CSR strategy, company size,
and industry type. The findings show that 16 of the 23 hypotheses were supported, with the
remaining seven hypotheses being rejected.
To conclude, the findings reveal that there are contingencies in the relationship between
strategic CSR integration and CP. The findings suggest that this relationship is mediated by
stakeholder relationships (i.e., customer, employee, and operational performances). In addition
to mediating effect, this relationship is also moderated by four moderators: business strategy,
CSR strategy, company size, and industry type.

255
CHAPTER 6: FUNCTIONAL INTEGRATION AND COMBINED CSR
INTEGRATION-FINDINGS AND DISCUSSION
This chapter presents the procedures and results for functional integration and combined
CSR integration. Like strategic integration, SPSS 26 and SmartPLS 3 were used for statistical
analysis. This chapter consists of two parts: functional integration and combined CSR
integration. At the end of this chapter, a summary is provided.
I. Functional Integration
This first part of this chapter is divided into eight sections. Several descriptive analyses of
functional integration are described first, followed by the validation of measurement and
structural models. The findings of functional integration are then discussed. Next, MGA results
are explained. A conclusion of functional integration is presented at the end of this part.
6.1 Desriptive Statistical Analysis in Functional Integration
This section provides descriptival statistical analysis regarding functional integration. Since
the previous chapter already presented the descriptive statistical analysis for business strategy,
CSR strategy, strategic integration and CP, this chapter provides descriptive statistical analysis
for functional integration. Appendix C.1 displays the mean standard deviation and correlation
for variables of functional integration. All 30 variables have high mean values with the value
for ‘Our products and/or services satisfy national and/or international quality standards’ and
‘We provide a prompt response to the complaints of our customers about products and/or
services’ (FI14 and FI22, 4.40). The correlation coefficients of functional integration variables
are significant and range from 0.11 to 0.69, indicating that their relationships have small to
large effects.

256
6.2 Model Specification of Functional Integration
This section explains how model specification of functional integration is determined. Like
strategic integration, functional integration was conceptualised as a second-order construct.
This construct consisted of six different components with related indicators (Table 4.10).
Functional Integration has six exogenous constructs (i.e., Cost, Innovation, Quality, Suppliers,
Customers, and Employees). CP, as an endogenous construct, involves four dimensions,
namely CCP, CEP, COP, and CFP. Subsequently, there are 24 paths from functional integration
to endogenous constructs, and three paths from CCP, CEP, and COP, to CFP. These 27 paths
make the model quite complex and rather difficult to examine. Thus, HCM is established to
minimise the complexity. Six dimensions formed an overall abstraction of functional
integration, which suggests that omitting one of the dimensions might hamper the conceptual
meaning of HOC Functional Integration as a second-order construct (Hair et al. 2017).
Figure 6.1 presents the model of functional integration and CP (Model 2). HOC Functional
Integration is a formative second-order construct that contains two-layered structures of
constructs and represent a more general construct of their lower-order constructs (LOC)
reflectively measured (Hair, Sarstedt, et al. 2018). It consists of six LOCs: Cost, Innovation,
Quality, Suppliers, Customers, and Employees, with five indicators on each construct. To
examine the impact of functional integration on CP, four LOCs are reflectively measured: CCP
with three indicators, CEP with four indicators, CFP, and COP with five indicators. Model 2
refers to a second-order molar model as it has an arrow from its LOCs to the HOC (Chin 2010)
and suggests a collective model since LOCs have similar numbers to shape the HOC (Becker,
Klein & Wetzels 2012; Hair, Sarstedt, et al. 2018). LOCs of HOC Functional Integration and
four constructs of CP belong to Mode A because these constructs are reflectively measured.
The relationship from LOCs to their HOC, Functional Integration, describes Mode B since this
HOC is a formatively measured construct (Hair, Sarstedt, et al. 2018).

257
6.3 Model Assessment of Functional Integration
This section discusses model assessment of functional integration employed in this thesis.
Similar to Model 1, there are two evaluations of Model 2 using the PLS-SEM algorithm and
bootstrapping: the measurement model assessment and the structural model evaluation.
Figure 6.1: Model of Functional Integration and Company Performance (Model 2)
6.3.1 Assessment of the Outer Measurement Model in Functional Integration
This subsection presents the assessment of the outer measurement model. Because Model 2
adopts reflective-formative HCM, this subsection contains reflective and formative measures
evaluation.
6.3.1.1 Assessment of Reflective Measurement Model in Functional Integration
The reflective measurement model assessment in functional integration is discussed in this
subsection. Because all LOCs in Model 2 comprise reflective indicators, the assessment of the
measurement models was conducted as follows:

258
1. Assessment of indicator reliability
Figure 6.2 shows the results for the PLS algorithm of Model 2, while the resulting evaluation
of the Model 2 structural model is summarised in Table 6.1. The results show that indicator
reliability for all indicators of functional integration and CP are above the threshold value
of 0.50 and significant (Götz, Liehr-Gobbers & Krafft 2010; Hair, Risher, et al. 2018;
Sarstedt, Ringle & Hair 2017).
Figure 6.2: Results of PLS Algorithm of Model 2
2. Assessment of the internal consistency (construct) reliability
Table 6.1 shows that all reflective measures of Model 2 have Cronbach’s alphas above 0.8,
above the threshold value of 0.7 and, therefore, satisfactory (Bagozzi & Yi 2012; Hair et al.
2017; Hair, Ringle & Sarstedt 2011). CR for all constructs in Model 2 fall between 0.88 to
0.91, signifying that all measures are between the required 0.70 and 0.95 level (Bagozzi &
Yi 2012; Hair et al. 2017). Additionally, all constructs achieve a reliability coefficient ρA in

259
the range of 0.82 to 0.87 (Benitez et al. 2020; Sarstedt, Ringle & Hair 2017). Thus, these
results support the establishment of internal consistency reliability in Model 2.
Table 6.1: Reflective Construct Assessments of Model 2
Construct SD t-
value
p-
value
Indicator
reliability
Convergent
validity Internal consistency reliability
Loading AVE Cronbach’s
alpha
Composite
reliability
ρA
Cost 0.59 0.83 0.88 0.84
FI01 <- Cost 0.03 23.52 0.00 0.53 0.73
FI02 <- Cost 0.03 20.15 0.00 0.49 0.70
FI03 <- Cost 0.02 33.59 0.00 0.66 0.81
FI04 <- Cost 0.02 46.07 0.00 0.67 0.82
FI05 <- Cost 0.02 37.98 0.00 0.62 0.79
Innovation 0.60 0.83 0.88 0.84
FI06 <- Innovation 0.03 25.36 0.00 0.53 0.73
FI07 <- Innovation 0.03 26.26 0.00 0.62 0.79
FI08 <- Innovation 0.02 40.16 0.00 0.67 0.82
FI09 <- Innovation 0.03 29.96 0.00 0.59 0.77
FI10 <- Innovation 0.02 35.28 0.00 0.59 0.77
Quality 0.66 0.87 0.91 0.87
FI11 <- Quality 0.03 25.04 0.00 0.61 0.78
FI12 <- Quality 0.02 33.62 0.00 0.66 0.81
FI13 <- Quality 0.02 39.70 0.00 0.71 0.84
FI14 <- Quality 0.02 34.29 0.00 0.66 0.81
FI15 <- Quality 0.02 43.18 0.00 0.67 0.82
Supplier 0.61 0.84 0.89 0.84
FI16 <- Supplier 0.03 28.97 0.00 0.56 0.75
FI17 <- Supplier 0.03 27.24 0.00 0.55 0.74
FI18 <- Supplier 0.02 44.06 0.00 0.67 0.82
FI19 <- Supplier 0.03 27.99 0.00 0.62 0.79
FI20 <- Supplier 0.02 41.16 0.00 0.66 0.81
Customer 0.62 0.85 0.89 0.85
FI21 <- Customer 0.02 31.42 0.00 0.61 0.78
FI22 <- Customer 0.02 34.32 0.00 0.66 0.81
FI23 <- Customer 0.02 38.28 0.00 0.67 0.82
FI24 <- Customer 0.03 21.06 0.00 0.52 0.72
FI25 <- Customer 0.03 30.68 0.00 0.64 0.80
Employee 0.66 0.87 0.91 0.87
FI26 <- Employee 0.02 36.91 0.00 0.64 0.80
FI27 <- Employee 0.02 50.41 0.00 0.72 0.85
FI28 <- Employee 0.03 25.67 0.00 0.58 0.76
FI29 <- Employee 0.02 48.79 0.00 0.74 0.86
FI30 <- Employee 0.02 33.94 0.00 0.61 0.78

260
Table 6.1 (continued)
CCP 0.73 0.81 0.89 0.82
CP12 <- CCP 0.01 65.34 0.00 0.76 0.87
CP13 <- CCP 0.02 54.07 0.00 0.74 0.86
CP14 <- CCP 0.02 48.45 0.00 0.69 0.83
CEP 0.65 0.82 0.88 0.82
CP04 <- CEP 0.02 42.15 0.00 0.64 0.80
CP05 <- CEP 0.02 44.89 0.00 0.69 0.83
CP15 <- CEP 0.02 43.66 0.00 0.66 0.81
CP19 <- CEP 0.03 28.12 0.00 0.58 0.76
CFP 0.61 0.84 0.89 0.84
CP03 <- CFP 0.02 33.10 0.00 0.58 0.76
CP08 <- CFP 0.02 38.81 0.00 0.69 0.83
CP09 <- CFP 0.02 47.68 0.00 0.71 0.84
CP10 <- CFP 0.03 26.74 0.00 0.58 0.76
CP18 <- CFP 0.03 25.22 0.00 0.53 0.73
COP 0.59 0.83 0.88 0.83
CP01 <- COP 0.03 20.82 0.00 0.72
CP02 <- COP 0.03 25.05 0.00 0.74
CP06 <- COP 0.02 36.87 0.00 0.80
CP07 <- COP 0.02 50.26 0.00 0.82
CP17 <- COP 0.03 28.97 0.00 0.75
3. Assessment of the convergent validity
Results in Table 6.1 indicate that all indicators of Model 2 have a loading above 0.70 (Chin
2010; Hair et al. 2017). AVE values of six constructs of functional integration are more than
0.50 (Götz, Liehr-Gobbers & Krafft 2010; Hair, Ringle & Sarstedt 2011); that is, Cost
(0.59), Innovation (0.60), Quality (0.66), Supplier (0.61), Customer (0.62) and Employee
(0.66), respectively. Four constructs of CP also have AVEs above 0.5. As a result,
convergent validity has been established in Model 2.
4. Assessment of the discriminant validity
This thesis employed three approaches to assess discriminant validity: cross-loading,
Fornell-Larcker criterion and HTMT. First, in terms of cross-loading, the results in
Appendix C.2 show that each indicator loads more highly on their own construct than on
other constructs, indicating that all constructs share more variance with their measures than
with other constructs (Chin 2010). Second, Table 6.2 presents the results regarding Fornell-

261
Larcker criterion. Each construct shared more variance with its own measurement items than
with the constructs of the different measurement items (Fornell & Larcker 1981; Götz,
Liehr-Gobbers & Krafft 2010; Hair et al. 2017). These results indicate that the discriminant
validity has been established.
Table 6.2: Fornell-Larcker Testing of Model 2
Construct AVE 1 2 3 4 5 6 7 8 9 10 11
1 CCP 0.73 0.85
2 CEP 0.65 0.63 0.80
3 CFP 0.61 0.68 0.72 0.78
4 COP 0.59 0.66 0.72 0.74 0.77
5 Cost 0.59 0.38 0.43 0.45 0.49 0.77
6 Customer 0.62 0.39 0.49 0.40 0.48 0.49 0.79
7 Employee 0.66 0.38 0.60 0.44 0.48 0.46 0.71 0.81
8 Functional
Integration 0.42 0.48 0.62 0.54 0.57 0.71 0.86 0.83 0.65
9 Innovation 0.60 0.42 0.49 0.47 0.46 0.55 0.62 0.61 0.83 0.78
10 Quality 0.66 0.43 0.51 0.50 0.49 0.61 0.69 0.58 0.86 0.72 0.81
11 Supplier 0.61 0.34 0.53 0.42 0.41 0.45 0.68 0.69 0.81 0.57 0.58 0.78
Note: The square root of AVE (on bold remark) is shown in diagonal while the correlations are off-diagonal.
Last, Table 6.3 displays the HTMT values for all constructs. All LOCs of Model 2 have
HTMT values between 0.52 and 0.84, below the conservative threshold value of 0.85
(Henseler, Ringle & Sarstedt 2015). Discriminant validity was established between LOCs
and the reflectively measured constructs CCP, CEP, CFP, and COP with the HTMT value
ranging from 0.41 to 0.71, less than 0.85. HTMT values among four constructs of CP (i.e.,
CCP, CEP, CFP and COP) are below 0.90 (Henseler, Ringle & Sarstedt 2015). Furthermore,
the corresponding bootstrap confidence interval for all constructs does not include the value
of 1, indicating the HTMT value is significantly lower than 1 (Hair et al. 2017; Hair,
Sarstedt, et al. 2018). Nonetheless, it should be noted that the discriminant validity between
LOCs (Cost, Innovation, Quality, Supplier, Customer, and Employee) and their HOC
Functional Integration cannot be defined because the HOC measurement model repeats
indicators of its LOCs (Hair, Sarstedt, et al. 2018; Sarstedt, Hair, et al. 2019).

262
The results of three criteria of discriminant validity signify that each indicator had higher
loadings on their own construct than on other constructs (Chin 2010). Consequently, the
measurement model assessment of Model 2 was satisfactorily accomplished; therefore, it is
reliable and valid for further analysis.
Table 6.3: HTMT Values of Model 2
Note: The values in brackets represent the 95% bias-corrected and accelerated confidence interval of the HTMT
values obtained by running the bootstrapping routine with 5,000 samples in SmartPLS (Hair, Sarstedt, et al. 2018).
6.3.1.2 Assessment of Formative Measurement Models in Functional Integration
This subsection provides formative measurement model evaluation in functional integration.
Because HCM Functional Integration is reflective-formative HOC, the formative
measurements should be evaluated (Hair, Sarstedt, et al. 2018; Sarstedt, Hair, et al. 2019).
Table 6.4 presents the VIF and TOL values, showing VIF values of below five, and TOL values
of above 0.2. Thus, collinearity among the LOCs of HOC Functional Integration is not a critical
issue in this thesis (Hair et al. 2017; Hair, Risher, et al. 2018).
Table 6.4: Collinearity Test of Formative Measures of Model 2
Exogenous Construct Endogenous Construct VIF value TOL value
Cost Functional Integration 1.68 0.60
Customer 2.83 0.35
Employee 2.53 0.40
Innovation 2.45 0.41
Quality 2.88 0.35
Supplier 2.33 0.43

263
Table 6.5 exhibits the six paths from LOCs to HOC Functional Integration. They are
significant and have the same weight to establish the HOC Functional Integration (Hair,
Sarstedt, et al. 2018).
Table 6.5: Indicator Validity of Formative Measurements of Model 2
Second-Order
Constructs Paths Path Coefficient SD t-value p-value
Functional
Integration
Cost -> Functional Integration 0.17 [0.15, 0.19] 0.01 16.43 0.00
Customer -> Functional Integration 0.21 [0.19, 0.22] 0.01 29.40 0.00
Employee -> Functional Integration 0.22 [0.20, 0.24] 0.01 23.61 0.00
Innovation -> Functional Integration 0.20 [0.18, 0.22] 0.01 23.70 0.00
Quality -> Functional Integration 0.23 [0.21, 0.24] 0.01 27.73 0.00
Supplier -> Functional Integration 0.20 [0.18, 0.22] 0.01 20.24 0.00
To sum up, the assessment of the measurement model, including both reflective and
formative measures, suggests that 11 constructs used in Model 2 (10 LOCs and 1 HOC) were
reliable and valid in the context of this thesis. Therefore, the model can be used for further
analysis.
6.3.2 Assessment of the Structural Model in Functional Integration
Having confirmed that the measurement (outer) model has an adequate fit, the structural
(inner) model is now evaluated. The results of the evaluation are presented in this subsection.
Similar to strategic integration, the assessment of structural model of functional integration
covers six stages according to the guidelines from Hair et al. (2017), as per the following.
6.3.2.1 Assessment of Collinearity in Functional Integration
This subsection shows how to assess collinearity in functional integration. As shown in
Tables 6.6 and 6.7, outer and inner VIF values of indicators and constructs in Model 2 are less
than five. The results indicate no significant levels of collinearity in Model 2 (Hair et al. 2017).
6.3.2.2 Assessment of the Structural Model Relationships in Functional Integration
This subsection explains how to assess the structural model relationships in functional
integration and how to interpret the results. Path coefficients represent the strength of the

264
relationships between latent variables (Sarstedt, Ringle & Hair 2017). The path coefficients
usually range from -1 to +1, with coefficients closer to +1 suggesting strong positive
relationships, and those closer to -1 suggesting strong negative relationships (Sarstedt, Ringle
& Hair 2017).
Table 6.6: Outer VIF values of Model 2
Indicator VIF Indicator VIF Indicator VIF Indicator VIF
FI01 1.61 FI13 2.19 FI25 1.84 CP07 2.17
FI02 1.98 FI14 2.14 FI26 1.89 CP08 2.43
FI03 2.26 FI15 2.20 FI27 2.39 CP09 2.57
FI04 2.03 FI16 1.54 FI28 1.71 CP10 1.59
FI05 1.93 FI17 1.69 FI29 2.47 CP12 1.95
FI06 1.52 FI18 2.13 FI30 1.81 CP13 1.94
FI07 2.31 FI19 1.95 CP01 1.96 CP14 1.62
FI08 2.48 FI20 1.91 CP02 2.01 CP15 1.74
FI09 1.65 FI21 1.75 CP03 1.61 CP17 1.48
FI10 1.64 FI22 2.31 CP04 1.77 CP18 1.47
FI11 1.90 FI23 1.92 CP05 2.01 CP19 1.46
FI12 2.15 FI24 2.35 CP06 2.09
Table 6.7: Inner VIF values of Model 2
Construct 1 2 3 4 5 6 7 8 9 10 11
1 CCP 0.00 0.00 1.97 0.00 0.00 0.00 0.00 0.00 0.00 0.00 0.00
2 CEP 0.00 0.00 2.58 0.00 0.00 0.00 0.00 0.00 0.00 0.00 0.00
3 CFP 0.00 0.00 0.00 0.00 0.00 0.00 0.00 0.00 0.00 0.00 0.00
4 COP 0.00 0.00 2.51 0.00 0.00 0.00 0.00 0.00 0.00 0.00 0.00
5 Cost 0.00 0.00 0.00 0.00 0.00 0.00 0.00 1.68 0.00 0.00 0.00
6 Customer 0.00 0.00 0.00 0.00 0.00 0.00 0.00 2.83 0.00 0.00 0.00
7 Employee 0.00 0.00 0.00 0.00 0.00 0.00 0.00 2.53 0.00 0.00 0.00
8 Functional
Integration 1.00 1.00 1.73 1.00 0.00 0.00 0.00 0.00 0.00 0.00 0.00
9 Innovation 0.00 0.00 0.00 0.00 0.00 0.00 0.00 2.45 0.00 0.00 0.00
10 Quality 0.00 0.00 0.00 0.00 0.00 0.00 0.00 2.88 0.00 0.00 0.00
11 Supplier 0.00 0.00 0.00 0.00 0.00 0.00 0.00 2.33 0.00 0.00 0.00
▪ Direct Effect in Functional Integration
Table 6.8 presents the results of bootstrapping indicating the direct effects of Model 2 (Hair
et al. 2017; Wong 2016). As displayed in Figure 6.2, seven relationships have positive direct
effects. Six of them are positive, meaningful and significant direct effects. The most

265
substantial direct effects are in Functional Integration → CEP (β=0.62, t=21.86), then
Functional Integration → COP (β=0.57, t16.30), and last, Functional Integration → CCP
(β=0.48, t=10.28). Only one direct effect is weak and insignificant; this is Functional
Integration → CFP (β=0.05, t=1.40).
Table 6.8: Direct Effects of Model 2
Path Direct Effect SD t-value p-value Significant?
Functional Integration -> CCP 0.48 [0.38, 0.57] 0.05 10.24 0.00 Yes
Functional Integration -> CEP 0.62 [0.56, 0.68] 0.03 21.86 0.00 Yes
Functional Integration -> CFP 0.05 [-0.02, 0.14] 0.04 1.40 0.16 No
Functional Integration -> COP 0.57 [0.50, 0.64] 0.04 16.30 0.00 Yes
CCP -> CFP 0.24 [0.15, 0.34] 0.05 4.89 0.00 Yes
CEP -> CFP 0.29 [0.17, 0.41] 0.06 4.74 0.00 Yes
COP -> CFP 0.34 [0.23, 0.45] 0.06 6.01 0.00 Yes
Note: The values in brackets represent the 95% bias-corrected and accelerated confidence interval of the path
coefficients obtained by running the bootstrapping routine with 5,000 samples in SmartPLS.
▪ Mediating Effect in Functional Integration
As displayed in Model 2, there is a multiple mediation effect from constructs of CP (CCP,
CEP, and COP) to CFP (Hair et al. 2017). The model shows that CCP, CEP, and COP are
mediators that intervene in the relationship from Functional Integration to CFP. In other
words, the effect of the independent variable (HOC Functional Integration) on the dependent
variable (CFP) is mediated by third variables (e.g., CCP, CEP, and COP) (Nitzl, Roldan &
Cepeda 2016).
Following suggestions from Nitzl, Roldan and Cepeda (2016), the assessment of mediating
effects applies two steps as follows:
▪ Step a. Testing the strength of the indirect effect. As shown in Table 6.8, three paths have
positive and significant direct effects (b) on CFP. In sequence, results signify that COP
→ CFP has the most substantial path coefficient (β=0.34, t=6.01), followed by CEP →
CFP (β=0.29, t=4.74), and last, CCP → CFP (β=0.24, t=4.89).
Because Model 2 contains multiple mediation, the total indirect effect includes several
specific indirect effects (Hair et al. 2017). Table 6.9 presents three specific indirect

266
effects, significantly different from zero, and their confidence interval do not include zero
(Hair et al. 2017). Hence, the results fulfill the main criterion for determining mediation
(Nitzl, Roldan & Cepeda 2016).
Table 6.9: Specific Indirect Effects of Model 2
Path Specific indirect
effect SD t-value p-value Significant?
Functional Integration -> CCP -> CFP 0.12 [0.07, 0.17] 0.03 4.32 0.00 Yes
Functional Integration -> CEP -> CFP 0.18 [0.10, 0.26] 0.04 4.56 0.00 Yes
Functional Integration -> COP -> CFP 0.19 [0.13, 0.26] 0.03 5.75 0.00 Yes
Note: The values in brackets represent the 95% bias-corrected and accelerated confidence interval of the path
coefficients obtained by running the bootstrapping routine with 5,000 samples in SmartPLS.
The running of PLS algorithm revealed the total indirect effect from Functional
Integration to CFP with meaningful and significant path coefficient of 0.49, t-value of
13.52 and p-value of 0.00 (Chin 1998). Accordingly, the total effect for the relationship
between Functional Integration and CFP is calculated as follows: (Hair et al. 2017)
Direct effect of Functional Integration → CFP (c) = 0.05
Total indirect effect of Functional Integration → CFP (ab) = 0.49
Total effect (c’) = direct effect (c) + indirect effects (ab)
Thus, total effect of Functional Integration → CFP = 0.05 + 0.49 = 0.54
Table 6.10 displays the direct effects, indirect effects and total effects of Model 2. This
result identifies a change between the total effect and direct effect. Direct effect from
Functional Integration to CFP is weak and insignificant (β=0.05, t=1.40), while its total
effect is greater, positive and significant (β=0.54, t=16.09).
▪ Step b. Determining the type of effect and/or mediation. As presented in Table 6.10,
results show that mediators can change a relationship between FI and CFP. The direct
effect of its relationship is weak and insignificant, but its total effect is meaningful and
significant that is mediated by CCP, CEP, and COP. Accordingly, this mediation implies
an indirect-only (full) mediation type because the effect of FI to CFP is completely

267
transmitted with the help of the mediators variables (Hair et al. 2017; Nitzl, Roldan &
Cepeda 2016). Specifically, FI releases its influence only under a certain condition of
CCP (or CEP or COP) on CFP.
Table 6.10: Direct Effects, Indirect Effects and Total Effects of Model 2
Path
Direct
Effect
(a)
Direct
Effect
(b)
Indirect
Effect
(axb)
Total
Effect
(c’)
t-
value
p-
value
Functional Integration -> CCP -> CFP 0.12
[0.07, 0.17] 4.32 0.00
Functional Integration -> CCP 0.48
[0.38, 0.57] 10.24 0.00
CCP -> CFP 0.24
[0.15, 0.34] 4.89 0.00
Functional Integration -> CEP -> CFP 0.18
[0.10, 0.26] 4.56 0.00
Functional Integration -> CEP 0.62
[0.56, 0.68] 21.86 0.00
CEP -> CFP 0.29
[0.17, 0.41] 4.74 0.00
Functional Integration -> COP -> CFP 0.19
[0.13, 0.26] 5.75 0.00
Functional Integration -> COP 0.57
[0.50, 0.64] 16.30 0.00
COP -> CFP 0.34
[0.23, 0.45] 6.01 0.00
Functional Integration -> CFP 0.05
[-0.02, 0.14] 1.40 0.16
Functional Integration -> CFP 0.49
[0.42, 0.56] 13.52 0.00
Functional Integration -> CFP 0.54
[0.48, 0.61] 16.09 0.00
Table 6.11 presents the VAF value to measure the strenght of the mediators. CCP, CEP
and COP have partial mediating effects on the path from functional integration to CFP
with the VAF more than 0.20 (20%) (Hair et al. 2017). Among the three mediators, COP
has the most substantial effect on the Functional Integration → CFP (35%), followed by
CEP (33%) and last, CCP (22%).
Overall, the results from the structural model assessment of Model 2 show that HOC
Functional Integration with six LOCs has a positive and significant impact on CP. More
specifically, functional integration has an essential effect on CCP, CEP, and COP,
whereas its impact on CFP is significantly mediated by CCP and CEP as well as COP.

268
Table 6.11: VAF for Mediation Effect of Model 2
Path Direct Effect
(a)
Direct Effect
(b)
Indirect Effect
(a x b)
Total Effect
(c)
VAF
(per cent)
Functional Integration -> CCP -> CFP 0.48 0.24 0.12 0.54 22.22
Functional Integration -> CEP -> CFP 0.62 0.29 0.18 0.54 33.33
Functional Integration -> COP -> CFP 0.57 0.34 0.19 0.54 35.19
6.3.2.3 Assessment of the Coefficient of Determination (R2) in Functional Integration
The assessment of the coefficient determination in functional integration is discussed in this
subsection. As shown in Table 6.12, R2 values of the endogenous constructs are in the range
from 0.23 to 0.65, indicating varying degrees of predictive capability. CFP is the largest
predictor of the structural model with the R2 value of 0.65, because this construct has impacts
not only from HOC Functional Integration but also from the three mediators’ constructs,
namely CCP, CEP, and COP. This result suggests that the four constructs (LOCs), namely
Functional Integration, CCP, CEP, and COP, can jointly explain 65% of the variance of the
endogenous construct CFP. The same model estimation also reveals the R2 value for other
latent constructs. Functional Integration explains 39% of CEP, 33% of COP, and 23% of CCP.
Subsequently, CEP and COP have weak-to-medium levels of predictive accuracy, while CCP
has a weak effect. As HOC Functional Integration has six LOCs (Cost, Innovation, Quality,
Supplier, Customer, and Employee), it explains 100% of the variance of the HOC Functional
Integration the a R2 value of 1.00 (Becker, Klein & Wetzels 2012; Hair, Sarstedt, et al. 2018).
Table 6.12: R2 and Q2 values of Model 2
Endogenous Construct R2 value Q2 value
CCP 0.23 0.16
CEP 0.39 0.25
CFP 0.65 0.39
COP 0.33 0.18
Functional Integration 1.00 0.41
6.3.2.4 Assessment of the Effect Size (f2) in Functional Integration
This subsection how the effect size is evaluated in functional integration. Table 6.13 shows
that the range of f2 values is from 0.01 to 0.64 (Henseler, Ray & Hubona 2016). The strongest

269
effect size is from Functional Integration to CEP (0.64), then Functional Integration to COP
(0.49) and finally, Functional Integration to CCP (0.30). The medium effect size is disclosed
by COP on CFP (0.13). The results in Table 6.13 also demonstrate that Functional Integration
→ CFP as well as CCP → CFP and CEP → CFP have a weak effect size with the f2 values of
0.01, 0.09 and 0.09, respectively (Chin 2010; Cohen 1992; Hair et al. 2017).
Table 6.13: f2 Values of Model 2
Path f2 value
Functional Integration -> CCP 0.30
Functional Integration -> CEP 0.64
Functional Integration -> CFP 0.01
Functional Integration -> COP 0.49
CCP -> CFP 0.09
CEP -> CFP 0.09
COP -> CFP 0.13
6.3.2.5 Assessment of the Predictive Relevance (Q2) in Functional Integration
The predictive relevance assessment in functional integration is provided in this subsection.
Table 6.12 presents the Q2 values after carrying the blindfolding procedure using an omission
distance, D=7 (Hair et al. 2017; Henseler, Ringle & Sinkovics 2009). The resulting cross-
validated redundancy Q2 values are positive between 0.16 and 0.41, indicating that there is
significance in the prediction of the constructs (Hair, Risher, et al. 2018). Specifically, the
exogenous construct (HOC Functional Integration) has excellent predictive relevance for all
four endogenous constructs of CP.
6.3.2.6 Assessment of Effect Size (q2) in Functional Integration
This subsection shows how to evaluate effect size in functional integration. Table 6.14
presents q2 values (Hair et al. 2017). As Model 2 applies HCM, the q2 values cannot be
identified between predictors and outcomes. The q2 values should be assessed from six
predictors LOCs to their HOC, this is Functional Integration. The six LOCs have q2 values of
0.02, indicating a small to medium predictive relevance from them to their HOC. In addition,

270
the SRMR for the structural model was slightly above 0.08 (0.09 for Model 2), suggesting that
the model fit is quite good (Hair et al. 2017).
Table 6.14: q2 Values of Model 2
Endogenous Construct Cost Customer Employee Innovation Quality Supplier
CCP 0.01 0.00 -0.01 0.00 0.01 -0.01
CEP 0.00 0.00 0.01 0.00 0.00 0.00
CFP 0.00 0.00 0.00 0.00 0.00 0.00
COP 0.01 0.00 0.00 0.00 0.00 -0.01
Functional Integration 0.02 0.02 0.02 0.02 0.02 0.02
6.4 Discussion of Functional Integration
The findings of functional integration are discussed in this section. The objectives are to
address the research questions determined in Chapter 1 and to confirm the functional
integration hypotheses. The discussion is based on conceptual framework and hypotheses
developed in Chapter 3, current literature, and prior research findings, as well as PLS-SEM
data analysis. This section is divided into two subsections, each of them explains (i) discussion
of functional integration and company performance and (ii) discussion of mediating effect in
functional integration.
6.4.1 Discussion of Functional Integration and Company Performance
The results interpretation and the hypotheses verification of functional integration and
company performance is discussed in this subsection. The empirical evidence supports the
conceptualisation of functional integration as a HOC containing six associated LOCs: Cost,
Innovation, Quality, Supplier, Customer and Employee. The evaluations of the measurement
and the structural model have been achieved satisfactorily and signified that the model is quite
a good fit. The result demonstrates that the proposed model is considered appropriate for
exploring and predicting the integration of CSR into business strategy at the functional level
and its effect on CP among Indonesian manufacturing companies. Six LOCs of HOC

271
Functional Integration can represent how CSR can be integrated at the functional level,
particularly among manufacturing companies.
The proposed hypothesis investigates the relationship between functional integration and
CP. The direction and intensity of each hypothesised relation is assessed as results of PLS-
SEM data analysis, based on the path coefficients and their corresponding t-values. If paths are
significant and follow the way hypothesised, a prior hypothesis is empirically confirmed. By
comparison, if the paths are insignificant and do not follow the hypothesised direction, they do
not support the proposed causal relationship (Götz, Liehr-Gobbers & Krafft 2010). The four
first hypotheses test the relationship between functional integration and CP particular
hypotheses as follows:
▪ Hypothesis 2a (H2a): The functional integration of CSR and business strategy has a
positive impact on customer performance.
The finding reveals that functional integration has a significant impact on customer
performance (β=0.48, t=10.24, p<0.05), supporting H2a. Similar to Model 1, customer
performance in Model 2 includes customer satisfaction, customer loyalty, and increasing
number of consumers. This finding empirically supports a relationship between functional CSR
integration and customer performance. Specifically, functional integration includes some
activities related to customers (see Table 4.4 in Chapter 4 and Table 6.2 for details), for
instance, “Our company is honest with the customers in the sale or promotion of products and
services” and “We incorporate the interests of our customers in our business decisions”. These
activities will have a positive and significant impact on this essential primary external
stakeholder by enhancing customer satisfaction, improving customer loyalty and producing
more customers. Integrating CSR activities into the operation process will enable the
company's business operations to be performed responsibly (Busaya, Kalayanee & Gary 2009).

272
Particularly, integrating customers into functional integration also reflects the commitment
of companies to further engage in CSR by considering customers’ needs in relation to business
operations. Customers are more likely to trust responsible companies that operate honestly in
their activities and reflect the interests of both parties in the relationship when making
decisions. In addition, customers are more willing to engage with companies that carry out
socially responsible initiatives. Hence, customers are likely to support and reward companies
that spend the most om socially responsible programs by generating a greater satisfaction and
loyalty to them (Martínez & Rodríguez del Bosque 2013).
Moreover, Peloza and Shang (2011) argued that when CSR is implemented into a product,
customer satisfaction is greater. In functional integration, some CSR practices relate to the
product, such as developing environmentally friendly products and using eco-friendly
technologies and materials in processes, products, and packaging. The finding shows that these
activities can boost customer satisfaction.
▪ Hypothesis 2b (H2b): The functional integration of CSR and business strategy has a
positive impact on employee performance.
Current findings confirm that functional integration has a significant effect on employee
performance (β=0.62, t=21.86, p<0.05), supporting H2b. More specifically, this finding
provides new evidence that functional CSR integration enables companies to achieve better
employee performance measured by employee training, career opportunities, employee
motivation and overall social performance (see Table 6.2 and Figure 6.1).
There is a plausible explanation for this finding. One construct (LOC) of HOC Functional
Integration is Employee, with five indicators of how companies treat their employees legally
and ethically (see Table 4.4 in Chapter 4 for details). For example, “We provide procedures to
help to insure the health and safety of our employees” and “We treat our employees fairly and
respectfully, regardless of gender or ethnic background”. Workplace safety is a vital

273
component of employee well-being (Sprinkle & Maines 2010). Many see it as a worthy
objective in its own right to have a working atmosphere that improves employee well-being or
job satisfaction. It can be similarly concluded that people who are happy with their jobs can
more easily align with organisational goals and work more effectively (Chenhall 2003).
Furthermore, CSR practices that directly support employees should be more likely to meet
employees’ need for safety and security. Policies and procedures that demonstrate concern for
employees and provide a good working environment can enhance company attractiveness and
decrease counter-productive actions in the workplace (Bauman & Skitka 2012). Besides,
providing employees with equal working conditions and treating them well will result in greater
employee satisfaction and, ultimately, higher productivity (Aguilera et al. 2007).
The results suggest that through incorporating CSR into business strategy at the functional
level, especially carrying out effective employee-focused CSR activities, companies can
provide their employees with appropriate training, give them good job opportunities, and thus
increase employee motivation and boost overall social performance. Notably, functional
integration has the largest effect on employee performance compared with other CP.
This finding is supported by prior studies that argued CSR can also have a positive impact
on employees. For example, according to Cochran (2007), a company with good employee
relations can lower its employee turnover rate and improve employee motivation. Ihlen (2008)
claimed that companies have a moral responsibility towards their employees over and beyond
other social actors. Adams (2011) also contended that a company’s value depends on its
relationship with its employees; thus, it is essential to count employees as the most important
stakeholder when companies implement CSR. Moreover, Dhanesh (2012) highlighted that the
adaptation of CSR to the needs of internal stakeholders will contribute significantly to
organisational engagement that can further produce other internal returns, such as increased
loyalty from employees. As previously stated, functional integration also represents the good

274
will of companies to maintain good relationships with employees by treating them fairly and
respectfully. Michelon, Boesso and Kumar (2013) emphasised that a good partnership with
employees will increase a company's ability to recruit and retain employees and improve
employee commitment and effort, thus leading to efficiency and productivity enhancements.
Employees who work for socially responsible companies tend to experience high self-esteem
and work motivation because they associate themselves with their organisations (Singhapakdi
et al. 2015). Hadj (2020) found that if employees positively perceive their companies’ CSR,
pride in the company can be increased. If employees feel satisfied and motivated because the
company treats them well, employees will enjoy their work, feel at home, and will not leave
the company. They are also reluctant to hold demonstrations or strikes. These conditions enable
companies to carry out their operational activities in a convenient and safe manner.
▪ Hypothesis 2c (H2c): The functional integration of CSR and business strategy has a
positive impact on operational performance.
Functional integration is found to have a significant and positive impact on operational
performance (β=0.57, t=16.30, p<0.05), supporting H2c. As explained in the previous section,
the model in Figure 6.1 involves four indicators of operational performance, namely timeline
of customer service, delivery time, productivity, and operational efficiency. In this thesis,
functional integration has the second greatest effect on operational performance after employee
performance. Three dimensions in functional integration are closely related to operations,
namely cost, innovation and quality. For example, “We increase labour productivity”, “We
have introduced innovations and improvements in production processes, logistics or
distribution” and “We improve product performance and reliability”.
The findings are supported by prior studies. CSR actions related to internal aspects of the
company, such as a commitment to quality in internal operational processes, promotion of
innovation and employee care, contribute to short-term increases in labour productivity

275
(Sánchez & Benito-Hernández 2015). Additionally, companies have the opportunity to reduce
production costs, increase flexibility and improve the quality and performance of shipments
when they involve themselves in CSR initiatives, which impacts on their operational
performance in terms of cost, quality, delivery, and flexibility (Famiyeh 2017). Furthermore,
improved productivity can result from human resource management; for instance, when
companies are able to attract and retain talent as a result of their CSR commitments or when
employees become more productive due to better health and safety policies (Rasche, Morsing
& Moon 2017).
▪ Hypothesis 2d (H2d): The functional integration of CSR and business strategy has a
positive impact on financial performance.
The finding reveals that functional integration has a significant impact on financial
performance (β=0.54, t=16.09, p<0.05), supporting H2d. The finding is supported by previous
research. Companies can improve performance, such as profitability, sales growth, better return
on investment and increased market share, when they invest in CSR activities (Famiyeh 2017).
The findings of this thesis extend on previous research by showing companies integrating
CSR with specific activities at the functional level can have better financial performance
through good cash flow reports, increased sales growth and improved ROI. Particularly, in
Model 2, one critical dimension of functional integration is innovation. Some companies
benefit financially from CSR because their social and environmental efforts contribute to
innovative goods and services, which in turn boost revenue growth (Rasche, Morsing & Moon
2017).
6.4.2 Discussion of Mediating Effects in Functional Integration
With respect to mediation analysis in functional integration, this subsection presents the
three hypotheses verification as follows.

276
▪ Hypothesis 5a (H5a): The relationship between functional CSR integration and financial
performance is mediated by customer performance.
Customer performance is found to have a mediation effect on the relationship between
functional integration and financial performance (β=0.12, t=4.32, p<0.05), supporting H5a.
This result supports an argument that customer satisfaction mediates between the relationship
of CSR and financial performance. CSR significantly influences financial performance, and
this relationship is partially mediated by customer satisfaction, corporate reputation, and
competitive advantage (Sindhu & Arif 2017). Customer satisfaction will influence customer
buying decisions, which can be demonstrated as improved customer buying intentions or an
increasing customer willingness to pay higher prices for the companies’ products and services
(Bhardwaj et al. 2018; Goli ´nski 2019).
Previous studies highlight that CSR affects financial performance through the mediator of
customer satisfaction (García-Madariaga & Rodríguez-Rivera 2017; Luo & Bhattacharya
2006; Saeidi et al. 2015; Xie et al. 2017). CSR activities can help companies boost their
financial performance by enhancing customer satisfaction. Thus, companies can improve the
effect of CSR efforts on companies' financial performance by using the indirect effect of
customer satisfaction.
▪ Hypothesis 5b (H5b): The relationship between functional CSR integration and financial
performance is mediated by employee performance.
Current findings indicate that the relationship between functional integration and financial
performance can be mediated by employee performance (β=0.18, t=4.56, p<0.05), supporting
H5b.
The findings of this thesis highlight that mutual trust and cooperative partnerships between
a company and its employees can provide a competitive advantage (Jones 1995). In addition,
functional integration of CSR includes many employee-related CSR activities that can build an

277
environment of shared confidence that will improve employee performance (e.g., employee
motivation) (Maulamin 2017). If employees are happy at work, they tend to increase
productivity and decrease absenteeism, which have positive effects on a company’s financial
performance (Yuen et al. 2018).
▪ Hypothesis 5c (H5c): The relationship between functional CSR integration and financial
performance is mediated by operational performance.
Operational performance is indicated to have a significant mediation effect on the
relationship between functional operation and financial performance (β=0.19, t=5.75, p<0.05),
supporting H5c. This finding proves that shareholder welfare can be achieved by involving
operational priorities, such as quality, cost and delivery (Chenhall 2003). In addition,
companies are supposed to operate in a socially and environmentally responsible way in the
pursuit of economic benefits (Achda 2006).
CSP can be defined as the extent to which the expectations of stakeholders, with regards to
a company's behaviour towards the same or other relevant stakeholders, are met or exceeded.
This term also includes stakeholder managers (Husted 2000). Corporate social performance
depends on the extent to which the company meets or exceeds the expectations stakeholders
(Clarkson 1995). Where there is a high level of stakeholder satisfaction, corporate social
performance is high (Husted 2000).
Research has recorded numerous ways of generating value for stakeholders in CSR activities
while also increasing financial performance (Vishwanathan et al. 2020). For instance,
Michelon, Boesso and Kumar (2013) suggested that a company should align its CSR initiatives
to the stakeholders' likely expectations (captured by more focus on some CSR areas than
others) and then use CSR tools strategically to meet certain CSR goals. When a company
practices CSR initiatives linked to stakeholder preferences and allocates resources in a strategic
manner to those initiatives, the positive impact of its CSR initiatives on CFP will be

278
strengthened (Boesso, Favotto & Michelon 2015). Thus, managers interested in maximising
their CSR initiatives should plan their CSR initiatives according to the most important and
influential stakeholder priorities in terms of overall CSR contribution to CP (Boesso, Favotto
& Michelon 2015). Moreover, Famiyeh (2017) argued that a company can improve its
reputation, which positively influences financial performance by considering the expectations
of variety of stakeholders under stakeholder theory. When companies can develop closer
relationships with their stakeholders through CSR, those relationships will allow companies to
anticipate and prevent predictable risks (Vishwanathan et al. 2020).
This thesis extends on findings from prior studies because this thesis comprehensively
assesses the impacts of CSR integration, measured by customer, employee, operational and
financial performance. This thesis demonstrates companies can obtain many benefits through
functional CSR integration and thereby increase their competitiveness. More specifically,
based on the mediation analysis, the findings suggest that companies can achieve improved
financial performance through better performance of customers, employees and operating
because of integrating CSR into business strategy at the functional level.
Indonesia is the world's first nation to obligate companies, especially those related to natural
resources, to conduct CSR and to report their CSR activities (Maris 2014; Ridho 2018;
Sustainablesquare 2017; Waagstein 2011). At a minimum, companies dedicated to CSR should
implement principles and practices along with organisational processes to mitigate their
negative impacts and optimise their positive impacts on critical stakeholder issues (Isabelle,
Ferrell & Linda 2005). Thus, findings show that by integrating CSR, Indonesian manufacturing
companies implement CSR not only to comply with regulations but also to engage CSR in their
business operations in a manner that goes beyond any regulatory requirements.
Furthermore, there is an increasing trend in large companies in Indonesia to conduct CSR
as an integral part of the daily operations of a company (Widjaja 2011), which reflects the

279
increasing and diversity of the quantity and quality of CSR activities (Azzahra 2016). The idea
of standardising CSR implementation has also begun to emerge. Some ideas are even quite
detailed on how to implement and document CSR; for example, ISO 26000 for standardisation
of CSR management. GRI governs the issue of international reporting standards, known as the
Sustainability Report, with more than 70 criteria (Maulamin 2017).
Most studies aiming to determine the relationship between corporate social performance and
financial performance reveal a positive correlation (Bernal-Conesa, de Nieves-Nieto &
Briones-Peñalver 2017; Ganescu 2012a; Lee 2008). Under stakeholder theory, it is argued that
social performance may affect financial performance (Chtourou & Triki 2017) and by
responding to the expectations of various stakeholders, a company can enhance its reputation,
which positively influences its financial performance (Famiyeh 2017). Moreover, Tang, Hull
and Rothenberg (2012) identify that companies increase profits if they implement CSR strategy
consistently, including related dimensions of CSR and starting with those more internal to the
companies.
6.5 Multi-group Analysis in Functional Integration
After completing the direct and mediation analyses, the moderating effect in functional
integration is measured to provide a more complete picture of the relationship between
functional integration and CP. This sections presenst the results of MGA in functional
integration for business strategy, CSR strategy, company size, and industry type.
6.5.1 MGA Business Strategy in Functional Integration
MGA for business strategy in fuctional integration is discussed in this subsection. Based on
the guidelines from Matthews (2017), MGA is carried out as follows:
1. Generating data groups

280
Likewise strategic integration, three clusters of business strategy are used as categorical
variables: differentiation group (267 respondents), cost leadership group (154 respondents)
and no strategy group (14 respondents).
2. Analysing the MICOM
As three procedures in Step 1 MICOM have been met, this step has been established. Thus,
the following subsection explains Steps 2 and 3 of MICOM.
▪ Step 2. Compositional invariance. This thesis employed one-tailed testing, with results
presented in Appendix C.3. Comparing the correlation between the composite score of
the differentiation and cost leadership group (original correlations), the value of the 5%
quantile is always smaller than (or equal to) the value of the correlation permutation for
10 constructs (Henseler, Ringle & Sarstedt 2016). All 11 constructs have p-values
exceeding 0.05, indicating the establishment of compositional invariance.
▪ Step 3. Equality of composite mean values and variances. Appendix C.4 shows the results
for Step 3. The confidence interval of differences in means between the construct score
of the differentiation and cost leadership group does not include the original difference
in mean values as the mean-original difference for all constructs is too much above the
upper level of the confidence internal. Permutation p-values for the means are also below
0.05. Hence, there are significant differences in the mean values of latent variables across
the two groups (Hair, Sarstedt, et al. 2018). Conversely, the variance-original difference
for 10 constructs falls in the confidence interval of differences in variance between two
groups, and permutation p-values for variance are above 0.05.
Subsequently, these results signify partial measurement invariance across the two groups
(Matthews 2017), supporting the standardized path coefficient comparison across the groups
(Hair, Sarstedt, et al. 2018; Henseler, Ringle & Sarstedt 2016). Because of the mediating
effect, the total effect was used in the comparison of path coefficients. Appendix C.5 shows

281
the total effects from the permutation tests. The first two columns show the total effects in
the differentiation group and the cost leadership group, followed by their differences in the
original data set and permutation testing. All seven paths have different total effects between
two groups. Two significant total effect differences with p-values less than 0.05 are
Functional Integration → CCP and COP → CFP. These results suggest that the
differentiation group has a greater total effect than the cost leadership group in the
relationship between FI and CCP. In contrast, cost leadership has a bigger total effect than
the differentiation group in the path COP → CFP.
3. Analysing and Interpreting Permutation Results
Taking into account the results, the assessment of previous steps was continued by
examining the results of MGA (Hair, Sarstedt, et al. 2018; Henseler, Ringle & Sarstedt
2016). Table 6.15 shows the results for the PLS-MGA. There are total effect differences
between the differentiation and cost leadership group. The biggest significant differences
rely on Functional Integration → CCP (total effect difference=0.20, p=0.03) on COP →
CFP (total effect difference=0.20, p=0.04). These results suggest that total effects from FI
to CCP are bigger in the differentiation group than in the cost leadership group. Conversely,
the total effect from COP to CFP is larger in the cost leadership group than in the
differentiation group.
Table 6.15: PLS-MGA Business Strategy in Functional Integration
Totally, Table 6.16 presents PLS path estimations for the complete sample and subsamples
of business strategy. It can be shown that the total effects of both samples and the subsamples

282
are different. The significant difference is indicated by quite a big difference in the total effect
across all samples and subsamples (shown by bold marks in Table 6.16). Consequently, it is
appropriate to conduct MGA to analyse the total effect in each group of business strategy.
Table 6.16: Multi-group Results Business Strategy in Functional Integration
Path
All Samples Group 1
(Differentiation)
Group 2
(Cost)
Group 1
vs Group
2 N = 435 N = 267 N = 154
β CI β CI β CI p-value
Functional Integration -> CCP 0.48 0.38-0.57 0.50 0.42-0.58 0.30 0.12-0.46 0.03
Functional Integration--> CEP 0.62 0.56-0.68 0.58 0.51-0.65 0.59 0.48-0.67 0.47
Functional Integration -> CFP 0.05 -0.02-0.14 0.52 0.44-0.59 0.46 0.32-0.57 0.24
Functional Integration -> COP 0.57 0.50-0.64 0.56 0.48-0.62 0.46 0.33-0.56 0.13
CCP -> CFP 0.24 0.15-0.35 0.30 0.21-0.40 0.21 0.08-0.34 0.17
CEP -> CFP 0.29 0.17-0.41 0.32 0.21-0.42 0.18 0.02-0.33 0.10
COP -> CFP 0.34 0.23-0.45 0.27 0.17-0.37 0.47 0.31-0.61 0.04
Note: β = path coefficient; CI = 95% confidence intervals; bold marks = the significant difference in group
comparison
Appendix C.6 presents the results of parametrics and Welch-Satterthwaite tests, slightly
different from the results of PLS-MGA. The total effect difference is significant in two paths;
that is, Functional Integration → CCP and COP → CFP. In addition, at the 10% confidence
level, CEP → CFP has a significant total effect difference (0.15, p=0.09), suggesting that the
differentiation group has bigger total effects than the cost leadership group.
In sum, Table 6.17 presents the PLS multi-group results, which show similar results across
methods. Except for CEP → CFP, this path achieves the difference of total effect in parametric
and Welch-Satterthwaite tests.
Table 6.17: PLS Business Strategy in Functional Integration across Methods
Path Coefficient Permutation
Test
PLS-MGA
Test
Parametric
Test
Welch-Satterthwaite
Test
Functional Integration -> CCP X X X X
Functional Integration -> CEP
Functional Integration -> CFP
Functional Integration -> COP
CCP -> CFP
CEP -> CFP X X
COP -> CFP X X X X

283
6.5.2 MGA CSR Strategy in Functional Integration
This subsection explains how to conduct MGA for CSR strategy in functional integration.
Like strategic integration, MGA CSR strategy in functional integration is carried out with three
steps (Matthews 2017). As the configural invariance (Step 1 of MICOM) has been established
(Henseler, Ringle & Sarstedt 2016), the results of Step 2 and Step 3 are presented for each
group comparison of CSR strategy.
1. Proactive versus Reactive in Functional Integration
▪ Step 2. Compositional invariance. One-tailed permutation testing was employed because the
proactive group is assumed to have a bigger impact of functional integration on CP than the
reactive group. Appendix C.7 presents the results of Step 2 MICOM for comparing these
two groups. The value of the 5% quantile is always smaller than (or equal to) the value of
the correlation permutation for all constructs (Henseler, Ringle & Sarstedt 2016). This result
is also confirmed by most p-values exceeding 0.05, except Supplier which has a p-value
below 0.05. Accordingly, compositional invariance has not been established for all eight
constructs.
▪ Step 3. Equality of composite mean values and variances. Appendix C.8 displays the results
for Step 3. Since the confidence interval of mean differences between the proactive and
reactive groups does not include the original difference in mean values, there are significant
differences in the mean values of latent variables across the two groups (Hair, Sarstedt, et
al. 2018). The mean-original differences are above the upper level of the confidence interval,
implying significant variances across the two groups.
In contrast, the confidence intervals for differences in variance between the construct score
of these two groups do not include the original difference in variance values, particularly in
the eight constructs. The original differences in variance values are less than the lower level
of the confidence interval. In addition, this result is supported by permutation p-values for

284
variance below 0.05, indicating significant differences in the variance values of latent
variables across the two groups (Hair, Sarstedt, et al. 2018). Except for Supplier, CCP and
COP, these three constructs have p-values greater than 0.05 and their variance original
differences fall within the confidence interval.
Because these results indicate significant differences in both the means and variance values
across the two groups, the comparison of the standardized path coefficient across the groups
using MGA was supported with evidence (Hair, Sarstedt, et al. 2018; Henseler, Ringle &
Sarstedt 2016). The total effect was used in the comparison of path coefficients because of the
mediation effect, with results presented in Appendix C.9. The first two columns show the total
effects in the proactive group and reactive group, followed by their differences in the original
data set and the permutation testing, respectively. All seven paths have different total effects
between two groups, but not all of them are significant. The significant total effect differences
are shown by Strategic Integration → CEP (p=0.03). At the 10% confidence level, the
significant total effect difference lies on Strategic Integration → COP (p=0.07).
Given the outcome, the assessment of the previous measures was continued by running PLS-
MGA (Hair, Sarstedt, et al. 2018; Henseler, Ringle & Sarstedt 2016), with results in Table 6.18.
At the confidence level of 10%, the largest and significant total effect differences rely on two
paths: Functional Integration → CEP (total effect difference=0.11, p=0.07) and Functional
Integration → COP (total effect difference=0.12, p=0.08). In both paths, the reactive group has
a bigger total effect than the proactive group.
Table 6.18: PLS-MGA Proactive and Reactive in Functional Integration

285
The parametric and Welch-Satterthwaite tests are carried out to gain more confidence in the
final results achieved (Hair, Sarstedt, et al. 2018). Appendix C.10 shows results for the
parametric and the Welch-Satterthwaite tests, which are consistent with the permutation and
PLS-MGA tests and identify significant total impact differences between the two groups. More
specifically, at the 10% level, the total effect is different between two groups in the Functional
Integration → CCP and Functional Integration → CFP, which shows that the reactive group
has a greater total effect than the proactive group.
Table 6.19 summarises the PLS multi-group results. Four methods produce similar results,
which signify the total effect differences of the impact of Functional Integration on CEP and
on COP.
Table 6.19: PLS Proactive and Reactive in Functional Integration across Methods
Path Coefficient Permutation
Test
PLS-MGA
Test
Parametric
Test
Welch-Satterthwaite
Test
Functional Integration -> CCP
Functional Integration -> CEP X X X X
Functional Integration -> CFP
Functional Integration -> COP X X X X
CCP -> CFP
CEP -> CFP
COP -> CFP
2. Proactive versus Accommodative in Functional Integration
▪ Step 2. Compositional invariance. One-tailed testing is employed as proactive groups are
considered to have a bigger impact than accommodative groups. Appendix C.11 shows the
results of the permutation run in comparing the proactive and accommodative groups. The
consequence of comparing the correlation between the composite score of these two groups
means that the value of the 5% quantile for all constructs is equal to the value of the
permutation correlation (Henseler, Ringle & Sarstedt 2016). Most p-values exceed 0.05,
except for Quality, Functional Integration and CEP with p-values below 0.05. Based on
these results, compositional invariance has not been established for all constructs.

286
▪ Step 3. Equality of composite mean values and variances. Appendix C.12 presents the
results for Step 3. The confidence intervals of differences in means between the construct
score of the proactive group and accommodative group do not include the original difference
in mean values. Significant differences occur as the mean-original differences are above the
upper level of the confidence interval (Hair, Sarstedt, et al. 2018).
Regarding variance, some original difference in variance values fall outside the confidence
interval, but the others do not. The confidence intervals for Cost, Supplier, CCP and CEP
include the variance value original differences with permutation p-values greater than 0.05.
Hence, these results indicate that there are significant differences in the variance values of
latent variables across the two groups (Hair, Sarstedt, et al. 2018).
Appendix C.13 shows the total effect from the permutation test. At a 10% confidence level,
Functional Integration → CFP has a significant difference across two groups (total effect
difference=0.12, p=0.08). As these results imply substantial differences across the two groups,
they support running PLS-MGA (Hair, Sarstedt, et al. 2018) with results in Table 6.20. Only
one path has significant total effect differences, which implies that the accommodative group
has the stronger total effect than the proactive group; this is, Functional Integration → CFP
(total effect difference=0.12, p=0.08).
Table 6.20: PLS-MGA Proactive and Accommodative in Functional Integration
To increase confidence in the end results achieved, parametric and Welch-Satterthwaite tests
are conducted, with results in Appendix C.14 (Hair, Sarstedt, et al. 2018). Their results are in
line with results from the permutation test and PLS-MGA, showing significant differences in
total effects between proactive and accommodative group. Specifically, total effect difference

287
in Functional Integration → CFP is significant, which reveals that the accommodative group
has a bigger total effect than the proactive group.
The PLS multi-group results are summarised in Table 6.21. Four methods yield identical results
that show the total effect differences on CEP and COP as the impacts of functional integration.
Table 6.21: PLS Proactive and Accommodative in Functional Integration across Methods
Path Coefficient Permutation
Test
PLS-MGA
Test
Parametric
Test
Welch-Satterthwaite
Test
Functional Integration -> CCP
Functional Integration -> CEP
Functional Integration -> CFP X X X X
Functional Integration -> COP
CCP -> CFP
CEP -> CFP
COP -> CFP
3. Accommodative versus Reactive in Functional Integration
▪ Step 2. Compositional invariance. Because the accommodative group tends to have a greater
impact than the reactive group, one-tailed testing is employed with results in Appendix C.15.
The value of the 5% quantile for all constructs is smaller than (or equal to) the value of the
permutation correlation (Henseler, Ringle & Sarstedt 2016). Most have p-values above 0.05,
except for CCP and CEP, which have p-values below 0.05. CEP has a 5% quantile higher
than its original correlation. Thus, compositional invariance has not been established for all
composites.
▪ Step 3. Equality of composite mean values and variances. The composite’s equality of mean
values and variances across groups is assessed in Step 3 (Henseler, Ringle & Sarstedt 2016)
with results in Appendix C.16. Mostly, the original differences in mean values fall outside
the confidence interval. The mean-original differences are well above the upper level of
their confidence interval, suggesting substantial differences in the mean values of latent
variables between the two groups (Hair, Sarstedt, et al. 2018). However, five constructs have

288
mean original differences inside the confidence interval (i.e., Cost, Customer, Quality, CCP
and COP).
In terms of variance, most of the original difference in variance values falls within the
confidence interval with permutation p-values above 0.05. Only Quality has an original
difference in variance value outside its confidence interval (p-value =0.04). Accordingly,
these results imply a substantial difference both in means and variance values across the two
groups and support the necessity of comparing the standardized path coefficient across the
groups (Hair, Sarstedt, et al. 2018; Henseler, Ringle & Sarstedt 2016). Appendix C.17
presents the total effects from permutation tests. Although seven paths have different total
effects between two groups, their permutation p-values are above 0.05, indicating
insignificant differences.
To further analyse group-specific effects, PLS-MGA was run with the results in Table 6.22
(Hair, Sarstedt, et al. 2018; Henseler, Ringle & Sarstedt 2016). There are differences of total
effects across the two groups, significant with p-values above 0.05. Then, parametric and
Welch-Satterthwaite tests are conducted to complete MGA results (Hair, Sarstedt, et al. 2018).
Appendix C.18 shows their results are similar to PLS-MGA, indicating no significant
differences in total effects between two groups.
Table 6.22: PLS-MGA Accommodative and Reactive in Functional Integration
The results for MGA of CSR strategy in functional integration are presented in Tables 6.23
and 6.24. Both tables show that in most of the seven paths, the accommodative group dominates
with larger total effects than the reactive and proactive groups. Specifically, a bold remark in
Table 6.24 shows that in three group comparisons, the accommodative group has a significantly

289
larger total effect than the proactive group in Functional Integration → CFP. Nonetheless, in
some paths, the proactive group has a bigger and significant total effect in Functional
Integration → CEP and Functional Integration → COP compared to the reactive group. Thus,
the results suggest that CSR strategy moderates the impacts from functional integration to CP.
Table 6.23: MGA Results CSR Strategy in Functional Integration
Path
All Samples Group 1
(Reactive)
Group 2
(Proactive)
Group 3
(Accommodative)
N = 435 N = 145 N = 180 N = 110
β CI β CI β CI β CI
Functional Integration -> CCP 0.48 0.38-0.57 0.38 0.18-0.53 0.44 0.32-0.54 0.51 0.34-0.62
Functional Integration -> CEP 0.62 0.56-0.68 0.61 0.50-0.69 0.49 0.40-0.57 0.50 0.35-0.60
Functional Integration -> CFP 0.54 0.48-0.61 0.45 0.31-0.55 0.43 0.32-0.51 0.55 0.41-0.64
Functional Integration -> COP 0.57 0.50-0.64 0.56 0.44-0.65 0.44 0.31-0.52 0.54 0.38-0.65
CCP -> CFP 0.24 0.15-0.34 0.24 0.08-0.39 0.33 0.20-0.43 0.21 0.06-0.36
CEP -> CFP 0.29 0.17-0.41 0.27 0.09-0.45 0.22 0.10-0.34 0.28 0.11-0.45
COP -> CFP 0.34 0.23-0.45 0.38 0.20-0.54 0.37 0.25-0.50 0.31 0.12-0.49
Note: β = path coefficient; CI = 95% confidence intervals.
Table 6.24: Comparison of CSR Strategy in Functional Integration
Path
Proactive versus
Reactive
Proactive versus
Accommodative
Accommodative versus
Reactive
Proactive Reactive Proactive Accommodative Accommodative Reactive
Functional Integration -> CCP 0.44 0.38 0.44 0.51 0.51 0.38
Functional Integration -> CEP 0.49 0.61 0.49 0.50 0.50 0.61
Functional Integration -> CFP 0.43 0.45 0.43 0.55 0.55 0.45
Functional Integration -> COP 0.44 0.56 0.44 0.54 0.54 0.56
CCP -> CFP 0.33 0.24 0.33 0.21 0.21 0.24
CEP -> CFP 0.22 0.27 0.22 0.28 0.28 0.27
COP -> CFP 0.37 0.38 0.37 0.31 0.31 0.38
Note: the green colour means the significant difference in each comparison.
6.5.3 MGA Company Size in Functional Integration
How to perform MGA for company size in functional integration is discussed in this
subsection. Similar with strategic integration, MGA company size in functional integration are
conducted in three steps (Matthews 2017). Since all three procedures of Step 1 MICOM have
been met (Henseler, Ringle & Sarstedt 2016), the following presents Step 2 and Step 2
MICOM.

290
▪ Step 2. Compositional invariance. Appendix C.19 presents the results for Step 2 MICOM
and shows that the value of the 5% quantile is always equal to the value of the correlation
permutation (Henseler, Ringle & Sarstedt 2016). Most constructs have permutation p-values
over 0.05, but the p-values for four constructs are below 0.05. Thus, these results suggest
that the compositional invariance is not established for all 11 constructs.
▪ Step 3. Equality of composite mean values and variances. Appendix C.20 shows the results
of Step 3 MICOM. Most confidence intervals do not include the original difference in mean
values, while the mean-original differences of the seven constructs (i.e., Cost, Employee,
Innovation, Quality, Supplier, Functional Integration and CEP) are much greater than the
upper level of their confidence interval, implying significant variances across two groups.
Additionally, permutation p-values for the means of these seven constructs are less than
0.05, suggesting significant differences in the mean values of latent variables across the two
groups (Hair, Sarstedt, et al. 2018). However, the original difference in variance values for
the 10 constructs falls inside their confidence interval. They also have p-values above 0.05,
implying no significant variances across two groups.
Based on the results, the full measurement variance is not established. As these results
support partial measurement invariance, the standardized path coefficient across the groups
using a MGA can be compared with confidence (Hair, Sarstedt, et al. 2018; Henseler, Ringle
& Sarstedt 2016). Due to the mediation effect, the total effect is used in the comparison of path
coefficients presented in Appendix C.21. All seven paths have different total effects between
two groups. Total effect original differences for five paths fall within their confidence levels
with permutation p-values above 0.05. But the original difference of total effect for the other
two paths falls outside their confidence interval: Functional Integration → COP and CCP →
CFP. With permutation p-values less than 0.05, these results indicate significant differences
across the two groups, whereby large companies have a greater total effect than SMEs.

291
Taking into account the results, the assessment of previous steps is continued by examining
the results of MGA (Hair, Sarstedt, et al. 2018; Henseler, Ringle & Sarstedt 2016) with results
presented in Table 6.25. There are differences in path coefficients between large companies
and SMEs, but not all differences are significant. Two paths have significant differences:
Functional Integration → COP (total effect difference=0.15, p=0.04), and CCP → CFP (total
effect difference=0.19, p=0.03). These differences show that large companies have stronger
total effect than SMEs.
Table 6.25: PLS-MGA Company Size in Functional Integration
Generally, Table 6.26 presents PLS path estimations for the complete sample and
subsamples of company size. Total effects of all samples (pooled data) are different from total
effects in subsamples. Accordingly, the results confirm that the total effects evaluation should
be conducted across two groups as it provides a deeper analysis.
Table 6.26: MGA Results Company Size in Functional Integration
Path
All Samples Group 1 (Large) Group 2 (SME) Group 1
vs
Group 2 N = 435 N = 297 N = 138
β CI β CI β CI p-value
Functional Integration -> CCP 0.48 0.38-0.57 0.51 0.40-0.59 0.44 0.26-0.57 0.24
Functional Integration -> CEP 0.62 0.56-0.68 0.63 0.57-0.68 0.59 0.48-0.67 0.25
Functional Integration -> CFP 0.54 0.48-0.61 0.56 0.49-0.62 0.52 0.39-0.61 0.29
Functional Integration -> COP 0.57 0.50-0.64 0.62 0.54-0.67 0.47 0.33-0.57 0.04
CCP -> CFP 0.24 0.15-0.34 0.33 0.23-0.43 0.13 -0.03-0.26 0.03
CEP -> CFP 0.29 0.17-0.41 0.26 0.15-0.38 0.31 0.15-0.46 0.35
COP -> CFP 0.34 0.23-0.45 0.30 0.18-0.41 0.39 0.24-0.53 0.21
Note: β = path coefficient; CI = 95% confidence intervals; bold marks = the significant difference in group
comparison

292
To obtain comprehensive results, the parametric and Welch-Satterthwaite tests are carried
out, with results in Appendix C.22 (Hair, Sarstedt, et al. 2018). The results support the MGA
results, showing significant differences in Functional Integration → COP and CCP → CFP.
Overall, Table 6.27 summarises the PLS multi-group results, which show similar results
across methods. It can be concluded that total effects between large companies and SMEs differ
significantly in the relationship between functional integration and CP. Accordingly, the results
from multi-methods approach can provide confidence in the final results obtained (Hair,
Sarstedt, et al. 2018).
Table 6.27: PLS Company Size in Functional Integration across Methods
Path Coefficient Permutation
Test
PLS-MGA
Test
Parametric
Test
Welch-Satterthwaite
Test
Functional Integration -> CCP
Functional Integration -> CEP
Functional Integration -> CFP
Functional Integration -> COP X X X X
CCP -> CFP X X X X
CEP -> CFP
COP -> CFP
6.5.4 MGA Industry Type in Functional Integration
This subsection explains how MGA for industry type is conducted in functional integration
with three steps (Matthews 2017). Because the configural invariance (Step 1 MICOM) has
been met (Henseler, Ringle & Sarstedt 2016), the results of Step 2 and Step 3 MICOM is
explained as follows.
▪ Step 2. Compositional invariance. As non-ESI group is perceived to have less strategic
integration impact on CP than the ESI group, this thesis employed a one-tailed permutation
test, and results are presented in Appendix C.23. The value of the 5% quantile is always
equal to the value of the correlation permutation for all constructs (Henseler, Ringle &
Sarstedt 2016). Also, this result is confirmed by most p-values exceeding 0.05. Thus,
compositional invariance is established for 11 constructs.

293
▪ Step 3. Equality of composite mean values and variances. The composite’s equality of mean
values and variances across groups is assessed in Step 3 (Henseler, Ringle & Sarstedt 2016)
(see Appendix C.24). The confidence interval of differences in means between the construct
score of ESI and non-ESI groups include the original difference in mean values, indicating
insignificant differences across the two groups (Hair, Sarstedt, et al. 2018). The 11
constructs also have permutation p-values for variance above 0.05.
Most original difference of variance values fall within the confidence interval of differences
in variance between the construct score for non-ESI and ESI groups. Besides, permutation
p-values for variance are 0.05. In the case of CCP and CFP, their original difference of
variance values falls outside their confidence level, exceeding the upper level of the
confidence level. These two constructs have permutation p-values below 0.05. These results
suggest that significant differences in the variance values of latent variables across the two
groups was achieved (Hair, Sarstedt, et al. 2018).
To confirm the results, the total effect was compared (Hair, Sarstedt, et al. 2018; Henseler,
Ringle & Sarstedt 2016), with results in Appendix C.25. The first two columns present the total
effects in non-ESI and ESI groups, followed by their differences in the original data set and the
permutation testing, respectively. One path, CEP → CFP, has a significant different total effect
(0.22, p=0.04). At confidence level 10%, two paths have significant total effect differences:
Functional Integration → CCP (0.15, p=0.06) and Functional Integration → CFP (0.09,
p=0.08). These results imply that the non-ESI group has a bigger total effect than the ESI group.
Next, the assessment was continued by analysing the effects of MGA by running PLS-MGA
(Hair, Sarstedt, et al. 2018; Henseler, Ringle & Sarstedt 2016), with results shown in Table
6.28. There are differences between the ESI and non-ESI groups, but not all differences are
significant. At the 5% confidence level, only CEP → CFP has a significant total effect
difference (total effect difference=0.22, p=0.03). At 10% confidence level, the total effect

294
differences of two paths are significant: Functional Integration → CCP (total effect
difference=0.15, p=0.06) and Functional Integration → CFP (total effect difference=0.09,
p=0.1). These results show that in these relationships, non-ESI group have higher total effect
than ESI group.
Table 6.28: PLS-MGA Industry Type in Functional Integration
As shown in Table 6.29, total effects in complete sample (pooled data) are different from
total effects in subsamples of industry type (shown by bold marks in Table 6.29). Thereby,
MGA is appropriate for evaluating the differences between non-ESI and ESI groups.
Table 6.29: MGA Results Industry Type in Functional Integration
Path
All Samples Group 1
(ESI)
Group 2
(Non-ESI) Group 1
vs Group 2 N = 435 N = 228 N = 107
β CI β CI β CI p-value
Functional Integration -> CCP 0.48 0.38-0.57 0.41 0.29-0.51 0.55 0.43-0.5 0.06
Functional Integration -> CEP 0.62 0.56-0.68 0.59 0.51-0.65 0.66 0.58-0.71 0.13
Functional Integration -> CFP 0.05 -0.02-0.14 0.50 0.41-0.58 0.59 0.50-0.66 0.10
Functional Integration -> COP 0.57 0.50-0.64 0.56 0.47-0.65 0.58 0.50-0.65 0.38
CCP -> CFP 0.24 0.15-0.34 0.24 0.10-0.36 0.23 0.14-0.32 0.46
CEP -> CFP 0.29 0.17-0.41 0.19 0.05-0.34 0.41 0.31-0.52 0.03
COP -> CFP 0.34 0.23-0.45 0.38 0.24-0.51 0.28 0.17-0.39 0.15
Note: β = path coefficient; CI = 95% confidence intervals; bold marks = the significant difference in group
comparison
Appendix C.26 presents the results of the parametric and Welch-Satterthwaite tests of
industry type in functional integration. Results are in line with MGA results. Three paths have
significant differences of total effect between ESI and non-ESI groups: Functional Integration
→ CCP, Functional Integration → CFP and CEP →CFP. Table 6.30 summarises the PLS multi-
group results, showing that MGA results across methods are slightly similar.

295
Table 6.30: PLS Industry Type in Functional Integration across Methods
Path Coefficient Permutation
Test
PLS-MGA
Test
Parametric
Test
Welch-Satterthwaite
Test
Strategic Integration -> CCP X X X X
Strategic Integration -> CEP
Strategic Integration -> CFP X X X X
Strategic Integration -> COP
CCP -> CFP
CEP -> CFP X X X
COP -> CFP
6.5.5 Discussion of Multi-Group Analysis in Functional Integration
The discussion of MGA in functional integration are presented in this subsection. The
purposes are to answer the research questions and to verify the hypotheses. The discussion is
based on the conceptual framework and hypotheses outlined in Chapter 3, existing literature,
and research findings from prior studies, as well as PLS-SEM data analysis outcomes. The
discussion is divided into four subsections: (i) moderating effect of business strategy in
functional integration, (ii) moderating effect of business strategy in functional integration, (iii)
moderating effect of company size in functional integration, and (iv) moderating effect of
industry type in functional integration.
6.5.5.1 Moderating Effect of Business Strategy in Functional Integration
This subsection presents moderating effect analysis of business strategy in functional
integration. In relation to MGA in functional integration, there are several hypotheses whether
business strategy has a moderator effect in the relationship between functional integration and
CP as per the following.
▪ Hypothesis 7a (H7a): Business strategy moderates the impact of functional CSR
integration on customer performance.
Current findings reveal the relationship between functional integration and customer
performance is significantly influenced by business strategy (total effect difference=0.20,
p=0.03), supporting H7a. This finding shows that the differentiation group has a bigger total

296
effect than the cost leadership group. The finding is fairly justified. By offering higher quality,
better efficiency, or unique features, the differentiation strategy creates products or unique
services (Galbreath 2009; Porter 1985; Valipour, Birjandi & Honarbakhsh 2012). Companies
with a differentiation strategy focus on recognising consumer needs and adding value to
customers (Sun & Pan 2011), which ultimately boosts customer satisfaction and loyalty.
▪ Hypothesis 7b (H7b): Business strategy moderates the impact of functional CSR
integration on employee performance.
The result suggests the impacts of functional integration on employee performance are not
influenced by business strategy (total effect difference=0.00, p=0.47), thereby not supporting
H7b.
▪ Hypothesis 7c (H7c): Business strategy moderates the impact of functional CSR
integration on operational performance.
The result implies there is no difference impact of functional integration on operational
performance caused by business strategy (total effect difference=0.09, p=0.13), thereby not
supporting H7c.
▪ Hypothesis 7d (H7d): Business strategy moderates the impact of functional CSR
integration on financial performance.
The finding indicates that the relationship between functional integration and financial
performance is not influenced by business strategy (total effect difference=0.06, p=0.24),
thereby not supporting H7d.
Overall, business strategy affects only customer performance in the functional integration,
which suggests that the differentiation group has more significant total effects than the cost
leadership group. Business strategy does not mediate the relationship between functional
integration and other performance, namely employee, operating and financial performance.

297
There is a plausible explanation for these findings. Differentiation is the ability to provide
unique and superior value to the buyer in terms of the service (product) itself (i.e., design,
quality), marketing approach, delivery system, or after-sales service. It, therefore, permits a
company to charge a premium price, which leads to superior profitability, provided a
differentiator’s cost position is not so far above that of competitors so as to offset its price
premium (O'Farrell, Hitchens & Moffat 1992). A company following a differentiation strategy
aims to build a belief in consumers' minds that their goods or services possess superior features
relative to those of their rivals in terms of brand and credibility, reliability, design features and
efficiency (Sashi & Stern 1995). In most developing countries, companies implementing the
differentiation strategy do not focus on a single dimension but simultaneously emphasise
multiple dimensions, such as image, consumer loyalty, quality, innovation and service level
(Kim, Nam & Stimpert 2004). Moreover, compared to companies with cost leadership strategy,
companies with differentiation strategy have better socially responsible supply chain
management (Hoejmose, Brammer & Millington 2013), involved in functional CSR
integration.
In addition to moderating the effect of business strategy, other findings reveal the total effect
from COP to CFP is more significant in the cost leadership group than the differentiation group.
In manufacturing systems, the economies of scale and efficiency could be considered as key
examples of manufacturing skills associated with cost leadership strategy (Porter 1985). Lower
cost, although not neglecting quality, service and other areas, emphasises the ability of the
company to design, produce and sell a standardised product or service more efficiently than its
competitors with an emphasis on reaping cost advantages from all sources (O'Farrell, Hitchens
& Moffat 1992). One of four indicators of operational performance is operational efficiency.
Thus, it can be understood that companies with cost leadership strategy have a higher total
effect on operational performance compared with those with differentiation strategy.

298
6.5.5.2 Moderating Effect of CSR Strategy in Functional Integration
The hypotheses verification regarding moderating effect of CSR strategy in functional
integration is explained in this subsection. In terms of CSR strategy, hypotheses relate to
whether the impact of functional integration on CP is influenced by CSR strategy, as per the
following:
▪ Hypothesis 9a (H9a): CSR strategy moderates the impact of functional CSR integration
on customer performance.
The finding reveals that the impact of functional integration on customer performance is not
significantly different across the three groups of CSR (reactive, accommodative and proactive
group), thereby not supporting H9a.
▪ Hypothesis 9b (H9b): CSR strategy moderates the impact of functional CSR integration
on employee performance.
The empirical evidence shows that there are differences in total effects across three groups
of CSR strategy, particularly when comparing reactive and proactive groups. At the 10%
confidence level, the result indicates that the reactive group has a bigger total effect than the
proactive group (total effect difference=0.11, p=0.07). This suggests that the impact of
functional integration on employee performance is moderated by the CSR strategy, supporting
H9b.
▪ Hypothesis 9c (H9c): CSR strategy moderates the impact of functional CSR integration
on operational performance.
The result indicates that differences of total effects across the three groups of CSR strategy
are significant. More specifically, the accommodative group has a greater total effect than the
proactive group at the confidence level of 10% (total effect difference=0.12, p=0.08). In other

299
words, CSR strategy moderates the impact of functional integration on operational
performance, supporting H9c.
▪ Hypothesis 9d (H9d): CSR strategy moderates the impact of functional CSR integration
on financial performance.
The finding shows that the reactive group has a bigger total effect than the proactive group
at the confidence level of 10% (total effect difference=0.12, p=0.08). Thus, CSR strategy
moderates the impact of functional integration on financial performance, supporting H9d.
Totally, the findings suggest that CSR strategy has an influence on the relationship of
functional integration and CP, particularly on employee, operating and financial performance.
In particular, the reactive group has a more significant total effect than the proactive group on
employee and operational performance, while the accommodative group has a greater total
effect than the proactive group on financial performance.
The reactive strategy indicates that companies fulfil their economic responsibilities, and
they apply CSR at the basic level required to meet their regulatory compliance (Lee 2011;
Maignan et al. 1999; Torugsa, O'Donohue & Hecker 2013). Companies following the
accommodative strategy support certain ethical responsibilities, particularly those of their
stakeholders, without initiating voluntary actions for the common good (Ganescu 2012b). The
findings show that although companies implement CSR at a minimum to fulfil regulatory
compliance, they already make an effort to adopt values and norms along with organisational
processes to minimise their negative impacts and maximise their positive impacts on important
stakeholder issues (Isabelle, Ferrell & Linda 2005). Because companies focus on economic
responsibly, they carry out several activities to pursue their goals, such as cost savings,
enhancing employee motivation, increasing efficiency, improving productivity and
maximising profit.

300
Three corporate paradigms are relevant to implementation of the CSR system: first, the
organisation provides merely lip service and coercion, and second, the organisation makes
effort to comply. CSR is enforced because, for example, there are rules, legislation and
regulations that require it, and because there is market driven control. Third, companies take
steps beyond compliance towards enforcement. CSR is applied because there is a genuine
(internal driven) drive from within (Wibisono 2007, cited in Maulamin 2017).
6.5.5.3 Moderating Effect of Company Size in Functional Integration
In terms of company size, this subsection presents several hypotheses verifications whether
company size has a moderating effect on the relationship between functional integration and
CP.
▪ Hypothesis 11a (H11a): Company size affects the impact of functional CSR integration
on customer performance.
The finding shows that the impact of the functional integration on customer performance is
not influenced by company’s size (total effect difference=0.08, p=0.24), thereby not supporting
H11a.
▪ Hypothesis 11b (H11b): Company size affects the impact of functional CSR integration
on employee performance.
The relationship between functional integration and employee performance is not
significantly different across large companies and SMEs (total effect difference=0.05, p=0.25),
thereby not supporting H11b.
▪ Hypothesis 11c (H11c): Company size affects the impact of functional CSR integration
on operational performance.

301
Current findings reveal that the relationship between functional integration and operational
performance is significantly moderated by company size (total effect difference=0.15, p=0.04),
supporting H11c. This suggests that large companies have better COP than SMEs.
Larger companies have a greater social impact because of greater visibility (Dupire &
M’Zali 2018). They tend to have more power to monitor their operating environment and use
large-scale mass manufacturing techniques, which minimise the task uncertainty (Chenhall
2003). Moreover, the existence of economies of scale often leads to a cost advantage for larger
companies over small companies, assuming that large companies have the most efficient
facilities, distribution systems, service organisations and other functional units for its size
(Porter 1980b; Reverte, Gómez-Melero & Cegarra-Navarro 2016).
▪ Hypothesis 11d (H11d): Company size affects the impact of functional CSR integration
on financial performance.
The result suggests that the impact of functional integration on financial performance does
not differ by company size (total effect difference=0.04, p=0.29), thereby not supporting H11d.
Many studies examine the connection between company size and CSR. For example, Aras,
Aybars and Kutlu (2010) argued that company size has a significant relationship on CSR. Tang,
Hull and Rothenberg (2012) also contend that larger companies may have stronger motives for
engaging in CSR activities and can handle complicated and fast CSR engagement strategies
better, because they are more familiar with diverse operations. Nonetheless, this thesis provides
a new empirical finding, particularly when analysing the moderating effect of company size in
the relationship between functional CSR integration and CP. The results demonstrate that large
companies have significantly a stronger impact from functional integration on operational
performance.

302
6.5.5.4 Moderating Effect of Industry Type in Functional Integration
This subsection provides the hypotheses verifications whether industry type moderates the
relationship between functional integration and CP.
▪ Hypothesis 13a (H13a): Industry type affects the impact of functional CSR integration on
customer performance.
Findings demonstrate the relationship between functional integration and customer
performance is significantly influenced by industry type (total effect difference=0.15, p=0.06),
supporting H13a.
▪ Hypothesis 13b (H13b): Industry type affects the impact of functional CSR integration on
employee performance.
The finding suggests that the relationship between functional integration and employee
performance does not differ by the industry type (total effect difference=0.06, p=0.13), thereby
not supporting H13b.
▪ Hypothesis 13c (H13c): Industry type affects the impact of functional CSR integration on
operational performance.
The relationship between functional integration and operational performance is not
significantly different according to the industry type (total effect difference=0.02, p=0.38),
thereby not supporting H13c.
▪ Hypothesis 13d (H13d): Industry type affects the impact of functional CSR integration on
financial performance.
The results suggest there is a different impact of functional integration on financial
performance by industry type at the confidence level of 10% (total effect difference=0.09,
p=0.10), supporting H13d.

303
In general, the findings indicate that there is a significant difference of total effect based on
industry type. Specifically, the results suggest that non-ESI groups have higher total effects on
customer and financial performance than ESI groups. In the relationship between employee
and financial performance, non-ESI groups have a stronger total effect than ESI groups. There
is a plausible justification for this finding. The process of prioritisation and strategic approach
with regard to environmental CSR activities reinforces the CSR and CP relationship more in
ESI than in non-ESI companies (Boesso, Favotto & Michelon 2015). 'Business exposure'
should also be identified when assessing CSR; that is, the extent to which a company is
vulnerable to its environment (Michelon, Boesso & Kumar 2013). The industry in which a
company operates can also affect the pressures from various stakeholder groups it deals with.
Consumer product companies, for instance, encounter their greatest exposure and pressure
from customer groups, while companies in industrial sectors, such as utilities and oil and gas,
face the biggest push from stakeholders concerned about environmental effects. Conversely,
companies in industries such as consumer goods, utilities, and oil and natural gas are under
intensive scrutiny from various stakeholders (i.e., they face considerable business exposure),
so they are more likely to engage in certain CSR acts than companies in other industries
(Michelon, Boesso & Kumar 2013). Other industries, especially the newer manufacturing and
service industries, have significantly smaller environmental effects and are associated with less
visible environmental issues (Reverte, Gómez-Melero & Cegarra-Navarro 2016).
6.6 Results for all Tested Hypotheses in Functional integration
Based on evidence derived from the findings, this subsection shows 15 significant and
supported hypotheses that explain the relationship between functional CSR integration and CP,
the mediating effects, and the moderating effects on this relationship. However, the remaining
(eight) hypotheses that refer to the moderating effects are insignificant and hence unsupported.

304
The results of all hypothesised relationships in the functional integration of CSR into business
strategy are presented in Table 6.31.
Table 6.31: Final Results of Hypothesis in Functional integration
Hypothesis Propositions Results
H2a The functional integration of CSR and business strategy has a positive impact on
customer performance.
Supported
H2b The functional integration of CSR and business strategy has a positive impact on
employee performance.
Supported
H2c The functional integration of CSR and business strategy has a positive impact on
operational performance.
Supported
H2d The functional integration of CSR and business strategy has a positive impact on
financial performance.
Supported
H5a The relationship between functional CSR integration and financial performance is
mediated by customer performance.
Supported
H5b The relationship between functional CSR integration and financial performance is
mediated by employee performance.
Supported
H5c The relationship between functional CSR integration and financial performance is
mediated by operational performance.
Supported
H7a Business strategy moderates the impact of functional CSR integration on customer
performance.
Supported
H7b Business strategy moderates the impact of functional CSR integration on employee
performance.
Not
Supported
H7c Business strategy moderates the impact of functional CSR integration on operational
performance.
Not
supported
H7d Business strategy moderates the impact of functional CSR integration on financial
performance.
Not
supported
H9a CSR strategy moderates the impact of functional CSR integration on customer
performance.
Not
supported
H9b CSR strategy moderates the impact of functional CSR integration on employee
performance.
Supported
H9c CSR strategy moderates the impact of functional CSR integration on operational
performance.
Supported
H9d CSR strategy moderates the impact of functional CSR integration on financial
performance.
Supported
H11a Company size moderates the impact of functional CSR integration on customer
performance.
Not
supported
H11b Company size moderates the impact of functional CSR integration on employee
performance.
Not
supported
H11c Company size moderates the impact of functional CSR integration on operational
performance.
Supported
H11d Company size moderates the impact of functional CSR integration on financial
performance.
Not
supported
H13a Industry type moderates the impact of functional CSR integration on customer
performance.
Supported
H13b Industry type moderates the impact of functional CSR integration on employee
performance.
Not
supported
H13c Industry type moderates the impact of functional CSR integration on operational
performance.
Not
supported
H13d Industry type moderates the impact of functional CSR integration on financial
performance.
Supported

305
6.7 Conclusion of Functional Integration
This first part of this chapter presented results regarding the proposed hypotheses and
conceptual model previously developed in Chapter 3. Following guidelines for assessing
measurement and structural models, a HCM using a repeated-indicator approach was
employed, generating reliable and robust results.
After completing the reflective and formative measurement assessments, the reliability and
validity of structural models were checked. The findings indicate the reliability and validity of
the measurement and structural models are satisfactory. Thus, Model 2 can represent how CSR
is integrated at the functional level, which consists of six dimensions of functional integration
and four dimensions of CP with their indicators. Moreover, the hypothesised model of
functional integration of CSR (Model 2) was verified based on the statistical analysis. The
model was also evaluated for the mediating impact, which supported confirmation of the
hypotheses. The significance and relevance of coefficient paths of the structural model and
mediating effects were empirically identified.
MGA was also conducted to determine whether business strategy, CSR strategy, company
size and type of industry moderate the functional integration of CSR and its effect on CP.
Notably, with respect to functional integration, the results support 14 of 23 hypotheses, while
nine hypotheses were not confirmed.
The findings highlight that by concerning themselves with environmental and social issues,
companies can achieve competitive advantage (Moczadlo 2015). Notably, the findings provide
empirical evidence that contingency theory can be used to assess whether companies that match
their strategies with environmental requirements will achieve superior performance (Kotha &
Nair 1995).

306
II. The Combined CSR Integration
After investigating the integration of CSR into business strategy at the strategic and
functional levels, the relationship between both integrations is examined and presented in the
second part of Chapter 6. Because the descriptive analyses of strategic and functional CSR
integration were discussed in Chapter 5, this part presents PLS-SEM analysis of the combined
CSR integration.
6.8 Model Assessment in The Combined CSR Integration
This section explains how to assess the model in the combined CSR integration. Model 3
depicts the relationship between strategic and functional integration, which contains two
HOCs, Strategic Integration and Functional Integration (see Figure 6.3). HOC Strategic
Integration comprises three LOCs, while HOC Functional Integration consists of six LOCs.
Model 3 has four constructs of CP (see Table 4.10 and Figure 4.7 for details). The evaluation
of Model 3 covers two steps (the assessment of the measurement model and structural model)
using PLS-SEM algorithms and bootstrapping procedures.

307
Figure 6.3: Model of CSR Integration and Company Performance (Model 3)
6.8.1 Assessment of the Measurement Model in The Combined CSR Integration
The measurement model evaluation in the combined CSR integration is provided in this
subsection. Since Model 3 involves reflective-formative HCM, the assessment of the
measurement (outer) model contains reflective and formative measure evaluation. The results
are presented below.
6.8.1.1 Assessment of Reflective Measurement Model in The Combined CSR Integration
This subsection presents the reflective measurement model assessment in the combined
CSR integration. The assessment of Model 3’s measurement models include four criteria as
per the following (Götz, Liehr-Gobbers & Krafft 2010; Hair et al. 2017; Sarstedt, Ringle &
Hair 2017).
1. Assessment of indicator reliability
Table 6.32 presents the resulting evaluation of Model 3’s structural model, which indicates
that all indicators of strategic integration, functional integration, and CP have a significant

308
indicator reliability of above 0.50 (Götz, Liehr-Gobbers & Krafft 2010; Hair, Risher, et al.
2018; Sarstedt, Ringle & Hair 2017).
Table 6.32: Reflective construct assessments of Model 3
Construct SD t-
value
p-
value
Indicator
reliability
Convergent
validity Internal consistency reliability
Loading AVE Cronbach’s
alpha
Composite
reliability ρA
Aligning CSR with company’s strategy (Aligning) 0.67 0.88 0.91 0.88
SI01 <- Aligning 0.02 33.62 0.00 0.65 0.80
SI02 <- Aligning 0.02 44.52 0.00 0.68 0.82
SI03 <- Aligning 0.03 25.02 0.00 0.53 0.73
SI04 <- Aligning 0.01 58.70 0.00 0.76 0.87
SI05 <- Aligning 0.02 51.36 0.00 0.72 0.85
Support from top management (SuppTM) 0.74 0.91 0.93 0.91
SI06 <- SuppTM 0.02 51.71 0.00 0.73 0.85
SI07 <- SuppTM 0.01 66.16 0.00 0.78 0.88
SI08 <- SuppTM 0.02 45.09 0.00 0.71 0.84
SI09 <- SuppTM 0.01 73.80 0.00 0.77 0.88
SI10 <- SuppTM 0.02 43.46 0.00 0.70 0.83
Developing effective communication (EffCom) 0.75 0.91 0.94 0.91
SI11 <- EffCom 0.02 40.53 0.00 0.70 0.83
SI12 <- EffCom 0.02 53.94 0.00 0.72 0.85
SI13 <- EffCom 0.02 58.46 0.00 0.77 0.88
SI14 <- EffCom 0.01 63.83 0.00 0.77 0.88
SI15 <- EffCom 0.01 64.55 0.00 0.76 0.87
Cost 0.59 0.83 0.88 0.84
FI01 <- Cost 0.03 23.49 0.00 0.53 0.73
FI02 <- Cost 0.03 20.13 0.00 0.49 0.70
FI03 <- Cost 0.02 32.57 0.00 0.65 0.81
FI04 <- Cost 0.02 46.56 0.00 0.67 0.82
FI05 <- Cost 0.02 37.97 0.00 0.62 0.79
Innovation 0.60 0.83 0.88 0.84
FI06 <- Innovation 0.03 25.68 0.00 0.53 0.73
FI07 <- Innovation 0.03 26.12 0.00 0.62 0.79
FI08 <- Innovation 0.02 40.20 0.00 0.67 0.82
FI09 <- Innovation 0.03 29.59 0.00 0.59 0.77
FI10 <- Innovation 0.02 34.47 0.00 0.60 0.77
Quality 0.66 0.87 0.91 0.87
FI11 <- Quality 0.03 24.93 0.00 0.61 0.78
FI12 <- Quality 0.02 33.42 0.00 0.66 0.81
FI13 <- Quality 0.02 40.60 0.00 0.70 0.84
FI14 <- Quality 0.02 34.42 0.00 0.66 0.81
FI15 <- Quality 0.02 43.16 0.00 0.68 0.82

309
Table 6.32 (continued)
Supplier 0.61 0.84 0.89 0.84
FI16 <- Supplier 0.03 29.14 0.00 0.56 0.75
FI17 <- Supplier 0.03 27.24 0.00 0.54 0.74
FI18 <- Supplier 0.02 44.32 0.00 0.68 0.82
FI19 <- Supplier 0.03 28.06 0.00 0.62 0.79
FI20 <- Supplier 0.02 40.81 0.00 0.65 0.81
Customer 0.62 0.85 0.89 0.85
FI21 <- Customer 0.03 31.33 0.00 0.62 0.78
FI22 <- Customer 0.02 34.78 0.00 0.65 0.81
FI23 <- Customer 0.02 38.47 0.00 0.67 0.82
FI24 <- Customer 0.03 20.95 0.00 0.52 0.72
FI25 <- Customer 0.03 29.83 0.00 0.64 0.80
Employee 0.66 0.87 0.91 0.87
FI26 <- Employee 0.02 36.97 0.00 0.65 0.80
FI27 <- Employee 0.02 49.47 0.00 0.72 0.85
FI28 <- Employee 0.03 26.32 0.00 0.57 0.76
FI29 <- Employee 0.02 48.73 0.00 0.74 0.86
FI30 <- Employee 0.02 34.70 0.00 0.61 0.78
Company customer performance (CCP) 0.73 0.81 0.89 0.82
CP12 <- CCP 0.01 66.53 0.00 0.77 0.87
CP13 <- CCP 0.02 54.13 0.00 0.73 0.86
CP14 <- CCP 0.02 48.53 0.00 0.69 0.83
Company employee performance (CEP) 0.65 0.82 0.88 0.82
CP04 <- CEP 0.02 43.04 0.00 0.65 0.81
CP05 <- CEP 0.02 44.90 0.00 0.70 0.84
CP15 <- CEP 0.02 41.75 0.00 0.66 0.81
CP19 <- CEP 0.03 28.32 0.00 0.58 0.76
Company financial performance (CFP) 0.61 0.84 0.89 0.84
CP03 <- CFP 0.02 32.77 0.00 0.58 0.76
CP08 <- CFP 0.02 39.10 0.00 0.69 0.83
CP09 <- CFP 0.02 47.88 0.00 0.71 0.84
CP10 <- CFP 0.03 25.90 0.00 0.57 0.76
CP18 <- CFP 0.03 25.89 0.00 0.53 0.73
Table 6.32 (continued)
Company operational performance (COP) 0.59 0.83 0.88 0.83
CP01 <- COP 0.03 20.82 0.00 0.52 0.72
CP02 <- COP 0.03 24.71 0.00 0.54 0.74
CP06 <- COP 0.02 36.04 0.00 0.64 0.80
CP07 <- COP 0.02 49.66 0.00 0.67 0.82
CP17 <- COP 0.02 30.19 0.00 0.56 0.75

310
2. Assessment of internal consistency (construct) reliability
As displayed in Table 6.32, all reflective measures of strategic and functional integration
and CP have Cronbach’s alphas well above the threshold value of 0.70 and are satisfactory
(Bagozzi & Yi 2012; Hair et al. 2017; Hair, Ringle & Sarstedt 2011). CR for all Model 3
constructs fall between 0.70 and 0.95 (Bagozzi & Yi 2012; Hair et al. 2017). Furthermore,
all constructs have a reliability coefficient ρA ranging from 0.82 to 0.91 (Benitez et al.
2020). Hence, these results support the establishment of the internal consistency and
reliability of Model 3.
3. Assessment of convergent validity
Table 6.32 presents loadings for all indicators of functional integration and CP, which are
more than 0.70 (Chin 2010; Hair et al. 2017). AVE values for all constructs of strategic
integration, functional integration, and CP fall within 0.59 and 0.75, above the threshold
value of 0.50 (Götz, Liehr-Gobbers & Krafft 2010; Hair, Ringle & Sarstedt 2011). Model
3, thus, has satisfactorily achieved convergent validity.
4. Assessment of discriminant validity
Three approaches are employed to evaluate discriminant validity in Model 3, namely cross-
loading, Fornell-Larcker criterion and HTMT. Cross-loading results in Model 1 and Model
2 show that each indicator loads more on its own composition than on other constructs (see
Appendices B.7 and C.2). As Model 3 includes identical constructs and indicators with both
models, the cross-loading test is therefore not replicated.
Table 6.33 displays the results of Fornell-Larcker criterion, showing that each construct
shared more variance with its own measurement items than with the constructs of the
different measurement items. Nonetheless, there is a small variation for the Aligning-
SuppTM. Because the difference is small (0.01), it may be ignored (Rahim & Magner 1995).
There is also a little difference in HOC and its LOCs. The square root of AVE is less than

311
the correlations, particularly for EffCom-Strategic Integration, Customer-Functional
Integration, Innovation-Functional Integration and Quality-Functional Integration. It should
be noted, however, that HOCs should demonstrate the selective validity of all other models,
with the exception of their own HOCs, of which they are part (Sarstedt, Hair, et al. 2019).
Table 6.33: Fornell-Larcker Testing of Model 3
Note: The square root of AVE (on bold remark) is shown in diagonal while the correlations are off-diagonal.
Table 6.34 presents the HTMT values for all constructs, which fall between 0.31 and 0.83,
below the threshold value of 0.85 (Henseler, Ringle & Sarstedt 2015). Discriminant validity
was established between LOCs and the reflectively measured construct CCP, CEP, CFP,
and COP with the HTMT values ranging from 0.33 to 0.71, less than the threshold of 0.85.
HTMT values among four constructs of CP (i.e., CCP, CEP, CFP and COP) are below 0.90.
Nonetheless, the discriminant validity between LOCs and their related HOC Strategic
Integration, as well as HOC Functional Integration, cannot be determined because the HOC
measurement model repeats indicators of its LOCs (Hair, Sarstedt, et al. 2018; Sarstedt,
Hair, et al. 2019).
To sum up, the reflective measurement assessment of Model 3 has been established. As a
result, it is reliable and valid for further analysis.

312
Table 6.34: HTMT Values of Model 3
Note: The values in brackets represent the 95% bias-corrected and accelerated confidence interval of the HTMT
values obtained by running the bootstrapping routine with 5,000 samples in Smart PLS (Hair, Sarstedt, et al.
2018).
6.8.1.2 Assessment of Formative Measurement Models in The Combined CSR Integration
The formative measurements of HCM Strategic Integration (Model 1) and HCM Functional
Integration (Model 2) have been assessed in the previous chapters. The results show that
collinearity is not a critical issue (Hair et al. 2017; Hair, Risher, et al. 2018), and three LOCs
of HOC Strategic Integration and six LOCs of HOC Func2tional Integration have a similar
weight to form their related HOC (Hair, Sarstedt, et al. 2018).
6.8.2 Assessment of the Structural Model in The Combined CSR Integration
The structural model assessment of Model 3 is presented in this subsection that includes six
stages (Hair et al. 2017) as per the following.
1. Assessment of Collinearity in CSR Integration
The results indicate no significant levels of collinearity detected among the indicators and
the constructs in Models 1 and 2 (see 5.3.2.1 and in 6.3.2.1 for detail) (Hair et al. 2017).
2. Assessment of the Structural Model Relationships in CSR Integration

313
Figure 6.4 shows the direct effects as results from the PLS algorithm of Model 3, and Table
6.35 presents the direct effects as determined by bootstrapping procedures (Hair et al. 2017;
Wong 2016).
Figure 6.4: Results of PLS Algorithm of Model 3
The results show that 11 of 12 paths have positive direct effects. Although nine paths are
positive, only seven relationships have meaningful and significant direct effects with a path
coeeficient of at least 0.20 (Chin 1998). One path has a negative direct effect and is not
significant: Strategic Integration → CCP (β=-0.01, p=0.80).
Although the relationship between strategic and functional integration has a significant
direct effect at the 10% confidence level (p=0.06), it is not meaningful while its path
coeficient is 0.00, below the minimum value of 0.20 (Chin 1998). Accordingly, the result
suggest that CSR integration can be implemented either separately (i.e., Models 1 and 2) or
sequentially (Model 3).

314
Table 6.35: Direct Effects of Model 3
Path Direct Effect SD t-
value
p-
value Significant?
Strategic Integration -> CCP 0.03 [-0.07, 0.13] 0.05 0.55 0.58 No
Strategic Integration -> CEP 0.40 [0.31, 0.49] 0.04 9.17 0.00 Yes
Strategic Integration -> CFP -0.01 [-0.09, 0.07] 0.04 0.25 0.80 No
Strategic Integration -> COP 0.15 [0.05, 0.27] 0.06 2.72 0.01 Yes
Strategic Integration -> Functional Integration 0.00 [0.00, 0.00] 0.00 1.90 0.06 Yes
Functional Integration -> CCP 0.46 [0.34, 0.57] 0.06 7.95 0.00 Yes
Functional Integration -> CEP 0.39 [0.30, 0.48] 0.04 8.96 0.00 Yes
Functional Integration -> CFP 0.06 [-0.03, 0.14] 0.04 1.36 0.17 No
Functional Integration -> COP 0.48 [0.38, 0.58] 0.05 9.24 0.00 Yes
CCP -> CFP 0.24 [0.14, 0.34] 0.05 4.54 0.00 Yes
CEP -> CFP 0.30 [0.16, 0.43] 0.07 4.37 0.00 Yes
COP -> CFP 0.34 [0.23, 0.45] 0.06 5.97 0.00 Yes
Note: The values in brackets represent the 95% bias-corrected and accelerated confidence interval of the path
coefficients obtained by running the bootstrapping routine with 5,000 samples in Smart PLS.
In general, the mediation analysis in Model 3 produces similar results as Models 1 and 3.
There are mediating effects from three constructs of CP as mediators (CCP, CEP and COP)
in the relationship between both HOC Strategic Integration and HOC Functional Integration
and CFP. Because the mediation analysis of Models 1 and 2 can provide detailed and robust
results as previously discussed in Chapter 5 and 6 the assessment of the mediating effect is
not replicated in Model 3.
3. Assessment of the Coefficient of Determination (R2) in CSR Integration
Table 6.36 shows R2 values of the endogenous constructs ranging from 0.23 to 0.65, which
are not substantially different from the R2 values of Model 1 and Model 2. CFP is the largest
predictor of the structural model, with an R2 value of 0.65. As can be seen in Figures 5.1,
6.1 and 6.2, this construct is impacted by not only HOC Strategic Integration and HOC
Functional Integration but also three mediators, namely CCP, CEP, and COP. As a result,
this construct get the highest R2 value since the greater the number of predictor constructs,
the higher the R2 (Hair, Risher, et al. 2018). This result suggests that both HOCs can jointly
explain 65% of the variance of the endogenous construct CFP. The same model estimation
also reveals R2 values for other latent constructs: two HOCs explain 50% of CEP, 34% of

315
COP, and 23% of CCP. Subsequently, CEP and COP has weak-to-medium levels of
predictive accuracy, while CCP has a weak effect. Three LOCs, in particular, shape HOC
Strategic Integration depicting the variance of the HOC Strategic Integration by 100% with
an R2 value of 1.00. Likewise, HOC Functional Integration gets an R2 value of 1.00 because
it consists of six LOCs (Becker, Klein & Wetzels 2012; Hair et al. 2017; Hair, Sarstedt, et
al. 2018).
Table 6.36: R2 and Q2 values of Model 3
Endogenous Construct R2 value Q2 value
CCP 0.23 0.16
CEP 0.50 0.31
CFP 0.65 0.39
COP 0.34 0.19
Functional Integration 1.00 0.41
Strategic Integration 1.00 0.62
4. Assessment of the Effect Size (f2) in CSR Integration
Table 6.37 demonstrates that the range of f2 values falls between 0.00 and 0.23. Among 12
relationships, the strongest effect size is from Functional Integration to COP (0.23), while
the weakest effect size is from Strategic Integration to CCP (0.00). Totally, five paths have
a medium effect size, and four paths have a weak effect size. However, two paths have f2
values of less than 0.02, indicating that there is no effect (Hair et al. 2017).
Table 6.37: f2 Values of Model 3
Path f2 value
Functional Integration -> CCP 0.18
Functional Integration -> CEP 0.20
Functional Integration -> CFP 0.01
Functional Integration -> COP 0.23
Strategic Integration -> CCP 0.00
Strategic Integration -> CEP 0.21
Strategic Integration -> CFP 0.00
Strategic Integration -> COP 0.02
Strategic Integration -> Functional Integration 0.04
CCP -> CFP 0.08
CEP -> CFP 0.08
COP -> CFP 0.13

316
5. Assessment of the Predictive Relevance (Q2) in CSR Integration
Table 6.36 presents the resulting cross-validated redundancy Q2 values after running the
blindfolding procedure using an omission distance D=7 (Hair et al. 2017; Henseler, Ringle
& Sinkovics 2009). Q2 values of all constructs fall between 0.16 and 0.62. As they are
positive Q2 values, they indicate a significant prediction of the constructs. Specifically, the
exogenous constructs (HOC Strategic Integration and HOC Functional Integration) have
satisfactory predictive relevance for all four endogenous constructs of CP.
6. Assessment of Effect Size (q2) in CSR Integration
Table 6.38 shows results of the q2 calculations (Hair et al. 2017). Because q2 values fall in
the between 0.00 and 0.12, they suggest a small to medium predictive relevance from
exogenous constructs (two HOCs) to four endogenous constructs of CP.
Table 6.38: q2 Values of Model 3
Endogenous Construct CCP CEP CFP COP
Functional Integration 0.12 0.09 0.00 0.11
Strategic Integration 0.00 0.10 0.00 0.01
Finally, the SRMR for the structural model was slightly above 0.08 (0.09 for Model 3),
suggesting that the model fit is quite good (Hair et al. 2017).
6.9 Model Comparison
To further examine the relationships in Models 1, 2, and 3, the direct effects of these three
models are compared. This section presents the direct effects resulting from PLS-SEM data
analysis. As shown in Table 6.41, there is a difference in direct effects, particularly in the
relationship between strategic integration and CP. For example, Strategic Integration → CCP
has a positive and significant direct effect in Model 1 (β=0.30, p=0.00), but its direct effect is
insignificant in Model 3 (β=0.03, p=0.58). Strategic Integration → CEP has a positive and
significant direct effect in Model 1 and Model 3. However, the direct effect in Model 1 is
stronger (β=0.63) than in Model 3 (β=0.40). Similarly, Strategic Integration → COP has a

317
bigger and significant direct effect in Model 1 (β=0.43) than in Model 3 (β=0.15). Moreover,
Strategic Integration → CFP has a larger total effect in Model 1 (β=43) than in Model 3
(β=0.17); both total effects are significant.
Models 2 and 3 have slight similar direct effects in the relationships between functional
integration and CP. Even though, the direct effects in Model 2 are more significant than in
Model 3. For instance, the direct effect of Functional Integration → CEP in Model 2 (β=0.62)
is greater than in Model 3 (β=0.39). Furthermore, Table 6.39 shows that, in these three models,
the relationships between CCP, CEP and COP to CFP have nearly the same direct effects.
Table 6.39: Direct Effects and Total Effect Comparison across Three Models
Path
Model 1 Model 2 Model 3
Direct
Effect
Total
Effect
Direct
Effect
Total
Effect
Direct
Effect
Total
Effect
Strategic Integration -> CCP 0.30 0.30 0.03 0.03
Strategic Integration -> CEP 0.63 0.63 0.40 0.40
Strategic Integration -> CFP 0.01 0.43 -0.01 0.17
Strategic Integration -> COP 0.43 0.43 0.15 0.15
Functional Integration -> CCP 0.48 0.48 0.46 0.46
Functional Integration -> CEP 0.62 0.62 0.39 0.39
Functional Integration -> CFP 0.05 0.54 0.06 0.45
Functional Integration -> COP 0.57 0.57 0.48 0.48
Strategic Integration -> Functional Integration 0.00 0.00
CCP -> CFP 0.25 0.25 0.24 0.24 0.24 0.24
CEP -> CFP 0.30 0.30 0.29 0.29 0.30 0.30
COP -> CFP 0.35 0.35 0.34 0.34 0.34 0.34
Table 6.40 displays the specific indirect effects across the three models and shows the
differences among them. The difference in indirect effects of Models 1 and 3 falls between
0.07 and 0.10. Specifically, the mediating effects in Model 1 have a larger difference compared
to Model 3. For example, the indirect effect from SI to CFP mediated by CEP is more
substantial in Model 1 (β=0.15) than in Model 3 (β=0.05). Nonetheless, the difference in the
indirect effects of Model 2 and Model 3 is not substantial, between 0.01 and 0.06. For instance,
the indirect effect from functional integration to CFP mediated by CEP is 0.12 in Model 2 and
0.11 in Model 3.

318
Table 6.40: Specific Indirect Effects Comparison across Three Models
Path Model 1 Model 2 Model 3
Strategic Integration -> CCP -> CFP 0.08 0.01
Strategic Integration -> CEP -> CFP 0.19 0.12
Strategic Integration -> COP -> CFP 0.15 0.05
Functional Integration -> CCP -> CFP 0.12 0.11
Functional Integration -> CEP -> CFP 0.18 0.12
Functional Integration -> COP -> CFP 0.19 0.16
Because CP has been measured in four dimensions, each model has differences in the
strength of mediating effect among those four dimensions. In Model 1, the greatest mediating
effect lies on CEP, followed by COP and last, CCP. But, in Model 2, COP has the most
significant mediating effect, followed by CEP and CCP.
Generally, the results reveal that the indirect effects are greater if Models 1 and 2 are carried
out separately rather than aligned in Model 3, because alignment can impact the total effect.
Especially, as presented in Table 6.39, total effects from HOC Strategic and Functional
Integration to CFP are bigger if both models (Models 1 and 2) are conducted separately.
Since the results indicate that Models 1 and 2 should be applied independently, MGA is not
evaluated in Model 3 with the assumption that Models 1 and 2 have provided an acceptable
and robust result. Table 6.41 summarises the MGA results for both models, showing varying
results. Particularly, bold marks indicate a significant total effect. Business strategy can
moderate the relationship from strategic integration to CCP and CFP in Model 1, but only
moderates the relationship between functional integration and CCP in Model 2. The effect of
strategic integration on CCP and CFP in Model 1 can be moderated by CSR strategy.
Conversely, in Model 2, CSR strategy can moderate the impact of functional integration on
other CP; that is, CEP and COP and COP. Company size moderates the path from strategic
integration to three aspects of CP (i.e., CCP, COP and CFP). But company size can moderate
the impact of functional integration on only one CP, COP. In Model 1, industry type can
moderate the relationship between strategic integration and CFP only, whereas in Model 2, it
moderates the impact of functional integration on CCP and CFP.

319
Despite the variations in the moderating impact of Models 1 and 2, the findings show that
company performance as a result of both CSR integrations is influenced by business and CSR
strategies adopted by a company, as well as the company size and the type of industry. Those
four variables can therefore be considered as contingent variables in CSR integration.
However, these results are slightly different from those for strategic integration that show
that the proactive group has the largest total effect between the three CSR strategy groups.
Findings in functional integration are different, with the assumption that the proactive group
would get a greater total effect than the other two groups (i.e., reactive and accommodative
groups).
Table 6.41: MGA Results Model 1 and Model 2
6.10 Discussion of The Combined CSR Integration
This subsection offers a review of the combined CSR integration results explained in the
previous section. The aim is to answer the research questions as outlined in Chapter 1. The
discussion is based on the conceptual framework and hypotheses outlined in Chapter 3, current
literature, and research findings from prior research, as well as PLS-SEM data analysis.
▪ Hypothesis 3 (H3): Strategic CSR has a positive relationship with functional CSR
integrationy.
Research findings reveal that strategic integration has a positive relationship with functional
integration (β=0.00, t=1.90, p<0.10), supporting H3. However, the connection is not

320
meaningful as it is zero. Thus, this result suggests that strategic integration can be implemented
either separately or sequentially with functional integration. Either strategic or functional
integration could be conducted individually because they both have positive and significant
total effects on CP. This means that companies could implement functional integration without
completing strategic integration. However, if they are carried out sequentially, strategic
integration has no significant impact on customer performance. An organisation cannot pass
every level, and the stages can progress sequentially or concurrently. The implementation
process thus tends to be circular rather than linear (Lindgreen et al. 2011).
The findings suggest both strategic and functional integration can be conducted either
separately or sequentially. However, each implementation of either strategic or functional
integration gives a positive and more meaningful overall impact on CP. This means companies
could implement functional integration without completing strategic integration.
6.11 Conclusion of Combined CSR Integration
This section provided findings related to the hypotheses and conceptual model previously
outlined in Chapter 3, particularly regarding the relationship between strategic and functional
integration. Following the guidelines for the evaluation of measurement and structural models,
a HCM used a repeat-indicator approach, producing accurate and robust results. The findings
indicated that the reliability and validity of the measurement and structural models were
satisfactory. Thus, CSR was appropriate to be integrated into business strategy and operations
at the strategic and functional levels. The former represents a ‘top-down’ approach, whereby
companies begin with their competitive strategy to define company policy as guidance for
organisational work at the lower level (Skinner 1969). In this thesis, strategic integration
represents CSR integration conducted at the strategic level and comprises three dimensions
(i.e., aligning with the company’s strategy, gaining support from top management and
developing effective communication). The latter, functional integration reflects CSR

321
integration at the functional level by coordinating the six functions of companies: Cost,
Innovation, Quality, Supplier, Customer and Employee.
The hypothesised model of CSR integration into business strategy (Model 3) was verified
based on the statistical analysis. The significance and relevance of coefficient paths of a
structural model were empirically identified, which supports the proposed hypothesis. Strategic
integration has a minor impact on functional integration, according to the findings. Based on
the results, the findings suggest that Models 1 and 2 can be applied separately to have a greater
impact than combining as Model 3.
In terms of mediating effects, Models 1 and 2 produce approximately similar results, which
confirm that the relationship between both strategic and functional integration and financial
performance can be mediated by customer, employee, and operational performance. However,
in terms of the moderating effect, both models generate different results. The results also
indicate that business strategy, CSR strategy, company size and industry type have different
impacts on CP resulting from integration. In other words, there is a contingency in the
company's performance as an impact of CS integration, which depends on business strategy,
CSR strategy, company size, and industry type.
6.12 Summary of Chapter 6
This chapter discusses results related to functional integration and the combined CSR
integration, based on data analysis conducted with SPSS 26 and SmartPLS 3. HCM, using a
repeated-indicator approach, was employed in both integrations, producing reliable and robust
results. The assessment of reflective and formative measurement achieved satisfactory results.
The findings reveal that functional integration and the combined CSR integration have a
significant impact on company performance.
Furthermore, the hypothesised model of functional integration (Model 2) and model of the
combined CSR integration (Model 3) were verified based on the statistical analysis. To

322
complete the data analysis, MGA was also conducted to examine whether business strategy,
CSR strategy, company size, and type of industry moderate the functional integration of CSR
and the combined CSR integration, as well as their effects on CP.
This chapter also presents the comparison between Model 1, Model 2, and Model 3. In terms
of mediating effects, Models 1 and 2 generated similar results. They revealed that the
relationship between both strategic and functional integration and financial performance can
be mediated by customer, employee, and operational performance. Nonetheless, regarding
moderating effects, both models resulted distinctive results.
In total, the findings supported 16 of 24 hypotheses, while 8 hypotheses were not
confirmed. These findings suggest that stakeholders should be considered in CSR integration.
When companies incorporate their interests in CSR implementation, as well as business
strategy and operations, companies can achieve a better performance that will enhance their
competitive advantage.
In relation to the contingency, the findings show that business and CSR strategy, company
size, and industry type can influence company performance because of functional integration
and the combined CSR integration.

323
CHAPTER 7: CONCLUSIONS AND IMPLICATIONS
This chapter provides a conclusion of this thesis. An introduction is presented first, followed
by a summary and several key findings of this thesis. Next, this chapter discusses contributions
and implications, as well as the limitations of this thesis and directions for future research.
7.1 Introduction
The introduction to this thesis is summarised in this section. It begins by summarising the
research background, objectives, and research questions of this thesis. The research
methodology is then briefly explained. Finally, it summarises the findings of this thesis.
CSR, as one of the two key aspects of NMS (Baron & Diermeier 2007), is the most
frequently used term for highlighting the connection between companies and society (Branco
& Rodrigues 2006), and has received much attention over the past three decades. Arguably, a
company’s CSR should be aligned or integrated with its business strategy to further develop
its competitive advantage. Such integration is crucial to enhance companies social,
environmental, and financial performance (Carroll & Shabana 2010; Dey & Sircar 2012;
Galbreath 2006; Ganescu 2012b; Hasan et al. 2018; Marín, Rubio & de Maya 2012; Porter &
Kramer 2011; Torugsa, O'Donohue & Hecker 2013). Despite the potential impact of such
integration on CP, research on how CSR and business strategies can be integrated remains scant
(Rangan, Chase & Karim 2012).
The key objectives of this thesis were to investigate how companies integrate CSR into
business strategy and functions and to examine the impact of integrations on organisational
performance in the context of the Indonesian manufacturing sector. The primary research
questions of this thesis are:
1. To what extent are CSR and business strategy integrated?
2. How does such integration impact on a company’s performance?

324
These two primary research questions were complemented by the following subsidiary
research questions:
(i) To what extent does CSR integrate into business at the strategic and functional
levels?
(ii) To what extent does CSR integration affect company performance?
(iii) To what extent does social performance mediate the relationship between CSR
integration and financial performance?
(iv) To what extent do business and CSR strategies moderate the impact of CSR
integration on company performance?
(v) To what extent do company size and industry type moderate the impact of CSR
integration on company performance?
This thesis used quantitative research approach with a survey method to investigate how
manufacturing companies in Indonesia integrate CSR into their business strategy and functions,
and to identify the impact of such integration on their CP. A total of 514 questionnaires were
returned and after data screening, 435 responses remained in the data set, with a final effective
response rate of 41.23%.
This thesis developed a theoretical framework for integrating CSR with business strategy
and functions based on the literature review using stakeholder and contingency theories. Then,
it used survey data from 435 Indonesian companies of varying size and across different
manufacturing industries to test the hypotheses developed based on the theoretical framework.
SPSS 26 and SmartPLS 3 were employed for the statistical analyses to discover and evaluate
the direct, mediating and moderating effects. The findings of this thesis provide a deeper
understanding of how CSR can be integrated into business strategy at the strategic and
functional levels and the effect of these integrations on CP.

325
7.2 Thesis Summary
This section explains how the findings of this thesis can help to address the research
questions. It starts by outlining how each of the five research questions can be answered. It
then goes on to describe a summary of hypothesised relationship in CSR strategic and
functional integrations into business strategy.
As mentioned previously, this thesis proposed and tested the models that depicted the
relationship between the integration of CSR into business strategy and the impacts of this
integration on company performance. Based on the results, this thesis has provided a clear
response to Research Question One (RQ1), that is, the extent to which CSR can be integrated
into business strategy. To the best of my knowledge, this thesis is the first to investigate how
market and non-market strategies are aligned by integrating CSR into business strategy.
Business strategy represents the market strategy and CSR reflects the NMS. The findings
demonstrate that the integration of market and non-market strategies can be conducted at both
strategic and functional levels for companies’ financial and social benefit.
Moreover, the findings support the hypothesis that CSR integration in companies has a
meaningful impact on their customer, employee, operating and financial performance. As a
result, this thesis extends findings from previous studies by measuring company performance
across these four performance areas at the strategic and functional levels. It is one of the first
to examine the performance implications of integrating CSR into business strategy and
functions, both empirically and comprehensively. The findings of this thesis provide empirical
evidence that CSR practices, including CSR integration, can be a means to improve company
performance (Hur, Kim & Woo 2014). The findings are thus appropriate to answer Research
Question Two (RQ2), that is, the extent to which integration of CSR affects company
performance.

326
The findings of this thesis further reveal that strategic CSR integration has a positive effect
on functional CSR integration, although this effect is small. These findings show that CSR
integration at either the strategic or functional level has a positive and significant effect on
company performance. This relationship indicates that companies need to coordinate activities
and arrange them smoothly. They may integrate CSR at both levels, but have to ensure that
CSR integration at the strategic level can provide guidance for conducting integration at the
functional level. Hence, CSR is carried out in daily business operations and is a way of working
throughout a company. These findings suggest that through CSR integration, CSR can be
regarded as companies’ commitment to accounting for the social and financial effects of their
operations, and consistently ensuring that their stakeholders benefit from these effects.
Investigation of the social performance effect of CRS is highly critical when evaluating the
mechanisms through which CSR integration influences financial performance. The interaction
between stakeholders was proposed in the model using stakeholder theory. The results offered
a more in-depth understanding of how a company’s non-financial performance (customer,
employee, and operational performance) can mediate the effect of CSR integration on financial
performance. Accordingly, the findings of the mediation analysis can provide a robust answer
to Research Question Three (RQ3), that is, the extent to which social performance mediates
the relationship between CSR integration and financial performance. This thesis highlights that
when companies integrate CSR into business strategy, they should consider stakeholders
interests in the integration.
In addition, the findings suggest that CSR should be considered as a long-term investment,
rather than a temporary activity disconnected from a company's operational activities. A
company can consider CSR as their responsibility to stakeholders, whose support is needed to
run its business, including employees, suppliers and customers. Because CSR is a long-term
investment, the company cannot expect results from CSR over a short period. The benefits of

327
CSR instead need to be seen over the longer-term. Hence, the company must carry out CSR
consistently and continuously and adopt it as its lifestyle—as a way of working—so that all of
its functions are motivated and accustomed to doing CSR.
Furthermore, this thesis conducted MGA to explore the moderating impact of contingency
variables on the relationships between CSR integration and company performance. The results
show that variation exists in the relationship between CSR integration and company
performance, due to the influence of a company’s business and CSR strategy. Business strategy
can determine how companies run their business to achieve their goals, including whether they
are pursuing differentiation or cost leadership strategy. This thesis finds that in relation to
strategic and functional CSR integrations, companies adopting differentiation strategy achieve
better customer performance compared to those with cost leadership strategy. Surprisingly, this
thesis also discovered that in strategic CSR integration, companies with differentiation strategy
have a greater effect on financial performance than those that use cost leadership strategy.
Because business strategy is a crucial determinant of CSR performance (Yuan et al. 2020), this
thesis highlights that business strategy can moderate the impact of CSR integration on company
performance as a result of this integration.
The results of this thesis further highlight that CSR strategy moderates the relationship
between strategic CSR integration and company performance. The findings reveal that
proactive groups have the most substantial total effect on customer and financial performance
at the strategic level. In contrast, at the functional level, the reactive group achieves the greatest
total effect on employee and operational performance, while the accommodative group has the
most significant total effect on financial performance.
Furthermore, the findings of this thesis support the argument that company performance is
contingent on their business and CSR strategies. Specifically, the findings of the moderation
analysis provide empirical evidence to address Research Question Four (RQ4), that is, the

328
extent to which business and CSR strategies moderate the impact of CSR integration on
company performance.
In addition to business strategy and CSR strategy, this thesis applied other contingency
variables (i.e., company size and industry type) as control variables. Company size, determined
by the number of employees, may indicate organisational resources and capacity. This thesis
discovers that company size has a significant moderator impact on the relationship between
CSR integration and company performance. The results, especially at the strategic level,
indicate that large companies have better company performance than SMEs on customer,
employee, operating and financial performance. At the functional level, the results show that
large companies have a more substantial total effect on operational performance than do SMEs.
Industry type is classified by the kind of products that companies manufacture. The findings
indicate that industry type can moderate the impact of CSR integration on company
performance. Particularly at the strategic level, non-ESI groups have a more significant total
effect on financial performance than those of ESI groups. Nevertheless, at the functional level,
the results suggest slight differences. Non-ESI groups were found to have a more significant
total effect on customer and financial performance than ESI groups. These findings of the
moderation analysis thus support a clear response to Research Question Five (RQ5), that is, the
extent to which company size and industry type moderate the impact of CSR integration on
company performance.
The results of all hypothesised relationships in CSR strategic and functional integration into
business strategy are provided in Table 7.1.

329
Table 7.1: Final Results of Hypothesis of CSR Integrtation
Hypothesis Propositions Results
CSR integration-company performance relationship
H1 Strategic CSR integration has a positive impact on (a) customer
performance, (b) employee performance, (c) operational performance and
(d) financial performance.
Supported
H2 Functional CSR integration has a positive impact on (a) customer
performance, (b) employee performance, (c) operational performance and
(d) financial performance.
Supported
H3 Sstrategic CSR integration has a positive relationship with functional CSR
integration.
Supported
Mediating effects
H4 The relationship between strategic CSR integration and financial
performance is mediated by (a) customer performance, (b) employee
performance, and (c) operational performance.
Supported
H5 The relationship between functional CSR integration and financial
performance is mediated by (a) customer performance, (b) employee
performance, and (c) operational performance.
Supported
Moderating effects
H6 Business strategy moderates the impact of strategic CSR integration on (a)
customer performance, (b) employee performance, (c) operational
performance and (d) financial performance.
H6 (a,d) supported
H6 (b,c) not
supported
H7 Business strategy moderates the impact of functional CSR integration on
(a) customer performance, (b) employee performance, (c) operational
performance and (d) financial performance.
H7 (a) supported
H7 (b,c,d) not
supported
H8 CSR strategy moderates the impact of strategic CSR integration on (a)
customer performance, (b) employee performance, (c) operational
performance and (d) financial performance.
H8 (a,d) supported
H8 (b,c) not
supported
H9 CSR strategy moderates the impact of functional CSR integration on (a)
customer performance, (b) employee performance, (c) operational
performance and (d) financial performance.
H9 (a) not supported
H9 (b,c,d) supported
H10 Company size moderates the impact of strategic CSR integration on (a)
customer performance, (b) employee performance, (c) operational
performance and (d) financial performance.
Supported
H11 Company size moderates the impact of functional CSR integration on (a)
customer performance, (b) employee performance, (c) operational
performance and (d) financial performance.
H11 (a,b,d) not
supported
H11 (c) supported
H12 Industry type moderates the impact of strategic CSR integration on (a)
customer performance, (b) employee performance, (c) operational
performance and (d) financial performance.
H12 (a,b,c) not
supported
H12 (d) supported
H13 Industry type moderates the impact of functional CSR integration on (a)
customer performance, (b) employee performance, (c) operational
performance and (d) financial performance.
H13 (a,d) supported
H13 (b,c) not
supported

330
There are 13 main hypotheses and 47 specific hypotheses because each main hypothesis is
broken down into three to four supporting hypotheses. Based on the findings in Chapters Five
and Six, a total of 31 hypotheses (66%) are statistically supported, while the remaining 16
hypotheses (34%) are statistically insignificant and thus unsupported. Overall, all nine main
hypothesis related to the relationship between CSR integration and company performance
(H1a,b,c,d, H2a,b,c,d and H3) and six hypotheses of the mediating effect (H4a,b,c and H5a,b,c)
were supported. Regarding the moderating effect, among the 32 hypotheses (H6a,b,c,d -
H13a,b,c,d), 16 hypotheses (50%) were supported, while the rest were not supported. Through
the proposed and verified models, as well as supported hypotheses, this thesis emphasises that
CSR should be integrated with company strategy and implemented comprehensively to the
company's operational activities and decision-making processes.
Table 7.2 summarises the results of hypotheses verification, particularly regarding
mediating and moderating effects. The findings of strategic integration are similar to functional
integration. Nonetheless, having been influenced by the contingency variables, strategic and
functional integrations reveal different findings for the moderating effects.

331
Table 7.2: Summary of Hypotheses Verification
Propositions Strategic
Integration
Functional
Integration
The integration of CSR and business strategy has a positive impact on customer
performance.
√ √
The integration of CSR and business strategy has a positive impact on employee
performance.
√ √
The integration of CSR and business strategy has a positive impact on operational
performance.
√ √
The integration of CSR and business strategy has a positive impact on financial
performance.
√ √
The relationship between integration and financial performance is mediated by
customer performance.
√ √
The relationship between integration and financial performance is mediated by
employee performance.
√ √
The relationship between integration and financial performance is mediated by
operational performance.
√ √
Business strategy moderates the impact of integration on customer performance. √ √
Business strategy moderates the impact of integration on employee performance. - √
Business strategy moderates the impact of integration on operational
performance.
- -
Business strategy moderates the impact of integration on financial performance. √ -
CSR strategy moderates the impact of integration on customer performance. √ -
CSR strategy moderates the impact of integration on employee performance. - √
CSR strategy moderates the impact of integration on operational performance. - √
CSR strategy moderates the impact of integration on financial performance. √ √
Company size affects the impact of integration on customer performance. √ -
Company size affects the impact of integration on employee performance. √ -
Company size affects the impact of integration on operational performance. √ √
Company size affects the impact of integration on financial performance. √ -
Industry type affects the impact of integration on customer performance. - √
Industry type affects the impact of integration on employee performance. - -
Industry type affects the impact of integration on operational performance. - -
Industry type affects the impact of integration on financial performance. √ √
7.3 Conclusions
This section presents several conclusions that can be drawn based on the key findings of this
thesis. The first conclusion is that strategic integration between a company’s CSR and business
strategy can have a positive impact on its social and financial performance. Based on findings
presented in Chapter 5, strategic CSR integration has positive simultaneous effects on four

332
aspects of a company’s performance, namely customer, employee, operational and financial
performance. Thus, when a company starts integration at the strategic level by aligning CSR
with its objectives, gaining support from top management, and communicating CSR effectively
to its internal and external stakeholders, it can gain not only social but also financial benefits.
The second conclusion drawn from this thesis is that functional integration between CSR
and business can have a substantial impact on a company’s social and financial
performance. Based on the findings presented in Chapter 6, this thesis highlights that if
companies integrate CSR at the functional level through six key dimensions, namely Cost,
Innovation, Quality, Supplier, Customer and Employee, they can benefit from this integration
through customer, employee, operational and financial performance.
Based on these conclusions, this thesis emphasises that CSR integration has a positive
impact on company performance at several organisational levels, including financial
performance at the strategic level, operational performance at the operational level, and
customer and employee performance at the tactical level. In the pyramid of CSR (Carroll 1991),
philanthropic responsibility is placed on top. This means companies will carry out activities
related to philanthropic responsibility if they already fulfil the three other responsibilities on
the pyramid below, that is, economic, legal and ethical responsibilities. The primary goal of
companies is indeed to gain profits. However, they also have to consider how to run their
business legally and ethically through integrating CSR among their core values and activities.
This has changed in recent decades as companies are expected to fulfil social and
environmental targets to meet the needs of all stakeholders and to ensure their own long-term
existence (Cazeri et al. 2018). Because stakeholders, such as customers and employees, have
to be satisfied prior to any improvements in financial performance, it is essential that CSR
practices are evaluated, aligned with the interests of stakeholders, and implemented to their

333
satisfaction (Bhattacharya, Korschun & Sen 2009). This concern can be resolved by CSR
integration as defined in this thesis.
Furthermore, the integration of CSR, both at the strategic and functional levels, reflects that
companies want to engage deeply and continuously in CSR. Strategic integration can reflect
CSR ‘talk’, similar to the type of symbolic impression management strategies that include the
different ways in which the company interacts with its external stakeholders, such as customers
(Rasche, Morsing & Moon 2017). Functional integration, in contrast, can indicate CSR ‘walk’
that involves substantive and behavioural practices within the company, such as modifying
manufacturing processes to reduce environmental impacts or improving working conditions
through the company’s supply chain (Rasche, Morsing & Moon 2017). Companies that ‘walk’
CSR invest in responsible business behaviour and incorporate CSR in key business processes
to achieve measurable results (Rasche, Morsing & Moon 2017). Thus, this thesis
comprehensively describes how companies can ‘talk’ and ‘walk’ CSR. Instead of conducting
CSR in discretionary activities, such as donation and compliance, this thesis highlights that
companies should carry out CSR comprehensively and commit to it by aligning CSR with
business strategy and implementing CSR in their business operations. In doing so, companies
are undertaking an endless improvement change and continuous development and, at the same
time, increase their contributions to stakeholders socially and financially. CSR integration also
represents a leap in CSR practices. Companies shift from traditional CSR, which is carried out
through discretionary and short-term activities with no impact on financial performance, such
as donations and charities, to strategic CSR, which has a significant impact on financial
performance.
Donation and charity activities are easily imitated by competitors because they are
momentary and customised to their needs. In contrast, the integrated implementation of CSR
across all company functions is not easily copied by competitors. It takes a long time and

334
sufficient resources to integrate CSR into value chain activities. As a result, CSR integration
may serve the competitive advantage of a company, suggesting a unique and precise
differentiator from competitors.
Third, it can be concluded that there is a positive relationship between strategic and
functional integration. As explained in Chapter 6, although the impact is not large, this finding
shows that integration of CSR at the strategic level would have an impact on integration of
CSR at the next level, such as at the functional level. The result confirmed an argument that
companies show various levels of CSR concern (Öberseder, Schlegelmilch & Murphy 2013).
Particularly in the context of the Indonesian manufacturing industry, this finding implies that
CSR integration is more easily implemented at the functional level than the strategic level. It
also suggests that many activities related to the requirements of the manufacturing sector have
been carried out to date, such as environmental legislation, labour laws, ISO and supply chain
management. Nonetheless, the companies do not know that these activities are also linked to
CSR.
The fourth conclusion is a positive link between a company’s social performance and its
financial performance. By investigating the mechanism of the relationship between CSR and
financial performance in greater depth using multiple mediations, the findings in Chapter 5
provide crucial evidence that strategic CSR integration has the most significant direct and
mediating effect on employee performance. The findings in Chapter 6 highlight that in
functional CSR integration, employee performance has the second greatest direct and
mediating effect after operational performance. With respect to stakeholder theory, this finding
reveals that employees are important internal and primary stakeholders who are most impacted
by CSR integration. These findings suggest that companies should implement CSR with
internal primary stakeholders before undertaking CSR with external stakeholders. Employees
can see how companies operate their business in a responsible, legal, and ethical manner while

335
pursuing economic profit. If they are satisfied with what companies are doing to them, they
will then be motivated to work better, more effectively and more productively.
Notably, the findings of this thesis also show that operational performance has the second-
highest direct effect and the second greatest mediating effect on strategic and functional CSR
integrations. To date, there has been little research analysing the impact of CSR on operational
performance. Thus, this thesis offers critical new findings, particularly in non-market studies
and the manufacturing sector, that CSR integration can have a positive impact on operational
performance. Functional integration involves CSR in all activities along the value chain, which
relate to suppliers, production, employees, and customers. If companies conduct these activities
well and responsibly, they will undoubtedly have an impact on operational performance.
In addition to employee and operational performance, this thesis provides empirical
evidence that CSR integration has a significant and positive impact on customer performance,
which plays a significant role in the mechanism through which CSR affects financial
performance. A company’s dedication to CSR integration reflects that it will treat its customers
well and produce goods responsibly. Consequently, customers can be satisfied with and loyal
to that company; they are likely to repeat buying, increase their buying volume and promote
the products to others (through word-of-mouth) which, in turn, can improve financial
performance. Satisfied and loyal customers can also provide an excellent image of the
company, which will boost its reputation.
Overall, the mediation analysis showed that customer, employee, and operational
performance represents a mechanism underlying the relationship between CSR integration and
financial performance. Strategic and functional CSR integrations contribute to customer
performance, which in turn leads to better financial performance. Likewise, they positively
influence employee performance, which then impacts financial performance. Similarly, they
lead to operational performance, which in turn affects financial performance. Through an

336
examination the potential mediating role of social (i.e., customer and employee) and
operational performance, the mechanisms through which CSR integration significantly impacts
on financial performance can be better understood. Accordingly, this thesis provides one well-
researched empirical mechanism through which CSR integration has been found to influence
financial performance including customer, employee, and operational performance.
Furthermore, regarding stakeholder theory, the results offer new key findings that
customers, employees, and other stakeholders are more supportive of socially responsible
companies. Thus, by conducting ethical, legal, and responsible activities, companies have the
potential to increase their competitive advantage.
Last, this thesis concludes that the impact of CSR integration on company performance can
be moderated by several contingent variables. In terms of CSR strategy, this thesis finds that
CSR strategy affects the impact of CSR integration on company performance in different ways.
Especially in relation to strategic CSR integration, this thesis proposes that CSR in those
proactive companies can have a more substantial impact on customer and financial
performance. Companies that implement proactive strategy fully understand their social
obligations and actively participate in meeting the needs of stakeholders (Ganescu 2012b),
while ensuring economic, social and environmental development that exceeds the level needed
to comply with government regulations (Torugsa, O'Donohue & Hecker 2013; Wagner, Lutz
& Weitz 2009).
Proactive strategy indicates that companies do more than what is legally required.
Particularly in Indonesia, companies can be rewarded by their excellent efforts in CSR
implementation. Such rewards can certainly increase the company’s reputation from
stakeholders’ perspectives, including customers, shareholders, and investors. Customers will
have more trust in the companies, while shareholders and investors will be more interested in
investing their money in them. These impacts can increase the stock price of companies.

337
Surprisingly, in functional CSR integration, the findings of this thesis reveal that reactive
companies have better results in terms of employee and operational performance. In contrast,
accommodative companies obtain a greater impact than others. Companies that follow reactive
strategy focus on economic responsibility and practice CSR merely to comply with regulations
(Lee 2011; Maignan et al. 1999; Torugsa, O'Donohue & Hecker 2013). Consequently, such
companies perform CSR limited to the level of charity, which is temporary and tailored to
needs, such as donations in response to natural disasters and building village roads. However,
these activities are more visible, which shows that they have met CSR regulations. Thus,
companies can concentrate on their internal process and plan how they can achieve high profit.
In Indonesia, regulations exist regarding employees. For example, the Labour Law of the
Republic of Indonesia No. 13 of 2013 (UU Ketenagakerjaan Repubik Indonesia No 13 Tahun
2013) regulates labour working hours, decent wages, social security and occupational safety
and health. In meeting this regulation, companies treat their employees well. Employees can
work well and be productive because they feel safe and secure. As a result, operational
performance can increase.
7.4 Theoretical Contributions
This section explains how this thesis can contribute to the literature. First, it enriches the
literature by integrating two theories (i.e., stakeholder and contingency theories) to create a
conceptual framework. Such theories describe how constructs and indicators are
operationalised and related to each other. This thesis integrates CSR, measured through several
activities related to primary stakeholders at the strategic and functional levels. The impact of
CSR integration is measured for several stakeholders (i.e., employees, customers, and
shareholders). The findings highlight that the stakeholder relationship is the key mechanism
through which companies can gain financial benefits from CSR integration. Additionally, this
thesis provides empirical evidence that stakeholder relationships should be considered when

338
evaluating the mechanism between CSR integration and financial performance as it can be
mediated by customer and employee performance (in addition to operational performance).
Accordingly, this thesis represents the first attempt to understand the essential factors of
company strategy, which affect CSR-company performance relationships: stakeholder theory
and contingency theory.
Second, this thesis enhances the theory on CSR by highlighting a novel finding that CSR
integration benefits organisations socially and financially. Notably, this thesis contributes to
the literature by developing a framework that enables researchers to identify the different types
of benefits provided by CSR integration, and the effect these benefits have on the stakeholder-
company relationship. A broadened stakeholder perspective is critical to thoroughly assess the
benefits of CSR integration. Findings demonstrated that the impacts of CSR are not restricted
to a single stakeholder domain (Bhattacharya, Korschun & Sen 2009). Nevertheless, CSR
integration benefits several stakeholders (i.e., managers, employees, customers and
shareholders) with tangible and intangible benefits.
Last, this thesis explored the theory of contingency and its consequences in the relationship
between CSR integration and company performance. This thesis applied four variables of
contingency that can moderate the effect of CSR integration on company performance. The
results of the moderation analysis show that the impacts of CSR integration in four dimensions
of company performance are contingent on business strategy and CSR strategy adopted by a
company, along with its size and industry. The moderated mediation analyses provide adequate
support for the related hypotheses. Hence, this thesis offers new insights into CSR from a
contingency perspective.
7.5 Methodological Contributions
How this thesis offers several contributions from a methodological perspective is discussed
in this section. First, this thesis contributes to the literature by addressing knowledge gaps about

339
CSR in developing countries, particularly Indonesia, where the manufacturing industry
contributes the most to the national economy.
Second, the integration of non-market strategies with competitive market strategies is
critical in strategic management. Such a mechanism, however, remains unknown to both
practitioners and researchers, particularly in emerging markets (Yoo 2015). This thesis
examined how the integration of non-market strategies (CSR in this thesis) with business
strategies is applied at two levels, strategic and functional. More specifically, it explored how
integration is achieved by including a variety of business strategy and CSR strategy practices,
such as integrating CSR into strategic planning, concentrating on manufacturing operations and
addressing stakeholder concerns. The integration should be used to improve the overall
performance of a company, rather than just affecting financial performance.
Third, this thesis used quantitative research with a survey method. As discussed in the
previous chapter, conceptual and qualitative research have dominated the literature on CSR
integration. The integration of CSR in SEM is rarely undertaken to explore the interaction
between CSR integration and other target constructs, such as company performance. To
address this gap, this thesis employed PLS-SEM in a more sophisticated way to simultaneously
perform several advanced analyses, such as higher-order modelling, multiple mediation, MGA
and MICOM. In doing so, this thesis contributes to a deeper understanding of the relationship
between CSR integration and company performance.
Fourth, this thesis highlights the significance of including mediator and moderator variables
into PLS-SEM models and analyses. Within the conceptual literature, these variables are often
discussed, but empirical evidence remains scarce. For mediator variables, in addition to
operational performance, this thesis includes primary stakeholders, employees and customers,
to analyse their effects on the CSR-CFP relationship. This thesis also focuses on the moderating
effects of contextual variables that can explain CSR-CFP relationship heterogeneity. As the

340
proposed model can be conducted at the strategic and functional levels, CSR integration into
business strategy can be conducted comprehensively in the organisation and can have an effect
on company performance across financial and non-financial aspects.
Fifth, this thesis fills a substantial gap by comprehensively examining the impact of CSR
integration on company performance including financial and non-financial aspects, and by
analysing the potential mediating role of customer, employee, and operational performance in
the relationship between CSR integration and financial performance. Furthermore, this thesis
investigates the possible moderating effect of business and CSR strategies, as well as company
size and industry type.
7.6 Managerial Implications
This section lists several significant managerial implications provided by this thesis in
addition to contributions to theory and methodology. First, the findings of this thesis can
provide a better understanding of CSR implementation, especially in Indonesia. As shown in
several prior studies, most Indonesian companies conduct CSR through donation and charitable
practices, which are sporadic, temporary, and undertaken only when necessary. These activities
are immediately visible to external stakeholders, such as the local community surrounding the
companies.
However, this thesis generated different results. As explained in Chapter 5, in terms of CSR
strategy, four of 20 items had a mean value less than four, and they referred to philanthropic
responsibility. These results indicated that respondents’ perception of philanthropic
responsibility is less than other three responsibilities that had value more than four (see
Appendix B.2). As a result, the findings of this thesis back up the PER-05/MBU/04/2021 that
encourages everyone to recognise that CSR is more than just donation and community
development (Santia 2021).

341
Furthermore, since CSR deals more with a company’s internal activities, CSR must be
prioritised for internal stakeholders, rather than the community (Radyati 2014). The thesis
findings can inspire companies, particularly Indonesian manufacturing companies, to return to
implementing CSR within the company by treating its closest stakeholders well, those who
interact directly and daily with business operations: employees. Indeed, this requires
commitment and a great deal of resources, such as time, money, and people. However,
companies should understand that through CSR integration, they can maintain their business
sustainability and experience the benefits of CSR for a long time, not only financially but also
socially and operationally.
Second, the findings of this thesis can guide how companies meet their economic, legal, and
ethical responsibilities by integrating CSR. The integration of CSR at the strategic level
emphasises what top management should do, which can serve as a guide for CSR integration
at the next level. Meanwhile, at the functional level, CSR integration closely relates to the
company's daily business operations in six related functions (i.e., production, quality, R&D,
purchasing, marketing and human resources). Strategic CSR integration has 15 indicators and
functional CSR integration has 30 indicators. They can be used as suggestions to monitor
whether the companies already conduct them in their CSR implementation. In this way,
companies can adopt formalised CSR practices and thereby establish the procedures and tools
that are aligned with their corporate strategy (Bocquet et al. 2013). In doing so, CSR is
integrated upstream to downstream or along the value chain, covering all functions within the
company and relating to the company's internal activities.
Accordingly, these findings support PER-05/MBU/04/2021 as mentioned in Chapter 2. In
this new regulation, CSR (TJSL) refers to actions that represent company commitments to
sustainable development through delivering benefits to the community, economy, social, and
environments, as well as legal and governance principles that are more integrated and part of

342
the company's business approach (Jogloabang 2021). The findings of this thesis show that CSR
can be integrated into and be a part of the company’s business strategy and operations.
Third, understanding whether CSR integration is successful in improving company
performance is essential, not only for researchers, but also for managers who have been
practicing or are being motivated to engage in CSR. The findings of this thesis can encourage
manufacturing companies to increase their level of CSR implementation. They will not conduct
CSR as a mere charity, philanthropy, or compliance activity (as many currently do) or just to
meet regulations, but they will integrate CSR into business strategy. As a result, they will
achieve better financial and non-financial performance, which in turn could enhance their
competitive advantage. Thus, investing in CSR to boost the financial performance of an
organisation makes good business sense. Validating the model will help managers understand
why they should be paying attention to CSR integration, and what to expect from their attempts
to achieve social performance, beyond financial performance. When managers know what
benefits they can get from CSR integration, they will be motivated to implement it effectively.
As stated in PER-05/MBU/04/2021, the impacts of CSR (TJSL) should be targeted and
measured (Jogloabang, 2021). Hence, the findings of this thesis are in line with this regulation
by discovering that the effects of CSR integration can be evaluated comprehensively in four
aspects: customer, employee, financial, and operational performances.
Moreover, the findings of this thesis provide several suggestions for policymakers, such as
the Indonesian government. First, the government releases laws mandating companies to
practice CSR, and provides clear, systematic, and complete guidance. Accordingly, companies
should know to what extent they should implement CSR and the scope of CSR they can
conduct.
Second, the government should communicate regulations and guidance on their official
website, at association meetings, annual gatherings, or awards appreciation more often and

343
effectively. In doing so, large companies and SMEs will also recognise the regulation and
understand how to comply with it.
Third, the government can be a facilitator, by providing seminars, workshops and training
to companies on how to integrate CSR with business activities. Furthermore, to ensure that
companies, mostly SMEs, understand how to meet the regulations, the government can work
with universities and/or non-profit organisations (e.g., NGOs) to provide training to companies.
Training could cover, for example, how companies can implement occupational health and
safety, create a comfortable work environment, control product and process quality using
statistical process controls and communicate their CSR activities.
Fourth, the government can reward companies that have successfully implemented CSR. It
should be noted that the award is not for companies that make many donations, but companies
that conduct a sustainable business while involving the surrounding community. Thus, the
award can motivate companies to run their business in a responsible, legal, and ethical manner
that makes a significant impact to their stakeholders. Indeed, there have been many awards
given to companies that perform CSR well. Nonetheless, the awards are usually given by a
third party that does do not relate directly to the company, such as the media. It would be better
if the awards are provided by the government as the party issuing CSR regulations. Hence, the
government would be acting consistently with the regulations by monitoring and measuring
their implementation.
Last, the government can also provide incentives, which can motivate companies to conduct
CSR better. For instance, the government may facilitate the licence for new company branches,
reduce taxes and offer the company to foreign investors. Through these activities,
manufacturing companies in Indonesia will be more motivated to implement CSR strategically
and effectively. More specifically, they will be encouraged to integrate CSR into their business
strategy and operations. As a result, manufacturing companies in Indonesia will achieve better

344
company performance and appreciation from the government. These benefits are conducive to
enhance their competitive advantage and make their business sustainable.
7.7 Research Limitations and Directions for Future Research
This section outlines research limitations in this thesis, which can be seen as opportunities
for further research. First, this thesis focused on the integration of CSR. However, knowledge
of the antecedents of CSR integration is equally essential. Future research could address this
issue by interviewing executives and managers to comprehensively explore their perceptions
in detail.
Second, this thesis used a quantitative survey to address the proposed hypotheses and
research questions. As a result, this thesis relied on the information provided by respondents as
single informants in their companies. The collected data reflected managerial evaluation (or
perception) of organisational ways of working and business outcomes. Use of self-report
measures, although commonly used in behavioural and strategy research, may raise some
questions about the findings (Boesso & Kumar 2009). Hence, future research could overcome
this shortcoming by involving multiple informants, such as combining surveys of employees
and customers to obtain a better description of CSR implementation and business performance.
Third, in the data collection process, this thesis employed a cross-sectional approach. Using
this approach, customer strategy, CSR practices, and company performance were gathered at a
single point in time to clarify their relationship. A longitudinal study is required to provide an
in-depth understanding of the relationship between CSR integration and company
performance. Longitudinal data enables the researcher to analyse certain aspects of a mediation
model that are not available in cross-sectional data, such as whether the effect is stable over
time and whether evidence exists for one of the essential causality conditions (MacKinnon,
Fairchild & Fritz 2007).

345
Fourth, this thesis emphasised on a single industrial field, the manufacturing sector, and
used one region, Java, which might restrict data generalisability. Future research may overcome
this limitation by covering more than one industrial sector and one geographical area, such as
including the service sector both within and outside of Java, enabling data generalisability and
comparison of results.
Fifth, this thesis conducted a survey without case studies. To understand the mechanism
underlying the relationships between the variables investigated in this thesis, future research
can use case studies to enrich our understanding of these relationships. Case studies can also
help discover whether the effect is stable over time and whether evidence exists for one of the
essential causality conditions.
Last, this thesis used subjective measurement due to a lack of published company reports
and reluctance from respondents to discuss their company’s performance. Future research can
overcome this limitation by using objective data from multiple sources or validating subjective
dependent variables with objective measures to further verify the proposed research model.
Despite these limitations, this thesis could be seen as pioneering, as it represents a starting
point for the integration of CSR and the benefits of such integration across several aspects of
company performance in manufacturing companies. The results of this thesis provide empirical
evidence that companies can reap the benefits of CSR integration, which will enhance their
competitive advantage.
7.8 Summary of Chapter 7
This section provides a summary of this chapter. It summarises the thesis's introduction.
Then, the entire thesis is concisely explained by describing how the thesis' findings can address
the research questions. Accordingly, it is clear that the findings of this thesis can answer five
research questions. This chapter also discovered that 31 of 47 hypotheses (66%) are statistically

346
supported, while 16 hypotheses (34%) are not. This means that the findings of this thesis can
confirm the majority of hypotheses.
This chapter highlights nine key findings in this thesis. Accordingly, the research objectives
can be achieved in a satisfactory manner. In addition, this chapter shows how this thesis can
make a theoretical and methodological contribution. This chapter offers various managerial
implications, not only for managers but also for policymakers. Last, this chapter lists research
limitations that can be seen as potential areas for further research.

347
REFERENCES
Achda, BT 2006, 'The sociological context of corporate social responsibility development and
implementation in Indonesia', Corporate Social Responsibility and Environmental
Management, vol. 13, no. 5, pp. 300-305.
Adams, KR 2011, 'Corporate Social Responsibility: Stakeholder Determination and Reporting',
PhD thesis, RMIT University, Melbourne, Australia,
<https://researchrepository.rmit.edu.au/esploro/outputs/doctoral/Corporate-social-
responsibility-stakeholder-determination-and-reporting/9921861230701341>.
Adeneye, YB & Ahmed, M 2015, 'Corporate Social Responsibility and Company
Performance', Journal of Business Studies Quarterly, vol. 7, no. 1, pp. 151-166.
Afrin, S 2013, 'Traditional vs strategic corporate social responsibility: In pursuit of supporting
sustainable development', Journal of Economics and Sustainable Development, vol. 4, no. 20,
pp. 153-157.
Ağan, Y, Kuzey, C, Acar, MF & Açıkgöz, A 2016, 'The relationships between corporate social
responsibility, environmental supplier development, and firm performance', Journal of Cleaner
Production, vol. 112, pp. 1872-1881.
Aguilera, RV, Rupp, DE, Williams, CA & Ganapathi, J 2007, 'Putting the S Back in Corporate
Social Responsibility: A Multilevel Theory of Social Change in Organizations', The Academy
of Management Review, vol. 32, no. 3, pp. 836-863.
Aguinis, H & Glavas, A 2012, 'What We Know and Don’t Know About Corporate Social
Responsibility', Journal of Management, vol. 38, no. 4, pp. 932-968.
Aguinis, H, Gottfredson, RK & Joo, H 2013, 'Best-Practice Recommendations for Defining,
Identifying, and Handling Outliers', Organizational Research Methods, vol. 16, no. 2, pp. 270-
301.
Agustinus, M 2017, '99% Industri Pengolahan di RI Berskala Kecil', viewed 2 February 2018,
<https://finance.detik.com/industri/d-3485556/99-industri-pengolahan-di-ri-berskala-kecil >.
Aisyah, R 2019, 'Focus on Java holds back RI’s manufacturing', The Jakarta Post, 14 August
2019, viewed 30 April 2020, <https://www.thejakartapost.com/news/2019/08/14/focus-java-
holds-back-ri-s-manufacturing.html>.
Al-Shuaibi, KM 2016, 'A Structural Equation Model of CSR and Performance: Mediation by
Innovation and Productivity', Journal of Management and Sustainability, vol. 6, no. 2, p. 139.
Ali, HY, Danish, RQ & Asrar-ul-Haq, M 2020, 'How Corporate Social Responsibility Boosts
Firm Financial Performance: The Mediating Role of Corporate Image And Customer
Satisfaction', Corporate Social Responsibility and Environmental Management, vol. 27, no. 1,
pp. 166-177.
Ali, M, Ali, FH, Raza, B & Ali, W 2020, 'Assessing the mediating role of work engagement
between the relationship of corporate social responsibility with job satisfaction and

348
organizational citizenship behavior', International Review of Management and Marketing, vol.
10, no. 4, pp. 1-10.
Ambadar, J 2017, CSR Dalam Praktik di Indonesia, PT Elex Media Komputindo, Jakarta,
Indonesia.
Ameer, R & Othman, R 2012, 'Sustainability Practices and Corporate Financial Performance:
A Study Based on the Top Global Corporations', Journal of Business Ethics, vol. 108, no. 1,
pp. 61-79.
Amindoni, A 2016, 'Indonesia one of the world's top 10 manufacturers', The Jakarta Post, April
21, 2016, viewed 1 January 2018,
<https://www.thejakartapost.com/news/2016/04/21/indonesia-one-of-the-worlds-top-10-
manufacturers.html>.
Amran, A & Haniffa, R 2011, 'Evidence in development of sustainability reporting: a case of
a developing country', Business Strategy and the Environment, vol. 20, no. 3, pp. 141-156.
Andrews, KR 1987, The Concept of Corporate Strategy, Irwin.
Andrews, R, Boyne, GA & Walker, RM 2006, 'Strategy Content and Organizational
Performance: An Empirical Analysis', Public Administration Review, vol. 66, no. 1, pp. 52-63.
Aninkan, DO & Oyewole, AA 2014, 'The influence of individual and organizational factors on
employee engagement', International Journal of Development and Sustainability, vol. 3, no. 6,
pp. 1381-1392.
Anna, BC & Jason, O 2005, 'Best practices in exploratory factor analysis: four
recommendations for getting the most from your analysis', Practical Assessment, vol. 10, no.
7, pp. 1-9.
Anwar, J, Shah, S & Hasnu, S 2016, 'Business strategy and organizational performance:
Measures and relationships', Pakistan Economic and Social Review, vol. 54, no. 1, pp. 97-122.
Aqueveque, C & Encina, C 2010, 'Corporate Behavior, Social Cynicism, and Their Effect on
Individuals’ Perceptions of the Company', Journal of Business Ethics, vol. 91, no. 2, pp. 311-
324.
Aras, G, Aybars, A & Kutlu, O 2010, 'Managing corporate performance. Investigating the
relationship between corporate social responsibility and financial performance in emerging
markets', International Journal of Productivity and Performance Management, vol. 59, no. 3,
pp. 229-254.
Arjaliès, D-L & Mundy, J 2013, 'The use of management control systems to manage CSR
strategy: A levers of control perspective', Management Accounting Research, vol. 24, no. 4,
pp. 284-300.
Armstrong, JS & Overton, TS 1977, 'Estimating Nonresponse Bias in Mail Surveys', Journal
of Marketing Research, vol. 14, no. 3, pp. 396-402.

349
AsiaLinkBusiness n.d., 'Manufacturing in Indonesia', Asia Link Business, viewed 07 April
2020, <https://asialinkbusiness.com.au/indonesia/business-practicalities-in-
indonesia/manufacturing-in-indonesia?doNothing=1>.
Asif, M, Searcy, C, Zutshi, A & Fissher, OAM 2013, 'An integrated management systems
approach to corporate sustainability', Journal of Cleaner Production, vol. 56, pp. 7-17.
Aupperle, KE, Carroll, AB & Hatfield, JD 1985, 'An Empirical Examination of the
Relationship Between Corporate Social Responsibility and Profitability', Academy of
Management Journal, vol. 28, no. 2, p. 446.
Azzahra, MH 2016, 'Masih Banyak Permasalahan dalam Pelaksanaan CSR Perusahaan', Swa
Online Magazine, viewed 19 July 2020, <https://swa.co.id/swa/trends/business-
research/masih-banyak-permasalahan-dalam-pelaksanaan-csr>.
Bach, D & Allen, D 2010, 'What Every CEO Needs to Know About Nonmarket Strategy', MIT
Sloan Management Review, vol. 51, no. 3, pp. 41-48.
Bagozzi, R & Yi, Y 2012, 'Specification, evaluation, and interpretation of structural equation
models', Journal of the Academy of Marketing Science, vol. 40, no. 1, pp. 8-34.
Banker, RD, Mashruwala, R & Tripathy, A 2014, 'Does a differentiation strategy lead to more
sustainable financial performance than a cost leadership strategy?', Management Decision, vol.
52, no. 5, pp. 872-896.
Bappenas n.d., 'Industri', Badan Perencanaan Pembangunan Nasional, viewed 15 August 2020,
<https://www.bappenas.go.id/files/7413/4985/2796/bab-13-74-75-
cek__20090130070438__3.doc>.
Barlett, JE, Kotrlik, JW & Higgins, CC 2001, 'Organizational research: Determining
appropriate sample size in survey research', Information Technology, Learning, and
Performance Journal, vol. 19, no. 1, pp. 43-50.
Barlian, JK 2018, 'Indonesia's Best Practices of Corporate Social Initiative sebagai Benchmark
Program CSR di Indonesia', Swa Online Magazine, viewed 19 July 2020,
<https://swa.co.id/swa/csr-corner/indonesias-best-practices-of-corporate-social-initiative-
sebagai-benchmark-program-csr-di-indonesia>.
Baron, D 1995a, 'Integrated Strategy: Market and Nonmarket Components', California
Management Review, vol. 37, no. 2, pp. 47-65.
Baron, D 1995b, 'The Nonmarket Strategy System', Sloan Management Review, vol. 37, no. 1,
p. 73.
Baron, D 1997, 'Integrated strategy, trade policy, and global competition', California
Management Review, vol. 39, no. 2, pp. 145-169.
Baron, D 2000, Business and Its Environment, 3rd edn, Prentice Hall, Upper Saddle Riber, NJ.

350
Baron, DP & Diermeier, D 2007, 'Introduction to the Special Issue on Nonmarket Strategy and
Social Responsibility', Journal of Economics & Management Strategy, vol. 16, no. 3, pp. 539-
545.
Baron, RM & Kenny, DA 1986, 'The Moderator-Mediator Variable Distinction in Social
Psychological Research: Conceptual, Strategic, and Statistical Considerations', Journal of
Personality and Social Psychology, vol. 51, no. 6, pp. 1173-1182.
Baroto, MBMMBAHLW 2012, 'Hybrid Strategy: A New Strategy for Competitive Advantage',
International Journal of Business and Management, vol. 7, no. 20, pp. 120-133.
Bauman, CW & Skitka, LJ 2012, 'Corporate social responsibility as a source of employee
satisfaction', Research in Organizational Behavior, vol. 32, pp. 63-86.
Baumgartner, RJ 2014, 'Managing Corporate Sustainability and CSR: A Conceptual
Framework Combining Values, Strategies, and Instruments Contributing to Sustainable
Development', Corporate Social Responsibility & Environmental Management, vol. 21, no. 5,
pp. 258-271.
Beard, DW & Dess, GG 1981, 'Corporate-Level Strategy, Business-Level Strategy, and Firm
Performance', Academy of Management Journal, vol. 24, no. 4, p. 663.
Beck, C, Frost, G & Jones, S 2018, 'CSR disclosure and financial performance revisited: A
cross-country analysis', Australian Journal of Management, vol. 43, no. 4, pp. 517-537.
Becker, J-M, Klein, K & Wetzels, M 2012, 'Hierarchical Latent Variable Models in PLS-SEM:
Guidelines for Using Reflective-Formative Type Models', Long Range Planning, vol. 45, no.
5, pp. 359-394.
Becker, J-M, Rai, A, Ringle, CM & Volckner, F 2013, 'Discovering Unobserved Heterogeneity
in Structural Equation Models to Avert Validity Threats', MIS Quarterly, vol. 37, no. 3, pp.
665-694.
Benitez, J, Henseler, J, Castillo, A & Schuberth, F 2020, 'How to perform and report an
impactful analysis using partial least squares: Guidelines for confirmatory and explanatory IS
research', Information & Management, vol. 57, no. 2.
Beritasatu 2020, 'CSR Perusahaan Dorong Pencapaian SDGs 2030' viewed 6 August 2021,
<https://www.beritasatu.com/nasional/607061/csr-perusahaan-dorong-pencapaian-sdgs-
2030>.
Bernal-Conesa, JA, de Nieves-Nieto, C & Briones-Peñalver, A-J 2016, 'CSR and technology
companies: A study on its implementation, integration and effects on the competitiveness of
companies', RSC y empresas tecnológicas: Un estudio sobre su implantación e integración y
efectos sobre la competitividad de las empresas., vol. 12, no. 5, pp. 1529-1590.
Bernal-Conesa, JA, de Nieves-Nieto, C & Briones-Peñalver, AJ 2017, 'CSR Strategy in
Technology Companies: Its Influence on Performance, Competitiveness and Sustainability',
Corporate Social Responsibility and Environmental Management, vol. 24, no. 2, pp. 96-107.

351
Bhardwaj, P, Chatterjee, P, Demir, KD & Turut, O 2018, 'When and how is corporate social
responsibility profitable?', Journal of Business Research, vol. 84, pp. 206-219.
Bhattacharya, C, Korschun, D & Sen, S 2009, 'Strengthening Stakeholder–Company
Relationships Through Mutually Beneficial Corporate Social Responsibility Initiatives',
Journal of Business Ethics, vol. 85, pp. 257-272.
Bhattacharyya, SS 2010, 'Exploring the concept of strategic corporate social responsibility for
an integrated perspective', European Business Review, vol. 22, no. 1, pp. 82-101.
Blowfield, M 2007, 'Reasons to be cheerful? What we know about csr's impact', Third World
Quarterly, vol. 28, no. 4, pp. 683-695.
Blowfield, M & Frynas, JG 2005, 'Setting New Agendas: Critical Perspectives on Corporate
Social Responsibility in the Developing World', International Affairs (Royal Institute of
International Affairs 1944-), vol. 81, no. 3, pp. 499-513.
Bocquet, R, Le Bas, C, Mothe, C & Poussing, N 2013, 'Are firms with different CSR profiles
equally innovative? Empirical analysis with survey data', European Management Journal, vol.
31, no. 6, pp. 642-654.
Boesso, G, Favotto, F & Michelon, G 2015, 'Stakeholder Prioritization, Strategic Corporate
Social Responsibility and Company Performance: Further Evidence', Corporate Social
Responsibility and Environmental Management, vol. 22, no. 6, pp. 424-440.
Boesso, G & Kumar, K 2009, 'An investigation of stakeholder prioritization and engagement:
who or what really counts', Journal of Accounting & Organizational Change, vol. 5, no. 1, pp.
62-80.
Bos-Brouwers, HEJ 2010, 'Corporate sustainability and innovation in SMEs: Evidence of
themes and activities in practice', Business Strategy and the Environment, vol. 19, no. 7, pp.
417-435.
Boubakary & Moskolaï, DD 2016, 'The influence of the implementation of CSR on business
strategy: An empirical approach based on Cameroonian enterprises', Arab Economic and
Business Journal, vol. 11, no. 2, pp. 162-171.
Bourgeois, LJ, III 1980, 'Strategy and Environment: A Conceptual Integration', Academy of
Management. The Academy of Management Review, vol. 5, no. 1, p. 25.
Bowen, FE 2000, 'Environmental visibility: a trigger of green organizational response?',
Business Strategy and the Environment, vol. 9, no. 2, pp. 92-107.
Bowman, EH & Helfat, CE 2001, 'Does Corporate Strategy Matter?', Strategic Management
Journal, vol. 22, no. 1, pp. 1-23.
BPS 2017a, Analisis Hasil Listing: Aglomerasi Industri Manufaktur Di Indonesia, Indonesia.
BPS 2017b, Direktori Industri Manufaktur 2017, Jakarta, Indonesia.

352
Branco, MC & Rodrigues, LL 2006, 'Corporate Social Responsibility and Resource-Based
Perspectives', Journal of Business Ethics, vol. 69, no. 2, pp. 111-132.
Brealey, RA, Myers, SC, Allen, F & Mohanty, P 2012, Principles of Corporate Finance, 12th
edn, Mcgraw-Hill Education, < >.
Brine, M, Brown, R & Hackett, G 2007, 'Corporate Social Responsibility and Financial
Performance in the Australian Context', Economic Round-up, vol. no. Autumn 2007, pp. 47-
58.
Brislin, RW 1970, 'Back-Translation for Cross-Cultural Research', Journal of Cross-Cultural
Psychology, vol. 1, no. 3, pp. 185-216.
Bryman, AB, E 2011, Business Research Methods, 3rd edn, Oxford University Press.
BSN 2019, 'BSN Berpartisipasi dalam Peluncuran ICA 2020', Badan Standarisasi Nasional,
viewed 19 July 2020, <https://bsn.go.id/main/berita/detail/10808/bsn-berpartisipasi-dalam-
peluncuran-ica-2020>.
Bu¨ yu¨ kbalcı, P 2012, 'Sustaining Multinational Strategic Performance Through Value Chain
Based Competitive Advantage', in Business Strategy and Sustainability: Developments in
Corporate Governance and Responsibility, Emerald Group Publishing Limited, pp. 45-65.
Burke, L & Logsdon, JM 1996, 'How corporate social responsibility pays off', Long Range
Planning, vol. 29, no. 4, pp. 495-502.
Busaya, V, Kalayanee, K & Gary, NM 2009, 'CSR activities in award‐winning Thai
companies', Social Responsibility Journal, vol. 5, no. 2, pp. 178-199.
Campbell-Hunt, C 2000, 'What Have We Learned about Generic Competitive Strategy? A
Meta-Analysis', Strategic Management Journal, vol. 21, no. 2, pp. 127-154.
Campbell, JL 2007, 'Why Would Corporations Behave in Socially Responsible Ways? An
Institutional Theory of Corporate Social Responsibility', The Academy of Management Review,
vol. 32, no. 3, pp. 946-967.
Carroll, AB 1979, 'A Three-Dimensional Conceptual Model of Corporate Performance', The
Academy of Management Review, vol. 4, no. 4, pp. 497-505.
Carroll, AB 1991, 'The pyramid of corporate social responsibility: Toward the moral
management of organizational stakeholders', Business Horizons, vol. 34, no. 4, pp. 39-48.
Carroll, AB & Shabana, KM 2010, 'The Business Case for Corporate Social Responsibility: A
Review of Concepts, Research and Practice', International Journal of Management Reviews,
vol. 12, no. 1, pp. 85-105.
Caspar, RP, Emilia; Yan, Ting; Lee, Sunghee: Liu, Mingnan; and Hu, Mengyao 2016,
'Pretesting', in Cross-Cultural Survey Guidelines.

353
Cavusgil, ST & Das, A 1997, 'Methodological issues in empirical cross-cultural research: A
survey of the management literature and a framework', Management International Review, vol.
37, no. 1, pp. 71-96.
Cazeri, GT, Anholon, R, Da Silva, D, Cooper Ordoñez, RE, Gonçalves Quelhas, OL, Filho,
WL & de Santa-Eulalia, LA 2018, 'An assessment of the integration between corporate social
responsibility practices and management systems in Brazil aiming at sustainability in
enterprises', Journal of Cleaner Production, vol. 182, pp. 746-754.
CECT, T 'About The Awads', CECT Trisakti, viewed 31 August 2020,
<https://www.cectsustainabilityawards.com/index.html#awards>.
Cekindo 2020, 'Indonesia: The Global Leader in Manufacturing to Be', viewed 7 April 2020,
<https://www.cekindo.com/blog/indonesia-global-leader-manufacturing>.
Cenfetelli, RT & Bassellier, G 2009, 'Interpretation of formative measurement in information
systems research.(Research Essay)(Essay)', MIS Quarterly, vol. 33, no. 4, p. 689.
CFI 2018, 'What is Cash Flow', Corporate Finance Institute, viewed 27 December 2017,
<https://corporatefinanceinstitute.com/resources/knowledge/finance/cash-flow/>.
Chang, C-H 2015, 'Proactive and reactive corporate social responsibility: antecedent and
consequence', Management Decision, vol. 53, no. 2, pp. 451-468.
Chang, Y-H & Yeh, C-H 2016, 'Managing corporate social responsibility strategies of airports:
The case of Taiwan’s Taoyuan International Airport Corporation', Transportation Research
Part A: Policy and Practice, vol. 92, pp. 338-348.
Chen, L, Feldmann, A & Tang, O 2015, 'The relationship between disclosures of corporate
social performance and financial performance: Evidences from GRI reports in manufacturing
industry', International Journal of Production Economics, vol. 170, Part B, pp. 445-456.
Chen, Yy & Wang, Ll 2010, 'Non-Market Strategy and Firm Performance: The Empirical
Study of Listed Companies in China', 2010 International Conference on Management and
Service Science, 24-26 August 2010, pp. 1-4.
Chen, ZF, Hong, C & Occa, A 2019, 'How different CSR dimensions impact organization-
employee relationships: The moderating role of CSR-culture fit', Corporate Communications,
vol. 24, no. 1, pp. 63-78.
Chenhall, RH 2003, 'Management control systems design within its organizational context:
findings from contingency-based research and directions for the future', Accounting,
Organizations and Society, vol. 28, no. 2, pp. 127-168.
Chi, CG & Gursoy, D 2009, 'Employee satisfaction, customer satisfaction, and financial
performance: An empirical examination', International Journal of Hospitality Management,
vol. 28, no. 2, pp. 245-253.
Chi, T 2015, 'Business Contingency, Strategy Formation, and Firm Performance: An Empirical
Study of Chinese Apparel SMEs', Administrative Sciences, vol. 5, no. 2, pp. 27-45.

354
Chiarini, A 2015, 'Marketing Strategy, Strategic Planning and Corporate Social Responsibility:
An Exploratory Research ', in Ae Chiarini (ed.), Sustainable Operations Management
Advances in Strategy and Methodology, Springer International Publishing: Imprint: Springer,
Cham, pp. 1-14.
Chin, WW 1998, 'Issues and Opinion on Structural Equation Modeling', MIS Quarterly, vol.
22, no. 1, pp. 1-1.
Chin, WW 2010, 'How to Write up and Report PLS Analyses', in Ve Esposito Vinzi, WWe
Chin, Je Henseler & He Wang (eds), Handbook of Partial Least Squares, Springer Berlin
Heidelberg, Berlin, Heidelberg, pp. 655-690.
Choi, J & Wang, H 2009, 'Stakeholder relations and the persistence of corporate financial
performance', Strategic Management Journal, vol. 30, no. 8, pp. 895-907.
Chtourou, H & Triki, M 2017, 'Commitment in corporate social responsibility and financial
performance: a study in the Tunisian context', Social Responsibility Journal, vol. 13, no. 2, pp.
370-389.
Churchill, GA 1979, 'A Paradigm for Developing Better Measures of Marketing Constructs',
Journal of Marketing Research, vol. 16, no. 1, pp. 64-73.
Clarkson, MBE 1995, 'A Stakeholder Framework for Analyzing and Evaluating Corporate
Social Performance', Academy of Management. The Academy of Management Review, vol. 20,
no. 1, p. 92.
Cochran, PL 2007, 'The evolution of corporate social responsibility', Business Horizons, vol.
50, no. 6, pp. 449-454.
Cochran, PL & Wood, RA 1984, 'Corporate Social Responsibility and Financial Performance',
The Academy of Management Journal, vol. 27, no. 1, pp. 42-56.
Cohen, J 1992, 'A power primer', Psychological Bulletin, vol. 112, pp. 155-159.
Commission, E 2011, Communication From The Commission To The European Parliament,
The Council, The European Economic And Social Committee And The Committee Of The
Regions: A Renewed EU Strategy 2011-14 For Corporate Social Responsibility.
Crane, A, Palazzo, G, Spence, LJ & Matten, D 2014, 'Contesting the Value of "Creating Shared
Value"', California Management Review, vol. 56, no. 2, pp. 130-153.
Creswell, JW 2014, Research design : qualitative, quantitative, and mixed methods
approaches, 4th edn, SAGE Publications, Inc, Thousand Oaks, California.
Creswell, JW & Clark, VLP 2018, Designing and conducting mixed methods research, 3rd
edn, SAGE Publications Inc., Thousand Oaks, California.
Crifo, P, Diaye, M-A & Pekovic, S 2016, 'CSR related management practices and firm
performance: An empirical analysis of the quantity–quality trade-off on French data',
International Journal of Production Economics, vol. 171, Part 3, pp. 405-416.

355
Cunanan, PM 2018, 'Carbon Intensive Industries – The Industry Sectors That Emit The Most
Carbon', Eco Warrior Princess, viewed 11 November 2019,
<https://ecowarriorprincess.net/2018/04/carbon-intensive-industries-industry-sectors-emit-
the-most-carbon/>.
Dahlsrud, A 2008, 'How corporate social responsibility is defined: an analysis of 37
definitions', Corporate Social Responsibility and Environmental Management, vol. 15, no. 1,
pp. 1-13.
Danny, M & Peter, HF 1986, 'Porter's (1980) Generic Strategies and Performance: An
Empirical Examination with American Data: Part I: Testing Porter', Organization Studies, vol.
7, no. 1, pp. 37-55.
David, FR & David, FR 2014, Strategic management: concepts and cases-a competitive
advantage approach, 5th edn, Pearson, Boston.
Dawkins, J 2005, 'Corporate responsibility: The communication challenge', Journal of
Communication Management, vol. 9, no. 2, pp. 108-119.
Dembek, K, Singh, P & Bhakoo, V 2016, 'Literature Review of Shared Value: A Theoretical
Concept or a Management Buzzword?', Journal of Business Ethics, vol. 137, no. 2, pp. 231-
267.
Dess, GG & Davis, PS 1984, 'Porter's (1980) Generic Strategies as Determinants of Strategic
Group Membership and Organizational Performance', The Academy of Management Journal,
vol. 27, no. 3, pp. 467-488.
Dess, GG, Gupta, A, Hennart, J-F & Hill, CWL 1995, 'Conducting and Integrating Strategy
Research at the International, Corporate, and Business Levels: Issues and Directions', Journal
of Management, vol. 21, no. 3, pp. 357-393.
Dess, GG & Robinson, RB 1984, 'Measuring Organizational Performance in the Absence of
Objective Measures: The Case of the Privately-Held Firm and Conglomerate Business Unit',
Strategic Management Journal, vol. 5, no. 3, pp. 265-273.
DeVellis, RF 2012, Scale development : theory and applications, 3rd edn, SAGE, Thousand
Oaks, Calif.
Dey, M & Sircar, S 2012, 'Integrating Corporate Social Responsibility Initiatives with Business
Strategy: A Study of Some Indian Companies', IUP Journal of Corporate Governance, vol.
11, no. 1, pp. 36-51.
Dhanesh, GS 2012, 'The view from within: Internal publics and CSR', Journal of
Communication Management, vol. 16, no. 1, pp. 39-58.
Dhanesh, GS 2014, 'CSR as Organization–Employee Relationship Management Strategy: A
Case Study of Socially Responsible Information Technology Companies in India',
Management Communication Quarterly, vol. 28, no. 1, pp. 130-149.

356
Diamantopoulos, A & Siguaw, JA 2006, 'Formative Versus Reflective Indicators in
Organizational Measure Development: A Comparison and Empirical Illustration', British
Journal of Management, vol. 17, no. 4, pp. 263-282.
Dictionary, B 2017, 'Profit', WebFinance Inc., viewed 2 January 2017,
<http://www.businessdictionary.com/definition/profit.html>.
Dobele, AR, Westberg, K, Steel, M & Flowers, K 2014, 'An Examination of Corporate Social
Responsibility Implementation and Stakeholder Engagement: A Case Study in the Australian
Mining Industry', Business Strategy & the Environment (John Wiley & Sons, Inc), vol. 23, no.
3, pp. 145-159.
Doh, JP, Lawton, TC & Rajwani, T 2012, 'Advancing Nonmarket Strategy Research:
Institutional Perspectives in a Changing World', Academy of Management Perspectives, vol.
26, no. 3, pp. 22-39.
Donaldson, L 2001, The Contingency Theory of Organizations, SAGE Publications, Inc.,
United States of America.
Donaldson, T & Preston, LE 1995, 'The stakeholder theory of the corporation: Concepts,
evidence, and implications', Academy of Management. The Academy of Management Review,
vol. 20, no. 1, pp. 65-91.
Dong, Y & Peng, C-YJ 2013, 'Principled missing data methods for researchers', SpringerPlus,
vol. 2, no. 1, pp. 222-222.
Du, J, Bai, T & Chen, S 2019, 'Integrating corporate social and corporate political strategies:
Performance implications and institutional contingencies in China', Journal of Business
Research, vol. 98, pp. 299-316.
Du, S, Bhattacharya, CB & Sen, S 2007, 'Reaping relational rewards from corporate social
responsibility: The role of competitive positioning', International Journal of Research in
Marketing, vol. 24, no. 3, pp. 224-241.
Dupire, M & M’Zali, B 2018, 'CSR Strategies in Response to Competitive Pressures', Journal
of Business Ethics, vol. 148, no. 3, pp. 603-623.
Eberl, M 2010, 'An Application of PLS in Multi-Group Analysis: The Need for Differentiated
Corporate-Level Marketing in the Mobile Communications Industry', in Handbook of Partial
Least Squares: Concepts, Methods and Applications, Springer Berlin Heidelberg, Berlin,
Heidelberg, Berlin, Heidelberg, pp. 487-514.
Eccles, RG, Ioannou, I & Serafeim, G 2014, 'The Impact of Corporate Sustainability on
Organizational Processes and Performance', Management Science, vol. 60, no. 11, pp. 2835-
2857.
Effendi, MI & Kusmantini, T 2015, 'The Moderating Effect of Contingency Variables on the
Relationship between Formal Strategic Planning and Company Performance', Procedia -
Social and Behavioral Sciences, vol. 211, pp. 1132-1141.

357
Engert, S, Rauter, R & Baumgartner, RJ 2016, 'Exploring the integration of corporate
sustainability into strategic management: a literature review', Journal of Cleaner Production,
vol. 112, pp. 2833-2850.
Erawaty, E 2019, 'Persoalan Hukum Seputar Tanggung Jawab Sosial dan Lingkungan
Perseroan dalam Perundang-Undangan Ekonomi Indonesia', viewed 28 November 2019,
<http://ditjenpp.kemenkumham.go.id/hukum-pedata/847-persoalan-hukum-seputar-tanggung-
jawab-sosial-dan-lingkungan-perseroan-dalam-perundang-undangan-ekonomi-
indonesia.html>.
Etee, S 2019, 'What are The Most Polluting Industries? The Answer is Complicated ', viewed
11 November 2019, <https://www.shopetee.com/blogs/plastic-pollution/what-are-the-most-
polluting-industries-the-answer-is-complicated>.
FabricoftheWorld n.d., 'Fashion is the second most polluting industry globally!', Fabric of The
World, viewed 11 November 2019, <http://www.fabricoftheworld.com/fashion-is-the-second-
most-polluting-industry-globally/>.
Fabrigar, LR, Wegener, DT, Maccallum, RC & Strahan, EJ 1999, 'Evaluating the Use of
Exploratory Factor Analysis in Psychological Research', Psychological Methods, vol. 4, no. 3,
pp. 272-299.
Famiyeh, S 2017, 'Corporate social responsibility and firm's performance: empirical evidence',
Social Responsibility Journal, vol. 13, no. 2, pp. 390-406.
Ferraz, D, António, F & Gallardo-Vázquez, D 2016, 'Measurement tool to assess the
relationship between corporate social responsibility, training practices and business
performance', Journal of Cleaner Production, vol. 129, pp. 659-672.
Field, AP 2009, Discovering statistics using SPSS : (and sex, drugs and rock 'n' roll), 3rd edn,
SAGE Publications Ltd., London.
Finch, H 2012, 'Distribution of Variables by Method of Outlier Detection', Frontiers in
Psychology, vol. 3, no. 211.
Fornell, C & Larcker, DF 1981, 'Evaluating Structural Equation Models with Unobservable
Variables and Measurement Error', Journal of Marketing Research, vol. 18, no. 1, pp. 39-50.
Fowler, FJ 2014, Survey Research Methods, SAGE, Los Angeles.
Frambach, RT, Prabhu, J & Verhallen, TMM 2003, 'The influence of business strategy on new
product activity: The role of market orientation', International Journal of Research in
Marketing, vol. 20, no. 4, pp. 377-397.
Freeman, RE 2010, Strategic Management: A Stakeholder Approach, Cambridge University
Press, New York.
Frynas, JG & Yamahaki, C 2016, 'Corporate social responsibility: review and roadmap of
theoretical perspectives', Business Ethics: A European Review, vol. 25, no. 3, pp. 258-285.

358
Galbreath, J 2006, 'Corporate social responsibility strategy: strategic options, global
considerations', Corporate Governance: The International Journal of Business in Society, vol.
6, no. 2, pp. 175-187.
Galbreath, J 2009, 'Building corporate social responsibility into strategy', European Business
Review, vol. 21, no. 2, pp. 109-127.
Galbreath, J & Shum, P 2012, 'Do customer satisfaction and reputation mediate the CSR–FP
link? Evidence from Australia', Australian Journal of Management, vol. 37, no. 2, pp. 211-
229.
Gallardo-Vázquez, D & Sanchez-Hernandez, MI 2014, 'Measuring Corporate Social
Responsibility for competitive success at a regional level', Journal of Cleaner Production, vol.
72, pp. 14-22.
Ganescu, MC 2012a, 'Assessing Corporate Social Performance from a Contingency Theory
Perspective', Procedia Economics and Finance, vol. 3, no. Supplement C, pp. 999-1004.
Ganescu, MC 2012b, 'Corporate social responsibility, a strategy to create and consolidate
sustainable businesses', Theoretical and Applied Economics, vol. 11, no. 576, pp. 91-106.
García-Madariaga, J & Rodríguez-Rivera, F 2017, 'Corporate social responsibility, customer
satisfaction, corporate reputation, and firms’ market value: Evidence from the automobile
industry', Spanish Journal of Marketing - ESIC, vol. 21, pp. 39-53.
Garriga, E & Melé, D 2004, 'Corporate Social Responsibility Theories: Mapping the Territory',
Journal of Business Ethics, vol. 53, no. 1, pp. 51-71.
Gazzola, P & Colombo, G 2014, 'CSR Integration into The Corporate Strategy ', Cross-
Cultural Management Journal, vol. XVI, no. 2 (6), pp. 331-338.
Geldhof, GJ, Preacher, KJ & Zyphur, MJ 2014, 'Reliability Estimation in a Multilevel
Confirmatory Factor Analysis Framework', Psychological Methods, vol. 19, no. 1, pp. 72-91.
Ghasemi, S, Nazemi, M & Hajirahimian, T 2014, 'From Corporate Social Responsibility (CSR)
to Creating Shared Value (CSV): Case Study of Mobarakeh Steel Company', Global Business
and Management Research, vol. 6, no. 1, pp. 15-23.
Ghobadian, A, O'Regan, N & Nandakumar, MK 2010, 'Business‐level strategy and
performance: The moderating effects of environment and structure', Management Decision,
vol. 48, no. 6, pp. 907-939.
Ghozali, I & Sulistyani, L 2016, 'Firm Capabilities Role as Mediator of Relationship Between
Levers of Control and Firm Performance (Empirical Study on Financial Institutions in
Indonesia)', International Information Institute (Tokyo). Information, vol. 19, no. 7A, p. 2533.
Glavas, A & Piderit, SK 2009, 'How Does Doing Good Matter?: Effects of Corporate
Citizenship on Employees', Journal of Corporate Citizenship, vol. no. 36, pp. 51-70.

359
GlobalBusinessGuide 2011, 'Overview of the Manufacturing Sector', viewed 1 May 2020,
<http://www.gbgindonesia.com/en/manufacturing/article/2011/overview_of_the_manufacturi
ng_sector.php>.
Globalreporting n.d.a, 'About GRI', Global Reporting Website, viewed 7 August 2021,
<https://www.globalreporting.org/about-gri/>.
Globalreporting n.d.b, 'How to use the GRI Standards', Global Reporting Website, viewed 7
August 2021, <https://www.globalreporting.org/how-to-use-the-gri-standards/>.
Goli ́ nski, MSn, Maciej 2019, 'Application of Corporate Social Responsibility for Competency
Management—Case Study', in PS Golinska-Dawson, Małgorzata (ed.), Corporate Social
Responsibility in the Manufacturing and Services Sectors, Environmental Issues in Logistics
and Manufacturing, EcoProduction, Springer-Verlag GmbH Germany, pp. 3-18.
Gond, J-P, Grubnic, S, Herzig, C & Moon, J 2012, 'Configuring management control systems:
Theorizing the integration of strategy and sustainability', Management Accounting Research,
vol. 23, no. 3, pp. 205-223.
González-Benito, J & Suárez-González, I 2010, 'A Study of the Role Played by Manufacturing
Strategic Objectives and Capabilities in Understanding the Relationship between Porter's
Generic Strategies and Business Performance: Role of Manufacturing Strategic and
Capabilities', British Journal of Management, vol. 21, no. 4, pp. 1027-1043.
Goran, S & Greg, W 2004, 'Proactive versus reactive business ethics performance: a conceptual
framework of profile analysis and case illustrations', Corporate Governance: The International
Journal of Business in Society, vol. 4, no. 2, pp. 18-33.
Gorbiano, MI 2019, 'Manufacturing sector to drive Indonesia's economy', The Jakarta Post,
viewed 11 February 2019, <https://www.thejakartapost.com/news/2019/02/11/manufacturing-
sector-to-drive-indonesias-economy-bappenas.html>.
Götz, O, Liehr-Gobbers, K & Krafft, M 2010, 'Evaluation of Structural Equation Models Using
the Partial Least Squares (PLS) Approach', in V Esposito Vinzi, WW Chin, J Henseler & H
Wang (eds), Handbook of Partial Least Squares: Concepts, Methods and Applications,
Springer Berlin Heidelberg, Berlin, Heidelberg, pp. 691-711, <https://doi.org/10.1007/978-3-
540-32827-8_30>.
Greenley, GE & Foxall, GR 1997, 'Multiple Stakeholder Orientation in UK Companies and the
Implications for Company Performance', Journal of Management Studies, vol. 34, no. 2, pp.
259-284.
Grewatsch, S & Kleindienst, I 2015, 'When Does It Pay to be Good? Moderators and Mediators
in the Corporate Sustainability–Corporate Financial Performance Relationship: A Critical
Review', Journal of Business Ethics, vol., pp. 1-34.
GRI 2013, 'G4 Sustainability Reporting Guidelines', Global Reporting Initiative (GRI), viewed
29 January 2018, <https://www.globalreporting.org/resourcelibrary/GRIG4-Part1-Reporting-
Principles-and-Standard-Disclosures.pdf>.

360
GRI 2017, 'Sustainability Disclosure Database', Global Reporting Initiative, viewed 24 April
2018, <https://database.globalreporting.org/search/>.
Griffin, JJ & Prakash, A 2013, 'Corporate Responsibility: Initiatives and Mechanisms',
Business & Society, vol. 53, no. 4, pp. 465-482.
Groza, MD, Pronschinske, MR & Walker, M 2011, 'Perceived Organizational Motives and
Consumer Responses to Proactive and Reactive CSR', Journal of Business Ethics, vol. 102, no.
4, pp. 639-652.
Guadamillas-Gómez, F, Donate-Manzanares, MJ & Škerlavaj, M 2010, 'The integration of
corporate social responsibility into the strategy of technology-intensive firms: a case study',
Zbornik radova Ekonomskog fakulteta u Rijeci : časopis za ekonomsku teoriju i praksu, vol.
28, no. 1, pp. 9-34.
Hadj, TB 2020, 'Effects of corporate social responsibility towards stakeholders and
environmental management on responsible innovation and competitiveness', Journal of
Cleaner Production, vol. 250, no. 119490, pp. 1-10.
Hair, J, Black, W, Babin, B & Anderson, R 2010, Multivariate Data Analysis: A Global
Perspective, 7th edn, Pearson, Upper Saddle River, New Jersey.
Hair, J, Celsi, M, Money, AH, Samouel, P & Page, MJ 2011, Essentials of Business Research
Methods, 2nd edn, M.E. Sharpe, Inc. , New York, the United States of America.
Hair, J, Hult, G, Ringle, CM & Sarstedt, M 2017, A primer on partial least squares structural
equation modeling (PLS-SEM), 2nd edn, Sage, Los Angeles.
Hair, J, Ringle, C, Gudergan, S, Fischer, A, Nitzl, C & Menictas, C 2019, 'Partial least squares
structural equation modeling-based discrete choice modeling: an illustration in modeling
retailer choice', Business Research, vol. 12, no. 1, pp. 115-142.
Hair, J, Ringle, C & Sarstedt, M 2011, 'PLS-SEM: Indeed a Silver Bullet', The Journal of
Marketing Theory and Practice, vol. 19, no. 2, pp. 139-152.
Hair, J, Risher, J, Sarstedt, M & Ringle, C 2018, 'When to use and how to report the results of
PLS-SEM', European Business Review, vol. 31, no. 1, pp. 2-24.
Hair, J, Sarstedt, M, Hopkins, L & Kuppelwieser, V 2014, 'Partial least squares structural
equation modeling (PLS-SEM): An emerging tool in business research', European Business
Review, vol. 26, no. 2, pp. 106-121.
Hair, J, Sarstedt, M, Pieper, T & Ringle, C 2012, 'The Use of Partial Least Squares Structural
Equation Modeling in Strategic Management Research: A Review of Past Practices and
Recommendations for Future Applications', Long Range Planning, vol. 45, no. 5, pp. 320-340.
Hair, J, Sarstedt, M, Ringle, C & Mena, J 2012, 'An assessment of the use of partial least
squares structural equation modeling in marketing research', Journal of the Academy of
Marketing Science, vol. 40, no. 3, pp. 414-433.

361
Hair, J, Sarstedt, M, Ringle, CM & Gudergan, SP 2018, Advanced Issues in Partial Least
Squares Structural Equation Modeling, Sage Publications Inc. , United States of America.
Hair, JF, Jr., Sarstedt, M, Matthews, LM & Ringle, CM 2016, 'Identifying and treating
unobserved heterogeneity with FIMIX-PLS: part I - method', European Business Review
(Bingley), vol. 28, no. 1, pp. 63-76.
Hair, JF, Ringle, CM & Sarstedt, M 2013, 'Partial Least Squares Structural Equation Modeling:
Rigorous Applications, Better Results and Higher Acceptance', Long Range Planning, vol. 46,
no. 1, pp. 1-12.
Halme, M & Huse, M 1997, 'The influence of corporate governance, industry and country
factors on environmental reporting', Scandinavian Journal of Management, vol. 13, no. 2, pp.
137-157.
Halme, M & Laurila, J 2009, 'Philanthropy, Integration or Innovation? Exploring the Financial
and Societal Outcomes of Different Types of Corporate Responsibility', Journal of Business
Ethics, vol. 84, no. 3, pp. 325-339.
Hambrick, DC 1983, 'High Profit Strategies in Mature Capital Goods Industries: A
Contingency Approach', The Academy of Management Journal, vol. 26, no. 4, pp. 687-707.
Hambrick, DC & Lei, D 1985, 'Toward An Empirical Prioritization Of Contingency Variables
For Business Strategy', Academy of Management Journal, vol. 28, no. 4, pp. 763-788.
Hamid, MRAS, W.; Sidek, M. H. Mohmad 2017, 'Discriminant Validity Assessment: Use of
Fornell & Larcker criterion versus HTMT Criterion', Journal of Physics: Conf. Series, vol. 890,
pp. 1-5.
Handayani, R, Wahyudi, S & Suharnomo 2017, 'The effects of corporate social responsibility
on manufacturing industry performance: the mediating role of social collaboration and green
innovation', Verslas : Teorija ir Praktika, vol. 18, pp. 152-159.
Hasan, I, Kobeissi, N, Liu, L & Wang, H 2018, 'Corporate Social Responsibility and Firm
Financial Performance: The Mediating Role of Productivity', Journal of Business Ethics, vol.
149, no. 3, pp. 671-688.
Hasanudin, AI & Budianto, R 2013, 'The Implications of Corporate Social Responsibility and
Firm Performance with Reputation as Intervening Variable Empirical Study in the
Manufacturing Company in Indonesia', GSTF Journal on Business Review (GBR), vol. 2, no.
4, pp. 106-109.
Hax, AC & Majluf, NS 1984, 'The Corporate Strategic Planning Process', Interfaces, vol. 14,
no. 1, pp. 47-60.
Helm, S, Eggert, A & Garnefeld, I 2010, 'Modeling the Impact of Corporate Reputation on
Customer Satisfaction and Loyalty Using Partial Least Squares', in Ve Esposito Vinzi, WWe
Chin, Je Henseler & He Wang (eds), Handbook of Partial Least Squares Concepts, Methods
and Applications, Springer Berlin Heidelberg, Berlin, Heidelberg, pp. 515-534.

362
Henseler, J & Fassott, G 2010, 'Testing Moderating Effects in PLS Path Models: An Illustration
of Available Procedures', in V Esposito Vinzi, WW Chin, J Henseler & H Wang (eds),
Handbook of Partial Least Squares: Concepts, Methods and Applications, Springer Berlin
Heidelberg, Berlin, Heidelberg, pp. 713-735.
Henseler, J, Ray, PA & Hubona, G 2016, 'Using PLS path modeling in new technology
research: updated guidelines', Industrial Management & Data Systems, vol. 116, no. 1, pp. 2-
20.
Henseler, J, Ringle, CM & Sarstedt, M 2015, 'A new criterion for assessing discriminant
validity in variance-based structural equation modeling', Journal of the Academy of Marketing
Science, vol. 43, no. 1, pp. 115-135.
Henseler, J, Ringle, CM & Sarstedt, M 2016, 'Testing measurement invariance of composites
using partial least squares', International Marketing Review, vol. 33, no. 3, pp. 405-431.
Henseler, J, Ringle, CM & Sinkovics, RR 2009, The use of partial least squares path modeling
in international marketing, Emerald Group Publishing Limited.
Hill, CWL 1988, 'Differentiation Versus Low Cost or Differentiation and Low Cost: A
Contingency Framework', Academy of Management Review, vol. 13, no. 3, pp. 401-412.
Hilton, CE 2017, 'The importance of pretesting questionnaires: a field research example of
cognitive pretesting the Exercise referral Quality of Life Scale (ER-QLS)', International
Journal of Social Research Methodology, vol. 20, no. 1, pp. 21-34.
Hinsliff, G 2019, 'Fast fashion is eating up the planet – and this feeble government enables it',
The Guardian, viewed 11 November 2019,
<https://www.theguardian.com/commentisfree/2019/jun/18/fast-fashion-environmental-audit-
committee-polluting-industry>.
Hoejmose, S, Brammer, S & Millington, A 2013, 'An empirical examination of the relationship
between business strategy and socially responsible supply chain management', International
Journal of Operations & Production Management, vol. 33, no. 5, pp. 589-621.
Hoffman, AJ 1999, 'Institutional Evolution and Change: Environmentalism And The U.S.
Chemical Industry', Academy of Management Journal, vol. 42, no. 4, pp. 351-371.
Hopkins, M 2005, 'Measurement of corporate social responsibility', International Journal of
Management and Decision Making, vol. 6, no. 3-4, pp. 213-231.
Huang, C-J 2010, 'Corporate governance, corporate social responsibility and corporate
performance', Journal of Management and Organization, vol. 16, no. 5, pp. 641-655.
Huber, GP & Power, DJ 1985, 'Retrospective reports of strategic‐level managers: Guidelines
for increasing their accuracy', Strategic Management Journal, vol. 6, no. 2, pp. 171-180.
Hulland, J, Baumgartner, H & Smith, KM 2018, 'Marketing survey research best practices:
evidence and recommendations from a review of JAMS articles', Journal of the Academy of
Marketing Science, vol. 46, no. 1, pp. 92-108.

363
Hur, W-M, Kim, H & Woo, J 2014, 'How CSR Leads to Corporate Brand Equity: Mediating
Mechanisms of Corporate Brand Credibility and Reputation', Journal of Business Ethics, vol.
125, no. 1, pp. 75-86.
Husted, BW 2000, 'A Contingency Theory of Corporate Social Performance', Business &
Society, vol. 39, no. 1, pp. 24-48.
Husted, BW & David, BA 2011, Corporate Social Strategy: Stakeholder Engagement and
Competitive Advantage, Cambridge University Press, New York, United States of America.
Hwang, G, Han, S, Jun, S & Park, J 2014, 'Operational Performance Metrics in Manufacturing
Process: Based on SCOR Model and RFID Technology ', International Journal of Innovation,
Management and Technology, vol. 5, no. 1, pp. 50-55.
Ihlen, Ø 2008, 'Mapping the environment for corporate social responsibility: Stakeholders,
publics and the public sphere', Corporate Communications, vol. 13, no. 2, pp. 135-146.
Indonesia, M 2016, 'Indonesia: One of the World’s Top 10 Manufacturers', viewed 7 April
2020, <https://manufacturingindonesia.com/indonesia-one-worlds-top-10-manufacturers/>.
Indonesia, PI 2019, 'RI Andalkan 5 Produk Unggulan', viewed April 07,
<https://indonesia.go.id/narasi/indonesia-dalam-angka/ekonomi/ri-andalkan-5-produk-
unggulan>.
Indonesia, R 2011, Masterplan: Acceleration and Expansion of Indonesia Economic
Development 2011-2025, Coordinating Ministry for Economic Affairs, Ministry of National
Planning and Development, Jakarta, <www.aseanbriefing.com › resources-pdfs › Indonesia ›
FDI>.
IndustryToday 2016, 'Made in Indonesia?', Industrytoday.com, viewed 7 April 2020,
<https://industrytoday.com/made-in-indonesia/>.
Insight, E 2016, 'The factors that really drive CSR integration: Use of corporate social
responsibility is complex and diverse', Strategic Direction, vol. 32, no. 10, pp. 27-29.
Investment, I 2020, 'Economy of Indonesia', viewed 7 April 2020, <https://www.indonesia-
investments.com/culture/economy/item177>.
Isabelle, M, Ferrell, OC & Linda, F 2005, 'A stakeholder model for implementing social
responsibility in marketing', European Journal of Marketing, vol. 39, no. 9/10, pp. 956-977.
ISO n.d., 'ISO 26000 Social Responsibility, ISO official website, viewed 7 August 2021,
<https://www.iso.org/iso-26000-social-responsibility.html>.
Izzo, MF 2014, 'Bringing theory to practice: how to extract value from corporate social
responsibility', Journal of Global Responsibility, vol. 5, no. 1, pp. 22-44.
Jamali, D 2006, 'Insights into triple bottom line integration from a learning organization
perspective', Business Process Management Journal, vol. 12, no. 6, pp. 809-821.

364
Jamali, D 2008, 'A Stakeholder Approach to Corporate Social Responsibility: A Fresh
Perspective into Theory and Practice', Journal of Business Ethics, vol. 82, no. 1, pp. 213-231.
Jamali, D & Karam, C 2018, 'Corporate Social Responsibility in Developing Countries as an
Emerging Field of Study', International Journal of Management Reviews, vol. 20, no. 1, pp.
32-61.
Jarvis, CB, Mackenzie, SB, Podsakoff, PM, Mick, DG & Bearden, WO 2003, 'A Critical
Review of Construct Indicators and Measurement Model Misspecification in Marketing and
Consumer Research', Journal of Consumer Research, vol. 30, no. 2, pp. 199-218.
Jogloabang 2021, 'Permen BUMN Per-05/MBU/04/2021 tentang Program TJSL BUMN',
viewed 6 August 2021, <https://www.jogloabang.com/ekbis/permen-bumn-05mbu042021-
program-tjsl-bumn>.
Johnson, RB & Onwuegbuzie, AJ 2004, 'Mixed Methods Research: A Research Paradigm
Whose Time Has Come', Educational Researcher, vol. 33, no. 7, pp. 14-26.
Jones, MT 1999, 'The Institutional Determinants of Social Responsibility', Journal of Business
Ethics, vol. 20, no. 2, pp. 163-179.
Jones, T 1995, 'Instrumental stakeholder theory: A synthesis of ethics and', Academy of
Management. The Academy of Management Review, vol. 20, no. 2, p. 404.
Jörg, H, Theo, KD, Marko, S, Christian, MR, Adamantios, D, Detmar, WS, David J. Ketchen,
Jr., Joseph, FH, Hult, GTM & Roger, JC 2014, 'Common Beliefs and Reality About PLS:
Comments on Rönkkö and Evermann (2013)', Organizational Research Methods, vol. 17, no.
2, pp. 182-209.
Joseph, C, Gunawan, J, Sawani, Y, Rahmat, M, Avelind Noyem, J & Darus, F 2016, 'A
comparative study of anti-corruption practice disclosure among Malaysian and Indonesian
Corporate Social Responsibility (CSR) best practice companies', Journal of Cleaner
Production, vol. 112, pp. 2896-2906.
Judd, CM, Kenny, D. A. 2010, 'Data analysis in social psychology: Recent and recurring
issues', in ST Fiske, DT Gilbert & G Lindzey (eds), Handbook of social psychology, 5th edn,
Wiley, Hoboken, N.J.
Kabadayi, S, Eyuboglu, N & Thomas, GP 2007, 'The Performance Implications of Designing
Multiple Channels to Fit with Strategy and Environment', Journal of Marketing, vol. 71, no. 4,
pp. 195-211.
Kapoor, S & Sandhu, HS 2010, 'Does it Pay to be Socially Responsible? An Empirical
Examination of Impact of Corporate Social Responsibility on Financial Performance', Global
Business Review, vol. 11, no. 2, pp. 185-208.
Karnani, A 1984, 'Generic Competitive Strategies-an Analytical Approach', Strategic
Management Journal, vol. 5, no. 4, pp. 367-380.
365
Katsoulakos, T & Katsoulacos, Y 2007, 'Integrating corporate responsibility principles and
stakeholder approaches into mainstream strategy: A stakeholder‐oriented and integrative
strategic management framework', Corporate Governance: The International Journal of
Business in Society, vol. 7, no. 4, pp. 355-369.
Kemenperin 2018, 'Lima Sektor Unggulan Mampu Hadapi Revolusi Industri Digital', Kontan
Harian, viewed 20 January 2020, <https://kemenperin.go.id/artikel/18792/Lima-Sektor-
Unggulan-Mampu-Hadapi-Revolusi-Industri-Digital >.
Kemenperin 2020a, 'Industri Pengolahan Jadi Andalan Ekspor Nasional', viewed 7 April 2020,
<https://kemenperin.go.id/artikel/21409/Industri-Pengolahan-Jadi-Andalan-Ekspor-
Nasional>.
Kemenperin 2020b, 'Kemenperin Bidik Industri Tumbuh 5,3 Persen Tahun 2020', viewed 7
April 2020, <https://kemenperin.go.id/artikel/21346/Kemenperin-Bidik-Industri-Tumbuh-5,3-
Persen-Tahun-2020>.
Kencana, MRB 2019, 'BEI Dorong Perusahaan Tercatat Terapkan Pembangunan
Berkelanjutan', Liputan6.com, viewed 19 July 2020,
<https://www.liputan6.com/bisnis/read/3950084/bei-dorong-perusahaan-tercatat-terapkan-
pembangunan-berkelanjutan >.
Ketchen, DJ & Shook, CL 1996, 'The application of cluster analysis in strategic management
research: An analysis and critique', Strategic Management Journal, vol. 17, no. 6, pp. 441-458.
Khan, HuR, Ali, M, Olya, HGT, Zulqarnain, M & Khan, ZR 2018, 'Transformational
leadership, corporate social responsibility, organizational innovation, and organizational
performance: Symmetrical and asymmetrical analytical approaches', Corporate Social
Responsibility and Environmental Management, vol. 25, no. 6, pp. 1270-1283.
Kiessling, T, Isaksson, L & Yasar, B 2016, 'Market Orientation and CSR: Performance
Implications', Journal of Business Ethics, vol. 137, no. 2, pp. 269-284.
Kim, E, Nam, D-i & Stimpert, JL 2004, 'Testing The Applicability of Porter's Generic
Strategies in The Digital Age: A Study of Korean Cyber Malls', Journal of Business Strategies,
vol. 21, no. 1, pp. 19-45.
Kim, K-H, Kim, M & Qian, C 2018, 'Effects of Corporate Social Responsibility on Corporate
Financial Performance: A Competitive-Action Perspective', Journal of Management, vol. 44,
no. 3, pp. 1097-1118.
Kiron, D, Kruschwitz, N, Reeves, M & Goh, E 2013, 'The Benefits of Sustainability-Driven
Innovation', MIT Sloan Management Review, vol. 54, no. 2, pp. 69-73.
Kleine, A & von Hauff, M 2009, 'Sustainability-Driven Implementation of Corporate Social
Responsibility: Application of the Integrative Sustainability Triangle', Journal of Business
Ethics, vol. 85, no. 3, p. 517.

366
KlikLegal 2017, 'Indonesia Dinilai Memiliki Terlalu Banyak Regulasi yang Mengatur CSR',
KlikLegal.com, viewed 6 October 2018, <https://kliklegal.com/indonesia-dinilai-memiliki-
terlalu-banyak-regulasi-yang-mengatur-csr/>.
Kock, N 2015, 'Common method bias in PLS-SEM: A full collinearity assessment approach',
International Journal of e-Collaboration, vol. 11, no. 4, pp. 1-10.
Kock, N & Lynn, GS 2012, 'Lateral Collinearity and Misleading Results in Variance-Based
SEM: An Illustration and Recommendations', Journal of the Association for Information
Systems, vol. 13, no. 7, pp. 546-580.
Kolk, A 2003, 'Trends in sustainability reporting by the Fortune Global 250', Business Strategy
and the Environment, vol. 12, no. 5, pp. 279-291.
Kotha, S & Nair, A 1995, 'Strategy and Environment as Determinants of Performance:
Evidence from the Japanese Machine Tool Industry', Strategic Management Journal, vol. 16,
no. 7, pp. 497-518.
Kotha, S & Vadlamani, BL 1995, 'Assessing Generic Strategies: An Empirical Investigation of
Two Competing Typologies in Discrete Manufacturing Industries', Strategic Management
Journal, vol. 16, no. 1, pp. 75-83.
Kotler, P & Lee, N 2005, Corporate Social Responsibility : Doing the Most Good for Your
Company and Your Cause, Wiley, Hoboken, N.J., nlebk database.
Kun, L, Nasrin, RK & Weiquan, C 2019, 'Corporate Social Responsibility Practices in China:
Trends, Context, and Impact on Company Performance', Sustainability, vol. 11, no. 2, p. 354.
Kunda, MM, Ataman, G & Behram, NK 2019, 'Corporate Social Responsibility and
Organizational Citizenship Behavior: The Mediating Role of Job Satisfaction', Journal of
Global Responsibility, vol. 10, no. 1, pp. 47-68.
Laguir, L, Laguir, I & Tchemeni, E 2019, 'Implementing CSR activities through management
control systems', Accounting, Auditing & Accountability Journal, vol. 32, no. 2, pp. 531-555.
Lai, W-H, Lin, C-C & Wang, T-C 2015, 'Exploring the interoperability of innovation capability
and corporate sustainability', Journal of Business Research, vol. 68, no. 4, pp. 867-871.
Lane, AB & Devin, B 2018, 'Operationalizing Stakeholder Engagement in CSR: A Process
Approach', Corporate Social Responsibility and Environmental Management, vol. 25, no. 3,
pp. 267-280.
Lao, Y, Hong, P & Rao, SS 2010, 'Supply management, supply flexibility and performance
outcomes: An empirical investigation of manufacturing firms', Journal of Supply Chain
Management, vol. 46, no. 3, pp. 6-22.
Latif, KF, Sajjad, A, Bashir, R, Shaukat, MB, Khan, MB & Sahibzada, UF 2020, 'Revisiting
the relationship between corporate social responsibility and organizational performance: The
mediating role of team outcomes', Corporate Social Responsibility and Environmental
Management, vol. 27, no. 4, pp. 1630-1641.

367
Laufer, WS 2003, 'Social Accountability and Corporate Greenwashing', Journal of Business
Ethics, vol. 43, no. 3, pp. 253-261.
Lawton, TC, Doh, JP & Rajwani, T 2014, Aligning for Advantage Competitive Strategies for
the Political and Social Arenas, Oxfod University Press, Oxfod, United Kingdom.
Lee, J & Miller, D 1996, 'Strategy, Environment and Performance in Two Technological
Contexts: Contingency Theory in Korea', Organization Studies, vol. 17, no. 5, pp. 729-750.
Lee, M-DP 2008, 'A review of the theories of corporate social responsibility: Its evolutionary
path and the road ahead', International Journal of Management Reviews, vol. 10, no. 1, pp. 53-
73.
Lee, M-DP 2011, 'Configuration of External Influences: The Combined Effects of Institutions
and Stakeholders on Corporate Social Responsibility Strategies', Journal of Business Ethics,
vol. 102, no. 2, pp. 281-298.
Lewis-Beck, MS, Bryman, A & Liao, TF 2004, The Sage encyclopedia of social science
research methods, Encyclopedia of social science research methods, Sage, Thousand Oaks,
Calif.
Leys, C, Klein, O, Dominicy, Y & Ley, C 2018, 'Detecting multivariate outliers: Use a robust
variant of the Mahalanobis distance', Journal of Experimental Social Psychology, vol. 74, pp.
150-156.
Liket, K & Maas, K 2015, 'Strategic Philanthropy: Corporate Measurement of Philanthropic
Impacts as a Requirement for a "Happy Marrige" of Business and Society', Business & Society,
vol. 55, no. 6, pp. 889-921.
Lin, C, Tsai, H-L & Wu, J-C 2014, 'Collaboration strategy decision-making using the Miles
and Snow typology', Journal of Business Research, vol. 67, no. 9, pp. 1979-1990.
Lincoln, Y, Lynham, SA & Guba, EG 2011, 2011, 'Paradigmatic Controversies, Contradictions
and Emerging Confluences Revisited, the Sage Handbook of Qualitative Research.', in YSL
Norman K. Denzin (ed.), Sage.
Lindell, MK & Whitney, DJ 2001, 'Accounting for Common Method Variance in Cross-
Selectional Research Designs', Journal of Applied Psychology, vol. 86, no. 1, pp. 114-121.
Lindgreen, A, Swaen, V, Harness, D & Hoffmann, M 2011, 'The Role of ‘High Potentials’ in
Integrating and Implementing Corporate Social Responsibility', Journal of Business Ethics,
vol. 99, no. 1, pp. 73-91.
Lindgreen, A, Swaen, V & Maon, F 2009, 'Corporate Social Responsibility Within the
Organization', Corporate Reputation Review, vol. 12, no. 2, pp. 83-86.
Lindgreen, A, Swaen, V, xe, rie & Johnston, WJ 2009, 'Corporate Social Responsibility: An
Empirical Investigation of U.S. Organizations', Journal of Business Ethics, vol. 85, pp. 303-
323.

368
Linnenluecke, MK & Griffiths, A 2010, 'Corporate sustainability and organizational culture',
Journal of World Business, vol. 45, no. 4, pp. 357-366.
Liu, Y, Li, W & Li, Y 2019, 'Ambidexterity between low cost strategy and CSR strategy:
contingencies of competition and regulation', Asia Pacific Journal of Management, vol.
Lorenz, C, Gentile, G-C & Wehner, T 2013, 'Exploring Corporate Community Engagement in
Switzerland', Business & Society, vol. 55, no. 4, pp. 594-631.
Lourenço, IC & Branco, MC 2013, 'Determinants of corporate sustainability performance in
emerging markets: the Brazilian case', Journal of Cleaner Production, vol. 57, pp. 134-141.
Luo, X & Bhattacharya, CB 2006, 'Corporate Social Responsibility, Customer Satisfaction,
and Market Value', Journal of Marketing, vol. 70, no. 4, pp. 1-18.
Luo, Y & Zhao, H 2004, 'Corporate link and competitive strategy in multinational enterprises:
a perspective from subsidiaries seeking host market penetration', Journal of International
Management, vol. 10, no. 1, pp. 77-105.
MacKinnon, DP, Fairchild, AJ & Fritz, MS 2007, 'Mediation Analysis', vol. 58, no. 1, pp. 593-
614.
Mahendra n.d., ' ISO 26000 sebagai Standar Global dalam Pelaksanaan CSR, ISO Indonesia
Center, viewed 7 August 2021, <https://isoindonesiacenter.com/sekilas-tentang-iso-26000/>.
Mahmoud, MA, Blankson, C & Hinson, RE 2017, 'Market orientation and corporate social
responsibility: towards an integrated conceptual framework', International Journal of
Corporate Social Responsibility, vol. 2, no. 1, p. 9.
Maignan, I & Ferrell, OC 2000, 'Measuring Corporate Citizenship in Two Countries: The Case
of the United States and France', Journal of Business Ethics, vol. 23, no. 3, pp. 283-297.
Maignan, I & Ferrell, OC 2001, 'Antecedents and benefits of corporate citizenship: an
investigation of French businesses', Journal of Business Research, vol. 51, no. 1, pp. 37-51.
Maignan, I & Ferrell, OC 2004, 'Corporate Social Responsibility and Marketing: An
Integrative Framework', Journal of the Academy of Marketing Science, vol. 32, no. 1, pp. 3-19.
Maignan, I, Ferrell, OC, Hult, G & Tomas, M 1999, 'Corporate citizenship: Cultural
antecedents and business benefits', Journal of the Academy of Marketing Science, vol. 27, no.
4, p. 455.
Maignan, I & Ralston, DA 2002, 'Corporate Social Responsibility in Europe and the U.S.:
Insights from Businesses' Self-Presentations', Journal of International Business Studies, vol.
33, no. 3, pp. 497-514.
Majerova, IN, J. 2017, 'The Measurement of Human Development using the Ward Method of
Cluster Analysis', Journal of International Studies, vol. 10, no. 2, pp. 239-257.

369
Malik, M 2015, 'Value-Enhancing Capabilities of CSR: A Brief Review of Contemporary
Literature', Journal of Business Ethics, vol. 127, no. 2, pp. 419-438.
Maon, F, Lindgreen, A & Swaen, V 2009, 'Designing and Implementing Corporate Social
Responsibility: An Integrative Framework Grounded in Theory and Practice', Journal of
Business Ethics, vol. 87, no. 1, pp. 71-89.
Maráková, VL, Marzanna; Wolak-Tuzimek, Anna 2019, 'Forms of Stakeholders
Communication by Socially Responsible Enterprises in Slovakia and Poland', in PG-DM
Spychała (ed.), Corporate Social Responsibility in the Manufacturing and Services Sectors,
Environmental Issues in Logistics and Manufacturing, EcoProduction, Springer-Verlag GmbH
Germany, Berlin, pp. 235-25.
Marin-Garcia, J & Alfalla-Luque, R 2019, 'Key issues on Partial Least Squares (PLS) in
operations management research: A guide to submissions', Journal of Industrial Engineering
and Management, vol. 12, no. 2, pp. 219-240.
Marín, L, Rubio, A & de Maya, SR 2012, 'Competitiveness as a Strategic Outcome of
Corporate Social Responsibility', Corporate Social Responsibility and Environmental
Management, vol. 19, no. 6, pp. 364-376.
Maris, A 2014, 'Compulsory CSR: Indonesia takes a tough stance but clarity on definitions is
lacking', International Public Relations Association, viewed 6 October 2019,
<https://www.ipra.org/news/itle/compulsory-csr-indonesia-takes-a-tough-stance-but-clarity-
on-definitions-is-lacking>.
Marques-Mendes, A & Santos, MJ 2016, 'Strategic CSR: an integrative model for analysis',
Social Responsibility Journal, vol. 12, no. 2, pp. 363-381.
Martinez-Conesa, I, Soto-Acosta, P & Palacios-Manzano, M 2017, 'Corporate social
responsibility and its effect on innovation and firm performance: An empirical research in
SMEs', Journal of Cleaner Production, vol. 142, no. Part 4, pp. 2374-2383.
Martínez, P & Rodríguez del Bosque, I 2013, 'CSR and customer loyalty: The roles of trust,
customer identification with the company and satisfaction', International Journal of Hospitality
Management, vol. 35, pp. 89-99.
Martinuzzi, A & Krumay, B 2013, 'The Good, the Bad, and the Successful – How Corporate
Social Responsibility Leads to Competitive Advantage and Organizational Transformation',
Journal of Change Management, vol. 13, no. 4, pp. 424-443.
Massimo, B, Francesco, T, Lara, B, Fabio, I & Marco, F 2014, 'Corporate Social Responsibility
and Competitiveness within SMEs of the Fashion Industry: Evidence from Italy and France',
Sustainability, vol. 6, no. 2, pp. 872-893.
Matten, D & Crane, A 2005, 'Corporate Citizenship: Toward an Extended Theoretical
Conceptualization', The Academy of Management Review, vol. 30, no. 1, pp. 166-179.
Matthews, L 2017, 'Applying Multigroup Analysis in PLS-SEM: A Step-by-Step Process', in
H Latan & R Noonan (eds), Partial Least Squares Path Modeling: Basic Concepts,

370
Methodological Issues and Applications, Springer International Publishing, Cham, pp. 219-
243.
Matthews, L, Hair, J & Matthews, R 2018, 'PLS-SEM: The Holy Grail for Advanced Analysis',
The Marketing Management Journal, vol. 28, no. 1, pp. 1-13.
Maulamin, T 2017, 'The Implementation of Corporate Social Responsibility (CSR) in
Indonesia: A Case Study Approach', European Journal of Research in Social Science, vol. 5,
no. 1, pp. 70-81.
McWilliams, A & Siegel, DS 2011, 'Creating and Capturing Value: Strategic Corporate Social
Responsibility, Resource-Based Theory, and Sustainable Competitive Advantage', Journal of
Management, vol. 37, no. 5, pp. 1480-1495.
Mellahi, K, Frynas, JG, Sun, P & Siegel, D 2015, 'A Review of the Nonmarket Strategy
Literature', Journal of Management, vol. 42, no. 1, pp. 143-173.
Menon, A, Bharadwaj, SG & Howell, R 1996, 'The Quality and Effectiveness of Marketing
Strategy: Effects of Functional and Dysfunctional Conflict in Intraorganizational
Relationships', Journal of the Academy of Marketing Science, vol. 24, no. 4, p. 299.
Meznar, MB & Nigh, D 1995, 'Buffer or bridge? Environmental and organization determinants
of public affairs activities in American firms', Academy of Management Journal, vol. 38, no.
4, pp. 975-996.
Michaelidou, N & Dibb, S 2006, 'Using email questionnaires for research: Good practice in
takcling non-response', Journal of Targeting, Measurement and Analysis for Marketing, vol.
14, no. 4, pp. 289-296.
Michelon, G, Boesso, G & Kumar, K 2013, 'Examining the Link between Strategic Corporate
Social Responsibility and Company Performance: An Analysis of the Best Corporate Citizens',
Corporate Social Responsibility and Environmental Management, vol. 20, no. 2, pp. 81-94.
Miller, JG & Roth, AV 1994, 'A taxonomy of manufacturing strategies', Management Science,
vol. 40, no. 3, p. 285.
Milligan, GW & Mahajan, V 1980, 'A note on procedures for testing the quality of a clustering
of a set of objects', Decision Sciences, vol. 11, no. 4, pp. 669-677.
Moczadlo, R 2015, 'Creating Competitive Advantages - The European CSR-Strategy
Compared with Porter's and Kramer's Shared Value Approach ', Ekonomski Vjesnik, vol. 28,
no. 1, pp. 243-256.
Moir, L 2001, 'What do we mean by corporate social responsibility?', Corporate Governance:
The International Journal of Business in Society, vol. 1, no. 2, pp. 16-22.
Moisescu, O-I 2018, 'From perceptual corporate sustainability to customer loyalty: a multi-
sectorial investigation in a developing country', Economic Research-Ekonomska Istraživanja,
vol. 31, no. 1, pp. 55-72.

371
Moon, H-C, Parc, J, Yim, SH & Park, N 2011, 'An Extension of Porter and Kramer's Creating
Shared Value (CSV): Reorienting Strategies and Seeking International Cooperation', Journal
of International and Area Studies, vol. 18, no. 2, pp. 49-64.
Moonsamy, V & Singh, S 2014, 'Using factor analysis to explore principal components for
quality management implementation', Quality & Quantity, vol. 48, no. 2, pp. 605-622.
Mursitama, T, Fakhrudin, I & Hasan, M 2014, 'Evolving Practices of Corporate Social
Responsibility in Indonesia's Pulp and Paper Industry', Asian Journal of Scientific Research,
vol. 7, no. 1, pp. 1-17.
Myers, MD 2009, Qualitative research in business and management, Qualitative research in
business & management, SAGE, Los Angeles.
Nag, OS 2018, 'The World's Most Polluting Industries', World Atlas, viewed 11 November
2019, <worldatlas.com/articles/the-top-10-polluting-industries-in-the-world.html.>.
Nandakumar, MK, Ghobadian, A & O'Regan, N 2011, 'Generic strategies and performance –
evidence from manufacturing firms', International Journal of Productivity and Performance
Management, vol. 60, no. 3, pp. 222-251.
NCSR 2020, 'Tentang Asia SR Rating', National Center for Sustainability Reporting, viewed
19 July 2020, <https://www.ncsr-id.org/id/asia-sr-rating/tentang-asia-sr-rating/>.
Nguyen P-M, DVN, Phuc Nguyen N, Choo Y. 2020, 'Corporate Social Responsibilities of Food
Processing Companies in Vietnam from Consumer Perspective', Sustainability., vol. 12, no. 1,
p. 71.
Nicholas, OR & Abby, G 2006, 'Perceptions of generic strategies of small and medium sized
engineering and electronics manufacturers in the UK: The applicability of the Miles and Snow
typology', Journal of Manufacturing Technology Management, vol. 17, no. 5, pp. 603-620.
Nitzl, C, Roldan, JL & Cepeda, G 2016, 'Mediation analysis in partial least squares path
modeling: Helping researchers discuss more sophisticated models', Industrial Management &
Data Systems, vol. 116, no. 9, pp. 1849-1864.
Nunnaly, JCB, Ira H. 1994, Psychometric Theory, 3rd edn, McGraw-Hill, New York.
O'Farrell, P, Hitchens, D & Moffat, L 1992, 'Does strategy matter? An analysis of generic
strategies and performance in business service firms', Business Strategy Review, vol. 3, no. 1,
p. 71.
Öberseder, M, Schlegelmilch, BB & Murphy, PE 2013, 'CSR practices and consumer
perceptions', Journal of Business Research, vol. 66, no. 10, pp. 1839-1851.
OECD 2020, 'Economic Survey of Indonesia', OECD, viewed 7 April 2020,
<http://www.oecd.org/economy/indonesia-economic-snapshot/>.

372
Ofori, D, F.; Hinson, Robert, E. 2007, 'Corporate social responsibility (CSR) perspectives of
leading firms in Ghana', Corporate Governance: The International Journal of Business in
Society, vol. 7, no. 2, pp. 178-193.
OJK 2016, 'Undang-Undang No. 40 Tahun 2007 Tentang Perseroan Terbatas', Otoritas Jasa
Keuangan, viewed 19 July 2020, <https://www.ojk.go.id/sustainable-
finance/id/peraturan/undang-undang/Documents/5.%20UU-40-
2007%20PERSEROAN%20TERBATAS.pdf>.
Omsa, SA, Ibrahim H.; Jamali, Hisnol 2017, 'Five Competitive Forces Model and the
Implementation of Porter’s Generic Strategies to Gain Firm Performances', Science Journal of
Business and Management, vol. 5, no. 1, pp. 9-16.
Ooi, SK, Amran, A & Yeap, JAL 2017, 'Defining and Measuring Strategic CSR: A Formative
Construct', Global Business and Management Research, vol. 9, no. 4s, pp. 250-265.
Orlitzky, M, Schmidt, FL & Rynes, SL 2003, 'Corporate Social and Financial Performance: A
Meta-Analysis', Organization Studies, vol. 24, no. 3, pp. 403-441.
Orsato, RJ 2006, 'Competitive Environmental Strategies: When Does It Pay To Be Green?',
California Management Review, vol. 48, no. 2, pp. 127-143.
Pallant, JF 2005, SPSS survival manual: a step by step guide to data analysis using SPSS for
Windows (Version 12), 2nd edn, Allen & Unwin, Crows Nest, N.S.W.
Paraschiv, DM, Nemoianu, EL, Langa, CA & Szabó, T 2012, 'Eco-Innovation, Responsible
Leadership And Organizational Change For Corporate Sustainability ', Amfiteatru Economic,
vol. 14, no. 32, pp. 404-419.
Parisi, C 2013, 'The Impact of Organisational Alignment on the Effectiveness of Firms'
Sustainability Strategic Performance Measurement Systems: An Empirical Analysis', Journal
of Management and Governance, vol. 17, no. 1, pp. 71-97.
Park, E, Kim, KJ & Kwon, SJ 2017, 'Corporate social responsibility as a determinant of
consumer loyalty: An examination of ethical standard, satisfaction, and trust', Journal of
Business Research, vol. 76, pp. 8-13.
Patrisia, D & Dastgir, S 2017, 'Diversification and corporate social performance in
manufacturing companies', Eurasian Business Review, vol. 7, no. 1, pp. 121-139.
Pearce, JA, Robbins, DK & Robinson, RB 1987, 'The Impact of Grand Strategy and Planning
Formality on Financial Performance', Strategic Management Journal, vol. 8, no. 2, pp. 125-
134.
Peloza, J & Shang, J 2011, 'How can corporate social responsibility activities create value for
stakeholders? A systematic review', Journal of the Academy of Marketing Science, vol. 39, no.
1, pp. 117-135.

373
Peng, DX & Lai, F 2012, 'Using partial least squares in operations management research: A
practical guideline and summary of past research', Journal of Operations Management, vol.
30, no. 6, pp. 467-480.
Pérez, A & Rodríguez del Bosque, I 2015, 'An Integrative Framework to Understand How CSR
Affects Customer Loyalty through Identification, Emotions and Satisfaction', Journal of
Business Ethics, vol. 129, no. 3, pp. 571-584.
Perri & Bellamy, C 2012, Principles of Methodology: Research Design in Social Science,
SAGE Publications, California.
Ping-Ju Wu, S, Straub, DW & Liang, T-P 2015, 'How Information Technology Governance
Mechanisms And Strategic Alignment Influence Organizational Performance: Insights From
A Matched Survey Of Business And IT Managers ', MIS Quarterly, vol. 39, no. 2, pp. 497-
A497.
PIRAC 2002, Investing in Ourselves: Giving and Fundraising in Indonesia, Manila, viewed 6
February 2018, <https://www.issuelab.org/resource/investing-in-ourselves-giving-and-fund-
raising-in-indonesia.html>.
Podsakoff, PM, MacKenzie, SB, Jeong-Yeon, L & Podsakoff, NP 2003, 'Common Method
Biases in Behavioral Research: A Critical Review of the Literature and Recommended
Remedies', Journal of Applied Psychology, vol. 88, no. 5, p. 879.
Porter, M & Kramer, M 2006, 'Strategy and society: the link between competitive advantage
and corporate social responsibility', Harvard Business Review, vol. 84, no. 12, p. 78.
Porter, M & Kramer, M 2011, 'Creating Shared Value', Harvard Business Review, vol. 89, no.
1/2, pp. 62-77.
Porter, M & Siggelkow, N 2008, 'Contextuality within Activity Systems and Sustainability of
Competitive Advantage', Academy of Management Perspectives, vol. 22, no. 2, pp. 34-56.
Porter, ME 1980a, Competitive Strategy: Techniques for Analysing Industries and
Competitors, The Free Press, New York.
Porter, ME 1980b, 'Industry Structure and Competitive Strategy: Keys to Profitability',
Financial Analysts Journal, vol. 36, no. 4, pp. 30-41.
Porter, ME 1985, Competitive Advantage: Creating and Sustaining Superior Performance,
Free Press, New York, NY, USA.
Porter, ME 1987, 'Michael Porter on Competitive Strategy Reflections and Round Table
Discussion', European Management Journal, vol. 6 No 1, pp. 2-9.
Post, JE, Preston, LE & Sachs, S 2002, 'Managing the Extended Enterprise: The New
Stakeholder View', California Management Review, vol. 45, no. 1, pp. 6-28.

374
Preacher, KJ & Hayes, AF 2008, 'Asymptotic and resampling strategies for assessing and
comparing indirect effects in multiple mediator models', Behavior research methods, vol. 40,
no. 3, pp. 879-891.
Preacher, KJ, Rucker, DD & Hayes, AF 2007, 'Addressing Moderated Mediation Hypotheses:
Theory, Methods, and Prescriptions', Multivariate Behavioral Research, vol. 42, no. 1, pp. 185-
227.
Purbowati, R & Mutiarni, R 2017, 'Pengungkapan Corporate Social Responsibility Ditinjau
dari Karakteristik Perusahaan', Jurnal Akuntansi dan Bisnis, vol. 3, no. 2, pp. 167-176.
Putra, KDC 2015, 'CSR: Lebih dari Sekadar Pelaksanaan dan Pelaporan', Swa Online
Magazine, viewed 19 July 2020, <https://swa.co.id/swa/my-article/csr-lebih-dari-sekedar-
pelaksanaan-dan-pelaporan >.
Quairel-Lanoizelée, F 2011, 'Are competition and corporate social responsibility compatible?',
Society and Business Review, vol. 6, no. 1, pp. 77-98.
Quarshie, AM, Salmi, A & Leuschner, R 2016, 'Sustainability and corporate social
responsibility in supply chains: The state of research in supply chain management and business
ethics journals', Journal of Purchasing and Supply Management, vol. 22, no. 2, pp. 82-97.
Qutab, M 2016, 'What’s the Second Most Polluting Industry? (We’ll Give You A Hint – You’re
Wearing It)', One Green Planet, viewed 11 November 2019,
<https://www.onegreenplanet.org/environment/clothing-industry-second-most-polluting/>.
Radyati, MRN 2014, Sustainable Business & Corporate Social Responsibility (CSR), CECT
Trisakti University, Jakarta, Indonesia.
Radyati, MRN 2015, Organisational Governance Based On ISO 26000: A Toolbox, CECT
Trisakti University, Jakarta, Indonesia.
Radyati, MRN 2021, 'Kepemimpinan BUMN untuk CSR yang Holistis', Media Indonesia,
viewed 30 July 2021, <https://mediaindonesia.com/opini/403653/kepemimpan-bumn-untuk-
csr-yang-holistik> .
Rahim, MA & Magner, NR 1995, 'Confirmatory Factor Analysis of the Styles of Handling
Interpersonal Conflict: First-Order Factor Model and Its Invariance Across Groups', Journal of
Applied Psychology, vol. 80, no. 1, pp. 122-132.
Ramachandran, V 2011, 'Strategic corporate social responsibility: a ‘dynamic capabilities’
perspective', Corporate Social Responsibility and Environmental Management, vol. 18, no. 5,
pp. 285-293.
Rangan, K, Chase, L & Karim, S 2012, Why Every Company Needs a CSR Strategy and How
to Build It, Harvard Business School, April 5, 2012, Working Paper.
Raquel, G-S, María Victoria, L-P & Antonio, ML-H 2018, 'Current Trends in Research on
Social Responsibility in State-Owned Enterprises: A Review of the Literature from 2000 to
2017', Sustainability, vol. 10, no. 7, p. 2403.

375
Rasche, A, Morsing, M & Moon, J 2017, Corporate social responsibility: strategy,
communication, governance, Cambridge University Press, Cambridge, United Kingdom.
Razafindrambinina, D & Sabran, A 2014, 'The Impact of Strategic Corporate Social
Responsibility on Operating Performance: An Investigation Using Data Envelopment Analysis
in Indonesia', Journal of Business Studies Quarterly, vol. 6, no. 1, pp. 68-78.
Reimann, M, Schilke, O & Thomas, JS 2010, 'Customer relationship management and firm
performance: the mediating role of business strategy', Journal of the Academy of Marketing
Science, vol. 38, no. 3, pp. 326-346.
Renewable Energy, W 2014, 'How These 5 Industries Are Striving to Become More
Environmentally Friendly', Renewable Energy World, viewed 11 November 2019,
<https://www.renewableenergyworld.com/2014/04/25/how-these-5-industries-are-striving-to-
become-more-environmentally-friendly/#gref>.
Reverte, C, Gómez-Melero, E & Cegarra-Navarro, JG 2016, 'The influence of corporate social
responsibility practices on organizational performance: evidence from Eco-Responsible
Spanish firms', Journal of Cleaner Production, vol. 112, pp. 2870-2884.
Richard, LP, Abdul, MAR & Andrew, GK 1995, 'Rationality in Strategic Decision Processes,
Environmental Dynamism and Firm Performance', Journal of Management, vol. 21, no. 5, pp.
913-929.
Richard, SA & Marilyn, MH 2006, 'Linking strategic practices and organizational performance
to Porter's generic strategies', Business Process Management Journal, vol. 12, no. 4, pp. 433-
454.
Ridho, TK 2017, 'CSR in Indonesia: Company's Perception and Implementation', The
EUrASEANs: journal on global socio-economic dynamics, vol. 4, no. 3, pp. 93-99.
Ridho, TK 2018, 'The Development of CSR Implementation in Indonesia and Its Impact on
Company’s Financial and Non-financial Performance', International Conference on Islamic
Finance, Economics and Business (ICIFEB), pp. 324-334.
Ridjal, S & Muhammadin, A 2018, 'Analysis of Influencing Factors Social Environment and
Generic Strategies toward Performance of The Banking Sector in Indonesia', Journal of
Physics: Conference Series, vol. 1029, no. 012191, pp. 1-8.
Robinson, RB & Pearce, JA 1988, 'Planned Patterns of Strategic Behavior and Their
Relationship to Business- Unit Performance', Strategic Management Journal, vol. 9, no. 1, pp.
43-60.
Rofelawaty, B 2014, 'Analisis Praktik Pelaporan Berkelanjutan (Sustainability Reporting) pada
Perusahaan yang Terdaftar di Bursa Efek Indonesia', Jurnal Aplikasi Manajemen, vol. 12, no.
2, pp. 258-268.
Rosen, CM 2001, 'Environmental strategy and competitive advantage: An introduction',
California Management Review, vol. 43, no. 3, pp. 8-15.

376
Rosser, A & Edwin, D 2010, 'The politics of corporate social responsibility in Indonesia', The
Pacific Review, vol. 23, no. 1, pp. 1-22.
Ruane, JM 2005, Essentials of research methods: a guide to social research, Blackwell
Publishing Ltd., Malden, MA.
Rudy, BC & Johnson, AF 2013, 'Performance, Aspirations, and Market Versus Nonmarket
Investment', Journal of Management, vol. 42, no. 4, pp. 936-959.
Ruel, EE, Wagner, WE & Gillespie, BJ 2016, 'Pretesting and Pilot Testing', in WEa Wagner &
BJa Gillespie (eds), The Practice of Survey Research: Theory and Applications, Sage
Publications, Inc., Thousand Oaks, CA, pp. 101-119.
Saeidi, SP, Sofian, S, Saeidi, P, Saeidi, SP & Saaeidi, SA 2015, 'How does corporate social
responsibility contribute to firm financial performance? The mediating role of competitive
advantage, reputation, and customer satisfaction', Journal of Business Research, vol. 68, no. 2,
pp. 341-350.
Salancik, GR & Pfeffer, J 1977, 'An Examination of Need-Satisfaction Models of Job
Attitudes', Administrative Science Quarterly, vol. 22, no. 3, pp. 427-456.
Salikha, A 2018, 'Meet The Only Southeast Asia Representative Country In G20 (Group of
Twenty)', Good News From Southeast Asia, viewed 2 March 2021,
<https://seasia.co/2018/12/01/meet-the-only-southeast-asia-representative-country-in-g20-
group-of-twenty>.
Salna, KS, Harry 2019, 'Indonesia Chases Manufacturing Hub Dream as Commodities Wither',
Bloomberg, viewed 30 April 2020, <https://www.bloomberg.com/news/articles/2019-05-
06/indonesia-chases-manufacturing-hub-dream-as-commodities-wither>.
Salzmann, O, Ionescu-somers, A & Steger, U 2005, 'The Business Case for Corporate
Sustainability:: Literature Review and Research Options', European Management Journal, vol.
23, no. 1, pp. 27-36.
Sánchez, PE & Benito-Hernández, S 2015, 'CSR Policies: Effects on Labour Productivity in
Spanish Micro and Small Manufacturing Companies', Journal of Business Ethics, vol. 128, no.
4, pp. 705-724.
Santia, T 2021, 'Tanggung Jawab Sosial Perusahaan Tidak Hanya Sekadar Donasi', Liputan 6,
viewed 6 August 2021, <https://www.liputan6.com/bisnis/read/4608228/tanggung-jawab-
sosial-perusahaan-tidak-hanya-sekadar-donasi>.
Santos, JB & Brito, LAL 2012, 'Toward a Subjective Measurement Model for Firm
Performance', Brazilian Administration Review, vol. 9, pp. 95-117.
Sarkar, S & Searcy, C 2016, 'Zeitgeist or chameleon? A quantitative analysis of CSR
definitions', Journal of Cleaner Production, vol. 135, pp. 1423-1435.

377
Sarstedt, M, Hair, JF, Cheah, J-H, Becker, J-M & Ringle, CM 2019, 'How to specify, estimate,
and validate higher-order constructs in PLS-SEM', Australasian Marketing Journal (AMJ), vol.
27, no. 3, pp. 197-211.
Sarstedt, M & Mooi, E 2014, A Concise Guide to Market Research: The Process, Data, and
Methods Using IBM SPSS Statistics, 2nd edn, The Process, Data, and Methods Using IBM
SPSS Statistics, Springer Berlin Heidelberg, Berlin, Heidelberg.
Sarstedt, M, Ringle, CM, Cheah, J-H, Ting, H, Moisescu, OI & Radomir, L 2019, 'Structural
model robustness checks in PLS-SEM', Tourism Economics, vol., pp. 1-24.
Sarstedt, M, Ringle, CM & Hair, JF 2017, 'Partial Least Squares Structural Equation Modeling',
in MK Christian Homburg, Arnd Vomberg (ed.), Handbook of Market Research, C. Homburg
et al., Springer International Publishing AG, pp. 1-41.
Sashi, CM & Stern, LW 1995, 'Product differentiation and market performance in producer
goods industries', Journal of Business Research, vol. 33, no. 2, pp. 115-127.
Saunders, M, Lewis, P & Thornhill, A 2009, Research Methods for Business Students, Prentice
Hall.
Sayekti, Y 2015, 'Strategic Corporate Social Responsibility (CSR), Company Financial
Performance, and Earning Response Coefficient: Empirical Evidence On Indonesian Listed
Companies', Procedia - Social and Behavioral Sciences, vol. 211, pp. 411-420.
Schmidt, WC 1997, 'World-Wide Web survey research: Benefits, potential problems, and
solutions', Behavior Research Methods, Instruments, & Computers, vol. 29, no. 2, pp. 274-279.
Schniederjans, M & Cao, Q 2009, 'Alignment of operations strategy, information strategic
orientation, and performance: an empirical study', International Journal of Production
Research, vol. 47, no. 10, pp. 2535-2563.
Schumacker, RE & Lomax, RG 2004, A beginner's guide to structural equation modeling, 2nd
edn, Lawrence Erlbaum Associates, Mahwah, N.J.
Schwaiger, M & Festge, F 2007, 'The Drivers of Customer Satisfaction with Industrial Goods:
An International Study', in Cross-Cultural Buyer Behavior, Advances in International
Marketing, Emerald Group Publishing Limited, pp. 179-207.
SDG n.d., 'Goals', SDG Website, viewed 30 July 2021, <https://sdgs.un.org/goals>.
Sen, S & Bhattacharya, CB 2001, 'Does Doing Good Always Lead to Doing Better? Consumer
Reactions to Corporate Social Responsibility', Journal of Marketing Research, vol. 38, no. 2,
pp. 225-243.
Sen, S & Cowley, J 2013, 'The Relevance of Stakeholder Theory and Social Capital Theory in
the Context of CSR in SMEs: An Australian Perspective', Journal of Business Ethics, vol. 118,
no. 2, pp. 413-427.

378
Sharma, B 2002, 'Porter's (1980) Generic Strategies, Contextual Factors and Performance: An
Empirical Examination of Their Relationship', Metamorphosis, vol. 1, no. 1, pp. 52-68.
Sheany 2017, 'Indonesia Commits to Sustainable Development Through New Presidential
Regulation', Jakarta Globe, viewed 30 July 2021, <https://jakartaglobe.id/news/indonesia-
commits-sustainable-development-new-presidential-regulation/>.
Sheehy, B & Damayanti, C 2019, Issues and Initiatives: Sustainability and Corporate Social
Responsibility in Indonesia, The Cambridge Handbook of Corporate Law, Corporate
Governance and Sustainability.
Shen, N, Au, K & Li, W 2019, 'Strategic alignment of intangible assets: The role of corporate
social responsibility', Asia Pacific Journal of Management, vol., pp. 1-21.
Shields, MD, Deng, FJ & Kato, Y 2000, 'The design and effects of control systems: tests of
direct- and indirect-effects models', Accounting, Organizations and Society, vol. 25, no. 2, pp.
185-202.
Shital, J 2014, 'Intertwining CSR with strategy – the way ahead', Corporate Governance: The
International Journal of Business in Society, vol. 14, no. 2, pp. 211-219.
Shmueli, G, Ray, S, Velasquez Estrada, JM & Chatla, SB 2016, 'The elephant in the room:
Predictive performance of PLS models', Journal of Business Research, vol. 69, no. 10, pp.
4552-4564.
Short, JC, McKenny, AF, Ketchen, DJ, Snow, CC & Hult, GTM 2016, 'An Empirical
Examination of Firm, Industry, and Temporal Effects on Corporate Social Performance',
Business & Society, vol. 55, no. 8, pp. 1122-1156.
Simons, R 1990, 'The role of management control systems in creating competitive advantage:
New perspectives', Accounting, Organizations and Society, vol. 15, no. 1, pp. 127-143.
Sindhu, MI & Arif, M 2017, 'The Inter Linkage of Corporate Reputation between Corporate
Social Responsibility and Financial Performance', Pakistan Journal of Commerce & Social
Sciences, vol. 11, no. 3, pp. 898-910.
Singhapakdi, A, Lee, D-J, Sirgy, MJ & Senasu, K 2015, 'The impact of incongruity between
an organization's CSR orientation and its employees' CSR orientation on employees' quality of
work life', Journal of Business Research, vol. 68, no. 1, pp. 60-66.
Skinner, W 1969, 'Manufacturing - missing link in corporate strategy', Harvard Business
Review, vol. 47, no. 3, p. 136.
SmartPLS 2014, 'HTMT - A New Criterion to Assess Discriminant Validity', SmartPLS
GmbH, viewed 13 December 2018, <https://www.smartpls.com/documentation/videos/htmt-
a-new-criterion-to-assess-discriminant-validity>.
Sousa Filho, JMd, Wanderley, LSO, Gómez, CP & Farache, F 2010, 'Strategic Corporate Social
Responsibility Management for Competitive Advantage', BAR - Brazilian Administration
Review, vol. 7, no. 3, pp. 294-309.

379
Spanos, YE, Zaralis, G & Lioukas, S 2004, 'Strategy and Industry Effects on Profitability:
Evidence from Greece', Strategic Management Journal, vol. 25, no. 2, pp. 139-165.
Sprinkle, GB & Maines, LA 2010, 'The benefits and costs of corporate social responsibility',
Business Horizons, vol. 53, no. 5, pp. 445-453.
Stasiuk-Piekarska, AKW, Magdalena K. 2019, 'Corporate Social Responsibility in
Manufacturing—Good Practices, Advantages and Limitations', in PG-DM Spychała (ed.),
Corporate Social Responsibility in the Manufacturing and Services Sectors, Environmental
Issues in Logistics and Manufacturing edn, EcoProduction, Springer-Verlag GmbH Germany,
Berlin, pp. 223-234.
Statistik, BP 2020, 'Industri Besar dan Sedang', viewed April 07,
<https://www.bps.go.id/subject/9/industri-besar-dan-sedang.html>.
Stoian, C & Gilman, M 2017, 'Corporate Social Responsibility That “Pays”: A Strategic
Approach to CSR for SMEs', Journal of Small Business Management, vol. 55, no. 1, pp. 5-31.
Streukens, S & Leroi-Werelds, S 2016, 'Bootstrapping and PLS-SEM: A step-by-step guide to
get more out of your bootstrap results', European Management Journal, vol. 34, no. 6, pp. 618-
632.
Sun, L-Y & Pan, W 2011, 'Differentiation strategy, high-performance human resource
practices, and firm performance: moderation by employee commitment', International Journal
of Human Resource Management, vol. 22, no. 15, pp. 3068-3079.
Sun, L & Yu, TR 2015, 'The impact of corporate social responsibility on employee performance
and cost', Review of Accounting & Finance, vol. 14, no. 3, pp. 262-284.
Supriyanto, B 2014, 'Program CSR, Penting Saat Perusahaan Bermasalah dengan Masyarakat',
Bisnis.com, viewed 19 July 2020,
<https://entrepreneur.bisnis.com/read/20141126/240/275845/program-csr-penting-saat-
perusahaan-bermasalah-dengan-masyarakat>.
Sustainablesquare 2017, 'CSR Landscape In Indonesia: The Past, Present and The Future',
Sustainablesquare.com, viewed 6 October 2019, <http://sustainablesquare.com/evolution-csr-
landscape-indonesia>.
Swink, M, Narasimhan, R & Kim, SW 2005, 'Manufacturing Practices and Strategy
Integration: Effects on Cost Efficiency, Flexibility, and Market-Based Performance', Decision
Sciences, vol. 36, no. 3, pp. 427-457.
Tabachnick, BG & Fidell, LS 2006, Using Multivariate Statistics (5th Edition), Allyn \&
Bacon, Inc.
Talita, R & Maria Laura Ferranty, M 2016, 'Strategic human resource management and
corporate social responsibility: Evidence from Emerging Markets', Internext: Revista
Eletrônica de Negócios Internacionais, vol. 11, no. 2, pp. 66-80.

380
Tang, Z, Hull, CE & Rothenberg, S 2012, 'How Corporate Social Responsibility Engagement
Strategy Moderates the CSR–Financial Performance Relationship', Journal of Management
Studies, vol. 49, no. 7, pp. 1274-1303.
Tavakol, M & Dennick, R 2011, 'Making sense of Cronbach's alpha', International journal of
medical education, vol. 2, p. 53.
Teddlie, C & Yu, F 2007, 'Mixed Methods Sampling: A Typology with Examples', Journal of
Mixed Methods Research, vol. 1, no. 1, pp. 77-77.
Theodorou, P & Florou, G 2008, 'Manufacturing strategies and financial performance—The
effect of advanced information technology: CAD/CAM systems', Omega, vol. 36, no. 1, pp.
107-121.
Tonysheva, LL & Chumlyakova, DV 2016, 'Corporate social responsibility: The principles and
the process of integration into the system of strategic management', Asian Social Science vol.
12, no. 9, pp. 115-123.
Tore, M 2012, 'Sustainability as corporate mission and strategy', European Business Review,
vol. 24, no. 6, pp. 496-509.
Torugsa, NA, O'Donohue, W & Hecker, R 2012, 'Capabilities, Proactive CSR and Financial
Performance in SMEs: Empirical Evidence from an Australian Manufacturing Industry Sector',
Journal of Business Ethics, vol. 109, no. 4, pp. 483-500.
Torugsa, NA, O'Donohue, W & Hecker, R 2013, 'Proactive CSR: An Empirical Analysis of
the Role of its Economic, Social and Environmental Dimensions on the Association between
Capabilities and Performance', Journal of Business Ethics, vol. 115, no. 2, pp. 383-402.
Tsiotsou, R 2006, 'The role of perceived product quality and overall satisfaction on purchase
intentions', International Journal of Consumer Studies, vol. 30, no. 2, pp. 207-217.
Turker, D 2009, 'How Corporate Social Responsibility Influences Organizational
Commitment', Journal of Business Ethics, vol. 89, no. 2, pp. 189-204.
Tuzzolino, F & Armandi, BR 1981, 'A Need-Hierarchy Framework for Assessing Corporate
Social Responsibility', Academy of Management. The Academy of Management Review, vol. 6,
no. 1, p. 21.
UNDP n.d., 'What are the Sustainable Development Goals?', UNDP Website, viewed 30 July
2021, <https://www.id.undp.org/content/indonesia/en/home/sustainable-development-
goals.html>.
Valdez-Juárez, LE, Gallardo-Vázquez, D & Ramos-Escobar, EA 2018, 'CSR and the Supply
Chain: Effects on the Results of SMEs', Sustainability, vol. 10, no. 7, p. 2356.
Valipour, H, Birjandi, H & Honarbakhsh, S 2012, 'The Effects of Cost Leadership Strategy and
Product Differentiation Strategy on the Performance of Firms', Journal of Asian Business
Strategy, vol. 2, no. 1, p. 14.

381
van Marrewijk, M 2003, 'Concepts and Definitions of CSR and Corporate Sustainability:
Between Agency and Communion', Journal of Business Ethics, vol. 44, no. 2, pp. 95-105.
Van Selm, M & Jankowski, NW 2006, 'Conducting Online Surveys', Quality and Quantity,
vol. 40, no. 3, pp. 435-456.
Venkatraman, N 1989, 'Strategic Orientation Of Business Enterprises: The Construct,
Dimensionality, And Measurement', Management Science, vol. 35, no. 8, pp. 942-962.
Venkatraman, N & Ramanujam, V 1986, 'Measurement of Business Performance in Strategy
Research: A Comparison of Approaches', Academy of Management Review, vol. 11, no. 4, pp.
801-814.
Venkatraman, N & Vasudevan, R 1987, 'Measurement of Business Economic Performance:
An Examination of Method Convergence', Journal of Management, vol. 13, no. 1, pp. 109-
122.
Vidal, N, Kozak, RA & Hansen, E 2015, 'Adoption and Implementation of Corporate
Responsibility Practices: A Proposed Framework', Business & Society, vol. 54, no. 5, pp. 701-
717.
Vidaver-Cohen, D & BrØNn, PS 2008, 'Corporate Citizenship and Managerial Motivation:
Implications for Business Legitimacy', Business and Society Review, vol. 113, no. 4, pp. 441-
475.
Vilanova, M, Lozano, JM & Arenas, D 2009, 'Exploring the Nature of the Relationship
Between CSR and Competitiveness', Journal of Business Ethics, vol. 87, no. 1, pp. 57-69.
Vinzi, VE, Chin, WW, Henseler, J & Wang, H 2010, Handbook of Partial Least Squares:
Concept, Methods, and Applications, Springer, Berlin, Heidelberg.
Vishwanathan, P, Van Oosterhout, H, Heugens, PPMAR, Duran, P & Essen, M 2020, 'Strategic
CSR: A Concept Building Meta‐Analysis', Journal of Management Studies, vol. 57, no. 2, pp.
314-350.
Vitolla, F, Rubino, M & Garzoni, A 2016, 'Integrated corporate social responsibility: Driving
factors and means of integration – a multiple case study analysis', Journal of Management
Development, vol. 35, no. 10, pp. 1323-1343.
Vitolla, F, Rubino, M & Garzoni, A 2017, 'The integration of CSR into strategic management:
a dynamic approach based on social management philosophy', Corporate Governance: The
International Journal of Business in Society, vol. 17, no. 1, pp. 89-116.
Vo, L-C, Delchet-Cochet, K & Akeb, H 2015, 'Motives Behind The Integration Of CSR Into
Business Strategy: A Comparative Study In French SMEs', Journal of Applied Business
Research, vol. 31, no. 5, p. 1975.
Waagstein, PR 2011, 'The Mandatory Corporate Social Responsibility in Indonesia: Problems
and Implications', Journal of Business Ethics, vol. 98, no. 3, pp. 455-466.

382
Waddock, SA & Graves, SB 1997, 'The Corporate Social Performance-Financial Performance
Link', Strategic Management Journal, vol. 18, no. 4, pp. 303-319.
Wagner, T, Lutz, RJ & Weitz, BA 2009, 'Corporate Hypocrisy: Overcoming the Threat of
Inconsistent Corporate Social Responsibility Perceptions', Journal of Marketing, vol. 73, no.
6, pp. 77-91.
Wai-Kwong, FY, Priem, RL & Cycyota, CS 2001, 'The performance effects of human resource
managers' and other middle managers' involvement in strategy making under different
business-level strategies: the case in Hong Kong', International Journal of Human Resource
Management, vol. 12, no. 8, pp. 1325-1346.
Wall, TD, Michie, J, Patterson, M, Wood, SJ, Sheehan, M, Clegg, CW & West, M 2004, 'On
the validity of subjective measures of company performance', Personnel Psychology, vol. 57,
no. 1, pp. 95-118.
Wang, Q, Dou, J & Jia, S 2016, 'A Meta-Analytic Review of Corporate Social Responsibility
and Corporate Financial Performance: The Moderating Effect of Contextual Factors', Business
& Society, vol. 55, no. 8, pp. 1083-1121.
Wang, Y & Berens, G 2015, 'The Impact of Four Types of Corporate Social Performance on
Reputation and Financial Performance', Journal of Business Ethics, vol. 131, no. 2, pp. 337-
359.
Ward, PT, Duray, R, Keong Leong, G & Sum, C-C 1995, 'Business environment, operations
strategy, and performance: An empirical study of Singapore manufacturers', Journal of
Operations Management, vol. 13, no. 2, pp. 99-115.
Waring, P & Lewer, J 2004, 'The Impact of Socially Responsible Investment on Human
Resource Management: A Conceptual Framework', Journal of Business Ethics, vol. 52, no. 1,
pp. 99-108.
Wartick, SL & Cochran, PL 1985, 'The Evolution of the Corporate Social Performance Model',
The Academy of Management Review, vol. 10, no. 4, pp. 758-769.
Wei, W, Zhao, X, Li, M & Warner, M 2016, 'Integrating nonmarket and market resources,
strategy and performance in Chinese enterprises: a review of the field and a resource-based
empirical study', Asia Pacific Business Review, vol. 22, no. 2, pp. 220-237.
Weir, KA, Kochhar, AK, LeBeau, SA & Edgeley, DG 2000, 'An Empirical Study of the
Alignment Between Manufacturing and Marketing Strategies', Long Range Planning, vol. 33,
no. 6, pp. 831-848.
Welford, R, Chan, C & Man, M 2008, 'Priorities for corporate social responsibility: a survey
of businesses and their stakeholders', Corporate Social Responsibility & Environmental
Management, vol. 15, no. 1, pp. 52-62.
Werre, M 2003, 'Implementing Corporate Responsibility: The Chiquita Case', Journal of
Business Ethics, vol. 44, no. 2/3, pp. 247-260.

383
White, RE 1986, 'Generic Business Strategies, Organizational Context and Performance: An
Empirical Investigation', Strategic Management Journal, vol. 7, no. 3, pp. 217-231.
Wibisono, D 2011, 'A Framework of Performance Measurement System for Manufacturing
Company', The South East Asian Journal of Management, vol. 5, no. 2, pp. 107-117.
Widjaja, AE 2011, 'Corporate Social Responsibility (CSR) and Its Current Practices in
Indonesia', paper presented at the Proceeding of 21st Annual Meeting of International
Conference on The Pacific Rim Management, Tainan, Taiwan,
Windolph, SE, Harms, D & Schaltegger, S 2014, 'Motivations for Corporate Sustainability
Management: Contrasting Survey Results and Implementation', Corporate Social
Responsibility & Environmental Management, vol. 21, no. 5, pp. 272-285.
Witek-Hajduk, MK & Zaborek, P 2016, 'Does Business Model Affect CSR Involvement? A
Survey of Polish Manufacturing and Service Companies', Sustainability, vol. 8, no. 93, pp. 1-
20.
Wong, KK-K 2016, 'Technical Note: Mediation analysis, categorical moderation analysis, and
higher-order constructs modeling in Partial Least Squares Structural Equation Modeling (PLS-
SEM): A B2B example using SmartPLS', The Marketing Bulletin, vol. 26, pp. 1-22.
Wood, DJ 1991, 'Corporate Social Performance Revisited', Academy of Management Review,
vol. 16, no. 4, pp. 691-718.
Wood, DJ 2010, 'Measuring Corporate Social Performance: A Review', International Journal
of Management Reviews, vol. 12, no. 1, pp. 50-84.
Worldbank 2020, 'Indonesia Overview', viewed 7 April 2020,
<https://www.worldbank.org/en/country/indonesia/overview>.
Wright, S, Proimos, A & Lau, B 2008, 'Accounting measures of operating performance
outcomes for Australian mergers', Journal of Applied Accounting Research, vol. 9, no. 3, pp.
168-180.
Xie, P, Li, X & Xie, X 2014, 'The integration of corporate non-market and market strategies:
why, what, and how', Nankai Business Review International, vol. 5, no. 1, pp. 115-132.
Xie, X, Jia, Y, Meng, X & Li, C 2017, 'Corporate social responsibility, customer satisfaction,
and financial performance: The moderating effect of the institutional environment in two
transition economies', Journal of Cleaner Production, vol. 150, pp. 26-39.
Yoo, JW 2015, 'A Study for Integrated Strategic Use of Nonmarket CSR Strategies',
International Information Institute (Tokyo). Information, vol. 18, no. 5(A), pp. 1585-1590.
Young, SL & Makhija, MV 2014, 'Firms' corporate social responsibility behavior: an
integration of institutional and profit maximization approaches', Journal of international
business studies, vol. 45, no. 6, pp. 670-698.

384
Yuan, W, Bao, Y & Verbeke, A 2011, 'Integrating CSR Initiatives in Business: An Organizing
Framework', Journal of Business Ethics, vol. 101, no. 1, pp. 75-92.
Yuan, Y, Lu, LY, Tian, G & Yu, Y 2020, 'Business Strategy and Corporate Social
Responsibility', Journal of Business Ethics, vol. 162, no. 2, pp. 359-377.
Yuen, KF, Thai, VV, Wong, YD & Wang, X 2018, 'Interaction impacts of corporate social
responsibility and service quality on shipping firms’ performance', Transportation Research
Part A: Policy and Practice, vol. 113, pp. 397-409.
Z. Jannoo, BWY, N. Auchoybur, M. A. Lazim 2014, 'The Effect of Nonnormality on CB-SEM
and PLS-SEM Path Estimates', International Journal of Mathematical and Computational
Sciences, vol. 8, no. 2, pp. 285-291.
Zahra, SA & Covin, JG 1993, 'Business Strategy, Technology Policy and Firm Performance',
Strategic Management Journal, vol. 14, no. 6, pp. 451-478.
Zatwarnicka-Madura, B, Siemieniako, D, Glińska, E & Sazonenka, Y 2019, 'Strategic and
Operational Levels of CSR Marketing Communication for Sustainable Orientation of a
Company: A Case Study from Bangladesh', Sustainability, vol. 11, no. 2.
Zbuchea, A & Pînzaru, F 2017, 'Tailoring CSR Strategy to Company Size?', Management
Dynamics in the Knowledge Economy, vol. 5, no. 3, pp. 415-437.
Zhu, Q, Liu, J & Lai, K-h 2016, 'Corporate social responsibility practices and performance
improvement among Chinese national state-owned enterprises', International Journal of
Production Economics, vol. 171, pp. 417-426.
Zikmund, W, D'Alessandro, S, Winzar, H & Babin, B 2017, Marketing Research, Cengage
Learning Australia.

385
APPENDICES
Appendix A.1: Concept Definition and Concept Measurement Used in This Thesis
Concept Conceptual Definition Conceptual Operational / Measurement
Business strategy How a company competes and positions
itself successfully in the market (Bowman
& Helfat 2001).
Cost leadership, differentiation, focus (Porter
1985).
Cost leadership Cost leadership companies need to control
costs tightly, refrain from incurring too
many expenses from innovation or
marketing, and cut prices when selling their
products (Porter 1985).
Lowering production costs, improving
productivity, maximizing capacity utilization,
investment in production facilities, large-scale
facilities, process improvements, cost
minimization, achieve/maintain lowest inventory
(Chi 2015; Torugsa, O'Donohue & Hecker
2012).
Differentiation This strategy requires the development of
goods or unique services from unmatched
by relying on customer loyalty to the brand
(Porter 1985); Differentiation strategy
offers customers unique products or
services that are differentiated in such a
way that customers are willing to pay a
price premium that exceeds the additional
cost of the differentiation (Chi 2015).
Developing technology for new products for
increased economic and social inclusiveness
(Bhattacharyya 2010; Moon et al. 2011);
releasing new or improved products launched to
the market, introducing changes in company
products (Martinez-Conesa, Soto-Acosta &
Palacios-Manzano 2017).
Corporate Social
Responsibility
Companies’ ability to be socially
responsible to the development and growth
of the society where they run the business
(Adeneye & Ahmed 2015); A continuous
business agreement to have an ethical
behaviour and to benefit sustainable
economic development and at the same
time to enhance the life quality of
employee, their families, the local
community as well as wide society (World
Business Council for Sustainable
Development, cited in Moir 2001).
Economic, legal, ethical, and philanthropic
responsibilities (Carroll 1991); measurement of
four CSR classifications (Maignan & Ferrell
2000; Marín, Rubio & de Maya 2012).
Integration The synergy between competitive strategies
that seek superior performance in the
marketplace and NMS that shape the
competitive environment (Baron 1997).
The greater the level of integration across these
two strategic levels (CSR strategy and company
strategy), the closer the strategic clusters of these
two levels prove proximate and consequently
generating higher levels of synergies (Marques-
Mendes & Santos 2016).
Strategic
integration
How companies engage CSR in
management systems (Werre 2003);
Indication of the existing level of
interconnectedness between the CSR
strategy and the company strategy
(Marques-Mendes & Santos 2016).
CSR is integrated by triggering, maintaining, and
sharing a set of core dominant values (Marques-
Mendes & Santos 2016); The inclusion of social
responsibility objectives in the business strategy
(Ganescu 2012b).
Aligning CSR
with company
strategy
Companies incorporate CSR into
company’s vision and mission in this stage
(Guadamillas-Gómez, Donate-Manzanares
& Škerlavaj 2010).
Establishing CSR as one of the main long-term
goals of the company, evaluation of strategic
business decision in terms of CSR criteria,
creating a code of conduct describing desired

386
Appendix A.1 (continued)
behaviour (Guadamillas-Gómez, Donate-
Manzanares & Škerlavaj 2010; Werre 2003);
enriching customer lives, ensuring employees
consider social issues when performing business
duties, taking responsibility for the
organisation’s impact on the world, highlight
CSR in their strategy statements and employee
value policies (Lindgreen et al. 2011).
Gaining support of
top management
Senior managers determine strategy and
without their support become critical
barriers to CSR implementation (Werre
2003).
Team meeting with top-management with CSR
as a fundamental topic, organizing CSR efforts,
creating CSR steering committee with regular
meeting (Guadamillas-Gómez, Donate-
Manzanares & Škerlavaj 2010; Martinez-
Conesa, Soto-Acosta & Palacios-Manzano 2017;
Werre 2003).
Effective
communication
Companies should develop an effective
communication to generate a clear
perception that CSR is an aspect of strategic
importance for the company (Guadamillas-
Gómez, Donate-Manzanares & Škerlavaj
2010).
CSR reports, detailed information on the
company’s web, and continuous communication
within the organisation in order to further
increase the awareness of CSR (Guadamillas-
Gómez, Donate-Manzanares & Škerlavaj 2010;
Martinez-Conesa, Soto-Acosta & Palacios-
Manzano 2017; Werre 2003).
Functional
integration
Converting these concepts into actual
practices and processes (Lindgreen et al.
2011).
The development of CSR activities depends on
how they are internally managed and integrated
into business practices (Marques-Mendes &
Santos 2016).
Quality
Companies focus on the conformance
dimension of quality with aims to get
advantage by stabilizing the quality of the
product at a predetermined level according
to competition (Theodorou & Florou 2008).
Providing high performance design, offer
consistent and reliable quality, and conformance
to product design specification (Chi 2015);
providing product with more quality than those
of the rival companies (Marín, Rubio & de Maya
2012); fitting customer needs for products and
provide a product of excellent quality
(Boubakary & Moskolaï 2016); Implementing a
quality management such as ISO or total quality
management (TQM) (Martinuzzi & Krumay
2013; Ward et al. 1995).
Productivity in the
value chain
Enhancing the social, environmental, and
economic capabilities of supply chain
members (Vitolla, Rubino & Garzoni
2017).
Value chain dimension consists of suppliers,
customers and specific tools (Witek-Hajduk &
Zaborek 2016).
Stakeholders Groups and individuals who can affect, or
are affected by, the achievement of
companies mission (Freeman 2010).
Internal stakeholders are the owners, managers,
employees of a company, who reside inside the
boundary of the company, while the external
stakeholders of a company are the suppliers,
customers, communities and government
(Freeman 2010).

387
Appendix A.1 (continued)
Suppliers Companies implement some practices to
develop strong and lasting relationship with
suppliers.
Treating suppliers, regardless of their size and
location, fairly and respectfully, incorporating
the interests of suppliers in company business
decisions, informing suppliers about
organisational changes affecting our purchasing
decisions (Lindgreen, Swaen & Maon 2009).
Customers Companies practice some activities to
enhance the relationship with customers.
Informing customers about appropriate use and
risks of products, taking the necessary steps to
avoid customer complaints, giving response to
customer complaints (Martinez-Conesa, Soto-
Acosta & Palacios-Manzano 2017); providing
all customers with the information needed to
make sound purchasing decisions, satisfying the
complaints of customers about products or
services, and incorporating the interests of our
customers in business decisions (Lindgreen et al.
2009).
Employee Corporate socially responsible activities
aimed at employees (Witek-Hajduk &
Zaborek 2016) that reflects how
organisations treat employee in their
activities (Ganescu 2012b).
Health and safety, working conditions, and equal
treatment in the workplace (Chen, Feldmann &
Tang 2015; Lindgreen et al. 2011; Torugsa,
O'Donohue & Hecker 2012; Witek-Hajduk &
Zaborek 2016); employee development
(Ganescu 2012; Lindgreen et al. 2011).
Community Commitment to improve community well-
being through discretionary business
practices and contributions of corporate
resources (Kotler & Lee 2005); Companies’
practices that relate to communication,
cooperation, and support for local and
wider social partners (Rangan, Chase &
Karim 2012; Witek-Hajduk & Zaborek
2016).
Funding for social or environmental programs as
an extension of its business interests through
strategic corporate philanthropy initiatives,
charitable donation, sponsorship of local
community initiatives, developing local talent
(Griffin & Prakash 2013; Liket & Maas 2015;
Martinuzzi & Krumay 2013; Rangan, Chase &
Karim 2012).
Performance
measurement
system
A set of related measures-described by rules
and procedures for capture, compilation,
presentation and communication of data
that in combination reflect key
performances and characteristic of a
selected process effectively enough to
allow intelligent analysis leading to action
if needed (Ljungberg 1994, cited in
Wibisono 2011).
Five levels are proposed for managing the
performance of manufacturing company:
financial perspective, customer perspective,
manufacturing competitive priorities, internal
process, and resource availability (Wibisono
2011).
Corporate
financial
performance
Measuring the results of a firm's policies
and operations in monetary terms (Business
Dictionary 2017).
These results are reflected in the firm's return on
investment, return on assets, value added, etc.
(Business Dictionary 2017).

388
Appendix A.1 (continued)
Accounting-based
measures
Capturing a firm's internal efficiency in
some ways; accounting returns are subject
to managers' discretionary allocations of
fund to different projects and policy
choices, and reflect internal decision-
making capabilities and managerial
performance (Chi 2015; Cochran & Wood
1984)
Return on assets (ROA), return on equity (ROE),
earnings per share (EPS); market share, profit
margin, sales growth (Chi 2015).
Return on
Investment (ROI)
How profitable a company’s capital
investment is in generating revenue (Chi
2015)
Net Profit x 100
Total Capital Employed (Wibisono 2011)
Profit One operational measure of the efficiency
of a firm with regard to the profitable use
of its total asset base (Dess & Robinson
1984).
After tax return on total asset (Dess & Robinson
1984).
Sales growth Sales growth are a very good reflection of
the value that firms create and share with
society, as this implies an increase in
economic growth (Stoian & Gilman 2017).
An increase in the value of goods and services
delivered to consumers (Stoian & Gilman 2017).
Delivery On time delivery Number of product delivery on time x 100%
Total product
(Wibisono 2011)
Corporate social
performance
A business organisation’s configuration of
principles of social responsibility,
processes of social responsiveness, and
policies, programs, and observable
outcomes as they relate to the firm’s
societal relationships (Wood 1991).
Social dimension The social dimension refers to the impacts
generated by the company on the social
systems within which they works (GRI
2013)
The Social Category includes the sub-
Categories: Labour Practices and Decent Work,
Human Rights, Society, and Product
Responsibility (GRI 2013)
Social impact on
customers
Influence of socially responsible actions
which refers to customer as the external
field (Commission of the European
Communities 2001, cited in Ferraz,
António & Gallardo-Vázquez 2016)
Reduced customer complaints, improvement on
customer service, and increased customer
loyalty (Bernal-Conesa, de Nieves-Nieto &
Briones-Peñalver 2017).
Social impact on
employees
Influence of socially responsible actions
which refers to employee as the internal
field (Commission of the European
Communities 2001, cited in Ferraz,
António & Gallardo-Vázquez 2016).
Reduced absenteeism, increase of employee
satisfaction, employee participation in decision-
making processes, employee motivation, reduces
the number of accidents, employees' loyalty and
morale (Chi 2015; Ganescu 2012b; Ghasemi,
Nazemi & Hajirahimian 2014; Martinez-Conesa,
Soto-Acosta & Palacios-Manzano 2017).

389
Appendix A.1 (continued)
Strategic
integration
The extent to which a manufacturing
company makes use of interactions with
other intra-organisational units to make its
program objectives and practices consistent
with its internal and external requirements
(Swink, Narasimhan & Kim 2005).

390
Appendix A.2: Questionnaire - English Version
The Integration of Corporate Social Responsibility (CSR) with Business Strategies
and Its Impact on Company Performance: An Investigation of the Indonesian
Manufacturing Industry
QUESTIONNAIRE
We invite you to participate in this research with purposes to investigate the integration of corporate
social responsibility (CSR) and business strategies into manufacturing operations and to identify how
such integration impacts company performance. We ask your assistance to give a perception or an
opinion how the company run its business operation and implement CSR.
This research is conducted by Esti Dwi Rinawiyanti (principal researcher) as a part of Doctor of
Philosophy and supervised by Dr Charlie Huang and Professor Sharif As-Shaber from RMIT
University, Australia. The principal researcher is a permanent lecturer at University of Surabaya who
gets a scholarship from Indonesian government (LPDP)
This research has obtained an approval from BCHEAN RMIT Ethics Committee. If you would like to
get more information about this research, please contact the researcher as the following:
Esti Dwi Rinawiyanti
Dr Charlie Huang
We expect your honest opinions, perceptions, and information for this research. It is an ANONYMOUS
survey and all information will be treated in STRICTEST CONFIDENCE, and no person or business
will be identified.
Participation in any research project is voluntary. If you decide to take part, you will continue to
complete the questionnaire and return it to the researcher. By completing the survey and return it to the
researcher, you consent to the research team collecting and using information from you for the research
project by maintaining the anonymity.
Please answer ALL questions by CROSSING (X) the appropriate box, which BEST describes the
condition and the situation in your company accurately.
PART ONE: BUSINESS STRATEGY
Please indicate the importance of each strategy in your company.
(From 1 = least important to 5 = most important)
No. Statement 1 2 3 4 5
1. Pursuing operating efficiency
2. Controlling the product quality
3. Developing/refining existing products
4. Innovation in manufacturing processes
5. Emphasis on the efficiency of securing raw materials or components (e.g.,
bargaining down the purchase price)
6. Developing brand identification
7. Having cooperative and supportive channels of distribution
8. Creating new product development
9. Providing customer service capabilities
10. Innovation in marketing techniques and methods (e.g., public relations, sales
promotion, direct marketing)

391
Appendix A.2 (continued)
PART TWO: CSR STRATEGY
Please indicate how much you agree or disagree with each of the following CSR strategy.
(From 1 = strongly disagree to 5 = strongly agree)
No. Statement 1 2 3 4 5
1. We strive to lower our operating costs.
2. We closely monitor employees’ productivity.
3. Top management establishes long-term strategies.
4. We have a procedure in place to respond to every customer complaint.
5. We continually improve the quality of our products.
6. Internal policies prevent discrimination in employee’s compensation and
promotion.
7. We seek to comply with all laws regulating hiring and employee benefits.
8. All our products meet legal standards.
9. Our contractual obligations are always honoured.
10. Managers are informed about relevant environmental laws.
11. We have a comprehensive code of conduct.
12. We are recognised as a trustworthy company.
13. Fairness toward co-workers and business partners is an integral part of the
employee evaluation process.
14. We have a proper procedure for employees to report any misconduct at work.
15. Members of our company follow professional standards.
16. We give adequate contributions to charities.
17. We encourage partnerships with local businesses and schools.
18. We give a donation for sport and/or cultural activities.
19. A program is in place to reduce the amount of energy and materials wasted in our
business.
20. We encourage employees to join civic organisations that support our community.
PART THREE: THE STRATEGIC INTEGRATION
Please indicate how much you agree or disagree with each of the following statements.
(From 1 = strongly disagree to 5 = strongly agree)
No. Statement 1 2 3 4 5
1. We establish CSR as one of the main long-term goals of our company.
2. Objectives have been established relating to social and environmental aspects.
3. Mechanisms are available for evaluating the results of the objectives.
4. CSR strategy is well aligned with corporate vision and mission.
5. Continuous improvement and/or preventive actions are made in the area of CSR.
6. Top management formulates and shares a clear vision and core corporate values
with regards to CSR.
7. Top management remains responsive to the issues related to CSR.
8. Top management provides mentoring and coaching to managers to develop
decision-making skills that integrate CSR criteria in evaluating options.
9. We systematically organize CSR efforts.
10. We conduct team meeting regularly with top-management with CSR as a
fundamental topic.
11. CSR strategies and goals are clearly communicated to all employees.
12. We use IT by intensifying the company's presence on the Internet and social
networks to communicate CSR.
13. We communicate CSR activities within the company through multiple channels,
such as face-to-face meetings, formal communications from senior managers, and
a company newsletter.
14. We create CSR report with detailed CSR activities information.
15. We provide CSR information on the company’s web.

392
Appendix A.2 (continued)
PART FOUR: THE FUNCTIONAL INTEGRATION
Please indicate how much you agree or disagree with each of the following statements.
(From 1 = strongly disagree to 5 = strongly agree)
No. Statement 1 2 3 4 5
1. We achieve/maintain the lowest production cost.
2. We reduce material costs.
3. We reduce overhead costs.
4. We increase labour productivity.
5. We increase capacity utilization.
6. We actively conduct product innovation to improve the product and service.
7. We develop environmentally friendly products.
8. We use eco-friendly technologies and materials in our processes, products, and
packaging.
9. We produce high-quality products which use raw materials up to standard and do
not use hazardous materials.
10. We have introduced innovations and improvements in production processes,
logistics or distribution.
11. We reduce defective rates.
12. We improve product performance and reliability.
13. We implement quality control circles.
14. Our products and/or services satisfy national and/or international quality
standards.
15. We enforce strict product quality control procedures.
16. We treat suppliers, regardless of their size and location, fairly and respectfully.
17. We seek to provide training to our suppliers and partners in business activities.
18. We incorporate the interests of our suppliers in our business decisions.
19. We inform our suppliers about company changes affecting our purchasing
decisions.
20. We strive to enhance stable relationships of collaboration with our suppliers.
21. We provide our customers with accurate and complete information about our
products and/or services.
22. We provide a prompt response to the complaints of our customers about products
and/or services.
23. We incorporate the interests of our customers in our business decisions.
24. We provide responsive and fair after-sales service.
25. Our company is honest with the customers in the sale or promotion of products
and services.
26. We provide procedures to help to insure the health and safety of our employees.
27. We treat our employees fairly and respectfully, regardless of gender or ethnic
background.
28. We incorporate the interests of our employees in our business decisions.
29. We provide our employees with salaries that properly and fairly reward them for
their work.
30. We update the social and environmental knowledge through the training of our
employees.
PART FIVE: THE COMPANY PERFORMANCE
Please indicate your company performance relatively COMPARES TO COMPETITORS OVER
THE LAST THREE-YEAR PERIOD
No. From 1 = much longer to 5 = much shorter 1 2 3 4 5
1. Compared to our competitors, our timeline of customer service is
2. Compared to our competitors, our delivery time is
From 1 = much worse to 5 = much better 1 2 3 4 5
3. Compared to our competitors, our cash flow report is
4. Compared to our competitors, our training of employee is

393
Appendix A.2 (continued)
5. Compared to our competitors, career opportunities in our company are
From 1 = much lower to 5 = much higher 1 2 3 4 5
6. Compared to our competitors, our productivity is
7. Compared to our competitors, our operational efficiency is
8. Compared to our competitors, our profit is
9. Compared to our competitors, our return on investment (ROI) is
10. Compared to our competitors, our sales growth is
11. Compared to our competitors, our customer complaints are
12. Compared to our competitors, our customer satisfaction is
13. Compared to our competitors, our customer loyalty is
14. Compared to our competitors, our increasing number of consumers is
15. Compared to our competitors, our employee motivation is
16. Compared to our competitors, our employee turnover is
From 1 = very unsatisfied to 5 = very satisfied 1 2 3 4 5
17. Overall, with the operational excellence, we are
18. Overall, with the financial performance, we are
19. Overall, with the social performance, we are
PART SIX: COMPANY AND DEMOGRAPHIC INFORMATION
Please choose ONE ANSWER by CROSSING (X) the appropriate option for the following questions.
The main product of the company:
[ ] Food and drinks [ ] Tobacco processing
[ ] Textiles and apparel [ ] Leather, leather goods, and footwear
[ ] Paper and articles of paper [ ] Chemicals and articles of chemicals
[ ] Furniture [ ] Rubber, articles of rubber, and plastics
[ ] Automotive [ ] Metal goods, not machinery and equipment
[ ] Consumer goods [ ] Computers, electronics, and optical goods
[ ] Machinery and electrical equipment [ ] Handicraft
[ ] Pharmaceuticals, chemical, and traditional medicine products
[ ] Others: _________________________________
Number of employees in your company: [ ] < 20 [ ] 20-99 [ ] 100-499
[ ] 500-999 [ ] > 1.000
Please indicate the turnover for the previous financial year (2017) (in Rupiahs):
[ ] < 2.5 billion [ ] 2.5 - 50 billion [ ] > 50 billion [ ] Prefer not to answer
The age of company: [ ] < 5 [ ] 6-10 [ ] 11-20 [ ] 21-50 [ ] > 50
The company’s ownership: [ ] State-ownership [ ] Private [ ] Multi-national company
Town/city of the company: [ ] Surabaya [ ] Sidoarjo [ ] Gresik [ ] Pasuruan
[ ] Mojokerto [ ] Jakarta [ ] Bekasi [ ] Tangerang
[ ] Others: ____________
Is the company located in an industrial estate? [ ] Yes [ ] No

394
Appendix A.2 (continued)
Your position in the company: [ ] Owner [ ] CEO [ ] Director
[ ] Senior Manager [ ] Middle Manager [ ] Assistant Manager
[ ] Team Leader [ ] Others: ______________
How many years have you been working in this company (years):
[ ] < 5 [ ] 6-10 [ ] 11-20 [ ] > 20
Your age (years):
[ ] < 25 [ ] 25-30 [ ] 31-40 [ ] 41-50 [ ] 51-60 [ ] > 60
Your highest education level: [ ] Secondary education [ ] Bachelor [ ] Diploma
[ ] Post-graduate (e.g., Master, Doctor)
PLEASE RETURN THE COMPLETED QUESTIONNAIRE IN THE PRE-PAID ENVELOPE
PROVIDED.
THANK YOU VERY MUCH FOR YOUR TIME AND CO-OPERATION

395
Appendix A.3: Questionnaire – Indonesia Version
Integrasi Tanggung Jawab Sosial Perusahaan (CSR) dengan Strategi Bisnis serta
Dampaknya pada Kinerja Perusahaan: Investigasi pada Industri Manufaktur di
Indonesia
KUESIONER
Kami mengundang Anda untuk berpartisipasi dalam penelitian ini yang bertujuan untuk
mengidentifikasi bagaimana tanggung jawab sosial perusahaan (CSR) diintegrasikan dengan strategi
bisnis dalam operasi manufaktur serta untuk menganalisisis bagaimana integrasi tersebut berdampak
pada kinerja perusahaan. Kami memohon kesediaan Anda untuk memberikan persepsi atau pendapat
bagaimana perusahaan menjalankan operasi bisnis dan mengimplementasikan CSR.
Penelitian ini dilakukan oleh Esti Dwi Rinawiyanti (peneliti utama) sebagai bagian dari program doktor
(Doctor of Philosophy) yang dibimbing oleh Dr Charlie Huang dan Profesor Sharif As-Shaber dari
RMIT University, Australia. Peneliti utama adalah seorang dosen tetap di Universitas Surabaya dan
mendapatkan dana pendidikan dan penelitian dari Lembaga Pengelola Dana Pendidikan (LPDP).
Penelitian ini mendapatkan persetujuan dari Komite Etika Penelitian RMIT University. Jika Anda
menginginkan informasi lebih lanjut mengenai penelitian ini, Anda dapat menghubungi peneliti melalui
kontak berikut:
Esti Dwi Rinawiyanti
Dr Charlie Huang
Mohon pertanyaan-pertanyaan dalam kuesioner ini dapat dijawab dengan sejujur mungkin. Silakan
memberi TANDA SILANG (X) pada kotak yang sesuai untuk menandakan pilihan mana yang paling
sesuai dengan kondisi dan situasi di perusahaan Anda. Kuesioner ini konfidensial dan bersifat rahasia.
Kami akan bertanggung jawab atas segala informasi yang telah diberikan. Survei ini ANONIM dan
tidak ada data yang dapat diidentinfikasi, baik nama Anda ataupun merek produk dan nama perusahaan
Anda.
Partisipasi dalam penelitian ini bersifat sukarela. Jika Anda memutuskan untuk berpartisipasi, mohon
kesediaan Anda untuk mengisi dan mengembalikan kuesioner yang telah dilengkapi, yang berarti Anda
menyetujui tim peneliti menggunakan informasi dari Anda untuk penelitian dan publikasi dengan
pengertian bahwa anonimitas akan dipertahankan.
BAGIAN PERTAMA: STRATEGI BISNIS
Berikan tanda silang di bawah nilai yang sesuai dengan sudut pandang perusahaan Anda mengenai
betapa pentingnya strategi bisnis di bawah ini.
(Dari 1 = paling tidak penting sampai dengan 5 = paling penting) No. Pernyataan 1 2 3 4 5
1. Menciptakan efisiensi operasi
2. Mengendalikan kualitas produk
3. Mengembangkan/menyempurnakan produk yang ada
4. Berinovasi dalam proses manufaktur
5. Menekankan pentingnya efisiensi dalam memperoleh bahan mentah atau komponen
produksi (misal: tawar-menawar dalam menentukan harga pembelian)
6. Mengembangkan identitas merek
7. Adanya saluran distribusi yang kooperatif dan suportif
8. Menciptakan produk baru
9. Menyediakan pelayanan prima bagi pelanggan
10. Berinovasi dalam teknik dan metode pemasaran (misal: promosi penjualan, direct
marketing, public relation)

396
Appendix A.3 (continued)
BAGIAN KEDUA: IMPLEMENTASI CSR
Berikan tanda silang di bawah nilai yang menunjukkan seberapa Anda setuju atau tidak setuju dengan
strategi CSR di bawah ini. (Dari 1 = sangat tidak setuju sampai dengan 5 = sangat setuju) No. Pernyataan 1 2 3 4 5
1. Kami berusaha untuk menurunkan biaya operasi.
2. Kami memantau produktivitas karyawan dengan ketat.
3. Manajemen tingkat atas menetapkan strategi jangka panjang.
4. Terdapat prosedur untuk menanggapi setiap keluhan pelanggan.
5. Kami terus meningkatkan kualitas produk.
6. Terdapat kebijakan internal perusahaan yang mencegah terjadinya diskriminasi
dalam pemberian upah/gaji dan promosi karyawan.
7. Kami berusaha untuk mematuhi semua hukum yang mengatur rekrutmen dan
kesejahteraan karyawan.
8. Semua produk kami memenuhi standar hukum.
9. Kami selalu mematuhi kewajiban kontrak kami.
10. Para manajer telah memahami undang-undang lingkungan yang terkait dengan
operasi perusahaan.
11. Kami memiliki kode etik yang komprehensif.
12. Kami diakui sebagai perusahaan yang terpercaya.
13. Keadilan bagi rekan kerja dan mitra bisnis kami merupakan bagian penting dari
proses evaluasi karyawan.
14. Terdapat prosedur yang layak bagi karyawan untuk melaporkan pelanggaran kode
etik yang terjadi di tempat kerja.
15. Tiap karyawan terutama yang memegang posisi/jabatan telah mengikuti standar
profesional.
16. Kami memberikan sumbangan yang memadai untuk badan amal.
17. Kami mendorong adanya kemitraan dengan perusahaan lokal dan sekolah.
18. Kami memberikan sumbangan untuk kegiatan olahraga dan/atau budaya.
19. Terdapat program untuk mengurangi jumlah energi dan bahan baku yang terbuang
dalam bisnis kami.
20. Kami mendorong karyawan untuk bergabung dengan organisasi masyarakat yang
mendukung komunitas sekitar.
BAGIAN KETIGA: INTEGRASI STRATEGIS
Berikan tanda silang di bawah nilai yang menunjukkan seberapa Anda setuju atau tidak setuju dengan
pernyataan di bawah ini. (Dari 1 = sangat tidak setuju sampai dengan 5 = sangat setuju) No. Pernyataan 1 2 3 4 5
1. CSR ditetapkan sebagai salah satu tujuan jangka panjang utama perusahaan kami.
2. Sasaran perusahaan kami berkaitan dengan aspek sosial dan lingkungan.
3. Terdapat mekanisme untuk mengevaluasi hasil dari sasaran perusahaan.
4. Strategi CSR sejalan dengan visi dan misi perusahaan.
5. Terdapat perbaikan berkelanjutan dan/atau tindakan pencegahan di bidang CSR.
6. Manajemen tingkat atas menyusun dan berbagi visi dan nilai-nilai inti perusahaan
yang jelas dengan mempertimbangkan CSR.
7. Manajemen tingkat atas terus bertindak responsif terhadap isu-isu yang terkait
dengan CSR.
8. Manajemen tingkat atas menyediakan bimbingan dan pelatihan untuk para manajer
dalam mengembangkan keterampilan pengambilan keputusan yang mengutamakan
CSR sebagai salah satu kriterianya.
9. Kegiatan CSR dikelola secara sistematis.
10. Kami secara teratur mengadakan rapat tim dengan manajemen tingkat atas dengan
CSR sebagai bahan pembicaraan utama.
11. Strategi dan tujuan CSR telah disampaikan dengan jelas kepada seluruh karyawan.

397
Appendix A.3 (continued)
12. Kami menggunakan teknologi informasi (IT) untuk meningkatkan visibilitas
perusahaan di internet dan jejaring sosial untuk mengomunikasikan CSR.
13. Kami mengomunikasikan kegiatan CSR dalam perusahaan melalui berbagai saluran,
seperti pertemuan tatap muka, komunikasi formal dari manajer senior serta
buletin/majalah perusahaan.
14. Kami membuat laporan CSR yang berisikan informasi mendetail mengenai kegiatan
CSR.
15. Kami menyediakan informasi tentang CSR pada halaman web perusahaan.
BAGIAN KEEMPAT: INTEGRASI FUNGSIONAL
Mohon berikan nilai yang menunjukkan seberapa Anda setuju atau tidak setuju dengan pernyataan di
bawah ini. (Dari 1 = sangat tidak setuju sampai dengan 5 = sangat setuju) No. Pernyataan 1 2 3 4 5
1. Kami telah mencapai/mempertahankan biaya produksi terendah.
2. Kami menurunkan biaya bahan baku.
3. Kami menurunkan biaya overhead.
4. Kami meningkatkan produktivitas tenaga kerja.
5. Kami meningkatkan pemanfaatan kapasitas.
6. Kami secara aktif melakukan inovasi produk untuk meningkatkan produk dan
layanan.
7. Kami mengembangkan produk ramah lingkungan.
8. Kami menggunakan teknologi dan bahan-bahan ramah lingkungan dalam proses
manufaktur serta pada produk dan kemasan kami.
9. Kami memproduksi produk-produk berkualitas tinggi yang menggunakan bahan
baku yang memenuhi standar dan tidak menggunakan bahan-bahan berbahaya.
10. Kami telah mengadakan inovasi dan perbaikan dalam proses produksi, logistik atau
distribusi.
11. Kami mengurangi tingkat kerusakan produk.
12. Kami meningkatkan kinerja dan keandalan produk.
13. Kami menerapkan gugus kendali mutu.
14. Produk dan/atau jasa kami memenuhi standar kualitas nasional dan/atau
internasional.
15. Kami menerapkan prosedur pengendalian mutu produk yang ketat.
16. Kami memperlakukan pemasok dengan adil dan penuh hormat terlepas dari ukuran
dan lokasi perusahaan pemasok.
17. Kami berusaha untuk memberikan pelatihan kepada pemasok dan mitra kami dalam
kegiatan bisnis.
18. Kami mempertimbangkan kepentingan pemasok kami dalam pengambilan
keputusan bisnis.
19. Kami menginformasikan para pemasok mengenai perubahan yang terjadi pada
perusahaan yang mempengaruhi keputusan pembelian kami.
20. Kami berusaha untuk meningkatkan hubungan kolaboratif yang stabil dengan para
pemasok.
21. Kami menyediakan informasi yang akurat dan lengkap tentang produk dan/atau jasa
kami kepada para pelanggan.
22. Kami merespons dengan cepat keluhan pelanggan tentang produk dan/atau jasa kami.
23. Kami mempertimbangkan kepentingan pelanggan dalam pengambilan keputusan
bisnis.
24. Kami menyediakan layanan purna jual yang responsif dan adil.
25. Kami jujur pada pelanggan dalam penjualan atau promosi produk dan/atau jasa.
26. Kami menyediakan prosedur untuk membantu memastikan kesehatan dan keamanan
karyawan.
27. Kami memperlakukan karyawan secara adil dan dengan penuh hormat terlepas dari
jenis kelamin atau latar belakang etnis.

398
Appendix A.3 (continued)
28. Kami mempertimbangkan kepentingan karyawan dalam pengambilan keputusan
bisnis.
29. Kami menyediakan penggajian yang sepatutnya dan adil sebagai imbalan untuk
pekerjaan karyawan.
30. Kami memperbarui pengetahuan sosial dan lingkungan dengan memberikan
pelatihan bagi karyawan.
BAGIAN KELIMA: KINERJA PERUSAHAAN
Berikan penilaian Anda terhadap kinerja perusahaan Anda jika DIBANDINGKAN DENGAN PARA
PESAING SELAMA TIGA TAHUN TERAKHIR.
No. Dari 1 = lebih lama sampai dengan 5 = lebih singkat 1 2 3 4 5
1. Dibandingkan dengan para pesaing, masa tunggu layanan pelanggan kami…
2. Dibandingkan dengan para pesaing, waktu pengiriman kami…
No. Dari 1 = jauh lebih buruk sampai dengan 5 = jauh lebih baik 1 2 3 4 5
3. Dibandingkan dengan para pesaing, laporan arus kas kami…
4. Dibandingkan dengan para pesaing, pelatihan karyawan kami…
5. Dibandingkan dengan para pesaing, peluang karir di perusahaan kami…
No. Dari 1 = jauh lebih rendah sampai dengan 5 = jauh lebih tinggi 1 2 3 4 5
6. Dibandingkan dengan para pesaing, produktivitas kami…
7. Dibandingkan dengan para pesaing, efisiensi operasional kami…
8. Dibandingkan dengan para pesaing, laba (profit) kami…
9. Dibandingkan dengan para pesaing, laba atas investasi (ROI) kami…
10. Dibandingkan dengan para pesaing, pertumbuhan penjualan kami…
11. Dibandingkan dengan para pesaing, keluhan pelanggan kami…
12. Dibandingkan dengan para pesaing, kepuasan pelanggan kami…
13. Dibandingkan dengan para pesaing, loyalitas pelanggan kami…
14. Dibandingkan dengan para pesaing, peningkatan jumlah konsumen kami…
15. Dibandingkan dengan para pesaing, motivasi karyawan kami…
16. Dibandingkan dengan para pesaing, turnover karyawan kami…
No. Dari 1 = sangat tidak puas sampai dengan 5 = sangat puas 1 2 3 4 5
17. Secara keseluruhan, kami … dengan keunggulan operasional perusahaan.
18. Secara keseluruhan, kami … dengan kinerja keuangan perusahaan.
19. Secara keseluruhan, kami … dengan kinerja sosial perusahaan.
BAGIAN KEENAM: INFORMASI PERUSAHAAN DAN DEMOGRAFI
Berikan SATU JAWABAN saja dengan memberikan TANDA SILANG (X) pada kotak yang sesuai
untuk tiap isian di bawah ini.
Jenis produk utama perusahaan:
[ ] Makanan dan minuman [ ] Tembakau dan olahannya
[ ] Tekstil dan pakaian [ ] Kulit, barang berbahan kulit dan alas kaki
[ ] Kertas dan barang berbahan kertas [ ] Bahan kimia dan barang berbahan kimia
[ ] Mebel [ ] Karet, barang berbahan karet dan plastik
[ ] Otomotif [ ] Barang-barang konsumsi (sabun, dll)
[ ] Komputer, elektronik, dan barang optik [ ] Mesin dan peralatan listrik
[ ] Kerajinan tangan [ ] Lain-lain: ___________________________
[ ] Obat-obatan, produk obat kimia dan obat tradisional
[ ] Barang berbahan logam bukan mesin dan peralatan

399
Appendix A.3 (continued)
Jumlah karyawan di perusahaan: [ ] < 20 [ ] 20-99 [ ] 100-499 [ ] 500-999 [ ] > 1.000
Omzet perusahaan untuk tahun keuangan sebelumnya (2017) (dalam rupiah):
[ ] < 2,5 miliar [ ] 2,5 - 50 miliar [ ] > 50 miliar [ ] Memilih untuk tidak menjawab
Umur perusahaan (tahun): [ ] < 5 [ ] 6-10 [ ] 11-20 [ ] 21-50 [ ] > 50
Kepemilikan perusahaan: [ ] Milik negara (BUMN) [ ] Swasta [ ] Perusahaan multinasional
Kota lokasi perusahaan: [ ] Surabaya [ ] Sidoarjo [ ] Gresik [ ] Pasuruan
[ ] Mojokerto [ ] Jakarta [ ] Bekasi [ ] Tangerang [ ] Lain-lain: ______________
Apakah perusahaan Anda berada di area industri? [ ] Ya [ ] Tidak
Jabatan Anda di perusahaan: [ ] Pemilik [ ] CEO [ ] Direktur [ ] Senior Manager
[ ] Middle Manager [ ] Assistant Manager [ ] Team Leader
[ ] Lain-lain: ______________
Berapa lama Anda telah bekerja di perusahaan (tahun): [ ] < 5 [ ] 6-10 [ ] 11-20 [ ] > 20
Umur Anda (tahun): [ ] < 25 [ ] 25-30 [ ] 31-40 [ ] 41-50 [ ] 51-60 [ ] > 60
Tingkat pendidikan tertinggi Anda: [ ] Sekolah Menengah [ ] Sarjana [ ] Diploma
[ ] Pascasarjana (misal: S2, S3)
TERIMA KASIH ATAS WAKTU DAN KERJASAMA ANDA
MOHON MENGEMBALIKAN KUESIONER YANG TELAH DIISI LENGKAP DENGAN
MENGGUNAKAN AMPLOP PRABAYAR YANG TELAH DISEDIAKAN.

400
Appendix A.4: Mann-Whitney Test of Business Strategy

401
Appendix A.5: Kruskal-Wallis Test of Strategic Integration

402
Appendix A.6: Normality Test of Business Strategy

403
Appendix A.7: Skewness and Kurtosis for All Items

404
Appendix A.8: Kruskall-Wallis Test of Company Performance

405
Appendix A.9: Mann-Whitney Test of Strategic Integration

406
Appendix A.10: Mann-Whitney Test of Company Performance

407
Appendix A.11: Ethics Approval

408
Appendix A.12: PCA Constructs of Strategic Integration
Construct &
Indicator
Cronbach’s
Alpha KMO Eigen Value
Total Variance Explained
Cumulative (%) Communalities Loading
Aligning 0.88 0.87 3.35 70
SI01 0.64 0.80
SI02 0.68 0.83
SI03 0.55 0.74
SI04 0.76 0.87
SI05 0.71 0.84
SuppTM 0.91 0.89 3.69 73.82
SI06 0.73 0.85
SI07 0.78 0.88
SI08 0.72 0.85
SI09 0.77 0.88
SI10 0.69 0.83
EffCom 0.91 0.88 3.73 74.51
SI11 0.69 0.83
SI12 0.73 0.85
SI13 0.77 0.88
SI14 0.77 0.88
SI15 0.77 0.88

409
Appendix A.13: PCA Constructs of Functional Integration
Construct &
Indicator
Cronbach’s
Alpha KMO Eigen Value
Total Variance Explained
Cumulative (%) Communalities Loading
Cost 0.83 0.77 2.99 59.69
FI01 0.56 0.75
FI02 0.56 0.75
FI03 0.69 0.83
FI04 0.61 0.78
FI05 0.56 0.75
Innovation 0.84 0.80 3.02 60.31
FI06 0.52 0.72
FI07 0.65 0.81
FI08 0.69 0.83
FI09 0.58 0.76
FI10 0.57 0.75
Quality 0.87 0.84 3.31 66.13
FI11 0.60 0.78
FI12 0.66 0.82
FI13 0.71 0.84
FI14 0.66 0.81
FI15 0.67 0.82
Supplier 0.84 0.82 3.05 61.06
FI16 0.52 0.72
FI17 0.56 0.75
FI18 0.70 0.83
FI19 0.64 0.80
FI20 0.63 0.80
Customer 0.84 0.86 3.11 62.09
FI21 0.61 0.78
FI22 0.66 0.81
FI23 0.67 0.82
FI24 0.52 0.72
FI25 0.65 0.80
Employee 0.87 0.86 3.29 65.84
FI26 0.63 0.80
FI27 0.71 0.85
FI28 0.58 0.76
FI29 0.74 0.86
FI30 0.62 0.79

410
Appendix A.14: PCA Constructs of Company Performance
Construct &
Indicator
Cronbach’s
Alpha KMO Eigen Value
Total Variance Explained
Cumulative (%) Communalities Loading
CCP 0.44 0.71 2.26 56.57
CP11 0.12 -0.35
CP12 0.76 0.87
CP13 0.74 0.86
CP14 0.63 0.80
CEP 0.63 0.80 2.60 52.00
CP04 0.66 0.81
CP05 0.72 0.85
CP15 0.65 0.81
CP16 0.02 -0.15
CP19 0.54 0.73
CFP 0.84 0.83 3.08 61.56
CP03 0.57 0.75
CP08 0.71 0.84
CP09 0.74 0.86
CP10 0.56 0.75
CP18 0.50 0.71
COP 0.83 0.76 2.95 58.93
CP01 0.57 0.75
CP02 0.60 0.77
CP06 0.63 0.79
CP07 0.64 0.80
CP17 0.51 0.72

411
Appendix B.1: Descriptive Analysis of Business Strategy
Variable Mean SD BS01 BS02 BS03 BS04 BS05 BS06 BS07 BS08 BS09 BS10
BS01 4.53 0.64 1.00
BS02 4.68 0.61 0.33** 1.00
BS03 4.29 0.71 0.26** 0.27** 1.00
BS04 4.26 0.71 0.29** 0.30** 0.43** 1.00
BS05 4.31 0.76 0.37** 0.26** 0.33** 0.22** 1.00
BS06 4.14 0.82 0.19** 0.18** 0.32** 0.31** 0.25** 1.00
BS07 4.25 0.72 0.32** 0.31** 0.34** 0.33** 0.35** 0.39** 1.00
BS08 4.00 0.87 0.12** 0.20** 0.40** 0.43** 0.21** 0.31** 0.29** 1.00
BS09 4.54 0.71 0.24** 0.37** 0.27** 0.34** 0.21** 0.24** 0.35** 0.27** 1.00
BS10 4.25 0.72 0.18** 0.24** 0.36** 0.33** 0.25** 0.38** 0.41** 0.36** 0.40** 1.00

412
Appendix B.2: Descriptive Analysis of CSR Strategy

413
Appendix B.3: Descriptive Analysis of Strategic Integration

414
Appendix B.4: Descriptive Analysis of Company Performance

415
Appendix B.5: Outer Model Loadings and Cross Loadings of Model 1
Indicator Construct
Aligning EffCom SuppTM CCP CEP CFP COP
SI01 0.80 0.59 0.68 0.19 0.44 0.36 0.34
SI02 0.82 0.62 0.65 0.26 0.53 0.33 0.35
SI03 0.73 0.47 0.54 0.24 0.41 0.27 0.31
SI04 0.87 0.65 0.73 0.24 0.51 0.34 0.39
SI05 0.85 0.70 0.76 0.23 0.50 0.32 0.36
SI06 0.77 0.66 0.85 0.20 0.51 0.30 0.32
SI07 0.73 0.71 0.88 0.22 0.53 0.36 0.38
SI08 0.66 0.65 0.84 0.23 0.48 0.31 0.32
SI09 0.73 0.78 0.88 0.29 0.58 0.40 0.41
SI10 0.66 0.76 0.83 0.26 0.50 0.37 0.33
SI11 0.66 0.83 0.77 0.32 0.55 0.40 0.41
SI12 0.61 0.85 0.69 0.22 0.44 0.30 0.27
SI13 0.64 0.88 0.70 0.24 0.50 0.35 0.34
SI14 0.67 0.88 0.75 0.21 0.50 0.33 0.31
SI15 0.63 0.87 0.65 0.17 0.42 0.30 0.29
CP01 0.28 0.24 0.28 0.45 0.48 0.45 0.72
CP02 0.28 0.23 0.26 0.44 0.46 0.46 0.73
CP03 0.34 0.30 0.32 0.50 0.56 0.76 0.58
CP04 0.48 0.47 0.51 0.45 0.81 0.55 0.54
CP05 0.48 0.41 0.45 0.49 0.83 0.55 0.56
CP06 0.33 0.28 0.30 0.54 0.56 0.63 0.81
CP07 0.36 0.31 0.33 0.55 0.57 0.64 0.82
CP08 0.32 0.38 0.35 0.53 0.56 0.83 0.56
CP09 0.33 0.31 0.33 0.50 0.52 0.84 0.56
CP10 0.25 0.24 0.26 0.62 0.54 0.76 0.60
CP12 0.26 0.25 0.25 0.87 0.55 0.59 0.64
CP13 0.20 0.19 0.22 0.85 0.53 0.54 0.53
CP14 0.25 0.25 0.24 0.84 0.54 0.61 0.53
CP15 0.42 0.43 0.48 0.57 0.81 0.60 0.59
CP17 0.37 0.36 0.38 0.53 0.64 0.61 0.75
CP18 0.32 0.30 0.34 0.50 0.63 0.73 0.58
CP19 0.51 0.48 0.49 0.52 0.76 0.62 0.61
Note: the blue remark indicates the loading of the indicator on its construct.

416
Appendix B.6: Varimax-Rotated Common Factor Matrix of Business Strategy
Code Item Factor loadinga
Communalities Factor 1 Factor 2
BS01 Pursuing operating efficiency 0.81 0.67
BS02 Controlling the product quality 0.79 0.66
BS03 Developing/refining existing products 0.58 0.45 0.53
BS04 Innovation in manufacturing process 0.60 0.48
BS05 Emphasis on the efficiency of securing raw materials or
components (e.g., bargaining down the purchase price)
0.67 0.49
BS06 Developing brand identification 0.72 0.53
BS07 Having cooperative and supportive channels of distribution 0.59 0.49
BS08 Creating new product development 0.74 0.56
BS09 Providing customer service capabilities 0.43 0.59 0.53
BS10 Innovation in marketing techniques and methods (e.g.,
public relations, sales promotion, direct marketing)
0.72 0.53
Total
Sum of squared loadings (eigenvalue) 4.32 1.14 5.46
% of variance 43.17 11.43 54.59
Note: aFactor loadings less than 0.40 were excluded to improve readability.

417
Appendix B.7: Collinearity of Business Strategy
Item
Unstandardized
Coefficients
Standardized
Coefficients t-
value Sig.
Collinearity
Statistics
B Std. Error Beta Tolerance VIF
BS01 0.09 0.07 0.08 1.32 0.19 0.63 1.58
BS02 0.09 0.07 0.07 1.15 0.25 0.66 1.53
BS04 -0.12 0.06 -0.11 -1.91 0.06 0.66 1.51
BS05 0.04 0.06 0.04 0.72 0.47 0.72 1.39
BS06 0.04 0.05 0.04 0.65 0.51 0.67 1.49
BS08 -0.02 0.06 -0.02 -0.25 0.80 0.63 1.60
BS08 0.13 0.05 0.14 2.58 0.01 0.70 1.43
BS10 0.12 0.06 0.11 1.93 0.05 0.71 1.41
Note: Dependent Variable: profit

418
Appendix B.8: Notification from SmartPLS about Small Sample Size

419
Appendix B.9: Varimax-Rotated Common Factor Matrix of CSR Strategy
Code Item
Factor loadinga
Communalities Factor
1
Factor
2
Factor
3
CS01 We strive to lower our operating costs. 0.79 0.62
CS02 We closely monitor employees’ productivity. 0.70 0.59
CS03 Top management establishes long-term strategies. 0.49 0.42 0.47
CS04 We have a procedure in place to respond to every
customer complaint.
0.45 0.46
CS05 We continually improve the quality of our
products.
0.50 0.48 0.50
CS06 Internal policies prevent discrimination in
employee’s compensation and promotion.
0.56 0.40
CS07 We seek to comply with all laws regulating hiring
and employee benefits.
0.73 0.59
CS08 All our products meet legal standards. 0.73 0.62
CS09 Our contractual obligations are always honoured. 0.68 0.55
CS10 Managers are informed about relevant
environmental laws.
0.69 0.51
CS11 We have a comprehensive code of conduct. 0.73 0.59
CS12 We are recognised as a trustworthy company. 0.68 0.52
CS13 Fairness toward co-workers and business partners
is an integral part of the employee evaluation
process.
0.66 0.51
CS14 We have a proper procedure for employees to
report any misconduct at work.
0.70 0.63
CS15 Members of our company follow professional
standards.
0.58 0.50
CS16 We give adequate contributions to charities. 0.66 0.54
CS17 We encourage partnerships with local businesses
and schools.
0.75 0.62
CS18 We give a donation for sport and/or cultural
activities.
0.85 0.74
CS19 A program is in place to reduce the amount of
energy and materials wasted in our business.
0.45 0.51 0.55
CS20 We encourage employees to join civic
organisations that support our community.
0.76 0.60
Total
Sum of squared loadings (eigenvalue) 8.12 1.82 1.16 11.11
% of variance 40.62 9.12 5.79 55.53
Note: aFactor loadings less than 0.40 were excluded to improve readability.

420
Appendix B.10: Collinearity of CSR Strategy
Item
Unstandardized
Coefficients
Standardized
Coefficients t Sig. Collinearity Statistics
B Std. Error Beta Tolerance VIF
CS01 0.01 0.05 0.02 0.30 0.77 0.81 1.24
CS02 -0.01 0.06 -0.01 -0.26 0.80 0.68 1.47
CS06 -0.01 0.05 -0.01 -0.18 0.86 0.64 1.55
CS07 -0.01 0.07 -0.01 -0.08 0.94 0.48 2.10
CS08 0.07 0.07 0.07 0.99 0.32 0.44 2.28
CS09 -0.09 0.08 -0.07 -1.08 0.28 0.48 2.09
CS10 0.11 0.07 0.10 1.72 0.09 0.56 1.78
CS11 0.03 0.07 0.03 0.45 0.66 0.47 2.13
CS12 0.11 0.06 0.10 1.66 0.10 0.56 1.78
CS13 -0.09 0.06 -0.09 -1.44 0.15 0.55 1.81
CS14 -0.04 0.07 -0.04 -0.53 0.60 0.44 2.30
CS15 0.12 0.07 0.11 1.80 0.07 0.51 1.98
CS16 0.08 0.05 0.10 1.62 0.11 0.58 1.72
CS17 0.06 0.05 0.07 1.08 0.28 0.53 1.90
CS18 0.11 0.05 0.14 2.16 0.03 0.50 2.00
CS20 0.05 0.05 0.07 1.13 0.26 0.58 1.73
a. Dependent Variable: profit

421
Appendix B.11: Step 2 MICOM Proactive and Reactive of Strategic Integration
Composite Original
Correlation
Correlation
Permutation
mean
5.0% Permutation
p-values
Compositional
invariance
established?
Aligning 1.00 1.00 1.00 0.03 No
EffCom 1.00 1.00 1.00 0.74 Yes
SuppTM 1.00 1.00 1.00 0.47 Yes
Strategic _Integration 1.00 1.00 1.00 0.35 Yes
CCP 1.00 1.00 1.00 0.03 No
CEP 1.00 1.00 1.00 0.30 Yes
CFP 1.00 1.00 1.00 0.30 Yes
COP 1.00 1.00 0.99 0.24 Yes

422
Appendix B.12: Step 3 MICOM Proactive and Reactive of Strategic Integration

423
Appendix B.13: Permutation Test Proactive versus Reactive of Strategic Integration

424
Appendix B.14: Parametric and Welch-Satterthwaite Tests Proactive and Reactive of
Strategic Integration

425
Appendix B.15: Step 2 MICOM Proactive and Accommodative of Strategic Integration
Composite Original
Correlation
Correlation
Permutation Mean 5.0%
Permutation
p-Values
Compositional
invariance
established?
Aligning 1.00 1.00 1.00 0.90 Yes
EffCom 1.00 1.00 1.00 0.50 Yes
SuppTM 1.00 1.00 1.00 0.09 Yes
Strategic _Integration 1.00 1.00 1.00 0.00 No
CCP 1.00 1.00 1.00 0.73 Yes
CEP 1.00 1.00 1.00 0.54 Yes
CFP 1.00 1.00 1.00 0.04 No
COP 1.00 1.00 0.99 0.35 Yes

426
Appendix B.16: Step 3 MICOM Proactive and Accommodative of Strategic Integration

427
Appendix B.17: Permutation Test Proactive and Accommodative of Strategic Integration

428
Appendix B.18: Parametric and Welch-Satterthwaite Tests Proactive and
Accommodative of Strategic Integration
Note: Pro=Proactive; Accom=Accommodative

429
Appendix B.19: Step 2 MICOM Accommodative and Reactive of Strategic Integration
Composite Original
Correlation
Correlation
Permutation Mean 5.0%
Permutatio
n p-Values
Compositiona
l invariance
established?
Aligning 1.00 1.00 1.00 0.27 Yes
EffCom 1.00 1.00 1.00 0.54 Yes
SuppTM 1.00 1.00 1.00 0.22 Yes
Strategic Integration 1.00 1.00 1.00 0.00 No
CCP 1.00 1.00 1.00 0.02 No
CEP 1.00 1.00 1.00 0.06 Yes
CFP 1.00 1.00 1.00 0.42 Yes
COP 1.00 1.00 0.99 0.25 Yes

430
Appendix B.20: Step 3 MICOM Accommodative and Reactive of Strategic Integration

431
Appendix B.21: Permutation Test Accommodative and Reactive of Strategic Integration

432
Appendix B.22: Parametric and Welch-Satterthwaite Tests Accommodative and Reactive
of Strategic Integration
Note: Accom=Accommodative.

433
Appendix B.23: Step 2 MICOM Company Size of Strategic Integration
Composite Original
Correlation
Correlation
Permutation Mean 5.0%
Permutatio
n p-Values
Compositiona
l invariance
established?
Aligning 1.00 1.00 1.00 0.45 Yes
EffCom 1.00 1.00 1.00 0.02 No
SuppTM 1.00 1.00 1.00 0.13 Yes
Strategic Integration 1.00 1.00 1.00 0.15 Yes
CCP 1.00 1.00 1.00 0.04 No
CEP 1.00 1.00 1.00 0.14 Yes
CFP 1.00 1.00 1.00 0.09 Yes
COP 1.00 1.00 1.00 0.22 Yes

434
Appendix B.24: Step 3 MICOM Company Size of Strategic Integration

435
Appendix B.25: Permutation Test Company Size of Strategic Integration

436
Appendix B.26: Parametric and Welch-Satterthwaite Tests Company Size of Strategic
Integration

437
Appendix B.27: Step 2 MICOM Industry Type of Strategic Integration
Composite Original
Correlation
Correlation
Permutation
mean
5.0% Permutation
p-values
Original
Correlation
established?
Aligning 1.00 1.00 1.00 0.60 Yes
EffCom 1.00 1.00 1.00 0.86 Yes
SuppTM 1.00 1.00 1.00 0.46 Yes
Strategic Integration 1.00 1.00 1.00 0.98 Yes
CCP 1.00 1.00 1.00 0.72 Yes
CEP 1.00 1.00 1.00 0.75 Yes
CFP 1.00 1.00 1.00 0.18 Yes
COP 1.00 1.00 1.00 0.86 Yes

438
Appendix B.28: Step 3 MICOM Industry Type of Strategic Integration

439
Appendix B.29: Permutation Test Industry Type of Strategic Integration

440
Appendix B.30: Parametric and Welch-Satterthwaite Tests Industry Type of Strategic
Integration

441
Appendix C.1: Descriptive Analysis of Functional Integration

442
Appendix C.2: Outer Model Loadings and Cross Loadings of Model 2

443
Appendix C.3: Step 2 MICOM Business Strategy of Functional Integration
Construct Original
Correlation
Correlation
Permutation Mean 5.0%
Permutation
p-Values
Original
Correlation
established?
Cost 1.00 1.00 0.99 0.42 Yes
Customer 1.00 1.00 1.00 0.35 Yes
Employee 1.00 1.00 1.00 0.75 Yes
Innovation 1.00 1.00 1.00 0.45 Yes
Quality 1.00 1.00 1.00 0.00 No
Supplier 1.00 1.00 1.00 0.09 No
Functional Integration 1.00 1.00 1.00 0.04 No
CCP 1.00 1.00 1.00 0.40 Yes
CEP 1.00 1.00 1.00 0.35 Yes
CFP 1.00 1.00 1.00 0.16 Yes
COP 1.00 1.00 1.00 0.28 Yes

444
Appendix C.4: Step 3 MICOM Business Strategy of Functional Integration

445
Appendix C.5: Permutation Test Business Strategy of Functional Integration

446
Appendix C.6: Parametric and Welch-Satterthwaite Tests Business Strategy of
Functional Integration

447
Appendix C.7: Step 2 MICOM Proactive and Reactive of Functional Integration
Construct Original
Correlation
Correlation
Permutation Mean 5.0%
Permutation
p-Values
Original
Correlation
established?
Cost 1.00 1.00 0.99 0.15 Yes
Customer 1.00 1.00 1.00 0.42 Yes
Employee 1.00 1.00 1.00 0.28 Yes
Innovation 1.00 1.00 1.00 0.30 Yes
Quality 1.00 1.00 1.00 0.76 Yes
Supplier 1.00 1.00 1.00 0.01 No
Functional Integration 1.00 1.00 1.00 0.17 Yes
CCP 1.00 1.00 1.00 0.38 Yes
CEP 1.00 1.00 1.00 0.65 Yes
CFP 1.00 1.00 1.00 0.31 Yes
COP 1.00 1.00 0.99 0.21 Yes

448
Appendix C.8: Step 3 MICOM Proactive and Reactive of Functional Integration

449
Appendix C.9: Permutation Test Proactive and Reactive of Functional Integration

450
Appendix C.10: Parametric and Welch-Satterthwaite Tests Proactive and Reactive of
Functional Integration

451
Appendix C.11: Step 2 MICOM Proactive and Accommodative of Functional Integration
Composite Original
Correlation
Correlation
Permutation Mean 5.0%
Permutation
p-Values
Original
Correlation
established?
Cost 1.00 1.00 1.00 0.81 Yes
Customer 1.00 1.00 1.00 0.11 Yes
Employee 1.00 1.00 1.00 0.68 Yes
Innovation 1.00 1.00 1.00 0.07 Yes
Quality 1.00 1.00 1.00 0.05 No
Supplier 1.00 1.00 1.00 0.24 Yes
Functional Integration 1.00 1.00 1.00 0.01 No
CCP 1.00 1.00 1.00 0.21 Yes
CEP 0.99 1.00 1.00 0.00 No
CFP 1.00 1.00 1.00 0.06 Yes
COP 1.00 1.00 1.00 0.08 Yes

452
Appendix C.12: Step 3 MICOM Proactive and Accommodative of Functional Integration

453
Appendix C.13: Permutation Test Proactive and Accommodative of Functional
Integration

454
Appendix C.14: Parametric and Welch-Satterthwaite Tests Proactive and
Accommodative of Functional Integration

455
Appendix C.15: Step 2 MICOM Accommodative and Reactive of Functional Integration
Composite Original
Correlation
Correlation
Permutation Mean 5.0%
Permutation
p-Values
Original
Correlation
established?
Cost 1.00 1.00 0.99 0.28 Yes
Customer 1.00 1.00 1.00 0.56 Yes
Employee 1.00 1.00 1.00 0.21 Yes
Innovation 1.00 1.00 1.00 0.48 Yes
Quality 1.00 1.00 1.00 0.11 Yes
Supplier 1.00 1.00 1.00 0.47 Yes
Functional Integration 1.00 1.00 1.00 0.24 Yes
CCP 1.00 1.00 1.00 0.05 No
CEP 0.99 1.00 1.00 0.01 No
CFP 1.00 1.00 1.00 0.63 Yes
COP 1.00 1.00 0.99 0.26 Yes

456
Appendix C.16: Step 3 MICOM Accommodative and Reactive of Functional Integration

457
Appendix C.17: Permutation Test Accommodative and Reactive of Functional
Integration

458
Appendix C.18: Parametric and Welch-Satterthwaite Tests Accommodative and
Reactive of Functional Integration

459
Appendix C.19: Step 2 MICOM Company Size of Functional Integration
Composite Original
Correlation
Correlation
Permutation Mean 5.0%
Permutation
p-Values
Compositional
Invariance
Cost 1.00 1.00 1.00 0.22 Yes
Customer 1.00 1.00 1.00 0.32 Yes
Employee 1.00 1.00 1.00 0.90 Yes
Innovation 1.00 1.00 1.00 0.02 No
Quality 1.00 1.00 1.00 0.67 Yes
Supplier 1.00 1.00 1.00 0.83 Yes
Functional Integration 1.00 1.00 1.00 0.06 Yes
CCP 1.00 1.00 1.00 0.01 No
CEP 1.00 1.00 1.00 0.01 No
CFP 1.00 1.00 1.00 0.02 No
COP 1.00 1.00 1.00 0.21 Yes

460
Appendix C.20: Step 3 MICOM Company Size of Functional Integration

461
Appendix C.21: Permutation Test Company Size of Functional Integration

462
Appendix C.22: Parametric and Welch-Satterthwaite Tests Company Size of Functional
Integration

463
Appendix C.23: Step 2 MICOM Industry Type of Functional Integration
Composite Original
Correlation
Correlation
Permutation Mean 5.0%
Permutation
p-Values
Compositional
Invariance
Cost 1.00 1.00 1.00 0.93 Yes
Customer 1.00 1.00 1.00 0.14 Yes
Employee 1.00 1.00 1.00 0.15 Yes
Innovation 1.00 1.00 1.00 0.21 Yes
Quality 1.00 1.00 1.00 0.16 Yes
Supplier 1.00 1.00 1.00 0.86 Yes
Functional Integration 1.00 1.00 1.00 0.16 Yes
CCP 1.00 1.00 1.00 0.82 Yes
CEP 1.00 1.00 1.00 0.30 Yes
CFP 1.00 1.00 1.00 0.22 Yes
COP 1.00 1.00 1.00 0.94 Yes

464
Appendix C.24: Step 3 MICOM Industry Type of Functional Integration

465
Appendix C.25: Permutation Test Industry Type of Functional Integration

466
Appendix C.26: Parametric and Welch-Satterthwaite Tests Industry Type of Functional
Integration

467
Appendix D: Thesis Related Publications
Journal Articles (published):
▪ Rinawiyanti, E.D., Huang, X. and As-Saber, S. (2021). Integrating corporate social
responsibility into business functions and its impact on company performance: Evidence
from the Indonesian manufacturing industry. Social Responsibility Journal (ABCD B-
ranked, Q2 in Scimago, under review).
▪ Rinawiyanti, E.D., Huang, X. and As-Saber, S. (2020). Adopting management control
systems through CSR strategic integration and investigating its impact on company
performance: evidence from Indonesia. Corporate Governance: International journal of
business in society, https://doi.org/10.1108/CG-04-2020-0150 (ABCD C-ranked, Q2 in
Scimago).
Proceedings:
▪ Rinawiyanti, E.D., Huang, X. and As-Saber, S. (2021). The Impacts of Corporate Social
Responsibility on Small and Medium Enterprises Performance. Presented at International
Conference Project Management (ICPM), 12-13 June 2021, Malang, Indonesia (online):
Journal of International Conference Proceedings (JICP), p. 39.
▪ Rinawiyanti, E.D., Huang, X. and As-Saber, S. (2019). The Impact of Firms’ Strategic CSR
integration on Their Organisational Performance: Evidence from Indonesian Manufacturing
Firms. Presented at the 16th International Conference on Business Management (ICBM),
12-14 December 2019, Melbourne, Australia: Proceeding Book, p. 112.
▪ Rinawiyanti, E.D., Huang, C. and As-Saber, S. (2019). The Integration of Social
Responsibility into Business Operation: Case Study of Indonesian Manufacturing Industry.
Presented at the International Conference on Informatics, Technology, and Engineering
(InCITE), 22-24 August 2019, Bali, Indonesia: IOP Conference Series: Materials Science
and Engineering 703 (2019) 012016, pp. 1-6. doi:10.1088/1757-899X/703/1/012016.

468
Conference Presentations:
▪ Rinawiyanti, E.D., Huang, X. and As-Saber, S. (2021). Integration of Corporate Social
Responsibility for Improved Company Performance: Evidence from the Indonesian
Manufacturing Industry. Presented at the 3rd International Conference on Informatics,
Technology, and Engineering (InCITE), 25-26 August 2021 (online).
▪ Rinawiyanti, E.D., Huang, X. and As-Saber, S. (2021). Clustering of corporate social
responsibility in the Indonesian manufacturing industry: How far can you go? Presented at
the 18th International Symposium on Management (INSYMA), 27-29 May 2021 (online).
▪ Rinawiyanti, E.D., Huang, X. and As-Saber, S. (2021). Benefits of corporate social
responsibility on small and medium enterprises. Presented at the Australia and New Zealand
International Business Academy (ANZIBA) Conference 2021, 17-19 February 2021
(online).
▪ Rinawiyanti, E.D., Huang, X. and As-Saber, S. (2019). Strategic Integration of CSR with
The Company’s Strategy and Its Effect on The Firm’s Performance: Evidence from the
Indonesian Manufacturing Industry. Presented at the 33rd Annual Australian & New Zealand
Academy of Management (ANZAM) Conference, 3-6 December 2019, Cairns, Australia.
▪ Rinawiyanti, E.D., Huang, C. and As-Saber, S. (2018). A Brief Overview of Integrated CSR
Practices Assessment in A Developing Country: A Case Study of Manufacturing Industry
in Indonesia. Presented at the Governance and Sustainability (GAS) Conference, 2
November 2018, Melbourne, Australia.
▪ Rinawiyanti, E.D. (2017). Integrating Corporate Social Responsibility into Business
Strategy and Its Impact on Company Performance. Presented at the 7th Annual Business
Ethics Network (ABEN), 7-10 December 2017, Melbourne, Australia.

469
Achievements:
▪ Rinawiyanti, E.D., Huang, X. and As-Saber, S. (2021). Clustering of corporate social
responsibility in the Indonesian manufacturing industry: How far can you go? The Best
Paper Award in Strategic Category at the 18th International Symposium on Management
(INSYMA), 27-29 May 2021 (online).
▪ Rinawiyanti, E.D., Huang, X. and As-Saber, S. (2020). Let’s Integrate CSR. People Choice
Award at Three Minutes Presentation (3 MT), College of Business and Law, RMIT
University, 11 August 2020, Melbourne, Australia.
▪ Rinawiyanti, E.D., Huang, X. and As-Saber, S. (2018). Integrating Social Responsibility
into Business Operations and Its Impact on Organisational Performance: Evidence from the
Indonesian Manufacturing Industry. Runner Up at RMIT HDR Poster Competition, 23
October 2019, Melbourne, Australia.