The Information-Content of the Limit Order Book: Evidence from NYSE Specialist Actions
46
The Information-Content of the Limit Order Book: Evidence from NYSE Specialist Actions Lawrence E. Harris* and Venkatesh Panchapagesan † Version 1.2: October 8, 1999 * Marshall School of Business University of Southern California Los Angeles, CA 90089-1421 [email protected] † Olin School of Business Washington University St. Louis, MO 63130 [email protected] Preliminary. Please do not quote without permission. We thank Andrew Elul, Marc Lipson, Ananth Madhavan, George Sofianos and participants at the 1999 NASDAQ-Notre Dame Conference on Market Microstructure, 1999 NBER Meetings on Market Microstructure, and the 1999 European Finance Association Meetings at Helsinki for their comments and discussion. As always, the comments and opinions contained in this paper are those of the authors alone. © Lawrence Harris and Venkatesh Panchapagesan, 1999.
-
Upload
independent -
Category
Documents
-
view
0 -
download
0
Transcript of The Information-Content of the Limit Order Book: Evidence from NYSE Specialist Actions

The Information-Content of the Limit Order Book:
Evidence from NYSE Specialist Actions
Lawrence E. Harris*
and
Venkatesh Panchapagesan†
Version 1.2: October 8, 1999
* Marshall School of BusinessUniversity of Southern CaliforniaLos Angeles, CA [email protected]
† Olin School of BusinessWashington UniversitySt. Louis, MO [email protected]
Preliminary. Please do not quote without permission.
We thank Andrew Elul, Marc Lipson, Ananth Madhavan, George Sofianos and participants at the1999 NASDAQ-Notre Dame Conference on Market Microstructure, 1999 NBER Meetings onMarket Microstructure, and the 1999 European Finance Association Meetings at Helsinki fortheir comments and discussion. As always, the comments and opinions contained in this paper arethose of the authors alone.
© Lawrence Harris and Venkatesh Panchapagesan, 1999.

The Information-Content of the Limit Order Book:
Evidence from NYSE Specialist Actions
Abstract
Specialists compete with limit order traders to provide liquidity at the New York Stock
Exchange. Since specialists see all system limit orders, they enjoy a unique advantage in this
competition. We examine whether the limit order book is informative about future price changes
and whether specialists use this information when trading. Our analyses consider three actions
specialists can take when a market order arrives: stop the order, immediately fill the order at the
quoted price, or immediately fill the order at an improved price. Using SuperDOT limit orders in
the TORQ database, we find that the limit order book is informative, especially about short-term
price movements. We also find that the specialist uses this information in a way that favors him
(and sometimes the floor community) over the limit order traders. The results are more evident
for active stocks where the competition between specialists and limit order traders is more
intense. We also show that specialists in lower-priced stocks are less likely to initiate such actions
because of the binding tick size.
Keywords: Specialist trading, Limit order book, Market transparency, Limit order option values.

1 Introduction
Specialists at the New York Stock Exchange (NYSE) are broker-dealers. They trade as
brokers for their clients and as dealers for their own accounts. The dual nature of their operations
has attracted regulatory interest even as early as the 1930s (See Abolafia (1996)). In particular,
concerns have been raised about the extent to which specialists may profit from opportunities and
information they obtain when acting as brokers for other traders.
To mitigate potential conflicts of interest, the NYSE has adopted several rules. For
example, the public priority rule prohibits Exchange members, including specialists, from trading
ahead of public traders at the same price. Although these rules regulate what specialists can and
cannot do, specialists still enjoy an informational advantage over other traders. They see the
expressed orders of all traders whereas other traders only know about their own orders.
Whether specialists can trade profitably on this information given the constraints Exchange
rules impose upon them is an empirical question. Using the TORQ database, we examine for the
first time whether aggregate order information is indeed informative as academic and regulatory
studies suggest, and whether specialists use this information to their benefit. We find evidence for
both points.
Specialists place public orders that are not filled immediately in their limit order books.
These orders consist primarily of limit orders with limit prices that are away from the market.
Orders stay in the book until they are filled, until they expire, or until they are cancelled.
Until June 1991, only specialists (and Exchange officials) could see the contents of the
book. Subsequently, Exchange rules required specialists to share general information about the
book with other floor traders on an informal basis. In practice, the book remains largely hidden
from most traders in the market. This is in contrast with some automated markets such as the
Paris Bourse and the Toronto Stock Exchange that display their books.
Traders who know the contents of the book may exploit this information in at least two
ways. First, an asymmetry in the order book may reflect trader sentiment or the presence of well
informed traders. In either event, order book asymmetry may indicate the likely direction of
future price changes. Traders who can see the book therefore might want to trade in front of the
heavy side of the book. Second, even if asymmetries in the book are not correlated with future

2
price changes, asymmetries may still allow traders to profit from the quote-matching strategy
discussed in Amihud and Mendelson (1990) and Harris (1990). Traders who use this strategy
attempt to extract option values from standing limit orders. To do so, they would trade ahead of
the heavy side of the book. If prices subsequently move in their favor, they profit to the full
extent of the price rise. If prices move against them, they may be able to limit their losses by
trading with the heavy side of the book. Quote-matchers who can submit and adjust their orders
faster than can limit order traders may profit from this strategy. Whether the limit order book
conveys information about future price changes, or merely information about the trading options
inherent in limit orders, traders who know what is in the book clearly will trade more successfully
than those who do not.
Since NYSE specialists know more about their order books than all other traders, they
have an informational advantage over other traders who compete with them to offer liquidity.
Whether this advantage produces significant trading profits is uncertain. The NYSE maintains
that specialists provide liquidity only when none is available. The low specialist participation rate
supports this view: Most trades at the NYSE are between public traders with very little specialist
intervention.1 Not surprisingly, the participation rate is lowest for actively traded stocks with
narrow spreads. The public order precedence rule prevents specialists from competing effectively
against public traders in these stocks. The constraints on specialist trades may make it difficult for
them to profit from their informational advantages.
Empirical analyses of specialist trading profits have been highly limited because the
relevant data are not readily available. The few empirical studies that examine specialist profits
suggest that specialists can predict short-term price movements to some extent (See Sofianos
(1995)). These studies, however, do not explicitly identify how they make such predictions.
Using the NYSE Trades, Orders, Reports and Quotes (TORQ) database, we provide
evidence that specialists profit from knowing their limit order books. We find that the limit order
book is informative about immediate price movements, and that specialists use this information
when deciding how to respond to the arrival of a market order. We examine three possible
1 The participation rate has been steady near 17-18 percent. The rate is the ratio of the dollar value of all specialisttrades over the total dollar trading volume. (See Madhavan and Sofianos (1998))

3
responses: Specialists can stop the order,2 they can execute the order at the best quoted price, or
they can fill the order at an improved price. Since exchange rules and market conditions often
limit these choices, we focus only on situations when specialists have discretion in their choice of
response.
We find that specialists are more likely to stop, trade immediately, and improve prices
when they can trade in front of an order book that is heavy on the same side. Specialists are more
likely to buy for their own account when the book is heavy on the buy side and sell when it is
heavy on the sell side. This evidence is stronger for more active stocks than for less active stocks.
Our evidence supports the suggestion in Harris (1990) that relative tick size (tick size as a
fraction of price) affects quote-matcher strategies, especially in very active stocks. Because of a
binding tick size and a heavy limit order book, such stocks provide profitable opportunities for
quote-matchers. These results will be particularly relevant to the upcoming debate over the tick
size that US markets will adopt when they change to decimal pricing.
Though we show that specialists exploit information from their limit order books, we do
not address the broader question of the optimal degree of transparency. To do so would require
that we examine the costs of the affirmative obligations that the NYSE imposes upon specialists.
Specialists assume these costly obligations in part because they can profit from exploiting
information in their order books. Greater transparency would decrease the specialists’
informational advantage over other traders and thereby make their trading less profitable.3 Any
analysis of the optimal degree of transparency at the NYSE therefore must also consider the costs
and benefits of the specialists’ affirmative obligations, which is beyond the scope of this study.
We proceed as follows. Section 2 surveys the existing literature and motivates our key
hypotheses. Section 3 describes the data as well as the algorithms we use to identify specialist
2 A specialist stops an incoming market order by guaranteeing execution at or better than quoted price. While anorder is stopped, it must be matched with any incoming market orders on the other side. If no such orders arrive,the specialist must execute the order for his own account within 30 minutes. The specialist may also elect toexecute the order any time before then. Ready (1999) analyses various aspects of specialist order stoppingbehavior.3 Wider exposure of the limit order book to unregulated traders also would decrease the numbers and sizes oforders that traders are willing to leave in the book. This would further decrease specialist trading profits and likelyincrease transaction costs for large traders. These effects could be offset to some extent by allowing traders tospecify that their orders not be fully displayed in the order book. The electronic trading systems used at the ParisBourse, at Globex and in several markets allow large traders to specify such display instructions.

4
trades and to construct the limit order book. We present and interpret our results in Section 4
and conclude in Section 5.
2 Extant Literature and Hypotheses
2.1 Extant Literature
This study is closely linked to theoretical models of competition in markets with dealers
and limit order books. Rock (1999) models the competition between limit order traders and risk-
averse specialists arising out of risk-related inventory issues. In his paper, the informational
advantage of the specialist comes from market orders and not from limit orders, as proposed in
this paper. Seppi (1997) examines this competition using additional constraints such as public
priority rules and with informative limit orders. His model, however, assumes that the limit order
book is common knowledge. It therefore abstracts from the transparency issues that are
important to this paper.
This paper is also related to Madhavan and Panchapagesan (1999). They examine the role
of specialists in price discovery at the NYSE open. Specialists facilitate price discovery because
of their superior information on the evolution of order flow prior to the opening. Similar to our
results for the continuous market, they find evidence of specialists using order book information
in their trades in the opening auction.
Benveniste, Marcus and Wilhelm (1992) and Chan and Weinstein (1992) consider how
“professional relationships” among floor brokers and specialists provide specialists with
information that helps them trade profitably. This empirical paper focuses exclusively on
information in the booked order flow whereas these theoretical papers consider the importance of
information about orders held by floor brokers.
Our work also complements analyses of specialist trading and analyses of limit order
books. Using the same database as ours but using non-system trades as well, Hasbrouck and
Sofianos (1992) find specialist trades to be profitable, especially in the short-run. Sofianos (1995)
finds total profits for specialists to be small though the realized trading profits are found to be
significant, especially in the most active stocks. This suggests that specialists time their trades
well, a phenomenon that we attribute partly to their knowledge of the limit order book.
Madhavan and Sofianos (1998) model specialist trading as a function of several variables, but do

5
not explicitly consider information from the limit order book. Ready (1999) finds evidence that
suggests that specialists selectively stop orders to sample future order flow. Moreover, he finds
that the market orders that the specialist does not allow to cross with the limit order book are
those that are most profitable ex-post, a finding that is consistent with the results of this paper.
We extend Ready’s work to establish the link between stopping and order book information.
Though Copeland and Galai (1983) recognized the option-like characteristics of limit
orders, only recently have researchers used standard option valuation techniques to study order
book asymmetries. Such techniques are difficult to apply to limit orders because “time to
maturity” is random. Lo, Mackinlay and Zhang (1998) present a model to compute time to
expiration for limit orders using standard survival analysis methods. Jarnecic and McInish (1997)
compute the option value of the limit order book at the Australian Stock Exchange using
exogenously chosen expiration times such as 30 minutes, 1 hour and so on. We differ from the
above two studies by estimating time to removal for a limit order using regression models.
Kavejecz (1999) examines the factors that determine specialist quotations whereas this
paper primarily examines the factors that determine specialist trades. Since quotation and trading
decisions are closely related, the two studies are closely related. Quotation decisions and trading
decisions, however, differ in significant ways. Perhaps most importantly, quotations become
public information when the specialist makes them. Their trades, however, are not public
information and generally cannot be inferred from publicly available transactions data. Since any
trader can trade ahead of the specialist by expressing interest at the same price, specialists may be
reluctant to reveal private information in their quotes. Specialists trading decisions therefore may
reveal more about private information that they may have than do their quotation decisions.
Finally, our study provides empirical validation to the claim in Harris (1990, 1998) that an
economically meaningful tick size is necessary to protect limit order traders from quote-matchers.
Quote-matchers are traders who trade only to exploit other traders’ interest in a security. A large
relative tick makes it expensive for them to trade ahead of large orders in the book. A small
relative tick encourages quote-matching, and hence lowers incentives to offer liquidity. Goldstein
and Kavejecz (1998) provide evidence supporting this hypothesis in their study of the 1997 switch
in tick size from an eighth to a sixteenth at the NYSE.

6
2.2 Informativeness of the Limit Order Book
Harris (1990) discusses two types of traders who may want to use limit orders—pre-
committed traders and value-motivated traders. The former class of traders use limit orders to
reduce trading costs, while the latter class of traders use limit orders to trade only at prices that
are acceptable given their notion of value. Pre-committed traders place limit orders close to the
market especially when they have little time available at their disposal. If their limit orders do not
execute, they must place market orders to fulfil their commitment. On the other hand, value-
motivated traders may place aggressive limit orders (or sometimes even market orders) to
capitalize on inefficient aggregation of information into prices.
Whether orders are generated by pre-committed traders or value-motivated traders, the
aggregate order imbalance in the limit order book conveys some information about future price
changes. For example, an imbalance due to a rise in pre-committed trading activity could trigger
price changes if traders convert their limit orders to market orders upon their failure to execute.
Similarly, value-motivated traders affect prices as their information gets fully impounded into
prices. In both cases, prices tend to increase following buy side imbalances (when the buy side of
the book is heavier than the sell side), and decrease following sell side imbalances. The
knowledge of such imbalances is therefore quite valuable to any trader who can act on it. At the
NYSE, the specialists know more about when order imbalances arise than any other traders. We
now turn to describe the actions specialists may take to exploit this information.
2.3 Specialist Discretionary Actions
Though Exchange rules often constrain specialist trading, several actions remain within
their discretion. For example, upon the arrival of a market order, a specialist can stop the order
from executing at the prevailing quote by guaranteeing execution later at a better price. He may
then decide to fill the order for his account at any time before another order that can fill it arrives.
Alternatively, he can execute the incoming market order at the market quote, which may or may
not reflect his own trading interest. Finally, he also may choose to execute the market order
immediately for his account at an improved price.
The public priority rules of the NYSE often constrain these choices. As Exchange
members, specialists can never trade ahead of public orders at the same price. When public

7
traders offer the best quoted prices, specialists therefore must improve price if they wish to trade
immediately.4 We examine each alternative action in detail below.
2.3.1 Decision to stop
Several reasons may explain why specialists stop market orders. First, stopping orders
allows the specialist to seek price improvement for market orders. The specialist is likely to
update quotes to reflect the stopped market order. For example, a specialist who has stopped a
market sell order when the quotes were 10 1014− might now quote the stock at 10 101
8− with the
offer size reflecting the size of the stopped market sell order. The stopped order gets price
improvement when it trades with an incoming market buy order. Since the Exchange evaluates
specialist performance based on how often they improve prices, this stop mechanism allows
specialists to occasionally improve prices without trading themselves.
Specialists may also stop market orders when they are uncertain about where to place
their quotes. Unbalanced flows of market orders suggest that specialists are setting their quoted
prices either too low or too high. If the quotes reflect the specialists' commitments to supply
liquidity, rather than their booked limit orders, such imbalances could adversely affect their
inventories. By stopping market orders, specialists gain time to analyze subsequent market
conditions before deciding to trade for their accounts. For example, a specialist may stop a
market buy order instead of immediately trading with it to observe whether related market rise or
fall. If it appears that values are rising, the specialist will fill the order for his account and then
move his quotes up to limit his exposure to more buy orders. If it appears that values are falling,
the specialist will hope that a marketable sell order will arrive with which he can match the
stopped market buy order. Ready (1999) discusses these reasons in greater detail.
Specialists also may stop market orders to convey information about the book to the
trading crowd. Casual conversations with floor brokers and specialists indicate a high degree of
functional inter-dependence between them. Benveniste, Marcus and Wilhelm (1992) call it
“professional relationships.” Prior to June 1991, specialists were not allowed to share information
about the book with the trading crowd. But one way that they could still convey the imbalance in
4 The specialist is not obligated to reveal other traders’ interest in his quotes though he is prevented from tradingahead of them without improving prices (see McInish and Wood (1995)).

8
the book to the floor community was to stop a market order that arrives on the opposite side of
the imbalance. This argument suggests that the order stopping mechanism may benefit the floor
community at the expense of public traders who provide liquidity. It should be noted, however,
that market orders often receive price improvement in such cases.
We can empirically discriminate among the above reasons for stopping orders as they
imply different price-paths subsequent to stopping. The first reason implies no particular direction
for prices. If we assume that the specialist does not systematically stop the wrong orders, the
second motive implies that prices should drop following sell order stops and rise following buy
order stops. The third reason suggests the opposite. Specialists are likely to stop market buy
(sell) orders when the limit order book is heavy on the sell (buy) side.
2.3.2 Decision to trade
Having decided whether to stop the market order or not, the specialist then must decide
whether to trade with the order or not. Whether he has an option to trade or not depends on the
orders in his book and in the crowd.
If the specialist stops the order, he may trade with it only until a marketable order on the
other side arrives. At that time, the new order must be matched with the stopped order. If no
such order arrives, the Exchange requires that the specialist fill the stopped order after 30
minutes.
If the specialist does not stop the market order, he must match it with one or more limit
orders in his book (or in the crowd) or trade it himself. He can trade the order himself only at a
better price than the best price on his limit order book. If no limit order is in the book (or crowd)
at the specialist's quoted price, he must fill the incoming market order at his quoted price or
better, at least up to his quote size.
Whether the specialist wants to trade or not depends on his assessment of whether the
trade will prove to be profitable, on the effect the trade will have on the quantitative and
qualitative measures that the Exchange uses to evaluate his performance, and on the risks imposed
upon him by his current inventory position.
The expected profitability of the trade depends on the price at which he can trade and
upon any information that the specialist can extract from the order flow and from his limit order

9
book. With respect to the limit order book, we expect that the specialist will more likely trade if
he can buy when the limit order book is heavy on the buy side or sell when it is heavy on the sell
side. He will be less likely to trade when he must substantially improve price to do so. Since the
minimum price variation determines the minimum degree of price improvement necessary to
obtain precedence through price priority, it should be an important determinant of whether
specialists trade.
Exchange rules require that specialists trade to provide liquidity when no other traders are
willing to trade. Under these circumstances, specialists will tend to buy when the limit order
books are heavy on the sell side and sell otherwise.
Finally, specialists—like all dealers—do not like to have large inventory positions.
Therefore they are more likely to trade if they can buy when they are short of their desired
inventory or sell when they are long.
2.3.3 Decision to improve prices
Having decided to trade, the specialist then must decide whether to improve prices or not.
When the quotes reflect public orders, this decision is trivial: the specialist can trade only at
improved prices. Otherwise, the specialist may choose to trade at better than quoted prices to
improve his measured performance as a supplier of liquidity.
The ability to selectively improve prices after the arrival of a market order gives specialists
a distinct advantage in their competition with limit order traders. We expect that specialists will
improve prices more often when the book is highly asymmetric.
2.4 Hypotheses
We test two major hypotheses in this study. The first hypothesis examines the relation
between specialist trading decisions and asymmetry in the limit order book. The second
hypothesis examines whether relative tick size helps explain cross-sectional differences in
specialist trading decisions.
We break down the first hypothesis into three sub-hypotheses to examine each of the
specialist actions separately, namely, to stop, to trade with, and to improve prices in their trades
with SuperDOT market orders. If the limit order book is indeed informative about subsequent
price changes, then specialist actions should reflect that information. But exchange regulations

10
often constrain specialist actions. For example, exchange rules prohibit specialists from stopping
market orders in a minimum tick market.5 Also, public precedence rules prevent specialists from
trading ahead of limit orders at the same price.
To separate discretionary actions from non discretionary actions, we apply two tests on
every market order that reaches the specialist (see Appendix I). The tests are whether the
specialist is allowed to stop the order, and whether the specialist is allowed to participate without
improving the price. The results dictate whether the specialist has discretion in any of the three
actions that we discuss above or not. We describe the process in greater detail later in the paper.
The three actions and the two tests provide us with ten different scenarios to examine the
usefulness of the limit order book.
We expect that specialists are more likely to stop a market order, trade immediately, and
improve prices when they can trade in front of an order book that is heavy on the same side. For
example, the specialist is more likely to stop a market buy order if the book is heavy on the sell
side, than if the book is heavy on the buy side. Moreover, such actions based on information from
the book are more likely when they are discretionary in nature.
Furthermore, we expect the propensity of the specialist to act against limit order traders to
be inversely related to the relative tick size (tick size over price). In other words, specialists are
likely to take such actions more in higher-priced stocks than in lesser-priced stocks, given similar
market conditions including limit order book asymmetry. As discussed before, relative tick
measures the implicit cost to quote-matchers, and hence is important in the competition between
public providers of liquidity and floor traders including the specialist.
We now turn to the data we use for testing the above hypotheses.
3 Data
We use the NYSE Trades, Orders, Reports, and Quotes (TORQ) database for this study.
The TORQ database includes all trades, quotes and system orders for 144 randomly selected
5 Subsequent to March 1991 (after our sample), this rule was relaxed but only under certain conditions.

11
securities for the period November 1990 to January 1991.6 System orders include all orders
placed through the NYSE’s automated trading system, SuperDOT. Because non-system orders
are not in the database, we restrict our attention to only SuperDOT orders. The database also
includes audit trail information on the identity of the members behind each trade. We use this
information to identify specialist trades. Our cross-sectional analyses use market capitalization
and pre-sample daily prices taken from the CRSP database.
3.1 SuperDOT Market Order Sample
To construct our market order sample, we start with all orders marked as market orders in
the TORQ database. To these we add all limit orders that we identify as marketable limit orders.
We identify marketable limit orders by matching all limit orders with the prevailing quotes at the
time they arrived.7 Marketable limit orders are limit orders whose limit prices cross the quotes and
thereby make them immediately tradeable. We do not differentiate between marketable limit
orders and market orders.
We use three filters to narrow our sample. First, we include only standard buy and sell
orders. We do not examine short-sell orders or tick-sensitive orders since special rules govern
them. Second, we restrict our attention only to post-opening orders. Pre-opening orders are
filled in a batch market that is quite different from the subsequent continuous market. Finally, we
include only orders with matched contra-party audit information.
This last filter requires further explanation. The audit trail created by the Exchange includes
information about each trade from sources that include member firms and clearing agents.
Subsequent matching of buyers and sellers is accurate in most cases but not all. It is not
uncommon to find trades with unmatched or partially matched contra-parties. The latter case
arises when audit trail information exists only for part of a trade. Since contra-party identification
is crucial in flagging specialist participation, we include only market orders with full contra-party
6 The four files that form the TORQ data are: the Consolidated Transactions file (CT), the Consolidated Quotes file(CQ), the System Order Database file (SOD) and the Consolidated Audit Trail file (CD). For a detailed descriptionof the TORQ database, see Hasbrouck (1992).7 Studies that match trades to quotes often lag the quotes slightly because the quote revision process is often fasterthan the trade reporting process. (See Lee and Ready (1991).) Such lags are not necessary in this study becausewe match arriving orders to prevailing quotes. Since we study only system orders, chances of mismatch are low.

12
information in our sample. For all analyses that involve relative tick, we require the bid price
upon the arrival of the market order to be at least $1 to eliminate multiple tick sizes.
3.2 Limit Order Book Reconstruction
For each market order, we need to characterize the information contained in the limit
order book at the time it arrived. To do so, we reconstruct the limit order book for each stock as
in Kavejecz (1999).
The procedure involves several steps. First, from order cancellations and from trades that
had no corresponding submissions in the sample period, we infer all limit orders that were
submitted before the sample period. To these we add pre-opening orders submitted on the first
day of the sample period. We next identify all order submissions during each day of the sample
period. We then record trades and cancellations for each day respectively. Finally, we identify
standing limit orders at the time of arrival of each market order by including orders that were
submitted but not canceled or filled before the market order arrival.
The resulting limit order books include all system orders except those good-till-cancelled
orders that were placed before the start date of the sample and which were not executed or
cancelled during the sample period. In most cases, such orders would have been placed so far
from the market that they would not be very informative.
3.3 Valuing the Information in the Limit Order Book
To examine our hypotheses concerning specialist reliance upon their order books, we must
empirically characterize order book asymmetries. For this purpose, we need to reduce the
information in the order book to a single quantity that characterizes its asymmetry. Although we
can imagine many such measures, the best measure for our purpose is one that efficiently
summarizes information in the order book about trading options and future price changes. We
believe that such a measure should embody the following qualitative properties:
1. Larger orders are more informative than smaller orders.
2. Size offered close to the market is more informative than size offered far from the
market.
3. Orders that specialists expect to remain in the book for a long time are more
informative than those that they expect soon will be filled or cancelled.

13
4. All other things equal, buy and sell orders are equally informative.
5. All other things equal, orders are more informative when the market is volatile than
when it is stable.
Since limit orders are valuable trading options (see Copeland and Galai (1983)), we
believe that a measure patterned on an option pricing model is most appropriate. We therefore
arbitrarily chose to use the Black-Scholes option formula to characterize the values of the puts
and calls that buy and sell limit orders respectively offer to the market. Although the formula may
not accurately estimate the actual limit order option values, any estimation errors will likely
equally affect both buy and sell orders and therefore have little effect on our measure of
asymmetry.8
We construct our limit order book asymmetry measure by separately summing the option
values of all buy and sell limit orders in the book. The relative difference between these two
numbers (their difference divided by their average) is our measure of limit order book asymmetry.
Because this measure is based on an option pricing formula, it has all the desired qualitative
properties enumerated above.9
To apply the Black-Scholes formula, we must specify values for the various inputs.10 The
strike price is, of course, the limit price of the order. For the underlying security value, we take
the quotation midpoint.
We use the annualized 3-month Treasury bill rate as of October 31, 1990 for the risk-free
interest rate. The assumed interest rate has essentially no impact on the results since the short
8 The Black-Scholes formula may not accurately represent limit order option values because its derivation is basedon arbitrage and price continuity assumptions that are not reasonable in microstructure applications.9 We used alternatives to characterize the asymmetry in the book such as the difference in modal depth. Modaldepth represents the cumulative quantity offered or bid at prices that would produce the modal spread (or a
multiple of it) for the security in the sample. The measure we used was Q QO B− , where O and B represent offer
and bid prices such that O-B = n*modal spread and n=(1,2, …). Because our results did not vary, we use Black-Scholes option value difference to characterize the asymmetry in the limit order book.10 The Black-Scholes value for a call option is given by:
S N K e NrT* ( ) * ( ),d1 d2− −
where S is the stock price, K is the strike price, r is the annualized risk-free rate, T is the time to maturity in years,
and N(.) is the cumulative standard normal density. Further, d1=ln(
S
K and d2 = d1-) ( / )
.+ +r T
TT
σ
σσ
2 2 The
14
time intervals involved ensure that it has little effect on the option values. Moreover, any bias in
option values that might be caused by using the wrong interest rate will have equal and opposite
effects on the buy and sell orders and therefore should have no systematic effect on our results.
We estimate volatility for each stock by the its annualized daily return variance measured
over the twelve months preceding the sample. Although the volatility assumption substantially
affects the level of the option value estimates, the effects are symmetric on both sides of the
market. Although we might be able to estimate more precise absolute option values by using a
time-varying volatility model, we do not expect that the additional detail would significantly
change the results, which depend on relative option values.
The most important assumption we make concerns the time to maturity. Unlike options
contracts, limit orders do not expire at any set time. Instead, they stand until they are filled, are
cancelled, or are no longer valid. To compute limit order option values at the Australian Stock
Exchange, Jarnecic and McInish (1997) assume arbitrary maturities (5 minutes, 30 minutes and so
on) for all limit orders. However, when limit orders are removed from the book depends on their
prices, sizes and validity instructions (day or good-till-canceled), and also on current market
conditions. Since specialists undoubtedly are aware of these relations, we must model them to
better understand how specialists use information in their limit order books. Lo, Mackinlay and
Zhang (1997) use survival analysis techniques to estimate an economic model for the life of a limit
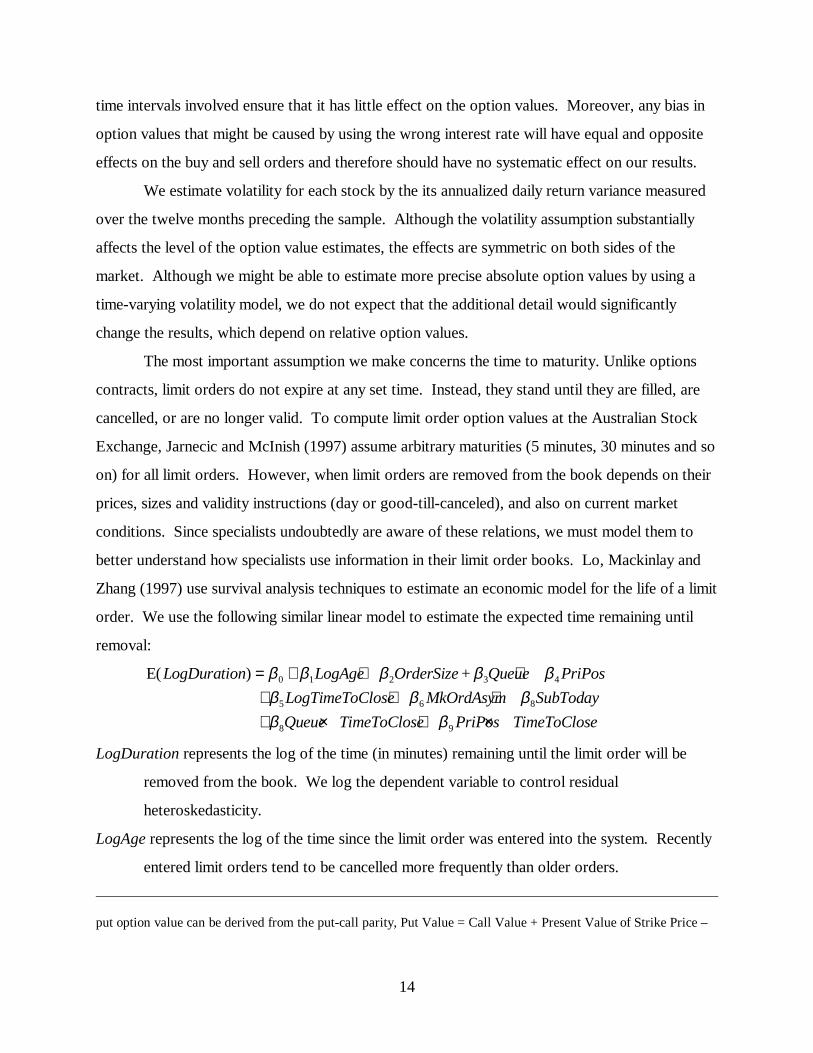
order. We use the following similar linear model to estimate the expected time remaining until
removal:
E( ) +LogDuration LogAge OrderSize Queue PriPos
LogTimeToClose MkOrdAsym SubToday
Queue TimeToClose PriPos TimeToClose
= + + ++ + ++ × + ×
β β β β ββ β ββ β
0 1 2 3 4
5 6 8
8 9
LogDuration represents the log of the time (in minutes) remaining until the limit order will be
removed from the book. We log the dependent variable to control residual
heteroskedasticity.
LogAge represents the log of the time since the limit order was entered into the system. Recently
entered limit orders tend to be cancelled more frequently than older orders.
put option value can be derived from the put-call parity, Put Value = Call Value + Present Value of Strike Price –
15
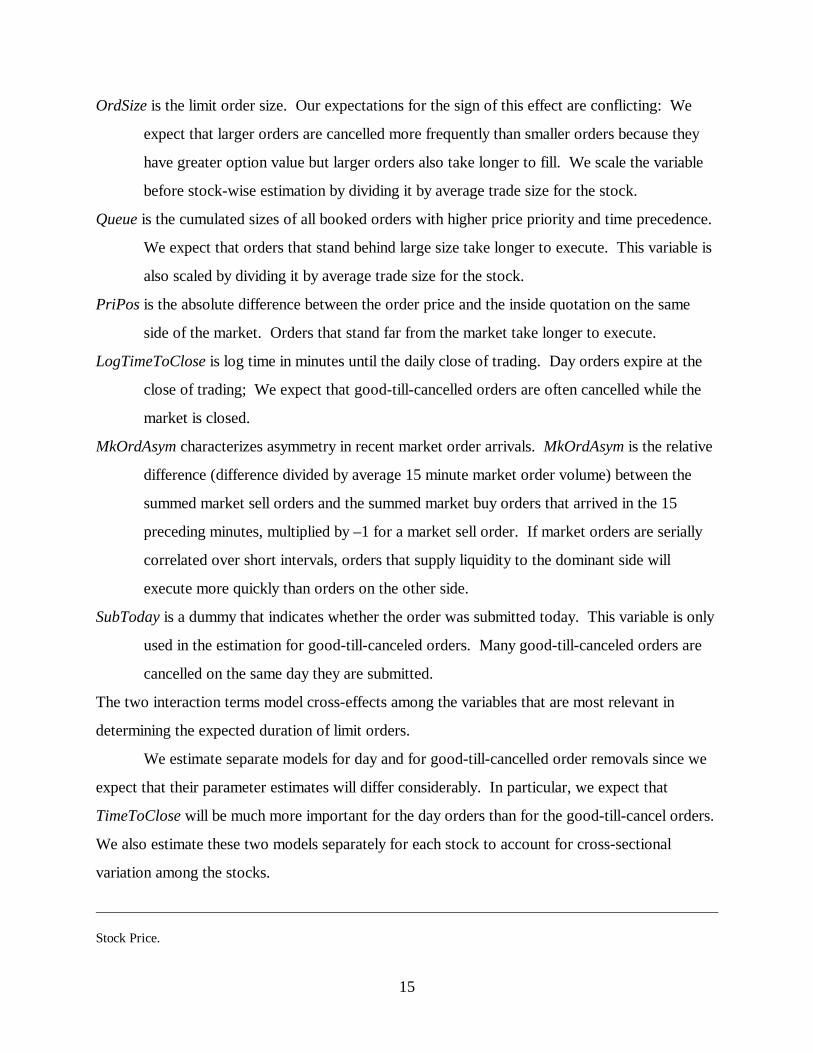
OrdSize is the limit order size. Our expectations for the sign of this effect are conflicting: We
expect that larger orders are cancelled more frequently than smaller orders because they
have greater option value but larger orders also take longer to fill. We scale the variable
before stock-wise estimation by dividing it by average trade size for the stock.
Queue is the cumulated sizes of all booked orders with higher price priority and time precedence.
We expect that orders that stand behind large size take longer to execute. This variable is
also scaled by dividing it by average trade size for the stock.
PriPos is the absolute difference between the order price and the inside quotation on the same
side of the market. Orders that stand far from the market take longer to execute.
LogTimeToClose is log time in minutes until the daily close of trading. Day orders expire at the
close of trading; We expect that good-till-cancelled orders are often cancelled while the
market is closed.
MkOrdAsym characterizes asymmetry in recent market order arrivals. MkOrdAsym is the relative
difference (difference divided by average 15 minute market order volume) between the
summed market sell orders and the summed market buy orders that arrived in the 15
preceding minutes, multiplied by –1 for a market sell order. If market orders are serially
correlated over short intervals, orders that supply liquidity to the dominant side will
execute more quickly than orders on the other side.
SubToday is a dummy that indicates whether the order was submitted today. This variable is only
used in the estimation for good-till-canceled orders. Many good-till-canceled orders are
cancelled on the same day they are submitted.
The two interaction terms model cross-effects among the variables that are most relevant in
determining the expected duration of limit orders.
We estimate separate models for day and for good-till-cancelled order removals since we
expect that their parameter estimates will differ considerably. In particular, we expect that
TimeToClose will be much more important for the day orders than for the good-till-cancel orders.
We also estimate these two models separately for each stock to account for cross-sectional
variation among the stocks.
Stock Price.

16
We composed the samples used to estimate the models as follows: At fifteen minute
intervals from 9:45 AM through 4:00 PM on each trading day and for each stock, we reconstruct
the limit order book as described above. We then identify and include in the estimation sample all
standing limit orders that subsequently were removed from the book during the sample.11
Having estimated the expected remaining duration of each limit order, we compute the
Black-Scholes option values of all standing orders in the book at the arrival time of each market
order. From these we then compute our measure of order book asymmetry,
OrdBookAsym =
+
− ∑ ∑∑ ∑
= == =
b sb s N
i
N
jj
sji
bi
N
i
N
jj
sji
bi SVSVSVSV
1 11 1
,
where V is the Black-Scholes option value per share, S is the outstanding order size, and the
superscripts b and s represent buy and sell orders respectively. OrdBookAsym characterizes
asymmetry in the limit order book by weighting limit orders by their option values. We will use it
to predict price future changes and to explain specialist trading decisions.
3.4 Identifying Specialist Trades
The TORQ database does not explicitly identify specialist trades. Instead, we infer them
using an algorithm originally developed by Edwards (1999) and later refined by Panchapagesan
(1998). The idea behind the algorithm is straightforward. The TORQ data include detailed
information taken from the NYSE CAUD (Equity Consolidated Audit Trade File) audit trail data
base about the identities of most traders that participated in each trade. However, certain trader
identities, including those of the specialists, are omitted from TORQ. The omission of a trader
identity code therefore may indicate that a specialist participated in the trade. Although trader
identities may be omitted for other traders as well, certain other tests allow us to confidently infer
most specialist trades. A complete description of our algorithm and measures of its efficiency
appear in Panchapagesan (1998).
11 Since the sample does not include orders that were removed from the book after the end of our sample period,we underestimate time-to-removal for long-standing good-till-cancelled orders placed far from the market. Sincethese orders are not very common and since orders standing far from the market usually do not have significantoption values, we do not expect that this selection bias will significantly affect the results.

17
We use the algorithm to identify all specialist trades with SuperDOT market orders in the
TORQ data.12 We also use it to measure specialist inventories by summing all signed specialist
trades. Since we do not observe opening inventories, we cannot estimate the actual inventory
levels. Our measure, however, is sufficient to estimate the changes in inventory levels that are
relevant to our analyses.
4 Empirical Results
4.1 Descriptive Statistics
Table 1 summarizes specialist trades in SuperDOT market orders and marketable limit
orders as identified by our specialist trade identification algorithm. In the TORQ sample,
SuperDot traders submitted more marketable buy orders than marketable sell orders, whether
measured by numbers of orders or by total share volume. Specialists, accordingly, sold more than
they bought when trading with SuperDOT marketable orders. Their participation rates (weighted
by the number of stock observations) were also higher for buy orders than sell orders. These
results are consistent with their role as liquidity suppliers. The specialists during this period either
divested inventory or they bought more from floor traders than they sold to them. These results
are robust across stocks classified by average number of trades and across orders classified by
size.13
As expected, specialists participate more in less less actively traded stocks reflecting a
greater role for dealers in these stocks. This result is consistent with many previous studies that
identify the importance of dealers for illiquid stocks.
Our simple linear model of limit order durations explains 43 percent of the variation in the
remaining time that day limit orders spend in the book, on average, across all TORQ stocks
(Table 2). Although not all the estimated coefficients are significant in each stock, most have the
expected sign and many are statistically significant. Among those estimates that do not have the
12 The audit information is incomplete for trades reported by other exchanges. This algorithm will therefore notcapture trades of NYSE specialists routed through other exchanges. However, such trades are likely to constitute alow percentage of their total trades.13 Other measures of trading activity such as dollar volume produce similar results.
18
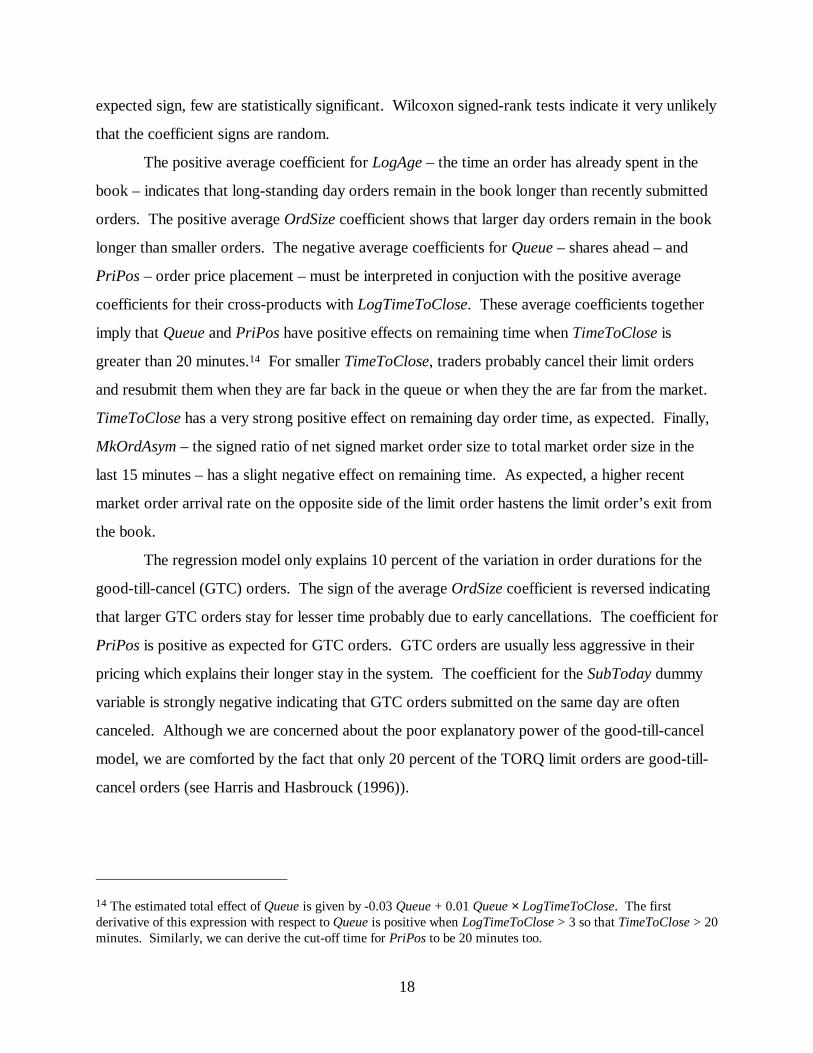
expected sign, few are statistically significant. Wilcoxon signed-rank tests indicate it very unlikely
that the coefficient signs are random.
The positive average coefficient for LogAge – the time an order has already spent in the
book – indicates that long-standing day orders remain in the book longer than recently submitted
orders. The positive average OrdSize coefficient shows that larger day orders remain in the book
longer than smaller orders. The negative average coefficients for Queue – shares ahead – and
PriPos – order price placement – must be interpreted in conjuction with the positive average
coefficients for their cross-products with LogTimeToClose. These average coefficients together
imply that Queue and PriPos have positive effects on remaining time when TimeToClose is
greater than 20 minutes.14 For smaller TimeToClose, traders probably cancel their limit orders
and resubmit them when they are far back in the queue or when they the are far from the market.
TimeToClose has a very strong positive effect on remaining day order time, as expected. Finally,
MkOrdAsym – the signed ratio of net signed market order size to total market order size in the
last 15 minutes – has a slight negative effect on remaining time. As expected, a higher recent
market order arrival rate on the opposite side of the limit order hastens the limit order’s exit from
the book.
The regression model only explains 10 percent of the variation in order durations for the
good-till-cancel (GTC) orders. The sign of the average OrdSize coefficient is reversed indicating
that larger GTC orders stay for lesser time probably due to early cancellations. The coefficient for
PriPos is positive as expected for GTC orders. GTC orders are usually less aggressive in their
pricing which explains their longer stay in the system. The coefficient for the SubToday dummy
variable is strongly negative indicating that GTC orders submitted on the same day are often
canceled. Although we are concerned about the poor explanatory power of the good-till-cancel
model, we are comforted by the fact that only 20 percent of the TORQ limit orders are good-till-
cancel orders (see Harris and Hasbrouck (1996)).
14 The estimated total effect of Queue is given by -0.03 Queue + 0.01 Queue × LogTimeToClose. The firstderivative of this expression with respect to Queue is positive when LogTimeToClose > 3 so that TimeToClose > 20minutes. Similarly, we can derive the cut-off time for PriPos to be 20 minutes too.
19
4.2 Is the Limit Order Book Imbalance Informative?
If future price changes can be predicted from information about limit order book
asymmetries, it would be surprising if specialist did not use this information when they make
trading decisions. The analyses presented in this section show that our limit order imbalance
measure, OrdBookAsym, does contain information about future price changes.
Using three time intervals (5 minutes, 1hour and 1 day) to compute future and past
returns, we estimate a linear regression model of future transaction price returns based on past
returns and our imbalance measure. We use the arrival times of SuperDOT market orders as the
benchmark times from which the future and past returns are computed. We use past returns as an
explanatory variable to capture the return mean reversion that is well documented for short
horizon transaction price returns. Finally, to control residual variation and thereby produce a
stronger test, we also include an indicator of whether the incoming market order was a buy or sell
order. If the sequence of market order sides is highly autocorrelated (buy orders follow buy
orders and sell order follow sell orders), the coefficient estimate on this dummy variable should be
positive. If the sequence of market order sides is random, bid/ask bounce should cause the
dummy coefficient estimate to be negative.
The results (Table 3) show that order book asymmetry has some explanatory value over
short time horizons, especially for active stocks. The asymmetry measure coefficient estimate is
significantly positive in more than a third of the stocks examined at five minute intervals. A
positive coefficient indicates that a buy-side heavy book forecasts future price increases. The
percentage of stocks with positive coefficients is higher for actively traded stocks than less active
stocks indicating a more active role for value traders in these stocks. At longer time horizons, the
asymmetry measure is less informative. This result suggests that order book imbalances convey
information about price movements only in the short-run. As expected, evidence for return mean
reversion is strong: the coefficient for lag returns is negative and significant in most stocks. The
market order side dummy is significantly positive indicating a strong autocorrelation in order
flow.

20
4.3 Limit Order Imbalances and Specialist Discretionary Actions
The above results show that specialists may indeed have an informational advantage by
from their exclusive access to the limit order book. We now consider whether specialists use their
information about limit order book imbalances.
4.3.1 Quotation Revisions
Specialists frequently revise their quotes following market order arrivals. These revisions
may depend on asymmetries in their limit order books. We therefore analyze whether limit order
book imbalances predict quote revisions.
Using methods nearly identical to those used in the previous analysis, we estimated a
linear regression model of future quotation midpoint returns based on past midpoint returns, our
order book imbalance measure, the market order side indicator, and an indicator for whether the
order was stopped. The last variable was added as specialists frequently revise their quotations to
reflect a stopped order. We expect that order book imbalances have a positive effect of quote
revisions. In particular, if the buy side is strong, we expect that quotes will be revised upward,
and vice versa for a strong sell side. Adverse selection spread theories (see Glosten and Milgrom
(1985)) predict that the market order indicator should also have a positive effect on quote revision
as specialists learn from their order flow.
The results (Table 4) are very similar to the results in Table 3. The order imbalance
variable is positive and significant in the short run in more than a third of all stocks and more than
half of all active stocks examined. Surprisingly, the stop dummy is not significant. Since the
model does not distinguish between stopping buy and sell orders, it could very well be the case
that prices move predictably in opposite directions following buy order stops and sell order stops.
This opposite movement could wash away any effect of stopping on the stock’s return.
4.3.2 Trading Decisions
In this section we use logit analyses to determine whether specialist trading decisions
made when an incoming SuperDot market order arrives depend on imbalances in their limit order
books. We consider the following three decisions:

21
1. Did they stop the order?15
2. Did they participate in the order?
3. Did they improve price?
We can learn about specialist trading decisions only by examining situations where they
could choose among two or more alternatives. In many cases, Exchange regulations limit the
actions that specialists can take. Our analyses therefore are conditioned on the following two
tests:
A. Could the specialist stop the incoming market order? Before March 1991 (and hence,
relevant to our study), specialists could stop market orders only when the quoted
spread was greater than the minimum tick for that security.
B. Could the specialist participate in the incoming market order without improving the
quoted price? If booked limit orders are at the best quoted price, and if their
aggregate size is larger than the incoming market order, the public order precedence
rule requires that the specialist improve price to trade the order.
Following the arrival of a market order, the specialist decides what to do by applying the two tests
and the three decisions in the following sequence:
Test A Can I stop? (Is the spread greater than one tick?)
Decision 1 Do I stop?
Test B Can I trade without improving price? (Does order book size at the
best quote have precedence?)
Decision 2 Do I trade?
Decision 3 Do I improve price?
The outcomes of some tests and of some decisions prelude future decisions. For example, if the
specialist cannot participate without improving price (Test B) then the decision to participate
(Decision 2) implies price improvement (Decision 3). Likewise, if the specialist cannot stop the
order (Test A), then it is implied that the specialist did not stop the order (Decision 1).
15 SuperDOT market orders are presumed always carry a ‘try to stop’ request, while floor-generated market orderscan be stopped only with the permission of the floor broker. Since our study involves only SuperDOT marketorders, the decision to stop the order lies exclusively with the specialist.

22
These various considerations imply the ten conditional decision models listed in Appendix
I. We estimate each of these models using all incoming SuperDot market orders that met the
various conditions upon which the decisions were made.
4.4 Sequential Logit Models of Specialist Discretionary Actions
We analyze each conditional decision using a logit model. We use relative order size,
excess spread, signed inventory and signed order book asymmetry as explanatory variables.
Relative size refers to the logarithm of the ratio of order size to the quote size, which is offered
size for a buy order and bid size for a sell order. Excess spread is the excess of spread over the
minimum tick, and is expressed in number of ticks. Signed inventory is the specialist inventory
variable that we construct using specialist trades multiplied by –1 if the market order is a sell
order. We construct this variable using all specialist trades (including non-SuperDot trades) but
we do not know their beginning of sample inventories. Fortunately, the model intercept captures
the effect of the omitted opening inventory. Signed order book asymmetry is our asymmetry
measure OrdBookAsym multiplied by –1 if the market order is a buy order. Both inventory and
imbalance variables are signed to provide positive coefficients if specialists indeed act to re-
balance their inventory or exploit their information about order imbalances.
Looking at the ten models listed in Appendix I, it is obvious that they are nested within
each other (see Figure 1). Such sequential logit models can be estimated as a series of binary logit
models. A key point to note is that the probability of choice at each stage is independent of the
probability of the choice at other stages (see Maddala (1983)). However, the actual sequence
used for estimation could be one of several possible sequences including a reverse of what is being
used, making them fairly robust to the choice of sequence. All these models are estimated
individually for stocks eliminating the need to control for differences across specialists. As such,
the estimates for active stocks are more reliable than those of less active stocks because of the
larger number of observations used for estimation.
Table 5 presents results of the sequential logit models. Panel A summarizes results when
exchange regulations allow the specialist to stop the order. In other words, the spread at the time
of the arrival of the market order was greater than one tick. This was true for 32 percent of all
market orders in the sample. Panel B summarizes results for the remaining 68 percent of orders in

23
the sample. Models 1 to 7 in Panel A examine the three specialist actions (to stop, to trade and to
improve price) under different outcomes laid out in Appendix I. We estimate the model
individually for stocks and then present percentages of significant negative and positive
coefficients.
For a fifth of all stocks, the specialist stopped market orders from hitting the side of the
book that was heavy on average. The numbers were distinctly higher for active stocks as opposed
to less active stocks. There are two reasons why this is the case. The first reason has to do with
the smaller number of observations used for estimation. The limit order book, for such stocks, is
more likely to be thin or comprise of orders placed far away from the market (where the option
has no or little value). The second reason is because limit order imbalances in less active stocks
are less informative as well as shown in Table 3. For more active stocks, the percentage of stocks
in which the specialist stopped market orders from hitting the limit order book jumps to 37
percent. This suggests that it is not the lack of liquidity in the book that induces specialists to
stop market orders.
The coefficients of relative order size and excess spread are as expected. The specialist
stops market orders when the spread is large, which is not surprising given the affirmative
obligations of the specialist. The relative size variable, which measures the order size relative to
the existing quote size, is negative for most stocks. This suggests that larger orders are less likely
to be stopped than smaller orders. This is not surprising given that specialists have to trade with
the stopped orders if they do not trade within a specified time. Large orders are more likely to
cause severe inventory imbalances for the specialist, making it more expensive to offset them
subsequently. The signed inventory variable is not significant in most of the stocks, indicating that
inventory is not an important factor in the decision to stop a system market order.
Once the order is stopped, subsequent decisions by the specialist to participate or to
improve price are unaffected by limit order book asymmetry (Models 2, 3 and 4). Increased
competition from the floor may very well limit the role of the specialist after a market order has
been stopped. Alternatively, specialists may indicate asymmetry in the book to the trading crowd
by stopping market orders. Though market orders may gain through price improvement, limit
order traders lose by not trading.

24
But what happens when the specialist chooses not to stop the market order? Clearly, we
find evidence of specialist actions that are correlated to information from the limit order book.
The evidence is stronger when the specialist is constrained by the exchange from trading without
improving price. In fact, in a little more than a quarter of all active stocks, the specialist chooses
to trade in front of a limit order book that is heavy on the same side. Not surprisingly, more than
a third of active stocks have positive coefficients for the excess spread variable, indicating that
spreads are wide enough for the specialist to improve upon. The results are similar though less
significant when the specialist could trade without improving price. These results are consistent
with Ready (1999) who finds that market orders immediately traded by the specialist happen to be
more profitable ex-post (for limit orders if they had traded instead of the specialist) than orders
not immediately traded.
Another interesting result is that specialists are more likely to trade with larger orders but
less likely to improve prices for them than smaller orders. Specialists are often required to fill the
balance if the large market order is not filled in entirety by the book or by the crowd. This
suggests a high specialist participation rate in large orders even though the specialist’s actual
commitment is often restricted to a few hundred shares. Inventory, on the other hand, does not
seem to affect specialist behavior in any significant way.
Panel B presents results of specialist actions when they are not allowed to stop the market
order. Note that this was unique to the period we examine; Subsequent to March 1991,
specialists are allowed to stop market orders even in a minimum tick market. Active stocks are
more likely to trade in a minimum tick market than less active stocks. In fact, 92 percent of all
orders that were entered in a minimum tick market were in the very active stocks. Therefore,
results for the active stocks are more likely to be economically meaningful.
When the specialist can participate without having to improve price, we find more active
specialist participation in front of a heavy limit order book. Specialists in active stocks trade
ahead of a limit order book that is heavy on the same side in 30 percent of the stocks, which is
five times more than when they trade ahead of a limit order book is heavy on the opposite side.
However, when the specialist is constrained to improve price if he has to trade, he is only twice as
likely to trade ahead of a limit order book that is heavy on the same side over a limit order book

25
that is heavy on the opposite side. As before, specialists are more likely to trade with larger
orders than smaller order.
To sum up, we find evidence of specialist actions that seem to use information from the
limit order book to the detriment of limit order traders. On the other hand, specialists face
affirmative obligations that may erode some of this advantage. Since we do not focus on their
obligations, we refrain from making overall evaluation of the specialist system. Aside of the limit
order book information, relative order size and spread seem to influence specialist’s choice of
actions. Inventory does not seem to be an important factor, a fact that is consistent with many
previous studies (see Madhavan and Panchapagesan (1999)).
These regressions do not highlight the cross-sectional differences in specialist actions that
are also equally important. Harris (1990) discusses the importance of a security’s relative tick
size (tick size over price) to liquidity providers of that security. A higher relative tick size makes
it difficult for traders, including the specialist, to capture option values inherent in limit orders
through quote-matching. In the next section, we examine whether relative tick affects specialist
discretionary actions.
4.5 Cross-sectional Analyses of Specialist Discretionary Actions
To see whether relative tick size impacts option values of limit orders, we examine
specialist discretionary actions cross-sectionally after controlling for effects described in the
previous section. We use the intercept of the models described in Table 5 to capture cross-
sectional propensity of specialists to undertake actions described above. Since the models are
estimated for each and every stock, the intercept captures the underlying propensity of the
specialist in that stock to stop, or to trade, or improve price. We then run a weighted-OLS
regression for each of ten models in Appendix I using the intercept as the dependent variable, and
market capitalization, daily return standard deviation, and relative tick as the independent
variables. Because the intercepts are estimated with error, we use one over their standard error
from the logit regressions as our weights in the OLS regression.
Market capitalization is measured as on October 31, 1990, the last day of the pre-sample
period, and is in millions of dollars. We use daily return standard deviation of log close-to-open
returns to measure volatility. We believe volatility to capture some of the variations in specialist

26
actions across stocks. Relative tick is the ratio of tick size over the average price of the security
in the sample period.
If relative tick matters in the competition between limit orders and floor traders, then it
should be evident in the cross-sectional regressions, especially in models 1, 4, 7 and 10. These
models involve specialist actions that are more likely to be discretionary than otherwise.
Specialists are more likely to act against limit orders when the relative tick is small. This suggests
a negative coefficient for relative tick in the regressions.
Table 6 presents results of the cross-sectional regressions. In models 1 and 10, the
coefficient for the relative tick is negative and significant. This suggests that specialists are more
likely to stop, or trade in front of limit orders that provide the best quote in the market in stocks
with low relative tick than in stocks with high relative tick. This is consistent with the argument
by Harris (1990) that quote matching is more likely in stocks with low relative ticks. Unlike
trading for their account, specialists do not seem to gain personally from stopping market orders.
However, the trading crowd is likely to benefit at the expense of limit order traders, indicating
“professional relationships” on the floor as discussed in Benveniste, Marcus and Wilhelm (1992).
The coefficient for relative tick is however not significantly different from zero in models 4
and 7. Since these models require spreads to be at least two ticks, it is likely that they are
weighted more by orders in lesser active stocks. Specialists are evaluated by different factors
such as price stabilization and liquidity that may limit their ability to act upon their information,
especially in less active stocks. Hence, even though the limit order book might set the inside
quote, the specialist may often trade to narrow the quotes irrespective of his order book
information.
While the coefficient for market capitalization is mostly positive and significant indicating
that specialists prefer larger stocks to smaller stocks, the coefficient for daily return standard
deviation is largely insignificant. This suggests that transitory order imbalances rather than
fundamental price volatility influence specialist behavior.
5 Conclusions
Specialists compete with limit orders for the provision of liquidity at the New York Stock
Exchange. Though the exchange uses a variety of mechanisms to make it a fair competition,

27
specialists have one unique advantage. They know the expressed trading interest of all traders,
while a limit order trader only knows about his own order. If the aggregate order information is
valuable, then specialists can profit from them through selective participation in trades, thereby
exacerbating the adverse selection problem for limit orders. In this paper, we examine for the first
time whether the limit order book is informative, and whether specialists use this information in
their discretionary actions. By discretionary actions, we mean all actions that the specialist is not
required to take as part of his obligations to the exchange.
We find that the limit order book is informative about imminent price changes, especially
in the short-run. We also find strong evidence that the specialist uses this information in his
decision to stop a market order, or trade with it. The results are stronger for active stocks where
the competition between the specialist and the limit orders is more intense. We also find that
specialists in lower-priced stocks are less likely to take such discretionary actions because of the
binding tick size as suggested by Harris (1990).
Though we find that the specialist uses information from the limit order book, we do not
address the broader issue of whether such information should be made transparent to all traders.
It may be the case that the specialists are given this advantage, as compensation for meeting their
exchange obligations such as providing liquidity when there is none available. We leave this issue
for future research, as it requires an analysis of the cost of such obligations that was beyond the
scope of this study.

28
References
Abolafia, Mitchel, 1996, Making Markets: Opportunism and Restraint on Wall Street (HarvardUniversity Press, Cambridge).
Amihud, Yakov and Haim Mendelson, 1990, Option Market Integration: An Evaluation, Workingpaper, New York University.
Benveniste, Lawrence, Alan Marcus and William Wilhelm, 1992, What’s Special About theSpecialist? Journal of Financial Economics 32, 61-86.
Blume, Marshall and Michael Goldstein, 1997, Quotes, Order Flow and Price Discovery, Journalof Finance 52, 221-244.
Chan, Yuk-Shee and Mark Weinstein, 1992, Reputation, Bid-Ask Spread and Market Structure,Working paper, University of Southern California.
Copeland, Tom and Dan Galai, 1983, Information Effects on the Bid-Ask Spread, Journal ofFinance 38, 1457-1469.
Edwards, Amy K., 1999, NYSE Specialists Competing with Limit Orders: A Source of PriceImprovement, Working paper, Securities Exchange Commission.
Glosten, Lawrence and Paul Milgrom, 1985, Bid, Ask and Transaction Prices in a SpecialistMarket with Heterogeneously Informed Traders, Journal of Financial Economics 14, 71-100.
Goldstein, Michael and Kenneth Kavejecz, 1998, Eighths, Sixteenths and Market Depth: Changesin Tick Size and Liquidity Provision on the NYSE, Working Paper, University ofColorado at Boulder.
Harris, Lawrence E., 1990, Liquidity, Trading Rules and Electronic Trading Systems, New YorkUniversity Salomon Center Monograph Series in Finance, Monograph 1990-4.
Harris, Lawrence E., 1998, Does a Large Minimum Price Variation Encourage Order Exposure?,Working paper, University of Southern California.
Harris, Lawrence and Joel Hasbrouck, 1996, Market vs. Limit Orders: The SuperDOT Evidenceon Order Submission Strategy, Journal of Financial and Quantitative Analysis 31, 219-232.
Hasbrouck, Joel, 1992, Using the TORQ Database, Working paper, New York Stock Exchange,Inc.
Hasbrouck, Joel and George Sofianos, 1993, The Trades of Market Makers: An EmpiricalAnalysis of NYSE Specialists, Journal of Finance 48, 1565-1594.
Hasbrouck, Joel, George Sofianos, and Deborah Sosebee, 1993, New York Stock ExchangeSystems and Trading Procedures, Working paper, New York Stock Exchange, Inc.
Jarnecic, Elvis and Thomas McInish, 1997, An Empirical Investigation of the Option Value of theLimit Order Book on the Australian Stock Exchange, Working paper, University ofSydney.

29
Kavejecz, Kenneth, 1999, A Specialist’s Quoted Depth and the Limit Order Book, Journal ofFinance 54, 747-771.
Lee, Charles and Mark Ready, 1991, Inferring Trade Direction from Intraday Data, Journal ofFinance 46, 733-746.
Lo, Andrew W., A. Craig MacKinlay and June Zhang, 1997, Econometric Models of Limit-OrderExecutions, Working paper, MIT Laboratory for Financial Engineering.
Maddala, G. S., 1983, Limited Dependent and Qualitative Variables in Econometrics(Cambridge University Press, Cambridge).
Madhavan, Ananth and Venkatesh Panchapagesan, 1999, Price Discovery in Auction Markets: ALook Inside the Black Box, Review of Financial Studies, forthcoming.
Madhavan, Ananth, and Seymour Smidt, 1993, An Analysis of Changes In Specialist Quotes andInventories, Journal of Finance 48, 1595-1628.
Madhavan, Ananth, and George Sofianos, 1998, An Empirical Analysis of NYSE SpecialistTrading, Journal of Financial Economics 48, 189-210.
McInish, Thomas and Robert Wood, 1995, Hidden Limit Orders on the NYSE, Journal ofPortfolio Management Spring 1995, 19-26.
New York Stock Exchange, 1991, New York Stock Exchange Fact Book (New York StockExchange, New York).
New York Stock Exchange, 1990, Constitution and Rules (Commerce Clearing House, Inc.Chicago, Illinois).
Panchapagesan, Venkatesh, 1998, Identifying Specialist Trades in the TORQ Data – A SimpleAlgorithm, Working paper, Washington University in St. Louis.
Ready, Mark, 1999, The Specialist’s Discretion: Stopped Orders and Price Improvement, Reviewof Financial Studies, forthcoming.
Rock, Kevin, 1998, The Specialist’s Order Book and Price Anomalies, Review of FinancialStudies, forthcoming.
Seppi, Duane J., 1997, Liquidity Provision with Limit Orders and a Strategic Specialist, Review ofFinancial Studies 10, 103-150.
Sofianos, George, 1995, Specialist Gross Trading Revenues at the New York Stock Exchange,Working paper, New York Stock Exchange, Inc.
Sofianos, George, and Ingrid Werner, 1997, The Trades of NYSE Floor Brokers, NYSEWorking paper 97-04, New York Stock Exchange, Inc..

30
Table 1Specialist Trades with SuperDOT Market and Marketable Limit Orders
This table presents summary statistics of specialist trades with SuperDOT market orders and marketable limit orders for all 144 stocksin the TORQ database between the period November 1, 1990 and January 31, 1991. Only standard non-opening buy and sell orderswith matched contra-party information in the audit file are included. Specialist trades are identified using the algorithm presented inPanchapagesan (1998). We use the average daily number of trades to classify stocks into three trading groups. Mean specialistparticipation percentage for a decile is the weighted average of the individual stocks’ percentages using the number of market orders foreach stock as weights. SE represents the cross-sectional standard error. Panel B classifies specialist participation percentages of dollarvolume based on the size of market orders they trade with.
Panel A: Overall StatisticsBuy Orders Sell Orders
Number of Orders Dollar Volume Number of Orders Dollar VolumeAll
Orders(N)
SpecialistParticipation
%
AllOrders($000)
SpecialistParticipation
%
AllOrders
(N)
SpecialistParticipation
%
AllOrders($000)
SpecialistParticipation
%Mean SE Mean SE Mean SE Mean SE
All Stocks 204,538 22.6 0.9 5,110,972 18.4 0.9 172,840 20.3 0.9 4,090,448 17.1 0.8Trading activitygroups
Less Active 3,547 42.7 2.9 24,612 36.5 2.8 4,985 32.7 2.8 26,479 27.0 2.7
ModeratelyActive
20,130 38.1 2.1 167,574 33.8 2.1 18,140 31.4 2.4 157,205 28.3 2.2
Very Active 180,861 20.5 1.2 4,918,786 16.3 1.0 149,715 18.5 1.3 3,906,763 15.4 1.0

31
Table 1 (Continued)
Panel B: Specialist Participation At Different Order Sizes (of Dollar Volume)Specialist Participation % Specialist Participation % Specialist Participation %
≤ 1,000 Shares 1,001-10,000 Shares ≥10,000 SharesBuy Sell Buy Sell Buy Sell
Mean SE Mean SE Mean SE Mean SE Mean SE Mean SEAll Stocks 17.3 0.9 15.2 0.9 17.6 0.8 17.3 0.8 12.6 1.4 17.9 2.8
Trading activitygroupsLess Active 39.3 2.8 13.3 1.1 26.9 3.2 21.8 2.4 14.8 21.0 0.0 0.0
ModeratelyActive
34.2 1.9 27.7 2.2 25.9 2.5 23.8 2.6 10.1 7.3 12.9 6.8
Very Active 15.0 1.1 13.3 1.1 16.5 1.0 16.2 1.1 12.6 1.4 18.7 3.2

32
Table 2Regression Estimates of the Time Remaining to Removal of SuperDOT Limit Orders
This table presents summary statistics of the OLS estimates of a regression model for the log time remaining until removal (in minutes) ofstanding limit orders. Orders are removed from the order book through execution, cancellation or expiration. The model is estimatedseparately for day orders and good-till-canceled orders for each stock using TORQ data sampled at 15-minute time intervals betweenNovember 1, 1990 and January 31, 1991. The independent variables are: LogAge, the logarithm of time already spent in the system bythe limit order (in minutes), OrdSize, the order size relative to average trade size for the stock (in shares), Queue, the number of sharesthat are ahead of the limit order in price and time priority relative to the average trade size for the stock, PriPos, the price position of theorder relative to the market (bid for a buy order and ask for a sell order) expressed in ticks, LogTimeToClose, the logarithm of time (inminutes) remaining till market-close (only for day orders), MkOrdAsym, the ratio of the difference between market sell (buy) orders andmarket buy (sell) orders in the preceding 15 minutes over average market order volume for a limit buy (sell) order, and SubToday, thedummy variable that is one, if the order was submitted today. The mean estimate is computed over all stocks. The last two columnsreport percentages of stocks with statistically significant coefficients measured at the 5% level under a two-sided test.
A. Day Orders
StandardPercentage of Stocks with Coefficients
VariableMean
EstimateError of
Mean Negative PositiveSignificantly
NegativeSignificantly
PositiveWilcoxon Signed Rank Test forHo: Coefficient = 0
Intercept -0.24 0.04 66% 34% 48% 12% Accept
LogAge 0.17 0.01 1 99 1 92 Reject
OrdSize 0.03 0.00 9 91 3 83 Reject
Queue -0.03 0.01 86 14 60 1 Reject
PriPos -0.09 0.01 87 13 55 2 Reject
LogTimeToClose 0.77 0.01 0 100 0 100 Reject
MkOrdAsym -0.00 0.00 74 26 31 5 Accept
Queue ×LogTimeToClose
0.01 0.00 12 88 2 68 Reject
PriPos ×LogTimeToClose
0.03 0.00 9 91 3 64 Reject
N =139 stocks; Average R2 = 0.43

33
Table 2 (Continued)
B. Good-till-canceled OrdersStandard Percentage of Stocks with Coefficients
VariableMean
EstimateError of
Mean Negative PositiveSignificantly
NegativeSignificantly
PositiveWilcoxon Signed Rank Test for
Ho: Coefficient = 0
Intercept 7.79 0.09 0% 100% 0% 100% Reject
LogAge 0.04 0.01 32 68 26 65 Accept
OrdSize -0.01 0.04 55 45 50 41 Accept
Queue -0.00 0.00 53 42 51 45 Accept
PriPos 0.04 0.01 15 85 13 84 Reject
MkOrdAsym -0.00 0.00 57 43 34 20 Accept
SubToday -0.63 0.03 97 3 96 0 Reject
N =141 stocks; Average R2 = 0.10

35
Table 3Informativeness of Limit Order Book Asymmetry
This table presents OLS estimates of a model of future transaction price returns on past returns, our measure of limit order bookasymmetry and a order side dummy variable. Specifically, the following model is estimated:
R R OrdBookAsym SideDummyi t k i i i t k i i t i i t, , , , , , ,+ −= + + +α β β β1 2 3 ,
where Ri t k, + is the percentage return on security i over k periods starting at time t, Ri t k, − is the percentage return on security i over k
periods ending at time t, OrdBookAsymi t, is our measure of limit order book asymmetry for security i at time t, and SideDummyi,t is a
dummy variable that is one if the arriving market or marketable limit order is a buy order. Time t denotes the arrival times of standardnon-opening SuperDOT market and marketable limit orders in the TORQ database. We consider 5 minute, 1 hour, and 1 trading dayperiods for k. The limit order book asymmetry measure is the relative difference between aggregate buy and sell option values of allstanding limit orders (see section 3.3). The option values are computed from the Black-Scholes option pricing formula using a risk-freeinterest rate of 7.5%, historic stock return volatility, and maturity equal to the expected remaining time to removal estimated from theregression model presented in Table 2. The model is estimated separately for each of the 139 TORQ stocks with adequate data. Thepercentage of stocks that have significant negative and positive coefficients (at 5% confidence level under a two-tailed test) is reportedfor each trading activity group. We use average daily number of trades to measure trading activity. The average coefficient andstandard error across all stocks are also reported.
k=5 minutes k=1 hour k=1 day Nβ1 β 2 β 3 β1 β 2 β 3 β1 β 2 β 3
Sample Average(Standard Error)
-0.15(0.02)
0.00(0.00)
0.02(0.00)
-0.04(0.01)
0.00(0.00)
0.02(0.00)
-0.02(0.01)
0.00(0.00)
0.01(0.00)
Neg Pos Neg Pos Neg Pos Neg Pos Neg Pos Neg Pos Neg Pos Neg Pos Neg PosAll Stocks 69 3 3 36 1 99 33 13 12 33 1 97 27 27 26 29 1 71 139Trading activitygroupsLess Active 55 2 2 23 5 95 25 7 7 27 5 93 23 11 20 25 5 66 44ModeratelyActive
83 0 0 25 0 100 33 10 4 27 0 100 23 25 15 29 0 69 48
Very Active 68 6 6 60 0 100 40 21 23 45 0 98 36 45 43 34 0 79 47

36
Table 4Quotation Revisions and Limit Order Book Asymmetry
This table presents OLS estimates of a model of future quotation midpoint returns on past returns, our measure of limit order bookasymmetry, an order side dummy, and a dummy variable to indicate whether the order was stopped. Specifically, the following model isestimated:
R R OrdBookAsym SideDummy StopDummyi t k i i i t k i i t i i t i i t, , , , , , , , ,+ −= + + + +α β β β β1 2 3 4 ,
where Ri t k, + is the percentage return on security i over k periods starting at time t, Ri t k, − is the percentage return on security i over k periods
ending at time t, OrdBookAsymi t, is our measure of limit order book asymmetry for security i at time t, SideDummyi,t is a dummy variable
that is one if the arriving market or marketable limit order is a buy order, and StopDummyi,t is a dummy variable that is one if the order isstopped. Time t denotes the arrival times of standard non-opening SuperDOT market and marketable limit orders in the TORQ database.We consider 5 minute, 1 hour, and 1 trading day periods for k. The limit order book asymmetry measure is the relative difference betweenaggregate buy and sell option values of all standing limit orders (see section 3.3). The option values are computed from the Black-Scholesoption pricing formula using a risk-free interest rate of 7.5%, historic stock return volatility, and maturity equal to the expected remainingtime to removal estimated from the regression model presented in Table 2. The model is estimated separately for each of the 139 TORQstocks with adequate data. The percentage of stocks that have significant negative and positive coefficients (at 5% confidence level under atwo-tailed test) is reported for each trading activity group. We use average daily number of trades to measure trading activity. Theaverage coefficient and standard error across all stocks are also reported.
k=5 minutes k=1 hour Nβ1 β 2 β 3 β 4 β1 β 2 β 3 β 4
Sample Average(Standard Error)
0.09(0.26)
0.00(0.00)
0.00(0.01)
0.00(0.00)
-0.04(0.01)
0.00(0.00)
0.01(0.00)
0.00(0.00)
Neg Pos Neg Pos Neg Pos Neg Pos Neg Pos Neg Pos Neg Pos Neg PosAll Stocks 56 8 3 37 1 98 11 11 36 15 14 37 1 95 15 12 139Trading activitygroupsLess Active 45 9 2 25 5 93 11 5 25 7 7 34 5 89 14 7 44ModeratelyActive
63 2 0 31 0 100 8 6 35 17 6 31 0 98 13 6 48
Very Active 60 13 6 55 0 100 13 21 47 21 28 47 0 98 19 21 47

37
Table 4 (Continued)
k=1 day Nβ1 β 2 β 3 β 4
Sample Average(Standard Error)
-0.02(0.01)
0.00(0.00)
0.01(0.00)
0.00(0.00)
Neg Pos Neg Pos Neg Pos Neg PosAll Stocks 28 27 23 30 2 68 14 12 139Trading activitygroupsLess Active 23 11 14 23 5 61 9 2 44ModeratelyActive
25 25 17 29 0 69 10 10 48
Very Active 36 43 38 38 2 72 23 23 47

38
Table 5Results of Sequential Logit Models of Specialist Actions
This table presents results of ten sequential logistic regression models of specialist discretionary actions on incoming SuperDOT market andmarketable limit orders in the TORQ database. The models are described in Appendix I. Only market and marketable limit orders thatsatisfy the following conditions are included: (1) The order must be a simple buy or sell order, (2) The order must not be an opening order,(3) The order must have matched contra-party information in the TORQ audit file, and (4) The order must be entered when the bid pricewas greater than $1. The independent variables are: (1) RelativeSize, the logarithm of the ratio of order size of the incoming market orderover the existing quote size (on the same side of the market order), (2) Spread, the dollar spread at the time of entry of the market order,(3) SignInventory, a constructed variable to represent specialist’s inventory (in shares) preceding the trade multiplied by –1 if the order is asell order, (5) SignImbalance, the ratio of the difference between the Black-Scholes option values of buy orders and sell orders over thesum of the option values multiplied by –1 if the order is a buy order. The spread variable is not included in Panel B as the conditionpresupposes that the spread is equal to one tick. The model is estimated for each stock individually but results are reported as percentageof stocks that have significant negative or positive coefficients under a two-tailed t-test. Results are further reported by trading activitydeciles formed using daily number of trades.
Panel A: When Exchange regulations allow the specialist to stop the order (i.e., the spread was greater than one tick)(32 percent of all orders)
Model 1: Did the specialist stop the order?Relative Size Spread SignInventory SignImbalance N
Neg Pos Neg Pos Neg Pos Neg PosAll Stocks 54.9 0.8 4.1 24.6 12.3 11.5 4.9 20.5 122Trading activitygroupsLess Active 13.8 0 0 10.3 0 6.9 0 17.2 59ModeratelyActive
61.7 0 2.1 31.9 10.6 10.6 6.4 6.4 47
Very Active 73.9 2.2 8.7 26.1 21.7 15.2 6.5 37.0 46

39
Table 5 (Continued)
Model 2: Did the specialist participate in a stopped order when he can participate without improving price?Relative Size Spread SignInventory SignImbalance N
Neg Pos Neg Pos Neg Pos Neg PosAll Stocks 1.1 43.3 3.3 10 6.7 6.7 2.2 2.2 90Trading activitygroupsLess Active 0 11.1 0 0 0 0 0 0 9ModeratelyActive
0 24.3 2.7 10.8 5.4 0 2.7 0 37
Very Active 2.3 65.9 4.5 11.4 9.1 13.6 2.3 4.5 44
Model 3: Did the specialist improve price on a stopped order when he can participate without improving price?Relative Size Spread SignInventory SignImbalance N
Neg Pos Neg Pos Neg Pos Neg PosAll Stocks 21.9 0 0 23.3 5.5 9.6 0 4.1 73Trading activitygroupsLess Active 0 0 0 0 0 0 0 0 7ModeratelyActive
21.4 0 0 21.4 3.6 7.1 0 0 28
Very Active 26.3 0 0 28.9 7.9 13.2 0 7.9 38
Model 4: Did the specialist participate in a stopped order when he cannot participate without improving price?Relative Size Spread SignInventory SignImbalance N
Neg Pos Neg Pos Neg Pos Neg PosAll Stocks 1 17.3 5.1 12.2 9.2 8.2 6.1 6.1 98Trading activitygroupsLess Active 0 0 0 0 0 0 0 0 13ModeratelyActive
0 2.6 0 12.8 5.1 2.6 5.1 5.1 39
Very Active 2.2 34.8 10.9 15.2 15.2 15.2 8.7 8.7 46
Table 5 (Continued)

40
Model 5: Did the specialist participate in an unstopped order when he can participate without improving price?Relative Size Spread SignInventory SignImbalance N
Neg Pos Neg Pos Neg Pos Neg PosAll Stocks 0 55.7 1.9 12.3 8.5 4.7 1.9 8.5 106Trading activitygroupsLess Active 0 10.5 0 5.3 5.3 0 5.3 0 19ModeratelyActive
0 47.6 0 11.9 7.1 7.1 0 9.5 42
Very Active 0 82.2 4.4 15.6 11.1 4.4 2.2 11.1 45
Model 6: Did the specialist improve price in an unstopped order when he can participate without improving price?Relative Size Spread SignInventory SignImbalance N
Neg Pos Neg Pos Neg Pos Neg PosAll Stocks 57.3 0 1 45.6 7.8 12.6 1 7.8 103Trading activitygroupsLess Active 45 0 0 10 5 15 0 0 20ModeratelyActive
60 0 0 57.5 7.5 7.5 0 0 40
Very Active 60.5 0 2.3 51.2 9.3 16.3 2.3 18.6 43
Model 7: Did the specialist participate in an unstopped order when he cannot participate without improving price?Relative Size Spread SignInventory SignImbalance N
Neg Pos Neg Pos Neg Pos Neg PosAll Stocks 20 10 0 40 10 10 4.5 18.2 110Trading activitygroupsLess Active 5 0 0 35 15 5 0 15 20ModeratelyActive
31.8 2.3 0 45.5 2.3 11.4 2.3 11.4 44
Very Active 15.2 21.7 0 37 15.2 10.9 8.7 26.1 46
Table 5 (Continued)

41
Table 5 (Continued)
Panel B: When Exchange regulations do not allow the specialist to stop the order (i.e., the spread is equal to one tick)(68 percent of all orders)
Model 8: Did the specialist participate when he can participate without improving price?Relative Size SignInventory SignImbalance N
Neg Pos Neg Pos Neg PosAll Stocks 1.6 48.4 10.3 7.1 3.2 13.5 126Trading activitygroupsLess Active 6.5 6.5 0 0 0 0 31ModeratelyActive
0 43.8 10.4 10.4 2.1 6.3 48
Very Active 0 80.9 17.0 8.5 6.4 29.8 47
Model 9: Did the specialist improve price when he can participate without improving price?Relative Size SignInventory SignImbalance N
Neg Pos Neg Pos Neg PosAll Stocks 28.2 0 5.6 0 2.8 1.4 71Trading activitygroupsLess Active 0 0 0 0 0 0 6ModeratelyActive
18.2 0 4.5 0 0 4.5 22
Very Active 37.2 0 7 0 4.7 0 43
Model 10: Did the specialist participate when he cannot participate without improving price?Relative Size SignInventory SignImbalance N
Neg Pos Neg Pos Neg PosAll Stocks 0.9 28.3 9.7 6.2 7.1 13.3 113Trading activitygroupsLess Active 0 4 0 0 0 4 25ModeratelyActive
2.4 19.5 4.9 2.4 4.9 7.3 41
Very Active 0 48.9 19.1 12.8 12.8 23.4 47

42
Table 6Results of Cross-sectional Regressions of Specialist Actions
This table presents results of cross-sectional weighted OLS regression models of specialist discretionary actions on incomingSuperDOT market and marketable limit orders in the TORQ database. Only market and marketable limit orders that satisfy thefollowing conditions are included: (1) The order must be a simple buy or sell order, (2) The order must not be an opening order, (3)The order must have matched contra-party information in the TORQ audit file, and (4) The order must be entered when the bid pricewas greater than $1. The dependent variable is the intercept from the stock-wise logit models described in Table 5. The explanatoryvariables in the cross-sectional regressions are market capitalization (in millions of dollars), standard deviation of log close-to-opendaily return, and relative tick (tick over the stock’s price). The standard errors of the intercepts from the logit models in Table 5 areused as weights in the estimation. Standard errors of the estimates are given in parentheses. An asterisk represents significance at 5%level under a two-tailed test.
Intercept Market Capitalization ($ M) Standard Deviationof Log Close-to-
Open Return
Relative Tick AdjustedR-square
N
Panel A: When Exchange regulations allow the specialist to stop the order (32 percent of all orders)
Model 1: Did the specialist stop the order?-1.52*(0.22)
0.02*(0.01)
28.77(15.76)
-0.53*(0.27)
0.10 122
Model 2: Did the specialist participate in a stopped order when he can participate without improving price?0.70
(0.60)-0.01(0.01)
-42.27(37.09)
0.91(0.91)
0.03 90
Model 3: Did the specialist improve price on a stopped order when he can participate without improving price?-2.35(1.46)
0.04(0.03)
28.36(88.70)
-0.45(2.73)
0.03 73
Model 4: Did the specialist participate in a stopped order when he cannot participate without improving price?-0.99(0.52)
0.00(0.01)
5.74(38.25)
-0.45(0.72)
0.01 98
Table 6 (Continued)

43
Model 5: Did the specialist participate in an unstopped order when he can participate without improving price?0.89*(0.25)
-0.01*(0.00)
-33.18*(15.95)
1.05*(0.32)
0.20 106
Model 6: Did the specialist improve price in an unstopped order when he can participate without improving price?-3.44*(0.50)
0.04*(0.01)
55.08(32.48)
-0.95(0.66)
0.18 103
Model 7: Did the specialist participate in an unstopped order when he cannot participate without improving price?-2.41*(0.32)
0.02*(0.00)
7.27(22.30)
0.00(0.35)
0.11 110
Panel B: When Exchange regulations do not allow the specialist to stop the order (68 percent of all orders)
Model 8: Did the specialist participate when he can participate without improving price?-0.11(0.12)
-0.01*(0.00)
-7.61(6.89)
0.22*(0.09)
0.17 126
Model 9: Did the specialist improve price when he can participate without improving price?-5.72*(0.96)
0.03*(0.01)
96.73(57.84)
-1.49(1.01)
0.12 71
Model 10: Did the specialist participate when he cannot participate without improving price?-2.71*(0.20)
0.01*(0.00)
16.32(11.04)
-0.37*(0.14)
0.18 113

44
Appendix IConditions Upon which Specialists Make Various Trading Decisions
This table presents the conditions under which specialists make the various trading decisions modeledin this paper. Each line of the table corresponds to an estimation model presented in Table 5. Thesample for that model consists of all market orders and marketablelimit orders that meet the conditionsspecified in the rows of the table to the left of the model number. The model addresses the decision atthe top of the column in which the model number appears.
Test A Decision 1 Test B Decision 2 Decision 3Did Exchangeregulationsallow thespecialist tostop the order?
Did the specialiststop the order?
Did Exchangeregulationspermit thespecialist toparticipate in theorder withoutimproving price?
Did the specialistparticipate in theorder?
Did the specialistimprove price?
Yes Model 1
Yes Yes Yes Model 2
Yes Yes Yes Yes Model 3
Yes Yes No Model 4 Yes (implied)
Yes No Yes Model 5
Yes No Yes Yes Model 6
Yes No No Model 7 Yes (implied)
No No (implied) Yes Model 8
No No (implied) Yes Yes Model 9
No No (implied) No Model 10 Yes (implied)

45
Arrival of a Market Order ora Marketable Limit Order
YES NO
Could he trade withoutimproving price?
Does he stop?
Could hestop?
YES NO
Could he trade withoutimproving price?
YESNO
Does he trade?
Does he improveprice?
YES NO
YES NO IMPLIED
Figure 1: A Flow Chart of Specialist Actions