the influence of social-class origins on - CORE
402
THE INFLUENCE OF SOCIAL-CLASS ORIGINS ON THE CHOICE OF COURSE, PREFERENCES, AND ENTRY TO EMPLOYMENT OF CNAA GRADUATES A thesis submitted to the Council for National Academic Awards in partial fulfilment of the requirements for the degree of Doctor of Philosophy. By David Alan Gatley North Staffordshire Polytechnic, in collabora- tion with the HELM Project at the CNAA and Bulmershe College of Higher Education. Although originally based at Bulmershe College, the HELM Project was moved to South Bank Polytechnic whilst the present writer was undertaking his research. August 1988
-
Upload
khangminh22 -
Category
Documents
-
view
1 -
download
0
Transcript of the influence of social-class origins on - CORE
THE INFLUENCE OF SOCIAL-CLASS ORIGINS ON
THE CHOICE OF COURSE, C~REER PREFERENCES, AND ENTRY
TO EMPLOYMENT OF CNAA GRADUATES
A thesis submitted to the Council for National Academic Awards in partial fulfilment of the requirements for the degree of Doctor of Philosophy.
By
David Alan Gatley
North Staffordshire Polytechnic, in collaboration with the HELM Project at the CNAA and Bulmershe College of Higher Education. Although originally based at Bulmershe College, the HELM Project was moved to South Bank Polytechnic whilst the present writer was undertaking his research.
August 1988

DEDICATION
To
The Memory
of
Catherine Gatley
1843 - 1879
. i i.
DECLARATION
While registered for the degree of Doctor of Philosophy, for which
the present submission is made, the author has not been a registered
candidate for any other awards, either of the CNAA or any
university.
The work was carried out in the Department of Sociology at North
Staffordshire Polytechnic between September 1984 and August 1988, as
a part of a wider CNAA funded project into Higher Education and the
Labour Market {HELM). The present study is based upon a class
analysis of the HELM data, for which the present writer was solely
responsible. The work is believed to be wholly original, except
where due reference is made.
Advanced courses of study in educational sociology and the
principles of sociological research were undertaken in partial
fulfilment of the requirements of this degree.
David Alan Gatley
. iii.
1
2
3
CONTENTS
CHAPTERS
Social Class, Social Mobility and Higher Education.
Research Methodology.
Derivation of a Social-Class Schema.
4 The Social-Class Origins of CNAA Graduates.
5
6
7
8
9
10
A
The Occupational and Social-Class Destinations of CNAA Graduates.
The Graduate Labour Market.
Choice of Course and Entry into Higher Education.
Gender, Social Class and the Employment Destinations of Graduates.
Ethnic Minorities in Higher Education and the Graduate Labour Market.
Conclusions.
APPENDICES
The Research Process.
8 Extracts From the HELM Questionnaires.
Footnotes
Bibliography
. i v.
PAGE
1
39
58
82
106
133
180
223
259
307
320
332
354
356
TABLE
1.1
1.2
2.1
2.2
TABLES
HEADING
Social-Class Destinations by School Attended.
Channels of Entry into Elite Occupations.
Sample Size and Response Rate by Course.
Faculties of all Students and HELM Graduates.
2.3 HELM Graduates and First Destination Statistics Compared.
2.4
2.5
2.6
3.1
3.2
Social-Class Origins: Wave I and Wave III.
Social-Class Destinations: Wave I and Wave II I.
Sample Size and Response Rate to the CRE Study by Course.
Occupational Class of Respondents' Fathers.
The Social-Class Origins of Graduates.
3.3 Social Class Positions of Respondents' Mothers.
3. 4
4.1
4.2
4. 3
4. 4
4. 5
4.6
4. 7
Measures of Job Quality by Social Class.
Attendance at Universities and Polytechnics by Gender.
Institution Attended by Gender.
Social-Class Origins of HELM Graduates by Institution.
Father's Highest Qualification by Institution.
School Attended by Institution.
Age of Graduates on Entry to Higher Education by Institution.
Entrance Qualifications by Institution.
.v.
PAGE
13
14
44
47
48
49
49
56
63
70
77
79
89
89
90
91
92
93
94
TABLE
4. 8
4.9
4.10
4.11
4.12
4.13
4.14
4.15
4.16
5.1
5.2
5.3
5.4
HEADING
Social-Class Origins by Age.
Social-Class Origins by Gender.
Fathers' by Mothers' Social-Class Position.
Fathers' Social-Class by Mother's Highest Educational Attainment.
Family Participation in Higher Education by Social-Class Origins (NSP).
Median Family Size by Social-Class Origins (NSP).
Graduates from Manual Origins.
Social-Class Origins by School Attended.
Social-Class Origins by Entry Qualifications.
Origins and Destinations of University Graduates.
Employment Sector in 1966 by SocialClass Origins.
Social-Class Origins of Men in 'Prestigious' Occupations in 1966
Occupations of Graduates by SocialClass Origins: Wave III.
5.5 Social-Class Origins and Destinations:
5.6
5.7
5. 8
5.9
5.10
Wave I.
Social-Class Origins and Destinations: Wave III.
Mean Income of Graduates by SocialClass Origins.
Measures of Job Quality by Social-Class Origins.
Social-Class Origins of Kelsall et al. 's Graduates Excluding those in Teaching.
Types off Course Undertaken by Students in Advanced Further Education: 1962/3.
. vi.
PAGE
96
97
98
99
100
101
102
103
104
107
108
108
111
112
115
116
118
125
126
TABLE
5.11
5.12
6.1
6.2
6.3
6.4
6.5
6.6
6.7
6.8
6.9
6.10
6.11
6.12
HEADING
Proportion of Men Aged 40-49 with Sub-Degree Level Qualifications.
Social-Class Origins and Destinations (Oxford Mobility Study).
First Destinations of Graduates by Institution: 1984.
Job Quality by Institution Attended.
Institution Attended By Social-Class Destinations: Wave III.
Type of Course by Institution.
Social-Class Destinations by Type of Course: Wave I.
Social-Class Destinations by Course: Wave III.
Social-Class Origins and Destinations: Male Generalists.
Social-Class Origins and Destinations: Male Vocationalists.
Social-Class Origins and Destinations: Female Generalists.
Social-Class Origins and Destinations: Female Vocationalists.
Matched Samples.
Type of Course Undertaken by 'Matched' Men and Women Graduates.
6.13 Male and Female Generalists and Vocationalists.
6.14
6.15
6.16
6.17
Social-Class Origins and Destinations of Graduate Men.
Occupations of Matched Samples by Social-Class Origins: Men.
Social-Class Origins and Destinations by Type of Course: Men.
Mean Salary of Graduate Men: Matched Sample.
.vii.
PAGE
129
130
151
152
153
154
155
156
160
160
161
162
163
164
164
165
166
167
168
TABLE
6.18
6.19
6.20
6.21
6.22
6.23
6.24
6.25
7.1
7.2
7.3
7. 4
7.5
7. 6
7.7
7.8
HEADING
Job Quality by Social-Class Origins: Male Generalists.
Social-Class Origins and Destinations of Graduate Women (Matched Samples)
Occupations of Matched Samples: Women.
Social-Class Origins and Destinations by Type of Course: Women (Matched Sample).
Job Quality by Social-Class Origins: Female Generalists.
Job Quality by Social-Class Origins: Female Vocationalists.
Personality Traits by Social-Class Destinations.
Postgraduate Study by Matched SocialClasses: Generalists.
Type of Course by Social-Class Origins.
Subjects Undertaken by Men from WorkingClass Origins.
Subjects Undertaken by Women from WorkingClass Origins.
Reasons Given for Undertaking Course by Social-Class Origins.
Attitudes Towards Higher Education by Social-Class Origins.
Academic Subjects.
Type of School Curriculum by Gender.
Occupations by School Curriculum.
7.9 Social-Class Destinations by School Curriculum.
7.10 Annual Salaries by School Curriculum.
7.11 School Curriculum by Type of Course.
7.12 Course by School Curriculum.
. viii.
PAGE
168
170
171
171
172
173
175
177
182
183
183
186
188
191
193
194
195
196
197
198
TABLE
7.13
7.14
HEADING
Main Characteristics and Destinations of Respondents by School Curriculum.
Personality Traits by School Curriculum.
7.15 Social-Class Origins by School Curriculum.
8.1
8.2
8.3
8. 4
8.5
8. 6
8.7
The Occupational Classes of Men and Women.
Graduates in the Workforce by Gender.
Graduates in Banking, Finance & Other Services by Gender.
Mothers' Social Class by Gender.
School Attended by Gender.
Entry Qualifications by Gender.
Type of School Curriculum by Gender.
8.8 GCE and CSE Examination Passes by Gender.
8.9
8.10
8.11
8.12
8.13
8.14
8.15
8.16
8.17
8.18
8.19
8.20
Subjects Undertaken by Gender.
Type of Course by Gender.
Preferred Characteristics of Long-Term Job by Gender.
Measures of Job Quality by Gender (Wave I).
Employment Status by Gender.
Occupations of Graduate Men and Women.
Employment Sector by Gender.
Social-Class Destinations by Gender.
Other Measures of Job Quality by Gender.
Major Job Characteristics by Gender.
Personality Traits by Gender.
Postgraduate Courses by Gender.
. ix.
PAGE
210
215
217
225
227
227
236
237
238
238
239
241
241
243
244
244
245
246
246
247
248
249
251
TABLE
8.21
8.22
8.23
8.24
9.1
9.2
9.3
9.4
9.5
9.6
9.7
9.8
9. 9
9.10
9.11
9.12
9.13
9.14
9.15
9.16
HEADING
Difficulty in Finding Suitable Employment by Gender (Wave I).
Difficulty in Finding Suitable Employment by Gender (Wave III).
Mean Salaries by Gender and SocialClass Destinations.
Measures of Job Quality by Gender and Social-Class Destinations.
Job Levels of Male Employees by Ethnicity.
Participation in Higher Education by Sector and Ethnicity.
Response Rates by Ethnicity.
Ethnic Origins of HELM Graduates.
Social-Class Origins by Ethnicity.
Social-Class of Respondents' Mothers by Ethnicity.
Highest Educational Attainment of Respondents' Mothers by Ethnicity.
Ethnic Origins by Gender.
Ethnic Origins by Age.
Proportions Starting Degree Courses Straight After Leaving School by Ethnicity.
Type of School Attended by Ethnicity.
Attendance at an F.E. College by Ethnicity.
Type of School Curriculum by Ethnicity.
Course of Study by Ethnicity.
Type of Course by Ethnic Origins.
Functions of Higher Education: Asians.
.x.
PAGE
253
253
255
255
262
267
270
272
274
275
275
276
276
277
279
279
280
281
281
282
TABLE
9.17
9.18
9.19
9.20
9.21
9.22
9.23
9.24
9. 25
9.26
9.27
9.28
9.29
9.30
9.31
9.32
9.33
9.34
9.35
9.36
A.l
A. 2
HEADING
Functions of Higher Education: African/ Caribbeans.
Job Applications in Final Year by Ethnicity (CRE).
Job Offers in Final Year by Ethnicity ( CRE).
Difficulty in Finding Employment by Ethnicity (CRE).
Employment Status by Ethnicity.
Type of Employment by Ethnic Origins.
Type of Employer by Ethnicity.
Type of Employer by Ethnicity (CRE).
Social-Class Destinations by Ethnicity.
Mean Incomes by Ethnicity.
Preferred Occupation by Ethnicity.
Feels Overqualified by Ethnicity.
Size of Employer by Ethnicity.
Factors Determining Job Success by Ethnicity.
Personality Traits of Asian Graduates.
Personality Traits of African/Caribbean Graduates.
Benefits of Higher Education: African/ Caribbeans (CRE).
Benefits of Higher Education: Asians (CRE).
Matched Samples Wave I.
Matched Samples Waves II and III.
Rough Timetable of Research Project.
Codes Given to Examination Passes.
A.3 Codes Given to Other Examination Passes.
.xi.
PAGE
283
285
286
286
287
288
288
290
290
292
292
293
29 3
296
298
299
302
302
305
305
323
327
327
FIGURES
FIGURE HEADING
3.1 Graduate Social Classes.
3.2 Fathers' Social-Class Schema.
4.1 Higher Education in Great Britain.
6.1 Brennan's Typology of Courses.
6.2 Fragmented Labour Markets.
9.1 Approaches to the Black Under Class.
9.2 Alternative Social-Class Schema.
9.3 Dual Class Model of Native and Minority Social-Class Schema.
.xii.
PAGE
73
74
84
146
149
261
263
264

ACKNOWLEDGEMENTS
This thesis would not have been possible without the help and
co-operation of many people and institutions. First, and foremost of
course, are those graduates who were kind enough to give up their
time to complete and return their questionnaires to us.
Finance was provided by North Staffordshire Polytechnic, where I was
supervised by Professor David Jary and David Newton, and received
invaluable assistance from Jim Zacune, Dr. Tony Chapman and Dr. Sam
Cameron.
Thanks are also due to, my external supervisor, John Brennan of the
CNAA, and to Dr. Stena Lyon, Dr. Philip McGeevor and Kate Murray of
South Bank Polytechnic.
Finally, my thanks must also go to Yvonne Webb, Anne Corden and
Margaret Fletcher for their help in coding the questionnaires, and
to Dr. Peter Franklin for his excellent proof reading.
David Alan Gatley
.xiii.
ABSTRACT
THE INFLUENCE OF SOCIAL-CLASS ORIGINS ON
THE CHOICE OF COURSE, CAREER PREFERENCES, AND ENTRY
TO EMPLOYMENT OF CNAA GRADUATES
By
David Alan Gatley
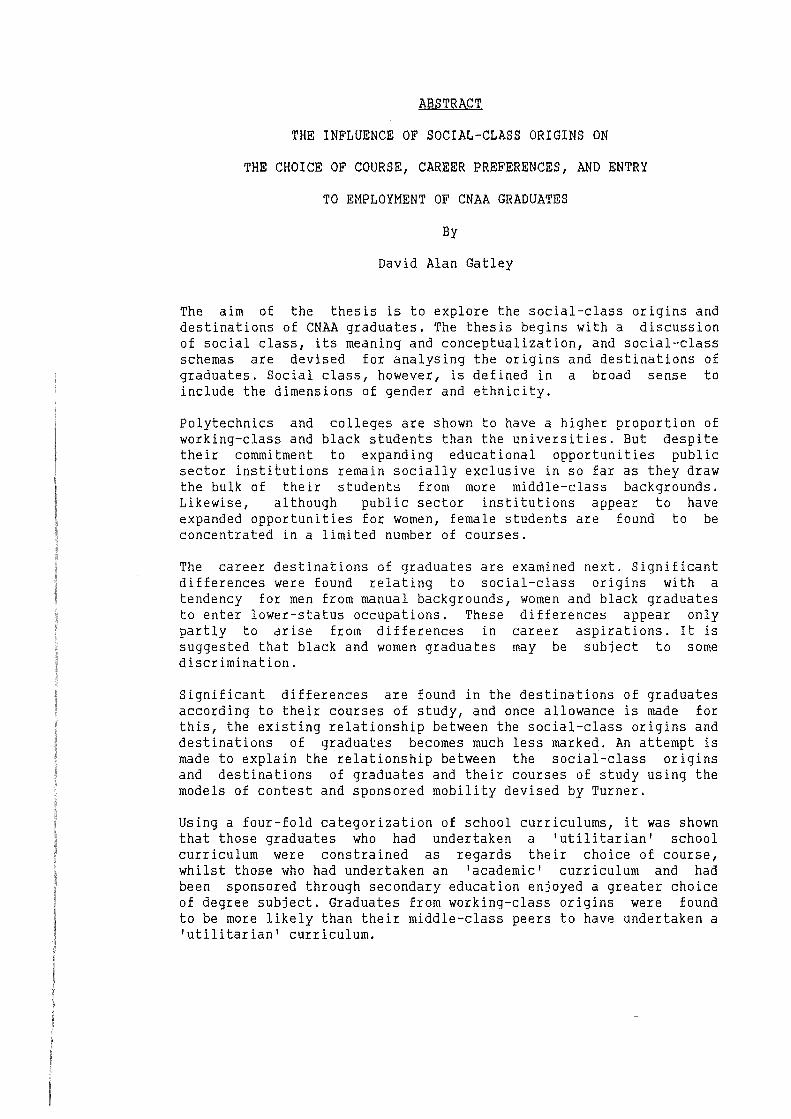
The aim of the thesis is to explore the social-class origins and destinations of CNAA graduates. The thesis begins with a discussion of social class, its meaning and conceptualization, and social-class schemas are devised for analysing the origins and destinations of graduates. Social class, however, is defined in a broad sense to include the dimensions of gender and ethnicity.
Polytechnics and colleges are shown to have a higher proportion of working-class and black students than the universities. But despite their commitment to expanding educational opportunities public sector institutions remain socially exclusive in so far as they draw the bulk of their students from more middle-class backgrounds. Likewise, although public sector institutions appear to have expanded opportunities for women, female students are found to be concentrated in a limited number of courses.
The career destinations of graduates are examined next. Significant differences were found relating to social-class or1g1ns with a tendency for men from manual backgrounds, women and black graduates to enter lower-status occupations. These differences appear only partly to arise from differences in career aspirations. It is suggested that black and women graduates may be subject to some discrimination.
Significant differences are found in the destinations of graduates according to their courses of study, and once allowance is made for this, the existing relationship between the social-class origins and destinations of graduates becomes much less marked. An attempt is made to explain the relationship between the social-class or1g1ns and destinations of graduates and their courses of study using the models of contest and sponsored mobility devised by Turner.
Using a four-fold categorization of school curriculums, it was shown that those graduates who had undertaken a 'utilitarian' school curriculum were constrained as regards their choice of course, whilst those who had undertaken an 'academic' curriculum and had been sponsored through secondary education enjoyed a greater choice of degree subject. Graduates from working-class or1g1ns were found to be more likely than their middle-class peers to have undertaken a 'utilitarian' curriculum.
CHAPTER ONE: SOCIAL CLASS, SOCIAL MOBILITY AND HIGHER EDUCATION
This thesis examines the relationship which exists between the
social-class origins of graduates, the courses which they undertake
and their transition from higher education to the graduate labour
market. As such, it can be regarded as a study of social mobility in
so far as its principal concern lies in examining the extent to
which public sector institutions of higher education act as an
avenue of social mobility for those from lower-class backgrounds.
This, in turn, involves a consideration of two matters: access, that
is the extent to which these institutions are providing places for
young people from lower-class backgrounds, and destinations, that is
the extent to which such graduates are successful in the labour
market after graduation.
This chapter is divided into four Parts. Part One looks at
theoretical approaches to social stratification and social class,
and an attempt is made to define the lower classes which are the
principal concern of this study. Part Two looks at .social mobility
and education. Part Three briefly reviews the nature of the HELM
(Higher Education and the Labour Market) data set which formed the
basis of this piece of work. Finally, in Part Four, the aims of the
thesis are discussed in relation to previous studies in the subject
area.
PAGE 1
Part One: Social Stratification and Social Class
Studies of social mobility have tended to conceptualize social class
in terms of constructed scales which often bear little relation to
sociological theory. The various ways in which these scales are
constructed are discussed more fully in Chapter Three and need not
concern us here. Suffice it to say, however, that they have been
constructed on the premise that occupations can be arranged in a
series of social classes, which are alike in their degrees of status
or general desirability, on a hierarchical scale possessing ordinal
properties, such that occupations at the top of the scale are
considered to be more socially desirable than those in the middle,
which, in turn, have more desirability than those at the bottom of
the scale. In these schemas the meaning of •desirability• and
•status• is rarely spelt out, although they are generally seen as
referring to matters such as •prestige•, 1 income 1 and •power•, which
are closely related to one another but are not equivalent. Using
such scales, intergenerational social mobility can be said to have
occurred in those instances in which the son or daughter occupies a
different social-class position to that of their family of origin.
Such social-class schemas have yielded much useful information as
regards the degree of openness of the social structure and the
accessibility of 1elite 1 positions, and have drawn attention to a
number of factors - social-class origins, race, gender, age, etc
which have a bearing on how well people are likely to perform in the
labour market. However, they tend to be descriptive in orientation
and examine disadvantage in terms of specific attributes which
PAGE 2
differ between social classes (see Byrne et al., 1975). With some
notable exceptions (1) they have also tended to ignore the
relationship which exists between social classes and the extent to
which their 'interests' may conflict with one another. This is
important to the extent to which members of some social classes are
able to use their position to the advantage of themselves and/or
their social class at the expense of others.
Following the works of Marx and Weber there are two main theoretical
approaches to the study of social class. In Marxian approaches
social classes are defined primarily in terms of the individual's
relationship to the means of production. In his major work Capital,
Marx developed an ideal-type model of capitalism in which there are
two basic social classes: the bourgeoisie who own and control the
means of production, and the proletariat who are employed by the
bourgeoisie and from whom a surplus is expropriated in the process
of production (Abercrombie and Urry, 1983: 50-2; Carter, 1985:
54-5). As a result of the exploitation process the interest of these
two social classes conflict with one another, giving each social
class a common identity. Marx's schema is essentially an
evolutionary one, in which social classes from earlier era - the
petit bourgeoisie and the peasantry - are gradually merged into one
of the other social classes.
The main problem with the approach taken by Marx is that since he
developed only a simplified model of capitalism he paid little
attention to people such as managers, administrators, professionals
and other non-manual workers who constitute neither a section of the
bourgeoisie nor the proletariat. As Goldthorpe (1980) shows us, it
PAGE 3
is interesting that Marx was aware of the existence of these groups
and foresaw that the absolute number of people employed within such
occupations would increase with time (Abercrombie and Urry,
1983:50-2; Carter, 1985: 54-5}. Modern Marxists attribute the growth
of such occupations to the development of monopoly capitalism
(Braverman, 1974}: as industrial enterprises have grown, so the
functions of control and ownership (formally undertaken by the
bourgeoisie} have become separated and capitalists have been forced
to employ managers and administrators to attend to the day-to-day
administration of their enterprises. Moreover, other developments
within capitalism - the growth of compulsory education and the
welfare state, the increase in the number of working women, and the
break up of the traditional working-class family and community
have led to a tremendous increase in the numbers of professional and
routine service workers.
Marxists differ in their treatment of these intermediate or middle
that classes. Poulantzas (1975) argues
constitute a middle class whose
other two classes. They do not form a
these intermediate groups
interests diverge from both the
section of the bourgeoisie
because they do not own the means of production. They do not form a
part of the proletariat because: a} they do not produce surplus
value; b) they exercise political control over the proletariat in
the production process; and c) they have expert (ideological}
knowledge of the labour process which the proletariat do not have.
Poulantzas's approach has, however, been criticised. Firstly, he
implies that the political and ideological dimensions of his schema
are at least as important as the economic one, while others (see
PAGE 4
carter; 1985: 77) argue that this ls contrary to Marx's schema which
is rooted in the material basis of society. More importantly,
however, Poulantzas links together diverse and distinct groups. It
is to be doubted if they share the same relationship to both capital
and labour, and their interests possibly diverge. Braverman (1974)
argues that owing to a process of deskilling many lower-grade
clerical and routine non-manual workers should be more correctly
placed within the proletariat. Braverman's position is accepted by
Ehrenreich and Ehrenreich (1979) who nevertheless argue that a
professional-managerial class (PMC) exists composed of those 'who do
not own the means of production and whose major function in the
social division of labour may be described broadly as the
reproduction of capitalist culture and capitalist class relations'
(1979: 12).
In contrast to Marx, Weber saw social stratification as having three
main components: class, status and party. In Weber's view, classes
arose within the market place such that the forces of supply and
demand determine the level of reward paid to individual workers
which in turn determines the distribution of income. Workers with
special skills in short supply have an advantage over other people
and thus receive higher rewards. In this approach 'social class'
refers to groups of workers who through virtue of having similar
skills undertake similar types of work, receive similar rewards, and
hence have similar life-chances.
Such an approach, however, shares much in common with that of Marx,
in so far as Weber saw the possession of property as placing people
in an advantageous position within the market place vis-a-vis those
PAGE 5
without property, and he wrote '"property" and lack of "property"
are, therefore, the basic categories of all class situations'
(quoted from Salaman, 1972: 19). Unlike Marx, however, Weber
believed that the propertyless might be divided into a number of
social classes differentiated according to the skills and special
attributes which they possess and are able to negotiate with in the
labour market (Giddens, 1980: 103).
Status refers to the differentiation of people and groups according
to life-styles, patterns of consumption and social honour. Often
groups of people sharing a similar life-style and pattern of
consumption form distinct communities which can become caste-like.
Status and class are usually linked together with a particular
occupation, and economic wealth can allow people to buy their way
into particular status groups. The tie between the two is not,
however, always perfect and factors such as skin colour, ethnicity
and gender can, under some circumstances, also be important.
Parties, to Weber, were groups which sought political power in a
broad sense of the term to improve the power and position of their
members. Like status, party is closely related to class, although it
is not necessarily the same and parties may also
particular status groups.
represent
Parkin (1979) has attempted a redefinition of Weber's basic approach
based upon the Weberian concept of social closure. This refers to
the ability which some groups possess to maximize rewards by
restricting access to the market place to a limited number of
eligibles. Two strategies of social closure exist: a) exclusion,
PAGE 6
which tends to be applied in a downward direction and leads to the
creation of subordinate classes; and b) usurpation, which relates to
the collective power of disadvantaged social classes which is
typically applied in an upward direction. Parkin, argues that almost
any distinguishing feature (qualifications, race, gender, religion,
language, etc) might be used as a basis of social closure but is in
agreement with both Marx and Weber that possession and lack of
property is the most important determinant of class position.
The main problem with the Weberian approach, however, is that it is
possible to differentiate many social classes and the boundaries
which exist between them are often blurred. One solution to this
'boundary problem' is that proposed by the Weberian Giddens (1980:
107) who argues that there are three social classes within
capitalist society based upon differences in their market
capacities: 'Ownership of property in the means of production;
possession of educational and technical qualifications; and
possession of manual labour-power'. Stated in this form many social
classes might still exist but Giddens argues that the unity of each
social class is structured through both mediate and proximate
sources of structuration. Mediate structuration refers to the extent
to which each social class is closed in the sense that others are
excluded from it. Proximate structuration refers to: a) the division
of labour within industrial enterprises (the extent to which members
of the three social classes perform different functions);
b) authority relationships within enterprises; and c) the influence
of 'distributive groupings' which relates to the extent to which the
social classes form distinct status groups with different
PAGE 7
life-styles and consumption patterns. Abercrombie and Urry (1983:
22-6) criticize Giddens' trichotomous social-class schema because
Giddens does not make it clear why capitalism should evolve a
three-class rather than multi-class system, and like Braverman
(1974), they are sceptical about placing routine white-collar
workers within the middle rather than the working class.
Finally, before concluding this section, it should be mentioned that
both Marxists and Weberians have attempted to expand the concept of
social class in such a way as to include within it both the
dimensions of ethnicity and gender. Since these approaches are
discussed in some detail in later chapters they need not concern us
further here. Suffice it to say that we shall throughout this study
be treating both ethnicity and gender as separate dimensions of
social class.
Even though Marxists and Weberians differ in their basic approaches
they share much in common. Firstly, they are agreed that the primary
division between social classes is that which exists between those
who own and those who do not own the means of production. Secondly,
they are agreed that the propertyless do not constitute a unified
social class, but can be divided in a number of distinct social
classes or class segments: a) a middle class which, in a Marxian
sense, can be distinguished from the working class according to the
functions which it performs for capital, and in a Weberian sense,
has an advantageous position in the labour market as a result of its
possession of educational and technical qualifications; b) a working
class which is exploited in the productive process and has few
formal qualifications; c) genaer classes - that is men and women;
PAGE 8
and d) race or ethnic classes. Finally, both Marxists and Weberian
theorists define social class in terms of a power relationship in
which those in a dominant class position have certain advantages
which stem from their ability to exploit and/or exclude others.
Thus, for example, the possession of property gives the bourgeoisie
the ability to exploit those whom they employ and possession of
particular attributes (educational qualifications, skin colour,
gender, etc) give some groups an advantageous position in the labour
market to the exclusion (or detriment) of those who do not possess
them.
We are now in a position to define the lower classes which will be
the principal focus of this study. These are the working class as
defined in the previous paragraph, women and ethnic minorities. It
should be mentioned, however, that these three groups are not
mutually exclusive of one another and many graduates whilst being
disadvantaged members of one class will be advantaged members of
another class. Thus, for example, the majority of women and some of
the black graduates (both disadvantaged social classes} originate
from middle-class families.
Part Two: Social Mobility
Studies of social mobility using constructed scales of social class
suggest that around two-thirds of men in Britain occupy a different
social-class position to those of their fathers, which in turn
suggests that Britain is an open society (Richardson, 1977: 19}.
However, most of the movement which occurs is comparatively short
PAGE 9
range and involves movement between one or two adjacent social
classes. Thus research undertaken in the late 1940s by Glass and
Hall (1954: 183) found that whilst 47.3% of the sons of skilled
manual workers were employed in similar occupations, 29.6% were
employed in other manual work and 12.3% were in routine non-manual
occupations. Similarly Goldthorpe and Llewellyn (1980: 48) in their
review of the Oxford mobility study undertaken in the early 1970s
found that whilst 30% of the sons of skilled manual workers were
themselves employed in skilled manual work, 25.6% were employed in
other unskilled or semi-skilled manual occupations and 12.3% were
low-grade technicians or foremen. Moreover, although studies show
that around one-third of sons have jobs on the opposite side of the
manual/non-manual division to those of their fathers, most of the
movement in both directions appears to occur between skilled manual
jobs and routine non-manual work (Richardson, 1977: 19).
Movement between the 'top' and 'bottom' of the social-class
hierarchy is much less common. Thus Glass (1954) found that 48.5% of
professional workers had fathers who were also professionals and
only 13.6% had fathers employed in manual occupations, whilst, at
the other extreme, under 0.5% of men employed in unskilled work had
fathers employed in professional occupations and 86.3% had fathers
employed in manual work (Glass and Hall, 1954: 183).
Although the methodology of Glass's work has been criticized (Heath,
1981: 47-8), broadly similar conclusions were reached by Goldthorpe
and Llewellyn (1977), who found that whilst 25.3% of senior
professionals and managers had fathers employed in a similar
occupation, only 12.1% had fathers employed in other (semi-skilled
PAGE 10
and unskilled) manual occupations, and, at the other extreme, whilst
36.6% of other manual workers had fathers employed in similar work,
only 2.4% had fathers employed in senior professional and managerial
occupations (see also Heath, 1981: 63).
Other research suggests that not only do men from working-class
origins tend to be employed in lower-status jobs than those from
more middle-class origins, but women tend to be employed in
lower-status jobs than men, and black people tend to be employed in
lower-status jobs than white people.
In regard to Britain's black population, a recent PSI study (Brown,
1984) found that unemployment amongst the West Indian and Asian
minorities was far higher than that amongst white people (p. 195),
and black people were found to be more likely to be employed in
manual and less likely to be employed in non-manual occupations than
white people (p. 197).
Using OPCS data, Arber et al. (1986) show us that, although women as
a whole are more likely than men to be employed in non-manual
occupations, most women in such jobs tend to be employed in
low-level clerical occupations (which are often less well paid than
skilled manual jobs) and they are far less likely than men to be
employed in senior professional and managerial positions. Moreover,
those women employed in manual occupations tend to be employed in
lower-status (semi-skilled and unskilled) jobs than men.
Looking first at the relationship which exists between the
social-class origins and destinations of men, several reasons can be
PAGE 11
advanced to account for the lack of long-range mobility between the
two extremes of the social-class hierarchy. In some societies where
roles are 'ascribed', men tend to enter their fathers' occupations
as a matter of course (Hoselitz, 1960), and even in Britain many
people originating from middle-class families benefit directly from
the inheritance of wealth, and many self-employed people have
inherited their businesses from their fathers (Heath, 1981: 67-8).
In Britain, however, most occupational roles tend to be 'achieved'
rather than 'ascribed', in so far as entry to the more prestigious
occupations is only possible with the possession of some form of
qualification (academic or vocational) or experience where people
have entered an occupation at a comparatively low level and have
worked their way up to more senior positions.
Table 1.1, taken from Hall and Glass (1954), illustrates the
relationship which exists between school attended and the
occupational destinations of respondents. From this we see that
whilst only 4.6% of respondents had attended private-elementary and
grammar schools and 9.7% had attended state-elementary and grammar
schools, 31.3% and 32.0% respectively of those employed within
professional, high administrative and managerial occupations had
done so. However, the 'fit' between education and occupation is far
from perfect, and thus we see that more than a third (36.7%) of
those in the 'top' social class had attended elementary school
most of these people having presumably worked their work up to more
senior positions.
PAGE 12
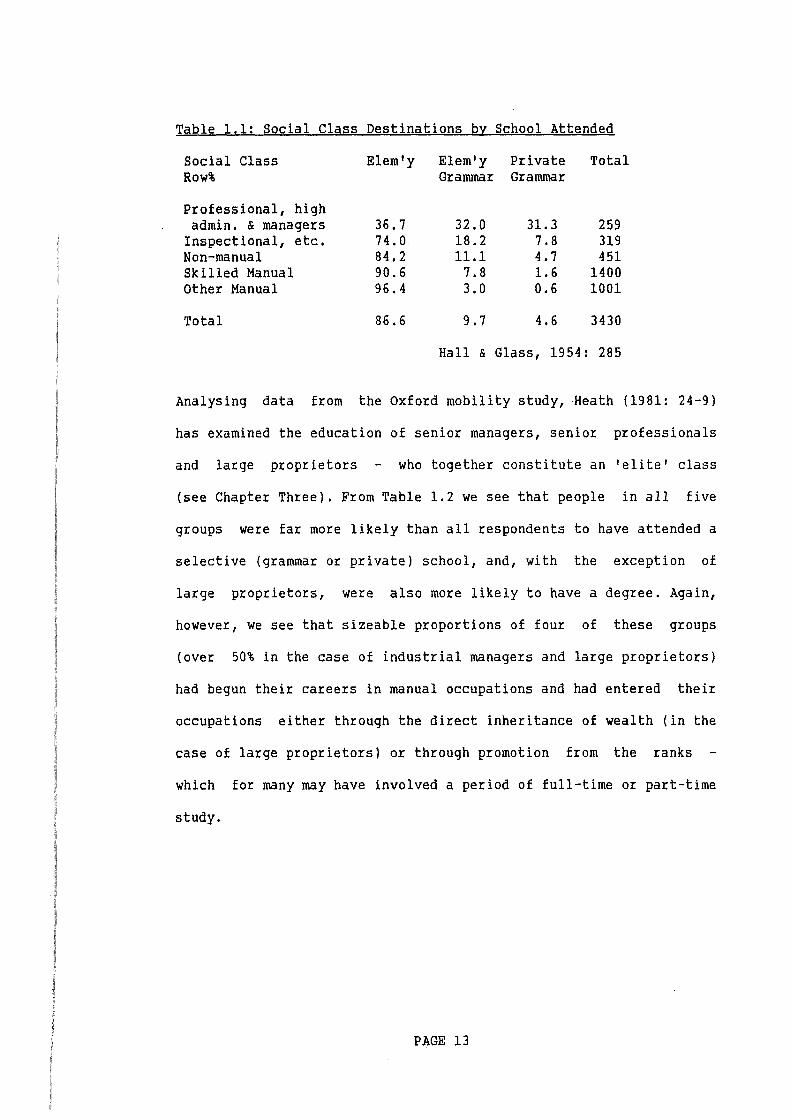
Table 1.1: Social Class Destinations by School Attended
Social Class Elem'y Elem'y Private Total Row% Grammar Grammar
Professional, high admin. & managers 36.7 32.0 31.3 259
Inspectional, etc. 74.0 18.2 7.8 319 Non-manual 84.2 11.1 4.7 451 Skilled Manual 90.6 7.8 1.6 1400 Other Manual 96.4 3.0 0.6 1001
Total 86.6 9.7 4.6 3430
Hall & Glass, 1954: 285
Analysing data from the Oxford mobility study, Heath (1981: 24-9)
has examined the education of senior managers, senior professionals
and large proprietors who together constitute an 'elite' class
(see Chapter Three). From Table 1.2 we see that people in all five
groups were far more likely than all respondents to have attended a
selective (grammar or private) school, and, with the exception of
large proprietors, were also more likely to have a degree. Again,
however, we see that sizeable proportions of four of these groups
(over 50% in the case of industrial managers and large proprietors)
had begun their careers in manual occupations and had entered their
occupations either through the direct inheritance of wealth (in the
case of large proprietors) or through promotion from the ranks
which for many may have involved a period of full-time or part-time
study.
PAGE 13
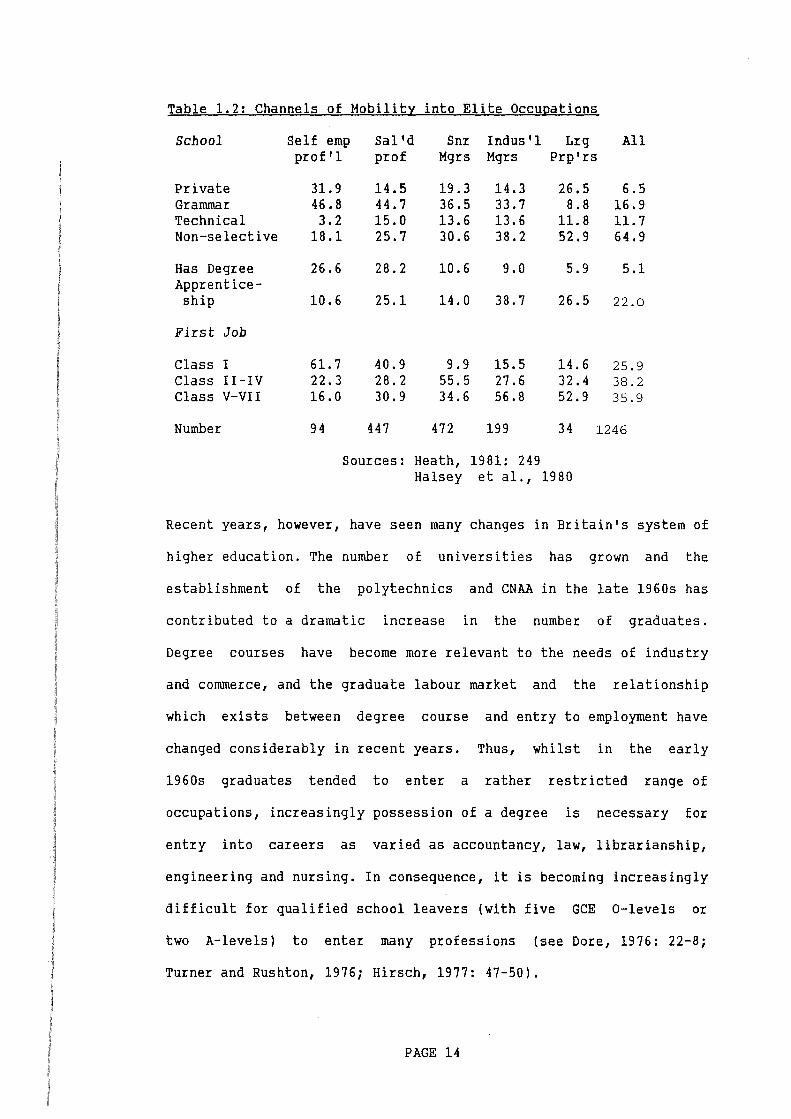
Table 1. 2: Channels of Mobility into Elite Occupations
School Self emp Sal'd Snr Indus'l Lrg All prof'l prof Mgrs Mgrs Prp'rs
Private 31.9 14.5 19.3 14.3 26.5 6.5 Grammar 46.8 44.7 36.5 33.7 8.8 16.9 Technical 3.2 15.0 13.6 13.6 11.8 11.7 Non-selective 18.1 25.7 30.6 38.2 52.9 64.9
Has Degree 26.6 28.2 10.6 9.0 5.9 5.1 Apprentice-ship 10.6 25.1 14.0 38.7 26.5 22.0
First Job
Class I 61.7 40.9 9.9 15.5 14.6 25.9 Class II-IV 22.3 28.2 55.5 27.6 32.4 38.2 Class V-VII 16.0 30.9 34.6 56.8 52.9 35.9
Number 94 447 472 199 34 1246
Sources: Heath, 1981: 249 Halsey et al., 1980
Recent years, however, have seen many changes in Britain's system of
higher education. The number of universities has grown and the
establishment of the polytechnics and CNAA in the late 1960s has
contributed to a dramatic increase in the number of graduates.
Degree courses have become more relevant to the needs of industry
and commerce, and the graduate labour market and the relationship
which exists between degree course and entry to employment have
changed considerably in recent years. Thus, whilst in the early
1960s graduates tended to enter a rather restricted range of
occupations, increasingly possession of a degree is necessary for
entry into careers as varied as accountancy, law, librarianship,
engineering and nursing. In consequence, it is becoming increasingly
difficult for qualified school leavers (with five GCE 0-levels or
two A-levels) to enter many professions (see Dore, 1976: 22-8;
Turner and Rushton, 1976; Hirsch, 1977: 47-50).
PAGE 14
Even though participation in higher education and the possession of
a degree is now increasingly necessary for entry into many of the
more prestigious occupations, little is known about the processes by
which people pass through secondary and higher-education and enter
the labour market (see Roizen & Jepson, (1985) Kogan and Boys, 1984
Brennan and McGeever, 1986). Moreover, the role of higher education
in providing a channel of social mobility for young people from
lower-class origins has been largely ignored. The First Destination
Statistics published yearly by AGCAS only give details of the
employment destinations of graduates six months after leaving
college and it is only possible to disaggregate the figures by
gender, subject and institution attended (Bourner, 1984). The career
paths of graduates over a longer time period are not examined, and
the relationship which might exist between home and social-class
background,
ignored.
ethnicity, secondary education and employment is
Kelsall et al. (1972) looked at the employment destinations of a
sample of 1960 graduates six years after they had left university.
This work will be reviewed in much more detail in later chapters:
suffice it to say here that their work is interesting because it
suggested that not only were graduates from working-class origins
grossly under-represented in the universities, but such graduates
also tended to be employed in lower-status occupations (mainly
teaching) than their peers from more middle-class backgrounds, a
finding which they believed was related to the lower aspirations of
such graduates.
Kelsall et al. 's work is now rather dated. The graduate labour
PAGE 15
market has changed, and they undertook their work before the
establishment of the polytechnics. As we shall see in Chapter Four,
the polytechnics were, in part, originally conceived as a vehicle
for expanding the educational and employment opportunities available
to mature people and young people from disadvantaged backgrounds.
Yet the role of such institutions iti providing such an avenue of
social mobility has not, as yet, been examined. This neglect of
public-sector institutions is all the more surprising when one
considers not only the high proportion of people graduating from
them, but also because there is some evidence that employers have a
preference for university over public sector graduates (see Roizen
and Jepson, 1985; Kogan and Boys, 1984; First Destination
Statistics). This thesis aims to help 'plug' this gap in our
knowledge, in so far as it examines the social-class origins and
destinations of public-sector graduates.
Part Three: The HELM Project
Data for the Ph.D came from a three-year longitudinal panel survey
of public sector (polytechnic and college of higher education)
graduates funded by the CNAA Development Services Unit. The broad
aim of the project was to examine the relationship which might exist
between the types of courses undertaken by graduates and their entry
into the labour market, and for this reason respondents were asked
questions relating to their courses of study, attitudes towards
higher education, their economic and employment status and the
'quality' of their work. In the formulation of the original project,
however, account was taken of the possibility of looking at a
variety of other factors which might influence how well graduates
PAGE 16
perform in the labour market, and for this reason a series of
further questions of potential value to us were also included in the
study. These included the bccupations of respondents' parents, their
ethnic origins, gender, secondary education and personality traits
(see Appendix A).
Over 4,000 graduates, who had undertaken 122 different courses,
grouped for analytical purposes into 31 course types, at 33 public
sector institutions, were included in the study. Use was made of
three highly-structured questionnaires which were sent to
respondents in three separate waves. The Wave I questionnaire was
sent to graduates in 1983, one year after graduation, and the
Wave II and Wave III questionnaires were distributed in 1984 and
1985 respectively.
In addition to the HELM data set, the author also had recourse to a
related data set arising from a study undertaken by the CNAA on
behalf of the CRE (Commission for Racial Equality). The CRE study
also made use of a highly-structured questionnaire which was
distributed to graduates in the summer of 1987. In total some 884
respondents who had undertaken six types of course took part in the
study. The principal aim of the CRE study was to examine the early
employment histories of black graduates. University graduates were
also sampled in this study and this has made it possible to draw
comparisons between the origins and destinations of graduates on
both sides of the binary divide (see Lyon and Gatley, 1988).
PAGE 17
Part Four: Aims of the Study
In this section the major aims of the study are discussed in
relationship to existing literature in the field. It will be
recalled from our brief discussion in the introduction to this
chapter that this will involve a consideration of two related
matters: a) access to higher education; and b) the destinations of
graduates. These two matters are dealt with in the following
sections. First, however, it should be stressed that the process by
which these aims were formulated was a complex one, as can be seen
from the discussion of the research timetable in Appendix A.
a) Access
The question of access to higher education will involve
consideration of the following matters:-
a) the extent to which public sector institutions of higher education provide places for those originating from working-class and ethnic-minority backgrounds, and women.
b) the extent to which graduates originating from the lower classes are typical or atypical of their class of origin.
c) the process by which students enter higher education, their motivations on entry and the nature of any constraints which may have limited their choice of which course to follow.
a
Since the 1950s, research has consistently shown that children and
young people from working-class origins tend to be less successful
academically than those from more middle-class backgrounds, and this
in turn, accounts for much of the absence of long range social
mobility discussed earlier.
PAGE 18
Douglas (1964), and Douglas and Simpson (1968) looked at the
experiences of 5,362 children born one week in March 1946 (1968: 8).
Using a four-point scale of social class they found that at the age
of eight children originating from the two non-manual groups
performed better than those from the two manual groups on a series
of five standardized tests devised to measure reading, vocabulary,
verbal, non-verbal and mathematical ability. Between the ages of
eight and fifteen, differences were found to increase as regards
reading, vocabulary and mathematical ability, although the
differences narrowed on the remaining two tests (1968: 18).
Another longitudinal study of nearly 16,000 children born in
March 1958 reached broadly similar conclusions to those of Douglas
and Simpson (Davie et al., 1972: 1). Using the registrar-general's
classification of occupations Davie et al. concluded that, whilst 7%
of seven year olds originating from social class I were 'poor'
readers, nearly 50% of those from social class V were (p. 104). A
similar distribution of replies was found for arithmetic, and whilst
13% of those from social class I obtained a 'poor' score on the set
test over 40% of those from social class V did (p. 103).
Other work undertaken in the 1950s and 1960s suggested that children
from working-class origins were less likely to attend grammar
schools than those from middle-class backgrounds. For example,
Floud et al. (1956) looked at 11+ selection in Hertfordshire and
Middlesbrough, and concluded that the son of a professional or
businessman had seven times the chance of attending a grammar school
than the son of an unskilled worker (quoted in Mortimore and
Blackstone, 1982: 12).
PAGE 19
Partly as a result of these trends, young people from working-class
origins were less likely to be entered for public examinations
(High-School Certificate and GCEs) and, in their study of
Huddersfield schools undertaken in the early 1950s, Jackson and
Marsden (1986: 23-4) found that whilst 78% of Huddersfield's male
population were employed in manual occupations their children formed
only 36% of those who were successful at HSC and/or GCE A-level.
Similar conclusions were reached by Douglas and Simpson (1968: 204),
who found that those from more middle-class backgrounds were more
likely than those from working-class backgrounds both to stay on at
school after reaching the school-leaving age and to obtain one or
more GCE 0-levels. Moreover, these differences remained even when
allowance had been made for the intelligence of the pupils. Thus
whilst 77% of those from upper middle-class backgrounds in the 'top'
ability range obtained good certificate passes only 37% of those
from lower-manual backgrounds of the same ability range did, and
whilst 20% of those from upper middle-class backgrounds in the
lowest ability range obtained a certificate pass, none of those from
the two manual groups did.
Similar differences were also found to exist in the social-class
origins of university students, and thus Kelsall et al. (1972: 180)
found that whilst 64.9% of males were employed in manual occupations
in 1961 only 28.1% of their sample of 1960 graduates had fathers in
such occupations.
More recent research suggests that even though most LEAs now operate
PAGE 20
a comprehensive system of education and the number of students
entering higher education has increased, the relative position of
young people from working-class backgrounds has not improved (see
DES 12/83; Mortimore and Blackstone, 1982: 20-1). Moreover, work by
Edwards (1982) and Williamson (1981; 1986: 72-3) suggests that the
proportion of students from working-class origins attending
universities and public sector institutions has not increased and
may actually have declined in recent years.
Research into the education of Britain's ethnic minorities suggests
that whilst young men from West Indian backgrounds fare less well at
school than white children those from Asian origins fare slightly
better. Thus Brown (1984: 147), in his review of the third PSI
study, found that 12% of young white men aged 16-24 had A-level
qualifications (or a degree) compared with under 7% of West Indians
and 19% of Asians. However, at the other extreme 27% of white boys,
but 35% of West Indian and Asian boys left school without a
qualification. Amongst the girls the situation was somewhat
different in so far as whilst 22% of white and 21% of West Indian
girls had no qualification this compared with 50% of Asian girls.
However, 9% of Asian and 11% of white, but only 5% of West Indian
women possessed an A-level pass (or better).
A similar pattern has been found to exist in the proportions of
young people from different ethnic groups entering higher education.
The Rampton Committee (1981) found that whilst 9% of all school
leavers went onto undertake a degree-level qualification, the
comparable figures for West Indian school-leavers was only 2% and 8%
for Asians (Little and Robbins, 1981: 58).
PAGE 21
Although girls tend to achieve as well, if not better, than boys at
school (Douglas and Simpson, 1968: 75; OECD, 1986: 10-21) women are
less likely to enter higher education than men. However, recent
years have seen a marked increase in the proportion of women
entering higher education: thus in 1953-4 just over one-quarter
(25.2%) of new graduates were women, but this figure had risen to
almost 40% (39.6%) in 1982. If this trend continues women may well
form a majority of the student body by the year 2000.
Chapter Four looks at the participation of students in public-sector
institutions of higher education and, in particular, examines the
extent to which these are providing an avenue of social mobility for
those from working-class origins. In an attempt to unravel some of
the factors which might help us to understand why they have been
educationally successful, Chapter Four also looks at the extent to
which graduates from working-class backgrounds are typical or
atypical of their class of origin. The same questions are examined
in relationship to women in Chapter Eight and black graduates in
Chapter Nine.
Three broad explanations have been advanced to explain why young
people from working-class and ethnic-minority backgrounds are less
successful in education and thus the labour market: the genetic,
socio-cultural and educational. It should be said, however, that the
three approaches are not mutually exclusive, rather theorists tend
to adhere to one basic approach whilst stressing that the other two
are also important.
PAGE 22
In recent times the genetic approach is associated with Jencks
(1972) and Eysenck (1973). The proponents of this view frequently
claim that differences in the attainment of children from different
ethnic groups and social classes are inherited and that since
individuals tend to marry people of the same ethnic group/social
class as
educational
themselves
attainment
inequalities in intelligence and hence
are perpetuated from generation to
generation. It should, however, be stressed that these claims are
not made by Eysenck and Jencks themselves but by their 'supporters'
who have fundamentally misinterpreted their work (Tyler, 1977:
82-95).
It is probably true that a person's genotype explains a certain
amount of variance in intelligence, although the actual amount is
uncertain (Tyler, 1877: 82). For example, a problem with Jencks'
work is that it was conducted amongst white people in the United
States and was concerned with individual and not group differences.
What constitutes 'intelligence' is also a problem. Eysenck believes
that there is a common factor 'g' which intelligence tests measure
but which cannot be directly observed. Whether such a factor exists
is not, however, our principal consideration,
lies in the extent to which intelligence
members of some groups (social classes, ethnic
they contain questions which are beyond
rather, our concern
tests tend to favour
groups, etc) where
the socio-cultural
experiences of some people: eg where questions implicitly assume the
existence of a stable horne background or contain words and phrases
which may be 'foreign' to some groups. Evidence suggests that the
construction of tests in this way has, in the past, contributed to
PAGE 23
I I
relatively low 'scores' being achieved by black and working-class
youngsters (Heim, 1970: 104-6). Eysenck (1973) has also argued that
group differences will tend to disappear over time as differences in
intelligence regress towards a common mean. This means that whilst
differences in intelligence may help us to account for why some
individuals are less successful than others, they are less likely to
be able to explain group differences. Furthermore, the genotype can
be influenced by a number of factors which are socially and
culturally determined. Thus research by Davie et al. (1972) suggests
that where a woman smokes, her children are likely to be less
intelligent than those of a non-smoking mother. In addition,
research by Jencks (1972: 82) in the United States also suggests
that the mean IQ of the population has increased somewhat in the
last fifty or so years as a result of a better diet and improved
antenatal care.
In view of these complexities, it is highly unlikely that genetic
factors alone can account for much of the variation in the
attainment of people from different social classes and ethnic
groups, although it may account for some of the variation in the
attainment of different individuals. Moreover, as was mentioned
earlier, there is evidence which suggests that people from
working-class and ethnic-minority backgrounds tend to underachieve
even when controls are introduced for intelligence. Halsey et al.
(1980: 186), for example, have found that the mean IQ of people in
further and· higher education varied between social classes, being
highest for those from working-class origins (127.4) and lowest for
those from service-class origins (120.8).
PAGE 24
The second explanation for the under-achievement of children and
young people from working-class and ethnic-minority backgrounds sees
differences resulting from socio-cultural influences. In these
approaches some children are seen to be disadvantaged because they
are brought up in deprived households. As was mentioned earlier, a
number of these factors can be expected to affect the intelligence
of children indirectly where the mother smokes heavily or is in ill
health during pregnancy, although other factors are likely to be
important during their formative years. Firstly, evidence suggests
that where children are brought up in large and/or single-parent
families and live in poor quality housing they are likely to be less
successful academically at school than other children (Douglas,
1964; Davie et al., 1972). This is important to the extent that such
disadvantages are more likely to be suffered by those from
working-class (Townsend, 1979) and ethnic-minority (Brown, 1984)
backgrounds.
Moreover, work by Bernstein (1973) and the 1982 PSI study
(Brown, 1984) suggests that children from working-class and
ethnic-minority backgrounds may be disadvantaged as a result of
their language. Bernstein (1973) suggests that whilst middle-class
children learn to use an elaborated form of communication which is
relatively independent of context, some working-class children learn
to use a more restricted form of communication rooted in
working-class culture which is more context bound, and less
transferable across social situations. The same may also be true of
some children from West Indian backgrounds and Brown (1984: 128-9)
suggests that many Asian children, and Asian girls in particular,
may have a poor command of the English language. Also important are
PAGE 25

parental attitudes towards education. Although much of the evidence
is contradictory, it seems likely that children, relative to others
within their social class, will tend to perform better in those
instances where they are encouraged to take an interest in their
school work by their parents. This in turn appears to benefit those
from middle- rather than working-class origins (2) .
The third set of explanations advanced to account for the
underachievement of children from working-class and
backgrounds sees the school as contributing to
ethnic-minority
their lack of
success. Several factors may be important: type of school attended,
differences in the formal curriculum taught to children and the
'hidden' curriculum. One obvious way in which more middle-class
children are advantaged in this respect is where their parents are
rich enough to be able to send them to fee-paying or public schools
where they tend to benefit from smaller classes and better
facilities. The tendency for children from more middle-class
families, under the old tripartite system, to attend grammar schools
has already been discussed. Suffice it to say here that any material
disadvantages which adversely affected the academic performance of
children from working-class homes were likely to have been
exacerbated in those instances where the children progressed to
secondary-modern schools. Few LEAs now operate the tripartite system
of education, yet there is some evidence which suggests that the way
in which comprehensive schools are organized may still be
disadvantaging children from working-class origins.
Much of the evidence is,
Tyler, 1977; Mortimore and
however, difficult to interpret (see
Blackstone, 1982). Writing of the
PAGE 26

situation in the United States, Jencks (1972) has concluded that the
type of school which children attend makes little difference to how
well they perform, and he writes, 'eliminating differences between
elementary schools would reduce cognitive inequality by 3% or less'
(1972: 91), and the Plowden Committee on primary education in
Britain reached very similar conclusions (Peaker, 1967). The
approach taken
Bryne et al.
psychological
by Plowden has,
( 1975: 25-6) who
in orientation and
however,
argue
there
been criticized by
that it was far too
were methodological
deficiencies in the study in so far as the measures employed appear
to have assumed a priori that parental attitudes and not the school
attended were of major importance. More fundamentally, they continue
(p. 34-5), social class was used as an explanatory variable rather
than as a relationship (p. 7). This is of prime importance to
Bryne et al. in so far as the parents of more middle-class children
have more power and control over educational resources and are able
to manipulate the educational system to their own and their
children's advantage. Thus Byrne et al. (1975) argue that within the
state sector children from more middle-class backgrounds attend
better schools as measured by staff-pupil ratios and the provision
of various facilities. This situation arises because of differences
in the geographical spread of people within LEAs, such that children
from working-class origins tend to live in poorer inner-city areas
and council estates on the outskirts of Britain's towns and cities
which tend to have poorer schools and educational facilities. In
contrast to this, children from more middle-class backgrounds tend
to live on private estates near to schools which have better staff
and other resources. Similarly, Rex and Tomlinson (1979: 19-24) show
us that black people tend to live in distinct communities in
PAGE 27

inner-city areas, and their children are likely to attend the poorer
schools.
The process by which resources come to be unequally distributed
between schools is much more difficult to explain, and several
factors are
predominantly
probably important. Firstly, because of the
middle-class composition of their student body
schools serving private estates tend to achieve better examination
results which in turn means they tend to attract the best teachers.
Secondly, the parents of their children are likely both to be more
articulate and to take an interest in the running of the schools,
and as such they are more likely to put pressure on governors and
local authorities to provide resources, help with fund raising and
may even make monetary gifts to the school. Finally, within the
inner-cities schools often lack adequate resources~ teaching is
likely to take place in older, unsuitable buildings, and, because of
falling rolls, a rather restricted range of subjects may be taught.
Other writers (for example Lawton, 1975; Nash, 1973) point to
differences in the curriculum taught to children in school and the
way in which teachers expectations of how children will perform and
of how intelligent they are determines what they are taught. Thus,
and especially within streamed comprehensive schools, those children
perceived as 'bright' tend to be taught a distinctly traditional or
'academic' curriculum in many ways similar to that taught in the old
grammar schools, whilst those perceived as less bright are taught a
more practical or 'utilitarian' curriculum in many ways similar to
that taught in the old secondary modern schools. One effect of this
is that children initially labelled as intelligent tend to succeed
PAGE 28
I
and those labelled as less intelligent tend to fare much less well
(Cicourel and Kitsuse, 1963; Rosenthal and Jacobson, 1968}.
Differences have also been noted in the curriculums taught to girls
and boys, and whilst boys tend to study mathematics and science
subjects, girls tend to study languages and the humanities (see
Kelly, 1981; Arnot, 1986; OECD, 1986}. These differences in the
school curriculum are unlikely to limit the chances of women
entering higher education, but they are likely to constrain the
range of subjects which women are able to study which, as will be
argued later in this chapter, is likely to limit the opportunities
open to them in the labour market.
Differences may also exist, according to both social class and
gender, in the 'hidden' curriculum taught to children in school.
Writing from a Marxian perspective, Bowles and Gintis (1976} in the
United States and Harris (1982} in Australia argue that a 'hidden'
curriculum exists in schools which aims to produce a servile
workforce for industry which will work for relatively low wages and
accept unquestioningly the decisions of the management of the firms
which will eventually employ them. In this approach the basic
organization of the school with its hierarchy of headmaster, teacher
and pupil is seen to mirror the basic structure of industrial firms
and various disciplinary measures are employed to keep children in
check. The brighter children are, however, subjected to less
stringent forms of teaching and are encouraged to develop social
relations which emphasize autonomy, independence and creativity.
Reference should also be made to the work of Willis (1977} who
PAGE 29
argues that for many working-class boys education involves a clash
of culture with the academically-orientated middle-class culture of
the school, which many reject and adopt in an exaggerated form the
more 'masculine' culture of the working-class home. The result is
that many working-class boys drop out of education as soon as they
can.
Moreover, feminist writers such as Clarricoats (1980) have argued
that schools instil into their children stereotyped images of
'masculinity' and 'femininity' which differ according to the social
class of the child. To take the two extremes, Okely (1978) has
argued that whilst the public schools attempt to instil into boys
traits of initiative, independence and leadership, girls are taught
to be passive, conformist and obedient, and encouraged to be
submissive and to accept society - which is predominantly
male-dominated - the way it is. Following the work of Willis (1977)
cited earlier, Arnot (1986: 136-7) argues that the education of
girls within state schools often involves a clash between the
'feminine' culture of the working-class home and the more
middle-class culture of the school, one result of which is that some
girls reject the culture of the school and come to accept the
culture of the home in exaggerated form. Thus they become
excessively 'feminine' and exaggerate traits of romance, marriage
and sexuality, and leave school as soon as they can.
Although these approaches have been questioned (see Mortimore and
Blackstone, 1982: 92-4) and the arguments are still in a state of
flux, one would logically expect those children taught non-academic
subjects to fare less well in their examinations - when, that is,
PAGE 30
they are entered for them whilst, if Bowles and Gintis and
feminist
'hidden'
writers are
curriculum,
underachievement of
correct concerning
this would help
lower-class
the influence of
to account for
youngsters and
the
the
the
under-representation of women in higher education. Moreover, as we
shall see in the next section, it may also handicap these groups
where they lack those personal qualities which employers value (3).
From the previous discussion it would appear that graduates from
lower-class backgrounds are atypical of their class of origin in so
far as they have been academically successful and have continued in
education for a prolonged period of time. Why they, rather than
other members of their class, should have entered higher education
is a question which is discussed more fully in Chapter Four.
Chapter Seven examines the process by which graduates enter higher
education, their motivations on entry, secondary education and the
nature of any factors which might have constrained them in their
choice of which course of study to undertake.
b) Destinations
The second main question to be examined concerns the relationship
which might exist between the origins and destinations of graduates,
that is, the extent to which the social-class origins of graduates
exerts an influence (if any) on their future employment. There are
three main matters which need to be discussed here:-
PAGE 31
a) the occupations and social-class destinations of graduates, and the differences, if any, which might exist according to social-class origins.
b) the aspirations of graduates.
c) the courses which graduates undertook as students and the links, if any, which exist between the social-class origins of graduates, their secondary education and entry into the labour market.
Earlier in this chapter, the work of Kelsall et al. (1972) was
mentioned who found that women and men from working-class origins
were more likely to be employed in lower-status occupations than men
from more middle-class origins. The HELM data set is interesting
because it allows us to test a number of their ideas, and it is
worthwhile briefly examining their approach here. Using occupational
choice theory, they argued that women as a whole and men from
working-class backgrounds had lower aspirations than men from
middle-class backgrounds (pp. 68-78).
Occupational-choice theorists believe that occupational choice is
essentially a process which gradually unfolds during the individuals
life-cycle (Ginzberg et al., 1951; Super, 1953; Williams, ed.,
1974). Various factors can be identified as acting upon each
individual, ranging from their sex, race and 'inborn' abilities
through to factors such as social class and school/higher education
institution attended. In these approaches the labour market is seen
as a sort of 'matching machine' in which the aspirations and career
preferences of individuals are matched with the needs and
preferences of employers in determining the 'level' at which the
individual enters the job market.
In general one can identify a number of key points at which social
PAGE 32
class can be said to intervene in influencing the occupational
preferences and employment outcomes of graduates in particular and
people in general. Social class can be expected to have already
exerted a strong influence on the career preferences of future
graduates by the time they enter secondary school. Through
identification with the father's and mother's occupational roles the
young child can be expected to form a vague notion as to the type of
work which he or she wants to do. Such notions, however, are likely
to be very vague, and may involve for instance simply working 'in a
factory', 'on the land', 'in an office', or (in the case of many
young girls) becoming a mother and housewife. Evidence from the
Granada Television longitudinal study suggested that children born
into upper-class families had far clearer notions than those born
into working-class families regarding their future employment and
the need to obtain the 'right' qualifications. Because of these
differences in the early-life socialization of children across the
social classes one would expect those from manual backgrounds to
have lower aspirations than those from more middle-class
backgrounds, and the aspirations of those from middle-class
backgrounds to be fairly similar to those of their parents.
The role which secondary schools might play in constraining the
educational opportunities available to women and young people from
working-class origins has already been discussed. Suffice it to add
here that similarly one might expect the curriculum taught to
children to have a direct influence upon how they come to view the
occupational structure and the type of career which they can
realistically hope to enter when they leave school. For example,
writing in 1962 Liversidge found that children attending
PAGE 33
secondary-modern and grammar schools made a '··· startlingly
accurate appraisal of their life chances .•• , and (had) a shrewd
appreciation of the social and economic implications of their
placing within the educational system' (p. 74). Today one might
expect to find similar differences to exist between fee-paying and
state schools, between comprehensive schools in 'rich' and 'poor'
areas and between the 'top' and 'bottom' streams of individual
comprehensive schools. Willis (1977: 102-3), for example, found that
the boys included in his study had a dislike of 'mental work' and
aspired towards employment within manual occupations.
Reference should also be made to the works of both Levin (1976) and
Kelley (1978) who point out that graduates from high-status
backgrounds can be expected to benefit from the direct inheritance
of wealth and from family connections which make it easier for them
to find suitable employment. This they term the lagged effect in so
far as it is likely to exert an influence on the employment
destinations of graduates sometime (and perhaps many years) after
graduation.
Other reasons for believing that women and graduates from
working-class and ethnic-minority backgrounds might be disadvantaged
in the labour market stem from the nature of the graduate labour
market itself, and the process by which employers reach their
recruitment decisions.
The nature of the graduate labour market is discussed more fully in
Chapter Six, so suffice it to say here that occupational choice
theory can be criticized in so far as it tends to treat the graduate
PAGE 34
labour market as being relatively homogenous in which perfect
competition exists, people are undifferentiated in their skills and
the laws of supply and demand determine wage rates. This view has
not gone unchallenged and it is to be doubted if such a state of
affairs corresponds with reality. In particular, it ignores
constraints which limit the employers' choice of whom to employ.
Prime amongst these constraints is the level of skill needed to
undertake a particular job. Many of the jobs traditionally
undertaken by graduates are of such a nature that specific skills
and a high degree of training are needed to undertake them: for
example medicine, the law and engineering. The growth in recent
years in the numbers of courses leading to vocational qualifications
has led to attempts to develop a typology of courses based upon
their vocational specificity (Brennan, 1984; Brennan and McGeever,
1986), such that where complex skills are required to undertake a
particular job and suitable applicants are in short supply graduates
with degrees in these subjects tend to perform better in the labour
market than others (Brennan and McGeever, 1986; First Destination
statistics). This is important to us since the influence which
gender and the social class origins of graduates exert on employment
outcomes will be mediated to a large extent by the courses of study
which they have undertaken. We saw earlier that there are major
differences in the school curriculums taught to boys and girls, and
thus one might expect women to be constrained in their choice of
which subject to undertake in higher education, which, in turn,
might constrain their choice of career.
Similarly it was argued earlier that children from more lower-class
origins were more likely than others to undertake a 'utilitarian'
PAGE 35

rather than 'academic' curriculum. Because of the lack of stress
which the 'utilitarian' curriculum places on ac~emically-orientated
subjects one might expect such people to be constrained in their
choice of which course to follow. Should this mean that graduates
from manual backgrounds have a tendency to undertake the more
generalist (or non-vocationally-orientated) courses, one would
expect them to be less successful in the labour market than they
would have been had they taken more vocationally-orientated
subjects.
Evidence collected by Kogan and Boys (1984) and Roizen and Jepson
(1985) suggest that employers often put less stress on the
individual graduate's degree than they do on other educational
factors. Other things being equal, employers had a preference for
those candidates who had attended universities rather than
polytechnics, attended selective (public and academic) rather than
comprehensive schools, who had obtained high rather than low A-level
scores and had undertaken an academic rather than utilitarian (or
practical) school curriculum. On each of these factors one might
reasonably expect graduates from working-class backgrounds to be
disadvantaged: they are more likely to have attended comprehensive
schools and public sector institutions of higher education, they are
less likely to have undertaken an academic school curriculum, and
tend to have lower A-level scores.
Educational factors are not, however, the only ones which employers
take into account in their recruitment strategies. The works of
Kogan and Boys (1984) and Roizen and Jepson (1985) suggest that
employers often put less stress on the actual degree course
PAGE 36
undertaken than on personality factors and have a preference for
graduates with a proven record of management and communication
skills, such that graduates who obtained such skills in, say,
cricket or rugby union captaincy were preferred to those without
such experience. A similar approach is taken by Buley (1972) who
argues that employers value graduates for three main reasons: their
general intelligence and personal qualities; their experience of the
higher educational process (as opposed to their specific education)
which is believed to contribute to their intellectual development;
and, lastly, their vocational and related skills gained during the
higher educational process. As was mentioned earlier, there is some
evidence that because of their early socialization and secondary
education women and graduates from ethnic-minority and working-class
backgrounds might be lacking in those personality factors which
employers value. If this . is so, then one would expect them to be
further disadvantaged in the labour market.
Finally, the traditional employment strategies adopted by employers
and their sheer conservatism may be important to the extent that
employers have a fixed stereotype image of the ideal employee.
Although this factor is, arguably, unlikely to disadvantage
graduates from working-class backgrounds, it may disadvantage women
and black graduates seeking employment in some occupations which
traditionally have been undertaken by white men.
To summarize, there are several reasons for believing that that our
three lower classes might be disadvantaged in the graduate labour
market: a) following occupational choice theory they may have rather
restricted aspirations; b) they may be disadvantaged in the basic
PAGE 37
i)
recruitment process where they lack the academic qualifications,
personal qualities and other factors which employers value; and
c) those from more middle-class backgrounds can be expected to
benefit from the direct inheritance of wealth.
In Chapter Five the experiences of graduate men and women in the
labour market is examined in terms of their social-class origins. In
Chapter Six this analysis is repeated making allowance for the types
of course which graduates had undertaken, and the aspirations and
personality traits of graduates are examined. In Chapter Seven the
thesis looks at the secondary education of graduates, the type of
curriculum which they undertook at school and the extent to which it
correlated with their social-class origins, on the one hand, and
constrained their choice of which subject to follow at college on
the other. Chapter Eight looks at the employment destinations of
graduate men and women in terms of feminist approaches which argue
that gender can be regarded as a dimension of social class. In
Chapter Nine the experiences of black and white graduates are
examined. Finally, in Chapter Ten the major findings of the study
are reviewed in relationship to the major aims of the thesis
outlined earlier.
The next chapter looks in detail
data sets which have been used
at the HELM and CRE projects
as bases for this study. Lastly,
Chapter Three looks at the major concepts used in the study, and in
particular focuses upon the problems encountered in constructing a
social-class schema for use in it.
PAGE 38
CHAPTER TWO: RESEARCH METHODOLOGY
Data for the Ph.D have come from a three-year longitudinal study of
public sector graduates - the HELM (Higher Education and the Labour
Market) project - directed by John Brennan of the CNAA with the
assistance of Dr. Philip McGeevor of Bulmurshe College of Higher
Education. Full details of this project, its background, aims,
methodology and a summary of its findings are presented in their
book Graduates at Work: Degree Courses and the Labour Market (1988).
Background to the Study
In 1987 the CNAA awarded over 40% of new U.K. degrees and it is now
the largest degree awarding body in Britain, yet little is known
about the origins and destinations of its students. The Further
Education Statistics published yearly by the DES only provides a
detailed breakdown of the student population by age, sex and
institution attended. Separate figures are not given relating
specifically to those studying for first and higher degrees, and no
statistics are given on the educational, social-class and ethnic
origins of students. Similarly the CNAA, in its Annual Report only
gives details of the numbers of students studying for degrees broken
down by year of study, subject and faculty grouping, and of the
total number of degrees awarded.
Information on the employment destinations of both university and
public-sector graduates is, however, collected annually by the
Association of Graduate Careers Advisory Services (AGCAS) who
publish the First Destination Statistics. These show the employment
PAGE 39
destinations of graduates six months after leaving college broken
down by gender, course of study, class of degree and institution
attended. Originally this information was collected to help the
careers service guide students into appropriate careers, although in
recent years it is being increasingly used as a guide to manpower
planning and course development. The First Destination statistics
are 1 however, of limited value in so far as they only give details
of the destinations of graduates six months after graduation. They
give little indication of the quality of people's work, no attempt
is made to 'follow-up' graduates and examine the paths which their
careers have subsequently taken, and no analysis is performed to
show how graduates differentiated according to their social-class
and ethnic origins have fared in the labour market.
The absence of adequate descriptive data on the composition of the
student body attending public sector institutions is hard to
understand when one considers the reasons for their establishment.
In Chapter Four the role envisaged for the polytechnics in providing
an avenue of social mobility for disadvantaged groups is briefly
discussed and it is argued that although the 1966 White Paper A Plan
for Polytechnics and Other Colleges (Cmnd. 3006) did not
specifically say that the polytechnics were intended to expand
opportunities for working-class youngsters, this is how it has
generally been interpreted. Thus it is rather strange that the
polytechnics, and later the Colleges of Higher Education, have not
attempted to monitor the social-class and ethnic composition of
their student intake, and - unlike UCCA - the PCAS application form
does not require students to state their father's occupation.
Similarly, given the stress which was placed on the role which the
polytechnics might play in providing trained manpower for industry
PAGE 40
and commerce it is odd that more detailed statistics have not been
kept of the destinations of graduates and of the links which might
exist between course of study and the labour market.
Aims of the HELM Project
The main aim of the HELM project was to help to try to overcome
these deficiencies by collecting detailed information on the origins
and destinations of a 10% sample of CNAA graduates. In their Final
Report on the HELM study Brennan and McGeever (1986: 2) tell us
that:-
We were interested in the characteristics of their (graduate) employment and their relationship to previous education and training. We were interested in the expectations and opinions of the graduates themselves towards current and future jobs, towards the value of higher education. We were interested in the transition between higher education and employment, the different routes between courses and jobs and the role played by postgraduate study, short-term or part-time employment and other experiences following graduation. Above all, we were interested in differences between degree courses, differences reflected in course objectives which seek to prepare students for employment in very different ways. Thus, we were interested in the range of employment outcomes from different kinds of course, in the different rates of securing employment, in the qualities of jobs eventually obtained.
In other words, the main concern of their research lay in
understanding the role of higher education in allocating highly
qualified personnel to positions within the labour market, and in
particular they were concerned with examining the links which might
exist between course of study and employment.
However, Brennan and McGeevor present only a preliminary analysis of
the HELM data set. They have little to say about the origins of
graduates, and they do not examine in any great depth how the
PAGE 41
destinations of graduates might differ as regards their gender,
ethnicity and social-class origins. Both gender and ethnicity have,
however, been examined in other HELM publications (see Brennan and
McGeevor (1985) and Lyon and Gatley (1988) on ethnicity, and Chapman
(1986) on gender). These studies are, however, mainly atheoretical
in orientation, in so far as they present the data and do not
attempt to analyse it in terms of theoretical approaches to social
class, social stratification, gender and ethnicity.
This Ph.D can be differentiated from these other works originating
from the HELM study in so far as its main concern has lain in
examining the role of public sector institutions in providing an
avenue of social mobility for disadvantaged groups: principally
those from working-class backgrounds, but including ethnic
minorities and women. As was mentioned in Chapter One this has two
main dimensions: a) access, that is the extent to which
public-sector institutions are catering for the needs of
working-class, black and women students, and b) destinations, that
is the relative success of such graduates in the labour market. The
process, however, by which the aims of the project were formulated
was a complex one as can be seen from the discussion in Appendix A.
How the study was Undertaken
The HELM study was undertaken by means of a panel survey of more
than 4,000 students who graduated from public sector institutions in
June 1982 and who were contacted one year, two years and three years
after graduation.
The sample was not a random one, but instead was deliberately chosen
PAGE 42
in order to test the major hypotheses of the study which, as we have
seen, were concerned with understanding more fully the relationship
which exists between course of study and entry into the labour
market. To quote Brennan and McGeevor (1988: 9):-
Course types were selected in order to explore different forms of relationships between degree qualifications and jobs. The criteria used were subject field, curriculum organization (eg single subject/multidisciplinary), course objectives (eg liberal/professional), and size of enrolments. Individual courses were selected (i) as being typical of the course type following inspection of prospectuses and consultation with CNAA board secretaries and members and (ii) to obtain a good geographical and institutional spread.
Thus the resulting sample consisted of all those graduates who had
studied 122 different courses, grouped for analytical purposes into
31 course types, at 33 public sector institutions. Table 2.1 shows
how these graduates were distributed between courses. From this
Table we see the total number of graduates included in the initial
sample varied from 73 for Mathematics to 246 for Humanities. Overall
a 66% response rate was achieved to the first wave: the actual
response varying from 43% for Law to 88% for Nursing.
There were a number of advantages is using the HELM data set to
undertake this study. Firstly, the large number of respondents to
the survey has made it possible not only to undertake a detailed
analysis of how all graduates have fared in the labour market, but
to look in depth at some sub-samples. Thus, for example, it has been
possible to examine both gender and social-class differences in the
employment destinations of graduates undertaking different types of
courses. Moreover, even though the number of participants to the
HELM study declined from 2,635 in the Wave I survey to 1,451 in the
Wave III survey, there were still enough respondents to make such an
analysis possible.
PAGE 43
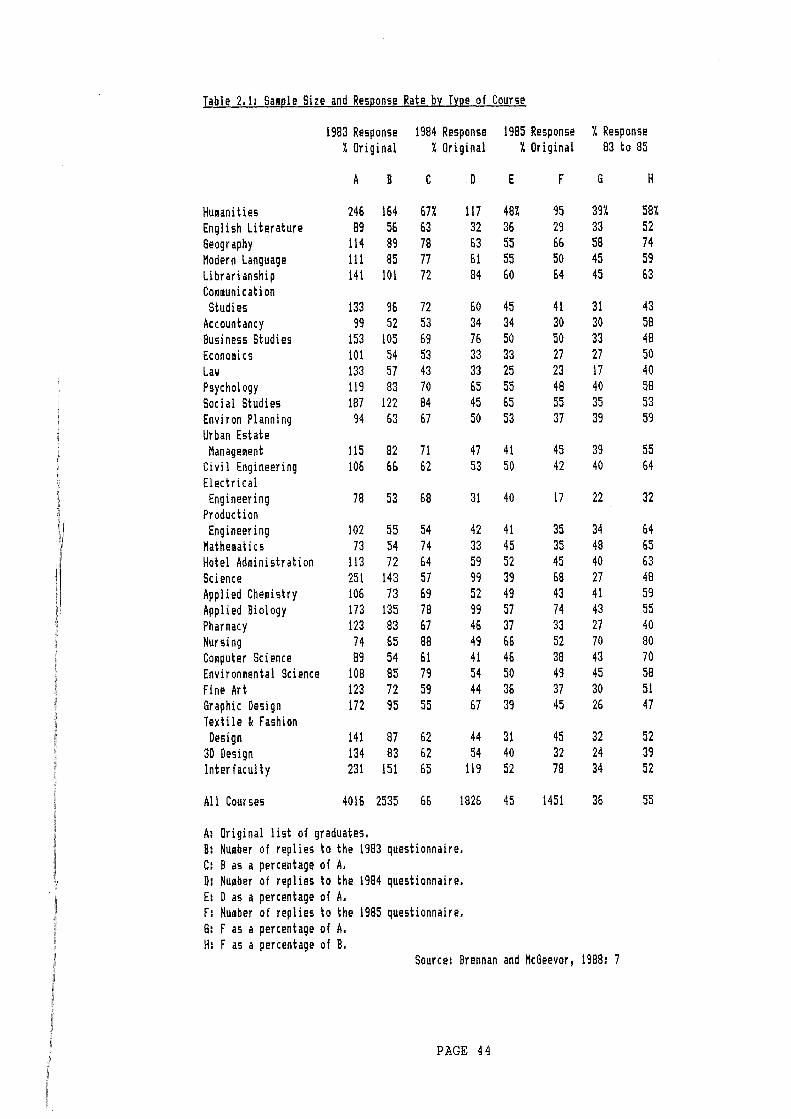
Table 2.1: Sa;ple Size and Response Rate by Type of Course
1983 Response 1984 Response 1985 Response % Response % Original % Original % Original 83 to 85
A B c D E f G H
Humanities 246 164 67% 117 48% 95 39% 58% English Literature 89 56 63 32 36 29 33 52 Geography 114 89 78 63 55 66 58 74 Modern Language 111 85 77 61 55 50 45 59 Li br ari anshi p 141 101 72 84 60 64 45 63 Communication Studies 133 96 72 60 45 41 31 43
Accountancy 99 52 53 34 34 30 30 58 Business Studies 153 105 69 76 50 50 33 48 Econo11ics 101 54 53 33 33 27 27 50 Law 133 57 43 33 25 23 17 40 Psychology 119 83 70 65 55 48 40 58 Social Studies 187 122 84 45 65 55 35 53 Environ Planning 94 63 67 50 53 37 39 59 Urban Estate
Manage111ent 115 82 71 47 41 45 39 55 Civil Engineering 106 66 62 53 50 42 40 64 Electrical Engineering 78 53 68 31 40 17 22 32
Production Engineering 102 55 54 42 41 35 34 64
Mathe11atics 73 54 74 33 45 35 48 65 Hotel Administration 113 72 64 59 52 45 40 63 Science 251 143 57 99 39 68 27 48 Applied Chemistry 106 73 69 52 49 43 41 59 Applied Biology 173 135 78 99 57 74 43 55 Pharmacy 123 83 67 46 37 33 27 40 Nursing 74 65 88 49 66 52 70 80 Computer Science 89 54 61 41 46 38 43 70 Environmental Science 108 85 79 54 50 49 45 58 fine Art 123 72 59 44 36 37 30 51 Graphic Design 172 95 55 67 39 45 26 47 Textile ~ Fashion Design 141 87 62 44 31 45 32 52
3D Design 134 83 62 54 40 32 24 39 Interfaculty 231 151 65 119 52 78 34 52
All Courses 4016 2535 66 1826 45 1451 36 55
A: Original list of graduates. B: Number of replies to the 1983 questionnaire. C: B as a percentage of A. D: Number of replies to the 1984 questionnaire. E: D as a percentage of A. F: Number of replies to the 1985 questionnaire. 6: F as a percentage of A. H: F as a percentage of B.
Source: Brennan and McGeevor, 1988: 7
PAGE 44
Secondly, because the HELM survey made use of three large
questionnaires, each of which ran to more than twenty sides, the
resulting data set contains a rich variety of data on areas of
interest to us. These include data on the social-class, ethnic and
educational origins of graduates, their employment destinations and
quality of their work, aspirations, major personality traits and
their attitudes towards secondary, further and higher education,
employment, and sexual and racial disadvantage. (Further details of
these questionnaires and of the use which was made of them are given
in Appendix A).
Thirdly, since the study was longitudinal in nature it was possible
to study entry into the labour market as a process rather than at
one point in time. Unfortunately, as some of the key information
from the Wave II questionnaire was not coded it was not possible to
exploit this facility fully. Nevertheless, it was possible to
examine the employment destinations of graduates at two points in
time (one year and three years after graduation), and to look at how
the attitudes, aspirations and experiences of graduates during their
first year in the labour market influenced their subsequent
employment.
Finally, the data set is unique and has a certain 'pioneering
quality' about it, in so far as it is concerned with what is to a
large extent •unexplored territory'. With a few notable exceptions
(Donaldson, 1975; Whitburn et al., 1976, Williamson, 1981b) previous
studies have tended either to ignore public-sector institutions, or
have concentrated their attention on the universities and made only
passing reference to the polytechnics and colleges of higher
PAGE 45
education.
A number
in using
problems
of technical and methodological problems were encountered
the HELM data set for the present study. The technical
related mainly to the coding and computer analysis of the
data, since these are discussed in Appendix A they need not detain
us here. Rather we are concerned here with the methodological
problems which were encountered. Firstly, because a non-random
sample was used it is impossible to calculate the extent to which
the sample is representative of all graduates. The result is that it
is not possible to draw strict inferences from our findings to the
graduate labour market as a whole. Several sources of bias can be
identified which mitigate against such direct inferences. Since
courses rather than individuals were sampled, this will have biased
the composition of the final sample if, as is suggested in
Chapter Seven, graduates from working-class origins tend to
undertake certain courses with the result that they may be under- or
over-represented in the sample. Moreover, since a full range of
courses was not sampled its composition may have been unduly
influenced by the 'quirks' of individual admissions tutors, who may
give preference to certain types of candidates such as mature
students.
Luckily there is some evidence which strongly suggests that these
problems are not unduly serious and that HELM respondents are
broadly representative of CNAA graduates as a whole. Table 2.2 shows
the extent to which Wave I respondents were broadly representative
of all CNAA students enrolled in 1982, excluding those undertaking
education. From this it can be seen that - with the exception of
Business and Management who were under-represented in the Wave I
PAGE 46
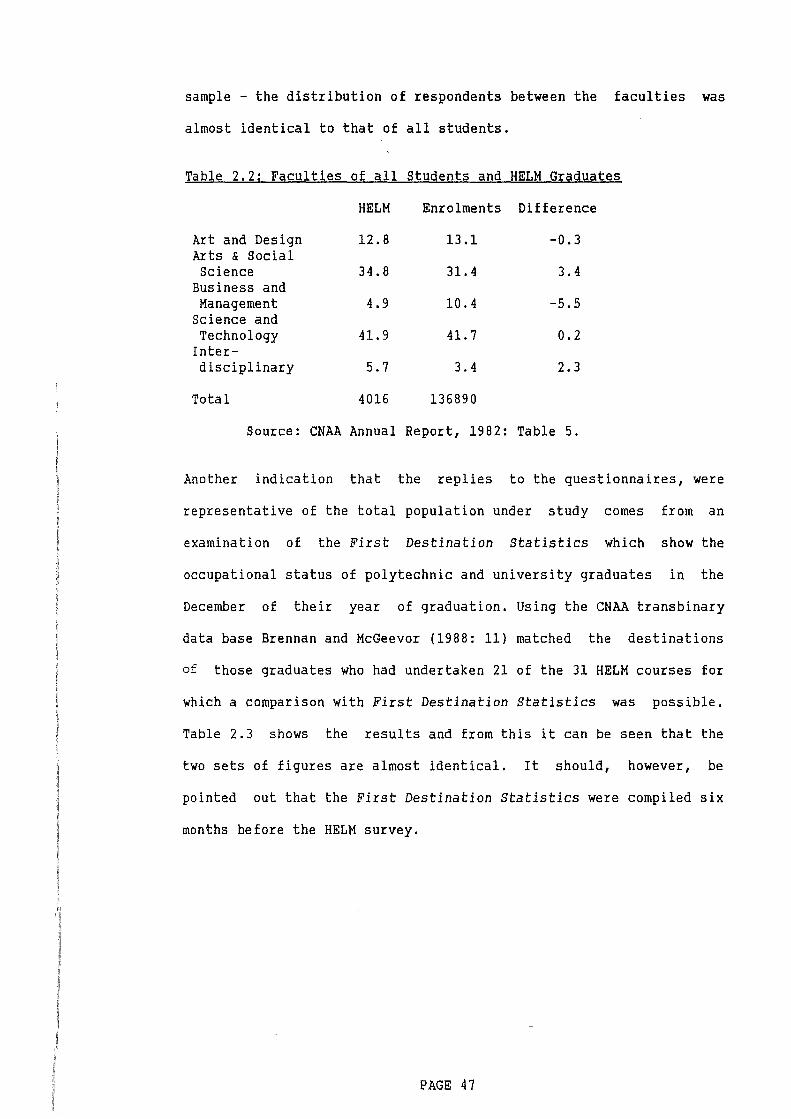
sample - the distribution of respondents between the faculties was
almost identical to that of all students.
Table 2.2: Faculties of all Students and HELM Graduates
HELM Enrolments Difference
Art and Design 12.8 13.1 -0.3 Arts & Social Science 34.8 31.4 3.4
Business and Management 4.9 10.4 -5.5
Science and Technology 41.9 41.7 0.2
Inter-disciplinary 5.7 3.4 2.3
Total 4016 136890
Source: CNAA Annual Report, 1982: Table 5.
Another indication that the replies to the questionnaires, were
representative of the total population under study comes from an
examination of the First Destination Statistics which show the
occupational status of polytechnic and university graduates in the
December of their year of graduation. Using the CNAA transbinary
data base Brennan and McGeevor (1988: 11) matched the destinations
of those graduates who had undertaken 21 of the 31 HELM courses for
which a comparison with First Destination Statistics was possible.
Table 2.3 shows the results and from this it can be seen that the
two sets of figures are almost identical. It should, however, be
pointed out that the First Destination Statistics were compiled six
months before the HELM survey.
!?AGE 47
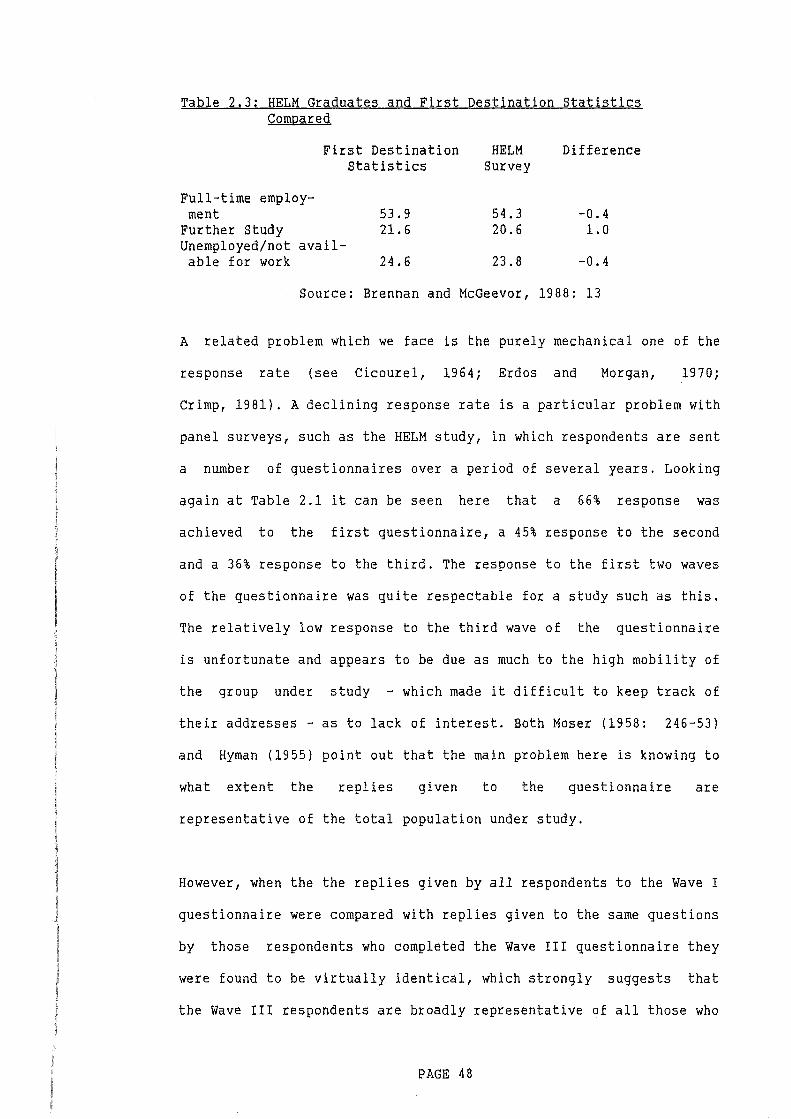
Table 2.3: HELM Graduates and First Destination Statistics Compared
Full-time employ-ment
Further study
First Destination Statistics
53.9 21.6
Unemployed/not avail-able for work 24.6
HELM Survey
54.3 20.6
23.8
Difference
-0.4 1.0
-0.4
Source: Brennan and McGeevor, 1988: 13
A related problem which we face is the purely mechanical one of the
response rate (see Cicourel, 1964; Erdos and Morgan, 1970;
Crimp, 1981). A declining response rate is a particular problem with
panel surveys, such as the HELM study, in which respondents are sent
a number of questionnaires over a period of several years. Looking
again at Table 2.1 it can be seen here that a 66% response was
achieved to the first questionnaire, a 45% response to the second
and a 36% response to the third. The response to the first two waves
of the questionnaire was quite respectable for a study such as this.
The relatively low response to the third wave of the questionnaire
is unfortunate and appears to be due as much to the high mobility of
the group under study - which made it difficult to keep track of
their addresses - as to lack of interest. Both Moser (1958: 246-53)
and Hyman (1955) point out that the main problem here is knowing to
what extent the replies given to the questionnaire are
representative of the total population under study.
However, when the the replies given by all respondents to the Wave I
questionnaire were compared with replies given to the same questions
by those respondents who completed the Wave III questionnaire they
were found to be virtually identical, which strongly suggests that
the Wave III respondents are broadly representative of all those who
PAGE 48
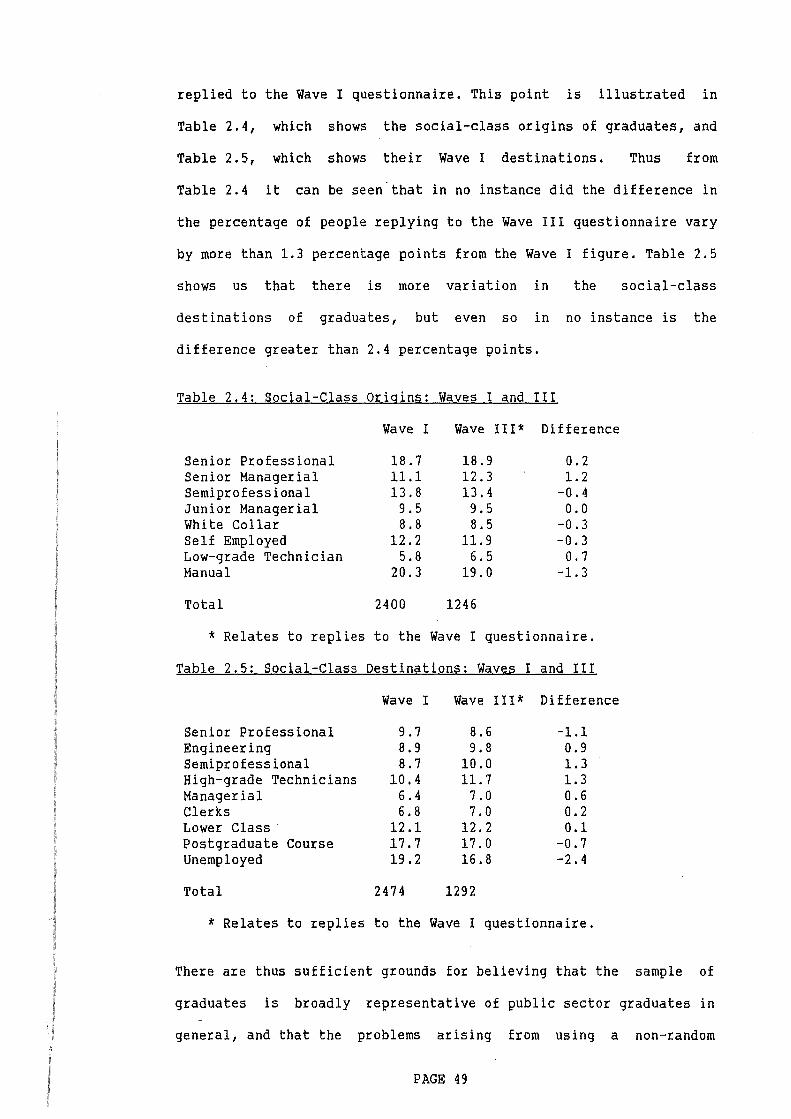
replied to the Wave I questionnaire. This point is illustrated in
Table 2.4, which shows the social-class origins of graduates, and
Table 2.5, which shows their Wave I destinations. Thus from
Table 2.4 it can be seen.that in no instance did the difference in
the percentage of people replying to the Wave III questionnaire vary
by more than 1.3 percentage points from the Wave I figure. Table 2.5
shows us that there is more variation in the social-class
destinations of graduates, but even so in no instance is the
difference greater than 2.4 percentage points.
Table 2.4: Social-Class Origins: Waves I and III
Senior Professional Senior Managerial Semiprofessional Junior Managerial White Collar Self Employed Low-grade Technician Manual
Total
Wave I
18.7 11.1 13.8
9.5 8.8
12.2 5.8
20.3
2400
Wave III* Difference
18.9 12.3 13.4 9.5 8.5
11.9 6.5
19.0
1246
0.2 1.2
-0.4 0.0
-0.3 -0.3
0.7 -1.3
* Relates to replies to the Wave I questionnaire.
Table 2.5: Social-Class Destinations: Waves I and III
Senior Professional Engineering Semiprofessional High-grade Technicians Managerial Clerks Lower Class Postgraduate Course Unemployed
Total
Wave I
9.7 8.9 8.7
10.4 6.4 6.8
12.1 17.7 19.2
2474
Wave III* Difference
8.6 9.8
10.0 11.7
7.0 7.0
12.2 17.0 16.8
1292
-1.1 0.9 1.3 1.3 0.6 0.2 0.1
-0.7 -2.4
* Relates to replies to the Wave I questionnaire.
There are thus sufficient grounds for believing that the sample of
graduates is broadly representative of public sector graduates in
general, and that the problems arising from using a non-random
PAGE 49
sample is not serious, but, owing to the declining response rate,
the Wave III replies should be treated with some caution (4).
A more fundamental problem occurs because the sample of graduates
was drawn from the public sector only, university graduates being
ignored. This raises two kinds of problem. Concerning the first
problem, studies of the recruitment practices of employers (reviewed
in Chapter Six) strongly suggest that many have a preference for
university rather than public sector graduates. This view is
reinforced in the First Destination Statistics which show that the
rate of unemployment amongst university graduates tends to be only
about half that for polytechnic graduates six months after
graduation. Moreover, Pearson (1976) suggests that university
graduates tend to achieve higher-status positions than public
sector ones. The net effect of this could be to 'compress' the range
of jobs within which public sector graduates are employed with the
result that both CNAA graduates and those from working-class
backgrounds might tend to be employed in lower-status occupations
than their university and more middle-class counterparts. If this is
so then it is likely to affect the nature of the relationship which
might exist between the origins and destinations of CNAA graduates
which could be less marked than that which might exist for all,
including university, graduates.
Concerning the second problem, a number of studies (see
Chapter Four) have shown that young people from manual backgrounds
are more likely to attend public sector institutions than their
middle class peers who are more likely to attend the universities
(although students from middle-class backgrounds are in the majority
in both types of institution). Because of this it can be argued that
PAGE 50
working-class and middle-class students attending public sector
institutions are atypical of their class of origin. Working-class
students being a 'success', in so far as they are attending an
institution of higher education, and middle-class students being a
'failure' in so far as they have failed to get into a university. To
the extent that this reflects differences in the aspirations and
motivations of the two groups, one might expect this to be reflected
in how well they perform in the labour market after graduation. Thus
it is possible that graduates from working-class origins who
attended public sector institutions might perform as well as their
university counterparts, whilst those from more middle-class origins
who attended public sector institutions might perhaps perform
somewhat worse than their university counterparts. If this is so it
is likely to confuse even further the relationship which exists
between the origins and destinations of graduates.
Fortunately, a recent study by Boys and Kirkland (1987) reviewed
in Chapter Six - has looked at the early career histories of CNAA
and university graduates, and their work suggests that although
university graduates as a whole tended to be more successful in the
labour market than CNAA graduates, much of the variance could be
explained by differences in the performance of Oxbrldge graduates,
on the one hand, who fared best in the labour market, and college of
higher education graduates, on the other, who fared worst. In
contrast, few differences were found in the performance of 'other'
university and polytechnic graduates. Since only a relatively small
proportion of graduates have Oxbridge degrees and only 15% of HELM
respondents had attended a college of higher education, the Boys and
Kirkland study would tend to support the contention that the failure
of the HELM study to examine university graduates is not a serious
PAGE 51
problem (5).
Another set of problems which were encountered in undertaking this
study arose from secondary analysis - that is having to use a data
set which had been collected for another purpose. This problem
occurs because the ideal way in which to undertake a research
project is to begin by first defining the problem under
investigation, and then operationalizing the concepts in such a way
that they can be researched using a methodological approach which
has been specifically devised to answer the questions in which we
are interested. Since secondary analysis, by definition, implies
using data which has been collected by someone else for another
purpose this approach is simply not possible. The researcher usually
has no control over the questions asked and has little control over
coding: he is therefore unable to operationalize the concepts in
which he is interested. Moreover, the data set may be old and may
not reflect present conditions. Finally, the researcher often has no
control over how the sample was taken and may not be aware of biases
(sampling errors) within it (see Hyman, 1972; Hakim, 1982). Luckily,
owing to the way in which the HELM project was undertaken most of
these are not serious problems.
Firstly, when the three panel questionnaires were being formulated
account was taken of the possibility of undertaking a social-class
analysis, and respondents were asked a series of questions about
their parents' occupations and qualifications. The questionnaires
also contained a rich variety of questions on areas of potential
interest to us, including job 'quality', attitudes towards work, and
,secondary and higher education. The author was also allowed a
limited input into the project at the questionnaire design stage and
PAGE 52
a number of potentially useful questions were included on the
Wave III questionnaire. Moreover, the author had full control over
the coding of occupations, social class and educational
qualifications (see Appendix A). The question on parental
occupations was, however, poorly worded (6), and a number of
questions of potential interest were omitted from the
questionnaires. No questions, for example, were asked on the motives
of respondents for entering higher education and their career
preferences were not examined. Respondents were not asked to say
where they were born, and only a limited amount of information was
collected on the families of origin of respondents. No questions
were included on respondents' brothers and sisters, their order of
birth and educational attainments. To a large extent, however, the
omission of these questions was compensated for by the longitudinal
nature of the data set.
The second problem often encountered in secondary analysis is that
of the age of the data set: researchers often have to use data which
is old and of only historical interest. Because the HELM data set
relates to a sample of graduates who left college in 1982 we did not
have this problem. The problem which we faced arose because there
are grounds for believing that the influence of the social-class
origins of graduates on their eventual employment destinations will
not become fully apparent until after they have been in the labour
market for some considerable time. The graduate's early years in the
labour market may be characterized by a period of experimentation in
which he/she moves from job to job until something is found to which
he/she is suited. Moreover, Levin (1976) points to the importance of
inheritance in the transference of wealth across generations, which
PAGE 53
may be expected to benefit graduates from more middle-class and
upper-class backgrounds relatively late in life. Partly because of
this problem Kelsall et al. (1972) looked at graduates some six
years after graduation. Our problem is that in looking at graduates
one, two and three years after graduation, we may be viewing them at
a point in time in which the influence of social-class origins on
their employment destinations has not yet fully manifested itself.
The final problem which was encountered related to the fact that
1982 was a particularly difficult year for new graduates. First
Destination Statistics for 1982, published in Brennan and McGeever
(1988: 12-3), suggest that unemployment amongst new graduates with
degrees in the 21 types of course for which direct comparisons with
HELM data are possible reached a peak of 24.6% for polytechnic and
16.1% for university graduates. Since this date the employment
situation facing new graduates has improved markedly. It is hard to
calculate how this factor may have affected the HELM sample and the
extent to which it is representative of other years. Brennan and
McGeever (1988: 13) appear to be reasonably confident that it has
not unduly affected the validity of the findings. As they point out,
the state of the labour market is one of many factors which affect
the long-term career development of graduates. In Chapter Six the
relationship which exists between the social-class origins and
destinations of graduates is examined by means of a matched sample
in which graduates from working-class origins are matched with those
from more middle-class backgrounds who are alike as regards their
course of study, institution attended, class of degree and gender.
It seems reasonable to argue that such a procedure should also have
had the affect of controlling for the depressed state of the labour
market.
PAGE 54
The CRE Study
In addition to the HELM study, the present writer also had access to
a related study commissioned by the CRE (Commission for Racial
Equality) into the employment destinations of graduates who
completed their degrees in 1984. The main aim of this study was to
examine how well graduates from different ethnic groups had fared in
the labour market. The results are reviewed in Chapter Nine of this
thesis (see also Lyon and Gatley, 1988).
The CRE study was undertaken by means of a highly structured postal
questionnaire which was distributed to graduates in 1987, three
years after graduation. All graduates (apart from those domiciled
overseas) who had undertaken six courses of study at nine
universities and 17 public-sector institutions were sampled.
Institutions were chosen for inclusion in this study which were
situated within areas known to have large black populations (eg
London, Bradford and Wolverhampton). Several courses were also
sampled because they were known to attract a high proportion of
black applicants.
Distribution of the questionnaires was left to individual
universities and colleges. Table 2.6 shows the courses sampled and
the number of respondents.
PAGE 55
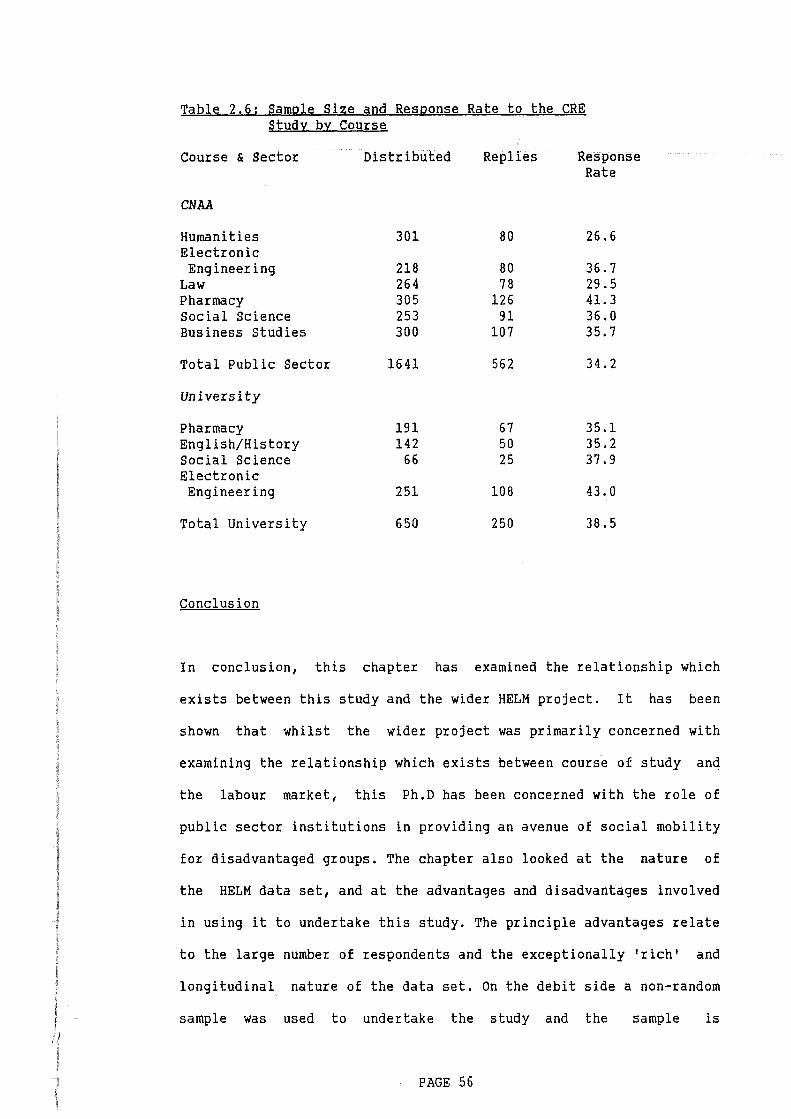
Table 2.6: Sample Size and Response Rate to the CRE Study by Course
Course & Sector
CNAA
Humanities Electronic Engineering
Law Pharmacy Social Science Business Studies
Total Public Sector
University
Pharmacy English/History Social Science Electronic Engineering
Total University
Conclusion
Distributed
301
218 264 305 253 300
1641
191 142
66
251
650
Replies
80
80 78
126 9l
107
562
67 50 25
108
250
Response Rate
26.6
36.7 29.5 41.3 36.0 35.7
34.2
35.1 35.2 37.9
43.0
38.5
In conclusion, this chapter has examined the relationship which
exists between this study and the wider HELM project. It has been
shown that whilst the wider project was primarily concerned with
examining the relationship which exists between cours'e of study and
the labour market, this Ph.D has been concerned with the role of
public sector institutions in providing an avenue of social mobility
for disadvantaged groups. The chapter also looked at the nature of
the HELM data set, and at the advantages and disadvantages involved
in using it to undertake this study. The principle advantages relate
to the large number of respondents and the exceptionally 'rich' and
longitudinal nature of the data set. On the debit side a non-random
sample was used to undertake the study and the sample is
PAGE 56

'incomplete' in so far as the university d'imension is missing. These
problems do not appear to be particular serious, however.
PAGE 57
CHAPTER THREE: DERIVATION OF A SOCIAL-CLASS SCHEMA
This chapter looks at the way in which a social-class schema was
derived for the analysis of the occupations of graduates and of
their
about
parents. Firstly,
the methodological
however, it is necessary to say something
problems which confront the social
scientist in constructing and interpreting variables.
The problems facing the researcher in undertaking a sociological
study are discussed by Cicourel (1964) who makes two points of
importance to us: the concepts used in a study should be adequately
defined beforehand, and the data should only be interpreted within a
methodology which is firmly rooted in its environment and is not
divorced from its own context.
Cicourel's first point relates to the problem of defining and
developing concepts. Concepts in the social sciences are of two
basic types - 'observables' and 'constructs'. The difference between
these is that whereas the former can be observed (eg age, gender and
ethnicity) the later are abstract formulations which cannot be
observed (Willer and Webster, 1969; Lin, 1976). For example, one may
wish to measure differences in the standard of living in different
countries. The problem here is that 'standard of living' is an
abstract formulation which cannot be studied directly. To study it
one must operationalize it and try to measure it in terms of some
'shadow' measure such as average income or the number of telephones
in each country. Cicourel's concern lies in the extent to which the
measures used to operationalize a construct are actual measures of
PAGE 58
it. This is important since the degree to which an hypothesis can be
tested is directly related to the extent to which the measures
employed are adequate representations of the construct
investigation.
under
Lin (1976: 39-40) suggests that one way to overcome this problem is
to use several measures of each construct in which we are
interested. In this way, if multiple relationships are found to
exist between each of these and the causal or independent variable
we can be reasonably confident about the direction and nature of any
relationship which might exist.
Cicourel's second point is that survey questionnaire and other data
can only be interpreted within its own environment and cannot be
divorced from its context. A biblical example will serve to
illustrate his point. One often hears accounts of the 'poverty of
Christ's birth', which is a reference to his birth in a stable. Such
a statement, however, confuses the conditions under which women in
Western nations give birth today with those pertaining in first
century Palestine. Christ's birth being, in fact, fairly typical of
births at that time. Similarly, just to describe the education, job
characteristics, incomes and attitudes of our graduates would be a
fruitless exercise without first saying something about the labour
market. For only by doing so is it possible to interpret our data.
For example, the finding that most graduates are in high-status
occupations is meaningless without a knowledge and understanding of
the role which education plays in the allocation of jobs within the
labour market. For this reason Chapter Six of this thesis looks at
the nature and major characteristics of the graduate labour market
PAGE 59
and at the types of jobs which graduates do.
Social Class
There are a number of 'social-class' scales in use today: those of
Hall and Jones, Reiss, Duncan, OPCS and Stewart et al. {see
Armstrong, 1972; Stewart et al., 1980; Marsh, 1986). Although these
scales differ in detail, they are all based upon the premise that it
is possible to arrange occupations which share similar market as
well as work and status situations into distinct social classes {see
Lockwood, 1958). Because these scales were devised for specific
studies, the differences which exist between them need not unduly
concern us here. Suffice it to say that most scales have been
constructed in one of four different ways: intuitive, relational,
constructed and reputational {Stewart et al., 1980: 20-7). In
intuitive approaches {the main example of which is the Registrar
General's Classification devised in 1911 {Armstrong, 1972: 203-4)),
the researcher simply ranks the occupations on the basis of his own
subjective assessment of their 'standing' in the community. In
relational approaches {for example, the Cambridge scale devised by
Stewart et al. {1980: 27-34)) occupations are ranked on the
assumption that people interact (marry, make friends and associate)
with people of broadly similar social standing as themselves. In
constructed approaches {for example, the NORC scale devised by
Duncan in the United States {Stewart et al., 1980: 27)) a number of
different factors, such as income and levels of education, are used
to rank occupations.
Our main interest lies in the reputational approach taken by Hope
PAGE 60
and Goldthorpe (1974), and Goldthorpe and Llewellyn (1977;
1980: 39-42), whose scale, in modified form, is used in this study.
In this approach a group of people (chosen at random) are asked to
rank occupations (1, 2, 3, 4, etc.) according to their perceived
standing in the community, and the social ranking of each occupation
is then calculated on the basis of its mean score. The reputational
approach has been criticized on the grounds that it is to be doubted
that their is common agreement as to what constitutes a 'good' and
'bad' job, and because for such a procedure to work respondents must
have perfect knowledge of all occupations, which is very unlikely
(see Stewart et al., 1980: 25-30).
Because of these criticisms Hope and Goldthorpe (1974) prefer not to
refer to their scale as one of occupational prestige, rather it
purports to measure the 'general desirability of occupations'
(p. 12). Their scale is multi-dimensional in character, being based
upon standard of living, power and influence over other people,
qualifications and value to society (p. 14). In the full
Hope-Goldthorpe scale there are 124 distinct categories, formulated
in such a way as to differentiate large and small proprietors, the
self-employed, professionals, managers, supervisors, foreman and
employees (pp. 22-3).
Hope and Goldthorpe believe that their scale has ordinal properties
because the relative status given to an occupation can be obtained
from its position in the scale, such that a lower score on the scale
indicates a high level of general desirability and a higher score a
low level of desirability. Thus individuals located in their
Category 1 (self-employed professionals eg doctors) have more status
PAGE 61
than those in Category 27 (high-grade technicians) who in turn have
more status than those in Category 124 (street vendors and jobbing
gardeners). The main advantage of using this scale in the present
study lies in the ability to collapse the 124 categories into a
smaller number of categories. This Hope and Goldthorpe do to arrive
at their thirty-six point scale (1974: 131).
For the purposes of this study the occupations of respondents and
their parents were coded according to the collapsed thirty-six point
schema, except that Category 6 (high-grade technicians) was
sub-divided into self-employed and salaried positions and
Category 28 (service workers intermediate grade) was divided into
shop workers and secretaries in order to make the scale, originally
devised for men, more applicable to women.
The Hope-Goldthorpe scale is not a scale of social class: rather it
is a measure of the 'general desirability of occupations'. However,
in a later work Goldthorpe, in collaboration with Llewellyn
(1977; 1980: 39), followed Lockwood (1958) in developing a
Weberian-type social class schema by amalgamating together the
thirty-six categories into seven distinct social class groupings of
'occupations whose incumbents will typically share in broadly
similar market and work situations', viz:-
That is to say, we combine occupational categories whose members would appear in the light of available evidence, to be typically comparable, on the one hand, in terms of their sources and levels of income, their degree of economic security and chances of economic advancement; and on the other, in their location within the systems of authority and control governing the process of production in which they are engaged, and hence in their degree of autonomy in performing their work-tasks and roles.
Goldthorpe and Llewellyn, 1980: 39
PAGE 62
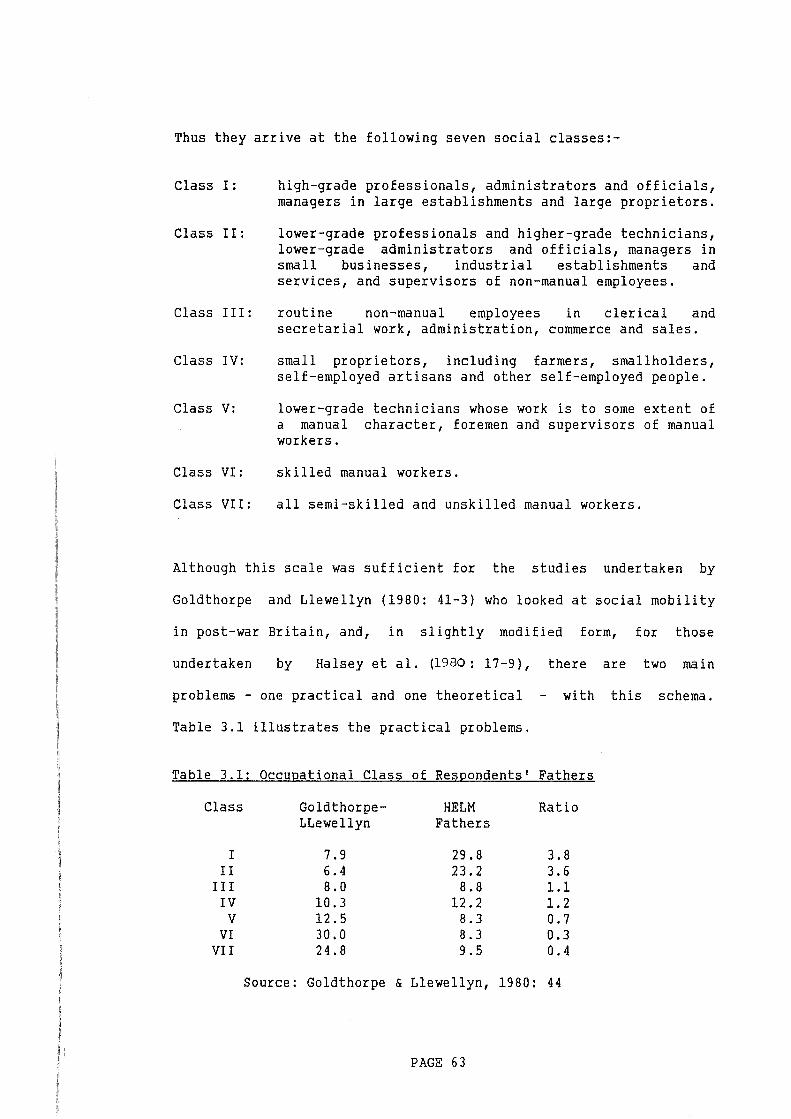
Thus they arrive at the following seven social classes:-
Class I:
Class II:
Class II I:
Class IV:
Class V:
Class VI:
Class VII:
high-grade professionals, administrators and officials, managers in large establishments and large proprietors.
lower-grade professionals and higher-grade technicians, lower-grade administrators and officials, managers in small businesses, industrial establishments and services, and supervisors of non-manual employees.
routine non-manual employees in clerical and secretarial work, administration, commerce and sales.
small proprietors, including farmers, smallholders, self-employed artisans and other self-employed people.
lower-grade technicians whose work is to some extent of a manual character, foremen and supervisors of manual workers.
skilled manual workers.
all semi-skilled and unskilled manual workers.
Although this scale was sufficient for the studies undertaken by
Goldthorpe and Llewellyn (1980: 41-3} who looked at social mobility
in post-war Britain, and, in slightly modified form, for those
undertaken by Halsey et al. (1980: 17-9} 1 there are two main
problems - one practical and one theoretical with this schema.
Table 3.1 illustrates the practical problems.
Table 3.1: Occupational Class of Respondents' Fathers
Class Gold thorpe- HELM Ratio LLewellyn Fathers
I 7.9 29.8 3.8 II 6.4 23.2 3.6
III 8.0 8.8 1.1 IV 10.3 12.2 1.2 v 12.5 8.3 0.7
VI 30.0 8.3 0.3 VII 24.8 9.5 0.4
Source: Goldthorpe & Llewellyn, 1980: 44
PAGE 63
From Table 3.1 we see that the HELM figures are almost a virtual
reverse image of those obtained by Goldthorpe and Llewellyn in their
Oxford mobility study. Thus we see that whilst only 7.9% of
Goldthorpe-Llewellyn fathers were in Class I and 6.4% were in
Class II, 29.8% of HELM fathers were in Class I and 23.2% were in
Class II. Similarly whilst 30% of Goldthorpe-Llewellyn fathers were
in Class VI and 24.8% were in Class VII only 8.3% and 9.5% of HELM
fathers were. Because of the large numbers of people in Classes I
and II a case exists on purely practical grounds for breaking them
down into a larger number of social classes.
More fundamentally, however, from a theoretical point of view the
homogeneity of Class I and Class II can be questioned. Goldthorpe
and Llewellyn (1980) lean heavily on the work of Dahrendorf (1964)
in defining Class I in terms, 'of those exercising power and
expertise on behalf of corporate bodies - plus such elements of the
classic bourgeoisie (independent businessmen and "free"
professionals) as are not yet assimilated into this new formation'
(p. 40). Dahrendorf's approach has, however, been criticized
(Abercrombie and Urry, 1983: 17-20). Thus, in our discussion of
theoretical approaches to social class in Chapter One it was
mentioned that most Weberian and Marxist writers are agreed that a
distinction can be drawn between those who own and those who manage
the means of production. Goldthorpe and Llewellyn, however, move
away from this position in so far as Class I groups together large
proprietors with both senior managers and senior professionals. This
procedure can be objected to on the grounds that it combines both
employed (managers) and self-employed people (proprietors). However,
Goldthorpe and Llewellyn (p. 40) point out that only 8% of the total
PAGE 64
Class I membership were large proprietors, and the distinction
between them and senior managers is often blurred both because many
large proprietors undertake managerial functions and because many
senior managers are substantial share owners.
A central difficulty is that Class I and also Class II combine
within them people from both professional and managerial
occupations. As such this corresponds to the position taken by the
Poulantzas (1975), Ehrenreich and Ehrenreich (1979), and Giddens
(1980) in their discussions of the middle class. Nevertheless this
approach can be objected to for several reasons: a) their functions
and work situations differ; b) there are differences in the patterns
of recruitment into these occupations; c) their 'interests' possibly
diverge; and d) they differ in how they transfer wealth across
generations. By definition managers and administrators are concerned
with the management of productive enterprises, and they have control
over and direction of a workforce. The independent, self-employed or
specialist professional worker, in contrast, performs a service
function for a clientele (be it in teaching, medicine, law,
religion, etc).
As we saw in Chapter One, entry into the professions tends
increasingly to be by the possession of qualifications. Such people,
therefore, tend to begin their careers with professional status, or
if not, at a lower (usually clerical) level with the intention of
qualifying over a number of years after a period of part-time study.
In contrast, many managers begin their careers in relatively
low-level (clerical) positions and generally rise in company
hierarchies to more senior positions. However, unlike the
PAGE 65
professional employee, they usually have a much less clear idea as
to how their careers are likely to develop (Heath, 1981: 61-5).
Thirdly, both Marxist and Weberian approaches to social class see
members of each class as having a common interest. It can, however,
be doubted that this is so in the case of professional and
managerial workers. Many professionals, and more especially
semiprofessionals, are employed within the state sector where they
serve a specific clientele, whilst most managers work within the
private sector. This creates a potential for conflict which arises
from differences in how they view the role of the state. Thus, in
order to benefit both themselves and their clients professionals
tend to advocate high-levels of state expenditure, whilst managers
in serving the needs of themselves and their employers tend to
favour low-levels of state expenditure and taxation. Differences in
the interests of these two groups should not, however, be
exaggerated, and
engineers) work
whilst many professionals (eg accountants and
in commerce and
perform administrative and managerial
sector.
industry,
functions
many civil servants
within the state
Finally, Heath (1981: 61-4) points out that large proprietors,
managers and professionals differ in how they transfer wealth across
generations, which in turn affects the occupational destinations of
their children and the character of social mobility. The children of
large proprietors tend to benefit from the direct inheritance of
wealth. Very often they begin their careers in low-level clerical
positions and gradually rise within the company hierarchy before
taking over control on the deaths of their parents. The children of
PAGE 66
professionals and senior managers, in contrast, tend to benefit from
the inheritance of what Bourdieu and Passeron (1977) have termed
cultural capital. Moreover, occupational choice theory leads one to
expect children from managerial and professional backgrounds to
differ in their choice of career.
Another problem facing us is that of how the working class is to be
defined. It is generally agreed that employed people undertaking
work of a distinctly manual character should be included within the
working class and indeed this was the approach taken by Goldthorpe
and Llewellyn. However, other theorists define the working class in
such a way as to include groups such as foremen, low-grade
technicians, low-grade service workers and shop and routine office
workers (see Roberts et al., 1977; Braverman, 1974; Westerguaard and
Resler, 1975: 72-3).
Looking firstly at foreman and low-grade technicians, these are
included within a separate class (V) by Goldthorpe and Llewellyn on
the grounds that although their work is to some extent manual in
character, they are, ' ... typically involved to some degree in the
exercise of authority and/or direction ... ' (p. 41). However, whilst
such a categorization may well have suited the needs of Goldthorpe
and Llewellyn it does pose a problem for us. In undertaking the
Oxford mobility study, Goldthorpe began with the premise that the
father's occupation during the respondents' formative years gave a
better indication of social mobility than their last occupation. For
this reason the occupations of his respondents were compared with
those of their fathers when they, the respondents, were aged
fourteen. Unfortunately the HELM questionnaire merely asked
PAGE 67
respondents to state their fathers' occupations: that is when the
respondents were in their early twenties or older. This creates a
problem for us because most foremen are promoted from the ranks of
shop-floor workers. Since many foremen within the HELM sample would
have been manual workers during their children's formative years a
case can, therefore, be made for including them within the working
class. Moreover, foremen and low-grade technicians differ from one
another in
qualifications
(electricians,
the character
needed
firemen,
for
etc)
and nature of the training and
entry.
generally
Low-grade technicians
need a few GCE 0-levels,
ONCs, etc for entry into their occupation, but since foreman tend to
be appointed from the ranks of manual workers formal qualifications
are not necessary. This, in turn, may well have an influence on the
stress which the parents of these two groups place on education
during their children's formative years.
Let us move on to a consideration of the social-class position of
clerical and routine-service workers. As was briefly mentioned in
the last chapter, owing to the introduction of new technologies the
level of skill required to undertake many such jobs may have fallen
in recent years along with their rates of pay relative to manual
workers, and this has led some (Braverman, 1974) to argue that they
should be more properly regarded as a section of the working class.
Against this, Lockwood (1958: 14), King and Raynor (1981: 128) have
argued that office work has not become as deskilled as is sometimes
suggested, qualifications are often needed to undertake many such
jobs, and they can be differentiated from manual workers in terms of
their market and work situations. Moreover, most men (but not women)
in such occupations are young, they have reasonably good promotion
PAGE 68
prospects, and many can expect to be employed within a managerial
role after a period of a few years. This is not the time to go into
the ins and outs of this debate, suffice it to say here that in
view of this difference of opinion it was decided to keep the two
groups separate so that they can be combined at a later stage of the
analysis should the need arise.
It is now possible to describe the social-class schema which will
be used to analysis the occupations of respondents' fathers,
viz:-
Class A (Hope-Goldthorpe Categories 1 and 2) Senior professionals, both self-employed and salaried, ineiu~ing doctors, lawyers, university lecturers, engineers and accountants.
Class B (Hope-Goldthorpe Categories 3, 4 and 7) Senior managers and administrators, company directors, senior civil servants and large proprietors employing 25 or more people.
Together social classes A and B correspond to Class I of the
Goldthorpe-Llewellyn schema. The principal advantage of the revised
schema lies in the ability to draw comparisons between how the
children of professional and managerial workers perform in the
labour market.
Class C (Hope-Goldthorpe Categories 6, 9 and 10} Semiprofessionals and high-grade technicians. Included here are school teachers, ministers of religion, nurses, executive officers in the civil service, computer programmers and draughtsmen.
Class D (Hope-Goldthorpe Categories 5, 8, 12, 14 and 16} Junior managers and low-level administrators, including bank managers, shop and office managers and supervisors of non-manual workers.
Classes C and D combined correspond to Class II of the
Goldthorpe-Llewellyn schema.
PAGE 69
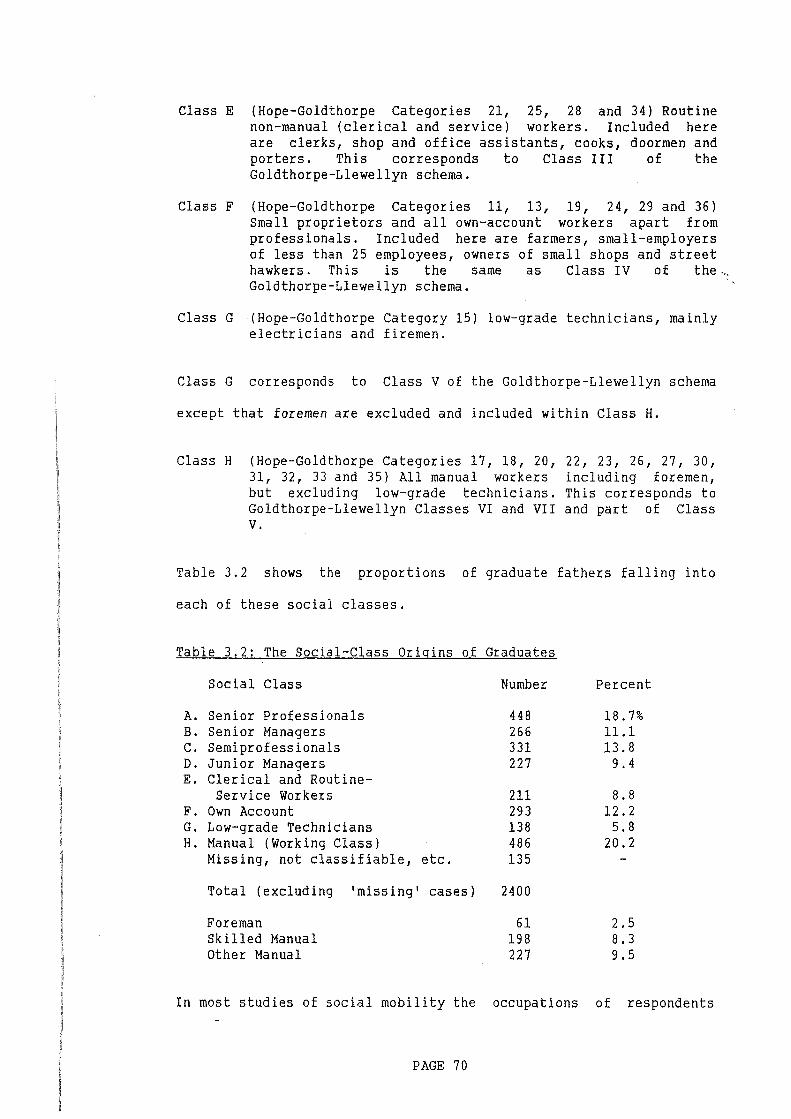
Class E (Hope-Goldthorpe Categories 21, 25, 28 and 34) Routine non-manual (clerical and service) workers. Included here are clerks, shop and office assistants, cooks, doormen and porters. This corresponds to Class III of the Goldthorpe-Llewellyn schema.
Class F (Hope-Goldthorpe Categories 11, 13, 19, 24, 29 and 36) Small proprietors and all own-account workers apart from professionals. Included here are farmers, small-employers of less than 25 employees, owners of small shops and street hawkers. This is the same as Class IV of the Goldthorpe-Llewellyn schema.
Class G (Hope-Goldthorpe Category 15) low-grade technicians, mainly electricians and firemen.
Class G corresponds to Class V of the Goldthorpe-Llewellyn schema
except that foremen are excluded and included within Class H.
Class H (Hope-Goldthorpe Categories 17, 18, 20, 31, 32, 33 and 35) All manual workers but excluding low-grade technicians. Goldthorpe-Llewellyn Classes VI and VII v.
22, 23, 26, 27, 30, including foremen, This corresponds to and part of Class
Table 3.2 shows the proportions of graduate fathers falling into
each of these social classes.
Table 3.2: The Social-Class Origins of Graduates
Social Class Number
A. Senior Professionals 448 B. Senior Managers 266 C. Semiprofessionals 331 D. Junior Managers 227 E. Clerical and Routine-
Service Workers 211 F. Own Account 293 G. Low-grade Technicians 138 H. Manual (Working Class) 486
Missing, not classifiable, etc. 135
Total (excluding 'missing' cases) 2400
Foreman 61 Skilled Manual 198 Other Manual 227
Percent
18.7% 11.1 13.8
9. 4
8.8 12.2
5.8 20.2
2.5 8.3 9.5
In most studies of social mobility the occupations of respondents
PAGE 70
and their parents are coded according to the same scale of social
class. Unfortunately, for a number of reasons, it was not feasible
to adopt this approach in this study, and a different social-class
schema (although derived from the thirty-six point Hope-Goldthorpe
schema) was used to analyse graduate occupations. The first problem
arose because over 40% of male graduates were employed in senior
professional (Class A) occupations, and it was felt necessary to
disaggregate this group in some way. Secondly, there is the problem
of vertical mobility which will be discussed shortly. Finally, only
a small number of respondents were employed in routine white-collar
and manual occupations. The solution adopted to these problems was
to draw a distinction between three types of occupation:
a) professional, b) managers and administrators and c) low status.
Firstly, since professionals (eg teachers, engineers, pharmacists,
etc) and high-grade technicians (computer programmers, laboratory
technicians 1 etc) tend to remain in the same kind of work for long
periods of time, these occupations were broken down into four
groups: senior professionals in engineering and technical
occupations, senior professional not in engineering (Hope-Goldthorpe
1 & 2), semiprofessionals (Hope-Goldthorpe 9 and 10) and high-grade
technicians (Hope-Goldthorpe 6).
Problems occur in dealing with managers and supervisors
(Hope-Goldthorpe 4, 8, 12, 14 and 17), administrators and officials
(Hope-Goldthorpe 3 and 5) and clerks (Hope-Goldthorpe 21). Vertical
mobility is a characteristic of such occupations in so far as people
tend to enter them in comparatively low-level positions (clerks or
junior managers) and through a process of internal promotion
PAGE 71
gradually rise to more senior posts. Because the study is looking at
graduates at an early point in their careers (three years after
graduation) it was decided to treat all these people as members of
the same group on the grounds that many of them are likely to be
promoted to more senior positions. However, in doing so we have
lumped together people performing different functions in different
work and market situations and there is no guarantee that a
particular individual employed within a low-level post will ever
achieve a more senior position. Because of this it should be
stressed that this group taken together should not be regarded as a
social class and for this reason we shall, from now on, refer to it
as the managerial trajectory.
Finally a lower class can be distinguished by amalgamating together
those graduates (7.6% of the total) in comparatively low-status
occupations: manual workers, low-grade technicians and service
workers (excluding clerks (Hope-Goldthorpe 21)) and the
self-employed (Hope-Goldthorpe categories 11, 13, 15, 17 to 20, and
22 to 36).
Thus we arrive at five basic social classes and a managerial
trajectory. Figure 3.1 shows how these classes and trajectory relate
to one another. From this it can be seen that, three years after
graduation, 12.6% of respondents were senior professionals, 12.6%
were engineers, 27.0% were semiprofessionals, 10.1% were high-grade
technicians, 16.1% were managers, administrators or clerks, and 6.6%
were lower class. Non-managerial social classes are relatively
independent of one another - in general movement between these
classes is difficult but not impossible and some of those within the
PAGE 72
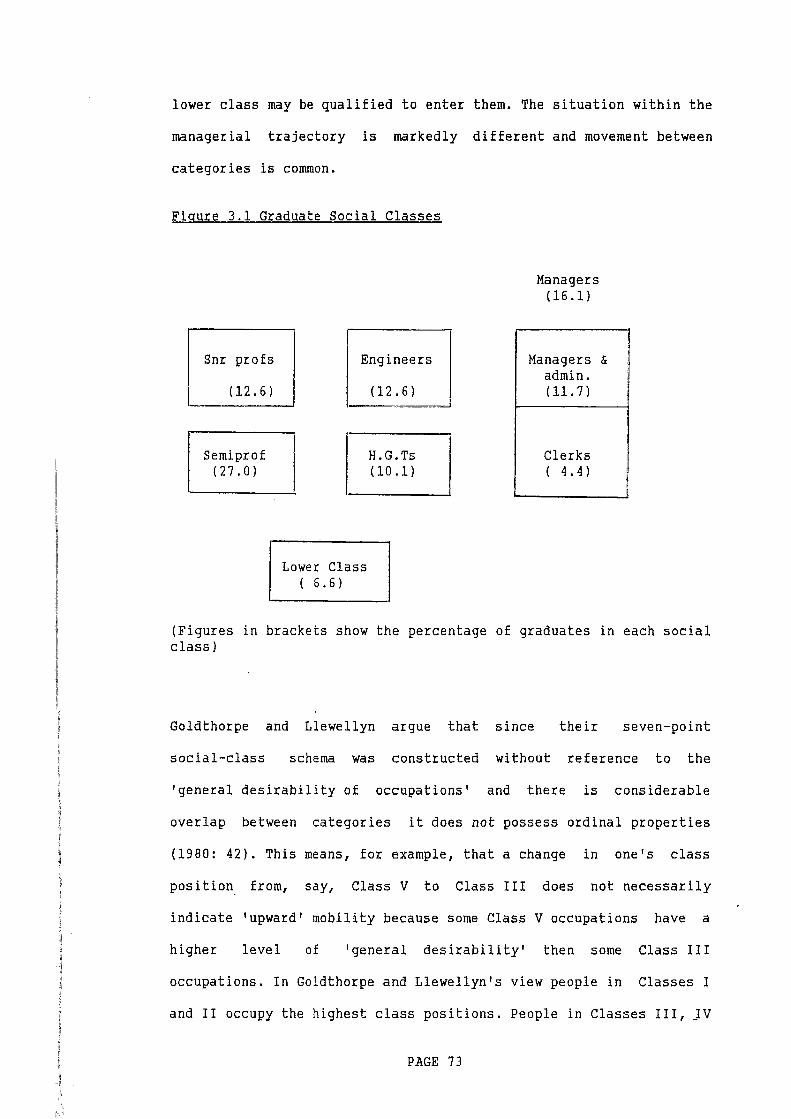
lower class may be qualified to enter them. The situation within the
managerial trajectory is markedly different and movement between
categories is common.
Figure 3.1 Graduate Social Classes
Snr profs
( 12.6)
Semipro£ ( 27.0)
Engineers
Lower Class ( 6. 6)
( 12.6)
H.G.Ts (10.1)
Managers ( 16.1)
Managers & admin. ( 11. 7)
Clerks ( 4. 4) I
(Figures in brackets show the percentage of graduates in each social class)
Goldthorpe and Llewellyn argue that since their seven-point
social-class schema was constructed without reference to the
'general desirability of occupations' and there is considerable
overlap between categories it does not possess ordinal properties
(1980: 42). This means, for example, that a change in one's class
position from, say, Class V to Class III does not necessarily
indicate 'upward' mobility because some Class V occupations have a
higher level of 'general desirability' then some Class III
occupations. In Goldthorpe and Llewellyn's view people in Classes I
and II occupy the highest class positions. People in Classes III, JV
PAGE 73
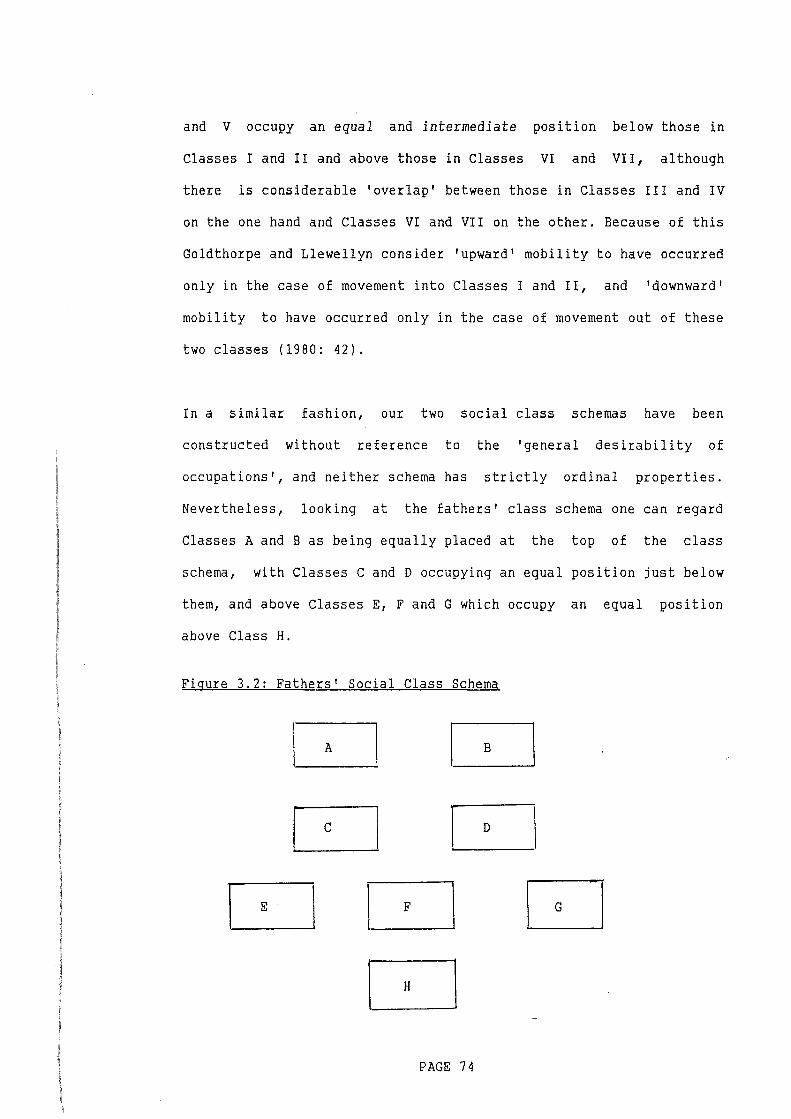
and V occupy an equal and intermediate position below those in
Classes I and II and above those in Classes VI and VII, although
there is considerable 'overlap' between those in Classes III and IV
on the one hand and Classes VI and VII on the other. Because of this
Goldthorpe and Llewellyn consider 'upward' mobility to have occurred
only in the case of movement into Classes I and II, and 'downward'
mobility to have occurred only in the case of movement out of these
two classes (1980: 42).
In a similar fashion, our two social class schemas have been
constructed without reference to the 'general desirability of
occupations', and neither schema has strictly ordinal properties.
Nevertheless, looking at the fathers' class schema one can regard
Classes A and B as being equally placed at the top of the class
schema, with Classes C and D occupying an equal position just below
them, and above Classes E, F and G which occupy an equal position
above Class H.
Figure 3.2: Fathers' Social Class Schema
c=J c=J D 8
D D D
PAGE 74
D
Comparing Figures 3.1 and 3.2, Classes A and B are on a par with
senior professionals and engineers, and Classes C and D are on a par
with semiprofessionals and high-grade technicians. 'Upward' mobility
can be regarded as having occurred in those instances in which the
respondent's father is employed in Classes E to H and the respondent
is employed in any one of the four graduate classes, and when the
respondent's father is employed in Classes C or D and the
respondent is a senior professional or engineer. Conversely,
'downward' mobility can be regarded as having occurred in those
instances in which the respondent's father is employed in classes
Classes A to D and the respondent is employed within the lower
class, and, arguably, when the respondent's father is employed in
Class A or B and the respondent is a semiprofessional or high-grade
technician. Our main problem is that it is difficulty to measure
social mobility amongst those employed within the managerial
trajectory, because it includes within it occupations which have
widely different levels of 'general desirability'.
Fathers, Mothers and Households
In Chapter One the works of Glass (1954)
Llewellyn (1980) were discussed and it will be
and Goldthorpe and
recalled that they
examined social mobility in terms of the relationship which exists
between the occupations of male respondents and their fathers.
Women in general, and mothers in particular were neglected in these
and most other studies of social mobility. Until recently, such an
approach has tended to be adopted on the grounds that the household
rather than the individual was the proper unit of analysis. Since
PAGE 75
few married women were in employment, and those who were tended to
be employed in comparatively low-status jobs and often worked only
part-time, the occupation of the male head was generally taken to be
the best indicator of a household's social-class position
(Goldthorpe, 1983; 1984; Dex, 1985: 143). In recent years this
approach has been questioned. The number of married women in
employment has risen, the number of single-parent families without a
male head has increased (Dex, 1985: 143-51), and Britten and Heath
(1983: 46-60) point out that many married women are employed in
white-collar jobs and occupy a higher class position than their
partners. In contradiction to this, Goldthorpe (1984) argues that
many white-collar jobs undertaken by women are of a routine-clerical
or sales nature, are often only part-time, tend to be less well paid
than many skilled manual jobs and have only poor promotion
prospects. In reply, Heath and Britten (1984) accept much of
Goldthorpe's argument yet they quote empirical work which suggests
that in itself a woman's class position is a good indicator of
voting behaviour and fertility, and helps to account for some social
mobility. Moreover, they also point to the existence of a few
'cross-class' families in which the male head was employed in manual
work and his partner in a professional or managerial capacity.
Table 3.3 shows the social-class position of respondents' mothers
using the eight-point scale of social class developed earlier in
this chapter.
PAGE 76
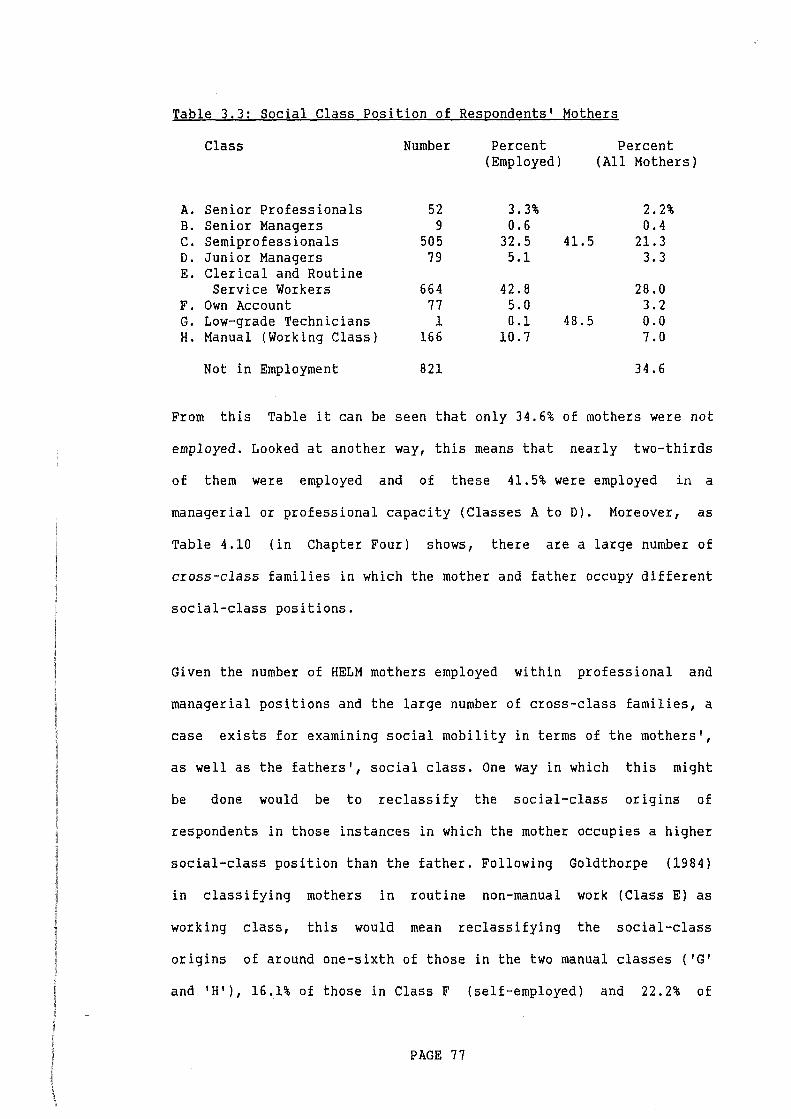
Table 3.3: Social CLass I?Qsition of Respondents' Mothers
Class Number Percent Percent (Employed) (All Mothers)
A. Senior Professionals 52 3.3% 2.2% B. Senior Managers 9 0.6 0.4 C. Semiprofessionals 505 32.5 41.5 21.3 D. Junior Managers 79 5.1 3.3 E. Clerical and Routine
Service Workers 664 42.8 28.0 F. Own Account 77 5.0 3.2 G. Low-grade Technicians 1 0.1 48.5 0.0 H. Manual (Working Class) 166 10.7 7.0
Not in Employment 821 34.6
From this Table it can be seen that only 34.6% of mothers were not
employed. Looked at another way, this means that nearly two-thirds
of them were employed and of these 41.5% were employed in a
managerial or professional capacity (Classes A to D). Moreover, as
Table 4.10 (in Chapter Four) shows, there are a large number of
cross-class families in which the mother and father occupy different
social-class positions.
Given the number of HELM mothers employed within professional and
managerial positions and the large number of cross-class families, a
case exists for examining social mobility in terms of the mothers',
as well as the fathers', social class. One way in which this might
be done would be to reclassify the social-class origins of
respondents in those instances in which the mother occupies a higher
social-class position than the father. Following Goldthorpe (1984)
in classifying mothers in routine non-manual work (Class E) as
working class, this would mean reclassifying the social-class
origins of around one-sixth of those in the two manual classes ( 'G'
and 'H'), 16.1% of those in Class F (self-employed) and 22.2% of
PAGE 77
those in Class E (white-collar}. To adopt this approach, however,
would drastically reduce the size of the two manual classes and make
it very difficult to draw comparisons between this and related
studies which have used social-class schemas based purely upon the
father's occupation. Because of these two problems, it was decided
to examine social mobility in terms primarily of the occupations of
respondents and their fathers, and to introduce the mothers
occupation into the analysis as an explanatory or supplementary
variable when the need arises.
Measures of Job Quality
Earlier in this chapter it was suggested that one way in which the
researcher can be more certain of the validity of his or her
findings is by making use of several measures of each construct. One
way in which we can do this, when looking at graduate occupations,
is by making use of a series of questions included in the three HELM
questionnaires to measure differences in the quality of graduate
jobs. Brennan and McGeevor (1988} made use of several such measures
in their book on the HELM project. The measures which they used were
of two basic kinds: 'objective' measures such as income and
'subjective' measures based upon questions which asked graduates to
say how they felt about their jobs (p. 34}. In order to obtain a
more complete picture of the nature of graduate occupations similar
measures of job quality are employed in this study.
PAGE 78
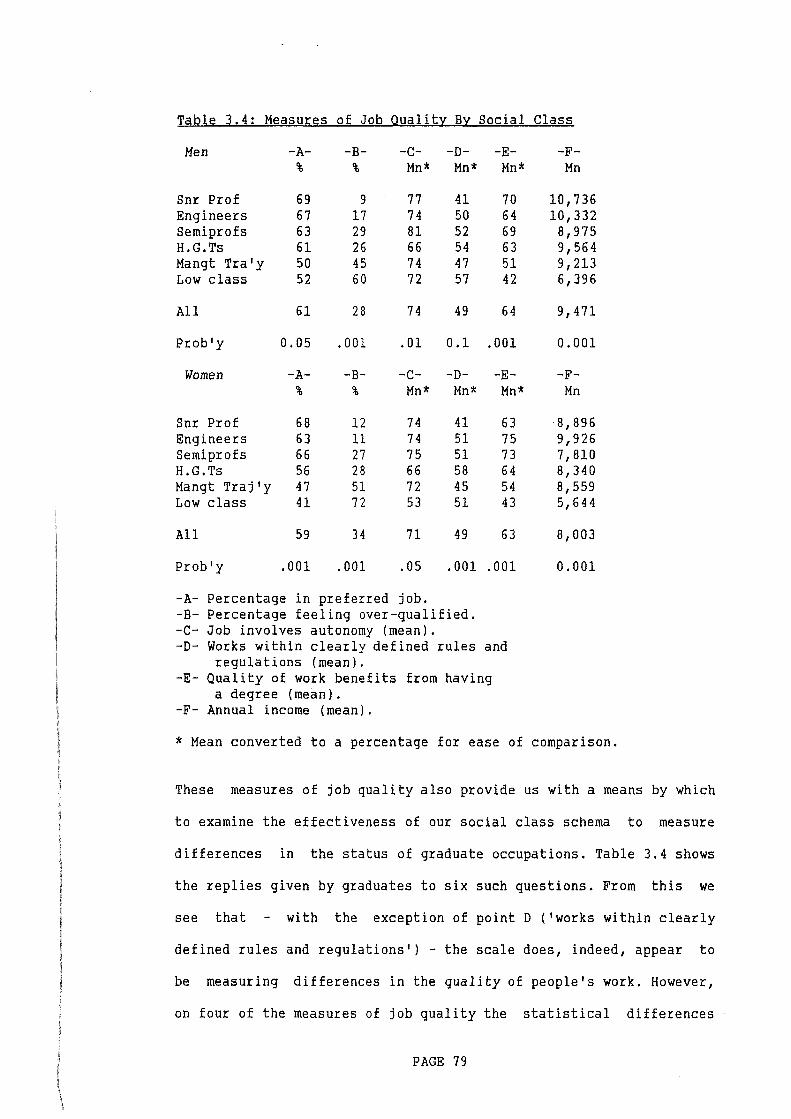
Table 3.4: Measures of Job Quality By Social Class
Men -A- -B- -c- -D- -E- -F-% % Mn* Mn* Mn* Mn
Snr Prof 69 9 77 41 70 10,736 Engineers 67 17 74 50 64 10,332 Semi profs 63 29 81 52 69 8,975 H.G.Ts 61 26 66 54 63 9,564 Mangt Tra'y 50 45 74 47 51 9, 213 Low class 52 60 72 57 42 6,396
All 61 28 74 49 64 9,471
Prob'y 0.05 .001 .01 0.1 .001 0.001
Women -A- -B- -c- -D- -E- -F-% % Mn* Mn* Mn* Mn
Snr Prof 68 12 74 41 63 8,896 Engineers 63 11 74 51 75 9,926 Semiprofs 66 27 75 51 73 7,810 H.G.Ts 56 28 66 58 64 8,340 Mangt Traj'y 47 51 72 45 54 8,559 Low class 41 72 53 51 43 5,644
All 59 34 71 49 63 8,003
Prob'y .001 .001 .05 .001 .001 0.001
-A- Percentage in preferred job. -B- Percentage feeling over-qualified. -c- Job involves autonomy (mean). -D- Works within clearly defined rules and
regulations (mean). -E- Quality of work benefits from having
a degree (mean). -F- Annual income (mean).
* Mean converted to a percentage for ease of comparison.
These measures of job quality also provide us with a means by which
to examine the effectiveness of our social class schema to measure
differences in the status of graduate occupations. Table 3.4 shows
the replies given by graduates to six such questions. From this we
see that with the exception of point D ('works within clearly
defined rules and regulations') -the scale does, indeed, appear to
be measuring differences in the quality of people's work. However,
on four of the measures of job quality the statistical differences
PAGE 79
are almost entirely due to differences in the results for those in
the managerial trajectory and lower-class jobs. These measures are
less efficient at differentiating senior professionals from
engineers, semiprofessionals and high-grade technicians.
That these measures are only weakly able to differentiate the
'quality' of work undertaken by senior professionals, engineers,
semiprofessionals and high-grade technicians is not as surprising as
might be thought. As Goldthorpe and Llewellyn (1980) point out the
market and work situations of such people share much in common and
they can be clearly differentiated from most other employees. They
tend to earn relatively high incomes, have staff status and enjoy a
great deal of autonomy at work. The differences between those
employed in Classes I and II tend to be those of degree rather than
kind and Goldthorpe and Llewellyn write (1980: 40):-
Typically, Class II positions guarantee income levels that rank directly below those of Class I, and also carry 'staff' status and conditions of employment. The occupational roles of Class II members tend to be located in the middle and lower ranges of bureaucratic hierarchies ... , so that they exercise some degree of authority and discretion in the performance of their work-tasks while •.• being subject to more or less systematic, if not particularly close, control from above. Class II could ... be seen as complementary to Class I of our schema in representing the subaltern or cadet levels of the service class (their emphasis).
In consequence, although people in Class II tend to be employed
within less prestigious occupations than those in Class I, they are
nevertheless employed within reasonably high-status occupations.
Thus it is not surprising that our measures of job quality are only
able to weakly differentiate semiprofessionals and high-grade
technicians from senior professionals and engineers.
PAGE 80
This does not mean that the measures of job quality, employed by
Brennan and McGeevor are of no use to us. By definition they provide
us with measures which - amongst other things - allow us to examine
the extent to which graduates are: a} satisfied with their jobs;
b) are in graduate-level employment; c) are using the special skills
and other attributes which they learnt during their undergraduate
studies; and d) allow us to examine a number of other matters of
potential interest to us such as promotion prospects and the degree
to which graduates are seeking alternative employment.
Conclusion
Using the Hope-Goldthorpe (1974) and Goldthorpe and Llewellyn (1977;
1980} schemas as a starting point, this chapter has been concerned
with the development of two social-class schemas for the analysis of
the occupations of graduates and their parents. The
by Goldthorpe and Llewellyn (1977; 1980),
approach taken
who developed a
seven-point schema, was rejected on the grounds that the homogeneity
of their social classes I and II can be questioned from a
theoretical point of view. Eventually an eight-point social-class
schema was developed for analysing the occupations of respondents'
parents
employed
in such a way as to draw a sharp distinction between those
in managerial and those employed within professional
positions. To analyse graduate occupations, a social-class schema
was developed which has five basic social classes and a managerial
trajectory.
PAGE 81
CHAPTER FOUR: THE SOCIAL-CLASS ORIGINS OF CNAA GRADUATES
This chapter examines the role
widening educational opportunities
identified in Chapter One: the
of public sector institutions in
for the three lower classes
working class, women and ethnic
minorities. It is divided into three parts. Part One
role envisaged for polytechnics and colleges
opportunities for our disadvantaged groups. Part Two
looks at the
in expanding
looks at the
origins of HELM respondents. Finally, Part Three examines the major
characteristics of graduates from working-class origins in an
attempt to discover how they may differ from those from more
middle-class backgrounds.
Part One: Higher Education in Britain Today
Higher education in Britain is organized into two distinct sectors,
the autonomous or university sector and the public sector. The
universities are independent bodies which receive their finance from
the University Grants Committee (UGC), they have full control over
their teaching, research and day-to-day administration, and they
award their own degrees.
In contrast, public sector institutions have been under the joint
financial control of the National Advisory Board (NAB) and
individual local authorities (LEAs). They teach a broader range of
subjects than the universities (including Education and Art and
Design, HNDs and various Foundation Courses) and have many part-time
and block-release students. Unlike the universities, they do not
PAGE 82
have the right to award degrees, rather they award CNAA degrees and
qualifications set by other outside bodies such as B/TEC.
Public sector institutions themselves, in England and Wales, can be
divided into the polytechnics and colleges of higher education
(CHEs}. The polytechnics were set up in the late 1960s following the
publication, in 1966, of the White Paper A Plan for Polytechnics and
Other Colleges (Cnmd. 3006}, which sought to rationalize higher
education outside the universities. In the main, the polytechnics
were formed from the old regional colleges and colleges of
technology. The CHEs were formed in the mid 1970s, many being based
upon the old teacher training colleges. In form and functions the
polytechnics and CHEs are very similar to one another. The
polytechnics do, however, tend to teach a broader range of subjects
and have more students. The CHEs tend to concentrate more on the
humanities and social sciences, although some are specialist
colleges teaching only one main subject. Some CHEs have strong links
with particular universities and in addition to CNAA degrees also
teach external university degrees. Finally, Scotland has its own
public sector institutions (Institutes} some of which are virtually
monotechnics and like the polytechnics and CHEs they award CNAA
degrees (see Matterson, 1981}. Figure 4.1 illustrates these points.
PAGE 83
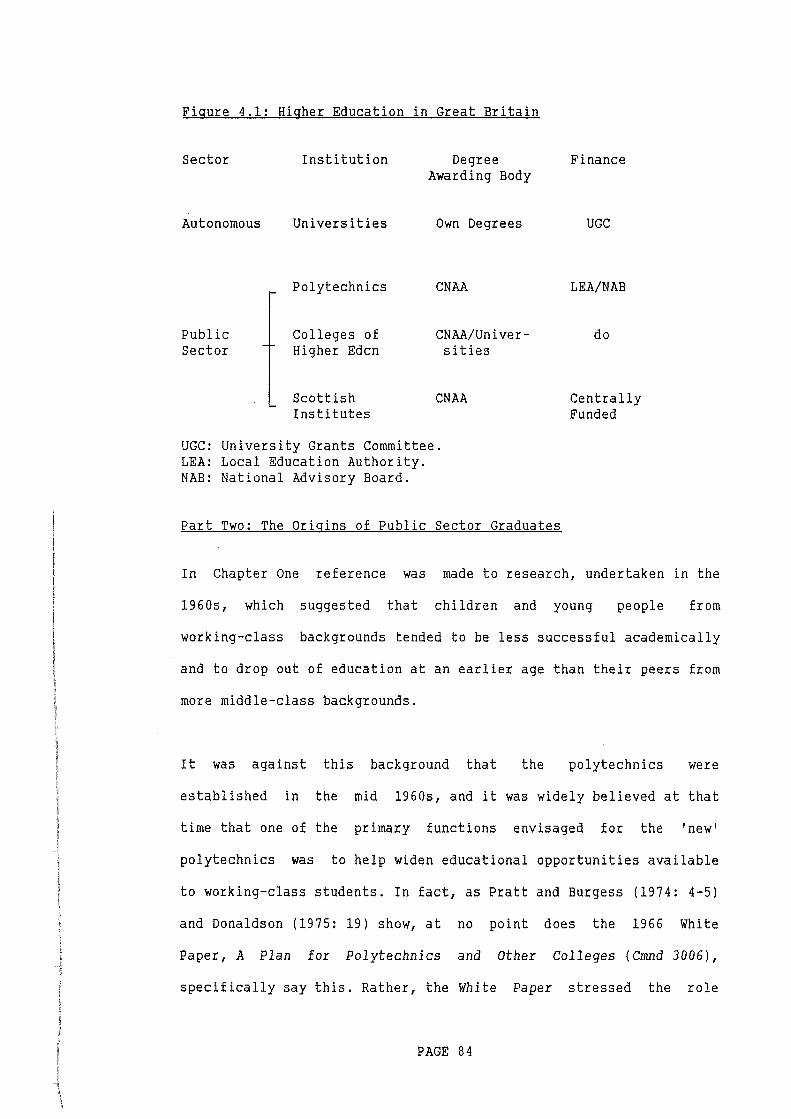
Figure 4.1: Higher Education in Great Britain
Sector Institution
Autonomous Universities
Polytechnics
Public l Colleges of Sector Higher Eden
Scottish Institutes
Degree Awarding Body
Own Degrees
CNAA
CNAA/Univer-sities
CNAA
UGC: University Grants Committee. LEA: Local Education Authority. NAB: National Advisory Board.
Part Two: The Origins of Public Sector Graduates
Finance
UGC
LEA/NAB
do
Centrally Funded
In Chapter One reference was made to research, undertaken in the
1960s, which suggested that children and young people from
working-class backgrounds tended to be less successful academically
and to drop out of education at an earlier age than their peers from
more middle-class backgrounds.
It was against this background that the polytechnics were
established in the mid 1960s, and it was widely believed at that
time that one of the primary functions envisaged for the 'new'
polytechnics was to help widen educational opportunities available
to working-class students. In fact, as Pratt and Burgess (1974: 4-5}
and Donaldson (1975: 19} show, at no point does the 1966 White
Paper, A Plan for Polytechnics and Other Colleges (Cmnd 3006},
specifically say this. Rather, the White Paper stressed the role
PAGE 84
which the polytechnics might play in providing places for those '···
who have ability to take full-time or sandwich courses of degree
standard; ... are seeking a qualification that requires a course of
higher education; ... (and for those who) can find time only for
part-time day and/or evening courses, whether they lead to a degree
or to a qualification below degree level standard' (cl. 3).
Indeed, Pratt and Burgess (1974: 5-6) point out that one must refer
to a speech made by Anthony Crosland (the then Secretary of State
for Education) in Lancaster in January 1966 for an official
statement of the role which the polytechnics might play in widening
educational opportunities. In this speech Crosland described the
kinds of students he believed had benefitted from Britain's system
of technical education and whom it was hoped would be served by the
new polytechnics. 'Perhaps they left school early, perhaps they were
late developers, perhaps they were first generation aspirants to
higher education who were too modest at the right moment to apply to
a university, perhaps they had started a career and thought that a
technical college course would directly improve their qualifications
for doing it'.
This statement is generally seen by writers to be, in the words of
Pratt and Burgess (p. 6), an 'extended circumlucation for
'working class''. It should, however, be stressed that there has
been no official statement that the polytechnics were established to
expand educational opportunities for working-class people.
Nevertheless this was how Crosland's remarks were widely interpreted
at the time (Scott, 1984: 185-6).
PAGE 85
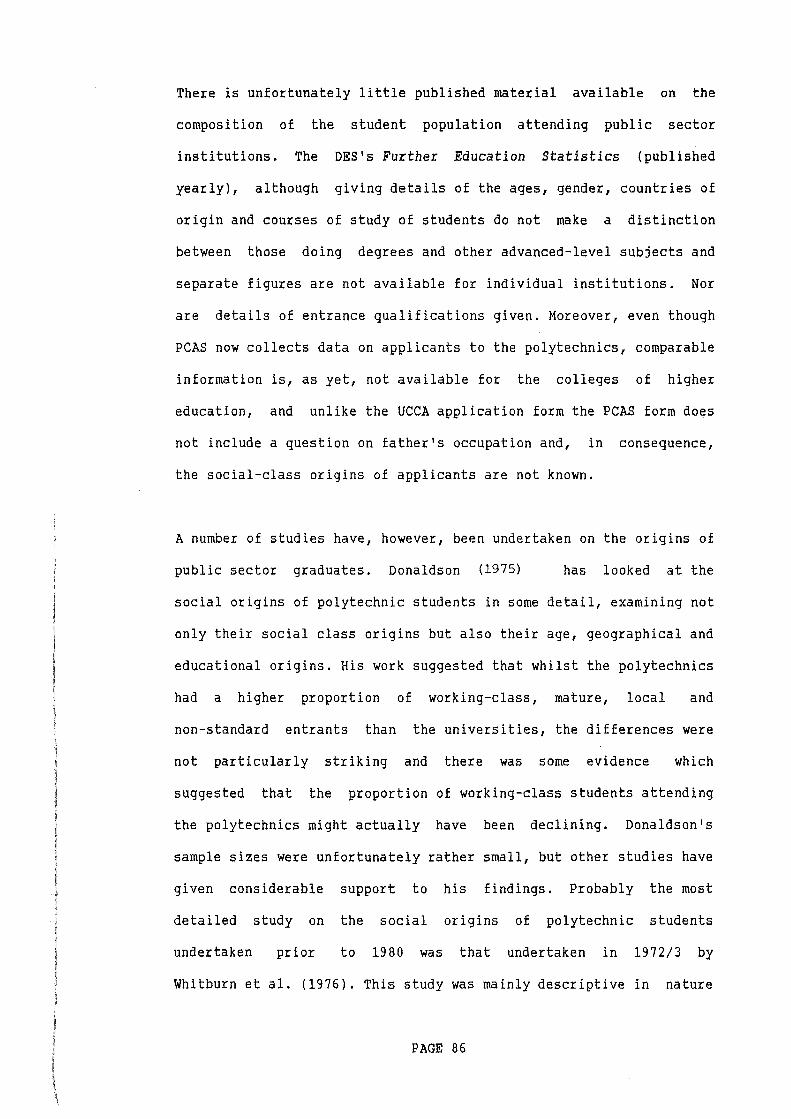
There is unfortunately little published material available on the
composition of the student population attending public sector
institutions. The DES's Further Education Statistics (published
yearly), although giving details of the ages, gender, countries of
origin and courses of study of students do not make a distinction
between those doing degrees and other advanced-level subjects and
separate figures are not available for individual institutions. Nor
are details of entrance qualifications given. Moreover, even though
PCAS now collects data on applicants to the polytechnics, comparable
information is, as yet, not available for the colleges of higher
education, and unlike the UCCA application form the PCAS form does
not include a question on father's occupation and, in consequence,
the social-class origins of applicants are not known.
A number of studies have, however, been undertaken on the origins of
public sector graduates. Donaldson (1975) has looked at the
social origins of polytechnic students in some detail, examining not
only their social class origins but also their age, geographical and
educational origins. His work suggested that whilst the polytechnics
had a higher proportion of working-class, mature, local and
non-standard entrants than the universities, the differences were
not particularly striking and there was some evidence which
suggested that the proportion of working-class students attending
the polytechnics might actually have been declining. Donaldson's
sample sizes were unfortunately rather small, but other studies have
given considerable support to his findings. Probably the most
detailed study on the social origins of polytechnic students
undertaken prior to 1980 was that undertaken in 1972/3 by
Whitburn et al. (1976). This study was mainly descriptive in nature
PAGE 86
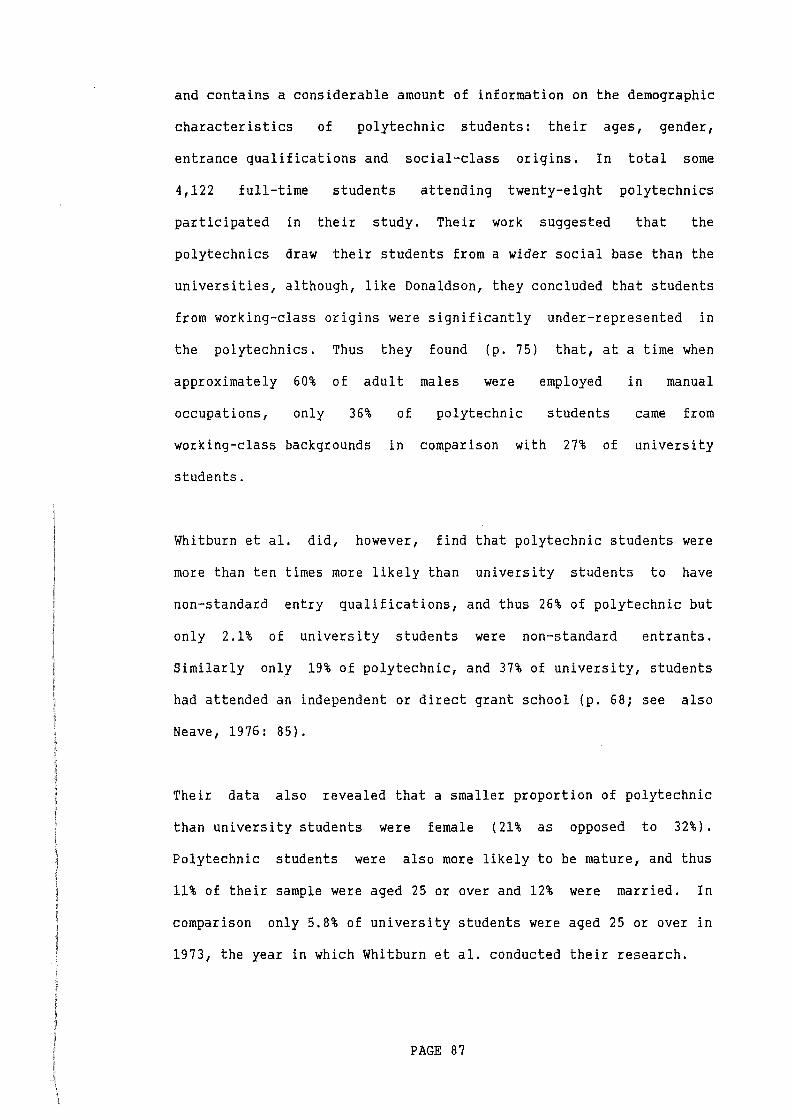
and contains a considerable amount of information on the demographic
characteristics of polytechnic students: their ages, gender,
entrance qualifications and social-class origins. In
4,122 full-time students attending twenty-eight
participated in their study. Their work suggested
total some
polytechnics
that the
polytechnics draw their students from a wider social base than the
universities, although, like Donaldson, they concluded that students
from working-class origins were significantly
the polytechnics. Thus they found {p. 75)
approximately 60% of adult males were
under-represented in
that, at a time when
employed in manual
occupations, only 36%
working-class backgrounds
students.
of polytechnic students
in comparison with 27% of
came from
university
Whitburn et al. did, however, find that polytechnic students were
more than ten times more likely than university students to have
non-standard entry qualifications, and thus 26% of polytechnic but
only 2.1% of university students were non-standard entrants.
Similarly only 19% of polytechnic, and 37% of university, students
had attended an independent or direct grant school {p. 68; see also
Neave, 1976: 85}.
Their data also revealed that a smaller proportion of polytechnic
than university students were female {21% as opposed to 32%}.
Polytechnic students were also more likely to be mature, and thus
11% of their sample were aged 25 or over and 12% were married. In
comparison only 5.8% of university students were aged 25 or over in
1973, the year in which Whitburn et al. conducted their research.
PAGE 87
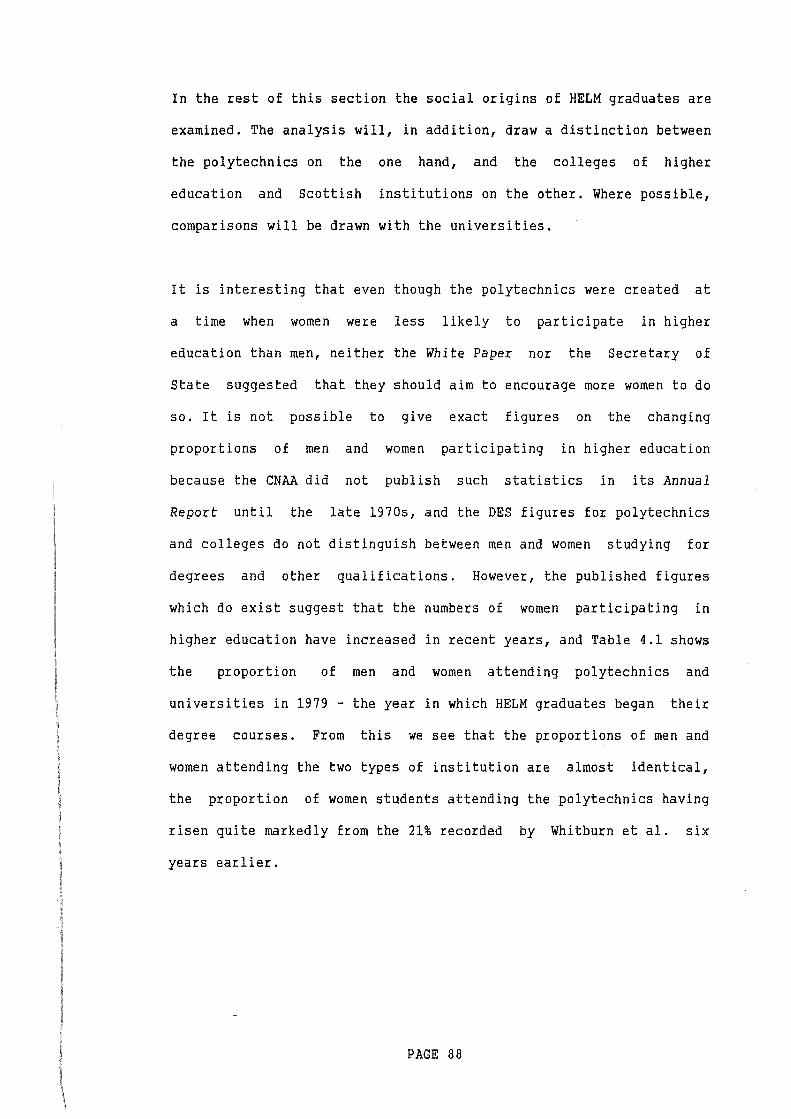
In the rest of this section the social origins of HELM graduates are
examined. The analysis will, in addition, draw a distinction between
the polytechnics on the one hand, and the colleges of higher
education and Scottish institutions on the other. Where possible,
comparisons will be drawn with the universities.
It is interesting that even though the polytechnics were created at
a time when women were less likely to participate in higher
education than men, neither the White Paper nor the Secretary of
State suggested that they should aim to encourage more women to do
so. It is not possible to give exact figures on the changing
proportions of men and women participating in higher education
because the CNAA did not publish such statistics in its Annual
Report until the late 1970s, and the DES figures for polytechnics
and colleges do not distinguish between men and women studying for
degrees and other qualifications. However, the published figures
which do exist suggest that the numbers of women participating in
higher education have increased in recent years, and Table 4.1 shows
the proportion of men and women attending polytechnics and
universities in 1979 - the year in which HELM graduates began their
degree courses. From this we see that the proportions of men and
women attending the two types of institution are almost identical,
the proportion of women students attending the polytechnics having
risen quite markedly from the 21% recorded by Whitburn et al. six
years earlier.
PAGE 88
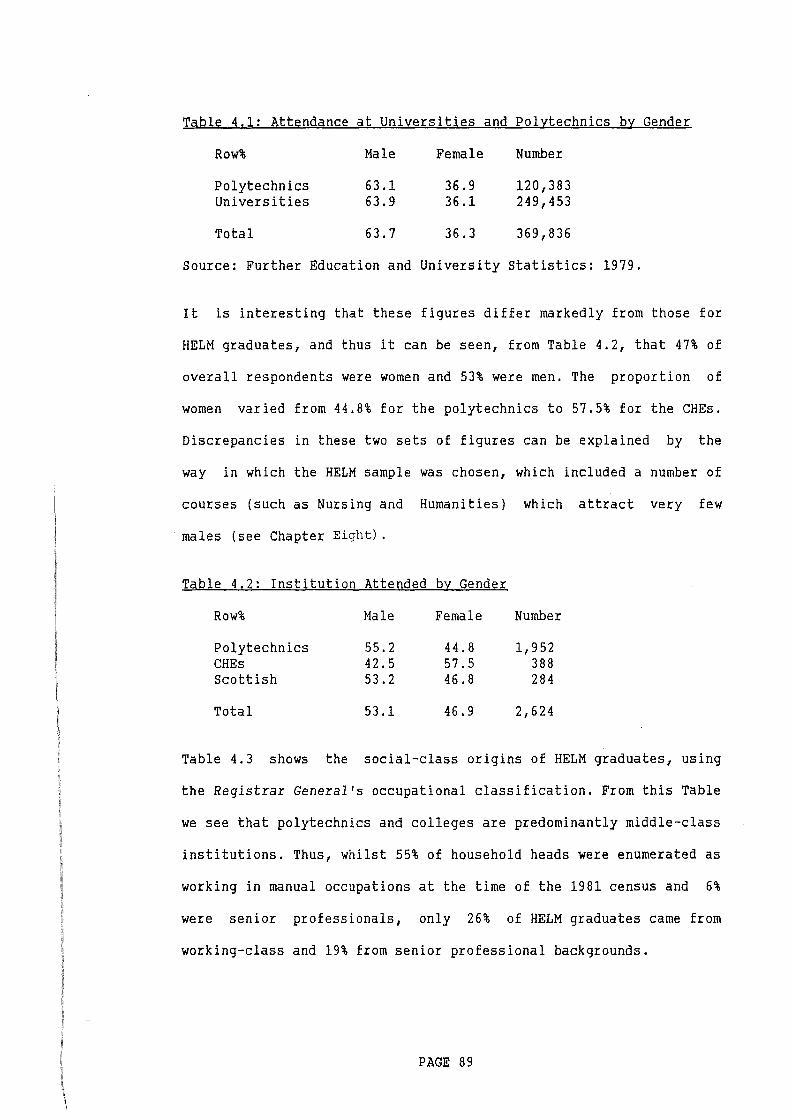
Table 4.1: Attendance at Universities a_nd Polytechnics by Gender
Row% Male Female Number
Polytechnics 63.1 36.9 120,383 Universities 63.9 36.1 249,453
Total 63.7 36.3 369,836
Source: Further Education and University Statistics: 1979.
It is interesting that these figures differ markedly from those for
HELM graduates, and thus it can be seen, from Table 4.2, that 47% of
overall respondents were women and 53% were men. The proportion of
women varied from 44.8% for the polytechnics to 57.5% for the CHEs.
Discrepancies in these two sets of figures can be explained by the
way in which the HELM sample was chosen, which included a number of
courses (such as Nursing and Humanities) which attract very few
males (see Chapter Eight) .
Table 4.2: Institution Attended by Gender
Row% Male Female Number
Polytechnics 55.2 44.8 1,952 CHEs 42.5 57.5 388 Scottish 53.2 46.8 284
Total 53.1 46.9 2,624
Table 4.3 shows the social-class origins of HELM graduates, using
the Registrar General's occupational classification. From this Table
we see that polytechnics and colleges are predominantly middle-class
institutions. Thus, whilst 55% of household heads were enumerated as
working in manual occupations at the time of the 1981 census and 6%
were senior professionals, only 26% of HELM graduates carne from
working-class and 19% from senior professional backgrounds.
PAGE 89
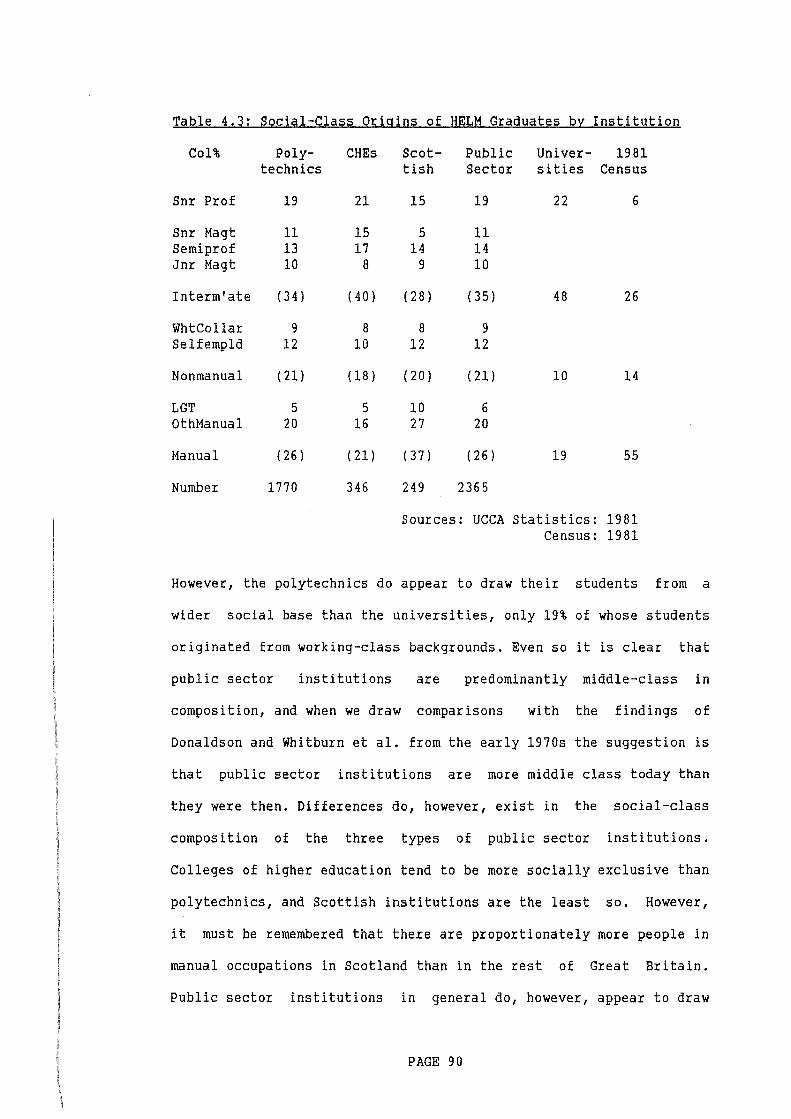
Table 4.3: Social-Class Origins of HELM Graduates by Institution
Col% Poly- CHEs technics
Snr Prof 19 21
Snr Magt 11 15 Semipro£ 13 17 Jnr Magt 10 8
Interm'ate ( 34) (40)
WhtCollar 9 8 Selfempld 12 10
Nonmanual ( 21) ( 18)
LGT 5 5 OthManual 20 16
Manual (26) ( 21)
Number 1770 346
Scot- Public Univer- 1981 tish Sector sities Census
15 19 22 6
5 11 14 14
9 10
( 28) (35) 48 26
8 9 12 12
( 20) ( 21) 10 14
10 6 27 20
( 3 7) ( 26) 19 55
249 2365
Sources: UCCA Statistics: 1981 Census: 1981
However, the polytechnics do appear to draw their students from a
wider social base than the universities, only 19% of whose students
originated from working-class backgrounds. Even so it is clear that
public sector institutions are predominantly middle-class in
composition, and when we draw comparisons with the findings of
Donaldson and Whitburn et al. from the early 1970s the suggestion is
that public sector institutions are more middle class today than
they were then. Differences do, however, exist in the social-class
composition of the three types of public sector institutions.
Colleges of higher education tend to be more socially exclusive than
polytechnics, and Scottish institutions are the least so. However,
it must be remembered that there are proportionately more people in
manual occupations in Scotland than in the rest of Great Britain.
Public sector institutions in general do, however, appear to draw
PAGE 90
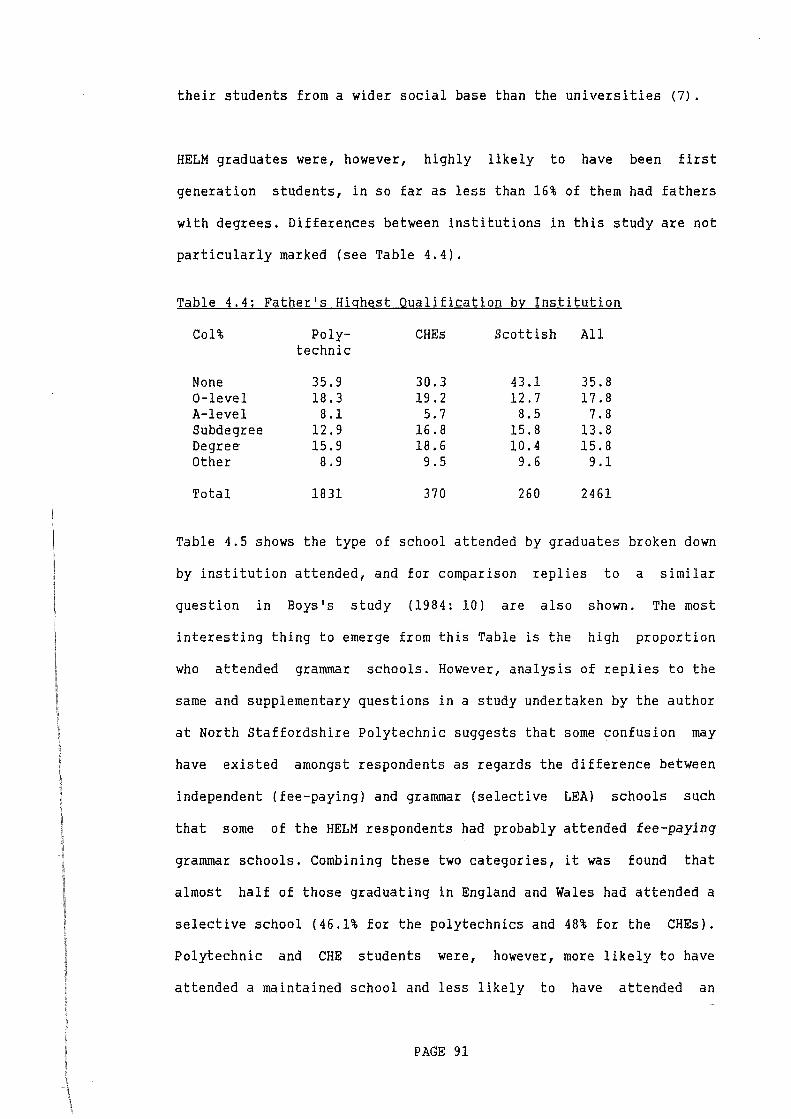
their students from a wider social base than the universities (7).
HELM graduates were, however, highly likely to have been first
generation students, in so far as less than 16% of them had fathers
with degrees. Differences between institutions in this study are not
particularly marked {see Table 4.4).
Table 4.4: Father's Highest Qualification by Institution
Col% Poly- CHEs Scottish All technic
None 35.9 30.3 43.1 35.8 0-level 18.3 19.2 12.7 17.8 A-level 8.1 5.7 8.5 7. 8 Subdegree 12.9 16.8 15.8 13.8 Degree· 15.9 18.6 10.4 15.8 Other 8.9 9. 5 9.6 9.1
Total 1831 370 260 2461
Table 4.5 shows the type of school attended by graduates broken down
by institution attended, and for comparison replies to a similar
question in Boys's study (1984: 10) are also shown. The most
interesting thing to emerge from this Table is the high proportion
who attended grammar schools. However, analysis of replies to the
same and supplementary questions in a study undertaken by the author
at North Staffordshire Polytechnic suggests that some confusion may
have existed amongst respondents as regards the difference between
independent (fee-paying) and grammar (selective LEA) schools such
that some of the HELM respondents had probably attended tee-paying
grammar schools. Combining these two categories, it was found that
almost half of those graduating in England and Wales had attended a
selective school (46.1% for the polytechnics and 48% for the CHEs).
Polytechnic and CHE students were, however, more likely to have
attended a maintained school and less likely to have attended an
PAGE 91
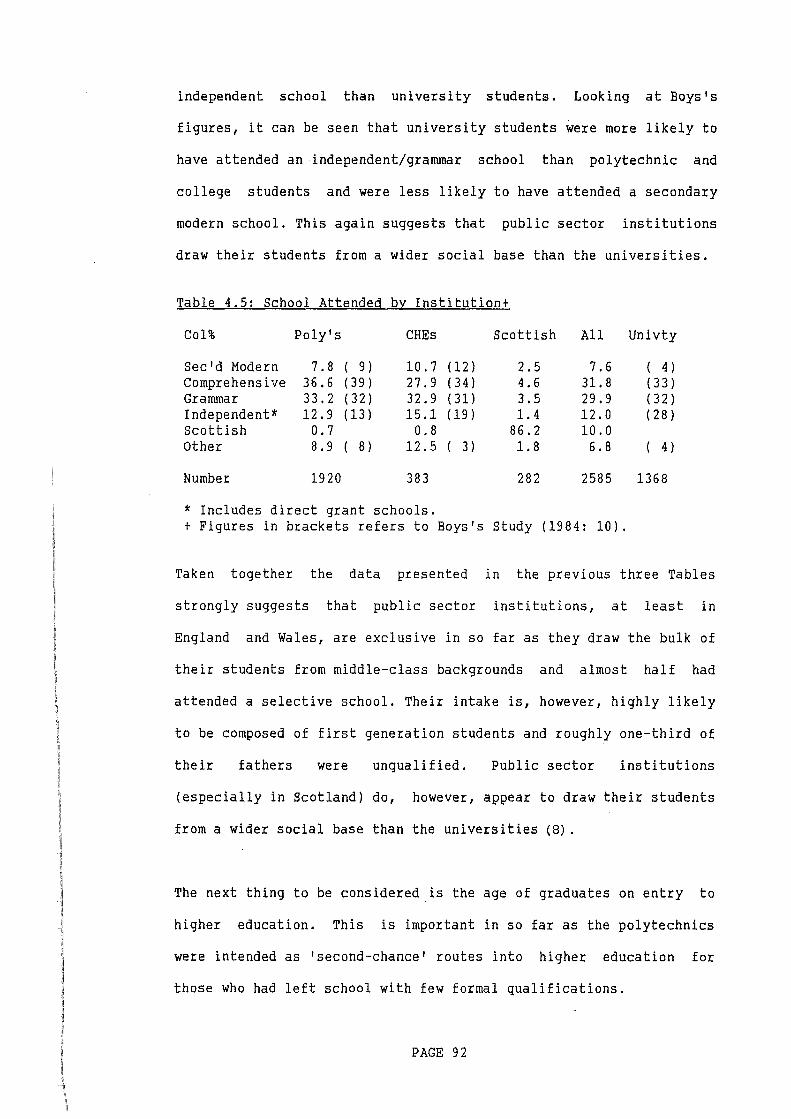
independent school than university students. Looking at Boys's
figures, it can be seen that university students were more likely to
have attended an independent/grammar school than polytechnic and
college students and were less likely to have attended a secondary
modern school. This again suggests that public sector institutions
draw their students from a wider social base than the universities.
Table 4.5: School Attended by Institution+
Col% Poly's CHEs Scottish All Univty
Sec'd Modern 7. 8 ( 9) 10.7 (12) 2.5 7.6 ( 4) Comprehensive 36.6 (39) 27.9 (34) 4.6 31.8 ( 33) Grammar 33.2 (32) 32.9 (31) 3.5 29.9 ( 32) Independent* 12.9 (13) 15.1 (19) 1.4 12.0 ( 28) Scottish 0.7 0.8 86.2 10.0 Other 8. 9 ( 8) 12.5 ( 3) 1.8 6. 8 ( 4)
Number 1920 383 282 2585 1368
* Includes direct grant schools. +Figures in brackets refers to Boys's Study (1984: 10).
Taken together the data presented in the previous three Tables
strongly suggests that public sector institutions, at least in
England and Wales, are exclusive in so far as they draw the bulk of
their students from middle-class backgrounds and almost half had
attended a selective school. Their intake is, however, highly likely
to be composed of first generation students and roughly one-third of
their fathers were unqualified. Public sector institutions
(especially in Scotland) do, however, appear to draw their students
from a wider social base than the universities (8).
The next thing to be considered is the age of graduates on entry to
higher education. This is important in so far as the polytechnics
were intended as 'second-chance' routes into higher education for
those who had left school with few formal qualifications.
PAGE 92
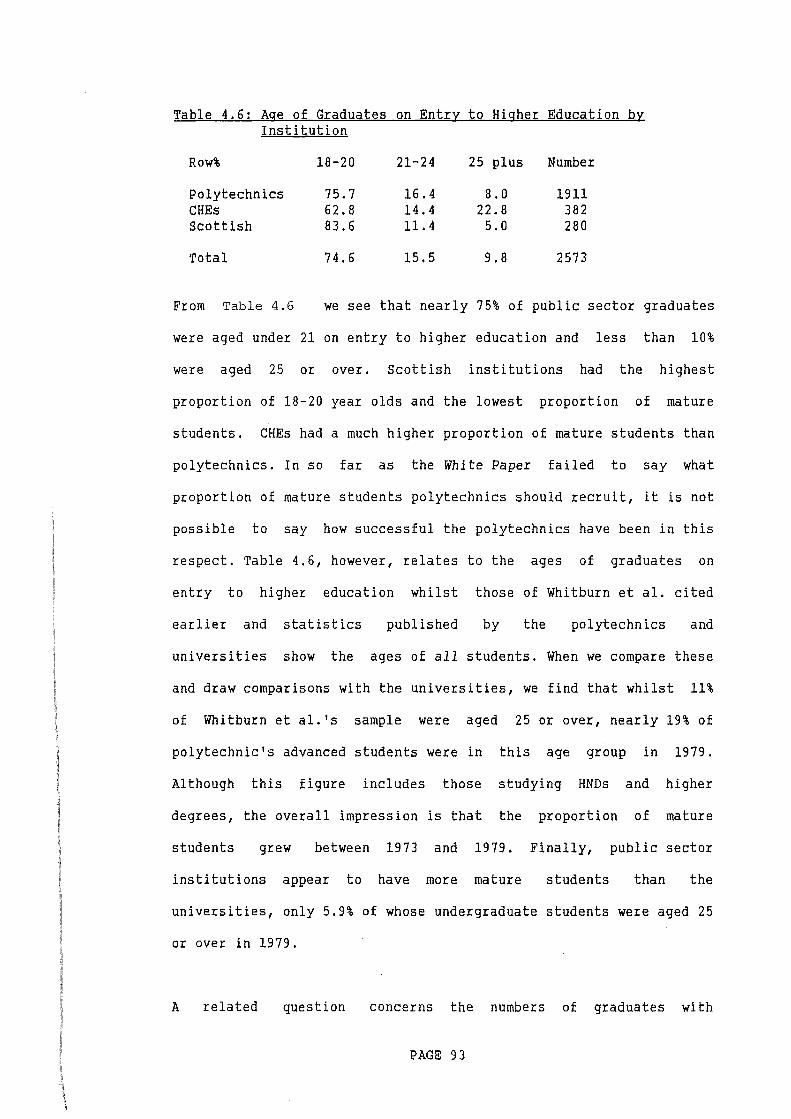
Table 4.6: Age of Graduates on Entr~ to Higher Education b~ Institution
Row% 18-20 21-24 25 plus Number
Polytechnics 75.7 16.4 8.0 1911 CHEs 62.8 14.4 22.8 382 Scottish 83.6 11.4 5.0 280
Total 74.6 15.5 9.8 2573
From Table 4. 6 we see that nearly 75% of public sector graduates
were aged under 21 on entry to higher education and less than 10%
were aged 25 or over. Scottish institutions had the highest
proportion of 18-20 year olds and the lowest proportion of mature
students. CHEs had a much higher proportion of mature students than
polytechnics. In so far as the White Paper failed to say what
proportion of mature students polytechnics should recruit, it is not
possible to say how successful the polytechnics have been in this
respect. Table 4.6, however, relates to the ages of graduates on
entry to higher education whilst those of Whitburn et al. cited
earlier and statistics published by the polytechnics and
universities show the ages of all students. When we compare these
and draw comparisons with the universities, we find that whilst 11%
of Whitburn et al. 's sample were aged 25 or over, nearly 19% of
polytechnic's advanced students were in this age group in 1979.
Although this figure includes those studying HNDs and higher
degrees, the overall impression is that the proportion of mature
students grew between 1973 and 1979. Finally, public sector
institutions appear to have more mature students than the
universities, only 5.9% of whose undergraduate students were aged 25
or over in 1979.
A related question concerns the numbers of graduates with
PAGE 93
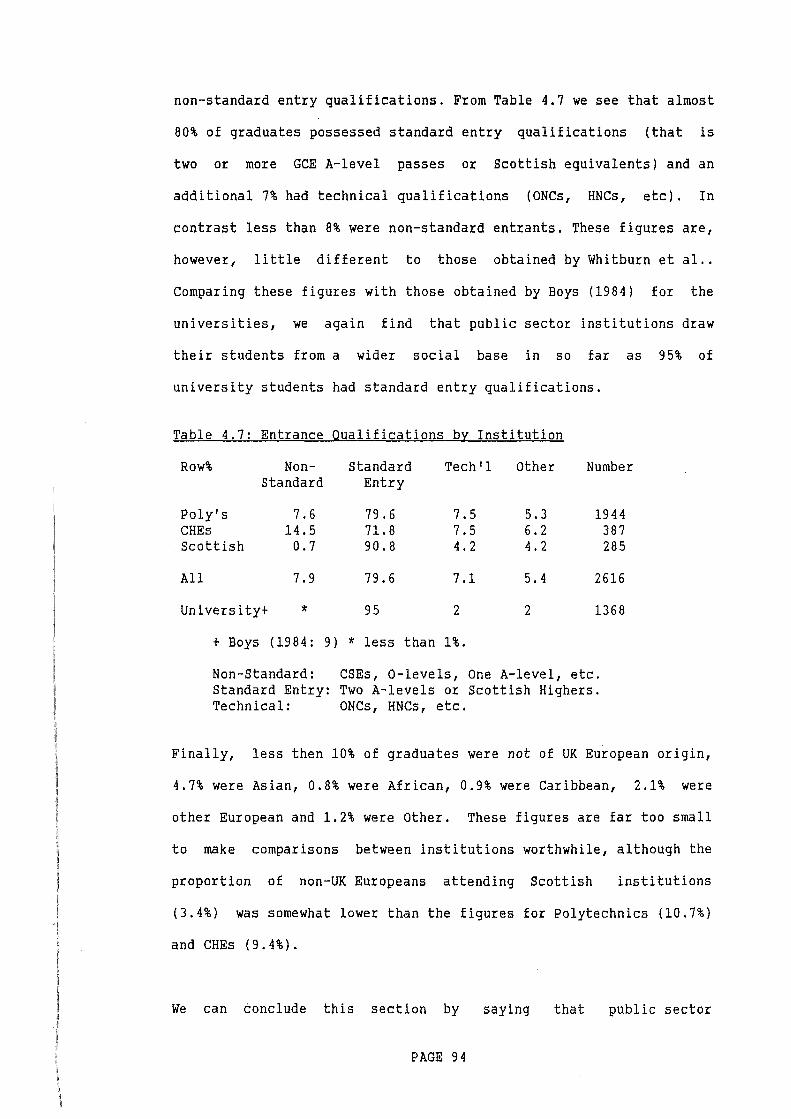
non-standard entry qualifications. From Table 4.7 we see that almost
80% of graduates possessed standard entry qualifications (that is
two or more GCE A-level passes or Scottish equivalents) and an
additional 7% had technical qualifications (ONes, HNCs, etc). In
contrast less than 8% were non-standard entrants. These figures are,
however, little different to those obtained by Whitburn et al •.
Comparing these figures with those obtained by Boys (1984) for the
universities, we again find that public sector institutions draw
their students from a wider social base in so far as 95% of
university students had standard entry qualifications.
Table 4.7: Entrance Qualifications by Institution
Row% Non- Standard Tech'l Other Number Standard Entry
Poly's 7.6 79.6 7.5 5.3 1944 CHEs 14.5 71.8 7.5 6. 2 387 Scottish 0.7 90.8 4.2 4. 2 285
All 7.9 79.6 7.1 5.4 2616
University+ * 95 2 2 1368
+ Boys (1984: 9) * less than 1%.
Non-Standard: CSEs, 0-levels, One A-level, etc. Standard Entry: Two A-levels or Scottish Highers. Technical: ONCs, HNCs, etc.
Finally, less then 10% of graduates were not of UK European origin,
4.7% were Asian, 0.8% were African, 0.9% were Caribbean, 2.1% were
other European and 1.2% were Other. These figures are far too small
to make comparisons between institutions worthwhile, although the
proportion of non-UK Europeans attending Scottish institutions
(3.4%) was somewhat lower than the figures for Polytechnics (10.7%)
and CHEs (9.4%).
We can conclude this section by saying that public sector
PAGE 94
institutions are predominantly middle-class in composition, in so
far as they draw the bulk of their students from white-collar,
professional and managerial backgrounds. They do, however, appear to
draw their students from a wider social base that the universities.
They have more mature, working-class and non-standard entrants than
the universities and most of their students appear to be
first-generation students, in so far as only a minority of their
parents possessed a degree-level qualification. When, however,
comparisons are drawn with the work of Whitburn et al. conducted in
1972/3 the overall impression is that, although the proportion of
non-standard entrants and mature students has remained almost
constant, a decline has occurred in the proportion of students from
working-class origins attending the polytechnics.
Part Three: Graduates from Working-Class Origins
Given research (reviewed in Chapter One) and our own findings, which
strongly suggest that they are far more likely than their more
middle-class counterparts to drop out of education at an early age,
it should be clear that students and graduates from working-class
origins are strongly atypical of their social class in so far as
they have been successful academically. In this section their main
characteristics are examined in an attempt to discover how they may
differ both from other graduates and from others of their class of
origin.
Our first clue as to how graduates from manual origins might differ
from other graduates comes from an examination of the works of Pratt
PAGE 95
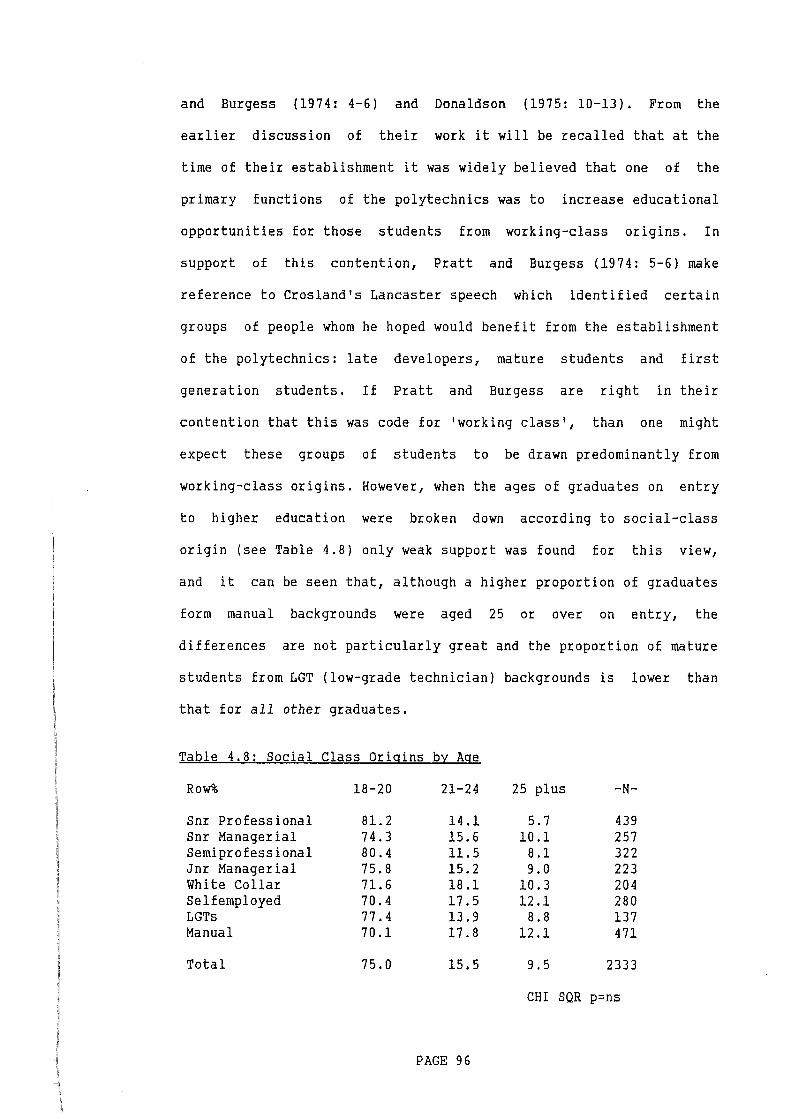
and Burgess (1974: 4-6) and Donaldson (1975: 10-13). From the
earlier discussion of their work it will be recalled that at the
time of their establishment it was widely believed that one of the
primary functions of the polytechnics was to increase educational
opportunities for those students from working-class origins. In
support of this contention, Pratt and Burgess (1974: 5-6) make
reference to Crosland's Lancaster speech which identified certain
groups of people whom he hoped would benefit from the establishment
of the polytechnics: late developers, mature students and first
generation students. If Pratt and Burgess are right in their
contention that this was code for 'working class', than one might
expect these groups of students to be drawn predominantly from
working-class origins. However, when the ages of graduates on entry
to higher education were broken down according to social-class
origin (see Table 4.8) only weak support was found for this view,
and it can be seen that, although a higher proportion of graduates
form manual backgrounds were aged 25 or over on entry, the
differences are not particularly great and the proportion of mature
students from LGT (low-grade technician) backgrounds is lower than
that for all other graduates.
Table 4.8: Social Class Origins by Age
Row%
Snr Professional Snr Managerial Semiprofessional Jnr Managerial White Collar Selfemployed LGTs Manual
Total
18-20
81.2 74.3 80.4 75.8 71.6 70.4 77.4 70.1
75.0
21-24
14.1 15.6 11.5 15.2 18.1 17.5 13.9 17.8
15.5
PAGE 96
25 plus
5.7 10.1
8.1 9.0
10.3 12.1
8.8 12.1
9.5
-N-
439 257 322 223 204 280 137 471
2333
CHI SQR p=ns
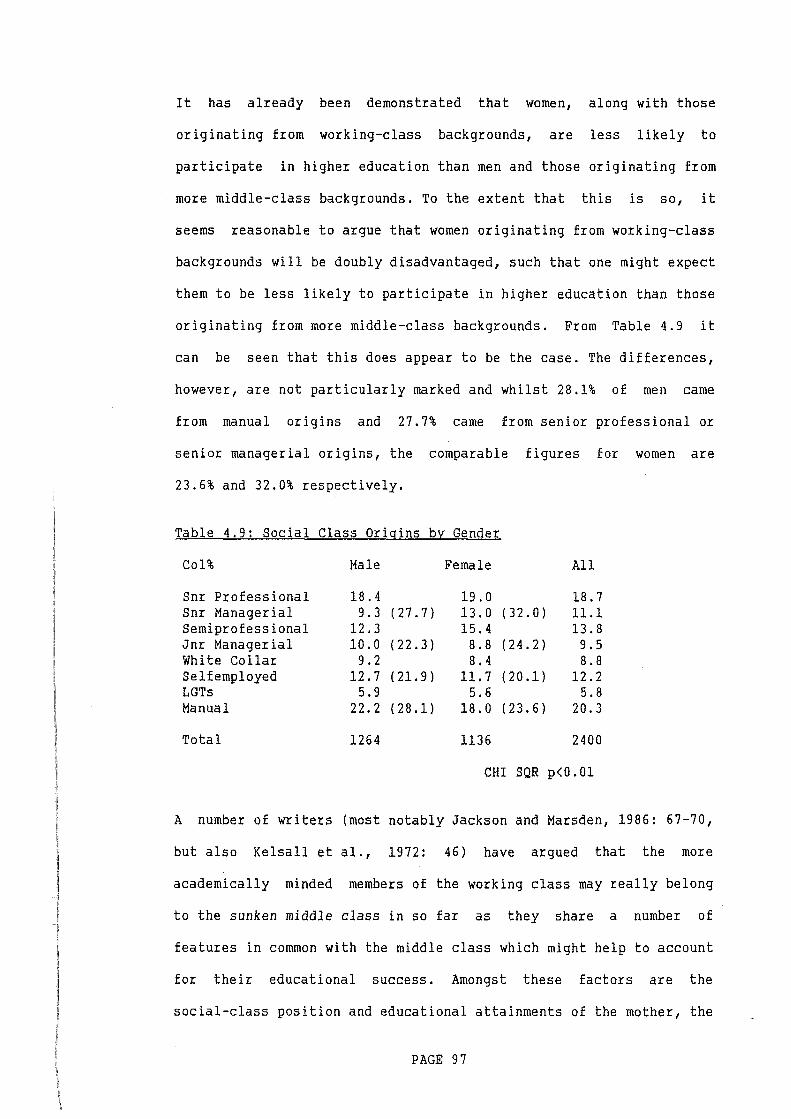
It has already been demonstrated that women, along with those
originating from working-class backgrounds, are less likely to
participate in higher education than men and those originating from
more middle-class backgrounds. To the extent that this is so, it
seems reasonable to argue that women originating from working-class
backgrounds will be doubly disadvantaged, such that one might expect
them to be less likely to participate in higher education than those
originating from more middle-class backgrounds. From Table 4.9 it
can be seen that this does appear to be the case. The differences,
however, are not particularly marked and whilst 28.1% of men came
from manual origins and 27.7% came from senior professional or
senior managerial origins, the comparable figures for women are
23.6% and 32.0% respectively.
Table 4.9: Social Class Origins by Gender
Col% Male Female All
Snr Professional 18.4 19.0 18.7 Snr Managerial 9.3 (27.7) 13.0 (32.0) 11.1 Semiprofessional 12.3 15.4 13.8 Jnr Managerial 10.0 (22.3) 8.8 (24.2) 9.5 White Collar 9.2 8.4 8. 8 Selfemployed 12.7 (21.9) 11.7 (20.1) 12.2 LGTs 5.9 5.6 5.8 Manual 22.2 (28.1) 18.0 (23.6) 20.3
Total 1264 1136 2400
CHI SQR p<0.01
A number of writers (most notably Jackson and Marsden, 1986: 67-70,
but also Kelsall et al., 1972: 46) have argued that the more
academically minded members of the working class may really belong
to the sunken middle class in so far as they share a number of
features in common with the middle class which might help to account
for their educational success. Amongst these factors are the
social-class position and educational attainments of the mother, the
PAGE 97
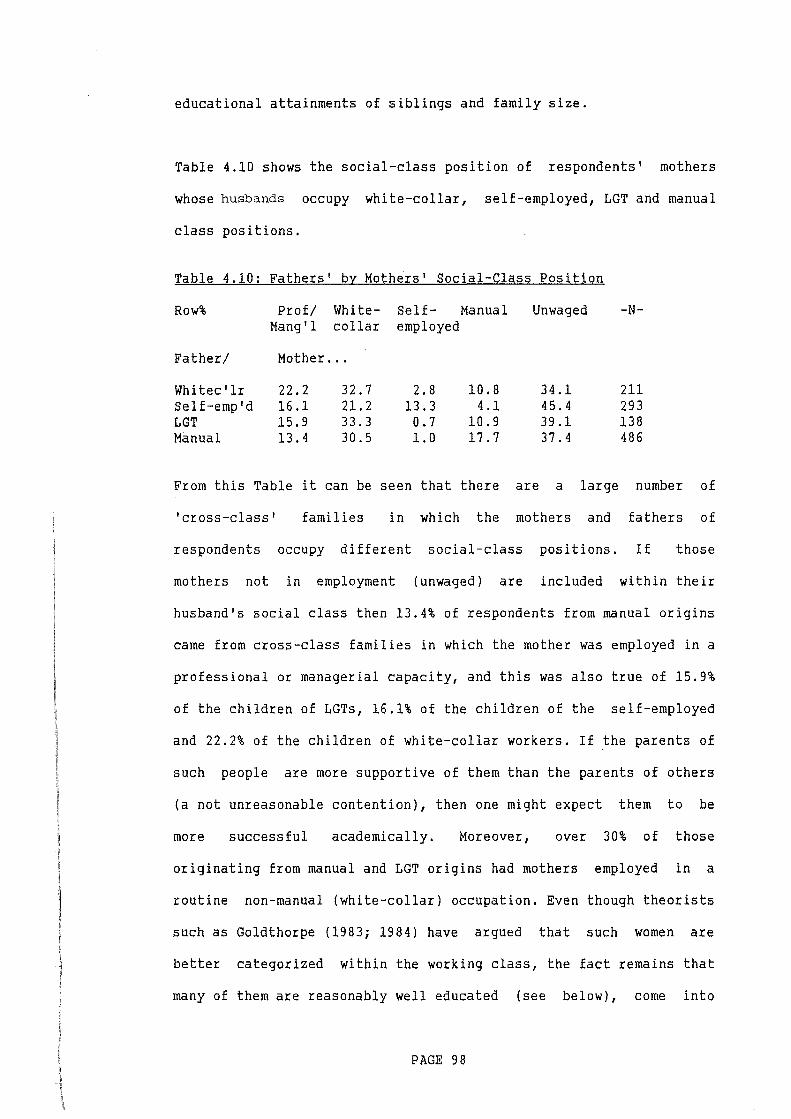
educational attainments of siblings and family size.
Table 4.10 shows the social-class position of respondents' mothers
whose husbands occupy white-collar, self-employed, LGT and manual
class positions.
Table 4.10: Fathers' by Mothers' Social-Class Position
Row% Prof/ White- Self- Manual Unwaged -N-Mang'l collar employed
Father/ Mother ...
Whitec'lr 22.2 32.7 2.8 10.8 34.1 211 Self-ernp'd 16.1 21.2 13.3 4.1 45.4 293 LGT 15.9 33.3 0.7 10.9 39.1 138 Manual 13.4 30.5 1.0 17.7 37.4 486
From this Table it can be seen that there are a large number of
'cross-class' farnil ies in which the mothers and fathers of
respondents occupy different social-class positions. If those
mothers not in employment (unwaged) are included within their
husband's social class then 13.4% of respondents from manual origins
carne from cross-class families in which the mother was employed in a
professional or managerial capacity, and this was also true of 15.9%
of the children of LGTs, 16.1% of the children of the self-employed
and 22.2% of the children of white-collar workers. If the parents of
such people are more supportive of them than the parents of others
(a not unreasonable contention), then one might expect them to be
more successful academically. Moreover, over 30% of those
originating from manual and LGT origins had mothers employed in a
routine non-manual (white-collar) occupation. Even though theorists
such as Goldthorpe (1983; 1984) have argued that such women are
better categorized within the working class, the fact remains that
many of them are reasonably well educated (see below), come into
PAGE 98
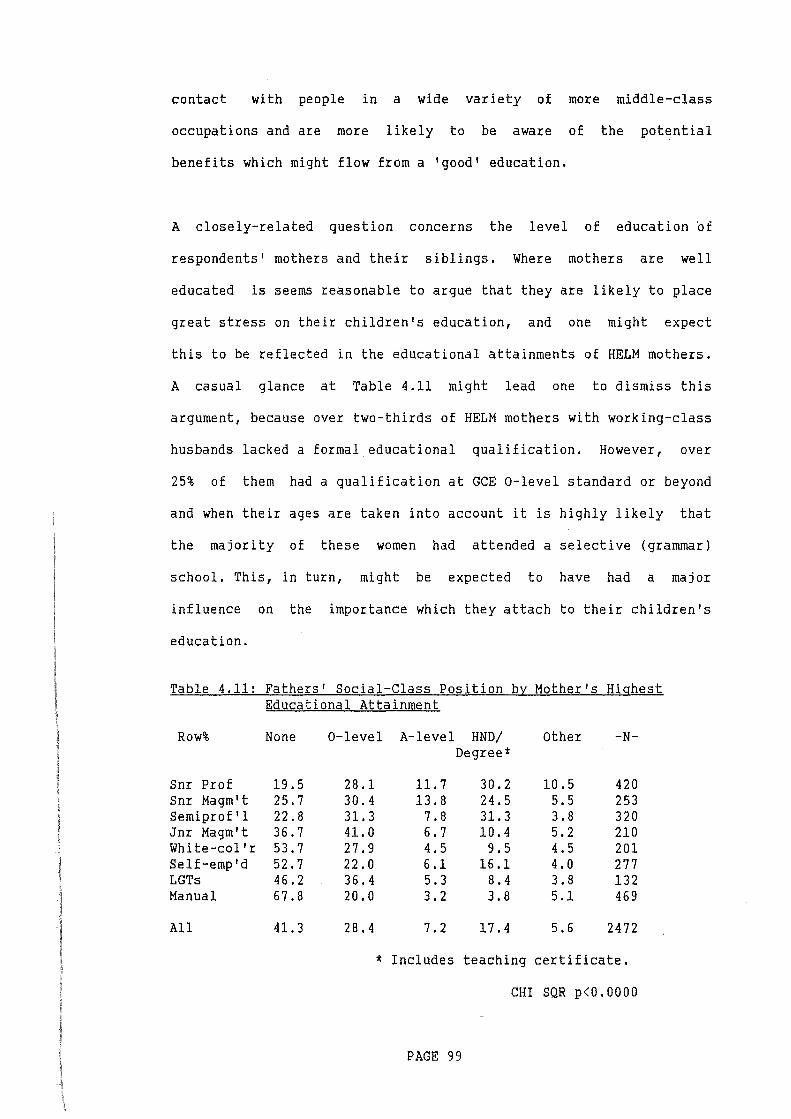
contact with people in a wide variety of more middle-class
occupations and are more likely to be aware of the potential
benefits which might flow from a 'good' education.
A closely-related question concerns the level of education bf
respondents' mothers and their siblings. Where mothers are well
educated is seems reasonable to argue that they are likely to place
great stress on their children's education, and one might expect
this to be reflected in the educational attainments of HELM mothers.
A casual glance at Table 4.11 might lead one to dismiss this
argument, because over two-thirds of HELM mothers with working-class
husbands lacked a formal educational qualification. However, over
25% of them had a qualification at GCE 0-level standard or beyond
and when their ages are taken into account it is highly likely that
the majority of these women had attended a selective (grammar)
school. This, in turn, might be expected to have had a major
influence on the importance which they attach to their children's
education.
Table 4.11: Fathers' Social-Class Position by Mother's Highest Educational Attainment
Row% None
Snr Prof 19.5 Snr Magm't 25.7 Semiprof'l 22.8 Jnr Magm't 36.7 White-col'r 53.7 Self-emp'd 52.7 LGTs 46.2 Manual 67.8
All 41.3
0-level A-level HND/ Degree*
28.1 11.7 30.2 30.4 13.8 24.5 31.3 7.8 31.3 41.0 6.7 10.4 27.9 4.5 9.5 22.0 6.1 16.1 36.4 5.3 8.4 20.0 3.2 3.8
28.4 7.2 17.4
Other -N-
10.5 420 5.5 253 3.8 320 5.2 210 4.5 201 4.0 277 3.8 132 5.1 469
5.6 2472
* Includes teaching certificate.
CHI SQR p<O.OOOO
PAGE 99
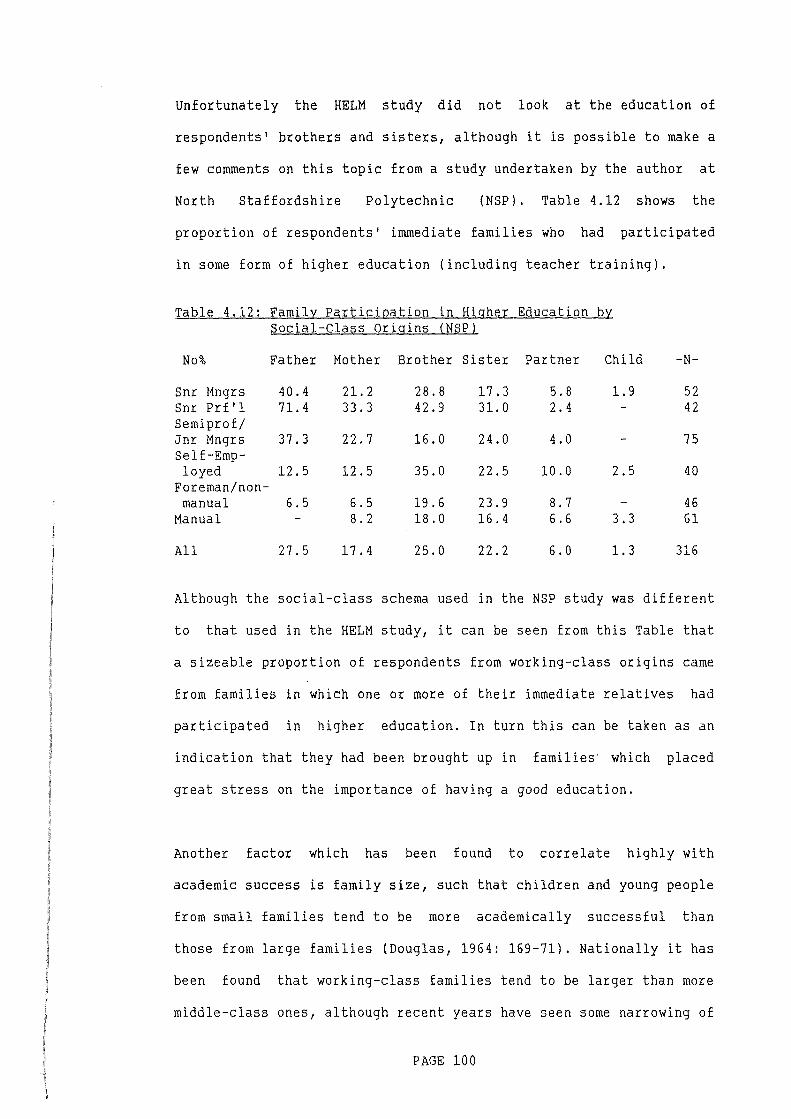
Unfortunately the HELM study did not look at the education of
respondents' brothers and sisters, although it is possible to make a
few comments on this topic from a study undertaken by the author at
North Staffordshire Polytechnic (NSP). Table 4.12 shows the
proportion of respondents' immediate families who had participated
in some form of higher education (including teacher training).
Table 4.12: Family Participation in Higher Education by Social-Class Origins (NSP)
No% Father Mother Brother Sister Partner Child -N-
Snr Mngrs 40.4 21.2 28.8 17.3 5.8 1. 9 52 Snr Prf'l 71.4 33.3 42.9 31.0 2.4 42 Semipro£/ Jnr Mngrs 37.3 22.7 16.0 24.0 4.0 75 Self-Emp-loyed 12.5 12.5 35.0 22.5 10.0 2.5 40
Foreman/non-manual 6.5 6.5 19.6 23.9 8.7 46
Manual - 8.2 18.0 16.4 6.6 3.3 61
All 27.5 17.4 25.0 22.2 6.0 1. 3 316
Although the social-class schema used in the NSP study was different
to that used in the HELM study, it can be seen from this Table that
a sizeable proportion of respondents from working-class origins came
from families in which one or more of their immediate relatives had
participated in higher education. In turn this can be taken as an
indication that they had been brought up in families which placed
great stress on the importance of having a good education.
Another factor which has been found to correlate highly with
academic success is family size, such that children and young people
from small families tend to be more academically successful than
those from large families (Douglas, 1964: 169-71). Nationally it has
been found that working-class families tend to be larger than more
middle-class ones, although recent years have seen some narrowing of
PAGE 100
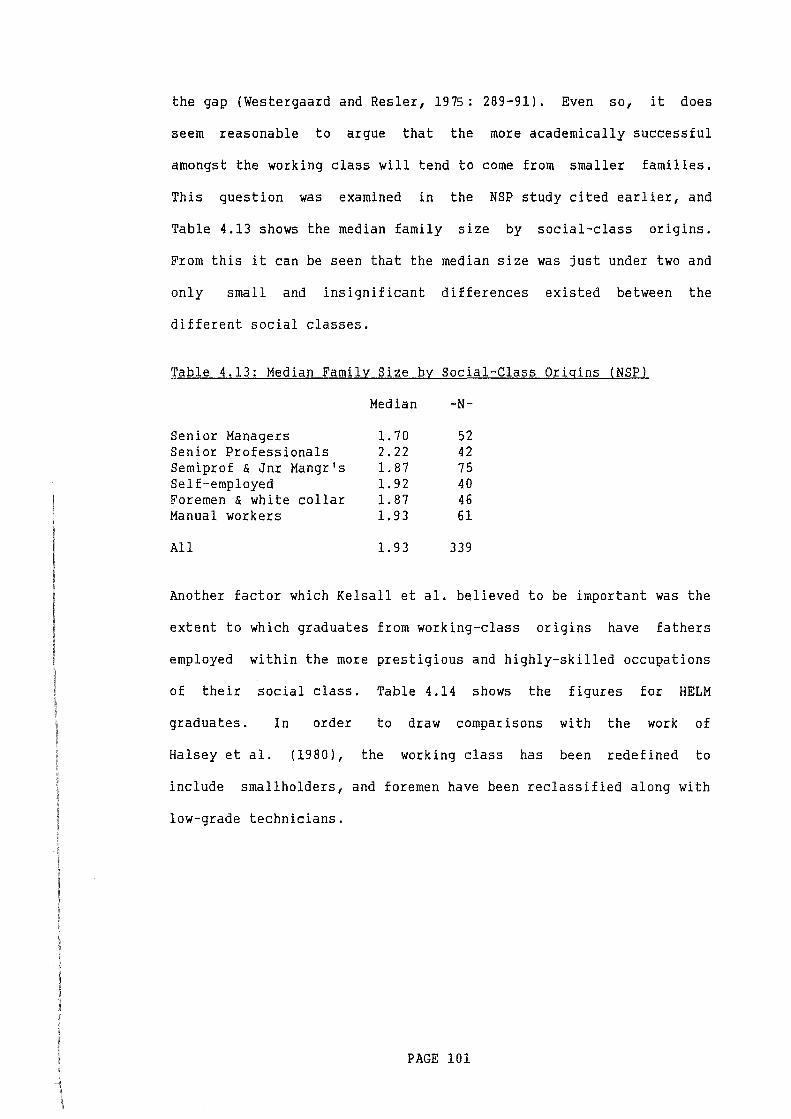
the gap (Westergaard and Resler, 1975: 289-91). Even so, it does
seem reasonable to argue that the more academically successful
amongst the working class will tend to come from smaller families.
This question was examined in the NSP study cited earlier, and
Table 4.13 shows the median family size by social-class origins.
From this it can be seen that the median size was just under two and
only small and insignificant differences existed between the
different social classes.
Table 4.13: Median Family Size by Social-Class Origins (NSP)
Median -N-
Senior Managers 1. 70 52 Senior Professionals 2.22 42 Semipro£ & Jnr Mangr's 1. 87 75 Self-employed 1.92 40 Foremen & white collar 1. 87 46 Manual workers 1. 93 61
All 1. 93 339
Another factor which Kelsall et al. believed to be important was the
extent to which graduates from working-class origins have fathers
employed within the more prestigious and highly-skilled occupations
of their social class. Table 4.14 shows the figures for HELM
graduates. In order to draw comparisons with the work of
Halsey et al. (1980), the working class has been redefined to
include smallholders, and foremen have been reclassified along with
low-grade technicians.
PAGE 101

Table 4.14: Graduates From Manual Origins
Oxford HELM Ratio study* Study
LGTs & Foremen 11.3% 8.3% 0.73 Skilled Manual 27.2 8.3 0.31 Semi- & unskilled 22.6 8.9 0.39 Agricultural Wrkrs 5.1 0.8 0.16
* Relates to Great Britain as a whole.
Kelsall et al. 's view is only partially born out by this Table in so
far as the children of LGTs and foremen were the most likely of
those from working-class origins to enter public sector institutions
(ratio: 0.73) and the children of agricultural workers (including
smallholders) were the least likely to do so. However, the
differences between the two other manual groups are rather small and
if anything the children of semi- and unskilled manual workers were
marginally more likely to attend public sector institutions than the
children of skilled manual workers.
Taken together these data add a great deal of support to the
contention that public sector graduates from manual origins share a
great deal in common with those from more middle-class origins. To
some extent their fathers occupy the more prestigious positions
within the working class, their mothers often work in white-collar,
managerial or professional occupations and many mothers must have
had a selective (grammar) school education. Working-class graduates
tended to come from small families and many had close relatives who
had also participated in higher education.
The next thing to consider is the secondary education of HELM
graduates. This question is, however, discussed more fully in
PAGE 102
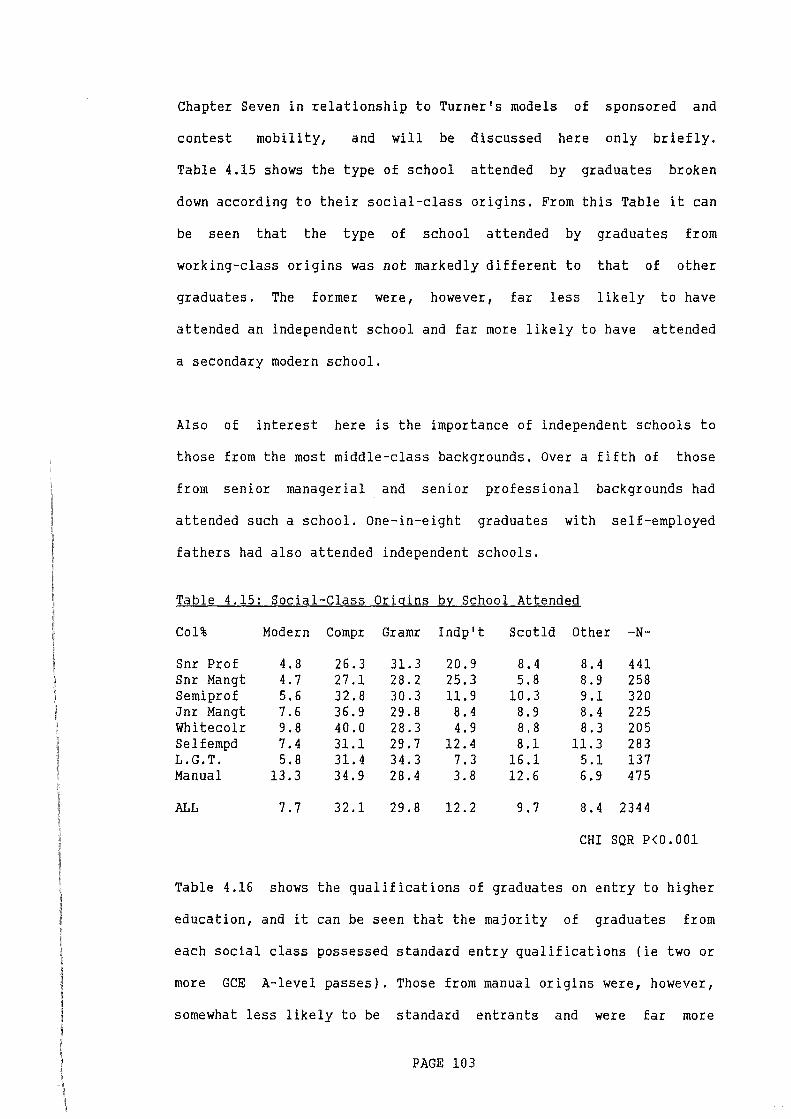
Chapter Seven in relationship to Turner's models of sponsored and
contest mobility, and will be discussed here only briefly.
Table 4.15 shows the type of school attended by graduates broken
down according to their social-class origins. From this Table it can
be seen that the type of school attended by graduates from
working-class origins was not markedly different to that of other
graduates. The former were, however, far less likely to have
attended an independent school and far more likely to have attended
a secondary modern school.
Also of interest here is the importance of independent schools to
those from the most middle-class backgrounds. Over a fifth of those
from senior managerial and senior professional backgrounds had
attended such a school. One-in-eight graduates with self-employed
fathers had also attended independent schools.
Table 4.15: Social-Class Origins by School Attended
Col%
Snr Prof Snr Mangt Semipro£ Jnr Mangt Whitecolr Selfempd L.G.T. Manual
ALL
Modern
4.8 4.7 5.6 7.6 9.8 7.4 5.8
13.3
7.7
Compr
26.3 27.1 32.8 36.9 40.0 31.1 31.4 34.9
32.1
Gramr
31.3 28.2 30.3 29.8 28.3 29.7 34.3 28.4
29.8
Indp't
20.9 25.3 11.9
8.4 4.9
12.4 7.3 3.8
12.2
Scotld
8.4 5.8
10.3 8.9 8.8 8.1
16.1 12.6
9.7
Other -N-
8.4 441 8.9 258 9.1 320 8.4 225 8.3 205
11.3 283 5.1 137 6.9 475
8.4 2344
CHI SQR P<O.OOl
Table 4.16 shows the qualifications of graduates on entry to higher
education, and it can be seen that the majority of graduates from
each social class possessed standard entry qualifications (ie two or
more GCE A-level passes). Those from manual origins were, however,
somewhat less likely to be standard entrants and were far more
PAGE 103
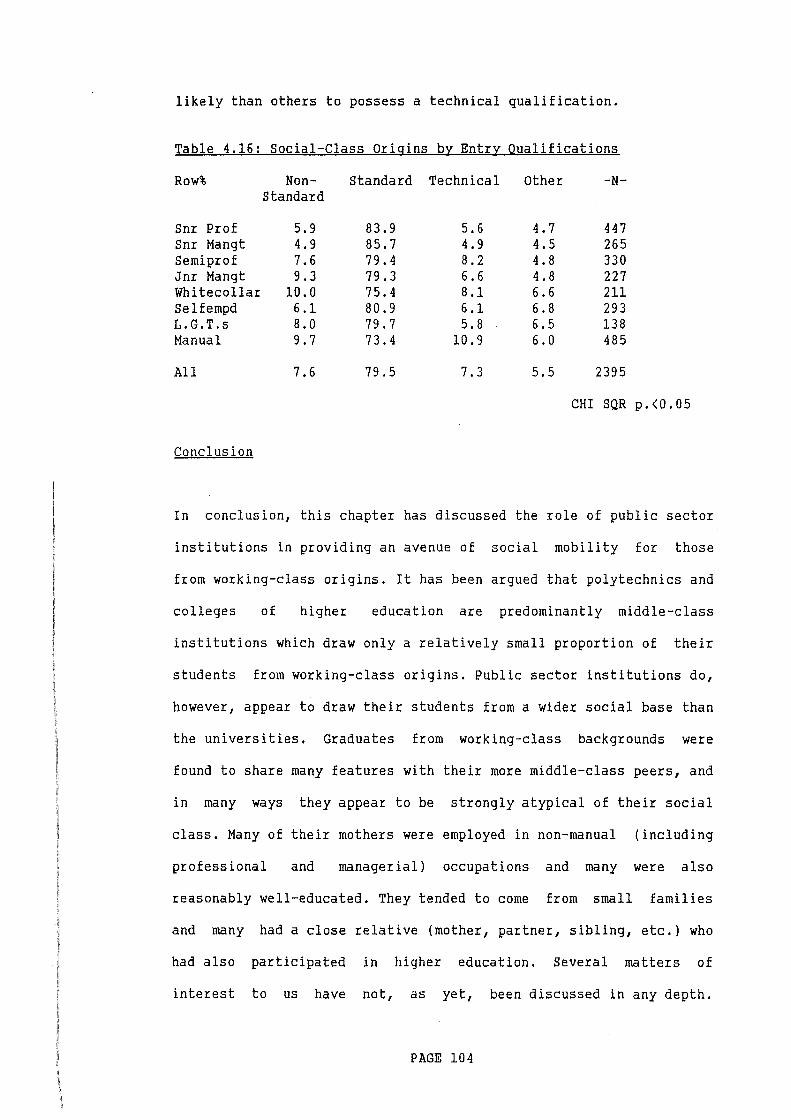
likely than others to possess a technical qualification.
Table 4.16: Social-Class Origins by Entry Qualifications
Row% Non- Standard Technical Other -N-Standard
Snr Prof 5.9 83.9 5.6 4.7 447 Snr Mangt 4.9 85.7 4.9 4.5 265 Semipro£ 7.6 79.4 8.2 4.8 330 Jnr Mangt 9.3 79.3 6.6 4.8 227 Wh i teco llar 10.0 75.4 8.1 6.6 211 Selfempd 6.1 80.9 6.1 6.8 293 L.G.T.s 8.0 79.7 5.8 6.5 138 Manual 9.7 73.4 10.9 6.0 485
All 7.6 79.5 7.3 5.5 2395
CHI SQR p.<0.05
Conclusion
In conclusion, this chapter has discussed the role of public sector
institutions in providing an avenue of social mobility for those
from working-class origins. It has been argued that polytechnics and
colleges of higher education are predominantly middle-class
institutions which draw only a relatively small proportion of their
students from working-class origins. Public sector institutions do,
however, appear to draw their students from a wider social base than
the universities. Graduates from working-class backgrounds were
found to share many features with their more middle-class peers, and
in many ways they appear to be strongly atypical of their social
class. Many of their mothers were employed in non-manual (including
professional and managerial) occupations and many were also
reasonably well-educated. They tended to come from small families
and many had a close relative (mother, partner, sibling, etc.) who
had also participated in higher education. Several matters of
interest to us have not, as yet, been discussed in any depth.
PAGE 104

Discussion of the secondary education of graduates, their courses of
study and motives for entering higher education has been held over
to Chapter Seven. Gender differences in the origins and employment
destinations of graduates are examined in Chapter Eight and
Chapter Nine looks at ethnicity.
PAGE 105
CHAPTER FIVE: THE OCCUPATIONAL AND SOCIAL-CLASS DESTINATIONS OF CNAA GRADUATES
This chapter examines the relationship which exists between the
social-class origins of CNAA graduates and their occupational and
social-class destinations. In Part One the work of Kelsall et al.
{1972} is examined in order to set the scene for the HELM data which
is discussed in Part Two. Finally, the implications of our findings
are examined in Part Three.
Part One: Kelsall et al.'s Study
In Chapter One reference was made to the work of Kelsall et al.
(1972}, who discovered that graduates from working-class backgrounds
tended to be less successful in the labour market than those from
more middle-class backgrounds. Table 5.1, taken from Kelsall et al.
(1972: 193}, illustrates this point. From this we see that six years
after graduation 40% of the sons of professional workers were
themselves professionals and 57% were employed in intermediate
occupations. In comparison only 21% of the sons of unskilled manual
workers were professionals and 77% were in intermediate occupations.
When the first jobs undertaken by women were examined a much weaker
relationship was found to exist between their social-class origins
and destinations, and we see (Table 5.1} that whilst 11% of the
daughters of professional workers were themselves professionals only
6% of the daughters of semiskilled and unskilled manual workers
were.
PAGE 106
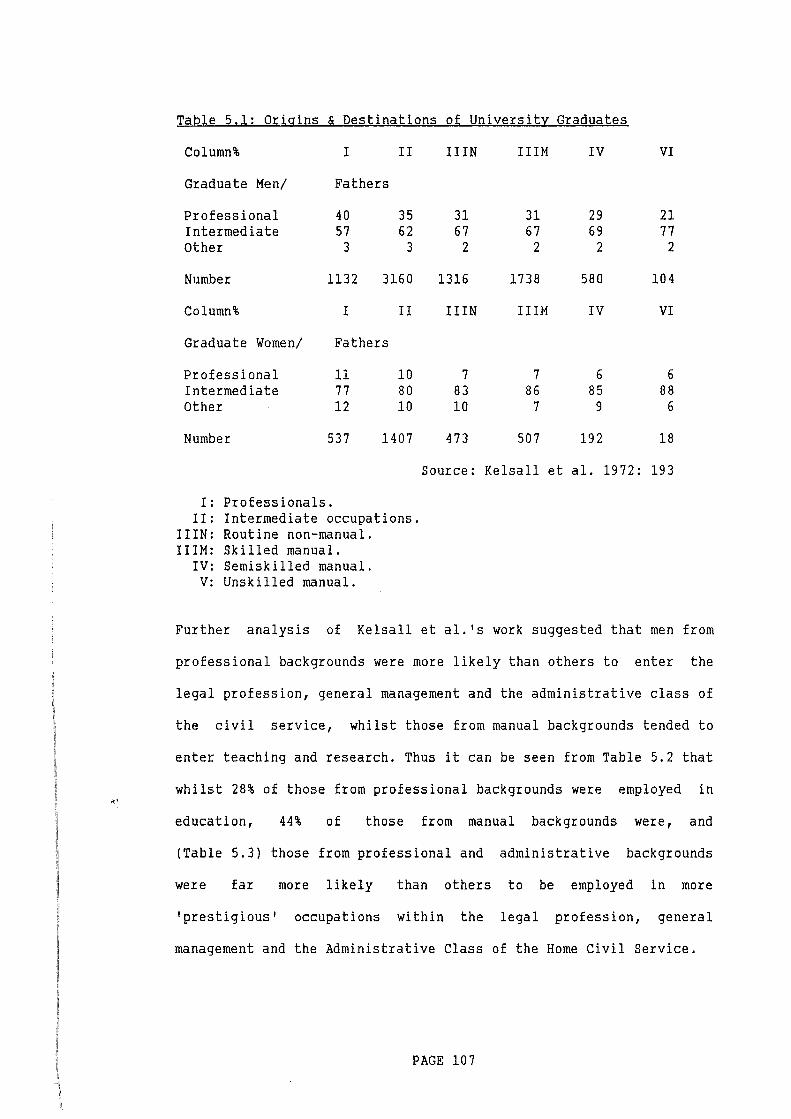
~·
Table 5.1: Origins & Destinations of University Graduates
Column% I II IIIN IIIM IV VI
Graduate Men/ Fathers
Professional 40 35 31 31 29 21 Intermediate 57 62 67 67 69 77 Other 3 3 2 2 2 2
Number 1132 3160 1316 1738 580 104
Column% I II IIIN IIIM IV VI
Graduate Women/ Fathers
Professional 11 10 7 7 6 6 Intermediate 77 80 83 86 85 88 Other 12 10 10 7 9 6
Number 537 1407 473 507 192 18
Source: Kelsall et al. 1972: 193
I: Professionals. II: Intermediate occupations.
IIIN: Routine non-manual. IIIM: Skilled manual.
IV: Semiskilled manual. V: Unskilled manual.
Further analysis of Kelsall et al. 's work suggested that men from
professional backgrounds were more likely than others to enter the
legal profession, general management and the administrative class of
the civil service, whilst those from manual backgrounds tended to
enter teaching and research. Thus it can be seen from Table 5.2 that
whilst 28% of those from professional backgrounds were employed in
education, 44% of those from manual backgrounds were, and
{Table 5.3) those from professional and administrative backgrounds
were far more likely than others to be employed in more
'prestigious' occupations within the legal profession, general
management and the Administrative Class of the Home Civil Service.
PAGE 107
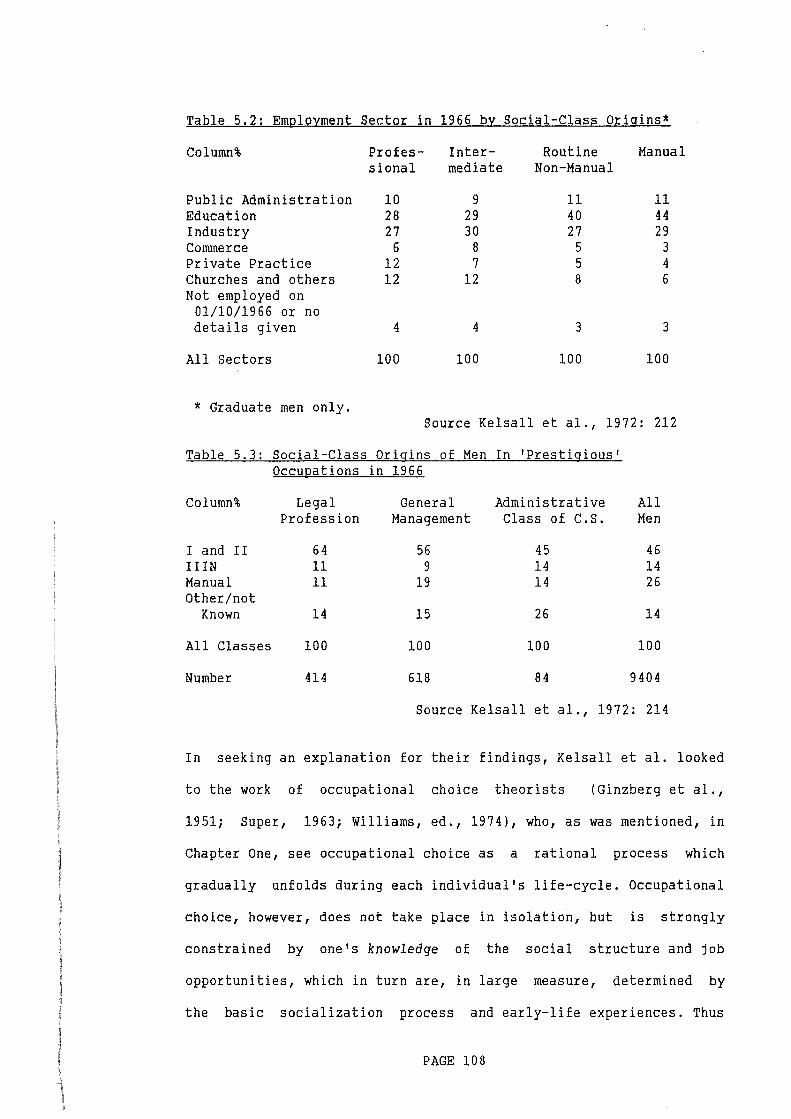
Table 5.2: Employment Sector in 1966 by Social-Class Origins*
Column% Profes- Inter- Routine Manual sional mediate Non-Manual
Public Administration 10 9 11 11 Education 28 29 40 44 Industry 27 30 27 29 Commerce 6 8 5 3 Private Practice 12 7 5 4 Churches and others 12 12 8 6 Not employed on
01/10/1966 or no details given 4 4 3 3
All Sectors 100 100 100 100
* Graduate men only. Source Kelsall et al., 1972: 212
Table 5.3: Social-Class Origins of Men In 'Prestigious' Occupations in 1966
Column% Legal General Administrative All Profession Management Class of C.S. Men
I and II 64 56 45 46 IIIN 11 9 14 14 Manual 11 19 14 26 Other/not
Known 14 15 26 14
All Classes 100 100 100 100
Number 414 618 84 9404
Source Kelsall et al., 1972: 214
In seeking an explanation for their findings, Kelsall et al. looked
to the work of occupational choice theorists (Ginzberg et al.,
1951; Super, 1963; Williams, ed., 1974), who, as was mentioned, in
Chapter One, see occupational choice as a rational process which
gradually unfolds during each individual's life-cycle. Occupational
choice, however, does not take place in isolation, but is strongly
constrained by one's knowledge of the social structure and job
opportunities, which in turn are, in large measure, determined by
the basic socialization process and early-life experiences. Thus
PAGE 108
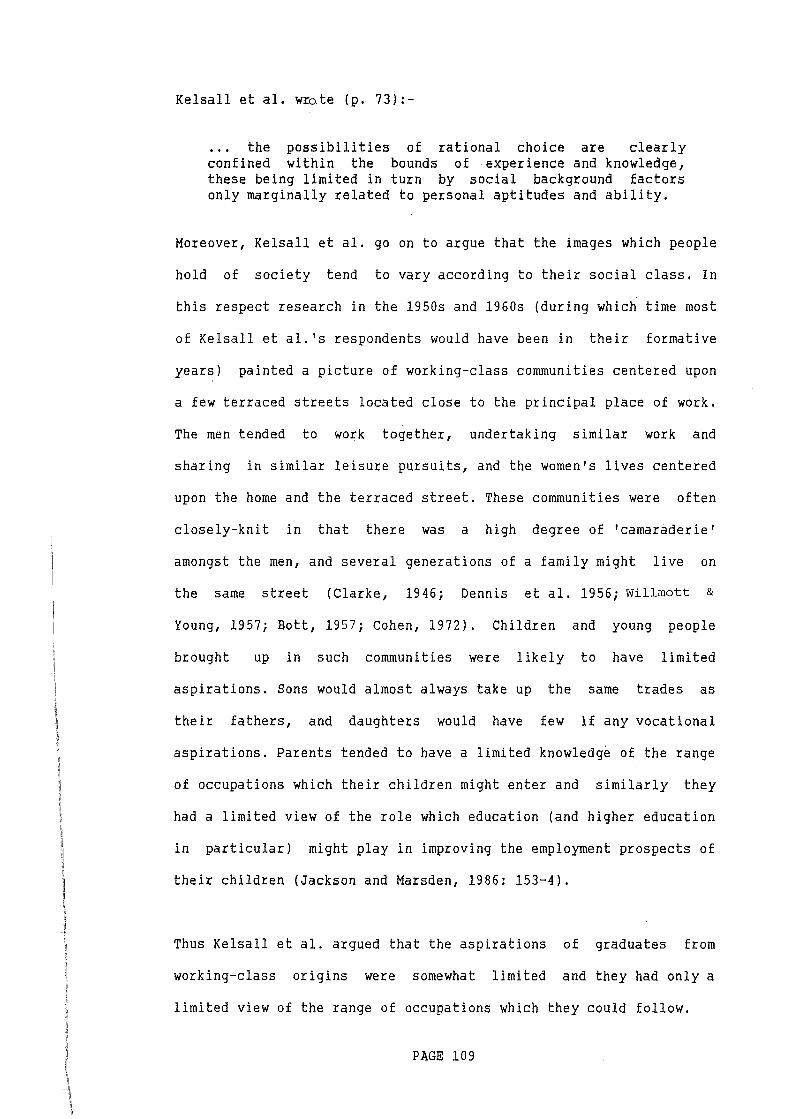
Kelsall et al. wro.te (p. 73) :-
the possibilities of rational choice are clearly confined within the bounds of experience and knowledge, these being limited in turn by social background factors only marginally related to personal aptitudes and ability.
Moreover, Kelsall et al. go on to argue that the images which people
hold of society tend to vary according to their social class. In
this respect research in the 1950s and 1960s (during which time most
of Kelsall et al. 's respondents would have been in their formative
years) painted a picture of working-class communities centered upon
a few terraced streets located close to the principal place of work.
The men tended to work together, undertaking similar work and
sharing in similar leisure pursuits, and the women's lives centered
upon the home and the terraced street. These communities were often
closely-knit in that there was a high degree of 'camaraderie'
amongst the men, and several generations of a family might live on
the same street (Clarke, 1946; Dennis et a1. 1956; Willmott &
Young, 1957; Bott, 1957; Cohen, 1972). Children and young people
brought up in such communities were likely to have limited
aspirations. Sons would almost always take up the same trades as
their fathers, and daughters would have few if any vocational
aspirations. Parents tended to have a limited knowledge of the range
of occupations which their children might enter and similarly they
had a limited view of the role which education (and higher education
in particular) might play in improving the employment prospects of
their children (Jackson and Marsden, 1986: 153-4).
Thus Kelsall et al. argued that the aspirations of graduates from
working-class origins were somewhat limited and they had only a
limited view of the range of occupations which they_could follow.
PAGE 109
Part Two: Origins and Destinations of HELM Graduates
Having in the last section examined the social-class origins and
destinations of Kelsall et al. 's graduates, this section repeats
their analysis using the HELM data.
The first things to be considered here are the occupations of HELM
graduates, differentiated according to their social-class origins.
Our analysis of their social-class destinations will be left until
later. Table 5.4 shows the occupations of graduates three years
after leaving college.
It is difficult to interpret this Table because of the small numbers
in some cells. However, looking first at the men we find (as did
Kelsall et al.) that the those from manual backgrounds were far more
likely than others to be employed in teaching and research
(including laboratory work), and they were also over-represented
within social work, art and design and computer programming. In
contrast, they were under-represented amongst pharmacists,
accountants and librarians, and fewer were employed within the legal
profession. Owing to the small numbers involved it would be
fruitless to analyse the rest of the data in detail. However, it can
be seen that the sons of'senior professionals are over-represented
amongst the engineers and pharmacists, the sons of senior managers
amongst librarians and artists and designers, and the sons of
semiprofessionals amongst pharmacists and librarians.
PAGE 110
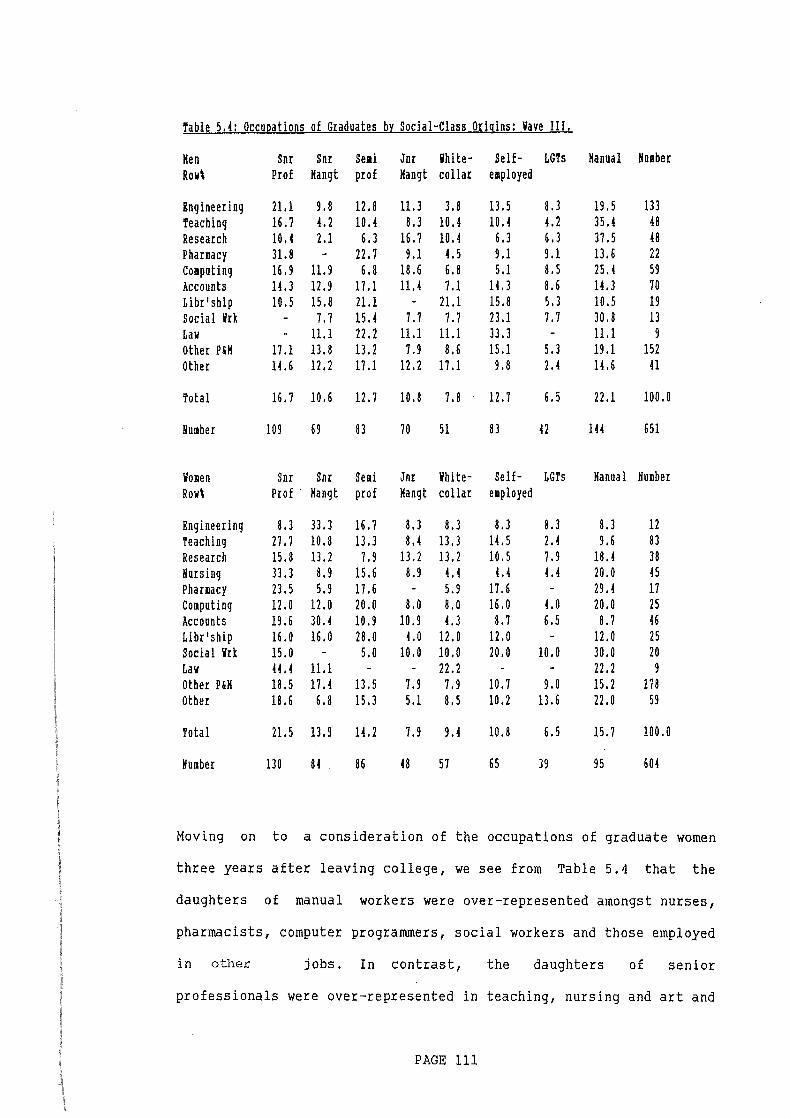
Table 5,4: Occupations of Graduates by Social-Class Origins: Wave III.
Ken Snr Snr Se1i Jnr White- Self- LGTs Manual Huaber Row\ Prof Kangt prof Kangt collar employed
Engineering 21.1 9.8 12.8 11.3 3.8 13.5 8.3 19.5 133 Teaching 16.7 4.2 10.4 8.3 10.4 10.4 4.2 35.4 48 Research 10.4 2.1 6.3 16.7 10.4 6.3 6.3 37.5 48 Pharmacy 31.8 - 22.7 9.1 4.5 9.1 9.1 13.6 22 Computing 16.9 11.9 6.8 18.6 6.8 5.1 8.5 25.4 59 Accounts 14.3 12.9 17.1 11.4 7.1 14.3 8.6 14.3 70 Libr'ship 10.5 15.8 21.1 - 21.1 15.8 5.3 10.5 19 Social Vrk - 7. 7 15.4 7.7 7.7 23.1 7.7 30.8 13 Law - 11.1 22.2 11.1 11.1 33.3 - 11.1 9 Other P&K 17.1 13.8 13.2 7.9 8.6 15.1 5.3 19.1 152 Other 14.6 12.2 17.1 12.2 17.1 9.8 2.4 14.6 H
Total 16.7 10.6 12.7 10.8 7.8 12.7 6.5 22.1 100.0
Number 109 69 83 70 51 83 42 144 651
Women Snr Sor Semi Jnr White- Self- LGTs Manual Humber Row\ Prof ' Kangt prof Kangt collar eaployed
Engineering 8.3 33.3 16.7 8.3 8.3 8.3 8.3 8.3 12 Teaching 27.7 10.8 13.3 8.4 13.3 14.5 2. 4 9.6 83 Research 15.8 13.2 7.9 13.2 13.2 10.5 7.9 18.4 38 Horsing 33.3 8.9 15.6 8.9 4.4 L4 4.4 20.0 45 Phanacy 23.5 5.9 17.6 - 5.9 17.6 - 29.4 17 Computing 12.0 12.0 20.0 8.0 8.0 16.0 4.0 20.0 25 Accounts 19.6 30.4 10.9 10.9 L3 8.7 6.5 8.7 46 Libr'ship 16.0 16.0 28.0 4.0 12.0 12.0 - 12.0 25 Social Vrk 15.0 - 5.0 10.0 10.0 20.0 10.0 30.0 20 Law H.4 11.1 - - 22.2 - - 22.2 9 Other P&K 18.5 17.4 13.5 7.9 7.9 10.7 9.0 15.2 178 Other 18.6 6.8 15.3 5.1 8.5 10.2 13.6 22.0 59
Total 21.5 13.9 14.2 7.9 9.4 10.8 6.5 15.7 100.0
Humber 130 84 86 48 57 65 39 95 604
Moving on to a consideration of the occupations of graduate women
three years after leaving college, we see from Table 5.4 that the
daughters of manual workers were over-represented amongst nurses,
pharmacists, computer programmers, social workers and those employed
in other jobs. In contrast, the daughters of senior
professionals were over-represented in teaching, nursing and art and
PAGE 111
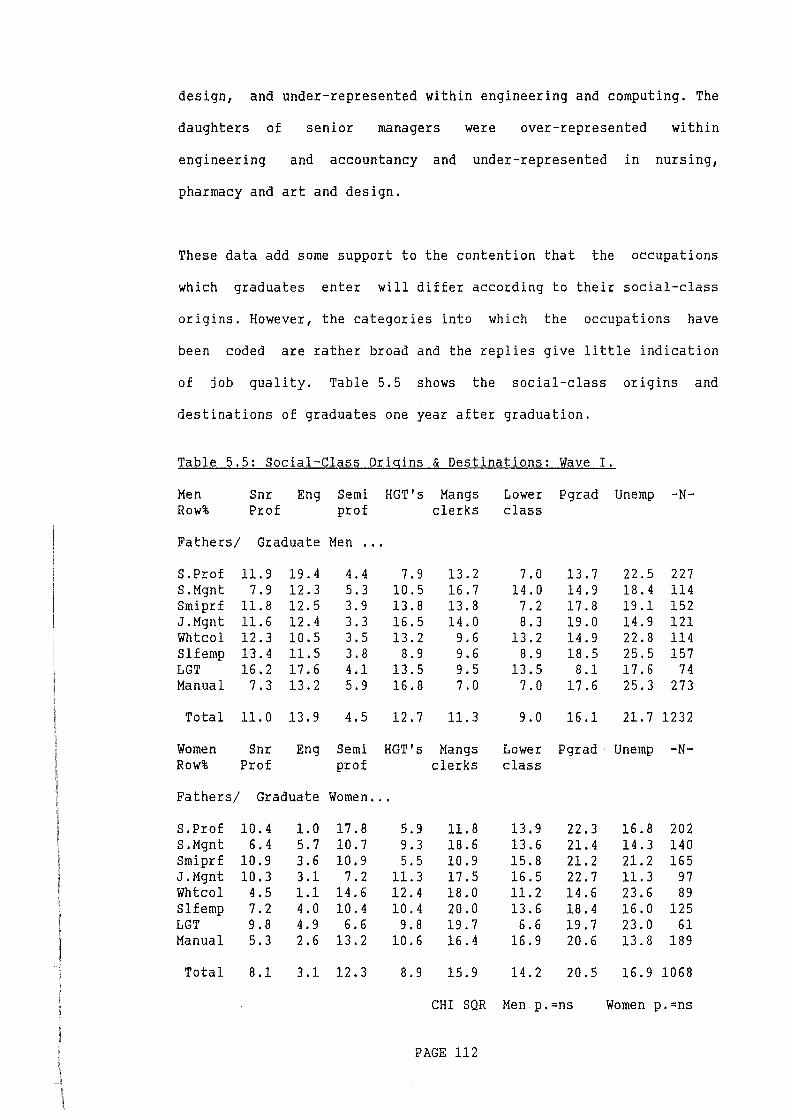
design, and under-represented within engineering and computing. The
daughters of senior managers were over-represented within
engineering and accountancy and under-represented in nursing,
pharmacy and art and design.
These data add some support to the contention that the occupations
which graduates enter will differ according to their social-class
origins. However, the categories into which the occupations have
been coded are rather broad and the replies give little indication
of job quality. Table 5.5 shows the social-class origins and
destinations of graduates one year after graduation.
Table 5.5: Social-Class Origins & Destinations: Wave I.
Men Row%
Snr Eng Semi Prof prof
Fathers/ Graduate Men ...
S.Prof S.Mgnt Smiprf J.Mgnt Whtcol Slfemp LGT Manual
11.9 7.9
11.8 11.6 12.3 13.4 16.2
7.3
19.4 12.3 12.5 12.4 10.5 11.5 17.6 13.2
4.4 5.3 3.9 3.3 3.5 3. 8 4.1 5.9
Total 11.0 13.9 4.5
Women Row%
Snr Prof
Eng Semi prof
HGT's Mangs clerks
7.9 10.5 13.8 16.5 13.2
8.9 13.5 16.8
12.7
13.2 16.7 13.8 14.0
9.6 9.6 9.5 7.0
11.3
HGT' s Mangs clerks
Lower Pgrad Unemp -Nclass
7.0 14.0
7.2 8.3
13.2 8.9
13.5 7.0
9.0
13.7 14.9 17.8 19.0 14.9 18.5
8.1 17.6
16.1
22.5 18.4 19.1 14.9 22.8 25.5 17.6 25.3
227 114 152 121 114 157
74 273
21.7 1232
Lower Pgrad · Unemp -Nclass
Fathers/ Graduate Women •..
S.Prof S.Mgnt Smiprf J.Mgnt Whtcol Slfemp LGT Manual
Total
10.4 6.4
10.9 10.3
4.5 7.2 9.8 5.3
8.1
1.0 5.7 3.6 3.1 1.1 4.0 4.9 2.6
17.8 10.7 10.9
7.2 14.6 10.4
6.6 13.2
3.1 12.3
5.9 9.3 5.5
11.3 12.4 10.4
9.8 10.6
8.9
11.8 18.6 10.9 17.5 18.0 20.0 19.7 16.4
15.9
13.9 13.6 15.8 16.5 11.2 13.6
6.6 16.9
14.2
22.3 21.4 21.2 22.7 14.6 18.4 19.7 20.6
20.5
CHI SQR Men p.=ns
PAGE 112
16.8 14.3 21.2 11.3 23.6 16.0 23.0 13.8
202 140 165
97 89
125 61
189
16.9 1068
Women p.=ns
From these tables it can be seen that one year after graduation
there is little evidence to support the contention that graduates
from working-class origins have fared less well in the labour market
than those from more middle-class backgrounds. Unemployment was,
however, particularly high amongst those from manual backgrounds and
this group was also the least likely to be employed as senior
professionals and engineers and the most likely to be high-grade
technicians (HGTs). However, men from LGT backgrounds appear to have
performed better than the other groups in so far as nearly a third
of them, but only a quarter of all graduates, were employed as
either senior professionals or engineers. The situation amongst the
women is more confused, although those from manual backgrounds were
the most likely to be in lower-class jobs and the least likely to
be senior professionals and engineers.
These figures, then, appear at first sight to give only weak support
to the hypothesis that graduates from working-class backgrounds will
tend to be less successful in the labour market than others.
However, the first year after graduation is for many graduates a
transitional period - 16% of men and 20% of women went on to
undertake further study and unemployment was also particularly high.
Moreover, it is likely that many graduates had taken only temporary
jobs whilst waiting for something better to come along. Finally,
Levin (1976) and Kelley (1978) have argued that graduates from
middle-class backgrounds are likely to benefit from the inheritance
of wealth and managerial roles some years after graduation. As a
result the relationship which might exist between the social-class
origins and destinations of graduates might be expected to grow
PAGE 113
with time, and indeed Kelsall et al. (1972) looked at the employment
of graduates some six years after they had left university.
When we examine the social-class destinations of graduates three
years after graduation we do indeed find a stronger relationship to
exist between the social-class origins and destinations of graduate
men. Thus from Table 5.6 we see that men from manual backgrounds
were more likely than others to be employed as semiprofessionals and
high-grade technicians and the least likely
senior professionals and managers. Moreover, it
to be employed as
will be recalled
from our discussion in Chapter Three that some writers define the
working class in such a way as to include many white-collar and
routine non-manual workers, and when we examine the social-class
destinations of their sons it can be seen that in some ways they
appear to have fared less well than the sons of manual workers. We
note, in particular, that 18.8% (nearly one in five) were employed
in lower-class occupations. However, these differences, although
statistically significant, are not particularly marked, and must be
set alongside the observation that the sons of low-grade technicians
have performed particularly well in the labour market as can be seen
from the proportion employed as senior engineers. Amongst the women
the relationship between their social-class origins and destinations
is not ·statistically significant, although those from manual and LGT
origins were amongst the most likely to be employed in lower-class
occupations and the managerial trajectory.
PAGE 114
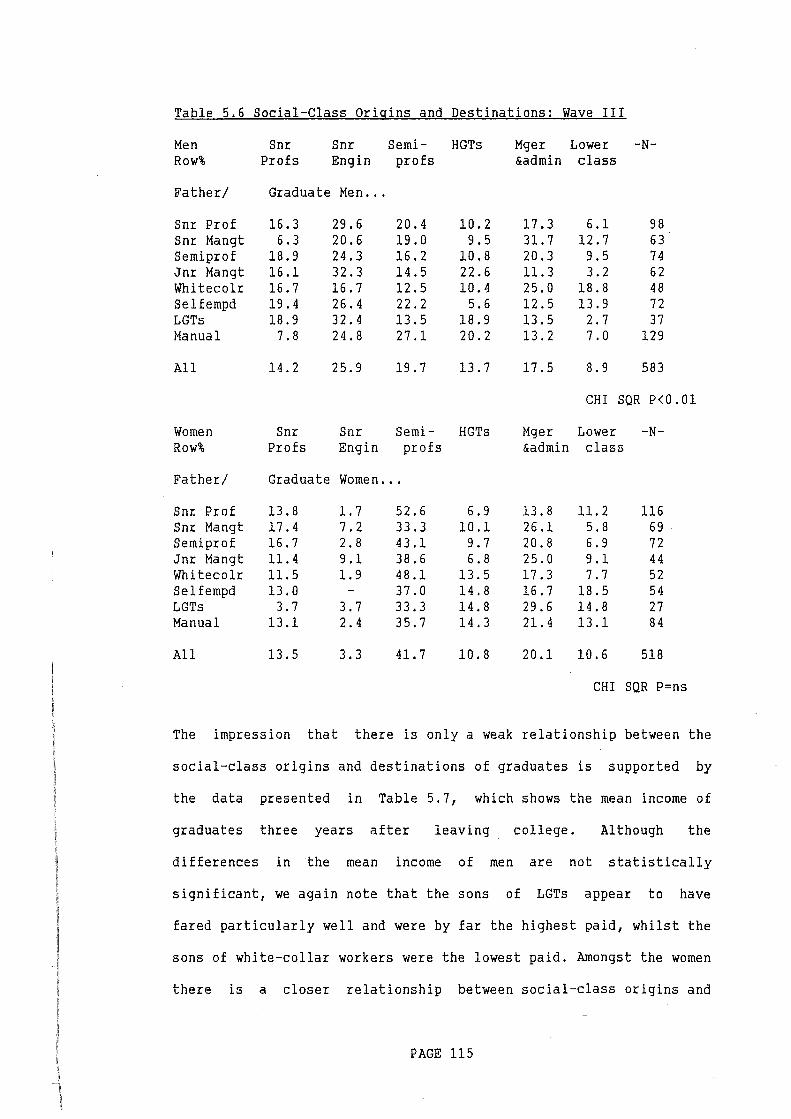
Table 5.6 Social-Class Origins and Destinations: Wave III
Men Row%
Father/
Snr Prof Snr Mangt Semipro£ Jnr Mangt Whitecolr Selfempd LGTs Manual
All
Women Row%
Father/
Snr Prof Snr Mangt Semipro£ Jnr Mangt Whitecolr Selfempd LGTs Manual
All
Snr Profs
Snr Eng in
Graduate Men ...
16.3 6.3
18.9 16.1 16.7 19.4 18.9
7.8
14.2
Snr Profs
29.6 20.6 24.3 32.3 16.7 26.4 32.4 24.8
25.9
Snr En gin
Semiprofs
20.4 19.0 16.2 14.5 12.5 22.2 13.5 27.1
19.7
Semiprofs
Graduate Women ...
13.8 17.4 16.7 11.4 ll. 5 13 .o
3.7 13.1
13.5
1.7 7.2 2.8 9.1 1.9
3.7 2.4
3.3
52.6 33.3 43.1 38.6 48.1 37.0 33.3 35.7
41.7
HGTs
10.2 9. 5
10.8 22.6 10.4
5.6 18.9 20.2
13.7
HGTs
6. 9 10.1
9.7 6.8
13.5 14.8 14.8 14.3
10.8
Mger Lower &admin class
17.3 31.7 20.3 ll. 3 25.0 12.5 13.5 13.2
17.5
6.1 12.7
9.5 3.2
18.8 13.9
2.7 7.0
8.9
-N-
98 63 74 62 48 72 37
129
583
CHI SQR P<O. 01
Mger Lower &admin class
13.8 26.1 20.8 25.0 17.3 16.7 29.6 21.4
20.1
11.2 5.8 6.9 9.1 7.7
18.5 14.8 13.1
10.6
-N-
116 69 72 44 52 54 27 84
518
CHI SQR P=ns
The impression that there is only a weak relationship between the
social-class origins and destinations of graduates is supported by
the data presented in Table 5.7, which shows the mean income of
graduates three years after leaving college. Although the
differences in the mean income of men are not statistically
significant, we again note that the sons of LGTs appear to have
fared particularly well and were by far the highest paid, whilst the
sons of white-collar workers were the lowest paid. Amongst the women
there is a closer relationship between social-class origins and
PAGE 115
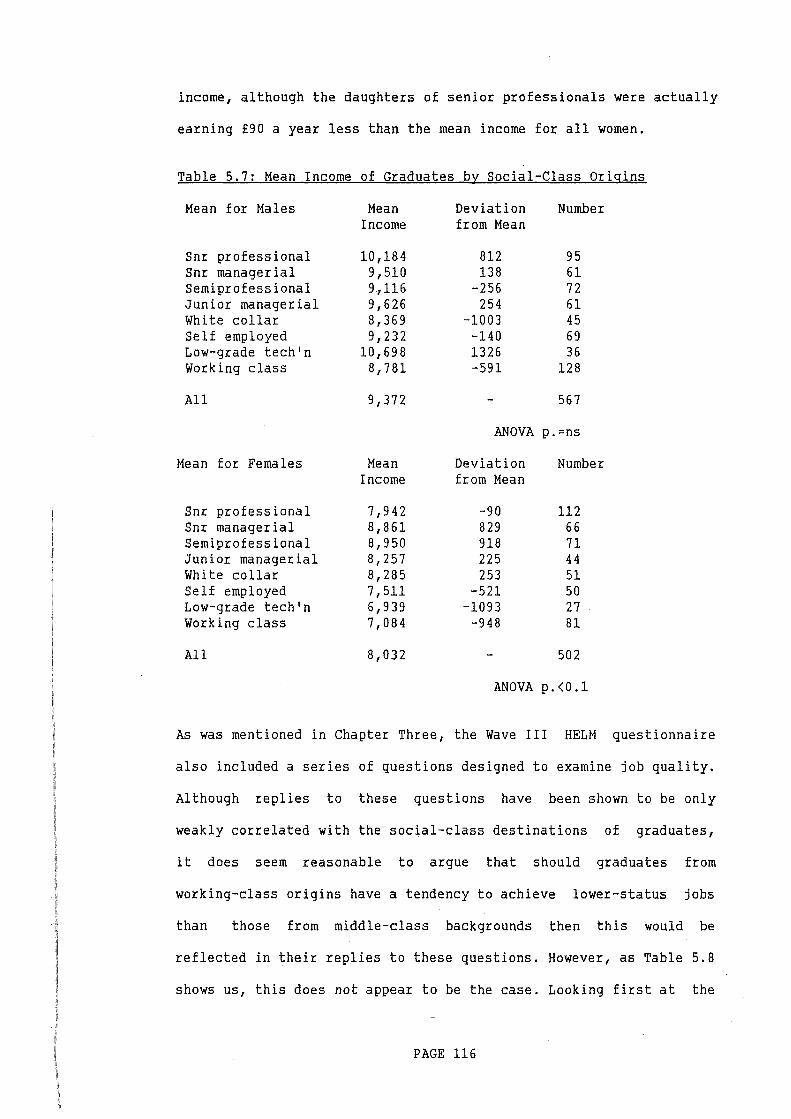
income, although the daughters of senior professionals were actually
earning £90 a year less than the mean income for all women.
Table 5.7: Mean Income of Graduates by Social-Class Origins
Mean for Males
Snr professional Snr managerial Semiprofessional Junior managerial White collar Self employed Low-grade tech'n Working class
All
Mean for Females
Snr professional Snr managerial Semiprofessional Junior managerial White collar Self employed Low-grade tech'n Working class
All
Mean Income
10,184 9,510 9,116 9,626 8,369 9,232
10,698 8,781
9,372
Mean Income
7,942 8,861 8, 9 50 8,257 8,285 7,511 6,939 7,084
8,032
Deviation Number from Mean
812 95 138 61
-256 72 254 61
-1003 45 -140 69 1326 36 -591 128
567
ANOVA p.=ns
Deviation Number from Mean
-90 112 829 66 918 71 225 44 253 51
-521 50 -1093 27 -948 81
502
AN OVA p. < 0 .1
As was mentioned in Chapter Three, the Wave III HELM questionnaire
also included a series of questions designed to examine job quality.
Although replies to these questions have been shown to be only
weakly correlated with the social-class destinations of graduates,
it does seem reasonable to argue that should graduates from
working-class origins have a tendency to achieve lower-status jobs
than those from middle-class backgrounds then this would be
reflected in their replies to these questions. However, as Table 5.8
shows us, this does not appear to be the case. Looking first at the
PAGE 116
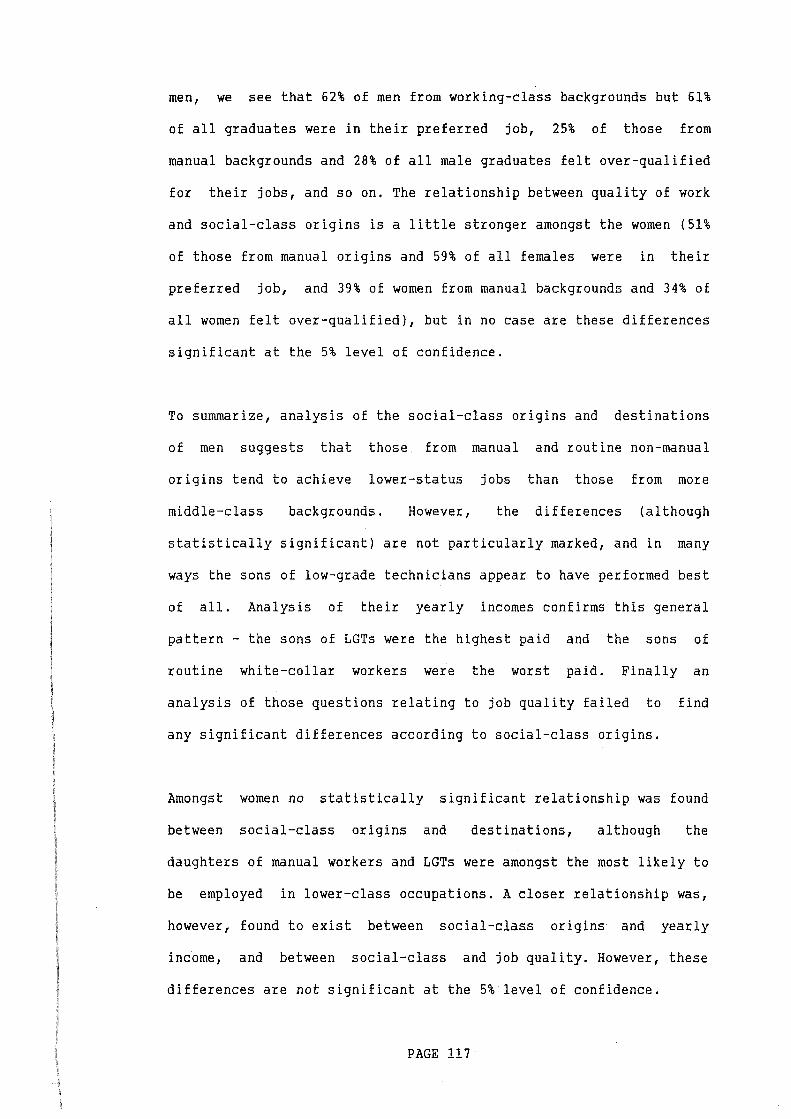
men, we see that 62% of men from working-class backgrounds but 61%
of all graduates were in their preferred job, 25% of those from
manual backgrounds and 28% of all male graduates felt over-qualified
for their jobs, and so on. The relationship between quality of work
and social-class origins is a little stronger amongst the women (51%
of those from manual origins and 59% of all females were in their
preferred job, and 39% of women from manual backgrounds and 34% of
all women felt over-qualified), but in no case are these differences
significant at the 5% level of confidence.
To summarize, analysis of the social-class origins and destinations
of men suggests that those. from manual and routine non-manual
origins tend to achieve lower-status jobs than those from more
middle-class backgrounds. However, the differences (although
statistically significant) are not particularly marked, and in many
ways the sons of low-grade technicians appear to have performed best
of all. Analysis of their yearly incomes confirms this general
pattern - the sons of LGTs were the highest paid and the sons of
routine white-collar workers were the worst paid. Finally an
analysis of those questions relating to job quality failed to find
any significant differences according to social-class origins.
Amongst women no statistically significant relationship was found
between social-class origins and destinations, although the
daughters of manual workers and LGTs were amongst the most likely to
be employed in lower-class occupations. A closer relationship was,
however, found to exist between social-class origins and yearly
income, and between social-class and job quality. However, these
differences are not significant at the 5% level of confidence.
PAGE 117
Table 5.8: Measures of Job Quality by Social-Class Origins
Men -A-%
Snr prof 63 Snr mangt 62 Semipro£ 58 Jnr mangt 65 White collar 60 Self empl'd 57 LGT 62 Manual 62
Total 61
Sign. ns
Women -A-%
Snr prof 56 Snr mangt 67 Semipro£ 59 Jnr mangt 71 White collar 65 Self empl'd 54 LGT 54 Manual 51
Total 59
Sign. p=O.l
-B%
29 28 33 25 32 31 24 25
28
ns
-B%
35 19 40 32 25 43 46 39
34
p<0.1
-C- -D- -E-Mn* Mn* Mn*
73 51 65 73 45 61 72 51 61 71 58 68 79 50 63 74 50 62 76 51 75 79 47 65
75 50 65
ns ns ns
-C- -D- -E-Mn* Mn* Mn*
71 53 69 81 45 65 72 52 59 77 43 68 68 52 64 66 45 61 63 58 57 67 58 58
71 51 63
p<0.1 ns p<0.1
* For ease of comparison mean replies to questions have been converted into percentages.
-A- Percentage in preferred job. -B- Percentage feeling over-qualified. -c- Job involves autonomy (mean). -D- Works within clearly defined rules and regulation (mean). -E- Work benefits from possession of degree (mean).
To conclude this section, our findings, in sharp contradiction to
those of Kelsall et al. discussed earlier, would tend to suggest
that only a weak correlation exists between the social-class origins
and destinations of graduates. Just why our findings should be so
much at variance with those of Kelsall et al. is the subject of the
next section.
PAGE 118
Part Three: The Social-Class Origins and Destinations of Graduates Reconsidered
Several factors might account for the differences between our
findings and those of Kelsall et al ..
The first point which needs to be stressed is that whilst
Kelsall et al. looked at university graduates, the HELM project
looked at public sector ones. How this might have affected our
findings is discussed more fully in the next chapter, which looks at
the fragmented labour market for graduates. Suffice it to say here
that one might expect this factor to bias our findings if it can be
shown that public sector graduates tend to be employed within
lower-status occupations than university ones. If this is so, then
both public sector graduates and those from working-class
backgrounds might be employed in a similar range of low-status
occupations, and a stronger relationship between the social-class
origins and destinations of graduates might have been found had
university graduates been included in the HELM sample. Recent
research by Boys and Kirkland (1987), discussed more fully in
Chapter Six, would, however, tend to suggest that this factor has
not seriously affected our findings.
Secondly, during the last thirty years there have been major changes·
in the nature of the working class and the traditional working-class
community has been radically transformed. In particular the 1950s
and 1960s were marked by urban redevelopment programmes on a massive
scale. Long-established working-class housing areas in many of
Britain's inner-city areas were demolished either because they were
judged unfit to live-in and/or to make way for urban motorways
PAGE 119
(Dennis, 1970). Their populations were moved to Britain's new towns
and to new housing estates on the outskirts of towns and cities
(Dennis, 1970; Hudson and Johnson, 1976; Gatley, 1984). Social
relations on these new estates are vastly different from those which
had existed in the older communities. The link which had existed
between the workplace and the local community was broken and people
were more likely to commute to work. People were also less likely to
live near to their kith and kin, and women were more likely to have
jobs. Allied to this process has been has been the growth of the
mass media and television which have widened people's horizons. In
consequence, the 'camaraderie' characteristic of the older
working-class communities was lost, neighbours were unlikely to be
related, work together or share in similar leisure pursuits, and
women living on the same street were less likely to mix together
socially. A number of writers (Zweig, 1961; Turner, 1963; Westley
and Westley, 1972) have argued that this process has widened the
aspirations and expectations of working-class people and they are
now more attuned to the role which education might play in improving
their children's social status.
However, even though the working-class community has been radically
transformed in recent years, it is clear from many studies
(Westerguaard and Resler, 1975; Reid, 1977) that people from
working-class origins continue to be disadvantaged in many ways in
comparison with those from more middle-class backgrounds. In
particular, as was shown in Chapters One and Four, children from
working-class origins continue to be less successful educationally
than those from more middle-class backgrounds, and Gatley (1984) has
demonstrated that within Britain's new towns (where the process of
PAGE 120
urban change has arguably been most marked) young people from
working-class backgrounds not only tend to achieve poorer
examination results, but are also far more likely than others to be
unemployed and tend to enter low-status jobs. Moreover, it is
unlikely that urban change has led to greater social mixing. The
council estates on which the bulk of the working-class live tend to
be located away from private (owner-occupied) estates, and both
council and private estates are segmented within themselves, with
the result that the social-class composition of individual housing
estates tends to be broadly uniform. Thus the poorest people tend to
live in high-rise council-owned flats and in inner-city terraced
houses, and the richest people tend to live in detached houses on
estates located on the outskirts of towns and cities. Given these
factors, one might reasonably expect differences to persist in the
attitudes and aspirations of people from different social-class
backgrounds. Because of this it is unlikely that the changes which
have occurred in recent years in the nature of the working class and
the transformation of the working-class community can, by
themselves, account for our findings.
Thirdly, we have so far treated the working class as homogeneous and
undifferentiated, yet, as was mentioned earlier in this thesis, it
can be differentiated in a number of ways. In particular (see
Chapter Four), our sample of graduates from working-class origins
were strongly atypical of their social class. Many of them came from
the more 'respectable' sections of the working class, and as such
they had many characteristics in common with their more middle-class
peers. In particular, many of their mothers are employed within
white-collar jobs and many are educated to GCE 0-level standard or
PAGE 121
beyond. They tend to come from small families, and many have a close
relative who has also participated in higher education. Because of
this one might expect the children of such people to have higher
aspirations than the rest of the working-class and if this is so it
might help to account for our findings.
The main problem with this explanation in helping us to account for
the differences between our findings and those of Kelsall et al., is
that the latter's sample of graduates from working-class origins was
also strongly atypical of their social class. Like HELM graduates,
they tended to come from small 'respectable' working-class families,
about 30% of their parents (mothers as well as fathers) had attended
a selective (grammar) school and 26% had a grandfather employed in a
non-manual occupation (pp. 42-46). Consequently, it is unlikely that
this factor alone can account for our findings, although this
section of the working class may have been most affected by the
changes which have occurred in recent years in the nature of the
working-class community.
A fourth point
considerably in
study. At that
is that the graduate labour market has changed
the years since Kelsall et al. undertook their
time graduates tended to enter a rather restricted
range of occupations of which education and teaching were by far the
most important (see Table 5.2). As will be shown in the next
chapter, the range of occupations which graduates enter has
increased markedly in recent years whilst the opportunities for them
to enter teaching have declined following the falling birth-rate and
the contraction of teaching training places in the 1970s. In
consequence it seems reasonable to argue that many graduates from
PAGE 122
working-class origins, who would otherwise have entered teaching,
may have been forced to broaden their horizons and now seek
employment in more varied fields.
More fundamentally, although Kelsall et al. found a strong
relationship between the social-class origins and destinations of
graduates, the way in which they undertook their study and choose
their sample may have led them to underestimate the extent to which
educated working-class youngsters in the 1960s were socially mobile.
Kelsall et al. 's sample was composed of every second male and every
female who graduated in 1960, with the exception of external-degree,
overseas and medical students, and those who had attended the
University of Bristol and some London colleges (1972: 9-10). The
trouble with this approach is that it neglected those young people
from working-class backgrounds who attended grammar schools and did
not attend university. This is potentially of some importance,
because the number of students in higher education was much lower in
1960 than it is today and entry to many of the professions (in
marked contrast to today) took place through a process of vertical
mobility in which, for example, a young person with a few GCE
0-levels might leave school to join, say, an accountancy or
engineering firm with the intention of obtaining professional
qualifications over a period of several years which would have
included a period of part-time study at a local technical college.
Moreover, existing alongside the universities there was a parallel
system of advanced further education which catered for those wishing
to obtain specifically vocationally-orientated qualifications, such
as HNDs.
PAGE 123
Career decisions, especially for working-class youngsters, were much
more likely to have taken place at school in the fifth or sixth
forms, and it may have been possible at this time to differentiate,
within {maintained) grammar schools, between three distinct groups
of pupils: those who wished to enter higher education to gain a
degree in order to enter a particular career such as teaching; those
who sought a technical or related qualification and went on to
attend a technical college; and those who left school {with GCE 0-
or A-levels) with the intention of obtaining professional
qualifications by serving apprenticeships and studying part-time
{Wolfenden, 1957). This situation would have contrasted markedly
with that existing in both the public and direct grant schools
{which over 40% of Kelsall et al. 's sample had attended) where a
much higher proportion of all students undertaking GCE A-levels
would probably have applied for a place at university.
Thus Kelsall et al. 's findings may be only partly explained in terms
of the aspirations of graduates and may also reflect the existence,
at that time, of two alternative routes of social mobility. It is
possible to make a few comments on this question using their own
data and other published research findings from studies which were
conducted in the late 1950s and early 1960s. Further analysis of
Kelsall et al. 's work suggests that much of the variation which they
found in the social-class origins and destinations of graduates can
be accounted for in terms of the numbers of graduates entering the
teaching profession. Table 5.9 illustrates this point. It has been
constructed from the two Tables given on pages 193 and 212 of
Kelsall et al. 's work {1972) and reproduced as Tables 5.1 and 5.2 of
the present volume. These show the social-class origins and
PAGE 124
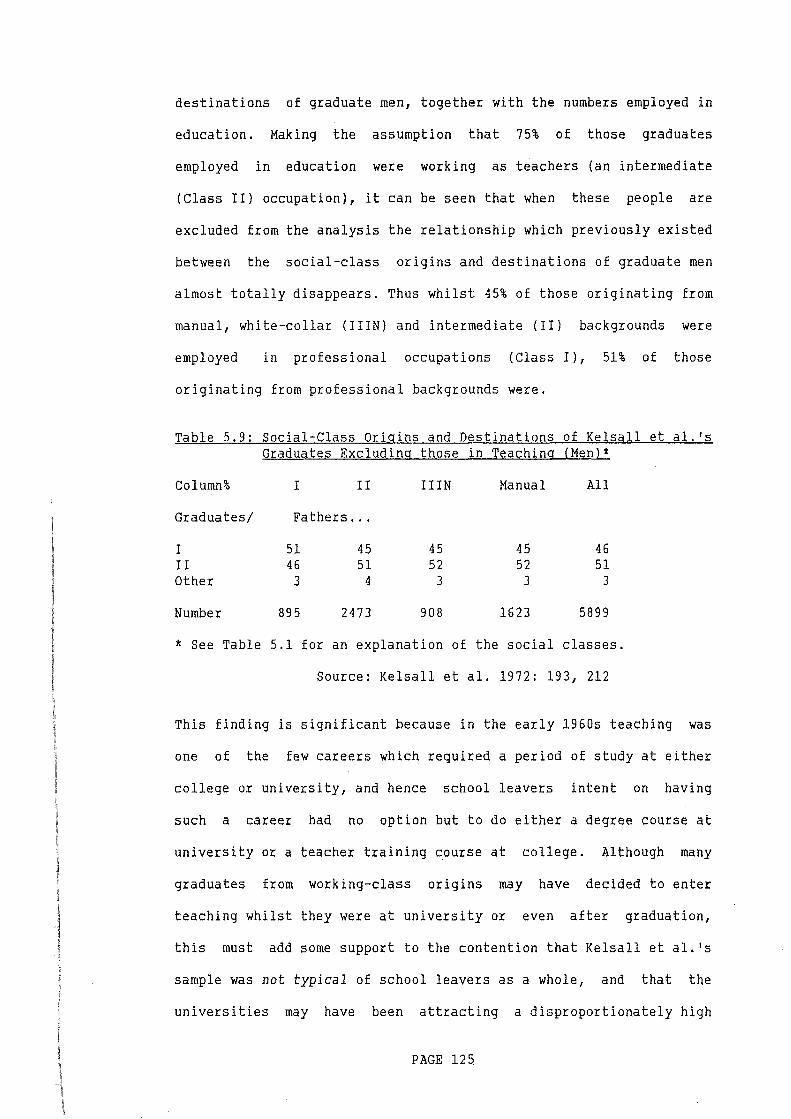
destinations of graduate men, together with the numbers employed in
education. Making the assumption that 75% of those graduates
employed in education were working as teachers (an intermediate
(Class II) occupation), it can be seen that when these people are
excluded from the analysis the relationship which previously existed
between the social-class origins and destinations of graduate men
almost totally disappears. Thus whilst 45% of those originating from
manual, white-collar (IIIN) and intermediate (II) backgrounds were
employed in professional occupations (Class I), 51% of those
originating from professional backgrounds were.
Table 5.9: Social-Class Origins and Destinations of Kelsall et al.'s Graduates Excluding those in Teaching (Men}t
Column% I II IIIN Manual All
Graduates/ Fathers ...
I 51 45 45 45 46 II 46 51 52 52 51 Other 3 4 3 3 3
Number 895 2473 908 1623 5899
* See Table 5.1 for an explanation of the social classes.
Source: Kelsall et al. 1972: 193, 212
This finding is significant because in the early 1960s teaching was
one of the few careers which required a period of study at either
college or university, and hence school leavers intent on having
such a career had no option but to do either a degree course at
university or a teacher training course at college. Although many
graduates from working-class origins may have decided to enter
teaching whilst they were at university or even after graduation,
this must add some support to the contention that Kelsall et al. 's
sample was not typical of school leavers as a whole, and that the
universities may have been attracting a disproportionately high
PAGE 125.
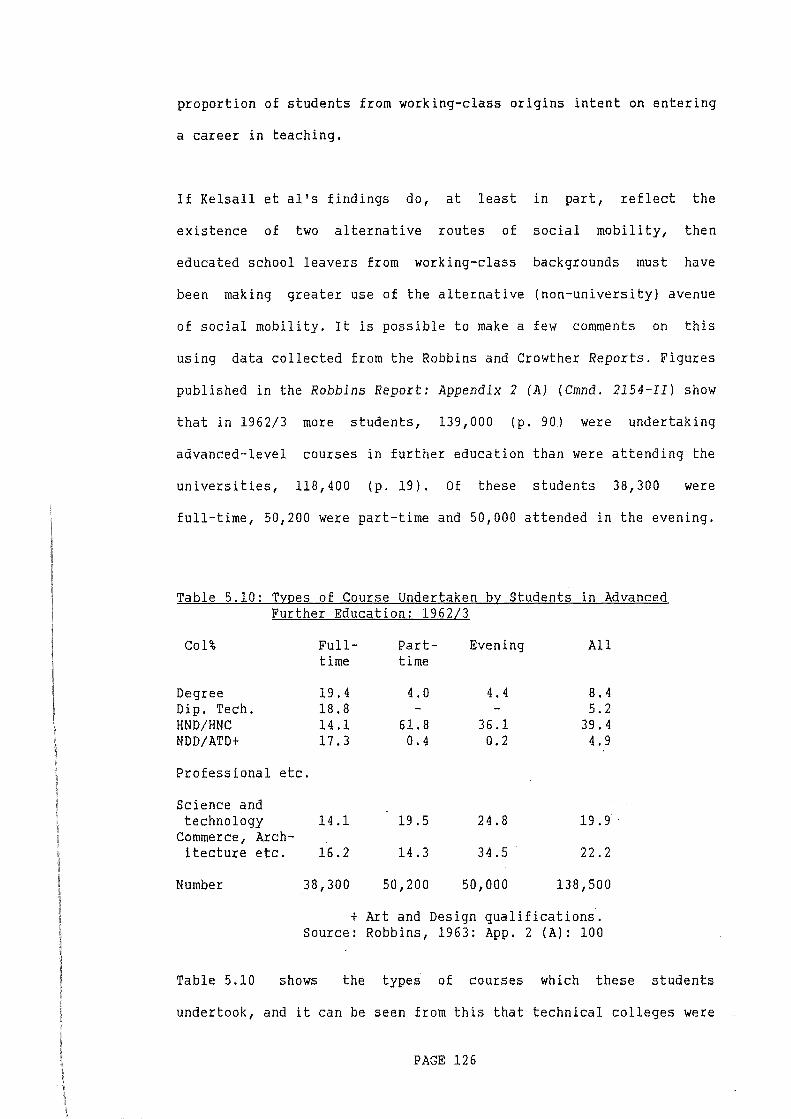
proportion of students from working-class origins intent on entering
a career in teaching.
If Kelsall et al's findings do, at least in part, reflect the
existence of two alternative routes of social mobility, then
educated school leavers from working-class backgrounds must have
been making greater use of the alternative (non-university) avenue
of social mobility. It is possible to make a few comments on this
using data collected from the Robbins and Crowther Reports. Figures
published in the Robbins Report: Appendix 2 (A) (Cmnd. 2154-II) show
that in 1962/3 more students, 139,000 (p. 90) were undertaking
advanced-level courses in further education than were attending the
universities, 118,400 (p. 19). Of these students 38,300 were
full-time, 50,200 were part-time and 50,000 attended in the evening.
Table 5.10: Types of Course Undertaken by Students in Advanced Further Education: 1962/3
Col% Full- Part- Evening All time time
Degree 19.4 4.0 4. 4 8.4 Dip. Tech. 18.8 - - 5.2 HND/HNC 14.1 61.8 36.1 39.4 NDD/ATD+ 17.3 0.4 0.2 4.9
Professional etc.
Science and technology 14.1 19.5 24.8 19.9
Commerce, Arch-itecture etc. 16.2 14.3 34.5 22.2
Number 38,300 50,200 50,000 138,500
+Art and Design qualifications. Source: Robbins, 1963: App. 2 (A): 100
Table 5.10 shows the types of courses which these students
undertook, and it can be seen from this that technical colleges were
PAGE 126
playing an important role in training highly-qualified manpower for
industry and commerce, and, in particular, we note the high
proportions of part-time and evening students undertaking HNDs, HNCs
and various professional qualifications.
Unfortunately the Robbin's Committee did not examine the educational
and social-class origins of these students. However, the Crowther
Committee which reported in 1960 did do so, though only in relation
to students undertaking all courses in further education, including
those taking relatively low-level courses such as GCEs, ONCs, City
and Guilds, etc .. Their .work (1960: II.57, 67) suggested that
although young people from working-class origins were far less
likely than those from more middle-class backgrounds to attend
university the differences in the proportion who went on to
undertake some other form of further education was much less marked.
A number of small-scale studies at this time (Cotgrove, 1958;
Jahoda, 1963) suggested that the proportion of students from
working-class backgrounds declined as the level of the course
increased (Jahoda, 1963: 54), and studies undertaken in specific.
colleges of advanced
technical colleges)
their students were
universities (Jahoda,
technology (the most 'prestigious'· of the
suggested that the social-class origins of
not markedly different from those of the
1963; Marries, 1964). Even so, it is clear
from this discussion that the technical colleges of the early 1960s
were an important alternative route into many high-status
occupations and that such colleges attracted at least as high (and
probably a higher) proportion of students from working-class origins
as the universities. An additional indication of the importance of
these alternative avenues of social mobility comes from an
PAGE 127
examination of Table 1.2 in Chapter One taken from the Oxford
Mobility Study, from which it can be seen that under 30% of
self-employed and salaried professionals possessed a degree, and
nearly 40% of self-employed and 60% of salaried professionals had
begun their careers in lower-status occupations and worked their way
into more senior positions.
What is not clear, however, is the extent to which the employment
and social-class destinations of those who studied an advanced
course in further education may have differed from those who had
studied at university. It is, however, possible to make a few
comments on this question by using material from the 1981 Census of
Highly Qualified Manpower. Table 5.11 shows the proportion of men
aged 40-49 (most of whom would have qualified in the 1950s and early
1960s), with a qualification above GCE A-level but below
degree-level standard, employed in various high-status occupations.
It should, however, be stressed that this Table underestimates the
importance of the alternative route in training highly-skilled
manpower both because those with low-level qualifications (such as
GCE A-levels and ONCs) are excluded and because those with
advanced-level qualifications of degree standard have been
classified along with those with a university degree. Nevertheless
it can be seen from this Table that advanced further education was
playing an important role in training people for some of the senior
professions (such as accountancy, personnel management, pharmacy,
engineering and architecture) and that it was playing an even more
important role in the training of semiprofessionals (welfare workers
and radiographers), technicians (including computer programmers and
systems analysts) and managers.
PAGE 128
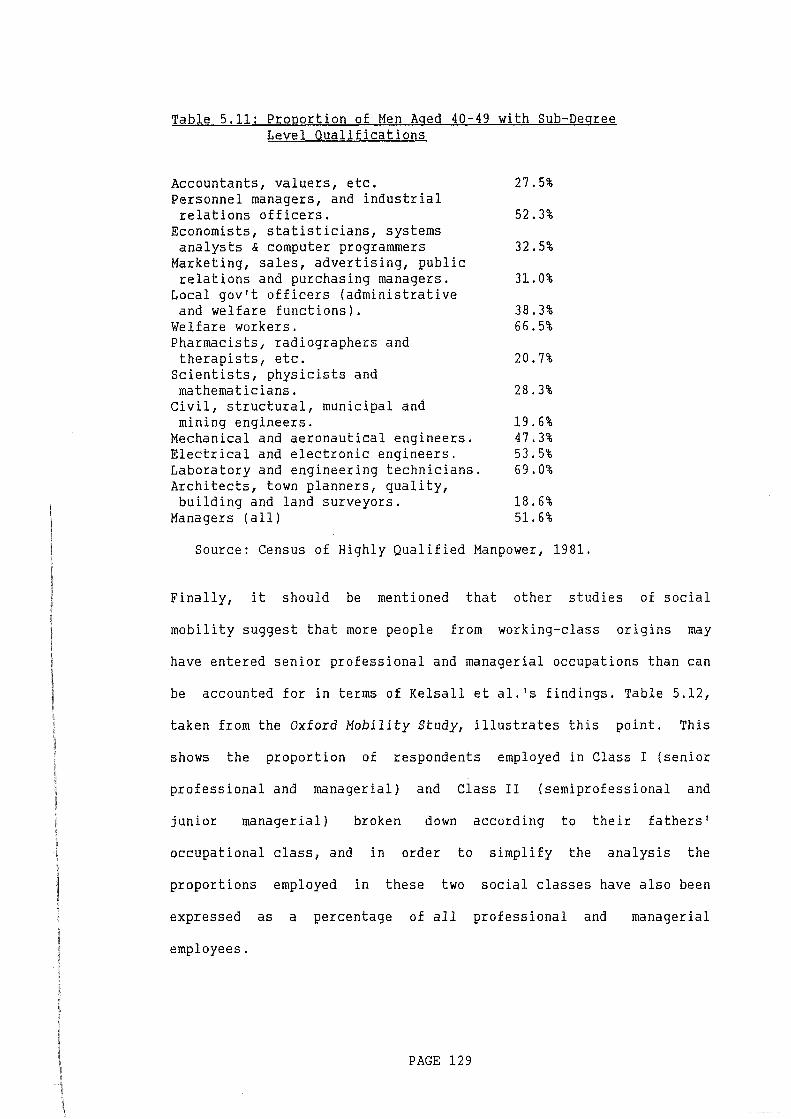
Table 5.11: Proportion of Men Aged 40-49 with Sub-Degree Level Qualifications
Accountants, valuers, etc. Personnel managers, and industrial relations officers.
Economists, statisticians, systems analysts & computer programmers
Marketing, sales, advertising, public relations and purchasing managers.
Local gov't officers (administrative and welfare functions).
Welfare workers. Pharmacists, radiographers and therapists, etc.
Scientists, physicists and mathematicians.
Civil, structural, municipal and mining engineers.
Mechanical and aeronautical engineers. Electrical and electronic engineers. Laboratory and engineering technicians. Architects, town planners, quality, building and land surveyors.
Managers (all)
27.5%
52.3%
32.5%
31.0%
38.3% 66.5%
20.7%
28.3%
19.6% 47.3% 53.5% 69.0%
18.6% 51.6%
Source: Census of Highly Qualified Manpower, 1981.
Finally, it should be mentioned that other studies of social
mobility suggest that more people from working-class origins may
have entered senior professional and managerial occupations than can
be accounted for in terms of Kelsall et al. 's findings. Table 5.12,
taken from the Oxford Mobility Study, illustrates this point. This
shows the proportion of respondents employed in Class I (senior
professional and managerial) and Class II (semiprofessional and
junior managerial) broken down according to their fathers'
occupational class, and in order to simplify the analysis the
proportions employed in these two social classes have also been
expressed as a percentage of all professional and managerial
employees.
PAGE 129
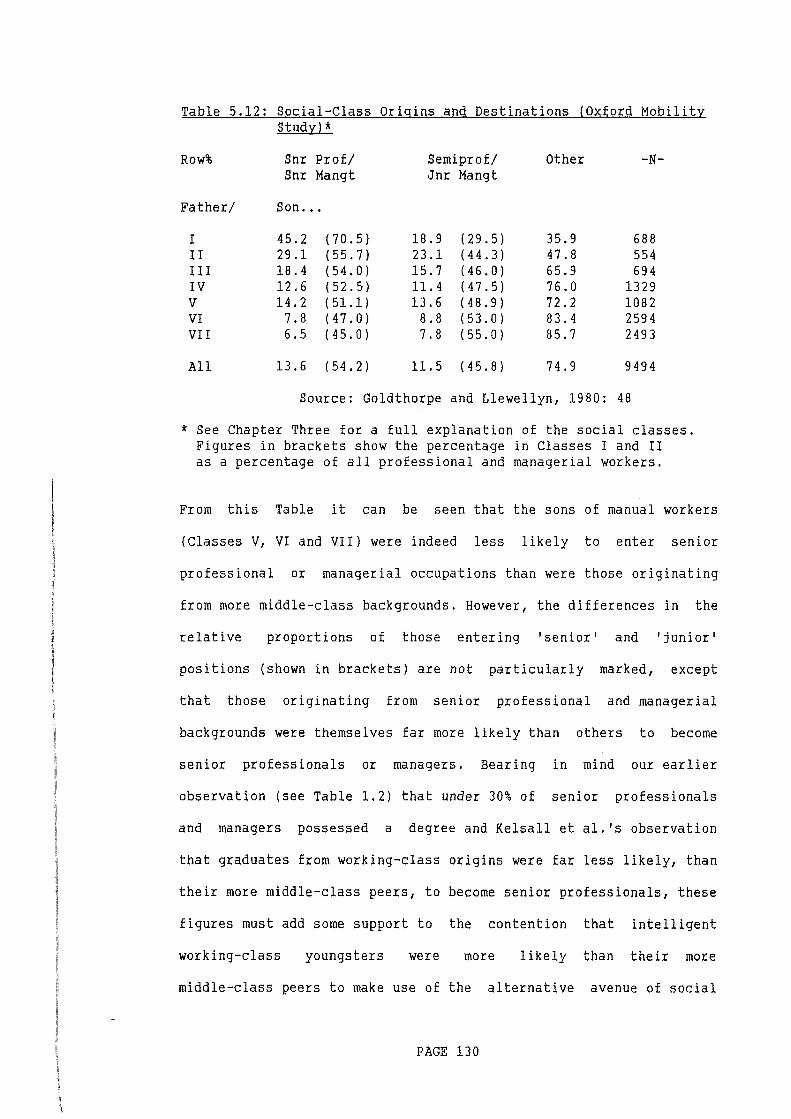
Table 5.12: Social-Class Origins and Destinations (Oxford Mobility Studyj *
Row% Snr Prof/ Semipro£/ Other -N-Snr Mangt Jnr Mangt
Father/ Son ...
I 45.2 ( 70.5) 18.9 (29.5) 35.9 688 II 29.1 (55.7) 23.1 ( 44.3) 47.8 554 III 18.4 (54. 0) 15.7 ( 46.0) 65.9 69 4 IV 12.6 (52. 5) 11.4 (47.5) 76.0 1329 v 14.2 ( 51.1) 13.6 ( 48.9) 72.2 1082 VI 7.8 ( 47.0) 8.8 (53.0) 83.4 2594 VII 6.5 ( 45.0) 7.8 (55. 0) 85.7 2493
All 13.6 (54. 2) 11.5 ( 45.8) 74.9 9494
Source: Goldthorpe and Llewellyn, 1980: 48
* See Chapter Three for a full explanation of the social classes. Figures in brackets show the percentage in Classes I and II as a percentage of all professional and managerial workers.
From this Table it can be seen that the sons of manual workers
(Classes V, VI and VII) were indeed less likely to enter senior
professional or managerial occupations than were those originating
from more middle-class backgrounds. However, the differences in the
relative proportions of those entering 'senior' and 'junior'
positions (shown in brackets) are not particularly marked, except
that those originating from senior professional and managerial
backgrounds were themselves far more likely than others to become
senior professionals or managers. Bearing in mind our earlier
observation (see Table 1.2) that under 30% of senior professionals
and managers possessed a degree and Kelsall et al. 's observation
that graduates from working-class origins were far less likely, than
their more middle-class peers, to become senior professionals, these
figures must add some support to the contention that intelligent
working-class youngsters were more likely than their more
middle-class peers to make use of the alternative avenue of social
PAGE 130

mobility.
Relating these findings back to the work of Kelsall et al., it
should be clear that there are sufficient grounds for believing that
Kelsall et al.'s decision to limit their study to university
graduates may have led them to underestimate the extent of social
mobility amongst educated working-class youngsters. If this is so,
than the HELM findings would become much easier to understand. The
last thirty years have seen qualification spiral (Dare, 1976) and
possession of a degree-level qualification is rapidly becoming a
prerequisite for entry into many high-status occupations from
accountancy to engineering, and it has become almost impossible for
the more intelligent school leaver with only a few GCE 0-levels to
enter these careers. The number of students has increased and many
of the old colleges of advanced technology and regional colleges
have been upgraded into universities and polytechnics. Because of
these trends fifth and sixth formers in modern comprehensive schools
have far less choice than existed in the old grammar schools over
what path to follow when they leave school, and many are forced to
enter higher education as a prerequisite to gaining the professional
qualifications which are now increasingly necessary for entry into
many high-status occupations.
Even so, our findings do lend some support to Kelsall et al. 's
contention that graduates from working-class origins will tend to be
employed in lower-status occupations than those from more
middle-class backgrounds, in so far as a weak but statistically
significant relationship was found to exist between the social-class
origins and destinations of graduate men and this deserves more
PAGE 131
attention. One area which we have so far ignored, and which was not
examined by Kelsall et al., is the nature of the graduate labour
market and the role played by qualifications and credentials in the
allocation of occupational roles. These matters are discussed in
more detail in the next chapter, but suffice it to say here that
Kelsall et al. looked at the supply side of the graduate labour
market only, and ignored employers and the recruitment strategies
which they adopt. Recent research based upon HELM data (Brennan and
McGeevor, 1988) suggests that employment outco~es - at least at the
initial point of entry into the labour market - vary according to
the course of study undertaken, and work by Roizen and Jepson (1985)
suggests that employers often put more stress on personality traits
(confidence, man-management skills, etc.) than upon the specific
course of study undertaken. These matters are potentially of great
importance to us because if these factors are unevenly distributed
between social classes to the disadvantage of those from manual
backgrounds - if, for example, they tend to undertake those courses
which have only poor employment outcomes or tend to be lacking in
those personality traits which employers value - then one might
expect them to fare less well in the labour market than others.
In Chapter Six the major characteristics of the graduate labour
market are examined in some detail, and the social-class origins and
destinations of graduates are compared by means of a matched sample.
In Chapter Seven the courses undertaken by graduates are examined,
and an attempt is made to analyse those factors which influence
young people in their choice of which course of study to follow in
higher education.
PAGE 132
CHAPTER SIX: THE GRADUATE LABOUR MARKET
The last chapter examined the employment and social-class
destinations of graduates and it will be recalled that, whilst a
weak relationship was found to exist between the social-class
origins and destinations of graduate men, no such relationship was
found for women. The analysis which has so far been performed can,
however, be criticized as being far too simplistic, in so far as, in
concentrating its attention on graduates, it has failed to take an
overall view of the labour market. In particular, it has ignored the
roles of employers and professional associations and has failed to
consider the parts played by different degree courses and other
qualifications. Further, our analysis has treated the labour market
as a homogeneous entity in which graduates compete for the same
jobs, when it is more realistic to view it as being divided into
distinct fragments or sectors within which different groups of
graduates compete for similar jobs. Moreover, the role of
degree-level and other qualifications and the nature of the
competition for jobs might differ in each sector. If this is so,
then the relationship which might exist between the social-class
origins and destinations of graduates may be more apparent in some
sectors than in others. It is to a consideration of this question
that we turn in this chapter.
The chapter is divided into three parts. In Part One, the changing
relationship between higher education and the labour market is
briefly discussed. Part Two looks at the various ways in which the
graduate labour market might be fragmented. Finally, Part Three
PAGE 133
examines the performance of graduates in each sector, differentiated
according to their social-class origins.
Part One: Change in Higher Education and the Graduate Labour Market
Although the approach which was taken to graduate employment in the
last chapter has been criticized as being too simplistic, until
comparatively recently most other writers - including Kelsall et al.
( 1972) have tended to adopt a similar one. The reasons for this
are not hard to find, for the labour market for graduates and
highly-educated labour has changed enormously since the early 1960s,
the absolute number of graduates was much lower, there were fewer
courses on offer, and fewer were specifically vocational in
orientation. As was shown in the previous chapter, graduates used to
be employed in a rather restricted range of occupations (see
Table 5.2), and entry into many professions took place through a
process of 'vertical mobility'.
In recent years, major changes have occurred both in higher
education and in the labour market for graduates and highly-skilled
manpower. The role previously played by the technical colleges in
training highly-skilled manpower has declined as the universities
have expanded and new institutions - polytechnics and colleges of
higher education - have come into being. UGC and CNAA statistics
show that the number of new degrees awarded each year has increased
enormously - from just under 10,000 in 1945, to 16,800 in 1954,
33,210 in 1966, 57,370 in 1975 and 102,000 in 1982. The number of
courses available to students has increased, many courses have
become more relevant to the world of industry and commerce, and
PAGE 134
offer exemption from various professional and related examinations.
The number of sandwich courses has increased, and it is now possible
to study courses in far more varied fields which, although not
specifically vocational in nature, nevertheless provide instruction
in skills necessary for employment in many occupations.
Partly as a result of these changes, graduate unemployment - at
least at the initial point of entry into the labour market - has
increased, and graduates
fields. With the growth
now
of
seek employment within more varied
professionally- and vocationally-
orientated courses there is now a closer tie between degree course
and the type of job undertaken by graduates. Moreover, it has been
argued (see below) that the relative success of graduates in the
labour market may be affected by factors other than the actual
degree course undertaken, including the type of institution
attended, social skills, personality traits, ethnicity and gender.
Part Two: Labour Market Fragmentation
The usual starting point in most discussions of the labour market is
the neo-classical economic model. In this model, wage rates are
assumed to be determined by the forces of supply and demand, such
that the rate paid for a particular job will tend to equal the
marginal productivity of the last man or woman employed. Such an
approach assumes the existence of a perfect market in which there
are many employers, none of whom are sufficiently large enough to
influence wage rates, and of workers who are undifferentiated as
regards their skills and qualifications (see McCormick, 1969;
PAGE 135
Schultz, 1971; Carline et al., 1985).
The human capital approach,
neo-classical tradition, rejects
although grounded within the
the assumption that the skills
needed to undertake different jobs are homogeneous. In this approach
rates of pay are seen to vary according to the level of skill needed
to undertake different jobs. Where people with the necessary skills
to undertake a particular job are in short supply, wages will be
high (Becker, 1964). This acts as a signal for people without such
skills to train for them, which increases the supply of suitably
trained manpower, which in turn reduces the rate of pay.
These neo-classical approaches can be criticized for a variety of
reasons (see Kreckle, 1980: 531-4). Firstly, they are unable to
explain differences in the earnings of similarly-qualified
individuals who differ as regards their sex, race, social origins
etc .. Secondly, they
of
assume that employers and employees have
the labour market, which is highly unlikely. perfect knowledge
Thirdly, the skills necessary to undertake jobs are often not
quantifiable and clear cut, and employers vary in the amounts of
stress which they place on them.
Nevertheless, these approaches are of interest to us in so far as
they suggest that those graduates who lack relevant knowledge of
labour market opportunities will be disadvantaged there because they
will not be able to respond to 'pricing signals' and will thus tend
to be employed in lower-status and lower-paid jobs than would
otherwise be the case. Indeed this, translated into economic
terminology, is what was implied by Kelsall et al. (1972: 73-4) when
PAGE 136
they suggested that, owing to their socialization, graduates from
working-class origins may have less knowledge of the graduate labour
market than others, which, in turn, might lead them to aspire to
lower-status jobs than those graduates from more middle-class
backgrounds. Conversely, one might expect those from more
middle-class backgrounds to benefit in those instances where they
have 'inside' knowledge of employment opportunities as a result of
the 'old-boy network'. This can be regarded as a form of labour
market fragmentation if it means that graduates from different
social-class backgrounds compete for different types of jobs.
Similarly, research by Kogan
employers often lack knowledge
and
not
Boyes
only of
(1984) suggests that
the credentials and
qualifications which potential candidates for jobs possess, but also
of the nature and characteristics of different degree courses and
institutions (universities, polytechnics and colleges) of higher
education (see also Roizen and Jepson, 1985). Quite simply,
relatively few managers and personnel officers in Britain possess
degree-level qualifications, few went to university and many
completed their education before the polytechnics and colleges of
higher education became fully established (see Lee, 1981). Because
of this few have a deep understanding of the country's system of
higher education and the differences which exist between
institutions and courses.
Hence the marginal productivity theory of labour (which suggests
that the best qualified individuals will be appointed to each
position) is incorrect in so far as employers are forced to make
their recruitment decisions on the basis of factors of which they
PAGE 137
have some 'knowledge'. Thus employers often put great stress on
A-level scores (a factor of some importance in those instances in
which employers recruit their graduate entrants before their degree
results are known) and the institution of higher education attended.
They may also hold stereotyped images of the ideal employee (which
may, for example, lead them to prefer to employ men rather than
women), and their traditional recruitment practices are important
because they simplify the recruitment process (Spencer and Podmore,
1987).
Arrow (1973) and Hirsch (1977) argue that candidates for a
particular job can be viewed as forming a queue in which education
serves a pre-selection (screen or filter) function which simplifies
the employers' recruitment process. In this queue Oxbridge graduates
are seen as the most able and other university graduates are
preferred to public sector ones, as are those with high rather than
low A-level scores and those who attended public and grammar rather
than comprehensive schools (see Kogan and Boys, 1984; Roizen and
Jepson, 1985).
This would tend to suggest that the graduate labour
by institution, such
market
that
may be
Oxbridge fragmented
graduates may
hierarchically
tend to be employed in higher-status jobs than
red-brick university graduates, who in turn tend to be employed in
higher-status jobs than public sector graduates. Moreover, should
employers have a preference for men rather than women and white
rather than black candidates then the labour market will also be
fragmented by gender and race. This approach, however, can be
criticized because it ignores the importance of different degree
PAGE 138

courses and other qualifications in determining employment outcomes.
Following Buley (1972) and Kreckle (1980), it can be argued that
there are three basic types of skill: occupational-specific,
industry-specific and general. Occupational-specific skills are
those which equip people to undertake a particular job.
Industry-specific skills are similar to these, but whilst someone
with occupational-specific skills may be qualified to work in many
industries, those with industry-specific skills tend to be 'tied' to
one industry or employer. Accountancy skills, for example, are
transferable across many occupations, whereas teaching and nursing
skills are not. General skills, in contrast, do not require a
specific training: they are easily transferred between occupations
and are learnt through both the education process (for example,
mathematical and related analytical skills which can be used in a
variety of fields) and the basic socialization process (for example,
man-management skills and the ability to get on with people and to
mix socially).
Employers vary in the stress which they place on specific and
general skills. Pearson (1976) argues that employers have three main
recruitment streams: one for professional/technical posts which are
filled by people with degrees in specific subjects such as teaching,
medicine and engineering, and two for managerial and administrative
posts which tend to be filled by people with degrees (or lower-level
qualifications such as HNCs) in non-vocational subjects. Within the
latter category it is possible to distinguish 'high-flyers' who are
very ambitious, and have strong man-management skills who tend to be
recruited from the more prestigious institutions (Oxbridge) and
PAGE 139
'low-flyers' who are less ambitious and perhaps lack man-management
skills, and who tend to be recruited from the less prestigious
institutions (polytechnics and redbrick universities}.
Although Pearson did not discuss fragmentation as such, his two
recruitment streams can, in effect, be thought of as forming two
distinct labour market sectors. Entry into the
professional/technical sector is only possible with a qualification
in a vocationally-orientated subject and any high-level (not
necessarily degree-level) qualification will suffice for entry into
the managerial/administrative sector. 'Success' within the
managerial/administrative sector is determined by factors in
addition to the possession of 'paper' qualifications (although these
are also important) and include the 'prestige' of the institution
attended, the possession of general skills and various personality
traits. Should these factors be distributed differentially between
social groups then some groups would tend to be more successful
within the managerial/administrative sector than others. Roizen and
Jepson (1985: 167-8) have argued that, owing to differences in their
upbringing and education, graduates from more middle-class
backgrounds may possess those characteristics valued by employers to
a greater extent than those from working-class backgrounds, with the
result that the latter may be disadvantaged within this sector, and
the same may also be true of women and black graduates.
The approach which has so far been taken is limited in so far as it
has examined labour-market fragmentation from the perspective of
employers only, and has ignored the influence which employees may
have over the recruitment process. Many, if not the majority of,
PAGE 140
graduates are employed within the professions, and it is to a
consideration of these that we now turn.
There are several approaches to the study of the professions which
need not unduly concern us here (see Millerson, 1964; Ritzer, 1972;
176-7). Although these approaches Johnson, 1972; Montagna, 1977:
differ in detail, they are similar in so far as they attempt to
number of traits or functions, define professions in terms of a
amongst the most important of which are: · ' ( 1) ski 11 based on
theoretical knowledge; (2) the provision of training and education;
(3) testing the competence of members; (4) organization;
(5) adherence to a professional code of conduct; and (6) altruistic
service' (Johnson, 1972: 23). Such an approach has, however, been
questioned by, amongst others, Johnson (1972) who argues that the
approach is too atheoretical in nature, being based to far too great
an extent on how professionals define themselves. Moreover, the
approach has been based on a small number of occupations (medicine,
law and the clergy) as they have existed in a limited number of
English speaking countries for only a relatively short period of
time.
Our interest in the professions lies in the approach taken by the
Parrys (1976), Parkin (1979) and Larson (1980), who point out that
professional bodies can be differentiated from other occupational
groups (such as trades unions) in so far as they enjoy an
advantageous position within the labour market which is based upon
the possession of a complex 'knowledge base' (eg medicine, law,
accountancy, etc) which requires a period of extensive training.
Unlike trades unions, professional bodies have the power to regulate
PAGE 141
entry into their occupations by the stipulation of minimum entry
qualifications and a fixed period of training. Thus, using the
Weberian concept of exclusion (see Chapter One), the Parrys (1977)
define professionalism as:-
a strategy for controlling an occupation in which colleagues set up a system of self-government through the control of education, training and the possession of qualifications.
This is important because professional associations, through their
control of the recruitment process, are able to limit the numbers of
people entering a particular occupation which not only increases
their earning potential but also constrains employers in their
recruitment strategies.
Moreover, since one of the main functions of knowledge in this
approach is to serve as a means of exclusion, it does not
necessarily follow that the knowledge acquired in training is of use
to those who practice the profession, and indeed Berg (1973) found
little evidence to support the claim that variations in the level of
education of people in a variety of professions were matched by
differences in the quality of their work. Rather, the important
point is that qualifications and credentials serve the function of
excluding people from an occupation.
Writing of the situation in the United States, Larson (1980: 141-2),
has shown us how professional associations have established links
with the universities. This has given their specialist 'knowledges'
a particular mystique, helped them to improve their occupational
status and served to limit recruitment by making it difficult for
people without a university training to enter the profession. A
PAGE 142
similar process of professionalization is also occurring in the
United Kingdom, and this is reflected in the growth of specialist
and vocationally-orientated.
Johnson (1972) considers that the 'success' of a professional
association is directly dependent upon the nature of its clientele.
Where professionals are self-employed and in direct contact with a
diffuse clientele which lacks a deep theoretical and practical
understanding of the professionals' knowledge base the process of
professionalization is likely to be most marked, and the
professional association is likely to be in a strong position to
regulate training and stipulate minimum entry requirements. For
example, doctors serve a clientele - the general public - who have
many of these characteristics (Johnson, 1972: 51-2). Conversely,
where professionals have a monopsonistic employer (ie where they
face a single employer) and they possess industry-specific skills
which, by definition, are not transferable between industries, the
process of professionalization is likely to be least effective and
the single employer is likely to be in a strong position to
determine minimum entry qualifications and regulate entry. Although
not perfect examples, many semiprofessionals employed within the
public sector (eg nurses, teachers and social workers) are in a
similar position.
The process of professionalization, the growth of specialist courses
and the increasing importance which employers place on specialist
skills have led to attempts to develop typologies of courses which
reflect their role in providing training for employment within
particular occupations. Firstly, however, it should be stressed that
PAGE 143
the distinction which is often drawn between vocational subjects
which provide specific work-orientated
and academic
variety of
training (eg Law,
(or general} subjects
fields (eg Sociology,
Accountancy, Medicine, etc.}
which lead to employment in a
History, English Literature,
distinction. In particular,
etc.} is in many ways a false
Jary (1969}, looking at Sociology
all courses have vocational as well as courses, has argued that
academic elements and it is simply not possible to separate the two,
and thus many Sociology courses provide instruction which can be
applied in fields as diverse as teaching, personnel management and
social work. Similarly, although courses in computing and
engineering are more strongly vocational in orientation, they also
cover theoretical approaches to the subject.
Brennan (1984} also doubts whether a simple dichotomy exists between
courses. He proposes a typology of courses based upon a
two-dimensional schema: role in training and role in selection. In
this schema the role which a course plays in training relates to the
extent to which it provides training aimed at a particular career.
As such, the training for a particular course may provide: a} no
vocational training; b) an optional base for future training; c) a
necessary base for future training; d) partially-complete training;
or e) complete training. The role of a course in selection relates
to the extent to which it affords access to a particular career. It
attempts to reflect both the demand for graduates from employers and
the influence of professional bodies (and government regulations}
over training and admission to a particular career. Three conditions
are possible where a degree is: a} the sole regulator of entry into
a career; b) a partial regulator of entry into a particular career
PAGE 144
(ie possession of a degree is only one of several entry routes); and
c) is not a regulator of entry into a career (ie an open-market
situation exists).
By putting these two dimensions together, it is possible to perceive
eight basic course types where the degree is: A) the sole regulator
of entry and training is complete; B) sole regulator and
part-training; C) sole regulator
training; D) partial regulation
E) partial regulation and partly
regulation and educational base for
employment-relevant educational
and an educational base for
and completed preparation;
completed training; F) partial
training; G) open market and
base; and H) open market and
non-relevant education base. In this schema, courses of type, A, B
and C can be differentiated from the others in that a degree is an
essential requirement for entry and they differ only in the amount
of further training which they require. Courses D, E and F can be
differentiated from the previous
degree is only one means of
competition from non-graduates
three in that possession of a
entry in so far as graduates face
with advanced-level qualifications
(eg HNDs, professional qualifications, etc) for available jobs, but
such graduates do, however, possess specialist skills. Graduates
with G- and H-type courses have general skills which may be of use
to employers in a range of areas. They can be differentiated from
one another in so far as type H courses have not been devised with
an eye to possible employment. Brennan's typology is illustrated in
Figure 6.1.
PAGE 145
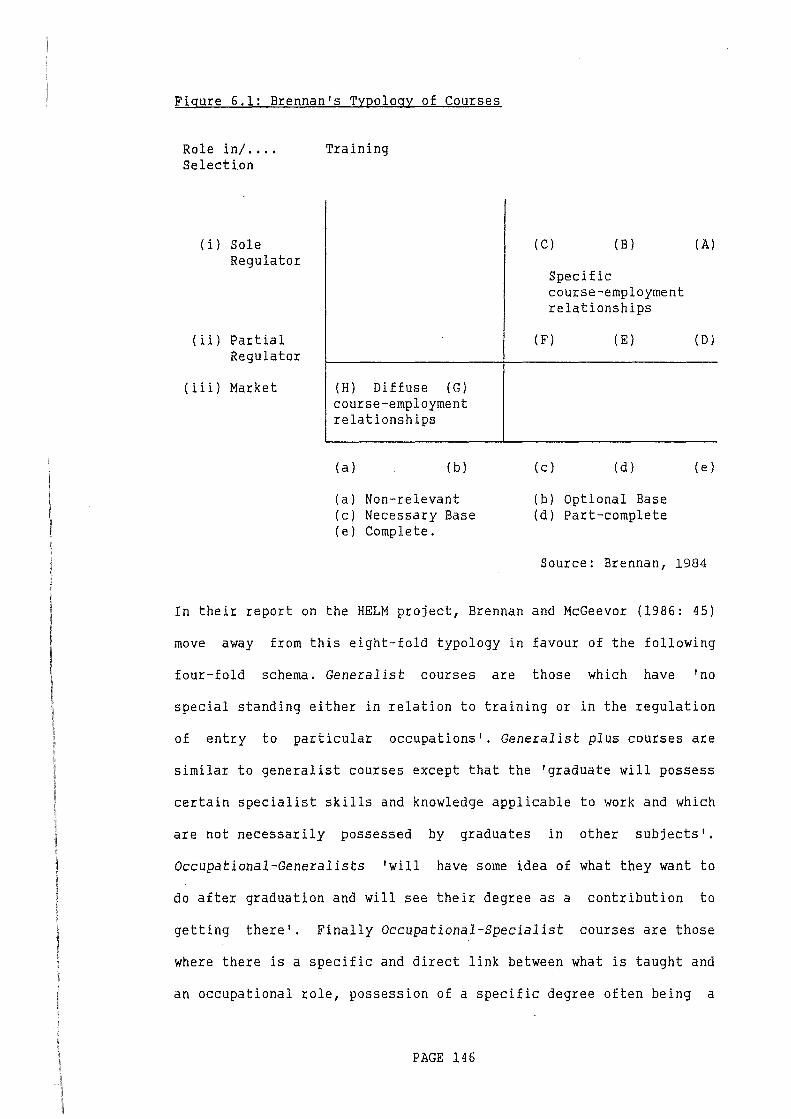
Figure 6.1: Brennan's Typology of Courses
Role in/ .... Selecti.on
(i) Sole Regulator
(ii) Partial Regulator
(iii) Market
Training
(H) Diffuse (G) course-employment relationships
(a) (b)
(a) Non-relevant (c) Necessary Base (e) Complete.
(C) (B)
Specific course-employment relationships
(F) (E)
(c) (d)
(b) Optional Base (d) Part-complete
(A)
(D)
(e)
Source: Brennan, 1984
In their report on the HELM project, Brennan and McGeevor (1986: 45)
move away from this eight-fold typology in favour of the following
four-fold schema. Generalist courses are those which have 'no
special standing either in relation to training or in the regulation
of entry to particular occupations'. Generalist plus courses are
similar to generalist courses except that the 'graduate will possess
certain specialist skills and knowledge applicable to work and which
are not necessarily possessed by graduates in other subjects'.
Occupational-Generalists 'will have some idea of what they want to
do after graduation and will see their degree as a contribution to
getting there'. Finally Occupational-Specialist courses are those
where there is a specific and direct link between what is taught and
an occupational role, possession of a specific degree often being a
PAGE 146
requirement of entry into a particular occupation. Table 6.6 shows
the HELM courses broken down according to this schema (see also
Brennan and McGeevor, 1988: 47-8).
Although not as complex or detailed as Brennan's eight-fold schema,
Brennan and McGeevor demonstrate that there are quite marked
differences in the employment destinations of graduates between each
of these four course groupings. Not surprisingly, those with degrees
in occupational-specialist courses tended to find employment within
the professionals and semiprofessions for which their degree
courses had provided a training, whilst those with degrees in
generalist courses were employed within a far wider variety of
occupations (Brennan and McGeevor, 1986: 51-3). They also found that
a direct relationship existed between how graduates rated the
quality of their work and the type of course which they had
undertaken. Thus they found that those with degrees in
occupational-specialist courses gave their jobs the highest rating
and those with degrees in generalist subjects gave their courses the
lowest rating (p. 56-7). Although Brennan and McGeevor do not
specifically refer to their model as one of labour market
fragmentation, it can be argued that their gradua~es are in fact
competing for jobs within separate labour markets.
We have, then, identified three possible sources of labour market
fragmentation, and these can be seen . as resulting from:
a) socialization; b) institution attended; and c) course undertaken.
To these may also be added gender and race, discussion of which
will, however, be left until later chapters.
PAGE 14 7
In the next section the contention that the relationship which
exists between the social-class origins and destinations of
graduates varies between labour market sectors is examined.
Part Three: Empirical Evidence
The first thing which needs to be considered is how the concept of
labour market fragmentation is to be measured. From our previous
discussion it should be clear that fragmentation can be said to
exist where people are excluded from employment within a particular
field (see Parkin, 1979: 44-7; Kreckle, 1980), and it has been
suggested that such exclusion might exist where
the 'wrong' qualifications defined in broad
graduates
terms to
possess
include
'knowledge' of labour market opportunities, personality traits,
paper qualifications and even physical characteristics such as
gender and ethnicity. Probably the easiest way to conceptualize this
is in terms of Figure 6.2, from which it can be seen that each
occupational group competes for jobs within a separate labour
market. Each occupation is closed to outsiders in the sense that
those without minimum entry qualifications are excluded from it, and
movement between occupations is difficult if not impossible.
PAGE 148
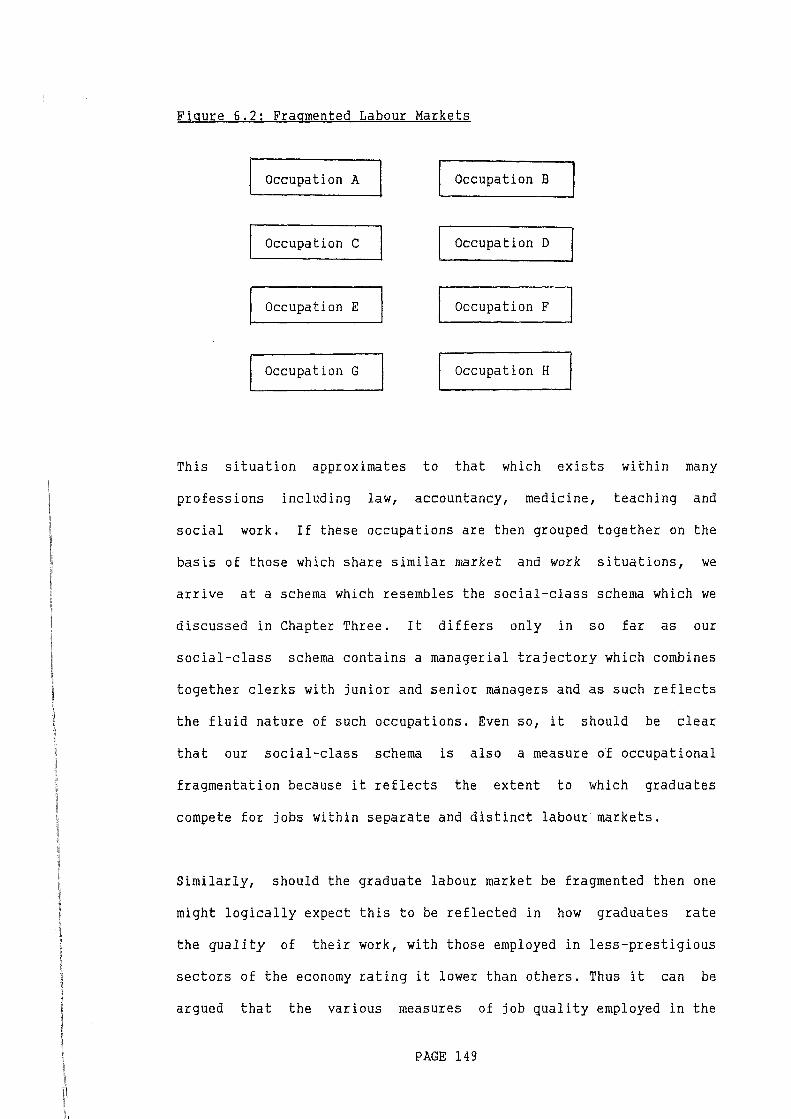
Figure 6.2: Fragmented Labour Markets
Occupation A Occupation B
Occupation C Occupation D
Occupation E Occupation F
Occupation G Occupation H
This situation approximates to that which exists within many
professions including law, accountancy, medicine, teaching and
social work. If these occupations are then grouped together on the
basis of those which share similar market and work situations, we
arrive at a schema which resembles the social-class schema which we
discussed in Chapter Three. It differs only in so far as our
social-class schema contains a managerial trajectory which combines
together clerks with junior and senior managers and as such reflects
the fluid nature of such occupations. Even so, it should be clear
that our social-class schema is also a measure of occupational
fragmentation because it reflects the extent to which graduates
compete for jobs within separate and distinct labour markets.
Similarly, should the graduate labour market be fragmented then one
might logically expect this to be reflected in how graduates rate
the quality of their work, with those employed in less-prestigious
sectors of the economy rating it lower than others. Thus it can be
argued that the various measures of job quality employed in the
PAGE 149
previous chapter can also be thought of as shadow measures of labour
market fragmentation.
Empirical support has already been found for the contention that
labour market fragmentation may exist as a result of differences in
the 'level of knowledge' which graduates originating from different
social classes have of the labour market, and this has already been
discussed in the last chapter. However, the discovery of such a
relationship does not indicate its cause, which may be a facet of
some other form of fragmentation. It is, therefore, necessary to
make allowances, for these other forms of fragmentation before this
question can be discussed further.
The second source of fragmentation which might exist is that of
fragmentation by institution, which may result from an employer's
preference for Oxbridge and other university graduates rather than
public sector ones. Unfortunately, university graduates were not
included in the HELM sample, although First Destination Statistics
and a recent study by Boys and Kirkland (1987) allow us to draw
comparisons between graduates on both sides of the binary divide.
Table 6.1 shows the employment status of university, polytechnic and
CHE (college of higher education) graduates six months after
graduation.
PAGE 150
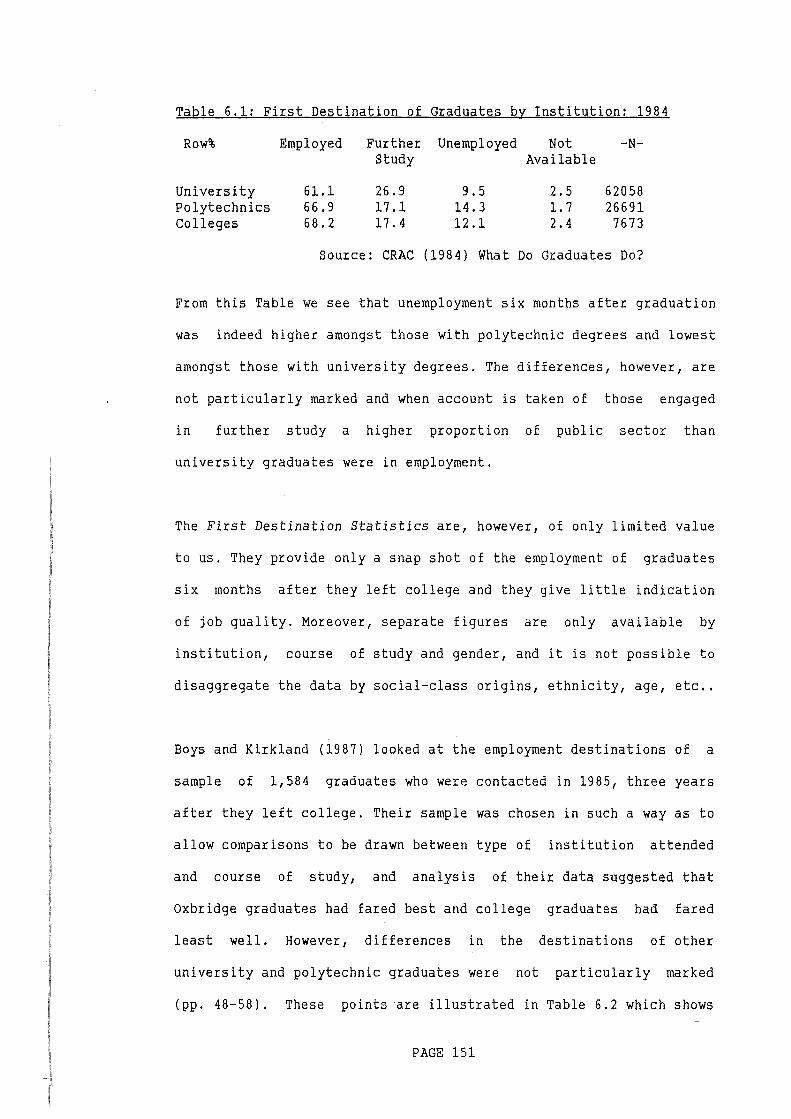
Table 6.1: First Destinat_ioll_ PLGtgduate_s by Institution: 1984
Row% Employed Further Unemployed Not -N-Study Available
University 61.1 26.9 9.5 2.5 62058 Polytechnics 66.9 17.1 14.3 1.7 26691 Colleges 68.2 17.4 12.1 2. 4 7673
Source: CRAC (1984) What Do Graduates Do?
From this Table we see that unemployment six months after graduation
was indeed higher amongst those with polytechnic degrees and lowest
amongst those with university degrees. The differences, however, are
not particularly marked and when account is taken of those engaged
in further study a higher proportion of public sector than
university graduates were in employment.
The First Destination Statistics are, however, of only limited value
to us. They provide only a snap shot of the employment of graduates
six months after they left college and they give little indication
of job quality. Moreover, separate figures are only available by
institution, course of study and gender, and it is not possible to
disaggregate the data by social-class origins, ethnicity, age, etc ..
Boys and Kirkland (1987) looked at the employment destinations of a
sample of 1,584 graduates who were contacted in 1985, three years
after they left college. Their sample was chosen in such a way as to
allow comparisons to be drawn between type of institution attended
and course of study, and analysis of their data suggested that
Oxbridge graduates had fared best and college graduates had fared
least well. However, differences in the destinations of other
university and polytechnic graduates were not particularly marked
(pp. 48-58). These points are illustrated in Table 6.2 which shows
PAGE 151
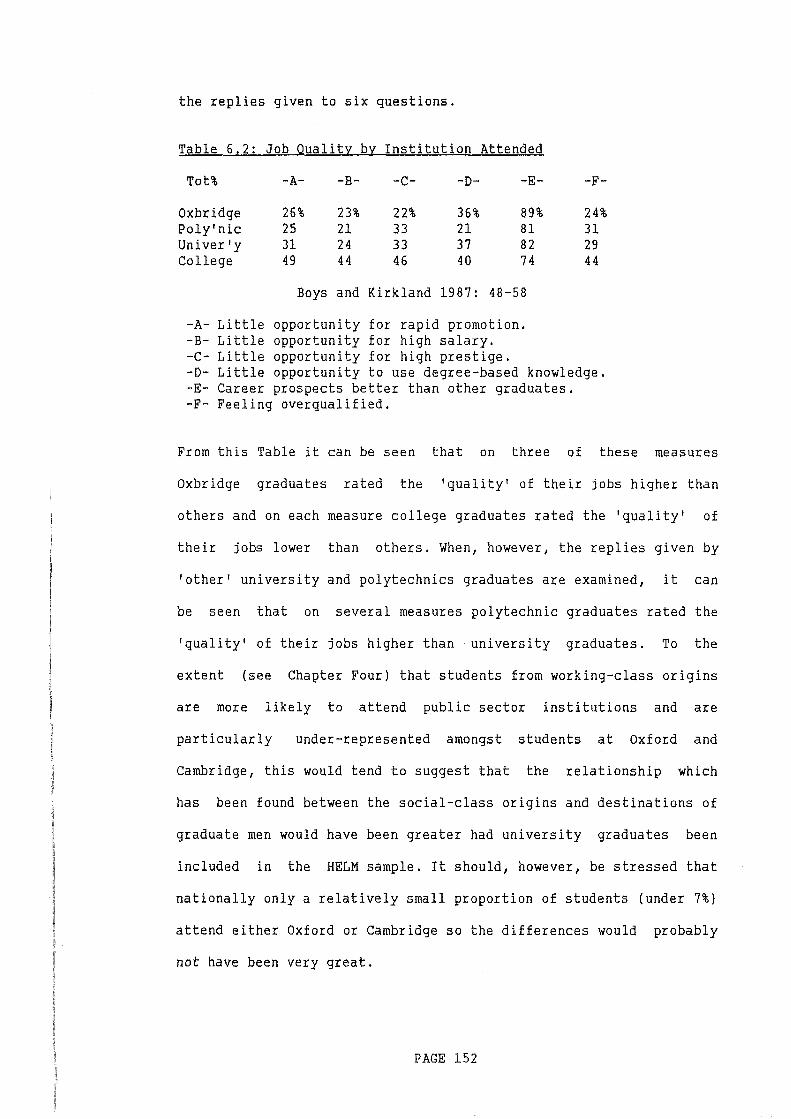
the replies given to six questions.
Table 6.2: Job Quality by Institution Attended
Tot% -A- -B- -c- -D- -E- -F-
Oxbridge 26% 23% 22% 36% 89% 24% Poly'nic 25 21 33 21 81 31 Univer'y 31 24 33 37 82 29 College 49 44 46 40 74 44
Boys and Kirkland 1987: 48-58
-A- Little opportunity for rapid promotion. -B- Little opportunity for high salary. -c- Little opportunity for high prestige. -D- Little opportunity to use degree-based knowledge. -E- Career prospects better than other graduates. -F- Feeling overqualified.
From this Table it can be seen that on three of these measures
Oxbridge graduates rated the 'quality' of their jobs higher than
others and on each measure college graduates rated the 'quality' of
their jobs lower than others. When, however, the replies given by
'other' university and polytechnics graduates are examined, it can
be seen that on several measures polytechnic graduates rated the
'quality' of their jobs higher than university graduates. To the
extent (see Chapter Four) that students from working-class origins
are more likely to attend public sector institutions and are
particularly under-represented amongst students at Oxford and
Cambridge, this would tend to suggest that the relationship which
has been found between the social-class origins and destinations of
graduate men would have been greater had university graduates been
included in the HELM sample. It should, however, be stressed that
nationally only a relatively small proportion of students (under 7%)
attend either Oxford or Cambridge so the differences would probably
not have been very great.
PAGE 152
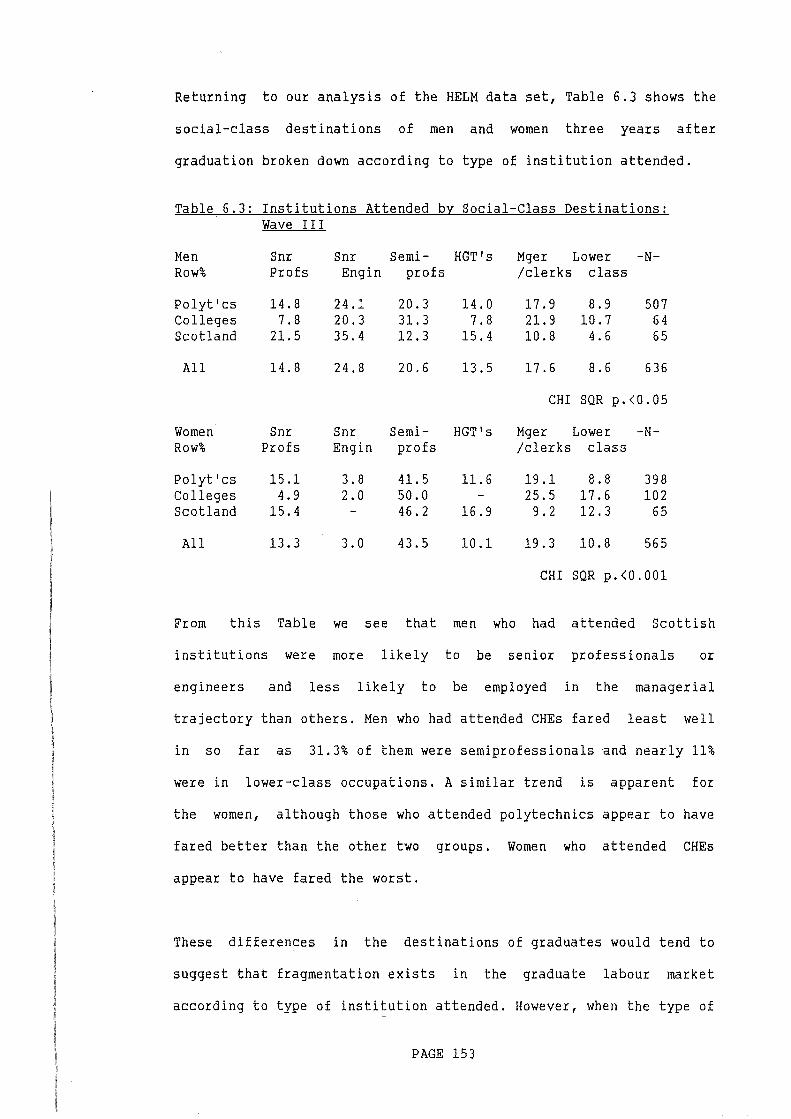
Returning to our analysis of the HELM data set, Table 6.3 shows the
social-class destinations of men and women three years after
graduation broken down according to type of institution attended.
Table 6.3: Institutions Attended by Social-Class Destinations: Wave III
Men Snr Snr Semi- HGT's Mger Lower -N-Row% Profs Eng in profs /clerks class
Polyt'cs 14.8 24.1 20.3 14.0 17.9 8.9 507 Colleges 7.8 20.3 31.3 7.8 21.9 10.7 64 Scotland 21.5 35.4 12.3 15.4 10.8 4. 6 65
All 14.8 24.8 20.6 13.5 17.6 8.6 636
CHI SQR p.<0.05
Women Snr Snr Semi- HGT's Mger Lower -N-Row% Profs Eng in profs /clerks class
Polyt'cs 15.1 3.8 41.5 11.6 19.1 8.8 398 Colleges 4.9 2.0 50.0 - 25.5 17.6 102 Scotland 15.4 - 46.2 16.9 9.2 12.3 65
All 13.3 3.0 43.5 10.1 19.3 10.8 565
CHI SQR p.<0.001
From this Table we see that men who had attended Scottish
institutions were more likely to be senior professionals or
engineers and less likely to be employed in the managerial
trajectory than others. Men who had attended CHEs fared least well
in so far as 31.3% of them were semiprofessionals and nearly 11%
were in lower-class occupations. A similar trend is apparent for
the women, although those who attended polytechnics appear to have
fared better than the other two groups. Women who attended CHEs
appear to have fared the worst.
These differences in the destinations of graduates would tend to
suggest that fragmentation exists in the graduate labour market
according to type of institution attended. However, when the type of
PAGE 153
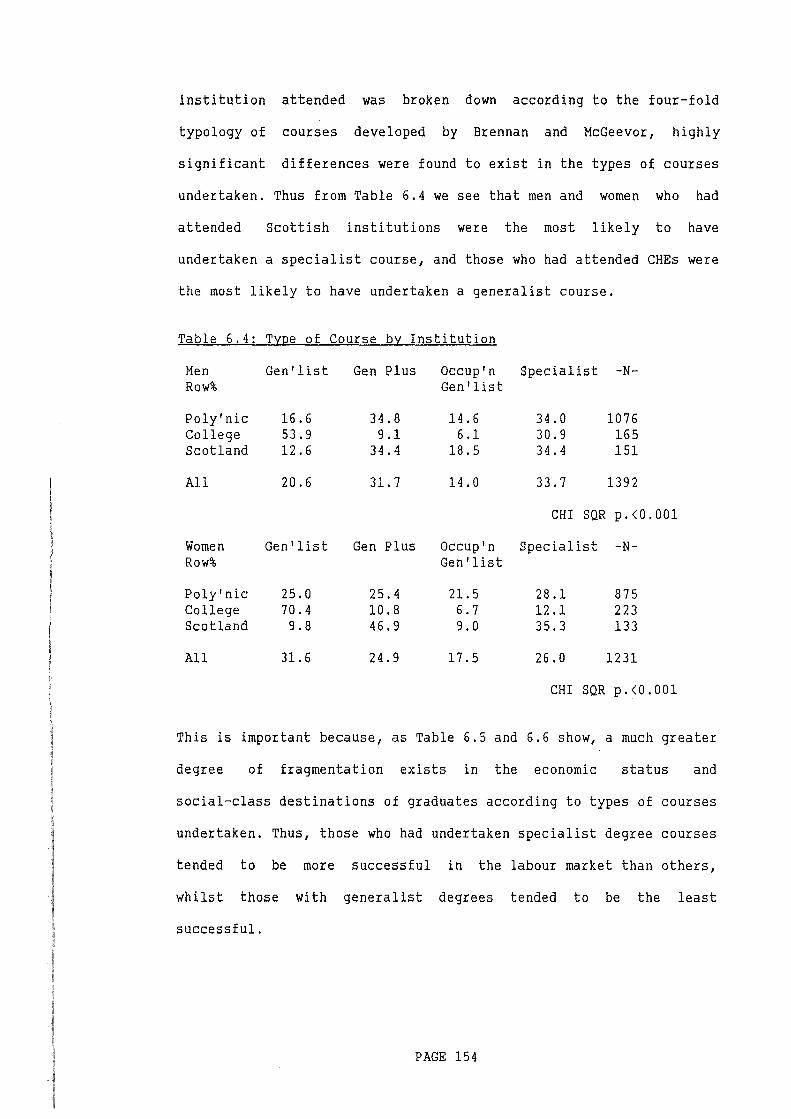
institution attended was broken down according to the four-fold
typology of courses developed by Brennan and McGeevor, highly
significant differences were found to exist in the types of courses
undertaken. Thus from Table 6.4 we see that men and women who had
attended Scottish institutions were the most likely to have
undertaken a specialist course, and those who had attended CHEs were
the most likely to have undertaken a generalist course.
Table 6.4: Type of Course by Institution
Men Gen'list Gen Plus Occup'n Specialist -N-Row% Gen'list
Poly'nic 16.6 34.8 14.6 34.0 1076 College 53.9 9.1 6.1 30.9 165 Scotland 12.6 34.4 18.5 34.4 151
All 20.6 31.7 14.0 33.7 1392
CHI SQR p.<0.001
Women Gen'list Gen Plus Occup'n Specialist -N-Row% Gen'list
Poly'nic 25.0 25.4 21.5 28.1 875 College 70.4 10.8 6.7 12.1 223 Scotland 9.8 46.9 9.0 35.3 133
All 31.6 24.9 17.5 26.0 1231
CHI SQR p.<0.001
This is important because, as Table 6.5 and 6.6 show, a much greater
degree of fragmentation exists in the economic status and
social-class destinations of graduates according to types of courses
undertaken. Thus, those who had undertaken specialist degree courses
tended to be more successful in the labour market than others,
whilst those with generalist degrees tended to be the least
successful.
PAGE 154
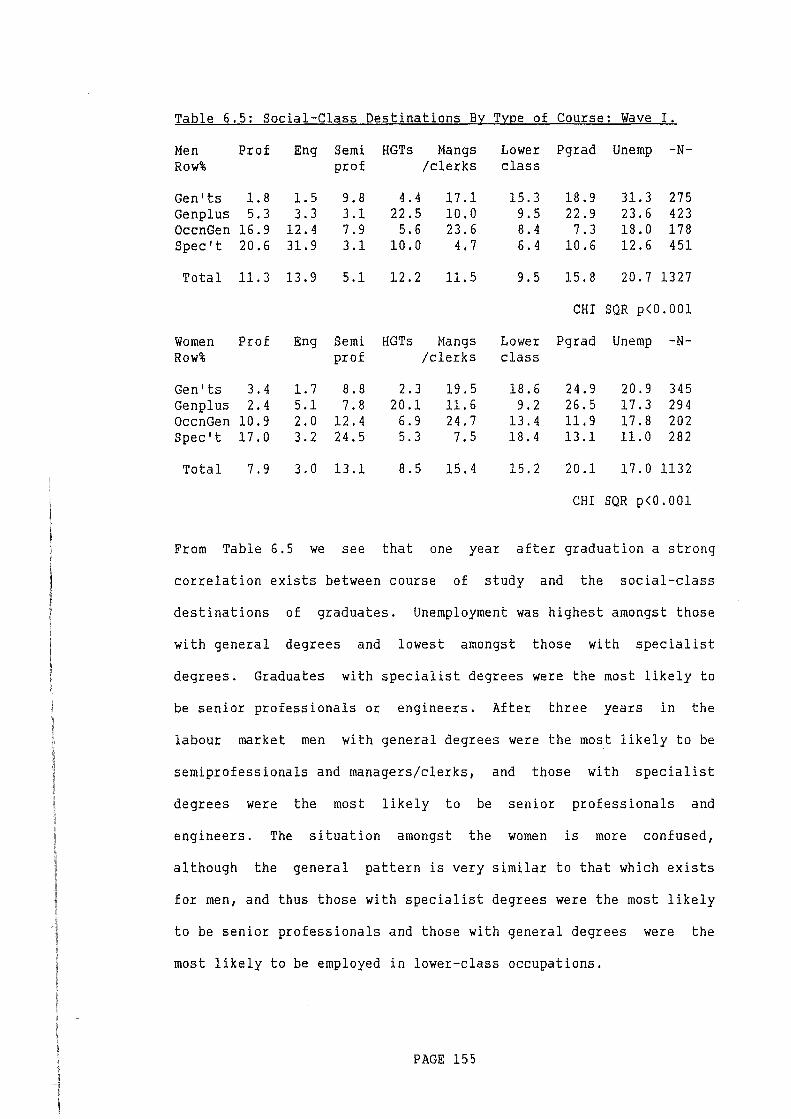
Table 6. 5: Social-Class Destinations _BY.....TYQe of Course: Wave I.
Men Prof Eng Semi HGTs Mangs Lower Pgrad Unemp -N-Row% prof /clerks class
Gen'ts 1.8 1.5 9.8 4.4 17.1 15.3 18.9 31.3 275 Genplus 5.3 3.3 3.1 22.5 10.0 9.5 22.9 23.6 423 OccnGen 16.9 12.4 7.9 5.6 23.6 8.4 7.3 18.0 178 Spec't 20.6 31.9 3.1 10.0 4.7 6.4 10.6 12.6 451
Total 11.3 13.9 5.1 12.2 11.5 9.5 15.8 20.7 1327
CHI SQR p<0.001
Women Prof Eng Semi HGTs Mangs Lower Pgrad Unemp -N-Row% prof /clerks class
Gen 1 ts 3.4 1.7 8. 8 2.3 19.5 18.6 24.9 20.9 345 Genplus 2. 4 5.1 7.8 20.1 11.6 9.2 26.5 17.3 294 OccnGen 10.9 2.0 12.4 6.9 24.7 13.4 11.9 17.8 202 Spec't 17.0 3.2 24.5 5.3 7.5 18.4 13.1 11.0 282
Total 7.9 3.0 13.1 8.5 15.4 15.2 20.1 17.0 1132
CHI SQR p<0.001
From Table 6.5 we see that one year after graduation a strong
correlation exists between course of study and the social-class
destinations of graduates. Unemployment was highest amongst those
with general degrees and lowest amongst those with specialist
degrees. Graduates with specialist degrees were the most likely to
be senior professionals or engineers. After three years in the
labour market men with general degrees were the most likely to be
semiprofessionals and managers/clerks, and those with specialist
degrees were the most likely to be senior professionals and
engineers. The situation amongst the women is more confused,
although the general pattern is very similar to that which exists
for men, and thus those with specialist degrees were the most likely
to be senior professionals and those with general degrees were the
most likely to be employed in lower-class occupations.
PAGE 155
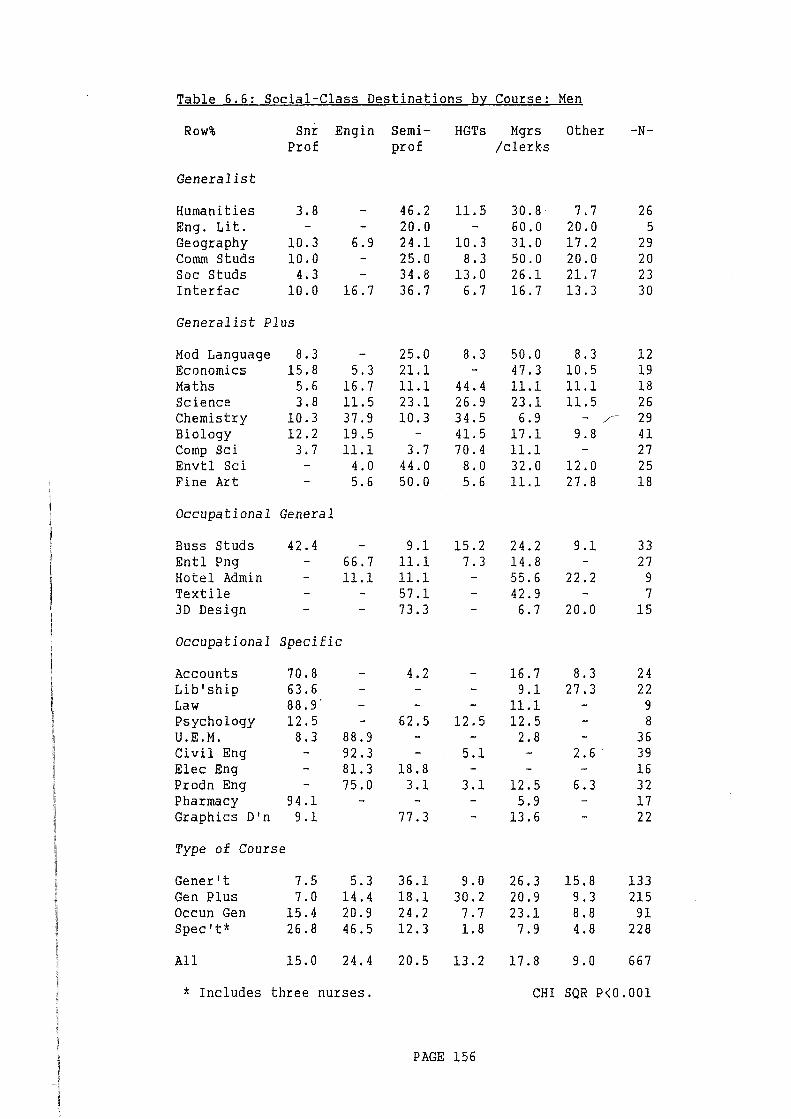
Table 6. 6: Social-Class Dest_ingt ions _by Course: Men
Row% Snr Eng in Semi- HGTs Mgrs Other -N-Prof prof /clerks
Generalist
Humanities 3.8 - 46.2 11.5 30.8 7.7 26 Eng. Lit. - - 20.0 - 60.0 20.0 5 Geography 10.3 6.9 24.1 10.3 31.0 17.2 29 Comm Studs 10.0 - 25.0 8.3 50.0 20.0 20 Soc Studs 4.3 - 34.8 13.0 26.1 21.7 23 Interfac 10.0 16.7 36.7 6.7 16.7 13.3 30
Generalist Plus
Mod Language 8.3 - 25.0 8. 3 50.0 8.3 12 Economics 15.8 5.3 21.1 - 47.3 10.5 19 Maths 5.6 16.7 11.1 44.4 11.1 11.1 18 Science 3.8 11.5 23.1 26.9 23.1 11.5 26 Chemistry 10.3 37.9 10.3 34.5 6.9 - /- 29 Biology 12.2 19.5 - 41.5 17.1 9.8 41 Comp Sci 3.7 11.1 3.7 70.4 11.1 - 27 Envt1 Sci - 4.0 44.0 8.0 32.0 12.0 25 Fine Art - 5.6 50.0 5.6 11.1 27.8 18
Occupational General
Buss Studs 42.4 - 9.1 15.2 24.2 9.1 33 Entl Png - 66.7 11.1 7.3 14.8 - 27 Hotel Admin - 11.1 11.1 - 55.6 22.2 9 Textile - - 57.1 - 42.9 - 7 3D Design - - 73.3 - 6.7 20.0 15
Occupational Specific
Accounts 70.8 - 4.2 - 16.7 8.3 24 Lib'ship 63.6 - - - 9.1 27.3 22 Law 88.9' - - - 11.1 - 9 Psychology 12.5 - 62.5 12.5 12.5 - 8 U.E.M. 8.3 88.9 - - 2.8 - 36 Civil Eng - 92.3 - 5.1 - 2. 6. 39 Elec Eng - 81.3 18.8 - - - 16 Prodn Eng - 75.0 3.1 3.1 12.5 6.3 32 Pharmacy 94.1 - - - 5.9 - 17 Graphics D'n 9.1 77.3 - 13.6 - 22
Type of Course
Gener't 7.5 5.3 36.1 9.0 26.3 15.8 133 Gen Plus 7.0 14.4 18.1 30.2 20.9 9.3 215 Occun Gen 15.4 20.9 24.2 7.7 23.1 8. 8 91 Spec't* 26.8 46.5 12.3 1.8 7.9 4.8 228
All 15.0 24.4 20.5 13.2 17.8 9.0 667
* Includes three nurses. CHI SQR P<0.001
PAGE 156
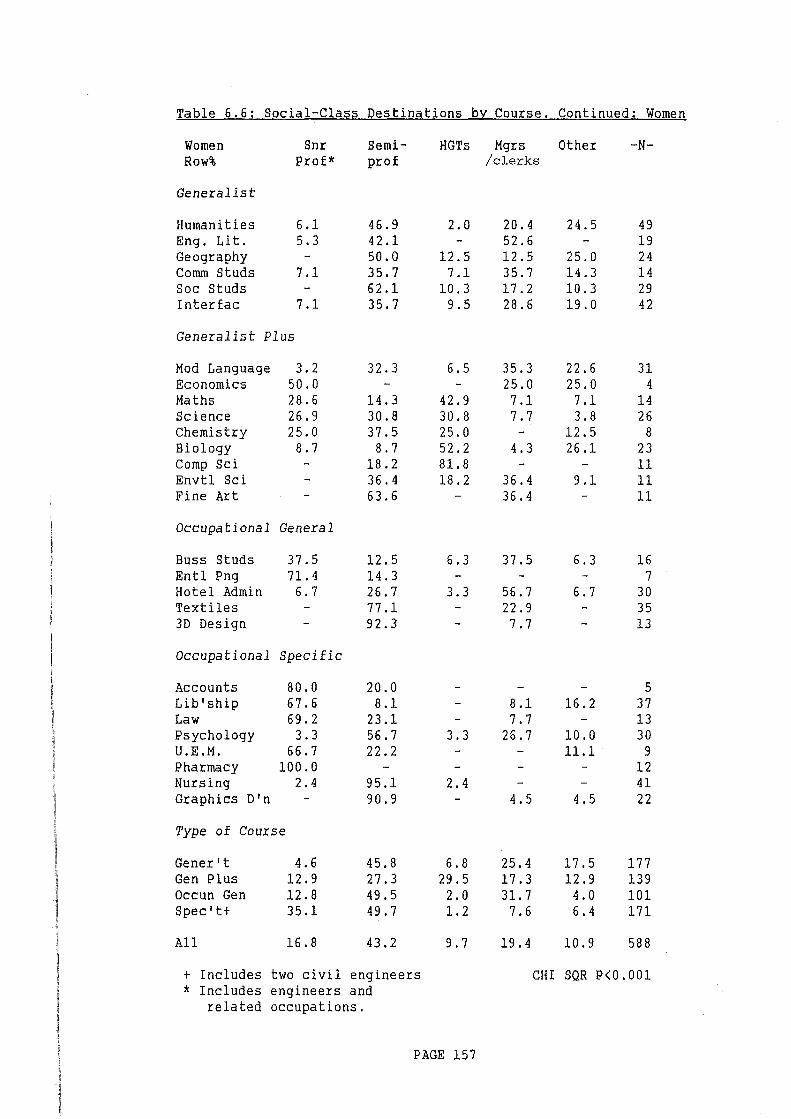
Table 6.6: Social-Class Destinations by_Course. Continued: Women
Women Snr Semi- HGTs Mgrs Other -N-Row% Prof* prof /clerks
Generalist
Humanities 6.1 46.9 2.0 20.4 24.5 49 Eng. Lit. 5.3 42.1 - 52.6 - 19 Geography - 50.0 12.5 12.5 25.0 24 Comm Studs 7.1 35.7 7.1 35.7 14.3 14 Soc Studs - 62.1 10.3 17.2 10.3 29 Interfac 7.1 35.7 9.5 28.6 19.0 42
Generalist Plus
Mod Language 3.2 32.3 6.5 35.3 22.6 31 Economics 50.0 - - 25.0 25.0 4 Maths 28.6 14.3 42.9 7.1 7.1 14 Science 26.9 30.8 30.8 7.7 3. 8 26 Chemistry 25.0 37.5 25.0 - 12.5 8 Biology 8.7 8.7 52.2 4.3 26.1 23 Comp Sci - 18.2 81.8 - - 11 Envtl Sci - 36.4 18.2 36.4 9.1 11 Fine Art - 63.6 - 36.4 - 11
Occupational General
Buss Studs 37.5 12.5 6. 3 37.5 6.3 16 Entl Png 71.4 14.3 - - - 7 Hotel Admin 6.7 26.7 3.3 56.7 6. 7 30 Textiles - 77.1 - 22.9 - 35 3D Design - 92.3 - 7. 7 - 13
Occupational Specific
Accounts 80.0 20.0 - - - 5 Lib'ship 67.6 8.1 - 8.1 16.2 37 Law 69.2 23.1 - 7. 7 - 13 Psychology 3.3 56.7 3.3 26.7 10.0 30 U.E.M. 66.7 22.2 - - 11.1 9 Pharmacy 100.0 - - - - 12 Nursing 2.4 95.1 2.4 - - 41 Graphics D'n - 90.9 - 4.5 4.5 22
Type of Course
Gener't 4.6 45.8 6.8 25.4 17.5 177 Gen Plus 12.9 27.3 29.5 17.3 12.9 139 Occun Gen 12.8 49.5 2.0 31.7 4. 0 101 Spec't+ 35.1 49.7 1.2 7.6 6. 4 171
All 16.8 43.2 9.7 19.4 10.9 588
+ Includes two civil engineers CHI SQR P<0.001 * Includes engineers and
related occupations.
PAGE 157
Taken together, these Tables suggest that the graduate labour market
is strongly fragmented according to the type of course which
graduates had undertaken such that graduates with different degree
courses tend to compete for jobs within separate and distinct labour
markets.
In the next chapter it is demonstrated
working-class origins were far more likely
that
than
graduates
others to
from
have
studied a generalist or generalist-plus degree course and were less
likely to have studied a specialist or occupational-generalist
course. This would tend to suggest that graduates from working-class
origins are disadvantaged in the labour market to the extent that
they have undertaken those courses which have poorer employment
outcomes. The process by which graduates are allocated to these
courses is therefore of some interest to us, and is a question to
which we shall be returning in the next chapter.
Given the high degree of labour market fragmentation which has been
found to exist between graduates who undertook different types of
course (that is the tendency for graduates with different degree
courses to find employment within different sectors of the economy)
it seems reasonable to argue that the relationship between the
social-class origins and destinations of graduates will be mediated
through their courses of study, such that amongst graduates in the
more vocationally-orientated subjects the relationship will be quite
weak as possession of such a degree often facilitates entry into
employment within a particular field, and amongst those with degrees
in more generalist subjects the relationship will be stronger.
PAGE 158
From our previous discussion it should be clear that there are
several reasons why one might expect the relationship between the
origins and destinations of graduates to be stronger amongst those
with more general degrees. Firstly, owing to differences in their
early socialization graduates from manual backgrounds are more
likely than others to 'lack knowledge' of the labour market with the
result that they are more likely to aspire to lower-status jobs, and
secondly, again owing to their socialization, graduates from manual
backgrounds may be lacking in the social skills which employers
value.
The easiest way in which to look for evidence of this association
would be to generate two sets of tables, for men and women, showing
the relationship between the social-class origins and destinations
of graduates for each of the four HELM course types. This approach
was not, unfortunately, feasible, as the numbers in some of the
cells would have been so small that interpretation would be
difficult if not impossible. In an attempt to overcome this problem
it was decided to combine both the generalist and generalist-plus
categories (generalists) on the one hand and the occupational
generalist and occupational-specialist categories (vocationalists)
on the other. Even so, the number of respondents in some of the
cells is rather small and the following four Tables should be
interpreted with great care.
Table 6.7 shows the relationship which exists between the
social-class origins and destinations of graduate men with general
degrees and Table 6.8 shows the same information for those with
vocational degrees.
PAGE 159
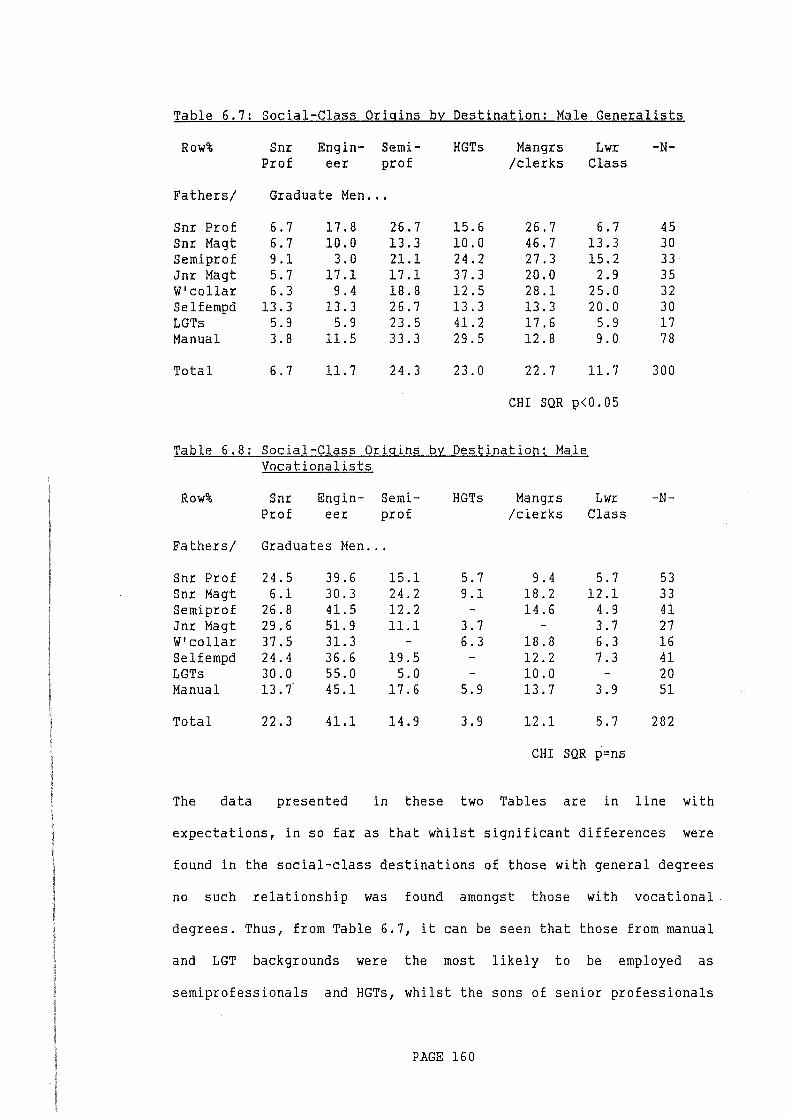
Table 6.7: Social-Class Origins by Destination: Male Generalists
Row%
Fathers/
Snr Prof Snr Magt Semipro£ Jnr Magt W'collar Selfempd LGTs Manual
Total
Snr Prof
Engin- Semi-eer prof
Graduate Men ...
6.7 6.7 9.1 5.7 6.3
13.3 5.9 3. 8
6.7
17.8 10.0
3.0 17.1
9.4 13.3
5.9 11.5
11.7
26.7 13.3 21.1 17.1 18.8 26.7 23.5 33.3
24.3
HGTs
15.6 10.0 24.2 37.3 12.5 13.3 41.2 29.5
23.0
Mangrs /clerks
26.7 46.7 27.3 20.0 28.1 13.3 17.6 12.8
22.7
Lwr Class
6.7 13.3 15.2
2.9 25.0 20.0
5.9 9.0
11.7
CHI SQR p<0.05
Table 6.8: Social-Class Origins by Destination: Male Vocationalists
Row%
Fathers/
Snr Prof Snr Magt Semipro£ Jnr Magt W' collar Selfempd LGTs Manual
Total
Snr Prof
Engin- Semi-eer prof
Graduates Men ...
24.5 6.1
26.8 29.6 37.5 24.4 30.0 13.7
22.3
39.6 30.3 41.5 51.9 31.3 36.6 55.0 45.1
41.1
15.1 24.2 12.2 11.1
19.5 5.0
17.6
14.9
HGTs
5.7 9.1
3.7 6.3
5.9
3.9
Mangrs Lwr /clerks Class
9.4 18.2 14.6
18.8 12.2 10.0 13.7
12.1
5.7 12.1
4.9 3.7 6.3 7.3
3.9
5.7
CHI SQR p=ns
-N-
45 30 33 35 32 30 17 78
300
-N-
53 33 41 27 16 41 20 51
282
The data presented in these two Tables are in line with
expectations, in so far as that whilst significant differences were
found in the social-class destinations of those with general degrees
no such relationship was found amongst those with vocational
degrees. Thus, from Table 6.7, it can be seen that those from manual
and LGT backgrounds were the most likely to be employed as
semiprofessionals and HGTs, whilst the sons of senior professionals
PAGE 160
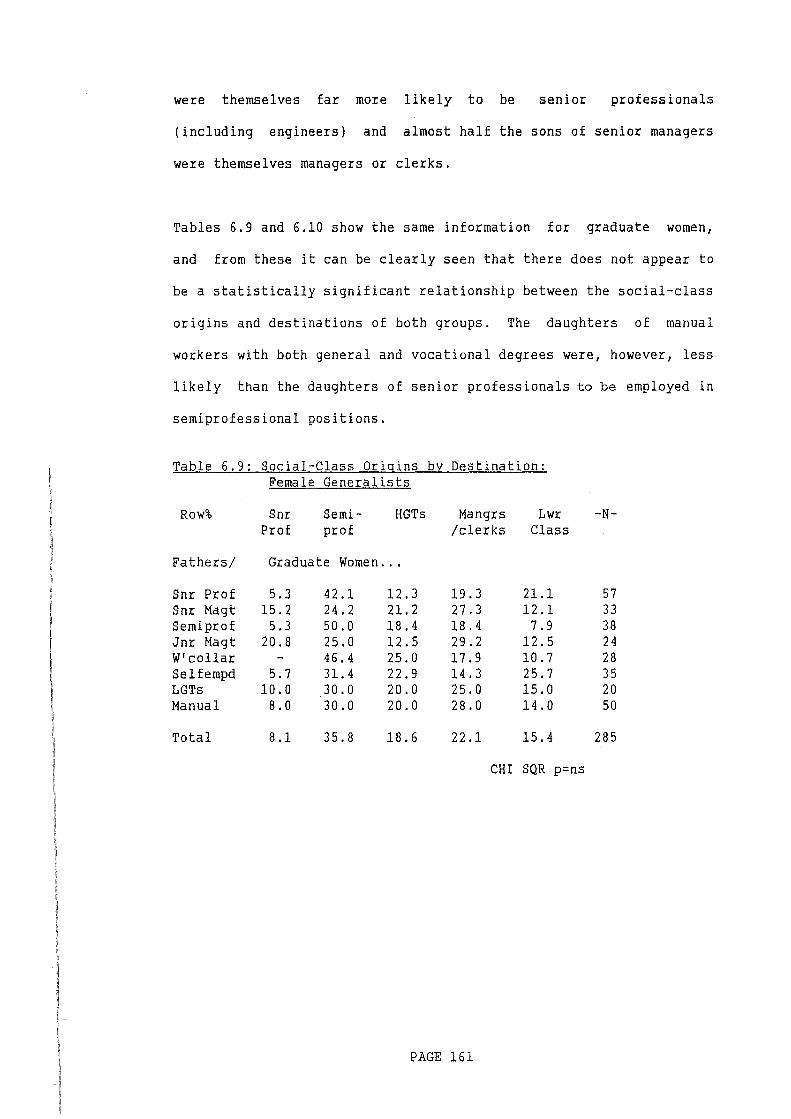
were themselves far more likely to be senior professionals
(including engineers) and almost half the sons of senior managers
were themselves managers or clerks.
Tables 6.9 and 6.10 show the same information for graduate women,
and from these it can be clearly seen that there does not appear to
be a statistically significant relationship between the social-class
origins and destinations of both groups. The daughters of manual
workers with both general and vocational degrees were, however, less
likely than the daughters of senior professionals to be employed in
semiprofessional positions.
Table 6.9: Social-Class Origins by Destination: Female Generalists
Row% Snr Semi- HGTs Mangrs Lwr -N-Prof prof /clerks Class
Fathers/ Graduate Women ...
Snr Prof 5.3 42.1 12.3 19.3 21.1 57 Snr Magt 15.2 24.2 21.2 27.3 12.1 33 Semipro£ 5.3 50.0 18.4 18.4 7.9 38 Jnr Magt 20.8 25.0 12.5 29.2 12.5 24 W' collar - 46.4 25.0 17.9 10.7 28 Selfempd 5;7 31.4 22.9 14.3 25.7 35 LGTs 10.0 30.0 20.0 25.0 15.0 20 Manual 8.0 30.0 20.0 28.0 14.0 50
Total 8.1 35.8 18.6 22.1 15.4 285
CHI SQR p=ns
PAGE 161
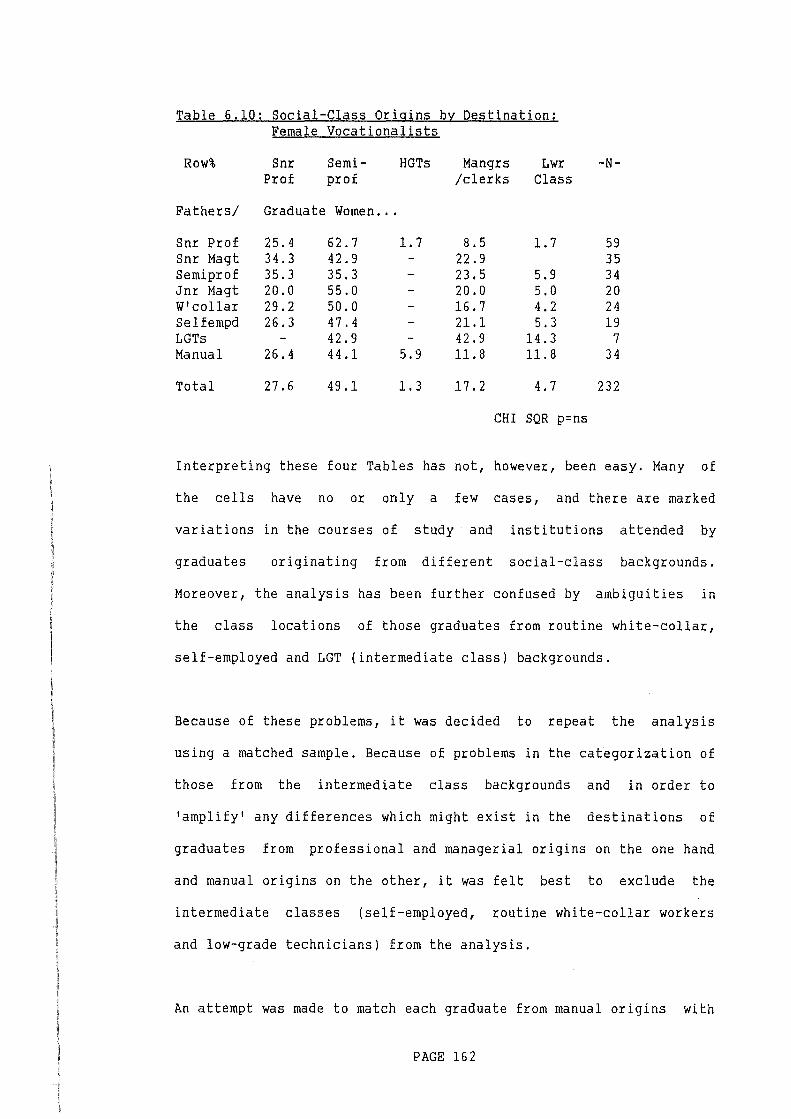
Table 6.10: Social-Class Origins bv Destination: Female Vocationalists
Row% Snr Semi- HGTs Mangrs Lwr -N-Prof prof /clerks Class
Fathers/ Graduate Women ...
Snr Prof 25.4 62.7 1.7 8.5 1.7 59 Snr Magt 34.3 42.9 - 22.9 35 Semipro£ 35.3 35.3 - 23.5 5.9 34 Jnr Magt 20.0 55.0 - 20.0 5.0 20 W' collar 29.2 50.0 - 16.7 4.2 24 Selfempd 26.3 47.4 - 21.1 5.3 19 LGTs - 42.9 - 42.9 14.3 7 Manual 26.4 44.1 5.9 11.8 11.8 34
Total 27.6 49.1 1.3 17.2 4.7 232
CHI SQR p=ns
Interpreting these four Tables has not, however, been easy. Many of
the cells have no or only a few cases, and there are marked
variations in the courses of study and institutions attended by
graduates originating from different social-class backgrounds.
Moreover, the analysis has been further confused by ambiguities in
the class locations of those graduates from routine white-collar,
self-employed and LGT (intermediate class) backgrounds.
Because of these problems, it was decided to repeat the analysis
using a matched sample. Because of problems in the categorization of
those from the intermediate class backgrounds and in order to
'amplify' any differences which might exist in the destinations of
graduates from professional and managerial origins on the one hand
and manual origins on the other, it was felt best to exclude the
intermediate classes (self-employed, routine white-collar workers
and low-grade technicians) from the analysis.
An attempt was made to match each graduate from manual origins with
PAGE 162
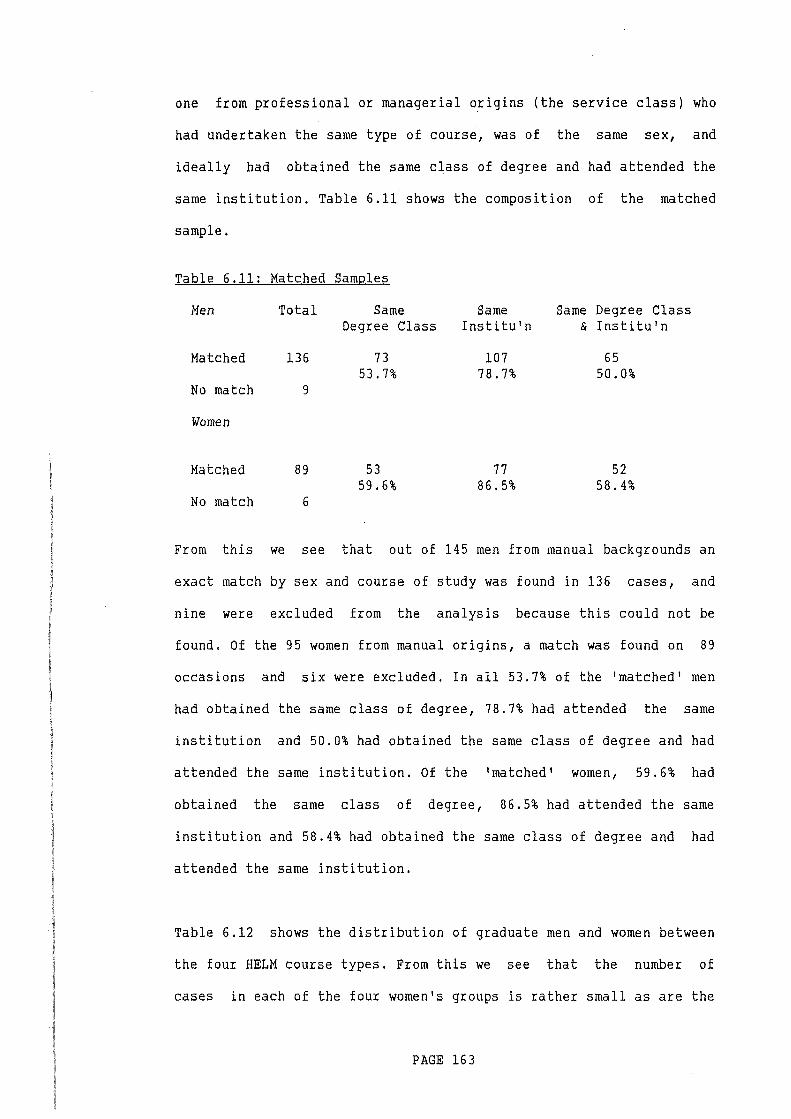
one from professional or managerial origins (the service class) who
had undertaken the same type of course, was of the same sex, and
ideally had obtained the same class of degree and had attended the
same institution. Table 6.11 shows the composition of the matched
sample.
Table 6.11: Matched Samples
Men Total
Matched 136
No match 9
Women
Matched 89
No match 6
Same Degree Class
73 53.7%
53 59.6%
Same Institu'n
107 78.7%
77 86.5%
Same Degree Class & Institu'n
65 50.0%
52 58.4%
From this we see that out of 145 men from manual backgrounds an
exact match by sex and course of study was found in 136 cases, and
nine were excluded from the analysis because this could not be
found. Of the 95 women from manual origins, a match was found on 89
occasions and six were excluded. In all 53.7% of the 'matched' men
had obtained the same class of degree, 78.7% had attended the same
institution and 50.0% had obtained the same class of degree and had
attended the same institution. Of the 'matched' women, 59.6% had
obtained the same class of degree, 86.5% had attended the same
institution and 58.4% had obtained the same class of degree and had
attended the same institution.
Table 6.12 shows the distribution of graduate men and women between
the four HELM course types. From this we see that the number of
cases in each of the four women's groups is rather small as are the
PAGE 163
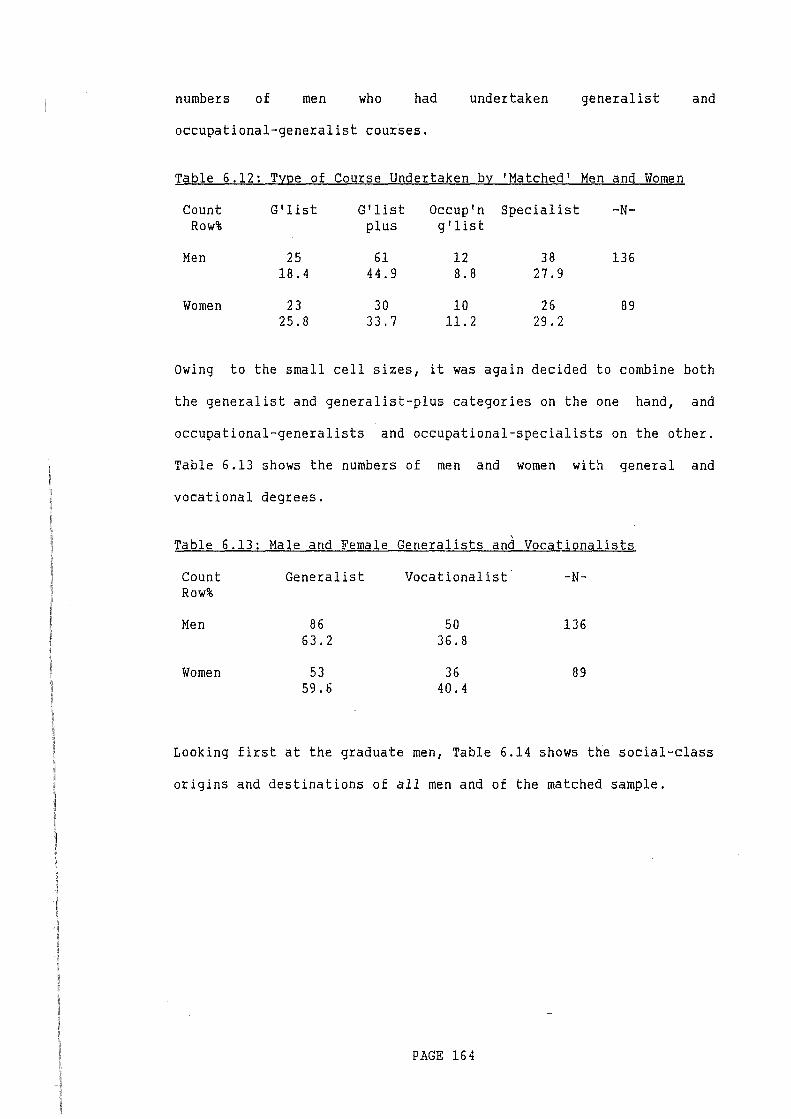
numbers of men who had undertaken generalist and
occupational-generalist courses.
Table 6.12: Type of Course Undertaken by 'Matched' Men and Women
Count G'list G'list Occup'n Specialist -N-Row% plus g'list
Men 25 61 12 38 136 18.4 44.9 8. 8 27.9
Women 23 30 10 26 89 25.8 33.7 11.2 29.2
Owing to the small cell sizes, it was again decided to combine both
the generalist and generalist-plus categories on the one hand, and
occupational-generalists and occupational-specialists on the other.
Table 6.13 shows the numbers of men and women with general and
vocational degrees.
Table 6.13: Male and Female Generalists and Vocationalists
Count Generalist Vocationalist -N-Row%
Men 86 50 136 63.2 36.8
Women 53 36 89 59.6 40.4
Looking first at the graduate men, Table 6.14 shows the social-class
origins and destinations of all men and of the matched sample.
PAGE 164
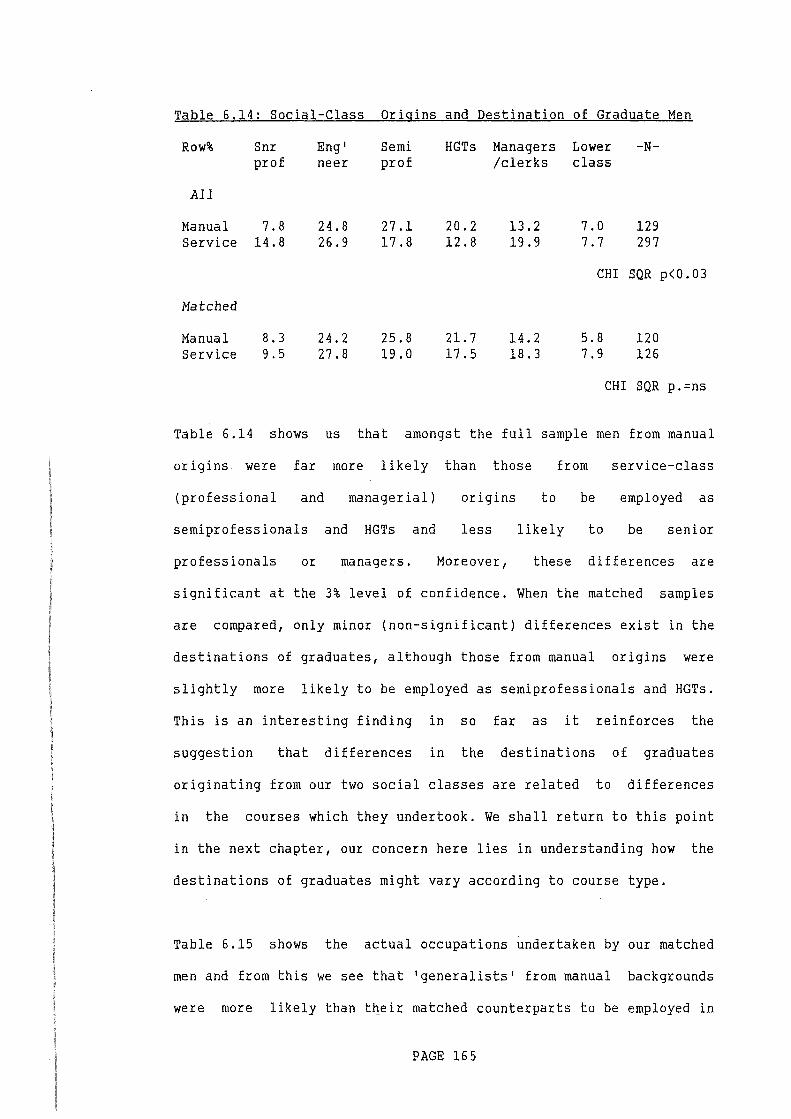
Table 6.14: Social-Class Origins and Destination of Graduate Men
Row%
All
Snr prof
Manual 7.8 Service 14.8
Matched
Manual Service
8.3 9.5
Eng• neer
24.8 26.9
24.2 27.8
Semi prof
27.1 17.8
25.8 19.0
HGTs Managers /clerks
20.2 12.8
21.7 17.5
13.2 19.9
14.2 18.3
Lower class
7.0 7.7
-N-
129 297
CHI SQR p<0.03
5.8 7.9
120 126
CHI SQR p.=ns
Table 6.14 shows us that amongst the full sample men from manual
origins were far more likely than those from service-class
(professional and managerial) origins to be employed as
semiprofessionals and HGTs and less likely to be senior
professionals or managers. Moreover, these differences are
significant at the 3% level of confidence. When the matched samples
are compared, only minor (non-significant) differences exist in the
destinations of graduates, although those from manual origins were
slightly more likely to be employed as semiprofessionals and HGTs.
This is an interesting finding in so far as it reinforces the
suggestion that differences in the destinations of graduates
originating from our two social classes are related to differences
in the courses which they undertook. We shall return to this point
in the next chapter, our concern here lies in understanding how the
destinations of graduates might vary according to course type.
Table 6.15 shows the actual occupations undertaken by our matched
men and from this we see that •generalists' from manual backgrounds
were more likely than their matched counterparts to be employed in
PAGE 165
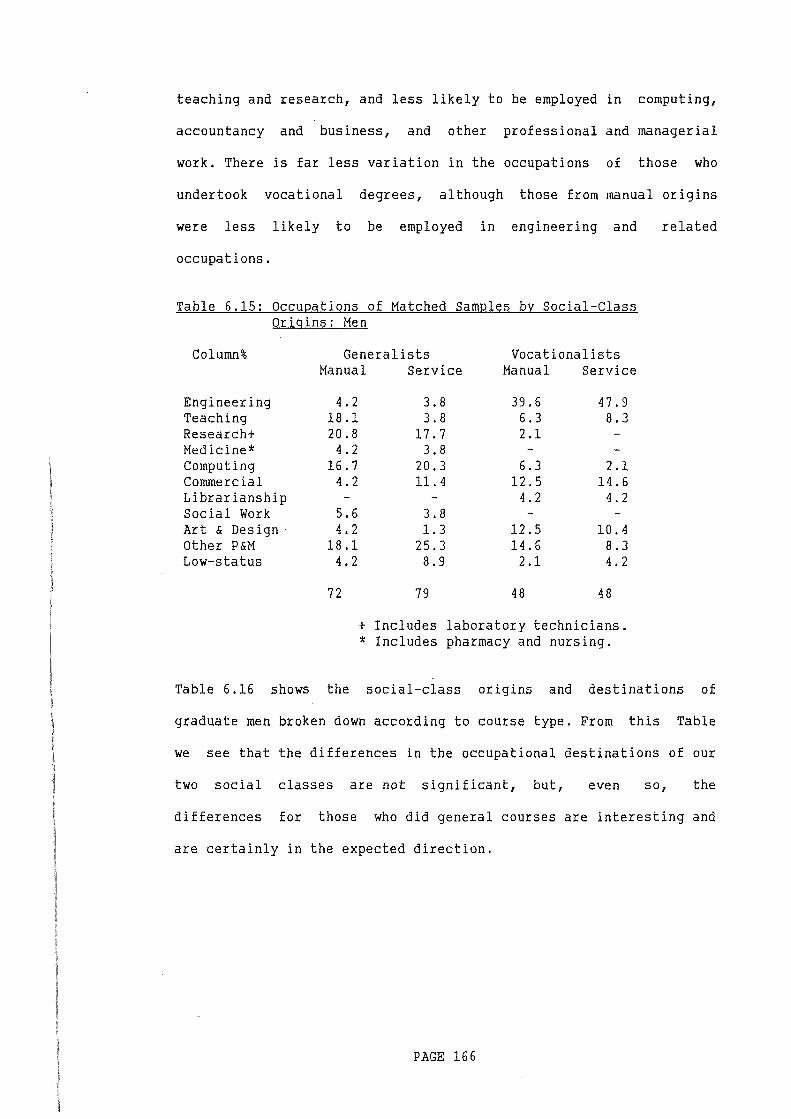
teaching and research, and less likely to be employed in computing,
accountancy and business, and other professional and managerial
work. There is far less variation in the occupations of those who
undertook vocational degrees, although those from manual origins
were less likely to be employed in engineering and
occupations.
Table 6.15: Occupations of Matched Samples by Social-Class Origins: Men
Column%
Engineering Teaching Research+ Medicine* Computing Commercial Librarianship Social Work Art & Design Other P&M Low-status
Generalists Vocationalists Manual Service Manual Service
4. 2 3.8 39.6 47.9 18.1 3.8 6.3 8.3 20.8 17.7 2.1
4.2 3. 8 16.7 20.3 6.3 2.1
4.2 11.4 12.5 14.6 - - 4.2 4.2
5.6 3. 8 4. 2 1.3 12.5 10.4
18.1 25.3 14.6 8.3 4. 2 8.9 2.1 4.2
72 79 48 48
+ Includes laboratory technicians. * Includes pharmacy and nursing.
related
Table 6.16 shows the social-class origins and destinations of
graduate men broken down according to course type. From this Table
we see that the differences in the occupational destinations of our
two social classes are not significant, but, even so, the
differences for those who did general courses are interesting and
are certainly in the expected direction.
PAGE 166
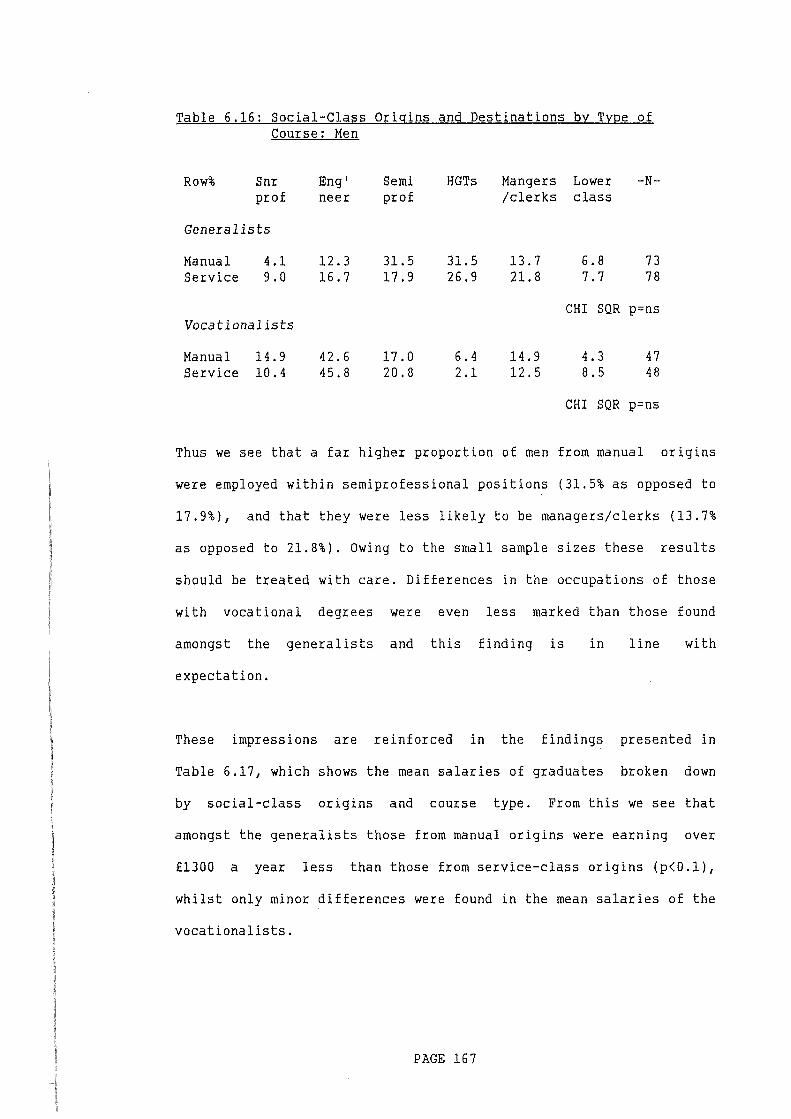
Table 6.16: Social-Class Origins and Destinations by Tyge of Course: Men
Row% Snr Eng' Semi HGTs Mangers Lower -N-prof neer prof /clerks class
Generalists
Manual 4.1 12.3 31.5 31.5 13.7 6.8 73 Service 9.0 16.7 17.9 26.9 21.8 7.7 78
CHI SQR p=ns Vocationalists
Manual 14.9 42.6 17.0 6. 4 14.9 4.3 47 Service 10.4 45.8 20.8 2.1 12.5 8.5 48
CHI SQR p=ns
Thus we see that a far higher proportion of men from manual origins
were employed within semiprofessional positions (31.5% as opposed to
17.9%), and that they were less likely to be managers/clerks (13.7%
as opposed to 21.8%). Owing to the small sample sizes these results
should be treated with care. Differences in the occupations of those
with vocational degrees were even less marked than those found
amongst the generalists and this finding is in line with
expectation.
These impressions are reinforced in the findings presented in
Table 6.17, which shows the mean salaries of graduates broken down
by social-class origins and course type. From this we see that
amongst the generalists those from manual origins were earning over
£1300 a year less than those from service-class origins (p<O.l),
whilst only minor differences were found in the mean salaries of the
vocationalists.
PAGE 167
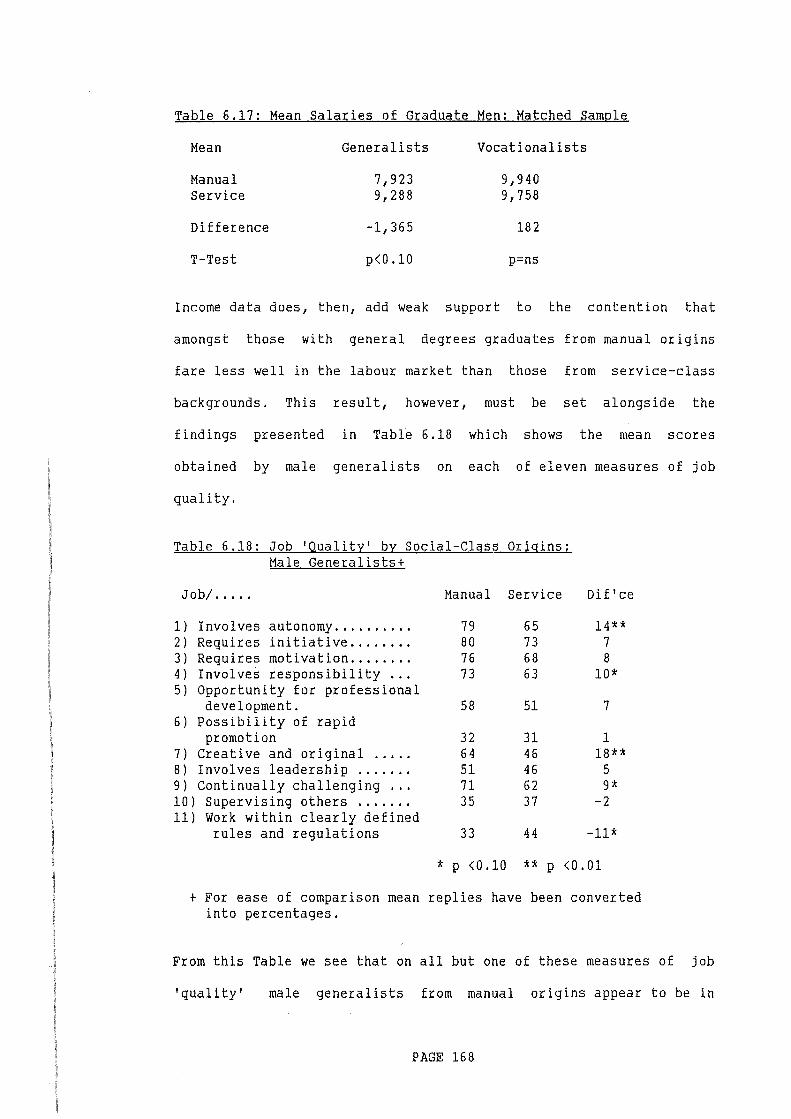
Table 6.17: Mean Salaries of Gradua_te_Men: Matched SamQ.le
Mean Generalists Vocationalists
Manual 7,923 9,940 Service 9,288 9,758
Difference -1,365 182
T-Test p<0.10 p=ns
Income data does, then, add weak support to the contention that
amongst those with general degrees graduates from manual origins
fare less well in the labour market than those from service-class
backgrounds. This result, however, must be set alongside the
findings presented in Table 6.18 which shows the mean scores
obtained by male generalists on each of eleven measures of job
quality.
Table 6.18: Job 'Quality' by Social-Class Origins: Male Generalists+
Job/ ..... Manual Service Dif 'ce
1) Involves autonomy .......... 79 65 14** 2) Requires initiative ........ 80 73 7 3) Requires motivation ........ 76 68 8 4) Involves responsibility ... 73 63 10* 5) Opportunity for professional
development. 58 51 7 6) Possibility of rapid
promotion 32 31 1 7) Creative and original ..... 64 46 18** 8) Involves leadership ....... 51 46 5 9) Continually challenging ... 71 62 9* 10) Supervising others ....... 35 37 -2 11) Work within clearly defined
rules and regulations 33 44 -11*
* p <0.10 ** p <0.01
+ For ease of comparison mean replies have been converted into percentages.
From this Table we see that on all but one of these measures of job
'quality' male generalists from manual origins appear to be in
PAGE 168
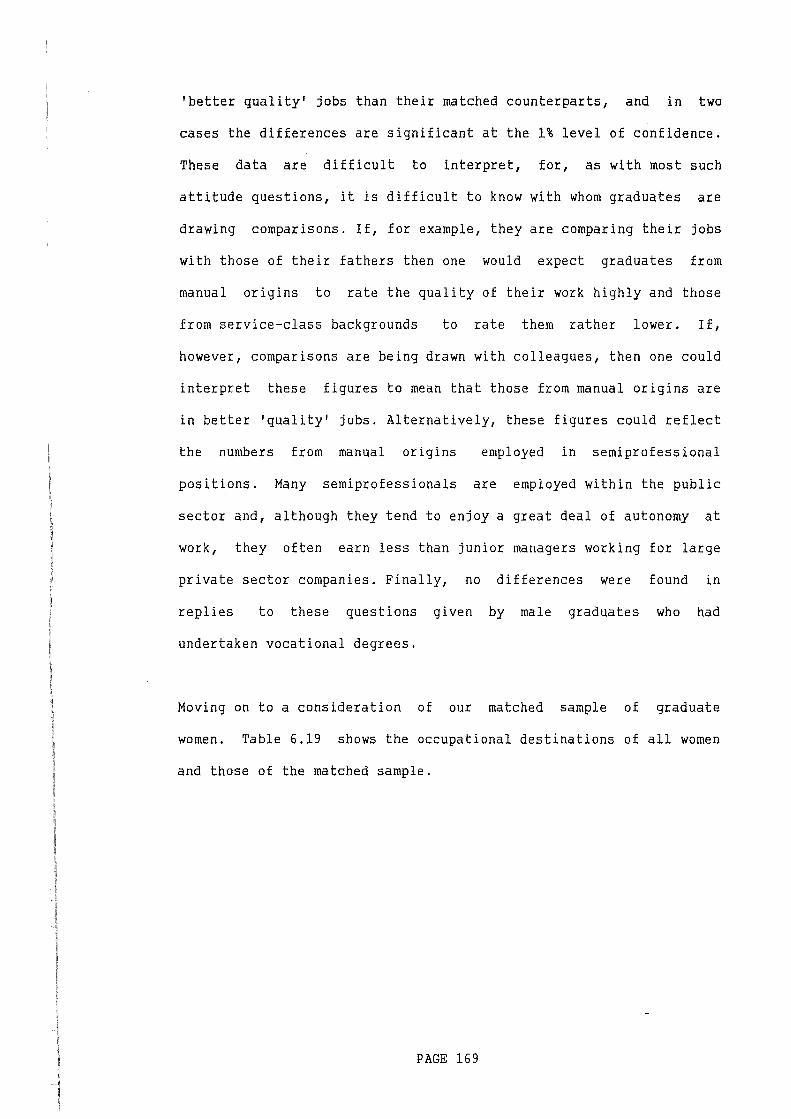
'better quality' jobs than their matched counterparts, and in two
cases the differences are significant at the 1% level of confidence.
These data are difficult to interpret, for, as with most such
attitude questions, it is difficult to know with whom graduates are
drawing comparisons. If, for example, they are comparing their jobs
with those of their fathers then one would expect graduates from
manual origins to rate the quality of their work highly and those
from service-class backgrounds to rate them rather lower. If,
however, comparisons are being drawn with colleagues, then one could
interpret these figures to mean that those from manual origins are
in better 'quality' jobs. Alternatively, these figures could reflect
the numbers from manual origins employed in semiprofessional
positions. Many semiprofessionals are employed within the public
sector and, although they tend to enjoy a great deal of autonomy at
work, they often earn less than junior managers working for large
private sector companies. Finally, no differences were found in
replies to these questions given by male graduates who had
undertaken vocational degrees.
Moving on to a consideration of our matched sample of graduate
women. Table 6.19 shows the occupational destinations of all women
and those of the matched sample.
PAGE 169
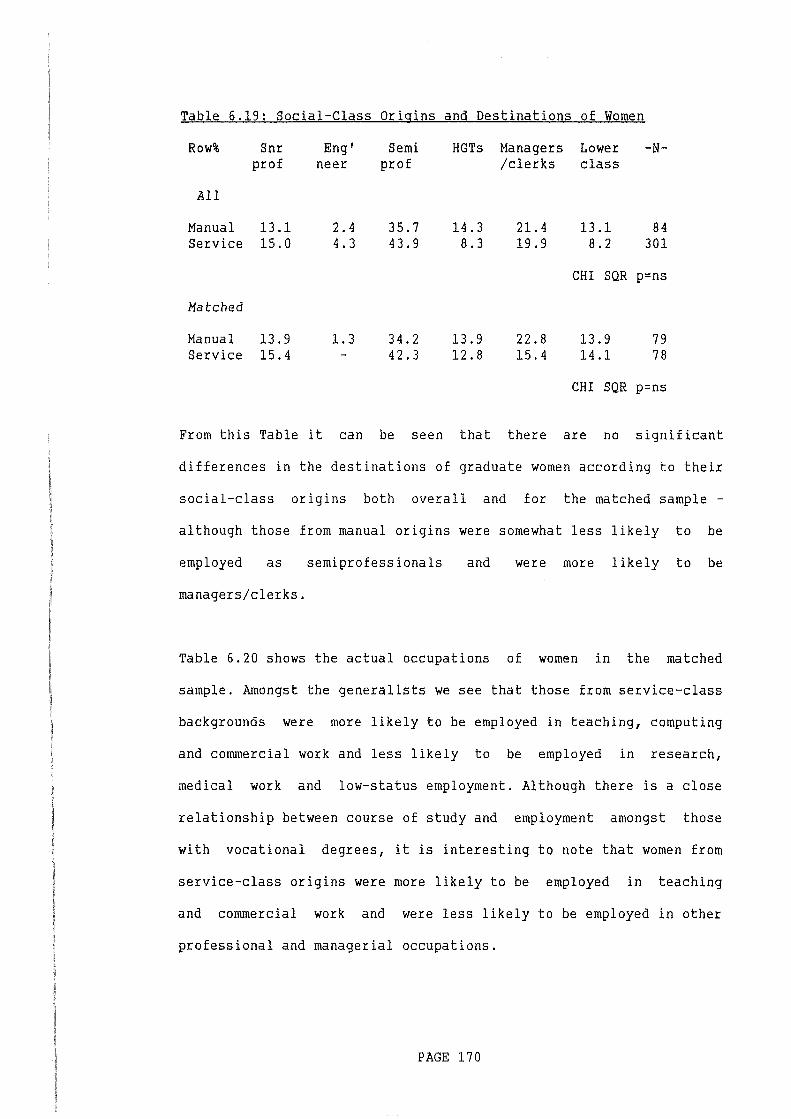
Table 6.19: Social-Class Origins and Destinations of Women
Row%
All
Snr prof
Manual 13.1 Service 15.0
Matched
Manual 13.9 Service 15.4
Eng' neer
2.4 4.3
1.3
Semi prof
35.7 43.9
34.2 42.3
HGTs Managers Lower /clerks class
-N-
14.3 8.3
13.9 12.8
21.4 19.9
22.8 15.4
13.1 8.2
84 301
CHI SQR p=ns
13.9 14.1
79 78
CHI SQR p=ns
From this Table it can be seen that there are no significant
differences in the destinations of graduate women according to their
social-class origins both overall and for the matched sample -
although those from manual origins were somewhat less likely to be
employed as semiprofessionals and were more likely to be
managers/clerks.
Table 6.20 shows the actual occupations of women in the matched
sample. Amongst the generalists we see that those from service-class
backgrounds were more likely to be employed in teaching, computing
and commercial work and less likely to be employed in research,
medical work and low-status employment. Although there is a close
relationship between course of study and employment amongst those
with vocational degrees, it is interesting to note that women from
service-class origins were more likely to be employed in teaching
and commercial work and were less likely to be employed in other
professional and managerial occupations.
PAGE 170
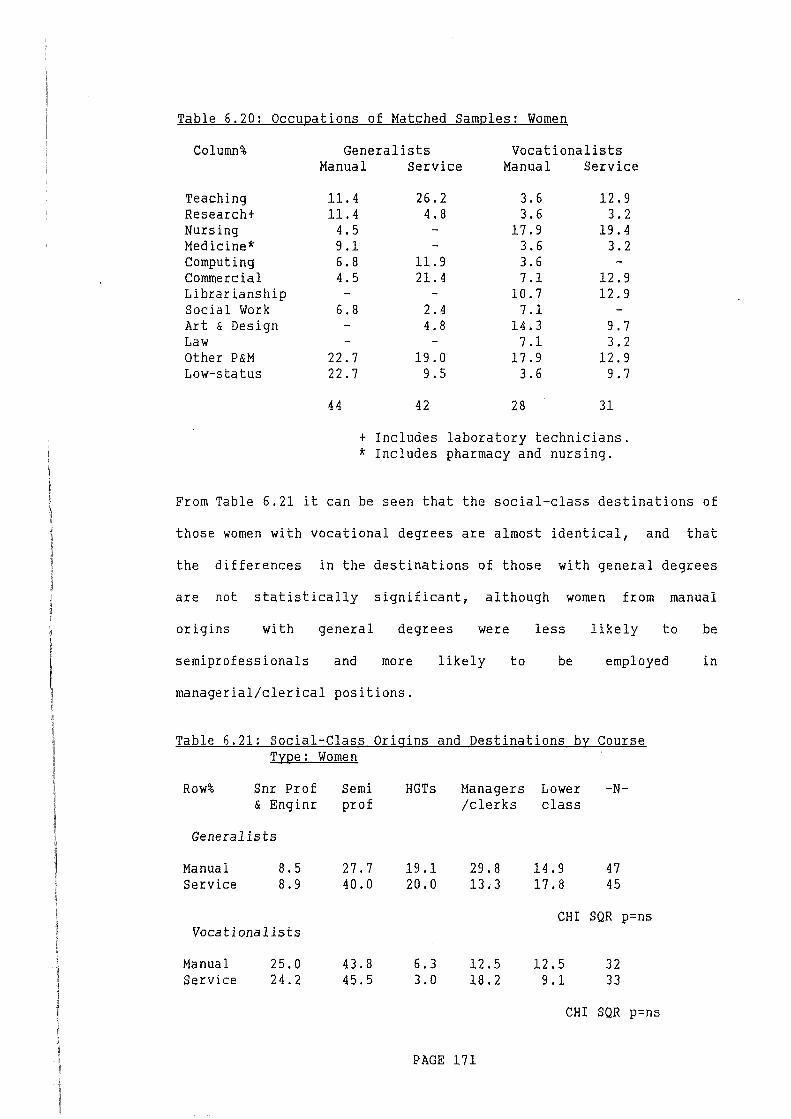
Table 6.20: Occupations of Matched Samples: Women
Column%
Teaching Research+ Nursing Medicine* Computing Commercial Librarianship Social Work Art & Design Law Other P&M Low-status
Generalists Vocationalists Manual Service Manual Service
11.4 26.2 3.6 12.9 11.4 4.8 3.6 3.2
4.5 - 17.9 19.4 9.1 - 3.6 3.2 6.8 11.9 3.6 4.5 21.4 7.1 12.9 - - 10.7 12.9
6.8 2.4 7.1 - 4. 8 14.3 9.7 - - 7.1 3. 2
22.7 19.0 17.9 12.9 22.7 9.5 3.6 9.7
44 42 28 31
+ Includes laboratory technicians. * Includes pharmacy and nursing.
From Table 6.21 it can be seen that the social-class destinations of
those women with vocational degrees are almost identical, and that
the differences in the destinations of those with general degrees
are not statistically significant, although women from manual
origins with general degrees were less likely to
semiprofessionals and more likely to be employed
managerial/clerical positions.
Table 6.21: Social-Class Origins and Destinations by Course Type: Women
Row% Snr Prof & Enginr
Generalists
Manual 8.5 Service 8.9
Vocationalists
Manual 25.0 Service 24.2
Semi prof
27.7 40.0
43.8 45.5
HGTs
19.1 20.0
6.3 3.0
Managers Lower /clerks class
29.8 14.9 13.3 17.8
-N-
47 45
CHI SQR p=ns
12.5 12.5 32 18.2 9.1 33
CHI SQR p=ns
PAGE 171
be
in
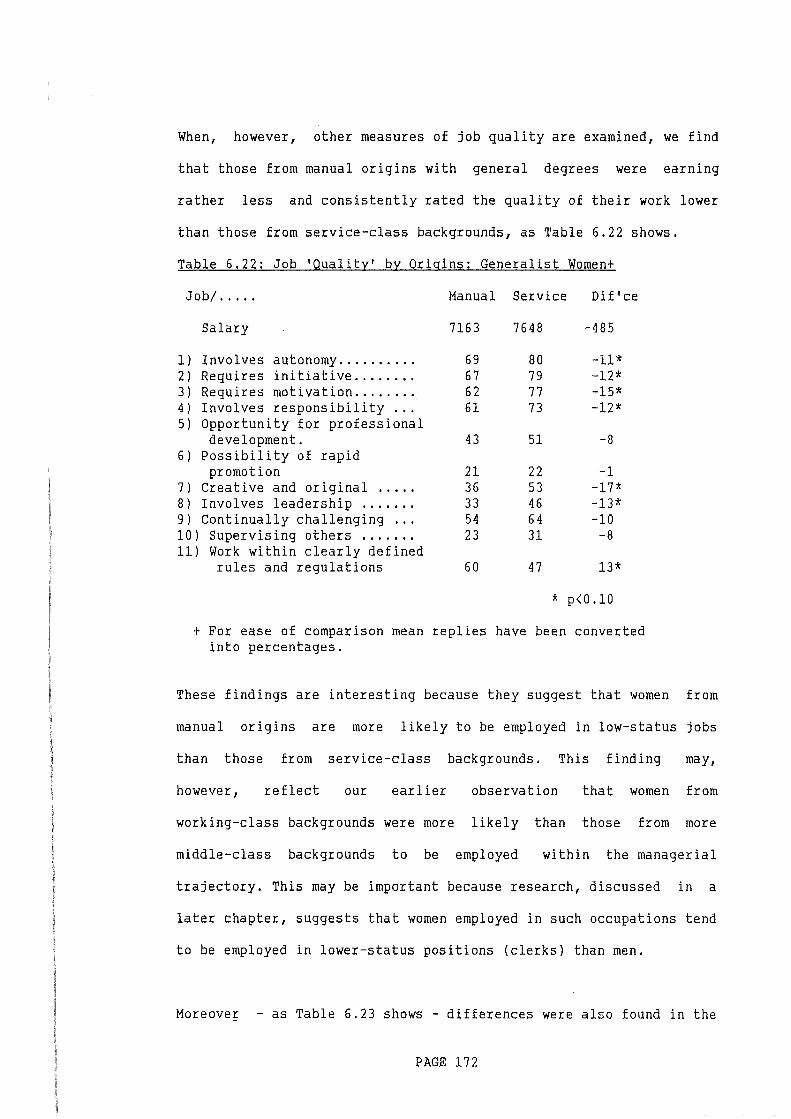
When, however, other measures of job quality are examined, we find
that those from manual origins with general degrees were earning
rather less and consistently rated the quality of their work lower
than those from service-class backgrounds, as Table 6.22 shows.
Table 6.22: Job 'Quality' by Origins: Generalist Women+
Job/ ..... Manual Service Dif'ce
Salary 7163 7648 -485
1) Involves autonomy .......... 69 80 -11* 2) Requires initiative ........ 67 79 -12* 3) Requires motivation ........ 62 77 -15* 4) Involves responsibility ... 61 73 -12* 5) Opportunity for professional
development. 43 51 -8 6) Possibility of rapid
promotion 21 22 -1 7) Creative and original ..... 36 53 -17* 8) Involves leadership ....... 33 46 -13* 9) Continually challenging ... 54 64 -10 10) Supervising others ....... 23 31 -8 11) Work within clearly defined
rules and regulations 60 47 13*
* p<O.lO
+ For ease of comparison mean replies have been converted into percentages.
These findings are interesting because they suggest that women from
manual origins are more likely to be employed in low-status jobs
than those from service-class backgrounds. This finding may,
however, reflect our earlier observation that women from
working-class backgrounds were more likely than those from more
middle-class backgrounds to be employed within the managerial
trajectory. This may be important because research, discussed in a
later chapter, suggests that women employed in such occupations tend
to be employed in lower-status positions (clerks) than men.
Moreover - as Table 6.23 shows -differences were also found in the
PAGE 172
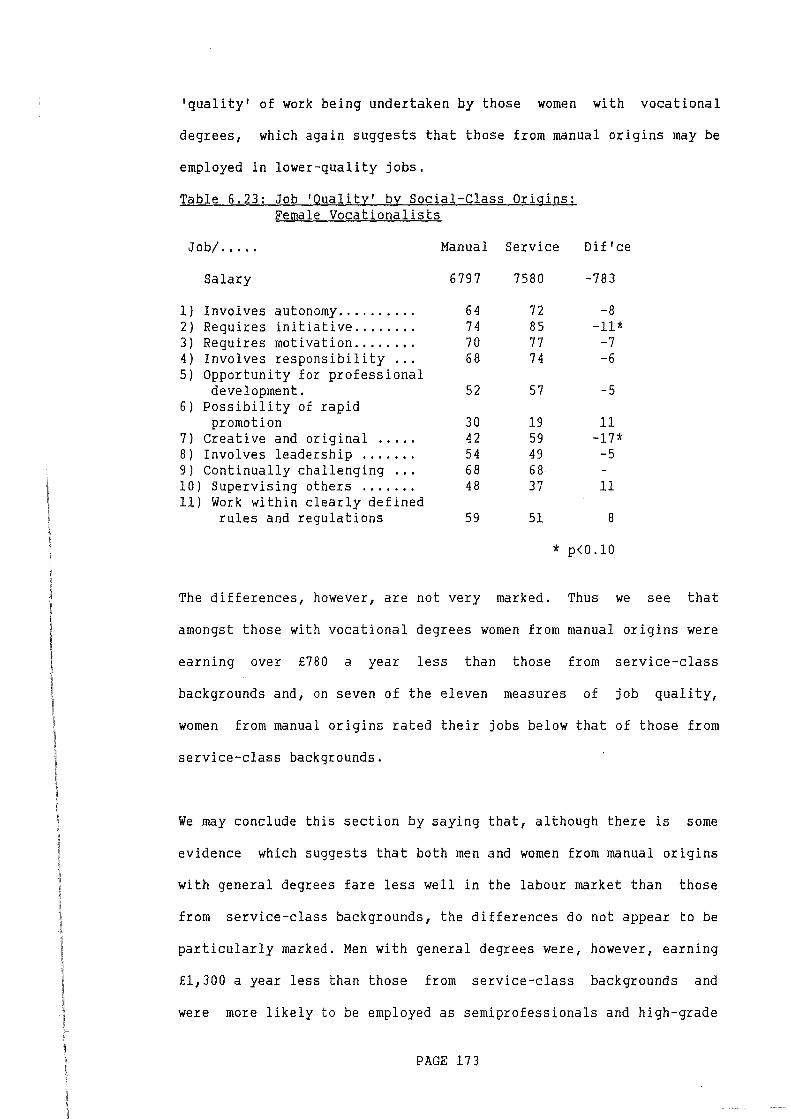
'quality' of work being undertaken by those women with vocational
degrees, which again suggests that those from manual origins may be
employed in lower-quality jobs.
Table 6.23: Job 'Quality' by Social-Class Origins: Female Vocationalists
Job/ ...•. Manual Service Dif'ce
Salary 6797 7580 -783
1) Involves autonomy .......... 64 72 -8 2) Requires initiative ........ 74 85 -11* 3) Requires motivation ........ 70 77 -7 4) Involves responsibility ... 68 74 -6 5) Opportunity for professional
development. 52 57 -5 6) Possibility of rapid
promotion 30 19 11 7) Creative and original ..... 42 59 -17* 8) Involves leadership ....... 54 49 -5 9) Continually challenging ... 68 68 10) Supervising others ....... 48 37 11 11) Work within clearly defined
rules and regulations 59 51 8
* p<O.lO
The differences, however, are not very marked. Thus we see that
amongst those with vocational degrees women from manual origins were
earning over £780 a year less than those from service-class
backgrounds and, on seven of the eleven measures of job quality,
women from manual origins rated their jobs below that of those from
service-class backgrounds.
We may conclude this section by saying that, although there is some
evidence which suggests that both men and women from manual origins
with general degrees fare less well in the labour market than those
from service-class backgrounds, the differences do not appear to be
particularly marked. Men with general degrees were, however, earning
£1,300 a year less than those from service-class backgrounds and
were more likely to be employed as semiprofessionals and high-grade
PAGE 173
technicians and were less likely to be employed as senior
professionals and within the managerial trajectory. Differences in
the social-class destinations of those men with vocational degrees
were comparatively small, and those from manual origins were
actually earning slightly more than those from service-class
backgrounds. Minor and, again, non-significant differences were also
found in the destinations of women differentiated by their
social-class origins. Those from manual origins with general degrees
were, however, more likely to be employed within managerial and
clerical positions and were less likely to be semiprofessionals.
They did, however, consistently rate the 'quality' of their jobs
below that of those from service-class backgrounds. Again, only
minor differences were found in the destinations of women with
vocational degrees. Those from manual origins were, however, earning
less and consistently rated the 'quality' of their work below that
of those from service-class backgrounds.
Trying to discern why such differences exist in the destinations of
our matched samples is difficult as the differences are
comparatively minor and are often within the bounds of statistical
error. If Kelsall et al. (1972) are right, they could be related to
differences in the deliberate occupational choices made by graduates
from the different social classes; if Roizen and Jepson are correct
then they would be due to graduates from manual backgrounds being at
a disadvantage in the recruitment practices adopted by graduate
employers.
The HELM questionnaires did contain a number of questions which
throw some light on to the validity of these two conflicting
PAGE 174
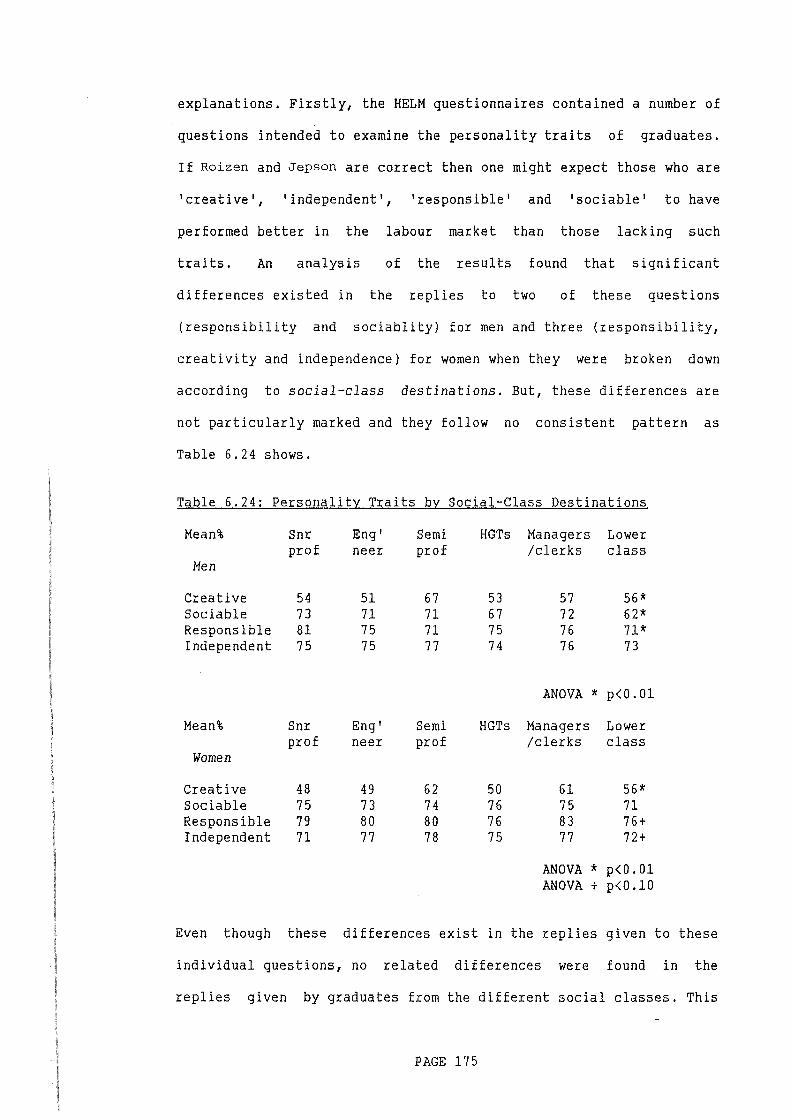
explanations. Firstly, the HELM questionnaires contained a number of
questions intended to examine the personality traits of graduates.
If Roizen and Jepson are correct then one might expect those who are
'creative', 'independent', 'responsible' and 'sociable' to have
performed better in the labour market than those lacking such
traits. An analysis of the results found that significant
differences existed in the replies to two of these questions
(responsibility and sociablity) for men and three (responsibility,
creativity and independence) for women when they were broken down
according to social-class destinations. But, these differences are
not particularly marked and they follow no consistent pattern as
Table 6.24 shows.
Table 6.24: Personality Traits by Social-Class Destinations
Mean% Snr Eng' Semi HGTs Managers Lower prof neer prof /clerks class
Men
Creative 54 51 67 53 57 56* Sociable 73 71 71 67 72 62* Responsible 81 75 71 75 76 71* Independent 75 75 77 74 76 73
ANOVA * p<O.Ol
Mean% Snr Eng' Semi HGTs Managers Lower prof neer prof /clerks class
Women
Creative 48 49 62 50 61 56* Sociable 75 73 74 76 75 71 Responsible 79 80 80 76 83 76+ Independent 71 77 78 75 77 72+
ANOVA * p<O.Ol ANOVA + p<0.10
Even though these differences exist in the replies given to these
individual questions, no related differences were found in the
replies given by graduates from the different social classes. This
PAGE 175
would tend to suggest that Roizen and Jepson are wrong in their view
that graduates from manual origins are lacking in the personality
traits which employers value. However, these questions were
subjective in nature and - as with all such questions - it is
difficult to know to what extent graduates are aware of personality
differences between themselves and other people. In other words,
graduates from manual backgrounds may indeed lack the personality
traits which employers value, but the HELM questionnaires were
unable to trace this.
There is, however, some evidence which supports the approach taken
by Kelsall et al .. Entry to many semiprofessional positions is now
only possible if potential candidates hold a professional
qualification, which in turn requires a period of postgraduate
training. When it is recalled that 31% of male graduates from manual
backgrounds in our matched sample were semiprofessionals compared
with only 17% of those from service-class backgrounds, this clearly
suggests that they have made a conscious decision to follow these
careers. This view is reinforced in Table 6.25, which shows us that
over half the men from manual origins who had undertaken general
degrees and went on to further study , took an educational
qualification (mainly PGCEs) in comparison with only 16.9% of those
from service-class origins, who were more likely to have gone on to
study engineering, business (including law) and farming.
Differences are much less marked amongst the women, and the
relatively high proportion of these who had undertaken business
courses can be explained by the large numbers with secretarial
qualifications.
PAGE 176
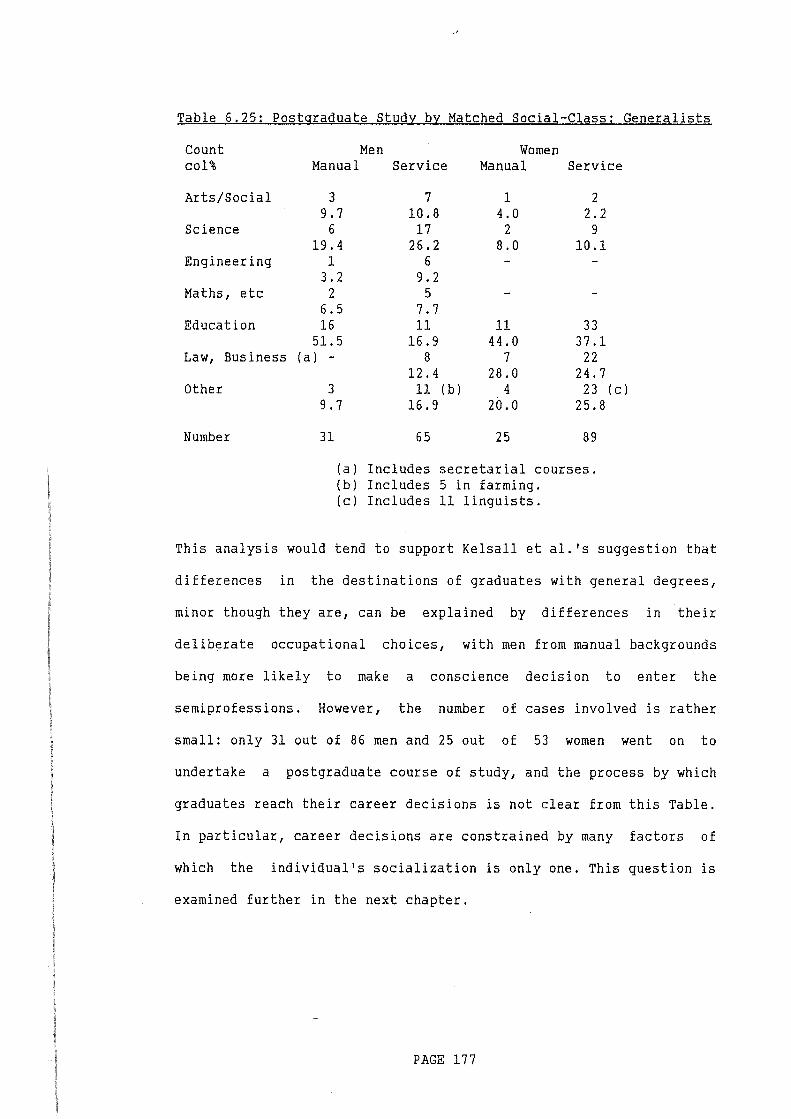
Table 6.25: Postgraduate Study by Matched Social-Class: Generalists
Count Men Women col% Manual Service Manual Service
Arts/Social 3 7 1 2 9.7 10.8 4.0 2.2
Science 6 17 2 9 19.4 26.2 8.0 10.1
Engineering 1 6 3.2 9.2
Maths, etc 2 5 6.5 7.7
Education 16 11 11 33 51.5 16.9 44.0 37.1
Law, Business (a) - 8 7 22 12.4 28.0 24.7
Other 3 11 (b) 4 23 (c) 9.7 16.9 20.0 25.8
Number 31 65 25 89
(a) Includes secretarial courses. (b) Includes 5 in farming. (c) Includes 11 linguists.
This analysis would tend to support Kelsall et al. 's suggestion that
differences in the destinations of graduates with general degrees,
minor though they are, can be explained by differences in their
deliberate occupational choices, with men from manual backgrounds
being more likely to make a conscience decision to enter the
semiprofessions. However, the number of cases involved is rather
small: only 31 out of 86 men and 25 out of 53 women went on to
undertake a postgraduate course of study, and the process by which
graduates reach their career decisions is not clear from this Table.
In particular, career decisions are constrained by many factors of
which the individual's socialization is only one. This question is
examined further in the next chapter.
PAGE 177
Conclusion
The HELM data has been analysed in this chapter in terms of various
approaches which suggest that the graduate labour market is
differentiated into a number of distinct fragments. Considerable
support has been found for Brennan and McGeever's contention that
graduates with specialist skills tend to be more successful in the
labour market than those with more general degrees. In order to test
the contention that the relationship which might exist between the
social-class origins and destinations of graduates is more marked
amongst those with generally-orientated degrees than amongst those
with vocationally-orientated degrees, their performances, were
examined by using matched samples. Analysis of the resulting data
for men showed that, whilst no statistically significant
relationship existed between the social-class origins and
destinations of those with vocational degrees, a weak relationship
was found to exist amongst those with general degrees, which,
although not statistically significant, was in the expected
direction. No such relationship was found to exist between the two
groups of women, although those from manual origins with general
degrees consistently rated the quality of their work below that of
those from service-class backgrounds. Further analysis of the data
for men failed to find any support for Roizen and Jepson's claim
(1985) that graduates from manual origins might be lacking in those
personality traits which employers value. More than half the men
with general degrees who went on to further study did a teacher
training course, and this can be taken as indirect evidence that
their aspirations may differ from those from more middle-class
backgrounds.
PAGE 178

In the next chapter the process by which graduates came to undertake
their courses is examined. This is important because, as will be
shown, graduates from working-class origins had a distinct tendency
to undertake those courses which had relatively poor employment
outcomes.
PAGE 179
CHAPTER SEVEN: CHOICE OF COURSE AND ENTRY INTO HIGHER EDUCATION.
From the discussion in previous chapters it should be clear to the
reader that Britain's system of higher education is now playing an
increasingly important role in the training of highly-skilled
manpower for industry and commerce, and is also an important avenue
of social mobility. The degree to which graduates are likely to be
successful in the labour market has, however, been shown to be
stron0ly related to the courses which they undertook as students,
such that those who studied the more vocationally-orientated
subjects (specialists and occupational-generalists) tended to be
more successful than others (see Tables 6.5 and 6.6). Moreover, it
was demonstrated in the last chapter that, although a weak
relationship exists between the social-class origins and
destinations of graduates, much of the variance disappears once
controls are introduced for the type of course undertaken. This
would tend to suggest that graduates originating from working-class
backgrounds might have a tendency to undertake those courses which
have the poorer employment outcomes, and, to the extent that this is
so, this, in turn, suggests that the process by which students enter
higher education and choose their courses of study is important if
one is to fully understand the various ways in which lhey might be
disadvantaged in the labour market. It is to a consideration of this
matter that we turn our attention in this chapter. In Part One the
courses undertaken by graduates are examined, differentiated
according to their social-class origins. Part Two focuses upon the
PAGE 180
reasons which graduates gave for entering higher education.
Part Three interrupts the
the relationship which exists
employment destinations. In
main sequence of the chapter to examine
between the school curriculum and
Part Four it is argued that, although
people are free to choose which courses to undertake in higher
education, that choice is strongly constrained by their upbringing
and secondary education. In Part Five our findings are analysed
using the model of sponsorship mobility developed by Turner (1960).
Finally, in Part Six, we return to our initial analysis of the
courses undertaken by graduates.
Part One: Courses of Study
We begin with the courses of study undertaken by graduates,
differentiated according to their social-class origins. It can be
seen from Table 7.1 that graduate men from manual backgrounds were,
as was suggested earlier, the least likely to have undertaken
vocationally-orientated (specialist and occupational general)
subjects, whilst those from LGT backgrounds were the most likely to
have done so. Differences are also evident in the subjects
undertaken by the middle-class groups, with those from the two
professional classes and the self-employed being the most likely to
have undertaken a vocationally-orientated course. Moreover, these
diffP.rences are statistically significant. Amongst the women there
are no significant differences in the types of course undertaken. It
is, however, interesting to note that those from senior professional
backgrounds were by far the most likely to have undertaken a
specialist course and those from junior managerial backgrounds were
the least likely to have done so.
PAGE 181
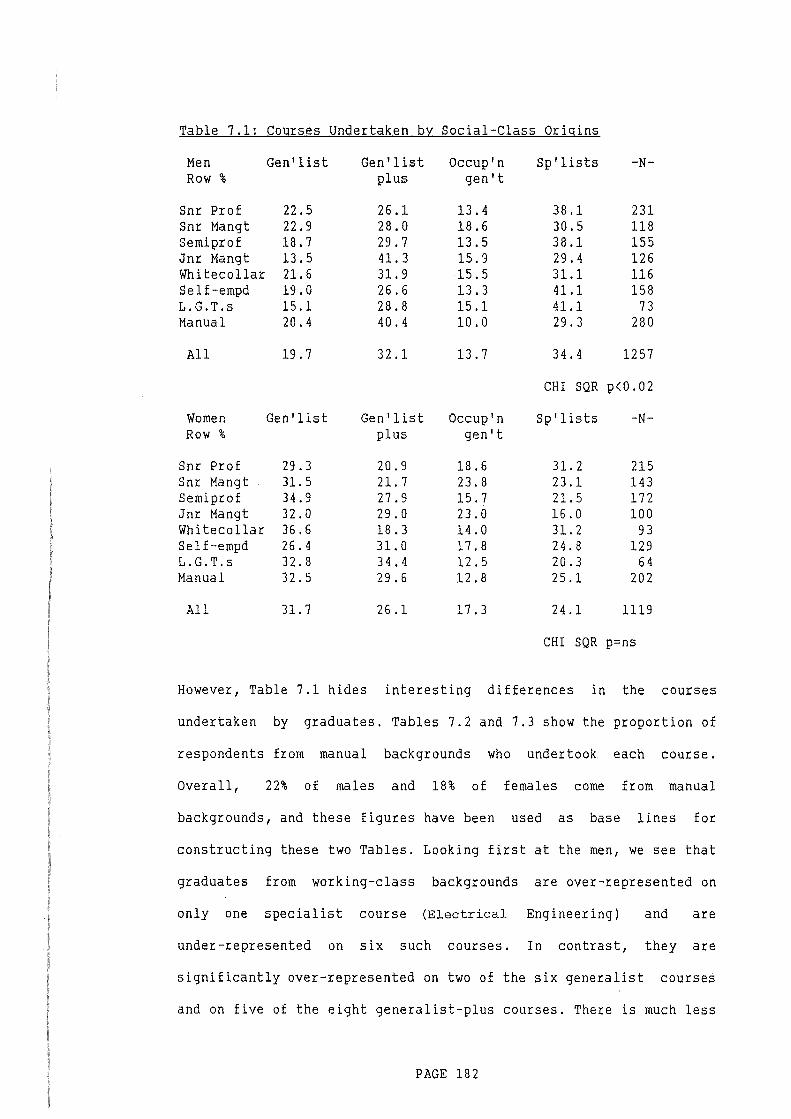
Table 7.1: Courses Undertaken by Social-Class Origins
Men Gen' list Gen' list Occup'n Sp'lists -N-Row % plus gen't
Snr Prof 22.5 26.1 13.4 38.1 231 Snr Mangt 22.9 28.0 18.6 30.5 118 Semipro£ 18.7 29.7 13.5 38.1 155 Jnr Mangt 13.5 41. 3 15.9 29.4 126 Whi tecollar 21.6 31.9 15.5 31.1 116 Self-empd 19.0 26.6 13.3 41.1 158 L.G.T.s 15.1 28.8 15.1 41.1 73 Manual 20.4 40.4 10.0 29.3 280
All 19.7 32.1 13.7 34.4 1257
CHI SQR p<0.02
Women Gen'list Gen'list Occup'n Sp'lists -N-Row % plus gen't
Snr Prof 29.3 20.9 18.6 31.2 215 Snr Mangt 31.5 21. 7 23.8 23.1 143 Semi prof 34.9 27.9 15.7 21.5 172 Jnr Mangt 32.0 29.0 23.0 16.0 100 Whi tecollar 36.6 18.3 14.0 31.2 93 Self-empd 26.4 31.0 17.8 24.8 129 L.G.T.s 32.8 34.4 12.5 20.3 64 Manual 32.5 29.6 12.8 25.1 202
All 31.7 26.1 17.3 24.1 1119
CHI SQR p=ns
However, Table 7.1 hides interesting differences in the courses
undertaken by graduates. Tables 7.2 and 7.3 show the proportion of
respondents from manual backgrounds who undertook. each course.
Overall, 22% of males and 18% of females come from manual
backgrounds, and these figures have been used as base lines for
constructing these two Tables. Looking first at the men, we see that
graduates from working-class backgrounds are over-represented on
only one specialist course (Electrical Engineering) and are
under-represented on six such courses. In contrast, they are
significantly over-represented on two of the six generalist courses
and on five of the eight generalist-plus courses. There is much less
PAGE 182
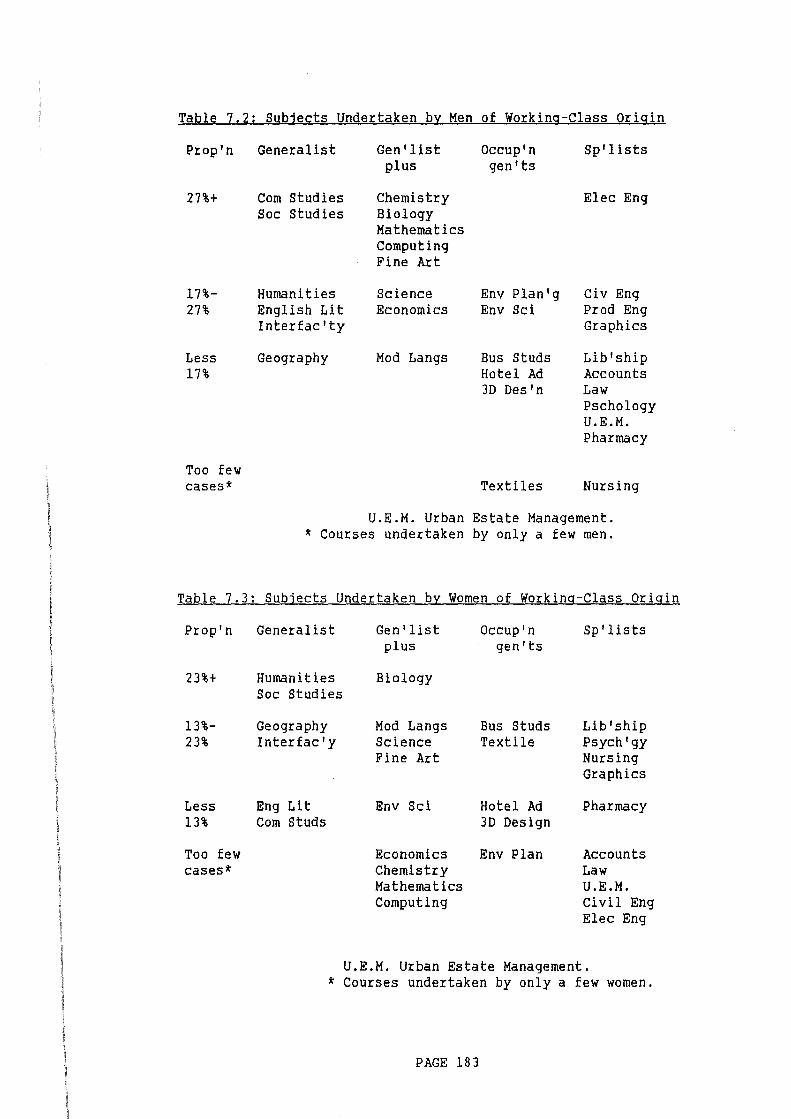
Table 7.2: Subjects Undertaken by Men of Working-Class Origin
Prop'n
27%+
17%-27%
Less 17%
Too few cases*
Generalist
Com Studies Soc Studies
Humanities English Lit Interfac'ty
Geography
Gen' list plus
Chemistry Biology Mathematics Computing Fine Art
Science Economics
Mod Langs
Occup'n gen'ts
Env Plan'g Env Sci
Bus Studs Hotel Ad 3D Des'n
Textiles
Sp'lists
Elec Eng
Civ Eng Prod Eng Graphics
Lib'ship Accounts Law Pschology U.E.M. Pharmacy
Nursing
U.E.M. Urban Estate Management. * Courses undertaken by only a few men.
Table 7.3: Subjects Undertaken by Women of Working-Class Origin
Prop'n Generalist Gen'list Occup'n Sp'lists plus gen'ts
23%+ Humanities Biology Soc Studies
13%- Geography Mod Langs Bus Studs Lib'ship 23% Interfac'y Science Textile Psych'gy
Fine Art Nursing Graphics
Less Eng Lit Env Sci Hotel Ad Pharmacy 13% Com Studs 3D Design
Too few Economics Env Plan Accounts cases* Chemistry Law
Mathematics U.E.M. Computing Civil Eng
Elec Eng
U.E.M. Urban Estate Management. * Courses undertaken by only a few women.
PAGE 183
variation in the proportion of women from manual backgrounds who
undertook each type of course, although they are over-represented on
none of the occupationally-general and specialist courses.
The tendency of graduates from working-class origins to undertake
those courses which have poorer employment outcomes is interesting
and requires further examination.
Part Two: Motives for Entering Higher Education
Educationalists and occupational choice theorists have advanced
three basic explanations as to why people enter higher education
(see Cohen, 1970; Dole, 1970; Harrison et al., 1977, Hansgert, 1985;
Jones, 19 79). These are the instrumental or economic, the
expressive or maturation and the fortuitous. In the instrumental
approach, people are seen as basing their educational decisions upon
occupational considerations (Ginzberg et al., 1951; Blau et al.,
1956), that is, they first decide upon a particular career and,
having done so, they enter higher education in order to underLake a
vocational course which will allow them to enter that career. In the
expressive approach, higher education is valued for its own sake and
the experience of higher education (both academic and social) is
believed to contribute to the individual's well-being. In the
fortuitous approach, entry into higher education is seen as a part
of a process over which the individual has little control and in
which school, family, friends and wider socializing influences are
seen as channelling people along a 'path' which leads them into it
(Katz and Martin, 1962).
PAGE 184
Each of these approaches contains an element of truth. Our concern
lies in understanding how the decision to enter higher education may
vary between social groups. It seems intuitively reasonable to argue
that young people from working-class origins will be more
instrumental in their reasons for entering higher education and will
view it in terms of its vocational relevance. It is argued (see
Donaldson, 1975: 75-82) that since working-class families, tend to
be poorer than middle-class families they are less likely to view
higher education as an end in itself (i.e. in terms of maturation)
and more likely to value it in terms of its potential economic
benefits.
Donaldson (1975: 77-82) in his own study and review of relevant
literature has found little support for the contention that students
from working-class origins are more likely to value higher education
because of its potential economic benefits. Indeed, work by Abbott
( 1971: 188-9) and Kelsall et al. ( 1972: 71-80) suggests that
students and graduates from middle-class backgrounds may actually be
more influenced by career considerations than those from
working-class backgrounds. However, the differences which they
obtained were not very significant and were well within the range of
statistical error. Similarly Donaldson (p. 82-4) found no existing
relationship between social-class origins and students' perceptions
of the binary system which led him to conclude that 1 •• the middle
class have instrumental and calculative orientations towards higher
education of a similar sort to those of the working class'.
Unfortunately, for us, HELM respondents were not specifically asked
PAGE 185
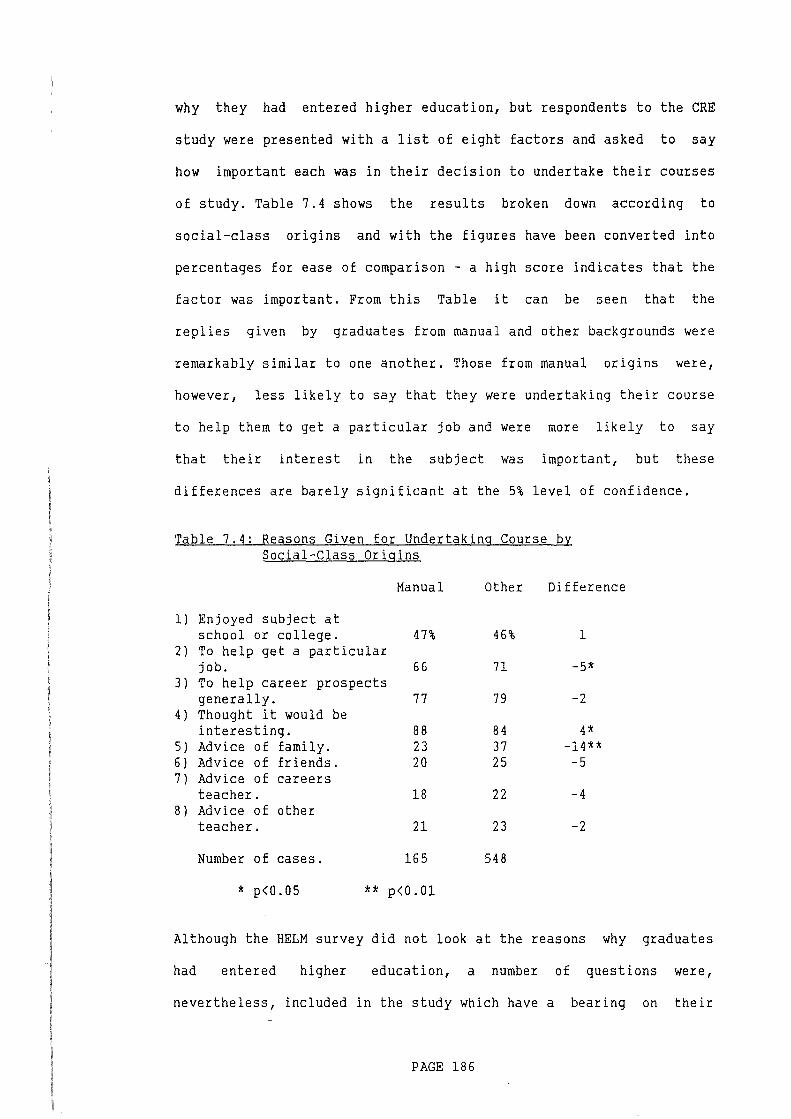
why they had entered higher education, but respondents to the CRE
study were presented with a list of eight factors and asked to say
how important each was in their decision to undertake their courses
of study. Table 7.4 shows the results broken down according to
social-class origins and with the figures have been converted into
percentages for ease of comparison - a high score indicates that the
factor was important. From this Table it can be seen that the
replies given by graduates from manual and other backgrounds were
remarkably similar to one another. Those from manual origins were,
however, less likely to say that they were undertaking their course
to help them to get a particular job and were more likely to say
that their interest in the subject was important, but these
differences are barely significant at the 5% level of confidence.
Table 7.4: Reasons Given for Undertaking Course by Social-Class Origins
Manual Other Difference
1) Enjoyed subject at school or college. 47% 46% 1
2) To help get a particular job. 66 71 -5*
3) To help career prospects generally. 77 79 -2
4) Thought it would be interesting. 88 84 4*
5) Advice of family. 23 37 -14** 6) Advice of friends. 20 25 -5 7) Advice of careers
teacher. 18 22 -4 8) Advice of other
teacher. 21 23 -2
Number of cases. 165 548
* p<O.OS ** p<0.01
Although the HELM survey did not look at the reasons why graduates
had entered higher education, a number of questions were,
nevertheless, included in the study which have a bearing on their
PAGE 186
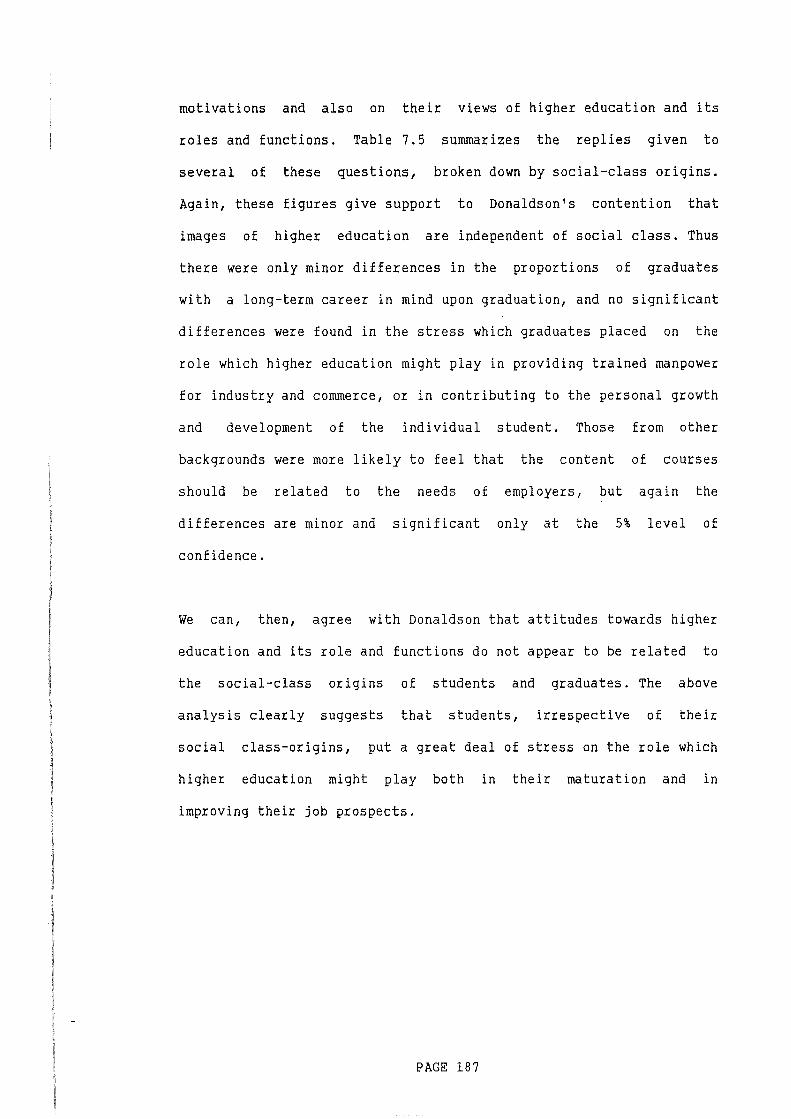
motivations and also on their views of higher education and its
roles and functions. Table 7.5 summarizes the replies given to
several of these questions, broken down by social-class origins.
Again, these figures give support to Donaldson's contention that
images of higher education are independent of social class. Thus
there were only minor differences in the proportions of graduates
with a long-term career in mind upon graduation, and no significant
differences were found in the stress which graduates placed on the
role which higher education might play in providing trained manpower
for industry and commerce, or in contributing to the personal growth
and development of the individual student. Those from other
backgrounds were more likely to feel that the content of courses
should be related to the needs of employers, but again the
differences are minor and significant only at the 5% level of
confidence.
We can, then, agree with Donaldson that attitudes towards higher
education and its role and functions do not appear to be related to
the social-class origins of students and graduates. The above
analysis clearly suggests that students, irrespective of their
social class-origins, put a great deal of stress on the role which
higher education might play both in their maturation and in
improving their job prospects.
PAGE 187
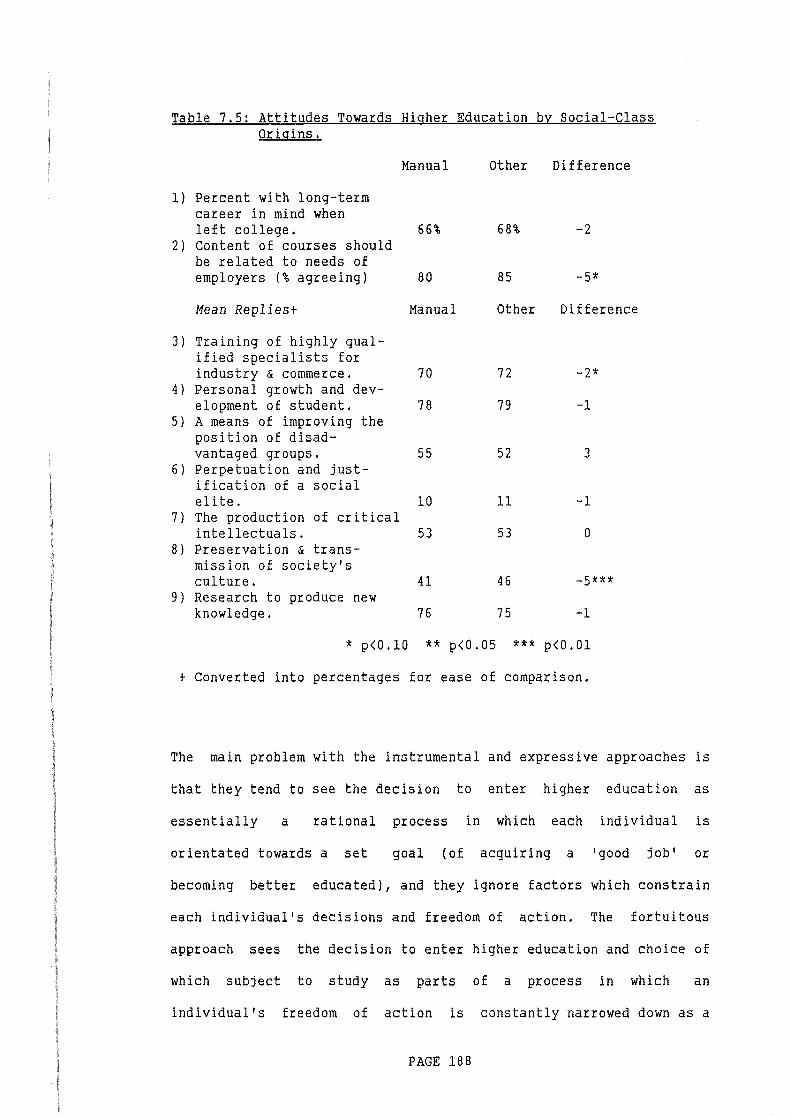
Table 7.5: Attitudes Towards Higher Education by Social-Class Origins.
1) Percent with long-term career in mind when
Manual
left college. 66% 2) Content of courses should
be related to needs of employers (% agreeing) 80
Mean Replies+ Manual
3) Training of highly qual-ified specialists for industry & commerce. 70
4) Personal growth and dev-elopment of student. 78
5) A means of improving the position of disad-vantaged groups. 55
6) Perpetuation and justification of a social elite. 10
7) The production of critical intellectuals. 53
8) Preservation & transmission of society's
Other Difference
68% -2
85 -5*
Other Difference
72 -2*
79 -1
52 3
11 -1
53 0
culture. 41 46 -5*** 9) Research to produce new
knowledge. 76 75 -1
* p<O.lO ** p<0.05 *** p<O.Ol
t Converted into percentages for ease of comparison.
The main problem with the instrumental and expressive approaches is
that they tend to see the decision to enter higher education as
essentially a rational process in which each individual is
orientated towards a set goal (of acquiring a 'good job' or
becoming better educated), and they ignore factors which constrain
each individual's decisions and freedom of action. The fortuitous
approach sees the decision to enter higher education and choice of
which subject to study as parts of a process in which an
individual's freedom of action is constantly narrowed down as a
PAGE 188

result of prior decisions (see Harrison et al., 1977; Pavalko,
1971). Thus, in this approach, student choice over which subject to
study in higher education is constrained by entry qualifications
which in turn are constrained by choice of which subjects to study
at secondary school. Moreover, few children are free to choose which
subjects to study at school, and the curriculum which each pupil
studies is strongly influenced by many factors (type of school
attended, the attitudes of teachers and parents, etc.) over which
he/she has little control. We return to this point later in the
chapter when it is argued that, for a number of reasons, students
originating from working-class households tend to be channelled by
the educational system and the school curriculum into those courses
which tend to have the poorest employment outcomes.
Part Three: School Curriculum and Employment Destinations
In order to explain why the school curriculum is important, it is
first necessary to show how the occupational and social-class
destinations of graduates vary according to their secondary
education. School attended and standard entry qualifications tell us
little about the secondary education of graduates. As Neave (1976:
42-3) points out, there is much variation in what are termed
'grammar', 'comprehensive', 'high' and 'fee-paying' schools. In some
authorities comprehensive schools are called 'high schools' and in
others 'grammar schools'. In some instances (for example Kent) the
old bipartite system still exists and their grammar schools take a
selective intake, and some grammar schools are fee-paying. Moreover,
the type of school attended tells us little about the curriculum
undertaken by graduates before they entered higher education. Some
PAGE 189

comprehensive schools are streamed and children are taught a
curriculum based upon their perceived level of ability.
In view of these problems, it was decided to ignore the actual
school attended and in the following analysis use is made of a
constructed variable which differentiates graduates on the basis of
their school curriculum. A number of writers (eg Lawton, 1975;
Eggleston, 1977; Goodson, 1983) have pointed to the existence of two
distinct traditions which have influenced the curriculum taught in
English schools. These are labelled, by Goodson, (1983: 27) the
'academic' and the 'utilitarian'. Historically the origins of these
two curriculums have lain in the twin origins of secondary education
in England, based upon the public/grammar schools on the one hand,
which tended to teach an academic range of subjects to children
originating from the upper and middle classes, and upon the
elementary school on the other hand, which taught a more practical
curriculum to working-class children (Goodson, 1983: 16-8; Lawson
and Silver, 1973). The academic curriculum consisted of a limited
number of subjects (for example Mathematics, Latin, French, History,
Geography, etc.) which were highly valued by the universities (Reid,
1972: 50). It aimed to instil into children the ability to think in
abstract terms and manipulate concepts in such a way as would fit
them for employment within white-collar occupations and the
professions. In sharp contrast, the utilitarian curriculum was far
more practical in orientation and concentrated on instilling into
children skills which would be useful to them in undertaking manual
and, for girls, domestic work. To a large extent the existence of
these two curriculums was sanctioned in the late 1940s by many local
authorities when they introduced the tripartite system of secondary
PAGE 190

education, and - in spite of the establishment of comprehensive
schools in the 1960s and 70s - a similar division still exists
within many schools today (Reid, 1972; Goodson, 1983).
Before discussing how the variable was constructed, it should be
mentioned that schools in Britain have tended not to teach subjects
of a strictly technical nature aimed at specific careers. Such
teaching has tended to be undertaken in technical colleges and has
consisted of business, engineering and craft-apprenticeship courses
often taught on a day- or block-release basis at ONC, HNC and B/TEC
level. Because many HELM graduates had such qualifications it was
necessary to make allowances for them in constructing the 'measure'.
The procedure adopted was first to code all passes at GCE 0- and
A-level, CSE and their Scottish equivalents according to the schema
discussed in Appendix A. The literature relating to the school
curriculum, discussed above, was then examined and a group of
seventeen GCE-level subjects was then chosen as forming the basis of
the academic curriculum- see Table 7.6.
Table 7.6: Academic Subjects
English Language English Literature Welsh/Gaelic French German Other Modern Language Latin/Greek History (b) Religious Studies (c)
Geography Mathematics Other Mathematics (a) Physics Chemistry Biology Economics Human Biology
(a) Includes pure mathematics and statistics. (b) Excludes economic and social history. (c) Christian religion only, excludes Islam and Hinduism.
It should be stressed that since the aim was to construct a variable
PAGE 191
capable of measuring differences in the curriculum taught to
children at secondary school, it was decided to deviate from the
normal practice of categorizing a CSE grade 1 pass as equivalent to
a GCE 0-level, and all CSE passes were categorized in the same way.
Where respondents had two or more passes in the same subject (eg CSE
and GCE A-level) only the higher pass was coded. The variable was
then constructed as follows: a) those graduates with no examination
passes, those with passes in CSEs only, and those with five or fewer
GCE passes in academic subjects were classified as having undertaken
a utilitarian curriculum; b) those with eight or more GCE passes in
academic subjects were classified as having undertaken an academic
curriculum; c) those with ONCs, HNCs, B/TECs etc. were classified as
having undertaken a technical curriculum irrespective of what other
examinations they had taken; and d) those who had undertaken a broad
range of academic and utilitarian subjects, and who lacked a
technical qualification as in 'c' above, were classified as having
undertaken a mixed curriculum.
Looking ahead to Table 7.13 it can be seen that our curriculum
variable does appear to differentiate graduates on the basis of
their secondary education. In particular we see that 51.5% of men
and 47.3% of women who had studied a utilitarian curriculum had
attended non-selective (secondary modern and comprehensive) schools
and they were the most likely to be non-standard entrants. Men and
women with technical curriculums were the most likely to have
attended a college of further education and those with an academic
curriculum were the most likely to have started their degree courses
straight after leaving school.
PAGE 192

Table 7.7 shows the proportions of men and women who had undertaken
these four types of curriculum.
Table 7.7: Type of Curriculum by Gender
Col%
Utilitarian Mixed Academic Technical
Number
Men
31.7 34.2 22.6 ll.S
1301
Women All
33.8 32.7 33.9 34.1 28.7 25.4 3.6 7.8
1147 2448
From this we see that the types of school curriculum undertaken by
men and women are not particularly different, except that women were
less likely than men to have undertaken a technical curriculum and
more likely to have undertaken an academic one. It should, however,
be mentioned that these figures conceal major differences in the
specific subjects undertaken by graduate men and women when they
were at school. This matter is discussed more fully in the next
chapter.
Table 7.8 shows the occupations of graduate men and women three
years after leaving college broken down according to their school
curriculum.
PAGE 193
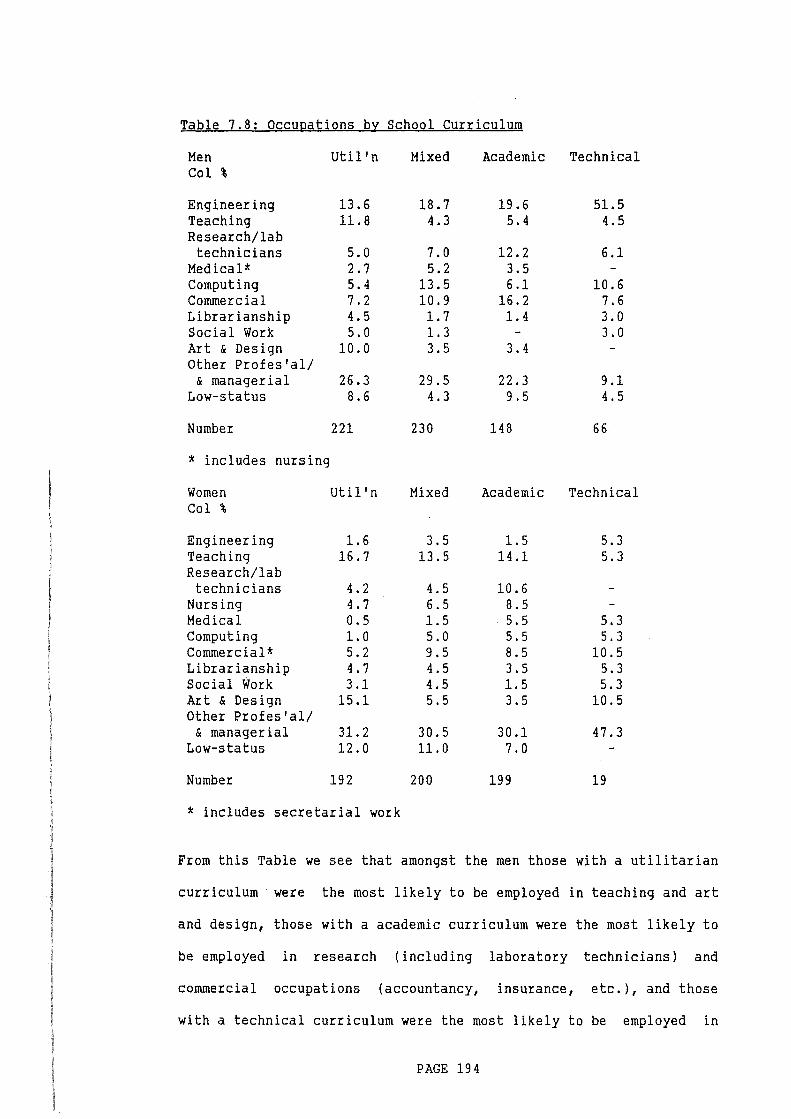
Table 7.8: Occupations by School Curriculum
Men Util 'n Mixed Academic Technical Col %
Engineering 13.6 18.7 19.6 51.5 Teaching 11.8 4.3 5.4 4.5 Research/lab technicians 5.0 7.0 12.2 6.1
Medical* 2.7 5.2 3.5 Computing 5.4 13.5 6.1 10.6 Commercial 7.2 10.9 16.2 7.6 Librarianship 4.5 1.7 1.4 3.0 Social Work 5.0 1.3 - 3.0 Art & Design 10.0 3.5 3.4 Other Profes'al/
& managerial 26.3 29.5 22.3 9.1 Low-status 8.6 4.3 9.5 4.5
Number 221 230 148 66
* includes nursing
Women Util' n Mixed Academic Technical Col \
Engineering 1.6 3.5 1.5 5.3 Teaching 16.7 13.5 14.1 5.3 Research/lab
technicians 4.2 4.5 10.6 Nursing 4.7 6.5 8.5 Medical 0.5 1.5 5.5 5.3 Computing 1.0 5.0 5.5 5.3 Commercial* 5.2 9.5 8.5 10.5 Librarianship 4.7 4.5 3.5 5.3 Social Work 3.1 4.5 1.5 5.3 Art & Design 15.1 5.5 3.5 10.5 Other Profes'al/
& managerial 31.2 30.5 30.1 47.3 Low-status 12.0 11.0 7.0
Number 192 200 199 19
* includes secretarial work
From this Table we see that amongst the men those with a utilitarian
curriculum were the most likely to be employed in teaching and art
and design, those with a academic curriculum were the most likely to
be employed in research (including laboratory technicians) and
commercial occupations (accountancy, insurance, etc.), and those
with a technical curriculum were the most likely to be employed in
PAGE 194
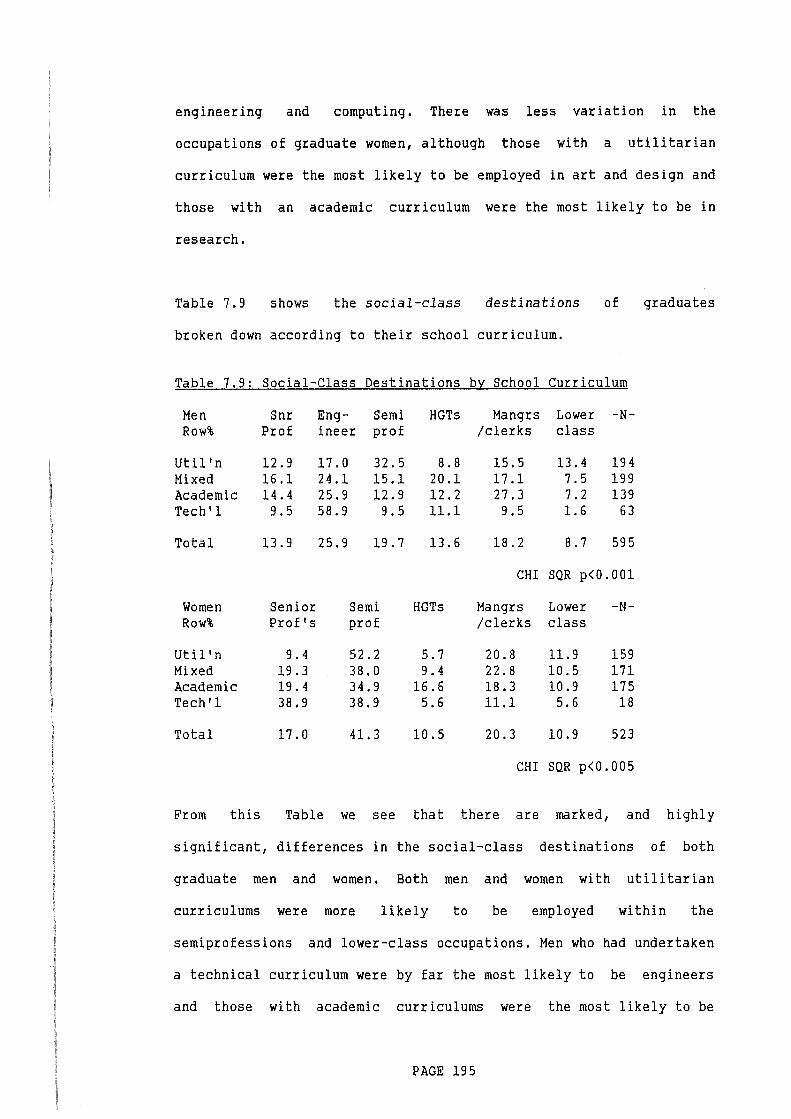
engineering and computing. There was less variation in the
occupations of graduate women, although those with a utilitarian
curriculum were the most likely to be employed in art and design and
those with an academic curriculum were the most likely to be in
research.
Table 7.9 shows the social-class destinations of graduates
broken down according to their school curriculum.
Table 7.9: Social-Class Destinations by School Curriculum
Men Snr Eng- Semi HGTs Mangrs Lower -N-Row% Prof ineer prof /clerks class
Util' n 12.9 17.0 32.5 8.8 15.5 13.4 194 Mixed 16.1 24.1 15.1 20.1 17.1 7.5 199 Academic 14.4 25.9 12.9 12.2 27.3 7.2 139 Tech'l 9.5 58.9 9.5 11.1 9.5 1.6 63
Total 13.9 25.9 19.7 13.6 18.2 8.7 595
CHI SQR p<0.001
Women Senior Semi HGTs Mangrs Lower -N-Row% Prof's prof /clerks class
Util' n 9.4 52.2 5.7 20.8 11.9 159 Mixed 19.3 38.0 9.4 22.8 10.5 171 Academic 19.4 34.9 16.6 18.3 10.9 175 Tech'1 38.9 38.9 5.6 11.1 5.6 18
Total 17.0 41.3 10.5 20.3 10.9 523
CHI SQR p<0.005
From this Table we see that there are marked, and highly
significant, differences in the social-class destinations of both
graduate men and women. Both men and women with utilitarian
curriculums were more likely to be employed within the
semiprofessions and lower-class occupations. Men who had undertaken
a technical curriculum were by far the most likely to be engineers
and those with academic curriculums were the most likely to be
PAGE 195
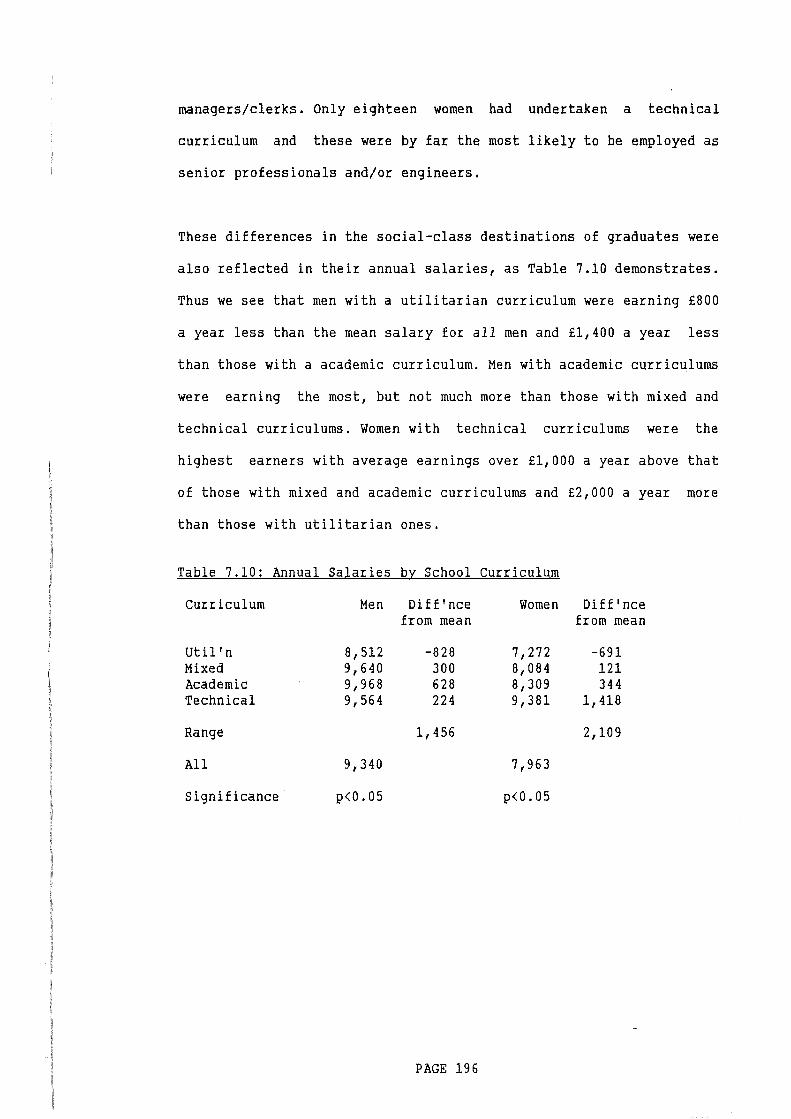
managers/clerks. Only eighteen women had undertaken a technical
curriculum and these were by far the most likely to be employed as
senior professionals and/or engineers.
These differences in the social-class destinations of graduates were
also reflected in their annual salaries, as Table 7.10 demonstrates.
Thus we see that men with a utilitarian curriculum were earning £800
a year less than the mean salary for all men and £1,400 a year less
than those with a academic curriculum. Men with academic curriculums
were earning the most, but not much more than those with mixed and
technical curriculums. Women with technical curriculums were the
highest earners with average earnings over £1,000 a year above that
of those with mixed and academic curriculums and £2,000 a year more
than those with utilitarian ones.
Table 7.10: Annual Salaries by School Curriculum
Curriculum Men Diff 'nee Women Diff 'nee from mean from mean
Util' n 8,512 -828 7,272 -691 Mixed 9,640 300 8,084 121 Academic 9,968 628 8,309 344 Technical 9,564 224 9,381 1,418
Range 1,456 2,109
All 9,340 7' 963
Significance p<0.05 p<0.05
PAGE 196
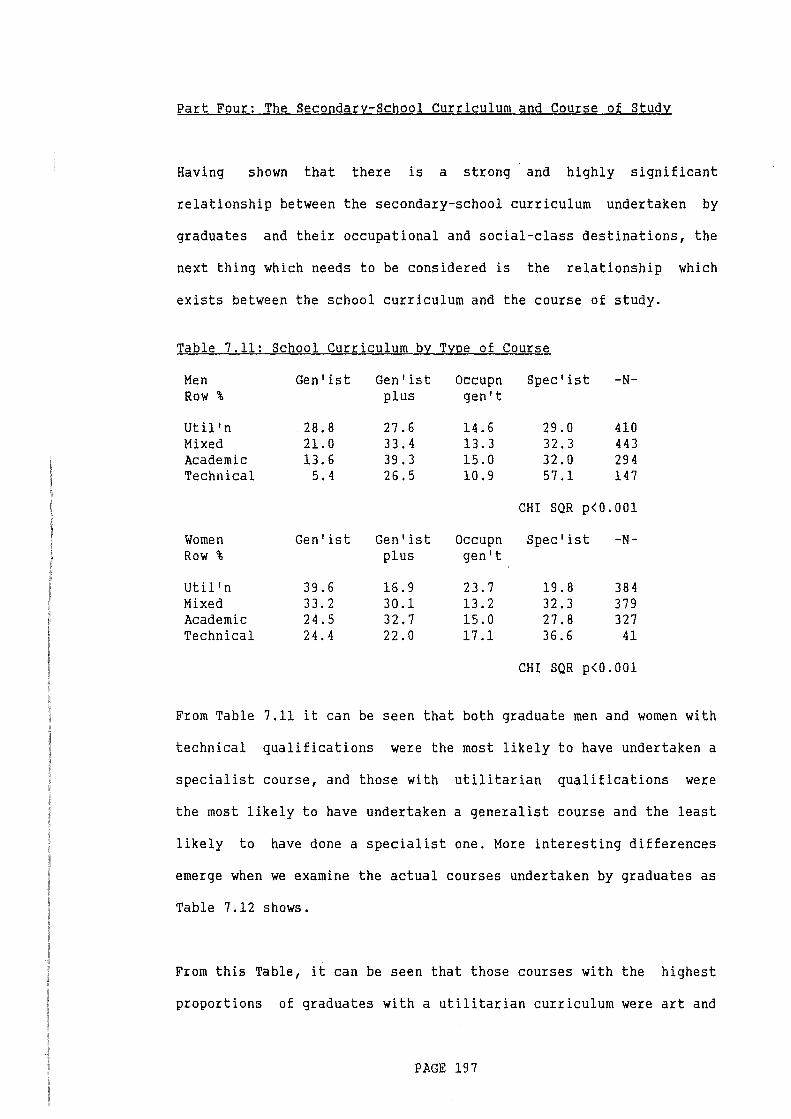
Part Four: The Secondary-School Curriculum and Course of Study
Having shown that there is a strong and highly significant
relationship between the secondary-school curriculum undertaken by
graduates and their occupational and social-class destinations, the
next thing which needs to be considered is the relationship which
exists between the school curriculum and the course of study.
Table 7.11: School Curriculum by Type of Course
Men Gen 1 ist Gen 1 ist Occupn Spec 1 ist -N-Row % plus gen 1 t
Util 1 n .28.8 27.6 14.6 29.0 410 Mixed 21.0 33.4 13.3 32.3 443 Academic 13.6 39.3 15.0 32.0 29 4 Technical 5.4 26.5 10.9 57.1 147
CHI SQR p<0.001
Women Gen 1 ist Gen 1 ist Occupn Spec 1 ist -N-Row % plus gen 1 t
Util 1 n 39.6 16.9 23.7 19.8 384 Mixed 33.2 30.1 13.2 32.3 379 Academic 24.5 32.7 15.0 27.8 327 Technical 24.4 22.0 17.1 36.6 41
CHI SQR p<0.001
From Table 7.11 it can be seen that both graduate men and women with
technical qualifications were the most likely to have undertaken a
specialist course, and those with utilitarian qualifications were
the most likely to have undertaken a generalist course and the least
likely to have done a specialist one. More interesting differences
emerge when we examine the actual courses undertaken by graduates as
Table 7.12 shows.
From this Table, it can be seen that those courses with the highest
proportions of graduates with a utilitarian curriculum were art and
PAGE 197
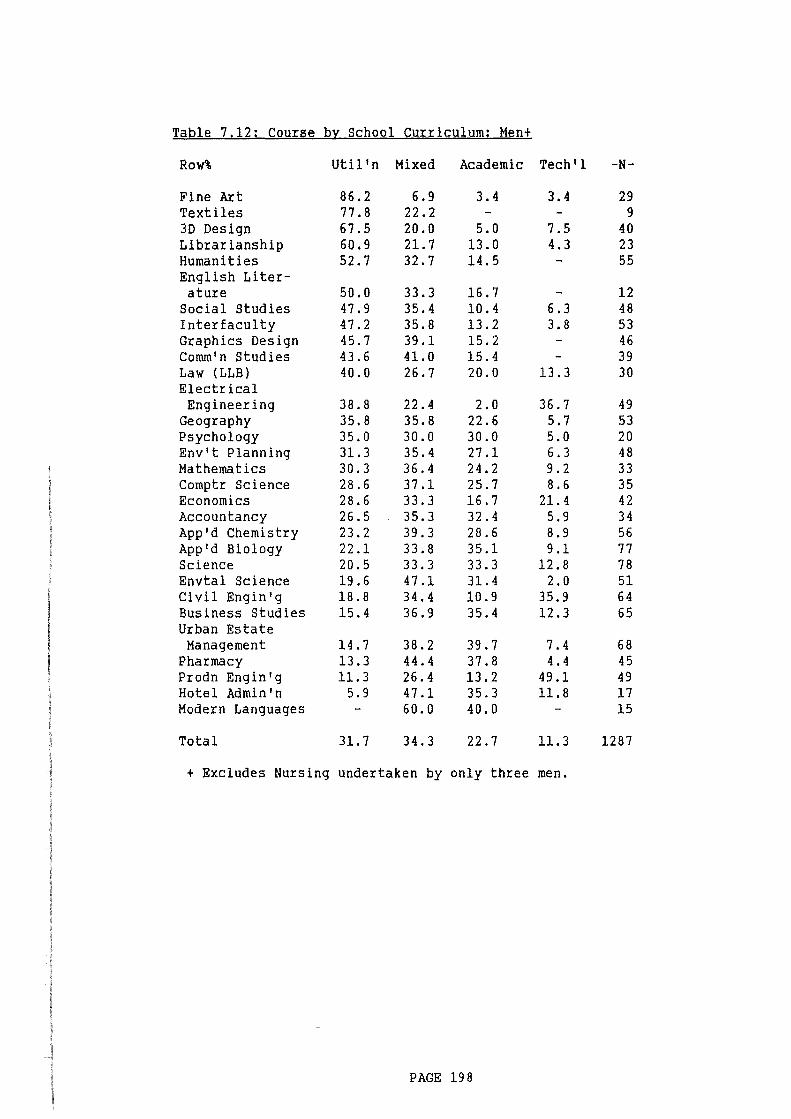
Table 7.12~Course by School Curriculum: Men+
Row% Util 'n Mixed Academic Tech'l -N-
Fine Art 86.2 6.9 3.4 3.4 29 Textiles 77.8 22.2 - - 9 3D Design 67.5 20.0 5.0 7.5 40 Librarianship 60.9 21.7 13.0 4.3 23 Humanities 52.7 32.7 14.5 - 55 English Liter-ature 50.0 33.3 16.7 - 12
Social Studies 47.9 35.4 10.4 6.3 48 Interfaculty 47.2 35.8 13.2 3.8 53 Graphics Design 45.7 39.1 15.2 - 46 Comm'n Studies 43.6 41.0 15.4 - 39 Law (LLB) 40.0 26.7 20.0 13.3 30 Electrical Engineering 38.8 22.4 2.0 36.7 49
Geography 35.8 35.8 22.6 5.7 53 Psychology 35.0 30.0 30.0 5.0 20 Env't Planning 31.3 35.4 27.1 6.3 48 Mathematics 30.3 36.4 24.2 9.2 33 Comptr Science 28.6 37.1 25.7 8.6 35 Economics 28.6 33.3 16.7 21.4 42 Accountancy 26.5 35.3 32.4 5.9 34 App'd Chemistry 23.2 39.3 28.6 8.9 56 App'd Biology 22.1 33.8 35.1 9.1 77 Science 20.5 33.3 33.3 12.8 78 Envtal Science 19.6 47.1 31.4 2.0 51 Civil Engin'g 18.8 34.4 10.9 35.9 64 Business Studies 15.4 36.9 35.4 12.3 65 Urban Estate
Management 14.7 38.2 39.7 7.4 68 Pharmacy 13.3 44.4 37.8 4.4 45 Prodn Engin'g 11.3 26.4 13.2 49.1 49 Hotel Admin'n 5.9 47.1 35.3 11.8 17 Modern Languages - 60.0 40.0 - 15
Total 31.7 34.3 22.7 11.3 1287
+ Excludes Nursing undertaken by only three men.
PAGE 198
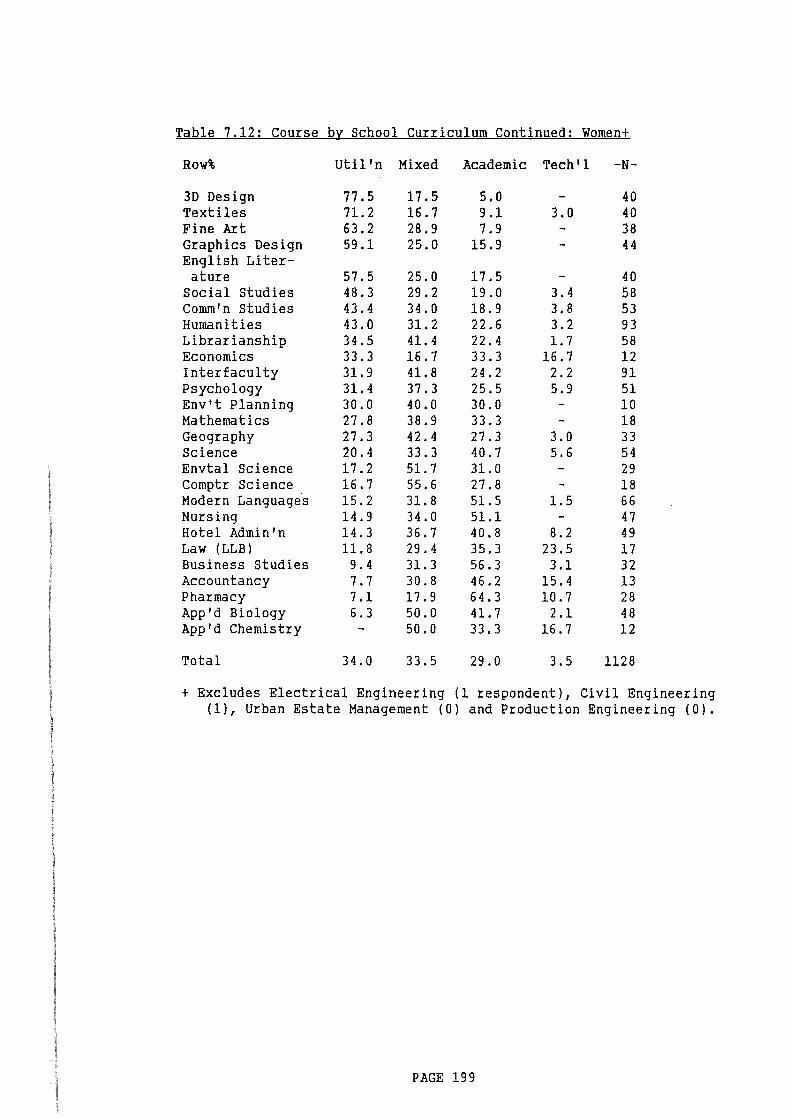
Table 7.12: Course by School Curriculum Continued: Women+
Row%
3D Design Textiles Fine Art Graphics Design English Liter-ature
Social Studies Comm'n Studies Humanities Librarianship Economics Interfaculty Psychology Env't Planning Mathematics Geography Science Envtal Science Comptr Science Modern Languages Nursing Hotel Admin'n Law (LLB} Business Studies Accountancy Pharmacy App'd Biology App'd Chemistry
Total
Util 'n
77.5 71.2 63.2 59.1
57.5 48.3 43.4 43.0 34.5 33.3 31.9 31.4 30.0 27.8 27.3 20.4 17.2 16.7 15.2 14.9 14.3 11.8
9.4 7.7 7.1 6.3
34.0
Mixed
17.5 16.7 28.9 25.0
25.0 29.2 34.0 31.2 41.4 16.7 41.8 37.3 40.0 38.9 42.4 33.3 51.7 55.6 31.8 34.0 36.7 29.4 31.3 30.8 17.9 50.0 50.0
33.5
Academic
5.0 9.1 7.9
15.9
17.5 19.0 18.9 22.6 22.4 33.3 24.2 25.5 30.0 33.3 27.3 40.7 31.0 27.8 51.5 51.1 40.8 35.3 56.3 46.2 64.3 41.7 33.3
29.0
Tech'l
3.0
3. 4 3.8 3.2 1.7
16.7 2.2 5.9
3.0 5.6
1.5
8.2 23.5 3.1
15.4 10.7
2.1 16.7
3.5
-N-
40 40 38 44
40 58 53 93 58 12 91 51 10 18 33 54 29 18 66 47 49 17 32 13 28 48 12
1128
+Excludes Electrical Engineering (1 respondent}, Civil Engineering (1}, Urban Estate Management (0) and Production Engineering (0).
PAGE 199

design courses (Fine Art
humanities and social
and Textiles), Librarianship, the
sciences, and those with the lowest
proportions of graduates with a utilitarian· curriculum were Modern
Languages, Hotel Administration, Pharmacy, Urban Estate Management
and Business Studies. Those courses with the highest proportion of
graduates with a technical curriculum were the three engineering
courses, Economics and Law.
Returning to our discussion of the relevance of the fortuitous
approach in explaining why people enter higher education, it is
possible to explain these differences in the courses undertaken by
graduates in terms of the constraints which the school curriculum
placed upon their freedom of choice. To a large extent, the
complexity and degree of background knowledge necessary to undertake
some degree courses explains why the school curriculum constrains
the extent to which students are free to choose a particular degree
course. But other factors are also important, as will be argued in
the next section.
To summarize at this point, it has been argued that the school
curriculum not only
students can pursue,
influence how well
places limits upon the range of courses which
but that this, in turn, also appears to
they perform in the labour market after
graduation. Given the association which has been found between the
school curriculum undertaken by graduates and their social-class
destinations two questions now need to be asked. Why do such
differences exist in the school curriculum which graduates had
undertaken? And what is the nature of the relationship between the
social-class origins of graduates and their school curriculum?
PAGE 200
Part Five: Sponsored and Contest Mobility
So far much of our analysis of the various factors which have a
bearing on the occupational and social-class destinations of
graduates might lead one to suppose that the social-class origins of
graduates are relatively unimportant. Much of the variance which
exists in their occupations can be related to differences in the
courses of study which they had undertaken, which, in turn, can be
related to differences in the curriculum which they had undertaken
at school. So far in this thesis, however, we have used the concept
of 'social class' as a variable rather than as a relationship. The
difference between these two uses of the concept is that where
social class is used as a variable, attention tends to focus upon
analysing its effect in terms of a number of attributes which
differ between social classes. For example, in our analysis of the
social-class origins of graduates, in Chapter Four, it was argued
that those from working-class backgrounds are strongly atypical of
their class of origin in so far as they share a number of attributes
with those who originate from more middle-class backgrounds. In
contrast, where social class is used as a relationship attention
tends to be drawn to the relationship which exists between social
classes, differences in the amount of power which they hold and the
ability of some groups to manipulate the system to their own
advantage.
The work of Turner (1960) provides us with a theoretical framework
within which to examine the influence of social class as a
PAGE 201
relationship rather than as a variable. Turner's interest lay in
developing two opposing models of social mobility, 'sponsored' and
'contest', which he believed typified social mobility in England and
the United States respectively. Under contest systems people are
seen as competing against one another for entry into elite
positions, whereas under the sponsorship model ' ... elite recruits
are chosen by the established elite or their agents, and elite
status is given on the basis of some criterion of supposed merit'
(p. 856). A similar position to that of Turner is taken by radical
and Marxist sociologists, such as Bowles and Gintis (1976), Grace
(1978) and Harris (1982), who argue that one of the primary
functions of education under capitalism is to help reproduce
capitalist modes of production. Like Turner, they argue that the
educational system tends to separate children at an early age and
gives them an education appropriate to their eventual station in
life. These approaches tend to differ from Turner's in the ways in
which they view contest mobility but are in broad agreement in how
they view sponsored mobility.
Before attempting to analyse the HELM data using Turner's framework,
several points need to be made. Firstly, Turner used the concept of
an elite in only a very vague sense, and he suggested that whilst
contest mobility was most likely to occur where 'multiple elites'
existed and no single group was powerful enough to control
recruitment, sponsored mobility was most likely to occur where their
was a 'a single elite' or a 'recognized elite hierarchy'. Thus he
described English society 'as the juxtaposition of two systems of
stratification, the urban industrial class system and the surviving
aristocratic system' (p. 858), and he argued that whilst sponsored
PAGE 202
mobility was the province of the aristocratic system it had been
imposed upon the industrial one. Secondly, Turner was concerned
about entry into the elite and the role of education in this
process, and he did not discuss the extent to which the elite was
self-recruiting, that is, the extent to which the elite is able to
transfer wealth and privilege across generations through inheritance
and its members' ability to buy their children a 'good' education.
Thirdly, in the twenty-seven years since Turner wrote his paper
major changes have occurred in Britain's system of secondary and
higher education. Finally, Turner did not discuss gender and the
extent to which the school curriculum taught to boys and girls might
differ a topic which is discussed in the next chapter.
It is now possible to discuss the role of the polytechnics within
Turner's theoretical framework. Looking at higher education in the
early 1960s and following the work of Tapper and Salter
(1978: 142-3), it is possible to see the university as the principal
agent facilitating entry into the elite. In Tapper and Salter's view
(p. 146-7) the main function of the universities was to help
legitimate the elite and preserve its power. Vocational training
aimed at specific careers tended to be neglected (if not ignored in
order to frustrate the ambitions of the 'educated' middle classes),
and students were educated within closely-knit and closed
communities where they were exposed to a cultural milieu which
supported and stressed elite values. The role of the universities,
however, went further than this. They set their own entry
qualifications (GCE 0- and A-levels) and in doing so defined what
was and what was not acceptable knowledge, and this in turn helped
to earmark those from lower-class origins who were to be sponsored
PAGE 203

through higher education.
In 1960, when Turner wrote his paper, a selective system of
secondary education was in operation in most of England and Wales,
in which, on the basis of an examination taken at the age of eleven
(the eleven-plus), children were allocated to one of three types of
school: grammar, secondary modern and (in some local authorities)
technical schools. The curriculum taught to children within these
schools reflected the twin origins of secondary education in
England, discussed earlier in this chapter, and differed according
to their levels of intelligence, and eventual station in life
(Lawson and Silver, 1973; Goodson, 1983: 16-8). Grammar school
pupils were taught a strongly academically-orientated curriculum
intended to equip them with knowledge and skills necessary to enter
university. Since the universities sought to 'educate' their
students into the elite culture, the grammar school curriculum was
not particularly vocational in orientation. In marked contrast, the
curriculum taught to children within secondary modern schools, which
the overwhelming majority of children attended, was more utilitarian
in orientation and sought to equip them with the skills necessary
for employment within more mundane {manual and low-level clerical)
occupations. The secondary modern school curriculum was simply not
geared to university entrance. Few such schools taught Latin (in
which a GCE pass was required by most universities), their science
laboratories were rarely on a par with those of grammar schools, and
until the early 1960s few entered their children for public
examinations (CSEs and GCEs).
This is not the place to discuss the profound changes which occurred
PAGE 204
in Britain's system of secondary and higher education during the
1960s - the establishment of comprehensive schools and the
polytechnics. Suffice it to say here that throughout this period a
tendency for working-class youngsters to attend secondary modern
schools and for more middle-class children to attend grammar schools
was noted (see Chapter One) with the result that the education
system tended to reinforce, rather than counteract, the educational
disadvantages suffered by youngsters from manual backgrounds and the
vocational opportunities available to such youngsters were thwarted
still further. Moreover, research was casting doubt on the ability
of the eleven-plus examination to differentiate people according to
their level of intelligence (Benn and Simon, 1972). Because of this
support grew for the introduction of the comprehensive system of
education. Finally, there was a widespread feeling that the
universities were neglecting the
concentrating on the teaching
economic needs of the nation by
of general rather than
vocationally-orientation subjects (Tapper and Salter, 1978: 147-9).
In terms of Turner's model, this would tend to suggest that the
system of sponsored mobility was not serving the best interests of
the country, because many of the more able working-class children
were not socially mobile, and the system was not producing the
highly-skilled manpower needed by industry and commerce.
The establishment of comprehensive schools and polytechnics can
therefore be viewed as an attempt to correct these shortcomings by
moving the education system away from the sponsorship model of
mobility and toward the contest one. At secondary level, the
introduction of comprehensive schooling can be seen as an attempt to
PAGE 205
give all children, irrespective of home background, an equal
opportunity to compete for entry into elite positions through the
education system (see Young, 1961: 40-6). Similarly, the
establishment of the polytechnics can be viewed as an attempt to
introduce a contest element into higher education and 'open-up'
higher education to the late developer and second-chance student who
had been unable to compete on equal terms at an earlier age.
The problem with this approach was that change was only attempted in
a 'partial' and 'half-hearted' fashion, in so far as the
polytechnics were grafted onto a sponsorship system of education. At
secondary-school level the public and private schools were not
affected by the changes in the state system of education, and some
LEAs (for example Kent) continued to operate a selective system of
education. Moreover, under the, then, new binary system of higher
education the universities were not (and have not been) radically
altered. They continued to encourage a sy~tem of sponsored mobility
drawing their students predominantly from selective
independent) schools, and through their control
and A-level curriculums they are in a strong position
what is taught in comprehensive schools.
(grammar and
of the GCE 0-
to influence
The continued control exercised by the universities over the school
curriculum has had two consequences. Firstly, it has meant that
comprehensive schools have been forced to teach an
academically-orientated curriculum in order to allow their pupils to
compete for places in higher education, and, secondly, public sector
institutions of higher education have been forced to adopt the same
entrance criterion as the universities. Let us take each of these
PAGE 206

points in turn.
Today only a few LEAs operate the old bipartite system of education,
yet there is some evidence which suggests that the curriculum taught
to pupils within comprehensive schools varies considerably. In many
local authorities, children from well-to-do families living in the
more middle-class suburban estates tend to attend one particular
comprehensive school which in consequence gets a 'good name',
attracting better teachers and arguably more generous funding,
whilst children from poorer families tend to attend an inner-city
comprehensive school which in consequence gets a 'bad name'
attracting poorer staff and perhaps less generous funding. As a
result suburban schools serving the more middle-class estates tend
to offer a broader range of subjects to their pupils, and generally
have better science and language laboratories which in turn improve
the chances of their pupils being successful in their GCSE
examinations. Moreover, the falling birth-rate in the 1960s and
early 1970s and the consequent fall in school rolls
disproportionately affected inner-city comprehensive schools at a
time when urban 'redevelopment' programmes were encouraging people
to move to new suburban housing estates. This has forced many
inner-city comprehensive schools to reduce the number of subjects
which they offer to their pupils, which has reduced the range of
subjects which they can undertake in higher education (see
Byrne et al., 1975).
Further, the curriculum taught to pupils attending the same school
also tends to vary according to the individual child's intelligence.
Until the recent introduction of the GCSE examination, brighter
PAGE 207

children tended to undertake GCE 0-levels and less bright children
CSEs. Although a CSE grade one pass is the equivalent of a GCE
0-level pass, it should be stressed that the CSE was originally
designed for the intelligent pupil who expected to leave school when
aged sixteen, and it is a qualification which places constraints on
the range of degree-level subjects which a student may undertake,
which, in turn, may be placing them at a disadvantage in the
graduate labour market. Moreover, a number of writers (Cicourel and
Kitsuse, 1963; Nash, 1973) have argued that teacher expectations
(labelling) can have a major influence on the academic achievements
of school children, such that where a teacher expects a child to
fail he or she is more likely to do so. In terms of our earlier
analysis, we might expect this to be reflected in the type of
curriculum which is taught to children, those perceived as less
intelligent being taught a utilitarian curriculum and those
perceived as more intelligent being taught an academic curriculum.
It was suggested earlier that the continued control exercised by the
universities over the secondary-school curriculum may have forced
many public sector institutions of higher education to adopt the
same entrance requirements for their students as the universities.
This is important because it has limited the ability of the
polytechnics and colleges to widen their entrance requirements in
order to attract the second-chance student who may have undertaken a
utilitarian curriculum. Other factors have also limited the ability
of public sector institutions to widen their entrance requirements.
Prime amongst these is the complexity of specific degree courses and
the level of attainment needed to undertake them. Science, Language
and Engineering courses, for instance, require examination passes
PAGE 208
(GCEs, 0/HNDs, etc) in related subjects, whilst Art and Design
courses require a grounding in more practically-orientated subjects
which those who studied a utilitarian curriculum are, arguably, more
likely than others to have received (see Table 7.12).
Another factor, discussed at length in Chapter Six, is the degree of
control exercised by professional bodies over recruitment. This is
important because they often set their own entry qualifications and
often have the ability to regulate the number of new entrants. It is
difficult to know how important this factor might be and the extent
to which it limits the ability of polytechnics and colleges to widen
their entry requirements. In teaching, for example, it is important
to the extent that new entrants require GCSE passes in English
Language and Mathematics, but such direct specification of entry
requirements is probably unusual. Of perhaps more importance is
Berg's (1973) observation that the level of knowledge needed to
undertake many professional occupations is only weakly related to
the level of attainment in professional examinations necessary for
entry. To the extent that this is so, it seems reasonable to argue
that polytechnics and colleges are further constrained in their
ability to open up their courses to those who have undertaken a
utilitarian curriculum and/or lack standard entry qualifications.
Thus public sector institutions of higher education have not
succeeded in opening up their courses to a wider range of potential
students, and the courses with a high proportion of students with a
utilitarian curriculum (Table 7.12) tend to be: those for which
students with such a curriculum are ideally suited {such as art and
design courses which require more 'practical' skills); those which
PAGE 209
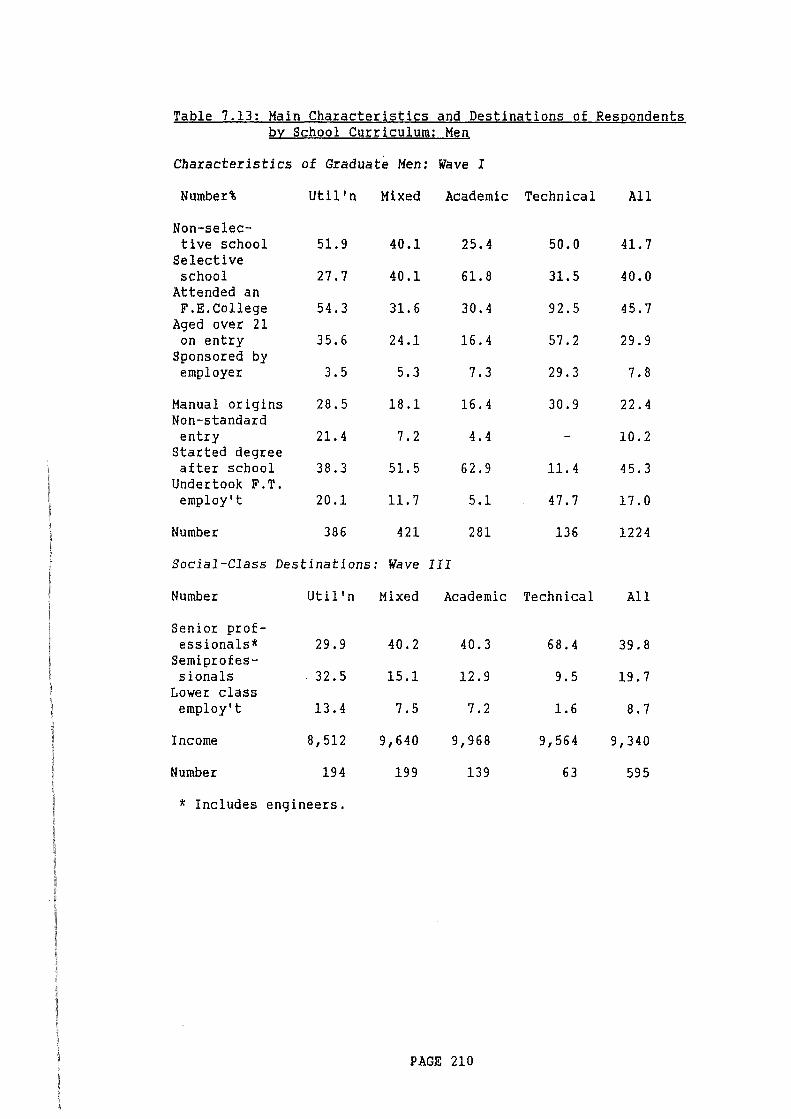
Table 7.13: Main Characteristics and Destinations of Respondents bv School Curriculum: Men
Characteristics of Graduate Men: Wave I
Number%
Non-selective school
Selective school
Attended an F.E.College
Aged over 21 on entry
Sponsored by employer
Manual origins Non-standard entry
Started degree after school
Undertook F.T. employ't
Number
Util'n Mixed Academic Technical
51.9 40.1 25.4 50.0
27.7 40.1 61.8 31.5
54.3 31.6 30.4 92.5
35.6 24.1 16.4 57.2
3.5 5.3 7.3 29.3
28.5 18.1 16.4 30.9
21.4 7.2 4.4
38.3 51.5 62.9 11.4
20.1 11.7 5.1 47.7
386 421 281 136
All
41.7
40.0
45.7
29.9
7.8
22.4
10.2
45.3
17.0
1224
Social-Class Destinations: Wave III
Number
Senior professionals*
Semiprofessionals
Lower class employ't
Income
Number
Util' n Mixed
29.9 40.2
32.5 15.1
13.4 7.5
8,512 9,640
194 199
* Includes engineers.
Academic Technical All
40.3 68.4 39.8
12.9 9.5 19.7
7.2 1.6 8.7
9,968 9,564 9,340
139 63 595
PAGE 210
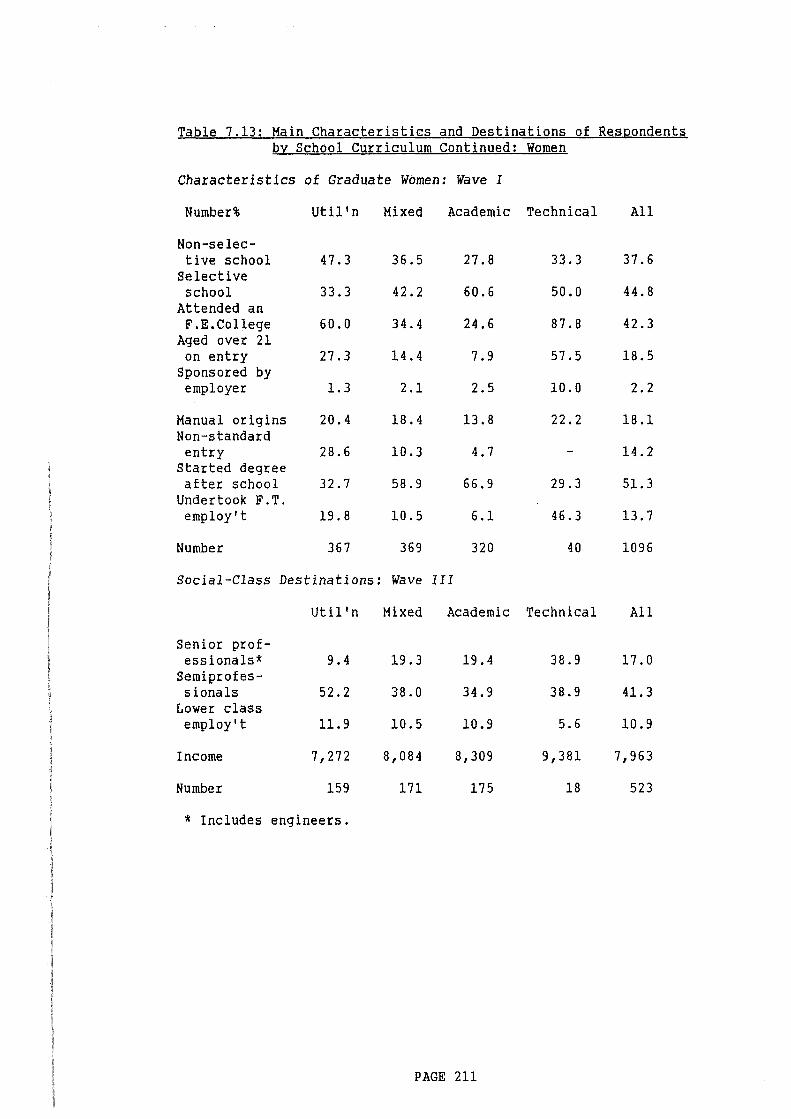
Table 7.13: Main Characteristics and Destinations of Resgondents by School Curriculum Continued: Women
Characteristics of Graduate Women: Wave I
Number% Util' n Mixed Academic Technical All
Non-selec-tive school 47.3 36.5 27.8 33.3 37.6
Selective school 33.3 42.2 60.6 50.0 44.8
Attended an F.E.College 60.0 34.4 24.6 87.8 42.3
Aged over 21 on entry 27.3 14.4 7.9 57.5 18.5
Sponsored by employer 1.3 2.1 2.5 10.0 2.2
Manual origins 20.4 18.4 13.8 22.2 18.1 Non-standard entry 28.6 10.3 4.7 - 14.2
Started degree after school 32.7 58.9 66.9 29.3 51.3
Undertook F.T. employ't 19.8 10.5 6.1 46.3 13.7
Number 367 369 320 40 1096
Social-Class Destinations: Wave III
Util' n Mixed Academic Technical All
Senior prof-essionals* 9.4 19.3 19.4 38.9 17.0
Semiprofes-sionals 52.2 38.0 34.9 38.9 41.3
Lower class employ't 11.9 10.5 10.9 5.6 10.9
Income 7,272 8,084 8,309 9,381 7,963
Number 159 171 175 18 523
* Includes engineers.
PAGE 211

require little pre-college training (English Literature, Humanities
and the Social Sciences); and those which are not specifically
vocational in orientation.
Using Turner's model it is now possible to view our four school
curriculums as representing three distinct routes through secondary
and higher education and into the graduate labour market. The major
characteristics of those who undertook the four curriculums are
shown in Table 7.13.
Those with an academic curriculum can be identified as being
sponsored through secondary school and higher education. In terms of
Tuxner's model they were chosen for 'elite' positions at an early
age, most attended selective (grammar and fee-paying) schools and
most entered higher education straight after leaving school. Because
of the broad and academic nature of their school curriculum there
were fewer constraints inhibiting their choice of which degree-level
subject to undertake, and they have fared relatively well in the
labour market. Those with a utilitarian curriculum can be thought of
as representing a 'contest' element. Over half the men attended a
non-selective (secondary modern or comprehensive) school, over a
third were aged twenty-one or over on entry to higher education,
many had studied at a college of further education and 20% had some
work experience. They were constrained in their choice of which
subject to undertake in higher education by their school curriculum
and this is reflected in their mean incomes and social-class
destinations. Those with a mixed curriculum appear on balance to
have more in common with those who undertook an academic than with
those who undertook a utilitarian curriculum.
PAGE 212
One group which we have not so far mentioned are those with a
technical curriculum. In terms of their early education, they have
much in common with those with a utilitarian curriculum: half the
men had attended a non-selective school and the vast majority had
attended a college of further education, almost half had some
full-time work experience and many were mature entrants. They differ
in terms of their employment outcomes as can be seen from their
incomes, and social-class destinations which reflect the vocational
specificity of their degree-level courses. In terms of Turner's
model they are more difficult to place than the other groups. To
some extent they represent a 'contest' group in so far as few were
directly sponsored through secondary education as those with an
academic curriculum were. However, many have been sponsored into
higher education directly by an employer.
So far the relationship between the school curriculum and the
occupational and social-class destinations of graduates has been
discussed primarily in terms of the constraints which the school
curriculum places upon the range of courses which students can
pursue. The school curriculum may, however, be exerting an influence
on the employment destinations of graduates via its hidden content.
Bowles and Gintis (1976) in the United States and Harris (1982) in
Great Britain and Australia have argued that the 'hidden curriculum'
aims to produce a servile workforce for industry. In this approach
the basic organization of the school with its hierarchy of
headmaster, teacher and pupil is seen to mirror the basic structure
of capitalist enterprises and various disciplinary measures are used
to keep children in check. The brighter children are, however,
PAGE 213
subjected to less stringent forms of teaching and are encouraged to
develop social relations which emphasize autonomy, independence, and ..
creativity (Hargreaves, 1982: 13-15).
An alternative approach to the 'hidden curriculum' is that taken by
Hargreaves (1982), who argues that schools tend to strip pupils of
their 'dignity' in so far as teachers tend to use sarcasm and fear
(if inadvertently) as forms of control in the classroom, the effects
of this being either to produce 'docile' children who accept what is
taught to them without question or a rebellious counter-culture.
Although Hargreaves, like most educationalists, is mainly concerned
with the problems posed by the pupil counter-culture, it seems
reasonable to suggest that 'docile' pupils (for want of a better
term) who enter higher education are likely to have lower
aspirations than others, and may lack some of the personality traits
(confidence, leadership potential, etc.) which are valued by
employers.
Unfortunately it is not possible to comment on the aspirations of
HELM gradautes on entry to higher education, although Floud and
Halsey (1956) and Liversidge (1962) found that grammar school pupils
tended to have far higher aspirations than secondary modern pupils,
and these differences remained even when allowance was made for
their social-class origins. Today one might reasonably expect
similar differences to exist between those who had undertaken an
academic and those who had undertaken a utilitarian curriculum.
If Bowles and Gintis (1976), Harris (1982) and Hargreaves (1982) are
right in their assertions concerning the hidden curriculum, then one
PAGE 214
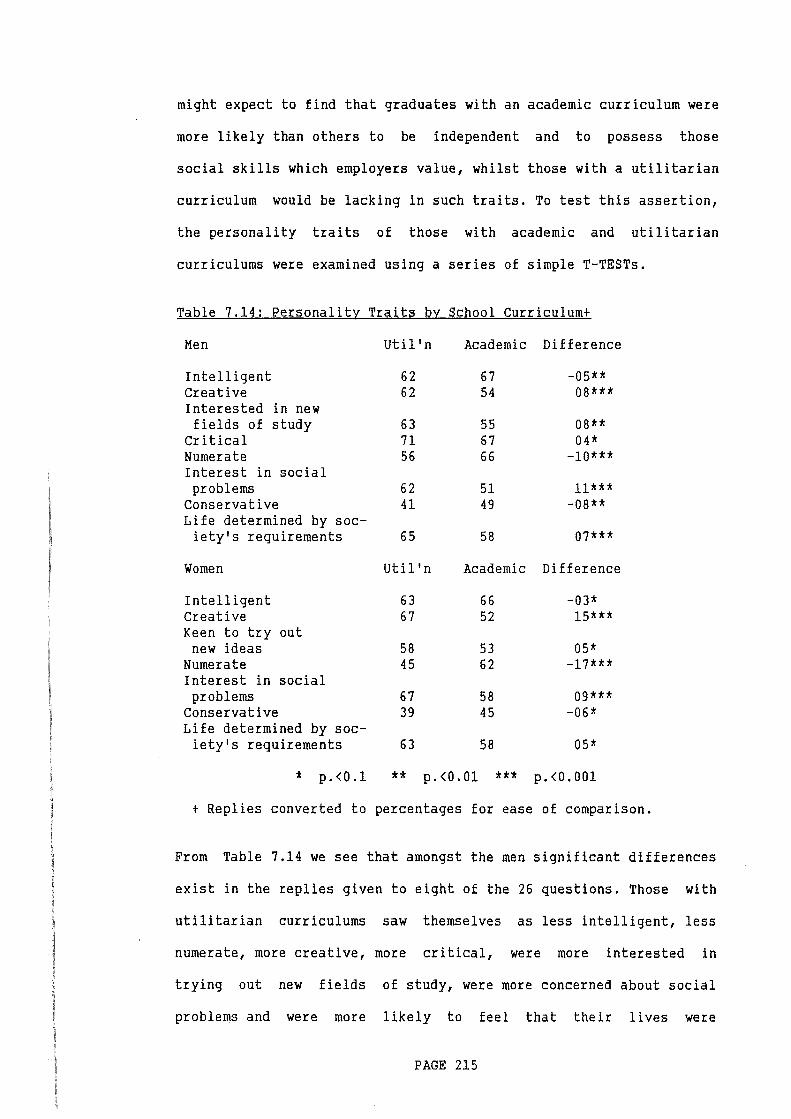
might expect to find that graduates with an academic curriculum were
more likely than others to be independent and to possess those
social skills which employers value, whilst those with a utilitarian
curriculum would be lacking in such traits. To test this assertion,
the personality traits of those with academic and utilitarian
curriculums were examined using a series of simple T-TESTs.
Table 7.14: Personality Traits by School Curriculum+
Men Util 'n Academic Difference
Intelligent 62 67 -05** Creative 62 54 08*** Interested in new fields of study 63 55 08**
Critical 71 67 04* Numerate 56 66 -10*** Interest in social problems 62 51 11***
Conservative 41 49 -08** Life determined by soc-iety's requirements 65 58 07***
Women Util 'n Academic Difference
Intelligent 63 66 -03* Creative 67 52 15*** Keen to try out
new ideas 58 53 05* Numerate 45 62 -17*** Interest in social
problems 67 58 09*** Conservative 39 45 -06* Life determined by soc-
iety's requirements 63 58 05*
't p.<0.1 ** p.<O.Ol *** p.<0.001
+ Replies converted to percentages for ease of comparison.
From Table 7.14 we see that amongst the men significant differences
exist in the replies given to eight of the 26 questions. Those with
utilitarian curriculums saw themselves as less intelligent, less
numerate, more creative, more critical, were more interested in
trying out new fields of study, were more concerned about social
problems and were more likely to feel that their lives were
PAGE 215
determined by society's requirements than those with an academic
curriculum. It is difficult to know what to make of these findings,
although their concern with social problems and interest in new
fields of study does tend to reinforce the view that such people
have a positive preference for careers in the semiprofessions
(teaching and social work). The replies do not appear to support the
contention that those with a utilitarian curriculum are lacking
those personality traits which employers value, although they were
less conservative: more importantly, however, no personality
differences were found as regards practicability, confidence,
independence, reliability, sociability and shyness. Almost identical
replies were given by the women, so much of what has been said about
the men also applies to them. This analysis strongly suggests that
differences in the occupational destinations of graduates according
to school curriculum are not due to those with utilitarian
curriculums lacking those personality traits which employers value,
and that differences in the employment destinations of graduates
with different school curriculums can be primarily related to
differences in their courses of study and possibly their
aspirations.
Part Six: Social-Class Origins and Sponsored Mobility
We are now in a position to relate our discussion of sponsored
mobility and of the school curriculum to our analysis of the
social-class origins of graduates and the courses which they
undertook. Not surprisingly, when the association between the
social-class origins and school curriculum undertaken by graduates
is examined we find that a highly significant relationship exists
PAGE 216
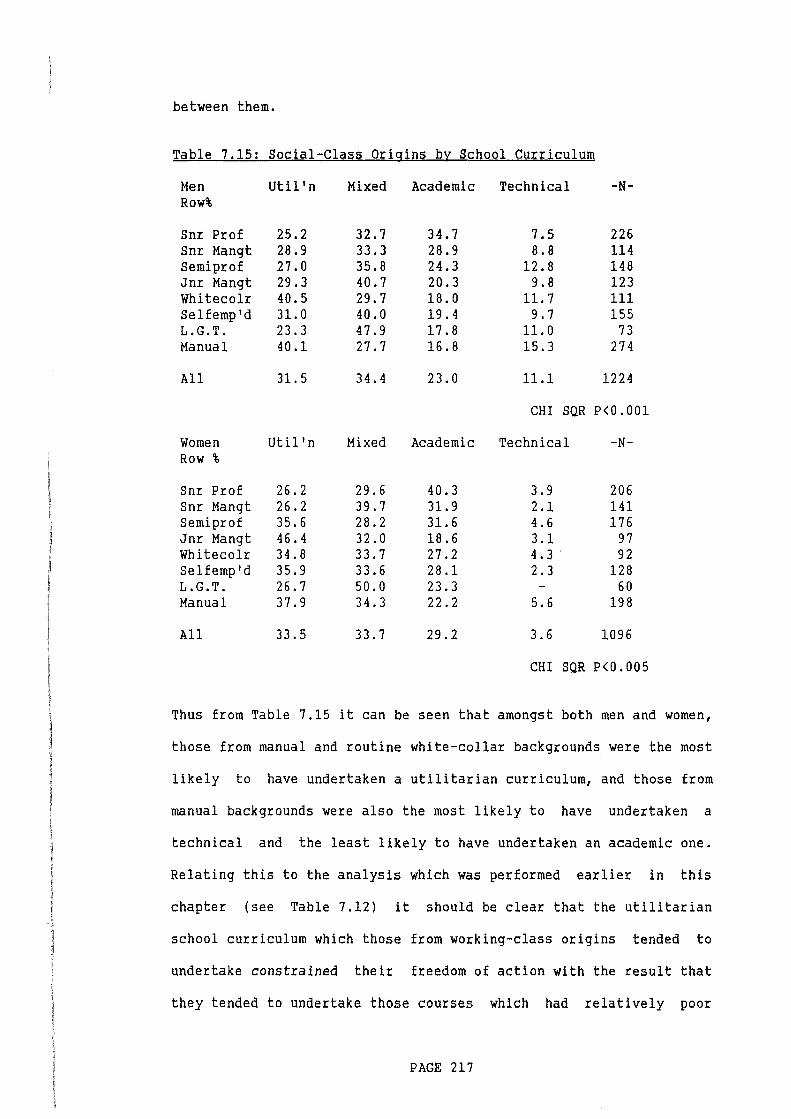
between them.
Table 7.15: Social-Class Origins by SchooLCurr_iculum
Men Util' n Mixed Academic Technical -N-Row%
Snr Prof 25.2 32.7 34.7 7.5 226 Snr Mangt 28.9 33.3 28.9 8.8 114 Semi prof 27.0 35.8 24.3 12.8 148 Jnr Mangt 29.3 40.7 20.3 9.8 123 Whitecolr 40.5 29.7 18.0 11.7 111 Selfemp'd 31.0 40.0 19.4 9.7 155 L.G.T. 23.3 47.9 17.8 11.0 73 Manual 40.1 27.7 16.8 15.3 274
All 31.5 34.4 23.0 11.1 1224
CHI SQR P<0.001
Women Util'n Mixed Academic Technical -N-Row %
Snr Prof 26.2 29.6 40.3 3.9 206 Snr Mangt 26.2 39.7 31.9 2.1 141 Semi prof 35.6 28.2 31.6 4.6 176 Jnr Mangt 46.4 32.0 18.6 3.1 97 Whitecolr 34.8 33.7 27.2 4. 3 ' 92 Selfemp 'd 35.9 33.6 28.1 2.3 128 L.G.T. 26.7 50.0 23.3 - 60 Manual 37.9 34.3 22.2 5.6 198
All 33.5 33.7 29.2 3.6 1096
CHI SQR P<0.005
Thus from Table 7.15 it can be seen that amongst both men and women,
those from manual and routine white-collar backgrounds were the most
likely to have undertaken a utilitarian curriculum, and those from
manual backgrounds were also the most likely to have undertaken a
technical and the least likely to have undertaken an academic one.
Relating this to the analysis which was performed earlier in this
chapter (see Table 7.12) it should be clear that the utilitarian
school curriculum which those from working-class origins tended to
undertake constrained their freedom of action with the result that
they tended to undertake those courses which had relatively poor
PAGE 217
employment outcomes.
What now needs to be accounted for is why such differences should
exist in the nature of the school curriculum undertaken by people
from different social-class backgrounds.
Firstly, it can be seen from Table 7.13 that 'mature' graduates
(aged 21 or over on entry to higher education) were more likely than
others to have undertaken a utilitarian curriculum. This is
understandable when one considers that many of these graduates would
have left school when aged 15 or 16 with few qualifications beyond
GCE 0-level standard, and the fact that some courses have special
arrangements for admitting mature students with less than standard
entry qualifications. However, as was mentioned in Chapter Four,
only a weak relationship exists between the age of graduates and
their social-class origins (29.9% of those originating from manual
backgrounds but 25.0% of all graduates were aged 21 or over on entry
to higher education), and in consequence 'age' only partially helps
us to account for the tendency of graduates from working-class
origins to have undertaken a utilitarian curriculum.
Referring again to Table 7.13, it can be seen that graduates with a
utilitarian curriculum were more likely than others to have attended
a non-selective (comprehensive or secondary modern) school.
Graduates from manual backgrounds were almost twice as likely to
have attended a secondary modern school as others - 7.7% of all
graduates but 13.3% of those originating from manual backgrounds had
attended such a school. More importantly, children from more
middle-class backgrounds tend to benefit from their parents' greater
PAGE 218
control over financial and other resources. The very rich are in a
strong position to buy their children a good education by sending
them to an independent (fee-paying) school - 20.9% of the children
of senior professionals, 25.3% of the children of senior managers
but only 6.9% of other respondents had attended such a school.
Graduates from lower middle-class backgrounds also benefit. Their
parents are often more attuned to the differences which exist
between state schools in their local areas, and they are more likely
to be in positions to send their children to one of the remaining
state-run selective (grammar) schools or the better comprehensive
schools. They often live on private suburban estates which tend to
be served by the best comprehensive schools which, as we have seen,
tend to have the best teaching staff and the best facilities. Such
schools also tend to have the most active parent-teacher
organizations which often run fund raising events. Moreover, it is
not uncommon for the families of such people to move house in order
to fall within the catchment area of a particular school. Thus the
middle classes are often in a position to sponsor their own children
through secondary and higher education. In marked contrast, children
from more working-class backgrounds tend to attend the poorer
schools often located on the outskirts of rundown council estates or
the inner cities. As was argued earlier, such schools tend to
attract the poorer teachers, offer a rather restricted range of
subjects, are often underfunded and lack external sources of finance
(see
and
Byrne et al.
the better
1975). Because independent (fee-paying), grammar
comprehensive schools tend to teach a more
academically-orientated
of the more middle-class
curriculum than other schools, and because
composition of their pupil intake, it
follows that students and graduates from middle-class backgrounds
PAGE 219
are more likely than their peers from more working-class backgrounds
to have undertaken an academic rather than a utilitarian curriculum.
Finally, it should be mentioned that because the parents of more
middle-class children tend to be better educated than the parents of
working-class children they are in stronger positions to pass on
cultural capital to their children. This tends to benefit their
children during their first years at school, with the result that
they are more likely to be labelled 'intelligent', which, in turn,
increases their chances of undertaking an academic curriculum and of
being sponsored through secondary education (Cicourel and Kitsuse,
1963; Hargreaves, 1982).
It should, however, be mentioned that more graduates from
working-class origins had undertaken either an academic or mixed
curriculum than had undertaken a utilitarian one, and, conversely, a
large number of men and women
(and over a quarter of
from more middle-class backgrounds
the sons and daughters of senior
professionals) had undertaken a utilitarian curriculum and in
consequence were relatively disadvantaged in the labour market. In
terms of the sponsorship model of social mobility, developed by
Turner (1960), this clearly suggests that the educational system is
providing for the needs of some of the more intelligent
working-class youngsters at the expense of those from more
middle-class backgrounds. Where the system falls down is at the
point of initial selection for sponsorship, and, as was shown in
Chapters One and Four, children from working-class origins tend to
'drop out' of education at an earlier age than their more
middle-class peers, and they are far less likely to participate in
PAGE 220
higher education.
Conclusion
Having argued in the previous chapter that much of the variance in
the relationship which exists between the social-class origins and
destinations of graduates can be explained in terms of the subjects
which they had undertaken, this chapter set out to explain why
graduates (and those from working-class origins in particular)
undertook the courses which they did. No significant differences
according to social-class origins were found in the reasons which
they gave for entering higher education and in their views of its
role and functions. Attempts were made to account for the
differences in the courses undertaken by graduates originating from
different social classes in terms of differences in the school
curriculum undertaken by them. Using the sponsorship model of social
mobility developed by Turner, it was argued that whilst those
earmarked for elite station tended to be taught an academic
curriculum others tended to be taught a more utilitarian one.
Analysis of the HELM data revealed that, whilst those who had
undertaken an academic curriculum had considerable . choice over
which subject to study and tended to fare particularly well in the
labour market, those who had undertaken a utilitarian curriculum
found themselves constrained over their choice of which course to
undertake and tended to fare much less well in the labour market.
Further analysis of the data suggested that this process tends to
work to the advantage and disadvantage of students from all social
classes, but the balance of the disadvantage undoubtedly lies with
those from working-class origins who tend to drop out of education
PAGE 221

at earlier ages than those from more middle-class backgrounds, and
many of those who do participate in higher education find themselves
constrained as regards their choice of which subject to study.
PAGE 222
CHAPTER EIGHT: GENDER, SOCIAL CLASS AND THE EMPLOYMENT DESTINATIONS GRADUATES
In our earlier discussion of the relationship which exists between
the social-class origins and destinations of graduates we have
treated men and women separately. We have not as yet discussed how
the careers of men and women as a whole might differ from one
another, and neither have we asked why the relationship which exists
between the social-class origins and destinations of graduates
appears to be less marked amongst women than men. It is to a
consideration of these matters to which we turn in this chapter. It
is divided into three. Part One looks at theoretical approaches to
social class and gender. Part Two looks at the participation of men
and women in higher education. Finally, Part Three looks at the
destinations of graduate men and women, and attempts are made to
interpret the data in terms of the theoretical approaches outlined
earlier in the chapter.
Part One: Theoretical Approaches to Gender and Social Class
Both Marxist and Weberian approaches to social class have been
criticized because they have tended to be 'gender blind' (see
Hartmann, 1981; Beechey, 1986; Crompton and Mann, 1986), that is,
they have tended to ignore differences in the occupations and
social-class situations of men and women. Hartmann (1981: 3-4), for
example, has criticized orthodox Marxist theory in so far as the
dichotomous social-class schema it employs (bourgeoisie and
proletariat) sees the proletariat as undifferentiated and
PAGE 223
homogeneous and as such ignores the extent to which the occupations
of men and women differ. The reasons for this neglect are not hard
to find: until comparatively recently women tended to withdraw from
the labour market when they married or started families with the
result that working women tended to be young and/or single and few
had a career. Moreover, women have also been ignored in studies of
social mobility, it being argued (Goldthorpe, 1983; see also
Walby, 1986) that the household rather than the individual should be
proper unit of analysis, and that since men rather than women are
the main breadwinners in most families, the husband's, rather than
the wife's, occupation is the best indicator of the family's
social-class position (see Chapter Three).
Recent years have seen a large increase in the numbers of women
participating in the labour market. Married women in particular are
now far more likely to work, the proportion in employment having
risen from 21.7% in 1951, to 29.7% in 1961 and 50% in 1981.
Moreover, whilst the number of males in employment fell from 13.1
million in 1979 to 11.5 million in 1983, the number of women in
employment has fallen by only a third of this figure from 9.3 to
8.8 million, with a slight increase having been registered in the
numbers working part-time (Beechey, 1986). Finally, the rising
divorce rate combined with an increase in the numbers of
illegitimate births has led to a large increase in the number of
single-parent families without a male head.
Research which has been undertaken into the employment of women
suggests that not only do women tend to be employed in different
occupations to men but the jobs which they do tend to be of lower
PAGE 224
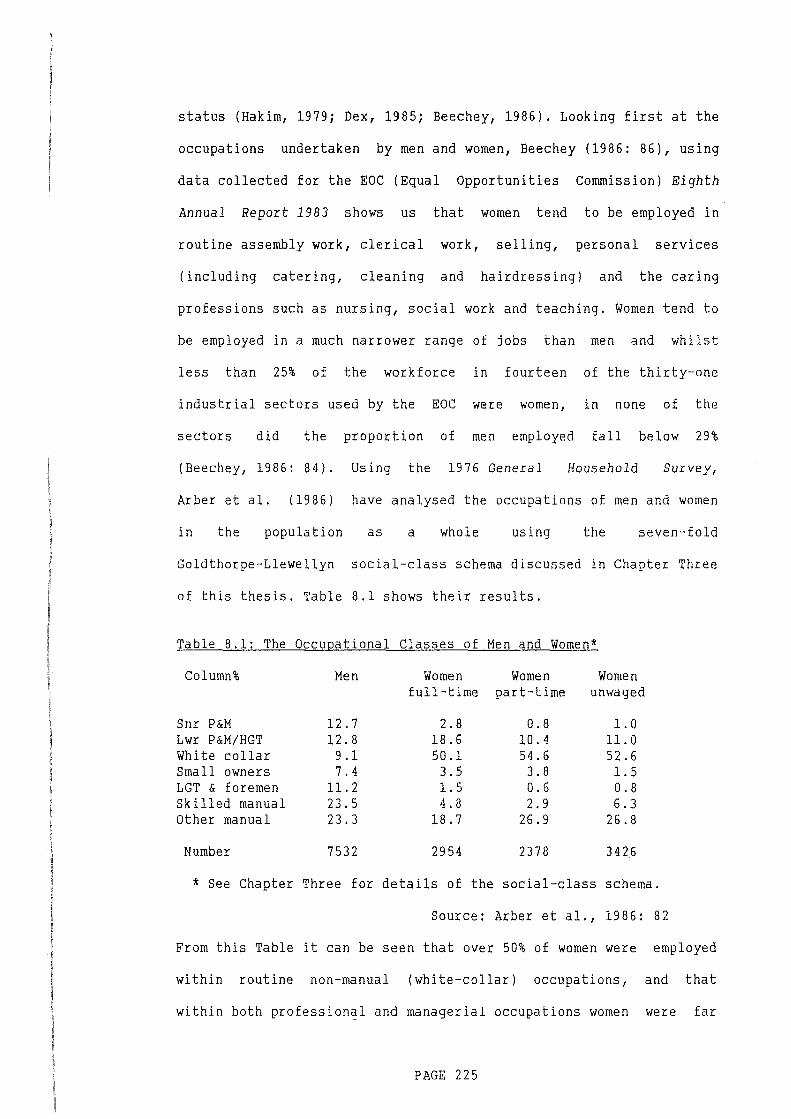
status (Hakim, 1979; Dex, 1985; Beechey, 1986). Looking first at the
occupations undertaken by men and women, Beechey (1986: 86), using
data collected for the EOC (Equal Opportunities Commission) Eighth
Annual Report 1983 shows us that women tend to be employed in
routine assembly work, clerical work, selling, personal services
(including catering, cleaning and hairdressing) and the caring
professions such as nursing, social work and teaching. Women tend to
be employed in a much narrower range of jobs than men and whilst
less than 25% of the workforce in fourteen of the thirty-one
industrial sectors used by the EOC were women, in none of the
sectors did the proportion of men employed fall below 29%
(Beechey, 1986: 84). Using the 1976 General Household Survey,
Arber et al. (1986) have analysed the occupations of men and women
in the population as a whole using the seven-fold
Goldthorpe-Llewellyn social-class schema discussed in Chapter Three
of this thesis. Table 8.1 shows their results.
Table 8.1: The Occupational Classes of Men and Women*
Column% Men Women Women Women full-time part-time unwaged
Snr P&M 12.7 2.8 0.8 1.0 Lwr P&M/HGT 12.8 18.6 10.4 ll. 0 White collar 9.1 50.1 54.6 52.6 Small owners 7.4 3.5 3. 8 1.5 LGT & foremen 11.2 1.5 0.6 0.8 Skilled manual 23.5 4.8 2.9 6.3 Other manual 23.3 18.7 26.9 26.8
Number 7532 2954 2378 3426
* See Chapter Three for details of the social-class schema.
Source: Arber et al., 1986: 82
From this Table it can be seen that over 50% of women were employed
within routine non-manual (white-collar) occupations, and that
within both profession~! and managerial occupations women were far
PAGE 225
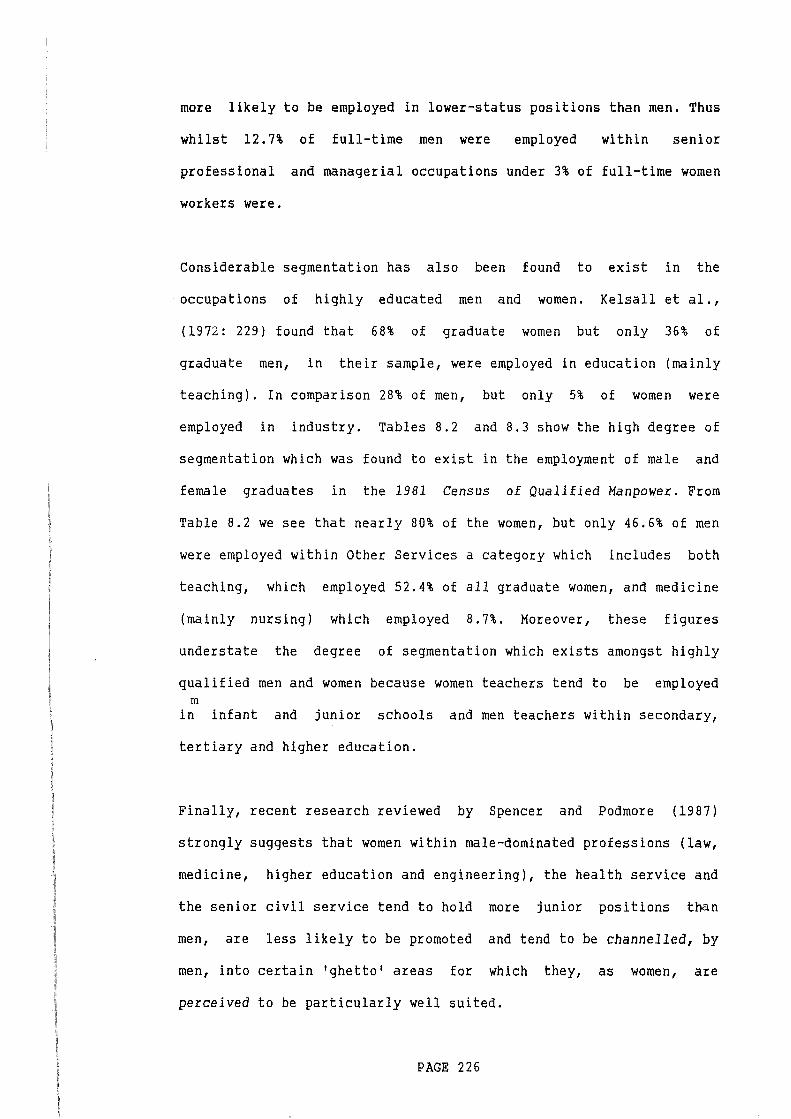
more likely to be employed in lower-status positions than men. Thus
whilst 12.7% of full-time men were employed within senior
professional and managerial occupations under 3% of full-time women
workers were.
Considerable segmentation has also been found to exist in the
occupations of highly educated men and women. Kelsall et al.,
(1972: 229) found that 68% of graduate women but only 36% of
graduate men, in their sample, were employed in education (mainly
teaching). In comparison 28% of men, but only 5% of women were
employed in industry. Tables 8.2 and 8.3 show the high degree of
segmentation which was found to exist in the employment of male and
female graduates in the 1981 Census of Qualified Manpower. From
Table 8.2 we see that nearly 80% of the women, but only 46.6% of men
were employed within Other Services a category which includes both
teaching, which employed 52.4% of all graduate women, and medicine
(mainly nursing) which employed 8.7%. Moreover, these figures
understate the degree of segmentation which exists amongst highly
qualified men and women because women teachers tend to be employed m
in infant and junior schools and men teachers within secondary,
tertiary and higher education.
Finally, recent research reviewed by Spencer and Podmore (1987)
strongly suggests that women within male-dominated professions (law,
medicine, higher education and engineering), the health service and
the senior civil service tend to hold more junior positions than
men, are less likely to be promoted and tend to be channelled, by
men, into certain 'ghetto' areas for which they, as women, are
perceived to be particularly well suited.
PAGE 226
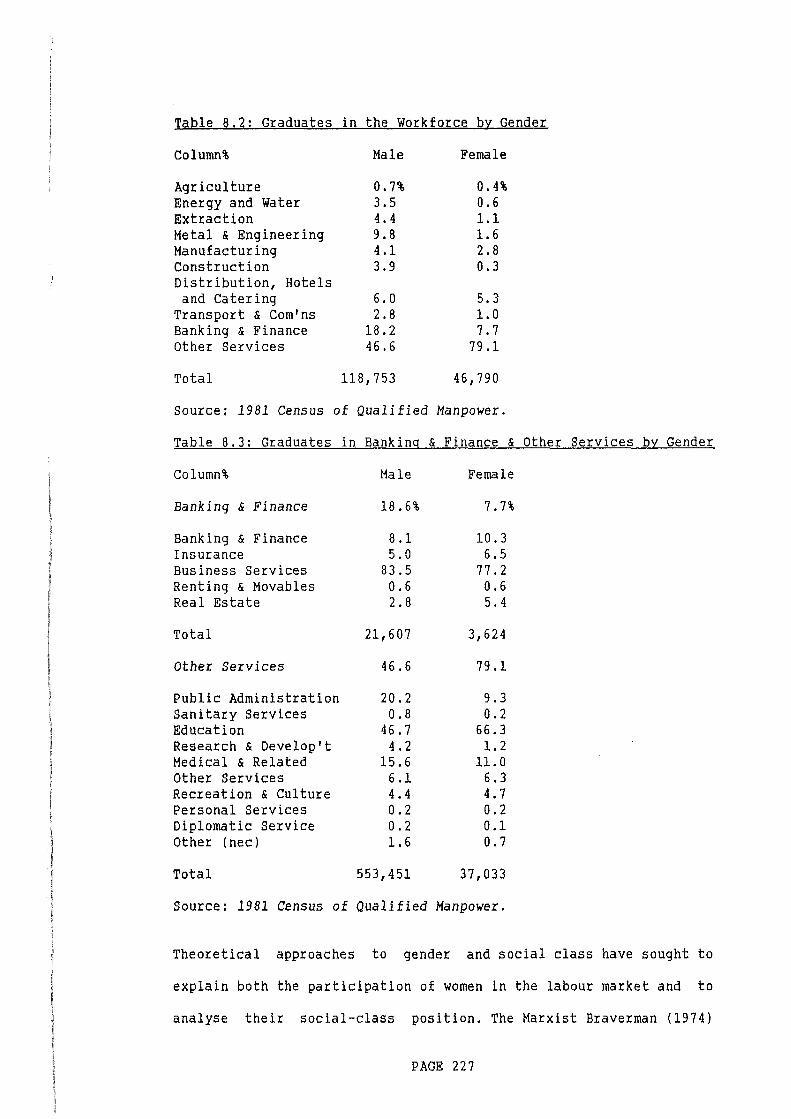
Table 8.2: Graduates in the Workforce by Gender
Column% Male Female
Agriculture 0.7% 0.4% Energy and Water 3.5 0.6 Extraction 4. 4 1.1 Metal & Engineering 9.8 1.6 Manufacturing 4.1 2.8 Construction 3.9 0.3 Distribution, Hotels and Catering 6.0 5.3
Transport & Com'ns 2.8 1.0 Banking & Finance 18.2 7.7 Other Services 46.6 79.1
Total 118,753 46,790
Source: 1981 Census of Qualified Manpower.
Table 8.3: Graduates in Banking & Finance & Other Services by Gender
Column%
Banking & Finance
Banking & Finance Insurance Business Services Renting & Movables Real Estate
Total
Other Services
Public Administration Sanitary Services Education Research & Develop't Medical & Related Other Services Recreation & Culture Personal Services Diplomatic Service Other (nee)
Total
Male
18.6%
8.1 5.0
83.5 0.6 2.8
21,607
46.6
20.2 0.8
46.7 4. 2
15.6 6.1 4.4 0.2 0.2 1.6
553,451
Female
7. 7%
10.3 6.5
77.2 0.6 5.4
3,624
79.1
9.3 0.2
66.3 1.2
11.0 6.3 4.7 0.2 0.1 0.7
37,033
Source: 1981 Census of Qualified Manpower.
Theoretical approaches to gender and social class have sought to
explain both the participation of women in the labour market and to
analyse their social-class position. The Marxist Braverman (1974)
PAGE 227
has argued that the process of capitalist development has had an
effect on the historical development of the family and productive
enterprises. The growth of labour-saving goods industries for the
home (processed foods, vacuum cleaners, washing machines, etc.) and
the development of education and social services has integrated into
the market economy many of the jobs traditionally undertaken by
women in the home, which, in turn, has released many women for
employment. Moreover, the growth of large productive enterprises,
the separation of ownership from control and the deskilling of many
previously skilled jobs has created new job opportunities. Women are
seen to be ideal employees in these new industries, because, many of
them have created jobs which women have traditionally undertaken in
the home and because women are a cheap source of labour. In this
view women are seen to form a part of the lumpenproletariat (the
reserve army of unemployed) who are relatively easy to dispense with
in times of recession. The problem with this approach is that in
using a simple dichotomous social-class schema (bourgeoisie and
proletariat) Braverman ignores the extent to which women tend to be
employed within a subordinate position to men within the productive
process. Nevertheless the approach is of some interest to us in so
far as it suggests that women will be employed in those tasks which
were formally undertaken within the confines of the family (caring
and education).
Another approach is that taken by Barron and Norris (1976) who have
attempted to analyse the position of women in the labour market
using dual labour market theory. This sees the labour market as
segmented into two distinct sectors: a primary sector, composed of
highly skilled workers with high incomes, stable jobs, career
PAGE 228
ladders, good working conditions and fringe benefits, and a
secondary sector with the opposite characteristics. Barron and
Norris (1976) go on to argue that the processes by which workers are
recruited into the two sectors differ and whilst men tend to be
employed in the primary sector, women tend to be recruited into the
secondary sector of the economy where they undertake unskilled and
semiskilled work, earn little and have only poor job security. To
Barron and Norris women are ideal people to employ within the
secondary sector: they are easy to dispense with in times of
recession, there is a clear physical difference between them and
men, they often have little interest in acquiring training, are
often prepared to work for a low income and have little involvement
with trades unions. This approach has, however, been criticized
because it is based on evidence collected from a limited number of
manufacturing industries and it ignores the fact that women are
employed within all social classes.
Nevertheless Barron and Norris's approach is of some interest to us
in so far as it focuses attention on the extent to which women might
be disadvantaged in the actual recruitment process. Should employers
have a preference for employing graduate men rather than women then
graduate women are likely to be employed in lower-status jobs than
graduate men. There are several
employers may have a preference for men
reasons
rather
for believing
than women.
that
Prime
amongst these is tradition, that is, men have always tended to be
employed in some jobs and through habit continue to be so. Secondly,
there is a cost involved to employers in training people to
undertake senior managerial roles, and employers may be reluctant to
incur this cost on training women for fear that they may leave after
PAGE 229
a short period of time: for example, to start a family. Thirdly, in
a society in which men rather than women tend to hold the more
senior positions within companies, employers may be reluctant to
employ women in these posts for fear of upsetting a predominantly
male workforce. Finally, Spencer and Podmore (1987: 2) have
suggested that employers may hold stereotyped images of women as
'emotional', 'unstable' and 'indecisive', and hence unsuitable for
employment within the 'more' physically demanding professions (see
also Roizen and Jepson, 1985: 167-8).
This approach, in turn, can be criticized because it ignores the
ability which male-dominated trades unions and professional
associations might have to limit recruitment into particular trades
and occupations. In particular, Parkin (1979: 95-7) and Beechey
(1986) seek to explain the tendency of women to undertake different,
and often lower-status, jobs than men in terms of the operation of
exclusionary
associations,
professional
strategies
who seek
occupations
by
to
in
trades
exclude
order
unions and professional
women from many skilled and
to maintain high levels of
remuneration. To Parkin women occupy a dual class position in the
labour market itself, vis-a-vis employers on the one hand and male
employees on the other. This theme is also taken up by Spencer and
Podmore (1987: 2) who argue that many women may find it difficult to
establish themselves in the professions because they lack the
support of senior professionals who fear that the influx of women
into the profession may adversely affect levels of remuneration and
prestige, and they may, therefore, be reluctant to employ women
and/or provide financial support for their training.
PAGE 230
An altogether different way of looking at the social-class position
of women is that used by radical and Marxist feminists. There are
several approaches (Millet, 1970; Firestone, 1972; Rowbotham, 1973;
Parkin, 1979; Hartmann, 1981; Walby, 1986) which argue that women
occupy a dual class position. Although these approaches differ in
detail, they agree in so far as they attempt to analyse the position
of women in terms of patriarchy and the social division of labour -
two concepts which are closely linked together. The social division
of labour refers to the extent to which roles within the family are
differentiated according to gender such that men tend to be employed
within the public domain of the workplace and women tend to be
employed within the private domain of the home. In a Marxist sense
both sexes are seen to constitute a section of the proletariat, but,
whilst men tend to be employed directly in the productive process,
women have responsibility for the reproduction of the labour force,
not only in a biological sense but also in terms of the
socialization of children (Rowbotham, 1973). Patriarchy refers to
the way in which power is structured within the family and wider
society and in particular refers to the subordination of men and
women. In some Marxist approaches (Firestone, 1972; Hartmann; 1981)
patriarchy is viewed as a parallel form of exploitation by which men
exploit women within the family. Marxist-Feminists disagree as to
the extent to which social class and patriarchy are two distinct
systems of exploitation. Firestone (1972) and Hartmann (1981) argue
that patriarchy has existed in all past societies, its form being
determined by the predominant mode of production. Others, for
example Young (1981), disagree because the factors which account for
the existence of patriarchy are rarely spelt out. Despite these
disagreements, however, Marxist-Feminists are agreed that women in
PAGE 231
our patriarchal society occupy a subordinate position to men.
Writing from within a Weberian perspective, Walby (1986) argues that
men and women do not form social classes but rather, ' ... housewives
and husbands can be conceptualized as classes, when class is defined
in terms of a distinctive work and market situation' (p 33). Within
this approach a class relationship exists within the family which is
patriarchal in form and in which the wife occupies a subordinate
position to that of her husband and is exploited in so far as she
performs domestic tasks for which she is not paid. Moreover, Walby
continues, the subordinate position of women is independent of the
husband's social-class position, and even in those instances in
which the family is rich enough to employ servants the wife is still
very often financially dependent on her husband and also serves a
managerial role vis-a-vis her servants.
Although we shall have little to say about the family and the
relationship which might exist within it between the husband and the
wife, these approaches are of considerable interest to us in so far
as people tend to be 'socialized' into a specific social-class
position. Bell and Newby (1976) have argued that girls and young
women tend to be socialized both at home and school to accept a
subordinate position within the family, to accept male authority, to
defer to male decisions and to accept the major responsibilities for
child rearing. Thus they write (p. 160):
That male and female children are in many important respects treated differently from birth by all their significant others, in a manner that is consistent with the existing ideological hegemony, is a, if not the vital social mechanism for the creation and maintenance of this (patriarchal) ideological control (their emphasis).
PAGE 232
This is important to us because if these writers are correct in
their analysis of the family and of the nature of male and female
socialization, then one might expect this to be reflected not only
in the role of men and women in the family but also in the
occupations which men and women enter, and, in fact, it will be
recalled from our earlier discussion that the occupations of men and
women do indeed differ significantly from one another with
'educated' women tending to be employed within health and education
to which, owing to their socialization, one might logically expect
them to be particularly well suited.
Although Turner (1960), in his discussion of sponsored and contest
mobility, did not specifically discuss gender, it is possible to
make a few comments on how the education of boys and girls might
differ under a sponsorship system such as that which exists in Great
Britain. Since women are socialized primarily to play a domestic
role within the family as housewives and mothers one might logically
expect fewer women than men to participate in higher education.
Moreover, one might also expect the curriculum taught to boys and
girls to differ significantly, that taught to boys having a
relatively strong vocational content and that taught to girls having
a strong domestic content. As we have seen the curriculum also
varies according to the expected occupational and social-class
destinations of the child. Thus boys earmarked for employment within
manual occupations tend to be taught a utilitarian curriculum and
those earmarked for employment within more middle-class occupations
tend to be taught a more academically-orientated curriculum. The
curriculum taught to girls, however, tends to reflect the needs of
their future husbands rather than themselves. Thus those expected to
PAGE 233
marry into the working-classes tend to
curriculum with a stress on domestic subjects
be taught a utilitarian
(Needlework,
to marry
Cookery
into the and Child care), whilst those expected
middle-classes tend to be taught a more academically-orientated
curriculum with a stress on the more cultural subjects (History,
Languages, Music, etc) which would equip them with skills which
would enable them to support their husbands in their careers and
help them to socialize their own children into middle-class mores.
In this approach the vocational content of the female school
curriculum can be thought of as a by-product of its primary function
of socializing girls into a subordinate social-class position within
the family, and can be expected to channel women into careers which
tend to be related to what the feminist writer Navarra (1980: 17-9)
has referred to as the 'six tasks' for which women have historically
been responsible, namely: 'child rearing', 'agriculture',
'clothing', 'caring', 'education' and 'domestic work' (see also
Deem, 1978; Arnot, 1986).
To summarise, a number of theoretical approaches to the social-class
positions of men and women have been discussed and it can now be
suggested that graduate women might be employed within a different
range of, often lower-status, jobs than men. Two reasons have been
advanced for believing that this might be so. Firstly, it has been
suggested that women might be disadvantaged in the actual
recruitment process both because employers might have a preference
for employing men rather than women and because professional
associations and trades unions might operate exclusionary policies
to the advantage of their predominantly male membership. Secondly,
women might be disadvantaged because they are socialized into a
PAGE 234
dual-class position within the home and work place. In this approach
women come to find employment within different and lower-status jobs
than men because their socialization and secondary education aims to
equip them to play a domestic role within the family which
constrains the range of occupations and careers open to them.
Part Two: Secondary Education & Participation in Higher Education
If, as was suggested earlier, women are socialized into a
subordinate social-class position within the family, then one might
expect fewer of them to participate in higher education. In fact, as
was mentioned in Chapter Four (Table 4.1) women are indeed less
likely to participate in higher education than men, although the
proportion of women amongst the student population (excluding the
old colleges of education) has risen from around 25% in the early
1950s to about 40% in the early 1980s. Similar proportions of men
and women students can be found in the polytechnics and
universities, although the proportion of women attending colleges of
higher education is probably higher. Regarding their social-class
origins, it seems reasonable to argue that women from working-class
backgrounds will be doubly disadvantaged and will be less likely to
participate in higher education than those from more middle-class
backgrounds. Indeed a number of studies (Whiteburn et al., 1976;
Edwards, 1982) have found that women students are less likely to
come from manual origins than men and more likely to come from more
middle-class backgrounds. As was shown in Chapter Four (Table 4.9),
this trend was also found in the HELM data set, although the
differences are not particularly marked.
PAGE 235
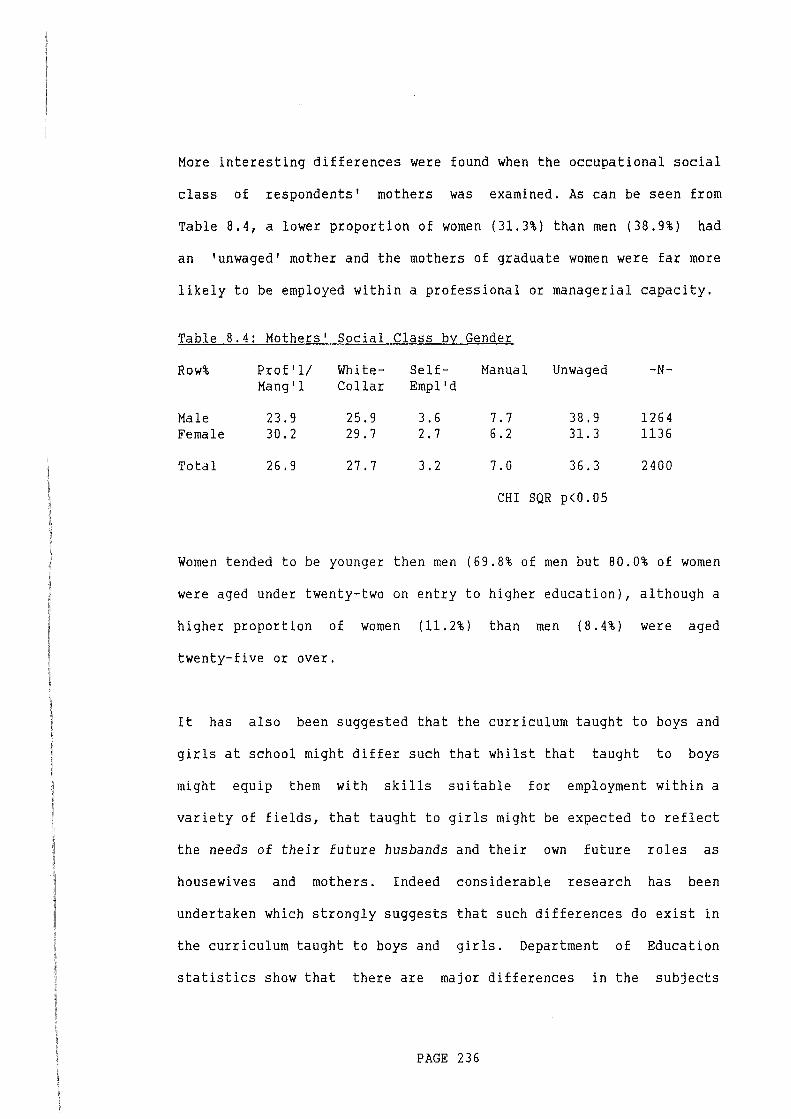
More interesting differences were found when the occupational social
class of respondents' mothers was examined. As can be seen from
Table 8.4, a lower proportion of women (31.3%) than men (38.9%) had
an 'unwaged' mother and the mothers of graduate women were far more
likely to be employed within a professional or managerial capacity.
Table 8.4: Mothers' Social Class by Gender
Row% Prof '11 White- Self- Manual Unwaged -N-Mang'l Collar Empl'd
Male 23.9 25.9 3.6 7.7 38.9 1264 Female 30.2 29.7 2. 7 6.2 31.3 1136
Total 26.9 27.7 3.2 7.0 36.3 2400
CHI SQR p<O.OS
Women tended to be younger then men (69.8% of men but 80.0% of women
were aged under twenty-two on entry to higher education), although a
higher proportion of women (11.2%) than men (8.4%) were aged
twenty-five or over.
It has also been suggested that the curriculum taught to boys and
girls at school might differ such that whilst that taught to boys
might equip them with skills suitable for employment within a
variety of fields, that taught to girls might be expected to reflect
the needs of their future husbands and their own future roles as
housewives and mothers. Indeed considerable research has been
undertaken which strongly suggests that such differences do exist in
the curriculum taught to boys and girls. Department of Education
statistics show that there are major differences in the subjects
PAGE 236
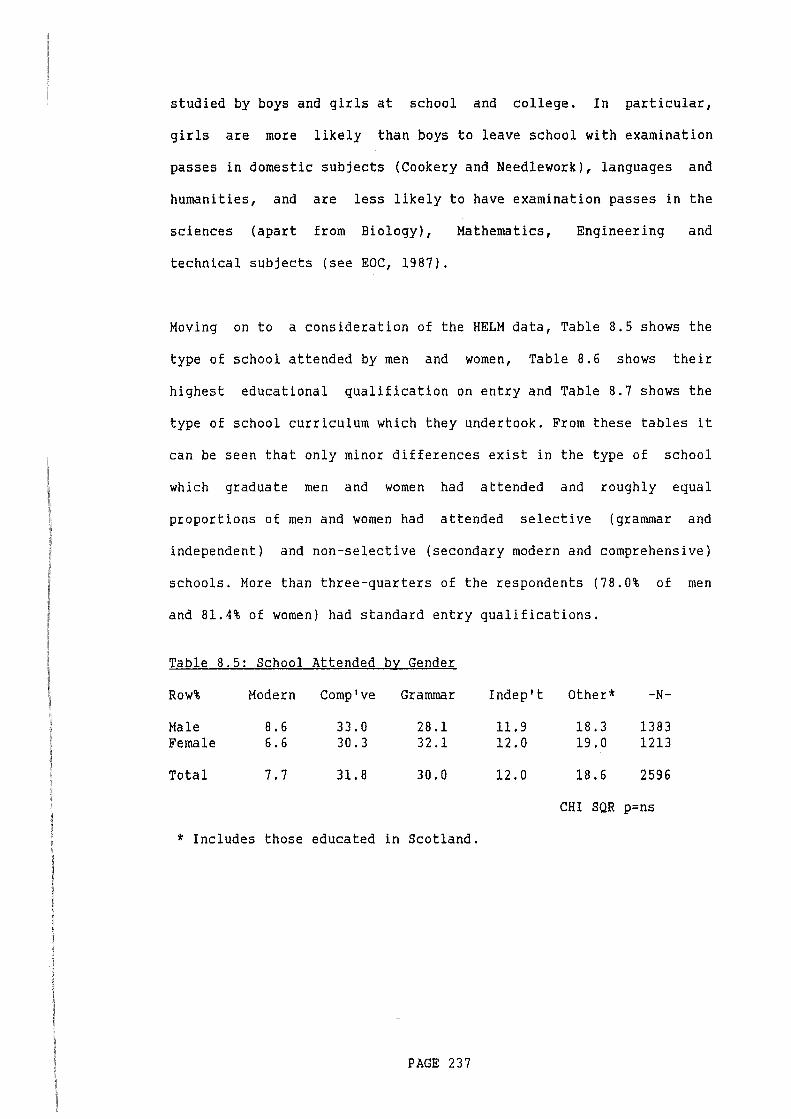
studied by boys and girls at school and college. In particular,
girls are more likely than boys to leave school with examination
passes in domestic subjects (Cookery and Needlework), languages and
humanities, and are less likely to have examination passes in the
sciences (apart from Biology), Mathematics, Engineering and
technical subjects (see EOC, 1987).
Moving on to a consideration of the HELM data, Table 8.5 shows the
type of school attended by men and women, Table 8.6 shows their
highest educational qualification on entry and Table 8.7 shows the
type of school curriculum which they undertook. From these tables it
can be seen that only minor differences exist in the type of school
which graduate men and women had attended and roughly equal
proportions of men and women had attended selective (grammar and
independent) and non-selective (secondary modern and comprehensive)
schools. More than three-quarters of the respondents (78.0% of men
and 81.4% of women) had standard entry qualifications.
Table 8.5: School Attended by Gender
Row% Modern Comp've Grammar Indep't Other* -N-
Male 8. 6 33.0 28.1 11.9 18.3 1383 Female 6.6 30.3 32.1 12.0 19.0 1213
Total 7.7 31.8 30.0 12.0 18.6 2596
CHI SQR p=ns
* Includes those educated in Scotland.
PAGE 237
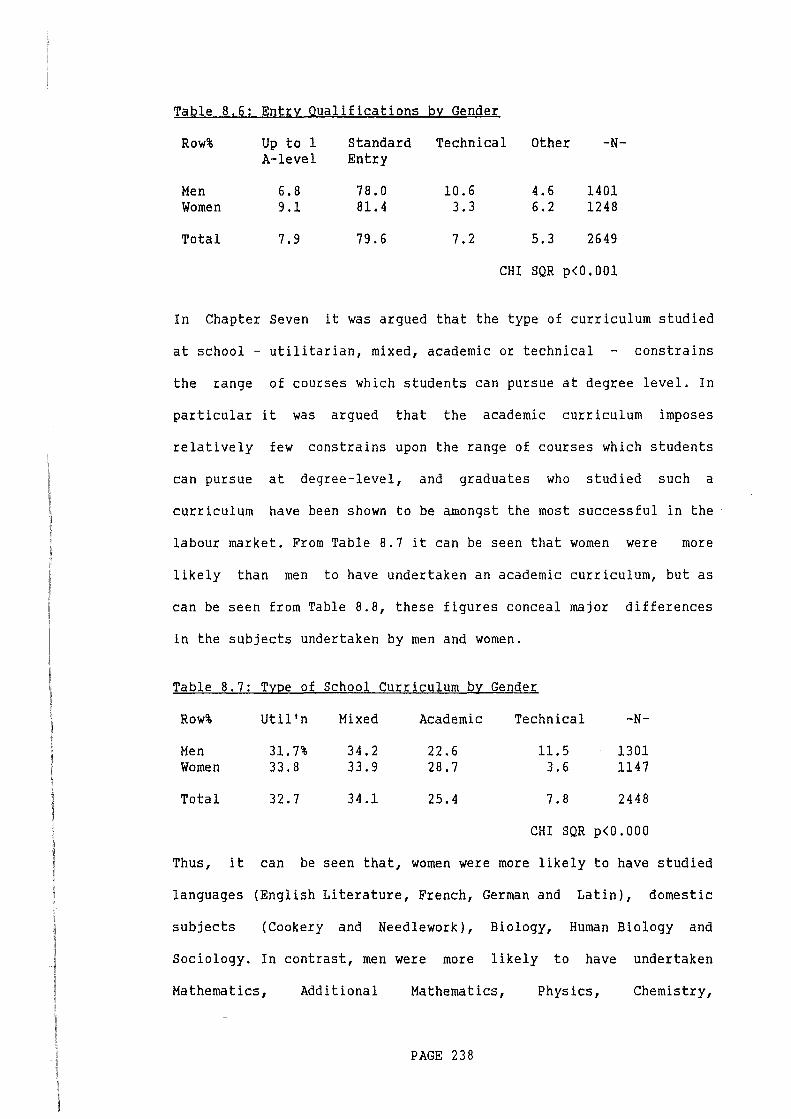
Table 8.6: Entry Qualifications by Gender
Row% Up to 1 Standard Technical Other -N-A-level Entry
Men 6.8 78.0 10.6 4.6 1401 Women 9.1 81.4 3.3 6.2 1248
Total 7.9 79.6 7.2 5.3 2649
CHI SQR p<0.001
In Chapter Seven it was argued that the type of curriculum studied
at school - utilitarian, mixed, academic or technical constrains
the range of courses which students can pursue at degree level. In
particular it was argued that the academic curriculum imposes
relatively few constrains upon the range of courses which students
can pursue at degree-level, and graduates who studied such a
curriculum have been shown to be amongst the most successful in the
labour market. From Table 8.7 it can be seen that women were more
likely than men to have undertaken an academic curriculum, but as
can be seen from Table 8.8, these figures conceal major differences
in the subjects undertaken by men and women.
Table 8.7: Type of School Curriculum by Gender
Row% Util' n Mixed Academic Technical
Men Women
Total
31.7% 33.8
32.7
34.2 33.9
34.1
22.6 28.7
25.4
11.5 3.6
7.8
-N-
1301 1147
2448
CHI SQR p<O.OOO
Thus, it can be seen that, women were more likely to have studied
languages (English Literature, French, German and Latin), domestic
subjects (Cookery and Needlework), Biology, Human Biology and
Sociology. In contrast, men were more likely to have undertaken
Mathematics, Additional Mathematics, Physics, Chemistry,
PAGE 238
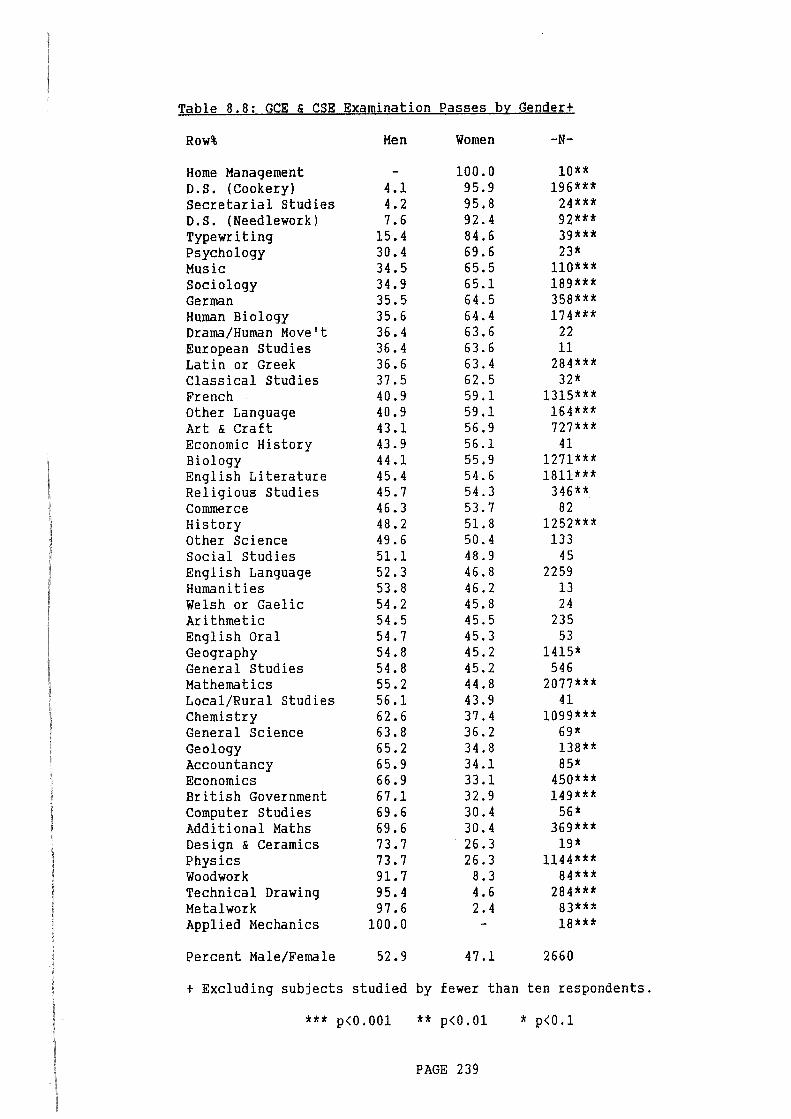
Table 8.8tGCE & CSE Examination Passes by Gender+
Row% Men Women -N-
Home Management - 100.0 10** D.S. (Cookery) 4.1 95.9 196*** Secretarial Studies 4.2 95.8 24*** D.S. (Needlework) 7.6 92.4 92*** Typewriting 15.4 84.6 39*** Psychology 30.4 69.6 23* Music 34.5 65.5 110*** Sociology 34.9 65.1 189*** German 35.5 64.5 358*** Human Biology 35.6 64.4 174*** Drama/Human Move't 36.4 63.6 22 European Studies 36.4 63.6 11 Latin or Greek 36.6 63.4 284*** Classical Studies 37.5 62.5 32* French 40.9 59.1 1315*** Other Language 40.9 59.1 164*** Art & Craft 43.1 56.9 727*** Economic History 43.9 56.1 41 Biology 44.1 55.9 1271*** English Literature 45.4 54.6 1811*** Religious Studies 45.7 54.3 346** Commerce 46.3 53.7 82 History 48.2 51.8 1252*** Other Science 49.6 50.4 133 Social Studies 51.1 48.9 45 English Language 52.3 46.8 2259 Humanities 53.8 46.2 13 Welsh or Gaelic 54.2 45.8 24 Arithmetic 54.5 45.5 235 English Oral 54.7 45.3 53 Geography 54.8 45.2 1415* General Studies 54. 8 45.2 546 Mathematics 55.2 44.8 2077*** Local/Rural Studies 56.1 43.9 41 Chemistry 62.6 37.4 1099*** General Science 63.8 36.2 69* Geology 65.2 34.8 138** Accountancy 65.9 34.1 85* Economics 66.9 33.1 450*** British Government 67.1 32.9 149*** Computer Studies 69.6 30.4 56* Additional Maths 69.6 30.4 369*** Design & Ceramics 73.7 26.3 19* Physics 73.7 26.3 1144*** Woodwork 91.7 8.3 84*** Technical Drawing 95.4 4.6 284*** Metalwork 97.6 2.4 83*** Applied Mechanics 100.0 - 18***
Percent Male/Female 52.9 47.1 2660
+ Excluding subjects studied by fewer than ten respondents.
*** p<0.001 ** p<0.01 * p<O.l
PAGE 239
Technical Drawing, Economics, Woodwork and Metalwork. These findings
are in line with the published statistics of the DES and in terms of
the analysis introduced in the last chapter one might expect the
formal curriculum undertaken by women at school to constrain the
range of subjects which they are able to pursue in higher education.
Indeed, Arnot (1986) has argued that amongst school leavers women
find it difficult to obtain craft apprenticeships because they lack
passes in Woodwork, Metalwork, Technical Drawing, etc., with the
result that they are often 'channelled' into work of a clerical or
personal service nature (hairdressing, shop assistants, etc.), and
partly-skilled light assembly work in, for example, the electronics,
textile and pottery industries (see also Silverstone and Ward, 1980:
209). Amongst those women who go on to higher education one might
expect their choice of degree subject to be constrained such that
they would be more likely than men to undertake the more generalist
courses in humanities and the social sciences and specialist courses
leading to employment within the 'caring' professionals: nursing,
teaching, social work, etc.. Moreover, men, were more likely than
women, to have a technical qualifications (see Table 8.7), and this
is important because students with such a qualification are often
preferred on courses such as Engineering, Business Studies,
Computing and Economics with the result that women may find it more
difficult than men to obtain places on such courses.
Table 8.9 shows the proportions of men and women who undertook each
of the 31 types of course included in the HELM sample. If a sex
ratio in the range 60:40 to 40:60 is taken, if somewhat arbitrarily,
as an indication of a sexually balanced course, than nine of the
PAGE 240
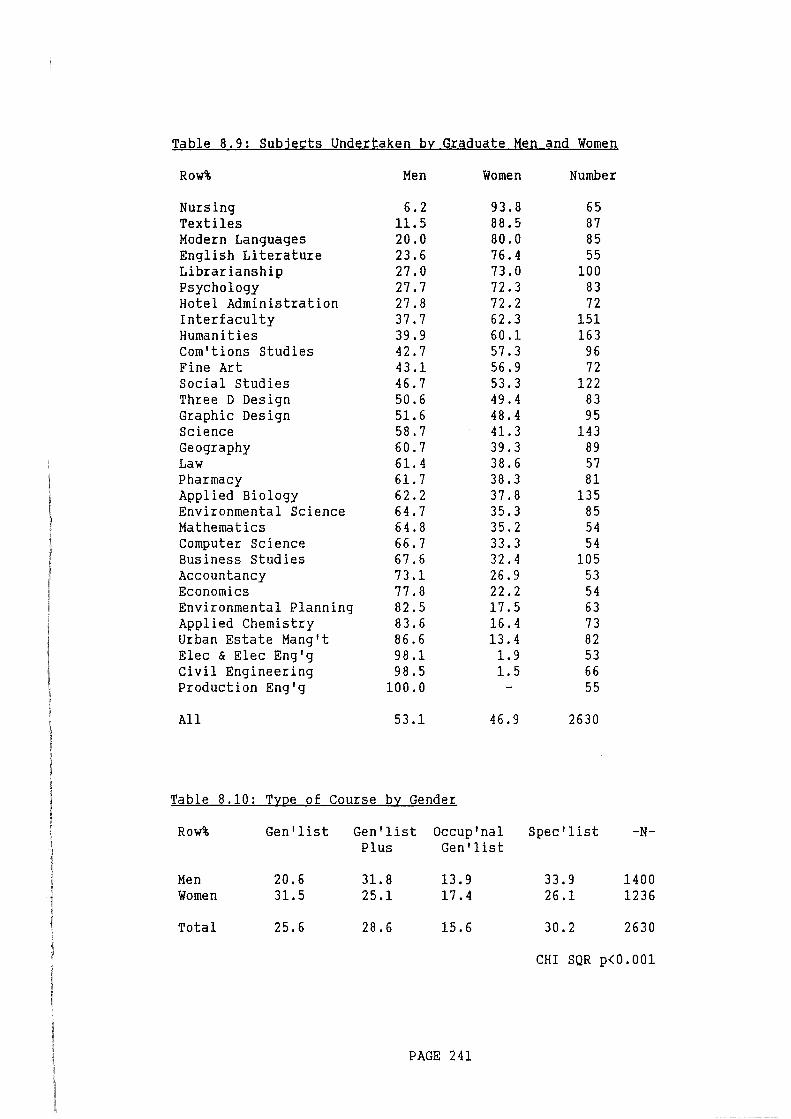
Table 8o9: Subjects Undertaken by Graduate Men and Women
Row% Men Women Number
Nursing 6o2 93o8 65 Textiles 1lo5 88o5 87 Modern Languages 20o0 80o0 85 English Literature 23o6 76o4 55 Librarianship 27o0 73o0 100 Psychology 27o7 72 0 3 83 Hotel Administration 27o8 72 0 2 72 Interfaculty 37o7 62o3 151 Humanities 39o9 60o1 163 Com'tions Studies 42o7 57o3 96 Fine Art 43o1 56o9 72 Social Studies 46o7 53o3 122 Three D Design 50o6 49o4 83 Graphic Design 51.6 48o4 95 Science 58o7 41.3 143 Geography 60o7 39o3 89 Law 61.4 38o6 57 Pharmacy 61.7 38o3 81 Appli.ed Biology 62.2 37.8 135 Environmental Science 64o7 35o3 85 Mathematics 64.8 35.2 54 Computer Science 66o7 33o3 54 Business Studies 67.6 32o4 105 Accountancy 73.1 26o9 53 Economics 77o8 22o2 54 Environmental Planning 82.5 l7o5 63 Applied Chemistry 83.6 16.4 73 Urban Estate Mang't 86o6 13o4 82 Elec & Elec Eng'g 98.1 1.9 53 Civil Engineering 98o5 1.5 66 Production Eng'g 100o0 - 55
All 53.1 46o9 2630
Table 8.10: Type of Course by Gender
Row% Gen 'list Gen'list Occup'nal Spec'list -N-Plus Gen'list
Men 20.6 31.8 13o9 33o9 1400 Women 31.5 25.1 17o4 26.1 1236
Total 25.6 28o6 15.6 30o2 2630
CHI SQR p<Oo001
PAGE 241
thirty-one courses had a majority of women, sixteen had a majority
of men and only six had roughly equal proportions of men and women.
These findings are in line with expectation and support our
hypothesis that the subjects and curriculum studied by girls at
school is likely to exert a major influence on the courses which
they pursue in higher education. Thus we see that women were far
less likely than men to have studied engineering and science
subjects and far more likely to have undertaken Nursing, Modern
Languages, Textiles and Librarianship. These differences are also
apparent in Table 8.10, which shows the vocational-specificity
of courses broken down by gender, and from this we see that women
were far more likely than men to have undertaken a generalist course
and less likely to have undertaken a specialist one.
Part Three: Men and Women in the Graduate Labour Market
Using HELM data Chapman (1986) has examined the careers of graduate
men and women during their first year in the labour market. His work
suggests that men and women have different orientations towards
work. Thus from Table 8.11 it can be seen that, relative to men,
women were more likely to seek a career within which they would be
working with people, caring for others and using their special
skills and attributes. They were less concerned than men about their
future salaries, the possibility of rapid promotion and the chance
to exercise leadership. Men and women did not differ, however, as
regards the stress which they placed on professional development,
the chance to improve society and the opportunity to be creative and
original.
PAGE 242
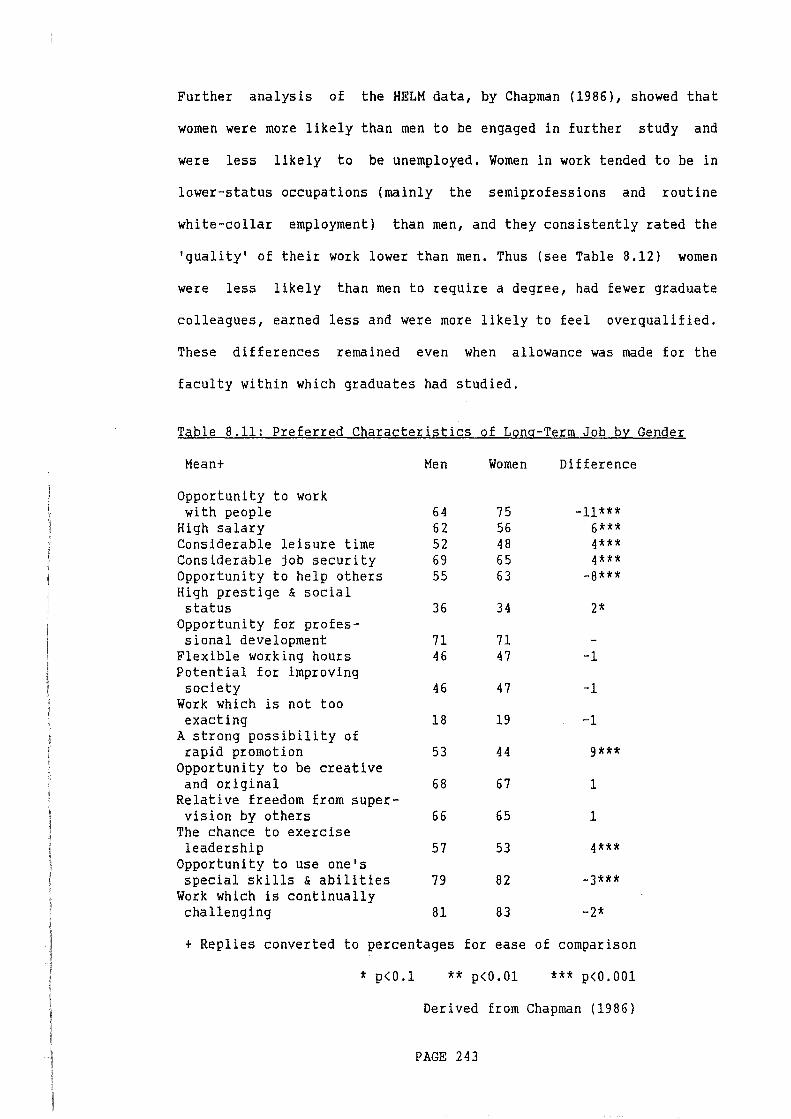
Further analysis of the HELM data, by Chapman (1986), showed that
women were more likely than men to be engaged in further study and
were less likely to be unemployed. Women in work tended to be in
lower-status occupations (mainly the semiprofessions and routine
white-collar employment) than men, and they consistently rated the
'quality' of their work lower than men. Thus (see Table 8.12) women
were less likely than men to require a degree, had fewer graduate
colleagues, earned less and were more likely to feel overqualified.
These differences remained even when allowance was made for the
faculty within which graduates had studied.
Table 8.11: Preferred Characteristics of Long-Term Job by Gender
Mean+
Opportunity to work with people
High salary Considerable leisure time Considerable job security Opportunity to help others High prestige & social status
Opportunity for professional development
Flexible working hours Potential for improving society
Work which is not too exacting
A strong possibility of rapid promotion
Opportunity to be creative and original
Relative freedom from supervision by others
The chance to exercise leadership
Opportunity to use one's special skills & abilities
Work which is continually challenging
Men
64 62 52 69 55
36
71 46
46
18
53
68
66
57
79
81
Women
75 56 48 65 63
34
71 47
47
19
44
67
65
53
82
83
Difference
-11*** 6*** 4*** 4***
-8***
2*
-1
-1
-1
9***
1
1
4***
-3***
-2*
+ Replies converted to percentages for ease of comparison
* p<O.l ** p<0.01 *** p<O. 001
Derived from Chapman (1986)
PAGE 243
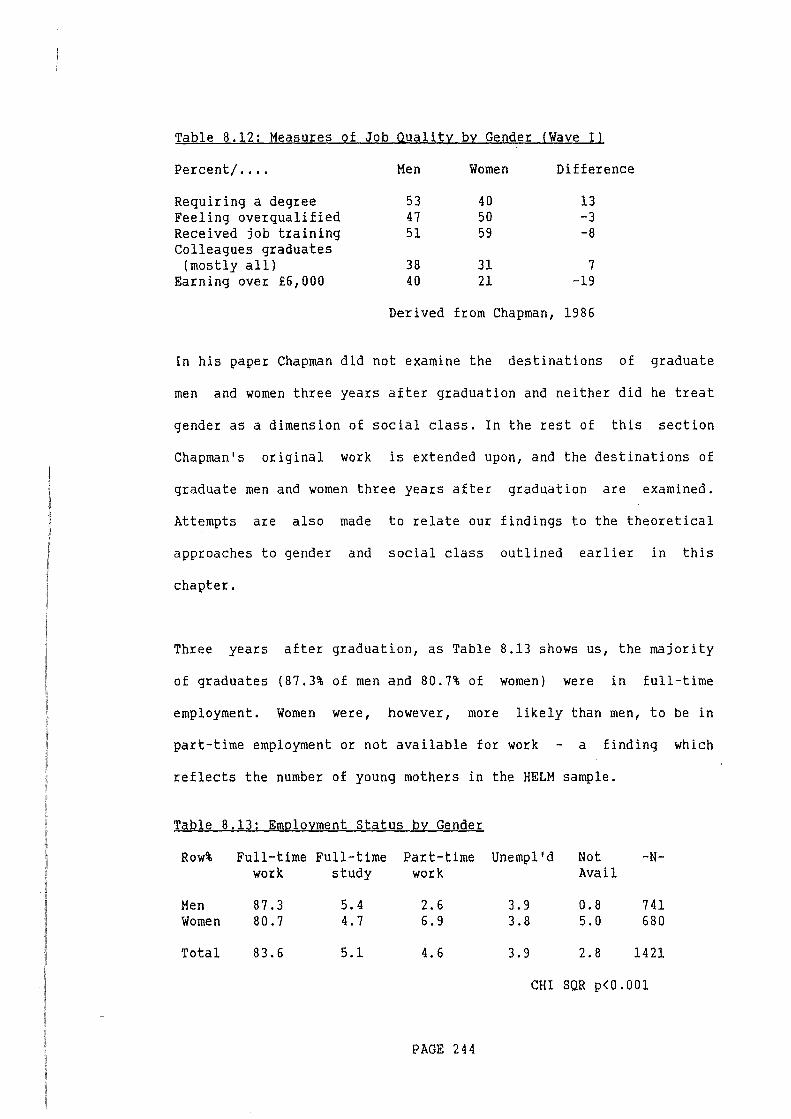
Table 8.12: Measures of Job Quality by Gender (Wave I l
Percent/ .... Men Women Difference
Requiring a degree 53 40 13 Feeling overqualified 47 50 -3 Received job training 51 59 -8 Colleagues graduates
(mostly all) 38 31 7 Earning over £6,000 40 21 -19
Derived from Chapman, 1986
In his paper Chapman did not examine the destinations of graduate
men and women three years after graduation and neither did he treat
gender as a dimension of social class. In the rest of this section
Chapman's original work is extended upon, and the destinations of
graduate men and women three years after graduation are examined.
Attempts are also made to relate our findings to the theoretical
approaches to gender and social class outlined earlier in this
chapter.
Three years after graduation, as Table 8.13 shows us, the majority
of graduates (87.3% of men and 80.7% of women) were in full-time
employment. Women were, however, more likely than men, to be in
part-time employment or not available for work a finding which
reflects the number of young mothers in the HELM sample.
Table 8.13: Employment Status by Gender
Row% Full-time Full-time Part-time Unempl'd Not -N-work study work Avail
Men 87.3 5.4 2.6 3.9 0.8 741 Women 80.7 4.7 6.9 3.8 5.0 680
Total 83.6 5.1 4.6 3.9 2.8 1421
CHI SQR p<O.OOl
PAGE 244
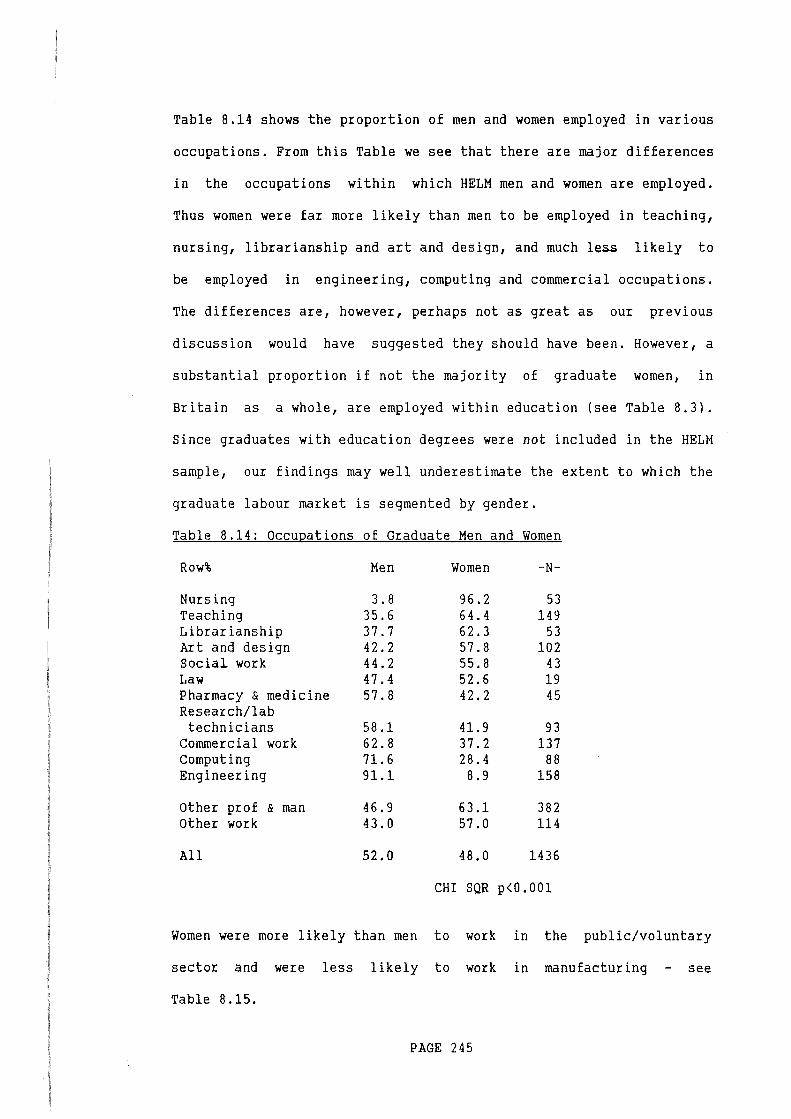
Table 8.14 shows the proportion of men and women employed in various
occupations. From this Table we see that there are major differences
in the occupations within which HELM men and women are employed.
Thus women were far more likely than men to be employed in teaching,
nursing, librarianship and art and design, and much less likely to
be employed in engineering, computing and commercial occupations.
The differences are, however, perhaps not as great as our previous
discussion would have suggested they should have been. However, a
substantial proportion if not the majority of graduate women, in
Britain as a whole, are employed within education (see Table 8.3}.
Since graduates with education degrees were not included in the HELM
sample, our findings may well underestimate the extent to which the
graduate labour market is segmented by gender.
Table 8.14: Occupations of Graduate Men and Women
Row% Men Women -N-
Nursing 3.8 96.2 53 Teaching 35.6 64.4 149 Librarianship 37.7 62.3 53 Art and design 42.2 57.8 102 Social work 44.2 55.8 43 Law 47.4 52.6 19 Pharmacy & medicine 57.8 42.2 45 Research/lab technicians 58.1 41.9 93
Commercial work 62.8 37.2 137 Computing 71.6 28.4 88 Engineering 91.1 8.9 158
Other prof & man 46.9 63.1 382 Other work 43.0 57.0 114
All 52.0 48.0 1436
CHI SQR p<0.001
Women were more likely than men to work in the public/voluntary
sector and were less likely to work in manufacturing - see
Table 8.15.
PAGE 245
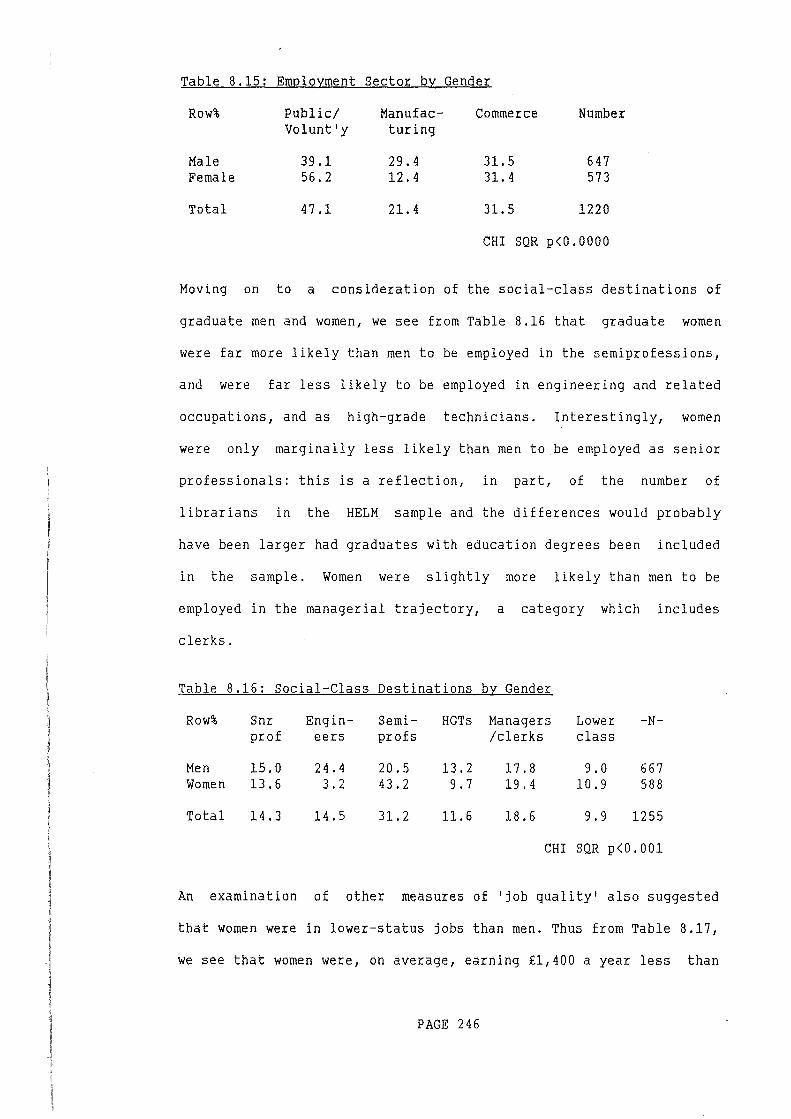
Table 8.15: Employment Sector by Gender
Row% Public/ Manufac- Commerce Number Volunt'y turing
Male 39.1 29.4 31.5 647 Female 56.2 12.4 31. 4 573
Total 47.1 21.4 31.5 1220
CHI SQR p<O.OOOO
Moving on to a consideration of the social-class destinations of
graduate men and women, we see from Table 8.16 that graduate women
were far more likely than men to be employed in the semiprofessions,
and were far less likely to be employed in engineering and related
occupations, and as high-grade technicians. Interestingly, women
were only marginally less likely than men to be employed as senior
professionals: this is a reflection, in part, of the number of
librarians in the HELM sample and the differences would probably
have been larger had graduates with education degrees been included
in the sample. Women were slightly more likely than men to be
employed in the managerial trajectory, a category which includes
clerks.
Table 8.16: Social-Class Destinations by Gender
Row% Snr Eng in- Semi- HGTs Managers Lower -N-prof eers profs /clerks class
Men 15.0 24.4 20.5 13.2 17.8 9.0 667 Women 13.6 3.2 43.2 9.7 19.4 10.9 588
Total 14.3 14.5 31.2 11.6 18.6 9.9 1255
CHI SQR p<D.OOl
An examination of other measures of 'job quality' also suggested
that women were in lower-status jobs than men. Thus from Table 8.17,
we see that women were, on average, earning £1,400 a year less than
PAGE 246
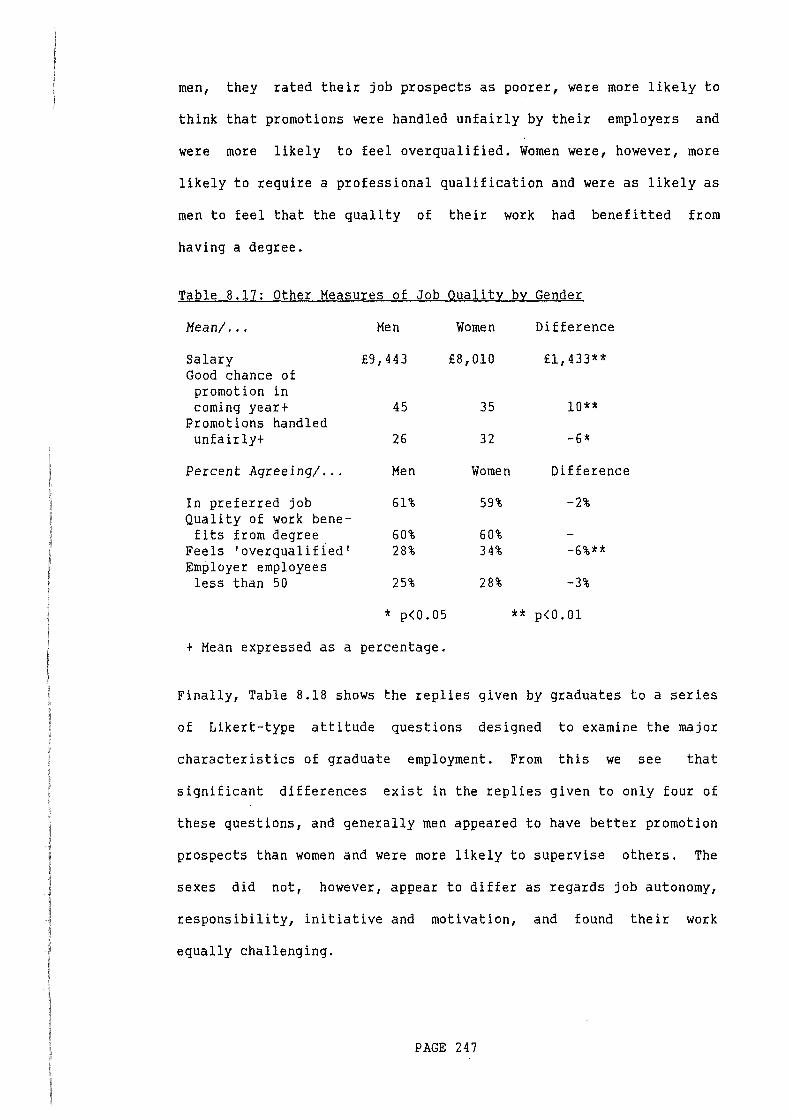
men, they rated their job prospects as poorer, were more likely to
think that promotions were handled unfairly by their employers and
were more likely to feel overqualified. Women were, however, more
likely to require a professional qualification and were as likely as
men to feel that the quality of their work had benefitted from
having a degree.
Table 8.17: Other Measures of Job Quality by Gender
Mean/... Men
Salary £9,443 Good chance of
promotion in coming year+ 45
Promotions handled unfairly+ 26
Percent Agreeing/... Men
In preferred job 61% Quality of work bene-fits from degree 60%
Feels 'overqualified' 28% Employer employees
less than 50 25%
* p<0.05
+ Mean expressed as a percentage.
Women
£8,010
35
32
Women
59%
60% 34%
28%
Difference
£1, 433**
10**
-6*
Difference
-2%
-6%**
-3%
** p<0.01
Finally, Table 8.18 shows the replies given by graduates to a series
of Likert-type attitude questions designed to examine the major
characteristics of graduate employment. From this we see that
significant differences exist in the replies given to only four of
these questions, and generally men appeared to have better promotion
prospects than women and were more likely to supervise others. The
sexes did not, however, appear to differ as regards job autonomy,
responsibility, initiative and motivation, and found their work
equally challenging.
PAGE 247
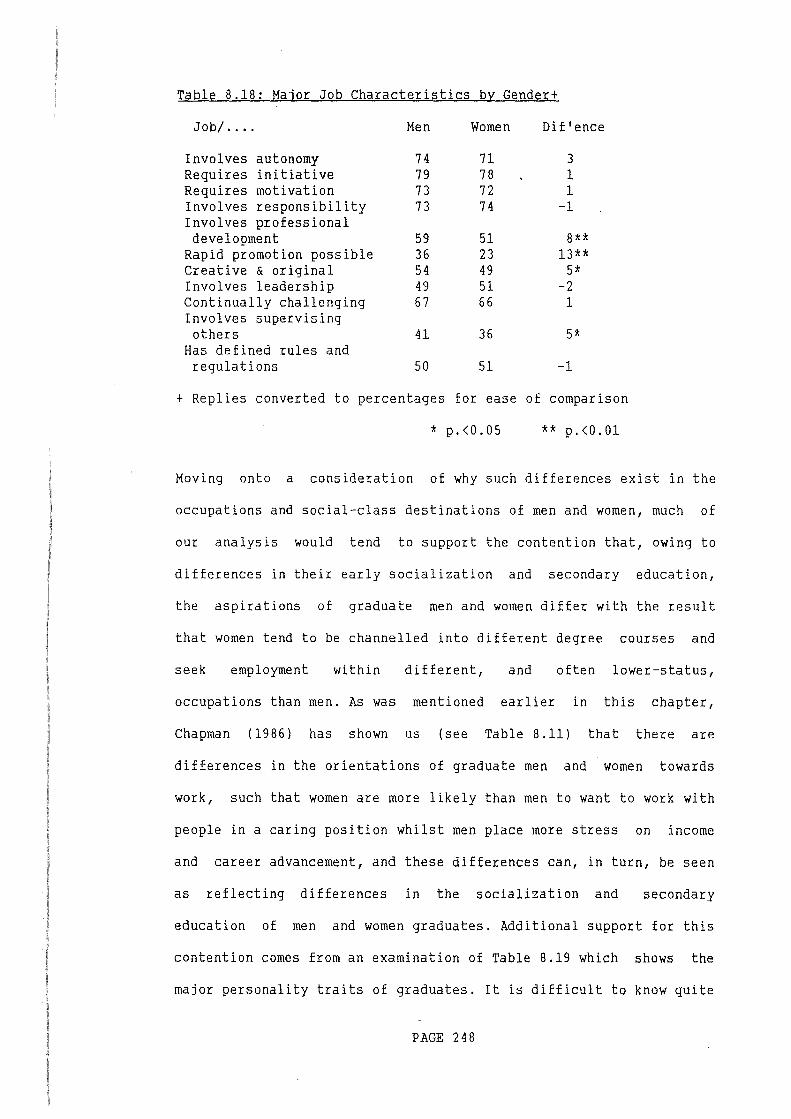
Table 8.18: Major Job Characteristics by Gender+
Job/ ....
Involves autonomy Requires initiative Requires motivation Involves responsibility Involves professional development
Rapid promotion possible Creative & original Involves leadership Continually challenging Involves supervising others
Has defined rules and regulations
Men
74 79 73 73
59 36 54 49 67
41
50
Women
71 78 72 74
51 23 49 51 66
36
51
Dif'ence
3 1 1
-1
8** 13**
5* -2
1
5*
-1
+ Replies converted to percentages for ease of comparison
* p.<0.05 ** p.<0.01
Moving onto a consideration of why such differences exist in the
occupations and social-class destinations of men and women, much of
our analysis would tend to support the contention that, owing to
differences in their early socialization and secondary education,
the aspirations of graduate men and women differ with the result
that women tend to be channelled into different degree courses and
seek employment within different, and often lower-status,
occupations than men. As was mentioned earlier in this chapter,
Chapman (1986) has shown us (see Table 8.11) that there are
differences in the orientations of graduate men and women towards
work, such that women are more likely than men to want to work with
people in a caring position whilst men place more stress on income
and career advancement, and these differences can, in turn, be seen
as reflecting differences in the socialization and secondary
education of men and women graduates. Additional support for this
contention comes from an examination of Table 8.19 which shows the
major personality traits of graduates. It is difficult to know quite
PAGE 248
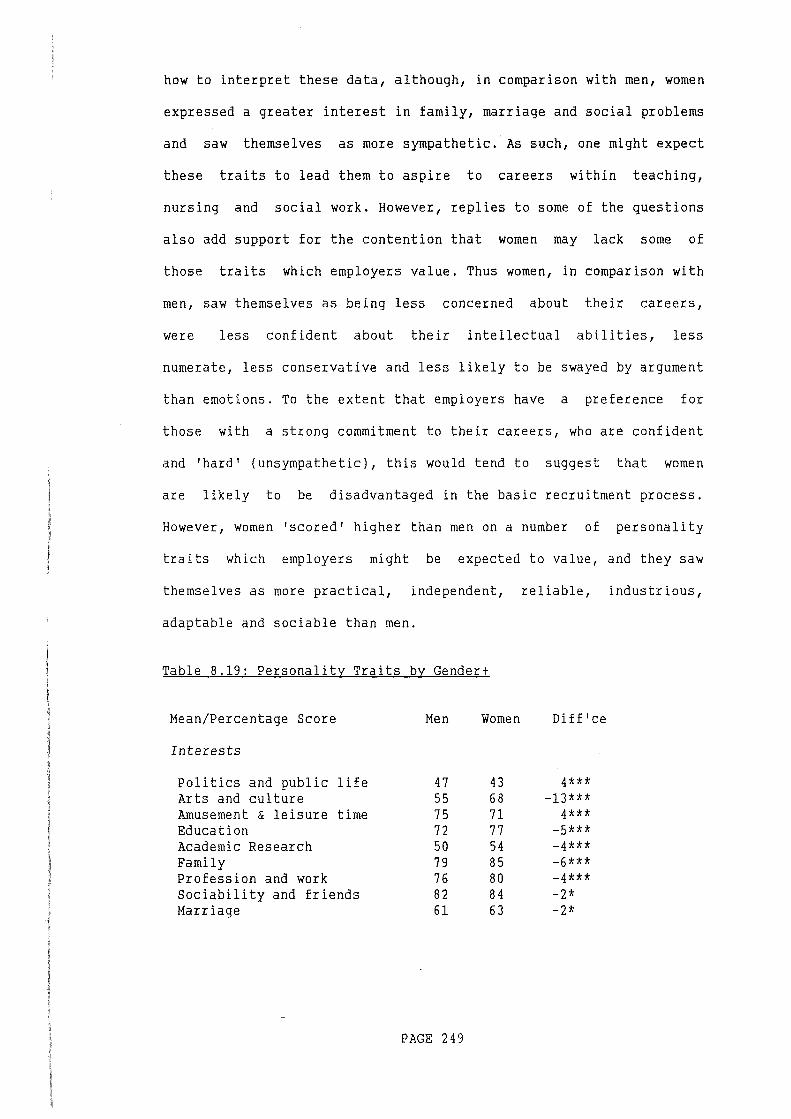
how to interpret these data, although, in comparison with men, women
expressed a greater interest in family, marriage and social problems
and saw themselves as more sympathetic .. As such, one might expect
these traits to lead them to aspire to careers within teaching,
nursing and social work. However, replies to some of the questions
also add support for the contention that women may lack some of
those traits which employers value. Thus women, in comparison with
men, saw themselves as being less concerned about their careers,
were less confident about their intellectual abilities, less
numerate, less conservative and less likely to be swayed by argument
than emotions. To the extent that employers have a preference for
those with a strong commitment to their careers, who are confident
and 'hard' (unsympathetic), this would tend to suggest that women
are likely to be disadvantaged in the basic recruitment process.
However, women 'scored' higher than men on a number of personality
traits which employers might be expected to value, and they saw
themselves as more practical, independent, reliable, industrious,
adaptable and sociable than men.
Table 8.19: Personality Traits by Gender+
Mean/Percentage Score
Interests
Politics and public life Arts and culture Amusement & leisure time Education Academic Research Family Profession and work Sociability and friends Marriage
Men Women
47 43 55 68 75 71 72 77 50 54 79 85 76 80 82 84 61 63
PAGE 249
Diff'ce
4*** -13***
4*** -5*** -4*** -6*** -4*** -2* -2*
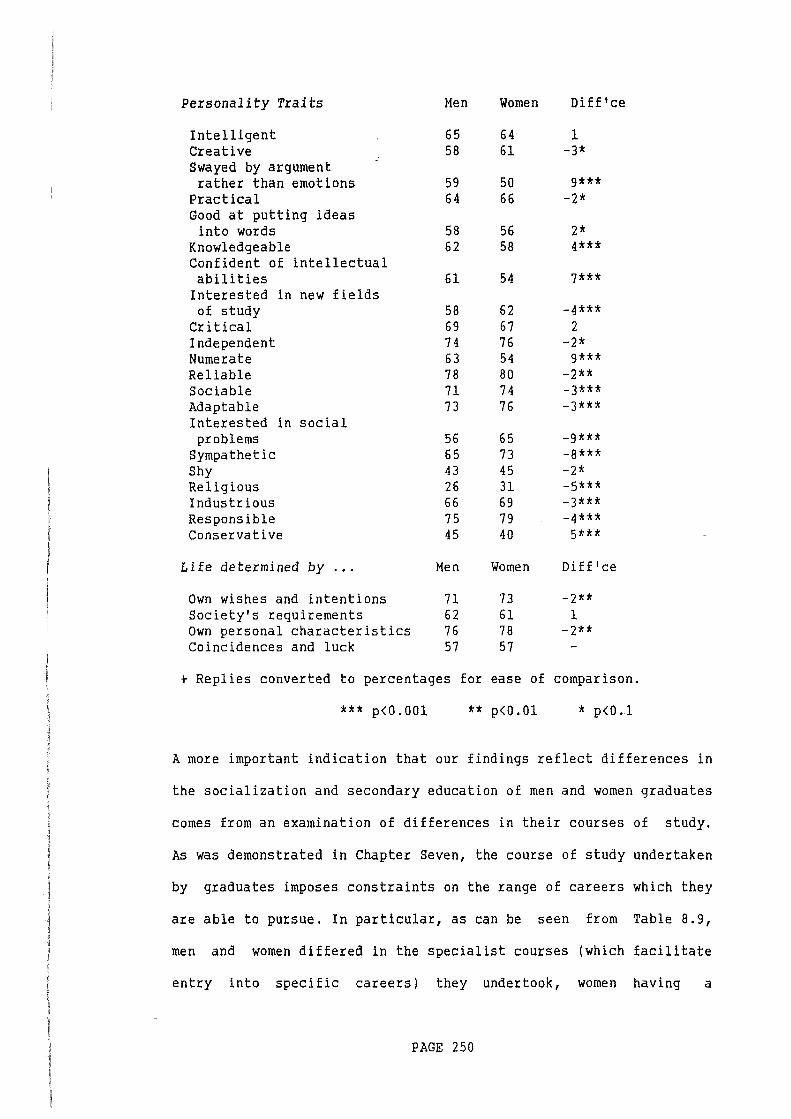
Personality Traits
Intelligent Creative Swayed by argument rather than emotions
Practical Good at putting ideas
into words Knowledgeable Confident of intellectual abilities
Interested in new fields of study
Critical Independent Numerate Reliable Sociable Adaptable Interested in social problems
Sympathetic Shy Religious Industrious Responsible Conservative
Life determined by ...
Own wishes and intentions Society's requirements Own personal characteristics Coincidences and luck
Men Women
65 64 58 61
59 50 64 66
58 56 62 58
61 54
58 62 69 67 74 76 63 54 78 80 71 74 73 76
56 65 65 73 43 45 26 31 66 69 75 79 45 40
Men Women
71 73 62 61 76 78 57 57
Diff'ce
1 -3*
9*** -2*
2* 4***
7***
-4*** 2
-2* 9***
-2** -3*** -3***
-9*** -8*** -2* -5*** -3*** -4*** 5***
Diff'ce
-2** 1
-2**
t Replies converted to percentages for ease of comparison.
*** p<O. 001 ** p<O.Ol * p<0.1
A more important indication that our findings reflect differences in
the socialization and secondary education of men and women graduates
comes from an examination of differences in their courses of study.
As was demonstrated in Chapter Seven, the course of study undertaken
by graduates imposes constraints on the range of careers which they
are able to pursue. In particular, as can be seen from Table 8.9,
men and women differed in the specialist courses (which facilitate
entry into specific careers} they undertook, women having a
PAGE 250
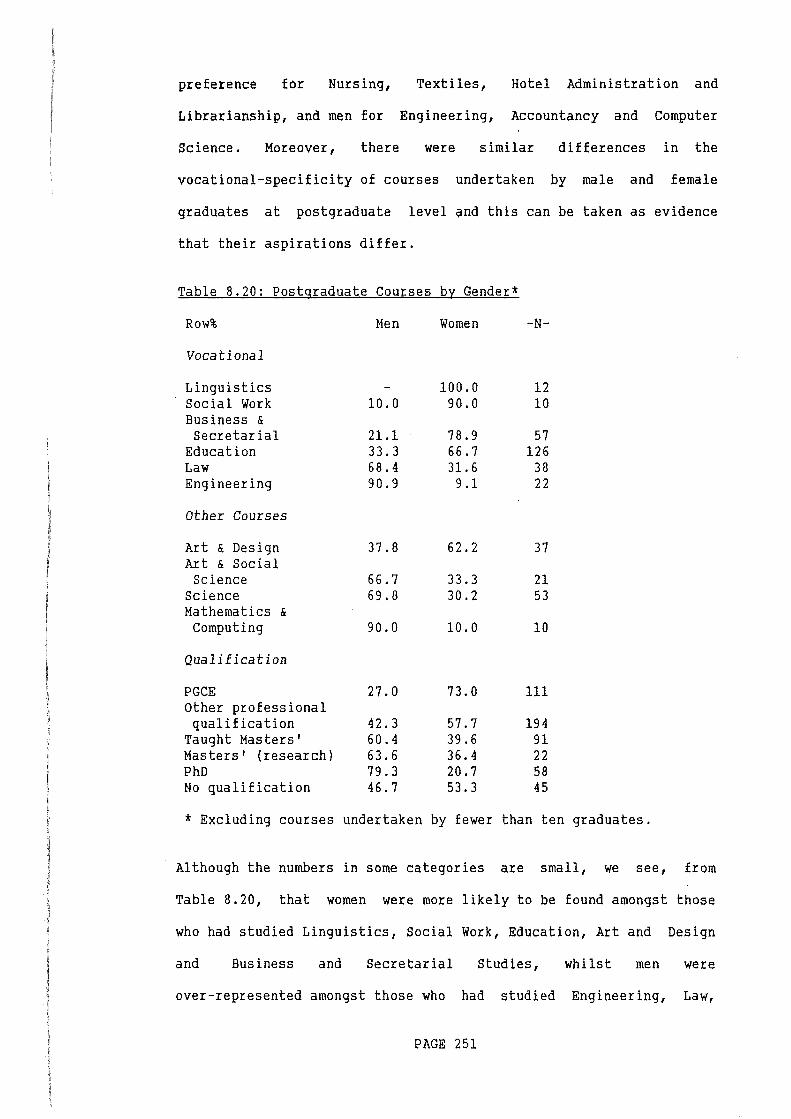
preference for Nursing, Textiles, Hotel Administration and
Librarianship, and men for Engineering, Accountancy and Computer
Science. Moreover, there were similar differences in the
vocational-specificity of courses undertaken by male and female
graduates at postgraduate level ~nd this can be taken as evidence
that their aspirations differ.
Table 8.20: Postgraduate Courses by Gender*
Row%
Vocational
Linguistics Social Work Business & Secretarial
Education Law Engineering
Other Courses
Art & Design Art & Social
Science Science Mathematics &
Computing
Qualification
PGCE Other professional qualification
Taught Masters' Masters' (research) PhD No qualification
Men
10.0
21.1 33.3 68.4 90.9
37.8
66.7 69.8
90.0
27.0
42.3 60.4 63.6 79.3 46.7
Women
100.0 90.0
78.9 66.7 31.6 9.1
62.2
33.3 30.2
10.0
73.0
57.7 39.6 36.4 20.7 53.3
-N-
12 10
57 126
38 22
37
21 53
10
111
194 91 22 58 45
* Excluding courses undertaken by fewer than ten graduates.
Although the numbers in some categories are small, we see, from
Table 8.20, that women were more likely to be found amongst those
who had studied Linguistics, Social Work, Education, Art and Design
and Business and Secretarial Studies, whilst men were
over-represented amongst those who had studied Engineering, Law,
PAGE 251
Science, Mathematics and Computing. Differences were also found in
the level of qualification undertaken by men and women. In
particular, men were more likely to have studied PhDs and Masters'
Degrees which traditionally lead to careers within higher education,
whilst women were more likely to have studied PGCEs and other
professional qualifications.
From our earlier discussion it will be remembered that there is,
however, an alternative explanation for our findings, namely that
women are the 'victims' of exclusionary policies operated by
employers and professional associations (Spencer and Podmore, 1987).
If this is the case it might be expected to manifest itself in one
of two ways: a) through differences in the ease with which men and
women were able to obtain work, and b) through differences in the
social status of men and women in the same social-class positions.
If graduate women are the 'victims' of the operation of exclusion
policies by employers and professional bodies then this might be
reflected in the rate of unemployment amongst graduate men and
women, and in the ease with which they were able to find suitable
employment. Chapman (1986) has already demonstrated that one year
after graduation there were only minor differences in the rates of
unemployment of men and women graduates and this was also true two
years later (see Table 8.13). Further analysis of the HELM Wave I
data set see Table 8.21 - suggested that men and women did not-
differ as regards the difficulties which they encountered in finding
suitable work.
PAGE 252
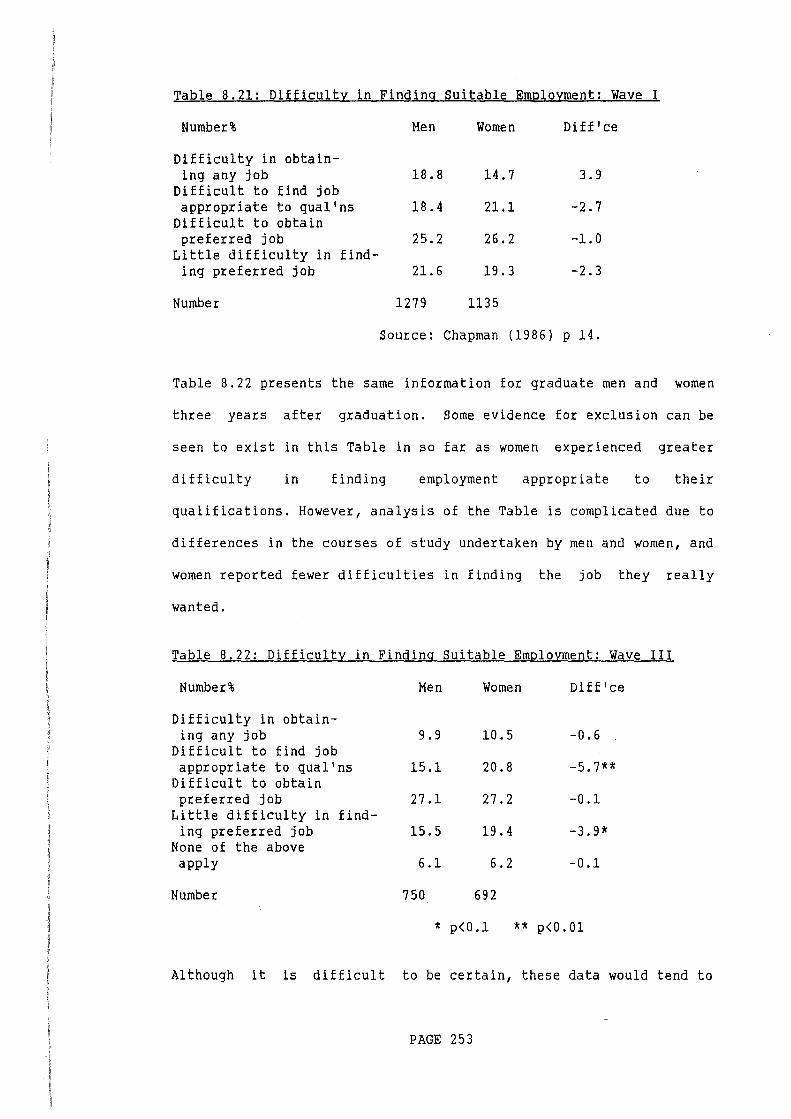
Table 8.21: nDif_ticulty in Finding Suitable Employment: Wave I
Number% Men Women Diff'ce
Difficulty in obtain-ing any job 18.8 14.7 3.9
Difficult to find job appropriate to qual'ns 18.4 21.1 -2.7
Difficult to obtain preferred job 25.2 26.2 -1.0
Little difficulty in find-ing preferred job 21.6 19.3 -2.3
Number 1279 1135
Source: Chapman (1986) p 14.
Table 8.22 presents the same information for graduate men and women
three years after graduation. Some evidence for exclusion can be
seen to exist in this Table in so far as women experienced greater
difficulty in finding employment appropriate to their
qualifications. However, analysis of the Table is complicated due to
differences in the courses of study undertaken by men and women, and
women reported fewer difficulties in finding the job they really
wanted.
Table 8.22: Difficulty in Finding Suitable Employment: Wave III
Number% Men Women Diff'ce
Difficulty in obtain-ing any job 9.9 10.5 -0.6
Difficult to find job appropriate to qual'ns 15.1 20.8 -5. 7**
Difficult to obtain preferred job 27.1 27.2 -0.1
Little difficulty in find-ing preferred job 15.5 19.4 -3.9*
None of the above apply 6.1 6.2 -0.1
Number 750 692
* p<0.1 ** p<0.01
Although it is difficult to be certain, these data would tend to
PAGE 253
support the contention that differences in the employment patterns
and social-class destinations of men and women graduates are not
primarily related to the operation of exclusionary policies by
employers and professional associations.
Nevertheless, should women in the same social-class position as men
tend to be employed in less-prestigious occupations than this might
point to the operation of exclusionary policies. To test this idea
the income of men and women graduates undertaking similarly placed
occupations within the social-class structure were examined together
with the replies which they gave to a number of questions designed
to measure job quality. Table 8.23 shows the mean income of men and
women graduates by social-class position and occupation. Some
evidence for the operation of exclusionary policies can be seen to
exist in this Table and thus women in all social classes were
earning less than men - the difference being particularly marked
amongst senior professionals. Differences in the annual salaries of
men and women undertaking the same occupation were not as marked,
and women employed in five occupations - computing, librarianship,
social work and other (low-status) occupations - were earning more
than men. However, when other measures of job quality were examined
no additional support was found for this contention as can be seen
from Table 8.24.
PAGE 254
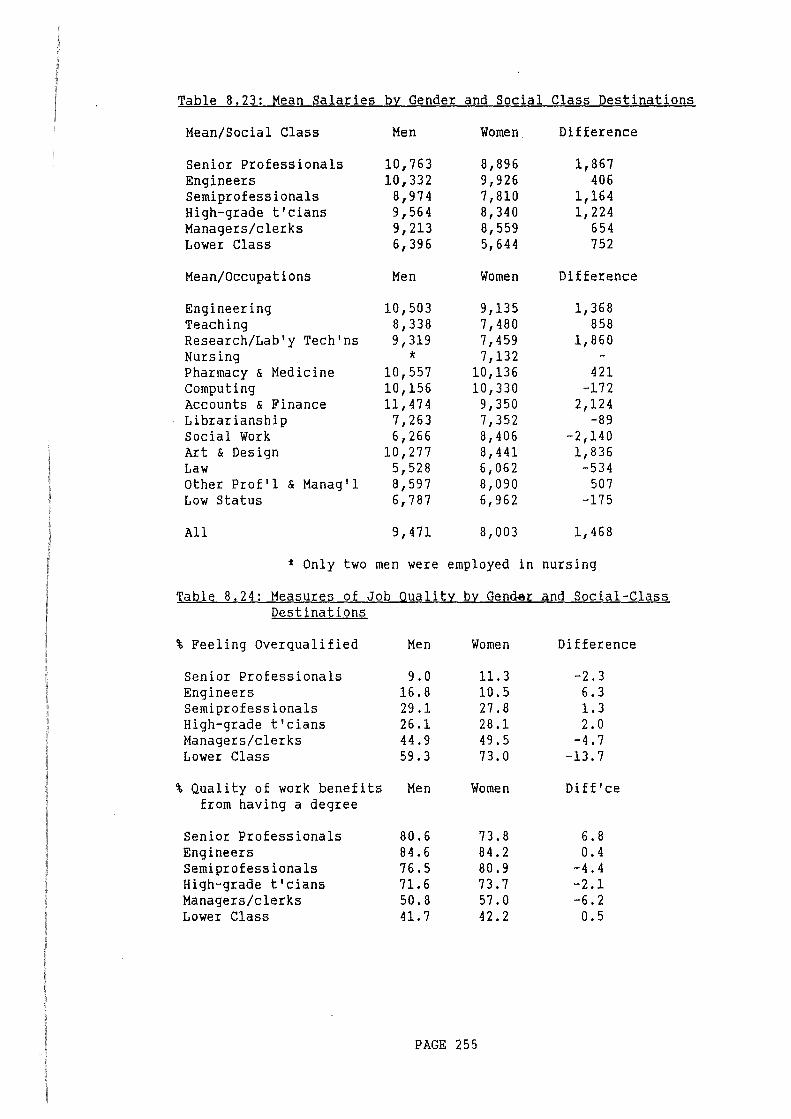
Table 8.23: Mean Salaries by Gender and Social Class Destinations
Mean/Social Class
Senior Professionals Engineers Semiprofessionals High-grade t'cians Managers/clerks Lower Class
Mean/Occupations
Engineering Teaching Research/Lab'y Tech'ns Nursing Pharmacy & Medicine Computing Accounts & Finance Librarianship Social Work Art & Design Law Other Prof'l & Manag'l Low Status
All
Men
10,763 10,332
8,974 9,564 91213 61396
Men
10,503 8,338 91319
* 101557 101156 111474
71263 61266
101277 51528 81597 61787
91471
Women.
81896 91926 71810 81340 8,559 51644
Women
9,135 7,480 71459 7,132
10,136 10,330
9,350 7,352 8,406 8,441 6,062 8,090 6,962
8,003
Difference
11867 406
1,164 11224
654 752
Difference
1,368 858
1,860
421 -172
2,124 -89
-2,140 11836
-534 507
-175
1,468
t Only two men were employed in nursing
Table 8.24: Measures of Job Quality by Gend~r And Social-Class Destinations
% Feeling Overqualified
Senior Professionals Engineers Semiprofessionals High-grade t'cians Managers/clerks Lower Class
% Quality of work benefits from having a degree
Senior Professionals Engineers Semiprofessionals High-grade t'cians Managers/clerks Lower Class
Men
9.0 16.8 29.1 26.1 44.9 59.3
Men
80.6 84.6 76.5 71.6 50.8 41.7
Women
11.3 10.5 27.8 28.1 49.5 73.0
Women
73.8 84.2 80.9 73.7 57.0 42.2
PAGE 255
Difference
-2.3 6.3 1.3 2.0
-4.7 -13.7
Diff'ce
6.8 0.4
-4.4 -2.1 -6.2 0.5
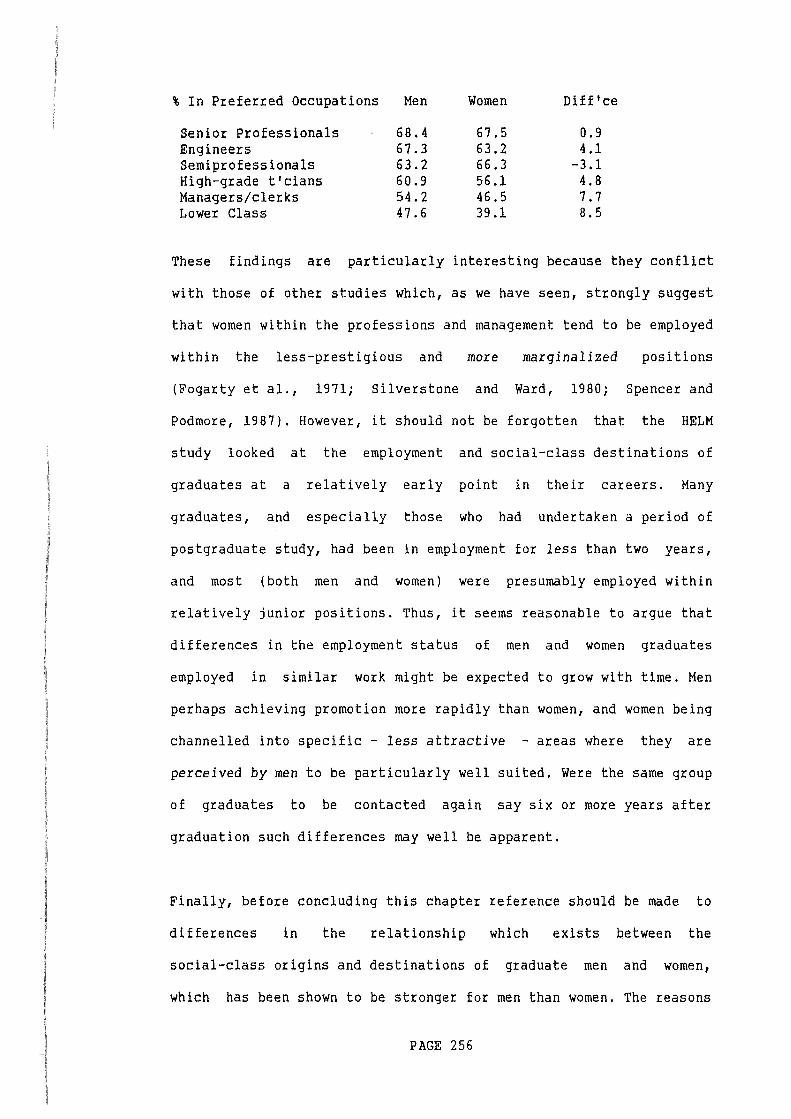
% In Preferred Occupations Men Women Diff 'ce
Senior Professionals 68.4 67.5 0.9 Engineers 67.3 63.2 4.1 Semiprofessionals 63.2 66.3 -3.1 High-grade t'cians 60.9 56.1 4.8 Managers/clerks 54.2 46.5 7.7 Lower Class 47.6 39.1 8.5
These findings are particularly interesting because they conflict
with those of other studies which, as we have seen, strongly suggest
that women within the professions and management tend to be employed
within the less-prestigious and more marginalized positions
(Fogarty et al., 1971; Silverstone and Ward, 1980; Spencer and
Podmore, 1987). However, it should not be forgotten that the HELM
study looked at the employment and social-class destinations of
graduates at a relatively early point in their careers. Many
graduates, and especially those who had undertaken a period of
postgraduate study, had been in employment for less than two years,
and most (both men and women) were presumably employed within
relatively junior positions. Thus, it seems reasonable to argue that
differences in the employment status of men and women graduates
employed in similar work might be expected to grow with time. Men
perhaps achieving promotion more rapidly than women, and women being
channelled into specific - less attractive - areas where they are
perceived by men to be particularly well suited. Were the same group
of graduates to be contacted again say six or more years after
graduation such differences may well be apparent.
Finally, before concluding this chapter reference should be made to
differences in the relationship which exists petween the
social-class origins and destinations of graduate men and women,
which has been shown to be stronger for men than women. The reasons
PAGE 256
for this should now be apparent to the reader, because, as has been
shown, graduate women tend to aspire to lower-status occupations
than men, and they tended not to have undertaken the more specialist
courses which facilitate entry into the senior professions (such as
Engineering and Accountancy}. In consequence, graduate women as a
whole tend to find employment within a much narrower range of
relatively low-status occupations than men, and this, in turn, might
be expected to obscure the nature of the relationship which might
exist between the social-class origins and destinations of graduate
women.
Conclusion
In this chapter the participation of men and women in higher
education and their eventual employment and social-class
destinations have been examined. In Part One theoretical approaches
to the study of social class were examined which argue that girls
and young women are socialized into a subordinate social-class
position, vis-a-vis men, within the home and the school. It was
hypothesised that such socialization, both at home and at school,
would have a major influence upon the school curriculum undertaken
by girls which in turn would both constrain the range of
degree-level courses which they could pursue in higher education and
lead them to aspire to a different range - and often lower-status
jobs than men. Considerable support for this contention was found in
the HELM data set. Large differences were found to exist in the
school curriculum undertaken by graduate men and women which, in
turn, appears both
channelled them into
to have affected their aspirations and to have
different degree courses. The employment
PAGE 257
destinations of men and women reflected these differences in the
courses which they had undertaken and women tended to be employed in
lower-status occupations, earned less and rated the quality of their
work as inferior to that of men. Little support for the contention
that women might be the 'victims' of the operation of exclusion
policies by employers and professional associations was found,
although there are reasons for believing that such exclusion
policies might exist, evidence for which might emerge some years
after graduation.
PAGE 258
CHAPTER NINE: ETHNIC MINORITIES IN HIGHER EDUCATION AND THE GRADUATE LABOUR MARKET
In this chapter the participation of Britain's ethnic minorities in
higher education, together with their members' early career
histories, is discussed in relation to the HELM data. Part One of
the chapter looks at Marxist and Weberian approaches to ethnicity
and social class. In Part Two the role of public sector institutions
in providing an avenue of social mobility for black people is
discussed, and, finally, in Part Three we look at the experiences of
black graduates in the labour market. It should, however, be
stressed that we are specifically concerned, in this chapter, with
the experiences of black Britons as opposed to people domiciled
overseas who graduated in this country.
Part One: Ethnic Minorities and Social Class
In our Chapter One discussion of social class it was briefly
mentioned that some Marxists and Weberians have attempted to expand
the concept of class in such a way as to include within it different
ethnic groups.
The Marxist approach (associated with Castles and Kosack: 1973; and
Phizacklea and Miles: 1980} asserts that, although both black people
and the white working class form a part of the same social class in
so far as both are propertyless, black people can nevertheless be
differentiated from the white working class in so far as they
constitute an under class or class fraction which differs from the
PAGE 259
white working class in several important respects. Firstly, black
people tend to be concentrated in what economists term the secondary
sector of the economy whereas white workers tend to be employed in
the primary sector (Doeringer and Piore, 1971). The importance of
this differentiation is that whilst workers in the primary sector
tend to be employed in skilled work and, to some extent, enjoy job
security, those in the secondary sector tend to be employed in
unskilled and semiskilled work, are concentrated in a narrow range
of industries and have little job security (Phizacklea and Miles:
1980). Secondly, although in objective terms both black and white
workers may form a part of the working class, in subjective terms
they often differ in how they view their class position. Thus the
indigenous working class often views black workers with suspicion in
so far as they compete for similar jobs in the marketplace. Finally,
migrant labour (as opposed to black labour) often has fewer
political rights than the indigenous working class, may face the
prospect of deportation and be excluded from trades unions.
It will be recalled from our discussion in Chapter One, that
Weberians define social class primarily in terms of the market
place. Each individual is seen to possess certain marketable skills
or attributes and social classes can be thought of as consisting of
groups of people who share broadly similar market and work
situations. In this approach ethnicity can be thought of as a
dimension of social class if, because of their ethnicity, different
groups are in an advantageous or disadvantageous position in the
labour market. Thus black people can be thought of as a social class
if employers exhibit a tendency to employ them within the less
skilled and more mundane occupations. A broadly similar position is
PAGE 260
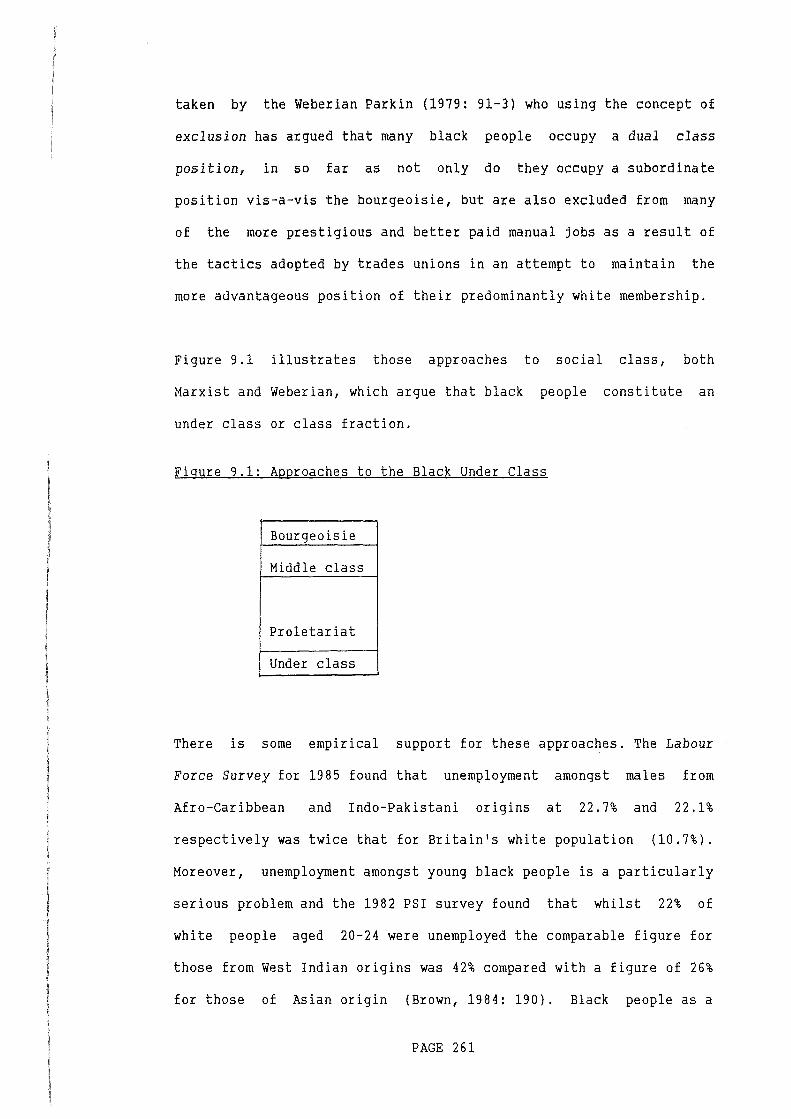
taken by the Weberian Parkin (1979: 91-3) who using the concept of
exclusion has argued that many black people occupy a dual class
position, in so far as not only do they occupy a subordinate
position vis-a-vis the bourgeoisie, but are also excluded from many
of the more prestigious and better paid manual jobs as a result of
the tactics adopted by trades unions in an attempt to maintain the
more advantageous position of their predominantly white membership.
Figure 9.1 illustrates those approaches to social class, both
Marxist and Weberian, which argue that black people constitute an
under class or class fraction.
Figure 9.1: Approaches to the Black Under Class
Bourgeoisie
Middle class
Proletariat
Under class
There is some empirical support for these approaches. The Labour
Force Survey for 1985 found that unemployment amongst males from
Afro-Caribbean and Indo-Pakistani origins at 22.7% and 22.1%
respectively was twice that for Britain's white population (10.7%).
Moreover, unemployment amongst young black people is a particularly
serious problem and the 1982 PSI survey found that whilst 22% of
white people aged 20-24 were unemployed the comparable figure for
those from West Indian origins was 42% compared with a figure of 26%
for those of Asian origin (Brown, 1984: 190). Black people as a
PAGE 261
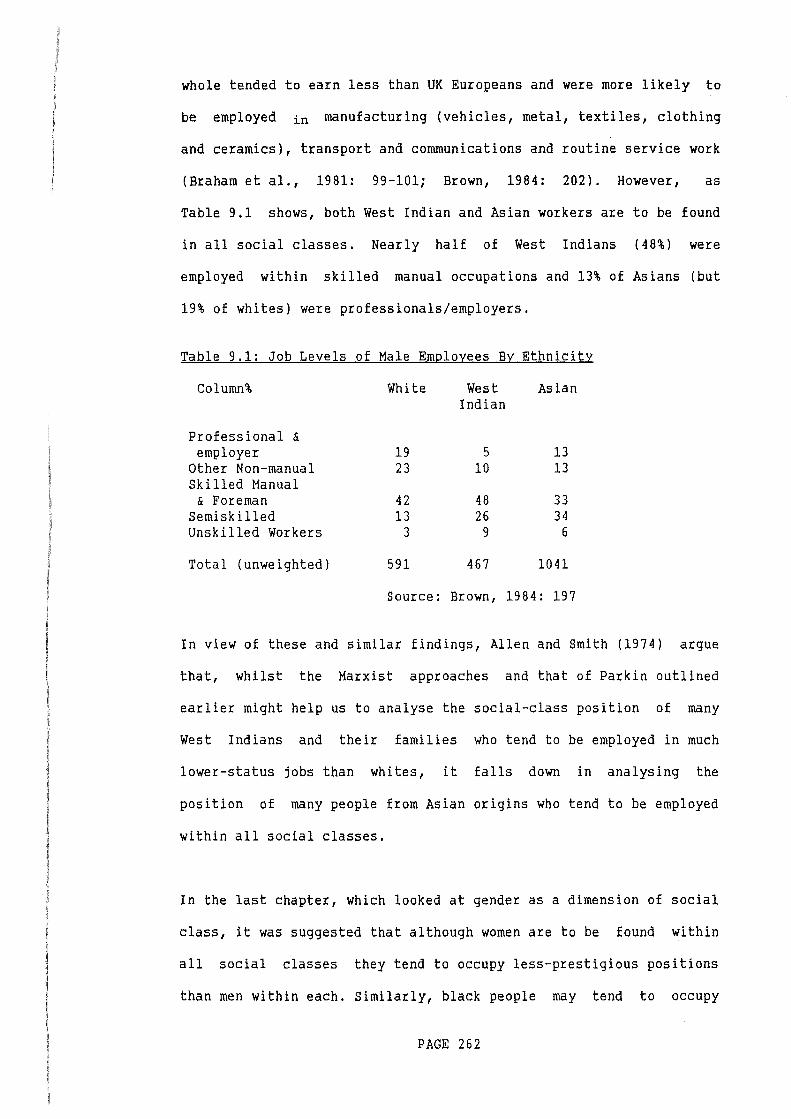
whole tended to earn less than UK Europeans and were more likely to
be employed in manufacturing (vehicles, metal, textiles, clothing
and ceramics), transport and communications and routine service work
(Braham et al., 1981: 99-101; Brown, 1984: 202). However, as
Table 9.1 shows, both West Indian and Asian workers are to be found
in all social classes. Nearly half of West Indians (48%) were
employed within skilled manual occupations and 13% of Asians (but
19% of whites) were professionals/employers.
Table 9.1: Job Levels of Male Employees By Ethnicity
Column% White West Asian Indian
Professional & employer 19 5 13
Other Non-manual 23 10 13 Skilled Manual
& Foreman 42 48 33 Semiskilled 13 26 34 Unskilled Workers 3 9 6
Total (unweighted) 591 467 1041
Source: Brown, 1984: 197
In view of these and similar findings, Allen and Smith (1974) argue
that, whilst the Marxist approaches and that of Parkin outlined
earlier might help us to analyse the social-class position of many
West Indians and their families who tend to be employed in much
lower-status jobs than whites, it falls down in analysing the
position of many people from Asian origins who tend to be employed
within all social classes.
In the last chapter, which looked at gender as a dimension of social
class, it was suggested that although women are to be found within
all social classes they tend to occupy less-prestigious positions
than men within each. Similarly, black people may tend to occupy
PAGE 262
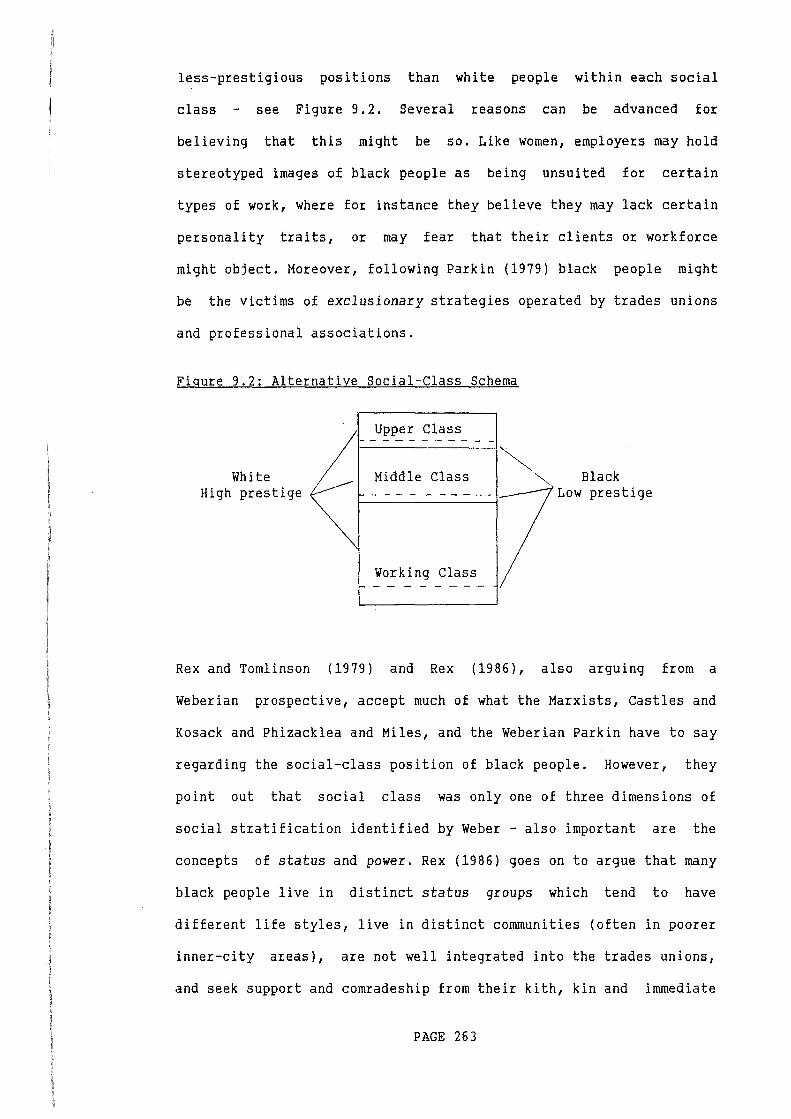
less-prestigious positions than white people within each social
class see Figure 9.2. Several reasons can be advanced for
believing that this might be so. Like women, employers may hold
stereotyped images of black people as being unsuited for certain
types of work, where for instance they believe they may lack certain
personality traits, or may fear that their clients or workforce
might object. Moreover, following Parkin (1979) black people might
be the victims of exclusionary strategies operated by trades unions
and professional associations.
Figure 9.2: Alternative Social-Class Schema
White High prestige
Upper Class
Middle Class
Working Class
~ '~ Black
Low prestige
Rex and Tomlinson (1979) and Rex (1986), also arguing from a
Weberian prospective, accept much of what the Marxists, Castles and
Kosack and Phizacklea and Miles, and the Weberian Parkin have to say
regarding the social-class position of black people. However, they
point out that social class was only one of three dimensions of
social stratification identified by Weber - also important are the
concepts of status and power. Rex (1986) goes on to argue that many
black people live in distinct status groups which tend to have
different life styles, live in distinct communities (often in poorer
inner-city areas), are not well integrated into the trades unions,
and seek support and comradeship from their kith, kin and immediate
PAGE 263
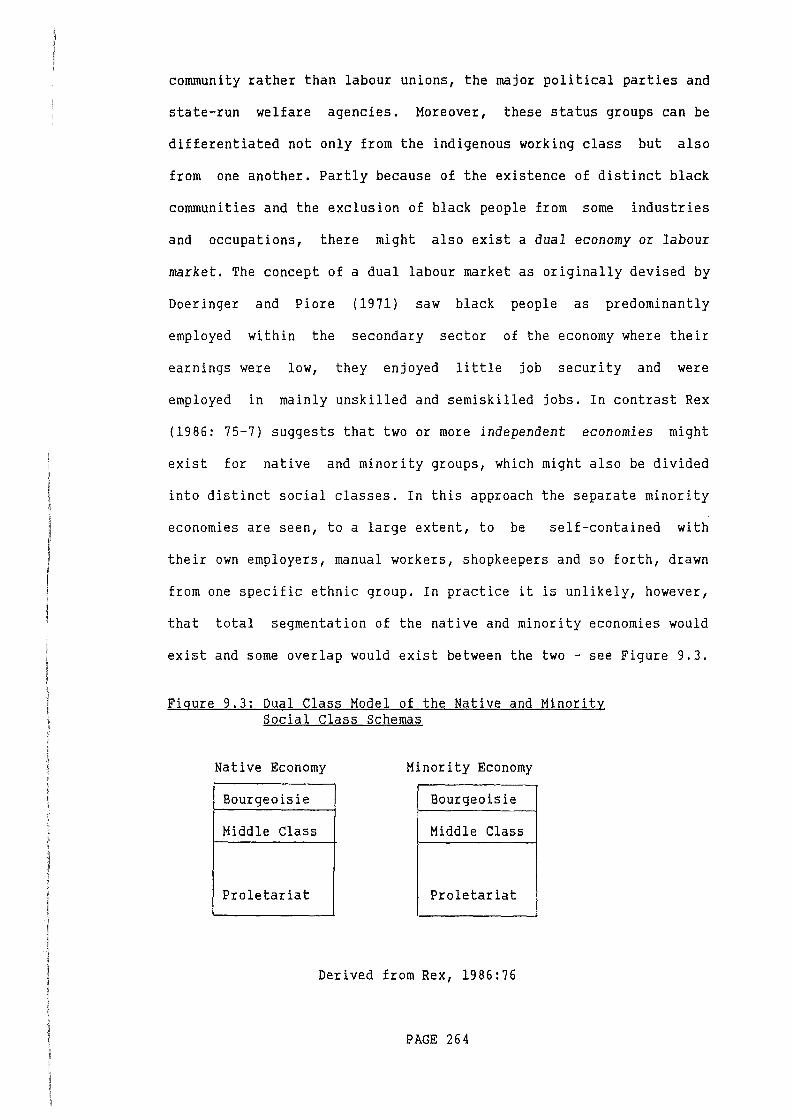
community rather than labour unions, the major political parties and
state-run welfare agencies. Moreover, these status groups can be
differentiated not only from the indigenous working class but also
from one another. Partly because of the existence of distinct black
communities and the exclusion of black people from some industries
and occupations, there might also exist a dual economy or labour
market. The concept of a dual labour market as originally devised by
Doeringer and Piore (1971) saw black people as predominantly
employed within the secondary sector of the economy where their
earnings were low, they enjoyed little job security and were
employed in mainly unskilled and semiskilled jobs. In contrast Rex
(1986: 75-7) suggests that two or more independent economies might
exist for native and minority groups, which might also be divided
into distinct social classes. In this approach the separate minority
economies are seen, to a large extent, to be self-contained with
their own employers, manual workers, shopkeepers and so forth, drawn
from one specific ethnic group. In practice it is unlikely, however,
that total segmentation of the native and minority economies would
exist and some overlap would exist between the two - see Figure 9.3.
Figure 9.3: Dual Class Model of the Native and Minority Social Class Schemas
Native Economy Minority Economy
Bourgeoisie Bourgeoisie
Middle Class Middle Class
Proletariat Proletariat
Derived from Rex, 1986:76
PAGE 264
Before concluding this section, it should be mentioned that so far
in this chapter we have tended to refer to Britain's black
population as if it were a single and unified group. This is far
from the case and the 1988 edition of Social Trends shows us that
there were c. 534,000 people of West Indian descent, c. 760,000
people of Indian descent, c. 397,000 people of Pakistani descent,
c. 103,000 people of Bangladeshi descent, c. 115,000 of Chinese
descent and c. 523,000 others living in the United Kingdom. Each of
these groups can be differentiated from the others and from the
predominantly white native population in so far as they originate
from different countries, are members of distinct ethnic groups and
profess different religious beliefs. As we shall see in the
following sections, differences exist in the average academic
attainments of each of these groups, their degree of participation
in higher education and in their degree of success in the labour
market.
Part Two: Participation in Higher Education
The participation of Britain's ethnic minorities in higher education
has been neglected until very recently, as a casual glance at both
government publications and more learned works reveals. The Robbins
Report (1963: 49-51; App. 2 (B): 1-3), whilst looking in some detail
at the social-class and educational origins of British students, did
not look at their ethnic origins although a section was devoted to
overseas students (App. 2. (B): Part VIII). The 1966 White Paper A
Plan for Polytechnics and Other Colleges (Cmnd. 3006) also ignored
ethnic minorities and the most recent government White Paper, Higher
Education: Meeting the Challenge ((em. 114) 1987: 5-13), whilst
PAGE 265
acknowledging the under-representation of students from
working-class origins in both the universities and public sector
institutions makes no specific reference to ethnic minorities.
In similar fashion Abbott (1972) makes only six insignificant
references to 'black' students and then, with only one exception, in
regard to the United States. But, Abbott's single reference is an
improvement on the works of Donaldson (1975) and Whitburn et al.
(1976) whose indexes contain not a single reference to 'black'
students and graduates. Even Edwards (1982), in one of the most
exhaustive works on the social-class origins of students in higher
education, does not appear to have looked at ethnic minorities. The
reason for this neglect is not hard to find, and Britain's 'black'
population
people of
is a comparatively
New Commonwealth and
new phenomenon - the proportion of
Pakistani descent within the
country's population having risen from 0.5% in 1945 to 1.7% in 1966
and 3.9% in 1980 (Brown, 1984: 37).
What we do know about the participation of ethnic minorities in
higher education is that those from West Indian origins are far less
likely to take part than those from both Asian and UK European
origins. Thus research by the Rampton Committee (1981) found that
only 2% of school leavers from West Indian origins went on to
undertake a degree in comparison with 8% of Asian and 9% of all
school leavers in the six LEAs examined. Table 9.2 breaks down these
figures by sectors.
PAGE 266
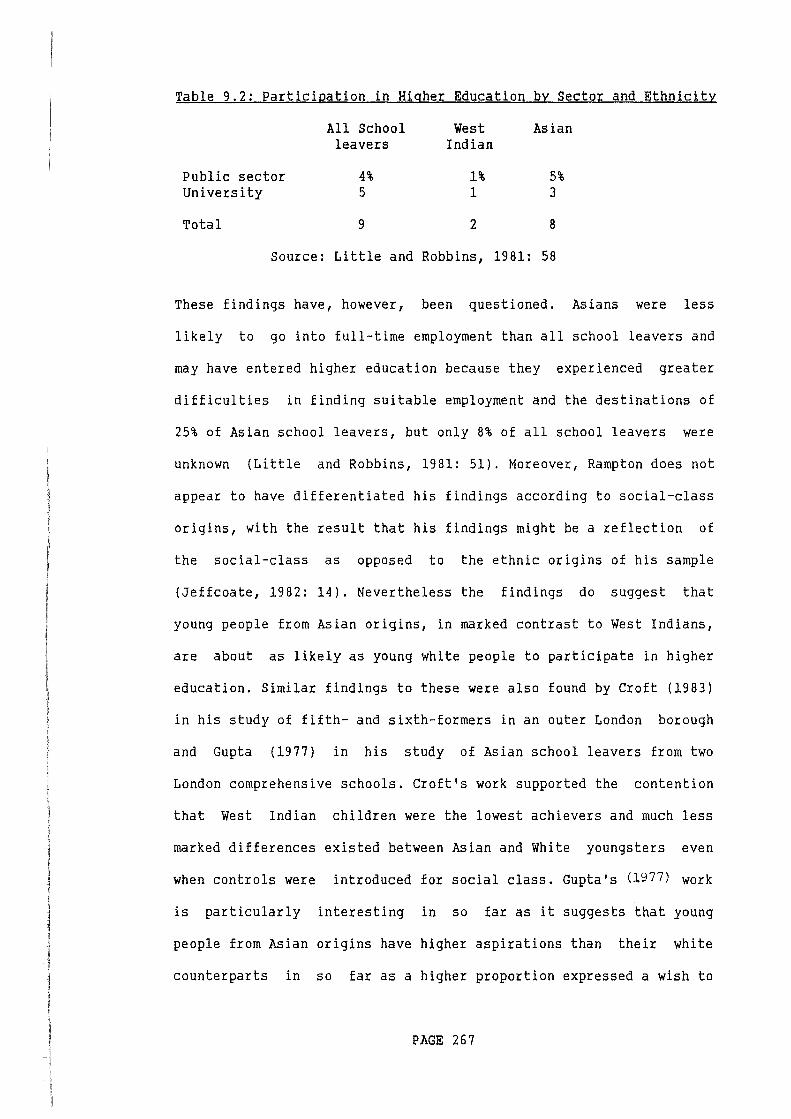
Table 9.2: Participation in Higher Education by Sector and Ethnicity
All School West Asian leavers Indian
Public sector 4% 1% 5% University 5 1 3
Total 9 2 8
Source: Little and Robbins, 1981: 58
These findings have 1 however, been questioned. Asians were less
likely to go into full-time employment than all school leavers and
may have entered higher education because they experienced greater
difficulties in finding suitable employment and the destinations of
25% of As ian school leavers, but only 8% of all .school leavers were
unknown (Little and Robbins, 1981: 51). Moreover, Rampton does not
appear to have differentiated his findings according to social-class
origins, with the result that his findings might be a reflection of
the social-class as opposed to the ethnic origins of his sample
(Jeffcoate, 1982: 14). Nevertheless the findings do suggest that
young people from Asian origins, in marked contrast to West Indians,
are about as likely as young white people to participate in higher
education. Similar findings to these were also found by Croft (1983)
in his study of fifth- and sixth-formers in an outer London borough
and Gupta (1977) in his study of Asian school leavers from two
London comprehensive schools. Croft's work supported the contention
that West Indian children were the lowest achievers and much less
marked differences existed between Asian and White youngsters even
when controls were introduced for social class. Gupta's (l977) work
is particularly interesting in so far as it suggests that young
people from Asian origins have higher aspirations than their white
counterparts in so far as a higher proportion expressed a wish to
PAGE 267
enter higher education and they were more likely to aspire to
white-collar employment. So far in this discussion, we have treated
Asians as a unified group when, in fact, differences have been found
to exist in the average academic attainments of different Asian
groups. In particular, research undertaken as a part of the Labour
Force Survey suggests that people of Indian descent are far more
likely to possess a degree-level qualification than those of
Pakistani and Bangladeshi descent (see Social Trends, 1988: 62).
One of the few studies of ethnic minorities in higher education was
that undertaken by Lyon (1988), who looked at the social and
educational origins and courses of study undertaken by students at
South Bank Polytechnic in central London which has a particularly
high proportion of black students. Owing to the absence of
comparable national data, Lyon's work needs to be interpreted with
some care. Nevertheless out of a total of 4,814 students, 5%
described themselves as Caribbean, 10% as Asian and 85% as European.
As regards their sex, men outnumbered women by a ratio of 7:3
amongst both Asian and European students, whilst 60% of Caribbean
students were women. Black students were more likely than Europeans
to come from manual origins: the figures being 38% of Europeans, 53%
of Asians and 65% of Caribbeans. Both Asian and Caribbean students
were more likely to be mature and they had a much more varied range
of entry qualifications. Interesting differences were also found in
their courses of study and whilst Asians were more likely than other
groups to study engineering, Caribbean students were more likely to
study education, humanities and social sciences, although these
findings may, in part, be a reflection of gender differences in the
students undertaking these courses.
PAGE 268
The HELM and CRE Studies
The origins and employment histories of HELM graduates one year
after graduation and differentiated according to their ethnic
origins have already been examined in
McGeever {1985). When they undertook
a paper by Brennan and
their work, however, they
lacked relevant data on the social-class origins and educational
histories of graduates and looked at their destinations only one
year after graduation. Moreover, their work was mainly descriptive
in nature and they did not attempt to relate their findings to
theories of social class and ethnicity. In the rest of this section
we build upon the work of Brennan and McGeever, and examine the
social-class and educational backgrounds of HELM graduates. In the
next section we look at the occupational and social-class
destinations of HELM respondents two and three
graduation.
years after
Firstly, however, it is necessary to say something about the
response rate to the three HELM questionnaires from the different
ethnic groups. In total only 120 Asians {4.5% of graduates), 19
{0.7%) Caribbeans {or West Indians) and 22 {0.8%) Africans replied
to the Wave I HELM questionnaire and the response to the second and
third ~aves was even lower as Table 9.3 shows.
PAGE 269
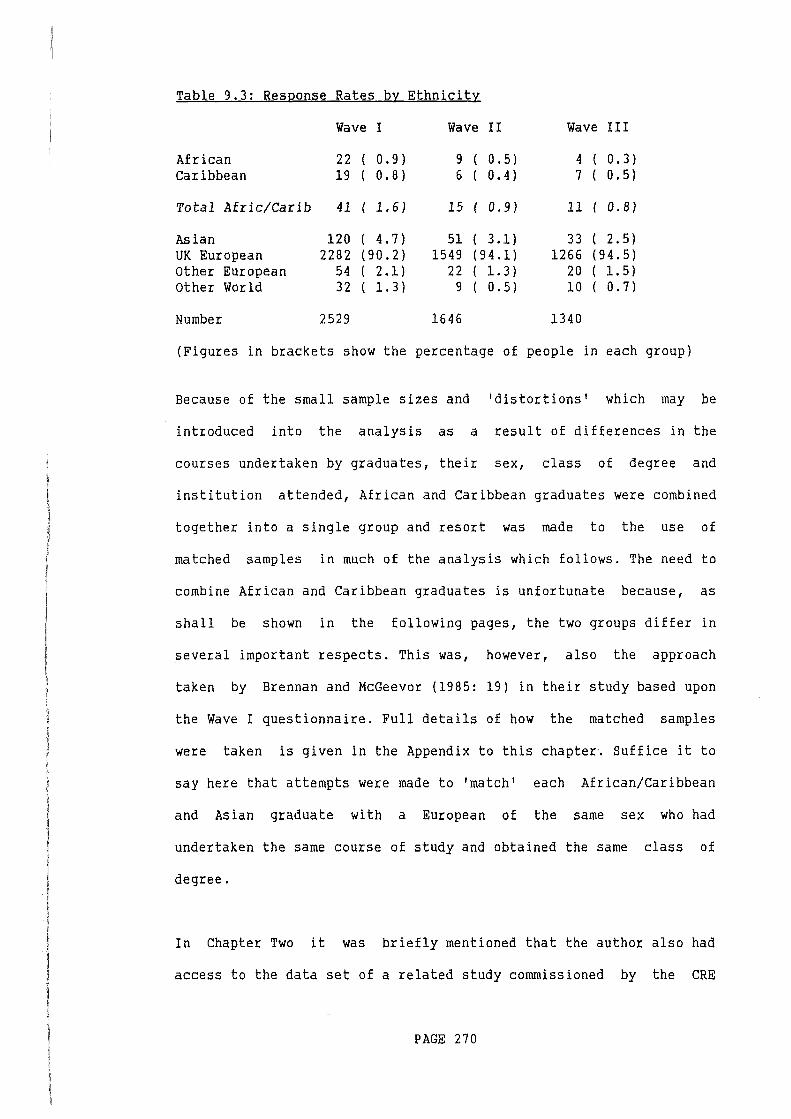
Table 9.3: Response Rates bv Ethnicity
African Caribbean
Total Afric/carib
Asian UK European Other European Other World
Number
Wave I
22 19
41
120 2282
54 32
2529
0. 9) 0. 8)
1. 6}
( 4. 7) (90.2) ( 2 .1) ( 1. 3)
Wave II
9 6
15
51 1549
22 9
1646
0. 5) 0. 4)
0.9}
( 3.1) (94.1) ( 1. 3) ( 0. 5)
Wave III
4 7
11
33 1266
20 10
1340
0. 3) 0. 5)
0.8}
( 2. 5) (94.5) ( 1. 5) ( 0. 7)
(Figures in brackets show the percentage of people in each group)
Because of the small sample sizes and 'distortions' which may be
introduced into the analysis as a result of differences in the
courses undertaken by graduates, their sex, class of degree and
institution attended, African and Caribbean graduates were combined
together into a single group and resort was made to the use of
matched samples in much of the analysis which follows. The need to
combine African and Caribbean graduates is unfortunate because, as
shall be shown in the following pages, the two groups differ in
several important respects. This was, however, also the approach
taken by Brennan and McGeevor (1985: 19) in their study based upon
the Wave I questionnaire. Full details of how the matched samples
were taken is given in the Appendix to this chapter. Suffice it to
say here that attempts were made to 'match' each African/Caribbean
and Asian graduate with a European of the same sex who had
undertaken the same course of study and obtained the same class of
degree.
In Chapter Two it was briefly mentioned that the author also had
access to the data set of a related study commissioned by the CRE
PAGE 270
(Commission for Racial Equality). It should, however, be mentioned
that, in order to sample as many black graduates as possible, the
institutions included in this study were deliberately chosen because
they were situated in areas known to have large black populations -
principally London, the West Midlands, the North West and West
Yorkshire. If, as seems likely, universities and colleges recruit a
high proportion of their students from their immediate localities
more black graduates would have been sampled than would have been
the case had a random sample been taken. By taking a large sample of
black graduates it was hoped to look at their careers in greater
detail than would otherwise have been possible. But, because the
sample is not a random one, it is not possible to calculate the
extent to which the findings fully reflect the experiences of black
graduates as a whole.
Unfortunately the number of black graduates who took part in the CRE
study was not as high as had been hoped, and of the 813 respondents
10 (1.2%) were African, 18 (2.2%) were Caribbean, 44 (5.4%) were
Asian, 15 (1.8%) were Afro-Asian, 680 (85.6%) were UK European and
there were 46 (4.7%) others. Overall 21.5% of public sector but only
4.8% of university graduates were black. Why the universities should
have such a low proportion of black (British) students is not known,
although it does suggest that public sector institutions may draw a
higher proportion of their students from their immediate localities
than the universities (see also Whitburn et al., 1976). Finally,
because of the small numbers involved, use was again made of a
matched sample and African and Caribbean graduates on the one hand
and Asian and Afro-Asian graduates on the other were combined (see
Lyon and Gatley, 1988).
PAGE 271
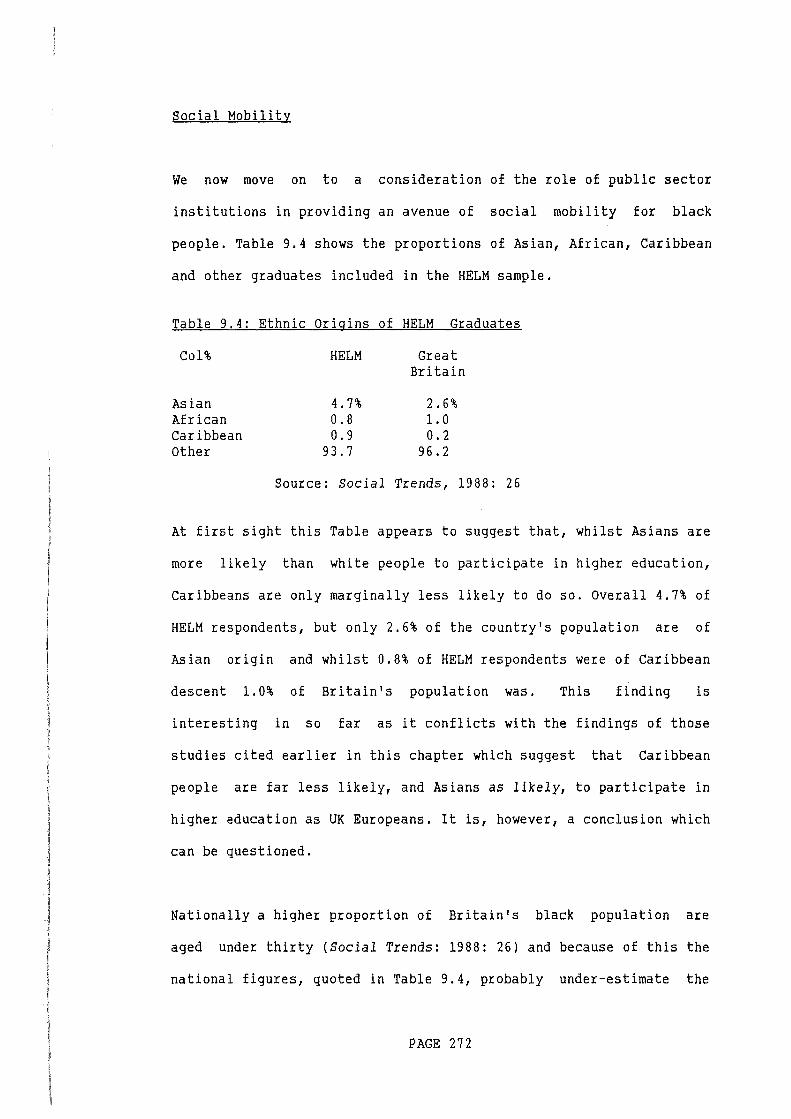
Social Mobility
We now move on to a consideration of the role of public sector
institutions in providing an avenue of social mobility for black
people. Table 9.4 shows the proportions of Asian, African, Caribbean
and other graduates included in the HELM sample.
Table 9.4: Ethnic Origins of HELM Graduates
Col% HELM Great Britain
Asian 4.7% 2.6% African 0. 8 1.0 Caribbean 0.9 0.2 Other 93.7 96.2
Source: Social Trends, 1988: 26
At first sight this Table appears to suggest that, whilst Asians are
more likely than white people to participate in higher education,
Caribbeans are only marginally less likely to do so. Overall 4.7% of
HELM respondents, but only 2.6% of the country's population are of
Asian origin and whilst 0.8% of HELM respondents were of Caribbean
descent 1.0% of Britain's population was. This finding is
interesting in so far as it conflicts with the findings of those
studies cited earlier in this chapter which suggest that Caribbean
people are far less likely, and Asians as likely, to participate in
higher education as UK Europeans. It is, however, a conclusion which
can be questioned.
Nationally a higher proportion of Britain's black population are
aged under thirty (Social Trends: 1988: 26) and because of this the
national figures, quoted in Table 9.4, probably under-estimate the
PAGE 272
II I
proportion of black people at an age in which they might pa:ticipate
in higher education. More importantly, however, the way in which the
sample was taken has probably artificially inflated the number of
black graduates included in the HELM sample. Nationally, black
people tend to live in a relatively small number of areas where they
form a particularly high proportion of the population (Brown, 1983:
20-1). Were institutions situated in these areas (eg London and the
West Midlands) over-represented in the HELM sample, then this would
have inflated the number of black people included in the sample.
Similarly, as shall be shown later in the chapter, black people
within the HELM sample, and Asians in particular, tended to
undertake a limited number of courses. Again were such courses
over-represented in the HELM sample then this may also have inflated
the numbers of black graduates there.
Even so, the HELM figures do show that public sector institutions
are providing places for Britain's black population. When it is
recalled that 21.5% of public sector but only 4.8% of university
graduates who replied to the CRE study were black, the overall
impression created is that public sector institutions are catering
for the needs of Britain's black population to a much greater extent
than the universities. This suggestion must, however, be set
alongside our earlier observation that, because of the way in which
the CRE sample was taken, it is not possible to calculate the extent
to which respondents were representative of graduates as a whole.
PAGE 273
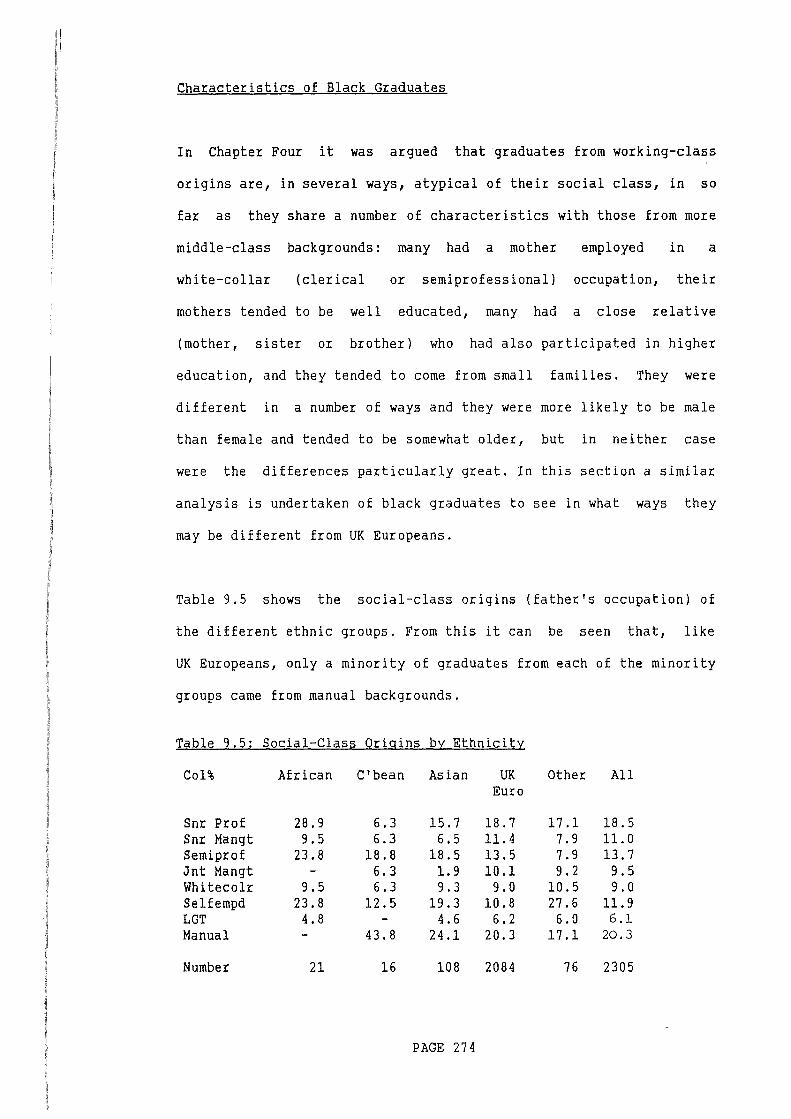
Characteristics of Black Graduates
In Chapter Four it was argued that graduates from working-class
origins are, in several ways, atypical of their social class, in so
far as they share a number of characteristics with those from more
middle-class backgrounds: many had a mother employed in a
white-collar (clerical or semiprofessional) occupation, their
mothers tended to be well educated, many had a close relative
(mother, sister or brother) who had also participated in higher
education, and they tended to come from small families. They were
different in a number of ways and they were more likely to be male
than female and tended to be somewhat older, but in neither case
were the differences particularly great. In this section a similar
analysis is undertaken of black graduates to see in what ways they
may be different from UK Europeans.
Table 9.5 shows the social-class origins (father's occupation) of
the different ethnic groups. From this it can be seen that, like
UK Europeans, only a minority of graduates from each of the minority
groups came from manual backgrounds.
Table 9.5: Social-Class Origins by Ethnicity
Col%
Snr Prof Snr Mangt Semipro£ Jnt Mangt Whitecolr Selfempd LGT Manual
Number
Afr.ican
28.9 9.5
23.8
9.5 23.8
4.8
21
C'bean
6.3 6.3
18.8 6.3 6.3
12.5
43.8
16
Asian
15.7 6.5
18.5 1.9 9.3
19.3 4. 6
24.1
108
PAGE 274
UK Euro
18.7 11.4 13.5 10.1
9.0 10.8
6.2 20.3
2084
Other
17.1 7.9 7.9 9.2
10.5 27.6 6.0
17.1
76
All
18.5 11.0 13.7 9.5 9.0
11.9 6.1
20.3
2305
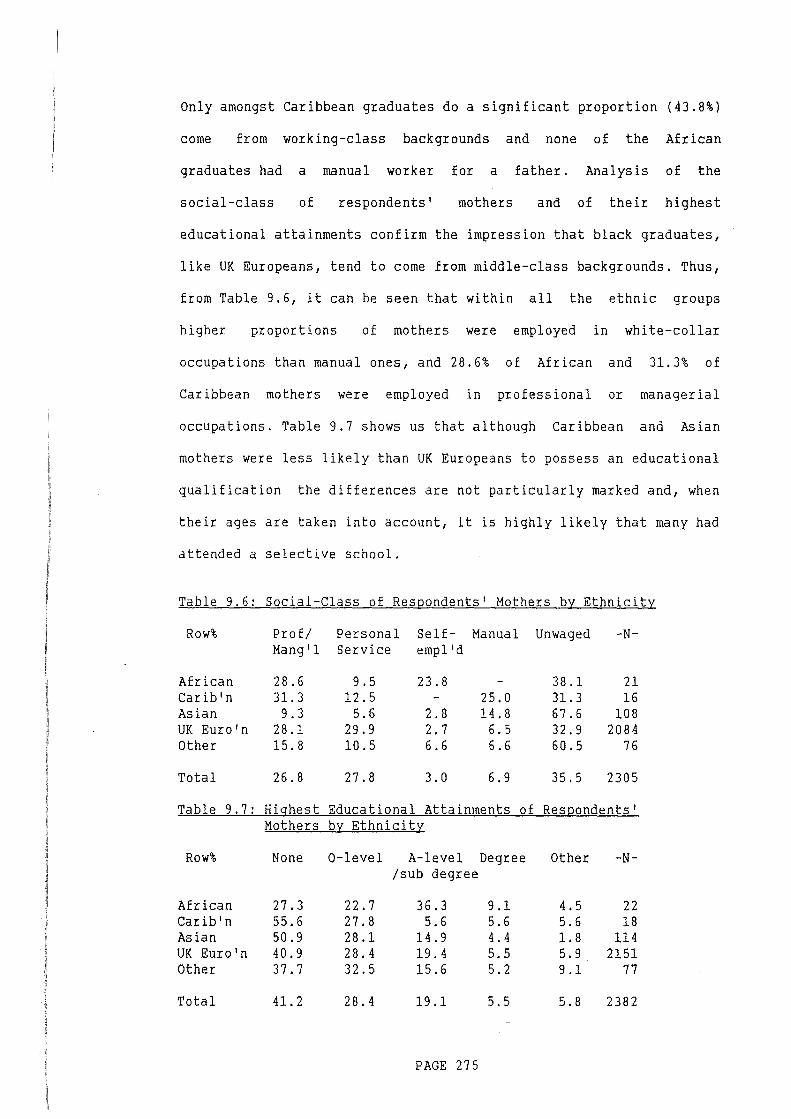
Only amongst Caribbean graduates do a significant proportion (43.8%)
come from working-class backgrounds and none of the African
graduates had a manual worker for a father. Analysis of the
social-class of respondents' mothers and of their highest
educational attainments confirm the impression that black graduates,
like UK Europeans, tend to come from middle-class backgrounds. Thus,
from Table 9.6, it can be seen that within all the ethnic groups
higher proportions of mothers were employed in white-collar
occupations than manual ones, and 28.6% of African and 31.3% of
Caribbean mothers were employed in professional or managerial
occupations. Table 9.7 shows us that although Caribbean and Asian
mothers were less likely than UK Europeans to possess an educational
qualification the differences are not particularly marked and, when
their ages are taken into account, it is highly likely that many had
attended a selective school.
Table 9.6: Social-Class of Respondents' Mothers by Ethnicity
Row% Prof/ Personal Self- Manual Unwaged -N-Mang'l Service empl'd
African 28.6 9.5 23.8 - 38.1 21 Carib'n 31.3 12.5 - 25.0 31.3 16 Asian 9. 3 5.6 2.8 14.8 67.6 108 UK Euro'n 28.1 29.9 2.7 6.5 32.9 2084 Other 15.8 10.5 6.6 6.6 60.5 76
Total 26.8 27.8 3.0 6.9 35.5 2305
Table 9.7: Highest Educational Attainments of Respondents' Mothers by Ethnicity
Row% None 0-level A-level Degree Other -N-/sub degree
African 27.3 22.7 36.3 9.1 4.5 22 Carib'n 55.6 27.8 5.6 5.6 5.6 18 Asian 50.9 28.1 14.9 4. 4 1.8 114 UK Euro'n 40.9 28.4 19.4 5.5 5.9 2151 Other 37.7 32.5 15.6 5.2 9.1 77
Total 41.2 28.4 19.1 5.5 5.8 2382
PAGE 275
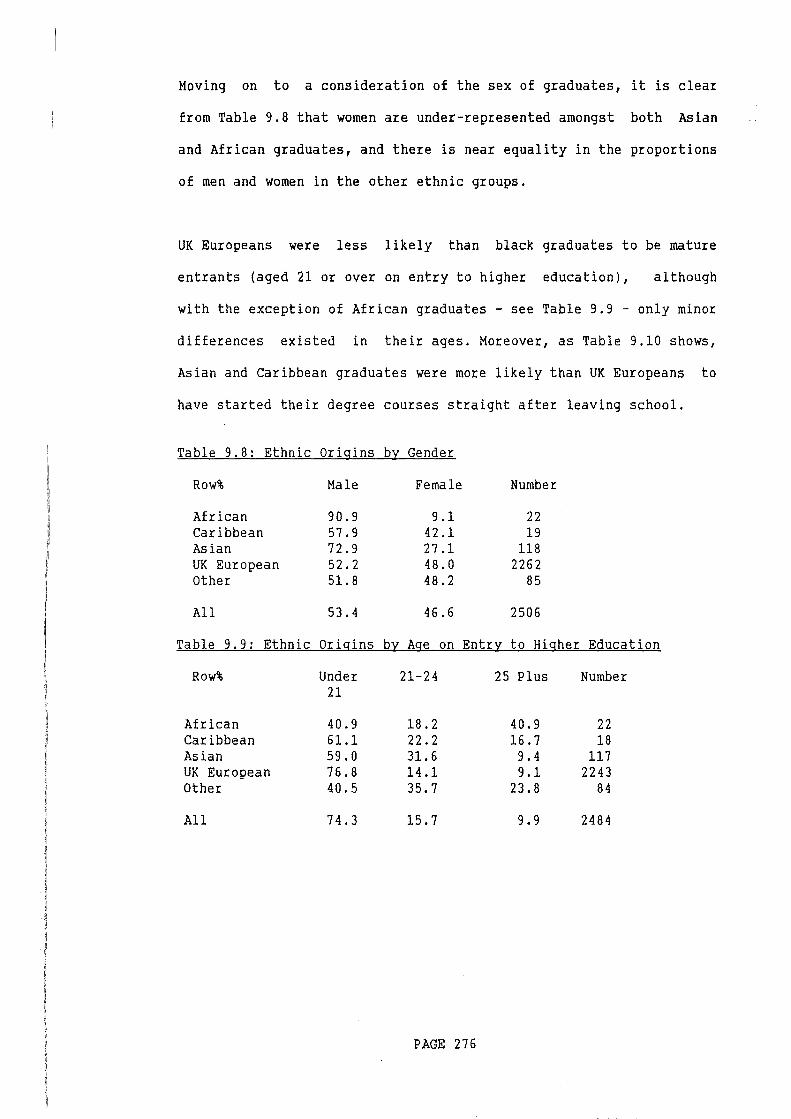
Moving on to a consideration of the sex of graduates, it is clear
from Table 9.8 that women are under-represented amongst both Asian
and African graduates, and there is near equality in the proportions
of men and women in the other ethnic groups.
UK Europeans were less likely than black graduates to be mature
entrants (aged 21 or over on entry to higher education), although
with the exception of African graduates - see Table 9.9 - only minor
differences existed in their ages. Moreover, as Table 9.10 shows,
Asian and Caribbean graduates were more likely than UK Europeans to
have started their degree courses straight after leaving school.
Table 9.8: Ethnic Origins by Gender
Row% Male Female Number
African 90.9 9.1 22 Caribbean 57.9 42.1 19 Asian 72.9 27.1 118 UK European 52.2 48.0 2262 Other 51.8 48.2 85
All 53.4 46.6 2506
Table 9.9: Ethnic Origins by Age on Entry to Higher Education
Row% Under 21-24 25 Plus Number 21
African 40.9 18.2 40.9 22 Caribbean 61.1 22.2 16.7 18 Asian 59.0 31.6 9.4 117 UK European 76.8 14.1 9.1 2243 Other 40.5 35.7 23.8 84
All 74.3 15.7 9.9 2484
PAGE 276
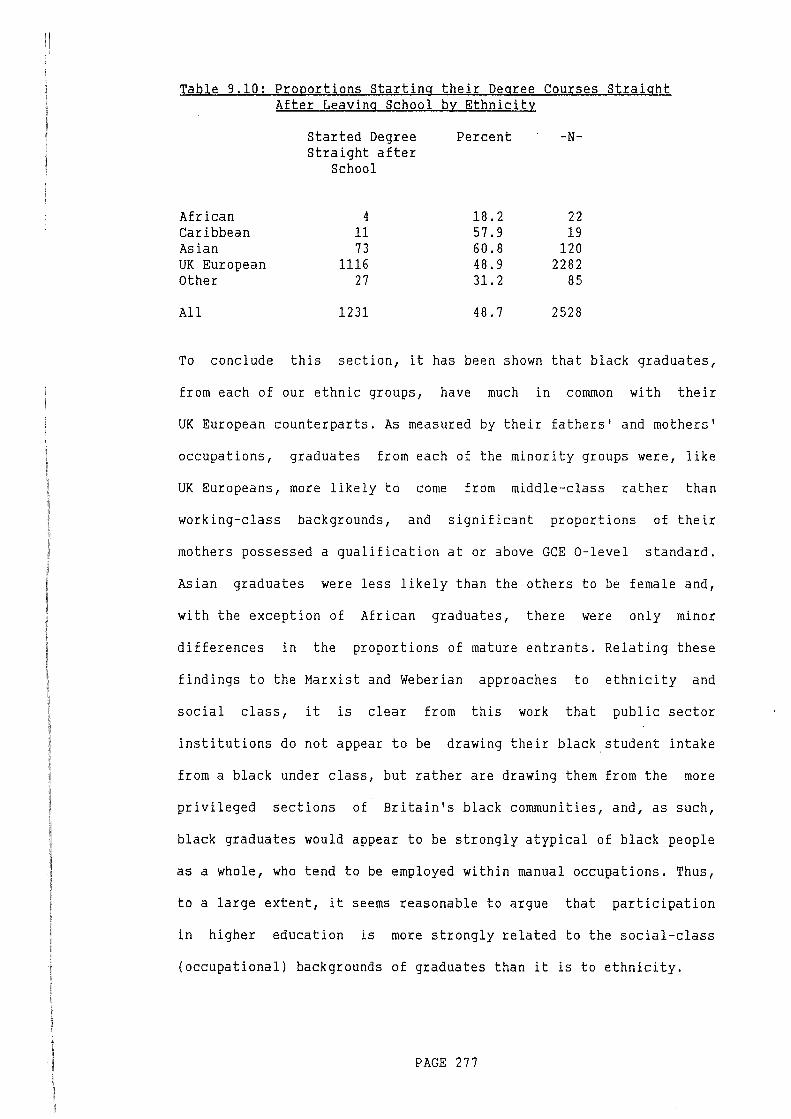
Table 9.10: ProQortions Starting their Degree Courses Straight After Leaving School by Ethnicity
Started Degree Percent -N-Straight after
School
African 4 18.2 22 Caribbean 11 57.9 19 Asian 73 60.8 120 UK European 1116 48.9 2282 Other 27 31.2 85
All 1231 48.7 2528
To conclude this section, it has been shown that black graduates,
from each of our ethnic groups, have much in common with their
UK European counterparts. As measured by their fathers' and mothers'
occupations, graduates from each of the minority groups were, like
UK Europeans, more likely to come from middle-class rather than
working-class backgrounds, and significant proportions of their
mothers possessed a qualification at or above GCE 0-level standard.
Asian graduates were less likely than the others to be female and,
with the exception of African graduates, there were only minor
differences in the proportions of mature entrants. Relating these
findings to the Marxist and Weberian approaches to ethnicity and
social class, it is clear from this work that public sector
institutions do not appear to be drawing their black student intake
from a black under class, but rather are drawing them from the more
privileged sections of Britain's black communities, and, as such,
black graduates would appear to be strongly atypical of black people
as a whole, who tend to be employed within manual occupations. Thus,
to a large extent, it seems reasonable to argue that participation
in higher education is more strongly related to the social-class
(occupational) backgrounds of graduates than it is to ethnicity.
PAGE 277
Secondary Education
Research into the factors which affect the educational performance
of black children has tended to focus upon those associated with
both the home and school. It is argued that many black children are
handicapped in so far as they are brought up in small, often
overcrowded, inner-city homes which lack basic facilities. Moreover
many West Indian children are disadvantaged because they originate
from single-parent families, and many of their mothers go out to
work (see Tomlinson, 1983: 64; Brown, 1984: 37). Since our principal
concern lies in analysing the educational origins and the
social-class destinations of black graduates we shall have little to
say about home-based factors, but suffice it to say here that when
one recalls the social-class origins of our sample, it seems
reasonable to suggest that relatively few of our HELM graduates
(apart possibly for some of the Caribbeans) would have been unduly
disadvantaged as a result of such home-based factors.
More important from our point of view is research which suggests
that many teachers hold stereotyped images of black children (see
Tomlinson (1983: 73-8) for a review of the literature), which lead
them to under-estimate their academic ability with the result that
they tend to underachieve in comparison to children who are more
favourably evaluated by teachers. If this is so, then one might
expect this to be reflected in the school curriculum undertaken by
black children such that Asian, African and Caribbean graduates
would be more likely to have studied a utilitarian, as opposed to an
academic, school curriculum, and it is to an examination of the
PAGE 278
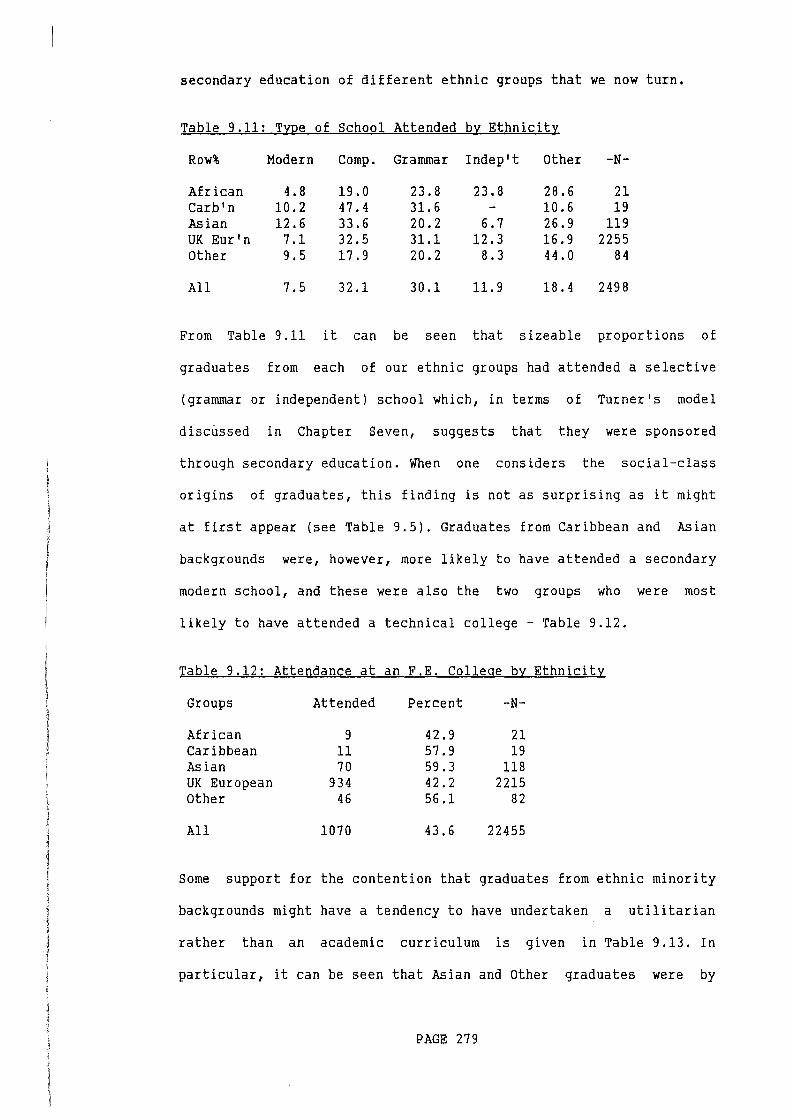
secondary education of different ethnic groups that we now turn.
Table 9.11: Type of School Attended by Ethnicity
Row% Modern Camp. Grammar Indep't Other -N-
African 4.8 19.0 23.8 23.8 28.6 21 Carb'n 10.2 47.4 31.6 - 10.6 19 Asian 12.6 33.6 20.2 6.7 26.9 119 UK Eur'n 7.1 32.5 31.1 12.3 16.9 2255 Other 9.5 17.9 20.2 8.3 44.0 84
All 7.5 32.1 30.1 11.9 18.4 2498
From Table 9.11 it can be seen that sizeable proportions of
graduates from each of our ethnic groups had attended a selective
(grammar or independent) school which, in terms of Turner's model
discussed in Chapter Seven, suggests that they were sponsored
through secondary education. When one considers the social-class
origins of graduates, this finding is not as surprising as it might
at first appear (see Table 9.5). Graduates from Caribbean and Asian
backgrounds were, however, more likely to have attended a secondary
modern school, and these were also the two groups who were most
likely to have attended a technical college - Table 9.12.
Table 9.12: Attendance at an F.E. College by Ethnicity
Groups
African Caribbean Asian UK European Other
All
Attended
9 11 70
934 46
1070
Percent -N-
42.9 21 57.9 19 59.3 118 42.2 2215 56.1 82
43.6 22455
Some support for the contention that graduates from ethnic minority
backgrounds might have a tendency to have undertaken a utilitarian
rather than an academic curriculum is given in Table 9.13. In
particular, it can be seen that Asian and Other graduates were by
PAGE 279
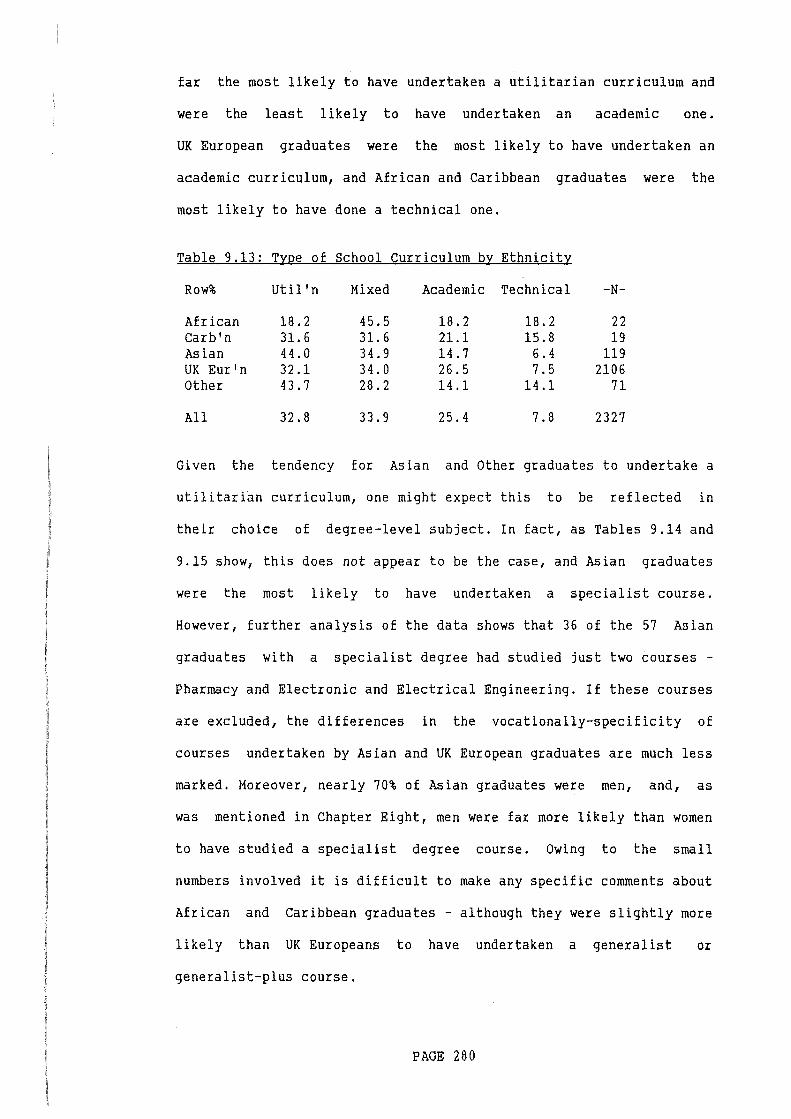
far the most likely to have undertaken a utilitarian curriculum and
were the least likely to have undertaken an academic one.
UK European graduates were the most likely to have undertaken an
academic curriculum, and African and Caribbean graduates were the
most likely to have done a technical one.
Table 9.13: Type of School Curriculum by Ethnicity
Row% Util 'n Mixed Academic Technical -N-
African 18.2 45.5 18.2 18.2 22 Carb'n 31.6 31.6 21.1 15.8 19 Asian 44.0 34.9 14.7 6.4 119 UK Eur•n 32.1 34.0 26.5 7.5 2106 Other 43.7 28.2 14.1 14.1 71
All 32.8 33.9 25.4 7. 8 2327
Given the tendency for Asian and Other graduates to undertake a
utilitarian curriculum, one might expect this to be reflected in
their choice of degree-level subject. In fact, as Tables 9.14 and
9.15 show, this does not appear to be the case, and Asian graduates
were the most likely to have undertaken a specialist course.
However, further analysis of the data shows that 36 of the 57 Asian
graduates with a specialist degree had studied just two courses -
Pharmacy and Electronic and Electrical Engineering. If these courses
are excluded, the differences in the vocationally-specificity of
courses undertaken by Asian and UK European graduates are much less
marked. Moreover, nearly 70% of Asian graduates were men, and, as
was mentioned in Chapter Eight, men were far more likely than women
to have studied a specialist degree course. Owing to the small
numbers involved it is difficult to make any specific comments about
African and Caribbean graduates - although they were slightly more
likely than UK Europeans to have undertaken a generalist or
generalist-plus course.
PAGE 280
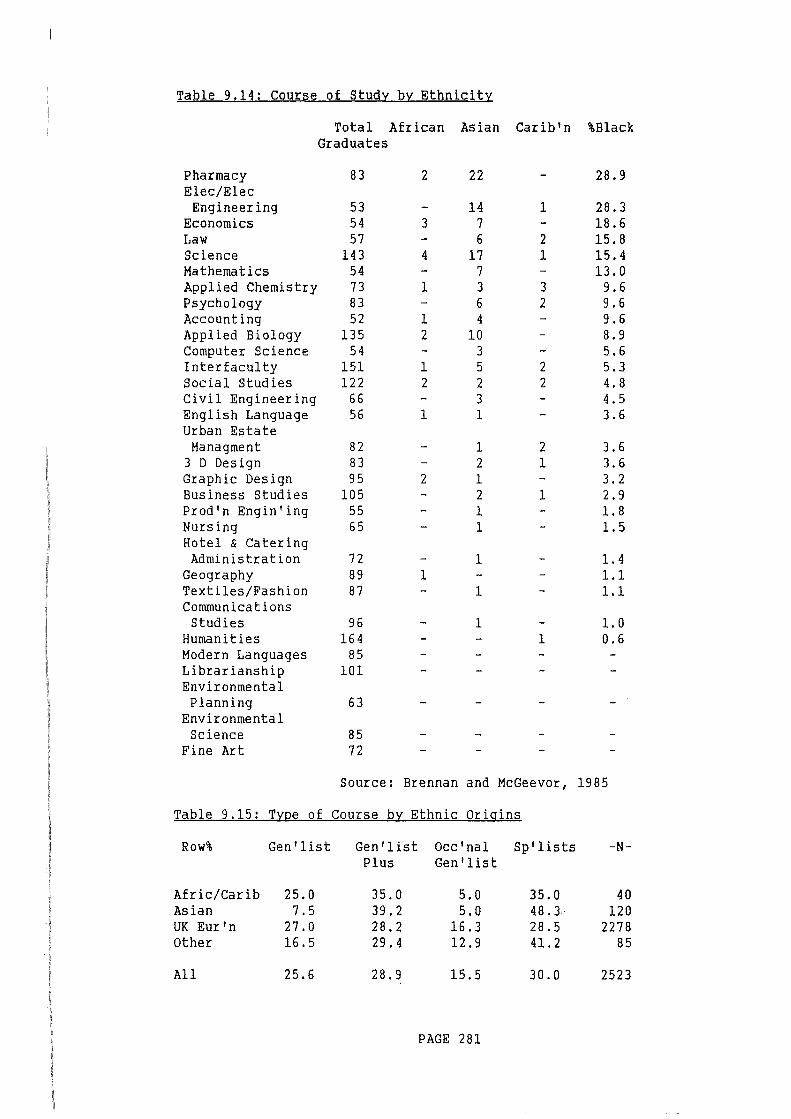
Table 9.14: Course of Study by Ethnicity
Total African Asian Carib'n %Black Graduates
Pharmacy 83 Elec/Elec
Engineering 53 Economics 54 Law 57 Science 143 Mathematics 54 Applied Chemistry 73 Psychology 83 Accounting 52 Applied Biology 135 Computer Science 54 Interfaculty 151 Social Studies 122 Civil Engineering 66 English Language 56 Urban Estate
Managment 82 3 D Design 83 Graphic Design 95 Business Studies 105 Prod'n Engin'ing 55 Nursing 65 Hotel & Catering Administration 72
Geography 89 Textiles/Fashion 87 Communications Studies 96
Humanities 164 Modern Languages 85 Librarianship 101 Environmental
Planning 63 Environmental
Science Fine Art
85 72
2
3
4
1
1 2
1 2
1
2
1
22
14 7 6
17 7 3 6 4
10 3 5 2 3 1
1 2 1 2 1 1
1
1
1
1
2 1
3 2
2 2
2 1
1
1
28.9
28.3 18.6 15.8 15.4 13.0
9.6 9.6 9.6 8.9 5.6 5.3 4.8 4.5 3.6
3.6 3.6 3.2 2.9 1.8 1.5
1.4 1.1 1.1
1.0 0.6
Source: Brennan and McGeever, 1985
Table 9.15: Type of Course by Ethnic Origins
Row%
Afric/Carib Asian UK Eur'n Other
All
Gen'list
25.0 7.5
27.0 16.5
25.6
Gen' list Plus
35.0 39.2 28.2 29.4
28.9
Occ'nal Gen'list
5.0 5.0
16.3 12.9
15.5
PAGE 281
Sp' lists
35.0 48.3 28.5 41.2
30.0
-N-
40 120
2278 85
2523
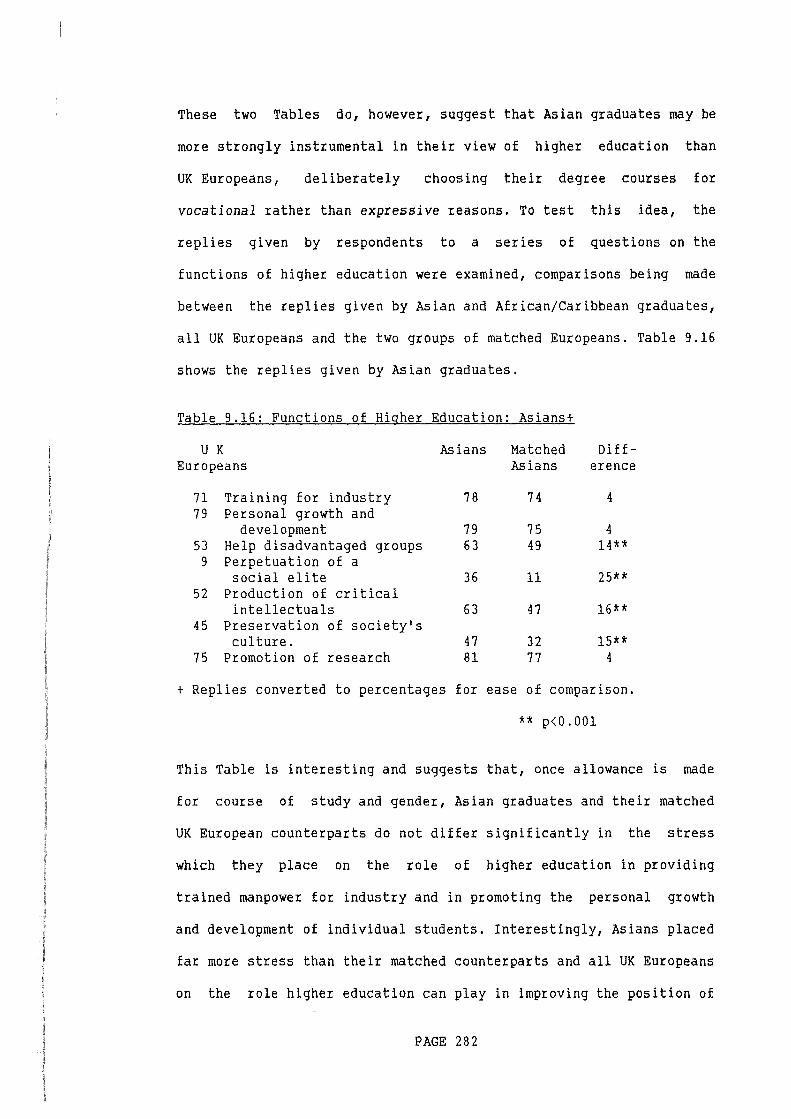
These two Tables do, however, suggest that Asian graduates may be
more strongly instrumental in their view of higher education than
UK Europeans, deliberately choosing their degree courses for
vocational rather than expressive reasons. To test this idea, the
replies given by respondents to a series of questions on the
functions of higher education were examined, comparisons being made
between the replies given by Asian and African/Caribbean graduates,
all UK Europeans and the two groups of matched Europeans. Table 9.16
shows the replies given by Asian graduates.
Table 9.16: Functions of Higher Education: Asians+
U K Asians Matched Diff-Europeans Asians erence
71 Training for industry 78 74 4 79 Personal growth and
development 79 75 4 53 Help disadvantaged groups 63 49 14** 9 Perpetuation of a
social elite 36 11 25** 52 Production of critical
intellectuals 63 47 16** 45 Preservation of society's
culture. 47 32 15** 75 Promotion of research 81 77 4
t Replies converted to percentages for ease of comparison.
** p<0.001
This Table is interesting and suggests that, once allowance is made
for course of study and gender, Asian graduates and their matched
UK European counterparts do not differ significantly in the stress
which they place on the role of higher education in providing
trained manpower for industry and in promoting the personal growth
and development of individual students. Interestingly, Asians placed
far more stress than their matched counterparts and all UK Europeans
on the role higher education can play in improving the position of
PAGE 282
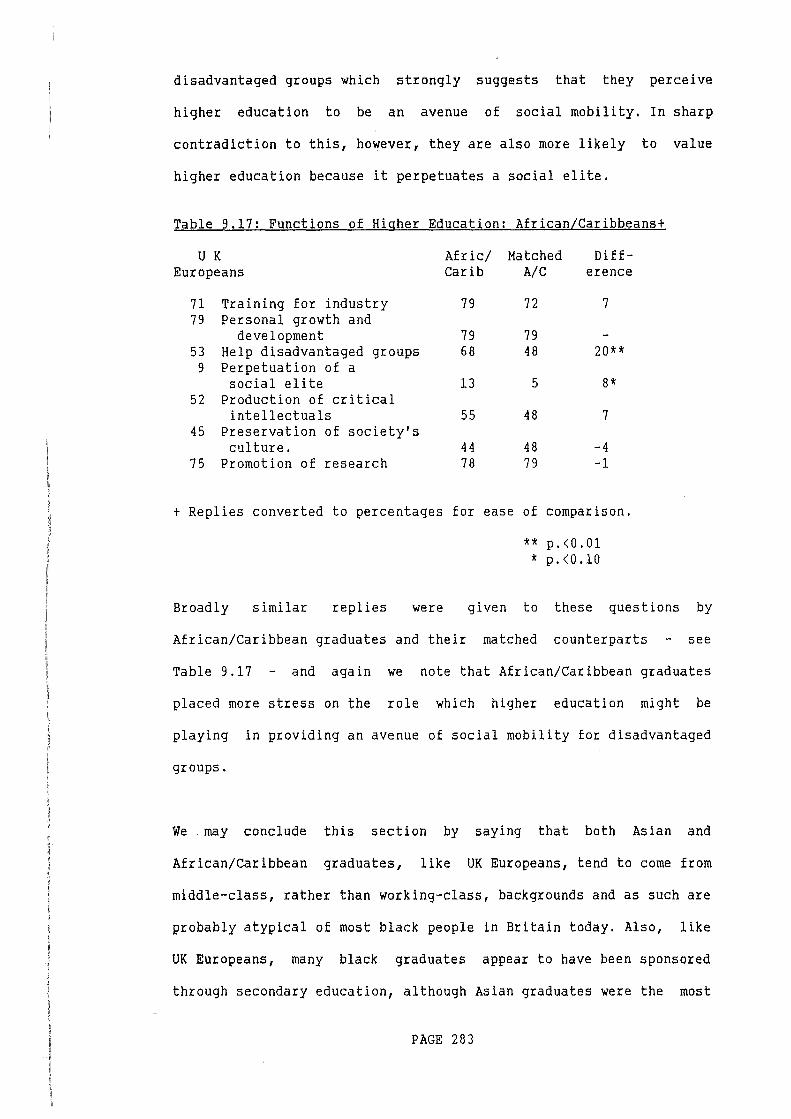
disadvantaged groups which strongly suggests that they perceive
higher education to be an avenue of social mobility. In sharp
contradiction to this, however, they are also more likely to value
higher education because it perpetuates a social elite.
Table 9.17: Functions of Higher Education: African/Caribbeans+
U K Afric/ Matched Diff-Europeans Carib A/C erence
71 Training for industry 79 72 7 79 Personal growth and
development 79 79 53 Help disadvantaged groups 68 48 20** 9 Perpetuation of a
social elite 13 5 8* 52 Production of critical
intellectuals 55 48 7 45 Preservation of society's
culture. 44 48 -4 75 Promotion of research 78 79 -1
+ Replies converted to percentages for ease of comparison.
Broadly similar replies were
** p.<O.Ol * p.<O.lO
given to these questions by
African/Caribbean graduates and their matched counterparts - see
Table 9.17 and again we note that African/Caribbean graduates
placed more stress on the role which higher education might be
playing in providing an avenue of social mobility for disadvantaged
groups.
We . may conclude this section by saying that both Asian and
African/Caribbean graduates, like UK Europeans, tend to come from
middle-class, rather than working-class, backgrounds and as such are
probably atypical of most black people in Britain today. Also, like
UK Europeans, many black graduates appear to have been sponsored
through secondary education, although Asian graduates were the most
PAGE 283
likely to have attended a secondary modern or comprehensive school
and they were also the most likely to have undertaken a utilitarian
curriculum. However, Asian graduates showed a strong preference for
undertaking strongly vocationally-orientated courses, and this
suggests that they may tend to hold more instrumental views of the
role which higher education might play in improving their vocational
opportunities and social status. Even so, no statistically
significant differences were found to exist in how Asian graduates
viewed the role of higher education in providing trained manpower
for industry, although both ethnic-minority groups stressed the role
which higher education might play in providing an avenue of social
mobility for the disadvantaged.
Part Three: Ethnic Minorities in the Graduate Labour Market
Little is known about the employment of black graduates. Ballard and
Holden (1975) looked at the difficulties encountered by black and
white students in applying for graduate-level jobs during their
final year at college. They concluded that black students made on
average more job applications, received fewer interviews and were
rejected for more jobs than white students. Further analysis of
their data suggested that these findings had not been unduly
influenced by other factors such as course of study, age, gender and
social origins. Brennan and McGeevor (1985) have already analysed
the Wave I HELM data relating to the employment of black graduates.
Their work suggested that both Asian and Caribbean graduates were
less likely to be in full-time employment and more likely to be
unemployed or in full-time education than their matched counterparts
(p 19-21). Using a variety of measures of 'job quality', they
PAGE 284
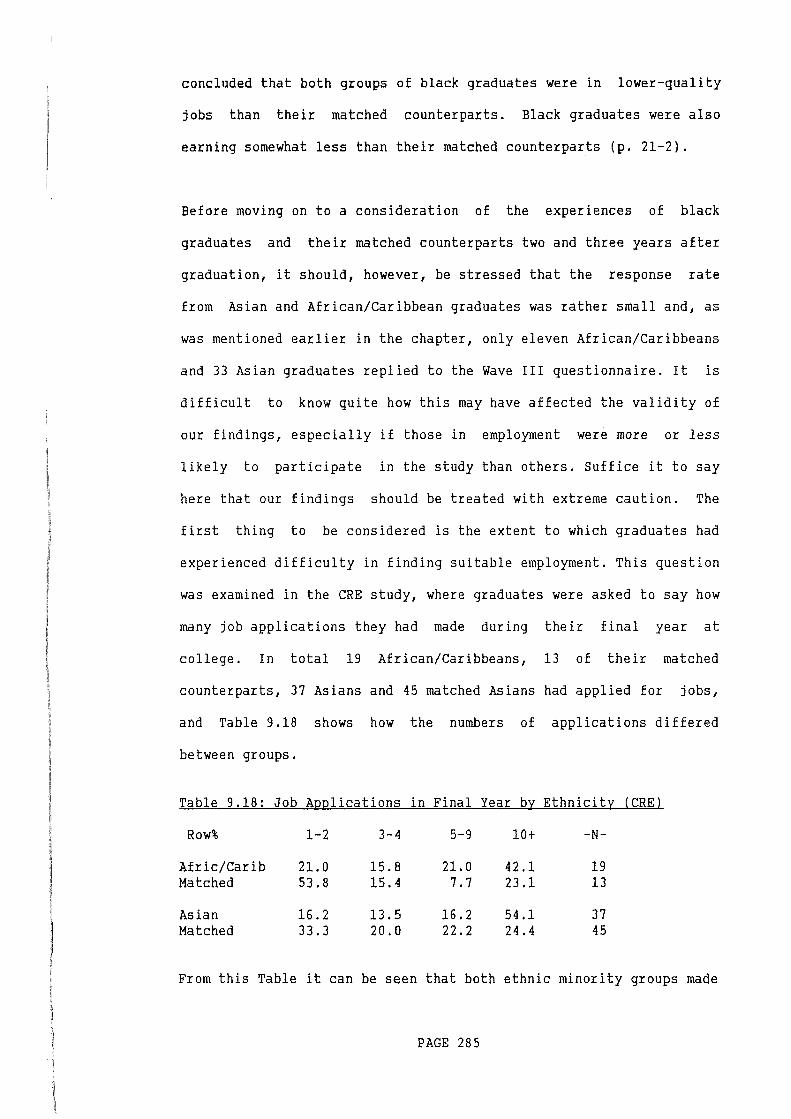
concluded that both groups of black graduates were in lower-quality
jobs than their matched counterparts. Black graduates were also
earning somewhat less than their matched counterparts (p. 21-2).
Before moving on to a consideration of the experiences of black
graduates and their matched counterparts two and three years after
graduation, it should, however, be stressed that the response rate
from Asian and African/Caribbean graduates was rather small and, as
was mentioned earlier in the chapter, only eleven African/Caribbeans
and 33 Asian graduates replied to the Wave III questionnaire. It is
difficult to know quite how this may have affected the validity of
our findings, especially if those in employment were more or less
likely to participate in the study than others. Suffice it to say
here that our findings should be treated with extreme caution. The
first thing to be considered is the extent to which graduates had
experienced difficulty in finding suitable employment. This question
was examined in the CRE study, where graduates were asked to say how
many job applications they had made during their final year at
college. In total 19 African/Caribbeans, 13 of their matched
counterparts, 37 Asians and 45 matched Asians had applied for jobs,
and Table 9.18 shows how the numbers of applications differed
between groups.
Table 9.18: Job Applications in Final Year by Ethnicity (CREl
Row% 1-2 3-4 5-9 10+ -N-
Afric/Carib 21.0 15.8 21.0 42.1 19 Matched 53.8 15.4 7.7 23.1 13
Asian 16.2 13.5 16.2 54.1 37 Matched 33.3 20.0 22.2 24.4 45
From this Table it can be seen that both ethnic minority groups made
PAGE 285
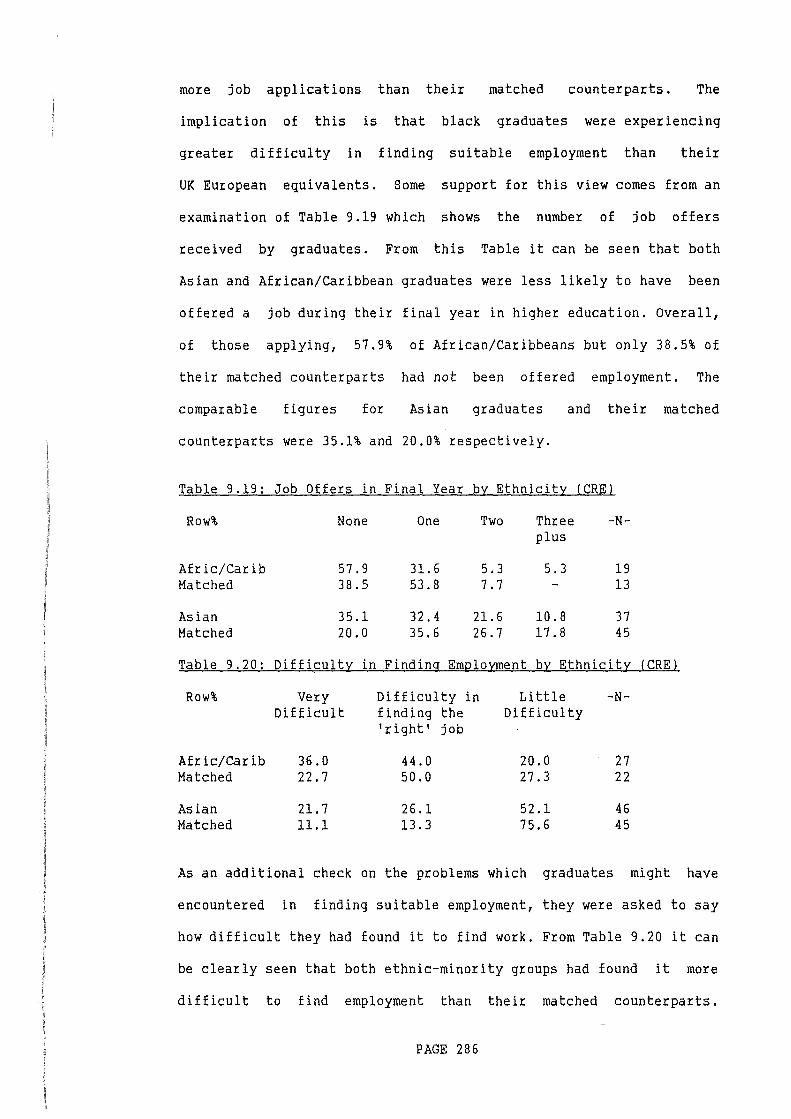
more job applications than their matched counterparts. The
implication of this is that black graduates were experiencing
greater difficulty in finding suitable employment than their
UK European equivalents. Some support for this view comes from an
examination of Table 9.19 which shows the number of job offers
received by graduates. From this Table it can be seen that both
Asian and African/Caribbean graduates were less likely to have been
offered a job during their final year in higher education. Overall,
of those applying, 57.9% of African/Caribbeans but only 38.5% of
their matched counterparts had not been offered employment. The
comparable figures for Asian graduates and their matched
counterparts were 35.1% and 20.0% respectively.
Table 9.19: Job Offers in Final Year by Ethnicity (CRE)
Row% None One Two Three -N-plus
Afric/Carib 57.9 31.6 5.3 5.3 19 Matched 38.5 53.8 7. 7 - 13
Asian 35.1 32.4 21.6 10.8 37 Matched 20.0 35.6 26.7 17.8 45
Table 9.20: Difficulty in Finding Employment by Ethnicity (CRE)
Row% Very Difficulty in Little -N-Difficult finding the Difficulty
'right' job
Afric/carib 36.0 44.0 20.0 27 Matched 22.7 50.0 27.3 22
Asian 21.7 26.1 52.1 46 Matched 11.1 13.3 75.6 45
As an additional check on the problems which graduates might have
encountered in finding suitable employment, they were asked to say
how difficult they had found it to find work. From Table 9.20 it can
be clearly seen that both ethnic-minority groups had found it more
difficult to find employment than their matched counterparts.
PAGE 286
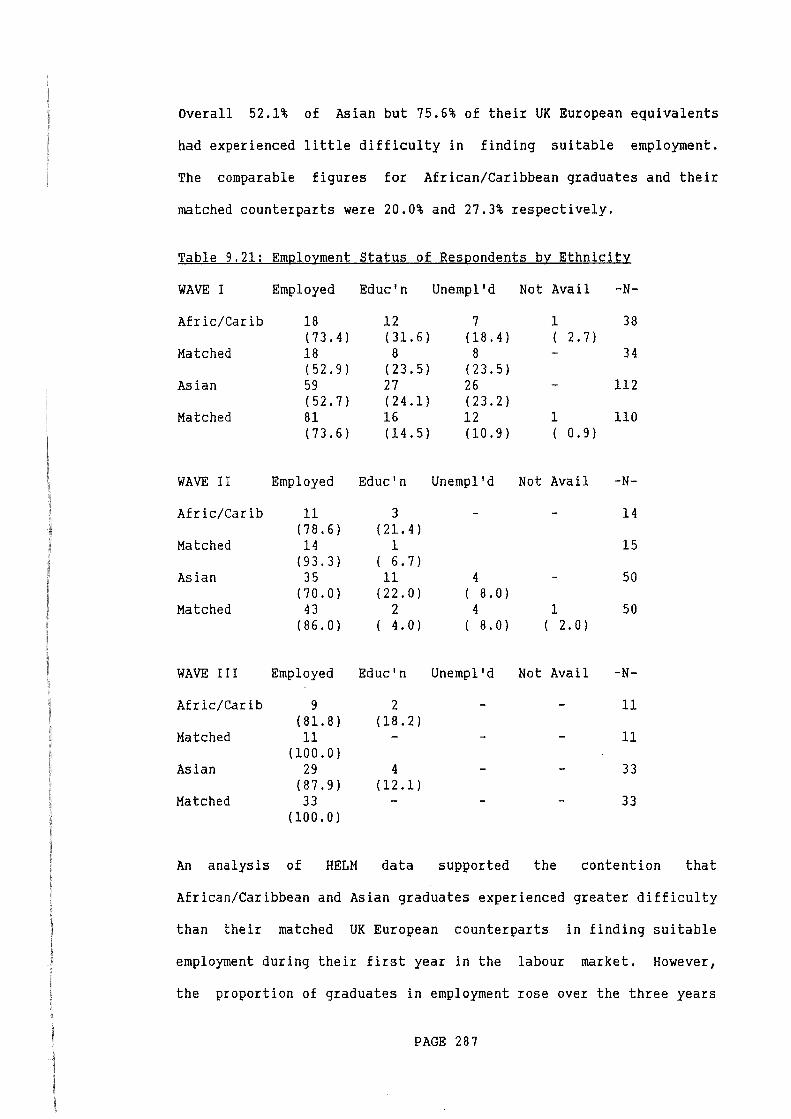
Overall 52.1% of Asian but 75.6% of their UK European equivalents
had experienced little difficulty in finding suitable employment.
The comparable figures for African/Caribbean graduates and their
matched counterparts were 20.0% and 27.3% respectively.
Table 9.21: Employment Status of Respondents by Ethnicity
WAVE I
Afric/Carib
Matched
Asian
Matched
WAVE II
Afric/carib
Matched
Asian
Matched
WAVE II I
Employed
18 ( 73.4) 18 (52.9) 59 (52.7) 81 ( 73.6)
Employed
11 ( 78.6) 14
(93.3) 35
( 70.0) 43
(86.0)
Employed
Afric/carib 9 (81.8)
Matched 11 (100.0)
Asian 29 ( 87.9)
Matched 33 (100.0)
Educ'n
12 ( 31.6) 8
( 23.5) 27 (24.1) 16 (14.5)
Educ'n
3 ( 21.4)
1 ( 6. 7) 11
( 22.0) 2
( 4. 0)
Educ'n
2 (18.2)
4 ( 12 .1)
Unempl'd
7 ( 18.4) 8
( 23.5) 26 ( 23.2) 12 ( 10.9)
Unempl'd
4 ( 8. 0)
4 ( 8. 0)
Unempl'd
Not Avail -N-
1 38 ( 2. 7)
34
112
1 110 ( 0. 9)
Not Avail -N-
14
15
50
1 50 ( 2. 0)
Not Avail -N-
11
11
33
33
An analysis of HELM data supported the contention that
African/Caribbean and Asian graduates experienced greater difficulty
than their matched UK European counterparts in finding suitable
employment during their first year in the labour market. However,
the proportion of graduates in employment rose over the three years
PAGE 287
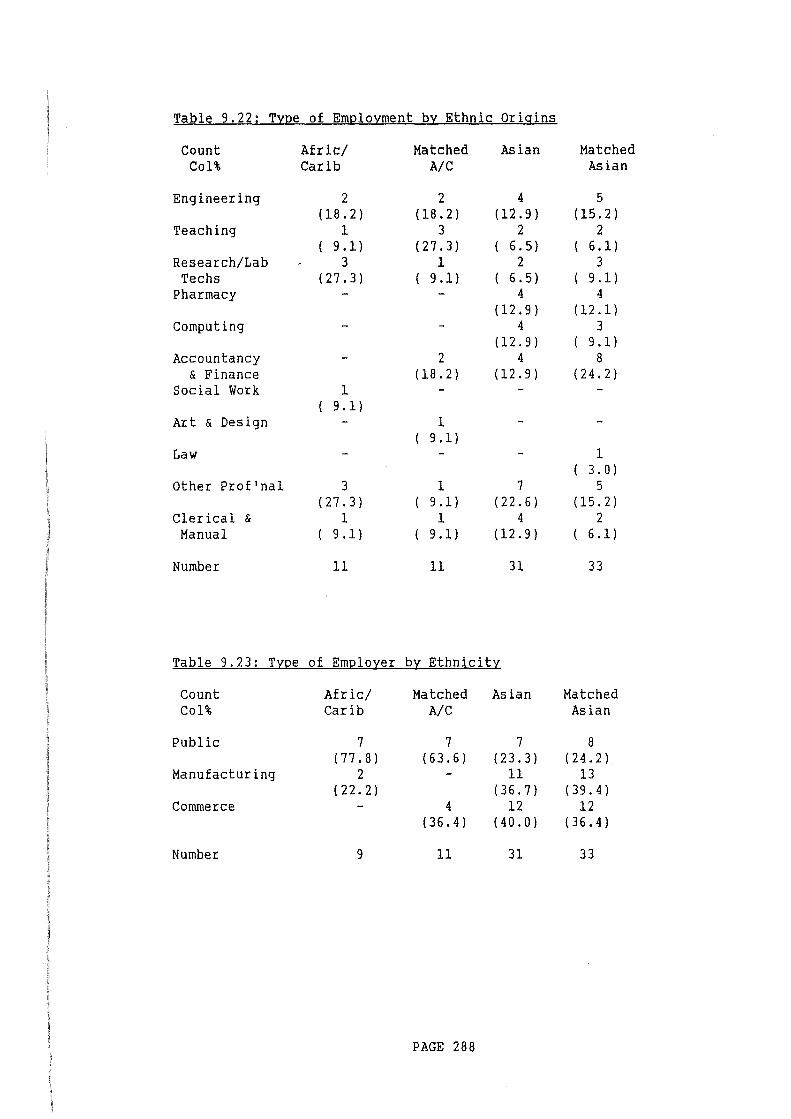
Table 9.22: Type of Employment by Ethnic Origins
Count Afric/ Matched Asian Matched Col% Carib A/C Asian
Engineering 2 2 4 5 ( 18.2) ( 18.2) ( 12.9) ( 15.2)
Teaching 1 3 2 2 ( 9.1) (27.3) ( 6.5) ( 6.1)
Research/Lab 3 1 2 3 Techs ( 27.3) ( 9 .1) ( 6. 5) ( 9.1)
Pharmacy - - 4 4 ( 12.9) ( 12.1)
Computing - - 4 3 {12. 9) ( 9 .1)
Accountancy - 2 4 8 & Finance ( 18.2) (12.9) ( 24. 2)
Social Work 1 9.1)
Art & Design - 1 9.1)
Law - - - 1 3. 0)
Other Prof'nal 3 1 7 5 ( 27.3) ( 9 .1) ( 22.6) (15.2)
Clerical & 1 1 4 2 Manual ( 9.1) ( 9 .1) ( 12.9) ( 6.1)
Number 11 11 31 33
Table 9.23: Type of Employer by Ethnicity
Count Afric/ Matched Asian Matched Col% Carib A/C Asian
Public 7 7 7 8 ( 77.8) ( 63.6) (23.3) ( 24.2)
Manufacturing 2 - 11 13 ( 22.2) ( 36. 7) ( 39. 4)
Commerce - 4 12 12 ( 36.4) ( 40.0) ( 36.4)
Number 9 11 31 33
PAGE 288
of the study (see Table 9.21), and none of the black graduates nor
their matched counterparts was unemployed after three years,
although four Asian and two African/Caribbean respondents were in
full-time study three years after graduation.
Moving on to a consideration of their employment, Table 9.22 shows
the types of work they were undertaking three years after graduation
and Table 9.23 shows the sectors of the economy within which they
were employed. Reading these two Tables together, we see that none
of the African/Caribbean graduates were employed in commerce in
comparison with four of their matched counterparts, and only four
Asians, but nine of their matched counterparts were employed in
accountancy, finance and law. This is an interesting finding, which
adds some support to the contention that the graduate labour market
may be segmented according to ethnicity. Unfortunately the small
numbers involved make such an interpretation difficult, although
some additional support for this view comes from an examination of
Table 9.24 which shows the employment sector of CRE graduates. As in
the HELM survey, African/Caribbean graduates were more likely than
their matched counterparts to be employed in the public sector, but
unlike HELM graduates, they were considerably less likely to be
employed in manufacturing. More interesting are the differences in
the employment sectors of Asian graduates and their matched
counterparts, and we note in particular the much higher proportion
of Asians who were self-employed.
PAGE 289
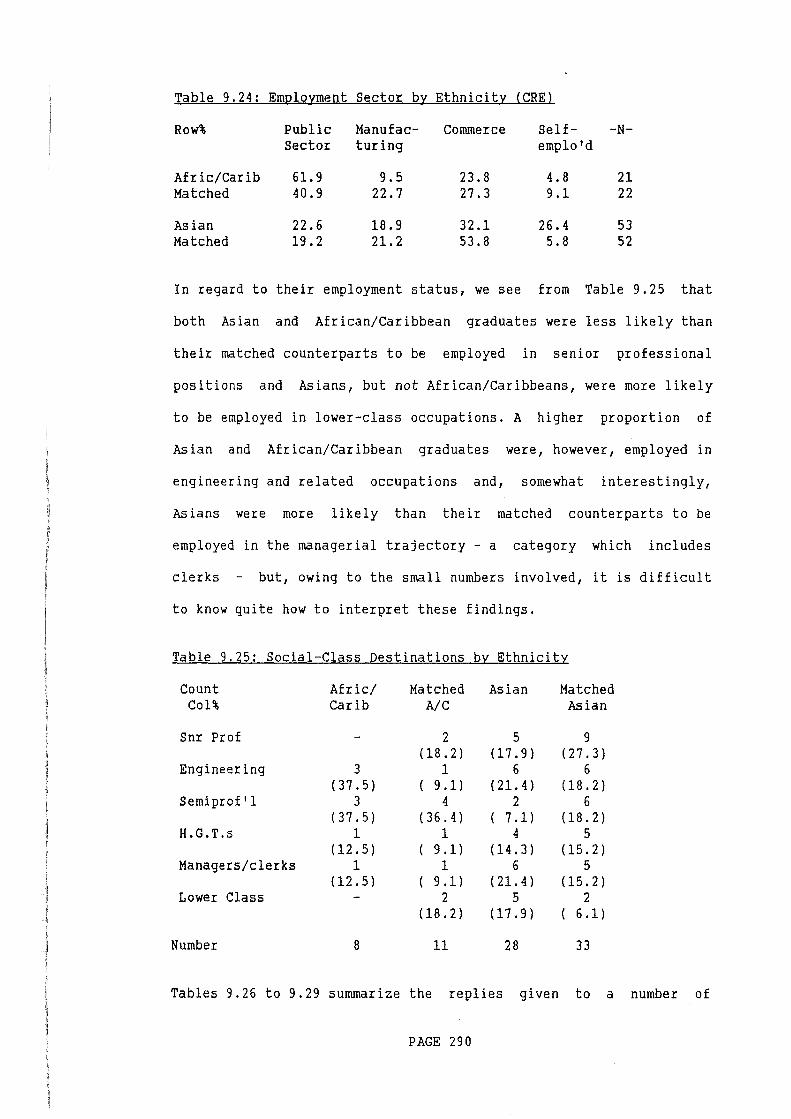
Table 9.24: Employment Sector by Ethnicity (CRE)
Row% Public Manufac- Commerce Self- -N-Sector turing emplo'd
Afric/Carib 61.9 9.5 23.8 4.8 21 Matched 40.9 22.7 27.3 9.1 22
Asian 22.6 18.9 32.1 26.4 53 Matched 19.2 21.2 53.8 5.8 52
In regard to their employment status, we see from Table 9.25 that
both Asian and African/Caribbean graduates were less likely than
their matched counterparts to be employed in senior professional
positions and Asians, but not African/Caribbeans, were more likely
to be employed in lower-class occupations. A higher proportion of
Asian and African/Caribbean graduates were, however, employed in
engineering and related occupations and, somewhat interestingly,
Asians were more likely than their matched counterparts to be
employed in the managerial trajectory - a category which includes
clerks but, owing to the small numbers involved, it is difficult
to know quite how to interpret these findings.
Table 9.25: Social-Class Destinations by Ethnicity
Count Col%
Snr Prof
Engineering
Semiprof'l
H.G.T.s
Managers/clerks
Lower Class
Number
Afric/ carib
3 (37.5)
3 ( 37.5)
1 ( 12.5)
1 (12.5)
8
Matched A/C
2 (18.2)
1 ( 9 .1)
4 (36.4)
1 9.1) 1
9 .1) 2
( 18.2)
11
Asian Matched Asian
5 9 ( 17.9) (27.3)
6 6 ( 21. 4) (18.2)
2 6 ( 7 .1) ( 18.2)
4 5 (14.3) ( 15.2)
6 5 ( 21. 4) ( 15.2)
5 2 (17.9) ( 6 .1)
28 33
Tables 9.26 to 9.29 summarize the replies given to a number of
PAGE 290
questions intended to measure 'job quality' by both HELM and CRE
respondents. The overall impression gained from an examination of
these Tables is that, whilst Asians tend to be in lower-status jobs
than their matched counterparts, African/Caribbeans appear to have
fared no better and no worse than their matched counterparts.
However, the position of the two minority groups does appear to have
improved considerably over the three years of the study. When it is
recalled that unemployment amongst black people in the population as
a whole is far higher than that for white people and that black
people tend to be in lower-status jobs, this would suggest that even
though Asian graduates do not appear to have performed as well as
white graduates, higher education is a major avenue of social
mobility for those black people who have participated in it. Again,
however, it should be stressed that these conclusions should be
treated with some caution owing to the small number of respondents.
From Table 9.26 we see that there are only minor differences in the
annual earnings of our two minority groups and their matched
counterparts. Asian graduates in the HELM sample were earning
slightly more than their UK European equivalents two years after
graduation, and the same was also true of those Asians sampled in
the CRE study. Three years after graduation, African/Caribbean
graduates in both studies were earning more than their matched
counterparts.
PAGE 291
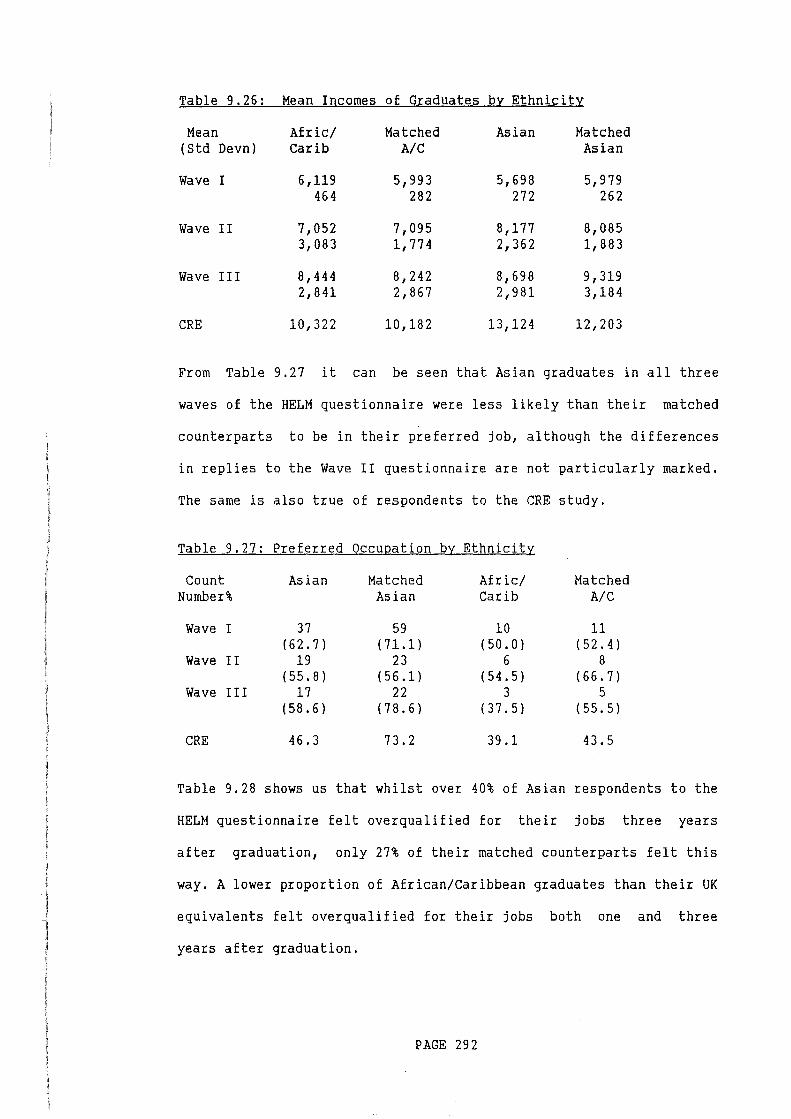
Table 9.26: Mean Incomes of Grad1.late_s bv Ethnici ty
Mean Afric/ Matched Asian Matched (Std Devn) Carib A/C Asian
Wave I 6,119 5,993 5,698 5,979 464 282 272 262
Wave II 7,052 7,095 8,177 8,085 3,083 1,774 2,362 1,883
Wave III 8,444 8,242 8,698 9,319 2,841 2,867 2,981 3,184
CRE 10,322 10,182 13,124 12,203
From Table 9.27 it can be seen that Asian graduates in all three
waves of the HELM questionnaire were less likely than their matched
counterparts to be in their preferred job, although the differences
in replies to the Wave II questionnaire are not particularly marked.
The same is also true of respondents to the CRE study.
Table 9.27: Preferred Occupation by Ethnicity
Count Asian Matched Afric/ Matched Number% Asian Carib A/C
Wave I 37 59 10 11 (62.7) (71.1) (50. 0) (52. 4)
Wave II 19 23 6 8 (55. 8) (56 .1) (54.5) ( 66. 7)
Wave III 17 22 3 5 (58. 6) ( 78.6) ( 37.5) (55.5)
CRE 46.3 73.2 39.1 43.5
Table 9.28 shows us that whilst over 40% of Asian respondents to the
HELM questionnaire felt overqualified for their jobs three years
after graduation, only 27% of their matched counterparts felt this
way. A lower proportion of African/Caribbean graduates than their UK
equivalents felt overqualified for their jobs both one and three
years after graduation.
PAGE 292
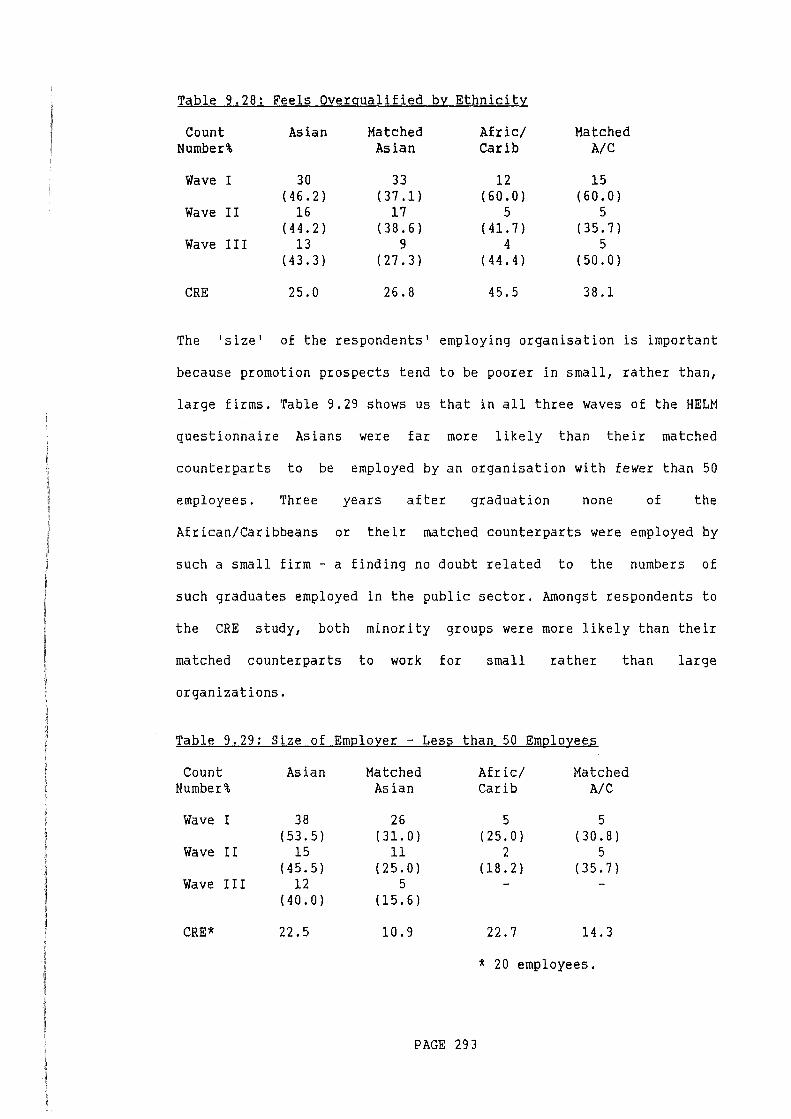
Table 9.28: Feels Overqualified by Ethnicity
Count Asian Matched Afric/ Matched Number% Asian carib A/C
Wave I 30 33 12 15 (46.2) (37.1) (60.0) (60.0)
Wave II 16 17 5 5 (44.2) (38.6) ( 41.7) ( 35.7)
Wave III 13 9 4 5 (43.3) ( 27.3) ( 4 4. 4) (50.0)
CRE 25.0 26.8 45.5 38.1
The 'size' of the respondents' employing organisation is important
because promotion prospects tend to be poorer in small, rather than,
large firms. Table 9.29 shows us that in all three waves of the HELM
questionnaire Asians were far more likely than their matched
counterparts to be employed by an organisation with £ewer than 50
employees. Three years after graduation none of the
African/Caribbeans or their matched counterparts were employed by
such a small firm - a finding no doubt related to the numbers of
such graduates employed in the public sector. Amongst respondents to
the CRE study, both minority groups were more likely than their
matched counterparts to work for small rather than large
organizations.
Table 9.29: Size of Employer -Less than 50 Employees
Count Asian Matched Afric/ Matched Number% Asian Carib A/C
Wave I 38 26 5 5 (53.5) (31. 0) ( 25.0) ( 30.8)
Wave II 15 11 2 5 ( 45.5) (25.0) ( 18.2) (35.7)
Wave III 12 5 ( 40. 0) (15.6)
CRE* 22.5 10.9 22.7 14.3
* 20 employees.
PAGE 293
To summarize at this stage analysis of the occupational and
social-class destinations of respondents, to both the CRE and HELM
studies, has been complicated by the small numbers of black
graduates who took part in the two studies. Analysis of the data
strongly suggests that black graduates during their first year in
the labour market experienced more difficulties in finding suitable
employment than their matched counterparts. During their final year
at college black graduates made more job applications and received
fewer job offers than their UK European equivalents, and one year
after graduation black graduates were more likely to be unemployed.
Analysis of questions relating to job quality suggested that whilst
African/Caribbean graduates fared about as well in the labour market
as their matched UK European counterparts, Asian graduates fared
somewhat worse. Asian respondents to the HELM study were less likely
to employed as senior professionals, they were earning less, they
were less likely to be in their pieferred occupations, were more
likely to be feel over-qualified and tended to work for smaller
organizations. Some evidence of labour market segmentation was found
in that African/Caribbean graduates were more likely to be employed
within the public sector than their matched counterparts and Asian
graduates were more likely to be self-employed.
Relating our findings to the theoretical approaches to social class
and ethnicity, it is clear from our findings that black graduates
do not form a part of a black under class in so far as relatively
few are employed in low-status jobs. Nor is the evidence that the
graduate labour market is segmented by ethnicity conclusive. Asian,
African/Caribbean and UK European graduates were employed within a
wide range of occupations within the public sector, manufacturing
PAGE 294
and commerce. It is true that Asian respondents to the CRE study
were more likely to be self-employed, but further analysis of the
data revealed that many of these people were pharmacists. Another
interpretation of our data sees Asian, and to a lesser extent
African/Caribbean, graduates as employed within a wide range of
occupations, but within each occupation they tend to be employed in
lower-status positions (see Figure 9.2).
Following Parkin (1979) it has already been suggested that one of
the reasons for the relatively poor performance of Asian graduates
in the labour market may be a reflection of the operation of
exclusion strategies by employers and professional associations who
give preferential treatment to white applicants for jobs. The nature
of the HELM and CRE data sets do not allow us to comment directly
upon these matters. Nevertheless there is some evidence that
employers may be discriminating against black graduates in their
recruitment strategies. A recent leader in The Guardian newspaper
(25.Feb.l988) described how St. George's hospital in London made use
of a computer program in its recruitment process which mimicked
human behaviour in such a way as to discriminate against women and
black applicants. Moreover, research by Jowell and Prescott-Clarke
(1970), Mcintosh and Smith (1974) and Firth (1981) strongly suggests
that many employers discriminate against black applicants. Firth,
for example, undertook a study in which bogus letters of application
were sent to accountancy firms in response to specific job
advertisements. His replies suggested that considerable
discrimination existed against black applicants for, whilst 85% of
(white) British applicants were set an application form and/or
invited to interview, only 48% of West Indian and 44% of Indian and
PAGE 295
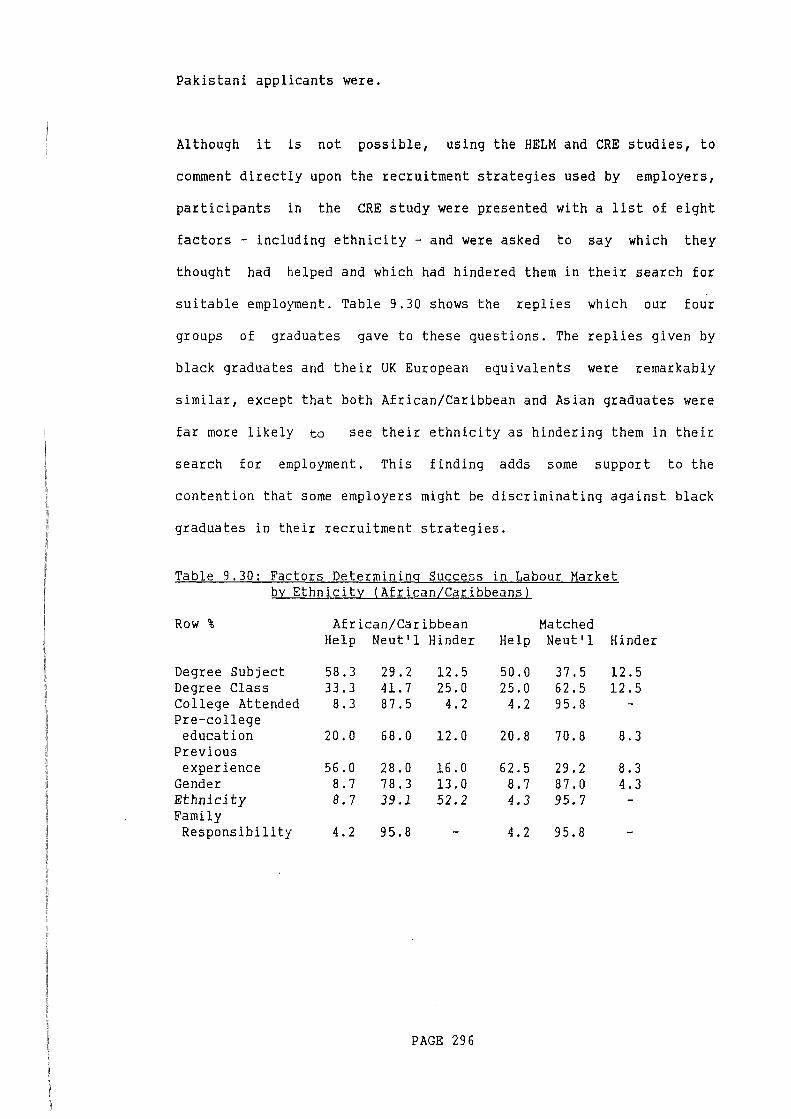
Pakistani applicants were.
Although it is not possible, using the HELM and CRE studies, to
comment directly upon the recruitment strategies used by employers,
participants in the CRE study were presented with a list of eight
factors - including ethnicity - and were asked to say which they
thought had helped and which had hindered them in their search for
suitable employment. Table 9.30 shows the replies which our four
groups of graduates gave to these questions. The replies given by
black graduates and their UK European equivalents were remarkably
similar, except that both African/Caribbean and Asian graduates were
far more likely to see their ethnicity as hindering them in their
search for employment. This finding adds some support to the
contention that some employers might be discriminating against black
graduates in their recruitment strategies.
Table 9.30: Factors Determining Success in Labour Market by Ethnicity (African/Caribbeans)
Row % African/Caribbean Matched Help Neut'l Hinder Help Neut'l Hinder
Degree Subject 58.3 29.2 12.5 50.0 37.5 12.5 Degree Class 33.3 41.7 25.0 25.0 62.5 12.5 College Attended 8.3 87.5 4. 2 4.2 95.8 Pre-college education 20.0 68.0 12.0 20.8 70.8 8.3
Previous experience 56.0 28.0 16.0 62.5 29.2 8.3
Gender 8.7 78.3 13.0 8.7 87.0 4.3 Ethnicity 8.7 39.1 52.2 4.3 95.7 Family Responsibility 4.2 95.8 - 4. 2 95.8
PAGE 296
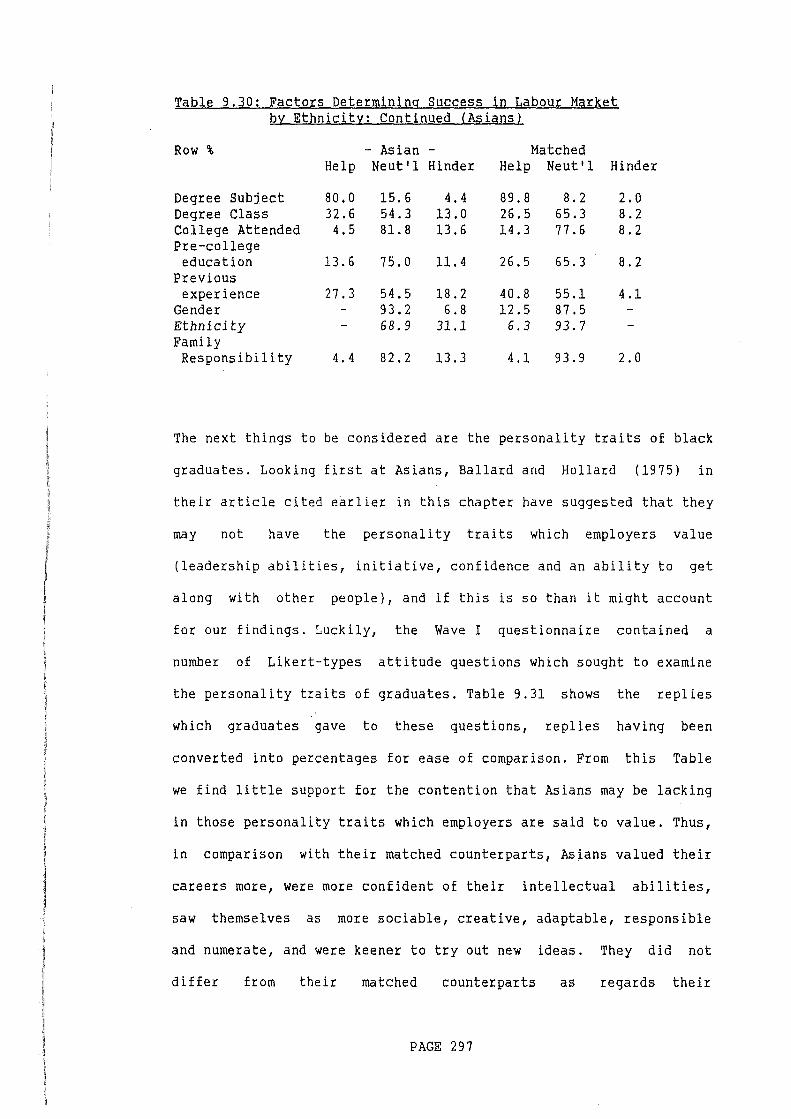
Table 9.30: Factors Determining Success in Labour Market by Ethnicity: Continued {Asians}
Row % - Asian - Matched Help Neut'l Hinder Help Neut'l Hinder
Degree Subject 80.0 15.6 4. 4 89.8 8.2 2.0 Degree Class 32.6 54.3 13.0 26.5 65.3 8.2 College Attended 4.5 81.8 13.6 14.3 77.6 8.2 Pre-college
education 13.6 75.0 11.4 26.5 65.3 8.2 Previous
experience 27.3 54.5 18.2 40.8 55.1 4.1 Gender - 93.2 6.8 12.5 87.5 Ethnicity - 68.9 31.1 6.3 93.7 Family Responsibility 4.4 82.2 13.3 4.1 93.9 2.0
The next things to be considered are the personality traits of black
graduates. Looking first at Asians, Ballard and Hollard (1975) in
their article cited earlier in this chapter have suggested that they
may not have the personality traits which employers value
(leadership abilities, initiative, confidence and an ability to get
along with other people), and if this is so than it might account
for our findings. Luckily, the Wave I questionnaire contained a
number of Likert-types attitude questions which sought to examine
the personality traits of graduates. Table 9.31 shows the replies
which graduates gave to these questions, replies having been
converted into percentages for ease of comparison. From this Table
we find little support for the contention that Asians may be lacking
in those personality traits which employers are said to value. Thus,
in comparison with their matched counterparts, Asians valued their
careers more, were more confident of their intellectual abilities,
saw themselves as more sociable, creative, adaptable, responsible
and numerate, and were keener to try out new ideas. They did not
d i Her from their matched counterparts as regards their
PAGE 297
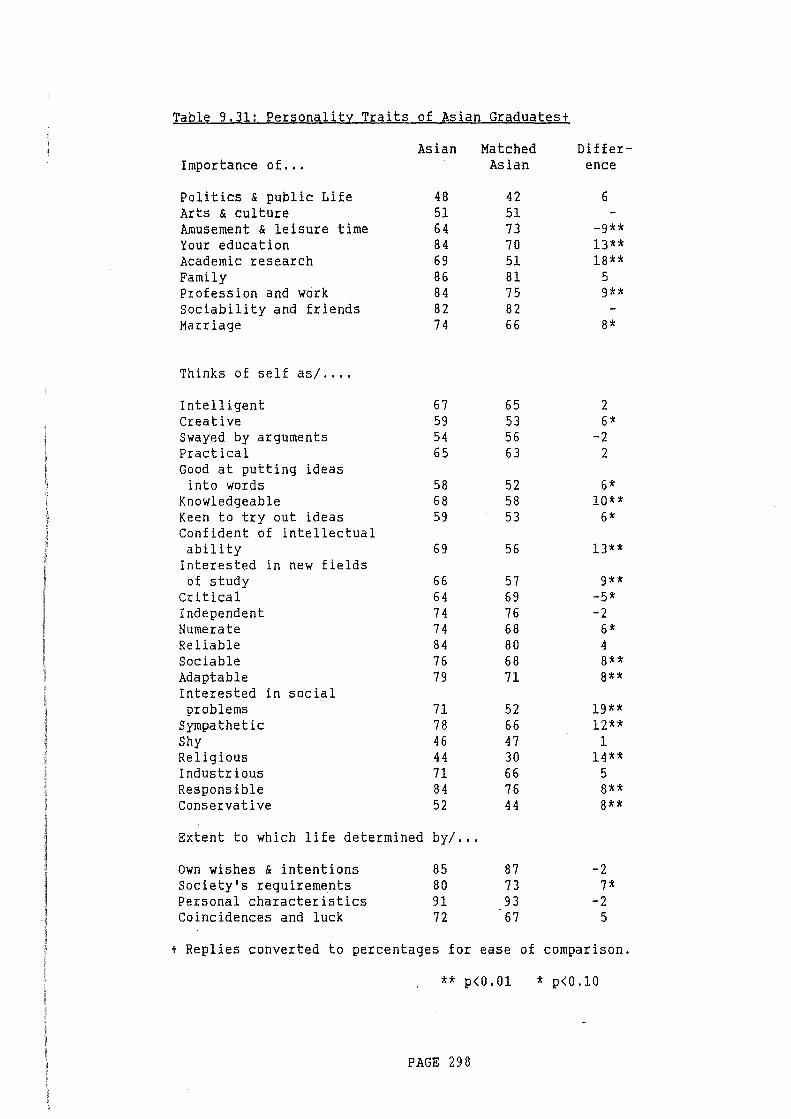
Table 9.31: Personality Traits of Asian Graduates+
Importance of ...
Politics & public Life Arts & culture Amusement & leisure time Your education Academic research Family Profession and work Sociability and friends Marriage
Thinks of self as/ ....
Intelligent Creative Swayed by arguments Practical Good at putting ideas
into words Knowledgeable Keen to try out ideas Confident of intellectual ability
Interested in new fields of study
Critical Independent Numerate Reliable Sociable Adaptable Interested in social problems
Sympathetic Shy Religious Industrious Responsible Conservative
Asian
48 51 64 84 69 86 84 82 74
67 59 54 65
58 68 59
69
66 64 74 74 84 76 79
71 78 46 44 71 84 52
Extent to which life determined by/ ...
Own wishes & intentions Society's requirements Personal characteristics Coincidences and luck
85 80 91 72
Matched Asian
42 51 73 70 51 81 75 82 66
65 53 56 63
52 58 53
56
57 69 76 68 80 68 71
52 66 47 30 66 76 44
87 73 93 67
Difference
6
-9** 13** 18**
5 9**
8*
2 6*
-2 2
6* 10**
6*
13**
9** -5* -2
6* 4 8** 8**
19** 12**
1 14**
5 8** 8**
-2 7*
-2 5
+ Replies converted to percentages for ease of comparison.
** p<0.01 * p<O.lO
PAGE 298
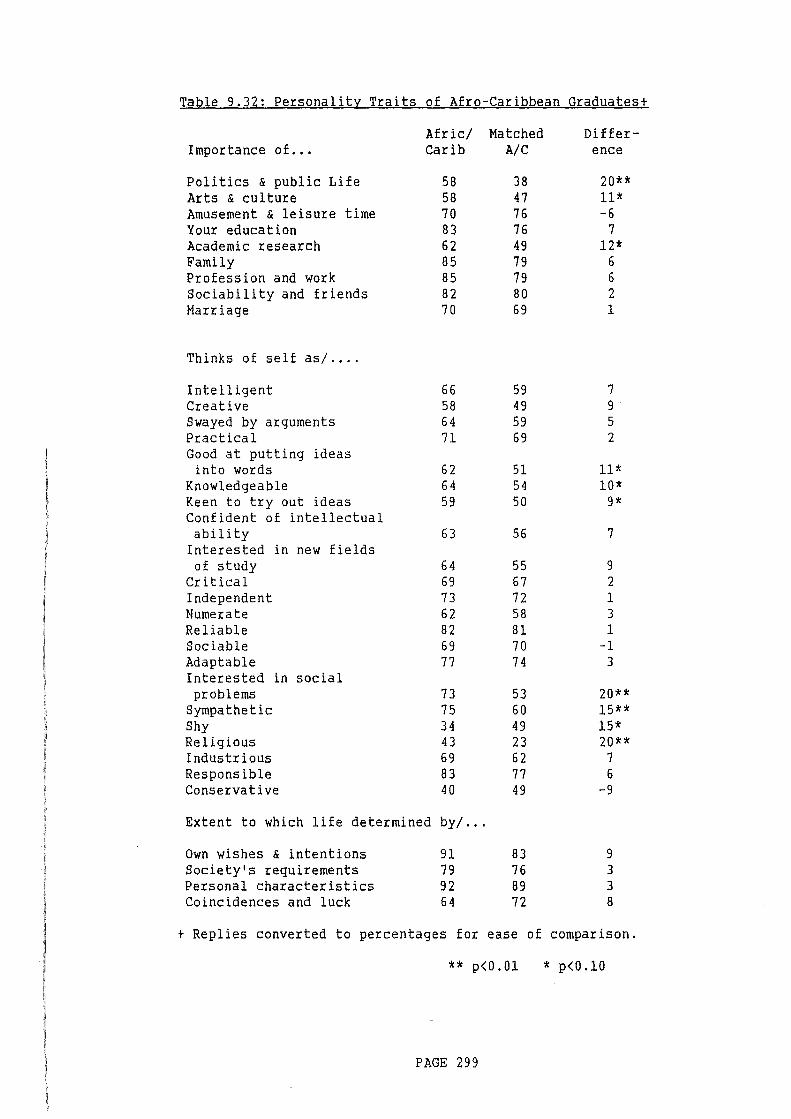
Table 9.32: Personality Traits of Afro-Caribbean Graduates+
Importance of ...
Politics & public Life Arts & culture Amusement & leisure time Your education Academic research Family Profession and work Sociability and friends Marriage
Thinks of self as/ ....
Intelligent Creative Swayed by arguments Practical Good at putting ideas
into words Knowledgeable Keen to try out ideas Confident of intellectual ability
Interested in new fields of study
Critical Independent Numerate Reliable Sociable Adaptable Interested in social problems
Sympathetic Shy Religious Industrious Responsible Conservative
Afric/ Matched Carib A/C
58 58 70 83 62 85 85 82 70
66 58 64 71
62 64 59
63
64 69 73 62 82 69 77
73 75 34 43 69 83 40
38 47 76 76 49 79 79 80 69
59 49 59 69
51 54 50
56
55 67 72 58 81 70 74
53 60 49 23 62 77 49
Extent to which life determined by/ ...
Own wishes & intentions Society's requirements Personal characteristics Coincidences and luck
91 79 92 64
83 76 89 72
Difference
20** 11* -6
7 12*
6 6 2 1
7 9 5 2
11* 10*
9*
7
9 2 1 3 1
-1 3
20** 15** 15* 20**
7 6
-9
9 3 3 8
+ Replies converted to percentages for ease of comparison.
** p<O.Ol * p<O.lO
PAGE 299
industriousness, shyness, independence and practical abilities.
Asians appear to value their education more, were keener on
research, more interested in social problems, and saw themselves as
more religious and sympathetic. It is difficult to see how such
traits could be a disadvantage to them in the labour market,
although they suggest that Asians may, relative to their UK European
counterparts, have a preference for careers in social work and/or
teaching. This impression is not, however, reflected in their actual
occupations.
Moving on to a consideration of the personality traits of
African/Caribbean graduates, Table 9.32 compares them with those of
their matched counterparts. From this we see that there are few
differences between our two groups of graduates. African/Caribbean
graduates saw themselves as more knowledgeable, less shy, more
religious and more sympathetic than their matched counterparts. They
were more concerned about social problems and expressed a greater
interest in politics and public life, and art and culture. Again,
because of the small numbers involved it is difficult to relate
these findings to the Wave III destinations of African/Caribbean
graduates, but, as with Asians, there is little reason to believe
that African/Caribbean graduates are unduly disadvantaged in the
labour market as a result of having the 'wrong' personality traits.
PAGE 300
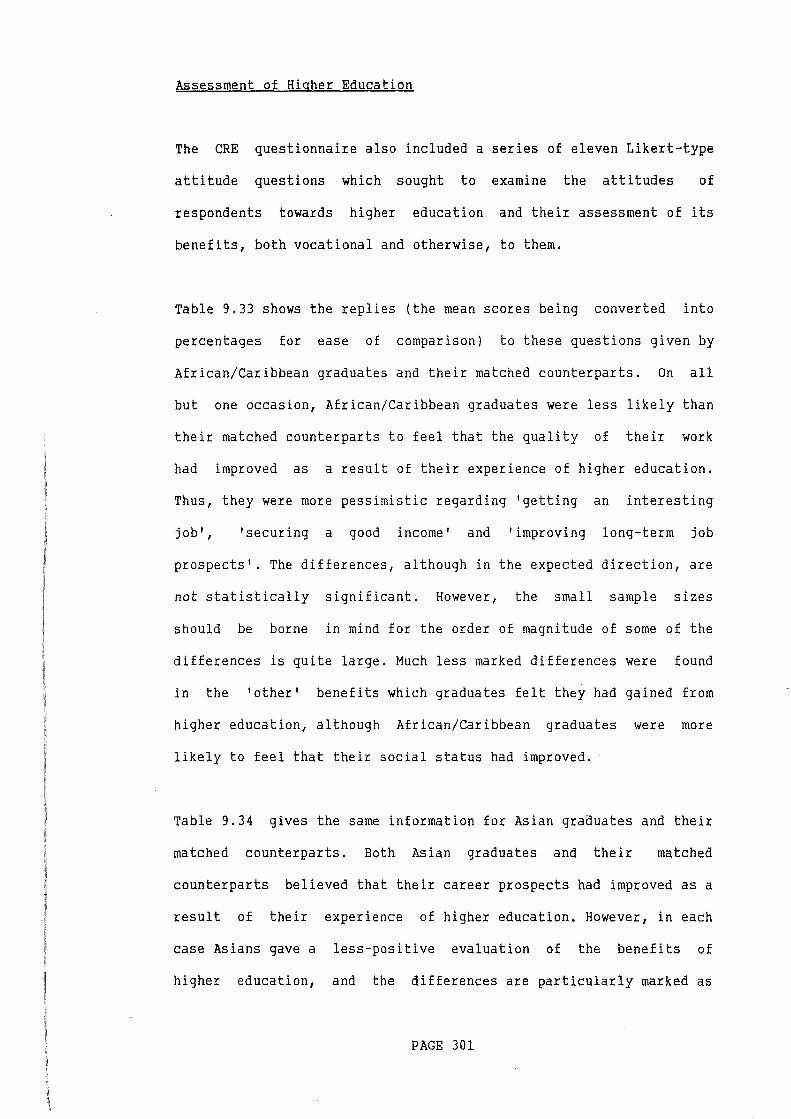
Assessment of Higher Education
The CRE questionnaire also included a series of eleven Likert-type
attitude questions which sought to examine the attitudes of
respondents towards higher education and their assessment of its
benefits, both vocational and otherwise, to them.
Table 9.33 shows the replies (the mean scores being converted into
percentages for ease of comparison) to these questions given by
African/Caribbean graduates and their matched counterparts. On all
but one occasion, African/Caribbean graduates were less likely than
their matched counterparts to feel that the quality of their work
had improved as a result of their experience of higher education.
Thus, they were more pessimistic regarding 'getting an interesting
job' I 'securing a good income' and 'improving long-term job
prospects'. The differences, although in the expected direction, are
not statistically significant. However, the small sample sizes
should be borne in mind for the order of magnitude of some of the
differences is quite large. Much less marked differences were found
in the 'other' benefits which graduates felt they had gained from
higher education, although African/Caribbean graduates were more
likely to feel that their social status had improved.
Table 9.34 gives the same information for Asian graduates and their
matched counterparts. Both Asian graduates and their matched
counterparts believed that their career prospects had improved as a
result of their experience of higher education. However, in each
case Asians gave a less-positive evaluation of the benefits of
higher education, and the differences are particularly marked as
PAGE 301
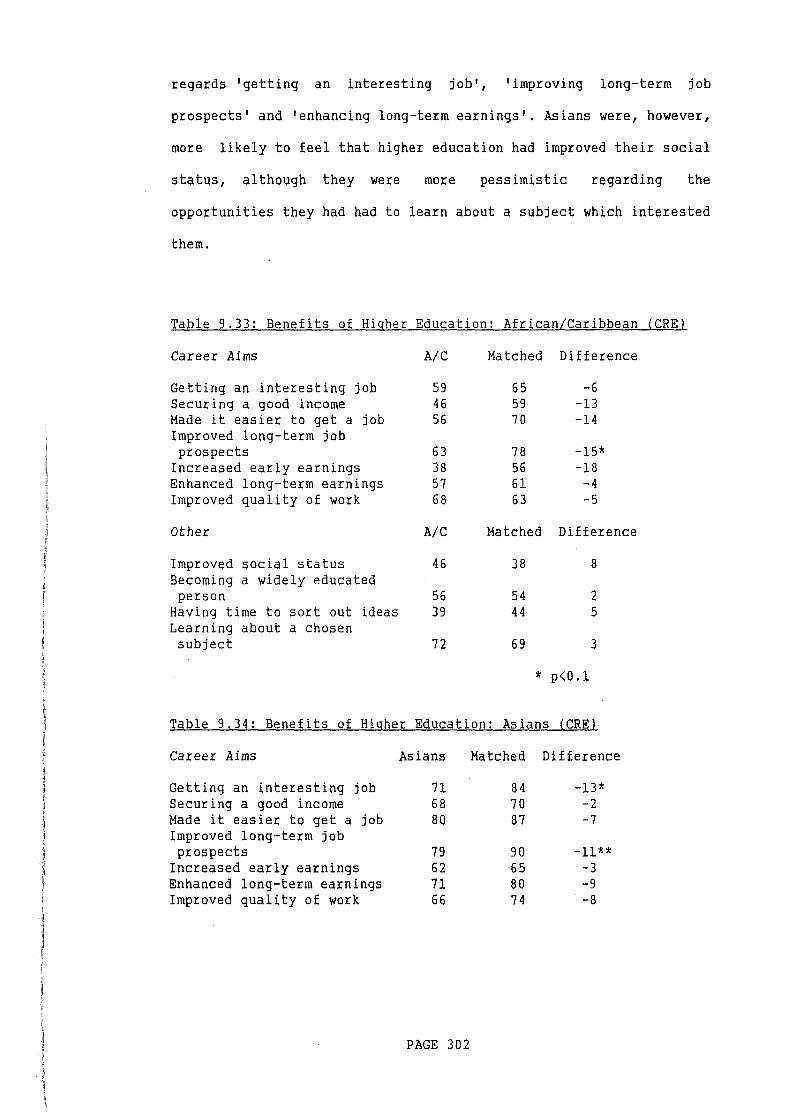
regards 'getting an interesting job', 'improving long-term job
prospects' and 'enhancing long-term earnings'. Asians were, however,
more likely to feel that higher education had improved their social
status, although they were more pessimistic regarding the
opportunities they had had to learn about a subject which interested
them.
Table 9.33: Benefits of Higher Education: African/Caribbean (CRE)
Career Aims
Getting an interesting job Securing a good income Made it easier to get a job Improved long-term job prospects
Increased early earnings Enhanced long-term earnings Improved quality of work
Other
Improved social status Becoming a widely educated person
Having time to sort out ideas Learning about a chosen subject
A/C
59 46 56
63 38 57 68
A/C
46
56 39
72
Matched Difference
65 -6 59 -13 70 -14
78 -15* 56 -18 61 -4 63 -5
Matched Difference
38 8
54 44
69
* p<0.1
2 5
3
Table 9.34: Benefits of Higher Education: Asians (CRE)
Career Aims Asians Matched Difference
Getting an interesting job 71 84 -13* Securing a good income 68 70 -2 Made it easier to get a job 80 87 -7 Improved long-term job prospects 79 90 -11**
Increased early earnings 62 65 -3 Enhanced long-term earnings 71 80 -9 Improved quality of work 66 74 -8
PAGE 302
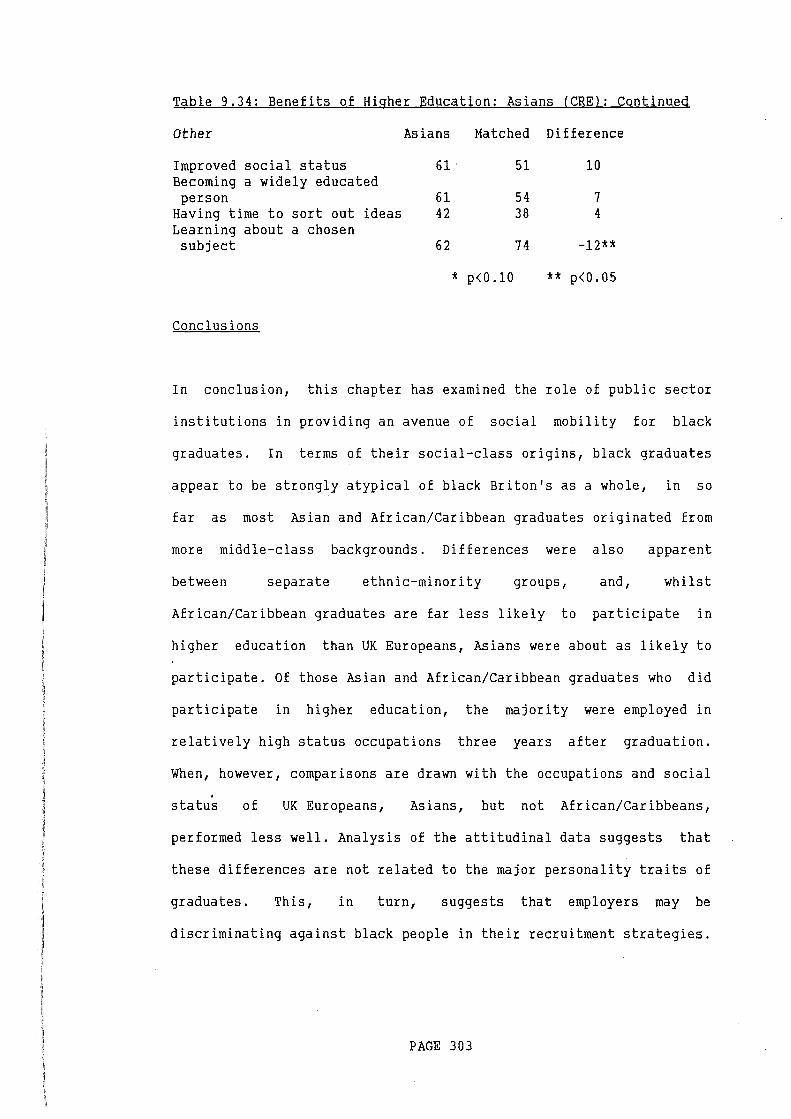
Table 9.34: Benefits of Higher Education: Asians (CRE): Continued
Other
Improved social status Becoming a widely educated
person Having time to sort out ideas Learning about a chosen subject
Conclusions
Asians Matched Difference
61 . 51 10
61 42
62
* p<0.10
54 38
74
7 4
-12**
** p<0.05
In conclusion, this chapter has examined the role of public sector
institutions in providing an avenue of social mobility for black
graduates. In terms of their social-class origins, black graduates
appear to be strongly atypical of black Briton's as a whole, in so
far as most Asian and African/Caribbean graduates originated from
more middle-class backgrounds. Differences were also apparent
between separate ethnic-minority groups, and, whilst
African/Caribbean graduates are far less likely to participate in
higher education than UK Europeans, Asians were about as likely to
participate. Of those Asian and African/Caribbean graduates who did
participate in higher education, the majority were employed in
relatively high status occupations three years after graduation.
When, however, comparisons are drawn with the occupations and social .
status of UK Europeans, Asians, but not African/Caribbeans,
performed less well. Analysis of the attitudinal data suggests that
these differences are not related to the major personality traits of
graduates. This, in turn, suggests that employers may be
discriminating against black people in their recruitment strategies.
PAGE 303
Appendix: Matched Samples
As was mentioned earlier in this chapter, the total number of Asian
and African/Caribbean graduates who participated in the HELM study
was quite small (see Table 9.3), and because of this comparisons
between Asian and African/Caribbean graduates on the one hand and
UK Europeans on the other were difficult to make due to distortions
which may have been introduced into the analysis as a result of
differences in both the courses of study and the sex of the
respondents. In an attempt to overcome this problem, use was made of
matched samples, this being the approach adopted by Brennan and
McGeever (1985: 19) in their report on the Wave I findings.
Attempts were made to match each of the Asian and African/Caribbean
graduates with a UK European of the same sex, course of study,
degree class and institution attended. Owing to differences in the
response rate between the three waves of the questionnaire, it was
not always possible to
African/Caribbean graduate
match
with
the
the
individual As~ian and
same European on each
questionnaire, and it was sometimes necessary to make new matches.
This has introduced an element of uncertainty into the analysis
which is unfortunately unavoidable.
On all three waves of the questionnaire exact matches were found by
sex and course of study. However, as Table 9.35 shows, in 31 out of
120 cases differences existed in the institution attended by Asian
graduates and in 11 cases there was a difference in degree class.
Amongst the 39 African/Caribbean cases an exact match was found on
27 occasions and on 12 occasions differences existed in the
PAGE 304
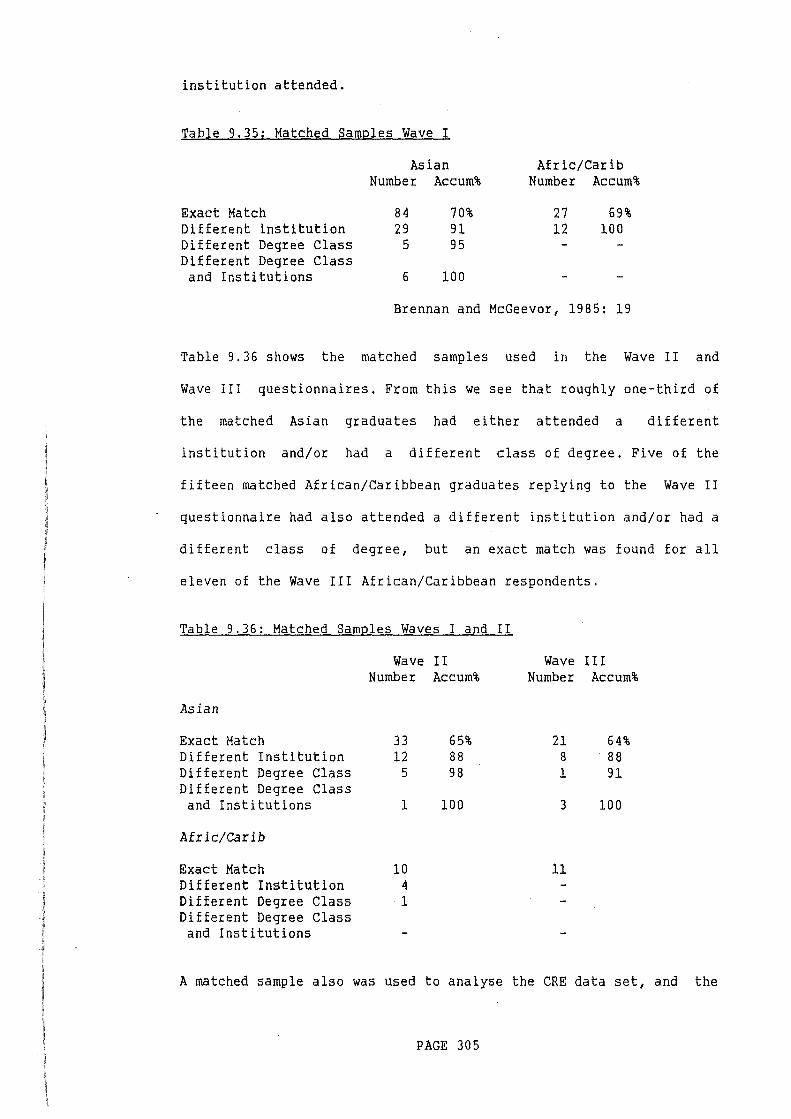
institution attended.
Table 9.35: Matched Samples Wave I
Exact Match Different institution Different Degree Class Different Degree Class and Institutions
Asian Number Accum%
84 70% 29 91
5 95
6 100
Afric/Carib Number Accum%
27 69% 12 100
Brennan and McGeever, 1985: 19
Table 9.36 shows the matched samples used in the Wave II and
Wave III questionnaires. From this we see that roughly one-third of
the matched Asian graduates had either attended a different
institution and/or had a different class of degree. Five of the
fifteen matched African/Caribbean graduates replying to the Wave II
questionnaire had also attended a different institution and/or had a
different class of degree, but an exact match was found for all
eleven of the Wave III African/Caribbean respondents.
Table 9.36: Matched Samples Waves I and II
Asian
Exact Match Different Institution Different Degree Class Different Degree Class
and Institutions
Afric/carib
Exact Match Different Institution Different Degree Class Different Degree Class and Institutions
Wave II Number Accum%
33 12
5
1
10 4 1
65% 88 98
100
Wave II I Number Accum%
21 8 1
3
11
64% 88 91
100
A matched sample also was used to analyse the CRE data set, and the
PAGE 305
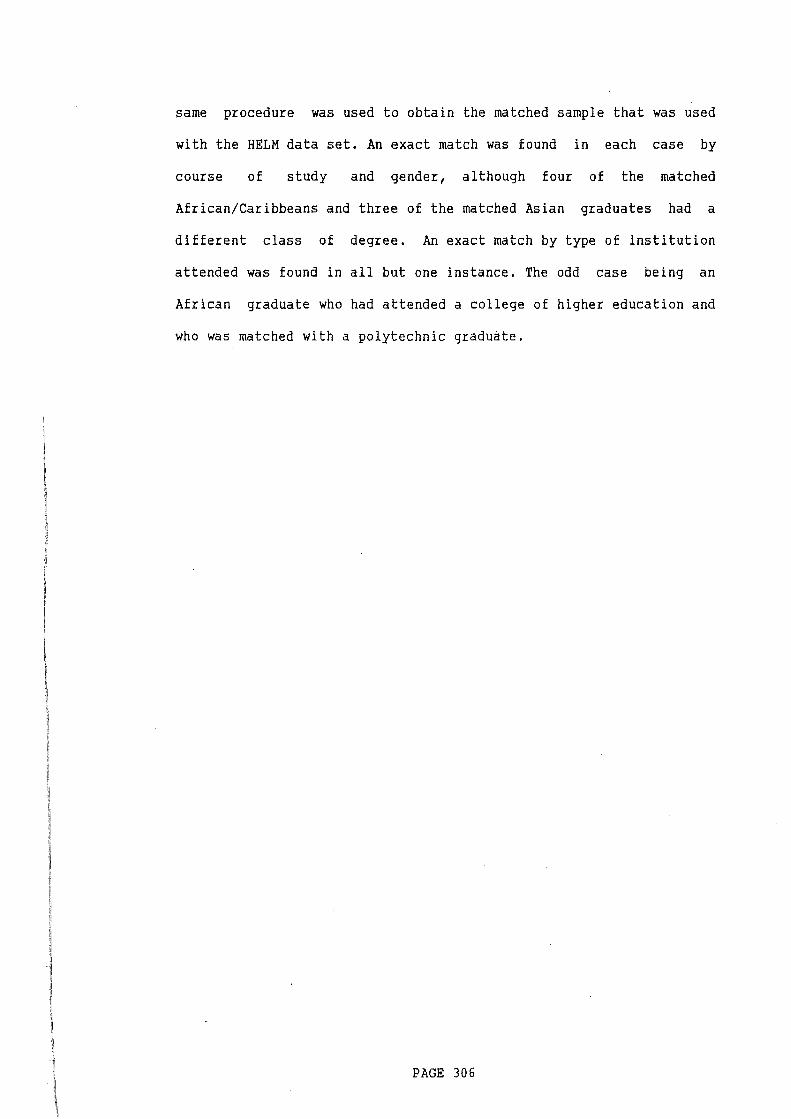
same procedure was used to obtain the matched sample that was used
with the HELM data set. An exact match was found in each case by
course of study and gender, although four of the matched
African/Caribbeans and three of the matched Asian graduates had a
different class of degree. An exact match by type of institution
attended was found in all but one instance. The odd case being an
African graduate who had attended a college of higher education and
who was matched with a polytechnic graduate.
PAGE 306
CHAPTER TEN: CONCLUSIONS
From our discussions in previous chapters it should be clear that
higher education has changed radically in the last thirty or so
years and is now playing an increasingly important role in the
allocation of high-status positions within British society. New
institutions, the polytechnics and colleges of higher education,
have been created. The number of degrees awarded by the universities
and (since 1965) by the CNAA has increased dramatically. Major
changes have occurred in the nature and composition of the student
body. The number of courses on offer to students has also increased
and they have become more relevant to business and professional
needs, many more than previously now offering exemption or
part-exemption from the qualifying examinations of professional
bodies. Finally, more students now undertake sandwich courses which
involve placements in commerce or industry.
These changes have had important consequences for the nature of
social mobility within our society. Prior to the early 1960s,
relatively few graduates were employed in industry and commerce, and
training for most professions (eg much of engineering, accountancy
and nursing) took place through a process of 'vertical mobility' in
which new recruits would start their employment in relatively
low-level positions (eg as articled clerks or apprentices) and
through a process of internal training supplemented by part-time
study would gradually rise in the company's hierarchy to more senior
positions. As a result of the growth in the number of places in
PAGE 307
higher education and in the types of course on offer, 'vertical
mobility' - at least in its traditional form - has now virtually
ceased in many professions and to a lesser extent in management, and
possession of a degree is now increasingly necessary for entry into
many professions and managerial posts.
Under these changing conditions this thesis, as its title suggests,
set out to examine how the social-class origins of graduates might
influence their participation in higher education, the courses which
they undertook and their entry into employment. Social class,
however, has been defined in a broad sense to refer not only to the
hierarchical division of society into distinct occupational groups
but to include also the dimensions of gender and race. In
particular, this study has been concerned with the experiences of
women, black graduates and those originating from working-class
backgrounds, and, as such, it has focused upon two main areas of
interest - access to higher education and the occupational and
social-class destinations of graduates. Finally, owing to the nature
of the HELM data set our study has looked at public sector
(polytechnic and college of higher education) graduates only, and we
have had little to say about university graduates.
At the time of their establishment in the 1960s, it was widely hoped
that the polytechnics would help to widen educational opportunities
for young people from working-class backgrounds, for at that time
research suggested that only a minority of students came from manual
origins. In Chapter Four it was demonstrated that, although a higher
proportion of students from manual origins attended public sector
institutions than the universities, they were nevertheless
PAGE 308
under-represented within them. Thus whilst, in 1979, only 19% of
university entrants were from working-class origins, the comparable
figure for public sector institutions was 26%. Conversely 22% of
university entrants but 19% of HELM respondents were from senior
professional backgrounds. Moreover, when comparisons were drawn
between the findings of the HELM study and those of related studies
undertaken in the early to mid 1970s, the general impression was
that the proportion of students attending the universities and
polytechnics had at best remained constant and had possibly declined
(see Edwards, 1982). When it is recalled that until the early 1960s
entry into many of the professions took place through a process of
vertical mobility, it is tempting to suggest that the expansion of
higher education, far from expanding vocational opportunities for
the working class may actually have helped to curtail them by
closing an alternative avenue of social mobility.
Further analysis of the HELM data revealed that graduates from
working-class origins tended to be older than others, although the
differences were not particularly marked. They also tended to be
atypical of their class of origin: many of their mothers were
reasonably well-educated and/or were employed within white-collar
occupations, and they tended to come from small families. They did
not differ from their more middle-class peers as regards their
reasons for entering higher education, and all graduates laid great
stress on the opportunity which higher education provided them with
both to further their careers and to learn about subjects which
interested them.
An examination of published statistics compiled by the DES and CNAA
PAGE 309
revealed that women are less likely to participate in higher
education than men, although recent years have seen an increase in
the proportions of women students from around 25% in the early 1960s
to over 40% today. Only minor differences exist in the proportions
of men and women attending universities and public sector
institutions. Women in the HELM sample are more likely then men to
have a working mother and a parent (father or mother) employed
within a managerial or professional capacity. Women also tended to
be younger then men.
Because only a minority (7.6%) of HELM respondents were black it was
difficult to make any firm conclusions about their characteristics.
Analysis of the HELM data suggested that, like UK Europeans, they
are more likely to be male than female and the majority come from
more middle-class backgrounds. Black graduates tended to be older
than their UK Europeans counterparts. The author also had access to
a related study commissioned by the CRE (Commission for Racial
Equality) and analysis of this confirmed many of the impressions
gained from the HELM data set as regards the sex, age and
social-class origins of black graduates. The CRE study also included
a sample of university graduates amongst whom there were far fewer
black Britons.
The second question which was examined concerns the relationship
which exists between the social-class origins and destinations of
graduates, that is, the extent to which their social-class origins
exert an influence (if any) on their future employment. A number
of studies which have investigated the process by which graduates
enter the labour market (Kelsall et al., 1972; Pearson, 1976;
PAGE 310
Parkin, 1979; Roizen and Jepson, 1985; Kogan & Boys, 1984; Beechey,
1986), suggest that for a variety of reasons graduate women and
those from working-class and ethnic-minority backgrounds are likely
to be disadvantaged. Kelsall et al. (1972) have suggested that both
women and those from manual origins are likely to have lower
aspirations than others, and in consequence are likely to attain
lower-status jobs. Other studies have focused upon those factors
which employers take into account in reaching their employment
decisions. Parkin (1979), in respect of black people and women, and
Beechey (1986), in respect of women, have suggested that employers
and professional associations may operate exclusionary strategies in
order to maintain high levels of remuneration for predominantly
(white) male employees. Pearson (1976), Parkin (1979), Roizen and
Jepson (1985) and Kogan and Boys (1984) argue that employers take a
number of factors into account in making their decisions over whom
to employ. These factors include subject of study, class of degree,
type of institution attended, school attended, and various
non-academic factors such as leadership potential, general
confidence, appearance and communications skills. The use which
employers make of these is determined primarily by the degree of
skill needed to undertake a particular job. Where the 'skills needed
are highly specific and there is a shortage of suitable applicants
the graduates' degree subject is likely to be of prime importance.
Where the skills needed are more general (for example in most
managerial positions) the actual course studied is likely to be of
less importance than the class of degree obtained, the institution
attended and personality traits. Should the factors which employers
take into account be unequally distributed between groups to the
disadvantage of women and those from manual and ethnic-minority
PAGE 311
backgrounds then one might expect them to fare less well in the
labour market.
In Chapter Five, the empirical evidence relating to the employment
of graduates originating from different social-class backgrounds was
examined. Amongst men, but not women, some but weak support was
found for the contention that graduates from manual origins will
tend to acquire lower-status jobs than those from more middle-class
backgrounds. Men from manual origins were more likely than others to
be employed as semiprofessionals (in teaching) and as high-grade
technicians (computer programmers and laboratory technicians) and
were amongst the least likely to be senior professionals. However,
the relationship between origins and destinations was complex, no
statistical difference was found in the yearly salaries of graduates
broken down according to their social-class backgrounds and the sons
of low-grade technicians appear, in some ways, to have performed
best of all. Graduate men from routine non-manual backgrounds were
the lowest earners and were the most likely to be in low-status
employment. In Chapter Six attempts were made, by the use a matched
sample, to control for the influence of course of study, gender,
class of degree and institution attended on the destinations of
graduates from manual backgrounds on the one hand, and professional
and managerial backgrounds on the other. When the results on the
full matched sample were examined, the relationship previously found
between the origins and destinations of graduate men originating
from the different social classes disappeared, and graduate men from
manual backgrounds appear to have performed just as well as their
matched counterparts. Minor, but statistically non-significant,
differences were found in the destinations of graduates with general
PAGE 312
{but not vocational) degrees, and graduates from manual backgrounds
were more likely than their matched counterparts to be employed in
the semiprofessions (mainly teaching) and less likely to be in
managerial positions. They were also earning less. An even less
marked relationship was found to exist for graduate women, although,
in contradiction to the results for men, women from manual origins
with generalist degrees were less likely to be employed in the
semiprofessions and more likely to be employed in the managerial
trajectory. Women
rate the 'quality'
counterparts. The
differences in the
from manual origins did, however, consistently
of their work below that of their matched
matched-sample analysis supported the view that
destinations of graduate men from different
social-class backgrounds are related primarily to differences in
their courses of study.
In Chapter Seven an attempt was made to analyse our findings using
the models of sponsored and contest mobility developed by Turner
(1960). The difference between these two opposing models of social
mobility is that whilst under a contest system pupils and students
are in competition against one another within the educational system
to gain the qualifications necessary for entry into many high-status
positions, under a sponsorship system 'elite' recruits are chosen
and segregated from others at an early age and given a specific
education deemed suitable for elite station. When Turner wrote his
paper a tripartite (bipartite) system of education was in operation
in most of Britain and grammar schools were the main educational
vehicles for facilitating entry into the universities and the elite.
Although the movement towards comprehensive schooling and the
establishment of public sector institutions which occurred in the
PAGE 313
1960s can be viewed, at least in part, as an attempt to introduce a
contest element into Britain's educational system, it was argued
that Britain's educational system remains essentially a sponsorship
one in which the curriculum taught to children varies according to
the type of school attended and the perceived level of intelligence
of the individual child. Those earmarked for 'elite' station tend to
be taught an academic curriculum whilst others are taught a more
utilitarian one. When the subjects undertaken by graduates whilst at
school were analysed, quite marked and highly significant
differences were found to exist in the types of school curriculum
undertaken by HELM graduates originating from different social-class
backgrounds. Those from manual backgrounds were found to be more
likely to have attended non-selective schools and to have undertaken
a utilitarian or technical curriculum, whilst those from more
middle-class backgrounds were more likely to have attended selective
schools and to have undertaken an academic curriculum. Further
analysis of the data found that those with a utilitarian curriculum
were more likely to be employed within the semiprofessions and
lower-class occupations, and that those with a technical curriculum
were the most likely to be employed in engineering. Men with
academic curriculums were the most likely to be employed in
management and enjoyed the highest salaries. The most obvious way in
which the school curriculum might influence the destinations of
graduates is by influencing their course of study in higher
education, and for both men and women a direct relationship was
found between the school curriculum and the vocational specificity
of their course of study. Thus graduates with technical
qualifications were the most likely to have undertaken specialist
courses (such a engineering) and those with utilitarian curriculums
PAGE 314
were the most likely to have undertaken
(Humanities, Fine Art, Social Science, etc).
generalist courses
It should, however, be stressed that, although the sponsorship
system appears to disadvantage those from working-class backgrounds
who were the most likely to have undertaken a utilitarian
curriculum, graduates from working-class origins with technical and
academic curriculums had a broader range of courses from which to
make their choices. Conversely, graduates from more middle-class
backgrounds with utilitarian curriculums found their choice of which
course to study constrained.
Graduate women appear to have fared ~ess well in the labour market
than their male counterparts. They were far more likely to be
employed in the semiprofessions (nursing and teaching) and far less
likely to employed in engineering and related occupations. Although
roughly equal proportions of men and women were senior professionals
differences were found in the type of work which they did. For
example, whilst women were more likely to be librarians men tended
to be employed in commercial posts such as accountancy. Overall,
three years after graduation, women were earning, on average, over
£1,400 a year less than men and they rated their promotion prospects
worse. By and large, however, women appeared to be satisfied with
their occupations and equal proportions of men and women were in
their preferred jobs three years after graduation. This suggests
that women might have lower aspirations than men, and little
evidence was found to support the contention that employers may have
a preference for employing men rather than women in high-status
occupations, although women in the same social-class position as men
PAGE 315
tended to earn less.
Although Turner (1960) did not discuss gender differences in the
curriculums taught to boys and girls at school, attempts were also
made to analyse gender differences in the employment of graduates
using his model of sponsored mobility. It was argued that women are
socialized to occupy a subordinate social-class position to men
within the family and that this socialization was affected by both
the home and school. It was suggested that the school curriculum
taught to girls will tend to reflect the needs of the men they are
are seen likely to marry, and that, as such, it is likely to vary
according to the expected social-class destinations of their future
husbands. In particular, those seen to be likely to marry into the
elite tend to be taught an academic curriculum with a stress on the
arts, humanities and social sciences which will equip them with
skills which will compliment the more vocationally-orientated ones
taught to their husbands. In this view the vocational content of the
female curriculum can be thought of as a by-product of its primary
function of socializing women into a domestic role within the
family. Considerable support for this view was found to exist in the
HELM data, and major differences were found to exist in the courses
of study undertaken by men and women with the latter tending to have
undertaken the more generalist courses and specialist courses in
Nursing, Librarianship, Psychology and Hotel Administration. In
turn, these course differences appeared to be related to quite
marked differences in the curriculums undertaken by graduates when
they were at school.
PAGE 316
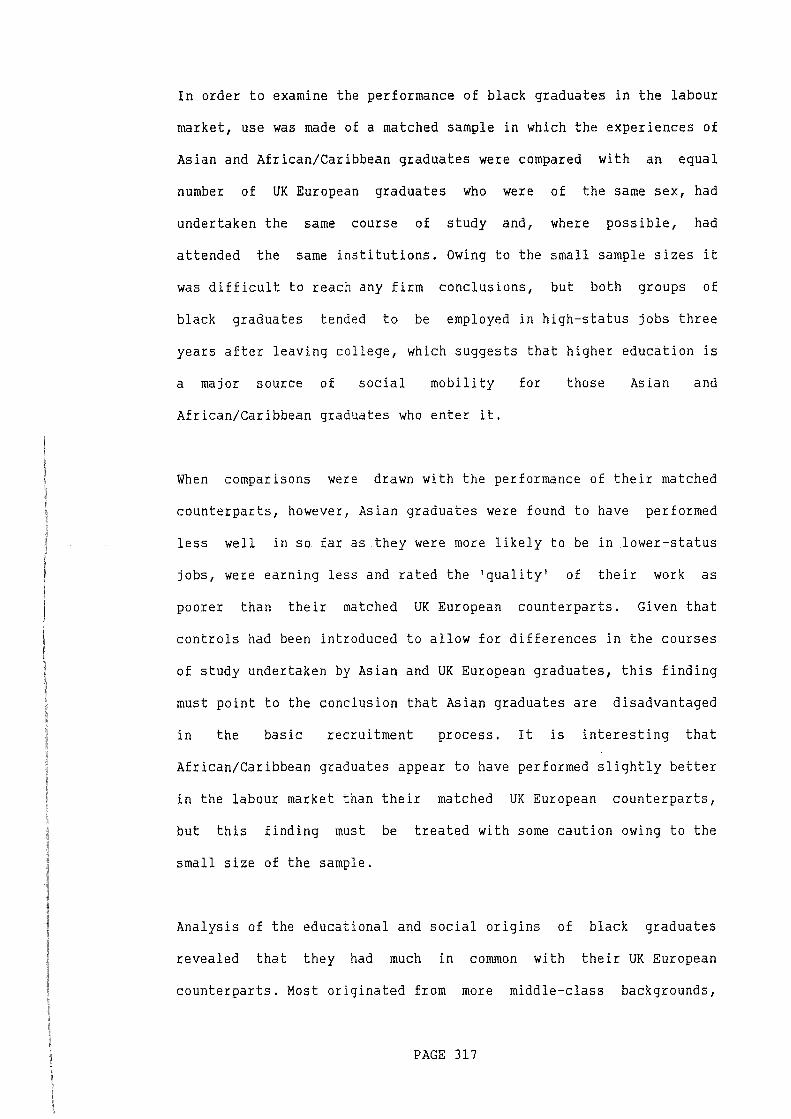
In order to examine the performance of black graduates in the labour
market, use was made of a matched sample in which the experiences of
Asian and African/Caribbean graduates were compared with an equal
number of UK European graduates who were of the same sex, had
undertaken the same course of study and, where possible, had
attended the same institutions. Owing to the small sample sizes it
was difficult to reach any firm conclusions, but both groups of
black graduates tended to be employed in high-status jobs three
years after leaving college, which suggests that higher education is
a major source of social mobility for those Asian and
African/Caribbean graduates who enter it.
When comparisons were drawn with the performance of their matched
counterparts, however, Asian graduates were found to have performed
less well in so far as they were more likely to be in lower-status
jobs, were earning less and rated the 'quality' of their work as
poorer than their matched UK European counterparts. Given that
controls had been introduced to allow for differences in the courses
of study undertaken by Asian and UK European graduates, this finding
must point to the conclusion that Asian graduates are disadvantaged
in the basic recruitment process. It is interesting that
African/Caribbean graduates appear to have performed slightly better
in the labour market than their matched UK European counterparts,
but this finding must be treated with some caution owing to the
small size of the sample.
Analysis of the educational and social origins of black graduates
revealed that they had much in common with their UK European
counterparts. Most originated from more middle-class backgrounds,
PAGE 317

many had attended a selective school and had undertaken an academic
curriculum. This suggests that they too had been sponsored through
secondary and higher education. Asian graduates were, however,
amongst the most likely to have undertaken a utilitarian curriculum.
To conclude, it has been argued that the influence which social
class exerts on the employment destinations of graduates manifests
itself primarily through the sponsorship system which exists in
Britain. Under this system children and young people are earmarked
for their eventual station in life at an early age and are sponsored
through secondary education. The type of curriculum which children
are taught at school can be differentiated according to their gender
and eventual occupation. Boys seen to be suitable only for
employment in manual occupations are -taught a distinctly utilitarian
curriculum with a stress on the more practical subjects, whilst
those seen to be suitable for elite status are taught a more
academic curriculum. Girls tend to be taught a curriculum more
suited to the needs of their future husbands then themselves, and,
whilst those seen to be likely to marry into the working-class are
taught a utilitarian curriculum aimed at equipping them with
domestic skills, those seen to be likely to marry into the elite are
taught a more academic curriculum which equips them with skills
which enable them to support their husbands in their careers.
Sponsorship under this system can take several forms - the very rich
are able to 'buy' their children a good education by sending them to
private schools, whilst the educated middle classes are in a strong
position to benefit their children by passing on cultural capital
and by manipulating the state education system to their children's
advantage. Finally, some children from working-class origins are
PAGE 318
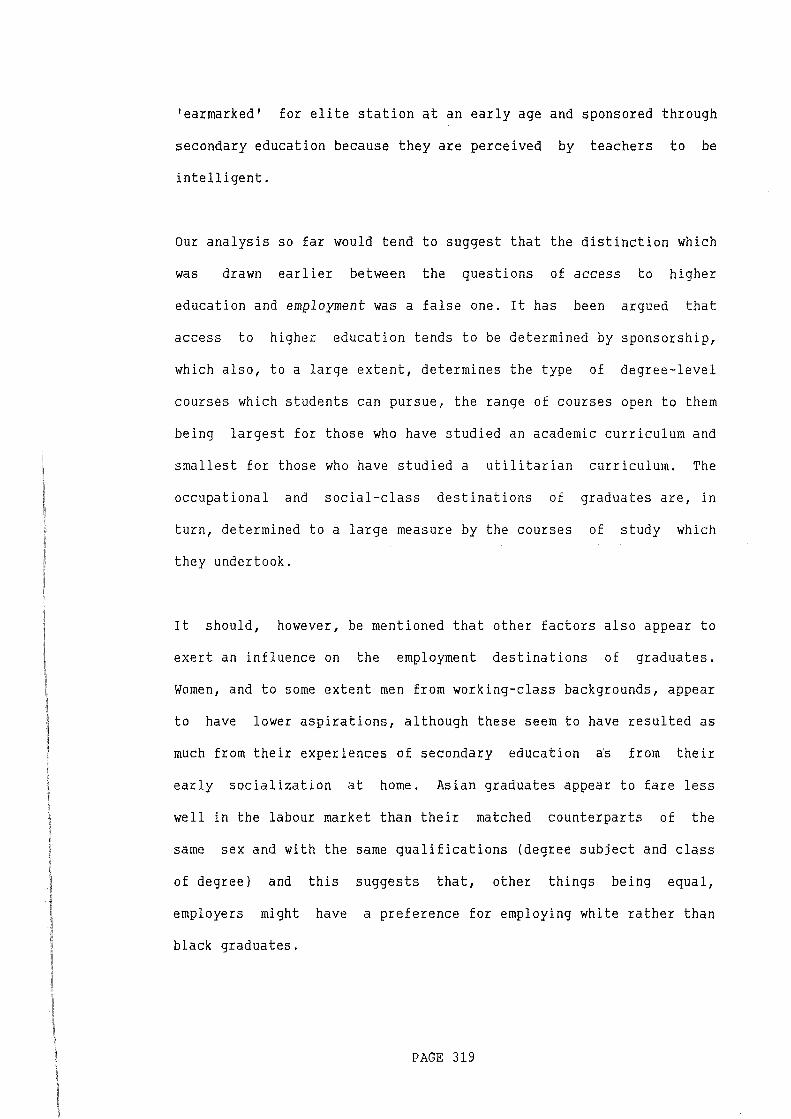
'earmarked' for elite station at an early age and sponsored through
secondary education because they are perceived by teachers to be
intelligent.
Our analysis so far would tend to suggest that the distinction which
was drawn earlier between the questions of access to higher
education and employment was a false one. It has been argued that
access to higher education tends to be determined by sponsorship,
which also, to a large extent, determines the type of degree-level
courses which students can pursue, the range of courses open to them
being largest for those who have studied an academic curriculum and
smallest for those who have studied a utilitarian curriculum. The
occupational and social-class destinations of graduates are, in
turn, determined to a large measure by the courses of study which
they undertook.
It should, however, be mentioned that other factors also appear to
exert an influence on the employment destinations of graduates.
Women, and to some extent men from working-class backgrounds, appear
to have lower aspirations, although these seem to have resulted as
much from their experiences of secondary education ~s from their
early socialization at home. Asian graduates appear to fare less
well in the labour market than their matched counterparts of the
same sex and with the same qualifications (degree subject and class
of degree) and this suggests that, other things being equal,
employers might have a preference for employing white rather than
black graduates.
PAGE 319

APPENDIX A: THE RESEARCH PROCESS
In this appendix four matters are discussed. Part One looks at the
nature of the research process. Part Two examines the HELM data set.
In Part Three various coding and technical problems which the author
encountered are discussed. Finally, in Part Four the statistical
tests which the author employed whilst analysing the data are
examined.
Part One: The Research Process
It is possible to identify a series of stages through which any
research programme processes (see Moser, 1958: 39-44; Drake, 1974:
24). These stages are:-
1) Problem definition stage. In this stage the initial problem to be investigated is defined.
2) Hypothesis formation stage. In which the aims of the project are defined and the hypotheses to be tested are formulated.
3) Review stage. At this point previous literature and other substantive work in the field of interest is examined in relationship to the major aims and hypotheses of the study.
4) Formulation of research strategy stage. In this stage a research strategy is devised to examine the aims and to test the major hypotheses of the study.
5) Data gathering and collection stage.
6) Data analysis stage.
7) Writing-up stage.
However, it should be stressed that although these stages are common
to most research programmes they rarely take place in a simple
sequential order. Rather the stages interact with one another and
they cannot be readily separated. This point can be best illustrated
PAGE A.320
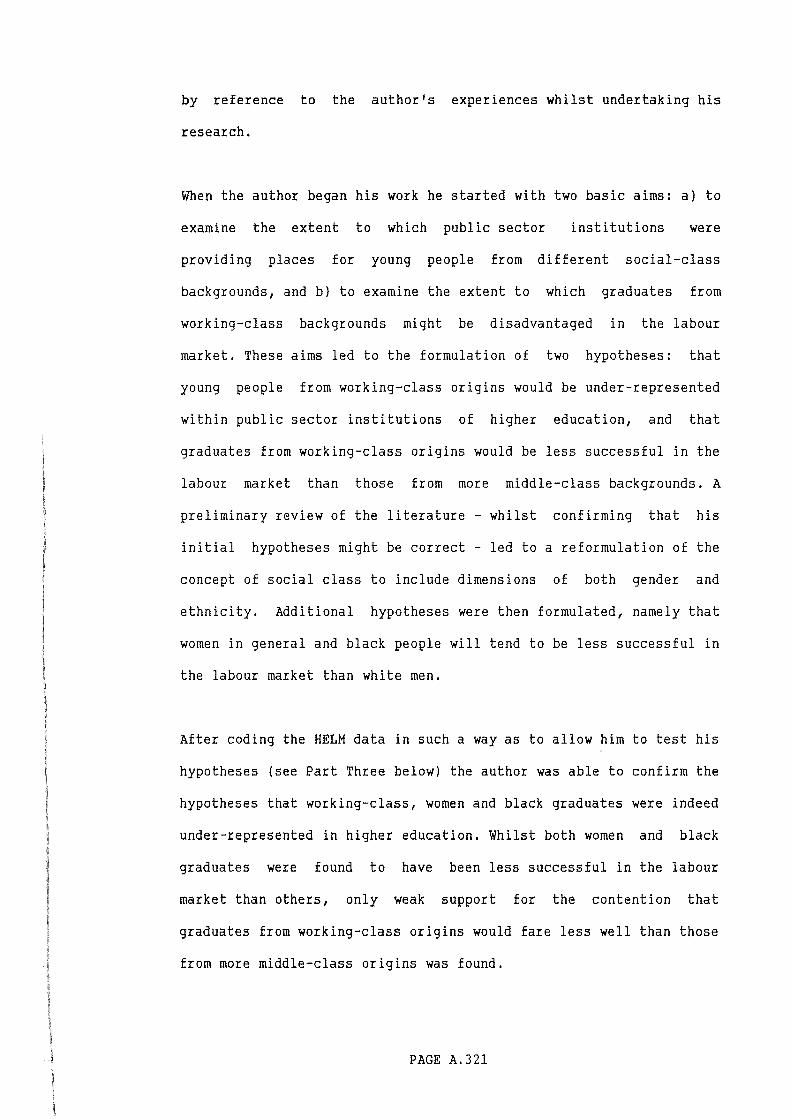
by reference to the author's experiences whilst undertaking his
research.
When the author began his work he started with two basic aims: a) to
examine the extent to which public sector institutions were
providing places for young people from different social-class
backgrounds, and b) to examine the extent to which graduates from
working-class backgrounds might be disadvantaged in the labour
market. These aims led to the formulation of two hypotheses: that
young people from working-class origins would be under-represented
within public sector institutions of higher education, and that
graduates from working-class origins would be less successful in the
labour market than those from more middle-class backgrounds. A
preliminary review of the literature - whilst confirming that his
initial hypotheses might be correct - led to a reformulation of the
concept of social class to include dimensions of both gender and
ethnicity. Additional hypotheses were then formulated, namely that
women in general and black people will tend to be less successful in
the labour market than white men.
After coding the HELM data in such a way as to allow him to test his
hypotheses (see Part Three below) the author was able to confirm the
hypotheses that working-class, women and black graduates were indeed
under-represented in higher education. Whilst both women and black
graduates were found to have been less successful in the labour
market than others, only weak support for the contention that
graduates from working-class origins would fare less well than those
from more middle-class origins was found.
PAGE A. 321
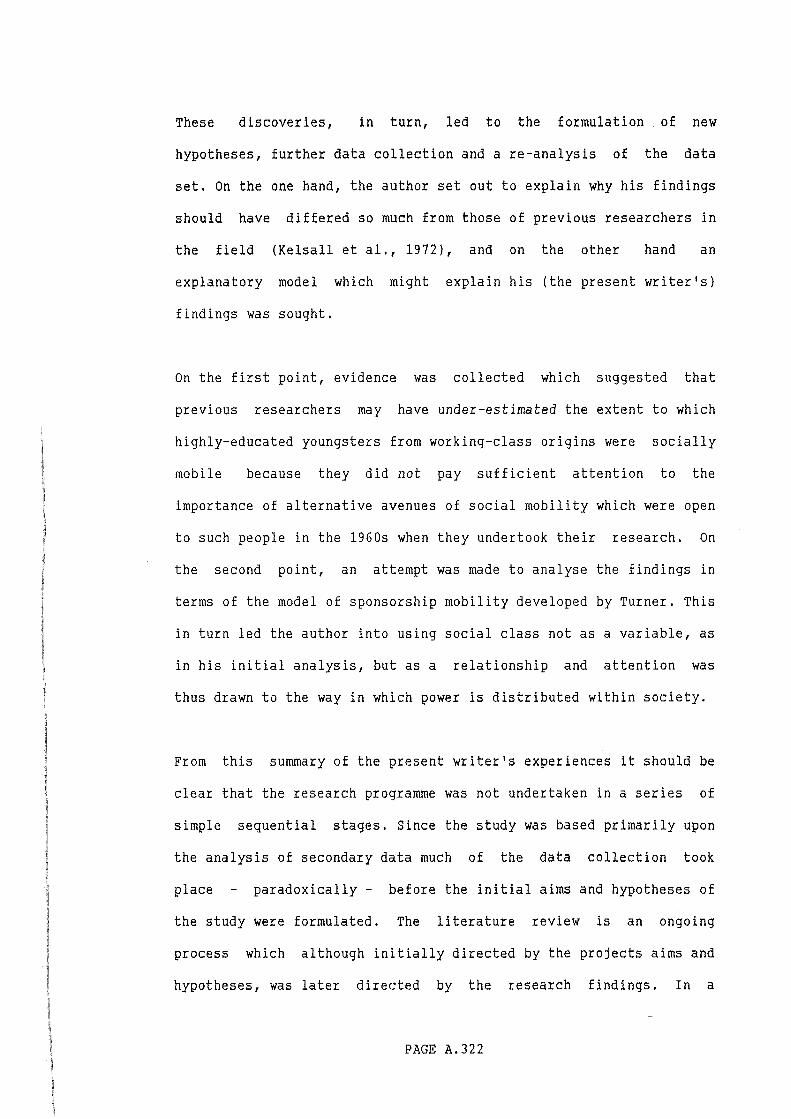
These discoveries, in turn, led to the formulation of new
hypotheses, further data collection and a re-analysis of the data
set. On the one hand, the author set out to explain why his findings
should have differed so much from those of previous researchers in
the field (Kelsall et al., 1972), and on the other hand an
explanatory model which might explain his (the present writer's)
findings was sought.
On the first point, evidence was collected which suggested that
previous researchers may have under-estimated the extent to which
highly-educated youngsters from working-class origins were
mobile because they did not pay sufficient attention
socially
to the
importance of alternative avenues of social mobility which were open
to such people in the 1960s when they undertook their research. On
the second point, an attempt was made to analyse the findings in
terms of the model of sponsorship mobility developed by Turner. This
in turn led the author into using social class not as a variable, as
in his initial analysis, but as a relationship and attention was
thus drawn to the way in which power is distributed within society.
From this summary of the present writer's experiences it should be
clear that the research programme was not undertaken in a series of
simple sequential stages. Since the study was based primarily upon
the analysis of secondary data much of the data collection took
place - paradoxically - before the initial aims and hypotheses of
the study were formulated. The literature review is an ongoing
process which although initially directed by the projects aims and
hypotheses, was later directed by the research findings. In a
PAGE A.322
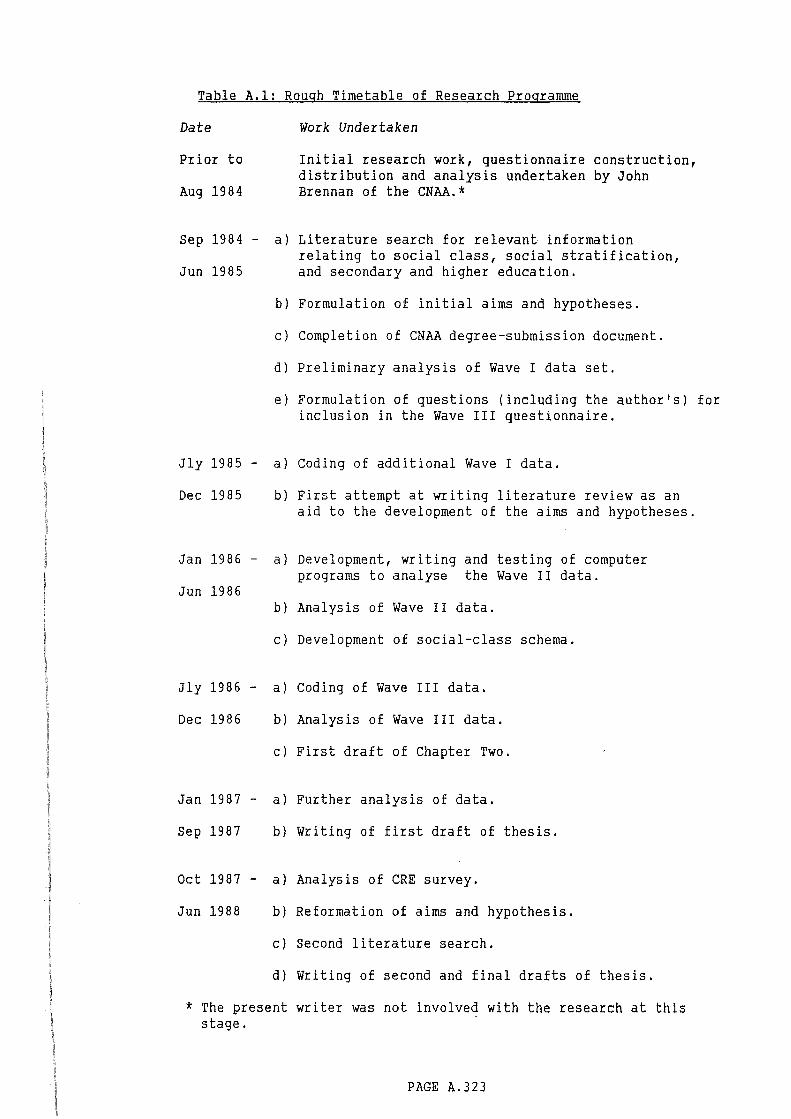
Table A.l: Rough Timetable of Research Programme
Date Work Undertaken
Prior to Initial research work, questionnaire construction, distribution and analysis undertaken by John
Aug 1984 Brennan of the CNAA.*
Sep 1984 - a) Literature search for relevant information relating to social class, social stratification,
Jun 1985 and secondary and higher education.
b) Formulation of initial aims and hypotheses.
c) Completion of CNAA degree-submission document.
d) Preliminary analysis of Wave I data set.
e) Formulation of questions (including the author's) for inclusion in the Wave III questionnaire.
Jly 1985 - a) Coding of additional Wave I data.
Dec 1985 b) First attempt at writing literature review as an aid to the development of the aims and hypotheses.
Jan 1986 - a) Development, writing and testing of computer programs to analyse the Wave II data.
Jun 1986 b) Analysis of Wave II data.
c) Development of social-class schema.
Jly 1986 - a) Coding of Wave III data.
Dec 1986 b) Analysis of Wave III data.
c) First draft of Chapter Two.
Jan 1987 - a) Further analysis of data.
Sep 1987 b) Writing of first draft of thesis.
Oct 1987 - a) Analysis of CRE survey.
Jun 1988 b) Reformation of aims and hypothesis.
c) Second literature search.
d) Writing of second and final drafts of thesis.
* The present writer was not involved with the research at this stage.
PAGE A. 323
similar fashion rather than the hypotheses directing the research
programme, the ongoing literature search and research findings led
to a constant redefinition of the project's aims and hypotheses.
Finally, like the literature search, the writing-up stage is also an
ongoing process, which helped the present writer to clarify his
ideas and direct his analysis of the data.
Because of the way in which the research programme was undertaken it
has not been possible to produce a simple straightforward timetable
of the research programme broken down into simple sequential stages,
and Table A.l should be taken as being only a rough approximation as
to the order in which research was undertaken.
Part Two: The HELM Questionnaires
In Chapter Two it was mentioned that the HELM study was undertaken
by means of three postal questionnaires which were sent to graduates
one year, two _years and three years after graduation. The three
questionnaires were highly structured in so far as they consisted
mainly of a series of pre-coded questions. The main advantages of
such questionnaires are well stated in the literature and relate
primarily to the ability to collect data which is easily comparable
between groups and individuals at relatively low cost (Nachmias and
Nachmias, 1976: 100).
As in most such studies, the author made only limited use of the
full data set and data from the Wave II questionnaire was only
briefly used in Chapter Nine. The reasons for not making more use of
PAGE A.324
the Wave II data were: a) much of the information relating to the
social-class origins and destinations of graduates had not been
coded; b) all the questions relevant to the social-class origins and
education of graduates were included in the Wave I questionnaire;
and c) it was felt that comparison of the Wave I and Wave III
questionnaire data was sufficient to indicate how graduate careers
were developing.
The main data used from the Wave I questionnaire related primarily
to the origins, attitudes and personality traits of graduates, and
included:-
Section One: Those course of study, obtained.
questions relating to the graduates institution attended and class of degree
Section Two: Questions relating to the employment status of graduates one year after graduation, their employment, annual salaries and social-class destinations.
Section Five: Questions relating to the functions of higher education.
Section Six: Questions relating to the major personality traits of graduates.
Section Seven: Questions relating to the sex, age, marital status, secondary education, social-class and ethnic origins of graduates.
The principal data used from the Wave III questionnaire related to
the destinations of graduates three years after graduation and their
attitudes towards work, viz:-
Section One: Employment status, occupations and social-class destinations of graduates, annual salary and 'job quality'.
Section Five: Reassessment of higher examination of those factors which determining success in the labour market.
PAGE A.325
education graduates
and saw
an as
Part Three: Technical Problems
In undertaking the research a number of technical problems were
encountered. Firstly, the questions relating to the social-class
origins and secondary education of graduates were not coded when the
Wave I data was 'punched' into the computer and the present writer
undertook this task himself. Although this caused him some
additional work, it did give the present writer full control over
the coding of this data, and gave him the opportunity to search for
a social-class schema which would best suit his needs.
Full details of how the social-class questions were coded are given
in Chapter Three. Suffice it to say here that the occupations were
initially coded according to a modified version of the 36 point
Hope-Goldthorpe schema of the 'general desirability of occupations'
in such a way as to allow the separate categories to be re-combined
into separate social classes.
The entry qualifications were coded on to a separate card with
provision for fifty-five separate CSE/GCE/RSA examinations {and
Scottish equivalents) and two other examinations. The examination
results were coded according to the schema given in Table A.2. From
this it can be seen that where an individual possessed a CSE in a
subject it was coded as one irrespective of the grade. Where a
graduate possessed two or more passes in the same subject the higher
code was used. Thus where a graduate had a CSE and a GCE A-level the
relevant GCE A-level code was used.
PAGE A.326
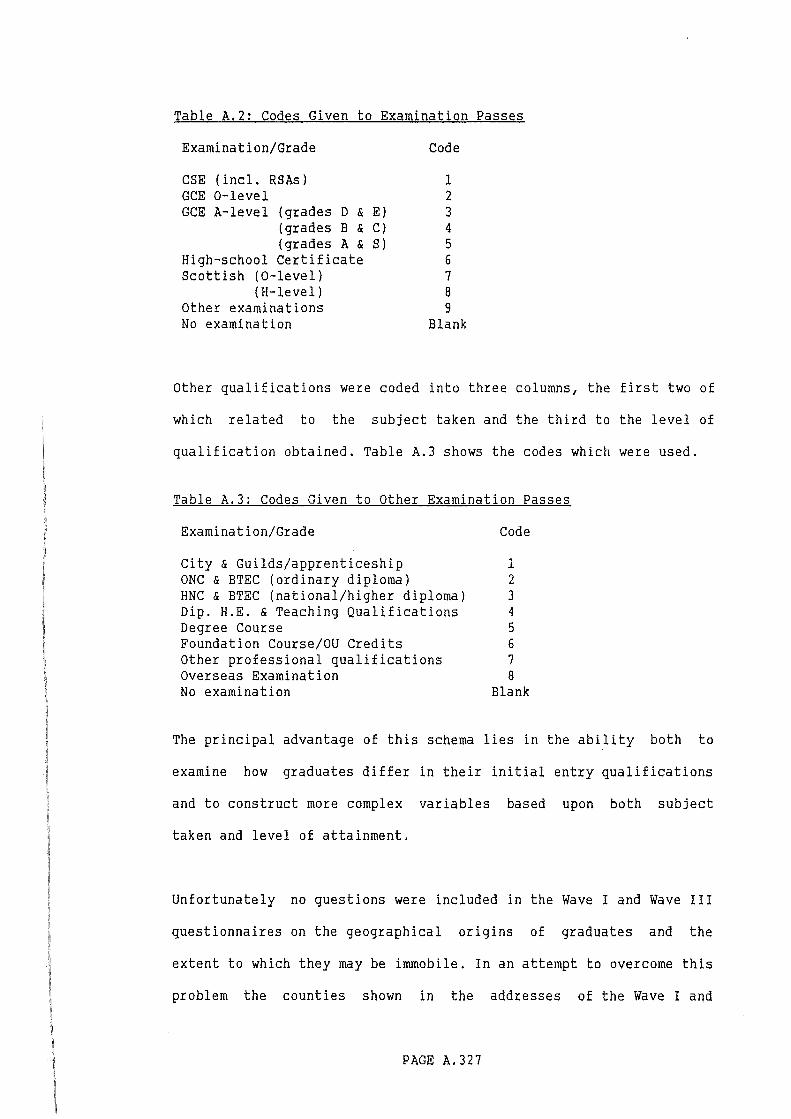
Table A.2: Codes Given to Examination Passes
Examination/Grade Code
CSE (incl. RSAs} 1 GCE 0-level 2 GCE A-level (grades D & E) 3
(grades B & C) 4 (grades A & S} 5
High-school Certificate 6 Scottish (0-level} 7
(H-level} 8 Other examinations 9 No examination Blank
Other qualifications were coded into three columns, the first two of
which related to the subject taken and the third to the level of
qualification obtained. Table A.3 shows the codes which were used.
Table A.3: Codes Given to Other Examination Passes
Examination/Grade
City & Guilds/apprenticeship ONC & BTEC (ordinary diploma) HNC & BTEC (national/higher diploma) Dip. H.E. & Teaching Qualifications Degree Course Foundation Course/OU Credits Other professional qualifications Overseas Examination No examination
Code
1 2 3 4 5 6 7 8
Blank
The principal advantage of this schema lies in the ability both to
examine how graduates differ in their initial entry qualifications
and to construct more complex variables based upon both subject
taken and level of attainment.
Unfortunately no questions were included in the Wave I and Wave III
questionnaires on the geographical origins of graduates and the
extent to which they may be immobile. In an attempt to overcome this
problem the counties shown in the addresses of the Wave I and
PAGE A.327
Wave III questionnaires were coded in such a way that counties were
numbered according to their standard region. Thus, for example, the
five counties of the northern region were coded 1 to 5 and the ten
Scottish Regions and Island authorities were coded 62 to 71. Such a
schema made it possible to regroup counties into regions with the
minimum of effort.
Owing to the relatively primitive nature of the SPSS program package
and the way in which the original coding was undertaking there was a
problem in merging the two files. This was overcome by writing a
small FORTRAN program to facilitate this process. A related problem
arose from having to merge some of the Wave I data with the Wave II
and Wave III data. This posed a problem because a certain amount of
'key' data (eg gender and social-class origins) had been collected
on the Wave I questionnaire and needed to be transferred to the
Wave III questionnaire for further analysis to take place. This
problem was overcome by writing two small FORTRAN programs: one to
extract the relevant information from the Wave I data set and
another to merge it into the Wave II and Wave III data sets. Because
of the declining response rate it was possible to 'match' only
approximately half of the Wave I questionnaire data with the
Wave III data set and there were a few individuals who replied to
the Wave III but not the Wave I questionnaire. In such cases the
'transferred' data was set to missing value. As things turned out
much of this work proved not to have been necessary as North
Staffordshire Polytechnic, where the work was undertaken, replaced
its ICL 2966 computer with a VAX computer with the SPSSX program
package which has an automatic 'merge' facility.
PAGE A. 328
Part Four: Analysis of the Data
SPSSX has many different subprograms which allow the user to
undertake a great many statistical tests from relatively simple
statistics such as chi-square to more complex tests such as
regression and factor analysis, but owing to the way in which the
HELM project was undertaken and the design of the HELM
questionnaires many of the more complex facilities available with
SPSSX were of little use to us.
Firstly, as was mentioned in Chapter Two, a non-random sample was
used in the HELM study and in consequence it is impossible to
calculate the degree to which the resulting sample is representative
of all CNAA graduates. Since most statistical tests draw inferences
on the basis of fully random samples to the population as a whole
they are of little use to us because the degree of error involved
cannot be calculated.
A second problem is one caused by the level of measurement. Stevens
(1944) has identified four variable types which are commonly used by
social scientists, namely: the nominal, ordinal, interval and ratio.
In nominal-level measurement each value represents a distinct
category and the value is merely a label or name. In ordinal-level
measurement values are arranged in a rank order, such that if 'a' is
greater than 'b' and 'b' is greater than 'c' then it follows that
'a' is also greater than 'c', but ordinal-level measurements give no
indication of the relative distances between categories.
Interval-level measurements are an extension of ordinal-level
variables except that the distances between categories are now fixed
PAGE A.329
and equal. For example, Likert-type attitude scales are of this
type. However, such scales are purely artificial constructions and·
although they make it possible to study differences they do not deal
in proportionate magnitudes. Finally, ratio-level measurements make
use of real numbers, and the distances between categories are fixed,
equal and proportionate (Nachmias and Nachmias, 1976: 54-6).
The importance of Stevens' classification is that the statistical
tests which it is permissible to use are determined by the
variable-type used. Arranging Stevens' variables in order -nominal,
ordinal, interval and ratio - it can be shown that a statistical
test which can be applied to a lower-level variable can also be
applied to a higher-level variable. Hence the mode
are the only permitted tests which can be
nominal-level variables, whilst any statistical
performed upon a ratio-level variable.
and chi-square
performed upon
test can be
Most variables which are commonly employed in questionnaire studies
are of a nominal and ordinal nature and this applies also to the
panel-questionnaires used to undertake this study. Unfortunately
only a limited number of tests can be applied to such variables: in
the case of ordinal variables the medium, gamma, tau and chi-square.
However, given the more sophisticated tests which can be undertaken,
many social scientists prefer to use statistical tests which involve
the calculation of the mean and standard deviation (eg T-Tests and
Anova), although -strictly speaking -they are only permitted with
higher-level measurements. Laboriz (1979) and Taylor (1983) have
undertaken a series of statistical tests on the validity of this
approach and have concluded that it is generally acceptable,
PAGE A.330

provided that the ordinal variables used are not of a dichotomous
(eg sex) or trichotomous nature.
Because of these problems it was decided to use only the more
elementary statistical tests (mainly chi-square) and to make
limited use of those statistical tests which require a fully random
sample and involve the calculation of the mean and standard
deviation. Even so it should be stressed that the tests employed
should be interpreted with considerable caution and should be taken
as guides rather than as absolutes.
PAGE A.331

APPENDIX B: EXTRACTS FROM THE HELM QUESTIONNAIRES.
The Wave I Questionnaire/ ...

- 2 - ,l'--·p· ~· '• ·,:; ,(..-1 _.,.. - I j,
\....- ,,, . . ' . - 7 i,.~_.c..l."("~ (~ _ \,',.--,,-·, ,. :/.") v...:: . ,,..... (_. J __ C.:~.-t ..... \• )~-; .. ;,·..:("":.. ... "'~< ,J
Section ONE: DETAILS AND EVALUATIOO OF YOOR DEGREE COURSE H'L/2..
Ql Which higher education institution did yo~ attend? N&~e of institution
Q2 h'hich year did you corrmence your ·course? 19
. Q3 Nnat was the full na.rne of the degree course on which you enro.i.led?
(eg BSc (Hons) Catering Systems, BA Combined Studies, etc)
------------------
Q4 If yo:.1r degree course allowed chc-ice between a number of major special:i.sms, please i;;oicate the mc.in subjects or areas of study selected.
·------- ----------·
--------------------
Q5 Wnat class of degree did you obtain? Ring One
First Class Second Class Upper Seco;,d Class Lower Third Class
1st 2.1 2.2 3
Unclassifie:3 deq ree v:i th co;rrnen:Jation U::-~clc.ssif.~ed degree vlitho:.Jt corrmendation Fail Otber (please specify)
1 2 3 4 5 6 7 8
office use ·
IT
D
0
D

r . - 7 -
Section 'I'i'\0: DETAilS OF EMPLOYMENI' SINCE GRADUATIOO
QlS (a) Are you currently engaged in Full-time study?
If YES, and if yaJ. had any perio:ls of employuent/ unenploynent between graduatic:n and starti.n:J fulltime sttrly 1 please answer questions 16-32 starting on paqe 8. otherwise, go to Q33 on page 15.
If N:>:
YES NO B
(b) Are you currently in FULL-TIME e~loyment? ~B If YES, GJ 'ID Ql6 on page 8
If ro I have you been ••• ?
(i) Continuously unemployed (ie. without any full or part-time work since graduation?
(ii) Had part-time work only since graduation
(iii) Had a period(s) of full-time work since graduation
If (i), please give reasons:
N:W m 'ID Q33 on page 15
If (ii) 1 please give reasons:
~"':»/
OOro Q16 on page 8
If (iii), please ao to Ql6 on page 8
Rin:J One
l
2
3
office use
D
D
D

- 8 -
Ql6 Please give details of your current iob (or your most recent job if you are currently unemployed but have v.•orked since graduatiot9
1 and your first job (if you have had more than one job since graauation)
Current 1st Job (if you : {f'.1ost Recent) have had more
Job than one job)
Were you? Self employed 1 1 Eril!Jloyed 2 2 ...
Full time 3 3 Part time 4 4
Job title (be specific) eg trainee ' chartered accountant; school tea-cher; secretary; production engi-neer; maintenance engineer;etc
Field of Employment: eg Comprehen-sive school; retail trade; pharma-ceutical industry; etc ••
Number of ~~loyees in the co~any as a whole (approx) less than 20 1 1 21 -49 2 2 50-199 3 3 200-499 4 4 500 + 5 5
Name of Employing Organization
Salary ~ l'leeUy income Salary p.a. £ £ ----(Before tax including any OR bonus supplement or Weekly income £ £ London weighting)
' Location of Job: Within a 50 mile radius of the College or Poly-technic from which you l 1
' graduated 51 - 150 miles 2 2 over 151 miles 3 3
office usE
B B D 0 D D D
D
0 0 D D
D D
·-l>'bnth
Date of starting:
('i\here ar,::plicable) Date of leaving: ,,
('r<Jnere awlicab:).e) Reasons for leaving
u:or each job)
_____ / ___ .. ~-
Year l'bnth
8
8
Year
8
8
B 8
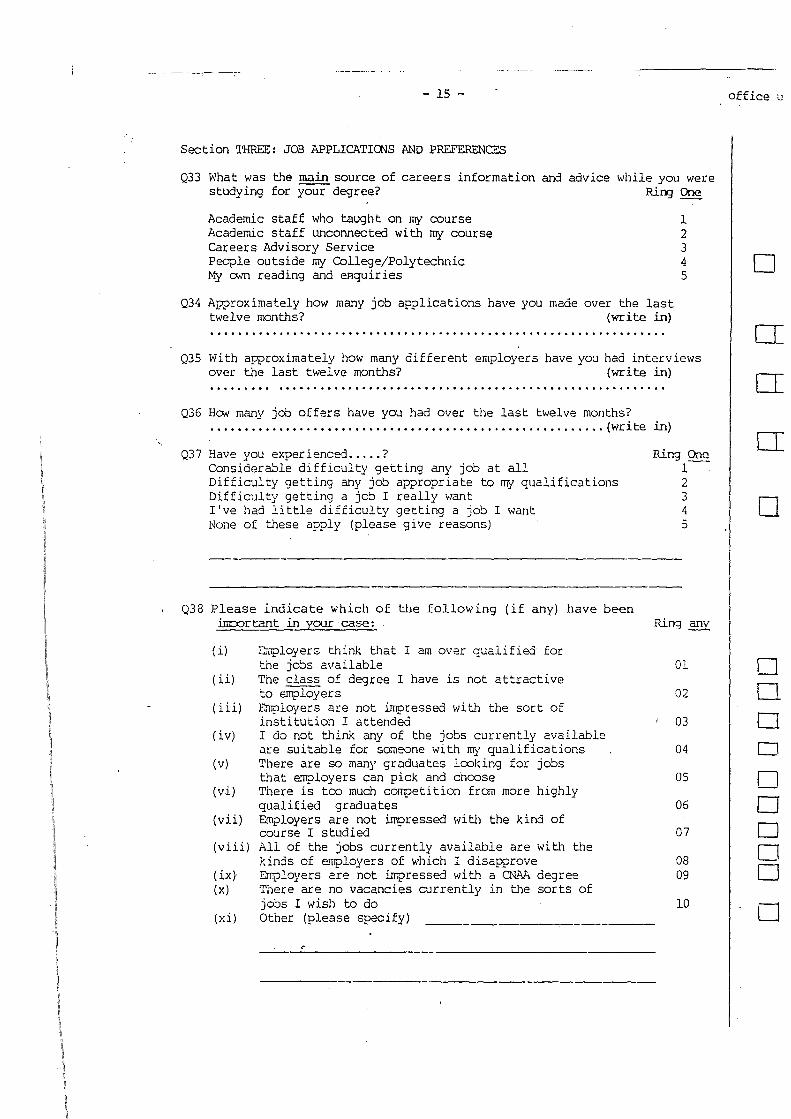
- 15 -
Section THREE: JOB APPLICATIOOS AND PREFERENCES
Q33 What was the main source of careers information and advice while you were studying for your degree? Ring One
Academic staff who taught on my course l Academic staff unconnected with my course 2 Careers Advisory Service 3 PeQ?le outside my College/Polytechnic 4 My own reading and eRquiries 5
Q34 Approximately how many job applicatio!1S have you made over the last twelve months? (write in)
Q35 With approximately how many different employers have you had interviews over the last twelve months? (write in)
Q36 How many job offers have you had over the last twelve months?
Q37
· · · · · · · ·. · · · · · · · ...... · .................................. (write
Have you experienced ....• ? Considera!:lle difficulty getting any job at all Difficulty getting any job appropriate to my qualifications Difficulty getting a jcb I really want I've had little difficulty getting a job I want None of these apply (please give reasons)
in)
Ring One 1-
2 3 4 5
---------------------------------·----------------------------------------
Q38 Please indicate which of the following (if any) have been i.nr:x:Jrtant in your case: Rin9 ~
(i)
(ii)
(iii)
(iv)
(v)
(vi)
(vii)
(viii)
(ix) (X)
(xi)
£m?loyers think that I am over qualified for tile jobs available The class of degree I have is not attractive to employers £~layers are not impressed with the sort of institution I attended I do not think any of the jobs currently available are suitable for someone with my qualifications There are so many graduates looking for jobs that e~loyers can pick and choose There is too much competition from more highly qualified graduates Employers are not iffi?ressed with the kind of course I studied All of the jobs currently available are with the kinds of employers of v.•hich I disapprove Err.ployers are not impressed with a CN.i\A degree There are no vacancies currently in the sorts of jobs I wish to do Other (please specify) -------------------
Ol
02
03
04
OS
06
07
08 09
10
office u
I 0
IT
IT
IT
0
0 0 D D
0 D 0 0 0
0
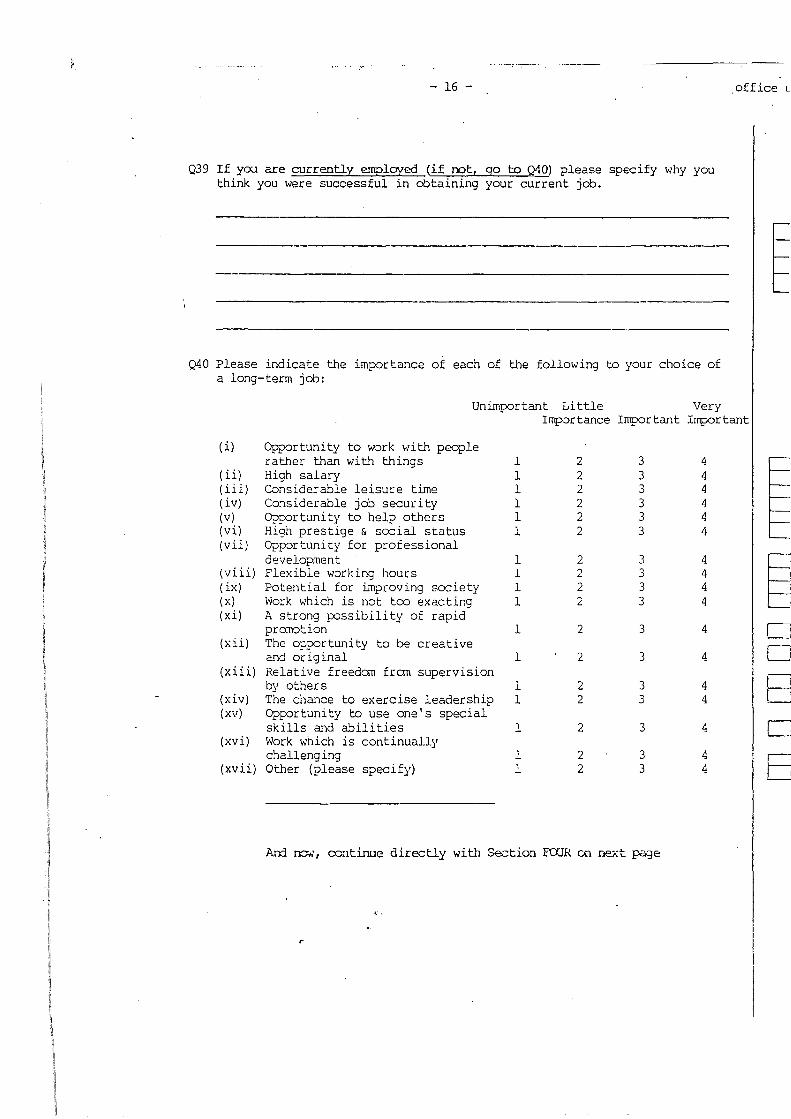
- 16 -
Q39 If YCXl are currently employed (if oot, go to Q40) please specify why you think you were successful in obtaining your current job.
Q40 Please indicate the importance of each of the following to your choice of a long-term job:
Unimportant Little Very
. office L
~
Importance Important Important
( i) Opportunity to work with people rather than with things 1 2 3 4
~ (ii) High salary 1 2 3 4 (iii) Considerable leisure time l 2 3 4 (iv) Co~siderable jo~ security 1 2 3 4 (v) ()p,?Ortunity to help others 1 2 3 4 (vi) High prestige & social status 1 2 3 4 (vii) Opportunity for professional
development 1 2 3 4
~ (viii) Flexible WQrking hours l "'\ 3 4 L..
(ix) Potential for improving society 1 2 3 4 (x) ivork v.'hich is nQt teo exacting 1 2 3 4 (xi) A strong possibility of rapid
pro:rotion 1 2 3 4 c (xii) The opportunity to be creative
D a'1d original 1 2 3 4 (xiii) Relative freedom from supervision
~ by others 1 2 3 4 (xiv) The chance to exercise leadership l 2 3 4 (xv) Opportunity to use one's special
skills and abilities 1 2 3 4 I CJ (xvi) Work v.'hich is continually
challenging 1 2 3 4 I 8 (xv ii) Other (please specify) l 2 3 4
And rr;.;:, coatinue direcUy with Section FCXJR oo next :f>09e
'' ("

--., .. -:-- ------
- 17 - office u:
Section FOUR: DETAILS OF COURSES OF STUDY UNDERTAKEN SINCE GPADUATION
Q41 Did you apply for any FULL-Til1S p~st-graduate course of study while you 1~ere an undergraduate, and have you applied since graduation?
YES, I applied while an undergraduate YES, I have applied since graduation NO
Q42 Have you undertaken any period of further study (either full- or part-time) since graduation?
If NO, GJ TO Q43 m Page 19
If YES:
Are/were all of these periods of study covered in Q27 (Training Courses in Current or Most Recent Employment)?
If YES, GJ TO Q43 on Page 19
If NO, please answer the following questions al::xxlt
(A) your current period of study and/or
YES l\10
YES NO
(B) any other periods of study si~ graduation which have been carpleted or whic..'l you left without carpletirq
(A) CURRENT PERIOD OF STUDY
(i) Title of course (give exact title, please)
(ii) Hov1 long d:>es the course last?
___ _,'ears
(iii) Is this course?
mo~ths" weeks
full-time part-time evenings part-time days/day and evenings other (please describe)
(iv) Is this course part of a GoverTh~ent training scheme? YES ~~
1 2 3
R
EJ
l 2 3 4
8 If YES, please state the title of the scheme (eg Training Op~rtuni ties Scheme, Corrrnuni ty Pr09r amne)
(v) Do you receive financial sup~rt from ..... ? an employer the tv'SC a Research Council a joinf industry and Research Council a college, polytec~~ic or university a local education authority relatives or friends other (please specify)
Ring all which apply l 2 3
award 4 5 6 7 8
B 0
D
IT
IT
0
0
0

- 18 -
(vi) If 0:1 a full- or part-time course, at which institution are you studying?
Name of Institution ------(vii) What qualification{s) result from successful completion of this
course?
No formal qualification Professional qualification (Exact title
PGCE Masters Degree (taught course) 1•1asters Degree (by research) PhD Other (please specify)
1 2
3 4 5 6 7
(viii) \~hat are the minimum qualifications for entry to the course?
No formal qualifications "0" level (or equivalent) "A" ;Level (or equivalent) A degree A·good hono~rs degree
(ix) To v:hat extent is this course relatee to yo~r undergraduate studies?
(X)
Not at all Only in general terms Very closely Too much overlap
1 2 3 4 5
1 2 3 4
If undertaking f~ll-tiwe study, does this course include a period of work experience? l.'ES
NO B (B) Perirus of study (excluding those covered in Q27) completed or
whichyou left without completing (Refer to cedes in A ab::Ne where apprcpriate)
(i) Title of course
(ii) How long did the course last (in weeks)?
(iii) Full-time [Cedes 1-4, see A (iii))
( i v) v~as this course part of a Government Training Scheme?
YES 1 NO 2
Per icd of Study
ONE TI'.D
office
0
B
D
0
0
D
LI
CI
a
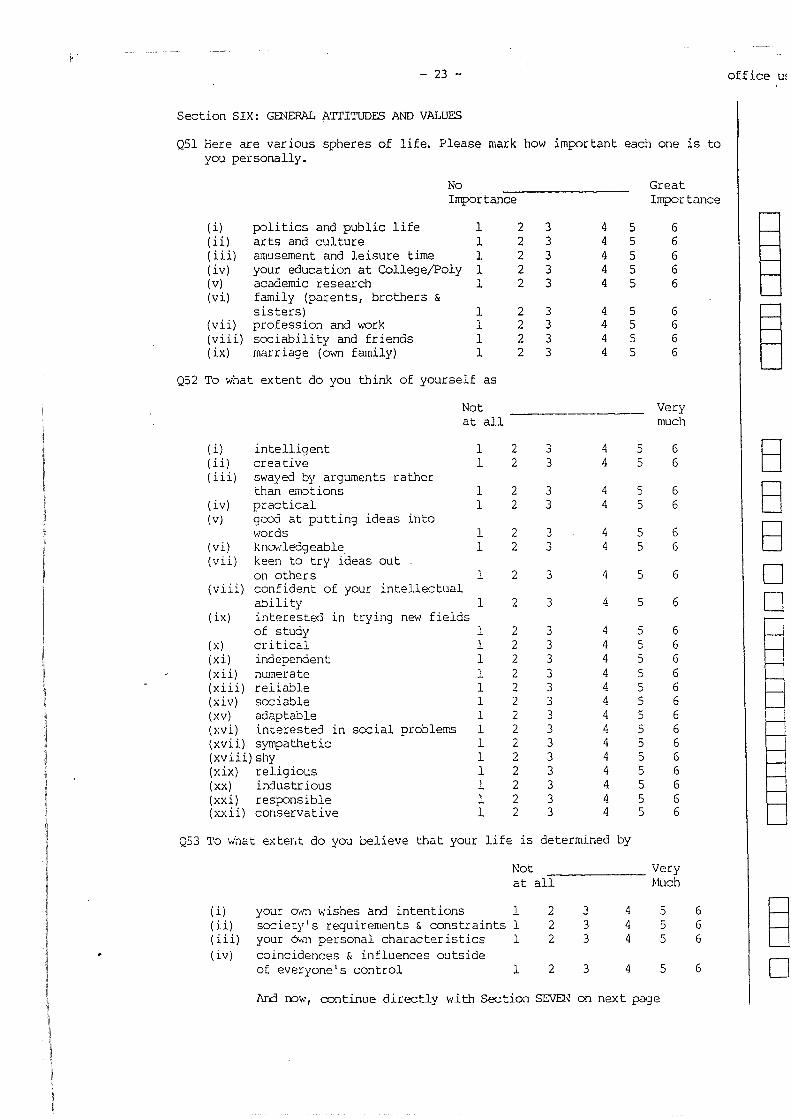
} '
- 23 -
Section SIX: GENERAL ATI'ITUDE.S AND VALUES
Q51 Here are various spheres of life. Please mark how important each one is to you personally.
No Importance
( i) (ii) (iii) (iv) (v) (vi)
(vii) (viii) (ix)
politics and public life 1 arts and culture 1 amusement and leisure time l your education at College/Poly l academic research l family (parents, brothers & sisters) 1 profession and ~Drk 1 sociability and friends 1 marriage (own family) l
QS2 To what extent do you think of yourself as
Not at all
( i) intelligent 1 (ii) creative l (iii) swayed by arguments rather
than em:>tions 1 (iv) practical l (v) good at putting ideas into
words l (vi) kno,.;ledgeable l (vii) keen to try ideas out
on others 1 (viii) confident of your intellectual
ability 1 (ix) interested in trying new fields
of study l (x) critic~l l (xi) independent l (xii) numerate l (xiii) reliable 1 (xiv) sociable l (xv) adaptable l (xvi) interested in social pro!::J1ems l (xvii) sympathetic l (xviii)shy l (xix) religious 1 (xx) industrious l (xxi) responsible l (xxii) conservative l
2 2
2 2
2 2
2
2
2 2 2 2 2
2 2 2 2
2 2 2 2 2 2 2 2 2 2 2 2 2 2
3 3 3 3 3
3 3 3 3
3 3
3 3
3 3
3
3
3 3 3 3 3 3 3 3 3 3 3 3 3 3
4 4 4 4 4
4 4 4 4
4 4
4 4
4 4
4
4
4 4 4 4 4 4 4 4 4 4 4 4 4 4
5 5 5 5 5
5 5 5 5
Q53 To what exter.t do you believe that your life is determined by
( i) (ii) (iii) (iv)
Not at all
your Q,\';1 ~·ishes and intentions l society's requirements & constraints l your ~n personal characteristics l coincidences & influences outside of everyone's control l
2 2 2
2
3 3 3
3
4 4 4
4
5 5
5 5
5 5
5
5
5 5 5 5 5 5 5 5 5 5 5 5 5 5
Great Importance
6 6 6 6 6
6 6 6 6
Very much
6 6
6 6
6 6
6
6
6 6 6 6 6 6 6 6 6 6 6 6 6 6
Very Huch
5 5 5
5
6 6 6
6
Ard rx:>t;.·, ce>.>tinue directly with Sectio.• SEV.El~ on next page
office U!
B B B B 0 D
§ 0

~.
- 24 -
Section SEVEN: BACKGROUND DETAILS
1 Name ____________________________________________________ ___
2 Year of Birth ---------------------------------------------------3 Sex M
4 Marital Status
F
(i) single 1 (ii) married/permanent relationship 2
(iii) separated, divorced, widowed 3
. office u
IT 0 0
5 Year of completion of full-time secondary education 19 __________________ _ IT 6 What kind of school did you last attend before entering a College or
Institute of Higher Education or Polytechnic?
7
Secondary Modern Technical Secondary Comprehensive Gramnar/High Direct Grant Independent (Public/Private) HM Forces School Institution outside UK Other (please specify)
If educa te:l in S<X>tlarrl
RiiB One
01 02 03 04 05 06 07 08 09
Junior Secondary (3-4 year selective) 11 Senior Secondary (6 year selective) 12 Comprehensive 13 Grant-Aided 14 Independent (Public/Private) 15 Other (please specify)
Did you attend a .College of Further Education? YES l\\) B
8 Please indicate the highest"level of qualification gained before entering your degree course.
( i) ( ii) (iii)
(iv) (v) (vi) (vii) (viii) (ix) (X)
(xi)
Ri09 one nurrber ool y.
No formal qualification GCE 0 levels or CSE Grade ls (1-4 subjects) GCE 0 levels or CSE Grade ls (5 or more) or General School Certificate GCE A level (l subject) GCE A level (2 or more) ONC/OND, TEC Certificate/BEe National ffi~C/ffi~, TEC Higher/BEC Higher National Scottish Highers DipH.l:: Open University credits Other (please specify)
l 2
3 4 5 6 7 8 9
10 11
IT
0
D

25
9 Complete the following table giving A levels, Scottish Highers and equivalent or higher qualifications (e.g. ONC, HND} which you obtained before studying for the degree you received in 1982.
--Type of qualification Subjects Grade A Level and above e.g. HND
- -----
- - -- ----- L__~----·- - -- ---------------
10 Com?lete the following table giving 0 Levels ill1d CSEs which you obtained before studying for the degree yo:J received in 1982.
T}pe of qualification Subjects Grade 0 Level and CSE
- ------'
1-------
j_ __ -
· ..
~
office
~
u

- 26 -
11 V."hat did you do between completion of full-time secondary education and entering your degree course? (Please r~ all those numbers which apf>ly in your case)
(i) (ii) (iii) (iv) (v)
(vi) (vii) (viii) (ix)
started immediately the degree course indicated in Q3 started a different course at Polytechnic or College started a different course at University completed a training course in further education undertook paid employment for a period of between 3 months and 1 year undertook paid emplaJment for a period of more than 1 year undertook unpaid domestic work raised a family other (please specify -------------------------
1 2 3 4
5 6 7 8 9
12 What is/was the main occupation of your father, mother and spouse (eg. civil servant, teacher, postman). Please include under self you own previous occupation if applicable. ----
(i) Father
(ii) Mother
(iii) Self
(iv) Spouse No S:x>use 0 (tick)
l3 As far as you know, "'hat is the hiq!Jest qualification achieved by your parents &~d spouse? (Please ring one in ea~h column; if overseas e::_ruivalent please give best estimate or specify in "other")
Father 1-iother Spouse
( i) None 1 1 1 (ii) GCE 0 levels, CSE grade ls, School
Certificate 2 2 2 (iii) GCE A levels or equivalent (ONC, O:'io,
TEC/BEC National) 3 3 3 (iv) Qualifications above A level but not
of degree equivalent (eg HNC, HND, TEC/BEC Higher, Teacher Certificate) 4 4 ~
(v) First degree or equivalent and/or higher degrees (eg BA, HSc, PhD) 5 5 5
(vi) Other (please specify) 6 6 6
14 To monitoring of access to higher education and movement in to work, please provide details of your ethnic origi~
Ethnic Origin (Please tick one only)
African/UK African Asian/dE Asian Caribbean/UK Caribbea~. UK EurCJ?ean Other Euro?ean Specify other Origin/Country
I
office w
~ ~ 0 0 D 0
[L


Ql
This is the final questionnaire fo~ our three year study of CNAA graduates. The confidence that we have in our findings depends on the number of returned questionnaires so please fill this in and ~eturn it in the p~e-paid envelope p~ovided. We have tried to make the questionnaire easy to use - ~elyi~ on circling o~ crossing out whe~ever }X)Ssible. If you have any ques tiona about the resea~ch o~ further comments to make please fill in the section at the end of the questionnaire and we •Ifill attempt to answe~ them as soon as possible.
Thanks in anticipation.
John Brennan Philip iY!cGeevor
Which of the following desc~ibes you~ cu~rent situation?
(ring ANY that apply) 1. In full-time employment 1 2. In part-time employment 1 3. In full-time study 1 4 • In part- time study 1 5. Unemployed and available fo~ employment 1 6. Unemployed and not available for employment 1 7 . Self employed 1
The next section asks fo~ details about your cu~rent employment. It is to be answered only by those currently employed whethe~ a.s employees o~ self-employed. Others f!P to SECTICN 2 on page 10 and answe~ question 32 onwards.
r 1
I
OFFICE USE ONLY
CARD 01 3-6 7-8 9-10
11-17
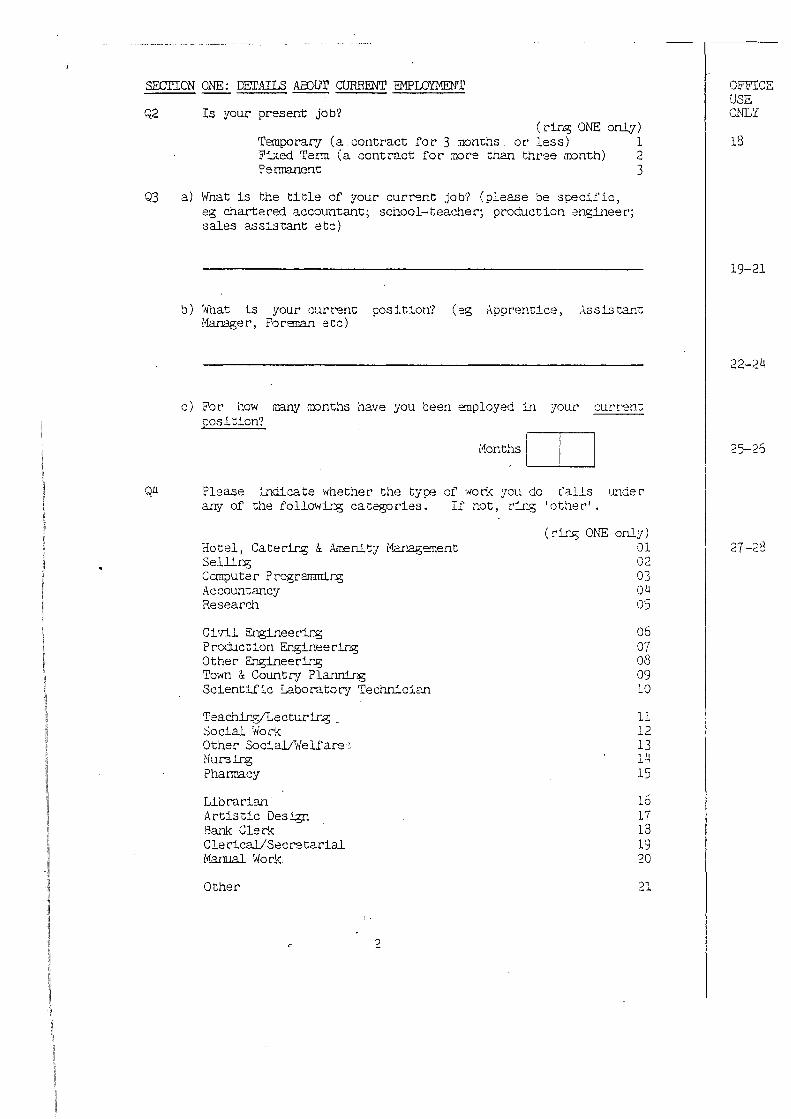
SECI'ICN ONE; DETAILS ABJflr CURRENT EMPLOYME11T -- ---Q2 Is your present job?
( ring ONE on.ly) Tempora.rJ (a contract for 3 months or less) 1 Fixed Tenn (a contract for rr.ore than three mnth) 2 Permanent 3
Q3 a) 11fuat is the title of your cur~nt job? (please be s~ecific, eg chartered accountant; school-teac.'ler; production engineer; sales assistant etc)
b) '1·ihat is your curt"ent [:OSition? (eg Apprem:ice, Assistant !1an3ge r, Foreman e cc)
c) For how nnny mnths have you been employed in your cur~nt cositicn?
Mont~s[IJ
Q4 Please indicate ·Hhether the ty~ of 'lfOr'.-<: you do falls under 3.rij of the f o llO'Hi.r.g ca tego rie s . If r.o t , rir..g ' other' .
Hotel, Caterir..g & Amenity Marzgement Sellir.g Ccmpu te r P rogrammir.g Accountancy Research
Ci'Til Engineec:i.r.:g Production Engineering Other Engineecir..g Town & CountrJ Planni.rg Scientific Laborator; Technician
Teachicg/Lecturir..g _ Social 'lio r~-< Other Socia.lJllieliare : ~lursirg Pharmacy
Llbcacian' Artistic Des!6n Bank Cle rl<: Clecical/Secretarial Ma.rual 'dork
Other
2
( rir...g ONE only) 01 02 03 04 05
06 07 08 09 10
ll 12 13 1'-1 15
16 17 13 19 20
?1 ~-"-
OFFICE USE ONLI
18
19-21
22-24
25-26
27-23
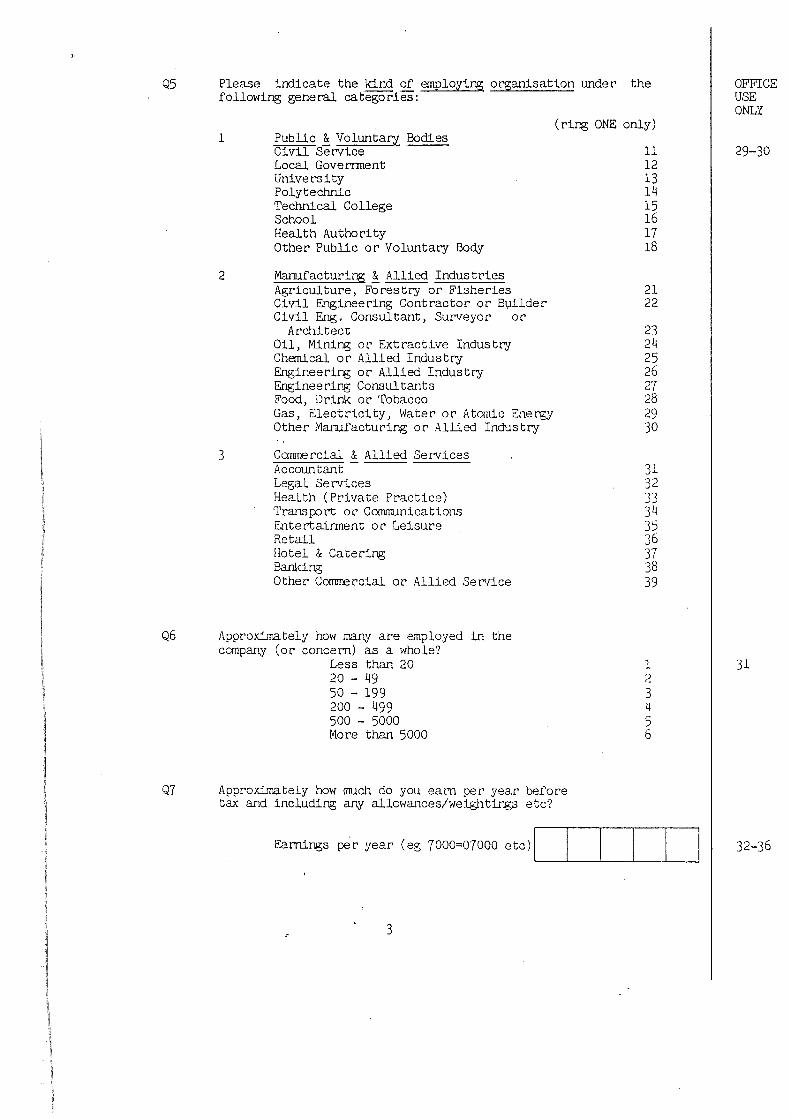
Q5 Please indicate the kind of emoloying osganisation unde~ the following gene~ catego~ies:
( ~i.r:.g ONE only)
Q6
1 Public ! Voluntary Bodies Civil Se~ice Local Gove rrment University Polytechnic Technical College School Health Autho~ity Othe~ Public o~ Voluntary Body
2 Manufacturing ! Allied Industries Agriculture, Forestry or Fisheries Civil Enginee~ing Contractor or Bl,lilde~ Civil Eng. Consultant, Su~eyor 0~
Architect Oil, Mining o~ Extractive Industry Chemical o~ Allied Industr<J Enginee~ing o~ Allied Industry Engineering Consultants Food, D~ink o~ Tobacco Gas, Electricity, \1ater o~ Atomic Energy Other' Marufacturing or Allied Industry
3 Commercial & Allied Se~ices Accountant Legal Se~ices Health (Private Practice) Transp::Jrt o~ Communications Entertainnent o~ Leisure Retail Hotel & Catering Banking Other' Commercial or Allied Se~ice
Approximately how many are employed in the company (or' concern) as a whole?
Less than 20 20 - 49 50 - 199 200 - 499 500 - 5000 More than 5000
Q7 Approximately how much do you earn per' yeac before tax and including any allowances/'neightings etc?
11 12 13 14 15 16 17 18
21 22
23 24 25 26 27 28 29 30
31 32 33 34 35 36 37 38 39
1 2 3 4 5 6
Earnings pet' year (eg 7000=07000 etc)/ I I I I I
3
I OFFICE USE ONLY
I 29-30
31
32-36
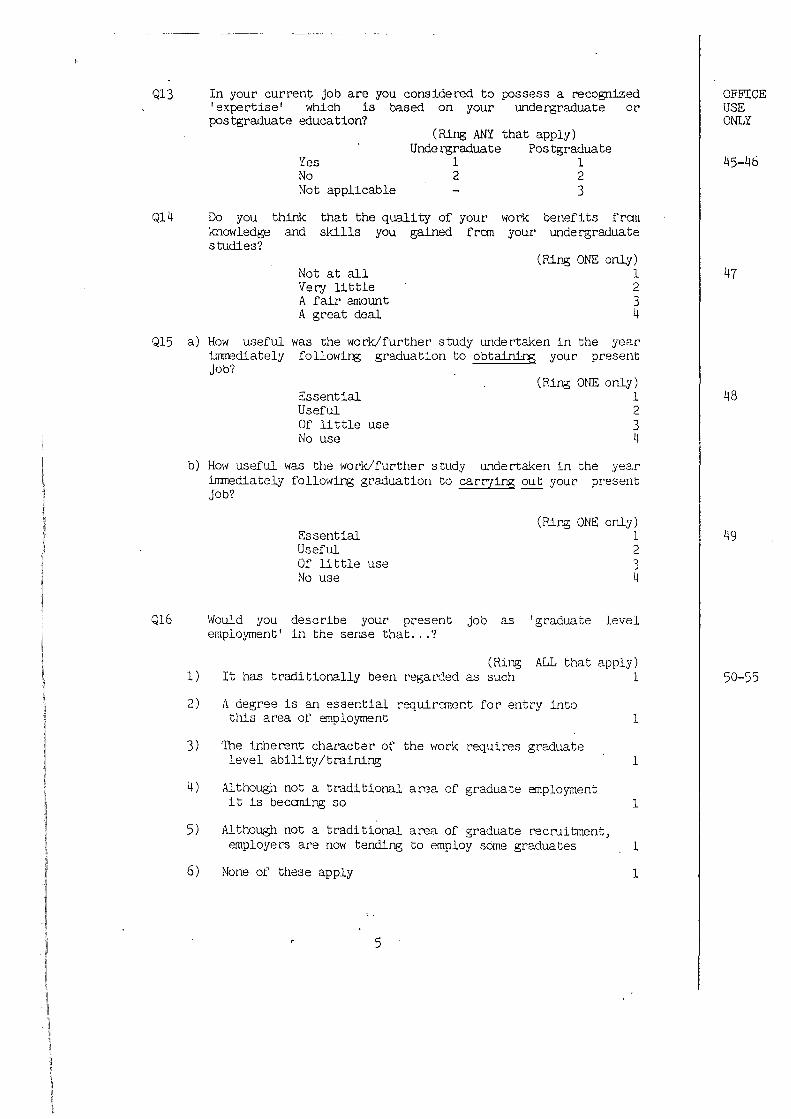
Q13 In your current job are you cons ide red to possess a recognized 'expertise' which is based on your undergraduate or postgraduate education?
Yes No Not applicable
(Ring ANY that apply) Undergraduate Postgraduate
1 1 2 2
3
Ql4 Do you think that the quality of your work benefits fran knowledge and skills you gained from your undergraduate studies?
Not at all Very little A fair amount A great deal
(Ring ONE only) 1 2 3 4
Ql5 a) How useful was the wor'k/further study undertaken in the year immediately following graduation to obtaining your present job?
Essential Useful Of 11 ttle use No use
(Ring ONE only) 1 2 3 4
b) How useful was the work/further study undertaken in the year immediately following graduation to carr;ing out your present job?
Essential Useful Of little use No use
(Ring ONE only) 1 2 3 4
Ql6 \ofould you describe your present job as 'graduate level employment' in the sense that ... ?
(Ring ALL that apply) 1) It has traditionally been regarded as such 1
2) A degree is an essential requin:ment for> entry into this area of employment 1
3) The inherent character> or the work requires graduate level ability/training 1
4) Although not a traditional area of graduate employment it is becoming so l
5) Although not a traditional area of graduate recruitment, employers are now tending to employ same graduates 1
6) None of these apply 1
5
OFFICE USE ONLY
45-46
47
48
49
50-55

Ql7 a) 'ilhich of the t'ollowir'..g describe the for.ns of .joo tminir..g 'r'fhich you received?
1) 2) 3) 4) 5)
6)
( rir.g None Informal guidance frcm imrr:ediate colleagues Guidance fran su~rvisoC'S
ALL that apply) 1 1
A systanatic course of tr"'1._..inir]g of less than five 'r'feek:s A systanatic course of trainir.g of rr:ore than fi7e 'r'feeks
1 1
and less than three rronti"..s A. lange r period of training
1
l
b) Have you received any trainir:g that is directed towaM.s future pranotion and career development rather than towards skills for your exi:s tir_g jo iJ?
·~s
~10 2
Ql8 8ow lor..g did it take you to feel ~hat you had oeccrre competent enough to car~; out your job effectively?
0 - 1 month 1 - 6 months 6 plus rronths Too early to say
( ?.ir.g ONE onl.J) l 2 3 L!
Q19 Co you comider that your current Job is?
Q20
·~21
i) ii) iii)
( ri:-.g ONE only) At the moment, my ms t !)t'efe rred ty;:e of occucacion l Gomenient, until I :::an find scmethir.g bett:ec 2 ~le.!..ther' 3
Are you accively seekir.g or ~pplyir.g fo t"? ~ r:r..g A.LI, thac apply)
i) ii) iii) iv) v) •ri)
a) ·,.,hac
'I:1e same sot't of job 'r'fith anocher employer' l A di-"~fet'ent sot't of job .,...it:h your curren"C employer' l Pramotion with your current employer l A different job '>'fith a different employer' l A job in a different pat't of the country 1 ({one .of the. above, l
formal qualifications. ·.•ere requi.red tor ::ontL) :....'1t:O your current job?
( ci:-.g ONE only) No formal qualifications
, l.
'0' levels/CSE 2 ' . .l.' levels/CNC/CND 3 'I'EC/3EC fli.gher Nacio.nal 4 Degree J
'o) 'dere ;Jrofessior.al. qual.:!...Cications. reqU:..red t,T-.., ..:.i:...) l NO 2
6
CF?ICE USE CN!2
56-61
52
63
64
65-70
7l
72
(73-·dO)
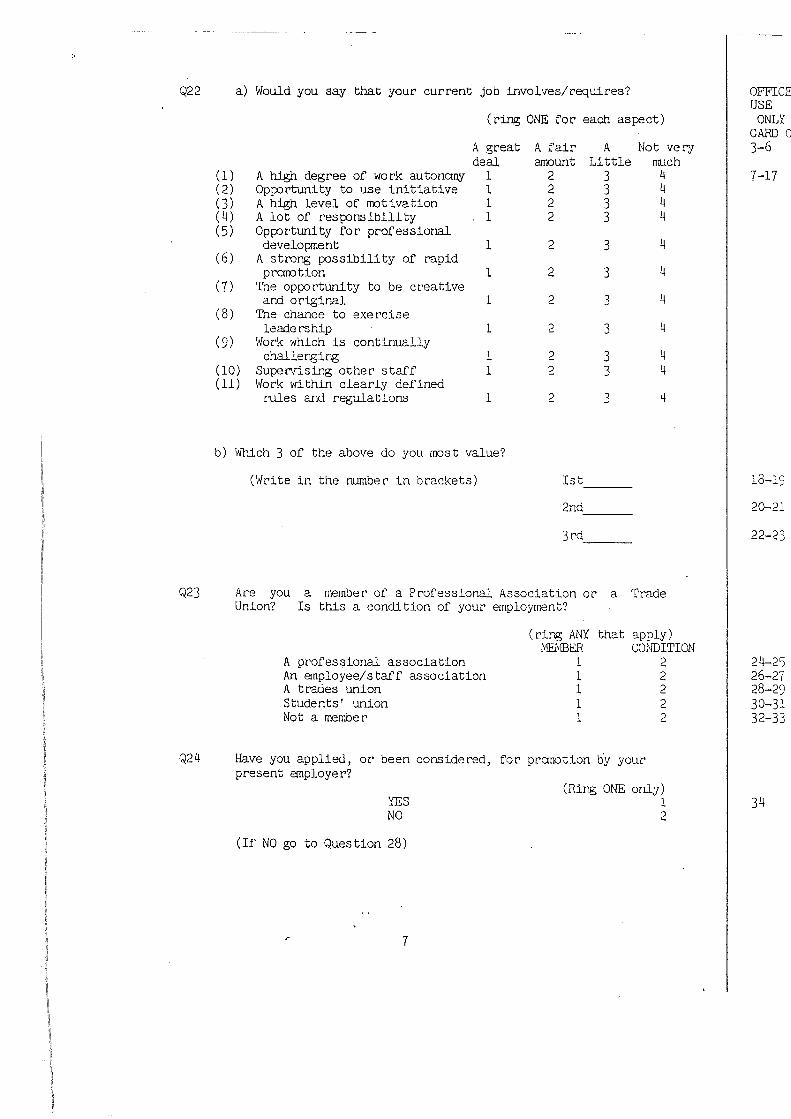
Q22 a) Would you say that your current job involves/requires?
(ring ONE for each as~ct)
A great A fair A Not ver.; deal amount Little much
(l) A high degree of work autonomy l 2 3 4 (2) Opportunity to use initiative l 2 3 4 (3) A high level of motivation l 2 3 4 (4) A lot of responsibility 1 2 3 4 (5) Opportunity for professional
development 1 2 3 4 (6) A strong possibility of rapid
prarotion 1 2 3 4 (7) The opportunity to be creative
and original 1 2 3 4 (8) The chance to exercise
leadership 1 2 3 4 (9) Work which is continually
challenging 1 2 3 4 (10) Supervising other staff 1 2 3 4 (11) 11lork within clearly defined
rules and regulations 1 2 3 4
b) Hhich 3 of the above do you most value?
('llrite in the number in brackets) Ist ---
2nd ---3rd __ _
Q23 Are you a member of a Professional Association or a Trade Union? Is this a condition of your employment?
A professional association An employee/staff association A trades union Students' union Not a member
( rir,g ANY t'IEI<!BER
1 1 1 1 1
that apply) CONDITION
2 2 2 2 2
Q24 Have you applied, or been considered, for pranotion by your present employer?
YES NO
(If NO go to Question 28)
<" 7
(Ring ONE only) 1 2
I
I
OFFICE USE
ONLY CARD C 3-6
7-17
18-19
20-21
22-23
24-25 26-27 28-29 30-3l 32-33
34
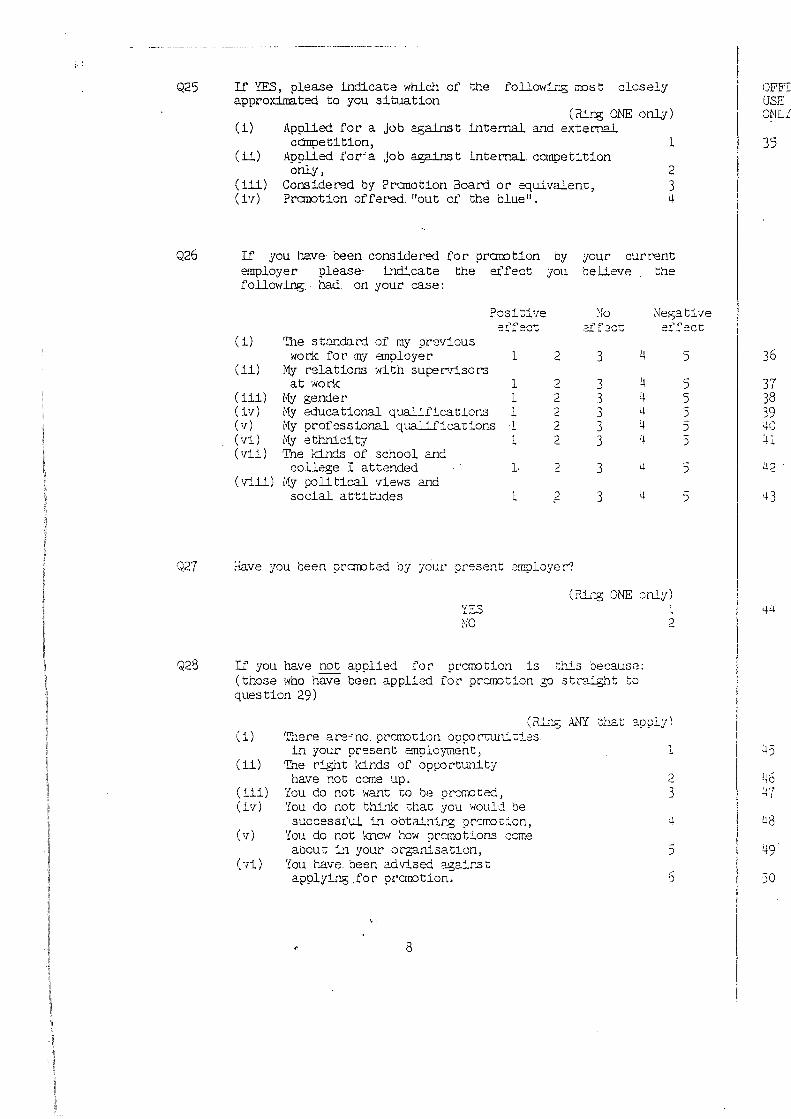
l·.
Q25
Q26
If ITS, please indicate which of the followLcg rr:ost closely app~oximated to you situation
( i)
(ii)
(iii) (iv)
If
( rt:.rg CNE onl,y ) Applied fo~ a job against internal and extero.al cdmpetition, 1
Applied for"a job aga.ir'1.st internal. competition o~. 2
Considered by Pranotion Board o~ equivalenc, 3 Pranotion offered "out of the blue". 4
you have been conside~ for promotion by your current employe~ please· indicate the effect you believe the following . had. on your case:
Posi':ive :ro ~legative e.f'1'ect .:::.r, F' ..:::.roi-
·.....-. .J.. ......... v ei'f2ct ( i) 'Ihe standard of my previous
'#ork for rrry employer 1 2 3 4 (ii) My relations Hith su~rrisors
at HO.rl..<: 1 2 3 4 (iii) My gender 1 2 3 4 ( iv) My educational qual..!.f1catior1s 1 2 3 u (v) My professional qualifica~io0.s 1 2 3 4 (vi) My ethnicit"J 1 2 3 u (vii) The kinds of school and
college I attended 1· 2 3 4 (Viii) 1•1y political <riews and
social attitudes 1 ,2 3 4
Q27 da.ve you been promoted by your present errrployer'"?
(rlir.g ONE cnly) 'SS NO
Q28 If you have not applied for prcrr:otion is ::his 'oecause: (those who have been applied for promotion 50 st~~t to question 29)
l 2
(ii..:i .. ::g At\fY that appl:/) ( i)
( 11)
(iii) ( i 1T)
(v)
( ··ri)
'I'here are·'no. promotion op~~':i:::s in your present employment,
The right kinds of opportunity have not cane up.
You do not want to be p~moced, 7ou do not think ;:;hat you '#OUld be successful L~ obtainir.g prcrr.ot~on,
You do not know how prc:rr..otior.s ccrr.e about L'1 your oqanisation,
You r.ave. been advised aga.:..r.s;:; applying .for promotion.
,.
,. 8
2 3
4
J
6
5
5 5 5 J
J
J
J
I
l
I
I
! I
I
om uSE ONL1
35
36
37 38 39 40 j" • .L
ll2
·~3
44
45
46 '17
"'' L!8
49
50

Q29 Co you think that you have a good chance of gaining pranotion (or fUr'ther prarotion) within the next 12 mnths?
YES NO
(Ring ONE only) 1 2
Q30 How do you r:'ate the promotion opportunities in your present organisation?
Very good Very bad
(Ring ONE only) 1 2 3 4 5
Q31 Co you think that prarotions are handled fairly within your organisation?
If NO please give reasons
9
YES NO
(Ring ONE only) 1 2
OFFICE USE ONLY
51
52
53
54-55
(56-80)
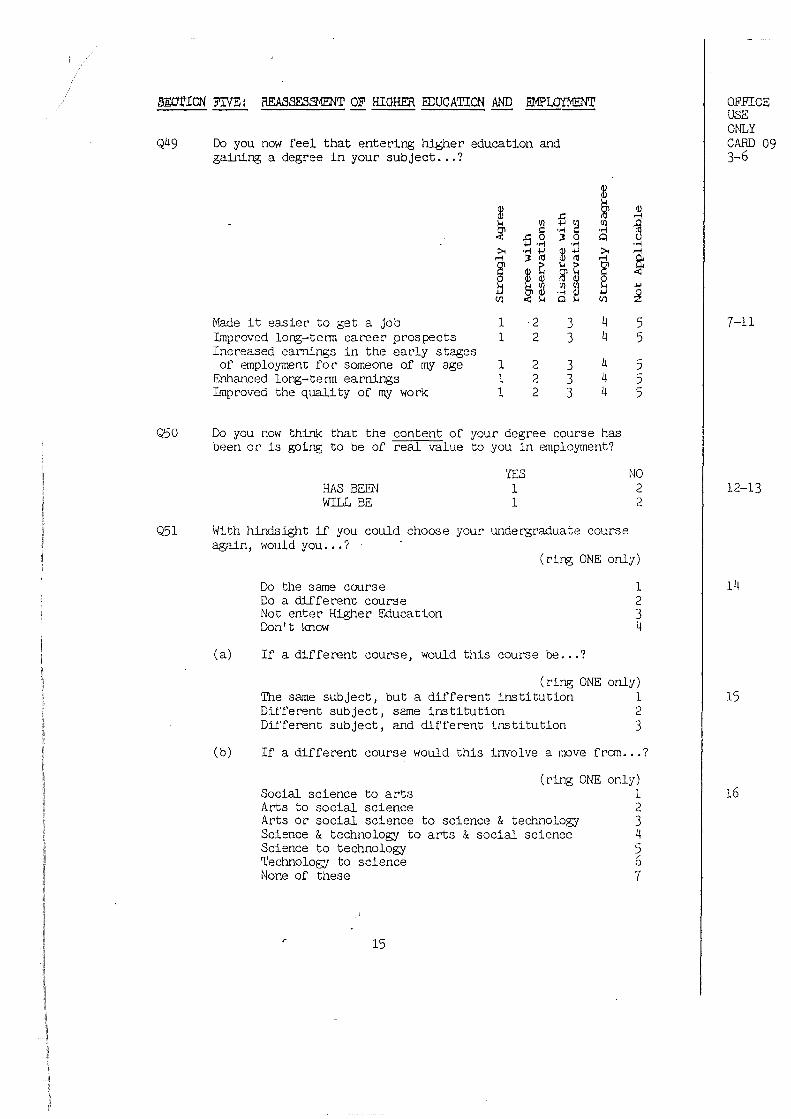
Sror:tON FIVE: REASSESSt!ENT OF HIGHER EDUCATICN AND EMPLOYMENT
Q49 Do you now feel that entering higher education and gaining a degree in your subject •.. ?
~
~ ~ <lJ .p ,..., ... ~ .,., ~ (IJ ~ ~ .,.,
.p .~ ) 0 0 (j ·.-1 .,.,
>< .,., .jj
~~ >< ,..., ,..., ) I'll ,..., 8; 1? ~~ ~~ [ <
b ·~ ~ .jj +.)
~ (/) < ... (/)
Made it easier to get a job 1 2 3 4 5 L11proved 1ong-tenn career prospects 1 2 3 4 5 Increased earnings in the early stages of employment for someone of my age 1 2 3 4 5
Enhanced long-tenn earnings 1 2 3 4 5 Imp roved the quality of my work 1 2 3 4 5
Q50 Do you now think that the content of your degree course has been or is going to be of real value to you in employment?
YES NO HAS BEfll 1 2 WILL BE 1 2
Q51 With hindsight if you could choose your undergraduate course again, would you ... ?
Do the same course Do a di.fferent course Not enter Higher Education Don't know
( ring ONE only)
1 2 3 4
(a) If a different course, would this course be ... ?
( ring ONE only) The same subject, but a different institution 1 Different subject, same institution 2 Different subject, and different institution 3
(b) If a different course would this involve a move from •.. ?
(ring ONE only) Social science to arts Arts to social science Arts or social science to science & technology Science & technology to arts & social science Science to technology Technology to science None of these
15
1 2 3 4 5 6 7
I
I
OFFICE USE ONLY CARD 09 3-6
7-11
12-13
14
15
16
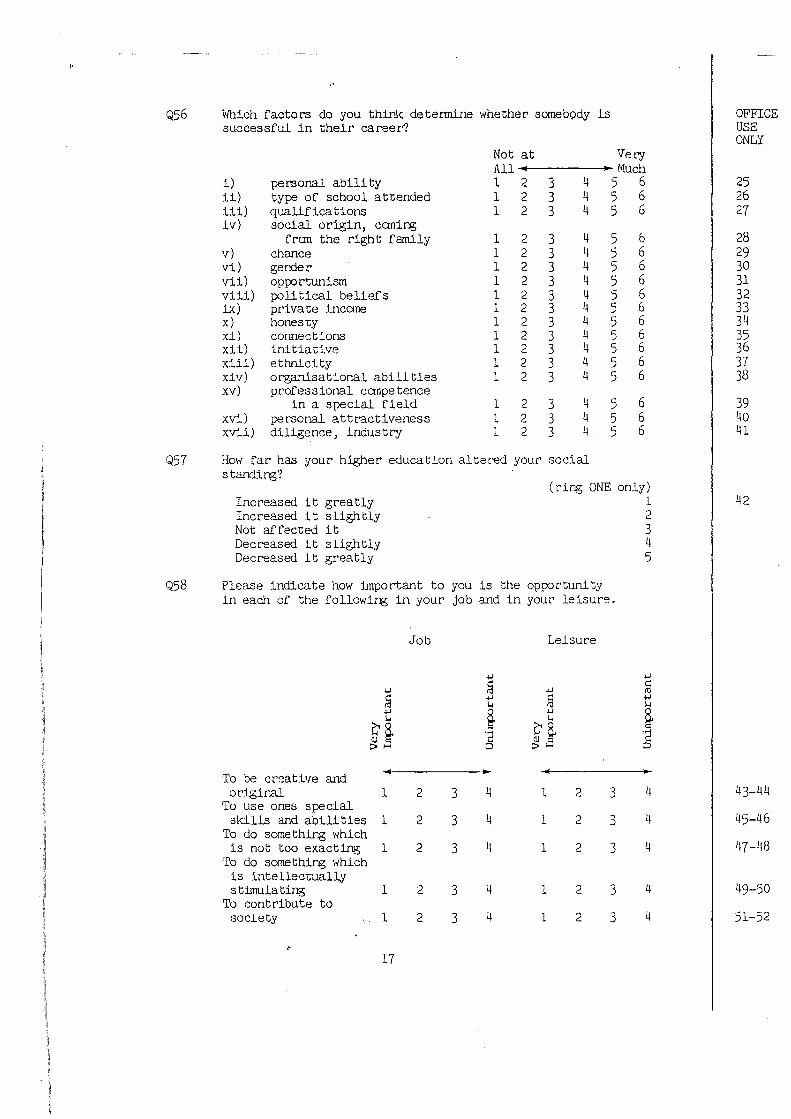
Q56 ifuich factors do you think determine whether someb9dy is
I OFFICE
successful in their career"? USE ONLY
Not at Very All Much
i) personal ability 1 2 3 4 5 6
I 25
ii) type of school attended 1 2 3 4 5 6 26 iii) qualifications 1 2 3 4 5 6 27 iv) social origin, coming
from the right family 1 2 3 4 5 6 28 v) chance 1 2 3 4 5 6 29 vi) gender 1 2 3 4 5 6 30 vii) opportunism 1 2 3 4 5 6 31 viii) political beliefs 1 2 3 4 5 6 32 ix) private income 1 2 3 4 5 6 33 x) honesty 1 2 3 4 5 6 34 xi) connections 1 2 3 4 5 6 35 xii) initiative 1 2 3 4 5 6 36 xiii) ethnicity 1 2 3 4 5 6 37 xiv) organisational abilities 1 2 3 4 5 6 38 xv) professional competence
in a special field 1 2 3 4 5 6
I 39
xvi) personal attractiveness 1 2 3 4 5 6 40 xvi.i) diligence; industry 1 2 3 4 5 6 41
Q57 How far has your higher education altered your social standing?
( ring ONE only) Increased it greatly 1 I 42 Increased it slightly 2 Not affected it 3 Decreased it slightly 4 Decreased it greatly 5
Q58 Please indicate how impor'tant to you is the opr:ortunity in each of the following in your job and in your leisure.
Job Leisure
.!-) .!-)
.!-) ~ .!-) ~ ~
.!-) ~ .!-) ... ...
.!-)
~ .!-) a ... ...
i! ca c:
·a '2 ::J ~~ ::J
To be creative and original 1 2 3 4 1 2 3 4 I 43-44
To use ones special skills and abilities 1 2 3 4 1 2 3 4 I 45-46
To do some thir~ which I is not too exacting 1 2 3 4 1 2 3 4 47-48
To do something which is intellectually stimulating 1 2 3 4 1 2 3 4 I 49-50
To contribute to society 1 2 3 4 1 2 3 4 I 51-52
r
17
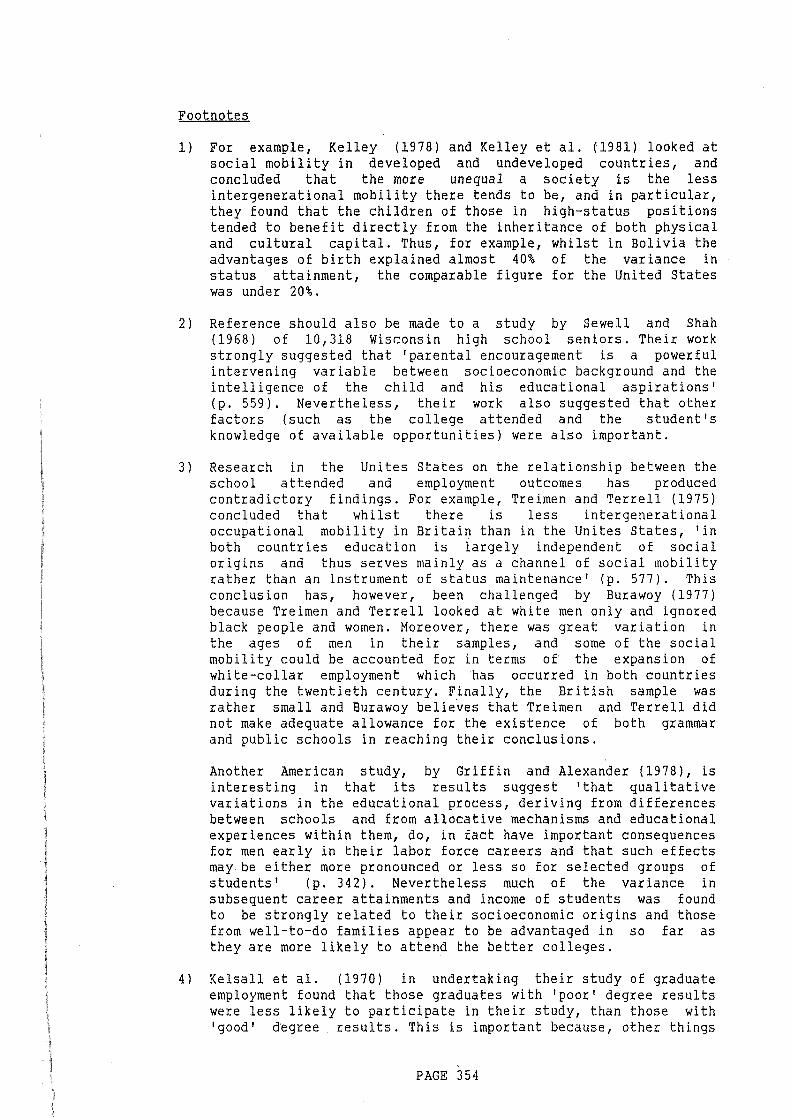
Footnotes
1) For example, Kelley (1978) and Kelley et al. (1981) looked at social mobility in developed and undeveloped countries, and concluded that the more unequal a society is the less intergenerational mobility there tends to be, and in particular, they found that the children of those in high-status positions tended to benefit directly from the inheritance of both physical and cultural capital. Thus, for example, whilst in Bolivia the advantages of birth explained almost 40% of the variance in status attainment, the comparable figure for the United States was under 20%.
2) Reference should also be made to a study by Sewell and Shah (1968) of 10,318 Wisconsin high school seniors. Their work strongly suggested that 'parental encouragement is a powerful intervening variable between socioeconomic background and the intelligence of the child and his educational aspirations' (p. 559). Nevertheless, their work also suggested that other factors (such as the college attended and the student's knowledge of available opportunities) were also important.
3) Research in the Unites States on the relationship between the school attended and employment outcomes has produced contradictory findings. For example, Treimen and Terrell (1975) concluded that whilst there is less intergenerational occupational mobility in Britain than in the Unites States, 'in both countries education is largely independent of social origins and thus serves mainly as a channel of social mobility rather than an instrument of status maintenance' (p. 577). This conclusion has, however, been challenged by Burawoy (1977) because Treimen and Terrell looked at white men only and ignored black people and women. Moreover, there was great variation in the ages of men in their samples, and some of the social mobility could be accounted for in terms of the expansion of white-collar employment which has occurred in both countries during the twentieth century. Finally, the British sample was rather small and Burawoy believes that Treimen and Terrell did not make adequate allowance for the existence of both grammar and public schools in reaching their conclusions.
Another American study, by Griffin and Alexander (1978), is interesting in that its results suggest 'that qualitative variations in the educational process, deriving from differences between schools and from allocative mechanisms and educational experiences within them, do, in fact have important consequences for men early in their labor force careers and that such effects may be either more pronounced or less so for selected groups of students' (p. 342). Nevertheless much of the variance in subsequent career attainments and income of students was found to be strongly related to their socioeconomic origins and those from well-to-do families appear to be advantaged in so far as they are more likely to attend the better colleges.
4) Kelsall et al. (1970) in undertaking their study of graduate employment found that those graduates with 'poor' degree results were less likely to participate in their study, than those with 'good' degree results. This is important because, other things
PAGE 354
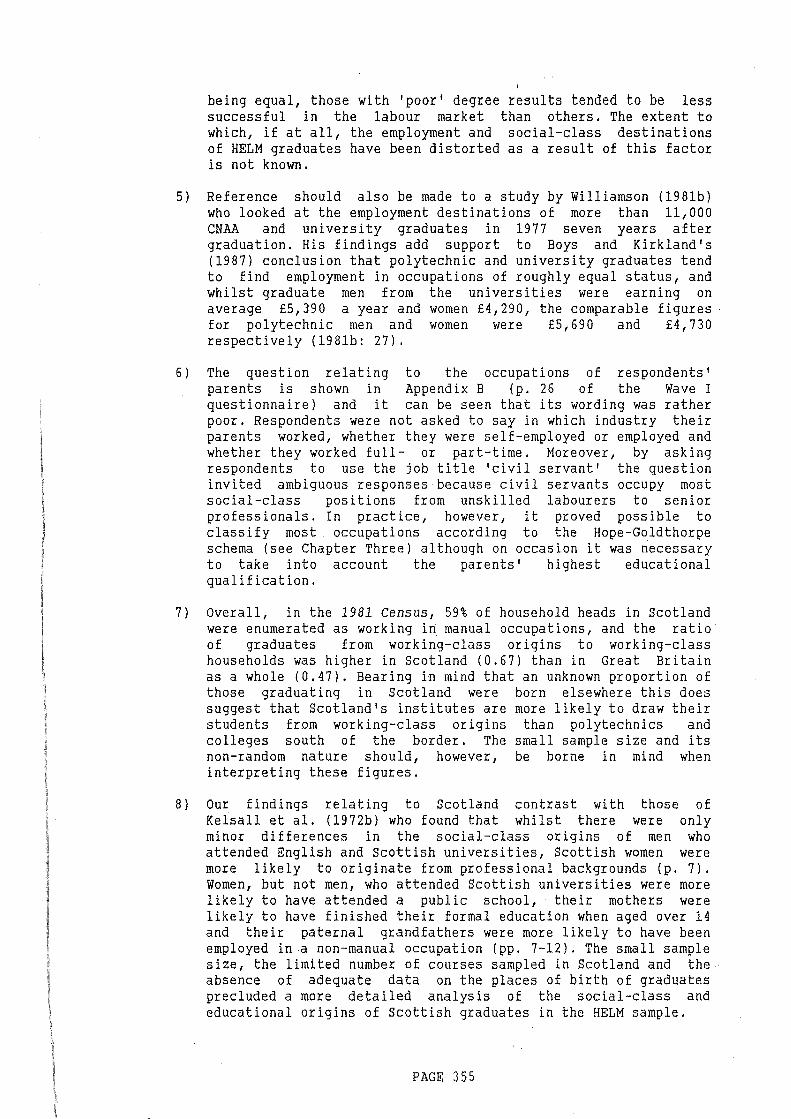
being equal, those with 'poor' degree results tended to be less successful in the labour market than others. The extent to which, if at all, the employment and social-class destinations of HELM graduates have been distorted as a result of this factor is not known.
5) Reference should also be made to a study by Williamson (1981b) who looked at the employment destinations of more than 11,000 CNAA and university graduates in 1977 seven years after graduation. His findings add support to Boys and Kirkland's (1987) conclusion that polytechnic and university graduates tend to find employment in occupations of roughly equal status, and whilst graduate men from the universities were earning on average £5,390 a year and women £4,290, the comparable figures· for polytechnic men and women were £5,690 and £4,730 respectively (1981b: 27).
6) The question relating to the occupations of respondents' parents is shown in Appendix B (p. 26 of the Wave I questionnaire) and it can be seen that its wording was rather poor. Respondents were not asked to say in which industry their parents worked, whether they were self-employed or employed and whether they worked full- or part-time. Moreover, by asking respondents to use the job title 'civil servant' the question invited ambiguous responses because civil servants occupy most social-class positions from unskilled labourers to senior professionals. In practice, however, it proved possible to classify most occupations according to the Hope-Goldthorpe schema (see Chapter Three) although on occasion it was necessary to take into account the parents' highest educational qualification.
7) Overall, in the 1981 Census, 59% of household heads in Scotland were enumerated as working in manual occupations, and the ratio of graduates from working-class origins to working-class households was higher in Scotland (0.67) than in Great Britain as a whole (0.47). Bearing in mind that an unknown proportion of those graduating in Scotland were born elsewhere this does suggest that Scotland's institutes are more likely to draw their students from working-class origins than polytechnics and colleges south of the border. The small sample size and its non-random nature should, however, be borne in mind when interpreting these figures.
8) Our findings relating to Scotland contrast with those of Kelsall et al. (1972b) who found that whilst there were only minor differences in the social-class origins of men who attended English and Scottish universities, Scottish women were more likely to originate from professional backgrounds (p. 7). Women, but not men, who attended Scottish universities were more likely to have attended a public school, their mothers were likely to have finished their formal education when aged over 14 and their paternal grandfathers were more likely to have been employed in a non-manual occupation (pp. 7-12). The small sample size, the limited number of courses sampled in Scotland and the absence of adequate data on the places of birth of graduates precluded a more detailed analysis of the social-class and educational origins of Scottish graduates in the HELM sample.
PAGE 355
BIBLIOGRAPHY
Abbott, J. (1965) 'Students' Social Class in Three Northern Universities', in British Journal of Sociology. Vol. 16.3, pp 206-33
Abbott, J. (1971) Student Life in A Class Society. Oxford: Pergamon.
Abercrombie, N. (1980) Class, Structure and Blackwell.
Knowledge. Oxford:
Abercrombie, N., Hill, S.R., and Turner, B. (1980) The Dominant Ideology Thesis. London: George Allen and Unwin.
Abercrombie, N., and Urry, J. (1983) Capital, Middle Class. London: George Allen and Unwin.
Labour and
Abrahams, P. and Lawthwaite, A. (eds, 1980) Development Diversity: British Conference.
Sociology, 1950-80. Transactions of the
the
and BSA
ACARD (1983) Improving Research Links Between Higher Education and Industry. London: HMSO.
Ahier, J. and Flude, M. (ed., 1983) Contemporary Education Policy. London: Croom Helm.
Albrow, M.C. (1966) 'The Influence of Accommodation Upon 64 Reading University Students', in British Journal of Sociology. Vol. 17.4, pp 403-18.
Allen, S. and Smith, C. (1974) 'Race and Ethnicity in Class Formation: A Comparison of Asian and West Indian Workers', in Parkin op. cit ..
Amsden, A.H. (ed., 1980) The Harmondsworth: Penguin.
Economics of Women and Work.
Anderson, A.C. (1975) 'Expanding Educational Opportunities: Conceptualization and Measurement', in Higher Education. Vol. 4.4, pp 393-408.
Anderson, C.A. (1979) 'Higher Education in Transition: An International Perspective', in Higher Education. Vol. 8.1, pp 3-8.
Arber, s., Dale, A., and Gilbert, G.N. (1986) 'The Limitations of Existing Social-Class Classifications for Women', in Jacoby op. cit ..
Archer, M.S. (1978) Social Origins of Educational Systems. London: Sage.
Archer, M.S. (ed., 1982) The Sociology of Educational Expansion. London: Sage.
PAGE 356
Ardener, S. (ed., 1978) Defining Females. London: Croom Helm.
Armstrong, W.A. (1972) 'The Use of Information About Occupations', in Wrigley, op. cit ..
Arnot, M. (1984) 'How Shall We Educate Our Sons?', in Deem, op. cit ..
Arnot, M. (1986) 'State Education Policy and Girls' Educational Experience', in Beechey, V. and Whitelegg, E. op. cit ..
Arnot, M. and Weiner, G. (1987) Gender and the Politics of Schooling. London: Hutchinson.
Arrow, K.J. (1973) 'Higher Education as a Filter', in Journal of Public Economics. Vol. 2.3, pp. 193-216.
Ashby, E. and Anderson, M. (1970) The Rise of the Student Estate in Britain. London: MacMillan.
Ashton, D.N., and Maguire, M.J., (1980) 'The Function of Academic and Non-Academic Criteria in Employers' Selection Strategies', in British Journal of Guidance and Counselling. Vol. 8.2, pp. 147-57.
Ashton, D.N., and Maguire, M.J., (1981) 'Dual Labour Market Theory and the Organization of Local Labour Markets•, in IJSE. Dept of Sociology, University of Leicester.
Ashton, D.N., Maguire, M.J., and Garland, V. (1982) Youth in the Labour Market. London: DOE.
Ashworth, J.M. (1985) 'Universities and Industry: National and Institutional Perspectives. •, in Oxford Review of Education. Vol. 11.3, pp 235-43.
Bacon, C. Gruneberg, M.M. and Benton, D. (1979) 'Polytechnic and University Students Attitudes to Employment•, in The Vocational Aspect of Education. Vol. 31.78, pp 31-6.
Bacon, C. Gruneberg, M.M. and Benton, D. (1979) 'Employers' Opinions of University and Polytechnic Guidance', in The Vocational Aspect of Education. Vol. 31.80, pp 95-102.
Ball, S.J. (ed., 1984) Comprehensive Schooling: A Reader. London: Falmer.
Ballard, R. and Holden, B. (1975) 'The Employment of Coloured Graduates in Britain', in Braham et al. (1981) op. cit ..
Banks, 0. (1955) Parity and Prestige in English Secondary Education: A Study in Educational Sociology. London: Routledge & Kegan Paul.
Banks, 0. (1968) The Sociology of Education. London: Batsford.
Barker D.L. and Allen, S. (eds., 1976) Dependence and Exploitation in Work and Marriage. London: Longman.
PAGE 357
Barron, R.D. and Norris, G.M. (1976) 'Sexual Divisions and Dual Labour Markets', in Barker and Allen op. cit ..
Baum, A. and Bourner, T. (1970) 'Initial Employment Experiences of Sociology Graduates in the U.K., 1976-80', in The Sociological Review. Vol. 29.2, pp 339-60.
Baxter, c., O'leary, P.J. and Westoby, A. (1977) Economics and Education Policy. London: Longman.
Becher, T., Hewton, E., Parlett, M., Simon 1 H. and Squires, G. (1975) The Drift of Change: An Interim Report of the Group for Research and Innovation in Higher Education. London: The Nuffield Foundation.
Becker, G. (1964) Human Capital: A Theoretical and Empirical Analysis. New York: National Bureau of Economic Research.
Becker, T. and Kogan, M. (1980) Process and Structure in Higher Education. London: Heineman.
Beecham, B.J. (1982) 'The Universities and Technical Education in England and Wales', in Journal of Further and Higher Education. Vol. 6.1, pp 59-74.
Beechey, V. and Whitelegg, E. (eds, 1986) Women in Britain Today. Milton Keynes: Open University Press.
Beechey V. (1986) 'Women's Employment in Contemporary Britain', in Beechey, V. and Whitelegg, E. op. cit ..
Bell, C. and Newby, H. (1976) 'Husbands and Wives', in Barker and Allen op. cit ..
Bell, C. (1979) The Cultural Contradictions of Capitalism. (2nd ed.) London: Heinemann.
Bendix, R. and Lipset, S.M. (eds, 1967) Class, Status and Power: Social Stratification in Comparative Perspective. London: Routledge and Kegan Paul.
Benn, C. and Simon, B. (1972) Hal£ Way There. Harmondsworth: Penguin Books.
Berger P. and Luckmann (1971) The Social Construction of Reality. Harmondsworth: Penguin Books.
Bernbaum, G. and Cook, M. (1984) 'Newly Qualified Graduate Teachers: The Search for Employment', in Journal of Higher and Further Education. Vol. 8.2, pp 32-8.
Berg, I. (1973) Education and Jobs: The Great Training Robbery. Harmondsworth: Penguin.
Bernstein, B. (ed., 1973) Class, Codes and Control: Towards a Theory of Educational Transmission. London: Paladin.
PAGE 358
Bernstein, B. (1973) 'On the Classification and Framing of Educational Knowledge', in Bernstein op. cit ..
Bernstein, B. (1973) 'Class, Codes and Pedagogues: visible and invisible', in Bernstein op. cit ..
Bland, R. (1979) 'Measuring Social Class', in Sociology. Vol. 13.2, pp 283-93.
Blau, P.M. and Duncan, O.D. Structure. New York: Wiley.
(1967) The American Occupational
Blau, P.M., Gustad, J.W., Jessor, R., Parnes, H.S. and Wilcock R.C. (1956) 'Occupational Choice: a Conceptual Framework', in Industrial and Labour Review. Vol. 9.4., pp. 531-43.
Blaug, M. (ed., 1968) The Economics of Education. Harmondsworth: Penguin.
Blaug, M. (1970) An Introduction to the Economics of Education. Harmondsworth: Penguin.
Blaug, M. (1972) 'The Earnings: What Does it pp 53-76.
Correlation Between Signify', in Higher
Higher Education and Education. Vol. 1.1,
Bott, E. (1957) Family and Social Networks. London: Tavistock.
Boudon, R. (19~3) Educational Opportunity and Social Inequality. London: John Wiley.
Bourdieu, P. and Passeron, J.C. (1977) Reproduction in Education, Society and Culture. London: Sage.
Bourner, T. Transbinary Publication.
(1984) Handbook Data Base.
for the Graduate First Destinations London: CNAA Development Services
Bowen, W.G. (1963) 'Assessing the Economic Contribution of Education: An Appraisal of Alternative Approaches', in Robbins op. cit. App. IV, pp 73-96 and Blaug op. cit ..
Bowen, W.G. (1977) Investment in Learning. London: Jossey-Bass.
Bowles, S. (1975) 'Unequal Education and the Reproduction of the Social Division of Labour', in Coxon and Jones, op. cit ..
Bowles, S. and Gintis, H. (1976) Schooling in Capitalist America. London: Routledge and Kegan Paul.
Boys, C.J. (1984) Expectations of Higher Education. Dept of Government, Brunel University.
Boys C.J. and Kirkland J. (1987) Degrees of Success: Career Aspirations and Destinations of a Cohort of College, University and Polytechnic Graduates 1982-5. Dept of Government, Brunel University.
Braham, P., Rhodes, E., and Pearn, M. (eds, 1981) Discrimination and Disadvantage in Employment; The Experience of Black Workers. London: Harper and Row.
PAGE 359
Brandis, W. and Henderson, D. (1970) Social Class, Language and Communication. London: George Allen and Unwin.
Braverman, H.V. (1974) Labour and Monopoly Capital. London: Monthly Review Press.
Brennan, J. (1969) Redbrick University: A Guide for Parents, Sixth Formers, and Students. Bucks: Pergammon.
Brennan, J. (1982) 'Sociologists and Sociological Review. Vol. 30.4, pp 647-67.
Employment', in The
Brennan, J. (1983) Higher Education and Employment: A Typology of Relationships Between Degree Course and Labour Market. London: CNAA Development Services Unit.
Brennan, J. (1984) Preparing Students for Employment. London: CNAA Development Services Unit.
Brennan, J. and McGeever, P. (1985) The Employment of Graduates from Ethnic Minorities. London: CNAA Development Services Unit.
Brennan, J. and McGeever, P. (1987) CNAA Graduates: Their Experiences and Views 12 Months after Graduation. (HELM Working Paper 4) London: CNAA Development Services Unit.
Brennan, J. and McGeever, P. (1986) Graduates at Work: Final Report of a Survey of CNAA Graduates. London: CNAA.
Brennan, J. and McGeever, P. (1988) Graduates at Work: Degree Courses and the Labour Market. London: Jessica Kingsley.
Brennan, J .L. and Weir, S. ( 1980) 'Sociology in the Polytechnics', in Abrahams and Lawthwaite op. cit ..
Britten, N. and Heath, A. (1983) 'Women, Men and Social Class', in Gamarnikow et al., op. cit ..
Brockington, F. and Stein, Z. (1963) 'Admission, Achievement and Social Class', in Universities Quarterly. Vol. 18.1, pp 52-73.
Broom, L. Jones, F.L., McDonnell, P. and Williams, T. (1980) The Inheritance of Inequality. London: Routledge and Kegan Paul.
Brosan, G., Carter, c., Layard, R., Venables, P. and Williams, G. (eds., 1971) Patterns and Policies in Higher Education. Harmondsworth: Penguin.
Brosan, G. (1971) 'The Polytechnic Philosophy' , in Brosan et al., op. cit ..
Brown, C. (1983) 'Ethnic Pluralism in Britain: The Demographic and Legal Background', in Glazer and Young, op. cit ..
Brown, C. (1984) Black and White Britain: The Third PSI Survey. London: Heinmann.
PAGE 360
Brown, R.K. (ed., 1973) Knowledge Education and Cultural Change. London: Tavistock.
Brown, D, and Harrison, M.J. (1980) 'Public Sector Business Degrees: A Context for Sociology', in Abrahams and Lawthwaite op. cit ..
Buley, A.L. (1972) 'Defining the Parameters', in Jevons and Turner op. cit ..
Bulmer, M. (1982) The Survey Method: The Contribution of Surveys to Sociological Explanations. (2nd ed.) London: George Allen and Unwin.
Bulmer, M. (1984) Sociology Research Methods: An (2nd ed.) London: MacMillan.
Introduction.
Burawoy, M. { 19 77) 'Social Structure, Homogenization and "The Process of Status Attainment in the United States and Great Britain"', in American Journal of Sociology. Vol. 82.5, pp. 1031-42.
Burgess, T. (ed., 1972) The Shape of Education. London: Cornmarket Place.
Burgess, T. (1977) Education After School. London: Victor Gollancz.
Burns, T. ( 1980) 'Science and Arts: The Job Gap Widens', in the Employment Gazette. November pp. 1182-4.
Byrne, D.S., Williamson, B. and Fletcher, B.G. (1975) The Poverty of Education: A Study in the Politics of Opportunity. London: Martin Robertson & Co.
Cantor, L.M. and Roberts, I.F. (1969) Further Education in England and Wales. London: Routledge and Kegan Paul.
Cantor, L.M. and Roberts, I.F. (1986) Further Education Today: A Critical Review. London: Routledge and Kegan Paul.
Carline, D., Pissarides, C.A., Siebert, W.S. and Sloane, P.J. (1985) Labour Ecomonmics. London: Longman.
Carlsson, G. (1958) Social Mobility and Class Structure. Lund: Gleerup.
Carnoy, M. Resources', pp 56-81.
(1971) 'Class Analysis and Investment in Review of Radical Political Economics.
in Vol.
Human 3. 4,
Carnoy, M. (1977) Education and Employment: A Critical AppraisQl. UNESCO: International Institute for Education Planning.
Carter, C. (1971) 'Variety and Vision', in Brosan op. cit ..
Carter, C. (1980a) Higher Education: For The Future. Oxford: Basil Blackwell.
Carter, C. (1980b) 'The British University and the State: A Comment', in Higher Education. Vol. 9.1, pp 1-5.
?AGE 361
Carter, R. (1985) Capitalism, Class Conflict and the New Middle Class. London: Routledge and Kegan Paul.
Castles, S. and Kosack, G. (1973) Immigrant Workers and Class Structure in Western Europe. London: Oxford University Press.
Catto, G., Goodchild, D.A. and Hughes, P. (1981) Higher Education and the Employment of Graduates. DOE: Research Paper No. 19.
CERI (1982) The University and Changing Relationships. Centre Innovation. Paris: OECD.
the Community: The Problem of for Educational Research and
Chapman, A. (1986) Men and Women Graduates in the Labour Market: Orientations to work and Experience of Employment One Year after Graduation. HELM Working Paper 6. Stoke.on.Trent: North Staffordshire Polytechnic.
Charlton, K. (1968) 'Polytechnic Education', in International Review of Education. Vol. XIV.l.
Cherry, N. (1975) 'Occupational Values and Employment: A Follow-up Study of Graduate Men and Women.', in Higher Education. Vol 4.3, pp 357-68.
Cicourel, A.V. and Kitsuse, J.I. (1963) The Educational Decision-Makers. New York: Bobbs-Merrill.
Cicourel, A.V. (1964) Method and Measurement in Sociology. London: Collier MacMillan.
Cicourel, A.V. (ed., 1973) Language Use and School Performance. London: Academic Press.
Clarke, C.W. (1946) Farewell Squalor. Hartlepool: William Barlow and Son.
Clarricoates, K. (1980) 'The Importance of Being Earnest ... Emma, Tom ... Jane: The Perception of Categorization of Gender, Conformity and Gender Deviation in Primary Schools', in Deem (ed) op. cit ..
Clifton, R.A., Perry, R.P., Parson, K. and Hryniuk, S. (1986) 'Effects of Ethnicity and Sex on Teachers Expectations of Junior High School Students', in Sociology of Education. Vol. 59.1, pp 58-67.
Cohen, L. (1968) 'Attitude Deterioration Industry' 1 in The Vocational Aspect of Education. Vol. 20.47, pp 181-6.
and the Experience of Secondary and Further
Cohen, L. (1970) 'Sixth-Form Pupils and their Views of Higher Education', the Journal of Curriculum Studies. Vol. 2.1, pp 67-72.
Cohen, P. (1972) 'Subcultural Conflict and the Working Class Community', in Hammersley and Woods op. cit ..
PAGE 362
Coleman, J.S. (1973) 'Equality of Opportunity and Equality of Results', in Harvard Educational Review. Vol. 43.1, pp 129-37.
Collins, R. (1971) 'Functional and Conflict Theories of Educational Stratification', the American Sociological Review. Vol. 36.Dec. pp 1002-19.
Cook, M. and Bernbaum, G. (1983) 'Unemployed Graduates: The Case of Student Teachers', in Employment Gazette, June pp. 223-9.
Combs, P.H. (1970) What is Education Planning? Paris: UNESCO.
eosin, B.R. (ed., 1972) Education: Structure and Society. Harmondsworth: Penguin.
Cotgrove, S.F. (1958) Technical Education and Social Change. London: George Allen and Unwin.
Cotgrove, S. and Box, S. (1970) Science, Industry and Society. London: George Allen and Unwin.
Coulson, M.A. et al (1967) 'Towards A Sociological Theory of Occupational Choice: A Critique', in The Sociological Review. Vol. 15.3, pp. 301-9.
Coxon, A.P.M. and Jones, C.L. (ed., 1975) Social Mobility. Harmondsworth: Penguin.
Coxon, A.P.M. and Jones, C.L. (1978) Images of Occupational Prestige: A Study in Social Cognition. London: MacMillan.
Craig, C. (1963) The Employment of Cambridge Graduates. Cambridge: Cambridge University Press.
Craven, B.M., Dick, B. and Wood, B (1984) 'The British Response of Higher Education to Changing Educational Perspectives', in Economics of Education Review. Vol. 3.4, pp. 279-88
Crimp, M. (1981) The Marketing Research Process. London: Prentice-Hall.
Croft, M. (1983) 'The Participation of Ethnic Minorities in Further and Higher Education', in Educational Research, Vol. 25.1., pp 10-9.
Crompton, R. and Jones, G. (1984) White-Collar Proletariat: Deskilling and Gender in Clerical Work. London: MacMillan.
' Crompton, R. and Mann, M. (eds, 1986) Gender and Stratification. Cambrige; Polity Press.
Crowther Report (1960) 15-18. Education. London: HMSO.
Central Advisory Council for
Dahrendorf, R. (1964) 'Recent Changes in the Class Structure of European Societies', in Daedalus. Vol. 93.1, pp 225-70.
Dale, R. Esland, G. and MacDonald, M. (eds, 1976) Schooling and Capitalism: A Sociological Reader. London: MacDonald.
PAGE 363
Dale, R. Esland, G. and State: Schooling and the Press.
MacDonald, M. (1981) Education and the National Interest. Basingstoke: Falmer
Daniel, W.W. (1968) Racial Discrimination in England. Harmonsworth: Penguin.
Davie, R., Butler, N. and Goldstein, H. (1972) From Birth to Seven. London: Longman.
Davies, B. and Evans, J. (1984) 'Mixed Ability and the Comprehensive School', in Ball op. cit ..
Davies, D.S. (ed., 1972) What Kind o£ Graduates Do We Need? Oxford: Oxford University Press.
Davies, D.S. (1972) 'The Short-Term and the Long-Term', in Davies op. cit ..
Day, D. (ed., 1982) Diversity and Decomposition in the Labour Market. Aldershot: Gower.
Dean, T. (1983) 'Degrees of Success into the Nineties', the Employment Gazette, January, pp 24-5.
Deem, R. (1978) Schooling for Ivomen's lvork. London: Routledge and Kegan Paul.
Deem, R. (ed., 1980) Co-Education Reconsidered. Milton Keynes: Open University Press.
Dennis, N. (1970) People and Planning: The Sociology o£ Housing in Sunderland. London: Faber and Faber.
Dennis, N., Herriques, F.M. and Slaughter, C. (1956) Coal is Our Life. London: Eyre and Spottiswoode.
Dex, S. (1985) The Sexual Division o£ Work. Brighton: Wheatsheaf Books.
Dickson, A. (1979) 'The Curriculum and the Needs of Society', in New Universities Quarterly, Vol. 33.4, pp 437-58.
Dingwell, R. and Lewis, P. (eds, 1983) The Sociology o£ the Professions: Lawyers, Doctors and Others. London: MacMillan.
Doeringer, P.B. and Piore, M.J. (1971) Internal Labour Markets and Manpower Analysis. Lexington: Heath and Company.
Dole, A.A. (1970) 'Stability of Reasons for Going to College', in Journal o£ Educational Research. Vol. 63.8, pp 373-8.
Dolphin, A.M. (1981) 'The Demon for Higher Education', in Employment Gazette, July, pp 302-5.
Donaldson, L. (1971) 'Social Class and the Polytechnics', in Higher Education Review. Vol. 4.1, pp 44-68.
PAGE 364
Donaldson, L. (1975) Policy and the Polytechnic. Hampshire: saxon House.
Douglas, J.W.B. (1964) The Home and School. London: MacGibbon and Kee.
Douglas, J.W.B. and Longitudinal Study of Gibb.
Simpson, H.R. (1968) All Our Future: A Secondary Education. London: Morrison and
Dore, R. (1976) The Diploma Disease: Education, Qualification and Development. London: Unwin.
Drake, M. (1974) The Quantitative Analysis of Historical Data. Milton Keynes: Open University Press.
Draper, A. Effort?', pp 59-63.
(1983) in The
'Is Business Education a Waste Vocational Aspect of Education.
of Vol.
Time and 34.91,
Edgell, s. (1980) Middle-Class Couples. London: George Allen and Unwin.
Edwards, E.G. (1982) Higher Education for Everyone. Nottingham: Spokesman.
Eggleston, J. (1965) 'Secondary Education and Oxford Blues', in British Journal of Sociology. Vol. 16.3, pp 232-41.
Eggleston, J. (1977) The Sociology of the School Curriculum. London: Routledge and Kegan Paul.
Ehrenreich, B. and Ehrenreich, J. (1979) 'The Professional-Managerial Class', in Walker op. cit ..
Employment Gazette (1979) 'Graduates in Road Transport', the Employment Gazette, June, p 568.
Employment Gazette (1980) 'Career Attitudes of Final Year Undergraduates', in Employment Gazette, January, pp 13-5,22.
Entwistle, H. (1970) Education, Work and Leisure. London: Routlegde and Kegan Paul.
Entwistle, H. ( 19 78) Class, Culture and Education. London: Methuen.
Entwistle, N.J. and Wilson, J.D. (1977) Degrees of Excellence: The Academic Achievement Game. London: Hodder and Stoughton.
EOC (1987) Facts That Figure in Equal Opportunities and Education. London: Equal Opportunities Commission.
Ericson, D.P. (1982) 'The Possibility of a General Theory of Educational Systems', in Archer op cit ..
Evans, N. Mcintyre.
(ed., 1980) Education Beyond
PAGE 365 -
School. London: Grant
Erdos, P.L. and Morgan, A.J. (1970) Professional Mail Surveys. New York: McCraw-Hill.
Eysenck, H.J. (1973) The Inequality of Man. London: Temple Smith.
Fagin, L. (1979) 'The Experience of Unemployment', in New Universities Quarterly. Vol. 34.1, pp 48-74.
Faulkner, R.R. (1974) 'Coming of Age in Organizations: A Comparative Study of Career Contingencies and Adult Socialization', in The Sociology of Work and Occupations. No. 1, pp 131-74.
Fidler, J. (1981) The British Business Elite: Its Attitudes to Class, Status and Power. London: Routledge and Kegan Paul.
Finch, J. and Rustin, M. Harmondsworth: Penguin.
(eds, 1986) A Degree of Choice?.
Finn, D.W., Wang, C.K., and Lamb, C.W. (1983) 'An Examination of the Effects of Sample Bias in A Mail Survey', in Journal of the Market Research Society. Vol. 25.4, pp 331-8
Firestone, s. (1972) The Dialectics of Sex. London: Paladin.
Firth, M. (1981) 'Racial Discrimination in Market', in Industrial and Labor Relations pp 265-72.
the Brit ish Review. Vol.
Labour 34.2,
Floud, M. and Ahier, J. (eds, 1974) Educability, Schools and Ideology. London: Croom Helm.
Floud, J and Halsey, A.H. (1956) 'English Secondary Education and the Supply of Labour', in Halsey et al., ( 1961) op. cit ..
Fogarty, M., Allen, A.J ., Allen, I. and Walter, P. (1971) Women in Top Jobs. London: Heineman.
Fogarty, M.P., Rapoport, R. and Rapoport, R.N. (1971) Sex, Career and Family. London: George Allen and Unwin Ltd.
Ford, ·J. (1969) Social Class and the Comprehensive School. London: Routledge and Kegan Paul.
Freeman, R.B. (1971) The Market for College-Trained Manpower: A Study of the Economics of Career Choice. Cambridge, Mass.: Harvard University Press.
Freeman, R.B. (1976) The Over-Educated American. New York: Academic Press.
Freidson, E. (1973) 'Professiona1ization and the Organization of Middle-Class Labour', in Halmos, op. cit ..
Fry, G.W. (1981) 'Degreeism: Disease or Cure?', in Higher Education. Vol. 10.5, pp 517-28.
Fulton, 0. (1984) 'Needs, Expectations and Responses: New Pressures on Higher Education', in Higher Education. Vol. 13.2, pp 193-223.
PAGE 366
Fulton, 0. and Gordon, A. (1979) 'The British Pool of Ability: How Deep and Will Cash Reduce It7', in Education Studies. Vol. 5.2, pp 157-69.
Furneaux, W.D. (1973) 'The Too Few Chosen and the Many that Could be Called', in Halmos op. cit ..
Gallop, R. (1971) 'Value Patterns, Personality and Social Attitudes of Foundation Students at Bournemouth College of Art', in The Vocational Aspect of Education. Vol. 23.54, pp 29-37.
Gamarnikow, E., Morgan, D., Purvis, J. and Taylorson, D. (eds, 1983) Gender, Class and Work. London: Heinemann.
Game, A. and Pringle, R. (1984) Gender at Work. London: Pluto.
Garnsey, E. (1978) 'Women's Work and Theories of Class Stratification', in Sociology, Vol. 12.2, pp 223-43.
Gathorne-Hardy, J. (1977) The Public School Phenomenon. London: Hodder and Stoughton.
Gatley, D.A. (1984) 16-19 Year Olds In Three Northern New Towns: Their Political, Economic and Social Outlooks and Aspirations. Unpublished MPhil Thesis (CNAA). Sunderland: Sunderland Polytechnic.
Gavron, H. (1966) The captive Wife. London: Routledge and Kegan Paul.
Giddens, A. (1980) The Class Structure of Advanced Societies. (2nd ed.) London: Hutchinson & Co.
Gilbert, R. and Richardson, E. (1974) 'Student Evaluation of a Vocational Curriculum', in The Vocational Aspect of Education. Vol. 24.65, pp 105-14.
Ginzberg, E., Ginzberg, S.W., Axelrad, S. and Herma, J.L. (1951) Occupational Choice: An Approach to a General Theory. New York: Columbia University Press.
Glass, D.V. (ed., 1954) Social Routledge and Kegan Paul.
Mobility in Britain. London:
Glass, D.V. and Hall, J.R. (1954) 'Social Mobility in Britain: A Study of Inter-Generational Changes in Status', in Glass op. cit ..
Glaser, B.G. and Strauss, A.L. (1971) Status Routledge and Kegan Paul.
Passage. London:
Glazer, N. and Young, K. Policy: Achieving Equality London: Heinemann.
(ed., 1983) Ethnic Pluralism and Public in the United States and Britain.
Goldthorpe, J.H. (1980) Social Mobility and Class Structure in Modern Britain. Oxford: Clarendon Press.
PAGE 367
Goldthorpe, J.H. (1980) 'Social Mobility and Social Interests', in Goldthorpe op. cit ..
Goldthorpe, J.H. (1983) 'Women and Class Analysis: In Defence of the Conventional View', in Sociology. Vol. 17.4, pp 465-88.
Goldthorpe, J.H. (1984) 'Women and Class Analysis: A Reply to the Replies', in Sociology. Vol. 18.4, pp. 491-99.
Goldthorpe, J.H. and Llewellyn, C. (1977) (1980) 'Class Mobility in Britain: Three Theses Examined', in Sociology (1977). Vol. 11, pp 257-87 and Goldthorpe (1980) op. cit ..
Goldthorpe, J.H., Lockwood, D., The Affluent Worker in the Class University Press.
Bechhofcr, F. and Platt, J. (1969) Structure. Cambridge: Cambridge
Goode, W.J. (1957) 'Community within a Community: The Professions', in American Sociological Review. Vol. 22.Apr., pp 194-200.
Goodson, I.F. (1983) School Subjects and Curriculum Change. London: Croom Helm.
Gordon, A. (1983) 'Attitudes of Employers to the Recruitment of Graduates', in Education Studies. Vol. 9.1, pp 45-64.
Gordon, A, Hutt, R. and Pearson, R. (1985) 'Employer Sponsorship of Undergraduate Engineers: A Student Perspective', in Educational Studies. Vol. 11.3, pp 189-202.
Gordon, D.l1. (1972) Theories of Poverty and Underemployment. London: Lexington.
Gordon, D.l1. (1975) 'Multiple Labour Markets 1 , in Coxon and Jones op. cit ..
Gordon, M.S. (ed., 1974) Higher Education and the Labour Market. Berks: McGraw-Hill.
Gordon, P. (ed., 1981) The Study of the Curriculum. London: Batsford Academic and Education Ltd.
Gouldner, A. (1979) The Future of the Intellectuals and the Rise o£ the New Class. London: MacMillan.
Grace, G. (1978) Teachers, Ideology and Control: A Study in Urban Education. London: Routledge and Kegan Paul.
Greenway, H. and Williams, G. (eds, 1973) Patterns of Change in Graduate Employment. Guildford: SRHE.
Griffin,L.J. and Alexander, K.L. (1978) 'Schooling and Socioeconomic Attainments: High School and College Influences', in American Journal of Sociology. Vol. 84.2, pp 319-47.
Gupta, P. (1977) 'The Educational and Vocational Aspirations of Asian Immigrants and English School-leavers', in British Journal of Sociology. Vol. 28.2, pp 185-98.
PAGE 368
Habermas, J. (1975) Legitimation Crisis. Boston: Beacon Press.
Hakim, C. (1979) Occupational Segregation: A Comparative Study of the Degree and Pattern of the Differentiation between Men and Women's Work in Britain, the United States and other Countries. Research Paper No. 9., London: Department of Employment.
Hakim, C. (1982) Secondary Analysis in Social Research: A Guide to Data Sources and Methods with Examples. London: George Allen and Unwin.
Hales, M. (1980) Living Thinkwork. London: CSE Books.
Hall, J.R. and Glass, D.V. (1954) 'Education and Social Mobility', in Glass op. cit ..
Hall, J.R. (1969) Occupations and the Social Structure. Englewood Cliffs: Prentice-Hall.
Halls, W.D. (1971) International Equivalence in Higher Education. Paris: UNESCO.
Halls, W.D. (1985) 'Universities, the Polity and the Market Place', in Oxford Review of Education. Vol. 11.3, pp 263-69.
Halmos, P. (1970) The Personal Service Society. London: Constable.
Halmos, P. (ed., 1973) Professionalization and Social Change. Sociological Review Monograph No. 2. Keele: University of Keele.
Halsey, A.H. (1958) 'British Universities and Intellectual Life', in Universities Quarterly. Vol. 12.1, pp 141-52.
Halsey, A.H. (1979) 'Are the British Universities Capable of Change?', in New Universities Quarterly. Vol. 33.4, pp 403-16.
Halsey, A.H., Floud, J. and Anderson, C.A. (eds, 1961) Education, Economy and Society. London: Collier-MacMillan.
Halsey, A.H., Heath, A.F. and Ridge, J.M. (1980) Origins and Destinations: Family, Class and Education in Modern Britain. Oxford: Oxford University Press.
Hammersley, M. and Woods, P. (eds, 1976) The Process of Schooling. London: Routledge and Kegan Paul.
Hansgert, P. (1985) 'Students in the Federal Republic of Germany: Diversity in Motives', in Higher Education in Europe. Vol. 20.1, pp 18-29.
Hargreaves, D.H. (1967) Social Relations in a Secondary School. London: Routledge and Kegan Paul.
Hargreaves, D.H. (1982) The Challenge of the Comprehensive School. London: Routledge and Kegan Paul.
PAGE 369
Harris, K. (1982) Teachers and Classes: A Marxist Analysis. London: Routledge and Kegan Paul.
Harrison, B., Pidgeon, M. and Volger, C. (1977) 'The Decision to Enter Higher Edu~ation: The Case of Polytechnic Sociology Students', in Higher Education Research. Vol. 6.4, pp 453-77.
Hartmann, H. (1976) 'Capitalism, Patriarchy and Job Segregation by Sex', in Signs. Vol. 3.2, pp 137-69.
Hartmann, H. (1981) 'The Unhappy Marriage of Marxism and Feminism: Towards a More Progressive Union', in Sargent op. cit ..
Heath, A. (1981) Social Mobility. Glasgow: Fontana.
Heath, A. and Britten, N. (1984) 'Women's Jobs Do Make a Difference: A Reply to Goldthorpe', in Sociology. Vol. 18.4, pp 475-90.
Heim, A.W. (1970) The Appraisal of Intelligence. London: NFER.
Henderson, J., Robins, L., and Wormald, E. (1980) 'Trained for Unemployment: A Note on Passivity Among University Teachers. 1
, in Journal of Further and Higher Education. Vol. 4.2, pp 3-11.
Herriot, P. (1984) Down from the Ivory Tower. Chichester: John Wiley and Sons.
Herriot, P. and Wingate, J. (1984) 'Graduate Pre-Selection: Some Findings and their Guidance Implications', in British Journal of Guidance and Counselling. Vol. 12.2, pp 166-74
Heywood, J. and Monk, J.D. (1977) 'The Education and Career Patterns of Mechanical Engineers in Design and Management', in The Vocational Aspect of Education. Vol. 29.72, pp 5-16.
Higman, M. (1983) 'Has the Milkround Turned Sour?', in Personnel Management. January, pp 2-3.
Hiller, P. (1973) 'Social Reality and Social Stratification', in The Sociological Revie~ Vol. 21.1., pp 77-99.
Himmelweit, H.T. (1954) 'Social Status and Secondary Education Since the 1944 Act', in Glass op. cit ..
Hirsch, F. (1977) Social Limits to Growth. Cambridge Mass: Harward University Press.
Hirst, P.H. (1975) Knowledge and the Curriculum. London: Routledge and Kegan Paul.
HMSO (1981) Higher Education Policy, Funding and Management. HMSO.
in England Outside the Universities: A Consultative Document. London:
Hobsbawn, E. (1969) Industry and Empire. Harmondsworth: Penguin.
PAGE 370
Holloway, B.J. (1972) 'Higher Education and Employment: A View from the Interface', in Jevons and Turner, op. cit ..
Holroyd, P. and Loveridge, D.J. (1978) 'Industry and Higher Education Alternatives', in Stephens and Roderick, op. cit ..
Hooper, R. (ed., 1971) The Curriculum: Context, Design and Development. Edinburgh: Oliver and Boyd.
Hope, K. (ed., 1972) The Analysis of Social Mobility. Clarendon Press.
Oxford:
Hope, K. and Goldthorpe, J.H. (1972) 'Occupational Grading and Occupational Prestige', in Hope, op. cit ..
Hope K. and Goldthorpe, J.H. (1974) The Social Grading of Occupations: A New Approach and Scale. Oxford: Clarendon Press.
Hopper, E. (ed., 1971) Readings in the Theory of Educational Systems. London: Hutchinson.
Hornsby-Smith, M.P. (1971) 'Student Experiences in Industry', The Vocational Aspect of Education. Vol. 23.55, pp 81-9.
Hoselitz, B.F. (1960) Sociological Factors in Economic Development. Glencoe: The Free Press.
Howard, C. and Partners (1986) Schools Fees Research. (Unpublished) London: Financial Strategy Ltd.
Hudson, R. and Johnson, M.R.D. (1976) New Towns in the North East of England. (Unpublished) Durham: University of Durham.
Hughes, E. (1973) Introduction to Education for the Professions of Medicine, Law, Theology and Social Welfare. New York: McGrow Hill.
Hunter, L.C. (1981) 'Employers' Perceptions of Demand', in Lindley, op. cit ..
Hyman, H.H. (1955) Interviewing in Social Research. Chicago: The University of Chicago Press.
Hyman, H.H. (1972) Secondary Analysis of Sample Surveys: Principles, Procedures and Potentialities. New York: John Wiley and Sons.
Illich, I. (1971) Deschooling Society. London: Calder and Boyars.
Irvine, D.H. (1979) 'A Critique of Laycock's, "The Polytechnics and Industry: The Importance of Social Skills"', in Journal of Further and Higher Education. Vol. 3.3, pp 27-30.
Jackson, J. (ed., 1970) Professions and Professionalism. Cambridge: Cambridge University Press.
PAGE 371
Jackson, B. and Marsden, D. (1986) Education and the Working-Class. (ARK 1st ed.) London: ARK.
Jacoby, A. (ed., 1986) The Measurement of Social Class: Some Proceedings from a Social Research Association Seminar on 'Measuring Employment Status and Social Class'. University of Surrey: Social Research Association.
Jahoda, M. (1963) The Education of Technologists: An Exploratory Case Study at Brunel College. London: Tacistock Publications.
James, B.M. (1977) 'Relating Course Design to Occupational Needs', in The Vocational Aspect of Education. Vol. 29.73, pp 59-65.
Jamieson, I. (1982) Schools and Industry. London: Methuen.
Jary, D. (1979) The Development of Sociology in Polytechnics. SIP (Sociology in Polytechnics) Paper.
Jeffcoate, R. (1982) 'Ethnic Minorities and Education Policy 1960-80', in Ethnic Minorities and Education. Open University Course Reader Unit 13. Milton Keynes: Open University Press.
Jencks, C. ( 1972) Inequality. Harmondsworth: Penguin.
Jenkins, R. (1986) Racism and Recruitment: Managers, Organisations and Equal Opportunities in the Labour Market. London: Cambridge University Press.
Jenkinson, A.J. (1980) 'Higher Education in 1981: The Nightmare Crush to Enter the Universities', in TheVocational Aspect of Education. Vol. 22.52, pp 49-51.
Jevons, F.R. and Turner, H.D. (eds, 1972) What Kind of Graduates do we Need? London: Oxford University Press.
Johnson, T. (1977) 'The Professions in the Class Structure', in Sease op. cit ..
Johnson, T.J. (1972) Professions and Power. London: MacMillan.
Johnston, F.J. (1983) 'The Price of Accuracy of Market Research Data', in The Journal of the Market Research Society. Vol. 25.2, pp 121-46.
Jones, J. (1979) 'Students' Views of the Roles of a University', in Higher Education. Vol. 8. pp 513-24.
Joseph, M. (1978) 'Professional Values: A Case Study of Professional Students in a Polytechnic', in Research in Education. No. 19, pp 49-65.
Jowell, R. and Prescott-Clarke, P. (1970) 'Racial Discrimination and White-Collar Workers in Britain', in Race. Vol. 11.4, pp 397-417.
Juster, F.T. (ed., 1975) Education, Income and Human Behaviour. New York: McGraw Hill.
PAGE 372
Kallenberg, A.L. and Sorensen, A.B. (1979) 'The Sociology of Labour Markets', in Annual Review of Sociology. Vol. 5., pp 351-79.
Kahl, J .A. (1975) 'Some Components of Occupational Mobility', in Coxon and Jones op. cit ..
Karabel, J. and Halsey, A.H. (eds, 1977) Power and Ideology in Education. London: Oxford University Press.
Katz, F.M. and Martin, H.W. (1962) 'Career Choices Processes', in Social Forces. Vol. 4.1., pp 149-54. ·
Kelley, J. (1978) 'Wealth and Family Background in the Occupational Career: Theory and Cross Cultural Data', in British Journal of Sociology. Vol. 29.1, pp 94-109.
Kelley, J., Robinson, R.V. and Klein, H.S. (1981) 'A Social Mobility with Data on Status Attainment in Peasant in Treiman and Robinson op. cit ..
Theory of Society',
Kelly, A. (ed., 1981) The Missing Half: Girls and Science Education. Manchester: Manchester University Press.
Kelly, E. (1931) op. cit ..
'Socialization in Patriarchal Society', in Kelly
Kelsall, R.K. (1957) Applications for Admission to Universities. Association of Universities of the British Commonwealth.
Kelsall, R.K. and Kelsall, H.M. (1971) Social Disadvantage and Educational Opportunity. London: Holt, Rinehart and Winston.
Kelsall, K., Kelsall, H.M. and Chisholm, L. (1984) Stratification: An Essay on Class and Inequality. (2nd ed.) London: Longman.
Kelsall, R.K., Poole, A. and Kuhn, A. (1970) Six Years After. Sheffield: The University.
Kelsall, R.K., Poole, A. and Kuhn, A. Sociology o£ an Elite. London: Methuen.
(1972) Graduates: The
Kelsall, R.K., Poole, A. and Kuhn, A. (1972b) Scotland's Graduates. Sheffield: The University.
King, R. and Raynor, J. (1981) The Middle-Class. Essex: Longman.
Kohn, M.L. (1963) 'Social Class and Parent-Child Relationships: An Interpretation', in American Journal of Sociology. Vol. 68.3, pp 471-80.
Kogan, M. and Boys, C.J. (1984) Expectations of Higher Education. (Unpublished) London: Brunel University.
Kogan, M. and Kogan, D. (1983) The Attack on Higher Education. London: Kogan Page.
Konrad, G. and Szelenyi, I. (1979) The Intellectuals on the Road to Class Power. Brighton: Harvester.
PAGE 373
Kreckle, R.K. (1980) 'Unequal Opportunity and Labour Market Segmentation', in Sociology. Vol. 14.4, pp 525-50.
Laboviz, S. (1979) 'The Assignment of Numbers to Rank Order Categories', in American Sociological Review. Vol. 3.3, pp 151-60
Lane, M. (1975) Design for Degrees: New Degree Courses Under the CNAA 1964-74. Basingstoke: MacMillan ..
Larson, M.S. (1977) The Rise of Professionalism: A Sociological Analysis. California: California University Press.
Larson, M.S. (1980) 'Proletarianisation and Educated Labour', in Theory and Society. Vol. 9.1, pp 131-75.
Lawson, J. and Silver, H. (1973) A Social History of Education in England. London: Methuan.
Lawton, D. (1975) Class, Culture and the Curriculum. London: Routledge and Kegan Paul.
Layard, R., King, J. and Moser, C. (ed., 1969) The Robbins. Harmondsworth: Penguin.
Impact of
Laycock, M. (1978) 1 The Polytechnics and Industry: The Importance of Social Skills', in Journal of Further and Higher Education. Vol. 2. 3, pp 72-8 7.
Lee, G.L. (1981) Who Gets to the Top? A Sociological Study of the Business Executive. Alde~shot: Gower.
Levin, H. (1976) 'Educational Opportunity and Social Inequality in Western Europe', in Social Problems. Vol. 24.2, pp 148-72.
Lewenhak, 8. (1980) Women and Work. Glasgow: Fontana.
Lewis, R. and Maude, A (1949) The English Middle-Classes. London: Phoenix House.
Lin, N. (1976) Foundations in Social Research. New York: McGraw-Hill.
Lindley, R. (ed., 1981) Higher Education and the Labour Market. Guildford: SRHE.
Lindley, R. (1981a) 'The Challenge of Market Imperatives', in Lindley, op. cit ..
Lindley, R. (198lb) 'Education, Training and the Labour Market in Britain', in European Journal of Education. Vol 16.1, pp 7-27.
Lipset, S.M. and Bendix, R. (1959) Social Mobility in Industrial Society. Berkeley: University of California Press.
Little, A. (1978) Educational Policies _for Multi-Racial Goldsmith College Inaugural Lecture: University of London.
Areas.
Little, A. and Robbins, D. (1981) 'Race Bias', in Piper op. cit ..
PAGE 374
Little, A. and Westergaard, J. (1964) 'The Trend of Social Class Differentials in Educational Opportunity', in British Journal of Sociology. Vol. 15.4, pp 307-16.
Liversidge, W. (1962) 'Life Chances', in Williams (1974) op. cit ..
Locke, M. and Russel, M. (1982a) Colleges of Higher Education. Chelmsford: NELPCO Commentary 17.
Locke,·M. and Russel, M. (1982b) Colleges of Higher Education: Constraints and Opportunities. Chelmsford: NELPCO Commentary 19.
Lockwood, D. (1958) The Blackcoated Worker. London: Allen and Unwin.
Lynton, E.A. (1984) 'The Economic Impact of Higher Education', in Journal of Higher Education. Vol. 54.6, pp 693-708.
Lyon, E.S. (1988) 'Unequal Opportunities: Black Minorities and Access to Higher Education.' (Forthcoming) Journal of Further and Higher Education. Autumn 1988.
Lyon, E.S. and Gatley, D.A. (1988) Black Graduates and Labour Market Recruitment. HELM Working Paper 5. London: South Bank Polytechnic.
McConnell, T.R. (1973) 'Beyond the Universities: The Movement Towards Mass Higher Education in Britain', in Higher Education. Vol. 2.2, pp 160-71.
McCormick, B.J. (1969) Wages: Harmondsworth: Penguin.
McCormick, K.J. (1977) 'The Political Context of Manpower Forecasting in Britain', in British Journal of Industrial Relations. Vol. 15.3, pp 403-13.
McCormick, K,J. (1982) 'Elite Ideologies in Higher Education: The Development of a Political Perspective on Higher Education in England', in The Sociological Review. Vol. 30.1, pp 45-71.
Mcintosh, N. and Smith, D.J. (1974) The Extent of Racial Discrimination. Harmondsworth: Penguin.
Mackie, L. and Pattulo, P, (1977) Women at Work. London: Tavistock Publications.
Magnusson, 0. (1979a) 'A Survey Education-Employment Relationships', Education. Vol. 14.1, pp 75-80.
of Various in European
Aspects Journal
of of
Magnusson, 0. (1919b) 'Further Aspects of the Education-Employment Relationship: Youth Unemployment and Education', in European Journal of Education. Vol. 14.3, p 258.
Marris, P. (1964) The Experience of Higher Education. London: Routledge and Kegan Paul.
Marsh, C. ( 1984) 'Problems with Sociology: Method or Epistemology?', in Bulmer op. cit ..
PAGE 375
Marsh, C. (1986) 'Occupationally-Based Measures of Social Class', in Jacoby op. cit •.
Marwick, A. (1980) Class Images and Reality. London: Collins.
Matterson, A. Administration Longman.
(1981) Polytechnics and Colleges: Control and in the Public Sector of Higher Education. Harlow:
Mayhew, L.B. and Ford, P.J. (1974) Reform in Graduate and Professional Education. London: Jossey-Bass Publishers.
Middleton, C. (1974) 'Sexual Inequality and Stratification Theory', in Parkin op. cit ..
Miles, R. and Phizacklea, A. (eds, 1979) Racism and Political Action in Britain. London: Routledge and Kegan Paul.
Miller, S.M. (1956) 'The Concept and Measurement of Mobility', in Coxon and Jones (1975) op. cit ..
Millerson, G. (1964) 'Dilemmas of Professionalism', in New Society. Vol. 4.June, p 15.
Millet, K. (1970) Sexual Politics. New York: Doubleday.
Mingat, A. and Elcher, J.C. (1982) 'Higher Education and Employment Markets in France', in Higher Education. Vol. 11.2, pp 211-20.
Montagna, P.D. (1977) Occupations and Society. New York: Wiley.
Moodie, G.C. and Eustace, R. (1974) Power and Authority in British Universities. London: George Allen and Unwin.
Morrison, A. and Mcintyre, D. (1971) Schools and Socialization. Harmondsworth: Penguin.
Mortimore, J. and Blackstone, T. (1982) Disadvantage and Education. London: Heinemann.
Moser, C.A. (1958) Survey Methods in Social Investigation. London: Heinemann.
Moser, C.A. and Layard, P.R.G. (1968) 'Estimating the Need for Qualified Manpower in Britain', in Blaug, op. cit ..
Musgrave, P.W. (1967) 'Towards a Sociological Theory of Occupational Choice', in The Sociological Review Vol. 15.1, pp 33-46.
Musgrove, F. (1967) 'Social Class and Levels of Aspiration in a Technological University', in The Sociological Review. Vol. 15.3, pp 311-22.
Musgrove, F. (1979) Schools and the Social Order. Chichester: John Wiley and Sons.
Nachmias, D. and Nachmias, C. (1976) Research Methods in Social Investigation. London: Edward Arnold.
PAGE 376
Nash, P. (1973) Classrooms Observed. London: Routledge and Kegan Paul.
Neave, G. (1976) Patterns of Inequality: Structures in European Higher Education Educational Opportunity. Slough: NFER.
The Influence of New upon the Equality of
Neave, G. (1979) 'Academic Drift: Some Views from Europe', in Studies in Higher Education. Vol. 4.2, pp 143-59.
Neave, G. (1982) 'On the Edge of the Abyss: an Overview of Recent Developments in European Higher Education', in European Journal of Education. Vol. 17.2, pp 123-44.
Newmark, P. (1982) 'The English Public Schools: A Reckoning', in New Universities Quarterly. Vol. 36.3, pp 263-79.
Newson Report (1963) Half Our Future. London: Ministry of Education.
Niessen, M and Pescnar, J (eds, 1982) Comparative Research in Education. Oxford: Pergamon.
Niblet Report (1957) Report of the Sub-Committee on Halls of Residence. London: University Grants Commission.
Noble, T. (1974) 'Intergenerational Mobility in Britain: A Criticism of the Counterbalance Theory', in Sociology. Vol. 8.3, pp 475-83.
Navarra, V. (1980) Women's Work Men's Work: The Ambivalence of Equality. London: Marion Boyars.
O'Donnell, C. (1984) 'The Relationship Between Women's Education and their Allocation to the Labour Market', in Studies in Higher Education. Vol. 9.1, pp 59-72.
Oatley, M. (1970) 'The Economics of Training', in The British Journal of Industrial Relations. March.
OECD (1971) Development of Higher Education: 1950-67. Paris: OECD.
OECD (1974a) Participatory Planning in Education. Paris: OECD.
OECD (1974b) Policies for Higher Education. Paris: OECD.
OECD (1974c) Towards Mass Higher Education. Paris: OECD.
OECD (1986) Girls and Women in Education. Paris: OECD.
Okely, J. (1978) 'Privileged, Schooled and Finished', in Ardener op. cit..
Oppenheimer, M. (1973) 'The Proletarianization of the Professions', in Halmos op. cit ..
Over, R .. (1986) 'Early Career Patterns of Men and Women in British Universities', in Higher Education. Vol. 13.2, pp 321-31.
PAGE 377
Oxtoby, R. Polytechnic pp 84-95.
( 1971) 'Educational and Students', in Universities
Vocational Quarterly.
Objectives of Vol. 26.1,
Page, C.F. and Yates, M, (eds, 1976) Power and Authority in Higher Education. Guildford: SRHE.
Parker, S. (1971) The Future of Work and Leisure. London: MacGibbon and Kee.
Parkin, F. (1971) Class, Inequality and Political Order. London: MacGibbon and Kee.
Parkin, F. (ed., 1974) The Social Analysis of Class Structure. London: Tavistock.
Parkin, F. (1979) Marxism and Class Theory: A Bourgeois Critique. New York: Columbia University Press.
Parry, N. and Parry J. (1976) The Rise of the Medical Professions: A Study of Collective Social Mobility. London: Croom Helm.
Parry, N. and Parry J. ( 19 77) 'Social Closure and Mobility', in Sease, op. cit ..
Collective
Pavalko, R. (1971) Sociology of Occupations and Professions. Illinois: Peacock.
Peaker, G.F. (1971) 'The Regression Analysis the National Survey', in Plowden op. cit., Vol. 2, App 4.
Pearson, R. (1976) Qualified Institute of Manpower Studies.
Manpower in Employment. Sussex:
Pellegrin, J.P. (1974) 'Quantitative Trends in Post Education', in OECD, op. cit ..
Secondary
Perucci, R. (1973) 'In the Service of Man', in Halmos, op. cit ..
Peston, M. (1981) 'Higher Education Policy', in Lindley, op. cit ..
Phelan, T.J. and Phelan, J.C. (1983) 'Higher Education and Early Life Outcomes', in Higher Education. Vol. 12.6, pp 665-80.
Phelps-Brown, E.H. (1977) The Inequality of Pay. London: Oxford University Press.
Phizacklea, A. and Miles, R. (1980) Labour and Racism. London: Routledge and Kegan Paul.
Piachaud, D. (1975) 'The Economics of Educational Opportunity', in Higher Education Vol. 4.2, pp 201-12.
Piper, D.W. (ed., 1981) Is Higher Education Fair? Guildford: SRHE.
PAGE 378
Piper, D.W. (ed., 1984) Is Higher Education Fair to Women? Gui1dford: SRHE.
Plowden Report (1967) Children and their Primary Schools: A Report of the Central Advisory Council for Education (England). London: HMSO.
Porter, B. (1975) The Lion's Share: A Short History of British Imperialism. London: Longman.
Poulantzas, N. (1975) Classes in Contemporary Capitalism. London: New Left Books.
Powell, J.P. (1973) 'Vocational Training and the Universities', in Universities Quarterly. Vol. 27.2, pp 223-34
Pratt, J. and Burgess, T. (1974) The Polytechnics: A Report. Bath: Pitman.
Premfors, R. (1980) 'Higher Education as a Political Issue Area: A Comparative View of France, Sweden and the United Kingdom', in Higher Education. Vol. 9.3, pp 325-44.
Price, T.K. (1972) 'The Curriculum Process - with Special Reference to Business Studies', in The Vocational Aspect of Education. Vol. 24.59, pp 119-22.
Psacharopoulos, G. (1980) 'Education Planning and the Labour Market', in European Journal of Education. Vol 15.2, pp 201-21.
Rampton Committee (1981) West Indian Children in our Schools. London: HMSO Cmnd. 8273.
Randall, E. (1977) 'Career and Subject Choice: 16-19', in The Vocational Aspect of Education. Vol. 29.72, pp 17-21.
Rapoport, R. and Rapoport, R.N. (eds, 1978) Working Couples. London: Routledge and Kegan Paul.
Reader, W.J. Classes in Nicholson.
(1966) Professional Men: The Rise of the Professional Nineteenth-Century England. London: Weidenfield and
Reich, M., Gordon, D.M. and Edwards, R.C. (1973) 'Dual Markets', in American Economic Review: Papers and Proceedings. 63.2, pp 359-65.
Labour Vol.
Reid, E. (1980) 'Young People and Employment (1): Employers' Use of Educational Qualifications', in Education Policy Bulletin. Vol. 8.1., pp 49-64.
Reid, I. (1977) Social Class Differences in Britain. London: Open Books.
Reid, I and Wormald, E. (eds., 1982) Sex Differences in Britain. London: Gr~nt Mcintyre.
Reid, W.A. (1972) The University and the Sixth Form Curriculum. London: MacMillan.
PAGE 379
Rex, J. (1973) Race, Colonialism and the City. London: Routledge and Kegan Paul.
Rex, J. (1986) Race and Ethnicity. Milton Keynes: Open University Press.
Rex, J. and Tomlinson, S. (1979) Colonial Immigrants in a British City: A Class Analysis. London: Routledge and Kegan Paul.
Richards, M.A. (1977) 'Predicting Sixth Formers' Choice of Education', The Vocational Aspect of Education. Vol. pp 113-17.
Richardson, C.J. (1977) Contemporary Social Frances Pinter.
Mobility.
Higher 29.74,
London:
Ritzer, G. (1972) Man and His Work: Conflict and Change. New York: Appleton-Century-Crofts.
Robbins, Lord (1963) Committee on Higher Education: Report (Cmnd. 2154). London: HMSO.
Robbins, Lord (1980) Higher Education Revisited. London: MacMillan.
Roberts, B.C., Loveridge, R. and Gennard, J. (1972) Reluctant Militants. London: Heinemann Educational Books.
Roberts, H.A. (1914) Careers for University Men. London: MacMillan.
Roberts, K. (1978) The Working Class. London: Longman.
Roberts, K., Cook, F.G., Clark, S.C. & Semeonoff, E. (1977) The Fragmentary Class Structure. London: Heinmann.
Robinson, E. (1968) The New Polytechnics. Harmondsworth: Penguin.
Roizen, J. and Jepson, M. (1985) Degrees for Jobs: Employers Expectations of Higher Education. Guildford: SRHE and NFER-Nelson.
Rosenberg, M. (1957) Occupations and Values. New York: Free Press.
Rosenthal, R. and Jacobson, L. (1968) Pygmalion in the Classroom: Teacher Expectations and Pupil's Intellectual Development. New York: Holt, Rinehart and Winston.
Roth, D.R. (1973) 'Intelligence Testing as a Social Activity', in Cicourel, op. cit ..
Routh, G. (1980) Occupation and Pay in Great Britain 1906-79. (2nd ed.) London: MacMillan.
Rowbottom, S. (1973) Women's Consciousness: Men's World. Harmondsworth: Pelican.
Rubery, J. (1980) 'Structured Labour Markets, Worker Organization and Low Pay', in Amsden op. cit ..
Rubin, I.S. (1979) 'Retrenchment, Loose Structure and Adaptability in the University', in Sociology of Education. Vol. 52.4, pp 211-22.
PAGE 380
Rubinstein, D. (ed., 1979) Education and Equality. Cambridge: Harper and Row.
Rudd, E. (1975) The Highest Education: A Study of Graduate Employment in Britain. London: Routledge and Kegan Paul.
Ruechemeyer, D. (1964) 'Doctors and Lawyers: A Comment on the Theory of the Professions', in Canadian Review of Sociology and Anthropology. Vol.1, pp 17-30.
Rutter, M. and Madge, N. (1976) Cycles of Disadvantage. London: Heinemann.
Saks, M. (1983) 'Removing the Blinkers? A Contributions to the Sociology of the Sociological Review. Vol. 31.1, pp 1-22.
Critique of Professions',
Recent in The
Salaman, G. (1972) Stratification and Social Class (D283lll (9-1)). Milton Keynes: Open University Press.
Salter, B. and Tapper, T. (1978) Education and the Political Order. London: MacMillan.
Sanderson, M. (1972) The Universities and British Industry. London: Routledge and Kegan Paul.
Sargent, L. (ed., 1981) The Unhappy Marriage o£ Marxism and Feminism: A Debate on Class and Patriarchy. London: Pluto Press.
Sease, R. (ed., 1977) Industrial Society: Class C~eavage & Control. London: George Allen and Unwin.
Scholefield, D.A. (1980) Arts Graduates: Five Years On. Higher Education Authority.
Dublin:
Schultz, T. (1971) Investment in Human Capital: The Role of Education and of Research. New York: MacMillan.
Scott, N. (1979) 'Graduate Supply and Demand', in Employment Gazette. February, pp 17-20.
Scott, N. (1980) 'Graduate Supply and Demand in 1980', in Employment Gazette. February, pp 133-5.
Scott, N. (1981) 'Graduate Supply and Demand in 1981', in Employment Gazette. February, pp 69-70.
Scott, N. (1983) 'Graduate Supply and Demand in 1983' 1 in Employment Gazette. February 1 pp 57-60.
Scott, P. (1984) The Crisis o£ the University. London: Croom Heim.
Sear, K. (1983) 'The Correlation Between A-level Grades and Degree Results in England', in Higher Education. Vol. 12.5, pp 609-19.
PAGE 381
Seidman, R.H. (1982) 'The Logic of Behavioural Principles of Educational Systems: Social Independence and Dependence', in Archer op. cit ..
Sewell, W.H. and Shah, V.P. (1968) 'Social Class, Parental Encouragement, and Educational Aspirations', in American Journal of Sociology. Vol. 73., pp 559-72.
Shattock, M.L. (1982) 'How Should British Universities Plan for the 1980s', in Higher Education. Vol. 11.2, pp 193-210.
Shipman, M. (1971) 'Curriculum for Inequality', in Hooper op. cit ..
Short, E. (1971) Education in a Changing World. London: Pitman and Son.
Silberston, D. (1960) Residence and Technical Education. London: Willian Clowes and Sons.
Silver, H. (ed., 1973) Equal Opportunity in Education. Norfolk: Cox and Wyman.
Silverstone, R. and Ward, A. (eds, 1980) Careers of Professional Women. London: Croom Helm.
Sizer, J. (1982) 'Assessing Institutional Performance', in Wagner op. cit.. ·
Sloane, P.J. (ed., 1980) Women and Low Pay. London: MacMillan.
Small, R. (1984) 'The Concept of Polytechnic Education', in British Journal of Higher Education. Vol. 32.1, pp 27-43.
Smith, D.J. (1977) Racial Disadvantage in Britain: The PEP Report. Harmondsworth: Penguin.
Smith, H.L. (1986) 'Overeducation and Underemployment: An Agnostic Approach', in Sociology of Education. Vol. 59.2, pp 85-99.
Smithers, A. (1975) 'Some Similarities and Differences in the Occupational Values of Male and Female Students', in The Vocational Aspect of Education. Vol. 27.66, pp 17-20.
Snow, G. (1959) The Public School in the New Age. London Bliss.
Geoffrey
Solomon, L.C. and Tauban, P.J. (eds, 1973) Does College Matter? New York: Academic Press.
Sorokin, P.A. (1927) Social Mobility. New York: Harper and Brothers.
Speakman, M.A. (1983) 'Class and Gender', in Current Controversies in Class and Stratification Theory. (Sociology Block 2.13). Milton Keynes: Open University.
Spencer, A. and Podmore, D. (eds, 1987) In a Man's World: Essays on Women in Male-Dominated Professions. London: Tavistock Publications.
Squires, G. (1983) Innovation Through Recession. Guildford: SRHE.
PAGE 382
Stanworth, P. and Giddens, A. {ed., 1974) Elites and Power in British Society. Cambridge: Cambridge Universality Press.
Stanworth, M. {1983) Gender and Schooling: A Study of Sexual Divisions in the Classroom. London: Hutchinson and Co ..
Startup, R. and Birks, R.S. {1975) 'Student's Views of the University and the Polytechnic', in The Vocational Aspect of Education. Vol 27.66, pp 37-40.
Stephans, M.D. and Roderick, G. Alternatives. London: Longman.
{eds, 1978) Higher Education
Stevans, S.S. {1946) 'On the Theory of Scales of Measurement', in Science. Vol. 103, pp 677-80.
Stevenson, T.H.C. {1928) 'The Vital Statistics of Wealth and Poverty', in Journal of the Royal Statistical Association. Vol. 91, pp 207-30.
Stewart, A., Prandy, K, and Blackburn, R.M. {1980) Social Stratification and Occupations. London: MacMillan.
Stone, J. (1985) Racial Conflict in Contemporary Society. London: Fontana.
Stone 1 M. (1981) The Education of the Black Child in Britain. Glasgow: Fontana.
Stoney, S.M. (1984) 'Careers Guidance in Colleges and Polytechnics' 1
in Educational Research. Vol. 26.3 1 pp 189-99.
Super 1 D.E. (1953) 'A Theory of Vocational Development', in American Psychologist, Vol. 8. 1 pp 185-90.
Tapper, T. and Salter, B. (1978) Education and the Political Order. London: MacMillan.
Tarsh, J. (1982) 'The Labour Market for New Graduates', in Employment Gazette. May, pp 205-15.
Tarsh, J. (1984) 'Graduate Shortages in Science and Engineering', in Employment Gazette. August, pp 354-60.
Taubman, P. and Wales, T. {1974) Higher Education as an Investment and a Screening Device. New York: McGraw-Hill.
Taylor, G. and Ayres, N. (1970) Born and Bred Unequal. Bucks: Longman ..
Taylor, J. (1984) 'The Unemployment of University Graduates', in Research in Education. Vol. 31.1, pp 11-24.
Taylor, J. (1986) 'The Employability of University Graduates', in Studies in Higher Education. Vol. 11.1 pp 17-25.
Taylor; M. (1983) 'Ordinal and Interval Scaling', in Journal of the Market Research Society. Vol. 25.4, pp 297-303.
PAGE 383
Taylor, w. (1969) Society and the Education of Teachers. London: Faber and Faber.
Teichler, U., Hartung, D. and Nuthmann, R. (1980) Higher Education and the Needs of Society. Windsor: NFER.
Thomas, B. and Creedy, B. (eds, 1982) The Economics of the Labour Market. London: Butterworth Scientific.
Thurow, L.C. (1972) 'Education and Economic Equality', in The Public Interest. Vol. 28.2, pp 66-81.
Thurow, L.C. (1976) Generating Inequality. London: MacMillan.
Tomlinson, S. (1983) Ethnic Minorities in British Schools: A Review of the Literature 1960-80. London: Heinemann.
Townsend, P. (1979) Poverty in the United Kingdom: A Survey of Household Resources and Standards of Living. Harmondsworth: Penguin.
Treiman, D.J. and Terrell, K. (1975) 'The Process of Status Attainment in the United States and Great Britain', in American Journal of Sociology. Vol. 81.3, pp 563-83.
Treiman, D.J. and Robinson, R.V. (ed., 1981) Research in Social Stratification and Mobility, Vol. I. Los Angeles: JAI Press.
Trow, M. (1970) 'Reflections on the Transition from Mass to Universal Higher Education', in Daedalus. Vol 90.1, pp 1-42.
Truscot, B. (1946) The First Year at University: A Freshman's Guide. London: Faber and Faber.
Truscot, B. (1951) The Red Brick University. Harmondsworth: Pelican.
Turner, G. (1963) The Car-Makers. London: Eyre and Spottiswoods.
Turner, J.D. and Rushton, J. (1976) Education for the Professions. Manchester: Manchester University Press.
Turner, R.H. (1960) 'Sponsored and Contest Mobility and the School System', in American Sociological Review. Vol. 25.1., pp 855-67.
Tyler, W. (1977) The Sociology of Educational Inequality. London: Methuen.
Vaizey, J.E. (1972) The Political Economy of Education. London: Duckworth.
Wagner, L. (ed., 1982) Agenda for Institutional Change in Higher Education. Guildford: SRHE.
Wagner, L. (1982·) 'The Challenge of Change', in Wagner op. cit ..
Wakeford, J (1969) The Cloiste.red Elite: A Sociological Analysis of the English Public Boarding School. London: -MacMillan.·
PAGE 384
Walby, S. (1986a) 'Gender, Class and Structure', in Crompton and Mann op. cit ..
Walby, s. (198Gb} 'Gender, Class and Stratification: Towards a New Approach', in Crompton and Mann op. cit ..
Walker, P. (ed., 1979} Between Capital and Labour. Pennsylvania: Harvester.
Waller, W. (1932} The Sociology of Teaching. New York: Wiley.
Wasser, H. (ed., 1978) Economics of Higher Education: A Comparative Perspective of Policy and Dilemma. New York: City University of New York.
Waterson, G. (1984) 'Continuing Professional Education: A Challenge for the Eighties', in Journal of Further and Higher Education. Vol. 8.1, pp 60-7.
Watts, A.G. (1972) Diversity and Change in Higher Education. London: Routledge and Kegan Paul.
Welsh, J.M. (1982) 'Improving the Supervision of Postgraduate Students', in Research in Education. No. 27., pp 1-8.
West, J. (ed., 1982) Work, Women and the Labour Market. London: Routledge and Kegan Paul.
Westley, M.A. and Westley, M.W. Montreal: McGill-Queens University.
(1972) The Emerging Worker.
Westergaard, J. and Resler, H. (1975) Class in a Capitalist Society: A Study of Contemporary Britain. London: Heinemann.
Whiston, T.G. (ed., 1979) The Uses and Abuses of London: MacMillan.
Forecasting.
Whitley, E.D. (1985) 'The Case for Postal Research', in Journal of the Market Research Society. Vol. 27.1, pp 5-13.
Whitburn, J., Mealing, M. and Cox, C. (1976) People in Polytechnics. Guildford: SRHE.
Whitehead, L. and Williamson, P. (1980) 'On the Way Up: An Analysis of First Jobs from the Early Careers Survey of Graduates', in Employment Gazette. May, pp 472-7.
Whitfield, K. (1982) 'Professional Labour Markets', in Thomas and Creedy op. cit ..
White Paper (1966} A Plan· for Polytechnics (Cmnd. 3006}. London: HMSO.
White Paper (1987) Higher Education: Meeting the Challenge (Cmd 114}. London: HMSO.
PAGE 385
Willer, D. and Webster, M. (1969) 'Theoretical Constructs and Observables', in American Sociological Review. Vol. 34.5, pp 748-57·.
Williams, G. (1973) 'The Economics of the Graduate Labour Market', in Greenway and Williams op. cit ..
Williams, G., Blackstone, T. and Metcalf, D. (1974) The Academic Labour Market. Amsterdam: Elsvier.
Williams, G. and Gordon, A. (1975) '16 and 19 Year Olds: Attitudes to Education', in Higher Education Bulletin. Vol. 4.1, pp 23-37.
Williams, M.M. (ed., 1974) Occupational Choice. London: George Allen and Unwin.
Williamson, B. (1979) Education, Social Structure and Development. London: MacMillan.
Williamson, B. (1981) 'Class Bias', in Piper op. cit ..
Williamson, B. (1986) 'Who Has Access?', in Finch and Rustin, op. cit ..
Williamson, P. (1981b) Early Careers of 1970 Graduates. London: Dept of Employment Research Unit.
Williamson, P. (198lc) 'Careers of Graduates Earnings and Unemployment', in Employment Gazette. May, pp 220-2.
Williamson, P. and Whitehead, L. (1980) 'Moving Around in the Room at the Top: Early Careers of Graduates -Their Latest Jobs', in Employment Gazette June, pp 622-7.
Williams, W.M. (ed., 1974) Occupational Choice. London: George Allen and Unwin.
Willis, P.E. (1977) Learning to Labour: How Working-Class Kids get Working-Class Jobs. Hants: Saxon House.
Willis-Jackson Committee (1957) The Supply and Training for Technical Colleges: Report of a Special Committee. London: HMSO
Willmott, P and Young, M. (1957) Family and Kinship in East London. London: Routledge and Kegan Paul.
Wilson, B.R. (ed., 1975) Education, Equality and Society. London: George Allen and Unwin.
Wolfenden,J. (1957) Directory of Opportunities for School Leavers. London: Cornmarket Press.
Wolpe, A.M. and Donald, J. (eds, 1983) Is There Anyone There from Education? Education After Thatcher. London: Pluto Press.
Wolter, W. (1984) 'Contemporary Approaches to the Planning of Higher Education', in Higher Education in Europe. Vol. 91.1, pp 21-24.
PAGE 386
Wright, E.O. (1976) 'Class Boundaries in Advanced Societies', in New Left Review. Vol 98.1, pp 31-41.
Wright, E.O. (1978) Class, Crisis and the State. London: New Left Books.
Wrigley, E.A. (1972) Nineteenth-Century of Quantitative Methods for the Study of Cambridge University Press.
Society: Essays in the Use Social Data. Cambridge:
Young, I. (1981) 'Beyond the Unhappy Marriage: A Critique of Dual Class Systems Theory', in Sargent op. cit ..
Young, M. (1961) The Rise of Meritocracy. Harmondsworth: Pelican.
Young, M. and Whitty, G. (eds, 1977) Society, State and Schooling. Sussex: The Falmer Press.
Young, M. (ed., 1971) Knowledge and Control: New Directions for the Sociology of Education. London: Collier MacMillan.
Zacune, J., Gatley, D.A. and Jary, D. (1986) CNAA Graduates Two Years After Graduation: Preliminary Report on Wave 2. London: CNAA.
Zweig, F. (1961) The Heinemann.
Worker in an Affluent Society. London:
PAGE 387