The influence of environmental factors on the abundance and recruitment of the sand crab Emerita...
12
The influence of environmental factors on the abundance and recruitment of the sand crab Emerita analoga (Stimpson 1857): Sourceesink dynamics? R. Veas a, b , E. Hernández-Miranda b, * , R.A. Quiñones a, b, c , E. Díaz-Cabrera b , J.M. Rojas d, e , J.M. Fariña d a Programa de Postgrados en Oceanografía, Departamento de Oceanografía, Casilla 160-C, Universidad de Concepción, Concepción, Chile b Programa de Investigación Marina de Excelencia (PIMEX), Facultad de Ciencias Naturales y Oceanográficas, Universidad de Concepción, Concepción, Chile c Interdisciplinary Center for Aquaculture Research (INCAR), Casilla 160-C, Universidad de Concepción, Concepción, Chile d Departamento de Ecología, Pontificia Universidad Católica de Chile, Santiago, Chile e Centro de Investigación e Innovación para el Cambio Climático (CIICC), Universidad Santo Tomás, Santiago, Chile article info Article history: Received 9 January 2013 Received in revised form 8 April 2013 Accepted 18 April 2013 Keywords: Sandy beach Seasonality Life history Larval supply Settlement Connectivity abstract The sandcrab Emerita analoga is the dominant species inhabiting sandy beaches along the Pacific coast of the American continent. In our study, 10 sandy beaches were sampled seasonally from 2006 to 2011, including coastal planktonic sampling from 2006 to 2008. Two major population cores were detected, the first one in the northern part of the study area and the second in the area immediately to the south of the Itata River mouth. Zoeal stages were found along the entire coastal zone. Highest densities and recruitment were found during spring and summer of each year. PLS regression indicated that sourceesink habitat proxies correlated positively with morphodynamic parameters; while beach slope and total organic matter were negatively correlated. These results agree with the sourceesink hypothesis, finding higher densities of adults, recruits and cohort recurrence on open coast beaches with milder physical dynamics. Furthermore, a hypoxic event and a mega-earthquake/tsunami negatively affected recruitment at the inter-annual scale. Ó 2013 Elsevier Ltd. All rights reserved. 1. Introduction Sandy beaches are dynamic environments, whose physical structure has been characterized by the interaction of three principal factors: tides, waves and sand type (McLachlan and Brown, 2006). The interaction between the tide regime, wave regime and sediment type produce morphodynamic gradients ranging from reflective microtidal beaches with narrow and steep slopes to wide and flat macrotidal dissipative beaches (Short, 1996, 1999). The abundance and species composition of macro- invertebrates living on sandy beaches is highly determined by geomorphologic structures, as well as other environmental factors such as the presence of fresh water streams, rivers and effluents reaching the coastal area (Lercari and Defeo, 1999; Celentano et al., 2010). Spatially sandy beaches occur in discrete units along the coast, and even neighboring beaches may be of different morphodynamic types. This type of heterogeneity may facilitate sourceesink dynamics in macroinvertebrate populations inhab- iting this kind of environment (Caddy and Defeo, 2003; Defeo and McLachlan, 2005). Kawecki (2008) defined a demographic source as a habitat where emigration on average exceeds immigration, and the number of births exceeds the number of deaths; by contrast, a demographic sink is a habitat in which immigration on average exceeds emigration and the number of deaths exceeds the number of births. According to this conceptual framework, pop- ulations living in source habitats (or high quality resource areas) should have reproductive rates that exceed their mortality rate, allowing migration to other habitats, defined in this regards as sinks (or poor quality resource areas). Population persistence in sink habitats depends on e and is determined by e migration from source habitats (Kawecki, 2008). At the population level, the Habitat Harshness Hypothesis (HHH, Defeo et al., 2003) predicts that the severe environment of reflective beaches will induce organisms to invest more energy in maintenance than in reproduction and growth, resulting in lower abundance, fecundity, growth and survival compared with * Corresponding author. E-mail address: [email protected] (E. Hernández-Miranda). Contents lists available at SciVerse ScienceDirect Marine Environmental Research journal homepage: www.elsevier.com/locate/marenvrev 0141-1136/$ e see front matter Ó 2013 Elsevier Ltd. All rights reserved. http://dx.doi.org/10.1016/j.marenvres.2013.04.004 Marine Environmental Research 89 (2013) 9e20
Transcript of The influence of environmental factors on the abundance and recruitment of the sand crab Emerita...
at SciVerse ScienceDirect
Marine Environmental Research 89 (2013) 9e20
Contents lists available
Marine Environmental Research
journal homepage: www.elsevier .com/locate/marenvrev
The influence of environmental factors on the abundance andrecruitment of the sand crab Emerita analoga (Stimpson 1857):Sourceesink dynamics?
R. Veas a,b, E. Hernández-Miranda b,*, R.A. Quiñones a,b,c, E. Díaz-Cabrera b, J.M. Rojas d,e,J.M. Fariña d
a Programa de Postgrados en Oceanografía, Departamento de Oceanografía, Casilla 160-C, Universidad de Concepción, Concepción, Chileb Programa de Investigación Marina de Excelencia (PIMEX), Facultad de Ciencias Naturales y Oceanográficas, Universidad de Concepción, Concepción, Chilec Interdisciplinary Center for Aquaculture Research (INCAR), Casilla 160-C, Universidad de Concepción, Concepción, ChiledDepartamento de Ecología, Pontificia Universidad Católica de Chile, Santiago, ChileeCentro de Investigación e Innovación para el Cambio Climático (CIICC), Universidad Santo Tomás, Santiago, Chile
a r t i c l e i n f o
Article history:Received 9 January 2013Received in revised form8 April 2013Accepted 18 April 2013
Keywords:Sandy beachSeasonalityLife historyLarval supplySettlementConnectivity
* Corresponding author.E-mail address: [email protected] (E. Hernán
0141-1136/$ e see front matter � 2013 Elsevier Ltd. Ahttp://dx.doi.org/10.1016/j.marenvres.2013.04.004
a b s t r a c t
The sandcrab Emerita analoga is the dominant species inhabiting sandy beaches along the Pacific coast ofthe American continent. In our study, 10 sandy beaches were sampled seasonally from 2006 to 2011,including coastal planktonic sampling from 2006 to 2008. Twomajor population cores were detected, thefirst one in the northern part of the study area and the second in the area immediately to the south of theItata Rivermouth. Zoeal stageswere found along the entire coastal zone. Highest densities and recruitmentwere found during spring and summer of each year. PLS regression indicated that sourceesink habitatproxies correlated positively with morphodynamic parameters; while beach slope and total organicmatter were negatively correlated. These results agree with the sourceesink hypothesis, finding higherdensities of adults, recruits and cohort recurrence on open coast beaches with milder physical dynamics.Furthermore, a hypoxic event and a mega-earthquake/tsunami negatively affected recruitment at theinter-annual scale.
� 2013 Elsevier Ltd. All rights reserved.
1. Introduction
Sandy beaches are dynamic environments, whose physicalstructure has been characterized by the interaction of threeprincipal factors: tides, waves and sand type (McLachlan andBrown, 2006). The interaction between the tide regime, waveregime and sediment type produce morphodynamic gradientsranging from reflective microtidal beaches with narrow and steepslopes to wide and flat macrotidal dissipative beaches (Short,1996, 1999). The abundance and species composition of macro-invertebrates living on sandy beaches is highly determined bygeomorphologic structures, as well as other environmental factorssuch as the presence of fresh water streams, rivers and effluentsreaching the coastal area (Lercari and Defeo, 1999; Celentanoet al., 2010). Spatially sandy beaches occur in discrete unitsalong the coast, and even neighboring beaches may be of different
dez-Miranda).
ll rights reserved.
morphodynamic types. This type of heterogeneity may facilitatesourceesink dynamics in macroinvertebrate populations inhab-iting this kind of environment (Caddy and Defeo, 2003; Defeo andMcLachlan, 2005). Kawecki (2008) defined a demographic sourceas a habitat where emigration on average exceeds immigration,and the number of births exceeds the number of deaths; bycontrast, a demographic sink is a habitat in which immigration onaverage exceeds emigration and the number of deaths exceeds thenumber of births. According to this conceptual framework, pop-ulations living in source habitats (or high quality resource areas)should have reproductive rates that exceed their mortality rate,allowing migration to other habitats, defined in this regards assinks (or poor quality resource areas). Population persistence insink habitats depends on e and is determined by e migrationfrom source habitats (Kawecki, 2008).
At the population level, the Habitat Harshness Hypothesis(HHH, Defeo et al., 2003) predicts that the severe environment ofreflective beaches will induce organisms to invest more energy inmaintenance than in reproduction and growth, resulting in lowerabundance, fecundity, growth and survival compared with
73 72.9 72.8 72.7
Longitude (°W)
36.6
36.5
36.4
36.3
36.2
36.1
Lat
itude
(°S
)
Cobquecura
Itata river
Coliumo Bay
Pacific Ocean
X
Z
Y
AB
C
DEF
G
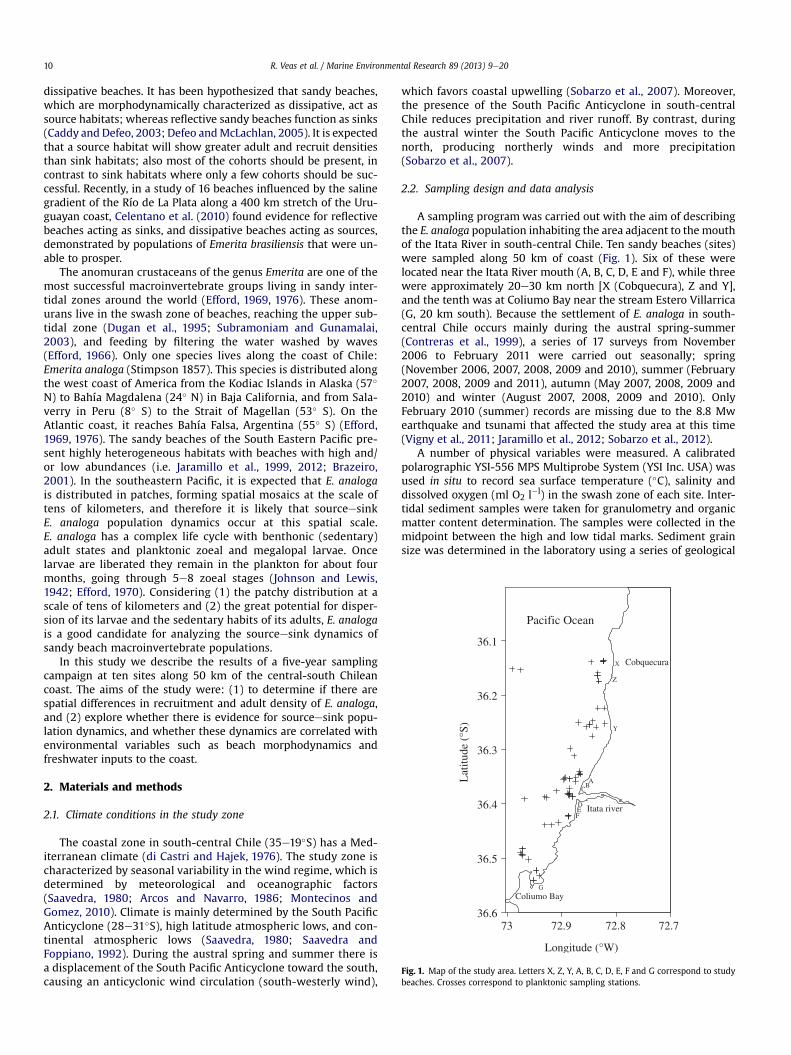
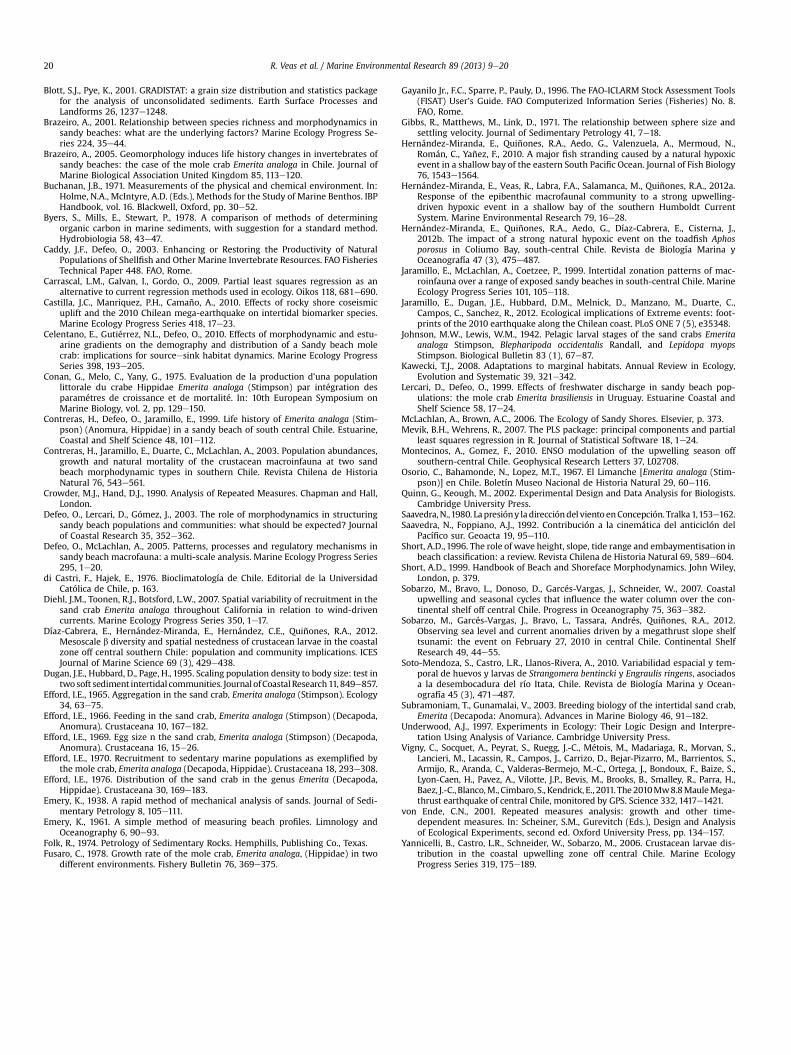
Fig. 1. Map of the study area. Letters X, Z, Y, A, B, C, D, E, F and G correspond to studybeaches. Crosses correspond to planktonic sampling stations.
R. Veas et al. / Marine Environmental Research 89 (2013) 9e2010
dissipative beaches. It has been hypothesized that sandy beaches,which are morphodynamically characterized as dissipative, act assource habitats; whereas reflective sandy beaches function as sinks(Caddy and Defeo, 2003; Defeo andMcLachlan, 2005). It is expectedthat a source habitat will show greater adult and recruit densitiesthan sink habitats; also most of the cohorts should be present, incontrast to sink habitats where only a few cohorts should be suc-cessful. Recently, in a study of 16 beaches influenced by the salinegradient of the Río de La Plata along a 400 km stretch of the Uru-guayan coast, Celentano et al. (2010) found evidence for reflectivebeaches acting as sinks, and dissipative beaches acting as sources,demonstrated by populations of Emerita brasiliensis that were un-able to prosper.
The anomuran crustaceans of the genus Emerita are one of themost successful macroinvertebrate groups living in sandy inter-tidal zones around the world (Efford, 1969, 1976). These anom-urans live in the swash zone of beaches, reaching the upper sub-tidal zone (Dugan et al., 1995; Subramoniam and Gunamalai,2003), and feeding by filtering the water washed by waves(Efford, 1966). Only one species lives along the coast of Chile:Emerita analoga (Stimpson 1857). This species is distributed alongthe west coast of America from the Kodiac Islands in Alaska (57�
N) to Bahía Magdalena (24� N) in Baja California, and from Sala-verry in Peru (8� S) to the Strait of Magellan (53� S). On theAtlantic coast, it reaches Bahía Falsa, Argentina (55� S) (Efford,1969, 1976). The sandy beaches of the South Eastern Pacific pre-sent highly heterogeneous habitats with beaches with high and/or low abundances (i.e. Jaramillo et al., 1999, 2012; Brazeiro,2001). In the southeastern Pacific, it is expected that E. analogais distributed in patches, forming spatial mosaics at the scale oftens of kilometers, and therefore it is likely that sourceesinkE. analoga population dynamics occur at this spatial scale.E. analoga has a complex life cycle with benthonic (sedentary)adult states and planktonic zoeal and megalopal larvae. Oncelarvae are liberated they remain in the plankton for about fourmonths, going through 5e8 zoeal stages (Johnson and Lewis,1942; Efford, 1970). Considering (1) the patchy distribution at ascale of tens of kilometers and (2) the great potential for disper-sion of its larvae and the sedentary habits of its adults, E. analogais a good candidate for analyzing the sourceesink dynamics ofsandy beach macroinvertebrate populations.
In this study we describe the results of a five-year samplingcampaign at ten sites along 50 km of the central-south Chileancoast. The aims of the study were: (1) to determine if there arespatial differences in recruitment and adult density of E. analoga,and (2) explore whether there is evidence for sourceesink popu-lation dynamics, and whether these dynamics are correlated withenvironmental variables such as beach morphodynamics andfreshwater inputs to the coast.
2. Materials and methods
2.1. Climate conditions in the study zone
The coastal zone in south-central Chile (35e19�S) has a Med-iterranean climate (di Castri and Hajek, 1976). The study zone ischaracterized by seasonal variability in the wind regime, which isdetermined by meteorological and oceanographic factors(Saavedra, 1980; Arcos and Navarro, 1986; Montecinos andGomez, 2010). Climate is mainly determined by the South PacificAnticyclone (28e31�S), high latitude atmospheric lows, and con-tinental atmospheric lows (Saavedra, 1980; Saavedra andFoppiano, 1992). During the austral spring and summer there isa displacement of the South Pacific Anticyclone toward the south,causing an anticyclonic wind circulation (south-westerly wind),
which favors coastal upwelling (Sobarzo et al., 2007). Moreover,the presence of the South Pacific Anticyclone in south-centralChile reduces precipitation and river runoff. By contrast, duringthe austral winter the South Pacific Anticyclone moves to thenorth, producing northerly winds and more precipitation(Sobarzo et al., 2007).
2.2. Sampling design and data analysis
A sampling program was carried out with the aim of describingthe E. analoga population inhabiting the area adjacent to the mouthof the Itata River in south-central Chile. Ten sandy beaches (sites)were sampled along 50 km of coast (Fig. 1). Six of these werelocated near the Itata River mouth (A, B, C, D, E and F), while threewere approximately 20e30 km north [X (Cobquecura), Z and Y],and the tenth was at Coliumo Bay near the stream Estero Villarrica(G, 20 km south). Because the settlement of E. analoga in south-central Chile occurs mainly during the austral spring-summer(Contreras et al., 1999), a series of 17 surveys from November2006 to February 2011 were carried out seasonally; spring(November 2006, 2007, 2008, 2009 and 2010), summer (February2007, 2008, 2009 and 2011), autumn (May 2007, 2008, 2009 and2010) and winter (August 2007, 2008, 2009 and 2010). OnlyFebruary 2010 (summer) records are missing due to the 8.8 Mwearthquake and tsunami that affected the study area at this time(Vigny et al., 2011; Jaramillo et al., 2012; Sobarzo et al., 2012).
A number of physical variables were measured. A calibratedpolarographic YSI-556 MPS Multiprobe System (YSI Inc. USA) wasused in situ to record sea surface temperature (�C), salinity anddissolved oxygen (ml O2 l�l) in the swash zone of each site. Inter-tidal sediment samples were taken for granulometry and organicmatter content determination. The samples were collected in themidpoint between the high and low tidal marks. Sediment grainsize was determined in the laboratory using a series of geological
R. Veas et al. / Marine Environmental Research 89 (2013) 9e20 11
sieves (from 2 mm to 63 mm mesh) (Buchanan, 1971). Mean grainsize was calculated by the moment method using the GRADISTATsoftware (Blott and Pye, 2001), and the results were expressed on aphi scale (Folk, 1974). Total organic matter (TOM) was calculated asthe percentage loss in dry sediment weight after combustion at550 �C for 4 h (Byers et al., 1978). Sand fall velocity (Ws) wasdirectly measured using settling tubes (Emery, 1938; Gibbs et al.,1971). In the field, wave period (Tb) was estimated as the time in-terval between consecutive breaking waves, and breaker height(Hb) was estimated bymeasuring the height of breakingwaveswithgraduated poles against the horizon (e.g. Contreras et al., 2003;Brazeiro, 2005). Beach slope (Sb) was measured by the Emerymethod (Emery, 1961); this variable can be used as a proxy of thephysical dynamics of beaches. Estimates of breaker height (Hb),wave period (Tb), and sand fall velocity (Ws) were used to calculateDean’s parameter (U), an index of the morphodynamic state of thebeach, according to:
U ¼ HbWs � Tb
The Dean index (U) is a measure of how reflective or dissipativea beach is. If U < 2 the beach is considered reflective, if U > 5 thebeach is dissipative, and 2 < U < 5 describes a wide range of in-termediate beach states (Short, 1996; Defeo and McLachlan, 2005).In order to test temporal and spatial differences in the environ-mental variables mentioned above, a two-way analysis of variancewas performed, with sites (beaches) and time (sampling dates) asfactors. When significant differences were found a Tukey HSD posthoc comparison was also carried out for testing differences amongparticular sites and times.
Sampling of E. analoga was performed under daylight low tideconditions by sampling at each site using four transects perpen-dicular to the coastline, separated by 100 m, running from thelower to the higher tide mark. Along each transect, ten sampleswere taken with a cylindrical PVC corer of 63.6 cm2 and 15 cmdepth. During each survey a total of 400 samples were collected (40from each location). Collected samples were sieved at 0.5 mmmeshsize, conserved in 8% formaldehyde, and dyed with Rose Bengalsolution to facilitate the sorting of the individuals. In the laboratorysampled individuals were sorted, characterized as recruits or adults(using their body sizes, see below) and counted. Density (total,recruits, and adults), standardized as the number of individuals persquare meter (ind./m2), was determined by pooling all the samplesfrom each transect and averaging the four transects of each sam-pling area. To test temporal and spatial differences in recruitmentand adult density, a two-way repeated measures analysis of vari-ance (RM ANOVA) was performed using the log (xþ 1) transformeddata (Underwood, 1997; von Ende, 2001). Time was the within-subject factor and “sites” (beaches) the between subject factor,including the time � site interaction. For ANOVA the four transectssampled at each site in every sampling date were considered asreplicates. The assumptions of normality and variance homogene-ity were tested by residual plots and sphericity was tested using theMauchly test. Since in both cases (total and recruit density) thesphericity assumption was not fulfilled, Greenhouse-Geisser,Huynh-Feldt and Lower-bound corrections were applied(Crowder and Hand, 1990; Quinn and Keough, 2002). Tukey HSDpost hoc comparisons were also carried out for testing differencesamong particular sampling areas and dates.
Additionally, cephalothorax length (CL, mm) was measured inall individuals collected. Brazeiro (2005) and Diehl et al. (2007),described that E. analoga recruits at 3e4 mm CL. However, duringour 3 month inter-sampling period, individuals should have grownnear 8 mm on average (Osorio et al., 1967; Fusaro, 1978); we thus
classified individuals under 8mm as recruits, and individuals largerthan 8 mm as adults (juveniles and sexually mature adults). Withthis information, a global size frequency distribution (SFD) wasbuilt for each beach to visualize the size structure representative ofthe entire study period, grouped into 1mm size classes and poolingthe entire sampling time series together. To identify the cohortspresented in each SFD, the normal components were separated bythe NORMSEP routine included in the FISAT software package(Gayanilo et al., 1996). Also an index of recurrence of size classes(IRSC) was calculated for each beach (Caddy and Defeo, 2003;Celentano et al., 2010), according to:
IRSC ¼ Ni
NT
where Ni represents the ith size class on a beach and NT the totalnumber of size classes observed on all sampled beaches. This indexranges from 0 to 1 (1 corresponds to all size classes present).
Given that a source habitat is expected to showgreater adult andrecruit densities than sink habitats, most cohorts should be present.In contrast, in sink habitats only a few cohorts should be successful.Therefore, the negative exponential curve of total density versussize classes should have a greater determination coefficient (r2) insource than in sink habitats, because of the higher recruitment andnumber of cohorts in source habitats. For these reasons, to assesswhether a particular beach meets the characteristics of a source orsink habitat, four proxies were utilized for each beach: a) totaldensity, b) recruit density, c) index of size class recurrence (IRSC),and d) determination coefficient of the adjusted negative expo-nential curve of total density, as a function of relative time (sizeclasses).
To assess the relations among the four proxies of sourceesinkhabitat and environmental variables, a partial least squares (PLS)regression model was computed in Minitab v.15. PLS is a statisticalanalysis techniquewhich is especially suitable for dealing with datain which the number of samples is small compared to the numberof variables, and also when data displays co-linearity among vari-ables (Mevik and Wehrens, 2007; Carrascal et al., 2009). PLSregression is adequate for testing our hypothesis because it allowsrelating multiple dependent variables (sourceesink proxies) tomultiple independent variables (environmental variables) at thesame time. The number of PLS components to be included in themodel was determined by a jackknife procedure, running PLS asmany times as there were observations in the data set, leaving outone observation at a time for each run. The resulting weights ofeach PLS component can be utilized as an indicator of howimportant a variable is for explaining the variance of the PLScomponent; the higher the weight, the greater the importance ofthe variable.
Additionally, zooplankton sampling was carried out to obtainan estimation of larval supply in the coastal study area. Sevenresearch cruises were conducted between May 2006 andFebruary 2008 on board RVs “KayeKay” or “KayeKay II” (Uni-versidad de Concepción, Chile). The surveys were planned tocover both summer and winter conditions, and from Cobquecurato Coliumo Bay, especially three areas; Itata Mouth, North ItataRiver, and South Itata River (Fig. 1). In each area four samplingstations were allocated at random. Sampling was done in thecoastal zone up to five nautical miles offshore. A linear distanceof 50 km and a total area of 400 km2 were sampled (see alsoDíaz-Cabrera et al., 2012). The larvae were collected with a bongonet of 60 cm mouth diameter and 300 mm mesh size. To estimatethe volume of water filtered, the net was equipped with a cali-brated Hydrobios flowmeter. At each sampling station, obliquetows were made throughout the upper 15 m of the water
0
500
1000
1500
2000
2500
3000 X
0
2000
4000
6000
8000 A
0
400
800
1200
1600
2000 B
0
100
200
300 C
0
4000
8000
12000
16000 Z
0
500
1000
1500
2000
2500 D
0
2000
4000
6000
8000 E
0
2000
4000
6000 F
0
400
800
1200
1600 G
Den
sity
(ind
m-2
)
0
500
1000
1500
2000 Y
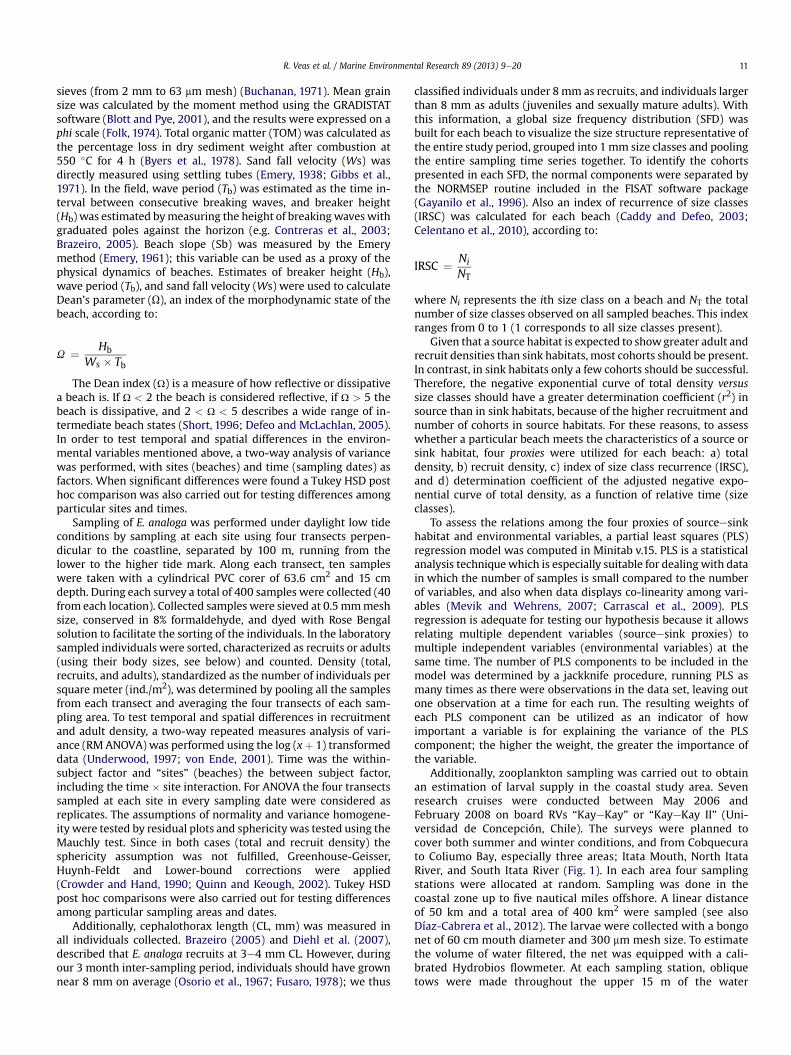
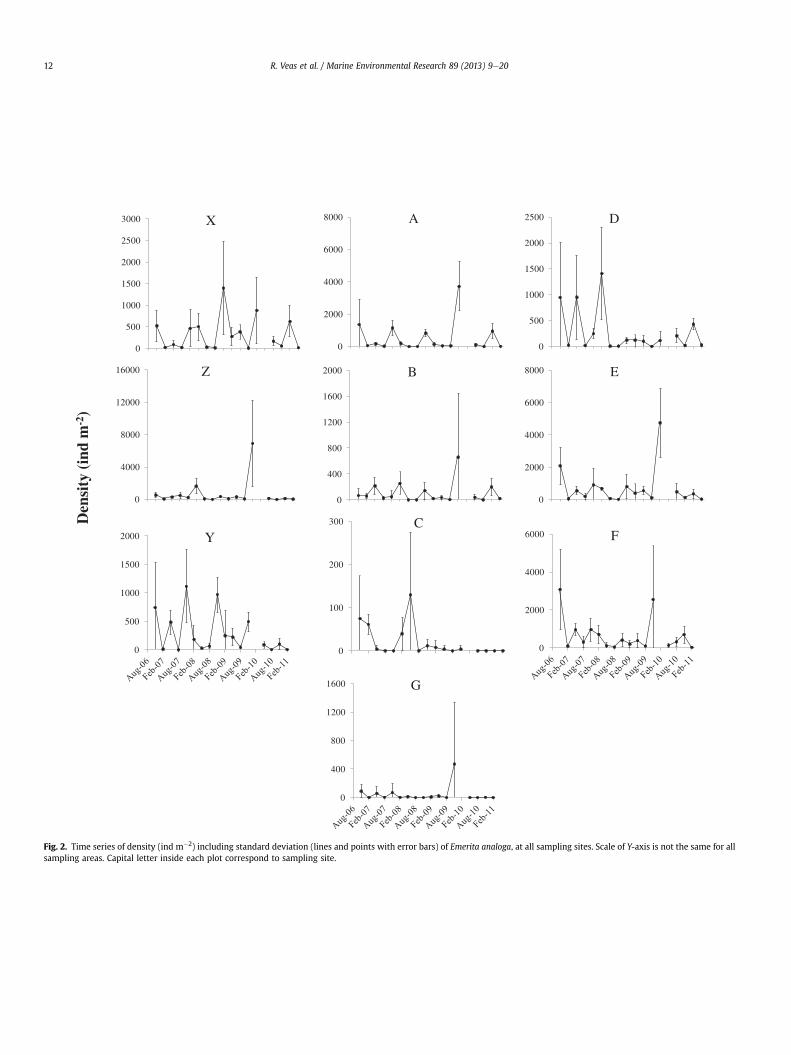
Fig. 2. Time series of density (ind m�2) including standard deviation (lines and points with error bars) of Emerita analoga, at all sampling sites. Scale of Y-axis is not the same for allsampling areas. Capital letter inside each plot correspond to sampling site.
R. Veas et al. / Marine Environmental Research 89 (2013) 9e2012
0
20
40
60
80
100 X
0
20
40
60
80
100 Z
0
20
40
60
80
100 D
0
20
40
60
80
100 E
0
20
40
60
80
100 F
Rel
ativ
e A
bund
ance
of
Rec
ruit
s (%
)
0
20
40
60
80
100 A
0
20
40
60
80
100 B
0
20
40
60
80
100 C
0
20
40
60
80
100 G
0
20
40
60
80
100 Y
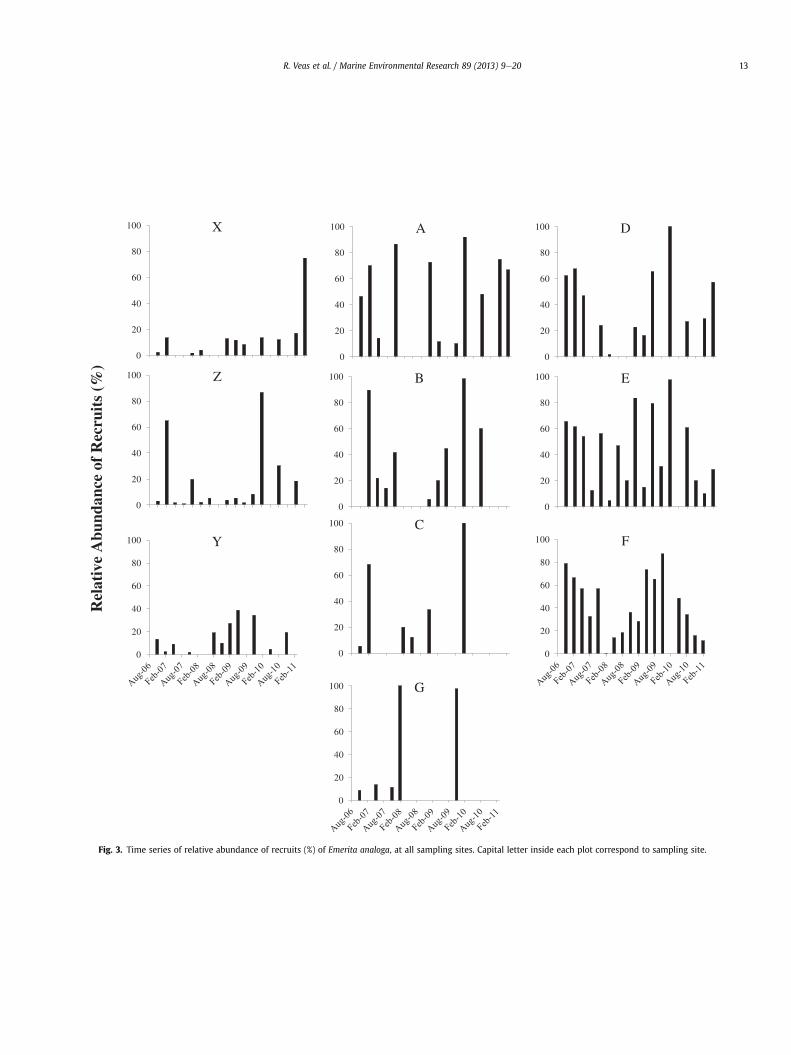
Fig. 3. Time series of relative abundance of recruits (%) of Emerita analoga, at all sampling sites. Capital letter inside each plot correspond to sampling site.
R. Veas et al. / Marine Environmental Research 89 (2013) 9e20 13
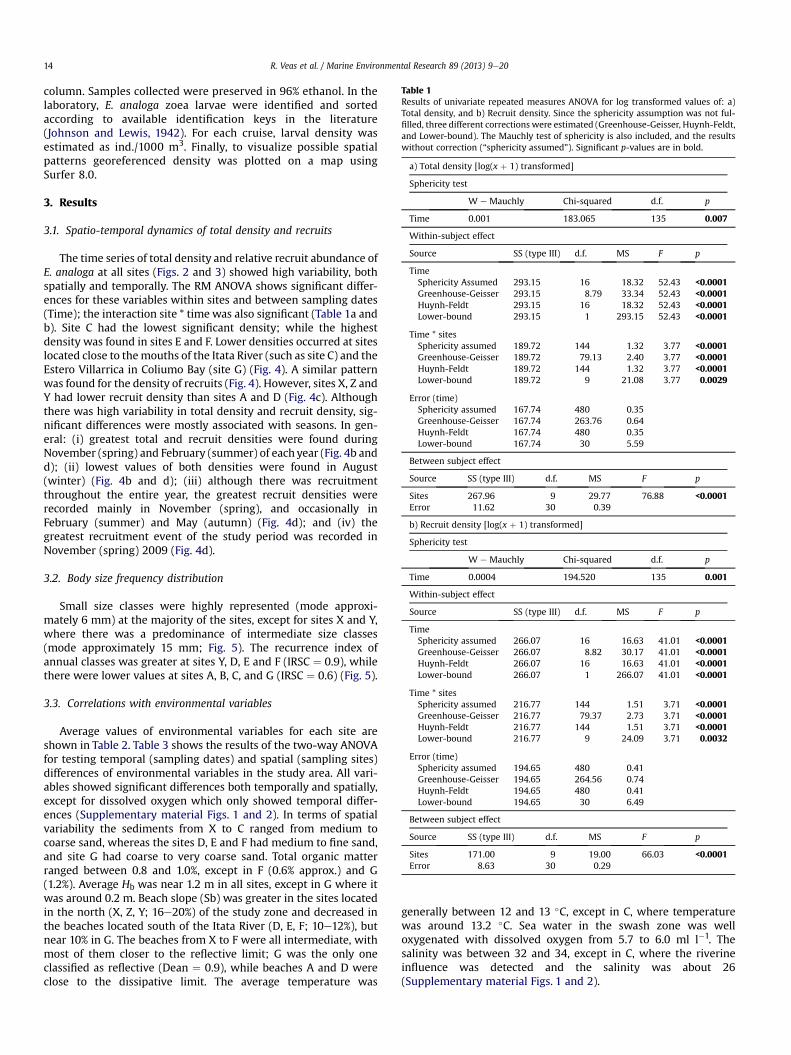
Table 1Results of univariate repeated measures ANOVA for log transformed values of: a)Total density, and b) Recruit density. Since the sphericity assumption was not ful-filled, three different corrections were estimated (Greenhouse-Geisser, Huynh-Feldt,and Lower-bound). The Mauchly test of sphericity is also included, and the resultswithout correction (“sphericity assumed”). Significant p-values are in bold.
a) Total density [log(x þ 1) transformed]
Sphericity test
W e Mauchly Chi-squared d.f. p
Time 0.001 183.065 135 0.007
Within-subject effect
Source SS (type III) d.f. MS F p
TimeSphericity Assumed 293.15 16 18.32 52.43 <0.0001Greenhouse-Geisser 293.15 8.79 33.34 52.43 <0.0001Huynh-Feldt 293.15 16 18.32 52.43 <0.0001Lower-bound 293.15 1 293.15 52.43 <0.0001
Time * sitesSphericity assumed 189.72 144 1.32 3.77 <0.0001Greenhouse-Geisser 189.72 79.13 2.40 3.77 <0.0001Huynh-Feldt 189.72 144 1.32 3.77 <0.0001Lower-bound 189.72 9 21.08 3.77 0.0029
Error (time)Sphericity assumed 167.74 480 0.35Greenhouse-Geisser 167.74 263.76 0.64Huynh-Feldt 167.74 480 0.35Lower-bound 167.74 30 5.59
Between subject effect
Source SS (type III) d.f. MS F p
Sites 267.96 9 29.77 76.88 <0.0001Error 11.62 30 0.39
b) Recruit density [log(x þ 1) transformed]
Sphericity test
W e Mauchly Chi-squared d.f. p
Time 0.0004 194.520 135 0.001
Within-subject effect
Source SS (type III) d.f. MS F p
TimeSphericity assumed 266.07 16 16.63 41.01 <0.0001Greenhouse-Geisser 266.07 8.82 30.17 41.01 <0.0001Huynh-Feldt 266.07 16 16.63 41.01 <0.0001Lower-bound 266.07 1 266.07 41.01 <0.0001
Time * sitesSphericity assumed 216.77 144 1.51 3.71 <0.0001Greenhouse-Geisser 216.77 79.37 2.73 3.71 <0.0001Huynh-Feldt 216.77 144 1.51 3.71 <0.0001Lower-bound 216.77 9 24.09 3.71 0.0032
Error (time)Sphericity assumed 194.65 480 0.41Greenhouse-Geisser 194.65 264.56 0.74Huynh-Feldt 194.65 480 0.41Lower-bound 194.65 30 6.49
Between subject effect
Source SS (type III) d.f. MS F p
Sites 171.00 9 19.00 66.03 <0.0001Error 8.63 30 0.29
R. Veas et al. / Marine Environmental Research 89 (2013) 9e2014
column. Samples collected were preserved in 96% ethanol. In thelaboratory, E. analoga zoea larvae were identified and sortedaccording to available identification keys in the literature(Johnson and Lewis, 1942). For each cruise, larval density wasestimated as ind./1000 m3. Finally, to visualize possible spatialpatterns georeferenced density was plotted on a map usingSurfer 8.0.
3. Results
3.1. Spatio-temporal dynamics of total density and recruits
The time series of total density and relative recruit abundance ofE. analoga at all sites (Figs. 2 and 3) showed high variability, bothspatially and temporally. The RM ANOVA shows significant differ-ences for these variables within sites and between sampling dates(Time); the interaction site * time was also significant (Table 1a andb). Site C had the lowest significant density; while the highestdensity was found in sites E and F. Lower densities occurred at siteslocated close to themouths of the Itata River (such as site C) and theEstero Villarrica in Coliumo Bay (site G) (Fig. 4). A similar patternwas found for the density of recruits (Fig. 4). However, sites X, Z andY had lower recruit density than sites A and D (Fig. 4c). Althoughthere was high variability in total density and recruit density, sig-nificant differences were mostly associated with seasons. In gen-eral: (i) greatest total and recruit densities were found duringNovember (spring) and February (summer) of each year (Fig. 4b andd); (ii) lowest values of both densities were found in August(winter) (Fig. 4b and d); (iii) although there was recruitmentthroughout the entire year, the greatest recruit densities wererecorded mainly in November (spring), and occasionally inFebruary (summer) and May (autumn) (Fig. 4d); and (iv) thegreatest recruitment event of the study period was recorded inNovember (spring) 2009 (Fig. 4d).
3.2. Body size frequency distribution
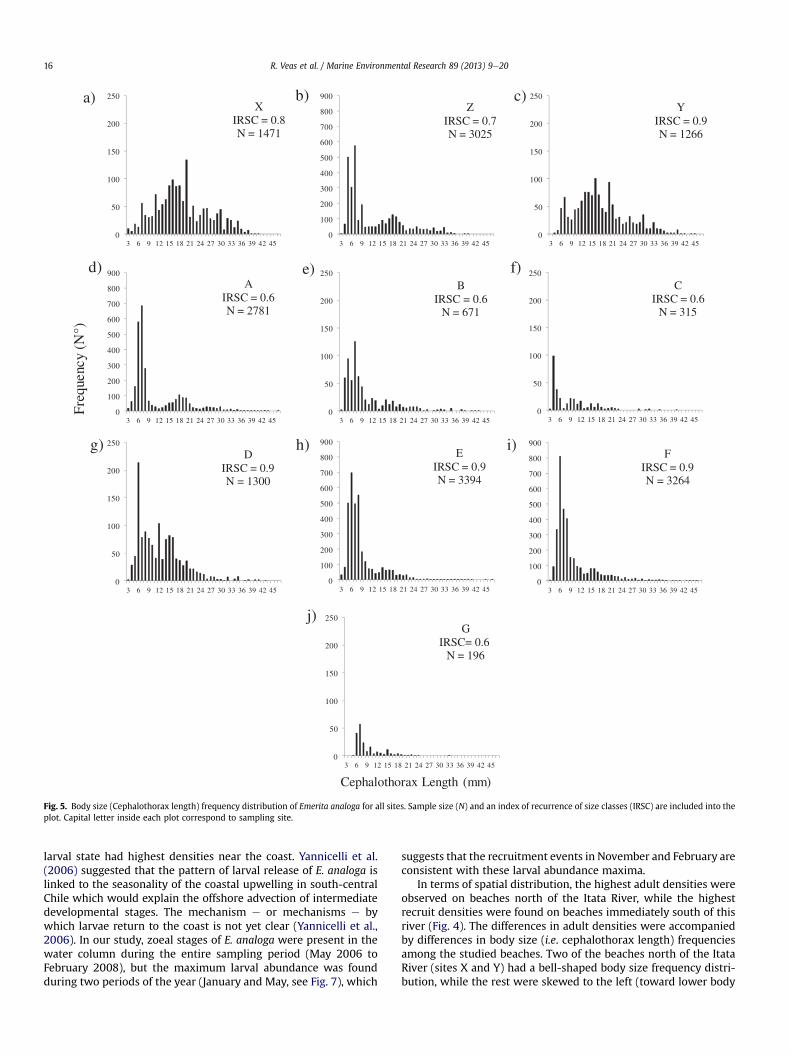
Small size classes were highly represented (mode approxi-mately 6 mm) at the majority of the sites, except for sites X and Y,where there was a predominance of intermediate size classes(mode approximately 15 mm; Fig. 5). The recurrence index ofannual classes was greater at sites Y, D, E and F (IRSC ¼ 0.9), whilethere were lower values at sites A, B, C, and G (IRSC ¼ 0.6) (Fig. 5).
3.3. Correlations with environmental variables
Average values of environmental variables for each site areshown in Table 2. Table 3 shows the results of the two-way ANOVAfor testing temporal (sampling dates) and spatial (sampling sites)differences of environmental variables in the study area. All vari-ables showed significant differences both temporally and spatially,except for dissolved oxygen which only showed temporal differ-ences (Supplementary material Figs. 1 and 2). In terms of spatialvariability the sediments from X to C ranged from medium tocoarse sand, whereas the sites D, E and F had medium to fine sand,and site G had coarse to very coarse sand. Total organic matterranged between 0.8 and 1.0%, except in F (0.6% approx.) and G(1.2%). Average Hb was near 1.2 m in all sites, except in G where itwas around 0.2 m. Beach slope (Sb) was greater in the sites locatedin the north (X, Z, Y; 16e20%) of the study zone and decreased inthe beaches located south of the Itata River (D, E, F; 10e12%), butnear 10% in G. The beaches from X to F were all intermediate, withmost of them closer to the reflective limit; G was the only oneclassified as reflective (Dean ¼ 0.9), while beaches A and D wereclose to the dissipative limit. The average temperature was
generally between 12 and 13 �C, except in C, where temperaturewas around 13.2 �C. Sea water in the swash zone was welloxygenated with dissolved oxygen from 5.7 to 6.0 ml l�1. Thesalinity was between 32 and 34, except in C, where the riverineinfluence was detected and the salinity was about 26(Supplementary material Figs. 1 and 2).
0
0.5
1
1.5
2
2.5
3
3.5
0
0.5
1
1.5
2
2.5
3
0
0.5
1
1.5
2
2.5
3
3.5
0
0.5
1
1.5
2
2.5
3
Log
Den
sity
±95
% H
SD T
ukey
Con
fide
nce
Inte
rval
a)
b)
c)
d)
Total Recruits
Fig. 4. Emerita analoga’s total density for each site (a) and sampling date (b), and E. analoga’s recruit density for each site (c) and sampling date (d). HSD Tukey confidence intervals(95%) are also shown. White triangles ¼ November; black triangles ¼ February; white circles ¼ May; black circles ¼ August.
R. Veas et al. / Marine Environmental Research 89 (2013) 9e20 15
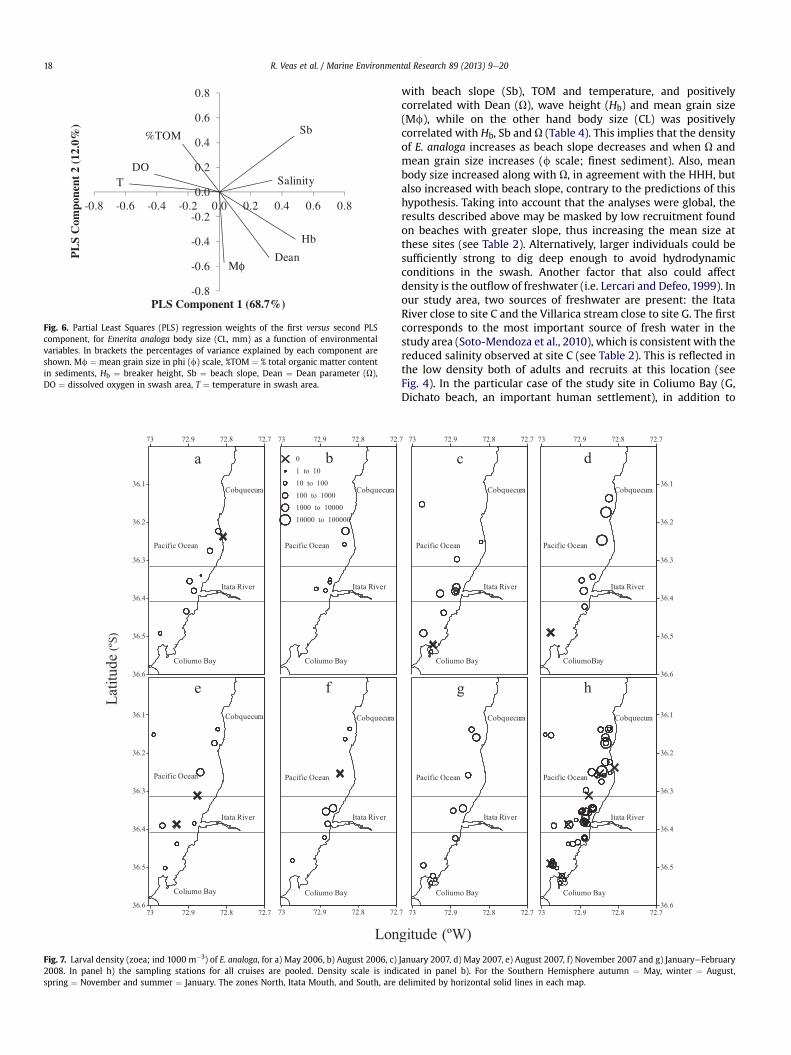
The values of PLS weights are proportional to their importancein the PLS component; the sign indicates whether the variable ispositively or negatively related to this PLS component. The resultsof the PLS regression between the proxies of sourceesink habitatand environmental variables are shown in Table 4; only the bestmodel (highest r2) is shown. In the case where both log density ofadults and log density of recruits were considered, the model wasimproved (r2 ¼ 0.59, p¼ 0.010). In the abovementioned case, meangrain size, Dean and Hb correlated positively with the first PLScomponent, while beach slope and TOMwere negatively correlatedwith that component. In the case of the PLS regression of logdensity as a function of the environmental variables (Table 4), onlyone valid component accounted for 57% of the variance; the mostimportant variables were those which described sediment char-acteristics (mean grain size and TOM) and beach morphodynamics(Dean, Hb and beach slope). Particularly, Dean, Hb and mean grainsize were positively correlated with the first component, whilebeach slope and TOM were negatively correlated with thiscomponent. Body size (CL, mm) was explained by two components(81%), with the first accounting for 69% and the second for 12% ofthe variance (Fig. 6, Table 4). Salinity and the variables describingbeach morphodynamics were directly correlated with the first PLScomponent; while temperature and dissolved oxygen were nega-tively correlated.
3.4. Zoeal larvae distribution
Zoeal larval stages were present during all surveys (Fig. 7),reaching maximum values in May, 2007 (Fig. 7d). Although larvaewere collected throughout the entire study area, maximum den-sities were recorded in the North Zone off Cobquecura (sites X, Z, Y)and around the mouth of the Itata River (sites A, B, C, D, E and F);they were significantly lower in the South Zone (two-way ANOVA,F2,37 ¼ 3.76, p ¼ 0.033). There was also a marginally significantdifference both for temporal variability (two-way ANOVA,F5,37 ¼ 2.21, p ¼ 0.074) and for the interaction zone*time (two-wayANOVA, F10,37 ¼ 1.87, p ¼ 0.082), probably associated with theseasonal reproduction of E. analoga.
3.5. Mega-perturbations and their effect on the inter-annualpopulation dynamics
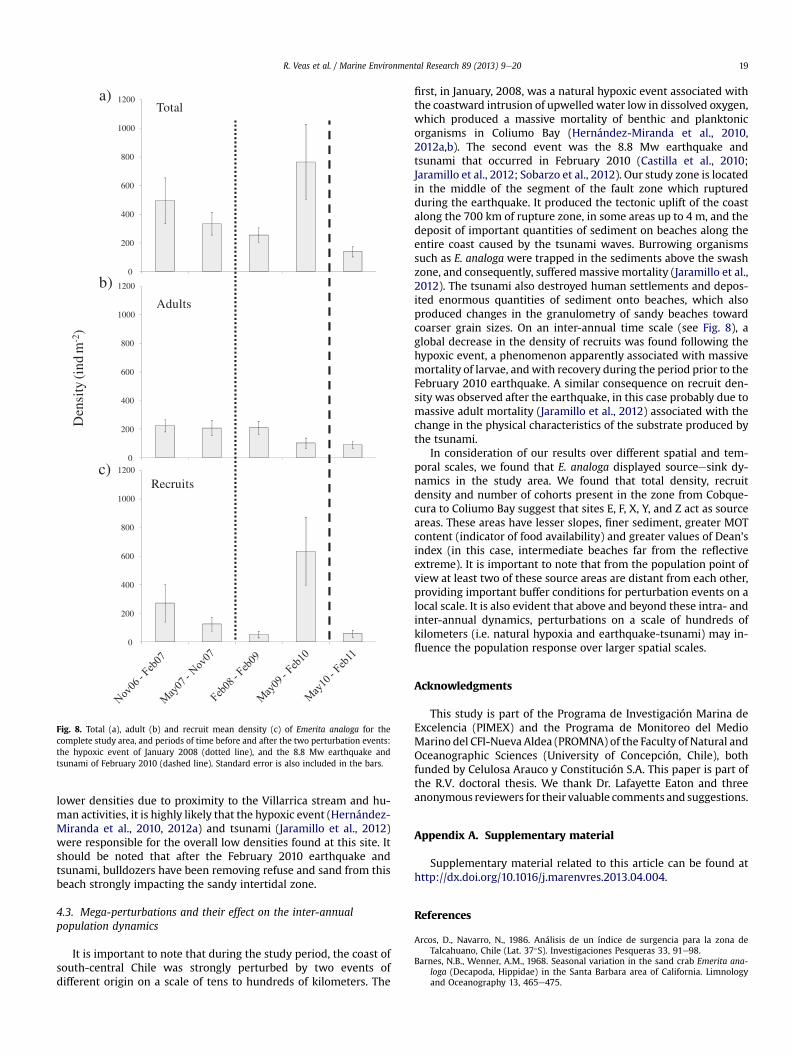
It is important to note that during the study period, the coast ofsouth-central Chile was strongly perturbed, on a scale of tens tohundreds of kilometers, by two events of different origin. In thiscontext, in an inter-annual time scale and considering the wholesampling area, a global decrease in the density of recruits wasobserved following two major perturbations: (i) a January 2008hypoxic event, and (ii) the February 2010 mega-earthquake 8.8 Mw(Fig. 8).
4. Discussion
4.1. Recruitment and adult density
Our results indicate great temporal (intra- and inter-annual) andspatial variability in the total density and recruitment of E. analoga.Recruit density generally presented higher values during Novemberand February, suggesting maximum annual settlement rates inspring and summer. According to the literature, settlement appearsto be variable over time along the geographic distribution ofE. analoga. In the Northern Hemisphere larval settling is alwayshigh during summer, although settling events do occur throughoutthe entire year at lower levels (Efford, 1965; Barnes and Wenner,1968; Diehl et al., 2007). In other coastal zones of Chile settle-ment occurs mainly during spring-summer (October to December,Contreras et al., 1999), as found in this study. However, off the coastof Valparaíso, Chile, Conan et al. (1975) reported two settling pe-riods in winter and at the beginning of spring (June and the end ofSeptember); Osorio et al. (1967) reported only one settling periodduring Spring. In south-central Chile larval release occurs mainlyduring winter (Contreras et al., 1999) and/or at the end of summer(Yannicelli et al., 2006; Díaz-Cabrera et al., 2012). According toYannicelli et al. (2006), the highest densities of the zoeal larvae arefound in the coastal zone. However, this zone displays importantadvection away from the coast. Intermediate larval states (zoea IIeIV) had higher densities further from the coast, while the zoea V
0
50
100
150
200
250
3 6 9 12 15 18 21 24 27 30 33 36 39 42 45
XIRSC = 0.8N = 1471
0
100
200
300
400
500
600
700
800
900
3 6 9 12 15 18 21 24 27 30 33 36 39 42 45
ZIRSC = 0.7N = 3025
0
50
100
150
200
250
3 6 9 12 15 18 21 24 27 30 33 36 39 42 45
YIRSC = 0.9N = 1266
0
100
200
300
400
500
600
700
800
900
3 6 9 12 15 18 21 24 27 30 33 36 39 42 45
AIRSC = 0.6N = 2781
0
50
100
150
200
250
3 6 9 12 15 18 21 24 27 30 33 36 39 42 45
BIRSC = 0.6
N = 671
0
50
100
150
200
250
3 6 9 12 15 18 21 24 27 30 33 36 39 42 45
CIRSC = 0.6
N = 315
0
50
100
150
200
250
3 6 9 12 15 18 21 24 27 30 33 36 39 42 45
DIRSC = 0.9N = 1300
0
100
200
300
400
500
600
700
800
900
3 6 9 12 15 18 21 24 27 30 33 36 39 42 45
EIRSC = 0.9N = 3394
0
100
200
300
400
500
600
700
800
900
3 6 9 12 15 18 21 24 27 30 33 36 39 42 45
FIRSC = 0.9N = 3264
Fre
quen
cy(N
°)
Cephalothorax Length (mm)
0
50
100
150
200
250
3 6 9 12 15 18 21 24 27 30 33 36 39 42 45
GIRSC= 0.6
N = 196
a)
d)
g)
b)
e)
h)
c)
f)
i)
j)
Fig. 5. Body size (Cephalothorax length) frequency distribution of Emerita analoga for all sites. Sample size (N) and an index of recurrence of size classes (IRSC) are included into theplot. Capital letter inside each plot correspond to sampling site.
R. Veas et al. / Marine Environmental Research 89 (2013) 9e2016
larval state had highest densities near the coast. Yannicelli et al.(2006) suggested that the pattern of larval release of E. analoga islinked to the seasonality of the coastal upwelling in south-centralChile which would explain the offshore advection of intermediatedevelopmental stages. The mechanism e or mechanisms e bywhich larvae return to the coast is not yet clear (Yannicelli et al.,2006). In our study, zoeal stages of E. analoga were present in thewater column during the entire sampling period (May 2006 toFebruary 2008), but the maximum larval abundance was foundduring two periods of the year (January and May, see Fig. 7), which
suggests that the recruitment events in November and February areconsistent with these larval abundance maxima.
In terms of spatial distribution, the highest adult densities wereobserved on beaches north of the Itata River, while the highestrecruit densities were found on beaches immediately south of thisriver (Fig. 4). The differences in adult densities were accompaniedby differences in body size (i.e. cephalothorax length) frequenciesamong the studied beaches. Two of the beaches north of the ItataRiver (sites X and Y) had a bell-shaped body size frequency distri-bution, while the rest were skewed to the left (toward lower body
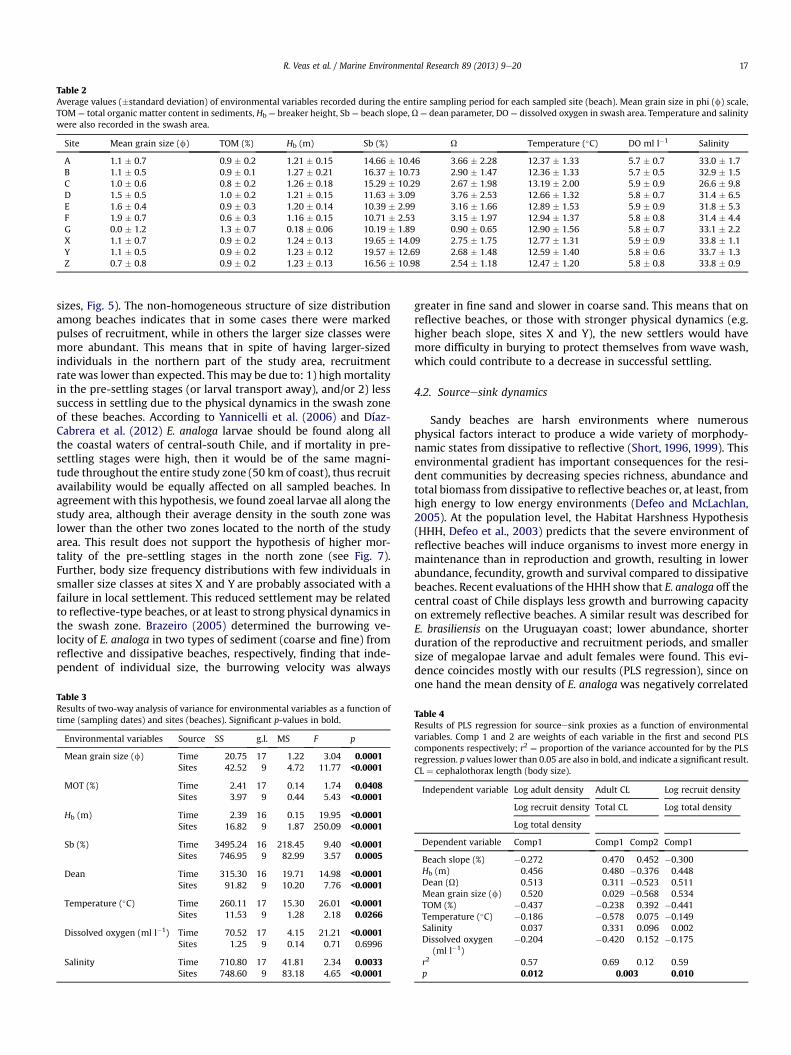
Table 2Average values (�standard deviation) of environmental variables recorded during the entire sampling period for each sampled site (beach). Mean grain size in phi (f) scale,TOM ¼ total organic matter content in sediments, Hb ¼ breaker height, Sb ¼ beach slope, U ¼ dean parameter, DO ¼ dissolved oxygen in swash area. Temperature and salinitywere also recorded in the swash area.
Site Mean grain size (f) TOM (%) Hb (m) Sb (%) U Temperature (�C) DO ml l�1 Salinity
A 1.1 � 0.7 0.9 � 0.2 1.21 � 0.15 14.66 � 10.46 3.66 � 2.28 12.37 � 1.33 5.7 � 0.7 33.0 � 1.7B 1.1 � 0.5 0.9 � 0.1 1.27 � 0.21 16.37 � 10.73 2.90 � 1.47 12.36 � 1.33 5.7 � 0.5 32.9 � 1.5C 1.0 � 0.6 0.8 � 0.2 1.26 � 0.18 15.29 � 10.29 2.67 � 1.98 13.19 � 2.00 5.9 � 0.9 26.6 � 9.8D 1.5 � 0.5 1.0 � 0.2 1.21 � 0.15 11.63 � 3.09 3.76 � 2.53 12.66 � 1.32 5.8 � 0.7 31.4 � 6.5E 1.6 � 0.4 0.9 � 0.3 1.20 � 0.14 10.39 � 2.99 3.16 � 1.66 12.89 � 1.53 5.9 � 0.9 31.8 � 5.3F 1.9 � 0.7 0.6 � 0.3 1.16 � 0.15 10.71 � 2.53 3.15 � 1.97 12.94 � 1.37 5.8 � 0.8 31.4 � 4.4G 0.0 � 1.2 1.3 � 0.7 0.18 � 0.06 10.19 � 1.89 0.90 � 0.65 12.90 � 1.56 5.8 � 0.7 33.1 � 2.2X 1.1 � 0.7 0.9 � 0.2 1.24 � 0.13 19.65 � 14.09 2.75 � 1.75 12.77 � 1.31 5.9 � 0.9 33.8 � 1.1Y 1.1 � 0.5 0.9 � 0.2 1.23 � 0.12 19.57 � 12.69 2.68 � 1.48 12.59 � 1.40 5.8 � 0.6 33.7 � 1.3Z 0.7 � 0.8 0.9 � 0.2 1.23 � 0.13 16.56 � 10.98 2.54 � 1.18 12.47 � 1.20 5.8 � 0.8 33.8 � 0.9
R. Veas et al. / Marine Environmental Research 89 (2013) 9e20 17
sizes, Fig. 5). The non-homogeneous structure of size distributionamong beaches indicates that in some cases there were markedpulses of recruitment, while in others the larger size classes weremore abundant. This means that in spite of having larger-sizedindividuals in the northern part of the study area, recruitmentratewas lower than expected. This may be due to: 1) highmortalityin the pre-settling stages (or larval transport away), and/or 2) lesssuccess in settling due to the physical dynamics in the swash zoneof these beaches. According to Yannicelli et al. (2006) and Díaz-Cabrera et al. (2012) E. analoga larvae should be found along allthe coastal waters of central-south Chile, and if mortality in pre-settling stages were high, then it would be of the same magni-tude throughout the entire study zone (50 km of coast), thus recruitavailability would be equally affected on all sampled beaches. Inagreement with this hypothesis, we found zoeal larvae all along thestudy area, although their average density in the south zone waslower than the other two zones located to the north of the studyarea. This result does not support the hypothesis of higher mor-tality of the pre-settling stages in the north zone (see Fig. 7).Further, body size frequency distributions with few individuals insmaller size classes at sites X and Y are probably associated with afailure in local settlement. This reduced settlement may be relatedto reflective-type beaches, or at least to strong physical dynamics inthe swash zone. Brazeiro (2005) determined the burrowing ve-locity of E. analoga in two types of sediment (coarse and fine) fromreflective and dissipative beaches, respectively, finding that inde-pendent of individual size, the burrowing velocity was always
Table 3Results of two-way analysis of variance for environmental variables as a function oftime (sampling dates) and sites (beaches). Significant p-values in bold.
Environmental variables Source SS g.l. MS F p
Mean grain size (f) Time 20.75 17 1.22 3.04 0.0001Sites 42.52 9 4.72 11.77 <0.0001
MOT (%) Time 2.41 17 0.14 1.74 0.0408Sites 3.97 9 0.44 5.43 <0.0001
Hb (m) Time 2.39 16 0.15 19.95 <0.0001Sites 16.82 9 1.87 250.09 <0.0001
Sb (%) Time 3495.24 16 218.45 9.40 <0.0001Sites 746.95 9 82.99 3.57 0.0005
Dean Time 315.30 16 19.71 14.98 <0.0001Sites 91.82 9 10.20 7.76 <0.0001
Temperature (�C) Time 260.11 17 15.30 26.01 <0.0001Sites 11.53 9 1.28 2.18 0.0266
Dissolved oxygen (ml l�1) Time 70.52 17 4.15 21.21 <0.0001Sites 1.25 9 0.14 0.71 0.6996
Salinity Time 710.80 17 41.81 2.34 0.0033Sites 748.60 9 83.18 4.65 <0.0001
greater in fine sand and slower in coarse sand. This means that onreflective beaches, or those with stronger physical dynamics (e.g.higher beach slope, sites X and Y), the new settlers would havemore difficulty in burying to protect themselves from wave wash,which could contribute to a decrease in successful settling.
4.2. Sourceesink dynamics
Sandy beaches are harsh environments where numerousphysical factors interact to produce a wide variety of morphody-namic states from dissipative to reflective (Short, 1996, 1999). Thisenvironmental gradient has important consequences for the resi-dent communities by decreasing species richness, abundance andtotal biomass from dissipative to reflective beaches or, at least, fromhigh energy to low energy environments (Defeo and McLachlan,2005). At the population level, the Habitat Harshness Hypothesis(HHH, Defeo et al., 2003) predicts that the severe environment ofreflective beaches will induce organisms to invest more energy inmaintenance than in reproduction and growth, resulting in lowerabundance, fecundity, growth and survival compared to dissipativebeaches. Recent evaluations of the HHH show that E. analoga off thecentral coast of Chile displays less growth and burrowing capacityon extremely reflective beaches. A similar result was described forE. brasiliensis on the Uruguayan coast; lower abundance, shorterduration of the reproductive and recruitment periods, and smallersize of megalopae larvae and adult females were found. This evi-dence coincides mostly with our results (PLS regression), since onone hand the mean density of E. analoga was negatively correlated
Table 4Results of PLS regression for sourceesink proxies as a function of environmentalvariables. Comp 1 and 2 are weights of each variable in the first and second PLScomponents respectively; r2 ¼ proportion of the variance accounted for by the PLSregression. p values lower than 0.05 are also in bold, and indicate a significant result.CL ¼ cephalothorax length (body size).
Independent variable Log adult density Adult CL Log recruit density
Log recruit density Total CL Log total density
Log total density
Dependent variable Comp1 Comp1 Comp2 Comp1
Beach slope (%) �0.272 0.470 0.452 �0.300Hb (m) 0.456 0.480 �0.376 0.448Dean (U) 0.513 0.311 �0.523 0.511Mean grain size (f) 0.520 0.029 �0.568 0.534TOM (%) �0.437 �0.238 0.392 �0.441Temperature (�C) �0.186 �0.578 0.075 �0.149Salinity 0.037 0.331 0.096 0.002Dissolved oxygen
(ml l�1)�0.204 �0.420 0.152 �0.175
r2 0.57 0.69 0.12 0.59p 0.012 0.003 0.010
Μφ
%TOM Sb
Salinity
Dean
DO
Hb
T
-0.8
-0.6
-0.4
-0.2
0.0
0.2
0.4
0.6
0.8
-0.8 -0.6 -0.4 -0.2 0.0 0.2 0.4 0.6 0.8
PL
S C
ompo
nent
2 (
12.0
%)
PLS Component 1 (68.7%)
Fig. 6. Partial Least Squares (PLS) regression weights of the first versus second PLScomponent, for Emerita analoga body size (CL, mm) as a function of environmentalvariables. In brackets the percentages of variance explained by each component areshown. Mf ¼ mean grain size in phi (f) scale, %TOM ¼ % total organic matter contentin sediments, Hb ¼ breaker height, Sb ¼ beach slope, Dean ¼ Dean parameter (U),DO ¼ dissolved oxygen in swash area, T ¼ temperature in swash area.
Fig. 7. Larval density (zoea; ind 1000 m�3) of E. analoga, for a) May 2006, b) August 2006, c)2008. In panel h) the sampling stations for all cruises are pooled. Density scale is indispring ¼ November and summer ¼ January. The zones North, Itata Mouth, and South, are
R. Veas et al. / Marine Environmental Research 89 (2013) 9e2018
with beach slope (Sb), TOM and temperature, and positivelycorrelated with Dean (U), wave height (Hb) and mean grain size(Mf), while on the other hand body size (CL) was positivelycorrelated with Hb, Sb and U (Table 4). This implies that the densityof E. analoga increases as beach slope decreases and when U andmean grain size increases (f scale; finest sediment). Also, meanbody size increased along with U, in agreement with the HHH, butalso increased with beach slope, contrary to the predictions of thishypothesis. Taking into account that the analyses were global, theresults described above may be masked by low recruitment foundon beaches with greater slope, thus increasing the mean size atthese sites (see Table 2). Alternatively, larger individuals could besufficiently strong to dig deep enough to avoid hydrodynamicconditions in the swash. Another factor that also could affectdensity is the outflow of freshwater (i.e. Lercari and Defeo, 1999). Inour study area, two sources of freshwater are present: the ItataRiver close to site C and the Villarica stream close to site G. The firstcorresponds to the most important source of fresh water in thestudy area (Soto-Mendoza et al., 2010), which is consistent with thereduced salinity observed at site C (see Table 2). This is reflected inthe low density both of adults and recruits at this location (seeFig. 4). In the particular case of the study site in Coliumo Bay (G,Dichato beach, an important human settlement), in addition to
January 2007, d) May 2007, e) August 2007, f) November 2007 and g) JanuaryeFebruarycated in panel b). For the Southern Hemisphere autumn ¼ May, winter ¼ August,delimited by horizontal solid lines in each map.
0
200
400
600
800
1000
12000
200
400
600
800
1000
1200
0
200
400
600
800
1000
1200a)
b)
c)
Den
sity
(ind
m-2
)
Total
Adults
Recruits
Fig. 8. Total (a), adult (b) and recruit mean density (c) of Emerita analoga for thecomplete study area, and periods of time before and after the two perturbation events:the hypoxic event of January 2008 (dotted line), and the 8.8 Mw earthquake andtsunami of February 2010 (dashed line). Standard error is also included in the bars.
R. Veas et al. / Marine Environmental Research 89 (2013) 9e20 19
lower densities due to proximity to the Villarrica stream and hu-man activities, it is highly likely that the hypoxic event (Hernández-Miranda et al., 2010, 2012a) and tsunami (Jaramillo et al., 2012)were responsible for the overall low densities found at this site. Itshould be noted that after the February 2010 earthquake andtsunami, bulldozers have been removing refuse and sand from thisbeach strongly impacting the sandy intertidal zone.
4.3. Mega-perturbations and their effect on the inter-annualpopulation dynamics
It is important to note that during the study period, the coast ofsouth-central Chile was strongly perturbed by two events ofdifferent origin on a scale of tens to hundreds of kilometers. The
first, in January, 2008, was a natural hypoxic event associated withthe coastward intrusion of upwelled water low in dissolved oxygen,which produced a massive mortality of benthic and planktonicorganisms in Coliumo Bay (Hernández-Miranda et al., 2010,2012a,b). The second event was the 8.8 Mw earthquake andtsunami that occurred in February 2010 (Castilla et al., 2010;Jaramillo et al., 2012; Sobarzo et al., 2012). Our study zone is locatedin the middle of the segment of the fault zone which rupturedduring the earthquake. It produced the tectonic uplift of the coastalong the 700 km of rupture zone, in some areas up to 4 m, and thedeposit of important quantities of sediment on beaches along theentire coast caused by the tsunami waves. Burrowing organismssuch as E. analoga were trapped in the sediments above the swashzone, and consequently, sufferedmassivemortality (Jaramillo et al.,2012). The tsunami also destroyed human settlements and depos-ited enormous quantities of sediment onto beaches, which alsoproduced changes in the granulometry of sandy beaches towardcoarser grain sizes. On an inter-annual time scale (see Fig. 8), aglobal decrease in the density of recruits was found following thehypoxic event, a phenomenon apparently associated with massivemortality of larvae, and with recovery during the period prior to theFebruary 2010 earthquake. A similar consequence on recruit den-sity was observed after the earthquake, in this case probably due tomassive adult mortality (Jaramillo et al., 2012) associated with thechange in the physical characteristics of the substrate produced bythe tsunami.
In consideration of our results over different spatial and tem-poral scales, we found that E. analoga displayed sourceesink dy-namics in the study area. We found that total density, recruitdensity and number of cohorts present in the zone from Cobque-cura to Coliumo Bay suggest that sites E, F, X, Y, and Z act as sourceareas. These areas have lesser slopes, finer sediment, greater MOTcontent (indicator of food availability) and greater values of Dean’sindex (in this case, intermediate beaches far from the reflectiveextreme). It is important to note that from the population point ofview at least two of these source areas are distant from each other,providing important buffer conditions for perturbation events on alocal scale. It is also evident that above and beyond these intra- andinter-annual dynamics, perturbations on a scale of hundreds ofkilometers (i.e. natural hypoxia and earthquake-tsunami) may in-fluence the population response over larger spatial scales.
Acknowledgments
This study is part of the Programa de Investigación Marina deExcelencia (PIMEX) and the Programa de Monitoreo del MedioMarino del CFI-Nueva Aldea (PROMNA) of the Faculty of Natural andOceanographic Sciences (University of Concepción, Chile), bothfunded by Celulosa Arauco y Constitución S.A. This paper is part ofthe R.V. doctoral thesis. We thank Dr. Lafayette Eaton and threeanonymous reviewers for their valuable comments and suggestions.
Appendix A. Supplementary material
Supplementary material related to this article can be found athttp://dx.doi.org/10.1016/j.marenvres.2013.04.004.
References
Arcos, D., Navarro, N., 1986. Análisis de un índice de surgencia para la zona deTalcahuano, Chile (Lat. 37�S). Investigaciones Pesqueras 33, 91e98.
Barnes, N.B., Wenner, A.M., 1968. Seasonal variation in the sand crab Emerita ana-loga (Decapoda, Hippidae) in the Santa Barbara area of California. Limnologyand Oceanography 13, 465e475.
R. Veas et al. / Marine Environmental Research 89 (2013) 9e2020
Blott, S.J., Pye, K., 2001. GRADISTAT: a grain size distribution and statistics packagefor the analysis of unconsolidated sediments. Earth Surface Processes andLandforms 26, 1237e1248.
Brazeiro, A., 2001. Relationship between species richness and morphodynamics insandy beaches: what are the underlying factors? Marine Ecology Progress Se-ries 224, 35e44.
Brazeiro, A., 2005. Geomorphology induces life history changes in invertebrates ofsandy beaches: the case of the mole crab Emerita analoga in Chile. Journal ofMarine Biological Association United Kingdom 85, 113e120.
Buchanan, J.B., 1971. Measurements of the physical and chemical environment. In:Holme, N.A., McIntyre, A.D. (Eds.), Methods for the Study of Marine Benthos. IBPHandbook, vol. 16. Blackwell, Oxford, pp. 30e52.
Byers, S., Mills, E., Stewart, P., 1978. A comparison of methods of determiningorganic carbon in marine sediments, with suggestion for a standard method.Hydrobiologia 58, 43e47.
Caddy, J.F., Defeo, O., 2003. Enhancing or Restoring the Productivity of NaturalPopulations of Shellfish and Other Marine Invertebrate Resources. FAO FisheriesTechnical Paper 448. FAO, Rome.
Carrascal, L.M., Galvan, I., Gordo, O., 2009. Partial least squares regression as analternative to current regression methods used in ecology. Oikos 118, 681e690.
Castilla, J.C., Manriquez, P.H., Camaño, A., 2010. Effects of rocky shore coseismicuplift and the 2010 Chilean mega-earthquake on intertidal biomarker species.Marine Ecology Progress Series 418, 17e23.
Celentano, E., Gutiérrez, N.L., Defeo, O., 2010. Effects of morphodynamic and estu-arine gradients on the demography and distribution of a Sandy beach molecrab: implications for sourceesink habitat dynamics. Marine Ecology ProgressSeries 398, 193e205.
Conan, G., Melo, C., Yany, G., 1975. Evaluation de la production d’una populationlittorale du crabe Hippidae Emerita analoga (Stimpson) par intégration desparamétres de croissance et de mortalité. In: 10th European Symposium onMarine Biology, vol. 2, pp. 129e150.
Contreras, H., Defeo, O., Jaramillo, E., 1999. Life history of Emerita analoga (Stim-pson) (Anomura, Hippidae) in a sandy beach of south central Chile. Estuarine,Coastal and Shelf Science 48, 101e112.
Contreras, H., Jaramillo, E., Duarte, C., McLachlan, A., 2003. Population abundances,growth and natural mortality of the crustacean macroinfauna at two sandbeach morphodynamic types in southern Chile. Revista Chilena de HistoriaNatural 76, 543e561.
Crowder, M.J., Hand, D.J., 1990. Analysis of Repeated Measures. Chapman and Hall,London.
Defeo, O., Lercari, D., Gómez, J., 2003. The role of morphodynamics in structuringsandy beach populations and communities: what should be expected? Journalof Coastal Research 35, 352e362.
Defeo, O., McLachlan, A., 2005. Patterns, processes and regulatory mechanisms insandy beach macrofauna: a multi-scale analysis. Marine Ecology Progress Series295, 1e20.
di Castri, F., Hajek, E., 1976. Bioclimatología de Chile. Editorial de la UniversidadCatólica de Chile, p. 163.
Diehl, J.M., Toonen, R.J., Botsford, L.W., 2007. Spatial variability of recruitment in thesand crab Emerita analoga throughout California in relation to wind-drivencurrents. Marine Ecology Progress Series 350, 1e17.
Díaz-Cabrera, E., Hernández-Miranda, E., Hernández, C.E., Quiñones, R.A., 2012.Mesoscale b diversity and spatial nestedness of crustacean larvae in the coastalzone off central southern Chile: population and community implications. ICESJournal of Marine Science 69 (3), 429e438.
Dugan, J.E., Hubbard, D., Page, H., 1995. Scaling population density to body size: test intwo soft sediment intertidal communities. Journal ofCoastalResearch11, 849e857.
Efford, I.E., 1965. Aggregation in the sand crab, Emerita analoga (Stimpson). Ecology34, 63e75.
Efford, I.E., 1966. Feeding in the sand crab, Emerita analoga (Stimpson) (Decapoda,Anomura). Crustaceana 10, 167e182.
Efford, I.E., 1969. Egg size n the sand crab, Emerita analoga (Stimpson) (Decapoda,Anomura). Crustaceana 16, 15e26.
Efford, I.E., 1970. Recruitment to sedentary marine populations as exemplified bythe mole crab, Emerita analoga (Decapoda, Hippidae). Crustaceana 18, 293e308.
Efford, I.E., 1976. Distribution of the sand crab in the genus Emerita (Decapoda,Hippidae). Crustaceana 30, 169e183.
Emery, K., 1938. A rapid method of mechanical analysis of sands. Journal of Sedi-mentary Petrology 8, 105e111.
Emery, K., 1961. A simple method of measuring beach profiles. Limnology andOceanography 6, 90e93.
Folk, R., 1974. Petrology of Sedimentary Rocks. Hemphills, Publishing Co., Texas.Fusaro, C., 1978. Growth rate of the mole crab, Emerita analoga, (Hippidae) in two
different environments. Fishery Bulletin 76, 369e375.
Gayanilo Jr., F.C., Sparre, P., Pauly, D., 1996. The FAO-ICLARM Stock Assessment Tools(FISAT) User’s Guide. FAO Computerized Information Series (Fisheries) No. 8.FAO, Rome.
Gibbs, R., Matthews, M., Link, D., 1971. The relationship between sphere size andsettling velocity. Journal of Sedimentary Petrology 41, 7e18.
Hernández-Miranda, E., Quiñones, R.A., Aedo, G., Valenzuela, A., Mermoud, N.,Román, C., Yañez, F., 2010. A major fish stranding caused by a natural hypoxicevent in a shallow bay of the eastern South Pacific Ocean. Journal of Fish Biology76, 1543e1564.
Hernández-Miranda, E., Veas, R., Labra, F.A., Salamanca, M., Quiñones, R.A., 2012a.Response of the epibenthic macrofaunal community to a strong upwelling-driven hypoxic event in a shallow bay of the southern Humboldt CurrentSystem. Marine Environmental Research 79, 16e28.
Hernández-Miranda, E., Quiñones, R.A., Aedo, G., Díaz-Cabrera, E., Cisterna, J.,2012b. The impact of a strong natural hypoxic event on the toadfish Aphosporosus in Coliumo Bay, south-central Chile. Revista de Biología Marina yOceanografía 47 (3), 475e487.
Jaramillo, E., McLachlan, A., Coetzee, P., 1999. Intertidal zonation patterns of mac-roinfauna over a range of exposed sandy beaches in south-central Chile. MarineEcology Progress Series 101, 105e118.
Jaramillo, E., Dugan, J.E., Hubbard, D.M., Melnick, D., Manzano, M., Duarte, C.,Campos, C., Sanchez, R., 2012. Ecological implications of Extreme events: foot-prints of the 2010 earthquake along the Chilean coast. PLoS ONE 7 (5), e35348.
Johnson, M.W., Lewis, W.M., 1942. Pelagic larval stages of the sand crabs Emeritaanaloga Stimpson, Blepharipoda occidentalis Randall, and Lepidopa myopsStimpson. Biological Bulletin 83 (1), 67e87.
Kawecki, T.J., 2008. Adaptations to marginal habitats. Annual Review in Ecology,Evolution and Systematic 39, 321e342.
Lercari, D., Defeo, O., 1999. Effects of freshwater discharge in sandy beach pop-ulations: the mole crab Emerita brasiliensis in Uruguay. Estuarine Coastal andShelf Science 58, 17e24.
McLachlan, A., Brown, A.C., 2006. The Ecology of Sandy Shores. Elsevier, p. 373.Mevik, B.H., Wehrens, R., 2007. The PLS package: principal components and partial
least squares regression in R. Journal of Statistical Software 18, 1e24.Montecinos, A., Gomez, F., 2010. ENSO modulation of the upwelling season off
southern-central Chile. Geophysical Research Letters 37, L02708.Osorio, C., Bahamonde, N., Lopez, M.T., 1967. El Limanche [Emerita analoga (Stim-
pson)] en Chile. Boletín Museo Nacional de Historia Natural 29, 60e116.Quinn, G., Keough, M., 2002. Experimental Design and Data Analysis for Biologists.
Cambridge University Press.Saavedra,N.,1980. Lapresióny ladireccióndel viento enConcepción. Tralka1,153e162.Saavedra, N., Foppiano, A.J., 1992. Contribución a la cinemática del anticiclón del
Pacífico sur. Geoacta 19, 95e110.Short, A.D., 1996. The role of wave height, slope, tide range and embaymentisation in
beach classification: a review. Revista Chilena de Historia Natural 69, 589e604.Short, A.D., 1999. Handbook of Beach and Shoreface Morphodynamics. John Wiley,
London, p. 379.Sobarzo, M., Bravo, L., Donoso, D., Garcés-Vargas, J., Schneider, W., 2007. Coastal
upwelling and seasonal cycles that influence the water column over the con-tinental shelf off central Chile. Progress in Oceanography 75, 363e382.
Sobarzo, M., Garcés-Vargas, J., Bravo, L., Tassara, Andrés, Quiñones, R.A., 2012.Observing sea level and current anomalies driven by a megathrust slope shelftsunami: the event on February 27, 2010 in central Chile. Continental ShelfResearch 49, 44e55.
Soto-Mendoza, S., Castro, L.R., Llanos-Rivera, A., 2010. Variabilidad espacial y tem-poral de huevos y larvas de Strangomera bentincki y Engraulis ringens, asociadosa la desembocadura del río Itata, Chile. Revista de Biología Marina y Ocean-ografía 45 (3), 471e487.
Subramoniam, T., Gunamalai, V., 2003. Breeding biology of the intertidal sand crab,Emerita (Decapoda: Anomura). Advances in Marine Biology 46, 91e182.
Underwood, A.J., 1997. Experiments in Ecology: Their Logic Design and Interpre-tation Using Analysis of Variance. Cambridge University Press.
Vigny, C., Socquet, A., Peyrat, S., Ruegg, J.-C., Métois, M., Madariaga, R., Morvan, S.,Lancieri, M., Lacassin, R., Campos, J., Carrizo, D., Bejar-Pizarro, M., Barrientos, S.,Armijo, R., Aranda, C., Valderas-Bermejo, M.-C., Ortega, J., Bondoux, F., Baize, S.,Lyon-Caen, H., Pavez, A., Vilotte, J.P., Bevis, M., Brooks, B., Smalley, R., Parra, H.,Baez, J.-C., Blanco,M., Cimbaro, S., Kendrick, E., 2011. The2010Mw8.8MauleMega-thrust earthquake of central Chile, monitored by GPS. Science 332, 1417e1421.
von Ende, C.N., 2001. Repeated measures analysis: growth and other time-dependent measures. In: Scheiner, S.M., Gurevitch (Eds.), Design and Analysisof Ecological Experiments, second ed. Oxford University Press, pp. 134e157.
Yannicelli, B., Castro, L.R., Schneider, W., Sobarzo, M., 2006. Crustacean larvae dis-tribution in the coastal upwelling zone off central Chile. Marine EcologyProgress Series 319, 175e189.