The Paradigm of Complexity in Clinical Neurocognitive Science
Upload
nottinghamtrentCategory
view
1download
0
Tn
Ja
b
c
d
a
ARRA
KDIAHDD
1
asrrtRcct
dG
(j
0h
Accident Analysis and Prevention 50 (2013) 1193– 1206
Contents lists available at SciVerse ScienceDirect
Accident Analysis and Prevention
j ourna l h o mepage: www.elsev ier .com/ locate /aap
he influence of differences in the functioning of the neurocognitive attentionaletworks on drivers’ performance
avier Rocaa,b,∗, David Crundall c, Sergio Moreno-Ríosd, Cándida Castroa, Juan Lupiáneza
Departamento de Psicología Experimental, Universidad de Granada, Campus Universitario Cartuja, s/n, 18071 Granada, SpainDepartamento de Psicología Evolutiva y de la Educación, Universidad de Valencia, Avenida Blasco Ibánez, 21, 46010 Valencia, SpainAccident Research Unit, University of Nottingham, University Park, Nottingham NG7 2RD, United KingdomDepartamento de Psicología Evolutiva y de la Educación, Universidad de Granada, Campus Universitario Cartuja, s/n, 18071 Granada, Spain
r t i c l e i n f o
rticle history:eceived 10 May 2012eceived in revised form 27 August 2012ccepted 11 September 2012
eywords:istraction
nattentionttention Networks Testazardous situationsriver behaviourriving simulator
a b s t r a c t
Considerable research efforts are currently being devoted to analysing the role that the attentional systemplays in determining driving behaviour, with the ultimate objective of reducing the number of attention-related accidents. The present study aims to assess the influence of differences in the functioning ofthe three attentional networks (executive control, attentional orienting and alerting) when drivers haveto deal with some common hazardous situations, for example, when an oncoming car or a pedestrianunexpectedly crosses their trajectory. Multiple measures of participants’ attentional functioning wereobtained from a computer-based neurocognitive test: the Attention Networks Test for Interactions andVigilance (ANTI-V). These measures were compared to performance in a driving simulator where differ-ent types of hazardous situations were presented. Correlation and linear regression analyses revealedsignificant associations between individual attentional measures and driving performance in specifictraffic situations. In particular, a higher attentional orienting score on the ANTI-V was associated withsafer driving in situations where a single precursor anticipated the hazard source, whereas in complex
situations with multiple potential hazard precursors, higher attentional orienting scores were associatedwith delayed braking. Additionally, partial evidence of a relationship between crash occurrence and thefunctioning of the executive control and the alerting networks was found. Overall, the current researchwould be helpful to better understand the role that each attentional network (executive control, atten-tional orienting and alerting) play in safe driving, and thus to develop efficient countermeasures to reduce.
attention-related crashes. Introduction
Driving a vehicle is a complex multi-tasking activity, in whichll cognitive resources should be applied in a coordinated way toafely complete a journey. Of the different cognitive resources,esearch efforts have increasingly been devoted to analysing theole played by the attentional system in driving behaviour, withhe aim of reducing the number of road traffic accidents (e.g.,egan et al., 2011). In fact, driver distraction and inattention are
onsidered among the major contributing causes of road trafficasualties and their negative impact on road safety is expectedo further increase in the immediate future, mainly due to the∗ Corresponding author at: Departamento de Psicología Experimental, Facultade Psicología, Universidad de Granada, Campus Universitario Cartuja, s/n, 18071ranada, Spain. Tel.: +34 958 240 663; fax: +34 958 246 239.
E-mail addresses: [email protected] (J. Roca), [email protected]. Crundall), [email protected] (S. Moreno-Ríos), [email protected] (C. Castro),[email protected] (J. Lupiánez).
001-4575/$ – see front matter © 2012 Elsevier Ltd. All rights reserved.ttp://dx.doi.org/10.1016/j.aap.2012.09.032
© 2012 Elsevier Ltd. All rights reserved.
proliferation of some potentially distracting in-vehicle technolo-gies (e.g. Kircher, 2007; Klauer et al., 2006; Ranney, 2008; Reganet al., 2011; Stutts et al., 2001).
The present study will provide additional evidence to explainthe influence of different attentional functions (such as executivecontrol, attentional orienting, phasic alertness and vigilance) whendrivers have to deal with common hazardous situations, such aswhen an oncoming car or a pedestrian unexpectedly crosses theirtrajectory. To achieve this objective, multiple measures of atten-tional function were obtained individually from participants usinga single computer-based neurocognitive test termed the AttentionNetworks Test for Interactions and Vigilance (ANTI-V; Roca et al.,2011), and these measures were compared with performance ina driving simulator where a number of hazardous situations hadto be safely negotiated. Although some previous attempts havebeen made with other neurocognitive tests to link attentional net-
work functions to driving behaviour (e.g., Weaver et al., 2009), therelationship between the attentional components assessed by theANTI-V and performance data from a driving simulator presentinghazardous situations is still unclear.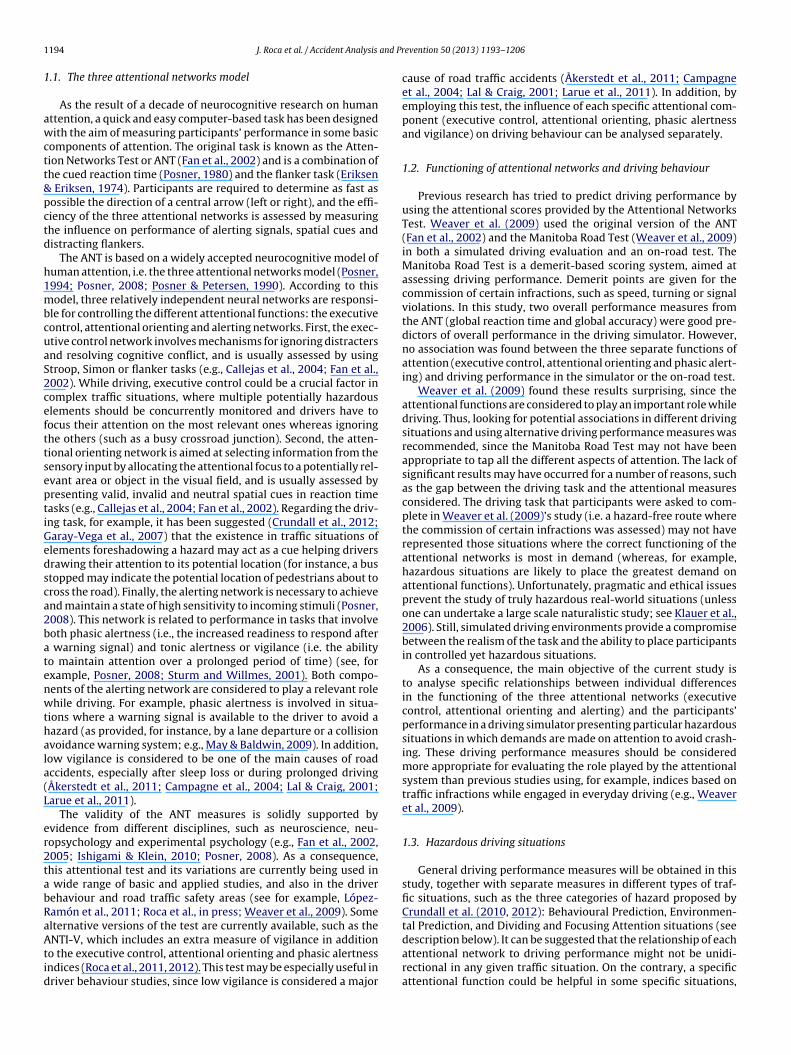
1 and Pr
1
awctt&pctd
h1mbcuaS2cefttseptiGedsca2batenwthala(L
er2tabRaAtid
194 J. Roca et al. / Accident Analysis
.1. The three attentional networks model
As the result of a decade of neurocognitive research on humanttention, a quick and easy computer-based task has been designedith the aim of measuring participants’ performance in some basic
omponents of attention. The original task is known as the Atten-ion Networks Test or ANT (Fan et al., 2002) and is a combination ofhe cued reaction time (Posner, 1980) and the flanker task (Eriksen
Eriksen, 1974). Participants are required to determine as fast asossible the direction of a central arrow (left or right), and the effi-iency of the three attentional networks is assessed by measuringhe influence on performance of alerting signals, spatial cues andistracting flankers.
The ANT is based on a widely accepted neurocognitive model ofuman attention, i.e. the three attentional networks model (Posner,994; Posner, 2008; Posner & Petersen, 1990). According to thisodel, three relatively independent neural networks are responsi-
le for controlling the different attentional functions: the executiveontrol, attentional orienting and alerting networks. First, the exec-tive control network involves mechanisms for ignoring distractersnd resolving cognitive conflict, and is usually assessed by usingtroop, Simon or flanker tasks (e.g., Callejas et al., 2004; Fan et al.,002). While driving, executive control could be a crucial factor inomplex traffic situations, where multiple potentially hazardouslements should be concurrently monitored and drivers have toocus their attention on the most relevant ones whereas ignoringhe others (such as a busy crossroad junction). Second, the atten-ional orienting network is aimed at selecting information from theensory input by allocating the attentional focus to a potentially rel-vant area or object in the visual field, and is usually assessed byresenting valid, invalid and neutral spatial cues in reaction timeasks (e.g., Callejas et al., 2004; Fan et al., 2002). Regarding the driv-ng task, for example, it has been suggested (Crundall et al., 2012;aray-Vega et al., 2007) that the existence in traffic situations oflements foreshadowing a hazard may act as a cue helping driversrawing their attention to its potential location (for instance, a bustopped may indicate the potential location of pedestrians about toross the road). Finally, the alerting network is necessary to achievend maintain a state of high sensitivity to incoming stimuli (Posner,008). This network is related to performance in tasks that involveoth phasic alertness (i.e., the increased readiness to respond after
warning signal) and tonic alertness or vigilance (i.e. the abilityo maintain attention over a prolonged period of time) (see, forxample, Posner, 2008; Sturm and Willmes, 2001). Both compo-ents of the alerting network are considered to play a relevant rolehile driving. For example, phasic alertness is involved in situa-
ions where a warning signal is available to the driver to avoid aazard (as provided, for instance, by a lane departure or a collisionvoidance warning system; e.g., May & Baldwin, 2009). In addition,ow vigilance is considered to be one of the main causes of roadccidents, especially after sleep loss or during prolonged drivingÅkerstedt et al., 2011; Campagne et al., 2004; Lal & Craig, 2001;arue et al., 2011).
The validity of the ANT measures is solidly supported byvidence from different disciplines, such as neuroscience, neu-opsychology and experimental psychology (e.g., Fan et al., 2002,005; Ishigami & Klein, 2010; Posner, 2008). As a consequence,his attentional test and its variations are currently being used in
wide range of basic and applied studies, and also in the driverehaviour and road traffic safety areas (see for example, López-amón et al., 2011; Roca et al., in press; Weaver et al., 2009). Somelternative versions of the test are currently available, such as the
NTI-V, which includes an extra measure of vigilance in additiono the executive control, attentional orienting and phasic alertnessndices (Roca et al., 2011, 2012). This test may be especially useful inriver behaviour studies, since low vigilance is considered a major
evention 50 (2013) 1193– 1206
cause of road traffic accidents (Åkerstedt et al., 2011; Campagneet al., 2004; Lal & Craig, 2001; Larue et al., 2011). In addition, byemploying this test, the influence of each specific attentional com-ponent (executive control, attentional orienting, phasic alertnessand vigilance) on driving behaviour can be analysed separately.
1.2. Functioning of attentional networks and driving behaviour
Previous research has tried to predict driving performance byusing the attentional scores provided by the Attentional NetworksTest. Weaver et al. (2009) used the original version of the ANT(Fan et al., 2002) and the Manitoba Road Test (Weaver et al., 2009)in both a simulated driving evaluation and an on-road test. TheManitoba Road Test is a demerit-based scoring system, aimed atassessing driving performance. Demerit points are given for thecommission of certain infractions, such as speed, turning or signalviolations. In this study, two overall performance measures fromthe ANT (global reaction time and global accuracy) were good pre-dictors of overall performance in the driving simulator. However,no association was found between the three separate functions ofattention (executive control, attentional orienting and phasic alert-ing) and driving performance in the simulator or the on-road test.
Weaver et al. (2009) found these results surprising, since theattentional functions are considered to play an important role whiledriving. Thus, looking for potential associations in different drivingsituations and using alternative driving performance measures wasrecommended, since the Manitoba Road Test may not have beenappropriate to tap all the different aspects of attention. The lack ofsignificant results may have occurred for a number of reasons, suchas the gap between the driving task and the attentional measuresconsidered. The driving task that participants were asked to com-plete in Weaver et al. (2009)’s study (i.e. a hazard-free route wherethe commission of certain infractions was assessed) may not haverepresented those situations where the correct functioning of theattentional networks is most in demand (whereas, for example,hazardous situations are likely to place the greatest demand onattentional functions). Unfortunately, pragmatic and ethical issuesprevent the study of truly hazardous real-world situations (unlessone can undertake a large scale naturalistic study; see Klauer et al.,2006). Still, simulated driving environments provide a compromisebetween the realism of the task and the ability to place participantsin controlled yet hazardous situations.
As a consequence, the main objective of the current study isto analyse specific relationships between individual differencesin the functioning of the three attentional networks (executivecontrol, attentional orienting and alerting) and the participants’performance in a driving simulator presenting particular hazardoussituations in which demands are made on attention to avoid crash-ing. These driving performance measures should be consideredmore appropriate for evaluating the role played by the attentionalsystem than previous studies using, for example, indices based ontraffic infractions while engaged in everyday driving (e.g., Weaveret al., 2009).
1.3. Hazardous driving situations
General driving performance measures will be obtained in thisstudy, together with separate measures in different types of traf-fic situations, such as the three categories of hazard proposed byCrundall et al. (2010, 2012): Behavioural Prediction, Environmen-tal Prediction, and Dividing and Focusing Attention situations (see
description below). It can be suggested that the relationship of eachattentional network to driving performance might not be unidi-rectional in any given traffic situation. On the contrary, a specificattentional function could be helpful in some specific situations,
and Pr
wpvhbims
dsBaBpviSistocP(stscEehth
ha
2fiaAoPce
ppndiam(ma
dtsidst
J. Roca et al. / Accident Analysis
hereas in some other cases it might be associated with a worseerformance. For example, focusing our attention on a precedingehicle (and thus partially ignoring the traffic environment) will beelpful when this vehicle unexpectedly brakes, but this attentionalehaviour can be dangerous when a pedestrian suddenly steps out
n front of one’s car. As a consequence, some qualitative differencesight be found in the relationship of a specific attentional network
core with performance in different traffic situations.Crundall et al. (2010, 2012) proposed that three categories of
riving hazards could be differentiated according to the relation-hip between potential precursors and the actual hazard source:ehavioural Prediction, Environmental Prediction, and Dividingnd Focusing Attention hazardous situations (see Table 1). First,ehaviour Prediction hazards can be avoided if the drivers antici-ate the behaviour of a visible precursor (i.e. a pedestrian or anotherehicle) before it becomes a hazard source (for example, an oncom-ng motorcycle that suddenly invades the participant’s trajectory).econd, in Environmental Prediction situations the hazard sources not visible before the hazard is triggered (for example, a childtepping out from behind an ice-cream van). It should be notedhat the precursors to Environmental Prediction hazards are partf the environment and conceal the hazard source (such as the ice-ream van hiding the child), while the precursors to Behaviouralrediction hazards are the same stimuli as the hazard sourcesfor example, the motorcycle is both a precursor and a hazardource). Third, Dividing and Focusing Attention situations requirehe drivers to monitor multiple sources of potential risk beforeelecting one as the actual hazard. This is a more complex categoryontaining potential hazards from both Behavioural Prediction andnvironmental Prediction categories, but specifically in this cat-gory, more than one hazard is visible at the point at which theazard triggered (for example, when driving over a crossroads junc-ion, there is traffic from the right that fails to give way, while aazard from the left was equally plausible).
By using this taxonomy of hazards, different results may beypothesized depending on the attentional function considerednd the characteristics of the simulated driving situation.
First, previous research (Crundall et al., 2012; Garay-Vega et al.,007) suggested that the existence in traffic situations of elementsoreshadowing a hazard may act as a cue helping drivers draw-ng their attention to its potential location. As a consequence, anssociation between a higher attentional orienting score in theNTI-V (which measures the influence of peripheral spatial cuesn participants’ performance) and better resolution of Behaviouralrediction and Environmental Prediction hazards (in which a pre-ursor could be used to foreshadow the hazard source) might bexpected.
Second, Dividing and Focusing Attention hazards involve com-lex situations where multiple potential hazards are concurrentlyresent, and thus executive control might be necessary to ignoreon-hazardous traffic elements. According to Crundall et al. (2012),ividing attention across the multiple potential hazards in Divid-
ng and Focusing Attention situations must give way to focusingttention upon the actual hazard when it occurs. Therefore, weay propose that a reduced executive control score in the ANTI-V
which reflects a participant’s higher ability to ignore distracters)ight be specifically associated to better performance in Dividing
nd Focusing Attention situations.Third, regarding the alerting network in the ANTI-V, none of the
riving situations include the presentation of warning signals andhus no particular association is expected with the phasic alertnesscore. Similarly, the current study was not specifically interested
n vigilance during driving and, therefore, did not contain any taskemands to manipulate vigilance (e.g., using a prolonged task orleep deprivation). Yet, it is possible to find significant results withhe phasic alertness or the vigilance measures, since both alertingevention 50 (2013) 1193– 1206 1195
network components are considered to play a relevant role in safelydriving, as previously claimed.
1.4. Relevance to driving research and application
A good understanding of how the attentional networks influ-ence common driving situations could be useful in various ways.For example, as raised by Weaver et al. (2009), each neural net-work is mainly influenced by a specific neurotransmitter (executivecontrol by dopamine, attentional orienting by acetylcholine, andalerting by noradrenaline; Posner, 2008). Therefore, it is possible toanticipate the possible impact of some medications or some clini-cal conditions on drivers’ performance in particular situations. Forexample, drugs or clinical conditions modulating the cholinergicsystem would have an impact on driving situations associated withthe attentional orienting network, whereas performance in driv-ing situations associated with other attentional networks might bepreserved. Also, it could be possible to use the ANTI-V to obtainindividual patterns of attentional dysfunction (e.g., from clinicalpopulations or from subclinical elderly drivers), and then createdriving rehabilitation programmes customised to their needs.
In addition, data obtained in the current study might providefurther evidence of the validity of hazard detection-based driversimulators, such as the FAROS GB3 used in this study. If relevantassociations between the attentional indices from the ANTI-V andperformance in the driving simulator are observed, this wouldsuggest that simulator is able to tackle important cognitive com-ponents of real driving (i.e. the attentional functions of executivecontrol, attentional orienting and alertness).
2. Material and methods
2.1. Participants
A sample of 42 students from the University of Nottingham vol-unteered for this study. Twenty were females (48%) and their meanage was 22 (St. Dev. = 4). Each of them had a valid UK driving licenceand a minimum experience of 12 months since passing the drivingtest (mean = 4.5 years; St. Dev. = 3.7). Also, normal or corrected-to-normal vision was required. None of them had previous experiencewith the driver simulator.
2.2. Stimuli and apparatus
2.2.1. The attentional test (ANTI-V)The Attention Networks Test for Interactions and Vigilance (ANTI-
V) was used to measure the participants’ attentional functioning(for a more detailed description see Roca et al., 2011, 2012). An E-Prime v2.0 (Psychology Software Tools, Inc.) script controlled thestimulus presentation on a 21′′ monitor and responses were col-lected from a standard keyboard. The task was presented to theparticipants as a game where they were working in a Centre forTraffic Management and the drivers’ parking habits were understudy. As shown in Fig. 1, the background scene represented atwo-lane street with two parking lanes in the centre of the screen.For each trial, a row of five cars pointing either left or right wasbriefly presented (200 ms) on one of the two parking lanes. Eachcar subtended ∼1.71 degrees of horizontal visual angle with a gapof ∼0.43 degrees between them in a standard (non-vigilance) trial.The participants had to indicate the direction of the central car(target) by pressing “c” (left) or “m” (right) keys, and they had to
ignore the direction of the flanker cars (distracters). Responses upto 2,000 ms were allowed. In every trial, the duration of the initialand final empty scenes were adjusted so that the total trial timewas 4,100 ms.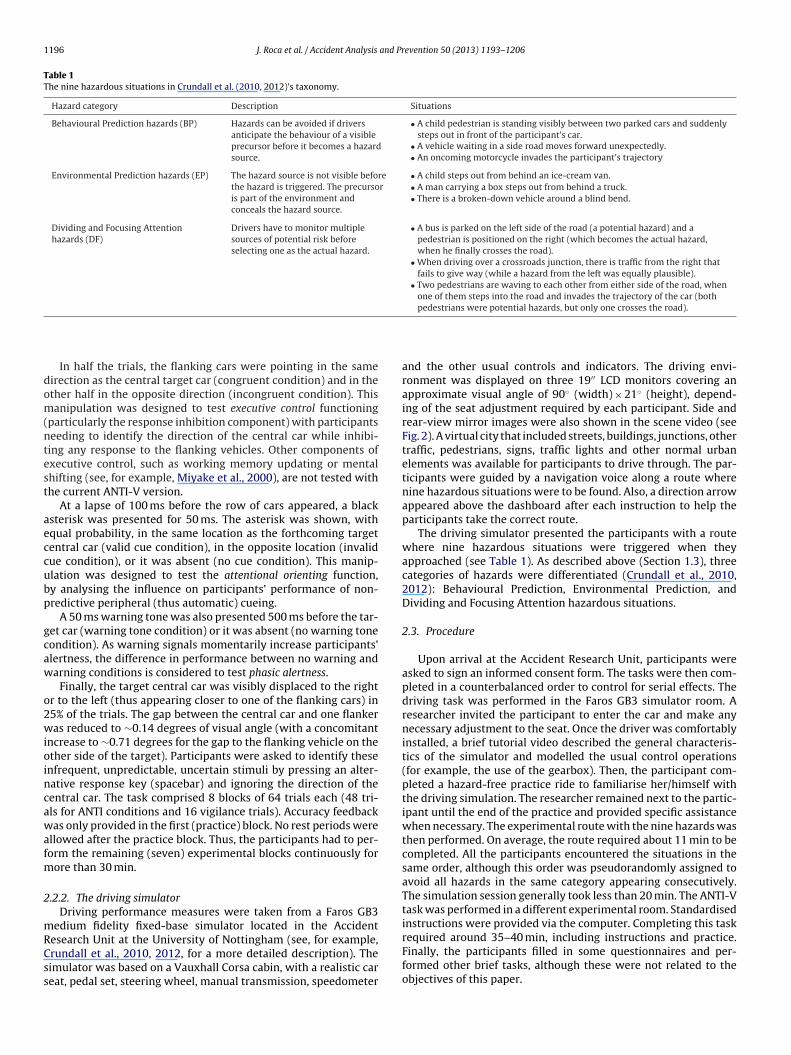
1196 J. Roca et al. / Accident Analysis and Prevention 50 (2013) 1193– 1206
Table 1The nine hazardous situations in Crundall et al. (2010, 2012)’s taxonomy.
Hazard category Description Situations
Behavioural Prediction hazards (BP) Hazards can be avoided if driversanticipate the behaviour of a visibleprecursor before it becomes a hazardsource.
• A child pedestrian is standing visibly between two parked cars and suddenlysteps out in front of the participant’s car.
• A vehicle waiting in a side road moves forward unexpectedly.• An oncoming motorcycle invades the participant’s trajectory
Environmental Prediction hazards (EP) The hazard source is not visible beforethe hazard is triggered. The precursoris part of the environment andconceals the hazard source.
• A child steps out from behind an ice-cream van.• A man carrying a box steps out from behind a truck.• There is a broken-down vehicle around a blind bend.
Dividing and Focusing Attentionhazards (DF)
Drivers have to monitor multiplesources of potential risk beforeselecting one as the actual hazard.
• A bus is parked on the left side of the road (a potential hazard) and apedestrian is positioned on the right (which becomes the actual hazard,when he finally crosses the road).
• When driving over a crossroads junction, there is traffic from the right thatfails to give way (while a hazard from the left was equally plausible).
• Two pedestrians are waving to each other from either side of the road, whenone of them steps into the road and invades the trajectory of the car (both
dom(ntest
aeccubp
gcaw
o2wioincawafm
2
mRCss
In half the trials, the flanking cars were pointing in the sameirection as the central target car (congruent condition) and in thether half in the opposite direction (incongruent condition). Thisanipulation was designed to test executive control functioning
particularly the response inhibition component) with participantseeding to identify the direction of the central car while inhibi-ing any response to the flanking vehicles. Other components ofxecutive control, such as working memory updating or mentalhifting (see, for example, Miyake et al., 2000), are not tested withhe current ANTI-V version.
At a lapse of 100 ms before the row of cars appeared, a blacksterisk was presented for 50 ms. The asterisk was shown, withqual probability, in the same location as the forthcoming targetentral car (valid cue condition), in the opposite location (invalidue condition), or it was absent (no cue condition). This manip-lation was designed to test the attentional orienting function,y analysing the influence on participants’ performance of non-redictive peripheral (thus automatic) cueing.
A 50 ms warning tone was also presented 500 ms before the tar-et car (warning tone condition) or it was absent (no warning toneondition). As warning signals momentarily increase participants’lertness, the difference in performance between no warning andarning conditions is considered to test phasic alertness.
Finally, the target central car was visibly displaced to the rightr to the left (thus appearing closer to one of the flanking cars) in5% of the trials. The gap between the central car and one flankeras reduced to ∼0.14 degrees of visual angle (with a concomitant
ncrease to ∼0.71 degrees for the gap to the flanking vehicle on thether side of the target). Participants were asked to identify thesenfrequent, unpredictable, uncertain stimuli by pressing an alter-ative response key (spacebar) and ignoring the direction of theentral car. The task comprised 8 blocks of 64 trials each (48 tri-ls for ANTI conditions and 16 vigilance trials). Accuracy feedbackas only provided in the first (practice) block. No rest periods were
llowed after the practice block. Thus, the participants had to per-orm the remaining (seven) experimental blocks continuously for
ore than 30 min.
.2.2. The driving simulatorDriving performance measures were taken from a Faros GB3
edium fidelity fixed-base simulator located in the Accident
esearch Unit at the University of Nottingham (see, for example,rundall et al., 2010, 2012, for a more detailed description). Theimulator was based on a Vauxhall Corsa cabin, with a realistic careat, pedal set, steering wheel, manual transmission, speedometerpedestrians were potential hazards, but only one crosses the road).
and the other usual controls and indicators. The driving envi-ronment was displayed on three 19′′ LCD monitors covering anapproximate visual angle of 90◦ (width) × 21◦ (height), depend-ing of the seat adjustment required by each participant. Side andrear-view mirror images were also shown in the scene video (seeFig. 2). A virtual city that included streets, buildings, junctions, othertraffic, pedestrians, signs, traffic lights and other normal urbanelements was available for participants to drive through. The par-ticipants were guided by a navigation voice along a route wherenine hazardous situations were to be found. Also, a direction arrowappeared above the dashboard after each instruction to help theparticipants take the correct route.
The driving simulator presented the participants with a routewhere nine hazardous situations were triggered when theyapproached (see Table 1). As described above (Section 1.3), threecategories of hazards were differentiated (Crundall et al., 2010,2012): Behavioural Prediction, Environmental Prediction, andDividing and Focusing Attention hazardous situations.
2.3. Procedure
Upon arrival at the Accident Research Unit, participants wereasked to sign an informed consent form. The tasks were then com-pleted in a counterbalanced order to control for serial effects. Thedriving task was performed in the Faros GB3 simulator room. Aresearcher invited the participant to enter the car and make anynecessary adjustment to the seat. Once the driver was comfortablyinstalled, a brief tutorial video described the general characteris-tics of the simulator and modelled the usual control operations(for example, the use of the gearbox). Then, the participant com-pleted a hazard-free practice ride to familiarise her/himself withthe driving simulation. The researcher remained next to the partic-ipant until the end of the practice and provided specific assistancewhen necessary. The experimental route with the nine hazards wasthen performed. On average, the route required about 11 min to becompleted. All the participants encountered the situations in thesame order, although this order was pseudorandomly assigned toavoid all hazards in the same category appearing consecutively.The simulation session generally took less than 20 min. The ANTI-Vtask was performed in a different experimental room. Standardisedinstructions were provided via the computer. Completing this task
required around 35–40 min, including instructions and practice.Finally, the participants filled in some questionnaires and per-formed other brief tasks, although these were not related to theobjectives of this paper.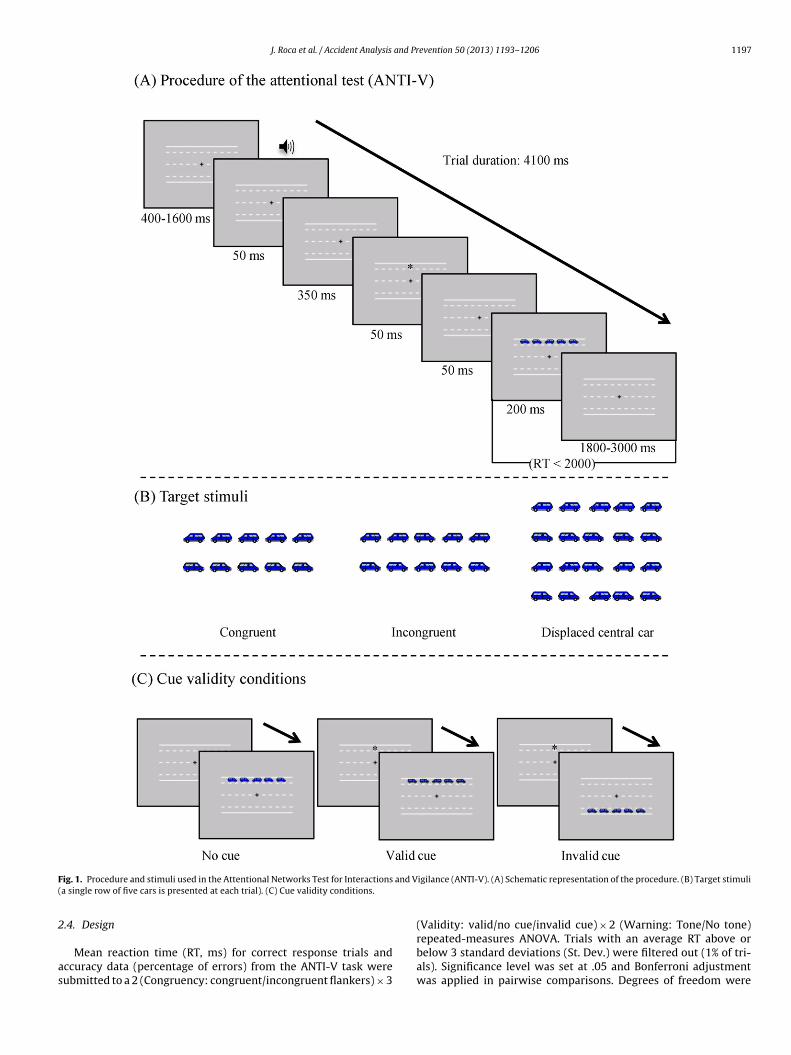
J. Roca et al. / Accident Analysis and Prevention 50 (2013) 1193– 1206 1197
F and V(
2
as
ig. 1. Procedure and stimuli used in the Attentional Networks Test for Interactionsa single row of five cars is presented at each trial). (C) Cue validity conditions.
.4. Design
Mean reaction time (RT, ms) for correct response trials andccuracy data (percentage of errors) from the ANTI-V task wereubmitted to a 2 (Congruency: congruent/incongruent flankers) × 3
igilance (ANTI-V). (A) Schematic representation of the procedure. (B) Target stimuli
(Validity: valid/no cue/invalid cue) × 2 (Warning: Tone/No tone)
repeated-measures ANOVA. Trials with an average RT above orbelow 3 standard deviations (St. Dev.) were filtered out (1% of tri-als). Significance level was set at .05 and Bonferroni adjustmentwas applied in pairwise comparisons. Degrees of freedom were
1198 J. Roca et al. / Accident Analysis and Pr
Fig. 2. A picture taken from inside the Faros GB3 cabin. Some of the different carcrf
actps2wgfl(tdtisvAtPuApFwtwtD
ete(cciaothdis
ontrols and indicators are shown. Also, an example of the simulated traffic envi-onment, including the side and rear-view mirror images, can be observed (adaptedrom Crundall et al., 2012).
djusted using the Greenhouse-Geisser method when sphericityould not be assumed. Different performance indices for the func-ioning of the three attentional networks were obtained for eacharticipant by subtracting average RT and percentage of errors ofpecific conditions (see, for example, Fan et al., 2002; Callejas et al.,004; Ishigami and Klein, 2010). An “Executive Control” score (EC)as obtained by subtracting “congruent” conditions from “incon-
ruent” conditions. A higher Executive Control score means thatankers have a greater impact on a participant’s performancesuggesting that the participant has worse executive control func-ioning). An “Attentional Orienting” score (AO) was measured as theifference between “invalid” and “valid” conditions. A higher Atten-ional Orienting score is obtained when the participant is morentensely influenced by non-predictive peripheral (thus automatic)patial cues, which confers a greater advantage when the cue isalid but a greater disadvantage when the cue is invalid. A “Phasiclertness” score (PhA) was obtained from “no cue” conditions, as
he difference between “no tone” and “tone” conditions. A higherhasic Alertness score is associated with a better performance atsing the warning signal to prepare to respond. Additionally, theNTI-V task provides a measure for vigilance by analysing thearticipant’s performance on the detection of infrequent stimuli.ollowing Roca et al. (2011), the percentages of hits and false alarmsere obtained and Signal Detection Theory (SDT) indices for sensi-
ivity (d′) and response bias (�) were computed. Three participantsere discarded because they failed to successfully complete the
ask or their overall percentage of errors was unusually high (>3 St.ev.).
The driving simulator provides detailed performance data forach participant. For example, in each of the nine hazardous situa-ions, speed (km/h) and brake pedal depression (%) were recordedvery 10-metre interval from 100 m to 10 m before the hazardhereafter the hazard window). The different performance indi-ators were then obtained from these data. First, approach speedhange (km/h) was calculated as the difference between the max-mum speed at the beginning of each hazard window (100–40 m)nd the minimum speed before reaching the hazard (30–10 m). Sec-nd, the farthest distance at which the participant started pressinghe brake pedal was considered the braking distance (m) in each
azardous situation. Also, crash occurrence was recorded when therivers collided with the hazard source or with any other elementn the traffic environment along the whole route. After a crash, theimulated car reappeared on the side of the road and participants
evention 50 (2013) 1193– 1206
were instructed to resume driving. Crundall et al. (2010), usingthe same simulator and driving situations, found that a safetytrained group reduced their speed to a greater extent on approachto hazards, applied pressure to the brakes sooner and had fewercrashes than untrained drivers. Therefore a greater approach speedchange, greater braking distance (i.e. earlier braking) and lowercrash frequency can be considered indicators of safer driving inhazardous situations, and individual scores in these measures weresubmitted to analysis in the current study. Two participants failedto complete the driving session due to simulator sickness and theirdata were discarded.
Finally, with the aim of analysing the relationship betweenattentional functioning and driving performance, Pearson’s corre-lations between the attentional scores obtained from the ANTI-V(executive control, attentional orienting, phasic alertness and vig-ilance measures) and the driving indicators from the simulator(approach speed change, braking distance and the number ofcrashes) were examined. Significance tests were computed for thenull hypothesis r = 0. When the correlation revealed a statisticallysignificant association, a linear regression analysis was computedto examine whether the driving simulator measures could be pre-dicted by using the attentional scores. The linear regression modelswere constructed in two steps: First, overall RT and percentage oferrors were considered using stepwise selection (since individualdifferences in these overall measures might mask the influence ofthe attentional components and reveal different strategies whenperforming the ANTI-V; see Roca et al., 2011, 2012). Second, theattentional scores were considered for inclusion using stepwiseselection. Condition indices were inspected to evaluate collinearity,and no value was equal or greater than 15 in these models.
3. Results
3.1. The attentional test (ANTI-V)
The usual main effects and interactions expected with theANTI-V task were obtained in the 2 (Congruency) × 3 (Validity) × 2(Warning) repeated-measures ANOVA (see Fig. 3). RT resultsrevealed that: (a) participants were faster when the central and theflanker cars were congruent as compared to when they were incon-gruent (618 ms and 691 ms, respectively; F(1,38) = 122.89; p < .001;eta2 = .76); (b) participants were faster when a valid cue was pre-sented in comparison to the no cue and invalid conditions (631, 659,and 674, respectively; F(2,76) = 41.17; p < .001; eta2 = .52). Pairwisecomparisons with Bonferroni correction confirmed the differencesbetween these three conditions (all p < .009); and (c) faster RTs wereobtained with the warning tone than when it was absent (639 and679, respectively; F(1,38) = 42.04; p < .001; eta2 = .53).
The overall pattern of interactions found by Roca et al. (2011)with the ANTI-V was also observed in the current study. The inter-action between cue validity and the congruency of the flankers wasstatistically significant (F(2,76) = 14.02; p < .001; eta2 = .27). Furtheranalysis revealed that the congruency effect was higher in invalidconditions (96 ms) than in no cue (68 ms) (F(1,38) = 8.70; p = .005;eta2 = .19), whereas the difference between the latter (no cue) andvalid conditions (54 ms) was smaller and failed to reach the sig-nificance level (F(1,38) = 3.88; p = .06; eta2 = .09). The interactionbetween the presence of a warning tone and cue validity wasstatistically significant (F(2,76) = 5.09; p = .008; eta2 = .12). Furtheranalysis showed that the difference between invalid and valid cueswas slightly higher after a warning tone (48 ms) than without the
tone (37 ms), although this interaction was not statistically signif-icant when “no cue” trials were excluded (F(1,38) = 1.66; p = .21;eta2 = .04). The ANTI-V typically does not produce a significantinteraction between the presence of the warning tone and flanker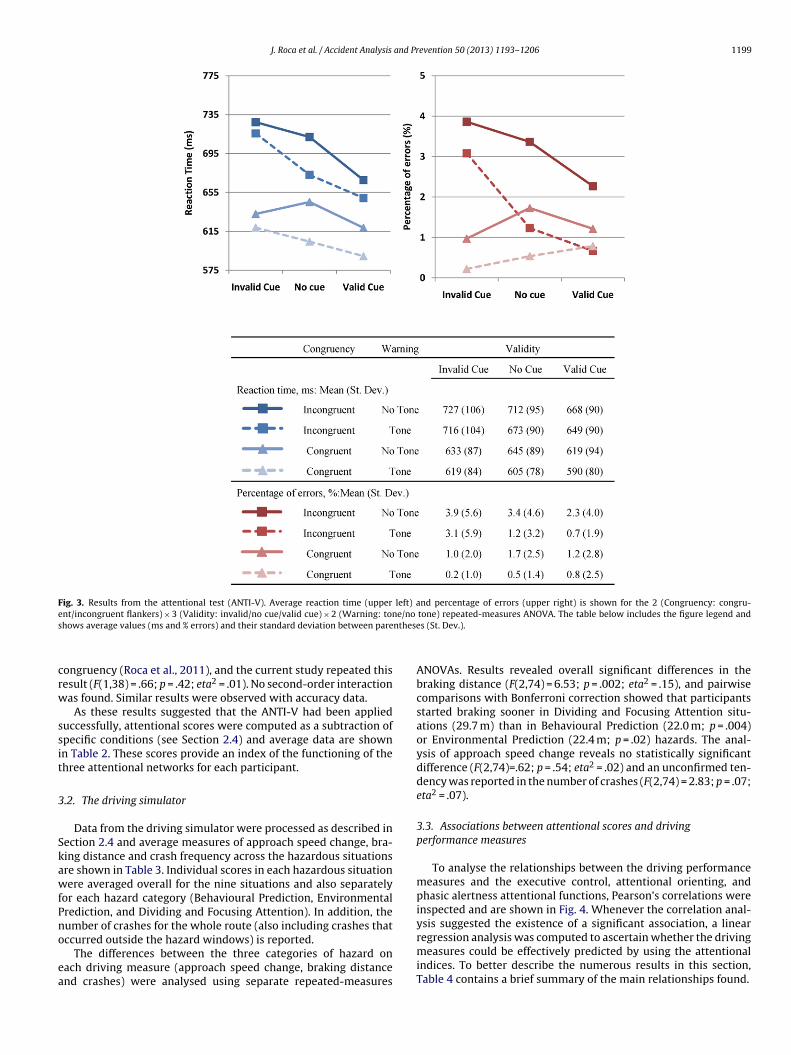
J. Roca et al. / Accident Analysis and Prevention 50 (2013) 1193– 1206 1199
Fig. 3. Results from the attentional test (ANTI-V). Average reaction time (upper left) and percentage of errors (upper right) is shown for the 2 (Congruency: congru-e e/no
s nthese
crw
ssit
3
SkawfPno
ea
nt/incongruent flankers) × 3 (Validity: invalid/no cue/valid cue) × 2 (Warning: tonhows average values (ms and % errors) and their standard deviation between pare
ongruency (Roca et al., 2011), and the current study repeated thisesult (F(1,38) = .66; p = .42; eta2 = .01). No second-order interactionas found. Similar results were observed with accuracy data.
As these results suggested that the ANTI-V had been applieduccessfully, attentional scores were computed as a subtraction ofpecific conditions (see Section 2.4) and average data are shownn Table 2. These scores provide an index of the functioning of thehree attentional networks for each participant.
.2. The driving simulator
Data from the driving simulator were processed as described inection 2.4 and average measures of approach speed change, bra-ing distance and crash frequency across the hazardous situationsre shown in Table 3. Individual scores in each hazardous situationere averaged overall for the nine situations and also separately
or each hazard category (Behavioural Prediction, Environmentalrediction, and Dividing and Focusing Attention). In addition, theumber of crashes for the whole route (also including crashes that
ccurred outside the hazard windows) is reported.The differences between the three categories of hazard onach driving measure (approach speed change, braking distancend crashes) were analysed using separate repeated-measures
tone) repeated-measures ANOVA. The table below includes the figure legend ands (St. Dev.).
ANOVAs. Results revealed overall significant differences in thebraking distance (F(2,74) = 6.53; p = .002; eta2 = .15), and pairwisecomparisons with Bonferroni correction showed that participantsstarted braking sooner in Dividing and Focusing Attention situ-ations (29.7 m) than in Behavioural Prediction (22.0 m; p = .004)or Environmental Prediction (22.4 m; p = .02) hazards. The anal-ysis of approach speed change reveals no statistically significantdifference (F(2,74)=.62; p = .54; eta2 = .02) and an unconfirmed ten-dency was reported in the number of crashes (F(2,74) = 2.83; p = .07;eta2 = .07).
3.3. Associations between attentional scores and drivingperformance measures
To analyse the relationships between the driving performancemeasures and the executive control, attentional orienting, andphasic alertness attentional functions, Pearson’s correlations wereinspected and are shown in Fig. 4. Whenever the correlation anal-ysis suggested the existence of a significant association, a linear
regression analysis was computed to ascertain whether the drivingmeasures could be effectively predicted by using the attentionalindices. To better describe the numerous results in this section,Table 4 contains a brief summary of the main relationships found.
1200 J. Roca et al. / Accident Analysis and Prevention 50 (2013) 1193– 1206
Table 2Summary of results for the attentional measures taken from the ANTI-V (minimum and maximum values, mean and standard deviation, St. Dev.): Attention network scores(executive control, attentional orienting and phasic alertness), for both (a) reaction time and (b) the percentage of errors; (c) Vigilance measures (hits, false alarms, sensitivity,and response bias); and (d) Global reaction time and global percentage of errors.
Minimum Maximum Mean St. Dev.
(a) Attentional scores: RT (ms)Executive control 11 237 73 41Attentional orienting −10 131 43 34Phasic alertness −56 110 39 39
(b) Attentional scores: % errorsExecutive control −1.3 8.6 1.6 2.3Attentional orienting −7.8 10.6 0.8 2.9Phasic alertness −4.4 8.7 1.7 3.1
(c) Vigilance measuresHits (%) 20 84 56 16False alarms (%) 1.0 14.0 2.7 2.7Sensitivity (d′) 1.3 2.8 2.2 0.4Response Bias (ˇ) 1.6 15.0 9.0 4.7
(d) Global resultsANTI RT (ms) 534 839 656 82ANTI % error 0.0 6.2 1.7 1.7
N = 38.
Table 3Summary of results for the driving performance measures taken from the Faros GB3 simulator (minimum and maximum values, mean and standard deviation, St. Dev.): (a)Average approach speed change (km/h), (b) braking distance (m), and (c) number of crashes, computed for each category of hazard (behavioural prediction, environmentalprediction, and dividing and focusing attention) and also overall for the nine hazardous situations. The number of crashes for the whole route (including data from insideand outside the hazard windows) is also reported.
Minimum Maximum Mean St. Dev.
(a) Approach speed change (km/h)Behavioural prediction 1.7 31.3 17.8 6.7Environmental prediction 0.7 40.3 18.0 9.5Dividing and focusing attention 8.7 37.3 19.6 7.5Overall situations 8.6 26.2 18.5 4.7
(b) Braking distance (m)Behavioural prediction 3.3 60.0 22.0 11.9Environmental prediction 0.0 56.7 22.4 12.1Dividing and focusing attention 3.3 63.3 29.7 12.8Overall situations 10.0 55.6 24.8 8.8
(c) Number of crashesBehavioural prediction 0 2 0.1 0.4Environmental prediction 0 2 0.3 0.6Dividing and focusing attention 0 2 0.3 0.5
N
3-
3-
Overall situations 0Whole route 0
= 38.
.3.1. Attentional functioning and approach speed change Environmental Prediction situations: The Attentional Orientingscore in RT was positively correlated with approach speed changein Environmental Prediction situations (r = .50; p = .002), suggest-ing that those participants who were more intensely influencedby spatial cues in the ANTI-V were more likely to reduce theirspeed on approach to an Environmental Prediction hazard. Theregression analysis confirmed that the Attentional Orientingscore in RT was predictive of the approach speed change in thesesituations (F(1,36) = 11.66; p = .002; R2 = .22; ˇAO-RT = .50).
.3.2. Attentional functioning and braking distance Overall for the situations: A positive correlation betweenthe Attentional Orienting score in percentage of errors andoverall braking distance was statistically significant (r = .35;p = .03). The regression analysis confirmed that this attentionalscore was predictive of overall braking distance (F(1,36) = 5.03;p = .03; R2 = .10; ˇAO-%error = .35). These results suggest that a
greater influence of spatial cues on allocating attention to spe-cific locations in the ANTI-V may be associated with overallgreater braking distance (i.e. earlier response) in the driversimulator.3 0.8 1.04 1.4 1.0
- Behavioural Prediction situations: Separate analyses for the threehazard categories showed that the reported positive correla-tion between the Attentional Orienting score in percentage oferrors and overall braking distance was explained mainly byBehavioural Prediction situations (r = .41; p = .01). The regressionanalysis confirmed that Attentional Orienting score in percentageof errors was predictive of the braking distance in these situations(F(1,36) = 7.08; p = .01; R2 = .14; ˇAO-%error = .41)
- Environmental Prediction situations: An unconfirmed positivetendency in the correlation between the Attentional Orientingscore in percentage of errors and the braking distance in Envi-ronmental Prediction situations was suggested (r = .31; p = .06).
- Dividing and Focusing Attention situations: A significant negativecorrelation between braking distance in Dividing and FocusingAttention situations and Attentional Orienting score in RT wasfound (r = −.43, p = .007), suggesting that, in situations wheremultiple potential hazards are shown, a greater influence of spa-tial cues on focusing attention may indeed be associated with areduced braking distance (i.e. delayed response). The regression
analysis confirmed this result, since the Attentional Orientingscore in RT was predictive of braking distance in Dividing andFocusing Attention situations (F(1,36) = 8.28; p = .007; R2 = .16;ˇAO-RT = −.43).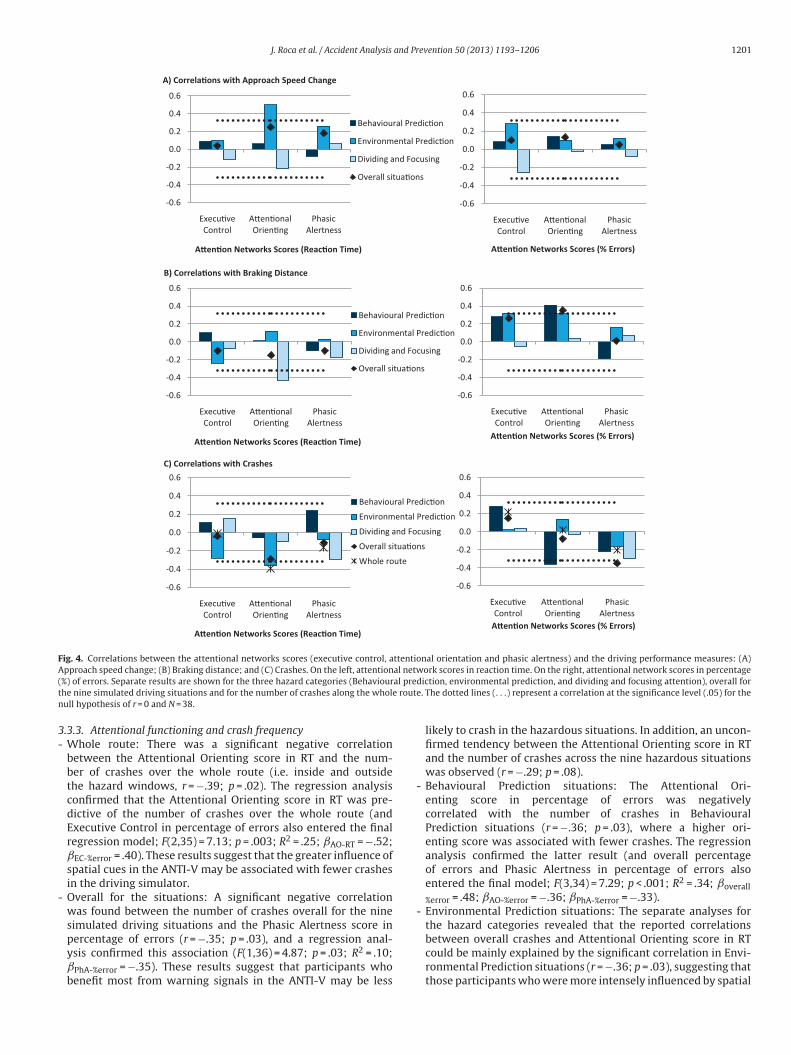
J. Roca et al. / Accident Analysis and Prevention 50 (2013) 1193– 1206 1201
-0.6
-0.4
-0.2
0.0
0.2
0.4
0.6
Execu�ve Control
A�en� onal Orien�ng
Phas ic Alertness
A�e n�on Netw orks Scores (% Errors )
-0.6
-0.4
-0.2
0.0
0.2
0.4
0.6
Execu�ve Control
A�en� onal Orien�ng
Phas ic Alertness
A�e n�on Netw orks Scores (% Errors )
-0.6
-0.4
-0.2
0.0
0.2
0.4
0.6
Execu�ve Control
A�en�onal Orien�ng
Phas ic Alertness
A�e n�on Networks Sco res (Re ac�on Time)
B) Correla�ons with Br aking Distance
Behavioural Pr edic�on
Environmental Pr edic�on
Dividi ng and Focusi ng
Overall situa� ons
-0.6
-0.4
-0.2
0.0
0.2
0.4
0.6
Execu�ve Control
A�en�onal Orien�ng
Phas ic Alertness
A�e n�on Networks Sco res (Re ac�on Time)
C) Correl a�ons with Crashes
Behavioural Pr edic�on
Environmental Pr edic�on
Dividi ng and Focusi ng
Overall situa� ons
Whole rou te
-0.6
-0.4
-0.2
0.0
0.2
0.4
0.6
Execu�ve Control
A�en� onal Orien�ng
Phas ic Alertness
A�e n�on Netw orks Scores (% Errors)
-0.6
-0.4
-0.2
0.0
0.2
0.4
0.6
Execu�ve Control
A�en�onal Orien�ng
Phas ic Alertness
A�e n�on Networks Sco res (Re ac�on Time)
A) Correl a�ons with Appro ach Speed Change
Behavioural Pr edic�on
Environmental Pr edic�on
Dividi ng and Focusi ng
Overall situa� ons
Fig. 4. Correlations between the attentional networks scores (executive control, attentional orientation and phasic alertness) and the driving performance measures: (A)Approach speed change; (B) Braking distance; and (C) Crashes. On the left, attentional network scores in reaction time. On the right, attentional network scores in percentage( al pret e routn
3-
-
%) of errors. Separate results are shown for the three hazard categories (Behaviourhe nine simulated driving situations and for the number of crashes along the wholull hypothesis of r = 0 and N = 38.
.3.3. Attentional functioning and crash frequency Whole route: There was a significant negative correlationbetween the Attentional Orienting score in RT and the num-ber of crashes over the whole route (i.e. inside and outsidethe hazard windows, r = −.39; p = .02). The regression analysisconfirmed that the Attentional Orienting score in RT was pre-dictive of the number of crashes over the whole route (andExecutive Control in percentage of errors also entered the finalregression model; F(2,35) = 7.13; p = .003; R2 = .25; ˇAO-RT = −.52;ˇEC-%error = .40). These results suggest that the greater influence ofspatial cues in the ANTI-V may be associated with fewer crashesin the driving simulator.
Overall for the situations: A significant negative correlationwas found between the number of crashes overall for the ninesimulated driving situations and the Phasic Alertness score in
percentage of errors (r = −.35; p = .03), and a regression anal-ysis confirmed this association (F(1,36) = 4.87; p = .03; R2 = .10;ˇPhA-%error = −.35). These results suggest that participants whobenefit most from warning signals in the ANTI-V may be lessdiction, environmental prediction, and dividing and focusing attention), overall fore. The dotted lines (. . .) represent a correlation at the significance level (.05) for the
likely to crash in the hazardous situations. In addition, an uncon-firmed tendency between the Attentional Orienting score in RTand the number of crashes across the nine hazardous situationswas observed (r = −.29; p = .08).
- Behavioural Prediction situations: The Attentional Ori-enting score in percentage of errors was negativelycorrelated with the number of crashes in BehaviouralPrediction situations (r = −.36; p = .03), where a higher ori-enting score was associated with fewer crashes. The regressionanalysis confirmed the latter result (and overall percentageof errors and Phasic Alertness in percentage of errors alsoentered the final model; F(3,34) = 7.29; p < .001; R2 = .34; ˇoverall
%error = .48; ˇAO-%error = −.36; ˇPhA-%error = −.33).- Environmental Prediction situations: The separate analyses for
the hazard categories revealed that the reported correlations
between overall crashes and Attentional Orienting score in RTcould be mainly explained by the significant correlation in Envi-ronmental Prediction situations (r = −.36; p = .03), suggesting thatthose participants who were more intensely influenced by spatial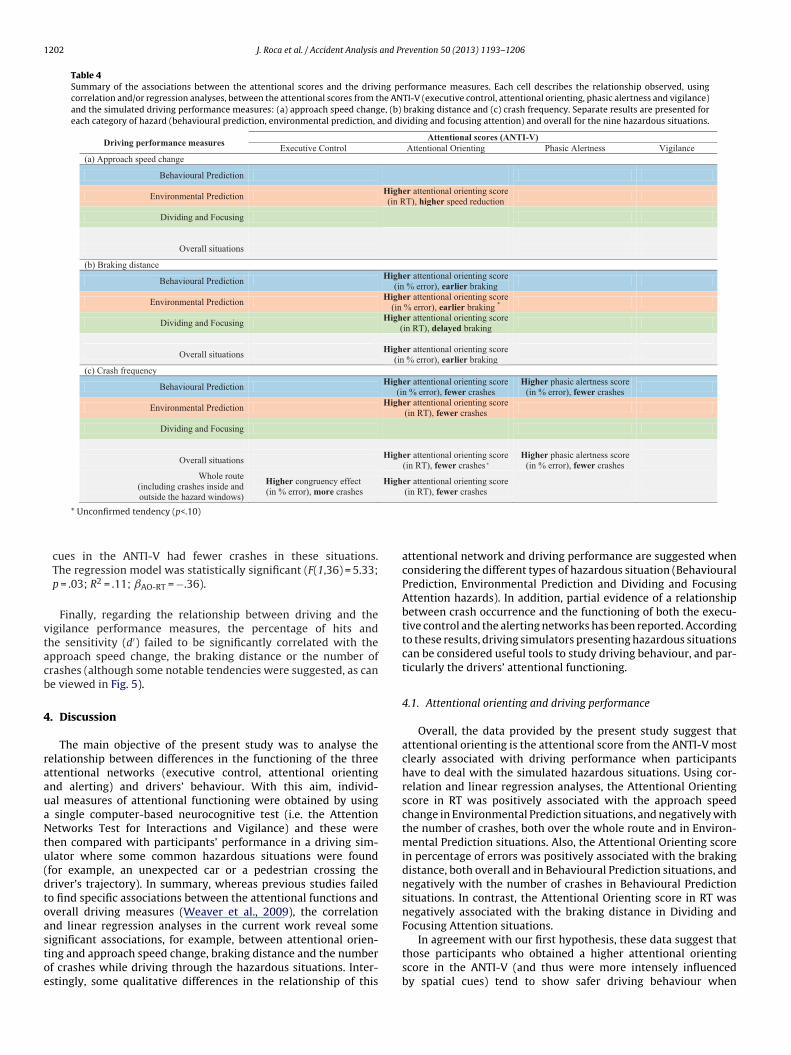
1202 J. Roca et al. / Accident Analysis and Prevention 50 (2013) 1193– 1206
Table 4Summary of the associations between the attentional scores and the driving performance measures. Each cell describes the relationship observed, usingcorrelation and/or regression analyses, between the attentional scores from the ANTI-V (executive control, attentional orienting, phasic alertness and vigilance)and the simulated driving performance measures: (a) approach speed change, (b) braking distance and (c) crash frequency. Separate results are presented foreach category of hazard (behavioural prediction, environmental prediction, and dividing and focusing attention) and overall for the nine hazardous situations.
Driving pe rforma nce measuresAttentional s cores (ANTI -V)
Executive Control Attentio nal Orient ing Phas ic Alertn ess Vigilance
(a) App roach speed change
Beha vioural Prediction
Environmental P redictionHigher attentio nal or ienting sco re
(in RT), high er speed re duction
Dividing and Focusing
Overall si tuations
(b) Br aking di stance
Beha vioural PredictionHigher attentio nal or ienting sco re
(in % e rror) , earlier brak ing
Environmental P redictionHigher attentio nal or ienting sco re
(in % e rror) , earlier brak ing *
Dividing and FocusingHigher attentio nal or ienting sco re
(in RT), delayed br aking
Overall si tuationsHigher attentio nal or ienting sco re
(in % e rror) , earlier brak ing
(c) Cra sh frequency
Beha vioural PredictionHigher attentio nal or ienting sco re
(in % e rror) , fewer cras hes
Higher phasic alertness score
(in % e rror) , fewer cras hes
Environmental P redictionHigher attentio nal or ienting sco re
(in RT), fewer cras hes
Dividing and Focusing
Overall si tuationsHigher attentio nal or ienting sco re
(in RT), fewer cras hes *Higher phasic alertness score
(in % e rror) , fewer cras hes
Whole route
(including cra shes inside and
outs ide th e hazard windows)
Higher congruency effect
(in % error), more cra shes
Higher attentio nal or ienting sco re
(in RT), fewer cras hes
vtacb
4
raauaNtu(dtoastoe
* Unconfirmed tendency (p<.10)
cues in the ANTI-V had fewer crashes in these situations.The regression model was statistically significant (F(1,36) = 5.33;p = .03; R2 = .11; ˇAO-RT = −.36).
Finally, regarding the relationship between driving and theigilance performance measures, the percentage of hits andhe sensitivity (d′) failed to be significantly correlated with thepproach speed change, the braking distance or the number ofrashes (although some notable tendencies were suggested, as cane viewed in Fig. 5).
. Discussion
The main objective of the present study was to analyse theelationship between differences in the functioning of the threettentional networks (executive control, attentional orientingnd alerting) and drivers’ behaviour. With this aim, individ-al measures of attentional functioning were obtained by using
single computer-based neurocognitive test (i.e. the Attentionetworks Test for Interactions and Vigilance) and these were
hen compared with participants’ performance in a driving sim-lator where some common hazardous situations were foundfor example, an unexpected car or a pedestrian crossing theriver’s trajectory). In summary, whereas previous studies failedo find specific associations between the attentional functions andverall driving measures (Weaver et al., 2009), the correlationnd linear regression analyses in the current work reveal some
ignificant associations, for example, between attentional orien-ing and approach speed change, braking distance and the numberf crashes while driving through the hazardous situations. Inter-stingly, some qualitative differences in the relationship of thisattentional network and driving performance are suggested whenconsidering the different types of hazardous situation (BehaviouralPrediction, Environmental Prediction and Dividing and FocusingAttention hazards). In addition, partial evidence of a relationshipbetween crash occurrence and the functioning of both the execu-tive control and the alerting networks has been reported. Accordingto these results, driving simulators presenting hazardous situationscan be considered useful tools to study driving behaviour, and par-ticularly the drivers’ attentional functioning.
4.1. Attentional orienting and driving performance
Overall, the data provided by the present study suggest thatattentional orienting is the attentional score from the ANTI-V mostclearly associated with driving performance when participantshave to deal with the simulated hazardous situations. Using cor-relation and linear regression analyses, the Attentional Orientingscore in RT was positively associated with the approach speedchange in Environmental Prediction situations, and negatively withthe number of crashes, both over the whole route and in Environ-mental Prediction situations. Also, the Attentional Orienting scorein percentage of errors was positively associated with the brakingdistance, both overall and in Behavioural Prediction situations, andnegatively with the number of crashes in Behavioural Predictionsituations. In contrast, the Attentional Orienting score in RT wasnegatively associated with the braking distance in Dividing andFocusing Attention situations.
In agreement with our first hypothesis, these data suggest thatthose participants who obtained a higher attentional orientingscore in the ANTI-V (and thus were more intensely influencedby spatial cues) tend to show safer driving behaviour when

J. Roca et al. / Accident Analysis and Pr
-0.6
-0.4
-0.2
0.0
0.2
0.4
0.6
Hits Sensi�vi ty-d'Vigi lance Measures
B) Correla�o ns with Br aki ng Distance
Behavioura l Pr edic�on
Environmental Pr edic�on
Dividi ng and Focusi ng
Overall si tua�ons
-0.6
-0.4
-0.2
0.0
0.2
0.4
0.6
Hits Sensi�vi ty-d'Vigi lance Measures
C) Correla�o ns wit h Crashe s
Behavioura l Pr edic�on
Environmental Pr edic�on
Dividi ng and Focusi ng
Overall si tua�ons
Whole rou te
-0.6
-0.4
-0.2
0.0
0.2
0.4
0.6
Hits Sensi�vi ty-d'Vigi lance Measures
A) Correla�o ns wit h Approach Speed Change
Behavioura l Pr edic�on
Environmental Pr edic�on
Dividi ng and Focusi ng
Overall si tua�ons
Fig. 5. Correlations between the vigilance measures (hits and sensitivity-d′) andthe driving performance measures: (A) Approach Speed Change; (B) Braking Dis-tance; and (C) Crashes. Separate results are shown for the three hazard categories(Behavioural Prediction, Environmental Prediction, and Dividing and FocusingAot
ar(i(swtot(atpt
ttention), overall for the nine simulated driving situations and for the numberf crashes along the whole route. The dotted lines (. . .) represent a correlation athe significance level (.05) for the null hypothesis of r = 0 and N = 38.
pproaching Environmental Prediction hazards (greater speededuction and fewer crashes) and Behavioural Prediction hazardsearlier braking and less crashes), whereas their behaviour in Divid-ng and Focusing Attention situations could be more dangerousdelayed braking). In Behavioural Prediction situations, the hazardource is visible before it becomes an actual hazard (for example,e can see the child before he steps outs in front of the car), and
hus it can be used as a precursor, or a visual cue, to the locationf the forthcoming hazard. In Environmental Prediction situations,he hazard source is concealed by a precursor in the environmentfor example, an ice-cream van hiding a pedestrian about to cross),
nd it is also possible to identify this precursor as a visual cue tohe location of the forthcoming hazard. Therefore, as suggested byrevious research (Crundall et al., 2012; Garay-Vega et al., 2007),hose participants with a higher ability to use their attention to giveevention 50 (2013) 1193– 1206 1203
processing priority to events occurring in spatially cued areas mayalso use this ability in the traffic environment to quickly detect andmore efficiently avoid a hazard source anticipated by a precursor.
On the other hand, in Dividing and Focusing Attention situationsthere are multiple hazard sources and it is impossible to anticipatewhich one is going to become the actual hazard (for example, thereare several cars approaching the crossroads but only one fails togive way). Thus, giving processing priority to a specific element inthe traffic environment (for example, a car approaching from theleft) will imply partially neglecting other potential hazard sources(for example, a car approaching from the right), and therefore moredangerous driving behaviour will be observed (for example, a delayin braking, as found in the current study). Underwood et al. (2011)reviewed different studies using eye-tracking technology in hazardperception situations and found convergent evidence to supportthat certain types of hazard are associated with a general reduc-tion in the spread of visual search, with hazardous events elicitinglonger fixations and less scanning of the traffic environment. Con-sistently with the findings in the current study, they claimed that,when a participant identifies a hazardous area, it is important thatthe information in this region is processed in depth and thereforethere may be advantages in monitoring that location (as found inBehavioural Prediction and Environmental Prediction situations);but there is also a potential danger in restricting visual search in sit-uations where over-focusing the attention may prevent the viewerfrom noticing and processing potential hazards elsewhere in thetraffic environment (as suggested for Dividing and Focusing Atten-tion situations).
In addition, these results for the attentional orienting networkare also in agreement with previous studies on the role of visualattention while driving. For example, certain studies have shownthat a computer-based test on visual attention (the Useful Fieldof Vision or UFoV) is sensitive in predicting risk for crash involve-ment, especially in older drivers (e.g., Ball et al., 1993; Ball et al.,2006). More specifically, Bédard et al. (2006) analysed the rela-tionship between driving performance and the inhibition of return(IOR), a reflexive visual attention mechanism that prevents atten-tion being re-allocated to a recently scanned location or object (seeKlein, 2000, or Lupiánez et al., 2006, for reviews). They observedthat IOR was associated with a measure of drivers’ ability to scanthe traffic environment effectively (the higher the IOR, the fewerthe scanning errors). The IOR is observed only when there are longdelays between the orienting cue and the relevant target and canbe considered a result of the habituation of the attentional cap-ture by the cue, so that the entire environment can be rapidlyexplored (Dukewich, 2009; Lupiánez, 2010). Thus, our data arecomplementary to Bédard et al.’s study and suggest that orien-ting attention to potential hazard precursors makes it possible tocope with them in a better way, thus showing safer performancein the driving task. However, paying attention to all the poten-tial precursors of hazards, when only one or some of them willin fact become hazards, could be more distracting than helpful tothe driver. In these situations, it is still important to attend to thepotential hazards, but it is also critical to habituate the attentionalcapture when they do not become a real risk. This would explainwhy both better attentional orienting (as in this study) and largerIOR (i.e. more habituation of attentional orienting, as in Bedardet al.’s study) are associated with safer driving performance.
4.2. Executive control network and driving performance
No significant association was found between the executive
control score and driving performance in Dividing and FocusingAttention hazardous situations, which did not provide supportour second hypothesis. Thus, individual differences in the exec-utive control component measured by the ANTI-V (i.e. response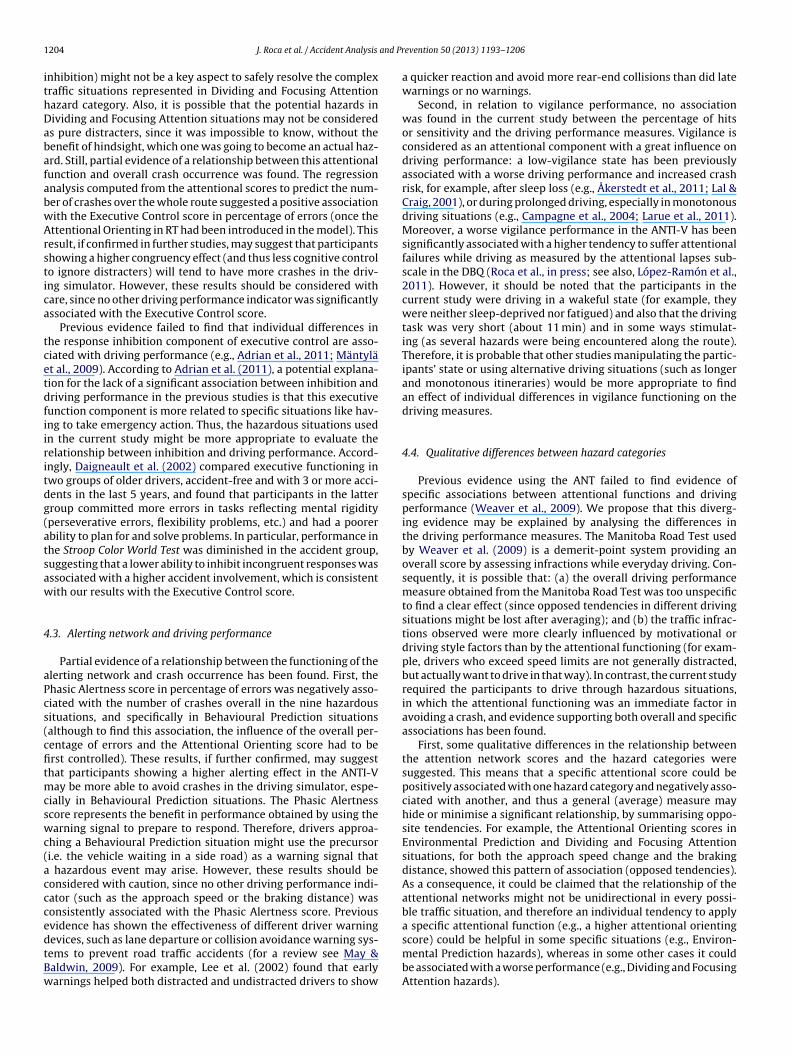
1 and Pr
ithDabafabwArstica
tcetdfiiritdg(atsaw
4
aPcs(cfitmcswc(acccedtBw
204 J. Roca et al. / Accident Analysis
nhibition) might not be a key aspect to safely resolve the complexraffic situations represented in Dividing and Focusing Attentionazard category. Also, it is possible that the potential hazards inividing and Focusing Attention situations may not be considereds pure distracters, since it was impossible to know, without theenefit of hindsight, which one was going to become an actual haz-rd. Still, partial evidence of a relationship between this attentionalunction and overall crash occurrence was found. The regressionnalysis computed from the attentional scores to predict the num-er of crashes over the whole route suggested a positive associationith the Executive Control score in percentage of errors (once thettentional Orienting in RT had been introduced in the model). Thisesult, if confirmed in further studies, may suggest that participantshowing a higher congruency effect (and thus less cognitive controlo ignore distracters) will tend to have more crashes in the driv-ng simulator. However, these results should be considered withare, since no other driving performance indicator was significantlyssociated with the Executive Control score.
Previous evidence failed to find that individual differences inhe response inhibition component of executive control are asso-iated with driving performance (e.g., Adrian et al., 2011; Mäntylät al., 2009). According to Adrian et al. (2011), a potential explana-ion for the lack of a significant association between inhibition andriving performance in the previous studies is that this executiveunction component is more related to specific situations like hav-ng to take emergency action. Thus, the hazardous situations usedn the current study might be more appropriate to evaluate theelationship between inhibition and driving performance. Accord-ngly, Daigneault et al. (2002) compared executive functioning inwo groups of older drivers, accident-free and with 3 or more acci-ents in the last 5 years, and found that participants in the latterroup committed more errors in tasks reflecting mental rigidityperseverative errors, flexibility problems, etc.) and had a poorerbility to plan for and solve problems. In particular, performance inhe Stroop Color World Test was diminished in the accident group,uggesting that a lower ability to inhibit incongruent responses wasssociated with a higher accident involvement, which is consistentith our results with the Executive Control score.
.3. Alerting network and driving performance
Partial evidence of a relationship between the functioning of thelerting network and crash occurrence has been found. First, thehasic Alertness score in percentage of errors was negatively asso-iated with the number of crashes overall in the nine hazardousituations, and specifically in Behavioural Prediction situationsalthough to find this association, the influence of the overall per-entage of errors and the Attentional Orienting score had to berst controlled). These results, if further confirmed, may suggesthat participants showing a higher alerting effect in the ANTI-V
ay be more able to avoid crashes in the driving simulator, espe-ially in Behavioural Prediction situations. The Phasic Alertnesscore represents the benefit in performance obtained by using thearning signal to prepare to respond. Therefore, drivers approa-
hing a Behavioural Prediction situation might use the precursori.e. the vehicle waiting in a side road) as a warning signal that
hazardous event may arise. However, these results should beonsidered with caution, since no other driving performance indi-ator (such as the approach speed or the braking distance) wasonsistently associated with the Phasic Alertness score. Previousvidence has shown the effectiveness of different driver warning
evices, such as lane departure or collision avoidance warning sys-ems to prevent road traffic accidents (for a review see May &aldwin, 2009). For example, Lee et al. (2002) found that earlyarnings helped both distracted and undistracted drivers to showevention 50 (2013) 1193– 1206
a quicker reaction and avoid more rear-end collisions than did latewarnings or no warnings.
Second, in relation to vigilance performance, no associationwas found in the current study between the percentage of hitsor sensitivity and the driving performance measures. Vigilance isconsidered as an attentional component with a great influence ondriving performance: a low-vigilance state has been previouslyassociated with a worse driving performance and increased crashrisk, for example, after sleep loss (e.g., Åkerstedt et al., 2011; Lal &Craig, 2001), or during prolonged driving, especially in monotonousdriving situations (e.g., Campagne et al., 2004; Larue et al., 2011).Moreover, a worse vigilance performance in the ANTI-V has beensignificantly associated with a higher tendency to suffer attentionalfailures while driving as measured by the attentional lapses sub-scale in the DBQ (Roca et al., in press; see also, López-Ramón et al.,2011). However, it should be noted that the participants in thecurrent study were driving in a wakeful state (for example, theywere neither sleep-deprived nor fatigued) and also that the drivingtask was very short (about 11 min) and in some ways stimulat-ing (as several hazards were being encountered along the route).Therefore, it is probable that other studies manipulating the partic-ipants’ state or using alternative driving situations (such as longerand monotonous itineraries) would be more appropriate to findan effect of individual differences in vigilance functioning on thedriving measures.
4.4. Qualitative differences between hazard categories
Previous evidence using the ANT failed to find evidence ofspecific associations between attentional functions and drivingperformance (Weaver et al., 2009). We propose that this diverg-ing evidence may be explained by analysing the differences inthe driving performance measures. The Manitoba Road Test usedby Weaver et al. (2009) is a demerit-point system providing anoverall score by assessing infractions while everyday driving. Con-sequently, it is possible that: (a) the overall driving performancemeasure obtained from the Manitoba Road Test was too unspecificto find a clear effect (since opposed tendencies in different drivingsituations might be lost after averaging); and (b) the traffic infrac-tions observed were more clearly influenced by motivational ordriving style factors than by the attentional functioning (for exam-ple, drivers who exceed speed limits are not generally distracted,but actually want to drive in that way). In contrast, the current studyrequired the participants to drive through hazardous situations,in which the attentional functioning was an immediate factor inavoiding a crash, and evidence supporting both overall and specificassociations has been found.
First, some qualitative differences in the relationship betweenthe attention network scores and the hazard categories weresuggested. This means that a specific attentional score could bepositively associated with one hazard category and negatively asso-ciated with another, and thus a general (average) measure mayhide or minimise a significant relationship, by summarising oppo-site tendencies. For example, the Attentional Orienting scores inEnvironmental Prediction and Dividing and Focusing Attentionsituations, for both the approach speed change and the brakingdistance, showed this pattern of association (opposed tendencies).As a consequence, it could be claimed that the relationship of theattentional networks might not be unidirectional in every possi-ble traffic situation, and therefore an individual tendency to applya specific attentional function (e.g., a higher attentional orienting
score) could be helpful in some specific situations (e.g., Environ-mental Prediction hazards), whereas in some other cases it couldbe associated with a worse performance (e.g., Dividing and FocusingAttention hazards).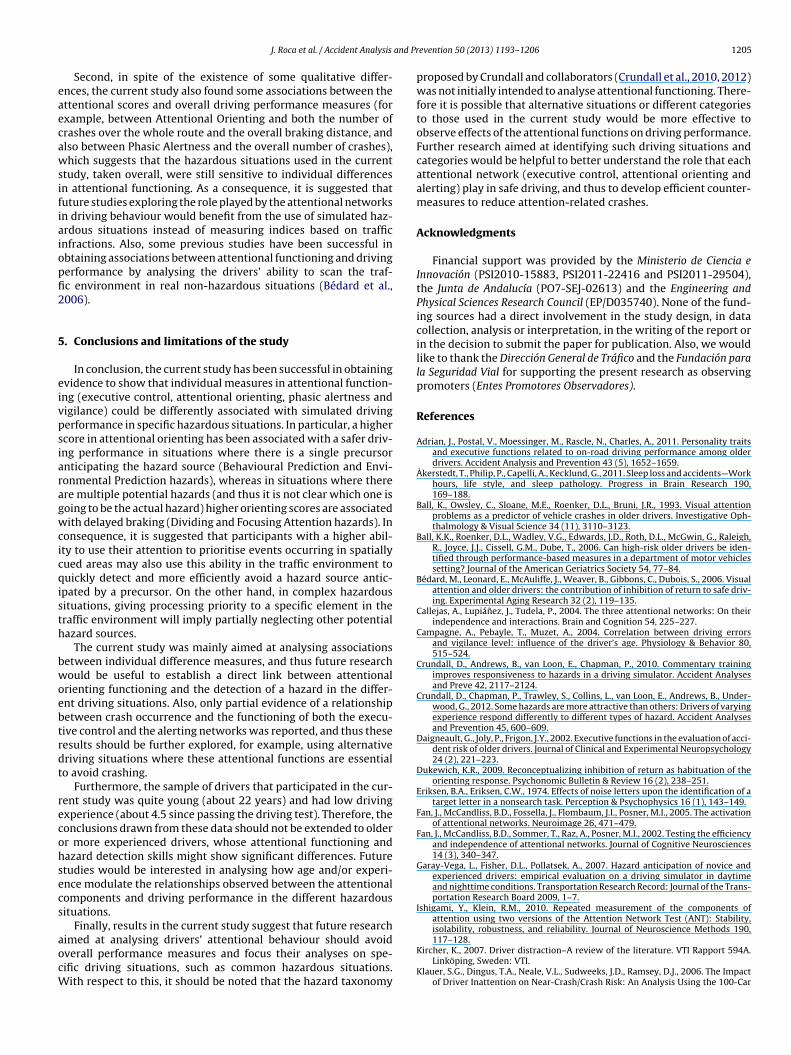
and Pr
eaecawsifiaiopfi2
5
eivpsiaragwcicqisth
bwoebtrdt
recohsecs
aocW
J. Roca et al. / Accident Analysis
Second, in spite of the existence of some qualitative differ-nces, the current study also found some associations between thettentional scores and overall driving performance measures (forxample, between Attentional Orienting and both the number ofrashes over the whole route and the overall braking distance, andlso between Phasic Alertness and the overall number of crashes),hich suggests that the hazardous situations used in the current
tudy, taken overall, were still sensitive to individual differencesn attentional functioning. As a consequence, it is suggested thatuture studies exploring the role played by the attentional networksn driving behaviour would benefit from the use of simulated haz-rdous situations instead of measuring indices based on trafficnfractions. Also, some previous studies have been successful inbtaining associations between attentional functioning and drivingerformance by analysing the drivers’ ability to scan the traf-c environment in real non-hazardous situations (Bédard et al.,006).
. Conclusions and limitations of the study
In conclusion, the current study has been successful in obtainingvidence to show that individual measures in attentional function-ng (executive control, attentional orienting, phasic alertness andigilance) could be differently associated with simulated drivingerformance in specific hazardous situations. In particular, a highercore in attentional orienting has been associated with a safer driv-ng performance in situations where there is a single precursornticipating the hazard source (Behavioural Prediction and Envi-onmental Prediction hazards), whereas in situations where therere multiple potential hazards (and thus it is not clear which one isoing to be the actual hazard) higher orienting scores are associatedith delayed braking (Dividing and Focusing Attention hazards). In
onsequence, it is suggested that participants with a higher abil-ty to use their attention to prioritise events occurring in spatiallyued areas may also use this ability in the traffic environment touickly detect and more efficiently avoid a hazard source antic-
pated by a precursor. On the other hand, in complex hazardousituations, giving processing priority to a specific element in theraffic environment will imply partially neglecting other potentialazard sources.
The current study was mainly aimed at analysing associationsetween individual difference measures, and thus future researchould be useful to establish a direct link between attentional
rienting functioning and the detection of a hazard in the differ-nt driving situations. Also, only partial evidence of a relationshipetween crash occurrence and the functioning of both the execu-ive control and the alerting networks was reported, and thus theseesults should be further explored, for example, using alternativeriving situations where these attentional functions are essentialo avoid crashing.
Furthermore, the sample of drivers that participated in the cur-ent study was quite young (about 22 years) and had low drivingxperience (about 4.5 since passing the driving test). Therefore, theonclusions drawn from these data should not be extended to olderr more experienced drivers, whose attentional functioning andazard detection skills might show significant differences. Futuretudies would be interested in analysing how age and/or experi-nce modulate the relationships observed between the attentionalomponents and driving performance in the different hazardousituations.
Finally, results in the current study suggest that future research
imed at analysing drivers’ attentional behaviour should avoidverall performance measures and focus their analyses on spe-ific driving situations, such as common hazardous situations.ith respect to this, it should be noted that the hazard taxonomy
evention 50 (2013) 1193– 1206 1205
proposed by Crundall and collaborators (Crundall et al., 2010, 2012)was not initially intended to analyse attentional functioning. There-fore it is possible that alternative situations or different categoriesto those used in the current study would be more effective toobserve effects of the attentional functions on driving performance.Further research aimed at identifying such driving situations andcategories would be helpful to better understand the role that eachattentional network (executive control, attentional orienting andalerting) play in safe driving, and thus to develop efficient counter-measures to reduce attention-related crashes.
Acknowledgments
Financial support was provided by the Ministerio de Ciencia eInnovación (PSI2010-15883, PSI2011-22416 and PSI2011-29504),the Junta de Andalucía (PO7-SEJ-02613) and the Engineering andPhysical Sciences Research Council (EP/D035740). None of the fund-ing sources had a direct involvement in the study design, in datacollection, analysis or interpretation, in the writing of the report orin the decision to submit the paper for publication. Also, we wouldlike to thank the Dirección General de Tráfico and the Fundación parala Seguridad Vial for supporting the present research as observingpromoters (Entes Promotores Observadores).
References
Adrian, J., Postal, V., Moessinger, M., Rascle, N., Charles, A., 2011. Personality traitsand executive functions related to on-road driving performance among olderdrivers. Accident Analysis and Prevention 43 (5), 1652–1659.
Åkerstedt, T., Philip, P., Capelli, A., Kecklund, G., 2011. Sleep loss and accidents—Workhours, life style, and sleep pathology. Progress in Brain Research 190,169–188.
Ball, K., Owsley, C., Sloane, M.E., Roenker, D.L., Bruni, J.R., 1993. Visual attentionproblems as a predictor of vehicle crashes in older drivers. Investigative Oph-thalmology & Visual Science 34 (11), 3110–3123.
Ball, K.K., Roenker, D.L., Wadley, V.G., Edwards, J.D., Roth, D.L., McGwin, G., Raleigh,R., Joyce, J.J., Cissell, G.M., Dube, T., 2006. Can high-risk older drivers be iden-tified through performance-based measures in a department of motor vehiclessetting? Journal of the American Geriatrics Society 54, 77–84.
Bédard, M., Leonard, E., McAuliffe, J., Weaver, B., Gibbons, C., Dubois, S., 2006. Visualattention and older drivers: the contribution of inhibition of return to safe driv-ing. Experimental Aging Research 32 (2), 119–135.
Callejas, A., Lupiánez, J., Tudela, P., 2004. The three attentional networks: On theirindependence and interactions. Brain and Cognition 54, 225–227.
Campagne, A., Pebayle, T., Muzet, A., 2004. Correlation between driving errorsand vigilance level: influence of the driver’s age. Physiology & Behavior 80,515–524.
Crundall, D., Andrews, B., van Loon, E., Chapman, P., 2010. Commentary trainingimproves responsiveness to hazards in a driving simulator. Accident Analysesand Preve 42, 2117–2124.
Crundall, D., Chapman, P., Trawley, S., Collins, L., van Loon, E., Andrews, B., Under-wood, G., 2012. Some hazards are more attractive than others: Drivers of varyingexperience respond differently to different types of hazard. Accident Analysesand Prevention 45, 600–609.
Daigneault, G., Joly, P., Frigon, J.Y., 2002. Executive functions in the evaluation of acci-dent risk of older drivers. Journal of Clinical and Experimental Neuropsychology24 (2), 221–223.
Dukewich, K.R., 2009. Reconceptualizing inhibition of return as habituation of theorienting response. Psychonomic Bulletin & Review 16 (2), 238–251.
Eriksen, B.A., Eriksen, C.W., 1974. Effects of noise letters upon the identification of atarget letter in a nonsearch task. Perception & Psychophysics 16 (1), 143–149.
Fan, J., McCandliss, B.D., Fossella, J., Flombaum, J.I., Posner, M.I., 2005. The activationof attentional networks. Neuroimage 26, 471–479.
Fan, J., McCandliss, B.D., Sommer, T., Raz, A., Posner, M.I., 2002. Testing the efficiencyand independence of attentional networks. Journal of Cognitive Neurosciences14 (3), 340–347.
Garay-Vega, L., Fisher, D.L., Pollatsek, A., 2007. Hazard anticipation of novice andexperienced drivers: empirical evaluation on a driving simulator in daytimeand nighttime conditions. Transportation Research Record: Journal of the Trans-portation Research Board 2009, 1–7.
Ishigami, Y., Klein, R.M., 2010. Repeated measurement of the components ofattention using two versions of the Attention Network Test (ANT): Stability,isolability, robustness, and reliability. Journal of Neuroscience Methods 190,
117–128.Kircher, K., 2007. Driver distraction–A review of the literature. VTI Rapport 594A.Linköping, Sweden: VTI.
Klauer, S.G., Dingus, T.A., Neale, V.L., Sudweeks, J.D., Ramsey, D.J., 2006. The Impactof Driver Inattention on Near-Crash/Crash Risk: An Analysis Using the 100-Car
1 and Pr
K
L
L
L
L
L
M
M
M
P
P
206 J. Roca et al. / Accident Analysis
Naturalistic Driving Study Data. DOT HS 810 594. Washington, USA: NationalHighway Traffic Safety Administration.
lein, R.M., 2000. Inhibition of return. Trends in Cognitive Sciences 4 (4),138–147.
al, S.K.L., Craig, A., 2001. A critical review of the psychophysiology of driver fatigue.Biological Psychology 55, 173–194.
arue, G.S., Rakotonirainy, A., Pettitt, A.N., 2011. Driving performance impairmentsdue to hypovigilance on monotonous roads. Accident Analysis and Prevention43, 2037–2046.
ópez-Ramón, M.F., Castro, C., Roca, J., Ledesma, R., Lupiánez, J., 2011. Attentionalnetworks functioning, age and attentional lapses while driving. Traffic InjuryPrevention 12 (5), 518–528.
upiánez, J., 2010. Inhibition of Return. In: Nobre, A.C., Coull, J.T. (Eds.), Attentionand Time. Oxford University Press, Oxford, UK, pp. 17–34.
upiánez, J., Klein, R.M., Bartolomeo, P., 2006. Inhibition of return: Twenty yearsafter. Cognitive Neuropsychology 23 (7), 1003–1014.
äntylä, T., Karlsson, M.J., Marklund, M., 2009. Executive control functions in sim-ulated driving. Applied Neuropsychology 16 (1), 11–18.
ay, J.F., Baldwin, C.L., 2009. Driver fatigue: The importance of identifying causalfactors of fatigue when considering detection and countermeasure technologies.Transportation Research Part F 12, 218–224.
iyake, A., Friedman, N.P., Emerson, M.J., Witzki, A.H., Howerter, A., Wager, T.D.,2000. The unity and diversity of executive functions and their contributions tocomplex “frontal lobe” tasks: A latent variable analysis. Cognitive Psychology
41, 49–100.osner, M.I., 1980. Orienting of attention. Quarterly Journal of Experimental Psych32, 3–25.
osner, M.I., 1994. Attention: the mechanism of consciousness. Proceedings of theNational Academy of Sciences 91 (16), 7398–7402.
evention 50 (2013) 1193– 1206
Posner, M.I., 2008. Measuring Alertness. Annals of the New York Academy of Sciences1129, 193–199.
Posner, M.I., Petersen, S.E., 1990. The attention system of the human brain. AnnualReview of Neuroscience 13, 25–42.
Ranney, T.A., 2008. Driver distraction: a review of the current state-of knowledge.DOT HS 810 787. Washington, USA: National Highway Traffic Safety Adminis-tration.
Regan, M.A., Hallett, C., Gordon, C.P., 2011. Driver distraction and driver inatten-tion: definition, relationship and taxonomy. Accident Analysis and Prevention43, 1771–1781.
Roca, J., Castro, C., López-Ramón, M.F., Lupiánez, J., 2011. Measuring vigilance whileassessing the functioning of the three attentional networks: The ANTI-Vigilancetask. Journal of Neuroscience Methods 298 (2), 312–324.
Roca, J., Fuentes, L.J., Marotta, A., López-Ramón, M.F., Castro, C., Lupiánez, J., Martella,D., 2012. The effects of sleep deprivation on the attentional functions and vigi-lance. Acta Psychologica 140 (2), 164–176.
Roca, J., Lupiánez, J., López-Ramón, M.F., Castro, C., in press. Are drivers’ attentionallapses associated with the functioning of neurocognitive attentional networksand with cognitive failure in everyday life?
Sturm, W., Willmes, K., 2001. On the functional neuroanatomy of intrinsic and phasicalertness. Neuroimage 14, S76–S84.
Stutts, J., Reinfurt, D., Staplin, L., Rodgman, E., 2001. The role of driver distractionin traffic crashes. Washington, DC: AAA Foundation for Traffic Safety. Retrievedfrom: http://www.aaafoundation.org/pdf/distraction.pdf
Underwood, G., Crundall, D., Chapman, P., 2011. Driving simulator validation withhazard perception. Transportation Research Part F 14, 435–446.
Weaver, B., Bédard, M., McAuliffe, J., Parkkari, M., 2009. Using the Attention Net-work Test to predict driving test scores. Accident Analysis and Prevention 41(1), 76–83.
Copyright © 2022 FDOKUMEN