The influence of body size and net diversification rate on molecular evolution during the radiation...
12
BioMed Central Page 1 of 12 (page number not for citation purposes) BMC Evolutionary Biology Open Access Research article The influence of body size and net diversification rate on molecular evolution during the radiation of animal phyla Eric Fontanillas* 1,3 , John J Welch 1,2 , Jessica A Thomas 1,3 and Lindell Bromham 1,3 Address: 1 Centre for the Study of Evolution, School of Life Sciences, University of Sussex, Falmer, Brighton, BN1 9QG, UK, 2 Institute of Evolutionary Biology; School of Biological Sciences; University of Edinburgh, West Mains Rd., Edinburgh, EH9 3JT, UK and 3 Centre for Macroevolution and Macroecology, School of Botany and Zoology, Australian National University, Canberra, A.C.T. 0200 Australia Email: Eric Fontanillas* - [email protected]; John J Welch - [email protected]; Jessica A Thomas - [email protected]; Lindell Bromham - [email protected] * Corresponding author Abstract Background: Molecular clock dates, which place the origin of animal phyla deep in the Precambrian, have been used to reject the hypothesis of a rapid evolutionary radiation of animal phyla supported by the fossil record. One possible explanation of the discrepancy is the potential for fast substitution rates early in the metazoan radiation. However, concerted rate variation, occurring simultaneously in multiple lineages, cannot be detected by "clock tests", and so another way to explore such variation is to look for correlated changes between rates and other biological factors. Here we investigate two possible causes of fast early rates: change in average body size or diversification rate of deep metazoan lineages. Results: For nine genes for phylogenetically independent comparisons between 50 metazoan phyla, orders, and classes, we find a significant correlation between average body size and rate of molecular evolution of mitochondrial genes. The data also indicate that diversification rate may have a positive effect on rates of mitochondrial molecular evolution. Conclusion: If average body sizes were significantly smaller in the early history of the Metazoa, and if rates of diversification were much higher, then it is possible that mitochondrial genes have undergone a slow-down in evolutionary rate, which could affect date estimates made from these genes. Background Dating the origin of the animal kingdom (Metazoa) has been a long standing challenge in evolutionary biology, and has important implications for our understanding of macroevolutionary processes and the tempo and mode of evolution [1,2]. One widely held view, the "Cambrian explosion" hypothesis, is that the major groups of animals diverged near-simultaneously during (or just before) the early Cambrian period [3]. This hypothesis stems from the sudden appearance of many metazoan phyla in the fossil record in the early Cambrian (from 542 to 488 mil- lion years ago, Mya). For while some consider the Edi- acaran fauna (approximately 600 to 542 Mya, however, most Ediacaran organisms are between 565 and 541 mil- lion years old [4]) to be ancestral metazoans (e.g., [5,6]) and putative Precambrian bilaterian fossils have been Published: 26 June 2007 BMC Evolutionary Biology 2007, 7:95 doi:10.1186/1471-2148-7-95 Received: 10 January 2007 Accepted: 26 June 2007 This article is available from: http://www.biomedcentral.com/1471-2148/7/95 © 2007 Fontanillas et al; licensee BioMed Central Ltd. This is an Open Access article distributed under the terms of the Creative Commons Attribution License (http://creativecommons.org/licenses/by/2.0 ), which permits unrestricted use, distribution, and reproduction in any medium, provided the original work is properly cited.
Transcript of The influence of body size and net diversification rate on molecular evolution during the radiation...

BioMed CentralBMC Evolutionary Biology
ss
Open AcceResearch articleThe influence of body size and net diversification rate on molecular evolution during the radiation of animal phylaEric Fontanillas*1,3, John J Welch1,2, Jessica A Thomas1,3 and Lindell Bromham1,3Address: 1Centre for the Study of Evolution, School of Life Sciences, University of Sussex, Falmer, Brighton, BN1 9QG, UK, 2Institute of Evolutionary Biology; School of Biological Sciences; University of Edinburgh, West Mains Rd., Edinburgh, EH9 3JT, UK and 3Centre for Macroevolution and Macroecology, School of Botany and Zoology, Australian National University, Canberra, A.C.T. 0200 Australia
Email: Eric Fontanillas* - [email protected]; John J Welch - [email protected]; Jessica A Thomas - [email protected]; Lindell Bromham - [email protected]
* Corresponding author
AbstractBackground: Molecular clock dates, which place the origin of animal phyla deep in thePrecambrian, have been used to reject the hypothesis of a rapid evolutionary radiation of animalphyla supported by the fossil record. One possible explanation of the discrepancy is the potentialfor fast substitution rates early in the metazoan radiation. However, concerted rate variation,occurring simultaneously in multiple lineages, cannot be detected by "clock tests", and so anotherway to explore such variation is to look for correlated changes between rates and other biologicalfactors. Here we investigate two possible causes of fast early rates: change in average body size ordiversification rate of deep metazoan lineages.
Results: For nine genes for phylogenetically independent comparisons between 50 metazoanphyla, orders, and classes, we find a significant correlation between average body size and rate ofmolecular evolution of mitochondrial genes. The data also indicate that diversification rate mayhave a positive effect on rates of mitochondrial molecular evolution.
Conclusion: If average body sizes were significantly smaller in the early history of the Metazoa,and if rates of diversification were much higher, then it is possible that mitochondrial genes haveundergone a slow-down in evolutionary rate, which could affect date estimates made from thesegenes.
BackgroundDating the origin of the animal kingdom (Metazoa) hasbeen a long standing challenge in evolutionary biology,and has important implications for our understanding ofmacroevolutionary processes and the tempo and mode ofevolution [1,2]. One widely held view, the "Cambrianexplosion" hypothesis, is that the major groups of animalsdiverged near-simultaneously during (or just before) the
early Cambrian period [3]. This hypothesis stems fromthe sudden appearance of many metazoan phyla in thefossil record in the early Cambrian (from 542 to 488 mil-lion years ago, Mya). For while some consider the Edi-acaran fauna (approximately 600 to 542 Mya, however,most Ediacaran organisms are between 565 and 541 mil-lion years old [4]) to be ancestral metazoans (e.g., [5,6])and putative Precambrian bilaterian fossils have been
Published: 26 June 2007
BMC Evolutionary Biology 2007, 7:95 doi:10.1186/1471-2148-7-95
Received: 10 January 2007Accepted: 26 June 2007
This article is available from: http://www.biomedcentral.com/1471-2148/7/95
© 2007 Fontanillas et al; licensee BioMed Central Ltd. This is an Open Access article distributed under the terms of the Creative Commons Attribution License (http://creativecommons.org/licenses/by/2.0), which permits unrestricted use, distribution, and reproduction in any medium, provided the original work is properly cited.
Page 1 of 12(page number not for citation purposes)
BMC Evolutionary Biology 2007, 7:95 http://www.biomedcentral.com/1471-2148/7/95
reported (e.g., refs. [7-10]), there are as yet no undisputedbilaterian fossils in the Proterozoic [11] and the severalhypotheses that support the existence of Precambrianbilaterians all seem to have some weaknesses (for areview, see [12]). The apparently rapid evolution of themajor groups of animals in the early Cambrian has longbeen considered a challenge to the universal applicationof Darwinian gradualism [13].
Against this "Cambrian explosion" hypothesis, it has beenargued that limitations of the fossil record may haveobscured the earlier evolutionary history of the Metazoa[2,14], and it therefore remains possible that the meta-zoan phyla arose not by an explosive radiation, but by along period of diversification [15]. Arguments for a Pre-cambrian diversification of animal phyla have come frommany sources, including phylogenetic [16] and palae-oecological analyses [17], but one of the most consistentlines of evidence has come from DNA sequence data.Molecular clock studies have traditionally relied upon theassumption that rates of molecular evolution are roughlyconstant over time and between lineages, meaning thatgenetic distance can be converted into an estimate of timesince divergence. Since the pioneering work of Runnegar[18], many studies have used the assumption of constantmolecular rates to date metazoan origins. These studieshave produced a wide range of date estimates for the ori-gin of bilaterians, with the date estimates for the splitbetween the protostomes and deuterostomes rangingfrom 630 Mya [19] to 1200 Mya ([20]). Although all strictmolecular clock studies (i.e. based on a constant molecu-lar rate) have placed the origin of bilaterians before thefirst undisputed fossil evidence in the Cambrian, thesestudies have been criticized for many reasons, particularlybecause evidence suggests that rates of molecular evolu-tion vary widely between different animal lineages(e.g.,[21]).
In response to these criticisms, molecular dating methodshave now been developed that allow for variation in rateof molecular evolution (for reviews see [22,23]). Whilemost rate-variable date estimates for the origins of majoranimal lineages are much older than the earliest bilaterianfossils (e.g. [24]), these methods have also producedsome dates that are considered more compatible with thefossil evidence (Peterson et al. date the last common bila-terian ancestor between 573 and 656 Mya, [25]; Aris-Bro-sou and Yang date the deuterostome/protostome split onaverage 582 ± 112 Mya, [26]). However, these very youngmolecular estimates rely on procedures expected on exter-nal grounds to yield artefactually young dates. For exam-ple, some procedures include methods of branch lengthestimation that are known to yield underestimates such asparsimony or minimum evolution methods [27], maxi-mum likelihood models that neglect between-site rate
heterogeneity [28], or use Bayesian methods with strongprior assumptions biased towards producing young dateestimates and fast early molecular rates [26,29,30]. There-fore, the conflict between molecular and palaeontologicaldates for the origin of the animal phyla remains unre-solved (for a review of this debate see [12]).
One possible explanation for the disagreement betweenpalaeontological and molecular estimates of animal ori-gins would be if rates of molecular evolution were fasterin all or most bilaterian lineages at the base of Cambrian[21,26]. But at this time, there is no molecular evidencefor higher rates of molecular evolution in the Cambrian.One possible reason for this, is that such concertedchanges in rate (e.g. where many lineages increase in rateat the same time) are a particular problem in moleculardating studies. Although new dating methods allow auto-correlation between ancestral and descendant lineages,they make no allowance for autocorrelation of ratesbetween descendant lineages. Moreover, such autocorre-lated changes in rate between lineages cannot be identi-fied by "clock tests" which aim to identify departures fromrate constancy [31]. Because concerted changes in ratecannot be detected from branch length estimates, rate-var-iable molecular dating methods will only account for suchchanges if they are incorporated into the estimation asprior knowledge.
All molecular dating methods must specify some form ofprior assumptions about both divergence dates andmolecular rates. Variable-rate methods can only accom-modate concerted changes in rate in two ways: throughthe date prior or the rate prior. Rate-variable methods mayspecify a date prior that allows a concerted rate change bycompressing or stretching all branches in part of the phy-logeny. This can be achieved in one of two ways [22]:using a model (such as a birth-death process) thatstretches portions of the tree, or via multiple calibrationseither side of the rate change. In practise, most rate-varia-ble dating methods have taken these approaches. How-ever, the use of evolutionary models to constrain rate-variable dates is problematic in that the assumptionsembodied in such methods (for example, birth and deathmodel of speciation), often do not adequately reflect thebiological systems being modelled. This is particularlyworrisome for some studies of the metazoan radiation,where it can be shown that the assumptions of the modelsare the main determinant for the young date estimates[30]. The use of multiple calibrations as constraints on thenodes of interest has the advantage of using empirical datato constrain solutions. However it makes the rate-variabledate estimates highly dependent on external calibrations,and prevents their use as a source of temporal informationthat is independent of the fossil record (which is impor-
Page 2 of 12(page number not for citation purposes)
BMC Evolutionary Biology 2007, 7:95 http://www.biomedcentral.com/1471-2148/7/95
tant for testing hypotheses such as the Cambrian explo-sion).
Alternatively, variable-rate methods can specify a rateprior that favours concerted changes. Again, this could bedone in one of two ways: by simply specifying a direction-ally biased model or by including additional informationthat has been independently found to be associated witha change in rates (e.g. a body size effect on molecularrates). Some rate-variable methods have included direc-tionally-biased models (e.g. [26]), in which case theyoung date estimates are a result of the assumption of fastearly rates, not a test of this hypothesis. The use of inde-pendent rate priors to take into account concerted changein rate-variable molecular dating has thus far never beenapplied, and would rely upon identifying correlates ofmolecular rate that may have varied systematically acrossthe phylogeny [22,32]. For example, if a life history traitwas found that correlated negatively with the rate ofmolecular evolution, and if that trait could be shown tohave increased in most metazoan lineages since the Cam-brian, then this might imply that rates were generallyfaster in Cambrian. Faster rates in the Cambrian wouldproduce a consistent bias in molecular date estimates,making molecular dates systematically overestimatedwhatever method or data was used. This is the motivationfor the present study. In this paper, we investigate twopotential correlates of molecular rate variation that may,in this way, help to explain the discrepancy betweenmolecular and fossil dates of the metazoan radiation.
The first potential correlate of molecular rate is body size.It has been proposed that ancestral small size in metazoanlineages would have increased rates of molecular evolu-tion (see discussion in [21]). This theory is supported byinterpretations of the fossil record suggesting that the ear-liest metazoans were much smaller than extant species,perhaps resembling modern meiofauna [33] or ciliatedmetazoan larvae [34]. However alternative hypothesessuggest the early presence of complex and large-bodiedmetazoans [12]. The potential correlation between ances-tral small size in metazoan and fast early rates is also sup-ported by the observation of a negative relationshipbetween body size and rate of molecular evolution in sev-eral vertebrates clades, including birds [35], reptiles [36]and mammals [37]. However, a recent study of inverte-brates which used sequence data from 330 species fromfive different phyla, found that, while rates of molecularevolution varied significantly, there was no evidence thatrate scaled with body size [38]. However that analysis wasrestricted to comparisons between species, genera andfamilies. It is possible that an influence of body size onrates of molecular evolution in the early stages of animalevolution will only be evident when extremely divergentlineages are compared. It is therefore interesting to inves-
tigate whether body size is associated with rate of molec-ular evolution at higher taxonomic levels (e.g. phylum,class and order).
We also investigate a second potential correlate of varia-tion in rate of molecular evolution: net diversification rate(i.e. speciation rate minus extinction rate). The Cambrianexplosion hypothesis suggests that net diversification ratemay have been greatly inflated during the early metazoanradiation [39]. A correlation between net diversificationrate and substitution rate has been observed in floweringplants [40], and for a collection of 56 phylogenies includ-ing several phylogenies of metazoans [41]. Theory alsosuggests that several speciation modes are expected toresult in an increase in substitution rate (see Discussion).Here we use estimates of extant species number to repre-sent the net diversification rate for the metazoan taxa.
In this study we use a phylogenetic comparative approachto compare rates of molecular evolution between meta-zoan phyla, classes, orders and families [see Additionalfile 1] that differ in taxon average body size and in speciesnumber. We examine rates of molecular evolution in ninedifferent genes (including mitochondrial and nuclear,protein- and RNA-coding genes). Our study shows strongevidence for a negative correlation between substitutionrate and body size for the mitochondrial genes. There isalso some evidence of a positive correlation between sub-stitution rate and net diversification rate for the mito-chondrial genes. This implies that if the earliestmetazoans were much smaller than their moderndescendants, and/or if the net diversification rate was sig-nificantly higher, then it is possible that rates of mito-chondrial molecular evolution could have been higherduring the early Cambrian. If this is true, then moleculardate estimates based on these sequences could systemati-cally overestimate the date of origin of metazoan phyla.
ResultsThe relationship between body size and molecular rate in mitochondrial genesThe mitochondrial sequences show clear evidence of anegative association between body size and rate of molec-ular evolution (Table 1). The C20 concatenated alignmentshows a significant negative correlation under the twopartitions of the sequence data (Table 1; C20 shows also asignificant negative correlation under the "gene partitionsmodel" implemented in PAML, results not shown). Thisobservation is also supported at the individual gene level,with two of the six mitochondrial genes showing signifi-cant correlations at the 5% level under the "No partition"model (COII and NADH4), and four of the six showingsignificant correlations at the 10% level under the "Codonpartitions" model (COII, COIII, cytB, NADH4). Further-more, correlation coefficients for all alignments were neg-
Page 3 of 12(page number not for citation purposes)
BMC Evolutionary Biology 2007, 7:95 http://www.biomedcentral.com/1471-2148/7/95
ative, whether significant or not. This negativerelationship is also evident from scatterplots of the data[see Additional file 2].
The relationship between net diversification rate and molecular rate in mitochondrial genesThere is also evidence, albeit weaker, that the rate ofmolecular evolution in mitochondrial genes is positivelycorrelated with clade size, which in this study is used torepresent net diversification rate. While this relationshipis only significant for a single gene (COIII: |rs| = 0.52; p-value = 0.031), the coefficients are positive in all cases,and the scatterplots confirm the positive trend [see Addi-tional file 3]. It is interesting to note the tendency of themitochondrial genes to produce "polygonal plots" aswhen the difference in species number is less than a factorof two (i.e of 1 on our log2 scale), then the rate differenceis highly variable, whereas the relationship appears some-what more obvious when the richness differences aremore dramatic. If this variation in rate contrast associatedwith small differences in species number is due to a meas-urement error effect (i.e. error in estimation of speciesnumber is expected to have a bigger impact on the smallcontrasts), it could add noise to the observed correlationand hide a stronger positive correlation between diversifi-cation rate and molecular rate.
Partial correlation test between molecular rate, body size and net diversification rate in mitochondrial genesBecause the negative correlation observed between molec-ular rate and body size could be an indirect result of a rela-tionship involving the net diversification rate, we
performed partial correlation tests which did not indicateany evidence for any relationship involving molecularrate, body size and net diversification rate together. How-ever, the interpretation of these results is problematic fordata which departs from a normal distribution [42].Moreover, consistent with the study by Orme et al. [43]our data indicate no evidence for a relationship betweenbody size and net diversification rate (p-value~1, resultsnot shown); the inclusion of the corresponding non-sig-nificant correlation coefficient in the partial correlationtests makes the interpretation of the results of such testsdifficult.
Study of correlates in nuclear genesIn contrast to the mitochondrial genes, the nuclear genesdo not show any significant relationship between molec-ular rate and either body size or net diversification rate.The correlation coefficients vary in sign, and are oftenclose to zero (Table 1). The sole exception is the correla-tion between body size and substitution rate for ef1awhich, though non-significant, is close in magnitude tothose observed for the mitochondrial sequences.
DiscussionThis study provides evidence that the rate of molecularevolution in mitochondrial genes is negatively correlatedwith body size for deep comparisons within the Metazoa.We have confidence in this result for several reasons. First,significant results were obtained for both concatenatedand single-gene sequences, despite the use of relativelyconservative non-parametric statistics. Second, all trendswere in the same direction (negatively correlated) whether
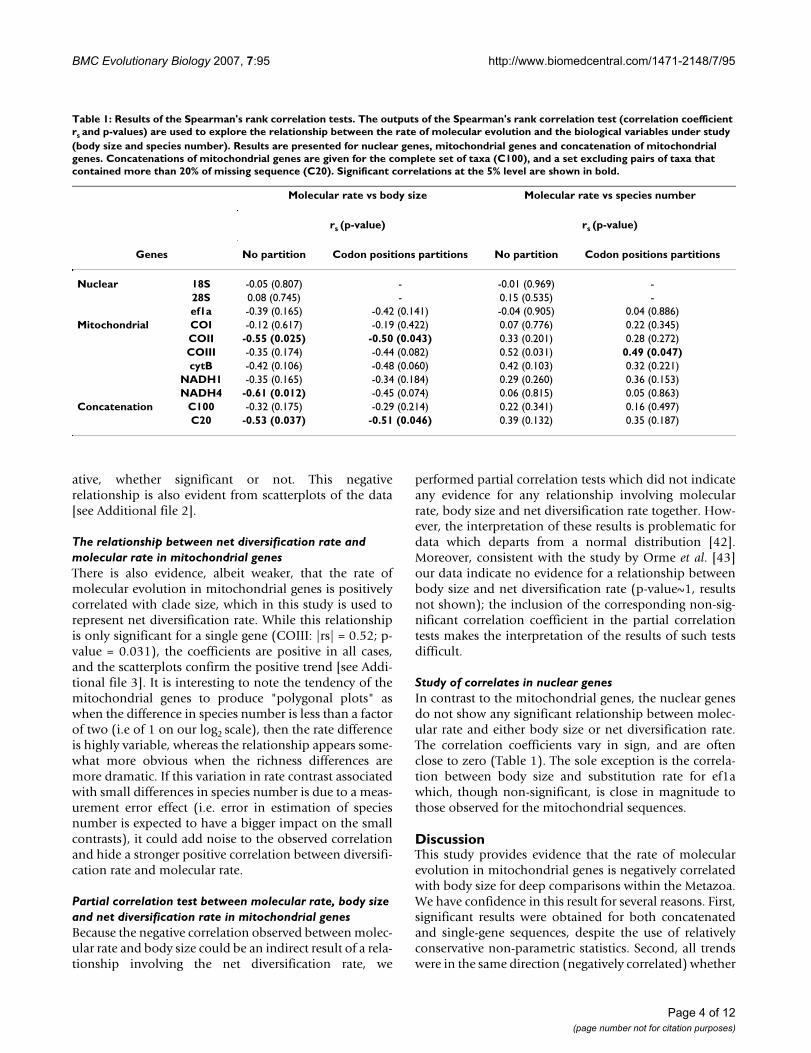
Table 1: Results of the Spearman's rank correlation tests. The outputs of the Spearman's rank correlation test (correlation coefficient rs and p-values) are used to explore the relationship between the rate of molecular evolution and the biological variables under study (body size and species number). Results are presented for nuclear genes, mitochondrial genes and concatenation of mitochondrial genes. Concatenations of mitochondrial genes are given for the complete set of taxa (C100), and a set excluding pairs of taxa that contained more than 20% of missing sequence (C20). Significant correlations at the 5% level are shown in bold.
Molecular rate vs body size Molecular rate vs species number
rs (p-value) rs (p-value)
Genes No partition Codon positions partitions No partition Codon positions partitions
Nuclear 18S -0.05 (0.807) - -0.01 (0.969) -28S 0.08 (0.745) - 0.15 (0.535) -ef1a -0.39 (0.165) -0.42 (0.141) -0.04 (0.905) 0.04 (0.886)
Mitochondrial COI -0.12 (0.617) -0.19 (0.422) 0.07 (0.776) 0.22 (0.345)COII -0.55 (0.025) -0.50 (0.043) 0.33 (0.201) 0.28 (0.272)COIII -0.35 (0.174) -0.44 (0.082) 0.52 (0.031) 0.49 (0.047)cytB -0.42 (0.106) -0.48 (0.060) 0.42 (0.103) 0.32 (0.221)
NADH1 -0.35 (0.165) -0.34 (0.184) 0.29 (0.260) 0.36 (0.153)NADH4 -0.61 (0.012) -0.45 (0.074) 0.06 (0.815) 0.05 (0.863)
Concatenation C100 -0.32 (0.175) -0.29 (0.214) 0.22 (0.341) 0.16 (0.497)C20 -0.53 (0.037) -0.51 (0.046) 0.39 (0.132) 0.35 (0.187)
Page 4 of 12(page number not for citation purposes)

BMC Evolutionary Biology 2007, 7:95 http://www.biomedcentral.com/1471-2148/7/95
or not tests were significant (Table 1). Third, our resultsare not confounded by evolutionary relationshipsbetween sequences (a common problem in the study ofrates of molecular evolution), because we used phyloge-netically independent comparisons, chosen from a phyl-ogeny supported by several recent studies [24,44-47].
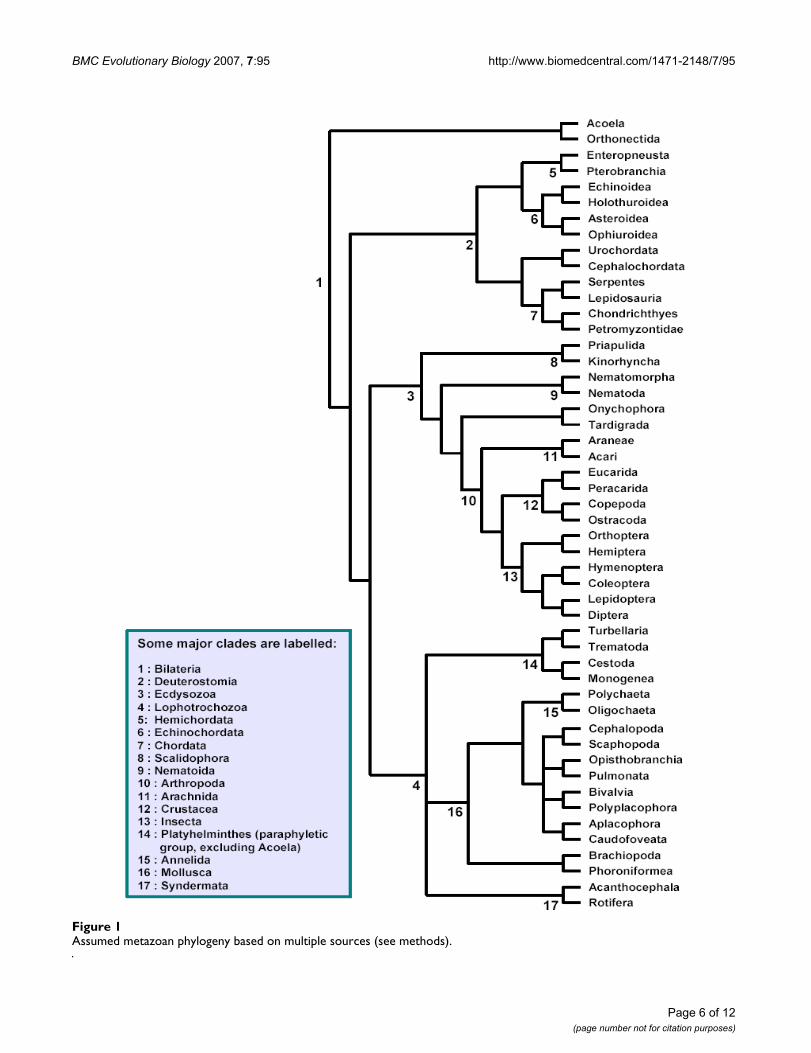
This result is in accordance with previous studies of rate ofmolecular evolution in vertebrates [37]. However, it is incontrast to that of Thomas et al. [38], which found no evi-dence of any body size effect over a wide range of inverte-brate taxa. So why does this study find evidence of arelationship in invertebrates, when the previous study didnot? The majority of data points in this study are compar-isons between invertebrate taxa (see Figure 1), so the asso-ciation is unlikely to be simply a result of the inclusion ofvertebrate comparisons (which were not included in Tho-mas et al. study). Furthermore, the two studies employvery similar methodologies, comparable sequence data,and overlapping taxonomic coverage. Importantly,though, the comparisons in Thomas et al. are at a differentlevel of the metazoan phylogeny to those used in thepresent study. Indeed, this study was designed to extendthat of Thomas et al., by sampling a part of the metazoanphylogeny not included in the earlier study. This is animportant distinction, because the deeper comparisonsincluded in this study (phylum, order and class) arepotentially more relevant to the problem of moleculardates for the metazoan radiation than the shallower com-parisons made by Thomas et al. (species, genus and fam-ily).
There are several possible reasons why this difference incomparison depth may be responsible for the differentresults obtained by the two studies. The use of muchdeeper comparisons may have increased the power of thetest in three ways. Firstly, the comparison pairs used herehave longer branch lengths. This means that every com-parison samples more substitutions, which will haveincreased the accuracy of the rate estimates (as long as thedata are not saturated). Secondly, the body size differ-ences were typically much greater in the present work: thecomparisons used by Thomas et al. differed in body sizeby a ratio of less than 8:1, whereas our comparisons havean average body size ratio of 125:1 [see Additional file 4].Thirdly, deeper comparisons may have greater resolvingpower if they overcome confounding effects of unknownvariables, which may fluctuate over evolutionary time. Forexample, a hidden causal variable might have masked theeffects of body size in shallow comparisons, if such a var-iable was fluctuating on timescales comparable to thedivergence times of species or genera.
In addition to differences in resolving power, it is possiblethat the discrepancy between the two studies is a result of
sampling different parts of metazoan diversity, and thatrates of molecular evolution really were affected by bodysize in the lineages included in the present study, but notin those sampled by Thomas et al. [38]. One possible dif-ference between the datasets is that most of the phyloge-nies analysed by Thomas et al. contained exclusivelyterrestrial invertebrates while most of the substitutionsmeasured in the current study will have taken place in amarine environment (even for phyla with many living ter-restrial representatives). It has been suggested that marineorganisms may have consistently different rates of molec-ular evolution due to, for example, larger effective popu-lation sizes [48] or a direct effect of salt concentration onmutation rates [49].
A further possibility, and one that is relevant to the issueof dating the metazoan radiation, is that the associationbetween body size and rates was more pronounced in theearly period of metazoan evolution. In this case, the effectdetected in this study might not be detected by studies ofmore recent metazoan lineages. However, we know of noreasons for such a temporal shift in the tempo and modeof molecular evolution.
Providing plausible causal explanations for the body sizeeffect we have observed is greatly complicated by the factthat so many life history traits, and other putative causalvariables, tend to covary with body size [37,50]. In partic-ular, two variables that co-vary with body size have beenput forward as potential causes of variation in molecularrates. Generation time may influence rates of molecularevolution because organisms that copy their germlineDNA more often per unit time are expected to incur moreDNA replication errors, which could increase the muta-tion rate. [35,50]. Alternatively, metabolic rate may influ-ence rates of DNA damage, through the production ofreactive oxygen species (ROS) which are by-products ofmetabolism [51]. Indeed, it has been suggested that met-abolic rate is the primary driver of rates of molecular evo-lution [50], linked to body mass through allometricscaling, perhaps through a "3/4 power law" (for a review,see [52]). However, the only studies that have explicitlycompared these two variables found no effect of meta-bolic rate on molecular rates above its covariation withgeneration time and body size [35,37]. Because both met-abolic rate and generation time may scale with body sizefor many metazoan lineages [52-55], we are unable to testwhich provides the better explanation for the pattern weobserve. However, it is possible that the metabolic rateeffect may provide an explanation for our observation ofa body size effect in mitochondrial genes but not innuclear genes. Because mitochondria are the site of pro-duction of ROS, it is possible that DNA damage frommetabolites accounts for a greater proportion of muta-tions in mitochondrial DNA than in nuclear DNA, poten-
Page 5 of 12(page number not for citation purposes)
BMC Evolutionary Biology 2007, 7:95 http://www.biomedcentral.com/1471-2148/7/95
Page 6 of 12(page number not for citation purposes)
Assumed metazoan phylogeny based on multiple sources (see methods)Figure 1Assumed metazoan phylogeny based on multiple sources (see methods).

BMC Evolutionary Biology 2007, 7:95 http://www.biomedcentral.com/1471-2148/7/95
tially explaining why we observe an effect in themitochondrial genes alone. Alternatively, it is possiblethat metabolic rate might influence the rate of adaptationof mitochondrial genes, thus potentially affecting the sub-stitution rate [56]. However, a recent study found no asso-ciation between metabolic rate and rate of molecularevolution for a large metazoan dataset [57].
Alternatively, the failure to detect a body size pattern inrates for nuclear genes may simply be an artefact of rela-tive lack of power: the nuclear sequences typically con-tained fewer substitutions per branch than did themitochondrial sequences, reducing our ability to accu-rately measure the substitution rate, and so reducing thepower of the tests. It is also possible that the effect we havedetected applies chiefly to synonymous substitutions inprotein coding sequences. Such substitutions will domi-nate estimates of the overall rate in mitochondrial, butnot in nuclear genes, because the former tend to have amuch lower ratio of amino-acid-changing to synonymoussubstitutions [56,58]. In support of this suggestion is theobservation that, in mammals, synonymous substitutionsshow more evidence of lineage-specific rate variation thando amino-acid-changing substitutions [59].
While the existence of a body size effect for deep meta-zoan comparisons is indicated relatively clearly by ouranalysis, evidence for a species number effect is moreequivocal. Although a significant result was obtained onlyfor a single mitochondrial gene (COIII), the agreement ofthe signs of the correlations across all of the mitochon-drial genes, together with observation of the scatterplots[see Additional file 3], tentatively suggest that rates ofmitochondrial evolution may increase with net diversifi-cation rate. These patterns are consistent with previousempirical work that has found a correlation betweendiversification rate and rate of molecular evolution[40,41]. Net diversification rate is the result of addition oflineages by speciation and removal of lineages by extinc-tion. It is difficult to predict the influence of variation inextinction rates on rates of molecular evolution, howeversome theoretical models do predict a link between speci-ation and rate of molecular change, and it is possible thatthis is the underlying cause of the relationship. For exam-ple, the population splitting involved in speciationimplies reduced effective population size (Ne) whichcould increase the fraction of mutations that are effec-tively neutral (with 0 <Ne|s| < < 1) and therefore able toreach fixation. (e.g., [60]). Speciation involving a founderevent [61] may involve an even more drastic reduction inNe. Alternatively, speciation involving adaptation to anew niche, or runaway sexual selection, may generateadaptive substitutions which could cause a detectableincrease in substitution rate. However, in contrast to thegenome-wide effects of a reduction in Ne, such adaptive
scenarios would be likely to generate gene-specific pat-terns which are unlikely to have been detected by ourstudy, particularly because we have targeted "house-keep-ing genes" involved in basic cellular processes common toall organisms (i.e. ribosomal RNAs and oxidative-chainproteins). Another consideration is that divergence itselfcan lead to speciation due to the accumulation of hybridincompatibilities (an idea developed in the Bateson-Dobzhansky-Muller model; [62,63]), and this appliesregardless of how the substitutions are caused (i.e.whether they are drift-mediated or adaptive substitu-tions). While these direct causal explanations are certainlypossible, as with the body size effect, it is also possiblethat we are observing an indirect relationship caused by ahidden variable. For example, a recent study in floweringplants suggests that environmental energy has strongindependent effects on both substitution rate and specia-tion rate [64].
ConclusionWe have shown that deep metazoan lineages differ sys-tematically in rate of molecular evolution for mitochon-drial genes. Importantly, our results suggest that if bodysize, or possibly net diversification rate, have shown con-sistent trends during the radiation of the Metazoa, then itis possible that many lineages could have undergone con-certed changes in rate of molecular evolution. Such a con-certed change could potentially confound attempts todate the metazoan radiation using mitochondrial protein-coding genes, whether by traditional molecular clockanalyses or the more recent rate-variable methods.
Our results also suggest that molecular dates might beoverestimated when larger animals are over-representedin the sampled taxa. Such a bias could apply even if thebody size of Metazoa has not systematically increased. Itis also important to note that our results apply only tomitochondrial genes, yet Precambrian molecular dateshave predominantly been generated from nuclear genedata.
However, our results do suggest that the search for biolog-ical correlates of molecular rates may uncover importantpatterns that may be used to assess the reliability ofmolecular dates, or develop new dating methods that canincorporate prior knowledge of molecular evolutionaryrates. In particular, this study emphasizes the importanceof examining patterns of molecular evolution at different"depths" in a phylogeny, as a pattern evident in deep com-parisons may not be detectable for shallow pairs.
MethodsComparison of phylogenetically independent sister taxaTo explore the relationship between lineage-specific ratesof molecular evolution and body size or net diversifica-
Page 7 of 12(page number not for citation purposes)

BMC Evolutionary Biology 2007, 7:95 http://www.biomedcentral.com/1471-2148/7/95
tion rate, we used the method of phylogenetically inde-pendent comparisons [65,66]. Such methods arenecessary due to the common ancestry of taxa, whichimplies that measurements from different taxa are not sta-tistically independent. Ignoring this fact means that thesame evolutionary history may be counted multipletimes, and this could generate a spurious associationbetween variables [66]. As such, we take as each datapointthe proportional change in the chosen variables betweena pair of sister taxa. Each pair is chosen so as not to overlapon the phylogeny with any other pair, ensuring that thedatapoints are statistically independent [37,38].
Choice of taxaWe collected data for 64 major taxa in the metazoan phy-logeny (Table 2). Phylogenetically independent sisterpairs were chosen from these 64 using an assumed phyl-ogeny (see Figure 1), constructed from multiple sources ofevidence from the literature (in particular from [24,44-47]. Because aspects of metazoan phylogeny remain con-troversial, we avoided including taxa whose placementvaried between our sources. If aspects of this phylogenyare found to be incorrect in future, we may have to revisesome data points, but we are confident that on the wholewe have been able to choose phylogenetically independ-ent comparisons (Table 2). Because we have restricted theanalysis to sister pairs, divergence dates for the pairs werenot required. Deep phylogenetic uncertainties, such as theposition of the Mollusca, did not affect the choice of thepairs. The comparison depth was chosen to optimizeDNA sequence availability and number of comparisons,targeting lineages relevant to dating the Cambrian explo-sion.
Body size and net diversification rate dataTo represent the variables of body size and net diversifica-tion rate, we used estimates of median adult biovolumeand extant species number presented in Orme et al. ([43]:Table 1). In their study, biovolume (in mm3) was calcu-lated for each taxon as the product of three linear dimen-sions – length, width and height – obtained from theliterature. For each linear dimension, the authors use themedian as a measure of central tendency, because of theleft skewed distribution of most of the taxa. For example,for the Nemertea, the median length is 75 mm but thearithmetic mean is 323 mm, largely because of the boot-lace worm (Lineus longissimus) which can be up to 10metres long. When one or two of these linear dimensionswere not available, Orme et al. extrapolated missing val-ues from the available dimensions and the body form. Netdiversification rate (the net result of speciation and extinc-tion for each taxon) is represented by the estimatednumber of extant species described per taxon (herereferred to as "clade size"). When several estimates wereavailable and differed between sources, Orme et al. chose
the most recent estimates, or the estimates from studieswhich focus on the particular taxa.
Substitution rate dataTo estimate change in rate of molecular evolution for eachof our species pairs, DNA sequence data from one speciesfrom each taxon was collected from GenBank ([67]; fordetails of sequences and taxons, see Additional files 5 and6). When several equally complete sequences were availa-ble for a taxon, one was chosen at random. Becausesequences of different types may show different patternsof evolution, separate results are reported for six mito-chondrial protein-coding genes (COI, COII, COIII, CytB,NADH1, NADH2), a nuclear protein-coding gene (ef1a)and two nuclear RNA-coding genes (18S, 28S). However,not all genes were available for all taxa [for details ofsequences, species names and accessions numbers, seeAdditional file 7].
The DNA sequences were automatically aligned usingClustalW [68]. These alignments were manually refinedusing BioEdit [69] and the unalignable parts excised:between 11% and 70% of the original sequences wereremoved depending on the gene [alignments are availablefrom the authors and for details of the excised part, seeAdditional file 8]. In addition to analysing each gene sep-arately, a concatenated alignment of the six mitochondrialgenes was generated, and if any taxon was missing a geneit was replaced by gaps. Because some concatenatedsequences included a relatively high proportion of gapsthat might bias branch length estimation, in addition tothe complete concatenated alignment (C100), we gener-ated a further alignment (C20) where pairs were removedif they contained over 20% of missing sequence. Fourpairs were removed under this criterion [see Additionalfile 9].
Fixing the phylogeny to the assumed relationships (seeFigure 1), we estimated branch lengths by maximum like-lihood, using the BASEML software from PAML v3.15[70]. For each sequence, we chose the HKY+Γ model ofDNA substitution, with parameter values estimated fromthe data for each alignment. Because our phylogeny con-tained long terminal branches and shorter internalbranches, the use of a more parameter-rich model mightlead to overparametrization, which can bias branchlength estimates [71,72]. For the protein-codingsequences, codon-based models could not be used, as ourphylogeny contains multiple genetic codes. However, forthese genes, separate results are reported for branchlengths estimated under a partition of the data into thethree codon positions. For the concatenated alignment ofsix mitochondrial genes, results are also reported for a par-tition in which each gene was assigned its own rate. Thecomputed values of the branch length estimates in each
Page 8 of 12(page number not for citation purposes)

BMC Evolutionary Biology 2007, 7:95 http://www.biomedcentral.com/1471-2148/7/95
pair of sister taxa are available in Additional files 5 and 6.To estimate the proportional change in the rate of molec-ular evolution between a pair of sister taxa, we used theratio of their maximum likelihood branch lengths. Eachbranch length is the product of a rate of evolution and adivergence time, so for pairs of sister taxa which share thesame divergence time, time cancels from the estimate withthe use of the ratio.
Statistical testsBecause we cannot assume any particular distribution forthe error associated with the variables under study(molecular rate, body size and clade size), we used thenon-parametric Spearman's rank correlation test toexplore their association. This test takes into account themagnitude of the difference in each variable, but makesno detailed assumptions about their associated error. Thetests were two-tailed, as we did not wish to assume thedirection of any potential association between rate and
traits. Tests were conducted using the programming lan-guage R [73], with PAML output initially formatted usingthe phylogenetic package Ape [74] available for R.
The Spearman's rank correlation test was used to test forassociations between the relative substitution rate variableand the biological traits variable (biovolume or cladesize). For each pair of taxa, the biological traits variable isthe ratio of the bigger over the smaller biological traitvalue. The relative substitution rate variable was repre-sented by the ratio BLBig /BLSmall where for a pair of taxa,BLBig and BLSmall represent the branch lengths of the taxonwith, respectively, the larger and smaller values of the rel-evant trait (biovolume or species number).
Authors' contributionsLB designed research project. EF and JT collected data, EFand JJW performed analyses. All authors wrote andapproved the final MS.
Table 2: Body size and species number values from Orme et al. [43] for each comparison pair. Comparisons 1 to 25 are the default set used for most genes (see Figure 1). Comparisons 26 to 29 are additional pairs used when sequence was unavailable for one or more of the default set.
Taxon 1 Taxon 2 Biovolume 1 (mm3) Biovolume 2 (mm3) Species number 1 Species number 2
1 Acoela Orthonectida 2.10E-02 1.30E-04 319 202 Turbellaria Trematoda 1.32E+01 1.25E-01 15000 200003 Cestoda Monogenea 1.12E+01 8.20E-02 10000 100004 Urochordata Cephalochordata 4.50E+03 2.31E+02 1990 255 Chondrichthyes Petromyzontidae 5.30E+07 9.84E+05 848 846 Serpentes Lepidosauria 1.13E+05 5.50E+03 2500 30007 Echinoidea Holothuroidea 1.93E+05 1.64E+04 950 11508 Asteroidea Ophiuroidea 1.72E+05 6.28E+03 1500 20009 Enteropneusta Pterobranchia 1.56E+03 6.60E+00 70 2510 Priapulida Kinorhyncha 6.35E+03 1.10E-03 17 15011 Nematomorpha Nematoda 8.33E+01 2.50E-03 304 2000012 Onychophora Tardigrada 8.51E+02 2.60E-03 70 60013 Araneae Acari 8.82E+01 2.01E+01 37000 4500014 Orthoptera Hemiptera 4.80E+02 4.25E+01 20000 9800015 Hymenoptera Coleoptera 5.00E+01 4.43E+01 120000 35000016 Lepidoptera Diptera 1.62E+02 9.40E+00 160000 12000017 Copepoda Ostracoda 6.90E-02 1.60E-02 9000 800018 Eucarida Peracarida 1.69E+04 3.20E+01 10566 1270619 Brachiopoda Phoroniformea 5.18E+03 5.80E+02 335 1220 Acanthocephala Rotifera 8.40E+00 3.20E-03 900 180021 Aplacophora Caudofoveata 1.56E+02 5.47E+01 180 7022 Bivalvia Polyplacophora 2.72E+03 8.58E+02 20000 55023 Cephalopoda Scaphopoda 7.33E+04 4.86E+00 656 35024 Opisthobranchia Pulmonata 2.21E+02 9.03E+01 1000 2000025 Polychaeta Oligochaeta 4.80E+02 1.86E+01 12000 6000
26 Petromyzontidae Urochordata 9.84E+05 4.50E+03 84 199027 Echinoidea Asteroidea 1.93E+05 1.72E+05 950 150028 Priapulida Nematoda 6.35E+03 2.50E-03 17 2000029 Cestoda Trematoda 1.12E+01 1.25E-01 10000 20000
Page 9 of 12(page number not for citation purposes)
BMC Evolutionary Biology 2007, 7:95 http://www.biomedcentral.com/1471-2148/7/95
Additional material
AcknowledgementsWe thank Mark Broom, Marcel Cardillo, Adam Eyre-Walker, Pierre Fonta-nillas, Manolis Ladoukadis, Rob Lanfear and Emmanuel Paradis for useful discussions. We thank also David Orme for useful comments on body size and species number data. This research was supported by a Biotechnology and Biological Sciences Research Council research grant.
References1. Smith AB, Peterson KJ: Dating the time of origin of major
clades: molecular clocks and the fossil record. Annu Rev EarthPlanet Sci 2002, 30:65-88.
2. Wray GA: Dating branches on the tree of life using DNA. GenBiol 2001, 3(1):1–7.
3. Gould SJ: Wonderful life: the Burgess Shale and the nature ofhistory. New York , W. W. Norton & Company; 2000.
4. Waggoner B: The Ediacaran biotas in space and time. Int CompBiol 2003, 43(1):104-113.
5. Shu DG, Morris SC, Han J, Li Y, Zhang XL, Hua H, Zhang ZF, Liu JN,Guo JF, Yao Y: Lower Cambrian Vendobionts from China andearly Diploblast evolution. Science 2006, 312(5774):731-734.
6. Glaessner MF: The dawn of animal life: a biohistorical study.Cambridge , Cambridge University Press; 1984.
7. Chen JY, Oliveri P, Li CW, Zhou GQ, Gao F, Hagadorn JW, PetersonKJ, Davidson EH: Precambrian animal diversity: putative phos-phatized embryos from the Doushantuo formation of China.Proc Natl Acad Sci USA 2000, 97:4457-4462.
8. Fedonkin MA, Waggoner BM: The late Precambrian fossil Kim-berella is a mollusc-like bilaterian organism. Nature 1997,388:868-871.
9. Xiao S, Knoll AH: Phosphatised animal embryos from the neo-proterozoic Doushantuo formation at Wen'an, Guizhou,South China. J Paleontol 2000, 74:767-788.
10. Wood RA, Grotzinger JP, Dickson JAD: Proterozoic modularbiomineralized metazoan from the Nama Group, Namibia.Science 2002, 296(5577):2383-2386.
Additional file 1Taxonomic ranks of the taxa under study.Click here for file[http://www.biomedcentral.com/content/supplementary/1471-2148-7-95-S1.pdf]
Additional file 2Scatterplots of the log of the relative molecular rate variable (y axis) versus the log of the relative biovolume variable (x axis) for each com-parison pair. BB and SB represent respectively the bigger and smaller bio-volumes; BL_BB and BL_SB represent the branch lengths of the taxon with, respectively, the larger and smaller biovolumes. Dotted lines indicate the median values of the variables. The branch lengths were estimated using three models: NP: no rate partition in the data; CP: codon position partitions for the protein-coding genes; GP: gene partitions for the con-catenation of mitochondrial genes. (a): nuclear genes; (b): mitochondrial genes; (c): concatenations of mitochondrial genes.Click here for file[http://www.biomedcentral.com/content/supplementary/1471-2148-7-95-S2.pdf]
Additional file 3Scatterplots of the log of the relative molecular rate variable (y axis) versus the log of the species number variable (x axis) for each compar-ison pair. BN and SN represent respectively the bigger and smaller species number; BL_BN and BL_SN represent the branch lengths of the taxon with, respectively, the larger and smaller species number. Dotted lines indicate the median values of the variables. The branch lengths were esti-mated using three models: NP: no rate partition in the data; CP: codon position partitions for the protein-coding genes; GP: gene partitions for the concatenation of mitochondrial genes. (a): nuclear genes; (b): mitochon-drial genes; (c): concatenations of mitochondrial genes.Click here for file[http://www.biomedcentral.com/content/supplementary/1471-2148-7-95-S3.pdf]
Additional file 4Comparison of body size ratios used in the present study with those used by Thomas et al.[38]. Shown for several taxa are the minimum ratio, the maximum ratio and geometric mean ratio.Click here for file[http://www.biomedcentral.com/content/supplementary/1471-2148-7-95-S4.pdf]
Additional file 5Branch length estimates and body size values (in mm3). Body size val-ues are taken from Orme et al. [43].Click here for file[http://www.biomedcentral.com/content/supplementary/1471-2148-7-95-S5.xls]
Additional file 6Branch length estimates and species richness values. Species richness values are taken from Orme et al. [43].Click here for file[http://www.biomedcentral.com/content/supplementary/1471-2148-7-95-S6.xls]
Additional file 7Pairs used for each gene under analysis. Each sequence that represents a taxon is reported together with its accession number from GenBank with the species it came from. The 25 first pairs represent the original pairs cho-sen on the metazoan tree (see Figure 1). Because gene sequences are not available for each pair, we chose additional phylogenetically independent pairs for certain genes (pairs 26 to 29). The symbol "-" indicates that gene sequences were not available for either one or both members of a compar-ison pair.Click here for file[http://www.biomedcentral.com/content/supplementary/1471-2148-7-95-S7.pdf]
Additional file 8Alignment length before and after removing unalignable sequence. Bases were excised manually in Bioedit [69].Click here for file[http://www.biomedcentral.com/content/supplementary/1471-2148-7-95-S8.pdf]
Additional file 9Comparison pairs used for each gene. Each pair used is indicated by an 'X'. Also shown are the total number of comparison pairs used, and the alignment lengths in base pairs.Click here for file[http://www.biomedcentral.com/content/supplementary/1471-2148-7-95-S9.pdf]
Page 10 of 12(page number not for citation purposes)
BMC Evolutionary Biology 2007, 7:95 http://www.biomedcentral.com/1471-2148/7/95
11. Benton MJ, Donoghue PCJ: Paleontological evidence to date thetree of life. Mol Biol Evol 2007, 24:26-53.
12. Budd GE, Jensen S: A critical reappraisal of the fossil record ofthe bilaterian phyla. Bio Rev 2000, 75(02):253-295.
13. Darwin C: The origin of species by means of natural selection.John Murray London; 1882.
14. Smith AB: Systematics and the fossil record. Blackwell Oxford;1994.
15. Bell MA: Origin of metazoan phyla: Cambrian explosion orproterozoic slow burn? Trends Ecol Evol 1997, 12(1):1-2.
16. Wills MA, Fortey RA: The shape of life: how much is written instone? BioEssays 2000, 22(12):1142-1152.
17. Peterson KJ, Butterfield NJ: Origin of the Eumetazoa: testingecological predictions of molecular clocks against the Prot-erozoic fossil record. Proc Natl Acad Sci USA 2005, 102:9547-9552.
18. Runnegar B: A molecular clock model for the origin of animalphyla. Lethaia 1982, 15:199–205.
19. Lynch M: The age and relationships of the major animal phyla.Evolution 1999, 53(2):319-325.
20. Wray GA, Levinton JS, Shapiro LH: Molecular evidence for deepPrecambrian divergences among metazoan phyla. Science1996, 274(5287):568-573.
21. Bromham LD, Hendy MD: Can fast early rates reconcile molec-ular dates with the Cambrian explosion? Proc Biol Sci 2000,267(1447):1041-1047.
22. Welch JJ, Bromham L: Molecular dating when rates vary. TrendsEcol Evol 2005, 20:320–327.
23. Rutschmann F: Molecular dating of phylogenetic trees: a briefreview of current methods that estimate divergence times.Diversity and Distributions 2006, 12(1):35-48.
24. Douzery EJP, Snell EA, Bapteste E, Delsuc F, Philippe H: The timingof eukaryotic evolution: does a relaxed molecular clock rec-oncile proteins and fossils? Proc Natl Acad Sci USA 2004,101:15386-15391.
25. Peterson KJ, Lyons JB, Nowak KS, Takacs CM, Wargo MJ, McPeekMA: Estimating metazoan divergence times with a molecularclock. Proc Natl Acad Sci USA 2004, 101:6536-6541.
26. Aris-Brosou S, Yang Z: Bayesian models of episodic evolutionsupport a late Precambrian explosive diversification of theMetazoa. Mol Biol Evol 2003, 20:1947-1954.
27. Roger AJ, Hug LA: The origin and diversification of eukaryotes:problems with molecular phylogenetics and molecular clockestimation. Philos Trans R Soc Lond B Biol Sci 2006, 361:1039-1054.
28. Yang Z: Among-site rate variation and its impact on phyloge-netic analyses. Trends Ecol Evol 1996, 11(9):367-372.
29. Ho SYW, Phillips MJ, Drummond AJ, Cooper A: Accuracy of rateestimation using relaxed-clock models with a critical focuson the early metazoan radiation. Mol Biol Evol 2005,22:1355-1363.
30. Welch JJ, Fontanillas E, Bromham L: Molecular dates for the“Cambrian explosion”: the influence of prior assumptions.Syst Biol 2005, 54(4):672-678.
31. Felsenstein J: Inferring phylogenies. Sunderland, Massachusetts ,Sinauer Associates; 2004.
32. Bromham L: Molecular clocks and explosive radiations. Mol BiolEvol 2003, 57(Suppl 1):S13-S20.
33. Boaden PJS: Meiofauna and the origins of the metazoa. ZoolJour Linnean Soc 1989, 96:217-227.
34. Davidson EH, Peterson KJ, Cameron RA: Origin of bilaterian bodyplans: evolution of developmental regulatory mechanisms.Science 1995, 270(5240):1319-1325.
35. Mooers AO, Harvey PH: Metabolic rate, generation time, andthe rate of molecular evolution in birds. Mol Phylogenet Evol1994, 3:344-350.
36. Bromham L: Molecular clocks in reptiles: life history influencesrate of molecular evolution. Mol Biol Evol 2002, 19:302-309.
37. Bromham L, Rambaut A, Harvey PH: Determinants of rate varia-tion in mammalian DNA sequence evolution. J Mol Evol 1996,43(6):610-621.
38. Thomas JA, Welch JJ, Woolfit M, Bromham L: There is no universalmolecular clock for invertebrates, but rate variation doesnot scale with body size. Proc Natl Acad Sci USA 2006,103:7366-7371.
39. Foote M: Origination and Extinction through the Phanero-zoic: A New Approach. Jour Geol 2003, 111:125-148.
40. Barraclough TG, Savolainen V: Evolutionary rates and speciesdiversity in flowering plants. Evolution 2000, 55(4):677-683.
41. Webster AJ, Payne RJ, Pagel M: Molecular phylogenies link ratesof evolution and speciation. Science 2003, 301(5632):478.
42. Kendall MG: Partial rank correlation. Biometrika 1942, 32(3/4):277-283.
43. Orme CDL, Quicke DLJ, Cook JM, Purvis A: Body size does notpredict species richness among the metazoan phyla. J Evol Biol2002, 15(2):235-247.
44. Philippe H, Lartillot N, Brinkmann H: Multigene analyses of Bilat-erian animals corroborate the monophyly of Ecdysozoa,Lophotrochozoa, and Protostomia. Mol Biol Evol 2005,22:1246-1253.
45. Philip GK, Creevey CJ, McInerney JO: The Opisthokonta and theEcdysozoa may not be clades: stronger support for thegrouping of plant and animal than for animal and fungi andstronger support for the Coelomata than Ecdysozoa. Mol BiolEvol 2005, 22:1175-1184.
46. Glenner H, Hansen AJ, Sørensen MV, Ronquist F, Huelsenbeck JP,Willerslev E: Bayesian inference of the metazoan phylogeny. Acombined molecular and morphological approach. Curr Biol2004, 14(18):1644-1649.
47. Halanych KM: The new view of animal phylogeny. Annu Rev EcolEvol Syst 2004, 35(1):229-256.
48. Yi S, Streelman JT: Genome size is negatively correlated witheffective population size in ray-finned fish. Trends Genet 2005,21(12):643-646.
49. Hebert PDN, Remigio EA, Colbourne JK, Taylor DJ, Wilson CC:Accelerated molecular evolution in halophilic crustaceans.Evolution 2002, 56(5):909-926.
50. Martin AP, Palumbi SR: Body size, metabolic rate, generationtime, and the molecular clock. Proc Natl Acad Sci USA 1993,90:4087-4091.
51. Shigenaga MK, Gimeno CJ, Ames BN: Urinary 8-hydroxy-2'-deox-yguanosine as a biological marker of in vivo oxidative DNAdamage. Proc Natl Acad Sci USA 1989, 86:9697-9701.
52. Glazier DS: Beyond the: variation in the intra-and interspecificscaling of metabolic rate in animals. Biol Rev 2005,80(04):611-662.
53. Lighton JRB, Fielden LJ: Mass scaling of standard metabolism inticks: a valid case of low metabolic rates in sit-and-wait strat-egists. Physiol Zool 1995, 68:.
54. Alekseeva TA, Zotin AI: Standard metabolism and macrotax-onomy of crustaceans. Biol Bull 2001, 28(2):157-162.
55. Wood JB, O'Dor RK: Do larger cephalopods live longer? Effectsof temperature and phylogeny on interspecific comparisonsof age and size at maturity. Marine Biology 2000, 136:91-99.
56. Ballard JWO, Whitlock MC: The incomplete natural history ofmitochondria. Mol Ecol 2004, 13:729-744.
57. Lanfear R, Thomas JA, Welch JJ, Brey T, Bromham L: Metabolic ratedoes not calibrate the molecular clock. (In press) 2007.
58. Moriyama EN: Synonymous substitution rates in Drosophila:mitochondrial versus nuclear genes. J Mol Evol 1997,45(4):378-391.
59. Smith NGC, Eyre-Walker A: Partitioning the variation in mam-malian substitution rates. Mol Biol Evol 2003, 20:10-17.
60. Coyne JA, Orr HA: Speciation. Sinauer Associates; 2004. 61. Mayr E: Evolution as a process. eds. Huxley, J., Hardy, A. C. &
Ford, E. B. (Allen & Unwin, London), pp. 157-180; 1954. 62. Orr HA: The population genetics of speciation: the evolution
of hybrid Incompatibilities. Genetics 1995, 139(4):1805-1813.63. Gavrilets S: Fitness landscapes and the origin of species. Prin-
ceton University Press; 2004. 64. Davies TJ, Savolainen V, Chase MW, Moat J, Barraclough TG: Envi-
ronmental energy and evolutionary rates in flowering plants.Proc Biol Sci 2004, 271(1553):2195-2200.
65. Felsenstein J: Phylogenies and the comparative method. AmNat 1985, 125(1):1-15.
66. Harvey PH, Pagel MD: The comparative method in evolution-ary biology. Oxford , Oxford Univ. Press; 1991.
67. GenBank [http://www.ncbi.nlm.nih.gov/]68. Thompson JD, Higgins DG, Gibson TJ: CLUSTAL W: improving
the sensitivity of progressive multiple sequence alignmentthrough sequence weighting, position-specific gap penaltiesand weight matrix choice. Nucleic Acids Res 1994, 22:4673-4680.
Page 11 of 12(page number not for citation purposes)
http://www.ncbi.nlm.nih.gov/entrez/query.fcgi?cmd=Retrieve&db=PubMed&dopt=Abstract&list_uids=7481819
http://www.ncbi.nlm.nih.gov/entrez/query.fcgi?cmd=Retrieve&db=PubMed&dopt=Abstract&list_uids=7481819
http://www.ncbi.nlm.nih.gov/entrez/query.fcgi?cmd=Retrieve&db=PubMed&dopt=Abstract&list_uids=7697191
http://www.ncbi.nlm.nih.gov/entrez/query.fcgi?cmd=Retrieve&db=PubMed&dopt=Abstract&list_uids=7697191
http://www.ncbi.nlm.nih.gov/entrez/query.fcgi?cmd=Retrieve&db=PubMed&dopt=Abstract&list_uids=8995058
http://www.ncbi.nlm.nih.gov/entrez/query.fcgi?cmd=Retrieve&db=PubMed&dopt=Abstract&list_uids=8995058
http://www.ncbi.nlm.nih.gov/entrez/query.fcgi?cmd=Retrieve&db=PubMed&dopt=Abstract&list_uids=8483925
http://www.ncbi.nlm.nih.gov/entrez/query.fcgi?cmd=Retrieve&db=PubMed&dopt=Abstract&list_uids=8483925
http://www.ncbi.nlm.nih.gov/entrez/query.fcgi?cmd=Retrieve&db=PubMed&dopt=Abstract&list_uids=2602371
http://www.ncbi.nlm.nih.gov/entrez/query.fcgi?cmd=Retrieve&db=PubMed&dopt=Abstract&list_uids=2602371
http://www.ncbi.nlm.nih.gov/entrez/query.fcgi?cmd=Retrieve&db=PubMed&dopt=Abstract&list_uids=2602371
http://www.ncbi.nlm.nih.gov/entrez/query.fcgi?cmd=Retrieve&db=PubMed&dopt=Abstract&list_uids=9321417
http://www.ncbi.nlm.nih.gov/entrez/query.fcgi?cmd=Retrieve&db=PubMed&dopt=Abstract&list_uids=9321417
http://www.ncbi.nlm.nih.gov/entrez/query.fcgi?cmd=Retrieve&db=PubMed&dopt=Abstract&list_uids=7789779
http://www.ncbi.nlm.nih.gov/entrez/query.fcgi?cmd=Retrieve&db=PubMed&dopt=Abstract&list_uids=7789779
http://www.ncbi.nlm.nih.gov/entrez/query.fcgi?cmd=Retrieve&db=PubMed&dopt=Abstract&list_uids=7984417

BMC Evolutionary Biology 2007, 7:95 http://www.biomedcentral.com/1471-2148/7/95
Publish with BioMed Central and every scientist can read your work free of charge
"BioMed Central will be the most significant development for disseminating the results of biomedical research in our lifetime."
Sir Paul Nurse, Cancer Research UK
Your research papers will be:
available free of charge to the entire biomedical community
peer reviewed and published immediately upon acceptance
cited in PubMed and archived on PubMed Central
yours — you keep the copyright
Submit your manuscript here:http://www.biomedcentral.com/info/publishing_adv.asp
BioMedcentral
69. Hall TA: BioEdit: a user-friendly biological sequence align-ment editor and analysis program for Windows 95/98/NT.Nucleic Acids Symp Ser 1999, 41:95–98.
70. Yang Z: PAML: a program package for phylogenetic analysisby maximum likelihood. Comp App Biosciences 1997,13(5):555-556.
71. Sullivan J, Joyce P: Model selection in phylogenetics. Annu RevEcol Evol Syst 2005, 36:445-466.
72. Rannala B: Identifiability of parameters in MCMC bayesianinference of phylogeny. Syst Biol 2002, 51(5):754-760.
73. R Development Core Team: R: a language and environment forstatistical computing. R Foundation for Statistical Computing, Vienna,Austria 2003 [http://www.R-project.org].
74. Paradis E, Claude J, Strimmer K: APE: analyses of phylogeneticsand evolution in R language. Bioinformatics 2004, 20(2):289-290.
Page 12 of 12(page number not for citation purposes)