The Influence of an Extended School Day on Middle School ...
230
The Influence of an Extended School Day on Middle School English Language Arts and Mathematics Achievement in a New Jersey Suburban School District Davida Lindsay-Harewood Dissertation Committee Gerard Babo, Ed.D., Mentor Daniel Gutmore, Ph.D. Lillie Johnson Edwards, Ph.D. Submitted in partial fulfillment of the requirements for the degree of Doctor of Education Department of Education Leadership, Management and Policy Seton Hall University June 2016
-
Upload
khangminh22 -
Category
Documents
-
view
1 -
download
0
Transcript of The Influence of an Extended School Day on Middle School ...

The Influence of an Extended School Day on Middle School English Language Arts and Mathematics Achievement in a New Jersey Suburban School District
Davida Lindsay-Harewood
Dissertation Committee
Gerard Babo, Ed.D., Mentor Daniel Gutmore, Ph.D.
Lillie Johnson Edwards, Ph.D.
Submitted in partial fulfillment of the requirements for the degree of
Doctor of Education
Department of Education Leadership, Management and Policy
Seton Hall University
June 2016

© Copyright by Davida Lindsay-Harewood
All Rights Reserved


ii
Abstract
This study examined the influence of an extended school day, reported in
instruction minutes, on academic achievement of general and special education middle
school students in one public suburban New Jersey school district using English
Language Arts and Mathematics data from the 2014 New Jersey Assessment of Skills
and Knowledge (NJ ASK). The sample was selected using Propensity Score Matching, a
statistical technique employed to reduce the influence of selection bias. The final sample
consisted of 238 students in Grade 6, 238 in Grade 7, and 238 in Grade 8 in the New
Jersey suburban, upper middle-income school district during the years 2011-2014. The
variables that were included in this study were gender, ethnicity, socioeconomic status,
attendance, enrollment in the extended school day middle school, special education, and
past performance as measured by the Grade 5 New Jersey Assessment of Skills and
Knowledge. Analyses were conducted using analysis of covariance (ANCOVA), and
factorial ANCOVA, analysis of variance (ANOVA), and factorial ANOVA. Results of
this study indicated that attending the extended-day school with increased instructional
minutes did not have a statistically significant impact on the performance of this sample
of middle school students on the English Language Arts and Mathematics sections of the
2014 NJ ASK in nine of ten research questions. The null hypothesis was not supported by
the data analysis and was therefore rejected in analysis of the interaction of extended
school day and ethnicity on the academic achievement of middle school students in
Grades 6-8 on the 2014 New Jersey Assessment of Skills and Knowledge (NJ ASK) in
Mathematics. The significant differences on the adjusted marginal mean scores for
Mathematics achievement based on ethnicity are important to note and are discussed

iii
further in Chapter 5. Further research is needed on extended school day to determine
what additional factors may have contributed to these findings.

iv
Acknowledgments
To my wonderful husband Gregory, I am so grateful for your constant support.
You have been my calm and ever present rock, supporting me and standing confidently
beside me on this journey of faith. At times I saw you bite your tongue and swallow your
desire for our “normal” life as I headed to the library. Your steadfast confidence in me
never wavered, and I learned to use it in my silent periods of doubt. Often my boisterous
celebration of a high grade or new learning seemed to be unremarkable to you as you
often had more confidence in me than I had in myself. Thank you for your patience,
understanding, encouragement, and loving support. I love you and appreciate you more
than words can say.
To my loving family, especially Curti, Jessika, Joseph, Geneva, and Gertrude, I
thank you for your love, prayers, moral support, and willingness to give me space and
time to take this faith journey. You have always believed in me and encouraged my
personal, academic, and professional pursuits. I am extremely blessed to have a loving
family that never doubted my decision to take this academic journey or questioned my
wisdom at investing precious time, talent, and treasury pursuing “another degree.” You
have each blessed and touched my life in unique and special ways.
To my St. Mark’s United Methodist Church family and prayer partners, most
notably Margaret, Portia, Joan and Langerine, your ceaseless prayers, encouragement,
phone calls, and meals have kept me moving forward. Each act of love and friendship
helped sustain Greg and me spiritually, physically, and emotionally.
Dr. Babo, you have now served as a mentor to me twice, once at Kean University

v
as I earned my master’s in educational leadership and now at Seton Hall University as I
earn my doctorate in educational leadership. I am so fortunate to have had the
opportunity to work with you as my mentor. Your knowledge of educational leadership,
statistics, and research has been extremely valuable. Thank you for your confidence and
no-nonsense manner that both encouraged and challenged me to do my best.
Dr. Gutmore, your knowledge of organizational structures has helped me to see
organizations and the people they impact in new ways as I continue my role as an
educational leader. Thank you for being willing to serve on my dissertation committee
and being a positive role model.
Dr. Lillie Edwards, your decision to serve as a member of my dissertation
committee solidified the connection of our church family to this academic journey. Your
professionalism, scholarship, and poise are augmented with your strong faith. You have
encouraged me to grow as a woman of faith and demonstrated service time after time. I
thank God for connecting us through St. Mark’s UMC.
Thank you to the educational leaders within the Seton Hall University Executive
Ed.D. program. I thank you for your smiles, willingness to answer one more question
and then explain what you just said in a different way. The knowledge that I have gained
from this program has been invaluable and will forever alter my life and career.
Finally, to cohort XVIII, what a journey we have had together! Thank you for
your ceaseless encouragement and support. It has been a true marathon, not a sprint.

vi
Dedication
This work is dedicated in loving memory of my mother, Ollie E. Mayweather.
The stories you told me about being smart but having academic opportunities denied you
as a young woman of color stayed with me and shaped me. Your edict, “Get that
education! They can’t take it away from you” has motivated me throughout my life.
You were the smartest woman I have ever known. Orphaned as a child in the backwoods
of the South during the Great Depression, you overcame poverty, despair, racism, and a
society that perceived no value in a strong African-American woman. You broke many
barriers and set an example of what we can achieve with prayer, persistence,
perseverance, and the courage to live our dreams. Mommy, you taught me that “my
Heavenly father owns the cattle on a thousand hills; and if I had ten thousand tongues, I
could not thank Him enough.” Your words and actions taught me to think big and know
the American dream is a reality to all who are willing to work for it. For you, it was a
given that we achieve. You set high standards and expected success. I know that you
were proud of our accomplishments and would have been so proud of the many
additional achievements of your children, grandchildren, and great grandchildren. I am
confident that you are with us as we celebrate this academic milestone.
“I can do all things through Christ who strengthens me.” (Philippians 4:13 NKJV)

vii
Table of Contents
ABSTRACT.................................................................................................................................... ii ACKNOWLEDGMENTS...............................................................................................................iv DEDICATION.................................................................................................................................vi LISTOFTABLES..........................................................................................................................................xLIST OF FIGURES........................................................................................................................xii
CHAPTER I. INTRODUCTION....................................................................................................1 INTRODUCTION............................................................................................................................1
STATEMENT OF THE PROBLEM ...............................................................................................7PURPOSE OF THE STUDY…………………………................................................................. 9
CONCEPTUAL FRAMEWORK ..................................................................................................10RESEARCH QUESTIONS............................................................................................................12
STUDY DESIGN………………....................................................................................................16 POPULATION...............................................................................................................................17SIGNIFICANCE OF THE STUDY................................................................................................18
LIMITATIONS ..............................................................................................................................19
DELIMITATION............................................................................................................................20ASSUMPTIONS ............................................................................................................................20 DEFINITION OF TERMS.............................................................................................................21
ORGANIZATION OF THE STUDY ............................................................................................27 CHAPTER II - LITERATURE REVIEW…...…….......................................................................29 INTRODUCTION…......................................................................................................................29
LITERATURE RESEARCH PROCEDURES ..............................................................................30
CRITERIA FOR LITERATURE REVIEW...................................................................................31 METHODOLOGICAL ISSUES WITH EXISTING LITERATURE…….…………………..… 31EXAMINATION OF CURRENT LITERATURE……………………………………………….34STATEWIDE STANDARDIZED TESTING................................................................................34HISTORY OF MIDDLE SCHOOLS…………….........................................................................36MIDDLE SCHOOL CONCEPT…………………………………………………………............39EXTENDED LEARNING TIME AND ACADEMIC ACHIEVEMENT..……………………...42

viii
SOCIOECONOMIC STATUS AND ACADEMIC ACHIEVEMENT.........................................49
RACE/ETHNICITY AND ACADEMIC ACHIEVEMENT.........................................................53
GENDER AND ACADEMIC ACHIEVEMENT..........................................................................57SPECIAL EDUCATION AND ACADEMIC ACHIEVEMENT………………..........................61PRIOR ACADEMIC ACHIEVEMENT AND ACADEMIC ACHIEVEMENT...........................63CONCLUSION...............................................................................................................................65
CHAPTER III- METHODOLOGY................................................................................................67
INTRODUCTION……………………………..............................................................................67
RESEARCH DESIGN....................................................................................................................68
SAMPLE POPULATION..............................................................................................................69 POWER……...…………………………………………………………………………..75
SAMPLE PARTICIPANTS……………………………………………………………..75INSTRUMENTATION OF NJ ASK.............................................................................................76
DATA COLLECTION...................................................................................................................79DATA ANALYSIS.........................................................................................................................80 VARIABLES…………....................................................................................................................80
PROPENSITY SCORE MATCHING............................................................................................82 ANCOVA.......................................................................................................................................83 FACTORIAL ANCOVA……….................................................................................................... 83 ANOVA..........................................................................................................................................84FACTORIAL ANOVA………....................................................................................................... 84
CHAPTER IV- ANALYSIS OF THE DATA ...............................................................................86
INTRODUCTION..........................................................................................................................86RESEARCH QUESTIONS............................................................................................................86 ORGANIZATION OF CHAPTER…………………...…………………………………………..91
DESCRIPTION OF THE SAMPLE…...…………..……………………………………………..91
SAMPLING PROPENSITY SCORE MATCHING……………………………………………..95
DESCRIPTIVE STATISTICS OF THE ENTIRE PSM SAMPLE……………………………...99
STATISTICAL ANALYSIS AND RESULTS…………………………………………………108
SUMMARY…….........................................................................................................................150

ix
CHAPTER V- CONCLUSIONS AND RECOMMENDATIONS..............................................154
INTRODUCTION .......................................................................................................................154
PURPOSE OF THE STUDY…....................................................................................................155
ORGANIZATION OF THE CHAPTER......................................................................................155 RESEARCH QUESTIONS AND FINDINGS............................................................................ 155 RECOMMENDATIONS FOR POLICY AND PRACTICE.......................................................174 RECOMMENDATIONS FOR FUTURE RESEARCH……………..........................................176 CONCLUDING STATEMENT……………...…………………………………………............178
REFERENCES………………………….....................................................................................180
APPENDICES…………………..................................................................................................195
APPENDIX A. REQUEST TO CONDUCT RESEARCH ........................................................ 196APPENDIX B. “MATCHIT” MATCHED CASES.....................................................................197

x
List of Tables
Table 1. Middle School Comparison Chart…………………………………………..………….74
Table 2. Coding in SPSS of Variables...........................................................................................81
Table 3. Coding for SPSS Analyses………………......................................................................92Table 4. Descriptive Statistics of the Entire Sample…………………….....................................93 Table 5. English Language Arts Statistics of the Entire Sample……………...............................94Table 6. Mathematics Statistics of the Entire Sample………………….......................................94
Table 7. Descriptive Statistics of the Entire Sample…………………………………..................95 Table 8. Coding for Propensity Score Matching Analysis………………………........................98Table 9. Descriptive Statistics of the Entire PMS Sample…………………….............................99 Table 10. Distribution of Students by Grade Level……………………….................................100Table 11. Distribution of Students by Gender………………………………………………......100 Table 12. Distribution of Students by Ethnicity…….……………………………………….......100
Table 13. Distribution of Students by Socioeconomic Status…………………………................101
Table 14. Distribution of Students by Special Education Services ………...……………….......101
Table 15. Descriptive Statistics of the Entire Sample...................................................................101
Table 16. Descriptive Statistics of Control Sample (MS 1) After PSM Calculations..................102
Table 17. Middle School MS 1 ELA 2014 Scores After PSM Calculations…............................103
Table 18. Middle School MS 1 Math 2014 Scores After PSM Calculations...............................103
Table 19. Middle School MS 1 ELA, Math, and Attendance Statistics After PSM Calculations…….....103
Table 20. Descriptive Statistics of Control Sample (MS 2) After PSM Calculations..................104
Table 21. Middle School MS 2 ELA After PSM Calculations……….........................................105
Table 22. Middle School MS 2 Math After PSM Calculations………........................................105
Table 23. Middle School MS 2 ELA, Math, and Attendance Statistics After PSM Calculations…….....105
Table 24. Descriptive Statistics of Treatment School (MS 3) After PSM Calculations...............106
Table 25. Middle School MS 3 ELA After PSM Calculations……….........................................107
Table 26. Middle School MS 3 Math After PSM Calculations………........................................107
Table 27. Middle School MS 3 ELA, Math, and Attendance Statistics After PSM Calculations…….....107
Table 28. Descriptive Statistics on 2014 ELA Mean Scores………............................................109
Table 29. Test of Between-Subjects Effects on 2014 ELA (School and ELA Gd. 5)…..............110
Table 30. Descriptive Statistics on 2014 Math Mean Scores ……………………………………....112
Table 31. Test of Between-Subjects Effects on 2014 Math (School and ELA Gd. 5)….............113

xi
Table 32. Descriptive Statistics on 2014 ELA Mean Scores and Gender ………........................115
Table 33. Test of Between-Subjects Effects on 2014 ELA (School, Gender, ELA Gd. 5)…......116
Table 34. Descriptive Statistics on 2014 Math Mean Scores and Gender ……….......................119
Table 35. Test of Between-Subjects Effects on 2014 Math (School and Gender)…...…............120
Table 36. Descriptive Statistics on 2014 ELA and SES………………………………...…….....122
Table 37. Test of Between-Subjects Effects on 2014 ELA (School, SES, ELA Gd. 5)…...........124
Table 38. Descriptive Statistics on 2014 Math Mean Scores and SES ………............................126
Table 39. Test of Between-Subjects Effects on 2014 Math (School, SES)…...………...…….....127
Table 40. Descriptive Statistics on 2014 ELA and SPED…...……….........................................129
Table 41. Test of Between-Subjects Effects on 2014 ELA (School, SPED, ELA Gd. 5)…........131
Table 42. Descriptive Statistics on 2014 Math Mean Scores and SPED ……….........................133
Table 43. Test of Between-Subjects Effects on 2014 Math (School, SES, Math Gd. 5)……......134
Table 44. Descriptive Statistics on 2014 ELA and Ethnicity.………..........................................137
Table 45. Test of Between-Subjects Effects on 2014 ELA (School, Ethnicity, ELA Gd. 5)…...138
Table 46. Adjusted Means on 2014 ELA based on Ethnicity..……….........................................139
Table 47. Pairwise Comparisons by Ethnicity on 2014 ELA...………........................................139
Table 48. Descriptive Statistics on 2014 Math and Ethnicity.………..........................................142
Table 49. Test of Between-Subjects Effects on 2014 Math (School, Ethnicity)……………......143
Table 50. Adjusted Means on 2014 Math based on Ethnicity .………........................................144
Table 51. Pairwise Comparisons by Ethnicity on 2014 Math..………........................................144
Table 52. Adjusted Means on 2014 NJ ASK Math based on School and Ethnicity…….............146 Table 53. Statistically Significant Differences in 2014 Math Achievement Multiple Comparisons .......149
Table 54. Summary of Research Question Findings ………..………………..…………….…….....152

xii
List of FiguresFigure 1. Conceptual Model.........................................................................................................11
Figure 2. Adjusted Marginal Means Interaction Plot for School and Ethnicity on NJASK
2014 Math .........................................................................................................147

1
CHAPTER I
INTRODUCTION
Background
While the demands of the 21st century continue to expand the knowledge and
skills students must master, little has changed from the minimum number of hours
students are required to devote to schooling. Across many American communities the
standard school year averages 180 days, and the school day lasts for approximately six
hours. While state policies establish minimums, districts and schools have the flexibility
to incorporate more learning time into their school schedules (Kolbe, Partridge, &
O’Reilly, 2012). More than 30 years ago, additional learning time was advocated in the
1994 seminal report Prisoners of Time by the National Education Commission on Time
and Learning (McMurrer,Frizzell,&Yoshioka,2015). They concluded that as a nation
we ask the impossible when we expect a higher degree of learning from students but
provide no additional time to learn content, develop skills, and progress toward mastery.
Reform-minded educators across the country have turned to extended learning
time (ELT) in its various forms as a tool to improve student achievement. Government
officials are recommending extended learning time to turn around schools where students
are not meeting achievement targets. This is not a new topic, but is it an effective tool to
increase academic achievement? This study examined the impact of an extended school
day on the achievement of students in Grades 6-8 by providing additional instructional
minutes for all students.
More and better use of learning time is the first recommendation of Brown,
Rocha, Sharkey, Hadley, Handley, and Kronley in their 2005 report addressing how the

2
American education system must respond to the social and economic shifts occurring in
the 21st century. “We must extend educational time and use the time we have more
effectively” (Brown et al., 2005, p. v). Increasing the time students are engaged in
instructional activities under the supervision of a certified teacher has been suggested as
one strategy to improve academic performance of school children (Brown et al., 2005).
More than 700 schools (75% charter, 25% non-charter) have extended their day
according to the National Education Commission on Time and Learning. Extended
learning time advocates have suggested more time for all students while others have
directed additional time to students who are scoring below proficiency or enter school
with disadvantages (Brown et al., 2005). Across the nation, in response to federal
financial inducements, many low-performing schools have increased learning time
(McMurrer, Frizzell, Yoshioka, Scott, & Ostler, 2015).
Different proposals for increasing learning time are included in the concept of
extended learning time. Both extended school year (ESY) and extended school day
(ESD), either provided by school districts or coordinated by outside agencies, including
not-for-profits, are extended learning time (ELT) reforms. An extended school day
(ESD) increases instructional minutes by increasing the length of the school day and/or
class hours. These are elements identified as parts of a reform effort to improve schools
and student learning in the United States. ESD provides added time for a curriculum
offering increased time for core subject instruction as well as time for music and the arts,
technology, and physical education. It has been suggested as one tool to turn around the
educational system that some see as falling behind our global competitors. Former U.S.
Secretary of Education, U.S. Senator Lamar Alexander, said, “Our nation is falling
3
behind" (Cavanaugh, 2012). Falling behind our global competitors academically is seen
as the forerunner to economic decline.
According to the 2012 Programme for International Program Assessment (PISA)
report, the United States performed below average in mathematics in 2012 and close to
the Organisation for Economic Co-operation and Development (OECD) average
performance in reading and science. They reported “no significant change in these
performances over time” (PISA, 2012). However, OECD did report that there was little
agreement on how much time in class is needed to learn science, reading, and
mathematics. They cited agreement among policymakers for students to spend
considerable time in instruction to acquire skills. The PISA report identified a positive
correlation between students who spent more time in mathematics studies with increased
mathematic scores. Across OECD countries, a net increase for attending schools with
longer learning times was 12 points per extra hour of mathematics instruction per week
on average (PISA, 2012).
Simply doing more of the same with the added minutes or days is not what is
needed to raise achievement. The quality and quantity of learning opportunities are
important factors according to the 2012 PISA report. “Simply expanding time . . . at
schools is not a silver bullet for success” (Gabrieli, 2010, p. 3). Deepening core subjects
instruction, providing time for enrichment opportunities, and supporting teachers with
time for collaboration were identified in the literature as effective uses of additional
school time to improve student achievement (McMurrer, Frizzell, Yoshioka, Scott, &
Ostler, 2015).

4
Across the country, states and districts are examining expanded learning time as a
tool to improve student achievement (Patall, Cooper, & Allen, 2010). They are
rethinking the school day to add more class time and even adding more days to the school
calendar for at-risk students in states such as Massachusetts, Rhode Island, New Jersey,
Illinois, Maryland, and Florida. States and school districts, often under federal guidance
that requires low-performing schools to increase student learning time, are implementing
ELT using School Improvement Grants (SIG) to pay for the added costs related to ELT
as reported by the Center on Education Policy (CEP) in its 2012 report. CEP’s conclusion
from its case study research found schools using the transformational and turnaround
models were indeed increasing learning time as intended. However, some schools
reported doing so only for students with the greatest needs. Perceptions about and
experiences with implementation varied across the states in the case studies. Despite
more than 300 initiatives launched by 30 states that incorporated ELT among high-
poverty and high-minority schools since 1991, little consensus exists on whether the
length of the school day and school year enhances student achievement (Patall et al.,
2010).
The National Education Commission on Time and Learning in its 1994 report
brought national attention to the policies that restricted the number of hours students
could be educated in the nation’s schools. The commission detailed the number of school
days and how time was used during the school day. The overarching recommendation
was for a departure from the rigid education policies around time and movement toward
more time for student learning in new and different ways to bring about additional
learning time for students.

5
Opponents argue that increasing time in school does not guarantee effective
instruction and that the increased costs are prohibitive. Estimates vary on the costs
associated with increasing school time. A Minnesota study estimated increasing the
number of school days to 200 per year would cost about $1,000 per student or a total
annual cost estimated at $750 million (Marcotte & Hansen, 2010). Those opposed to
increasing learning time also argue that adding time to the school day or year will not
bring about quality instruction or benefit student achievement. They proclaim it will be a
financial benefit to those who have not effectively used the existing educational time.
Fleming (2012) found that it was hard to determine for some ELT initiatives whether it
was the added time or other reforms that resulted in increased achievement. “The
findings in the literature indicate that simply adding more time is insufficient” to improve
student achievement (Redd, Boccanfuso, Walker, Princiotta, Knewstub, & Moore, 2012.
p. 65). Doing more of the same ineffective teaching strategies and methods for a longer
time will not increase achievement. It will add unneeded costs to taxpayers (Patall et al.,
2010).
Proponents of increasing school learning time, whether by extending the school
year or extending the school day, argue that increasing school time will lead to increased
learning and increased time for non-academic courses (McMurrer et al., 2015). They
argue that insufficient time is currently made available for students to master the core
subjects. Also, the demands of demonstrating mastery on standardized assessments have
reduced school time for non-tested subjects such as art, physical education, and social
studies. “What gets tested gets taught,” said Jennings, the Center of Education Policy
president and CEO in 2007. No Child Left Behind (NCLB) legislation has resulted in

6
more of the available school day being devoted to reading and math, limiting time for
non-tested subjects and the overall education of children, according to the CEP president.
Britt and Raine (2012) of the National Center on Time and Learning point to ELT
successes in Massachusetts, where the Clarence Edwards Middle School is an example of
successfully implementing ELT. The middle school, which served students in Grades 6-
8, had low standardized tests scores and high levels of student misbehavior. The
students’ academic performance was said to typify the academic achievement gap
challenge faced by many districts across the United States. The school redesigned its
education approach around expanded learning time. Three years later, “Eighth graders at
Edwards have now narrowed that gap by two-thirds in science and by more than 80% in
English Language Arts; they now score substantially higher than the state averages in
math” (Gabrieli, 2010, p. 2).
There are policy and economic considerations with ELT. Educating children is a
major financial commitment for governments. It is a significant portion of many local,
state, and national governments’ budgets. The Governor’s FY 2013 Budget Summary for
the State of New Jersey indicated the Education Department appropriation to be
$10,363,241,000 of the $32,145,634,000 total budget. There was no other department
that had a larger appropriation in the state’s 2013 budget. In many New Jersey towns it is
common for more than 50% of the property tax levy to be allocated to the public schools,
according to local explanations of taxes provided by townships. Finding additional or
reallocating current resources to fund ELT is a major part of the decision when evaluating
ELT for implementation.

7
Statement of Problem
The results from the literature regarding the influence of expanded learning time
(ELT) as a method to increase academic achievement of middle school students have
been mixed. Patall et al. (2010), in What the Research Says About Extending the School
Day and Year, conducted a search of studies on ELT from 1985 to 2009. Fifteen
empirical studies with various designs were conducted since 1985. The Patall et al. 2010
literature search of studies included several middle schools but none from the state of
New Jersey. Their analysis found that the “designs were generally weak for making
causal inferences, and outcomes other than achievement were rarely studied” (Patall et al.
2010, p. 401). They also noted, “The strength of the effect of extending school time as
well as the long-term and cumulative effects has yet to be determined” (Patall et al. 2010,
p. 431). They concluded by acknowledging that time is one of the influencers of student
learning and challenge education researchers to “conduct well-designed research that will
help determine under what conditions, for whom, and when more school time will yield
the greatest benefit” (Patall et al., p. 431).
There are few studies on the impact of an extended school day (ESD) on New
Jersey Assessment of Skills and Knowledge (NJ ASK) student achievement scores for
middle school students. Sammarone (2014) in her research looked at the influence of the
length of the school day on NJ ASK for Grades 6-8. Magnet schools were not included
in her sample. Her study found that socioeconomic status had the strongest influence on
student achievement. The researcher found only four of eighteen possible combinations
where the length of the school day could increase achievement. Sammarone’s

8
dissertation, like the Patall et al. study, recommended future research on instructional
minutes and its impact on academic achievement.
More time for instruction is a major component of the Obama administration’s
education policy. School Improvement Grants (SIG) and Race to the Top (RTTT)
funding both include extended school time within their models. It was estimated that 94%
of schools receiving SIG funding were implementing models that increased learning time
(Owen, 2011). “We can no longer afford an academic calendar designed when America
was a nation of farmers who needed their children at home plowing the land at the end of
each day. That calendar may have once made sense, but today it puts us at a competitive
disadvantage. Our children spend over a month less time in school than children in South
Korea. That is no way to prepare them for a 21st century economy” (Obama, 2009). The
President in his speech to the Hispanic Chamber of Commerce continued by saying, “I
know longer days and school years are not wildly popular ideas. But the challenges of a
new century demand more time in the classroom” (Obama, 2009).
Government officials, school administrators, researchers, and parents are looking
for reforms in public education. The demands for educational reforms to raise student
academic achievement come at the same time as districts manage funding challenges
from the same stakeholders. William Poston, Jr., in his book, School Budgeting for Hard
Times, asked the following question: “How can one make a school more educationally
effective and at the same time more cost-effective?” (p. 2). New Jersey is spending
billions of dollars to educate children each year according to The Governor’s FY 2013
Budget Summary. The 2012 Programme for International Student Assessment’s (PISA)
key findings reported the United States spent $115,000 per student yet ranked U.S.

9
students’ scores at 27 out of 34 OECD countries’ student performance in reading and
science. No significant change has been seen over time in student achievement according
to the PISA report.
Extended school days have been identified as one strategy in the reform
movement that could bring about efficiency and effectiveness. There are many questions
to be answered. What is the justification for spending more money to increase learning
time? Where is the empirical evidence to support this reform? It is important to conduct
additional research to conclude whether extended learning time, in its various forms, is an
effective educational reform that will improve middle school student achievement.
Purpose of the Study
The purpose for this research study was to investigate the influence of an
extended school day, reported in instructional minutes, on academic achievement of
middle school students. Standardized assessment data drawn from student performance
on the English Language Arts (ELA) and Mathematics sections of the 2014 New Jersey
Assessment of Skills and Knowledge (NJ ASK) was used as a proxy for academic
achievement. In addition, the study examined the amount of variance in student 2014 NJ
ASK scores accounted for by instructional minutes while controlling for student variables
of gender, ethnicity, socioeconomic status (SES), attendance, prior academic
achievement, special education classification (SPED), and grade.
As demands for greater academic achievement for all students comes from those
who decry the ongoing achievement gap and mediocre performance of American students
on international benchmarks such as the Programme for International Student
Assessment, it is essential to identify educational reforms that will support academic

10
achievement. These demands combined with the movement to Common Core State
Standards and annual standardized testing that some see as high-stakes, further challenge
educational leaders to promote strategies that will support opportunities for academic
achievement and growth for all students. There have been calls for releasing students and
educators from the “prison of time” and providing them the necessary time to meet the
increasing demands of education in the 21st century. However, the research has not been
conclusive on the benefits of extending school days for all students. As demands for
accountability of administrators and teachers continue to grow with regard to student
academic achievement and growth, more emphasis is placed on how education is
provided to students, including how much time is provided for mastery of content for all
students.
Conceptual Framework
Production function theory involves statistical analyses of inputs (student
variables and instructional minutes) used for the desired output (academic achievement).
Scientific management has been utilized in manufacturing since Frederick Taylor,
credited with the concept, introduced it in the early part of the 20th century (Taneja,
Pryor, & Toombs, 2011). He sought to manage and organize inputs in production to
bring about a desired output in an efficient manner. Per-student spending (input) as a link
to student achievement (output) is an example of Taylor’s impact on education. Student
achievement is the output of the educational process and is directly related to inputs that
are controlled by policy makers (Hanushek, 2007). The inputs include school
characteristics such as school hours, instructional minutes, teacher background, and
curricula. Hanushek (1989), in his educational research, found “educational production

11
functions have produced startlingly consistent results” (p. 45) around student
performance and expenditures. He found student performance variations are not
routinely related to school expenditure variations.
In this study, inputs (per-pupil expenditures, teacher variables, and student
demographics) were similar. The differing quantity of instructional minutes was the
input that was analyzed for its influence on the output: student achievement. The
conceptual framework for this study was based on the production function or input-output
theoretical framework model. Figure 1 illustrates the conceptual model for this study.
Figure 1. Conceptual model. (adapted by Lindsay-Harewood, 2016)

12
Research Questions
The two overarching research questions addressed in this study are as follows:
I. What is the influence of extended school day (ESD) on the academic
achievement of middle school students in Grades 6-8 on the 2014 New Jersey
Assessment of Skills and Knowledge (NJ ASK) in English Language Arts (ELA) and
Mathematics (Math), when controlling for prior academic achievement before entering
middle school?
II. What influence does the interaction of extended school day (ESD) and student
fixed factor demographic variables have on the academic achievement of middle school
students in Grades 6-8 on the 2014 New Jersey Assessment of Skills and Knowledge (NJ
ASK) in English Language Arts (ELA) and Mathematics (Math) when controlling for
prior academic achievement before entering middle school?
The subsidiary research questions, derived from the two overarching research
questions, answered in this research study are as follows:
1. What is the influence of extended school day (ESD) on the academic
achievement of middle school students in Grades 6-8 on the 2014 New Jersey
Assessment of Skills and Knowledge (NJ ASK) in English Language Arts
(ELA) when controlling for prior academic achievement before entering
middle school?
2. What is the influence of extended school day (ESD) on the academic
achievement of middle school students in Grades 6-8 on the 2014 New Jersey
Assessment of Skills and Knowledge (NJ ASK) in Mathematics when
controlling for prior academic achievement before entering middle school?

13
3. What influence does the interaction of ESD and gender have on the academic
achievement of middle school students in Grades 6-8 on the 2014 New Jersey
Assessment of Skills and Knowledge (NJ ASK) in English Language Arts
when controlling for prior academic achievement before entering middle
school?
4. What influence does the interaction of ESD and gender have on the academic
achievement of middle school students in Grades 6-8 on the 2014 New Jersey
Assessment of Skills and Knowledge (NJ ASK) in Mathematics when
controlling for prior academic achievement before entering middle school?
5. What influence does the interaction of ESD and socioeconomic status (SES)
have on the academic achievement of middle school students in Grades 6-8 on
the 2014 New Jersey Assessment of Skills and Knowledge (NJ ASK) in
English Language Arts when controlling for prior academic achievement
before entering middle school?
6. What influence does the interaction of ESD and socioeconomic status (SES)
have on the academic achievement of middle school students in Grades 6-8 on
the 2014 New Jersey Assessment of Skills and Knowledge (NJ ASK) in
Mathematics when controlling for prior academic achievement before entering
middle school?
7. What influence does the interaction of ESD and special education
classification (SPED) have on the academic achievement of middle school
students in Grades 6-8 on the 2014 New Jersey Assessment of Skills and

14
Knowledge (NJ ASK) in English Language Arts when controlling for prior
academic achievement before entering middle school?
8. What influence does the interaction of ESD and special education
classification (SPED) have on the academic achievement of middle school
students in Grades 6-8 on the 2014 New Jersey Assessment of Skills and
Knowledge (NJ ASK) in Mathematics when controlling for prior academic
achievement before entering middle school?
9. What influence does the interaction of ESD and ethnicity have on the
academic achievement of middle school students in Grades 6-8 on the 2014
New Jersey Assessment of Skills and Knowledge (NJ ASK) in English
Language Arts when controlling for prior academic achievement before
entering middle school?
10. What influence does the interaction of ESD and ethnicity have on the
academic achievement of middle school students in Grades 6-8 on the 2014
New Jersey Assessment of Skills and Knowledge (NJ ASK) in Mathematics
when controlling for prior academic achievement before entering middle
school?
NullHypotheses
1. Extended school day (ESD) has no influence on the academic achievement of
middle school students in Grades 6-8 on the 2014 New Jersey Assessment of
Skills and Knowledge (NJ ASK) in English Language Arts when controlling
for prior academic achievement before entering middle school.

15
2. Extended school day (ESD) has no influence on the academic achievement of
middle school students in Grades 6-8 on the 2014 New Jersey Assessment of
Skills and Knowledge (NJ ASK) in Mathematics when controlling for prior
academic achievement before entering middle school.
3. The interaction of ESD and gender has no influence on the academic
achievement of middle school students in Grades 6-8 on the 2014 New Jersey
Assessment of Skills and Knowledge (NJ ASK) in English Language Arts
when controlling for prior academic achievement before entering middle
school.
4. The interaction of ESD and gender has no influence on the academic
achievement of middle school students in Grades 6-8 on the 2014 New Jersey
Assessment of Skills and Knowledge (NJ ASK) in Mathematics when
controlling for prior academic achievement before entering middle school.
5. The interaction of ESD and socioeconomic status (SES) has no influence on
the academic achievement of middle school students in Grades 6-8 on the
2014 New Jersey Assessment of Skills and Knowledge (NJ ASK) in English
Language Arts when controlling for prior academic achievement before
entering middle school.
6. The interaction of ESD and socioeconomic status (SES) has no influence on
the academic achievement of middle school students in Grades 6-8 on the
2014 New Jersey Assessment of Skills and Knowledge (NJ ASK) in
Mathematics when controlling for prior academic achievement before entering
middle school.

16
7. The interaction of ESD and special education classification (SPED) has no
influence on the academic achievement of middle school students in Grades 6-
8 on the 2014 New Jersey Assessment of Skills and Knowledge (NJ ASK) in
English Language Arts when controlling for prior academic achievement
before entering middle school.
8. The interaction of ESD and special education classification (SPED) has no
influence on the academic achievement of middle school students in Grades 6-
8 on the 2014 New Jersey Assessment of Skills and Knowledge (NJ ASK) in
Mathematics when controlling for prior academic achievement before entering
middle school.
9. The interaction of ESD and ethnicity has no influence on the academic
achievement of middle school students in Grades 6-8 on the 2014 New Jersey
Assessment of Skills and Knowledge (NJ ASK) in English Language Arts
when controlling for prior academic achievement before entering middle
school.
10. The interaction of ESD and ethnicity has no influence on the academic
achievement of middle school students in Grades 6-8 on the 2014 New Jersey
Assessment of Skills and Knowledge (NJ ASK) in Mathematics when
controlling for prior academic achievement before entering middle school.
Study Design
This quantitative study examined the impact of an extended school day, with
increased instructional minutes, on student achievement. The effect, if any, was
determined by analyzing the performance of students who were not randomly assigned to

17
different middle schools using NJ ASK Grade 6-8 scores controlling for prior
achievement. This study also sought to determine if different subgroups demonstrated
different levels of achievement in the extended school day middle school.
Population
The student data in this study were selected from three middle schools in an upper
middle-income suburban New Jersey K-12 public school district. The township had a
population of approximately 38,000 people according to the 2010 U.S. Census; the
median household income was $95,696, and the per capita income was $59,536.
According to the 2014 New Jersey School Performance Report, the district was
comprised of about 6,700 students who attended one of the 11 schools. The District
Factor Groups (DFGs), originally developed in 1975 to compare students’ performance
on statewide assessments across demographically similar school districts, categorizes
school districts from the lowest (A) to the highest (J) and is a socioeconomic status
indicator of the district’s residents. This public school district was reported as an I
district, identifying it as one of the wealthier school districts in New Jersey.
Approximately 1,600 of the district’s students attended one of the three middle
schools that were the focus of this study. The middle schools in the district, MS 1, MS 2,
and MS 3, educated children in Grades 6-8. The population of MS 1 was 685. MS 2 had
a population of 594 students. The treatment school MS 3 had a population of 277. The
original sample of participants in this study consisted of 1,556 students enrolled in the
three district middle schools. According to the 2013-2014 New Jersey School
Performance Report, over 50% of the students in the middle schools were classified as

18
White, approximately 30% were African American/Black, and 11 % were Hispanic. The
remaining students were classified as Asian (6%) or two or more races (4%).
Students in the study were placed into one of the magnet-themed middle schools
using a freedom of choice process that sought to ensure racial balance in the schools and
provide parental choice in education according to the district website. In this district one
of the middle schools delivered its magnet theme using an extended school day schedule.
With the minimum hours/day in New Jersey set at four hours excluding lunch and recess,
two middle schools operated six hours and fourteen minutes while the extended day
school operated seven hours and forty-five minutes per school day.
Significance of the Study
“In a global economy where the most valuable skill you can sell is your
knowledge, a good education is no longer just a pathway to opportunity—it is a
prerequisite. And yet, we have one of the highest high school dropout rates of any
industrialized nation. And half of the students who begin college never finish. This is a
prescription for economic decline” (Obama, 2009 State of the Union Address). Given
that it is in middle school that the foundations of academic success and failure are most
tenuous, Gabrieli found that “Middle school is well documented to be the level at which
students seem to diverge into two groups. One group tends to be well socialized to
school, proficient academically, and on a strong path to high school graduation; the other
group tends to show alienation from school and become at high risk of dropping out”
(2010, p. 4). Although research evidence would suggest that extending learning time
would support student learning, particularly for those at risk (Patall et al., 2010), it is

19
difficult to assess the magnitude of the relationship between an extended school day and
academic achievement.
The unit of analysis for my study was the student at the middle school level in a
suburban New Jersey public school district; however, treatment was assigned at the
school level, which was accounted for in the analysis. This study sought to add to the
information available on ESD and build from prior research conducted, such as the meta-
analysis conducted by Patall et al. (2010) and the dissertation research of Sammarone
(2014). This empirical study adds to the research literature by studying ESD in a diverse
suburban school district where the middle schools studied draw students from the same
community. The influence of ESD on student achievement was analyzed as an
educational tool provided for all students as part of the middle school’s magnet theme.
Limited studies of ESD have been done in this setting or with this population.
Limitations
This study was limited to three magnet-themed middles schools in one suburban
northern New Jersey district with cultural and socioeconomic diversity. The majority of
the students included in the sample were in the middle to upper middle-income
socioeconomic groups. Students who attended the extended learning time magnet-
themed middle school were not randomly assigned. They, along with their parents,
selected the ESD-themed school using the district’s freedom of choice process. The
district had a process of not randomly assigning students to middle schools in an effort to
desegregate the schools in the district and provide parents school choice. The lack of
randomization was addressed using Propensity Score Matching to reduce selection bias in

20
samples. Further discussion of Propensity Score Matching is discussed in Chapters III
and IV.
Delimitations
Grades 6, 7, and 8 English Language Arts (ELA) and Mathematics (Math) data
were retrieved from three middle schools in one suburban school district. The data for
each grade level were limited to one public school district in one district factor group
within New Jersey. The district’s factor groups ranged from A to J and represented an
approximate measure of a community’s relative socioeconomic status (SES). Schools in
this district were reported to be in the I district factor group by the State of New Jersey
Department of Education. The 2014 NJASK students’ scores in Grades 6-8 were
reflected in this study. Student and school data were analyzed at one point in time.
Assumptions
There were several assumptions made during this research regarding the state
assessment, teaching of the district curriculum, and educators who delivered the
instruction. It was assumed that the NJ ASK for Grade 5 and the NJ ASK for Grades 6-8
were valid and reliable measures of academic achievement and that the assessments were
criterion-referenced standards-based assessments. It was also assumed that all the
students were assessed under the same testing conditions. The final assumption related to
the NJ ASK was that student data were reported accurately by the state to the district and
from the district to the researcher.Within the district, it was assumed that the middle
school teachers were teaching the same district approved curriculum to all students in
each of the three middle schools. Faculty variables were also assumed to be similar in all

21
three middle schools. This includes attendance rate and mobility as well as the number of
faculty with a master’s degree or higher.
Definition of Terms
Academic Achievement - According to the NJ School Performance Report, academic
achievement measures the content knowledge students have in English Language Arts
and Math. Middle school student content knowledge was gauged and reported using the
New Jersey Assessment of Skills and Knowledge (NJ ASK). For the purpose of this
study, student achievement was defined as a student scoring at the Proficient or
Advanced Proficient level on the NJ ASK. The NJ ASK assessed students’ knowledge of
the New Jersey Core Curriculum Content Standards.
Achievement Gap - The “achievement gap” in education refers to the disparity in
academic performance between groups of students. The achievement gap shows up in
grades, standardized-test scores, course selection, dropout rates, and college-completion
rates, among other success measures. It is most often used to describe the troubling
performance gaps between African-American and Hispanic students at the lower end of
the performance scale and their non-Hispanic White peers and the similar academic
disparity between students from low-income families and those who are better off
according to Education Week.
At-risk Students – The term is often used to describe students or groups of students who
are considered to have a higher probability of failing academically or dropping out of
school. The term may be applied to students who face circumstances that could
jeopardize their ability to complete school, such as homelessness, serious health issues,
domestic violence, or other conditions. It may also refer to learning disabilities, low test

22
scores, disciplinary problems, or other learning-related factors that could adversely affect
the educational performance and attainment of some students according to the Glossary
of Education Reform created by the Great Schools Partnership (Abbot, Guisbond, Levy,
& Sommerfield, 2014).
Common Core State Standards –Adopted by the New Jersey State Board of Education
in 2010, they define grade-level expectations from kindergarten through high school for
what students should know and be able to do in English Language Arts (ELA) and
Mathematics to be successful in college and careers.
English Language Arts (ELA) - The 2014 English Language Arts tests consisted of
reading passages, multiple-choice items, constructed-response items, and writing tasks.
The tests were administered over two days. The NJ ASK English Language Arts (ELA)
tests focused on students’ reading and writing knowledge and skills based on the
Common Core State Standards. The ELA score is reported in two content clusters:
Reading and Writing (NJ ASK 2014 Score Interpretation Manual, p. 11).
Ethnicity: The NJ ASK 2104 Score Interpretation Manual lists six codes for ethnicity
categories. The categories are the following: White, Black or African-American, Asian,
Native Hawaiian or other Pacific Islander, Hispanic, and American Indian or Alaska
Native. In addition, “O” is defined as missing or multiple codes.
Extended Learning Time (ELT) also called Extended School Day (ESD) - A school
model that incorporates additional instructional time beyond the traditional average six-
hour school day offered in most schools in the United States. The approach often
includes the expansion of instructional time across classes or the addition of classes or
programs that supplement an existing course in core academic areas. In some cases, extra

23
time is used to expand non-curricular offerings such as the arts and sports (Abbot,
Guisbond, Levy, & Sommerfield, 2014).
Extended School Year (ESY) - A school year that operates on a longer academic
school-year calendar than the traditional average 180-day calendar used by most schools
in the United States.
Extended Learning Opportunities Models (ELO) - A school model that provides
educational supports as well as enrichment and recreational opportunities to young
people and their families during non-school hours. ELO models provide a wide range of
social interventions (school- or community-based) but include at least one academic
component that targets student learning outcomes.
Individual Education Program (IEP) - An IEP is a written plan that includes present
levels of a student’s academic achievement and functional performance, measurable
annual goals, and short-term objectives. The IEP describes a student’s individually
designed instructional activities and related services necessary to achieve stated goals and
objectives. The plan provides rationale for the educational placement and serves as a
basis for program implementation (N.J.A.C. 6A: 14-1.3, 2009).
Mathematics (Math) - The 2014 Mathematics tests consisted of multiple-choice as well
as short and extended constructed-response items; these tests were administered over a
two-day period in Grades 3-7 and in one day in Grade 8. The NJ ASK Grades 6-8
Mathematics (Math) test measured knowledge and skills in the following clusters: ratio
and proportion, functions, number systems, geometry, and statistics and probability. The
assessments contained both multiple-choice and constructed-response items (NJ ASK
2014 Score Interpretation Manual, p. 11).

24
Middle School - Consisting of Grades 6-8 and students usually ranging in age from 10 -
14, middle schools are mechanisms to reduce time spent in elementary schools and are
intended to provide a smoother transition from elementary to high school for young
adolescents (Association of Supervision and Curriculum Development [ASCD], 1961).
Middle schools provide a balance between support and academic rigor for students by
applying practices such as smaller learning communities and advisories in which teachers
get to know their students and monitor academic progress more closely during the
transition from elementary to high school. There is recognition that the needs of young
adolescents are different from those of elementary and high school students and that
middle school should be organized in such a way that the students’ developmental needs
are met. “The school's organization must be based upon the developmental readiness,
needs, and interests of young adolescents” (Association of Middle Level Education,
2003, p. 1).
NJ School Performance Report - According to the New Jersey Department of
Education (NJDOE) website, annual reports of School Performance are presented. These
reports are designed to inform parents, educators, and students about how well a school is
preparing its students for college and careers.In particular, the new School Performance
Reports seek to accomplish the following:
• Focus attention on metrics that are indicative of college and career readiness.
• Benchmark a school’s performance against other peer schools that are
educating similar students, against statewide outcomes, and against state
targets to illuminate and build upon a school’s strengths and identify areas for
improvement.
25
• Improve educational outcomes for students by providing both longitudinal and
growth data so that progress can be measured as part of an individual school’s
efforts to engage in continuous improvement.
High-Stakes Testing - According to The Glossary of Education Reform, “Any test used
to make important decisions about students, educators, schools, or districts, most
commonly for the purpose of accountability; i.e., the attempt by federal, state, or local
government agencies and school administrators to ensure that students are enrolled in
effective schools and being taught by effective teachers.” In general, “high stakes” means
that test scores are used to determine punishments (such as sanctions, penalties, funding
reductions, negative publicity), accolades (awards, public celebration, positive publicity),
advancement (grade promotion or graduation for students), or compensation (salary
increases or bonuses for administrators and teachers).
New Jersey Assessment of Skills and Knowledge (NJ ASK) - New Jersey has revised
its standardized assessments at least seven times since the 1976 amendment to the NJ
Public School Education Act established uniform standards of minimum achievement.
The NJ ASK 3–8 was initially designed to provide information about each student’s
achievement in the areas required by the New Jersey Core Curriculum Content Standards
(NJ CCCS). In 2014, the NJ ASK was in a period of transition to the Common Core
State Standards (CCSS) that were being adopted throughout most of the country. The
2014 NJ ASK English Language Arts (ELA) and Mathematics tests in Grades 3–8 tests
addressed those standards. The Grades 4 and 8 Science tests were still aligned with the
NJ CCCS. This criterion-referenced standards-based assessment was designed to
measure the level to which all students in Grades 3-8 attained proficiency in the state

26
standards. The assessments took place over two days in which students were given up to
a total of 311 minutes to complete tests consisting of multiple choice and constructed
response questions, reading passages, and writing tasks. The NJ ASK identified three
levels of performance in each content area on its assessment: Partially Proficient,
Proficient, and Advanced Proficient. Student scores that are below the Proficient
performance level (i.e., below a scale score of 200) are considered to be below the state
minimum level of proficiency and may identify the need for additional student
instructional supports (NJ ASK 2014 Score Interpretation Manual Grades 3-8).
No Child Left Behind Act of 2001 (NCLB) – The2001updatetotheElementaryand
SecondaryEducationActof1965signedintolawbyPresident George W. Bush. The
education reform legislation introduced the concept of Annual Yearly Progress (AYP)
and mandated all schools achieve 100% proficiency by the year 2014. It mandated state
focus on eliminating academic achievement gaps and increased academic performance
for all students. To identify academic progress, schools are required to test students
annually.
Socioeconomic Status (SES) - The social and economic status of a family impacts the
knowledge of and ability to provide resources for a child’s education, according to the
American Psychological Association. SES is often measured as a combination of
education, income, and occupation. It is commonly identified as the social standing or
class of an individual or group. When viewed through a social class lens, privilege,
power, and control are emphasized. SES is relevant to all realms of behavioral and social
science, including research, practice, education, and advocacy. In this study students who
were eligible for free or reduced-price meals were classified as low SES.

27
Special Education -The term refers to specially designed instruction, at no cost to
parents, to meet the unique needs of a child with a disability. The NJ ASK 2014 Score
Interpretation Manual states that there are 16 codes for Special Education classification
including auditorily impaired, autistic, cognitively impaired–mild, communication-
impaired, emotionally and multiply disabled.
Organization of the Study
Chapter I provides an overview of the research problem along with background
information related to middle school students, achievement, and extended learning time
in the United States of America. Terms such as extended learning time, extended school
day, and academic achievement are defined. The debate over extended learning time as a
strategy to improve academic achievement is also discussed. The research questions are
introduced, and an overview of the sample population is provided along with limitations,
and assumptions.
Chapter II provides the criteria for research and procedures of the literature
search. The objective of the literature review was to locate, read, and synthesize literature
that addressed current examples of a relationship between increased instructional time
and academic achievement of middle school students. The statistical significance of
other variables identified on the NJ School Performance Report for 2014 were also
explored to uncover information that may influence student academic achievement and
be related to increased instructional time.
Chapter III provides information on the research design of this study. The
methods section also provides the population’s demographic information that was

28
included in the study as well as the assessment instrument (NJ ASK) that was utilized.
An explanation of the data collection and analysis procedures concludes the chapter.
Chapter IV restates the research questions and null hypotheses and provides
statistical analysis. It also includes the summary of the results found during the statistical
analyses.
Chapter V provides a synthesis of the results as well as recommendations for
policy and future research on the topic of an extended school day with increased
instructional minutes.

29
CHAPTER II
LITERATURE REVIEW
Introduction
The purpose for this research study was to investigate the influence, if any, of an
extended school day (ESD) incorporating increased instructional minutes on academic
achievement of middle school students. Statistical analyses were used to investigate
student and school variables and their influence on academic achievement as measured
by student performance on the 2014 English Language Arts (ELA) and Mathematics
(Math) sections of the New Jersey Assessment of Skills and Knowledge (NJ ASK).
The objective of the literature review was to locate, read, and synthesize existing
literature that addressed current findings on increased instructional time and its influence
or impact on academic achievement of middle school students. The statistical
significance of student and other variables identified on the NJ School Performance
Report for 2014 were also explored to uncover information that may influence student
academic achievement and be related to increased instructional time.
The production function theory, credited to Frederick Taylor in the early 20th
century, proposed that additional time spent to produce a product should result in a
greater quantity or quality (Jez & Wassmer, 2015). In education, the same theory is
being espoused when leaders seek additional instructional time as a method of increasing
student learning. The use of federal stimulus funds to extend learning time in public
schools was supported by the Obama administration and Education Secretary Arne
Duncan as an intervention to raise student performance (Jez & Wassmer, 2015).
Additional time to develop and practice skills, whether in a hobby or education, often

30
supported by conventional wisdom and championed by several education reform
organizations such as Education Trust-West in its 2011 policy brief and Massachusetts
2020 in its 2012 publication, offer one strategy to improve academic outcomes. A search
of literature on the influence of extended learning time on student educational
achievement resulted in studies that both affirmed and refuted the influence of increased
instructional time on student achievement.
This chapter provides an overview of the procedures used in the literature review
including the inclusion and exclusion criteria. The following sub-sections are included:
Statewide Standardized Testing, Extended Learning Time and Academic Achievement,
Socioeconomic Status and Academic Achievement, Race/Ethnicity and Academic
Achievement, Gender and Academic Achievement, Special Education and Academic
Achievement, and Prior Academic Achievement and Academic Achievement.
Literature Research Procedures
The two overarching research questions guided this literature review. The
standards and criteria of a scholarly literature review proposed by Boote and Bielle
(2005) were also incorporated. The following online databases were used in the search:
EBSCOhost, ProQuest, and ERIC. Educational journals, dissertations, books, briefs,
articles, and reports were also used. Publications were generally limited to those dated
2010 or later unless they were identified as seminal works. Google Scholar was used to
conduct general web-based searches. References cited by other researchers on extended
learning time and student or school variables associated with middle school achievement
were also used to expand the literature review. Search terms used in the review included
extended learning time, extended school day, extended day instruction, extended learning

31
opportunities, instructional time, instructional minutes, length of school day, middle
school, academic achievement, and student variables including ethnicity and academic
achievement, socioeconomic status (SES) and academic achievement, gender and
academic achievement, prior academic achievement, and special education and academic
achievement.
Inclusion and Exclusion Criteria for the Literature Review
For this literature review, scholarly material related to analysis of the impact of
increased instructional time (minutes) on student academic achievement as measured by a
standardized assessment was considered. This included seminal works, dissertations,
peer-reviewed articles, studies, and reports. In addition, published empirical research
within the last 5-7 years on extended learning time, extended day instruction, length of
school day, and increased instructional time that included a quantitative component and
studied the population in a Grades 3-12 environment were considered for inclusion.
Excluded from the search were extended learning time programs provided outside of the
normal school schedule such as those provided in after-school tutorial programs.
Methodological Issues with Existing Literature
Research conducted on the influence of increased instructional time on student
academic achievement has been mixed. Trust (2014) found in his study that various
types of research designs, including qualitative, quantitative, and mixed-method, have all
yielded different results. Yet, he asserts the “one constant that can be seen when looking
at the research, and that is that there is some effect on academic achievement when
discussing increased exposure to material” (Trust 2014, p. 21). Patall, Cooper, and Allen
(2010) identified that states and districts across the country are examining extended time

32
as a tool to improve achievement. In What the Research Says About Extending the
School Day and Year, 15 empirical studies conducted with various designs from 1985-
2009 were examined; “the designs were generally weak for making causal inferences”
(Patall et al., 2010, p. 401). They concluded by acknowledging time as one of the
influencers of student learning, yet encouraged additional researchers to “conduct well-
designed research that will help determine under what conditions, for whom, and when
school time will yield the greatest benefit” (Patall et al., 2010, p. 431). Sammarone’s
(2014) research on the influence of ELT and middle school student achievement found
four of eighteen combinations where the length of school day could increase
achievement. She, like Patall, recommended additional study.
The definition of extended learning time in the form of increased instructional
minutes is another methodological issue that is evident in the research. There are various
definitions and formats of extended learning time. The Glossary of Education Reform
created by Great School Partnerships defines ELT as “any educational program or
strategy intended to increase the amount of time students are learning, especially for the
purposes of improving academic achievement and test scores, or reducing learning loss,
learning gaps, and achievement gaps” Extended school day (ESD) is further defined by
the Glossary of Education Reform as a strategy for increasing the amount of time students
receive instruction. Adding additional time, such as an hour or more, onto the
conventional length of a school day or week may be a long-term or short-term school
strategy. The additional time may be used in different manners such as to supplement
instruction with the goal of improving student academic performance, to provide time for
participation in learning activities such as clubs and performances, or to provide time for

33
students to learn through expanded educational options such as internships and job
shadowing programs.
Delisle (2011), in her review of available research and literature for the Ohio
Department of Education, identified that extended learning time can include numerous
programs and options. She narrowed the definition to extended learning time
incorporated into the school day or year such as increasing a school day from 6.5 hours to
8 hours or adding 20 more days to the school year. Within the extended school day,
extended learning time can be used to lengthen the school day to increase class time
periods, adding an additional class period to the day or offering learning time outside of
the traditional classroom. Patall et al. (2010) report that lengthening class periods was
the most common extended day program option that they reported was often done for
core classes such as English and mathematics. Further complicating the research was the
varying methods of defining school day. Patall et al., (2010) defined the school day as
the number of hours that students are in attendance, which can also be analyzed by the
typical hours in a school day, total number of annual attendance hours divided by the
number of days of student attendance, engaged time, or total annual instructional hours
divided by the number of days of student attendance (excluding lunch, recess, classroom
management, etc.).
Redd, Boccanfuso, Walker, Princiotta, Knewstub, and Moore (2012) defined
extended school day (ESD) programs as incorporating additional instructional time into
the traditional 6.5-hour school day that is the average for most U.S. schools. “In most
cases extending the school day entails the expansion of instructional time across classes,
or the addition of classes or programs that supplement an existing course in a core

34
academic area, such as intensive tutoring or small-group study sessions for math or
English/language arts. In some cases, the extra time is used to expand offerings outside
the regular curriculum, such as arts and sports activities that many schools have elected to
cut in order to provide additional instructional time to improve student test scores " (p.
13). The number of increased instructional minutes varies with seven or more hours per
day considered to be an extended day (Kolbe, Partridge, & O'Reilly, 2012).
Examination of Current Literature
During the literature review it became apparent that research on extended learning
time can be divided into the following areas: seminal works related to academic
interventions to increase student achievement, increased instructional time for basic skills
during the school day without adding overall instructional minutes to the existing school
day, increased instructional time with added minutes provided outside of the standard
school day, and increased instructional time added to the standard school day for all
students.
Statewide Standardized Testing
New Jersey has revised its standardized assessments at least seven times since the
1976 amendment to the NJ Public School Education Act established uniform standards of
minimum achievement. The New Jersey Assessment for Skills and Knowledge (NJ ASK)
was initially designed to provide information about each student’s achievement in the
areas required by the New Jersey Core Curriculum Content Standards (NJ CCCS). In
2014, the NJ ASK was in a period of transition to the Common Core State Standards
(CCSS) that were being adopted throughout most of the country.

35
This criterion-referenced standards-based assessment was designed to measure
student proficiency in the state standards. The assessments consisting of multiple choice
and constructed response questions, reading passages and writing tasks, were used to
identify one of three levels of performance in each content area: Partially Proficient,
Proficient, and Advanced Proficient. Student scores that were below the Proficient
performance level (i.e., below a scale score of 200) were considered to be below the state
minimum level of proficiency and may have identified the need for additional student
instructional supports (NJ ASK 2014 Score Interpretation Manual Grades 3-8).
The national law that pushed for reforms in the nation’s schools has impacted
New Jersey, like other states that received federal money to support education under the
2004 landmark legislation No Child Left Behind (NCLB) Act. Officially named the
Elementary and Secondary Education Act, NCLB required states to set standards and
assess students in order to measure student progress toward achievement goals.
Demonstration of Annual Yearly Progress (AYP) by school districts was required, or
identification by the federal government as a district in need of improvement was risked
(NCLB, 2004).
Standardized assessments are not new in education. In states across the country
such as Texas, New York, Rhode Island, and Florida, standardized testing of school
children dates back several decades. The No Child Left Behind Act of 2001 mandated
standardized testing nationally and at more grade levels than in the past (Nichols, Glass,
& Berliner, 2012). Improvement of schools is the major goal of state and federal testing
policies according to Nichols, Glass, and Berliner (2012). “The theory of action
undergirding this approach suggests that by tying negative consequences (e.g., public

36
exposure or external takeover) to standardized test performance, teachers and students in
low-performing schools will work harder and more effectively, thereby increasing what
students learn” (p. 2). “The No Child Left Behind Act of 2001 (NCLB) and the reforms
brought about with the creation of the Common Core State Standards have perpetuated
the practice of using standardized test results as the deciding factor to evaluate student
achievement and the quality of schools” (Babo, Tienken, & Gencarelli, 2014).
Findings on the influence of statewide standardized testing and middle school
practices revealed that since No Child Left Behind (NCLB) and the required assessments,
school administrators have altered the developmentally appropriate middle school
practices such as advisories, recess, and collaborative activities to provide additional time
needed for test preparation. It was further identified that daily instructional time was
reallocated to provide additional time for tested subject areas such as reading and
mathematics (Musoleno & White, 2010).
History of Middle Schools
1909 saw the creation of the first junior high school to provide a smoother
transition from elementary school to high school. It claimed to provide an educational
program more suitable for young adolescents. The new century brought several societal
pressures that led to the shift from educating children solely in elementary and high
schools. Those historic changes included the increase in immigration, the need to prepare
students for the changing workforce, and demands from colleges for better prepared
students (Juvonen, 2004).
The modern middle school movement, begun in the 1960s, was a continuation of
the reorganization of secondary education that was launched in the early 1900s,
37
according to the National Middle School Association (NMSA). In their 2010 position
paper, This We Believe: Keys to Educating Young Adolescents, the essential
characteristics of middle grades schools for today’s students were outlined to address
both the academic and personal development of every young adolescent. “The
curriculum, pedagogy, and programs of middle grades schools must be based upon the
developmental readiness, needs, and interests of young adolescents. This concept is at the
heart of middle level education” (p. 5). Since 1982, updated versions of This We Believe
have been published reflecting the learning and practices of middle school educators
(NMSA, 2010).
Increasing enrollment pressures, recognition of the unique needs of early
adolescents, and larger societal issues continued to be important in shaping the formation
of middle grade school configurations for students ranging from Grades 5–9 through the
1980s (Juvonen, Le, Kaganoff, Augustine & Constant, 2004). Societal pressures and “the
recognition of the uniqueness of the students” (Brough, 1995, p. 36) were all inputs that
drove the movement toward middle grade schools. While middle grade schools can
sometimes include Grades 5-9, today most middle schools educate students in Grades 6-8
(Juvonen et al., 2004).
No longer seen as solely the link between overcrowded elementary schools and
high school, middle schools were challenged to care for the whole child and meet their
unique characteristics and needs. “Educating the whole child, including the intellectual,
emotional, social, moral, and physical domains, is central to the philosophy of middle
grades education” (Musoleno & White, 2010). These schools, originally used as a
mechanism to reduce the time children spent in elementary schools and to smooth the

38
transition to high school, have seen several recommendations and prescriptions for how
best to teach young adolescents.
Turning Points: Preparing American Youth for the 21st Century (Carnegie
Council, 1989) again refocused national attention on the needs of adolescents with its
1989 publication. This landmark report by the Carnegie Corporation’s Council on
Adolescent Development examined adolescents in America and how well they were
served by their schools, community organizations, and health agencies.
Recommendations for new structures for middle grades education were set forth in an
action plan with a comprehensive approach for a distinctive form of education for these
young adolescents. The report drew on the most effective middle grades practices and
research, urging the implementation of essential principles for improving middle grades
education, including dividing large middle schools into smaller learning communities,
teaching a core common knowledge to all students, staffing schools with teachers who
were experts at teaching young adolescents, and partnering communities with schools to
educate America’s young adolescents.
Turning Points 2000: Educating Adolescents in the 21st Century was published in
2000 by the main author of the 1989 report along with one of the leaders who
implemented the Turning Point principles. Jackson and Davis (2000) reported in their
review on the implementation of the Turning Point principles, synthesis of critical
lessons, and learning from the attempts to improve the education of young adolescents
over the ten years since the original publication, thus translating learning from research
into practical resources for middle school educators. Findings suggested that key
elements of the Turning Points principles for middle grades education had been

39
implemented as “a meteoric rise in the middle school organizational pattern of 5-8 and 6-
8 and the demise of the 7-9 junior high pattern” (p. 4). There was also an increase in the
creation of advisory programs, development of teacher and student teams, and common
planning for teacher teams, all of which were championed in Turning Points.
Turning Points 2000: Educating Adolescents in the 21st Century reported an
overall review of research on practices of middle schools by Hough in 1997, who found
that “since 1989, Turning Points has been the catalyst for development of both
components and blueprints for designing and implementing bona fide middle schools
throughout the United States” (pp. 288-289 as cited in Jackson & Davis, 2000). Jackson
and Davis (2000) asserted that to improve achievement for adolescents, middle grade
educators are required to make curriculum, instruction, and assessment changes in
addition to organizational and structural changes that are substantial and far-reaching
within the school and classrooms. Unfortunately, Jackson and Davis revealed that
Turning Points principles were found less often in high-poverty urban and rural middle
grade schools even though many of the networks for reforming schools begun by
foundations and other groups concentrated on these areas where unacceptably poor
student achievement continues as the norm. The Turning Points principles took greater
root in suburban and upper income areas (Jackson & Davis, 2000). These educators,
parents, and community members grasped the Turning Points principles and vision,
translating them into a reality for young adolescents (Jackson & Davis, 2000).
Middle School Concept
Recognizing that the needs of young adolescents are different from the needs of
students in elementary and high school and that schools can be organized to meet the

40
developmental needs of its students is at the core of creating middle schools. Increased
focus on accountability and academic achievement has caused policy makers and
stakeholders to focus on the role, structure, and organization of schools. Middle schools
are also under increased scrutiny. Core practices have been identified by middle school
reformers to bridge academic and social-emotional needs of these students (Jackson &
Davis, 2000). The review of literature identified practices that are at the core of middle
school education, including the following: curriculum and assessments to improve
teaching and learning, involvement of parents and communities, and interdisciplinary
team teaching. Flexible scheduling and advisory programs were frequently mentioned
and promoted by middle school organizations such as the Carnegie Council on
Adolescent Development, National Middle School Association, and the National Forum
to Accelerate Middle School Reform.
Interdisciplinary team organization is a strategy for making a large school smaller
and increasing the opportunity for students to get to know teachers and small groups of
students. A key aspect is common planning for the teaching team to support teachers
learning the needs, skills, and personalities of students. This increased knowledge
supports the social-emotional needs of students by limiting the negative aspects of a large
school, multiple teachers, and distant relationships (Jackson & Davis, 2000). It is a way
of organizing the faculty so that a group of teachers share (1) the same group of students,
(2) the responsibility for planning, teaching, and evaluating the curriculum and
instruction in more than one academic area, (3) the same schedule, and (4) the same area
of the building. Teaming remains one of the hallmarks of the middle school movement.
The presence of teaming in a school is among the first organizational steps toward

41
increasing student achievement through students’ enhanced sense of belonging (Carnegie
Council on Adolescent Development, 1989; Jackson & Davis, 2000). Combined with
looping, keeping students together for two or more years with the same teachers in
interdisciplinary teams “will improve teacher-student relationships and the teachers’
ability to recognize their students’ academic strengths and weakness” (Black, 2000).
Flexible scheduling represents a move away from the traditional structure of
schools that include a fixed number of classes taking place for a fixed number of minutes
over the school week. Brown (2001) defined flexible scheduling as alterations from
several equally divided periods to a format that provides fewer, but longer flexible
periods. Flexible scheduling, whether done in block scheduling or another form,
provides more time for activities that can be used to emphasize problem solving and
critical thinking. These extended learning periods provide time for interdisciplinary
connections and social-emotional learning by providing longer periods and more time for
interactions among students and teachers (NMSA, 2010).
Advisory programs provide scheduled time for teachers and other adults to meet
with groups of students regularly to guide, discuss issues, and provide academic and
social support. The programs aim to overcome middle school structural issues, like
transitioning, by encouraging smaller communities that foster relationships and provide
each student with individual attention (Jackson & Davis, 2000, Juvonen et al., 2004;
NMSA, 2010). Focusing on the social-emotional needs of students, advisories are a
strategy used by schools to use time purposefully to ensure students’ needs are not
overlooked.

42
Taken together, the core practices provide evidence that suggests that they are
promising practices for improving achievement of students in the middle grades. Full
implementation of the core middle school practices requires additional time in the school
day. Extended learning time during the school day may provide the needed additional
time to implement practices to support achievement and social-emotional needs
(Musoleno, 2010).
Extended Learning Time and Academic Achievement
Mapping the Field, produced by the National Center on Time and Learning
(2012), has a database of more than 1000 expanded learning time schools. The schools
are widespread and diverse. Located in 36 states, they serve approximately 520,000
students representing 1% of all schools in the United States. Traditional public school
districts make up about 40% of ELTs with the majority being public charter schools.
Many ELTs educate a population of students identified as high-needs located
predominantly in urban areas with 60% of the schools serving a student population where
75% are eligible for free or reduced lunch. Thirty percent of the schools educate a student
population that is 99% minority. These schools have significantly more time for learning
than traditional schools. Just less than eight hours (7.8) is the average length of day
compared to the national 6.5-hour day on average in traditional U.S. schools. While the
average number of annual hours of learning is 1,430 in ELT schools compared to the
traditional 1,206, most ELTs have not chosen to expand the number of school days
significantly, with 184 days in ELTs and 181 days on average in traditional schools.
Redd, Boccanfuso, Walker, Princiotta, Knewstub, & Moore (2012) identify John
B. Carroll’s 1963 A Model of School Learning as the “most influential publication within

43
the time-and-learning literature” (p. 13). Carroll’s model presented five core variables of
student learning: aptitude, opportunity to learn, perseverance, quality of instruction, and
ability to understand instruction. In relation to ELT, “The basic premise of Carroll’s
model is that school learning is dependent on the amount of time that a teacher has to
teach in relationship to the amount of time a learner takes to absorb and process the
information” (p. 14). Following its publication of Carroll’s A Model of School Learning,
numerous studies examining the relationship between student learning and time have
been conducted. (Redd, Boccanfuso, Walker, Princiotta, Knewstub, & Moore, 2012).
The researchers define "Extended school day (ESD) programs as incorporating additional
instructional time into the traditional 6.5-hour school day that is the norm for most
schools in the United States. In most cases extending the school day entails the expansion
of instructional time across classes, or the addition of classes or programs that
supplement an existing course in a core academic area, such as intensive tutoring or
small-group study sessions for math or English/language arts. In some cases, the extra
time is used to expand offerings outside the regular curriculum, such as arts and sports
activities that many schools have elected to cut in order to provide additional
instructional time to improve student test scores " (p. 13).
The dissertation of Castillo (2012) analyzed the relationship between extended
learning time and English language arts assessment scores of socio-economically
disadvantaged 4th grade students in five large cities. This quasi-experimental empirical
study utilized post-treatment data in the form of the English language arts (ELA) mean
assessment scores of two groups of socio-economically disadvantaged fourth grade
public school students attending both public and charter schools in the “Big Five”

44
(Buffalo, New York City, Rochester, Syracuse and Yonkers). Group A consisted of
students who attended schools with a traditional 6.5-hour schedule, while Group B
referred to students who attended schools with ELT programs consisting of seven or
more hours in length. Data did not support the hypothesis of ELT leading to improved
academic outcomes. "There is no statistically significant difference between the
academic achievement of socio-economically disadvantaged fourth-grade students in the
“Big Five” who are enrolled in ELT programs and those who are enrolled in standard
programs, as measured by scores on the fourth-grade level New York State English
Language Arts (ELA) assessment test" (p. 122). In this study the quantity of ELT or
instructional minutes were not the same in all ELT programs making it hard to make like
comparisons of treatments provided to students among the ELT programs or those
students who did not receive treatment in a non-ELT school.
Trust (2015) completed a statistical study of the influence of increased
instructional time on underperforming students' achievement scores in Grade 7 and 8
mathematics and English language arts in his dissertation. ELT was in the form of
academic intervention classes offered within the school district to 204 7th graders and
198 8th graders identified as struggling students, as defined by results of state
standardized test scores. Students were placed in academic intervention classes and
given increased instructional time in core content subjects to make up for deficits.
Students were removed from non-core classes such as electives and given increased
instruction. No additional time was added to the school day. Supplemental education was
provided during the school day as the treatment. In the correlational, quantitative study a
logistic regression was run to determine if enrollment in the academic intervention

45
classes had an impact on scoring in the proficient range on the subsequent state
standardized examination. Findings reported participation in the academic intervention
classes had no statistically significant impact on student performance on the subsequent
state examination. In Trust’s study, ELT was not provided in the form of increased
instructional minutes beyond the school day, making it hard to draw comparisons with
treatments provided to students within ELT programs that do increase instructional
minutes beyond the school day as well as offer students instruction in electives that apply
and integrate core content skills.
In the 2011 Scholastic Administrator Magazine, Schachter’s article, “Extending
the School Day: Extra Time is Being Championed by Reformers Left and Right,”
purports the key to using ELT to improve student academic performance is to add more
learning time and time on task. He reports extending the school day to be less costly than
extending the school year. The author wrote of ELT as a strategy that has been used for
more than a decade by districts to improve student outcomes in struggling schools.
Schachter reported students who had ELT made improvement in reading, language arts,
math, and science on Florida’s standardized assessments. KIPP charter schools in
Pennsylvania were reported to have had success using an extended school day.
Massachusetts’ use of ELT in underperforming middle schools starting in 2005 was
reported to have seen progress with one school making AYP targets for two years in a
row and the other seeing achievement gaps reduced in English language arts and science
by more than 60%. While highlighting ELT successes in Florida, Pennsylvania and
Massachusetts, no descriptions were provided on how the topic was studied.

46
Sammarone (2014), in her study of the length of the school day on student
assessment scores in New Jersey, analyzed over 600 public schools in different grade
level/subject combinations. She found school day length was a statistically significant
predictor variable in the six models, while she found the contribution of the length of the
school day was small. Her statistical analysis demonstrated the length of school day had a
small influence on achievement defined as scoring Proficient or Advanced Proficient on
the state standardized assessment. However, the study found socioeconomic status (SES)
to have the largest predictive contribution to the dependent variable (achievement). In
this study magnet schools were excluded from the sample. The form of increased
instructional minutes beyond the school day was not standardized, making it hard to draw
comparisons to treatments provided to students within ELT programs that do increase
instructional minutes in a magnet school setting beyond the school day as well as offer
students instruction in electives that apply core content skills.
Situating their research within the studies on the causal links between school
inputs and academic performance, Jez and Wassmer (2015) acknowledge the common
idea among education production function-based studies that “student and social inputs
(largely out of the control of educators and policymakers) explain more than half of the
variation in school scores (Hanushek, 1986, as cited in Jez & Wassmer, p. 292). In their
study on the impact of learning time on academic achievement, focus was placed on
instructional time as input schools can control and how it contributes to academic
performance. Jez and Wassmer’s study of California elementary public schools
concentrated on the effects of differences in learning times on state standardized test
performance. With a sample of 310 elementary schools that educated 500 or more

47
students each, they sought to find out "How does a minute of additional average teaching
time at a school site affect the site's overall API score after holding other explanatory
factors constant?" (p. 296). Using regression analysis, they found a statistically
significant and positive relationship between the number of instructional minutes in an
academic year and school-site standardized test scores, finding "greater allotted
instructional time has a statistically significant and positive impact on a school's average
academic achievement after controlling for other student and school factors expected to
influence achievement" (p. 301). Fifteen more minutes of school a day at a school site (or
about an additional week of classes over an academic year) related to an increase in
average overall academic achievement of about 1% and about a 1.5% increase in average
achievement for disadvantaged students (Jez & Wassmer, 2015). However, the
researchers identified their inability to study what schools did during the instructional
minutes and cited previous research on use of class time that "what is done in class is at
least as important as how much class time there is” (p. 303). It was recommended for
policy makers to ensure teachers use ELT effectively "generally meaning to ensure that
active teaching and learning are happening in this time" (p. 303). In summary, Jez and
Wassmer found that "more time allotted to instruction resulted in higher academic
achievement, especially for disadvantaged students, and supports extended learning time
as a way to improve student outcomes" (p. 303).
Completing a search of literature from 1985-2009 on extending the school day or
school year, Patall, Cooper, and Allen (2010) identified 15 empirical studies of various
designs that met their criteria for inclusion. Overall, while designs were found to be
generally weak for making causal inferences, they found outcomes of ELT other than

48
achievement were rarely studied. "It is fair to say that the effect of Extended Day (ED)
has yet to be fairly tested using well-controlled experimental or quasi experimental
designs from which strong causal implications could be drawn" (p. 423). Patall et al.
went on to state, "The evidence suggests there may be a neutral to small positive effect of
extending school time on achievement, and there is little chance that extended time has a
negative effect" (p. 426). Silva’s (2007) qualitative review of the relationship between
extended school time and achievement was cited. It identified “a positive relationship
between engaged learning time and achievement” (p. 413). The effectiveness of adding
school time was found to depend on how time was used. Silva’s review was cited as
identifying achievement gains to result from ELT programs where schools already had
effective curriculum, instruction, and classroom management in place. Patall et al. (2010)
identified the Virginia State Department of Education (1992) study and concluded,
“Research did not provide sufficient evidence that extending the school year or school
day in isolation would result in significant increases in student learning . . . [and] . . .
suggested that initiatives that emphasize improving the quality of instruction should be
supported" (p. 412). As an example of ELT’s use in a middle school, the researchers
cited Adelman, Haslam, and Pringle’s (1996) case study of 14 schools that implemented
a variety of ELT practices and highlighted one middle school in Boston that extended the
day to 7.5 hours. “Adelman and colleagues reported that student outcomes at the Boston
school improved dramatically, with the percentage of students passing the state basic
skills test in reading increasing from 77% to 90% over 3 years" (Patall et al., p. 416).
Teaching quality and classroom environment were surmised to be critical in the
success of extended time programs examined in the review. “For example, all of the

49
successful schools highlighted as part of the Massachusetts 2020 project (Farbman &
Kaplan, 2005) made efforts to promote teacher quality, strong leadership, rigorous and
continuous professional development, a positive school culture, and strong family
engagement” (Farbman & Kaplan, 2005, as cited by Patall et al., p. 430). The positive
effects of whole school reforms, consistent with the Turning Points principles, and
extended school day programs were evident in studies to support student achievement,
suggesting that extending school time could be an effective way to support student
academic achievement when considerations are made for how learning time is used.
Socioeconomic Status and Academic Achievement
"Without a doubt, poverty has a negative influence on student achievement,
especially when achievement is measured by state-mandated standardized tests"
(Tienken, 2012a, p. 105). Nearly fifty years ago Coleman, Campbell, Hobson,
McPartland, Mood, Weinfeld, and York conducted research as a result of a directive to
the U.S. Commissioner of Education in the Civil Rights Act of 1964. Their findings
resulted in the seminal work, Equality of Educational Opportunity (1966), known as The
Coleman Report. The report, cited more than 12,000 times according to Google Scholar,
presented several major findings, including the influence of family socioeconomics on
student achievement. Across all ethnic groups, the strongest predictor of student
achievement was identified as family socioeconomic status (Coleman et al., 1966).
Other researchers have investigated student achievement and, similar to Coleman
et al., found socioeconomic status to influence student achievement (Sammarone, 2014;
Tienken, 2012; Allard, 2008; Sirin, 2003; Stull, 2013; Gabrieli, 2011). DeAngelis (2014)
in her research of New Jersey high school proficiency assessment scores cited researchers

50
Michel (2004), Periera (2011), and Graziano (2012) all of whom referenced the work of
Coleman et al. (1966). “Socioeconomic status explained a greater proportion of student
test scores than other measures of school resources" (p. 48). Lytton and Pyryt (1998)
found socioeconomics to explain up to 45% of educational outcomes dominating all other
contributors to student achievement scores. There exist many years of “empirical
research that documents the connection between poverty and ultimate student
achievement as measured by standardized tests” (Tienken, 2012b, p. 5). The issue of
poverty and its impact in education was documented in the Coleman study in 1966 and
has a continuing scientific body of knowledge that demonstrates its impact on student
achievement as defined by standardized test scores (Tienken, 2012b).
Jez and Wassmer (2015) in the California study found "greater allotted
instructional time has a statistically significant and positive impact on a school's average
academic achievement after controlling for other student and school factors expected to
influence achievement" (p. 301). Fifteen more minutes of school a day at a school site (or
about an additional week of classes over an academic year) related to an increase in
average overall academic achievement for low-income, disadvantaged students. They
found ELT yielded gains in the average growth of low SES student achievement when
compared to the previous academic year and "that the impact of changes in learning time
is greater for disadvantaged students than their advantaged peers" (p. 303). In summary,
Jez and Wassmer surmised that "more time allotted to instruction resulted in higher
academic achievement, especially for disadvantaged students, and supports extended
learning time as a way to improve student outcomes" (p. 303).

51
Lavy (2012) examined ELT in Israel. His study found a positive impact on
achievement by increasing the length of the school week. There was also an increase in
subject-specific instructional time that showed positive effects on math, science, and
English test scores for both boys and girls. The effects of ELT were identified as greater
for pupils from low socioeconomic backgrounds than other students.
Fox (2011) in his study of student performance on standardized assessments in
Texas analyzed student data across race/ethnicity, gender, and socioeconomic status.
"Differences in achievement across groups have been a hot topic of conversation since at
least the Coleman Report” (p. 36). Fox found socioeconomic variables influenced
students’ achievement as defined by their performance on the state math assessment.
“Students identified as not economically disadvantaged scored significantly higher than
students receiving free meals” (p.113). "The results of this study affirm that the influence
of socioeconomic variables heavily influence students’ performance" (p.113). Fox noted
that his study was “conducted through a critical race lens which recognizes that each
individual student has to negotiate the social influence that race, gender, socioeconomic
status, and other variables have on their educational experiences” (p. 116). He proposed
not examining socioeconomic status in isolation, finding that such an analysis would not
account for the “complexity of multiple group membership . . . . Examining academic
performance data segregated by a single variable did not take into account the complexity
of multiple group memberships" (p. 116).
Gabrieli (2011), in an Educational Leadership article, stated the need for more
learning time to raise student academic achievement and provide a more well rounded
education for students. The author identified that ELT was typically used to educate

52
students who were defined as at-risk due to poverty, special education, English language
learner and/or minority status. Using three levers to support student academic
achievement (teacher schedules, partnerships, and adaptive software), the author wrote of
ELT school leaders identifying flexible schedules as necessary to accomplish their
mission, especially for highly disadvantaged students. ELT provided additional tools for
closing achievement gaps, broadening the curriculum beyond the tested subjects, and
offering enrichment courses such as the arts, sports, and music. The use of adaptive
technology was used to blend learning and manage costs of implementing ELT programs.
ELT schools reported excellent academic outcomes among their population of at-risk
students (high poverty and ELLs). To manage the costs of ELT, options such as
staggered teacher hours, stipends for additional hours, and use of community partnerships
were identified. Use of adaptive software enabling students to learn at differing paces and
progress through topics toward mastery were also incorporated.
Findings from Patall, Cooper, and Allen (2010) suggest that extending school
time can be an effective way to support student learning, particularly for students most at
risk of school failure and when considerations are made for how time is used. Their
review of research cited several researchers who identified ELT to have a positive
influence on socioeconomic status and achievement. Patall et al. cited Silva (2007) and
Virginia State Department of Education (1992), finding that “extended school time may
be particularly beneficial to at-risk or low-income students or students with disabilities."
(p. 413). Patall et al. also cited Wheeler (1987) in the correlational study of ELT in 1,030
California schools where “the length of the school day significantly predicted school-
level achievement test scores, with longer days predicting higher scores” (p. 417). An
53
analysis of reading, writing, and mathematics test performance among 6th grade students,
aggregated at the school level, found reading achievement levels were higher for schools
serving higher socioeconomic status (SES) families. “In additional analyses, the length
of the school week (total number of hours over the 5-day week) was positively associated
with reading and writing scores for students at low- and high-SES schools and not
students at middle-SES schools” (p. 417). A positive association between ELT and
writing scores for students at low-SES schools was identified, however, the association
was not found to be consistent in middle- and high-SES schools. “The relationship
between the length of the school week and writing scores was stronger for students at
low-SES schools compared to students at high-SES schools” (p. 417). Patall et al. found
ELT "appeared to be effective for at-risk students or that more time benefited minority,
low-SES, or low-achievement students most" (p.427). Citing Cooper et al., 1996, Patall
et al. identified their findings were consistent with "research showing that disadvantaged
students are the most susceptible to summer learning loss compared to their more
advantaged counterparts because of differences in opportunities to practice and learn
outside of school" (p. 427).
Race/Ethnicity and Academic Achievement
“The schools bear many responsibilities. Among the most important is the
teaching of certain intellectual skills such as reading, writing, calculating, and problem
solving” (Coleman et al., 1966. p. 123). Finding that most public schools were
segregated and unequal, many minority students did not receive the same education as
their majority student peers. The Coleman Report (1966) identified differences in
achievement across groups. Using standardized achievement tests that the researchers

54
identified as “culture bound,” it was found that African American students were ill
prepared by their schooling for college, a well-paying job, or progress toward
opportunities for academic or professional achievement (Coleman et al., 1966).
Allard (2008), citing Jencks and Phillips (1998), acknowledged the “extensive
research on the differences in educational attainment between racial and ethnic groups in
America, in particular the so-called Black-White achievement gap” (p. 11). Citing the
findings of Jencks and Phillips (1998), who found that the average African American
student still scores below 75% of American Caucasian students on standardized tests,
Allard identified that the achievement gap remains wide. The relationship to economic
disparities between African Americans and Caucasians is identified as impacting student
achievement. "In the case of Black-White inequalities, the social stratification and
inequalities that exist, result in an unequal (or perceived unequal) distribution of
resources that facilitate educational achievement” (p. 12). Despite educational gains
made by many American minority students since the Coleman Report, gaps in reading
proficiency and other academic subjects still persist across racial groups.
Redd, Boccanfuso, Walker, Princiotta, Knewstub, and Moore (2012), in
Expanding Time for Learning Both Inside and Outside the Classroom: A Review of the
Evidence Base, conducted a literature search to identify studies of extended learning time
provided in different forms for their report. Studies that met their criteria, such as
evaluations of ELT programs that used random assignment, quasi-experimental, or
nonexperimental designs, were included. Their report provided a synthesis of what is
known about the effectiveness of school and program interventions by expanding
learning time for children. Citing studies by Cooper, Nye, Charlton, Lindsay, and

55
Greathouse, 1996 and Burkham, Ready, Lee, and LoGerfo, 2004, the researchers
concluded that since disadvantaged students tend to have fewer outside-of-school
opportunities to learn or demonstrate academic skills, having an extended school day
would particularly benefit disadvantaged students. To support this assumption, Redd et
al. (2012) referenced existing research that indicates ELT “programs are beneficial to
students in minority groups, students who have performed poorly on standardized tests,
and students who are eligible for a free- or reduced-price lunch” (p. 24). They could not
definitively conclude that ELT programs were more beneficial for disadvantaged students
(including minorities) than for their high and middle SES and Caucasian peers because
few studies have studied this issue. Citing the Wheeler (1987) study as “one of the few
studies that examined the relationship between school-level achievement, socioeconomic
status (SES), and hours of instruction,” Redd et al. found mixed results (p. 24). Referring
to findings from the Link and Mulligan (1986) study, the researchers suggested that the
“school-day length may be associated with different outcomes for students of different
racial and ethnic backgrounds" (p. 24).
Redd et al. (2012) inferred research on ELT programs to be more advantageous to
disadvantaged student groups such as low-income, low-performing, or ethnic minorities.
Finding that ELT programs have been implemented in low-performing schools and that
several were targeted specifically at low performing, minority and disadvantaged
students, “evaluations found that this type of school schedule was significantly related to
improved academic performance” (p. 31). The researchers Tuttle, Teh, Nichols-Barrer,
Gill, and Gleason (2010) cited Wheeler (1987), who identified “studies that examined
ESD programs across schooling contexts found that the correlation of these programs and

56
test score improvement was greatest for students in poverty and students with low test
scores at the start of the study period," and many of these students were racial minorities
(p. 31). "Understanding the pathways through which the additional time might be useful
will be helpful to educators and policymakers interested in implementing these
approaches" (p. 65). The research suggests that ELT programs may provide tools to help
narrow academic achievement gaps.
Fox (2011) examined mathematics achievement in Grades 3-8 in Texas across
race/ethnicity, gender, and socioeconomic status in a quantitative study. Using data from
2004, 2007, and 2010, statistically significant differences were identified. “Asian
American students and European American students scored noticeably higher than Native
American, African American, and Latino/Latina/Hispanic American students" (p. 116).
The study consistently acknowledged that race/ethnicity, gender, and socioeconomic
status are interlocked across multiple intersections. Citing Boykin (1994) and Lee (2007),
Fox referenced the cultural mismatch theory identified by some scholars to explain
differences in achievement between diverse groups of students. He identified cultural
mismatch to occur “when the cultural capital of the student—or in some cases a group of
students—works in opposition of the cultural features of the school and educational
structures" (p. 40). Using a critical race lens, Fox referenced Crenshaw’s (1991) study
conducted with the recognition that “each individual student has to negotiate the social
influence that race, gender, socioeconomic status, and other variables have on their
educational experiences. Examining performance differences across only socioeconomic
status without examining the intersectionality of sociocultural variables is not enough” (p.
116). Fox explicated that segregating data by a single variable fails to account for
57
multiple group memberships and their complexities and connectedness. The study
suggested “racism and classism are still working persistently in the structures of society
and education" (p.128) and identified the need for culturally responsive teaching.
Fox cited Darling-Hammond (2004, p. 221) to expand on the differences in
achievement among America’s racial minority students and White students by drawing
attention to academic inequalities in education such as being taught by less qualified
teachers than their White counterparts, as well as differences in courses offered,
curriculum materials, and equipment. “Unequal access to high-level courses and
challenging curriculum explains another substantial component of the difference in
achievement between [students of color] and White students . . . . Tracking exacerbates
differential access to knowledge” (p. 37). Statistically significant differences of the
objective means were identified in the study. Fox concluded by stating his findings to be
consistent with The Coleman Report (1966) in that race and socioeconomic status are
critical identifiers in achievement differences.
Gender and Academic Achievement
Both de facto and de jure segregation of male and female public school students
have existed (La Morte, 2012). The separation of the sexes in entire schools was a
common practice in some school districts. However, more common was the separation
of students within classes or courses where educational opportunities for females were
limited and directed toward stereotypic female roles. Both Title VII (1964) and Title IX
(1972) of the Civil Rights Act of 1964 have been used to change segregation practices
based on sex.

58
Historical practices of segregation based on gender in public schools have led to a
gender gap in education and resulting careers. Research on the gender gap in education
is mixed. Females are still vastly underrepresented in math and science careers (Branom,
2013). Clark, Lee, Goodman & Yacco (2008) reported a gender gap in academic
achievement with boys falling behind girls with regard to grades and graduation rates. In
their mixed methods study Clark, et al. (2008) reported results that mirrored national
statistics regarding gender differences in achievement and school success factors. Citing
Gray, Peng, Steward, & Thomas, 2004; and using 2004 U.S. Department of Education
data, the authors stated, “statistics show that boys are achieving at lower levels across
most school subjects as a group than are girls; they earn lower grades and exhibit higher
school dropout rates.” (p. 111). These findings held across racial and ethnic groups for
elementary, middle and high school students (Clark, et al.2008). Significantly more girls
in all racial and ethnic groups in this study were achieving at a high level in middle and
high school, as measured by earning grade point averages greater than 3.0, compared to
their male peers. "Gender is a significant variable in the education of our students
today." (p. 129).
In research on the disparities in math motivation between genders, Branom,
(2013) found boys tend to have more positive beliefs and expectancies for math
performance than girls and that the self-beliefs and motivation differences “emerge as
early as first grade despite equal performance in this domain” (p. 11). The roles of self-
belief and motivation were found to be consistent with other literature on gender
differences in academic achievement. Acknowledging mixed research conclusions on
gender differences in math, Branom referenced studies (Eccles et al., 1993; Jacobs,

59
Lanza, Osgood, Eccles, & Wigfield, 2002; Wigfield et al., 1997) have found that girls
value math as much as boys, while other research (Brush, 1980; Eccles et al., 1983;
Eccles & Harold, 1992) suggests that boys value math to a greater extent than girls
((p. 11).
Meece, Glienke, and Burg (2006) acknowledged the history of education and
psychological research into the role of gender in academic motivation and achievement.
Analysis of gender differences in motivation identified stereotypic gender roles continued
to influence girls' and boys' motivation-related beliefs and behaviors (Meece et al., 2006).
Boys reported stronger ability and interest beliefs in mathematics and science, whereas
girls reported to have more confidence and interest in language arts and writing. The
effects of gender were found to be moderated by other variables including ability,
ethnicity, socioeconomic status, and classroom context. Meece et al. concurred with
Branom and Eccles (2013), who found gender differences in motivation are evident early
in school.
Kessels, Heyder, Latsch, and Hannover (2014) studied gender differences in
academic engagement related to students’ gender identity. They found gender
differences in educational outcomes exist. In some educational settings, boys lagged
behind girls and in other areas girls lagged behind boys on indicators of educational
success. Boys, in their analysis, have typically shown lower performance in reading
compared with girls but tend to show higher performance in mathematics related
subjects. They concluded that the differences between genders could be relatively small
and align with differences in motivation-related variables during school. The authors

60
acknowledged that the educational performances of the genders might channel students
into lifelong pathways via gender-influenced educational and occupational preferences.
Allard (2008) examined the gender differences in African American educational
achievement, finding educational achievement of young African American males to be
less than their female counterparts. She acknowledged the achievement gender gap to be
true across all races and ethnic groups in the American education system, but she found it
to be more acute in the African American community.
The influence of gender on student achievement is a factor that researchers
identify. St. John (2015), in his study of co-taught inclusive classrooms and academic
achievement of middle school students, reviewed gender as a variable. He found in an
analysis of the Program for International Student Assessment (PISA), “The result
indicates there was no statistical significance in achievement scores for math between
girls and boys in the United States" (p. 53). Citing the work of Marks (2008), who found
that there was no gender difference when the PISA data were statistically analyzed
controlling for student and school variables, St. John recommended caution when
interpreting findings that do not account for student and school variables. The 2011 Fox
study also examined gender and found no statistically significant differences existed
between male and female student academic performance in his examination of the Texas
state assessment in mathematics. Using statistical methods, Fox determined “no statistical
significance was present between groups or within groups in grades three through eight in
2004, 2007, and 2010" (p. 116).
Periera (2011), in her study of student and school variables on student
performance on the New Jersey standardized assessment, found with 8th grade students

61
there is little empirical evidence to support the stereotype that females outperform males
in reading and writing and that males outperform females in mathematics and the
sciences. Her research showed that the historical gender gap in mathematics and sciences
no longer exists. Citing the work of several authors including Else-Quest, Hyde, and Linn
(2010), Periera explained, "Stereotypes still prevail that claim females lag behind their
male peers in mathematics achievement" (p. 71). Like Fox and St. John, Periera
concluded, “There is little to no empirical evidence concerning the gender gap” (p. 71),
while other researchers such as Branom (2013), Allard (2008), Clark et al. (2008), and
Kessels et al. (2014) disagree with their findings.
Special Education and Academic Achievement
Sammarone (2014) in her cross-sectional, correlational, explanatory study on the
influence of the length of the school day on the achievement of Grades 6-8 students in
New Jersey schools reviewed literature on special education. She explicated the federal
and state emphasis to have all students meet proficiency using standardized test scores
has moved students with disabilities into the national discussion on high-stakes testing.
Citing Katsiyannis, Zhang, Ryan, and Jones (2007, p.161), she stated, “Schools have
been quick to raise concerns over these new mandates, given the historically poor
performances of special education students on these assessments” (p. 34.) Positive and
negative implications for students were cited. An increase of performance on
standardized assessments by special education students, as well as the inclusion and
participation in the training of curriculum standards and assessments by special education
teachers were seen as positive implications. Negative consequences of state standardized
tests, referred to as high-stakes, were illuminated by Sammarone, “Students with

62
disabilities are also more stressed, by test taking and their inability to reach the state
standard” (p. 36).
Sullivan and Bal (2013) studied disproportionality in special education. In a
sample of 18,000 students educated in 39 schools of an urban K-12 school system, they
found racial minority male students from low-income backgrounds to be at highest risk of
being classified in one of the disability categories. Multilevel analyses identify school
variables to not be predictors of student risk for identification. “The most consistent
predictors of identification across the categories were students' gender, race,
socioeconomic status, and number of suspensions” (p. 475). These findings support the
analysis of Gray, Peng, Steward, and Thomas (2004) who, using 2004 U.S. Department
of Education data, identified that boys were more frequently diagnosed with attention
deficit hyperactivity disorder (ADHD) and were also much more frequently placed in
special education programs. Sullivan and Bal (2013) cited Donovan and Cross (2002)
who described disproportionality as a “paradox of special education in that identification
is meant to allocate necessary and appropriate services and additional resources for
students with disabilities, but it may also lead to stigmatization, segregation, exposure to
low expectations, receipt of weak curriculum, and constraint of post school outcomes" (p.
476). Disproportionality in special education is not a new phenomenon. Using U.S.
Department of Education data published in 2010, Sullivan and Bal (2002) found "racial
disproportionality have been consistent for decades . . . . Black students are twice as
likely to be identified as ED (Emotionally Disturbed) . . . than their White peers
nationally . . . . Conversely, Latino students tend to be proportionally or slightly
underrepresented across disability categories nationally, whereas Asian/Pacific Islander

63
students are typically moderately underrepresented . . . relative to White students" (p.
476). Lower performing students in high achieving schools were also found to be more
likely to be identified for special education. It was recommended that districts “focus on
(a) preventing inappropriate identification where academic difficulties result from factors
outside of disability (e.g., cultural difference, lack of learning opportunities) and (b)
providing access to preventative services and interventions that may mitigate mild
disabilities—particularly among racial minority males from lower SES backgrounds"
(p. 491).
Prior Academic Achievement and Academic Achievement
Casillas, Robbins, Allen, Kuo, Hanson and Schmeiser (2012) in their research
published in the Journal of Educational Psychology investigated the ability to predict
academic failure in school using prior academic achievement and other variables such as
behavioral, demographic, and school context factors found in data on 4,660 middle-
school students from 24 schools. Their findings suggest that prior grades and
standardized achievement are the strongest predictors of high school GPA. These
findings highlight the importance of providing all students with opportunities and
interventions for academic success in their earliest years of schooling.
Engerman and Bailey (2006) analyzed family decision-making style, peer group
affiliation, and prior academic achievement as a predictor of the academic achievement
of African American students. Their findings published in the Journal of Negro
Education, “indicated that prior academic performance and socioeconomic status (SES)
predicted academic achievement" (p. 443). Citing Reis, Colbert, and Hébert (2005),
Engerman and Bailey recommended "productive programs designed to augment the

64
instruction students receive in the classroom . . . to improve academic achievement.
However, the success of these programs is determined by continuous participation.
Therefore, it should be a mandatory requirement for low-achieving African American
students to participate in such programs" (p. 455).
Phan (2012), in a longitudinal examination of prior academic achievement, effort,
and achievement goal orientations published in the Journal of Educational Psychology,
explored the effects of prior academic achievement and effort on mathematical
achievement, involving 234 university students, the analyses indicated that both prior
academic achievement and effort contributed to mathematical achievement. "Prior
academic achievement, as theorized by Bandura (1986, 1997), serves as a source of
information for individuals to cognitively appraise their capabilities. The gauging of
one’s success and/or failure in a subject matter (e.g., algebraic problems involving
addition) enables one to formulate and develop a sense of self-efficacy towards different
courses of actions" (p. 59).
St. John (2015) found past performance was a statistically significant predictor of
performance in his study of students in Grades 6-8 on the New York state standardized
assessment. “According to the analysis, past performance accounted for 45.6% of the
variability in Grades 6-8 student performance" (p. 82). In addition, past academic
performance on the 2013 New York state mathematics standardized assessment “was the
strongest predictor of academic performance on the 2014 New York State Mathematics
Assessment. There was a positive relationship between past academic performance and
performance on the 2014 New York State Mathematics Assessment. As performance
increased on the 2013 New York State Mathematics Assessment, performance on the
65
2014 New York State Mathematics Assessment increased as well" (pp.127-128). Trust
(2015) also found in his research of ELT the only statistically significant predictor of
student performance on subsequent examinations was performance on past examinations.
Conclusion
Middle schools are facing increased performance demands and pressure. Raising
levels of academic achievement of all students to meet NCLB mandates and addressing
the social-emotional needs of diverse adolescents require middle schools to consider
extending time. Adding additional time for instruction is one strategy to improve student
achievement and middle school performance. Simply doing more of the same with the
added minutes or days is not what is needed to raise achievement. “Simply expanding
time . . . at schools is not a silver bullet for success” (Gabrieli, 2010, p. 3). Deepening
core subjects instruction, providing time for enrichment opportunities, and supporting
teachers with time for collaboration are identified in the literature as effective uses of
additional school time to improve student achievement.
The pressure for students to show academic achievement on standardized tests has
impacted instructional time and content covered in middle schools. Instructional time
previously used for fundamental practices associated with middle schools have been
altered in the era of increased accountability that began in 2002 under the No Child Left
Behind Act (Musoleno, 2010). Reduced or removed are middle school practices such as
interdisciplinary and integrated curriculum, flexible groupings for instruction and
advisories in some middle schools, all of which have been identified in the literature to
support middle school students (Jackson & Davis, 2000). Reading, math, and writing
have been given more instructional time while art, science, and other non-tested subjects

66
have seen their instructional time reduced or eliminated (Musoleno, 2010). This shift has
altered the core practices of middle schools that were focused on the unique social and
emotional needs of young adolescents. The need to balance practices identified as
appropriate for middle school students and their social-emotional needs with the demands
of academic achievement, as defined under NCLB, has implications for educational
practice.
In 2009, President Obama, in his remarks to the Hispanic Chamber of Commerce
on a complete and competitive American education proclaimed the challenges of a new
century demanding more time in the classroom for students to learn. ELT offers a
strategy to increase instructional time for schools to balance the special needs of middle
school students and the demands of the new century and federal mandates under NCLB.

67
CHAPTER III
METHODOLOGY
Introduction
The purpose of this quantitative study was to examine the influence, if any, of an
extended school day (ESD) incorporating increased instructional minutes on academic
achievement of middle school students in Grades 6, 7, and 8 as measured by the 2014
New Jersey Assessment of Skills and Knowledge (NJ ASK). This study was designed to
produce research-based evidence on the influence, if any, of an extended school day on
achievement of general and special education students in middle school. It will add to the
existing but limited contra distinct research and provide educational leaders with data
required for policy, practice, and future research decisions. Patall et al. (2010)
conducted a search of studies on extended learning time (ELT) from 1985-2009, of the 15
empirical studies of various designs they found that ELT “can be an effective way to
support student learning, particularly for students most at risk of school failure when
considerations are made for how time is used” (p. 401). Sammarone’s 2014 study
examined the influence of the length of school day on NJ ASK scores of middle school
students; however, it did not include students who attend magnet schools and
recommended conducting a study on instructional minutes for future research. There is
little research on the impact of an extended school day incorporating increased
instructional minutes on student achievement for a diverse group of middle school
students in a suburban setting who attend magnet schools and are not all at risk for
failure.

68
In this study, school and student variables were reviewed, and the influence of an
extended school day on achievement incorporating increased instructional minutes
provided for one group of students was examined. This study also provided research-
based evidence that may assist policy makers and educational leaders with policy creation
and implementation that will positively influence the academic achievement of all
students.
Research Design
This study was conducted as a quantitative non-experimental, explanatory
research design. Random selection, generally the preferred method of participant
selection (Gay, Mills, & Airasian 2012), was not possible since the comparison groups
were formed by parent/student magnet school selection. Students were assigned, using
quantitative methods, to comparison groups. Propensity Score Matching (PSM), a control
technique, was used to equate sample groups on one or more variables. It was expected
that PSM would result in a sample selection where each student in the experimental
group would have a comparative counterpoint participant representative in the control
group. The goal was to have groups that were similar on all relevant variables except the
treatment grouping (Gay, Mills, & Airasian, 2012).
Data provided by the school district on student performance on the NJ ASK to
measure student achievement were used for analysis. Descriptive statistical methods
were used to analyze the population in addition to comparing the independent and
dependent variables. Analysis of the data using procedures such as factorial analysis of
variance, analysis of variance, factorial analysis of covariance, and analysis of covariance
were explored in an attempt to determine if an extended school day incorporating

69
increased instructional minutes had an influence on student academic achievement as
measured by the NJ ASK.
Sample Population
The participants in the study were selected from one of three middle schools in a
diverse suburban middle- to upper-middle-income K-12 public school district located in
New Jersey. With a population of approximately 37,700, the 2010 U.S. Census reported
the township to have the following major racial groups in the population: 62.16% White,
27.16% African-American 3.81% Asian, and 4.50% from two or more races. Hispanics
of any race were 7.46% of the population. The median household income was $95,696.
Of the township’s households, 33.9% had school age children. While the per capita
income of the township was $59,536, approximately 4.6% of families and 6.1% of the
population lived below the poverty line.
The suburban public school district was comprised of eleven schools educating
approximately 6,700 students from kindergarten through Grade 12. Of the 11 schools,
seven were elementary, three were middle, and one was a comprehensive high school.
The seven elementary and three middle schools each had different magnet themes.
According to the district website, the magnet system existed to ensure racial balance in its
schools and to provide parental choice in education. Parents selected the magnet-themed
schools they were most interested in having their child attend. The district reported that in
most cases, parents’ first or second school choice was honored. The three middle school
choices had the following magnet themes: STEM (Science, Technology, Engineering and
Mathematics), Gifted & Talented/Visual & Performing Arts, and Creating Connections:
Children, Community & Curriculum, using an extended day schedule.

70
For this study, the sample population was limited to students in Grades 6, 7, and 8
who attended the three district middle schools coded as MS 1, MS 2, and MS 3. This
population included males and females, children with and without disabilities,
economically disadvantaged, African-American, White, Asian, and Hispanic children, in
addition to children who identified as being of two or more races. The children ranged in
ages from 10 to 14. Students were not randomly assigned to a control or treatment group.
The existing groups of students enrolled in the three magnet-themed schools formed the
basis of the sample population.
MS 1 was in the non-experimental or control group. The school website
described its program as an inclusive Science, Technology, Engineering, and
Mathematics (“STEM”) magnet school that provided exploratory experiences for all
students and allowed opportunities for advanced study and competencies. The pre-
engineering program engaged students in hands-on curricula that encouraged the
development of problem-solving skills, creative and innovative reasoning along with
critical thinking. Students spent three years in small learning communities, or “houses,”
with the same core teachers. Using block scheduling, students worked in each of the four
core areas (mathematics, language arts, science, and social studies) for 80 minutes every
other day. The humanities, physical education, and technology courses rounded out the
curriculum, which supported the STEM magnet and were designed to address the whole
child. The curriculum connected 21st century technology, communication literacy,
interdisciplinary instruction, and global perspectives, in a collaborative, project-based
learning environment. The school operated on a Monday to Friday, 7:50 a.m. to 2:09 p.m.
schedule.
71
MS 1 had a population of approximately 594 students, 221 of which were in
Grade 6, 193 in Grade 7, and 180 in Grade 8. Male students made up 53% of the school
population, and the remaining 47% were female. Students enrolled were made up of the
following subgroups as defined by the No Child Left Behind Act of 2001.
Approximately 42.6% of the students were White, 33.5 % were African-American,
12.6% were Hispanic, 7.7% were Asian, 0.3% were American Indian, and 3.2% were two
or more races (identified as Other for this study). Approximately 21% of the students
were classified as having disabilities. Economically disadvantaged students made up
26.1% of the population and 0.0% were identified as students with limited English
proficiency. This group had a school week that was in session on average 31 hours and
35 minutes. Middle school students enrolled in MS 1 were engaged in instructional
activities under the supervision of a certified teacher for an average of 27 hours and 40
minutes per week. The school reported 6% of the students to have been absent from
school for any reason for 10% or more of the total days possible in the school year. The
percentage of students who were suspended one or more times per year was 5.1%. The
student to staff ratio was 9 students per faculty member, and there were 297 students per
administrator.
MS 2 was also in the non-experimental or control group. According to the school
website, the magnet school viewed all children as having special gifts and talents,
experiences were provided for children to explore through academics, related arts, and
academic arts programs. The value and contributions of the arts were integrated into the
curriculum with the goal of developing students’ problem solving abilities and higher
order thinking skills. Organized into small learning communities, or “houses,” the

72
instructional curriculum was divided into basics and related arts. The basic core areas
(mathematics, language arts, science, world language, and social studies) were taught by
house teachers. Related Arts teachers offered classes, including vocal and instrumental
music, visual and performing arts, drama, and technology. Enrichment classes in basic
courses were offered as Academic Arts. Using this structure, students learned content and
developed skills while exploring areas of interest and cultivating areas of strength, and
teachers presented curriculum through an interdisciplinary approach. The school
operated on a Monday to Friday, 7:50 a.m. to 2:09 p.m. schedule.
MS 2 had a population of approximately 685 students, 220 of which were in
Grade 6, 224 in Grade 7, and 240 in Grade 8; in addition, there was one student educated
in an ungraded classroom. Male students made up 47% of the school population, and the
remaining 53% were female. Students enrolled were made up of the following subgroups
as defined by the No Child Left Behind Act of 2001. Approximately 59% of students
were White, 29.3% were African-American, 9.8% were Hispanic, 5.8% were Asian, and
4.1% were two or more races (identified as Other for this study). Approximately 14% of
the students were classified as having disabilities. Economically disadvantaged made up
22.8% of the school population and 0.0% were students identified with limited English
proficiency. This group had a school week that was in session on average 31 hours and
35 minutes. Middle school students enrolled in MS 2 were engaged in instructional
activities under the supervision of a certified teacher for an average of 27 hours and 5
minutes per week. The school reported 3% of the students to have been absent from
school for any reason for 10% or more of the total days possible in the school year. The
percentage of students who were suspended one or more times per year was

73
0.3%. The student to staff ratio was 9 students per faculty member, and there were 342.5
students per administrator.
MS 3 was the extended school day (ESD) magnet middle school whose students
made up the experimental or treatment group. According to the school website, the
magnet school curriculum was inspired by the historic rebirth of the arts and sciences.
Organized into four homerooms per grade level, in a small learning environment,
students investigated ideas through an interdisciplinary, thematic curriculum. Teachers
operated as part of grade level instructional teams. The school operated on an extended
day schedule of Monday to Thursday, 8:20 a.m. to 4:05 p.m. Using block scheduling,
students worked in the four core areas (mathematics, language arts, science, and social
studies) for 70 minutes twice a week. Mathematics and writing workshops added two
additional forty minute periods of instruction two days a week. Included in the extended
day schedule was time for advisories, DEAR (Drop Everything and Read), and
community service. Friday was an enriched curriculum day with an 8:20-2:35 schedule
that was not an extended day. The Friday schedule was an approach that allowed
students to expand the work they did in the classroom through the exploration of
enrichment topics, monthly field trips, and community service. Friday class offerings
included Opera, Drama, Community Arts, Survivor, and Literary Circles.
With a school population of approximately 277 students, MS 3 educated 94 sixth
graders, 100 seventh graders, and 83 eighth graders. The student population was 63%
male and 37% female. Students enrolled were made up of the following subgroups as
defined by the No Child Left Behind Act of 2001. Approximately 53.4% were White,
24.5 % were African-American, 12.3% were Hispanic, 4.3% were Asian, and 5.4% were

74
two or more races (identified as Other for this study). Approximately 23% of the
students were classified as having disabilities. Economically disadvantaged students were
18.8% of the school population, and 0.0% were identified as students with limited
English proficiency. This group had a school week that averaged 38 hours and 45
minutes. Middle school students enrolled in MS 3 (the treatment school) were engaged
in instructional activities under the supervision of a certified teacher for an average of 34
hours and 35 minutes per week. The school reported 13% of the students to have been
absent from school for any reason for 10% or more of the total days possible in the
school year. The percentage of students who were suspended one or more times per year
was 3.3%. The student to staff ratio was 10 students per faculty member, and there were
277 students per administrator.
Table 1 Middle School Comparison Chart
School MS 1 MS 2 MS 3
Average School Week 31 hours 35
minutes 31 hours 35 minutes 38 hours 45 minutes
Average School Day 6 hours 19 minutes
6 hours 19 minutes 7 hours 45 minutes
Instructional Minutes/Week
27 hours 40 minutes
27 hours 5 minutes 34 hours 35 minutes
Instructional Minutes/Day 5 hours 32 minutes 5 hours 25 minutes 6 hours 55 minutes
Total School Population 594 685 277
% White 42.6 50.9 53.4
% African- American 33.5 29.3 24.5 % Hispanic 12.6 9.8 12.3 % Asian 7.7 5.8 4.3 % Other 3.2 4.1 5.4 % Special Education 21 14 23

75
% Limited English Proficient
0 0 0
% Free or Reduced Meals 26.1 22.8 18.8 % Male 53 47 63 % Female 47 53 37 Students in Grade 6 221 220 94
Students in Grade 7 193 224 100
Students in Grade 8 180 240 1 ungraded student
83
% Students Absent 10% or More of Total Days 6 3 13
% Suspension 5.1 0.3 3.3
Student to Faculty Ratio 9:1 9:1 10:1
Student to Admin. Ratio 297:2 343:2 277:1
Source: New Jersey School Performance Report 2013-2014 Power
The sample formation used Power Analysis for ANOVA Designs for the Factorial
ANCOVA, ANCOVA, factorial ANOVA, and ANOVA to identify the needed sample
size. The power parameters specified were as follows: a = 7 (levels of factor for power),
b = 1 (levels of factor(s) crossed with A), delta = 1.25 (effect size(s)), and alpha = 0.05
(significance level). The minimum sample was calculated to be 90.
Sample Participants
Participants were included in the study if they meet the following criteria: (1)
student was enrolled in one of the district middle schools during the 2013-2014 school
year and had a valid score in the Language Arts Literacy or Mathematics sections of the
2014 NJ ASK, (2) student attended the same middle school for one year or more, (3)
student was enrolled in one of the district’s elementary schools and had a valid score in
the English Language Arts or Mathematics sections of their 5th grade NJ ASK.

76
Participants were excluded from this study if they met the following criteria: (1)
student was in an out-of-district placement during one or more middle school year, (2)
time in district or time in school was less than one year, (3) student was coded as English
Language Learner (ELL), (4) student did not have a valid English Language Arts or
Mathematics 5th grade NJ ASK score, or (5) student did not have a valid English
Language Arts or Mathematics sixth, seventh, or eighth grade NJ ASK score.
Instrumentation of NJ ASK
The purpose of this study was to determine whether a relationship existed
between the student and school variables discussed in the review of the literature and
performance on the English Language Arts and Mathematics sections of the 2014 New
Jersey Assessment for Skills and Knowledge (NJ ASK) of sixth, seventh and eighth grade
students enrolled in one of the district’s three magnet-themed middle schools. The 2014
NJ ASK scores measured the level of proficiency of students on Common Core State
Standards (CCSS) in English Language Arts and Mathematics throughout the state of
New Jersey.
New Jersey has revised its standardized assessments at least seven times since the
1976 amendment to the New Jersey Public School Education Act established uniform
standards of minimum achievement. The state has reflected changing content standards
and national trends in standards-based education and educational accountability in its
standardized assessments. The NJ ASK was in a period of transition in 2013 from
providing information on each student’s achievement in the areas required under the New
Jersey Core Curriculum Content Standards (NJCCCS) to the Common Core State
Standards (CCSS). In 2014, the NJ ASK had transitioned to the Common Core State

77
Standards (CCSS) and, as a result, the 2014 English Language Arts and Mathematics
assessments were aligned to the CCCS for Grades 6-8 (NJ ASK 2014 Score
Interpretation Manual, p. 10).
The assessments took place over a four-day period within a two-week window
where students in Grades 6-8 were given a total of 363 minutes to complete English
Language Arts and Mathematics tests consisting of multiple choice questions,
constructed response questions, reading passages, and writing tasks. Extended testing
time, consisting of time and one half, was given to students who had the accommodation
written into their individual education plan (IEP).
The New Jersey Department of Education Division of Standards, Assessments,
and Curriculum Office of Assessments listed the following goals for the NJ ASK:
• To measure and promote student achievement of challenging state curriculum
standards
• To provide accurate and meaningful information about student performance
• To meet state and federal accountability requirements
(NJ ASK 2014 Score Interpretation Manual, p. 10)
The NJ ASK English Language Arts and Mathematics scores were reported as
scale scores with a range of 100 to 300 per content area. The state assessment identified
three levels of performance in each content area: Advanced Proficient, Proficient, and
Partially Proficient. Scores at or above 250 indicated Advanced Proficient performance,
reflecting performance that had clearly met or exceeded state standards. Scores from 200
to 249 indicated Proficient performance, reflecting performance that had met state
standards. A child performing in the Advanced Proficient or Proficient level had met the

78
state standards for that content area. Scores below 200 indicated a child performed at the
Partially Proficient level and had not met the state minimum level of proficiency.
Students performing at the Partially Proficient level and lower end of the Proficient score
distribution required a closer look to identify if instructional interventions and supports
were needed (NJ ASK 2013 Score Interpretation Manual, p. 23).
While designed to be reliable, the NJ ASK reported that it was not possible to
produce a 100% reliable assessment. As a result, the student’s score should be
interpreted as an estimate of the student’s performance. Accuracy of the score was
impacted by its location on the scale. Therefore, scores at the ends of the scale of
100-300 were generally considered to be less precise than scores in the 200 area. It was
recommended that more latitude and flexibility be called for when interpreting individual
scores at the ends of the score distribution. However, “scale scores may be used for
statistical analysis to study the effectiveness of instructional programs and
methodologies” (NJ ASK 2013 Score Interpretation Manual, p.25). NJ ASK school and
district reports were useful in making group comparisons at the school and district levels.
Analyses of similar groups on similar tasks enabled the most meaningful comparisons.
Federal law (NCLB) required the New Jersey Department of Education to ensure
the reliability of instruments it used to measure student achievement for school
accountability such as the NJ ASK. The NJ ASK 2014 Grades 3-8 Technical Report
indicated student achievement to be measured in a reliable manner. It stated the “size of
the measurement error associated with test scores is reasonable and can be taken into
account when interpreting the scores for individual students” (NJ ASK 2014 Grades 3-8
Technical Report, p. 137).

79
Data Collection
Permission was granted to use all requested resources by the interim
superintendent of schools under the authority of the Board of Education. Institutional
Review Board consent was requested and received. Data routinely collected by the
district student data analyst were shared from the Department of Education's
comprehensive statewide longitudinal data system, NJ Standards Measurement and
Resource for Teaching (NJ SMART), via Excel spreadsheets categorized by student
numbers at the beginning of the data collection process for this study. Student anonymity
and confidentiality was ensured using a number assignment system created by the district
data analyst. The reports included 2011-2014 NJ ASK scores in Language Arts and
Mathematics, eligibility for free or reduced lunch, ethnicity, gender, date of birth, time in
district less than one year, time in school less than one year, school name, grade,
attendance, English language proficiency, and special education classification for each
student. The focus of this study was on the academic achievement of all students who
had received an extended school day incorporating increased instructional minutes;
therefore, students who were classified as special education students were included in the
study. Students missing data from their student records still may have been included in
the study.
New Jersey School Performance Reports were downloaded from the State
Department of Education's website. These reports presented in the aggregate per school
strictly served as informational since the unit of analysis for this study was at the student
level. Presented annually, these reports were designed to inform stakeholders about how

80
well each school was preparing students for college and careers according to the DOE
website.
Data Analysis
Convenience samples from three middle schools located in the public suburban
school district in New Jersey where the performance of students who attend the ESD
magnet middle school and those who do not were examined in this study. NJ ASK data
were used as a proxy for achievement. The performance of tested students enrolled in
one of the middle schools with ESD incorporating increased instructional minutes was
examined and compared to student data from one of the other two middle schools where
ESD was not available. Collected data were analyzed with IBM SPSS Statistics Student
Version 22.0 for Windows computer program. The predictor variables gender,
socioeconomic status, ethnicity, attendance, enrollment in the ESD middle school, special
education, and prior achievement on the 5th grade NJ ASK were entered as independent
variables. Student performance on the 2014 NJ ASK was identified as the dependent
variable. For comparative purposes both ANCOVA and factorial ANCOVA, along with
ANOVA and Factorial ANOVA, were explored.
Variables
The six independent variables included in this study were gender, socioeconomic
status, ethnicity, attendance, enrollment in the ESD middle school, and special education
classification. Student past performance on the 5th grade NJ ASK was used to determine
prior achievement. The following dichotomous variables in this study were classified as
yes or no: SES, attended ESD middle school, and special education classification.
Gender, ethnicity, and attendance were dummy coded. The dependent variable in this

81
study was student achievement on the ELA or Math sections of the 2014 NJ ASK in
Grades 6-8. Here earning a Proficient or Advanced Proficient score (200-300) on the NJ
ASK was used as a proxy for achievement. Table 2 lists the coding that was used in
SPSS.
Table 2 Coding in SPSS of Variables
Variable Coding Status
Middle School Achievement
NJ ASK Scores Continuous score - actual composite score
Dependent
5th Grade (prior) Achievement
NJ ASK Scores Continuous score actual composite score
Covariate
Attended ESD School
No = 0 Yes = 1 Independent
Middle School Attended MS 1 = 1
MS 2 = 2 MS 3 = 3
Independent
Ethnicity Other = 1 Asian = 2 Hispanic = 3 African-American = 4 White = 5
Moderator/Independent
Gender Male = 0 Female = 1 Covariate
Socioeconomic Status (SES)
No Free or Reduced Meals = 0 Free or Reduced Meals = 1
Moderator/Independent
Student Annual Attendance
Continuous variable - actual attendance for the assessment year 2014
Moderator/Independent
Special Education Classification (SPED)
Does Not Receive SPED Services = 0 Receives SPED Services = 1
Covariate
Dummy Coded Variable
Attended MS 1, No = 0 Yes = 1 Attended MS 2, No = 0 Yes = 1 Attended MS 3, No = 0 Yes = 1
Covariate

82
Propensity Score Matching
Propensity score matching (PSM) was used as a method for selecting comparison
groups in this study. It was used to pair like students in the sample from the treatment
school (extended day school) with like students from the control schools in an effort to
reduce sampling bias and to additionally approximate more of a randomized design
methodology. This statistical tool was used to better balance the confounding variables
across subjects to decrease the overall impact of selection bias inherent in non-
randomized, primarily exploratory designs. Within education, there are many ethical and
cost limitations that prevent researchers from using randomized samples, according to
Lane and Henson (2010), which results in an “overabundance and over-reliance on
non-randomized studies throughout the field of education” (Lane & Henson, 2010, p. 3).
Endorsed by the U.S. Department of Education, this quasi experimental technique
controls for covariates such as self-selection bias and non-random assignment (Lane, To,
Shelley, & Henson, 2012). Self-selection, as in the case of magnet school selection,
made random assignment impossible and could produce non-equivalent groups. The PSM
method selected participants or units from a large bank to produce a control group that
was similar to the treatment group with respect to the distribution of covariates
(Rosenbaum & Rubin, 1985). “Propensity matching is used in studies when there is a
relatively small group of subjects exposed to a treatment and a much larger group of
control subjects not exposed” (Rosenbaum & Rubin, 1985, p. 33).
Propensity Score Matching (PSM) was used to equate sample groups on one or
more demographic variables, resulting in each member of the treatment group having a
direct counterpart in the non treatment group (Gay, Mills, & Airasian, 2012). All data

83
were analyzed using the IBM SPSS Statistical Student Version 22.0 for Windows
computer program. The predictor variables ethnicity, gender, socioeconomic status,
attendance, special education, placement in the non extended learning time middle
school, and placement in the extended learning time middle school were entered as the
independent variables. The performance of middle school students on 2014 NJ ASK was
identified as the dependent variable in this study. Multiple regression analysis and other
statistical methods were utilized to determine the association between the independent
variables and the dependent variable.
ANCOVA
Analysis of covariance (ANCOVA) is a parametric test of significance that was
used to control extraneous variables and as a means of increasing the power of a
statistical test (Gay, Mills, & Airasian, 2012). This statistical method sought to equalize
groups with respect to the control variable to enable comparison. According to Gay,
Mills, and Airasian (2012), “Any variable that is correlated with the dependent variable
can be controlled for using covariance” (p. 360). When analyzing covariance, an attempt
was made to reduce variation in NJ ASK scores that are attributed to variables other than
the ESD treatment.
Factorial ANCOVA
To investigate the research questions, a factorial analysis of variance (factorial
ANCOVA) was conducted to determine the differences between independent variables
on a dependent variable after controlling for the effects of one or more covariates
(Statistics Solutions, 2013). In causal comparative designs, a factorial ANCOVA is
useful for determining the effects of the grouping variable on the control variable in

84
combination or separately (Gay, Mills, & Airasian, 2012). The statistical procedure
determined how variables group together based on their commonalities (Gay, Mills, &
Airasian, 2012). In the analysis of the data underpinning this research project, the
covariate was past academic achievement as measured by the fifth grade NJ ASK
assessment. The covariate was chosen specifically because of its possible effect on the
dependent variable. The purpose was to control for the effect of that variable on the
dependent variable to determine if the effect was due to the covariate or if the difference
was independent of the effect of that covariate (Statistics Solutions, 2013).
ANOVA
The one-way analysis of variance (ANOVA) was used to examine differences
between two or more groups on a continuous variable. In this study it was used to
determine whether there were any significant differences between the mean scores of the
groups of students in the treatment school and the control schools. “Analysis of variance
is used when there is one independent variable with a few, often nominal, levels and one
normally distributed dependent variable” (Leech, Barrett, & Morgan, 2015, p. 336).
According to Laerd Statistics (2013), the one-way ANOVA compares the means between
groups and identifies whether any of the means are significantly different from each
other. Post-hoc tests were used to determine which specific groups differed from each
other in the study. In this study an attempt was made to reduce variation in NJ ASK
scores that are attributed to variables other than the ESD treatment.
Factorial ANOVA
To investigate the research questions where an interaction was found between
independent variables, a factorial analysis of variance (factorial ANOVA) was conducted

85
to determine the differences between independent variables on the dependent variable
without controlling for the effects of one or more covariates (Statistics Solutions, 2013).
Both factorial ANOVA and ANCOVA provide information on whether considering more
than one independent variable (such as gender and school) at a time provides additional
information beyond what would be provided if basic inferential statistics for each
independent variable was conducted separately (Leech, Barrett, & Morgan, 2015). Since
the independent variables were limited to two and each variable had a small number of
levels or categories, factorial ANOVA was useful for testing the hypotheses in several
research questions where an interaction was found.
This explanatory, non-experimental quantitative study analyzed the 2014 New
Jersey School Performance Report data and district student data to measure the
relationship, if any, of an extended school day incorporating increased instructional
minutes on Grades 6, 7, and 8 NJ ASK scores. Student NJ ASK scores were used as a
proxy for achievement.

86
CHAPTER IV
ANALYSIS OF THE DATA
Introduction
The purpose for this research study was to investigate the influence of an
extended school day, reported in instructional minutes, on academic achievement of
general and special education middle school students in Grades 6-8 in an upper middle-
income suburban K-12 public school district located in northern New Jersey. Student
performance on the English Language Arts (ELA) and Mathematics sections of the 2014
New Jersey Assessment of Skills and Knowledge (NJ ASK) was used as a proxy for
academic achievement. In addition, the study examined the amount of variance in
student 2014 NJ ASK scores that could be accounted for by instructional minutes while
controlling for student variables of gender, ethnicity, socioeconomic status (SES),
attendance, prior academic achievement, special education classification (SPED), and
grade.
Research Questions and Null Hypotheses
The following two overarching research questions were addressed in this study:
I. What is the influence of extended school day (ESD) on the academic
achievement of middle school students in Grades 6-8 on the 2014 New Jersey
Assessment of Skills and Knowledge (NJ ASK) in English Language Arts (ELA) and
Mathematics when controlling for prior academic achievement before entering middle
school?
II. What influence does the interaction of extended school day (ESD) and student
fixed factor demographic variables have on the academic achievement of middle school

87
students in Grades 6-8 on the 2014 New Jersey Assessment of Skills and Knowledge (NJ
ASK) in English Language Arts and Mathematics when controlling for prior academic
achievement before entering middle school?
Research Questions
The following subsidiary research questions, derived from the two overarching
research questions, were answered using individual SPSS analyses:
Research Question 1: What is the influence of extended school day (ESD) on the
academic achievement of middle school students in Grades 6-8 on the 2014 New Jersey
Assessment of Skills and Knowledge (NJ ASK) in English Language Arts (ELA) when
controlling for prior academic achievement before entering middle school?
Research Question 2: What is the influence of extended school day (ESD) on the
academic achievement of middle school students in Grades 6-8 on the 2014 New Jersey
Assessment of Skills and Knowledge (NJ ASK) in Mathematics (Math) when controlling
for prior academic achievement before entering middle school?
Research Question 3: What influence does the interaction of extended school day
(ESD) and gender have on the academic achievement of middle school students in
Grades 6-8 on the 2014 New Jersey Assessment of Skills and Knowledge (NJ ASK) in
La English Language Arts when controlling for prior academic achievement before
entering middle school?
Research Question 4: What influence does the interaction of extended school day
(ESD) and gender have on the academic achievement of middle school students in
Grades 6-8 on the 2014 New Jersey Assessment of Skills and Knowledge (NJ ASK) in

88
Mathematics when controlling for prior academic achievement before entering middle
school?
Research Question 5: What influence does the interaction of extended school day
(ESD) and socioeconomic status (SES) have on the academic achievement of middle
school students in Grades 6-8 on the 2014 New Jersey Assessment of Skills and
Knowledge (NJ ASK) in English Language Arts when controlling for prior academic
achievement before entering middle school?
Research Question 6: What influence does the interaction of extended school day
(ESD) and socioeconomic status (SES) have on the academic achievement of middle
school students in Grades 6-8 on the 2014 New Jersey Assessment of Skills and
Knowledge (NJ ASK) in Mathematics when controlling for prior academic achievement
before entering middle school?
Research Question 7: What influence does the interaction of extended school day
(ESD) and special education classification (SPED) have on the academic achievement of
middle school students in Grades 6-8 on the 2014 New Jersey Assessment of Skills and
Knowledge (NJ ASK) in English Language Arts when controlling for prior academic
achievement before entering middle school?
Research Question 8: What influence does the interaction of extended school day
(ESD) and special education classification (SPED) have on the academic achievement of
middle school students in Grades 6-8 on the 2014 New Jersey Assessment of Skills and
Knowledge (NJ ASK) in Mathematics when controlling for prior academic achievement
before entering middle school?

89
Research Question 9: What influence does the interaction of extended school day
(ESD) and ethnicity have on the academic achievement of middle school students in
Grades 6-8 on the 2014 New Jersey Assessment of Skills and Knowledge (NJ ASK) in
English Language Arts when controlling for prior academic achievement before entering
middle school?
Research Question 10: What influence does the interaction of extended school
day (ESD) and ethnicity have on the academic achievement of middle school students in
Grades 6-8 on the 2014 New Jersey Assessment of Skills and Knowledge (NJ ASK) in
Mathematics when controlling for prior academic achievement before entering middle
school?
Null Hypotheses
Null Hypothesis 1: Extended school day (ESD) has no influence on the academic
achievement of middle school students in Grades 6-8 on the 2014 New Jersey
Assessment of Skills and Knowledge (NJ ASK) in English Language Arts when
controlling for prior academic achievement before entering middle school.
Null Hypothesis 2: Extended school day (ESD) has no influence on the academic
achievement of middle school students in Grades 6-8 on the 2014 New Jersey
Assessment of Skills and Knowledge (NJ ASK) in Mathematics when controlling for
prior academic achievement before entering middle school.
Null Hypothesis 3: The interaction of extended school day (ESD) and gender has
no influence on the academic achievement of middle school students in Grades 6-8 on the
2014 New Jersey Assessment of Skills and Knowledge (NJ ASK) in English Language
Arts when controlling for prior academic achievement before entering middle school.

90
Null Hypothesis 4: The interaction of extended school day (ESD) and gender has
no influence on the academic achievement of middle school students in Grades 6-8 on the
2014 New Jersey Assessment of Skills and Knowledge (NJ ASK) in Mathematics when
controlling for prior academic achievement before entering middle school.
Null Hypothesis 5: The interaction of extended school day (ESD) and
socioeconomic status (SES) has no influence on the academic achievement of middle
school students in Grades 6-8 on the 2014 New Jersey Assessment of Skills and
Knowledge (NJ ASK) in English Language Arts when controlling for prior academic
achievement before entering middle school.
Null Hypothesis 6: The interaction of extended school day (ESD) and
socioeconomic status (SES) has no influence on the academic achievement of middle
school students in Grades 6-8 on the 2014 New Jersey Assessment of Skills and
Knowledge (NJ ASK) in Mathematics when controlling for prior academic achievement
before entering middle school.
Null Hypothesis 7: The interaction of extended school day (ESD) and special
education classification (SPED) has no influence on the academic achievement of middle
school students in Grades 6-8 on the 2014 New Jersey Assessment of Skills and
Knowledge (NJ ASK) in English Language Arts when controlling for prior academic
achievement before entering middle school.
Null Hypothesis 8: The interaction of extended school day (ESD) and special
education classification (SPED) has no influence on the academic achievement of middle
school students in Grades 6-8 on the 2014 New Jersey Assessment of Skills and

91
Knowledge (NJ ASK) in Mathematics when controlling for prior academic achievement
before entering middle school.
Null Hypothesis 9: The interaction of extended school day (ESD) and ethnicity
has no influence on the academic achievement of middle school students in Grades 6-8
on the 2014 New Jersey Assessment of Skills and Knowledge (NJ ASK) in English
Language Arts when controlling for prior academic achievement before entering middle
school.
Null Hypothesis 10: The interaction of extended school day (ESD) and ethnicity
has no influence on the academic achievement of middle school students in Grades 6-8
on the 2014 New Jersey Assessment of Skills and Knowledge (NJ ASK) in Mathematics
when controlling for prior academic achievement before entering middle school.
Organization of the Chapter
In this chapter a detailed description of the original sample of 1,343 middle school
students is provided. Propensity score matching, the techniques used to reduce sampling
bias and approximate a randomized design methodology, is described. Descriptive
statistics of the 714 students included in the revised sample are presented. The chapter
concludes with an analysis and the results of each research question along with a brief
summary of the findings.
Description of the Sample
The original sample included 1,555 Grade 6-8 students who attended one of the
three public middle schools in the New Jersey school district. The sample was reduced
after eliminating students who were missing assessment or demographic data, resulting in
1,343 students remaining in the sample. The sample consisted of 466 (34.7%) sixth

92
graders, 454 (33.8%) seventh graders, and 423 (31.5%) eighth graders. Six hundred and
eighty-seven (51.2%) students in the sample were White, while 405 (30.2%) were
African-American, 135 (10.1%) Hispanic, 110 (8.2%) Asian, and 6 (0.4%) were Other.
There were 693 (51.6%) males and 650 (48.4%) females in the sample. Two hundred
and nine (15.5%) students in the sample were eligible for free or reduced lunch, while
1,134 (84.4%) were not eligible for free or reduced lunch. Two hundred and twenty-five
(16.8%) students in the sample were classified as in need of special education services,
while 1,118 (83.2%) were not classified. Four hundred and seventy-eight (35.6%)
students were included in the sample from MS 1, 627 (46.7%) were from MS 2, and 238
(17.7%) were from the treatment school MS 3. The independent variables included were
grade, ethnicity, gender, and socioeconomic status as measured by eligibility for free or
reduced meals, attendance, and special education classification. Coding for the variables
is provided in Table 3. The mean number of days students in the sample were present in
school was 172.5 out of a maximum of 180 days, with a standard deviation of 8.56. The
mean score on the 2014 NJ ASK for ELA was 224.41 with a standard deviation of 27.06.
The mean score for NJ ASK for Math was 236.01, with a standard deviation of 40.11.
Table 3 Coding for SPSS Analyses School Nominal 1= MS 1
2= MS 2 3= MS 3
Grade Level Ordinal Number Indicated Gender Nominal 0= Male 1= Female Ethnicity Nominal 1= Other 2= Asian 3= Hispanic
4= African-American 5= White
Socioeconomic Status Nominal 0= No Free or Reduced Meals 1= Receives Free or Reduced Meals
Special Education Services Nominal 0= Does Not Receive SPED Services

93
1= Receives SPED Services ELA Scores 2014 Scale Scores Indicated Math Scores 2014 Scale Scores Indicated Attendance 2014 Scale Number Indicated Grade 5 ELA Scores Scale Scores Indicated Grade 5 Math Scores Scale Scores Indicated Treatment School Nominal 0= No Treatment
1= Receives Treatment
Table 4 Descriptive Statistics of the Entire Sample (N=1343)
Grade 6 Grade 7 Grade 8 Total
Male 233 (50.0%)
248 (54.6%)
212 (50.1%)
693 (51.6%)
Female 233
(50.0%)
206
(45.4%)
211
(49.9%)
650
(48.4%)
White 223 (47.9%)
238 (52.4%)
226 (53.4%)
687 (51.2%)
African-American 135 (29.0%)
136 (30.0%)
134 (31.7%)
405 (30.2%)
Hispanic 57
(12.2%)
54
(11.9%)
24
(5.7%)
135
(10.1%)
Asian 47
(10.1%)
25
(5.5%)
38
(9.0%)
110
(8.2%)
Other 4 (0.9%)
1 (0.2%)
1 (0.2%)
6 (0.4%)
Socioeconomic Status
71
(15.2%)
76
(16.7%)
62
(14.7%)
209
(15.6%)
Special Education Services
71
(15.2%)
89
(19.6%)
65
(15.4%)
225
(16.8%)
Total 466 454 423 1343

94
Table 5 English Language Arts (ELA) Statistics of the Entire Sample (N=1343)
Gender Minimum Maximum Mean Std. Deviation
Grade 6 Male 147.00 271.00 216.53 24.95
Female 168.00 271.00 224.51 23.00
Grade 7 Male 146.00 300.00 219.35 33.16
Female 139.00 300.00 229.60 32.81
Grade 8 Male 156.00 272.00 225.99 22.34
Female 171.00 275.00 232.27 19.25
Table 6
Mathematics (Math) Statistics of the Entire Sample (N=1343)
Gender Minimum Maximum Mean Std. Deviation
Grade 6 Male 138.00 300.00 237.70 35.90
Female 149.00 300.00 242.02 34.90
Grade 7 Male 123.00 300.00 225.55 42.56
Female 115.00 300.00 224.47 39.30
Grade 8 Male 129.00 300.00 246.99 43.01
Female 122.00 300.00 239.35 41.13

95
Table 7 Descriptive Statistics of the Entire Sample (N=1343)
Number Minimum Maximum Mean Std. Deviation
2014 ELA Scores 1343 139.00 300.00 224.41 27.06
2014 Math Scores 1343 115.00 300.00 236.02 40.11
2014 Attendance 1343 49.00 180.00 172.52 8.59
Sampling: Propensity Score Matching
In this study, propensity score matching (PSM) was used to pair like students in
the sample from the treatment school (MS 3) with like students from the control schools
(MS 1 and MS 2) in an effort to reduce sampling bias and to additionally approximate
more of a randomized design methodology. This statistical tool was used to better
balance the confounding variables across subjects to decrease the overall impact of
selection bias inherent in nonrandomized, primarily explanatory designs. Within
education, there are many ethical and cost limitations that prevent researchers from using
randomized samples, according to Lane and Henson (2010), resulting in an
“overabundance and over-reliance on non-randomized studies throughout the field of
education” (Lane & Henson, 2010, p. 3). PSM has been used to reduce bias and increase
precision in studies within economics, health services research, and social sciences
(D’Agostino, 1998). As in this study, it has also been used when there is “a relatively
small group of subjects exposed to a treatment and a much larger group of control
subjects not exposed” (Rosenbaum & Rubin, 1985, p. 33).

96
PSM allows for statistical analysis of the comparison groups as if randomization
had occurred in assignment of study participants. "The idea underlying propensity score
matching is that if a member of the treatment group is matched with a member of the
control group, both have the same probability of being in the treatment condition (i.e., the
same assumption underlying random group assignment designs)" (Stone & Tang, 2013,
p. 1). “Since quasi-experimental studies often lack random assignment to treatments as
true experiments boast, robust matching techniques can serve as a kind of proxy to
random assignment by controlling variables and ensuring that subjects in different
treatments are as similar as possible prior to treatment" (Phillips, 2012, p. 9). In this
study, the treatment school (MS 3) had a population of 238 students in Grades 6-8, while
the controls schools (MS 1 and MS 2) had a total combined population of 1,105 students
prior to propensity score matching.
The non-random process, including feeder schools and ranking of parental
choices, used to assign 5th grade students to attend one of the district’s three middle
schools was the basis for the original samples. “When randomization is not used,
treatment and comparison groups (whether they be students, classes, or schools) may
differ in their background characteristics” (Adelson, 2013, p. 1). Adelson identified PSM
as an alternative approach to balance treatment and comparison groups on many
covariates. According to D’Agostino (1998), PSM “should be thought of as an additional
tool available to the investigators as they try to estimate the effects of treatments in
studies” (p. 2278). The purposes of matching include “ensuring that the subjects in the
sample are similar, thus more effectively isolating treatment effects; and reducing initial
bias in the sample, thus increasing statistical power” (Phillips, 2012, p. 8). Used as a

97
technique to simulate an experimental study (Frye, 2014), PSM offers a “resolution to the
problems of bias and unobserved differences in estimating treatment effects”
(Rosenbaum & Rubin, 1985, p. 16).
Through the “nearest neighbor matching” (Stone & Tang, 2013) method of PSM,
a propensity score was calculated. "A propensity score is a single summary score that
represents the relationship between multiple observed characteristics for group members
and treatment group assignment” (Stone & Tang, 2013, p. 1). Rosenbaum and Rubin
(1983) described a propensity score as “the propensity towards exposure to treatment” (p.
47). Students in the sample were assigned a score and paired based on similarity of
characteristics such as gender, ethnicity, attendance, socioeconomic status, special
education classification, and past performance (St. John, 2015).
The statistical computing and graphics software language “R” (R Core Team,
2014) was used for the purpose of carrying out propensity score matching on the overall
sample. The add-on packages “Matchit” and “optimatch” were also used to “produce
inferences with substantially more robustness and less sensitivity to modeling
assumptions” (Ho, Imai, King, & Stuart, 2011). The collected student data were entered
into an Excel file and appropriately dummy-coded. The Excel file was later loaded into
“Matchit” via “R” where the one-to-one propensity score match was computed in
“optimatch” (Ho, Imai, King & Stuart, 2011). The resulting PSM analyses and
construction of the sample appear in Appendix B.

98
Table 8 Coding for PSM Analysis
School Nominal 1= MS 1 2= MS 2 3= MS 3
Grade Level Ordinal Number Indicated
Gender Nominal/Dichotomous 0= Male 1= Female
Ethnicity Nominal 1= Other 2= Asian 3= Hispanic
4= African-American 5= White
Socioeconomic Status Nominal/Dichotomous 0= No Free or Reduced Meals
1= Receives Free or Reduced Meals
Special Education Services Nominal/Dichotomous 0= No SPED
1= Receives SPED Services
2014 ELA Scores Scale Continuous Scale Variable
2014 Math Scores Scale Continuous Scale Variable
2014 Attendance Scale Continuous Scale Variable
Grade 5 ELA Scores Scale Continuous Scale Variable
Grade 5 Math Scores Scale Continuous Scale Variable
Treatment School Nominal 0= No Treatment
1= Receives Treatment
After PSM, a total of 714 students were included in the sample from Grades 6-8.
Seven independent/predictor variables (school, grade, gender, ethnicity, SES, special
education classification, and Grade 5 state assessment scores) were included in the PSM
calculations. The Grade 5 ELA and Math state assessment scores served as a baseline
measure of academic achievement prior to students being assigned to a particular middle
school. Two hundred and thirty-eight students (33.3%) attended the treatment school
(MS 3), 238 students (33.3%) attended MS 1, and 238 students (33.3%) attended MS 2.
Two hundred and eleven (29.6%) students were in Grade 6, and 256 students (35.9%)
were in Grade 7. Two hundred forty-seven (34.6%) students were in Grade 8. Four
hundred and sixty (64.4%) male students and 254 female students (35.6%) were included

99
in the PSM sample. Four hundred and fifty-three (63.4%) students were White, 157
students (22%) were African-American, 62 were Hispanic (8.7%), 38 students (5.3%)
were Asian, and four (0.6%) were classified as Other. Seventy-seven students (10.8%) in
the sample received free or reduced meals and 637 (89.2%) did not receive free or
reduced meals. One hundred and forty-nine (20.9%) students received special education
services and 565 students (79.1%) did not receive special education services. The mean
number of days present in school, based on a 180-day school year, was 170.43 with a
standard deviation of 10.62. The mean scaled score on the 2014 New Jersey ELA
Assessment was 227.20 with a standard deviation of 27.74, while the mean scaled score
on the 2014 New Jersey Math Assessment was 238.45, with a standard deviation of
40.73.
Descriptive Statistics of the Entire PSM Sample
Table 9
Distribution of Students Per Middle School
Frequency Percent Valid Percent Cumulative Percent
d MS 1 238 33.3 33.3 33.3
MS 2 238 33.3 33.3 66.7
MS 3 238 33.3 33.3 100.0
Total 714 100.0 100.0

100
Table 10 Distribution of Students by Grade Level
Frequency Percent Valid Percent Cumulative Percent
Grade 6 211 29.6 29.6 29.6
Grade 7 256 35.9 35.9 65.4
Grade 8 247 34.6 34.6 100.0
Total 714 100.0 100.0
Table 11 Distribution of Students by Gender
Frequency Percent Valid Percent Cumulative Percent
Male 460 64.4 64.4 64.4
Female 254 35.6 35.6 100.0
Total 714 100.0 100.0
Table 12 Distribution of Students by Ethnicity
Frequency Percent Valid Percent Cumulative Percent
Other 4 .6 .6 .6
Asian 38 5.3 5.3 5.9
Hispanic 62 8.7 8.7 14.6
African American 157 22.0 22.0 36.6
White 453 63.4 63.4 100.0
Total 714 100.0 100.0

101
Table 13 Distribution of Students by Socioeconomic Status
Frequency Percent Valid Percent Cumulative Percent
Does Not Receive Free or
Reduced Meals 637 89.2 89.2 89.2
Receives Free or Reduced
Meals 77 10.8 10.8 100.0
Total 714 100.0 100.0
Table 14 Distribution of Students by Special Education Services
Frequency Percent Valid Percent Cumulative Percent
Does Not Receive SPED Services 565 79.1 79.1 79.1
Receives SPED Services 149 20.9 20.9 100.0
Total 714 100.0 100.0
Table 15 Descriptive Statistics of the Entire Sample
Number Minimum Maximum Mean Std. Deviation
ELA Scores
2014 714 139.00 300.00 227.20 27.74
Math Scores
2014 714 129.00 300.00 238.45 40.73
Attendance
2014 714 49.00 180.00 170.43 10.62

102
For the control school MS 1, after PSM, a total of 238 students were included in
the sample from Grades 6-8 for ELA and Math. Seven independent variables—school,
attendance, grade, gender, ethnicity, SES—and special education classification were
included in the PSM calculations. Seventy students were in Grade 6, eighty-four (84)
were in Grade 7, and 84 students were in Grade 8. One hundred and forty-seven males
and 91 females were included in the PSM sample. One hundred and sixty-one students
were White, 49 students were African-American, 13 were Hispanic, 14 were Asian, and
one student was classified as Other. Twenty-seven students in the sample received free
or reduced meals and 211 did not receive free or reduced meals. Forty-nine students
received special education services and 189 did not receive special education services.
The mean number of days present in school, based on a 180-day school year, was 170.58
with a standard deviation of 10.45. The mean scaled score on the 2014 New Jersey ELA
Assessment was 226.29 with a standard deviation of 28.56; the mean scaled score on the
2014 New Jersey Math Assessment was 238.83, with a standard deviation of 41.85.
Table 16 Descriptive Statistics of Control Sample (MS 1 School) After PSM Calculations (N=238)
Grade 6 Grade 7 Grade 8 Total
Male 42 (60.0%) 56 (66.7%) 49 (58.3%) 147 (61.8%)
Female 28 (40.0%) 28 (33.3%) 35 (41.7%) 91 (38.2%)
White 47 (67.1%) 59 (70.2%) 55 (65.5%) 161 (67.6%)
African-American 16 (22.9%) 15 (17.9%) 18 (21.4%) 49 (20.6%)
Hispanic 2 (2.9%) 9 (10.7%) 2 (2.4%) 13 (5.5%)
Asian 5 (7.1%) 1 (1.2%) 8 (9.5%) 14 (5.9%)
Other 0 0 1 (1.2%) 1 (0.04%)
Socioeconomic Status 6 (8.6%) 5 (7.9%) 4 (7.0%) 27 (11.3%)
Special Education Services 11 (15.7%) 21 (25.0%) 17 (20.2%) 49 (20.6%)

103
Table 17 Middle School MS 1 ELA 2014 Scores After PSM Calculations (N=238)
Gender Minimum Maximum Mean Std. Deviation
Grade 6 Male 164.00 262.00 220.76 22.77
Female 181.00 266.00 234.43 23.18
Grade 7 Male 147.00 290.00 218.91 34.58
Female 139.00 296.00 235.71 37.68
Grade 8 Male 167.00 263.00 224.24 22.37
Female 186.00 275.00 233.54 23.48
Table 18 Middle School MS 1 Math 2014 Scores After PSM Calculations (N=238)
Gender Minimum Maximum Mean Std. Deviation
Grade 6 Male 188.00 300.00 252.19 32.33
Female 181.00 300.00 253.81 33.76
Grade 7 Male 141.00 300.00 226.57 42.87
Female 146.00 300.00 230.00 38.30
Grade 8 Male 142.00 300.00 244.10 45.16
Female 161.00 300.00 230.11 46.78
Table 19 Middle School MS 1 ELA, Math, and Attendance Statistics After PSM Calculations
Number Minimum Maximum Mean Std. Deviation
ELA Scores
2014 238 139.00 296.00 226.29 28.56
Math Scores
2014 238 141.00 300.00 238.83 41.85
Attendance 2014 238 49.00 180.00 170.58 10.45

104
For the control school MS 2, after PSM, a total of 238 students were included in
the sample from Grades 6-8 for ELA and Math. Seven independent variables—school,
attendance, grade, gender, ethnicity, SES, and special education classification—were
included in the PSM calculations. Sixty-two students were in Grade 6, ninety were in
Grade 7, and eighty-six students were in Grade 8. One hundred and sixty-three males
and 73 females were included in the PSM sample. One hundred and sixty-six students
were White, 42 students were African-American, 21 were Hispanic, 7 were Asian, and 2
were classified as Other. Twenty students in the sample received free or reduced meals
and 218 did not receive free or reduced meals. Forty-nine students received special
education services and 189 did not receive special education services. The mean number
of days present in school, based on a 180-day school year, was 171.00 with a standard
deviation of 11.30. The mean scaled score on the 2014 New Jersey ELA Assessment was
229.23 with a standard deviation of 26.49, while the mean scaled score on the 2014 New
Jersey Math Assessment was 241.25 with a standard deviation of 38.46.
Table 20 Descriptive Statistics of Control Sample (MS 2 School) After PSM Calculations (N=238)
Grade 6 Grade 7 Grade 8 Total
Male 46 (74.2%) 64 (71.1%) 53 (61.6%) 163 (68.5%)
Female 16 (25.8%) 26 (28.9%) 33 (38.4%) 73 (31.5%)
White 37 (59.7%) 60 (66.7%) 69 (80.2%) 166 (69.7%)
African-American 15 (24.2%) 16 (17.8%) 11 (12.8%) 42 (17.6%)
Hispanic 6 (9.7%) 11 (12.2%) 4 (4.7%) 21 (8.8%)
Asian 2 (3.2%) 3 (3.3%) 2 (2.3%) 7 (2.9%)
Other 2 (3.2%) 0 0 2 (0.8%)
Socioeconomic Status 9 (14.5%) 4 (4.4%) 7 (8.1%) 20 (8.4%)
Special Education 18 (29.0%) 19 (21.1%) 12 (14.0%) 49 (20.6%)

105
Table 21
Middle School MS 2 ELA After PSM Calculations (N=238)
Gender Minimum Maximum Mean Std. Deviation
Grade 6 Male 156.00 260.00 218.70 26.01
Female 168.00 269.00 226.75 31.34
Grade 7 Male 152.00 300.00 229.11 32.30
Female 162.00 281.00 237.58 28.88
Grade 8 Male 168.00 272.00 233.11 20.49
Female 201.00 255.00 232.52 11.89
Table 22
Middle School MS 2 Math Scores After PSM Calculations (N=238)
Gender Minimum Maximum Mean Std. Deviation
Grade 6 Male 138.00 300.00 242.30 39.60
Female 162.00 300.00 233.56 42.09
Grade 7 Male 146.00 300.00 235.52 37.43
Female 141.00 300.00 230.81 38.90
Grade 8 Male 157.00 300.00 256.08 37.16
Female 184.00 300.00 239.06 34.40
Table 23
Middle School MS 2 ELA, Math, and Attendance Statistics After PSM Calculations
Number Minimum Maximum Mean Std. Deviation
ELA Scores 2014 238 152.00 300.00 229.23 26.49
Math Scores 2014 238 138.00 300.00 241.25 38.46
Attendance 2014 238 62.00 180.00 171.01 11.30

106
For the treatment school MS 3, the entire population of 238 students was included
in the sample from Grades 6-8 for ELA and Math. PSM used the entire sample to find
matches within the control school MS 1 and MS 2. Seven independent variables—
school, attendance, grade, gender, ethnicity, SES, and special education classification—
were included in the PSM calculations to identify a comparative sample from the control
middle schools. The population of students who received treatment in MS 3 consisted of
79 students in Grade 6, eighty-two (82) in Grade 7, and 77 students in Grade 8. There
were 150 males and 88 females. One hundred and twenty-six students were White, 66
students were African-American, 28 were Hispanic, 17 were Asian, and one student was
classified as Other. Thirty students who attended MS 3 received free or reduced meals
and 208 did not receive free or reduced meals. Fifty-one students received special
education services and 187 did not receive special education services. The mean number
of days present in school, based on a 180-day school year, was 169.67 with a standard
deviation of 10.08. The mean scaled score on the 2014 New Jersey ELA Assessment was
226.07 with a standard deviation of 28.12. For the 2014 New Jersey Math Assessment,
the mean scaled score was 235.27 with a standard deviation of 41.72.
Table 24 Descriptive Statistics of Treatment School (MS 3) After PSM Calculations (N=238)
Grade 6 Grade 7 Grade 8 Total
Male 50 (63.3%) 53 (64.6%) 47 (61.0%) 150 (63.0%)
Female 29 (36.7%) 29 (35.4%) 30 (39.0%) 88 (37.0%)
White 41 (51.9%) 40 (48.8%) 45 (58.4%) 126 (52.9%)
African-American 17 (21.5%) 26 (31.7%) 23 (29.9%) 66 (27.7%)
Hispanic 15 (19.0%) 10 (12.2%) 3 (3.9%) 28 (11.8%)
Asian 5 (6.3%) 6 (7.3%) 6 (7.8%) 17 (7.1%)
Other 1 (1.3%) 0 0 1 (0.4%)
Socioeconomic Status 9 (11.4%) 13 (15.9%) 8 (10.4%) 30 (12.6%)
Special Education Services 20 (25.3%) 20 (24.4%) 11 (14.3%) 51 (21.4%)

107
Table 25
Middle School MS 3 ELA Scores After PSM Calculations (N=238)
Gender Minimum Maximum Mean Std. Deviation
Grade 6 Male 165.00 266.00 218.74 25.16
Female 168.00 260.00 230.69 20.21
Grade 7 Male 153.00 278.00 219.19 32.94
Female 169.00 300.00 239.00 35.04
Grade 8 Male 156.00 263.00 225.00 25.56
Female 180.00 275.00 235.17 19.42
Table 26
Middle School MS 3 Math Scores After PSM Calculations (N=238)
Gender Minimum Maximum Mean Std. Deviation
Grade 6 Male 166.00 300.00 226.32 33.64
Female 194.00 300.00 232.59 29.44
Grade 7 Male 129.00 300.00 227.68 42.82
Female 136.00 300.00 229.00 39.81
Grade 8 Male 129.00 300.00 230.21 49.13
Female 129.00 300.00 250.87 44.52
Table 27
Middle School MS 3 ELA, Math and Attendance Statistics After PSM Calculations
Number Minimum Maximum Mean Std. Deviation
ELA Scores 2014 238 153.00 300.00 226.07 28.12
Math Scores 2014 238 129.00 300.00 235.27 41.72
Attendance 2014 238 76.00 180.00 169.71 10.08

108
Statistical Analysis and Results
The following section reports and briefly discusses the analysis and results of
the research questions in order to address each research question and provide empirical
evidence to support the conclusions. The ten research questions addressed were derived
from the two overarching research questions that guided this study. The two overarching
research questions in this explanatory, non-experimental quantitative study were the
following:
I. What is the influence of extended school day (ESD) on the academic
achievement of middle school students in Grades 6-8 on the 2014 New Jersey
Assessment of Skills and Knowledge (NJ ASK) in English Language Arts (ELA) and
Mathematics (Math), when controlling for prior academic achievement before entering
middle school?
II. What influence does the interaction of extended school day (ESD) and student
fixed factor demographic variables have on the academic achievement of middle school
students in Grades 6-8 on the 2014 New Jersey Assessment of Skills and Knowledge (NJ
ASK) in English Language Arts (ELA) and Mathematics (Math), when controlling for
prior academic achievement before entering middle school?
Research Question 1: Analysis and Results
Research Question 1: What is the influence of extended school day (ESD) on
the academic achievement of middle school students in Grades 6-8 on the 2014 New
Jersey Assessment of Skills and Knowledge (NJ ASK) in English Language Arts (ELA)
when controlling for prior academic achievement before entering middle school?

109
Null Hypothesis 1: Extended school day (ESD) has no influence on the academic
achievement of middle school students in Grades 6-8 on the 2014 New Jersey
Assessment of Skills and Knowledge (NJ ASK) in English Language Arts (ELA) when
controlling for prior academic achievement.
In order to answer the first research question, an analysis of covariance
(ANCOVA) was run to assess the influence of extended school day (ESD) on the
achievement of students in Grades 6-8 on the 2014 New Jersey Assessment of Skills and
Knowledge (NJ ASK) in English Language Arts (ELA), using the Grade 5 NJ ASK
English Language Arts (ELA) scores as a covariate to control for prior achievement. The
analysis sought to identify if statistically significant differences were present among
students (n = 714) on the 2014 NJ ASK ELA scores based on the school to which they
were assigned. The 2014 ELA mean score for MS 1 was 226.29 with a standard deviation
of 28.56 (n = 238), MS 2 was 229.23 with a standard deviation of 26.49 (n = 238), and
MS 3 (the extended day school) was 226.07 with a standard deviation of 28.12 (n = 238).
Levene’s test of equality of error variances was not significant p >.469, consequently,
the assumption for equality of variance was met for an ANCOVA.
Table 28 Descriptive Statistics on 2014 ELA Mean Scores
School Mean Std. Deviation Number
MS 1 226.29 28.56 238
MS 2 229.23 26.49 238
MS 3 226.07 28.12 238
Total 227.20 27.74 714

110
In the ANCOVA the dependent variable was student performance on 2014 NJ
ASK ELA scores. School was the main effect or independent variable, and the Grade 5
ELA mean score served as the covariate. The interaction between the main effect,
school, and the covariate, Grade 5 ELA scores, was estimated and checked and no
significant interaction was found (p > .737), meeting the assumption for ANCOVA.
The ANCOVA (Table 29) revealed the influence of the covariate prior academic
achievement (Grade 5 ELA mean scores) was found to have a statistically significant
impact on the dependent variable, ELA 2014 achievement, as measured by the NJ ASK
(F (1,710) = 1218.70, p < .001). The partial Eta squared (the index for the effect size of
each independent variable and the interaction) for Grade 5 ELA mean score was .632,
indicating that 63.2% in the variance of 2014 ELA mean scores can be attributed to prior
achievement. The observed power was 1.000. The ANCOVA further revealed that the
main effect, school, was not statistically significant (p >.739).
Table 29 Tests of Between-Subjects Effects on 2014 ELA (School and ELA Gd. 5)
Source Type III Sum of Squares df Mean Square F Sig.
Partial Eta Squared
Noncent. Parameter
Observed Powerb
Corrected Model 347144.988a 3 115714.996 407.970 .000 .633 1223.091 1.000
Intercept 22054.208 1 22054.208 77.755 .000 .099 77.755 1.000
ELA_GR5 345666.969 1 345666.969 1218.699 .000 .632 1218.699 1.000
School 171.897 2 85.948 .303 .739 .001 .606 .098
Error 201381.561 710 283.636
Total 37403820.00 714
Corrected Total 548526.549 713
a. R Squared = .650 (Adjusted R Squared = .649) b. Computed using alpha = .05

111
The null hypothesis is supported by the data analysis. Controlling for prior
academic achievement, the influence of extended school day on the academic
achievement of middle school students in Grades 6-8 on the 2014 New Jersey
Assessment of Skills and Knowledge (NJ ASK) in English Language Arts (ELA) was not
statistically significant.
Research Question 2: Analysis and Results
Research Question 2: What is the influence of extended school day (ESD) on the
academic achievement of middle school students in Grades 6-8 on the 2014 New Jersey
Assessment of Skills and Knowledge (NJ ASK) in Mathematics when controlling for
prior academic achievement before entering middle school?
Null Hypothesis 2: Extended school day (ESD) has no influence on the academic
achievement of middle school students in Grades 6-8 on the 2014 New Jersey
Assessment of Skills and Knowledge (NJ ASK) in Mathematics when controlling for
prior academic achievement before entering middle school.
An analysis of covariance (ANCOVA) was run to assess the influence of
extended school day (ESD) on the achievement of students in Grades 6-8 on the 2014
New Jersey Assessment of Skills and Knowledge (NJ ASK) in Mathematics (Math) using
Grade 5 NJ ASK Math mean scores as a covariate to control for prior achievement. The
analysis sought to identify if statistically significant differences were present among
students (n = 714) on the 2014 NJ ASK Math scores based on the school to which they
were assigned. The 2014 Math mean score for MS 1 was 238.83 with a standard
deviation of 41.85 (n = 238), MS 2 was 241.25 with a standard deviation of 38.46 (n =
238), and MS 3 (the extended day school) was 235.27 with a standard deviation of 41.72

112
(n = 238). Levene’s test of equality of error variances was not significant (p >.684);
consequently, the assumption for equality of variance was met for an ANCOVA.
Table 30 Descriptive Statistics on 2014 Math Mean Scores
School Mean Std. Deviation Number
MS 1 238.83 41.85 238
MS 2 241.25 38.46 238
MS 3 235.27 41.72 238
Total 238.45 40.73 714
In the ANCOVA the dependent variable was student performance on the 2014 NJ
ASK Math. School was the main effect or independent variable and the Grade 5 Math
scores served as the covariate. The interaction between the main effect, school, and the
covariate, Grade 5 Math scores, was estimated and checked and no significant interaction
was found (p > .798), meeting the assumption for ANCOVA.
The ANCOVA (Table 31) revealed the influence of the covariate prior academic
achievement (Grade 5 Math mean scores) was found to have a statistically significant
impact on the dependent variable Math 2014 achievement, as measured by the NJ ASK
(F (1,710) = 1312.20, p < .001). The partial Eta squared (the index for the effect size of
each independent variable and the interaction) for Grade 5 Math scores was .649,
indicating that 64.9% of the variance in 2014 Math scores can be attributed to prior
achievement. The observed power was 1.000. The ANCOVA further revealed that the
main effect, school, was not statistically significant (p > .187).

113
Table 31
Test of Between-Subjects Effects on 2014 Math (School and Math Gd. 5)
Source
Type III Sum
of Squares df Mean Square F Sig.
Partial
Eta
Squared
Noncent.
Parameter
Observed
Powerb
Corrected
Model 768894.088a 3 256298.029 439.863 .000 .650 1319.588 1.000
Intercept 955.944 1 955.944 1.641 .201 .002 1.641 .249
Math_GR5 764588.606 1 764588.606 1312.199 .000 .649 1312.199 1.000
School 1957.217 2 978.608 1.680 .187 .005 3.359 .354
Error 413700.793 710 582.677
Total 41780305.000 714
Corrected
Total 1182594.881 713
a. R Squared = .650 (Adjusted R Squared = .649) b. Computed using alpha = .05
The null hypothesis is supported by the data analysis. Controlling for prior
academic achievement, the influence of extended school day on the academic
achievement of middle school students in Grades 6-8 on the 2014 New Jersey
Assessment of Skills and Knowledge (NJ ASK) in Mathematics was not statistically
significant.
Research Question 3: Analysis and Results
Research Question 3: What influence does the interaction of extended school day
(ESD) and gender have on the academic achievement of middle school students in
Grades 6-8 on the 2014 New Jersey Assessment of Skills and Knowledge (NJ ASK) in
English Language Arts (ELA) when controlling for prior academic achievement before
entering middle school?

114
Null Hypothesis 3: The interaction of extended school day (ESD) and gender has
no influence on the academic achievement of middle school students in Grades 6-8 on the
2014 New Jersey Assessment of Skills and Knowledge (NJ ASK) in English Language
Arts (ELA) when controlling for prior academic achievement before entering middle
school.
In order to answer this research question, a factorial analysis of covariance was
run to assess the influence of extended school day (ESD) and gender on the achievement
of students in Grades 6-8 on the 2014 New Jersey Assessment of Skills and Knowledge
(NJ ASK) in English Language Arts (ELA) using the Grade 5 NJ ASK English Language
Arts (ELA) mean scores as a covariate to control for prior achievement. The analysis
sought to identify if statistically significant differences were present among students (n =
714) on the 2014 NJ ASK ELA mean scores based on gender and the school to which
they were assigned. The test for interaction between the main effects was not significant.
All 714 students in the sample were equally distributed in the sample with 238
students in each middle school. The sample consisted of 460 males and 254 females.
The ELA mean score for MS 1 was 221.22 with a standard deviation of 27.67 (n = 147)
for males. Females had a mean score of 234.48 with a standard deviation of 28.22 (n =
91). The MS 2 ELA mean score for males was 227.47 with a standard deviation of 27.60
(n = 163). Females had a mean score of 233.04 with a standard deviation of 23.62 (n =
75). In MS 3 (the extended day school), the mean ELA score for males was 220.86, with
a standard deviation of 28.22 (n = 150). Female ELA mean score was 234.96 with a
standard deviation of 25.77 (n = 88). Levene’s test of equality of error variances was not

115
significant (p > .715); consequently, the assumption for equality of variance was met for
a factorial analysis of covariance.
Table 32 Descriptive Statistics on 2014 ELA Scores and Gender
School Gender Mean Std. Deviation Number MS 1 Male 221.22 27.67 147
Female 234.48 28.22 91
Total 226.29 28.56 238 MS 2 Male 227.47 27.60 163
Female 233.04 23.62 75 Total 229.23 26.49 238
MS 3 Male 220.86 28.22 150 Female 234.95 25.77 88 Total 226.07 28.12 238
Total Male 223.32 27.94 460 Female 234.22 25.99 254
Total 227.20 27.74 714
In this factorial ANCOVA, the dependent variable was student performance on
the 2014 NJ ASK ELA. School and gender were the two main effects, or independent
variables, and the Grade 5 ELA mean scores served as the covariate. The interaction
between each main effect, school and gender, and the covariate, Grade 5 ELA mean
scores, was estimated and checked and no significant interactions were found, meeting
the assumption for factorial ANCOVA.
The factorial analysis of covariance (Table 33) revealed the influence of the
covariate prior achievement (Grade 5 ELA) to have a statistically significant impact on
the dependent variable of ELA 2014 achievement, as measured by the NJ ASK (F (1,707)
= 1160.33, p < .001). The partial Eta squared (which is the index for the effect size of
each independent variable and the interaction) for Grade 5 ELA mean score was .621,
indicating that 62.1% of the variance in 2014 ELA mean scores can be attributed to prior

116
achievement. The observed power was 1.000. The main effect, gender, was revealed to
also have a statistically significant influence on the dependent variable, ELA 2014
achievement, as measured by the NJ ASK (F (1,707) = 6.48, p > .011). The partial Eta
squared (which is the index for the effect size of each independent variable and the
interaction) for gender was .009, indicating that 0.9% of the variance in 2014 ELA scores
can be attributed to gender. The observed power was .720.
The gender variable was further analyzed in a model where the covariate
appearing in this model was evaluated at the Grade 5 ELA mean score of 218.51. Within
this model the mean 2014 ELA score for males was 225.93, and the female mean score
was 229.32. The female to male mean difference was 3.39 with a standard deviation of
1.33 and p > .011. In this model, female students outperformed male students in 2014
ELA mean scores across all middle schools. The interaction between school and gender
was not found to have a statistically significant influence on ELA achievement (p > .210).
The factorial ANCOVA further revealed that the main effect, school, was not
statistically significant (p >.953).
Table 33 Tests of Between-Subjects Effects on 2014 ELA (School, Gender, ELA Gd. 5)
Source
Type III Sum
of Squares df Mean Square F Sig.
Partial
Eta
Squared
Noncent.
Parameter
Observed
Powerb
Corrected
Model 349924.553a 6 58320.759 207.615 .000 .638 1245.691 1.000
Intercept 23983.293 1 23983.293 85.378 .000 .108 85.378 1.000
ELA_GR5 325945.147 1 325945.147 1160.327 .000 .621 1160.327 1.000
School 27.092 2 13.546 .048 .953 .000 .096 .057
Gender 1821.160 1 1821.160 6.483 .011 .009 6.483 .720

117
School
*Gender 879.472 2 439.736 1.565 .210 .004 3.131 .333
Error 198601.966 707 280.908
Total 37403820.00 714
Corrected
Total 548526.549 713
a. R Squared = .638 (Adjusted R Squared = .635)
b. Computed using alpha = .05
The null hypothesis is supported by the data analysis. Controlling for prior
academic achievement, the influence of the interaction of extended school day and
gender on the academic achievement of middle school students in Grades 6-8 on the 2014
New Jersey Assessment of Skills and Knowledge (NJ ASK) in English Language Arts
was not statistically significant.
Research Question 4: Analysis and Results
Research Question 4: What influence does the interaction of extended school day
(ESD) and gender have on the academic achievement of middle school students in
Grades 6-8 on the 2014 New Jersey Assessment of Skills and Knowledge (NJ ASK) in
Mathematics (Math) when controlling for prior academic achievement before entering
middle school?
Null Hypothesis 4: The interaction of extended school day (ESD) and gender has
no influence on the academic achievement of middle school students in Grades 6-8 on the
2014 New Jersey Assessment of Skills and Knowledge (NJ ASK) in Mathematics (Math)
when controlling for prior academic achievement before entering middle school.

118
A factorial analysis of covariance (factorial ANCOVA) was run to assess the
influence of extended school day (ESD) and gender on the achievement of students in
Grades 6-8 on the 2014 New Jersey Assessment of Skills and Knowledge (NJ ASK) in
Mathematics (Math) using the Grade 5 NJ ASK Mathematics (Math) mean scores as a
covariate to control for prior achievement. The analysis sought to identify if statistically
significant differences were present among students (n = 714) on the 2014 NJ ASK Math
based on gender and school, the two main effects. Additionally, the primary purpose of
the analysis was to check the interaction between the two main effects (ESD and gender)
while controlling for prior achievement. However, a statistical significant interaction
between Grade 5 Math and gender (F (1,710) = 3.890, p < .049) was found so the
covariate, prior achievement, could not be included in the analysis. Consequently, a
simple two-way, or factorial, analysis of variance (factorial ANOVA) was used to answer
an alternate research question and hypothesis.
All 714 students in the sample were equally distributed in the sample with 238
students in each of the middle schools. The sample consisted of 460 males and 254
females. The 2014 NJ ASK Math mean score for MS 1 was 239.73, with a standard
deviation of 41.12 (n = 147) for males. Females had a mean score of 237.37 with a
standard deviation of 41.60 (n = 91). The MS 2 Math mean score on the 2014 NJ ASK
for males was 244.12 with a standard deviation of 38.74 (n = 163). Females had a mean
score of 235.03 with a standard deviation of 37.37 (n = 75). MS 3 (the extended day
school) had a mean Math score for males of 233.65 with a standard deviation of 43.18 (n
= 150) on the 2014 NJ ASK. The female Math mean score was 238.03 with a standard
deviation of 39.20 (n = 88). Levene’s test of equality of error variances was not

119
statistically significant (p > .260), meeting the assumption for equality of variance for a
factorial ANOVA.
Table 34 Descriptive Statistics on 2014 Math Mean Scores and Gender
School Gender Mean Std. Deviation Number
MS 1 Male 239.73 42.12 147
Female 237.37 41.60 91
Total 238.83 41.85 238
MS 2 Male 244.12 38.74 163
Female 235.03 37.37 75
Total 241.25 38.46 238
MS 3 Male 233.65 43.18 150
Female 238.03 39.20 88
Total 235.27 41.72 238
Total Male 239.30 41.45 460
Female 236.91 39.42 254
Total 238.45 40.73 714
In the factorial ANOVA (Table 35) the dependent variable was student
performance on 2014 NJ ASK Math. School and gender were the two main effects, or
independent variables. The analysis revealed neither of the main effects, school (p <
.616) or gender (p < .460), nor the interaction between school and gender (p < .233) to
have a statistically significant impact on the dependent variable, Math 2014 achievement,
as measured by the NJ ASK.

120
Table 35 Tests of Between-Subjects Effects on 2014 Math (School and Gender)
Source
Type III Sum of
Squares df
Mean
Square F Sig.
Partial Eta
Squared
Noncent.
Parameter
Observed
Powerb
Corrected
Model 9927.328a 5 1985.466 1.199 .308 .008 5.994 .429
Intercept 36878228.64 1 36878228.64
22265.2
92 .000 .969 2265.292 1.000
School 1606.570 2 803.285 .485 .616 .001 .970 .130
Gender 904.097 1 904.097 .546 .460 .001 .546 .114
School
*Gender 4841.657 2 2420.828 1.462 .233 .004 2.923 .313
Error 1172667.553 708 1656.310
Total 41780305.00 714
Corrected
Total 1182594.881 713
a. R Squared = .008 (Adjusted R Squared = .001)
b. Computed using alpha = .05
The original research question and null hypothesis sought to analyze 2014 Math
academic achievement on the NJ ASK controlling for prior achievement, using Grade 5
NJ ASK Math scores. As stated earlier, since a significant interaction between Grade 5
NJ ASK Math and gender (F (1,710) = 3.890, p < .049) was found; therefore, the
covariate, prior achievement, could not be included in this analysis. Consequently, a
simple two-way, or factorial, analysis of variance (factorial ANOVA) was used to answer
an alternate research question and hypothesis. The null hypothesis is supported by the
data analysis. The influence of the interaction of extended school day and gender on the
academic achievement of middle school students in Grades 6-8 on the 2014 NJ ASK in
Mathematics was not statistically significant.

121
Research Question 5: Analysis and Results
Research Question 5: What influence does the interaction of ESD and
socioeconomic status (SES) have on the academic achievement of middle school students
in Grades 6-8 on the 2014 New Jersey Assessment of Skills and Knowledge (NJ ASK) in
English Language Arts (ELA) when controlling for prior academic achievement before
entering middle school?
Null Hypothesis 5: The interaction of extended school day (ESD) and
socioeconomic status (SES) has no influence on the academic achievement of middle
school students in Grades 6-8 on the 2014 New Jersey Assessment of Skills and
Knowledge (NJ ASK) in English Language Arts (ELA) when controlling for prior
academic achievement before entering middle school.
To assess the influence of extended school day (ESD) and socioeconomic status
(SES) on the academic achievement of students in English Language Arts (ELA) in
Grades 6-8 while controlling for prior achievement, a factorial analysis of covariance
(factorial ANCOVA) was used. The analysis sought to identify if statistically significant
differences were present among students (n = 714) in the 2014 NJ ASK ELA scores
based on SES and school, the two main effects. The sample consisted of 238 students in
each of the study’s three middle schools. Six hundred and thirty-seven students did not
receive free or reduced meals, while 77 students did receive free or reduced meals. The
ELA mean score for MS 1 was 229.81 with a standard deviation of 27.79 (n = 211) for
students who did not receive free or reduced meals. Students who did receive free or
reduced meals had a mean score of 198.81 with a standard deviation of 27.46 (n = 27).
The MS 2 ELA mean score for students who did not receive free or reduced meals was

122
232.80 with a standard deviation of 24.01 (n = 218). Students who did receive free or
reduced meals had a mean score of 190.30 with a standard deviation of 20.59 (n = 20).
The MS 3 (the extended day school) mean ELA score for students who did not receive
free or reduced meals was 230.49 with a standard deviation of 25.52 (n = 208). For
students who did receive free or reduced meals, the ELA mean score was 195.47 with a
standard deviation of 26.55 (n = 30). Levene’s test of equality of error variances was not
significant (p > .617), meeting the assumption for equality of variance for an ANCOVA.
Table 36 Descriptive Statistics on 2014 ELA and SES
School Socioeconomic Status Mean Std. Deviation Number
MS 1 Does Not Receive Free or Reduced Meals 229.81 26.79 211
Receives Free or Reduced Meals 198.81 27.46 27
Total 226.29 28.56 238 MS 2 Does Not Receive Free or Reduced Meals 232.80 24.01 218
Receives Free or Reduced Meals 190.30 20.59 20 Total 229.23 26.49 238
MS 3 Does Not Receive Free or Reduced Meals 230.49 25.52 208 Receives Free or Reduced Meals 195.47 26.55 30 Total 226.07 28.12 238
Total Does Not Receive Free or Reduced Meals 231.05 25.44 637 Receives Free or Reduced Meals 195.30 25.38 77
Total 227.20 27.74 714
In the factorial ANCOVA the dependent variable was student performance on
2014 NJ ASK ELA. School and SES were the two main effects or independent variables
and the Grade 5 ELA mean scores served as the covariate. The interaction between each
main effect, school and SES, and the covariate, Grade 5 ELA mean scores, was estimated
and checked and no significant interactions were found meeting the assumption for
factorial ANCOVA.

123
The factorial analysis of covariance (Table 37) revealed that the main effect,
school, was not statistically significant (p >.336). However the second main effect, SES,
was significant (F (1,707) = 33.948, p < .001). The partial Eta squared (the index for the
effect size of each independent variable and the interaction) for SES was .046, indicating
that 4.6% of the variance in 2014 ELA scores can be attributed to SES. The observed
power was 1.000. The influence of prior academic achievement (Grade 5 ELA) was
found to have a statistically significant impact on the dependent variable of ELA 2014
achievement, as measured by the NJ ASK (F (1,707) = 987.101, p < .001). The partial
Eta squared (the index for the effect size of each independent variable and the interaction)
for Grade 5 ELA mean scores was .583, indicating that 58.3% of the variance in 2014
ELA scores can be attributed to prior achievement. The observed power was 1.000.
School was not statistically significant (p > .336). The interaction between school and
SES was not statistically significant in this model (p > .126).
The SES variable was further analyzed. The mean 2014 ELA score for students
who did not receive free or reduced meals was 228.50, while the mean score for students
who did receive free or reduced meals was 215.98. The SES covariate, which was
statistically significant, was evaluated in this model at the Grade 5 ELA mean score of
218.51. Students who did not receive free or reduced meals had a mean difference of
12.52 with a standard error of 2.15 and p < .001. In this model, students who did not
receive free or reduced meals outperformed students who did receive free or reduced
meals in 2014 ELA mean scores across all three middle schools.

124
Table 37
Tests of Between-Subjects Effects on 2014 ELA (School, SES, ELA Gr. 5)
Source Type III Sum of Squares df
Mean
Square F Sig.
Partial Eta Squared
Noncent. Parameter
Observed Powerb
Corrected Model 357047.021a 6 59507.837 219.721 .000 .651 1318.325 1.000
Intercept 26929.983 1 26929.983 99.434 .000 .123 99.434 1.000
ELA_Gr5 267340.322 1 267340.322 987.101 .000 .583 987.101 1.000
School 592.089 2 296.045 1.093 .336 .003 2.186 .242
SES 9194.173 1 9194.173 33.948 ..000 .046 33.948 1.000
School * SES 1124.109 2 562.054 2.075 .126 .006 4.151 .428
Error 191479.528 707 270.834
Total 37403820.000 714
Corrected Total 548526.549 713
a. R Squared = .651 (Adjusted R Squared = .648)
b. Computed using alpha = .05
The null hypothesis is supported by the data analysis. The interaction of extended
school day and socioeconomic status on the academic achievement of middle school
students in Grades 6-8 on the 2014 New Jersey Assessment of Skills and Knowledge (NJ
ASK) in English Language Arts (ELA) when controlling for prior academic achievement
was not statistically significant.
Research Question 6: Analysis and Results
Research Question 6: What influence does the interaction of ESD and
socioeconomic status (SES) have on the academic achievement of middle school students
in Grades 6-8 on the 2014 New Jersey Assessment of Skills and Knowledge (NJ ASK) in
Mathematics when controlling for prior academic achievement before entering middle
school?

125
Null Hypothesis 6: The interaction of extended school day (ESD) and
socioeconomic status (SES) has no influence on the academic achievement of middle
school students in Grades 6-8 on the 2014 New Jersey Assessment of Skills and
Knowledge (NJ ASK) in Mathematics when controlling for prior academic achievement
before entering middle school.
To assess the influence of extended school day (ESD) and socioeconomic status
(SES) on academic achievement of students in Grades 6-8 Math while controlling for
prior achievement, a factorial analysis of covariance was used. The analysis sought to
identify if statistically significant differences were present among students (n = 714) on
the 2014 NJ ASK Math mean scores based on SES and school, the two main effects. The
primary purpose of the analysis was to check interaction between the two main effects
(ESD and SES) while controlling for academic achievement prior to entering middle
school. However, a significant interaction between Grade 5 Math NJ ASK mean scores
and SES (F (1,710) = 6.997, p < .008) was found so the covariate, prior achievement,
could not be included in this analysis. Consequently, a simple two-way, or factorial,
analysis of variance (factorial ANOVA) was used to answer an alternate research
question and hypothesis.
The sample consisted of 238 students in each of the study’s three middle schools.
Overall, 637 students did not receive free or reduced meals while seventy-seven students
did receive free or reduced meals. The 2014 NJ ASK Math mean score for MS 1 was
243.66 with a standard deviation of 40.49 (n = 211) for students who did not receive free
or reduced meals. Students who did receive free or reduced meals had a mean score of
201.07 with a standard deviation of 32.39 (n = 27). The MS 2 Math mean score for

126
students who did not receive free or reduced meals was 245.81 with a standard deviation
of 35.64 (n = 218). Students who did receive free or reduced meals had a mean score of
191.60 with a standard deviation of 33.37 (n = 20). The extended-day school MS 3 mean
Math score for students who did not receive free or reduced meals was 241.29 with a
standard deviation of 38.67 (n = 208). Students who did receive free or reduced meals
Math mean score was 193.53 with a standard deviation of 38.66 (n = 30) on the NJ ASK
in 2014. Levene’s test of equality of error variances was statistically significant (p. >
.071).
Table 38 Descriptive Statistics on 2014 Math Mean Scores and Socioeconomic Status
School Socioeconomic Status Mean Std. Deviation Number
MS 1 Does Not Receive Free or Reduced Meals 243.66 40.49 211
Receives Free or Reduced Meals 201.07 32.39 27
Total 238.83 41.85 238
MS 2 Does Not Receive Free or Reduced Meals 245.81 35.64 218
Receives Free or Reduced Meals 191.60 33.37 20
Total 241.25 38.46 238
MS 3 Does Not Receive Free or Reduced Meals 241.29 38.67 208
Receives Free or Reduced Meals 193.53 38.66 30
Total 235.27 41.72 238
Total Does Not Receive Free or Reduced Meals 243.62 38.27 637
Receives Free or Reduced Meals 195.68 34.99 77
Total 238.45 40.73 714
In the factorial ANOVA the dependent variable was student performance on 2014
NJ ASK Math. School and socioeconomic status were the two main effects, or
independent variables. The factorial analysis of variance (Table 39) revealed the main
effect, school, was not statistically significant (p >.639). The second main effect, SES,

127
was statistically significant (F (1,708) = 107.708, p < .001). The partial Eta squared (the
index for the effect size of each independent variable and the interaction) for
socioeconomic status was .132, indicating that 13.2% of the variance in 2014 Math mean
scores can be attributed to socioeconomic status. The observed power was 1.000. The
interaction between school and socioeconomic status was not statistically significant in
this model (p > .616).
Table 39 Tests of Between-Subjects Effects on 2014 Math (School, SES)
Source
Type III
Sum of
Squares df Mean Square F Sig.
Partial Eta
Squared
Noncent.
Parameter
Observed
Powerb
Corrected
Model 161358.63a 5 32271.727 22.373 .000 .136 111.866 1.000
Intercept 12894834.6 1 12894834.6 8939.697 .000 .927 8939.697 1.000
School 1291.100 2 645.550 .448 .639 .001 .895 .123
SES 155360.106 1 155360.106 107.708 .000 .132 107.708 1.000
School * SES 1400.983 2 700.491 .486 .616 .001 .971 .130
Error 1021236.25 708 1442.424
Total 41780305.0 714
Corrected
Total 1182594.88 713
a. R Squared = 136 (Adjusted R Squared = .130) b. Computed using alpha = .05
The original research question and null hypothesis sought to analyze 2014 Math
academic achievement on the NJ ASK controlling for prior achievement, using Grade 5
NJ ASK Math scores. As stated earlier, a significant interaction between Grade 5 Math
and SES (F (1,710) = 6.997, p < .008) was found so the covariate, prior achievement,
could not be included in the analysis. Consequently, a simple two-way, or factorial,
analysis of variance (factorial ANOVA) was used to answer an alternate research
question and hypothesis. The null hypothesis is supported by the data analysis. The

128
influence of the interaction of extended school day and socioeconomic status on the
academic achievement of middle school students in Grades 6-8 on the 2014 New Jersey
Assessment of Skills and Knowledge (NJ ASK) in Mathematics was not statistically
significant.
Research Question 7: Analysis and Results
Research Question 7: What influence does the interaction of ESD and special
education classification (SPED) have on the academic achievement of middle school
students in Grades 6-8 on the 2014 New Jersey Assessment of Skills and Knowledge (NJ
ASK) in English Language Arts (ELA) when controlling for prior academic achievement
before entering middle school?
Null Hypothesis 7: The interaction of extended school day (ESD) and special
education classification (SPED) has no influence on the academic achievement of middle
school students in Grades 6-8 on the 2014 New Jersey Assessment of Skills and
Knowledge (NJ ASK) in English Language Arts (ELA) when controlling for prior
academic achievement before entering middle school.
In order to answer the this research question, a factorial analysis of covariance
was run to assess the influence of extended school day (ESD) and special education
classification (SPED) on the achievement of students in Grades 6-8 on the 2014 New
Jersey Assessment of Skills and Knowledge (NJ ASK) in English Language Arts (ELA),
using the Grade 5 NJ ASK English Language Arts (ELA) scores as a covariate to control
for prior achievement. The analysis sought to identify if statistically significant
differences were present among students (n = 714) on the 2014 NJ ASK ELA scores
based on SPED and the school to which they were assigned.

129
All 714 students were equally distributed in the sample with 238 students in each
of the study’s three middle schools. Five hundred and sixty-five students did not receive
special education services, while 149 students did receive special education services. The
ELA mean score for MS 1 was 234.20 with a standard deviation of 23.25 (n = 189) for
students who did not receive special education services. Students who did receive special
education services had a mean score of 195.78 with a standard deviation of 26.71 (n =
49). The MS 2 ELA mean score for students who did not receive special education
services was 236.39 with a standard deviation of 21.02 (n = 189). Students who did
receive special education services had a mean score of 201.61 with a standard deviation
of 27.45 (n = 49). The MS 3 (the extended day school) mean ELA score for students
who did not receive special education services was 232.45 with a standard deviation of
24.51 (n = 187). Students who did receive special education services had an ELA mean
score was 202.69 with a standard deviation of 28.35 (n = 51). Levene’s test of equality
of error variances was significant (p > .015).
Table 40 Descriptive Statistics on 2014 ELA and SPED
Special Education Services School Mean Std. Deviation Number
Does Not Receive SPED Services MS 1 234.20 23.25 189
MS 2 236.39 21.018 189
MS 3 232.45 24.52 187
Total 234.35 22.98 565
Receives SPED Services MS 1 195.78 26.71 49
MS 2 201.61 27.45 49
MS 3 202.69 28.35 51
Total 200.06 27.50 149
Total MS 1 226.29 28.56 238
MS 2 229.23 26.49 238

130
MS 3 226.07 28.12 238
Total 227.20 27.74 714
In the factorial ANCOVA the dependent variable was student performance on the
2014 NJ ASK ELA. School and SPED were the two main effects or independent
variables, and the Grade 5 ELA mean scores served as the covariate. The interaction
between each main effect, school and SPED, and the covariate, Grade 5 ELA mean
scores, was estimated and checked, finding no significant interactions and meeting the
assumption for factorial ANCOVA. The factorial analysis of covariance (Table 41)
revealed that the influence of the covariate prior academic achievement (Grade 5 ELA) to
have a statistically significant impact on the dependent variable of ELA 2014
achievement, as measured by the NJ ASK (F (1,707) = 819.059, p < .001). The partial
Eta squared (the index for the effect size of each independent variable and the interaction)
for Grade 5 ELA mean scores was .537, indicating that 53.7% of the 2014 ELA mean
scores can be attributed to prior achievement. The observed power was 1.000. The main
effect, SPED, was revealed to also have a statistically significant influence on the
dependent variable, ELA 2014 achievement, as measured by the NJ ASK (F (1,707) =
46.946, p < .001). The partial Eta squared (the index for the effect size of each
independent variable and the interaction) for SPED was .062, indicating that 6.2% of the
2014 ELA mean scores can be attributed to SPED. The observed power was 1.000. The
factorial ANCOVA further revealed that the main effect, school, was not statistically
significant (p >.837), nor was the interaction between school and special education
classification statistically significant in this model (p > .476).
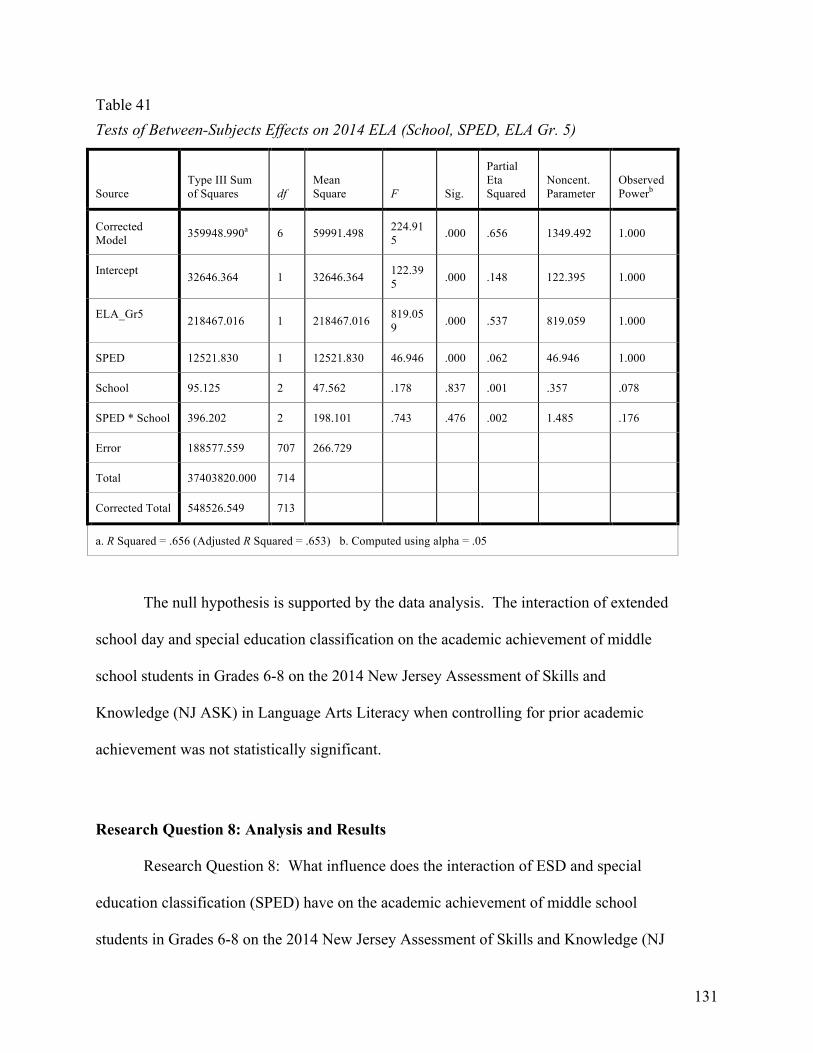
131
Table 41 Tests of Between-Subjects Effects on 2014 ELA (School, SPED, ELA Gr. 5)
Source Type III Sum of Squares df
Mean Square F Sig.
Partial Eta Squared
Noncent. Parameter
Observed Powerb
Corrected Model 359948.990a 6 59991.498 224.91
5 .000 .656 1349.492 1.000
Intercept 32646.364 1 32646.364 122.395 .000 .148 122.395 1.000
ELA_Gr5 218467.016 1 218467.016 819.059 .000 .537 819.059 1.000
SPED 12521.830 1 12521.830 46.946 .000 .062 46.946 1.000
School 95.125 2 47.562 .178 .837 .001 .357 .078
SPED * School 396.202 2 198.101 .743 .476 .002 1.485 .176
Error 188577.559 707 266.729
Total 37403820.000 714
Corrected Total 548526.549 713
a. R Squared = .656 (Adjusted R Squared = .653) b. Computed using alpha = .05
The null hypothesis is supported by the data analysis. The interaction of extended
school day and special education classification on the academic achievement of middle
school students in Grades 6-8 on the 2014 New Jersey Assessment of Skills and
Knowledge (NJ ASK) in Language Arts Literacy when controlling for prior academic
achievement was not statistically significant.
Research Question 8: Analysis and Results
Research Question 8: What influence does the interaction of ESD and special
education classification (SPED) have on the academic achievement of middle school
students in Grades 6-8 on the 2014 New Jersey Assessment of Skills and Knowledge (NJ

132
ASK) in Mathematics when controlling for prior academic achievement before entering
middle school?
Null Hypothesis 8: The interaction of extended school day (ESD) and special
education classification (SPED) has no influence on the academic achievement of middle
school students in Grades 6-8 on the 2014 New Jersey Assessment of Skills and
Knowledge (NJ ASK) in Mathematics when controlling for prior academic achievement
before entering middle school.
To assess the influence of extended school day (ESD) and special education
classification (SPED) on academic achievement of students in Mathematics (Math) in
Grades 6-8 on the 2014 New Jersey Assessment of Skills and Knowledge (NJ ASK) in
Mathematics (Math) using the Grade 5 NJ ASK Mathematics (Math) mean scores as a
covariate to control for prior achievement, a factorial analysis of covariance (factorial
ANCOVA) was used in this research question. The analysis sought to identify if
statistically significant differences were present among students (n = 714) on the 2014 NJ
ASK Math scores based on special education classification and the school to which they
were enrolled.
All 714 students in the sample were equally distributed in the sample with 238
students in each of the three middle schools in the study. Five hundred and sixty-five
students in the sample did not receive special education services, while 149 students did
receive special education services. The 2014 NJ ASK Math mean score in MS 1 was
248.24 with a standard deviation of 36.77 (n = 189) for students who did not receive
special education services. Students who did receive special education services had a
mean score of 202.53 with a standard deviation of 40.71 (n = 49). The MS 2 Math mean

133
score for students who did not receive special education services was 250.67 with a
standard deviation of 32.41 (n = 189). Students who did receive special education
services had a mean score of 204.94 with a standard deviation of 38.68 (n = 49) on the
2014 NJ ASK. The MS 3 (the extended day school) mean Math score for students who
did not receive special education services was 244.20 with a standard deviation of 36.68
(n = 187). For students who did receive special education services, the Math mean score
was 202.55 with a standard deviation of 43.09 (n = 51). Levene’s test of equality of error
variances was not statistically significant (p > .745), meeting the assumption for equality
of variance for a factorial analysis of covariance (factorial ANCOVA).
Table 42 Descriptive Statistics on 2014 Math and SPED
Special Education Services School Mean Std. Deviation Number Does Not Receive SPED Services MS 1 248.24 36.77 189
MS 2 250.67 32.41 189 MS 3 244.20 36.68 187 Total 247.72 35.38 565
Receives SPED Services MS 1 202.53 40.71 49 MS 2 204.94 38.68 49 MS 3 202.55 43.09 51 Total 203.33 40.64 149
Total MS 1 238.84 41.85 238 MS 2 241.25 38.46 238 MS 3 235.27 41.72 238 Total 238.45 40.73 714
In the factorial ANCOVA the dependent variable was student performance on the
2014 NJ ASK Math. School and SPED were the two main effects, or independent
variables, and the Grade 5 Math mean scores served as the covariate. The interaction
between each main effect, school and SPED, and the covariate, Grade 5 Math mean
scores, was estimated and checked, finding no significant interaction and meeting the

134
assumption for factorial ANCOVA. The factorial analysis of covariance (Table 43)
revealed the influence of the covariate prior academic achievement (Grade 5 Math) to
have a significant impact on the dependent variable of Math 2014 achievement, as
measured by the NJ ASK (F (1,707) = 972.619, p < .001). The partial Eta squared (the
index for the effect size of each independent variable and the interaction) for Grade 5
Math scores was .579, indicating that 57.9% of the 2014 Math scores can be attributed to
prior achievement. The observed power was 1.000. The main effect, SPED, was
statistically significant (F (1,707) = 26.942, p < .001). The partial Eta squared (the index
for the effect size of each independent variable and the interaction) for SPED was .037,
indicating that 3.7% of the 2014 Math scores can be attributed to SPED. The observed
power was .999. The interaction between school and SPED was not significant in this
model (p > .780). The factorial ANCOVA further revealed the main effect, school, was
not significant (p >.352).
Table 43 Tests of Between-Subjects Effects on 2014 Math (School, SPED, Math Gr. 5)
Source Type III Sum of Squares df
Mean Square F Sig.
Partial Eta Squared
Noncent. Parameter
Observed Powerb
Corrected Model 784353.322a 6 130725.554 232.078 .000 .663 1392.466 1.000
Intercept 4862.830 1 4862.830 8.633 .003 .012 8.633 .835 Math_GR5 547860.572 1 547860.572 972.619 .000 .579 972.619 1.000 SPED 15175.782 1 15175.782 26.942 .000 .037 26.942 .999 School 1178.421 2 589.210 1.046 .352 .003 2.092 .233 SPED * School 280.425 2 140.212 .249 .780 .001 .498 .089
Error 398241.559 707 563.284 Total 41780305.000 714 Corrected Total 1182594.881 713
a. R Squared = .663 (Adjusted R Squared = .660) b. Computed using alpha = .05
The null hypothesis is supported by the data analysis. The interaction of extended
school day and special education classification on the academic achievement of middle

135
school students in Grades 6-8 on the 2014 New Jersey Assessment of Skills and
Knowledge (NJ ASK) in Mathematics when controlling for prior academic achievement
was not statistically significant.
Research Question 9: Analysis and Results
Research Question 9: What influence does the interaction of extended school day
(ESD) and ethnicity have on the academic achievement of middle school students in
Grades 6-8 on the 2014 New Jersey Assessment of Skills and Knowledge (NJ ASK) in
English Language Arts (ELA) when controlling for prior academic achievement before
entering middle school?
Null Hypothesis 9: The interaction of extended school day (ESD) and ethnicity
has no influence on the academic achievement of middle school students in Grades 6-8
on the 2014 New Jersey Assessment of Skills and Knowledge (NJ ASK) in English
Language Arts (ELA) when controlling for prior academic achievement before entering
middle school.
To assess the influence of extended school day (ESD) and ethnicity on academic
achievement of students in Grades 6-8 on the 2014 New Jersey Assessment of Skills and
Knowledge (NJ ASK) in English Language Arts (ELA) using the Grade 5 NJ ASK
English Language Arts (ELA) mean scores as a covariate to control for prior
achievement, a factorial analysis of covariance (factorial ANCOVA) was used. The
analysis sought to identify if statistically significant differences were present among
students (n = 710) on the 2014 NJ ASK ELA based on school and ethnicity, the two main
effects.

136
Four students, classified as Other, were removed from this sample due to the
small number of students with the ethnic classification of Other. The newly created
sample of 710 consisted of 237 students in MS 1, two hundred and thirty-six (236)
students in MS 2, and 237 students in MS 3. Within the total sample of 710 students, 38
students were classified as Asian. Sixty-two students were classified under the Hispanic
ethnic classification. One hundred and fifty-seven students were classified with the
African-American ethnicity classification. White students, with 453 students, made up
the largest ethnic classification in the sample. Within MS 1, the Asian student mean
2014 ELA score was 233.71 with a standard deviation of 20.89 (n = 14). The Hispanic
student mean score was 214.23 with a standard deviation of 31.73 (n = 13). The African
American student mean score was 208.94 with a standard deviation of 26.78 (n = 49).
The White student mean score was 231.91 with a standard deviation of 27.24 (n = 161).
Within MS 2, the Asian student mean 2014 ELA score was 222.86 with a standard
deviation of 31.40 (n = 7). The Hispanic student mean score was 222.81 with a standard
deviation of 31.80 (n = 21). The African-American student mean score was 201.36 with
a standard deviation of 24.84 (n = 42). The White student mean score was 237.49 with a
standard deviation of 20.52 (n = 166). Finally, within the extended day school MS 3 the
Asian student mean 2014 ELA score was 238.35 with a standard deviation of 16.45 (n =
17). The Hispanic student mean score was 225.93 with a standard deviation of 28.22 (n =
28). The African-American student mean score was 201.53 with a standard deviation of
26.08 (n = 66). The White student mean score was 237.17 with a standard deviation of
21.74 (n = 126). Levene’s test of equality of error variances was significant (p > .040). ).

137
However, due to the large sample size and the fact that factorial ANOVA is a robust
statistic, this did not create concern when doing group comparisons (Field, 2011).
Table 44 Descriptive Statistics on 2014 ELA and Ethnicity
School Ethnicity Mean Std. Deviation Number MS 1 Asian 233.71 20.89 14
Hispanic 214.23 31.73 13 African-American 208.94 26.78 49 White 231.91 27.24 161 Total 226.30 28.62 237
MS 2 Asian 222.86 31.40 7 Hispanic 222.81 31.80 21 African-American 201.36 24.84 42 White 237.49 20.52 166 Total 229.32 26.58 236
MS 3 Asian 238.35 16.45 17 Hispanic 225.93 28.22 28 African-American 201.53 26.08 66 White 237.14 21.77 126 Total 225.99 28.15 237
Total Asian 233.79 21.50 38 Hispanic 222.42 30.04 62 African-American 203.80 26.05 157 White 235.41 23.54 453 Total 227.20 27.80 710
In the factorial ANCOVA, the dependent variable was student performance on the
2014 NJ ASK ELA. School and ethnicity were the two main effects, or independent
variables, and the Grade 5 ELA mean scores served as the covariate. The interaction
between the main effects, school and ethnicity, and the covariate, Grade 5 ELA mean
scores, was estimated and checked, finding no significant interaction (p >.188) and
meeting the assumption for factorial ANCOVA.
The factorial analysis of covariance (Table 45) revealed the influence of the
covariate prior academic achievement (Grade 5 ELA) to have a statistically significant

138
impact on the dependent variable of ELA 2014 achievement, as measured by the NJ ASK
(F (1,697) = 846.328, p < .001). The partial Eta squared (the index for the effect size of
each independent variable and the interaction) for Grade 5 ELA scores was .548,
indicating that 54.8% of the variance in 2014 ELA scores can be attributed to prior
achievement. The observed power was 1.000. The main effect, ethnicity, was revealed
to also have a significant influence on the dependent variable ELA 2014 achievement as
measured by the NJ ASK (F (3,697) = 11.184, p < .001). The partial Eta squared (the
index for the effect size of each independent variable and the interaction) for ethnicity
was .046 indicating that 4.6% of the variance in 2014 ELA scores can be attributed to
ethnicity. The observed power was .999. The factorial ANCOVA further revealed the
interaction between school and ethnicity was not a significant influence on ELA
achievement (p > .246) nor was the main effect, school, significant (p >.268).
Table 45 Tests of Between-Subjects Effects on ELA 2014 (School, Ethnicity, ELA Gd. 5)
Source Type III Sum of Squares df Mean Square F Sig.
Partial Eta Squared
Noncent. Parameter
Observed Powerb
Corrected Model 357853.478a 12 29821.123 109.313 .000 .653 1311.753 1.000
Intercept 28639.444 1 28639.444 104.981 .000 .131 104.981 1.000 ELA_Gr5 230882.903 1 230882.903 846.328 .000 .548 846.328 1.000 School 720.087 2 360.043 1.320 .268 .004 2.640 .286 Ethnicity 9153.190 3 3051.063 11.184 .000 .046 33.552 .999 School * Ethnicity 2160.614 6 360.102 1.320 .246 .011 7.920 .521
Error 190145.520 697 272.806 Total 37197631.000 710 Corrected Total 547998.999 709
a. R Squared = .653 (Adjusted R Squared = .647) b. Computed using alpha = .05
Since statistically significant differences were found on the one main effect,
ethnicity, a pairwise comparison to identify the significant mean differences was
performed based on the estimated marginal means. The adjusted ELA 2014 mean for

139
each ethnic grouping appear in Table 44 and the pairwise comparisons appear in Table
45.
Table 46 Adjusted Means on ELA 2104 based on Ethnicity
Ethnicity Mean Std. Error 95% Confidence Interval
Lower Bound Upper Bound Asian 224.757a 2.887 219.089 230.426 Hispanic 227.004a 2.214 222.658 231.350 African-American 219.836a 1.448 216.992 222.679 White 229.660a .807 228.075 231.245
a. Covariates appearing in the model are evaluated at the following values: ELA Scores Grade 5 = 218.5239.
Table 47 Pairwise Comparisons by Ethnicity on ELA 2014
(I) Ethnicity (J) Ethnicity
Mean Difference (I-J)
Std. Error Sig.b
95% Confidence Interval for Differenceb Lower Bound Upper Bound
Asian Hispanic -2.246 3.651 .539 -9.415 4.923 African-American 4.922 3.270 .133 -1.498 11.342
White -4.902 2.982 .101 -10.757 .952 Hispanic Asian 2.246 3.651 .539 -4.923 9.415
African-American 7.168* 2.602 .006 2.059 12.278
White -2.656 2.374 .264 -7.317 2.005 African-American
Asian -4.922 3.270 .133 -11.342 1.498 Hispanic -7.168* 2.602 .006 -12.278 -2.059 White -9.824* 1.723 .000 -13.208 -6.441
White Asian 4.902 2.982 .101 -.952 10.757 Hispanic 2.656 2.374 .264 -2.005 7.317 African-American 9.824* 1.723 .000 6.441 13.208
Based on estimated marginal means * The mean difference is significant at the .05 level. b. Adjustment for multiple comparisons: Least Significant Difference (equivalent to no adjustments).
The ethnicity variable was further analyzed in a model where the covariates were
evaluated at the Grade 5 ELA mean score of 218.52. Within this model the mean 2014
ELA score for Asian students was 224.78, for Hispanic students it was 227.00, for

140
African American students it was 219.84, and for White students it was 229.66. The
pairwise comparison of ethnicity with ELA 2014 achievement as the dependent variable
revealed statistically significant mean differences between ethnic groups. The Hispanic to
African American mean difference was 7.17 with a standard error of 2.60 and p > .006.
The White to African American mean difference was 9.82 with a standard error of 1.72
and p > .000. In this model, Hispanic and White students outperformed African
American students in the 2014 NJ ASK ELA.
The null hypothesis is supported by the data analysis. The interaction of extended
school day and ethnicity on the academic achievement of middle school students in
Grades 6-8 on the 2014 New Jersey Assessment of Skills and Knowledge (NJ ASK) in
English Language Arts (ELA) when controlling for prior academic achievement was not
statistically significant. However, the significant differences on the adjusted marginal
mean scores for ELA 2014 based on ethnicity are important to note and are discussed
more in depth in Chapter 5.
Research Question 10: Analysis and Results
Research Question 10: What influence does the interaction of extended school
day (ESD) and ethnicity have on the academic achievement of middle school students in
Grades 6-8 on the 2014 New Jersey Assessment of Skills and Knowledge (NJ ASK) in
Mathematics when controlling for prior academic achievement before entering middle
school?
Null Hypothesis 10: The interaction of extended school day (ESD) and ethnicity
has no influence on the academic achievement of middle school students in Grades 6-8

141
on the 2014 New Jersey Assessment of Skills and Knowledge (NJ ASK) in Mathematics
when controlling for prior academic achievement before entering middle school.
To assess the influence of extended school day (ESD) and ethnicity on academic
achievement of students in Grades 6-8 on the 2014 New Jersey Assessment of Skills and
Knowledge (NJ ASK) in Mathematics (Math) using Grade 5 NJ ASK Mathematics
(Math) mean scores as a covariate to control for prior achievement, a factorial analysis of
covariance was run. The analysis sought to identify if statistically significant differences
were present among students (n = 710) on the 2014 NJ ASK Math based on school and
ethnicity, the two main effects. Additionally, the primary purpose of the analysis was to
check the interaction between the two main effects while controlling for prior
achievement. However, a significant interaction between Grade 5 Math mean scores and
ethnicity (F (3,702) = 9.25, p < .001) was found so the covariate, prior achievement,
could not be included in the analysis. Consequently, a simple two-way or factorial
ANOVA was used to answer this research question.
As previously stated, four students classified as Other, were removed from this
sample due the small number of students with the ethnic classification of Other. The
newly created sample of 710 students consisted of 237 students in MS 1, two hundred
and thirty-six (236) students in MS 2, and 237 students in MS 3. Within the total sample
of 710 students, 38 students were classified as Asian. Sixty-two students were identified
under the Hispanic ethnic classification. One hundred and fifty-seven students were
classified with the African American ethnicity the classification code. White students,
with 453 students, made up the largest ethnic classification in this sample. Within MS 1,
the Asian students mean 2014 Math score was 264.79 with a standard deviation of 32.41

142
(n = 14). The Hispanic student mean score was 213.54 with a standard deviation of 38.51
(n = 13). The African-American student mean score was 214.08 with a standard
deviation of 35.64 (n = 49). The White student mean score was 246.22 with a standard
deviation of 40.77 (n = 161). Within MS 2, the Asian student 2014 Math mean score was
239.14 with a standard deviation of 36.83 (n = 7). The Hispanic student mean score was
227.38 with a standard deviation of 44.94 (n = 21). The African-American student mean
score was 199.76 with a standard deviation of 28.16 (n = 42). The White student mean
score was 253.49 with a standard deviation of 31.89 (n = 166). Finally, within the
extended day school MS 3, the Asian student mean 2014 Math score was 267.35 with a
standard deviation of 31.26 (n = 17). The Hispanic student mean score was 231.68 with a
standard deviation of 34.05 (n = 28). The African-American student mean score was
196.59 with a standard deviation of 35.58 (n = 66). The White student mean score was
251.98 with a standard deviation of 32.44 (n = 126). Levene’s test of equality of error
variances was significant (p > .010). However, due to the large sample size and the fact
that factorial ANOVA is a robust statistic this did not create concern when doing initial
group comparisons (Field, 2011).
Table 48 Descriptive Statistics 2014 Math and Ethnicity
School Ethnicity Mean Std. Deviation Number MS 1 Asian 264.79 32.41 14
Hispanic 213.54 38.51 13 African-American 214.08 35.64 49 White 246.22 40.77 161 Total 238.88 41.93 237
MS 2 Asian 239.14 36.83 7 Hispanic 227.38 44.94 21 African-American 199.76 28.160 42 White 253.49 31.90 166 Total 241.18 38.60 236
MS 3 Asian 267.35 31.26 17

143
Hispanic 231.68 34.05 28 African-American 196.59 35.58 66 White 251.98 32.44 126 Total 235.26 41.81 237
Total Asian 261.21 33.56 38 Hispanic 226.42 38.93 62 African-American 202.91 34.43 157 White 250.49 35.51 453 Total 238.44 40.83 710
In the factorial analysis of variance (Table 49), the dependent variable was student
performance on the 2014 NJ ASK Math. School and ethnicity were the two main effects
or independent variables. The factorial analysis of variance revealed that the main effect,
school, was not statistically significant (p >.398). However the second main effect,
ethnicity, was statistically significant (F (3,698) = 73.38, p < .001). The partial Eta
squared (the index for the effect size of each independent variable and the interaction) for
ethnicity was .240, indicating that 24% of the variance in 2014 Math scores can be
attributed to ethnicity. The observed power was 1.000. The interaction between school
and ethnicity was also statistically significant in this model (F (6,698) = 2.754, p > .012).
The partial Eta squared (the index for the effect size of each independent variable and the
interaction) for the interaction of school and ethnicity was .023, indicating that 2.3% of
the variance in 2014 Math scores can be attributed to the interaction of school and
ethnicity. The observed power was .878.
Table 49
Tests of Between-Subjects Effects 2014 Math (School, Ethnicity)
Source Type III Sum of Squares df Mean Square F Sig.
Partial Eta Squared
Noncent. Parameter
Observed Powerb
Corrected Model 313822.727a 11 28529.339 22.942 .000 .266 252.367 1.000
Intercept 15351183.244 1 15351183.244 12344.956 .000 .946 12345.0 1.000 School 2293.361 2 1146.680 .922 .398 .003 1.844 .210 Ethnicity 273763.407 3 91254.469 73.384 .000 .240 220.152 1.000

144
School * Ethnicity 20545.301 6 3424.217 2.754 .012 .023 16.522 .878
Error 867976.047 698 1243.519 Total 41547211.000 710 Corrected Total 1181798.773 709
a. R Squared = .266 (Adjusted R Squared = .254) b. Computed using alpha = .05
Since statistically significant differences were found on the one main effect,
ethnicity, a pairwise comparison to identify the significant mean differences was
performed based on the estimated marginal means. The Math 2014 means for each
ethnicity grouping appears in Table 50, and the pairwise comparisons appear in Table 51.
Table 50
Adjusted Means on Math 2104 based on Ethnicity
Ethnicity Mean Std. Error 95% Confidence Interval
Lower Bound Upper Bound Asian 257.094 6.143 245.033 269.155 Hispanic 224.199 4.706 214.961 233.438 African-American 203.478 2.864 197.855 209.101 White 250.567 1.669 247.289 253.845
Table 51 Pairwise Comparisons by Ethnicity on Math 2014
(I) Ethnicity (J) Ethnicity
Mean Difference (I-J) Std. Error
95% Confidence Interval for Differenceb
Sig.b Lower Bound Upper Bound
Asian Hispanic 32.895* 7.738 .000 17.702 48.087 African-American 53.616* 6.778 .000 40.308 66.923
White 6.527 6.366 .306 -5.972 19.025 Hispanic Asian -32.895* 7.738 .000 -48.087 -17.702
African-American 20.721* 5.509 .000 9.906 31.537
White -26.368* 4.993 .000 -36.171 -16.565 African-American
Asian -53.616* 6.778 .000 -66.923 -40.308 Hispanic -20.721* 5.509 .000 -31.537 -9.906 White -47.089* 3.315 .000 -53.598 -40.580
White Asian -6.527 6.366 .306 -19.025 5.972 Hispanic 26.368* 4.993 .000 16.565 36.171 African-American 47.089* 3.315 .000 40.580 53.598
Based on estimated marginal means *. The mean difference is significant at the .05 level. b. Adjustment for multiple comparisons: Least Significant Difference (equivalent to no adjustments).

145
As in the analysis of 2014 ELA achievement and ethnicity, the ethnicity variable
was also further analyzed. Within this model the mean 2014 Math score for Asian
students was 257.09, for Hispanic students it was 224.20, for African American students
it was 203.48, and for White students it was 250.57. The pairwise comparison of
ethnicity with Math 2014 achievement as the dependent variable revealed statistically
significant mean differences between ethnic groups. The Asian to Hispanic mean
difference was 32.90 with a standard error of 7.74 and p > .001. The Asian to African
American mean difference was 53.62 with a standard error of 6.78 and p > .001. The
Hispanic to African American mean difference was 20.72 with a standard error of 5.51
and p > .001. The White to Hispanic mean difference was 26.37 with a standard error of
4.99 and p > .001. The White to African American mean difference was 47.09 with a
standard error of 3.32 and p > .001. In this model there were statistically significant
differences in 2014 NJ ASK Math achievement among different ethnic groups.
Additionally, since the factorial ANOVA found a significant interaction between
school and ethnicity, further analysis was completed to identify the specific significant
differences in Math 2014 mean scores based on a combination of school assignment and
ethnic grouping. The adjusted Math 2014 means for each school assignment and ethnic
grouping appear in Table 52. Figure 2 displays the adjusted marginal means interaction
plot.

146
Table 52 Adjusted Means on 2014 NJASK Math based on School and Ethnicity
Number Mean
Std.
Deviation
Std.
Error
95%
Confidence
Interval for Mean
Minimum
Lower
Bound
Upper
Bound Maximum
MS 1 &
Asian 14 264.79 32.41 8.66 246.07 283.50 194.00 300.00
MS 1 &
Hispanic 13 213.53 38.51 10.68 190.27 236.81 156.00 276.00
MS 1 &
AA 49 214.08 35.64 5.09 203.85 224.32 146.00 300.00
MS 1 &
White 161 246.22 40.77 3.21 239.88 252.57 141.00 300.00
MS 2 &
Asian 7 239.14 36.84 13.92 205.08 273.21 184.00 291.00
MS 2 &
Hispanic 21 227.38 44.94 9.80 206.92 247.84 146.00 300.00
MS 2 &
AA 42 199.76 28.16 4.35 190.99 208.54 138.00 251.00
MS 2 &
White 166 253.50 31.89 2.48 248.61 258.38 141.00 300.00
MS 3 &
Asian 17 267.35 31.26 7.58 251.28 283.43 194.00 300.00
MS 3 &
Hispanic 28 231.68 34.05 6.44 218.47 244.88 170.00 300.00
MS 3 &
AA 66 196.59 35.58 4.38 187.84 205.34 129.00 270.00
MS 3 &
White 126 251.98 32.44 2.89 246.26 257.70 165.00 300.00
Total 710 238.44 40.83 1.53 235.43 241.45 129.00 300.00

147
Figure 2. Adjusted Marginal Means Interaction Plot for School and Ethnicity on NJASK
2014 Math
To check statistically significant differences between groups due to the significant
interaction between the two main effects, school and ethnicity, a separate interaction
variable was computed as required in order to facilitate the analysis (i.e., 1 = MS 1 and
Asian, 2 = MS 1 and Hispanic, etc.). An ANOVA on student performance on the NJASK
was then computed where the new school/ethnicity variable served as the main effect.
The one-way ANOVA revealed statistically significant differences between groups
(F (11, 698) = 22.943, p < .001). The test of homogeneity of variances was statistically
significant (p > .011); consequently, in order to reduce the possibility of Type 1 error, the
Games-Howell post hoc test was used to account for unequal variances across groups
(see Table 53).

148
Within MS 1, the multiple comparison analyses identified the following
statistically significant Math mean differences. Asian students had statistically
significant higher Math mean scores compared to Hispanic students (mean difference =
51.25, p > .039) and to African American students (mean difference = 50.70, p > .002).
Asian students had statistically significant higher Math mean scores compared to African
Americans in both MS 2 (mean difference = 65.02, p < .001) and MS 3 (mean difference
= 68.19, p < .001). There was a statistically significant difference in Math mean scores
within MS 1 where Hispanic students had a mean difference of (-53.81), p > .017
compared to Asian students in MS 3. The MS 1 African American students had
statistically significant lower Math mean scores than the MS 1 White students (mean
difference = (-32.14), p < .001, MS 2 White students (mean difference = (-39.41), p <
.001, MS 3 Asian students (mean difference = (-53.27), p < .001, and MS 3 White
students (mean difference = (-37.90), p < .001. White students in MS 1 had a statistically
significant difference in achievement compared to MS 2 African American students
(mean difference = 46.46, p < .001) and MS 3 African American students (mean
difference = 49.63, p < .001).
The MS 2 multiple comparison analyses identified the following statistically
significant Math mean differences in student achievement. African American students
had statistically significant different Math scores compared with MS 2 White students
(mean difference = (-53.73), p < .001. Compared with MS 3 Asian students (mean
difference = (-67.59), p < .001), Hispanic students (mean difference = (-31.92), p > .007),
and White MS 3 students (mean difference = (-52.22), p < .001), the statistically
significant difference in Math achievement continued. White students in MS 2 also had a

149
statistically significant difference compared to MS 3 African American students (mean
difference = 56.90, p < .001) in Math achievement.
Finally, within MS 3, the multiple comparison analyses identified the following
statistically significant Math mean differences. Asian students had statistically
significant Math mean scores compared to MS 3 Hispanic students (mean difference =
35.67, p < .039 and MS 3 African American students (mean difference = 70.76, p < .001).
Hispanic MS 3 students had a mean difference of 35.09, p < .002 compared to MS 3
African American students. African American students in MS 3 had a mean difference of
(-55.29), p < .001 when compared to the Math achievement of MS 3 White students.
Table 53 Statistically Significant Differences in 2014 Math Achievement Multiple Comparisons (Games-Howell) School & Ethnicity Interaction
School & Ethnicity Interaction
Mean Difference
Std. Error
Significance
MS 1 & Asian (N = 14)
MS 1 & Hispanic (N = 13)
51.25 13.75 .039
MS 1 & African-American (N = 49)
50.70 10.05 .002
MS 2 & African-American (N = 42)
65.02 9.69 .000
MS 3 & African-American (N = 66)
68.19 9.71 .000
MS 1 & Hispanic (N = 13)
MS 3 & Asian (N = 17) -53.81 13.10 .017
MS 1 & African American (N = 49)
MS 1 & White (N = 161)
-32.14 6.02 .000
MS2&White(N=166) -39.41 5.66 .000MS3&Asian(N=17) -53.27 9.13 .000MS3&White(N=126)
-37.90 5.85 .000
MS1&White(N=161)
MS2&African-American(N=42)
46.46 5.40 .000
MS3&African-American(N=66)
49.63 5.43 .000
MS2&AfricanAmerican(N=42)
MS2&White(N=166) -53.73 5.00 .000MS3&Asian(N=17) -67.59 8.74 .000MS3&Hispanic(N=28) -31.92 7.77 .007

150
MS3&White(N=126)
-52.22 5.22 .000
MS2&White(N=166) MS3&African-American(N=66)
56.90 5.03 .000
MS3&Asian(N=17) MS3&Hispanic(N =28)
35.67 9.95 .039
MS3&African-American(N=66)
70.76 8.76 .000
MS3&Hispanic(N=28) MS3&African-American(N=66)
35.09 7.78 .002
MS3&African-American(N=66)
MS3&White(N=126)
-55.39 5.25 .000
*Themeandifferenceissignificantatthe0.05level.
The null hypothesis is not supported by the data analysis and is therefore rejected.
The interaction of extended school day and ethnicity on the academic achievement of
middle school students in Grades 6-8 on the 2014 New Jersey Assessment of Skills
and Knowledge (NJ ASK) in Mathematics was statistically significant (see the above
profile plot). However, the significant differences on the adjusted marginal mean scores
for Math 2014 based on ethnicity are important to note and are discussed further in
Chapter 5.
Summary
Two overarching research questions were addressed in this study to investigate
the influence of an extended school day, reported in instructional minutes, on academic
achievement of general and special education middle school students. Student
performance on the 2014 New Jersey Assessment of Skills and Knowledge (NJ ASK)
was used as a proxy for academic achievement, and Grade 5 NJ ASK scores were used to
control for prior academic achievement before entering middle school. Table 54 provides
a summary of each null hypothesis. A more in depth discussion takes place in Chapter 5.
The first overarching research question sought to assess the influence of an
extended school day (ESD) on the academic achievement of middle school students in

151
Grades 6-8 on the 2014 New Jersey Assessment of Skills and Knowledge (NJ ASK) in
English Language Arts (ELA) and Mathematics when controlling for prior academic
achievement. Subsidiary Research Questions 1 and 2 utilized SPSS analyses to address
this overarching question. The null hypotheses were retained for both research questions.
The influence of ESD was found to not be statistically significant on academic
achievement of students in Grades 6-8 in Language Arts Literacy or Mathematics.
The second overarching research question sought to assess the influence of the
interaction of extended school day (ESD) and student fixed factor demographic variables
on the academic achievement of middle school students in Grades 6-8 on the 2014 New
Jersey Assessment of Skills and Knowledge (NJ ASK) in English Language Arts and
Mathematics controlling for prior academic achievement before entering middle school.
SPSS analyses were utilized with Research Questions 3 through 10 to address the second
overarching question. The null hypotheses were retained for Research Questions 3
through 9 but not for Research Question 10. The influence of the interaction of extended
school day and ethnicity on the academic achievement of middle school students in
Grades 6-8 on the 2014 New Jersey Assessment of Skills and Knowledge (NJ ASK) in
Mathematics was statistically significant. The significant differences in the adjusted
marginal mean scores based on ethnicity are important to note and are discussed in
Chapter 5.

152
Table 54 SummaryofResearchQuestionFindingsResearch Questions Retain Null
Hypothesis Reject Null Hypothesis
1) ESD has no influence on the academic achievement of middle school
students in Grades 6-8 on the 2014 New Jersey Assessment of Skills and
Knowledge (NJ ASK) in English Language Arts (ELA) when controlling
for prior academic achievement before entering middle school.
X
2) EDS has no influence on the academic achievement of middle school
students in Grades 6-8 on the 2014 New Jersey Assessment of Skills and
Knowledge (NJ ASK) in Mathematics when controlling for prior academic
achievement before entering middle school.
X
3) The interaction of ESD and gender has no influence on the academic
achievement of middle school students in Grades 6-8 on the 2014 New
Jersey Assessment of Skills and Knowledge (NJ ASK) in English
Language Arts (ELA) when controlling for prior academic achievement
before entering middle school.
X
4) The interaction of ESD and gender has no influence on the academic
achievement of middle school students in Grades 6-8 on the 2014 New
Jersey Assessment of Skills and Knowledge (NJ ASK) in Mathematics
when controlling for prior academic achievement before entering middle
school. *
(* - did not meet the assumption for factorial ANCOVA so a factorial
ANOVA was used instead).
X
5) The interaction of ESD and socioeconomic status (SES) has no influence
on the academic achievement of middle school students in Grades 6-8 on
the 2014 New Jersey Assessment of Skills and Knowledge (NJ ASK) in
English Language Arts (ELA) when controlling for prior academic
achievement before entering middle school.
X

153
6) The interaction of ESD and socioeconomic status (SES) has no influence
on the academic achievement of middle school students in Grades 6-8 on
the 2014 New Jersey Assessment of Skills and Knowledge (NJ ASK) in
Mathematics when controlling for prior academic achievement before
entering middle school.*
(* - did not meet the assumption for factorial ANCOVA so a factorial
ANOVA was used instead).
X
7) The interaction of ESD and special education classification (SPED) has
no influence on the academic achievement of middle school students in
Grades 6-8 on the 2014 New Jersey Assessment of Skills and Knowledge
(NJ ASK) in English Language Arts (ELA) when controlling for prior
academic achievement before entering middle school.
X
8) The interaction of ESD and special education classification (SPED) has
no influence on the academic achievement of middle school students in
Grades 6-8 on the 2014 New Jersey Assessment of Skills and Knowledge
(NJ ASK) in Mathematics when controlling for prior academic
achievement before entering middle school.
X
9) The interaction of ESD and ethnicity has no influence on the academic
achievement of middle school students in Grades 6-8 on the 2014 New
Jersey Assessment of Skills and Knowledge (NJ ASK) in English
Language Arts (ELA) when controlling for prior academic achievement
before entering middle school.
X
10) The interaction of ESD and ethnicity has no influence on the academic
achievement of middle school students in Grades 6-8 on the 2014 New
Jersey Assessment of Skills and Knowledge (NJ ASK) in Mathematics
when controlling for prior academic achievement before entering middle
school.*
(* - did not meet the assumption for Factorial ANCOVA so a Factorial
ANOVA was used instead).
X
154
CHAPTER V
CONCLUSIONS AND RECOMMENDATIONS
Introduction
Extended learning time advocates have suggested more time for all students,
while others education reformers have directed additional time for students who are
scoring below proficiency or enter school with disadvantages (Brown et al., 2005).
Opponents argue increasing time in school does not guarantee effective instruction and
the increased costs are prohibitive. Across the nation, in response to federal financial
inducements, many low-performing schools have increased learning time (McMurrer,
Frizzell, Yoshioka, Scott, & Ostler, 2015). In other American communities the average
six-hour school day and 180-day school year remain the norm. The necessity of
committing the needed quantity of time to understand new content, practice, and refine
skills, and later to apply learned content while connecting and transferring it to other
areas, is not questioned. Providing the essential amount of time for students in schools
has been debated for more than 30 years. However, questions still remain on the
effectiveness of extended learning time as a tool to increase academic achievement for all
students.
There have been calls from the White House to local Boards of Education for
releasing students and educators from the “prison of time” and providing increased
instructional time to meet the increasing demands of education in the 21st century.
However, the research has not been consistent or conclusive on the benefits of extending
school days for all students. My study found that extending the school day and increasing
instructional minutes for all middle school students in Grades 6-8 within one middle

155
school to achieve increased academic achievement, using standardized test scores as a
measure of achievement, could not be supported.
Purpose of the Study
The purpose for this research study was to investigate the influence of an
extended school day, reported in instructional minutes, on academic achievement of
middle school students, controlling for prior achievement before entering middle school.
Performance on the 2014 New Jersey Assessment of Skills and Knowledge for English
(NJ ASK) Language Arts (ELA) and Mathematics in Grades 6-8 was used to measure the
academic achievement of students who attended three middle schools in an upper
socioeconomic public school district located in suburban New Jersey. In addition, the
influence of the interaction of an extended school day and student fixed factor
demographic variables on academic achievement of middle school students, controlling
for prior achievement, was also examined.
Organization of the Chapter
In this chapter, the two overarching research questions and ten subsidiary research
questions examined are listed and the results discussed. The analyses of the results are
compared to previous research on the topic. From the findings, conclusions are drawn
and recommendations are made for current policy and practice. In addition,
recommendations are made for future research.
Research Questions and Findings
This study on the investigation of the influence of an extended school day,
reported in instructional minutes, on academic achievement of general and special
education middle school students was guided by two overarching research questions.
Student performance on the 2014 New Jersey Assessment of Skills and Knowledge (NJ

156
ASK) was used as a proxy for academic achievement. To control for prior academic
achievement, Grade 5 NJ ASK student scores were used.
The first overarching research question sought to assess the influence of an
extended school day (ESD) on the academic achievement of middle school students in
Grades 6-8 on the 2014 New Jersey Assessment of Skills and Knowledge (NJ ASK) in
English Language Arts (ELA) and Mathematics when controlling for prior academic
achievement before entering middle school. Subsidiary Research Questions 1 and 2
utilized SPSS analyses to address this overarching question.
Research Question 1: What is the influence of ESD on the academic achievement
of middle school students in Grades 6-8 on the 2014 New Jersey Assessment of Skills
and Knowledge (NJ ASK) in English Language Arts (ELA) when controlling for prior
academic achievement before entering middle school?
Null Hypothesis 1: Extended school day (ESD) has no influence on the academic
achievement of middle school students in Grades 6-8 on the 2014 New Jersey
Assessment of Skills and Knowledge (NJ ASK) in English Language Arts (ELA) when
controlling for prior academic achievement before entering middle school.
Research Question 2: What is the influence of extended school day (ESD) on the
academic achievement of middle school students in Grades 6-8 on the 2014 New Jersey
Assessment of Skills and Knowledge (NJ ASK) in Mathematics when controlling for
prior academic achievement before entering middle school?
Null Hypothesis 2: Extended school day (ESD) has no influence on the academic
achievement of middle school students in Grades 6-8 on the 2014 New Jersey

157
Assessment of Skills and Knowledge (NJ ASK) in Mathematics when controlling for
prior academic achievement before entering middle school.
Answer: In both Research Questions 1 and 2, the null hypotheses were retained
based on the analyses. Using analyses of covariance (ANCOVA), the influence of
extended school day, controlling for prior academic achievement, was found to not be
statistically significant on the academic achievement of middle school students in Grades
6-8 in English Language Arts (ELA) or Mathematics. However, in both research
questions, the analyses of covariance revealed the covariates, prior academic achievement
in Grade 5 English Language Arts and Mathematics, to have statistically significant
influences on the dependent variable 2014 NJ ASK scores. For English Language Arts,
the analysis revealed prior achievement (Grade 5 NJ ASK ELA mean scores) was
indicative of 63.2% of the variance in 2014 ELA mean scores. With regard to
Mathematics achievement, prior achievement (Grade 5 NJ ASK Math mean scores) was
revealed to contribute 64.9% of the variance in 2014 Math mean scores. The analysis
supports the findings of other researchers that also found prior grades and standardized
test scores were the strongest predictors of achievement (St. John, 2015; Phan, 2012;
Casillas, Robbins, Allen, Kuo, Hanson & Schmeiser, 2012; Engerman & Bailey, 2006).
The second overarching research question sought to assess the influence of the
interaction of extended school (ESD) and student fixed factor demographic variables on
the academic achievement of middle school students in Grades 6-8 on the 2014 New
Jersey Assessment of Skills and Knowledge (NJ ASK) in English Language Arts (ELA)
and Mathematics, controlling for prior academic achievement before entering middle
school. Subsidiary Research Questions 3 through 10 used individual SPSS analyses to

158
analyze the individual student fixed demographic variables and address this overarching
research question.
Research Question 3: What influence does the interaction of ESD and gender
have on the academic achievement of middle school students in Grades 6-8 on the 2014
New Jersey Assessment of Skills and Knowledge (NJ ASK) in English Language Arts
(ELA) when controlling for prior academic achievement before entering middle school?
Null Hypothesis 3: The interaction of ESD and gender has no influence on the
academic achievement of middle school students in Grades 6-8 on the 2014 New Jersey
Assessment of Skills and Knowledge (NJ ASK) in English Language Arts (ELA) when
controlling for prior academic achievement before entering middle school.
Research Question 4: What influence does the interaction of ESD and gender
have on the academic achievement of middle school students in Grades 6-8 on the 2014
New Jersey Assessment of Skills and Knowledge (NJ ASK) in Mathematics when
controlling for prior academic achievement before entering middle school?
Null Hypothesis 4: The interaction of ESD and gender has no influence on the
academic achievement of middle school students in Grades 6-8 on the 2014 New Jersey
Assessment of Skills and Knowledge (NJ ASK) in Mathematics when controlling for
prior academic achievement before entering middle school.
Answer: In both Research Questions 3 and 4, the null hypotheses were retained
based on the statistical analyses. The influence of the interaction of extended school day
and gender on the academic achievement of middle school students in Grades 6-8 on the
2014 New Jersey Assessment of Skills and Knowledge (NJ ASK) was not statistically
significant in either English Language Arts (ELA) or Mathematics.

159
The factorial analyses of covariance further revealed the influence of the covariate
prior achievement (Grade 5 ELA) to have a statistically significant impact on the
dependent variable of ELA 2014 achievement. It was revealed that 62.1% of the variance
in 2014 ELA mean scores was attributed to prior achievement. Gender was also found to
have a statistically significant influence on the dependent variable ELA 2014
achievement. The variance in 2014 ELA scores that could be attributed to gender was
estimated at 0.9%. Gender was further analyzed to show female students outperformed
male students in 2014 ELA mean scores across all middle schools. This finding with
regard to gender relates to previous studies by Meece, Glienke, and Burg (2006), who
found girls reported to have more confidence and interest in language arts and writing.
Kessels, Heyder, Latsch, and Hannover (2014) studied gender differences in academic
engagement related to students’ gender identity. They found gender differences in
educational outcomes exist. In some educational settings, boys lagged behind girls; and in
other areas girls lagged behind boys on indicators of educational success. However,
Periera (2011), in her study of student and school variables on student performance on
the New Jersey standardized assessment found with 8th grade students there was little
empirical evidence to support the stereotype that females outperform males in reading
and writing. As stated earlier, this research study identified a significant gender
difference in NJ ASK mean ELA scores.
In Research Question 4, the original research question and null hypothesis sought
to analyze 2014 Math academic achievement on the NJ ASK, controlling for prior
achievement using Grade 5 NJ ASK Math scores. However, a significant interaction
between Grade 5 NJ ASK Math scores and gender was found; therefore, the covariate,

160
prior achievement, could not be included in this analysis. Consequently, a simple two-
way or factorial analysis of variance (factorial ANOVA) was used to answer an alternate
research question and hypothesis. The null hypothesis is supported by the data analysis.
The influence of the interaction of extended school day and gender on the academic
achievement of middle school students in Grades 6-8 on the 2014 New Jersey
Assessment of Skills and Knowledge (NJ ASK) in Mathematics was not statistically
significant.
Research Question 5: What influence does the interaction of ESD and
socioeconomic status (SES) have on the academic achievement of middle school students
in Grades 6-8 on the 2014 New Jersey Assessment of Skills and Knowledge (NJ ASK) in
English Language Arts (ELA) when controlling for prior academic achievement before
entering middle school?
Null Hypothesis 5: The interaction of ESD and socioeconomic status (SES) has
no influence on the academic achievement of middle school students in Grades 6-8 on the
2014 New Jersey Assessment of Skills and Knowledge (NJ ASK) in English Language
Arts (ELA) when controlling for prior academic achievement before entering middle
school.
Research Question 6: What influence does the interaction of ESD and
socioeconomic status (SES) have on the academic achievement of middle school students
in Grades 6-8 on the 2014 New Jersey Assessment of Skills and Knowledge (NJ ASK) in
Mathematics when controlling for prior academic achievement before entering middle
school?

161
Null Hypothesis 6: The interaction of ESD and socioeconomic status (SES) has
no influence on the academic achievement of middle school students in Grades 6-8 on the
2014 New Jersey Assessment of Skills and Knowledge (NJ ASK) in Mathematics when
controlling for prior academic achievement before entering middle school.
Answer: The null hypotheses were again retained in Research Questions 5 and 6.
The influence of the interaction of extended school day and socioeconomic status on the
academic achievement of middle school students in Grades 6-8 on the 2014 New Jersey
Assessment of Skills and Knowledge (NJ ASK) was not statistically significant in either
English Language Arts (ELA) or Mathematics. However, in both research questions, the
analyses of covariance revealed the second main effect, SES, was significant.
Within ELA, the factorial analysis of covariance indicated that 4.6% of the
variance in NJ ASK 2014 ELA scores could be attributed to SES. Again, prior
achievement was found to be statistically significant in this model, indicating it
accounted for 58.3% of the variance in NJ ASK 2014 ELA. The SES variable was further
analyzed to find a mean difference of 12.52. In this model, students who did not receive
free or reduced meals outperformed students who did receive free or reduced meals in NJ
ASK 2014 ELA mean scores across all three middle schools.
SES continued to be statistically significant in the Math findings. The original
research question and null hypothesis sought to analyze 2014 Math academic
achievement on the NJ ASK, controlling for prior achievement using Grade 5 NJ ASK
Math scores. However, a significant interaction between Grade 5 Math and the student
fixed factor demographic variable SES was found. As a result, the covariate, prior
achievement, could not be included in the analysis. Consequently, as in Research

162
Question 4, a simple two-way or factorial analysis of variance (factorial ANOVA) was
used to answer an alternate research question and hypothesis. The analysis indicated
school or the interaction of school and SES were not significant. However, the analysis
did reveal that 13.2% of the variance in 2014 Math scores could be attributed to
socioeconomic status. The null hypothesis is supported by the data analysis. The
influence of the interaction of extended school day and socioeconomic status on the
academic achievement of middle school students in Grades 6-8 on the 2014 New Jersey
Assessment of Skills and Knowledge (NJ ASK) in Mathematics was not statistically
significant.
The findings in this study are similar to other research findings. Across all ethnic
groups, the strongest predictor of student achievement was identified as family
socioeconomic status (Coleman et al., 1966). Other researchers have investigated student
achievement and, similar to Coleman et al., found socioeconomic status to influence
student achievement (DeAngelis, 2014; Sammarone, 2014; Tienken, 2012; Ashby, 2010;
Allard, 2008; Sirin, 2003; Stull, 2013; Gabrieli, 2011). DeAngelis (2014) in her research
of New Jersey high school proficiency assessment scores cited researchers Michel
(2004), Periera (2011), and Graziano (2012) all of whom referenced the work of Coleman
et al. (1966). “Socioeconomic status explained a greater proportion of student test scores
than other measures of school resources" (p. 48). "Without a doubt, poverty has a
negative influence on student achievement, especially when achievement is measured by
state-mandated standardized tests" (Tienken, 2012a, p. 105).
Research Question 7: What influence does the interaction of ESD and special
education classification (SPED) have on the academic achievement of middle school

163
students in Grades 6-8 on the 2014 New Jersey Assessment of Skills and Knowledge (NJ
ASK) in English Language Arts (ELA) when controlling for prior academic achievement
before entering middle school?
Null Hypothesis 7: The interaction of ESD and special education classification
(SPED) has no influence on the academic achievement of middle school students in
Grades 6-8 on the 2014 New Jersey Assessment of Skills and Knowledge (NJ ASK) in
English Language Arts (ELA) when controlling for prior academic achievement before
entering middle school.
Research Question 8: What influence does the interaction of ESD and special
education classification (SPED) have on the academic achievement of middle school
students in Grades 6-8 on the 2014 New Jersey Assessment of Skills and Knowledge (NJ
ASK) in Mathematics when controlling for prior academic achievement before entering
middle school?
Null Hypothesis 8: The interaction of ESD and special education classification
(SPED) has no influence on the academic achievement of middle school students in
Grades 6-8 on the 2014 New Jersey Assessment of Skills and Knowledge (NJ ASK) in
Mathematics when controlling for prior academic achievement before entering middle
school.
Answer: Factorial ANCOVAs led to the retention of the null hypotheses in both
Research Questions 7 and 8. Controlling for prior academic achievement, the influence
of the interaction of extended school day and special education classification on the
academic achievement of middle school students in Grades 6-8 on the 2014 New Jersey
Assessment of Skills and Knowledge (NJ ASK) was not statistically significant in either

164
Language Arts Literacy or Mathematics. Again, the analyses revealed prior achievement
to have a statistically significant influence on 2014 NJ ASK scores. In ELA, Grade 5
mean scores accounted for 53.7% of the variance in 2104 ELA scores. The main effect,
SPED, was revealed to also have a statistically significant influence on the dependent
variable, 2014 ELA achievement, accounting for 6.2% of the variance in 2014 ELA mean
scores. Across all three middle schools, students who did not receive SPED services
scored higher than students who did receive SPED services. In ELA, the mean score was
234.35 compared to 200.06, accounting for a mean difference of more than 30 points.
For Math, the analyses revealed prior achievement to also have a statistically
significant influence on 2014 NJ ASK scores. Grade 5 Math scores attributed 57.9% to
the variance in 2014 Math scores. The main effect, SPED, was also statistically
significant. SPED attributed 3.7% to the variance in 2014 Math scores. As in ELA, the
analysis revealed students who did not receive SPED services scored higher than students
who did receive SPED services. In Math, the mean score was 247.72 compared to
203.33, accounting for a mean difference of more than 40 points.
The findings of other researchers on special education students and achievement
highlight concerns for stakeholders. Sammarone (2014) explicated the federal and state
emphasis to have all students meet proficiency using standardized test scores has moved
students with disabilities into the national discussion on high-stakes testing. "Schools
have been quick to raise concerns over these new mandates, given the historically poor
performances of special education students on these assessments” (Katsiyannis, Zhang,
Ryan, & Jones, 2007, p. 161). The exposure of high numbers of racial minority male
students from low-income backgrounds classified in one of the disability categories is

165
reported by Sullivan and Bal (2013), who cited Donovan and Cross’ (2002) description of
disproportionality as a “paradox of special education in that identification is meant to
allocate necessary and appropriate services and additional resources for students with
disabilities, but it may also lead to stigmatization, segregation, exposure to low
expectations, receipt of weak curriculum, and constraint of post school outcomes"
(p . 476). Extended learning time advocates have suggested the reform to support the
academic achievement of special education students (Pelko, 2014; Redd et al., 2012;
Patall et. al, 2010; Gabrieli, 2011; Jez & Wassmer, 2015). The findings of this research
study did not concur with extending learning time advocates on the relationship between
increased instructional time and the academic achievement of general and special
education students in an extended school day.
Research Questions 9 and 10 both sought to assess the influence of the interaction
of ESD and student fixed factor demographic variable ethnicity on the academic
achievement of middle school students in Grades 6-8 on the 2014 New Jersey
Assessment of Skills and Knowledge (NJ ASK) in English Language Arts (ELA) and
Mathematics, controlling for prior academic achievement before entering middle school.
Since the analyses identified different results, the research questions with their null
hypotheses are discussed separately.
Research Question 9: What influence does the interaction of extended school day
(ESD) and ethnicity have on the academic achievement of middle school students in
Grades 6-8 on the 2014 New Jersey Assessment of Skills and Knowledge (NJ ASK) in
English Language Arts (ELA) when controlling for prior academic achievement before
entering middle school?

166
Null Hypothesis 9: The interaction of ESD and ethnicity has no influence on the
academic achievement of middle school students in Grades 6-8 on the 2014 New Jersey
Assessment of Skills and Knowledge (NJ ASK) in English Language Arts (ELA) when
controlling for prior academic achievement before entering middle school.
Answer: Research Question 9 used factorial analysis of covariance to assess the
influence of the interaction of extended school day and ethnicity on the academic
achievement of middle school students in Grades 6-8 on the 2014 New Jersey
Assessment of Skills and Knowledge (NJ ASK) in English Language Arts (ELA),
controlling for prior academic achievement. The null hypothesis was retained since the
analysis revealed the influence of the interaction of extended school day and ethnicity on
the academic achievement of middle school students in Grades 6-8 on the 2014 New
Jersey Assessment of Skills and Knowledge (NJ ASK) in English Language Arts (ELA)
was not statistically significant. However, the analysis did highlight significant
differences in the adjusted marginal mean scores for English Language Arts (ELA) based
on ethnicity. Again, the influence of prior achievement was statistically significant on NJ
ASK 2014 ELA achievement. It was indicated that 54.8% of the variance in ELA scores
could be attributed to Grade 5 ELA scores. The main effect, ethnicity, was also revealed
to have a statistically significant influence on the dependent variable 2014 ELA
achievement. The analysis indicated that 4.6% of the variance in ELA scores could be
attributed to ethnicity.
Ethnicity was further analyzed in a pairwise comparison that revealed statistically
significant mean differences between ethnic groups. The Hispanic to African American
mean difference was 7.17, and the White to African American mean difference was 9.82.

167
In this model, Hispanic and White students outperformed African-American students in
the 2014 NJ ASK ELA. This finding with regard to ethnicity relates to previous research
findings related to the achievement gap in education between African American students
and their peers. This disparity is discussed after Research Question 10, which also
analyzed the ethnicity variable.
Research Question 10: What influence does the interaction of ESD and ethnicity
have on the academic achievement of middle school students in Grades 6-8 on the 2014
New Jersey Assessment of Skills and Knowledge (NJ ASK) in Mathematics when
controlling for prior academic achievement before entering middle school?
Null Hypothesis 10: The interaction of ESD and ethnicity has no influence on the
academic achievement of middle school students in Grades 6-8 on the 2014 New Jersey
Assessment of Skills and Knowledge (NJ ASK) in Mathematics when controlling for
prior academic achievement before entering middle school.
Answer: The original research question and null hypothesis sought to analyze the
influence of the interaction of ESD and ethnicity on 2014 Math academic achievement on
the NJ ASK, controlling for prior achievement using Grade 5 NJ ASK Math scores. A
significant interaction was again found between Grade 5 Math and a fixed factor
demographic variable. In this analysis the fixed factor demographic variable ethnicity
was found to have a significant interaction with prior achievement so the covariate, prior
achievement, could not be included in the analysis. Consequently, a simple two-way or
factorial analysis of variance (factorial ANOVA) was used to answer an alternate
research question and hypothesis. The null hypothesis was rejected with Research
Question 10 since it was not supported by the data analysis. The factorial ANOVA

168
revealed a statistical significance in the influence of the interaction of extended school
day and ethnicity on the academic achievement of middle school students in Grades 6-8
on the 2014 New Jersey Assessment of Skills and Knowledge (NJ ASK) in Mathematics.
Furthermore, the significant differences in the adjusted marginal mean scores based on
ethnicity are important to note.
As mentioned earlier, the influence of the interaction of extended school day and
ethnicity on the academic achievement of middle school students in Grades 6-8 on the
2014 New Jersey Assessment of Skills and Knowledge (NJ ASK) in Mathematics was
statistically significant in this study. While the analysis revealed the main effect, school,
was not significant, the analysis did highlight significant differences in the second main
effect, ethnicity, and the interaction between school and ethnicity. The second main
effect, ethnicity, was statistically significant and indicated that 24% of the variance in
2014 Math scores could be attributed to this variable. The interaction between school and
ethnicity was also statistically significant in this model. The interaction of school and
ethnicity indicated that 2.3% of the variance in 2014 Math scores could be attributed to
the interaction.
Since statistically significant differences were found on ethnicity, a pairwise
comparison to identify the significant mean differences was performed as was done in the
analysis of 2014 ELA achievement and ethnicity. The pairwise comparison of ethnicity
with Math 2014 achievement as the dependent variable revealed statistically significant
mean differences between ethnic groups. While the analysis showed the Asian to White
comparison of mean difference was not significant, other ethnic group mean differences
were significant, ranging from 20.72 to 53.62. The Asian to Hispanic mean difference

169
was 32.90, the Asian to African-American mean difference was 53.62, the Hispanic to
African American mean difference was 20.72, the White to Hispanic mean difference
was 26.37, and the White to African American mean difference was 47.09. In this model
there were statistically significant differences in 2014 NJ ASK Math achievement among
different ethnic groups. Each comparison of African American students’ academic
performance was significantly lower than their classmates.
Additionally, since the factorial ANOVA found a significant interaction between
school and ethnicity in 2014 Math mean scores, further analysis was completed with the
computation of a separate interaction variable to facilitate the analysis (i.e., 1 = MS 1 and
Asian, 2 = MS 1 and Hispanic, etc.). In an ANOVA on student performance on the NJ
ASK where the new school/ethnicity variable served as the main effect, statistical
differences between groups were revealed. Within MS 1, MS 2, and MS 3, multiple
comparison analyses identified statistically significant Math mean differences among
ethnic groups. In all cases of significant difference, the mean differences on Math mean
scores ranged from 31.92 to 70.76 points on the NJ ASK Math. It is significant to note
that in the treatment school (MS 3), four significant differences were identified between
ethnic groups and Math achievement within the school. The largest mean difference
(70.76) between students of different ethnic groups was also found within the treatment
school where MS 3 Asian students outperformed MS 3 African American students.
Caution should be taken with this specific comparison, as the number of Asian students
in the sample was 17 compared to 66 African American students.
The findings in Research Questions 9 and 10 relate to previous findings on
ethnicity and academic achievement. The Coleman Report (1966) identified differences
170
in achievement across groups. Allard (2008), citing Jencks and Phillips, 1998,
acknowledged the “extensive research on the differences in educational attainment
between racial and ethnic groups in America, in particular the so-called Black-White
achievement gap (p. 11). Citing the findings of Jencks and Phillips (1998), who found
that the average African American student still scores below 75% of American White
students on standardized tests, Allard identified that the achievement gap remains wide.
Fox (2011) examined mathematics achievement in Texas across race/ethnicity using data
from three different years, and statistically significant differences were identified. “Asian
American students and European American students scored noticeably higher than Native
American, African American, and Latino/Latina/Hispanic American students" (p. 116).
In this study, extended school day was not found to be beneficial to ethnic minority
students who have shown and continue to show lower achievement on standardized
assessments. The results here differ from those of extended learning time advocates.
Conclusions
In an effort to reduce sampling bias and to approximate more of a randomized
design methodology, propensity score matching (PSM) was used to pair like students in
the sample from the treatment school (MS 3) with like students from the control schools
(MS 1 and MS 2). The statistical tool propensity score matching was used to better
balance confounding variables across subjects to decrease the impact of selection bias
inherent in this nonrandomized, primarily explanatory design. Propensity score matching
has been used to reduce bias and increase precision in studies within economics, health
services research, and social sciences (D’Agostino, 1998). As in this study, it has also

171
been used when there is “a relatively small group of subjects exposed to a treatment and a
much larger group of control subjects not exposed” (Rosenbaum & Rubin, 1985, p. 33).
Propensity score matching and other statistical methods such as factorial analysis
of covariance and analysis of variance were used to explore the influence of an extended
school day, controlling for prior achievement in one suburban upper-income New Jersey
public school district with three middle schools. The analysis revealed extended school
day to have no statistical significance on academic achievement of middle school
students in Grades 6-8 in nine of the ten research questions. A statistically significant
influence was identified in one research question that sought to assess the interaction of
extended school day and ethnicity on achievement of middle school students in
Mathematics. However, the extended school day was found to not increase academic
achievement of minority middle school students as purported by extended learning time
advocates such as the National Center on Time and Learning and Jez and Wassmer
(2015). This study’s findings ran counter to the work of Redd, Boccanfuso, Walker,
Princiotta, Knewstub, and Moore (2012), who stated, “Existing research indicates that
ESD programs are beneficial to students in minority groups, students who have
performed poorly on standardized tests, and students who are eligible for a free- or
reduced-price lunch” (p. 24). The findings of this study were more aligned with Castillo
(2012), who found in his study that data did not support the hypothesis of extended
learning time leading to improve academic outcomes. He found no statistical difference
between the academic achievement of students who were enrolled in extended learning
time programs and those who were enrolled in standard programs, as measured by scores
on the state assessment test. However, this study did find interaction of ESD and ethnicity

172
to be statistically significant. Yet the findings on this fixed factor demographic variable
and ESD were not positive for ethnic minorities, who have historically failed to
demonstrate achievement on standardized assessments.
It is important to note the significant interactions between Grade 5 Math mean
scores and three student fixed factor demographic variables. In each analysis of the
interaction of ESD with gender, the interaction of ESD with SES, and the interaction of
ESD with ethnicity, a significant interaction was found. Strunk (2014) indicated in her
findings that previous achievement continues to have the greatest impact on academic
achievement gains at the middle school level. Citing Bishop (2003), DiPerna et al.
(2002), McCormick, Stoner, & Duncan (1994), she explicated previous academic
achievement to be one of the strongest predictors of later achievement. The significant
interactions between Grade 5 Math NJ ASK mean scores and three student fixed factor
demographic variables combined with the influence of prior academic achievement in all
research questions where the influence could be controlled may suggest differences in
this district’s elementary schools programs. More investigation is warranted on the
Mathematics achievement of students in the different magnet-themed elementary schools
prior to entering middle school.
Advocates of increasing learning time have argued that it is an effective tool to
improve student achievement. However, while this study’s findings do not support the
influence of ESD on student achievement, there may be other benefits to an extended
school day. It has been espoused and recognized that the needs of young adolescents are
different from the needs of their elementary and high school peers (Jackson & Davis,
2000). It is important to look at middle school practices that are targeted to meet the

173
social and emotional needs of middle school students such as teacher teams, flexible
scheduling, and advisories. Black (2000) stated that there was value in keeping students
and teachers together to “improve teacher-student relationships and teachers’ ability to
recognize their students’ academic strengths and weaknesses.” Flexible scheduling, more
available in extended school day models, provides more time for activities that can be
used to emphasize problem solving and critical thinking along with time for
interdisciplinary connections and social-emotional learning by providing longer periods
and more time for interactions among students and teachers (The National Middle School
Association, 2010). Advisory programs provide scheduled time for teachers and other
adults to meet with groups of students regularly to guide, discuss issues, and provide
academic and social support aiming to overcome middle school structural issues, like
transitioning, by encouraging smaller communities that foster relationships and provide
each student with individual attention (Jackson & Davis, 2000; Juvonen et al., 2004;
NMSA, 2010). Focusing on the social-emotional needs of students, advisories, teacher
teams and flexible scheduling are strategies available in an ESD to purposefully use time
to ensure students’ needs are not overlooked. Extended learning time during the school
day may provide the needed additional time to implement practices to support
achievement and social-emotional needs (Musoleno, 2010).
Within the public school district studied, the cost of delivering extended school
day instruction to all students in one of the three middle schools by increasing
instructional minutes has added financial costs. A review of the per pupil allocation for
the principals’ discretionary budget found similarities among schools. However,
comparisons of the major costs to operate the magnet-themed programs highlight the

174
significant disparities in per pupil staffing. The treatment school (MS 3) had higher per
pupil staffing cost than the control schools (MS 1 and MS 2), primarily because the
smaller student enrollment at MS 3 required staffing for all related arts, along with
staffing for students services provided by a full-time nurse, student assistance counselors,
security, etc. The magnet theme of MS 3 also required the school district to fund stipends
for additional staff to work beyond the contract time and to fund the curricular field trips,
which are part of the extended day school magnet theme. The added costs to the
taxpayers combined with no significant increase in student achievement in the extended
school day in middle school are questionable, at best.
Recommendations for Policy and Practice The findings from this study may be shared with school leaders and all
stakeholders who have a vested interest in the achievement of all students. Although the
magnet system in this New Jersey public school district is more than 30 years old and has
become part of the district’s education structure, the ESD magnet influence on
achievement of all students must be acknowledged. According to the district website, the
magnet system exists to ensure racial balance and parental choice in education. While
the magnet system has been effective at balancing the distribution of ethnic groups within
the three middle schools and providing choice, evidence has been presented that the ESD
magnet-themed middle school has not significantly influenced achievement in nine of the
ten areas researched; and its influence on one area, Mathematics achievement of African
American students, has been less than supportive. District educational leaders are
recommended to investigate Mathematics instruction. The findings identified the
significance of prior achievement in seven of seven research questions where prior
achievement could be analyzed.

175
In addition, while outside of the scope of this study that looked at the time
element of ESD, the literature on extended learning time, in its various forms, identifies
how time is used as an important variable to increase or improve student outcomes. It
has been argued “simply expanding time . . . at schools is not a silver bullet for success”
(Gabrieli, 2010, p. 3). Research suggests that administrators look closely at the
curriculum and teaching practices within the middle schools to ensure consistency. Silva
(2007) posited the effectiveness of adding school time was found to depend on how time
was used. It was found that achievement gains resulted from ESD programs where
schools already had effective curriculum, instruction, and classroom management in
place. Jez and Wassmer (2015) identified that "what is done in class is at least as
important as how much class time there is” (p. 303). It is recommended for policymakers
to ensure teachers use ESD effectively "generally meaning to ensure that active teaching
and learning are happening in this time" (p. 303). With the added cost related to
extending learning time, the effectiveness of this intervention had been questioned. It has
been espoused that increasing time without other reforms that focus on how time is used
will not benefit student achievement (Marcotte & Hansen, 2010; Redd, Boccanfuso,
Walker, Princiotta, Knewstub, & Moore, 2012).
It is also recommended to provide targeted resources to improve the achievement
of African American, Hispanic, and low SES students. The achievement gap between
African American, Hispanic, and low SES students and their peers is not new. It has
been studied since The Coleman Report (1966) identified differences in achievement
across groups and found African American students were ill prepared by their schooling
for college, a well-paying job, or progress toward opportunities for academic or

176
professional achievement. District administrators are recommended to share the data,
discuss it, enlist the support of the community and other education stakeholders to
identify and implement research-based solutions. Fox (2011) explicated that segregating
data by a single variable fails to account for multiple group memberships and their
complexities and connectedness. The study suggested “racism and classism are still
working persistently in the structures of society and education" (p. 128) and identified the
need for culturally responsive teaching and other education changes to meet the needs of
students who are not meeting achievement standards. Fox cited Darling-Hammond
(2004) to expand on the differences in achievement among America’s students by
drawing attention to academic inequalities in education. “Unequal access to high-level
courses and challenging curriculum explains another substantial component of the
difference in achievement.”
District leaders have the ability to direct resources toward achievement of all
students with an emphasis on students with the greatest need. Based on the findings of
this study, the investigation and implementation of strategies to lessen the achievement
gap must include education achievement prior to middle school.
Recommendations for Future Research
Research of extended learning time in its various forms is limited and the results
have not been consistent. There are few studies on the impact of an extended school day
using state assessment data to investigate the impact of achievement of middle school
students in diverse communities. This study adds to the empirical evidence within the
existing body of research on providing additional instructional time for all students. As

177
extended learning time is implemented across the country, more empirical research is
warranted on its influence on student achievement.
It is not possible for one study to answer all questions on a topic. This study was
limited to three middle schools in one suburban community in New Jersey, using
achievement data from only one school year (2014). Recommendations for future
research include the following:
1. Replicating the study with 2012 and 2013 data or with The Partnership for
Assessment of Readiness for College and Careers (PARCC) data, once three
years of data are available, to see if the same conclusions can be drawn.
2. Conducting a study with the focus on how ESD middle schools utilize the
additional in-school learning time either daily and/or weekly (i.e., strategic
class scheduling, advisories, special projects, etc.) and the influence on
student achievement.
3. Designing a study to investigate how instructional time is used within ESD
middle schools with a focus on active teaching and learning.
4. Replicating the study with a focus on student performance and/or achievement
in ESD schools in subject areas outside the core academic areas (i.e., P.E., art,
music, science, social studies, etc.).
5. Designing a qualitative study to investigate the purported non-academic
achievement benefits of ESD (i.e., social emotional development of middle
school students, reduced chronic absenteeism, school satisfactions, etc.).
6. Replicating the study with a focus on student achievement at each specific

178
grade level in middle school (i.e., Grade 6, Grade 7, and Grade 8) in order to
better explore the possibility of a cumulative or decreasing effect to ESD.
7. Conducting a study that focuses on the quality of additional learning time
afforded to ESD schools.
8. Conducting a study to analyze the influence of teacher quality within ESD
middle schools compared to teacher quality in the other middle schools.
9. Designing a study to investigate the post middle school achievement of
students who attended ESD middle schools.
10. Conducting a study on the influence of proven strategies/interventions to
narrow the achievement gap within middle school, using an ESD model.
11. Designing a study that focuses on the “quality” of additional instructional time
afforded to ESD schools.
Concluding Statement
Stakeholders, including parents, teachers, school administrators, and government
officials, are seeking reforms in public education. The demands to raise student
academic achievement of all students are increasing as the country moves into the 21st
century and our educational outcomes for all students are compared to the results from
other nations. Extending learning time is one reform that has garnered support from the
federal government and has been implemented in some schools, many of which are low-
performing on state standardized assessments. Yet, the results have not been consistent.
Questions still remain on the effectiveness of extended learning time, in its various
forms, as a tool to increase academic achievement for all students. Additional research is

179
needed to conclude whether extended learning time is an effective educational reform
that will improve middle school student achievement.
______________________________________
“The schools bear many responsibilities. Among the most important is the
teaching of certain intellectual skills such as reading, writing, calculating, and problem
solving” – The Coleman Report, 1966

180
References
Adelson, J. L. (2013) Educational research with real-world data: Reducing selection bias
with propensity scores. Practical Assessment, Research & Evaluation, 18(15), 2.
Allard, F. (2008). Mind the gap! Examining the gender differences in African American
educational achievement (Doctoral dissertation). Available from ProQuest
Dissertations and Theses. Paper AA133093888. Retrieved from
http://repositoryupenn.edu/dissertations/AA133093888
American Psychological Association. (n.d.). Education and socioeconomic status.
Retrieved from http://www.apa.org/pi/ses/resources/publications/factsheet-
education.aspx
Aronson, J., Zimmerman, J., & Carlos, L. (1999). Improving student achievement by
extending school; Is it just a matter of time? San Francisco, CA: Office of
Educational Research and Improvement.
Babo, G., Tienken, C. H., & Gencarelli, M. A. (2014). Interim testing, socioeconomic
status, and the odds of passing grade 8 state tests in New Jersey. RMLE Online,
38(3), 1-9. Retrieved from http://search.proquest.com/docview/
1630353693?accountid=13793
Boote, D. N., & Beile, P. (2005). Scholars before researchers: On the centrality of the
dissertation literature review in research preparation. Educational Researcher,
34(6), 3-15.
Bowles, S. (1970). Towards an educational production function. In W. L. Hannan (Ed.),
Education, income, and human capital (pp. 11-70). Cambridge, MA: National
Bureau of Economic Research.

181
Branom, C. M. (2013). The school context of gender disparities in math motivation
(Doctoral dissertation). Available from ProQuest Dissertations & Theses Global
(Order No. 3593740). Retrieved from http://search.proquest.com/docview/
1441335353?accountid=13793
Britt, M., & Raine, E. (2012). Clarence Edwards Middle School: Success through
transformation. Boston, MA: National Center on Time Learning. Retrieved from
http://search.proquest.com/docview/1140134501?accountid=13793
Brown, C. G., Rocha, E., Sharkey, A., Hadley, E., Handley, C., & Kronley, R. A. (2005).
Getting smarter, becoming fairer: A progressive education agenda for a
stronger nation. Washington DC: Center for American Progress and Institute for
America’s Future.
Brown, J. E. (2015). The influence of inclusion classes on the academic performance in
language arts literacy on suburban non-disabled eleventh grade students as
measured by the 2013 New Jersey High School Proficiency Assessment.
(Doctoral dissertation). Seton Hall University Dissertations and Theses (ETDs).
Paper 2046.
Carnegie Council on Adolescent Development. (1989). Turning points: Preparing
American youth for the 21st century. New York, NY: Carnegie Corporation of
New York.
Carroll, J. (1963). A model of school learning. The Teachers College Record, 64(8), 723-
723.
Casillas, A., Robbins, S., Allen, J., Kuo, Y. L., Hanson, M. A., & Schmeiser, C. (2012).
Predicting early academic failure in high school from prior academic

182
achievement, psychosocial characteristics, and behavior. Journal of Educational
Psychology, 104(2), 407.
Castillo, C. (2012). The relationship between extended learning time (ELT) and ELA
assessment scores of socioeconomically disadvantaged fourth grade students in
New York State’s big five cities (Doctoral dissertation). Education Doctoral. Paper
128.
Cavanaugh, S. (2012). U.S. education pressured by international comparisons. Education
Week, 31(16), 6-10.
Center on Education Policy (2007, July). As the majority of school districts spend more
time on reading and math, many cut time in other areas [News Release].
Washington, DC: Author.
Clark, M. A., Lee, S. M., Goodman, W., & Yacco, S. (2008). Examining male
underachievement in public education: Action research at a district level. NASSP
Bulletin, 92(2), 111-132. Retrieved from
http://search.proquest.com/docview/216022202?accountid=13793
Coleman, J. S., Campbell, E. Q., Hobson, C. J., McPartland, J., Mood, A. M., Weinfeld,
F. D., & York, R. (1966). Equality of educational opportunity. Washington, DC:
National Center for Educational Statistics.
Craw, J. (2013, September 05). Statistic of the month: Required classroom time and
learning outcomes. Washington, DC: National Center on Education and the
Economy Retrieved from http://www.ncee.org/2013/09/statistic-of-the-month-
required-classroom-time-and-learning-outcomes/>.

183
D’Agostino, R. B. (1998). Tutorial in biostatistics: Propensity score methods for bias
reduction in the comparison of a treatment to a non-randomized control group.
Statistics in Medicine, 17(19), 2265-2281.
DeAngelis, P. (2014). The influence of the length of the school day on grade 11 NJ HSPA
scores (Doctoral dissertation). Seton Hall University Dissertations and Theses
(ETDs). Paper 1978.
Delisle D. S. (2010). Extended learning opportunities for students: A summary of
research and recommendations for next steps. Columbus, OH: Ohio Department
of Education.
The Education Trust-West. (2011). Turning back the clock: The inequitable impact
of shortening the California's school year (Policy Brief). Oakland, CA: Author.
Engerman, K., & Bailey, U. O. (2006). Family decision-making style, peer group
affiliation and prior academic achievement as predictor of the academic achievement of African American students. The Journal of Negro Education, 75(3), 443.
Farbman, D. (2011). Learning time in America: Trends to reform the American school
calendar--A snapshot of federal, state, and local action. Boston, MA: National
Center on Time and Learning.
Farbman, D. (2012). The case for improving and expanding time in school: A review of
key research and practice. Boston, MA: National Center on Time and Learning.
Farbman D., & Kaplan, C. (2005). Time for a change: The promise of extended-time
schools for promoting student achievement (Research Report). Boston, MA:
Massachusetts 2020.

184
Federal Register / Vol. 77, No. 57 / Friday, March 23, 2012 / Notices DEPARTMENT
OF AGRICULTURE Food and Nutrition Service.
Fleming, N. (2011). Push is on to add time to school day, year. Education Week, 31(9), 1-
15.
Fleming, N. (2012). Expanding time for learning both inside and outside of the
classroom. Education Week, 32(2), 4.
Fleming, N. (2013). More and better learning: Year one report on ExpandED Learning.
Education Week, 32(29), 5.
Fox, B. L. (2011). A critical examination of Texas mathematics achievement in grades
three through eight by mathematical objective across race/ethnicity, gender, and
socioeconomic status (Doctoral dissertation). Available from ProQuest
Dissertations & Theses Global. (Order No. 3500147). Retrieved from
http://search.proquest.com/docview/925615853?accountid=13793
Frye, J. (2014). Using propensity score matching to model retention of developmental
math students in community colleges in North Carolina (Doctoral dissertation).
Available from ProQuest Dissertations & Theses Global (Order No. 3586109).
Retrieved from http://search.proquest.com/docview/1513572344?
accountid=13793
Gabrieli, C. (2010). More time, more learning. Educational Leadership, 67(7), 38-47.
Gabrieli, C. (2011). Time--It's not always money. Educational Leadership, 69(4), 24-29.
Gay L. R., Mills, G. E., & Airasian P. (2012). Educational research: Competencies for
analysis and applications (10th ed.). Upper Saddle River, NJ: Pearson-Merrill
Prentice Hall.

185
The Governor’s FY 2013 budget summary for the state of New Jersey. (2013). Retrieved
from http://www.state.nj.us/treasury/omb/publications/13bib/BIB.pdf
Gray, J., Peng, W. J., Steward, S., & Thomas, S. (2004). Towards a typology of gender-
related school effects: Some new perspectives on a familiar problem. Oxford Review
of Education, 30(4), 529-550.
Hanushek, E. (1989, May). The impact of differential expenditures on school
performance. Educational Researcher, 18, 45-62.
Hanushek, E. (2007). Education production functions. Stanford, CA: Hoover Institution,
Stanford University.
Hanushek, E. A. (2010). Education production functions: Developed countries evidence.
In D. J. Brewer & P. J. McEwan (Eds.), Economics of education (pp. 132-136).
Amsterdam: Elsevier.
Heyder, A., & Kessels, U. (2013). Is school feminine? Implicit gender stereotyping of
school as a predictor of academic achievement. Sex Roles, 69(11-12), 605-617.
doi:http://dx.doi.org/10.1007/s11199-013-0309-9
Ho, D. E., Imai, K. K., King, G. G., & Stuart, E. A. (2011). MatchIt: Nonparametric
preprocessing for parametric causal inference. Journal of Statistical Software, 42(8),
1-28.
Jackson, A. W., & Davis, G. A. (2000). Turning points 2000: Educating adolescents in
the 21st century. Williston, VT: Teachers College Press.
Jez, S. J., & Wassmer, R. W. (2015). The impact of learning time on academic
achievement. Education and Urban Society, 47(3), 284-306.

186
Johnson, B. R., & Christensen, L. (2013). Educational research: Quantitative,
qualitative, and mixed approaches (5th ed.). Thousand Oaks, CA: SAGE
Publications.
Joyner, S., Molina, C., Beckwith, S., & Williams, H. K. (2012, January). Class time and
student learning. Austin, TX: Texas Comprehensive Center.
Juvonen, J., Le, V., Kaganoff. T., Augustine, C., & Constant, L. (2004). Focus on the
wonder years: Challenges facing the American middle school. New York, NY:
RAND Education for Edna McConnell Clark Foundation
Kelly, D., Nord, C. W., Jenkins, F., Chan, J. Y., & Kastberg, D. (2013). Performance of
U.S. 15-year-old students in mathematics, science, and reading literacy in an
international context. U.S. Department of Education, National Center for
Education Statistics.
Kessels, U., Heyder, A., Latsch, M., & Hannover, B. (2014). How gender differences in
academic engagement relate to students’ gender identity. Educational Research,
56(2), 220-229.
Kolbe, T., Partridge, M., & O'Reilly, F. (2012). Time and learning in schools: A national
profile. Boston, MA: National Center on Time and Learning.
Ladson-Billings, G., & Tate, W. F. (1995). Toward a critical race theory of education.
Retrieved from http://search.proquest.com/docview/62659035?accountid=13793
Laerd Statistics. (2013). One-way ANOVA-An introduction to when you should run this
test and the test hypothesis. Retrieved from statistics.laerd.com
LaMorte, M. W. (2012). School law: Cases and concepts. Boston, MA: Allyn & Bacon.

187
Lane, F., & Henson, R. (2010). Using propensity scores in quasi-experimental designs to
equate groups. Denton, TX: University of North Texas Department of
Educational Psychology. Retrieved from http://files.eric.ed.gov/fulltext/
ED530015.pdf
Lane, F., To, Y., Shelley, K., & Henson, R. (2012). An illustrative example of propensity
score matching with education research. Career and Technical Education
Research, 37(3), 187-212.
Lavy, V. (2012). Expanding school resources and increasing time on task: Effects of a
policy experiment in Israel on student academic achievement and behavior
(NBER Working Paper No. 18369). Retrieved from http://www.nber.org/
papers/w18369
Leech, N. L., Barrett, K. C., & Morgan, G. A. (2015). IBM SPSS for intermediate
statistics: Use and interpretation. United Kingdom: Routledge.
Listening to experts: What Massachusetts teachers are saying about Time and Learning
and the expanded learning time initiative. (2012). Boston, MA: Massachusetts
2020. Retrieved from http://search.proquest.com/docview/1140129787?
accountid=13793
Long, D. A. (2013). Cross-national educational inequalities and opportunities to learn:
Conflicting views of instructional time. Educational Policy, 28(3), 351-392.
Lytton, H., & Pyryt, M. (1998). Predictors of achievement in basic skills: A Canadian
effective schools study. Canadian Journal of Education/Revue Canadienne De
L'éducation, 23(3), 281–301. Retrieved from http://doi.org/10.2307/1585940

188
Marcotte, D. E., & Hansen, B. (2010, Winter). Time for school?: When the snow falls,
test scores also drop. Education Next, 10(1).
McMurrer, J., Frizzell, M., Yoshioka, N., Scott, C., & Ostler, N. (2015). Expanded
learning time: A summary of findings from case studies in four states.
Washington, DC: Center on Education Policy. Retrieved from http://www.cep-
dc.org/cfcontent_file.cfm?Attachment=McMurrerFrizzellYoshioka%5FSummary
Report%5FExpandedLearningTime%5F011315%2Epdf#sthash.u6FnoQNi.dpuf
Meece, J. L., Glienke, B. B., & Burg, S. (2006). Gender and motivation. Journal of
School Psychology, 44(5), 351-373. Retrieved from
http://search.proquest.com/docview/62103628?accountid=13793
Musoleno, R. R., & White, G. P. (2010). Influences of high-stakes testing on middle
school mission and practice. RMLE Online: Research In Middle Level Education,
34(3), 1-10.
National Center for Time and Learning. (2014a). Financing expanded learning time in
schools. Boston, MA: Author. Retrieved from
http://www.timeandlearning.org/?q=financing-expanded learning-time-schools.
National Center for Time and Learning. (2014b). Time for teachers: Leveraging
expanded time to strengthen instruction and empower teachers. Boston, MA:
Author. Retrieved from http://www.timeandlearning.org/?q=financing-expanded-
learning-time-schools
National Education Commission on Time and Learning. (2005). Prisoners of time (Rev.
ed.). Denver, CO: Education Commission of the States. (Original work published
1994). (ERIC Document Reproduction Service No. ED489343)

189
National Middle School Association. (2003). This we believe: Successful schools for
young adolescents. Westerville, OH: Author.
National Middle School Association. (2010). This we believe: Keys to educating young
adolescents. Westerville, OH: Author.
New Jersey Assessment of Skills and Knowledge. (2014). Grades 3-8 technical report.
Retrieved from http://www.state.nj.us/education/assessment/es/njask_
tech_report14.pdf
New Jersey Assessment of Skills and Knowledge. (2014). 2014 Score interpretation
manual. Retrieved from http://ww.nj.gov/education/assessment/ms/5-
8/ref/SIM14.pdf
New Jersey State Department of Education. (2014). School performance report.
Retrieved from https://education.state.nj.us/pr/
Nichols, S., Gass, G., & Berliner, D. (2012). High-stakes testing and student
achievement: Updated analyses with NAEP data. Education Policy Analysis
Archives, 20, 20.
Obama, B. (2009, March 10). Speech given to the Hispanic Chamber of Commerce,
Washington, D.C. Retrieved from https://www.whitehouse.gov/the-press-office/
remarks-president-united-states-hispanic-chamber-commerce
OECD. (2015). Is spending more hours in class better for learning? PISA in Focus, No.
54. Paris: OECD Publishing.
doi: http://dx.doi.org/10.1787/5jrw21j8drmv-en

190
Owen, I. (2011). Take your time: Why states should use education waivers to increase
learning time. Washington, DC: Center for American Progress and Institute for
America’s Future.
Patall, E. A., Cooper, H., & Allen, A. B. (2010). Extending the school day or year: A
systematic review of research (1985-2009). Review of Educational Research, 80
(3), 401-436.
Peklo, W. (2014). The relationship between increased instructional time and student
learning in mathematics (Doctoral dissertation). Available from ProQuest
Dissertations & Theses Global. (1563381982). Retrieved from
http://search.proquest.com/docview/1563381982?accountid=13793
Periera, M. A. (2011). The influence of student and school variables on student
performance on the New Jersey Assessment of Skills and Knowledge in grade 8
(Doctoral dissertation). Seton Hall University Dissertations and Theses (ETDs).
Paper 1632.
Phan, H. P. (2012). Prior academic achievement, effort, and achievement goal
orientations: A longitudinal examination. Journal of Educational and
Developmental Psychology, 2(2), 57.
Phillips, S. M. (2012). Propensity score matching techniques: Simulation and application
in an educational research context (Doctoral dissertation). Available at ProQuest
LLC. ERIC Number ED541494)
Poston, Jr., W. K. (2010). School budgeting for hard times: Confronting cutbacks and
critics. Newberry Park, CA: Corwin Press.

191
Putbree, L. (1989). Advisory programs at the middle level: The students’ response.
NASSP Bulletin,73, 111-115.
Redd, Z., Boccanfuso, C., Walker, K., Princiotta, D., Knewstub, D., & Moore, K. (2012).
Expanding time for learning both inside and outside the classroom: A review of
the evidence base. Washington, DC: Child Trends. Retrieved from
http://search.proquest.com/docview/1140125588?accountid=13793
Rosenbaum, P. R., & Rubin, D. B. (1985). Constructing a control group using
multivariate matched sampling methods that incorporate the propensity score. The
American Statistician, 39(1), 33-38.
Sammarone, D. R. (2014). The influence of the length of the school day on the percentage
of proficient and advanced proficient scores on the New Jersey Assessment of
Skills and Knowledge for grades 6, 7, and 8 (Doctoral dissertation). Seton Hall
University Dissertations and Theses (ETDs). Paper 1995.
Schacter, R. (2011, Spring). Extending the school day: Extra time is being championed
by reformers left and right. Scholastic Administrator Magazine.
Scott, C., McMurrer, J., McIntosh, S., & Dibner, K. (2012). Opportunities and obstacles:
Implementing stimulus-funded school improvement grants in Maryland,
Michigan, and Idaho. Washington, DC: Center on Education Policy.
Silva, E.. (2012). Off the clock: What more time can (and can't) do for school
turnarounds (Education Sector Reports). Washington, DC: Education Sector.
Retrieved from
http://search.proquest.com/docview/1011398865?accountid=13793

192
Sirin, S. R. (2003). The relationship between socioeconomic status and school outcomes:
Meta analytic review of research, 1990-2000 (Doctoral dissertation).
Available from ProQuest Dissertations & Theses Global. (Order No. 3103221).
Retrieved from http://search.proquest.com/docview/305344159?accountid=13793
Sullivan, A. L., & Bal, A. (2013). Disproportionality in special education: Effects of
individual and school variables on disability risk. Exceptional Children, 79(4),
475-494. Retrieved from http://search.proquest.com/docview/1442712646?
accountid=13793
Statistics Solutions. (2013). Data analysis plan: Factorial ANCOVA [WWW Document].
Retrieved from http://www.statisticssolutions.com/academic-solutions/member-
resources/member-profile/data-analysis-plan-templates/data-analysis-plan-
factorial-ancova/
St. John, M. (2015). The influence of placement in a co-taught inclusive
classroom on the academic achievement of general education students on the
2014 New York State ELA and Mathematics Assessments (Doctoral dissertation).
Seton Hall University Dissertations and Theses (ETDs). Paper 2101.
Stone, C. A., & Tang, Y. (2013). Comparing propensity score methods in balancing
covariates and recovering impact in small sample educational program
evaluations. Practical Assessment, Research & Evaluation, 18(13), 1-12.
Stull, J. C. (2013). Family socioeconomic status, parent expectations, and a child's
achievement. Research in Education, (90), 53-67. Retrieved from
http://search.proquest.com/docview/1498088135?accountid=13793

193
Strunk T. A. (2014). An exploration of the relationships between academic enablers and
middle school achievement (Doctoral dissertation). Available from ProQuest
Dissertations & Theses Global (Order No. 3690161). Retrieved from
http://search.proquest.com/docview/1658227026?accountid=13793
Styron, R., & Nyman, T. (2008). Key characteristics of middle school performance.
RMLE Online: Research In Middle Level Education, 31(5), 1-17.
Taneja, S., Pryor, M., & Toombs, L. (2011). Frederick W. Taylor's scientific
management principles: Relevance and validity. Journal of Applied Management
and Entrepreneurship, 16(3).
Tanner, D., & Tanner, L. N. (1980). Curriculum development: Theory into practice. New
York, NY: Macmillan.
Tienken, C. H. (2012a). The influence of poverty on achievement. Kappa Delta Pi
Record, 48(3), 105-107.
Tienken, C. H. (2012b). Poverty Matters. AASA Journal of Scholarship and Practice,
9(1), 3-6.
Tienken, C. H., & Orlich, D. C. (2013). The school reform landscape: Fraud, myth, and
lies. New York, NY: R&L Education.
Trust, A. (2014). A statistical study of the influence of increased instructional time on
underperforming students' achievement scores in grade 7 and 8 mathematics and
English language arts (Doctoral dissertation). Seton Hall University Dissertations
and Theses (ETDs). Paper 2029.

194
Tuttle, C. C., Teh, B. R., Nichols-Barrer, I., Gill, B. P., & Gleason, P. (2010). Student
characteristics and achievement in 22 KIPP middle schools: Final report.
Princeton, NJ: Mathematica Policy Research.
U.S. Department of Commerce. (n.d.). U.S. Census Bureau quick facts beta. Retrieved
from http://www.census.gov/quickfacts/
U.S. Department of Education. (2014, September 8). Proposed requirements—School
improvement grants—Title I of the Elementary and Secondary Education Act of
1965; Proposed rule. Federal Register 79 (173). Retrieved from
http://www.gpo.gov/fdsys/pkg/FR-2014-09-08/pdf/2014-21185.pdf
Valentine, J., Clark, D., Hackman, D., & Petzko, V. (2002). A national study of
leadership in middle level schools: A national study of middle level leaders and
school programs, Vol. 1. Reston, VA: National Association of Secondary
Principals,
Yell, M. L., Katsiyannis, A., Collins, J. C., & Losinski, M. (2012). Exit exams, high-
stakes testing, and students with disabilities: A persistent challenge. Intervention
in School and Clinic, 48(1), 60-64.
doi:http://dx.doi.org/10.1177/1053451212449740
Zhao, Y. (2012, December 11). Numbers can lie: What TIMSS and PISA truly tell us, if
anything? [Web log post]. Retrieved from http://zhaolearning.com/2012/12/11/
numbers-can-lie-what-timss-and-pisa-truly-tell-us-if-anything/
Ziegler, S., & Mulhall, L. (1994). Establishing and evaluating a successful advisory
program in a middle school,” Middle School Journal, 25 (4), 42-46.

195
APPENDICES

196
APPENDIX A - Request to Conduct Research
Date: May 11, 2015xxxxxxxxxxxxxxxxxxxxxxxxxxxxxxxxxxxxxxxxxxx Public Schoolsxxxxxxxx Road xxxxxxxxx, NJ xxxxxRE: Permission to Conduct Quantitative Research
Dear Mr. xxxxxxx:
I am writing to request permission to conduct a quantitative research study at xxxxxxxxPublic Schools. As a graduate student in the Education Leadership, Management and Policy department at Seton Hall University in South Orange, NJ, I am in the process of writing my dissertation. The quantitative study is currently entitled The Influence of Extended Learning Time on Middle School Student Achievement.
It is my hope that the school administration will allow me to access and utilize two years of anonymous student NJ ASK data/records. Due to the nature of the study, I will not need to contact students or parents directly.
If approval is granted, the survey results will be pooled for the research project and individual results of this study will remain absolutely confidential and anonymous. Should this study be published, only pooled results will be documented.
Your approval to conduct this study will be greatly appreciated. I am happy to answer any questions or concerns regarding this study. You may contact me at my email address: xxxx@xxxxxxxxxxxxx or phone me at (xxx)xxx-xxxx.If you agree to my request, kindly sign below and return the signed form in the enclosed self-addressed envelope. Alternatively, kindly submit a signed letter of permission on xxxxxxxxxxxxxxxxxxPublic School’s letterhead acknowledging your consent and permission for me to conduct this study of xxxxxxxxmiddle school NJ ASK data/records. Sincerely,
Davida Lindsay-HarewoodDoctoral Candidate Seton Hall UniversityApproved by:
_________________________________ ____________________ _________
xxxxxxxxxInterim Superintendent Signature Date

197
APPENDIX B - Propensity Score Matching – Final Cases
R Console
Page 1
R version 3.0.3 (2014-03-06) -- "Warm Puppy" Copyright (C) 2014 The R Foundation for Statistical Computing Platform: i386-w64-mingw32/i386 (32-bit) R is free software and comes with ABSOLUTELY NO WARRANTY. You are welcome to redistribute it under certain conditions. Type 'license()' or 'licence()' for distribution details. R is a collaborative project with many contributors. Type 'contributors()' for more information and 'citation()' on how to cite R or R packages in publications. Type 'demo()' for some demos, 'help()' for on-line help, or 'help.start()' for an HTML browser interface to help. Type 'q()' to quit R. [Previously saved workspace restored] > install.packages("MatchIt") --- Please select a CRAN mirror for use in this session --- trying URL 'http://cran.mirrors.hoobly.com/bin/windows/contrib/3.0/MatchIt_2.4-21.zip' Content type 'application/zip' length 78124 bytes (76 Kb) opened URL downloaded 76 Kb package ‘MatchIt’ successfully unpacked and MD5 sums checked The downloaded binary packages are in C:\Users\babogera\AppData\Local\Temp\RtmpmKWJdZ\downloaded_packages > install.packages("optmatch") There is a binary version available (and will be installed) but the source version is later: binary source optmatch 0.9-3 0.9-5 trying URL 'http://cran.mirrors.hoobly.com/bin/windows/contrib/3.0/optmatch_0.9-3.zip' Content type 'application/zip' length 595931 bytes (581 Kb) opened URL downloaded 581 Kb package ‘optmatch’ successfully unpacked and MD5 sums checked The downloaded binary packages are in C:\Users\babogera\AppData\Local\Temp\RtmpmKWJdZ\downloaded_packages > library(MASS) > library(MatchIt) > library(optmatch) Loading required package: digest You're loading optmatch, by B. Hansen and M. Fredrickson. The optmatch package makes essential use of D. P. Bertsekas and P. Tseng's RELAX-IV algorithm and code, as well as Bertsekas' AUCTION algorithm and code. Using the software to 'satisfy in any part commercial delivery requirements to government or industry' requires a special agreement with Dr. Bertsekas. For more information, enter relaxinfo() at the command line. > data31<-read.csv("C:/data_3_1.csv") > m1.out<-matchit(treat~grd+g+ed+sped+attend+elag5+mathg5,data=data31,method="optimal",distance=" logit",ratio=1) Warning message: In fullmatch(d, min.controls = ratio, max.controls = ratio, omit.fraction = (n0 - : Without 'data' argument the order of the match is not guaranteed to be the same as your original data. > summary(m1.out) Call: R Console
matchit(formula = treat ~ grd + g + ed + sped + attend + elag5 + mathg5, data = data31, method = "optimal", distance = "logit", ratio = 1) Summary of balance for all data: distance

198
grd g ed Page 2
Means Treated Means Control SD Control Mean Diff eQQ Med eQQ Mean 0.3574 0.3199 0.0861 0.0375 0.037 0.0386 6.9916 6.8598 0.8030 0.1318 0.000 0.1345 0.3697 0.4582 0.4988 -0.0884 0.000 0.0882 0.1261 0.1820 0.3863 -0.0560 0.000 0.0546 0.2143 0.1904 0.3930 0.0239 0.000 0.0252 sped attend 169.7101 171.6088 8.2289 -1.8987 1.000 1.9664 elag5 217.8151 213.4456 26.8524 4.3695 6.000 5.5840 mathg5 255.5840 248.9686 38.5355 6.6154 6.000 6.8529 eQQ Max distance 0.1427 grd 1.0000 g 1.0000 ed 1.0000 sped 1.0000 attend 38.0000 elag5 20.0000 mathg5 27.0000 Summary of balance for matched data: Means Treated Means Control SD Control Mean Diff eQQ Med eQQ Mean 0.3536 0.0908 0.0038 7e-04 0.0054 7.0588 0.8039 -0.0672 0e+00 0.0672 0.3824 0.4870 -0.0126 0e+00 0.0126 distance 0.3574 grd 6.9916 g 0.3697 ed 0.1261 0.1134 0.3178 0.0126 0e+00 0.0126 sped 0.2143 0.2059 0.4052 0.0084 0e+00 0.0084 attend 169.7101 170.5798 10.4530 -0.8697 1e+00 1.3739 elag5 217.8151 217.5336 28.0949 0.2815 2e+00 2.7101 mathg5 255.5840 255.2227 37.6777 0.3613 2e+00 2.7479 eQQ Max distance 0.1317 grd 1.0000 g 1.0000 ed 1.0000 sped 1.0000 attend 27.0000 elag5 20.0000 mathg5 27.0000 Percent Balance Improvement: Mean Diff. eQQ Med eQQ Mean eQQ Max distance 89.8545 98.0006 85.9875 7.7169 grd 48.9793 0.0000 50.0000 0.0000 g 85.7427 0.0000 85.7143 0.0000 ed 77.4741 0.0000 76.9231 0.0000 sped 64.8529 0.0000 66.6667 0.0000 attend 54.1925 0.0000 30.1282 28.9474 elag5 93.5574 66.6667 51.4673 0.0000 mathg5 94.5378 66.6667 59.9019 0.0000 Sample sizes: Control Treated All 478 238 Matched 238 238 Unmatched 240 0 Discarded 0 0 > match.data=match.data(m1.out) > write.table(match.data, file="C:/data3-1.csv", sep=",",col.names=NA) > data32<-read.csv("C:/data_3_2.csv") > m2.out<-matchit(treat~grd+g+ed+sped+attend+elag5+mathg5,data=data32,method="optimal",distance=" logit",ratio=1) Warning message: R Console

199
In fullmatch(d, min.controls = ratio, max.controls = ratio, omit.fraction = (n0 - : Without 'data' argument the order of the match is not guaranteed to be the same as your original data. > summary(m2.out) Call: matchit(formula = treat ~ grd + g + ed + sped + attend + elag5 + mathg5, data = data32, method = "optimal", distance = "logit", ratio = 1) Summary of balance for all data: Means Treated Means Control SD Control Mean Diff eQQ Med eQQ Mean Page 3
distance 0.3504 grd 6.9916 g 0.3697 ed 0.1261 sped 0.2143 attend 169.7101 174.2711 7.8264 -4.5610 4.0000 4.4286 elag5 217.8151 219.3397 25.9491 -1.5246 2.0000 2.1134 mathg5 255.5840 255.6045 36.9369 -0.0204 2.0000 2.4454 0.2466 0.1153 0.1038 0.0941 0.1037 7.0415 0.8141 -0.0499 0.0000 0.0504 0.5470 0.4982 -0.1773 0.0000 0.1765 0.1467 0.3541 -0.0207 0.0000 0.0210 0.1324 0.3392 0.0819 0.0000 0.0798 eQQ Max distance 0.2518 grd 1.0000 g 1.0000 ed 1.0000 sped 1.0000 attend 15.0000 elag5 20.0000 mathg5 42.0000 Summary of balance for matched data: Means Treated Means Control SD Control Mean Diff eQQ Med eQQ Mean distance 0.3504 grd 6.9916 g 0.3697 ed 0.1261 sped 0.2143 attend 169.7101 171.0084 11.2992 -1.2983 1.0000 1.8445 elag5 217.8151 220.1849 24.3361 -2.3697 3.0000 3.3361 mathg5 255.5840 258.9538 35.2766 -3.3697 4.0000 3.9748 eQQ Max distance 0.1489 grd 1.0000 g 1.0000 ed 1.0000 sped 1.0000 attend 41.0000 elag5 11.0000 mathg5 28.0000 Percent Balance Improvement: Mean Diff. eQQ Med eQQ Mean eQQ Max distance 80.2539 98.7181 78.3651 40.8567 grd -119.0540 0.0000 -116.6667 0.0000 g 69.1927 0.0000 69.0476 0.0000 ed -103.1756 0.0000 -100.0000 0.0000 sped 89.7407 0.0000 89.4737 0.0000 attend 71.5346 75.0000 58.3491 -173.3333 elag5 -55.4354 -50.0000 -57.8529 45.0000 mathg5 -16392.4237 -100.0000 -62.5430 33.3333 Sample sizes: Control Treated All 627 238 Matched 238 238 Unmatched 389 0 Discarded 0 0 0.3299 0.1366 0.0205 0.0012 0.0224 7.1008 0.7837 -0.1092 0.0000 0.1092
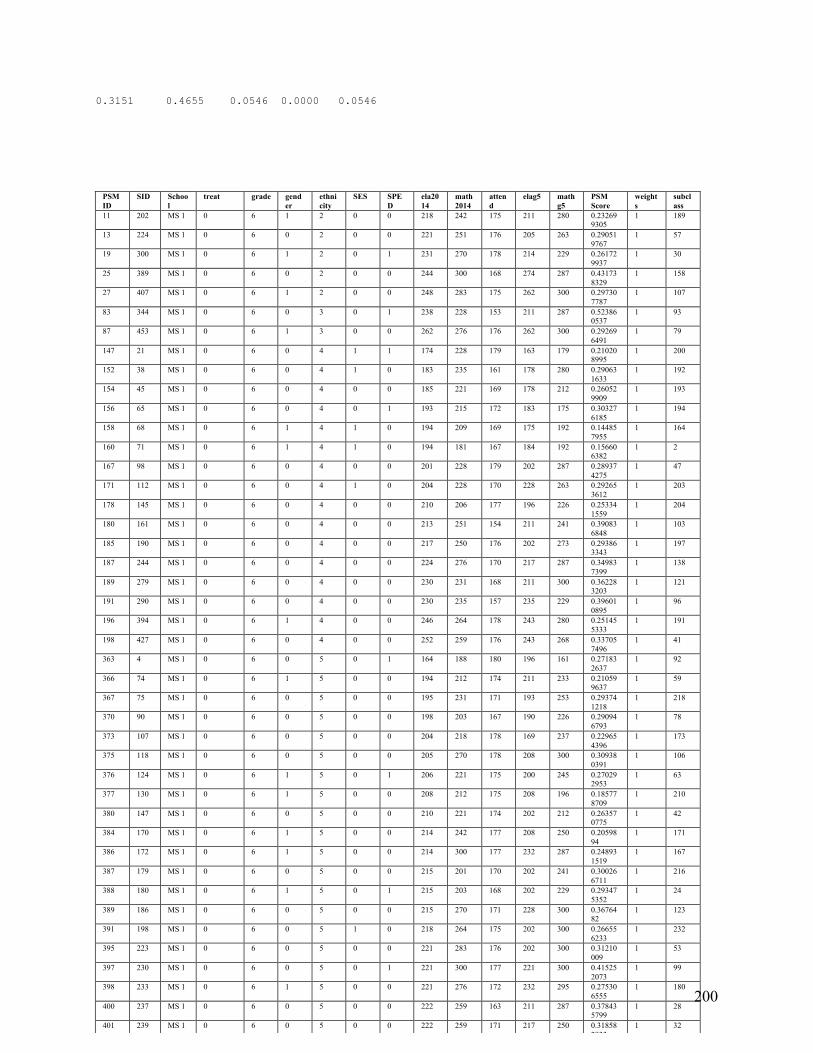
200
0.3151 0.4655 0.0546 0.0000 0.0546
PSM ID
SID School
treat grade gender
ethnicity
SES SPED
ela2014
math2014
attend
elag5 mathg5
PSM Score
weights
subclass
11 202 MS 1 0 6 1 2 0 0 218 242 175 211 280 0.232699305
1 189
13 224 MS 1 0 6 0 2 0 0 221 251 176 205 263 0.290519767
1 57
19 300 MS 1 0 6 1 2 0 1 231 270 178 214 229 0.261729937
1 30
25 389 MS 1 0 6 0 2 0 0 244 300 168 274 287 0.431738329
1 158
27 407 MS 1 0 6 1 2 0 0 248 283 175 262 300 0.297307787
1 107
83 344 MS 1 0 6 0 3 0 1 238 228 153 211 287 0.523860537
1 93
87 453 MS 1 0 6 1 3 0 0 262 276 176 262 300 0.292696491
1 79
147 21 MS 1 0 6 0 4 1 1 174 228 179 163 179 0.210208995
1 200
152 38 MS 1 0 6 0 4 1 0 183 235 161 178 280 0.290631633
1 192
154 45 MS 1 0 6 0 4 0 0 185 221 169 178 212 0.260529909
1 193
156 65 MS 1 0 6 0 4 0 1 193 215 172 183 175 0.303276185
1 194
158 68 MS 1 0 6 1 4 1 0 194 209 169 175 192 0.144857955
1 164
160 71 MS 1 0 6 1 4 1 0 194 181 167 184 192 0.156606382
1 2
167 98 MS 1 0 6 0 4 0 0 201 228 179 202 287 0.289374275
1 47
171 112 MS 1 0 6 0 4 1 0 204 228 170 228 263 0.292653612
1 203
178 145 MS 1 0 6 0 4 0 0 210 206 177 196 226 0.253341559
1 204
180 161 MS 1 0 6 0 4 0 0 213 251 154 211 241 0.390836848
1 103
185 190 MS 1 0 6 0 4 0 0 217 250 176 202 273 0.293863343
1 197
187 244 MS 1 0 6 0 4 0 0 224 276 170 217 287 0.349837399
1 138
189 279 MS 1 0 6 0 4 0 0 230 231 168 211 300 0.362283203
1 121
191 290 MS 1 0 6 0 4 0 0 230 235 157 235 229 0.396010895
1 96
196 394 MS 1 0 6 1 4 0 0 246 264 178 243 280 0.251455333
1 191
198 427 MS 1 0 6 0 4 0 0 252 259 176 243 268 0.337057496
1 41
363 4 MS 1 0 6 0 5 0 1 164 188 180 196 161 0.271832637
1 92
366 74 MS 1 0 6 1 5 0 0 194 212 174 211 233 0.210599637
1 59
367 75 MS 1 0 6 0 5 0 0 195 231 171 193 253 0.293741218
1 218
370 90 MS 1 0 6 0 5 0 0 198 203 167 190 226 0.290946793
1 78
373 107 MS 1 0 6 0 5 0 0 204 218 178 169 237 0.229654396
1 173
375 118 MS 1 0 6 0 5 0 0 205 270 178 208 300 0.309380391
1 106
376 124 MS 1 0 6 1 5 0 1 206 221 175 200 245 0.270292953
1 63
377 130 MS 1 0 6 1 5 0 0 208 212 175 208 196 0.185778709
1 210
380 147 MS 1 0 6 0 5 0 0 210 221 174 202 212 0.263570775
1 42
384 170 MS 1 0 6 1 5 0 0 214 242 177 208 250 0.2059894
1 171
386 172 MS 1 0 6 1 5 0 0 214 300 177 232 287 0.248931519
1 167
387 179 MS 1 0 6 0 5 0 0 215 201 170 202 241 0.300266711
1 216
388 180 MS 1 0 6 1 5 0 1 215 203 168 202 229 0.293475352
1 24
389 186 MS 1 0 6 0 5 0 0 215 270 171 228 300 0.3676482
1 123
391 198 MS 1 0 6 0 5 1 0 218 264 175 202 300 0.266556233
1 232
395 223 MS 1 0 6 0 5 0 0 221 283 176 202 300 0.31210009
1 53
397 230 MS 1 0 6 0 5 0 1 221 300 177 221 300 0.415252073
1 99
398 233 MS 1 0 6 1 5 0 0 221 276 172 232 295 0.275306555
1 180
400 237 MS 1 0 6 0 5 0 0 222 259 163 211 287 0.378435799
1 28
401 239 MS 1 0 6 0 5 0 0 222 259 171 217 250 0.318582933
1 32

201
402 255 MS 1 0 6 1 5 0 1 225 206 167 211 219 0.301342762
1 51
404 260 MS 1 0 6 0 5 0 0 225 238 173 239 287 0.3611831
1 48
405 276 MS 1 0 6 0 5 0 0 230 235 174 193 263 0.286629639
1 196
407 292 MS 1 0 6 0 5 0 0 230 235 170 250 258 0.368543996
1 215
409 312 MS 1 0 6 0 5 0 0 233 300 175 217 273 0.315311308
1 175
412 329 MS 1 0 6 0 5 0 0 235 259 174 250 287 0.369494518
1 237
414 336 MS 1 0 6 1 5 0 0 236 251 167 224 263 0.26863358
1 49
415 340 MS 1 0 6 0 5 0 1 236 300 173 250 300 0.474860167
1 234
418 358 MS 1 0 6 0 5 0 0 240 291 169 217 300 0.364474954
1 95
419 361 MS 1 0 6 0 5 0 0 240 283 173 221 295 0.345341176
1 1
420 362 MS 1 0 6 1 5 0 0 240 300 174 221 295 0.255359685
1 39
422 364 MS 1 0 6 0 5 0 0 240 251 175 232 253 0.318588195
1 236
426 375 MS 1 0 6 1 5 0 0 240 250 174 274 263 0.290480907
1 201
427 377 MS 1 0 6 1 5 0 0 242 291 176 224 300 0.252985079
1 187
431 400 MS 1 0 6 1 5 0 0 248 259 170 232 295 0.284241559
1 208
432 418 MS 1 0 6 1 5 0 0 252 259 171 200 258 0.225684745
1 80
433 422 MS 1 0 6 1 5 0 0 252 254 170 232 287 0.279063692
1 139
434 425 MS 1 0 6 1 5 0 0 252 300 169 235 263 0.271328645
1 12
436 434 MS 1 0 6 1 5 0 0 254 291 170 252 300 0.309590805
1 40
438 439 MS 1 0 6 0 5 0 0 256 291 170 239 300 0.386481296
1 157
439 440 MS 1 0 6 0 5 0 0 256 300 166 252 287 0.414242071
1 17
442 449 MS 1 0 6 0 5 0 0 260 300 171 280 300 0.43338701
1 137
443 450 MS 1 0 6 1 5 0 0 260 259 171 300 300 0.360999276
1 10
444 451 MS 1 0 6 0 5 0 1 262 300 180 239 287 0.412059092
1 136
445 456 MS 1 0 6 1 5 0 0 266 254 177 252 250 0.246532118
1 229
446 458 MS 1 0 6 1 5 0 0 266 300 170 257 300 0.315255896
1 156
447 459 MS 1 0 6 1 5 0 0 266 242 171 262 273 0.29779184
1 212
32 166 MS 1 0 7 1 2 0 0 220 194 172 215 235 0.260286574
1 29
89 20 MS 1 0 7 1 3 0 0 174 165 175 167 175 0.174204562
1 19
91 42 MS 1 0 7 0 3 0 0 202 165 172 187 204 0.292585025
1 238
94 73 MS 1 0 7 0 3 0 1 196 218 170 176 232 0.392460469
1 23
95 89 MS 1 0 7 0 3 1 1 200 156 180 190 222 0.297156781
1 235
98 109 MS 1 0 7 0 3 0 1 203 221 165 190 225 0.431761273
1 87
99 111 MS 1 0 7 0 3 1 1 162 187 159 200 201 0.398987791
1 55
100 117 MS 1 0 7 0 3 0 0 196 201 171 206 222 0.331171565
1 183
102 139 MS 1 0 7 0 3 1 0 208 221 175 204 246 0.275005699
1 37
107 362 MS 1 0 7 0 3 0 0 260 252 168 235 242 0.396652781
1 9
205 13 MS 1 0 7 0 4 1 1 159 187 173 167 207 0.294222225
1 14
206 15 MS 1 0 7 0 4 1 1 171 165 146 164 185 0.410352718
1 85
210 31 MS 1 0 7 0 4 0 1 200 180 180 232 242 0.417913416
1 124
214 47 MS 1 0 7 0 4 0 1 157 169 165 173 172 0.369611158
1 67
215 56 MS 1 0 7 1 4 1 1 166 146 170 181 134 0.201554057
1 186
218 60 MS 1 0 7 0 4 0 1 174 169 165 187 201 0.409200932
1 170
226 90 MS 1 0 7 0 4 1 0 175 204 177 176 213 0.219776026
1 228

202
229 102 MS 1 0 7 0 4 1 0 211 201 171 170 210 0.235919845
1 25
231 119 MS 1 0 7 1 4 0 0 202 208 175 200 225 0.227566134
1 174
241 204 MS 1 0 7 1 4 1 0 208 191 170 204 239 0.21595835
1 179
242 212 MS 1 0 7 0 4 0 0 215 191 171 218 246 0.362895299
1 205
244 217 MS 1 0 7 1 4 0 0 238 221 173 235 263 0.294923848
1 74
246 252 MS 1 0 7 0 4 0 0 234 240 167 212 258 0.385234764
1 5
248 289 MS 1 0 7 0 4 0 0 246 262 171 206 296 0.385525333
1 61
250 448 MS 1 0 7 0 4 1 0 284 252 177 235 300 0.336828748
1 198
449 23 MS 1 0 7 1 5 0 1 139 184 164 184 210 0.322872237
1 120
450 25 MS 1 0 7 0 5 1 1 173 204 169 192 232 0.360213935
1 77
453 34 MS 1 0 7 0 5 0 1 147 146 157 170 222 0.447104884
1 145
454 36 MS 1 0 7 0 5 0 1 171 141 162 187 201 0.425373699
1 217
456 50 MS 1 0 7 0 5 0 1 182 194 179 176 222 0.338827095
1 154
458 84 MS 1 0 7 0 5 0 1 170 176 167 176 219 0.398420349
1 224
459 86 MS 1 0 7 0 5 0 1 205 236 173 201 268 0.436231485
1 71
461 128 MS 1 0 7 0 5 0 1 205 194 175 195 216 0.377819453
1 66
462 129 MS 1 0 7 0 5 0 0 215 201 174 192 246 0.317242244
1 177
466 143 MS 1 0 7 1 5 0 1 214 200 104 209 219 0.679267399
1 161
469 156 MS 1 0 7 1 5 0 0 217 243 172 201 254 0.257779743
1 185
470 158 MS 1 0 7 0 5 0 1 229 200 172 206 225 0.414477712
1 84
472 179 MS 1 0 7 0 5 0 0 220 300 171 232 300 0.42159539
1 126
473 183 MS 1 0 7 0 5 0 0 217 225 177 225 250 0.343860457
1 153
475 201 MS 1 0 7 1 5 0 0 214 221 174 200 246 0.243653458
1 181
476 205 MS 1 0 7 0 5 0 1 219 240 176 200 263 0.414775456
1 149
477 206 MS 1 0 7 0 5 0 0 208 228 169 215 250 0.372501152
1 122
479 210 MS 1 0 7 0 5 0 0 220 191 172 192 188 0.287475932
1 178
480 220 MS 1 0 7 1 5 0 0 260 228 175 225 287 0.290717585
1 227
481 249 MS 1 0 7 0 5 0 0 220 228 179 204 246 0.307029521
1 159
482 251 MS 1 0 7 1 5 0 0 201 240 176 195 254 0.23543396
1 199
483 260 MS 1 0 7 1 5 0 0 246 262 164 225 258 0.322834596
1 172
484 265 MS 1 0 7 0 5 0 0 244 279 166 225 296 0.436572977
1 131
486 268 MS 1 0 7 0 5 0 0 231 300 177 235 274 0.373644054
1 15
487 270 MS 1 0 7 0 5 0 0 229 228 169 192 235 0.333854898
1 33
488 271 MS 1 0 7 0 5 0 0 224 262 175 218 258 0.351347496
1 18
489 276 MS 1 0 7 1 5 0 0 273 232 164 239 280 0.35513266
1 151
490 277 MS 1 0 7 0 5 0 0 229 221 49 232 254 0.903929908
1 4
491 281 MS 1 0 7 0 5 0 0 242 267 168 225 300 0.428828791
1 125
492 284 MS 1 0 7 0 5 0 0 208 228 167 232 296 0.440204196
1 116
493 294 MS 1 0 7 1 5 0 0 238 173 175 212 213 0.231973662
1 166
494 295 MS 1 0 7 0 5 0 0 220 218 165 209 254 0.388965671
1 73
496 301 MS 1 0 7 0 5 0 0 231 218 171 215 300 0.399897053
1 69
497 317 MS 1 0 7 1 5 0 0 260 252 170 272 268 0.355736151
1 26
499 330 MS 1 0 7 1 5 0 0 255 240 171 235 296 0.327024344
1 22
501 337 MS 1 0 7 0 5 0 0 229 232 169 256 296 0.46055946
1 141

203
502 343 MS 1 0 7 1 5 0 0 232 221 171 209 232 0.256631405
1 188
504 348 MS 1 0 7 0 5 0 0 222 262 173 232 254 0.375725956
1 31
505 349 MS 1 0 7 1 5 0 0 234 243 161 228 268 0.348317384
1 100
506 358 MS 1 0 7 1 5 0 0 257 250 172 243 296 0.331446248
1 146
508 369 MS 1 0 7 1 5 0 0 232 240 171 261 250 0.324823064
1 160
509 375 MS 1 0 7 0 5 0 0 246 300 173 232 296 0.4077272
1 43
510 385 MS 1 0 7 1 5 0 0 275 273 175 250 300 0.327734121
1 230
511 392 MS 1 0 7 0 5 0 0 246 273 168 215 274 0.395906304
1 195
512 404 MS 1 0 7 1 5 0 0 255 286 170 250 287 0.343175259
1 223
513 405 MS 1 0 7 0 5 0 0 255 295 176 252 296 0.41717119
1 233
515 410 MS 1 0 7 1 5 0 0 265 211 172 239 239 0.288004519
1 35
516 413 MS 1 0 7 0 5 0 0 273 300 168 266 300 0.482413067
1 143
517 415 MS 1 0 7 0 5 0 0 273 236 172 239 258 0.39273288
1 16
518 417 MS 1 0 7 0 5 0 0 253 243 173 239 254 0.38442504
1 209
519 418 MS 1 0 7 1 5 0 0 255 300 159 235 280 0.375946753
1 36
521 422 MS 1 0 7 0 5 0 0 262 267 175 215 300 0.378814173
1 11
522 428 MS 1 0 7 0 5 0 0 278 267 172 252 300 0.442034256
1 133
523 437 MS 1 0 7 0 5 0 0 255 273 173 250 296 0.430839209
1 115
524 438 MS 1 0 7 1 5 0 0 296 273 171 228 300 0.321737189
1 34
525 440 MS 1 0 7 0 5 0 0 265 279 170 239 287 0.425870123
1 75
527 447 MS 1 0 7 1 5 0 0 293 286 168 232 296 0.338277387
1 27
528 449 MS 1 0 7 0 5 0 0 290 295 170 272 300 0.479243191
1 117
529 454 MS 1 0 7 1 5 0 0 281 257 166 292 287 0.416062969
1 219
37 263 MS 1 0 8 0 2 0 0 206 216 178 176 174 0.275899171
1 54
39 291 MS 1 0 8 0 2 0 0 230 251 173 210 240 0.386141303
1 134
40 297 MS 1 0 8 1 2 0 0 195 251 172 193 212 0.263258021
1 52
42 302 MS 1 0 8 0 2 0 0 228 300 175 204 300 0.413962064
1 56
44 329 MS 1 0 8 0 2 0 0 259 300 166 256 261 0.500363509
1 110
46 336 MS 1 0 8 1 2 0 0 261 276 174 238 293 0.359629582
1 213
47 337 MS 1 0 8 1 2 0 0 248 283 166 234 271 0.379641859
1 86
49 343 MS 1 0 8 0 2 0 0 263 290 178 242 300 0.446778129
1 91
113 293 MS 1 0 8 0 3 1 0 236 216 173 216 209 0.31537603
1 97
114 305 MS 1 0 8 0 3 0 0 248 270 178 238 271 0.418832565
1 207
254 227 MS 1 0 8 0 4 1 1 187 169 177 195 230 0.368793224
1 65
257 231 MS 1 0 8 1 4 1 1 189 184 178 159 209 0.227039065
1 169
258 232 MS 1 0 8 1 4 1 1 186 161 173 156 185 0.230259901
1 72
262 236 MS 1 0 8 0 4 1 0 191 173 168 182 203 0.296761279
1 20
265 239 MS 1 0 8 0 4 1 0 221 270 159 201 300 0.43716129
1 113
266 240 MS 1 0 8 1 4 1 0 195 188 169 195 182 0.215509933
1 112
268 242 MS 1 0 8 1 4 0 1 188 200 170 176 163 0.297089364
1 225
270 251 MS 1 0 8 0 4 0 1 205 177 170 190 203 0.43759774
1 127
274 262 MS 1 0 8 1 4 1 0 221 173 177 216 188 0.207600698
1 163
277 268 MS 1 0 8 0 4 0 0 226 234 166 246 285 0.506371256
1 60
279 271 MS 1 0 8 0 4 0 1 214 259 174 223 221 0.473034643
1 128

204
283 279 MS 1 0 8 1 4 0 0 230 192 177 216 203 0.259716194
1 46
284 282 MS 1 0 8 1 4 0 0 250 216 172 246 261 0.355992471
1 62
285 284 MS 1 0 8 1 4 0 0 230 200 177 200 215 0.250969652
1 182
287 288 MS 1 0 8 0 4 0 0 222 212 171 223 252 0.422563438
1 104
288 295 MS 1 0 8 1 4 1 0 233 209 176 204 230 0.223356909
1 206
291 313 MS 1 0 8 0 4 0 0 235 270 173 230 266 0.431705551
1 144
295 320 MS 1 0 8 0 4 0 0 225 300 173 223 271 0.426579114
1 130
530 222 MS 1 0 8 0 5 0 1 168 147 180 131 167 0.289255039
1 162
531 225 MS 1 0 8 0 5 0 1 167 142 173 162 185 0.37222014
1 8
532 229 MS 1 0 8 0 5 0 1 185 188 167 162 230 0.43887947
1 21
533 246 MS 1 0 8 0 5 0 1 201 206 169 187 285 0.504438509
1 105
534 247 MS 1 0 8 0 5 0 1 211 195 158 174 221 0.49708629
1 119
535 248 MS 1 0 8 0 5 0 1 203 192 176 184 240 0.426233597
1 70
537 250 MS 1 0 8 0 5 0 1 230 250 179 193 266 0.441985802
1 94
538 252 MS 1 0 8 0 5 0 1 205 212 176 176 237 0.413618155
1 45
539 254 MS 1 0 8 0 5 0 0 224 234 165 213 230 0.42498369
1 118
540 255 MS 1 0 8 1 5 0 0 221 173 174 201 233 0.276063627
1 68
541 257 MS 1 0 8 0 5 0 1 196 192 176 204 240 0.452210128
1 155
542 258 MS 1 0 8 1 5 0 0 222 177 172 234 206 0.303213269
1 114
543 259 MS 1 0 8 1 5 0 1 215 195 170 184 212 0.340235036
1 165
544 260 MS 1 0 8 0 5 0 0 213 238 175 193 261 0.370425254
1 147
545 264 MS 1 0 8 0 5 0 0 222 223 175 216 250 0.390724214
1 13
546 267 MS 1 0 8 0 5 0 0 235 227 172 201 215 0.361505523
1 231
547 269 MS 1 0 8 1 5 0 0 228 230 170 226 230 0.320142636
1 89
548 276 MS 1 0 8 0 5 0 0 224 242 163 230 256 0.478722751
1 140
549 278 MS 1 0 8 0 5 0 0 230 300 179 201 266 0.363341082
1 222
550 280 MS 1 0 8 0 5 0 0 225 206 162 230 244 0.474677558
1 81
551 281 MS 1 0 8 0 5 0 0 213 216 175 187 209 0.32554794
1 101
552 283 MS 1 0 8 0 5 0 0 232 230 174 242 271 0.445769357
1 129
553 285 MS 1 0 8 0 5 0 0 225 264 172 204 240 0.383897966
1 109
554 287 MS 1 0 8 0 5 0 0 219 270 175 216 300 0.429395923
1 6
555 290 MS 1 0 8 1 5 0 0 233 250 171 230 271 0.349092717
1 50
556 292 MS 1 0 8 1 5 0 0 228 200 170 207 203 0.280959649
1 221
558 298 MS 1 0 8 1 5 0 0 217 165 176 204 237 0.272931943
1 44
559 301 MS 1 0 8 0 5 0 0 235 264 169 223 261 0.440502663
1 82
560 303 MS 1 0 8 1 5 0 0 246 209 176 238 285 0.343686223
1 3
561 306 MS 1 0 8 0 5 0 0 236 238 174 223 252 0.406421947
1 202
562 308 MS 1 0 8 1 5 0 0 250 195 157 216 233 0.375657721
1 176
563 309 MS 1 0 8 0 5 0 0 236 290 175 238 300 0.458029694
1 152
564 310 MS 1 0 8 1 5 0 0 246 290 175 250 293 0.369153311
1 7
565 311 MS 1 0 8 0 5 0 0 225 300 173 242 285 0.46236635
1 142
566 312 MS 1 0 8 1 5 0 0 220 202 175 207 209 0.262817598
1 168
567 317 MS 1 0 8 0 5 0 0 246 300 170 250 293 0.495871702
1 76
568 318 MS 1 0 8 1 5 0 0 241 202 165 234 252 0.370591969
1 58

205
569 319 MS 1 0 8 0 5 0 1 236 283 166 234 285 0.582288204
1 214
570 321 MS 1 0 8 1 5 0 0 248 242 172 216 261 0.320595641
1 88
571 322 MS 1 0 8 0 5 0 0 233 290 171 226 278 0.446886143
1 64
572 323 MS 1 0 8 1 5 0 0 239 251 171 246 293 0.385028538
1 98
573 324 MS 1 0 8 0 5 0 0 250 251 177 213 271 0.392394633
1 90
574 325 MS 1 0 8 1 5 0 0 268 223 169 246 252 0.364687883
1 83
575 326 MS 1 0 8 1 5 0 0 246 300 174 238 278 0.348654655
1 220
576 327 MS 1 0 8 0 5 0 0 257 300 176 242 285 0.445878457
1 132
577 328 MS 1 0 8 1 5 0 0 257 300 172 261 300 0.403977287
1 211
578 330 MS 1 0 8 1 5 0 0 268 300 170 238 300 0.385589864
1 108
579 333 MS 1 0 8 0 5 0 0 257 264 172 287 300 0.539092826
1 148
580 334 MS 1 0 8 0 5 0 0 261 300 170 242 300 0.490921956
1 150
582 338 MS 1 0 8 1 5 0 0 244 290 161 273 300 0.479579502
1 111
584 340 MS 1 0 8 0 5 0 0 239 300 171 234 293 0.469269241
1 135
585 342 MS 1 0 8 1 5 0 0 250 300 172 234 300 0.370206364
1 226
586 344 MS 1 0 8 0 5 0 0 253 300 169 242 300 0.496464169
1 102
587 345 MS 1 0 8 1 5 0 0 275 300 175 256 300 0.381824708
1 190
588 346 MS 1 0 8 1 5 0 0 261 300 172 261 300 0.403977287
1 38
716 296 MS 1 0 8 1 0 1 0 225 227 166 207 252 0.281247682
1 184
1 200 MS 2 0 6 0 1 0 0 218 264 171 205 295 0.386936178
1 18
3 25 MS 2 0 6 0 2 1 0 175 212 170 181 182 0.33278535
1 20
18 463 MS 2 0 6 1 2 0 0 269 291 165 287 263 0.357362972
1 175
66 31 MS 2 0 6 0 3 1 1 180 188 173 169 202 0.387001013
1 63
76 217 MS 2 0 6 1 3 0 1 219 218 170 228 229 0.346295948
1 134
80 240 MS 2 0 6 0 3 0 0 222 231 174 221 245 0.328174376
1 184
84 430 MS 2 0 6 0 3 0 0 252 251 179 262 263 0.263764588
1 179
85 446 MS 2 0 6 0 3 0 0 260 300 176 224 300 0.306139737
1 182
86 452 MS 2 0 6 1 3 0 0 262 300 170 257 287 0.267485192
1 149
155 3 MS 2 0 6 0 4 0 1 156 138 98 184 202 0.996462181
1 214
156 9 MS 2 0 6 1 4 1 1 168 184 165 175 133 0.357204567
1 168
157 13 MS 2 0 6 0 4 1 1 169 162 171 166 196 0.422406751
1 141
160 24 MS 2 0 6 0 4 0 1 174 191 180 190 212 0.310663231
1 80
164 30 MS 2 0 6 1 4 1 1 180 162 166 157 143 0.334822224
1 102
167 39 MS 2 0 6 0 4 0 1 183 188 173 193 212 0.440057791
1 128
170 48 MS 2 0 6 0 4 1 0 186 203 165 193 202 0.434426401
1 9
171 50 MS 2 0 6 0 4 1 0 189 203 179 187 222 0.204642606
1 56
172 52 MS 2 0 6 1 4 1 0 189 178 159 205 196 0.382045214
1 22
174 56 MS 2 0 6 1 4 0 0 192 203 165 190 189 0.307084175
1 12
177 61 MS 2 0 6 0 4 0 1 192 235 178 202 258 0.35952458
1 34
189 120 MS 2 0 6 0 4 1 1 206 158 176 166 226 0.336507604
1 38
193 150 MS 2 0 6 0 4 0 1 210 235 177 205 253 0.377916735
1 68
195 163 MS 2 0 6 0 4 0 0 213 242 166 217 287 0.486435414
1 170
201 251 MS 2 0 6 0 4 0 0 225 238 172 193 250 0.354312396
1 211
406 69 MS 2 0 6 0 5 0 1 194 194 149 181 215 0.836444514
1 78

206
407 95 MS 2 0 6 0 5 0 1 200 283 178 190 295 0.362882702
1 212
408 111 MS 2 0 6 0 5 0 0 204 270 180 211 300 0.239677226
1 44
409 128 MS 2 0 6 0 5 0 0 208 238 176 190 273 0.289304928
1 171
416 162 MS 2 0 6 0 5 0 0 213 264 177 214 287 0.283873333
1 130
418 176 MS 2 0 6 0 5 0 1 215 194 177 193 229 0.368143491
1 26
422 195 MS 2 0 6 0 5 0 1 217 251 178 250 300 0.386950677
1 183
424 207 MS 2 0 6 0 5 0 0 218 231 174 221 258 0.330827214
1 177
425 208 MS 2 0 6 0 5 0 0 218 251 173 221 295 0.356284016
1 196
427 218 MS 2 0 6 0 5 0 0 219 276 173 232 287 0.358718096
1 84
431 231 MS 2 0 6 0 5 0 0 221 259 171 224 268 0.388390958
1 198
434 245 MS 2 0 6 0 5 0 0 224 259 171 221 280 0.38985965
1 233
435 246 MS 2 0 6 1 5 0 1 224 224 177 228 280 0.242422891
1 91
438 263 MS 2 0 6 1 5 0 0 227 215 161 208 253 0.39884607
1 110
440 267 MS 2 0 6 1 5 0 0 227 251 178 224 287 0.155604007
1 154
443 285 MS 2 0 6 1 5 0 0 230 235 180 228 250 0.132800108
1 2
444 286 MS 2 0 6 0 5 0 0 230 254 166 228 300 0.493930894
1 67
451 303 MS 2 0 6 0 5 0 0 231 238 172 228 280 0.373975927
1 192
452 304 MS 2 0 6 0 5 0 0 231 283 166 228 287 0.49092968
1 190
453 305 MS 2 0 6 1 5 0 0 231 228 172 232 219 0.219498905
1 59
459 319 MS 2 0 6 0 5 0 1 233 238 174 243 273 0.454732126
1 194
460 320 MS 2 0 6 1 5 0 0 233 270 176 243 300 0.183809186
1 229
464 331 MS 2 0 6 0 5 0 1 236 270 176 205 300 0.407032457
1 111
469 360 MS 2 0 6 0 5 0 0 240 270 174 221 280 0.335341167
1 71
471 376 MS 2 0 6 0 5 0 0 242 242 165 217 273 0.502884496
1 73
472 378 MS 2 0 6 0 5 0 0 242 238 168 235 263 0.449055032
1 172
474 383 MS 2 0 6 0 5 0 0 244 251 171 217 245 0.380654536
1 205
476 388 MS 2 0 6 0 5 0 0 244 300 164 262 300 0.547060015
1 148
480 404 MS 2 0 6 0 5 0 0 248 259 172 250 287 0.383963448
1 19
482 409 MS 2 0 6 0 5 0 0 250 276 175 232 280 0.321937917
1 96
483 410 MS 2 0 6 0 5 0 0 250 300 178 232 300 0.276351918
1 16
484 411 MS 2 0 6 1 5 0 0 250 224 172 239 241 0.22498958
1 121
488 428 MS 2 0 6 0 5 0 0 252 283 178 257 287 0.28216261
1 37
489 429 MS 2 0 6 0 5 0 0 252 300 179 257 300 0.268844508
1 189
493 441 MS 2 0 6 0 5 0 0 256 300 176 262 300 0.319494881
1 150
494 444 MS 2 0 6 1 5 0 0 258 254 177 243 295 0.171631355
1 206
497 462 MS 2 0 6 1 5 0 0 269 300 179 268 300 0.156290072
1 107
865 203 MS 2 0 6 0 0 0 0 218 235 179 214 287 0.252974412
1 106
20 227 MS 2 0 7 0 2 1 0 193 184 170 215 225 0.334567535
1 234
21 244 MS 2 0 7 0 2 0 0 220 279 172 232 300 0.359512701
1 116
26 347 MS 2 0 7 0 2 0 0 244 232 172 239 296 0.361299462
1 209
88 16 MS 2 0 7 0 3 0 1 166 146 62 149 179 0.99975392
1 4
89 26 MS 2 0 7 0 3 0 1 162 146 173 173 160 0.399162281
1 115
95 167 MS 2 0 7 0 3 0 0 220 250 172 209 263 0.343155567
1 13
96 174 MS 2 0 7 1 3 0 1 198 204 166 215 258 0.400792712
1 75

207
98 213 MS 2 0 7 0 3 0 0 238 225 165 209 242 0.47066555
1 158
99 218 MS 2 0 7 1 3 0 0 227 221 157 201 239 0.448437822
1 226
100 223 MS 2 0 7 0 3 0 0 246 300 172 222 287 0.353009029
1 133
101 235 MS 2 0 7 0 3 0 1 202 201 175 187 232 0.38295054
1 202
105 338 MS 2 0 7 0 3 0 0 253 250 166 239 296 0.475698645
1 92
107 424 MS 2 0 7 1 3 0 0 260 279 174 232 280 0.188922963
1 191
108 442 MS 2 0 7 0 3 0 0 273 257 172 250 287 0.363534703
1 17
213 1 MS 2 0 7 0 4 0 1 167 169 174 178 201 0.391347398
1 125
216 24 MS 2 0 7 0 4 1 1 162 200 168 161 204 0.458902813
1 21
218 30 MS 2 0 7 0 4 0 1 212 180 168 176 175 0.500877232
1 152
219 33 MS 2 0 7 0 4 0 0 191 184 173 190 232 0.312661572
1 32
225 45 MS 2 0 7 1 4 1 1 162 141 157 215 222 0.525658895
1 165
237 112 MS 2 0 7 0 4 0 1 202 211 176 164 219 0.353109233
1 124
239 115 MS 2 0 7 0 4 0 0 232 200 167 215 239 0.433419007
1 61
240 116 MS 2 0 7 0 4 1 0 193 176 177 181 192 0.210010648
1 159
241 118 MS 2 0 7 0 4 0 1 201 208 175 204 250 0.393500824
1 99
243 126 MS 2 0 7 0 4 0 1 185 211 177 201 254 0.356333626
1 70
249 159 MS 2 0 7 0 4 0 0 189 184 179 200 204 0.219314904
1 108
255 232 MS 2 0 7 0 4 0 0 211 218 180 222 242 0.218004674
1 42
256 233 MS 2 0 7 0 4 0 1 240 243 178 232 263 0.351819205
1 129
264 274 MS 2 0 7 0 4 0 0 222 228 175 215 274 0.296188294
1 126
266 296 MS 2 0 7 0 4 0 0 234 225 165 212 258 0.475572291
1 30
272 429 MS 2 0 7 1 4 0 0 242 201 165 215 254 0.309989919
1 213
500 4 MS 2 0 7 0 5 0 1 152 169 176 164 225 0.35437618
1 52
502 65 MS 2 0 7 1 5 0 1 188 141 173 184 179 0.254072404
1 140
503 68 MS 2 0 7 0 5 0 1 205 228 170 195 246 0.48567252
1 43
507 133 MS 2 0 7 0 5 0 0 236 236 170 225 268 0.386748436
1 88
508 137 MS 2 0 7 0 5 0 0 214 204 176 206 250 0.27266551
1 39
509 145 MS 2 0 7 1 5 0 1 203 194 177 204 204 0.208139055
1 31
510 146 MS 2 0 7 1 5 0 0 224 232 178 222 258 0.140800163
1 151
513 160 MS 2 0 7 1 5 0 0 227 214 164 215 213 0.318799218
1 98
515 172 MS 2 0 7 0 5 0 0 220 250 177 228 268 0.267511914
1 46
516 173 MS 2 0 7 0 5 0 0 203 208 175 200 235 0.283723658
1 122
517 177 MS 2 0 7 0 5 0 0 222 252 178 215 280 0.25045319
1 235
518 178 MS 2 0 7 1 5 0 0 231 225 166 225 296 0.304965608
1 187
520 187 MS 2 0 7 0 5 0 0 227 262 154 209 287 0.68788374
1 195
521 191 MS 2 0 7 1 5 0 0 220 201 165 201 235 0.30140678
1 236
523 195 MS 2 0 7 0 5 0 0 217 218 163 222 258 0.519002031
1 162
525 200 MS 2 0 7 1 5 0 0 225 218 169 206 239 0.241641341
1 120
528 214 MS 2 0 7 0 5 0 1 273 228 175 228 239 0.400462724
1 64
532 224 MS 2 0 7 0 5 0 1 203 257 175 190 268 0.392006438
1 40
533 225 MS 2 0 7 1 5 0 1 234 208 160 218 254 0.517865886
1 14
535 234 MS 2 0 7 0 5 0 0 205 208 173 215 222 0.319501449
1 118
537 243 MS 2 0 7 1 5 0 0 234 252 178 212 274 0.14061002
1 62

208
538 245 MS 2 0 7 1 5 0 0 275 273 175 250 300 0.184243267
1 221
539 247 MS 2 0 7 0 5 0 0 231 228 176 218 263 0.278983076
1 28
541 254 MS 2 0 7 0 5 0 0 227 236 169 215 280 0.404312765
1 222
544 264 MS 2 0 7 0 5 0 0 255 286 176 228 300 0.289259203
1 166
546 278 MS 2 0 7 1 5 0 0 265 273 166 239 263 0.303359385
1 132
547 282 MS 2 0 7 0 5 0 0 240 300 175 201 296 0.295652588
1 155
551 293 MS 2 0 7 0 5 0 0 238 279 177 218 296 0.26937977
1 48
556 305 MS 2 0 7 0 5 0 0 250 232 171 212 258 0.361182562
1 143
557 306 MS 2 0 7 0 5 0 0 293 267 169 225 300 0.412727241
1 69
558 307 MS 2 0 7 0 5 0 0 238 286 173 218 300 0.336459378
1 135
560 311 MS 2 0 7 0 5 0 0 251 267 172 243 300 0.363664689
1 224
561 314 MS 2 0 7 0 5 0 0 240 262 174 222 239 0.308390048
1 238
562 315 MS 2 0 7 0 5 0 0 260 262 177 256 274 0.277688318
1 131
569 329 MS 2 0 7 0 5 0 0 238 252 165 232 263 0.484887651
1 207
572 333 MS 2 0 7 0 5 0 0 257 250 171 235 280 0.374652957
1 85
573 335 MS 2 0 7 0 5 0 0 300 257 172 250 280 0.362040023
1 113
575 340 MS 2 0 7 0 5 0 0 255 286 174 252 287 0.328656667
1 181
577 345 MS 2 0 7 0 5 0 0 250 236 173 209 246 0.322194124
1 3
578 350 MS 2 0 7 0 5 0 0 222 257 170 212 268 0.381719204
1 5
579 351 MS 2 0 7 1 5 0 0 242 221 165 228 268 0.317349686
1 101
581 353 MS 2 0 7 0 5 0 0 260 225 175 243 258 0.302692185
1 50
583 357 MS 2 0 7 0 5 0 0 278 267 175 250 263 0.306093561
1 201
585 365 MS 2 0 7 1 5 0 0 250 262 177 232 274 0.154623503
1 74
586 367 MS 2 0 7 0 5 0 0 246 243 177 190 250 0.252363992
1 123
587 368 MS 2 0 7 1 5 0 0 273 232 171 239 254 0.225592166
1 163
592 389 MS 2 0 7 1 5 0 0 253 262 176 243 250 0.164622409
1 208
594 393 MS 2 0 7 0 5 0 0 255 243 173 266 300 0.354200366
1 117
601 407 MS 2 0 7 1 5 0 0 255 286 174 239 280 0.190683078
1 231
602 419 MS 2 0 7 0 5 0 0 273 300 177 235 300 0.275622636
1 157
603 421 MS 2 0 7 0 5 0 0 255 262 176 243 300 0.294327593
1 144
605 425 MS 2 0 7 1 5 0 0 234 232 175 225 296 0.177638127
1 203
606 426 MS 2 0 7 1 5 0 0 281 300 171 243 287 0.232125451
1 169
607 427 MS 2 0 7 0 5 0 0 250 300 175 222 274 0.298579866
1 215
608 431 MS 2 0 7 1 5 0 0 231 236 171 261 258 0.23259742
1 173
611 435 MS 2 0 7 0 5 0 0 242 252 167 252 258 0.452675644
1 45
612 436 MS 2 0 7 1 5 0 0 278 243 175 261 258 0.18113647
1 147
613 444 MS 2 0 7 0 5 0 0 251 232 175 239 274 0.304433824
1 145
614 445 MS 2 0 7 1 5 0 0 265 250 174 256 300 0.197926047
1 153
615 446 MS 2 0 7 0 5 0 0 273 279 177 250 300 0.280546402
1 188
33 67 MS 2 0 8 0 2 0 1 224 234 155 216 266 0.748250898
1 217
37 112 MS 2 0 8 0 2 0 1 235 242 158 230 252 0.703295952
1 105
109 5 MS 2 0 8 0 3 0 1 200 223 172 171 206 0.406538522
1 65
110 28 MS 2 0 8 1 3 0 1 218 195 166 234 271 0.390220761
1 54
111 37 MS 2 0 8 1 3 1 0 201 188 154 201 156 0.424274481
1 83

209
112 51 MS 2 0 8 0 3 0 0 220 202 167 204 206 0.400428832
1 237
273 1 MS 2 0 8 0 4 1 1 168 161 173 174 182 0.344156428
1 95
281 12 MS 2 0 8 1 4 1 1 222 188 173 204 206 0.218028466
1 66
288 21 MS 2 0 8 0 4 0 0 203 227 178 179 203 0.211905147
1 225
295 31 MS 2 0 8 1 4 0 0 219 206 162 174 200 0.31687781
1 220
296 33 MS 2 0 8 0 4 1 0 197 209 166 207 206 0.37976144
1 90
300 39 MS 2 0 8 1 4 1 0 217 212 176 204 240 0.124002559
1 210
306 61 MS 2 0 8 0 4 1 0 219 223 176 201 215 0.217640539
1 160
310 75 MS 2 0 8 0 4 0 0 230 184 167 195 227 0.401553149
1 103
311 79 MS 2 0 8 1 4 0 0 224 192 161 195 233 0.348736475
1 86
317 106 MS 2 0 8 0 4 0 0 224 251 172 250 237 0.333247255
1 178
330 176 MS 2 0 8 0 4 0 0 257 238 168 242 300 0.417398898
1 1
617 8 MS 2 0 8 1 5 0 1 215 234 177 182 230 0.192253551
1 112
618 11 MS 2 0 8 0 5 0 1 195 157 167 184 206 0.509166085
1 23
619 17 MS 2 0 8 0 5 0 0 230 234 167 210 240 0.410363411
1 49
623 40 MS 2 0 8 0 5 0 0 220 219 167 200 240 0.406412848
1 142
625 45 MS 2 0 8 0 5 0 1 238 230 170 207 237 0.466720959
1 127
627 47 MS 2 0 8 0 5 0 0 225 270 172 219 252 0.325113858
1 55
628 48 MS 2 0 8 0 5 0 0 205 234 171 187 300 0.340825959
1 176
630 50 MS 2 0 8 0 5 0 0 232 270 177 219 244 0.243891162
1 223
632 55 MS 2 0 8 1 5 0 0 229 255 173 213 237 0.177064489
1 164
633 56 MS 2 0 8 0 5 0 0 233 300 172 216 300 0.333824439
1 219
635 59 MS 2 0 8 0 5 0 0 239 264 165 219 266 0.458533047
1 25
639 65 MS 2 0 8 0 5 0 0 220 223 170 204 252 0.354935714
1 72
640 68 MS 2 0 8 0 5 0 1 206 250 172 223 266 0.440816967
1 104
641 69 MS 2 0 8 0 5 0 0 215 270 171 219 278 0.348052166
1 119
642 72 MS 2 0 8 1 5 0 0 232 255 177 234 278 0.144411803
1 93
645 77 MS 2 0 8 1 5 0 0 236 230 170 250 271 0.230013272
1 137
646 78 MS 2 0 8 1 5 0 0 226 290 175 213 224 0.153702293
1 10
647 80 MS 2 0 8 0 5 0 0 213 195 174 213 224 0.284240383
1 58
651 85 MS 2 0 8 1 5 0 0 236 184 175 226 218 0.155757567
1 199
652 87 MS 2 0 8 0 5 0 0 229 276 172 213 252 0.322964935
1 193
653 88 MS 2 0 8 0 5 0 0 243 276 178 238 285 0.242087875
1 228
654 89 MS 2 0 8 1 5 0 0 218 192 171 200 227 0.196332659
1 81
656 92 MS 2 0 8 0 5 0 0 228 230 177 223 271 0.249742928
1 100
657 93 MS 2 0 8 0 5 0 0 222 238 178 242 244 0.236385991
1 76
658 96 MS 2 0 8 0 5 0 0 238 255 171 238 256 0.350494707
1 6
659 97 MS 2 0 8 1 5 0 0 228 264 173 216 261 0.181043966
1 156
661 99 MS 2 0 8 0 5 0 0 225 234 174 213 266 0.292198533
1 216
663 105 MS 2 0 8 1 5 0 0 235 242 146 238 293 0.664240414
1 167
664 107 MS 2 0 8 0 5 0 0 255 300 174 230 285 0.30166467
1 109
665 110 MS 2 0 8 1 5 0 0 228 223 175 223 244 0.158287027
1 27
667 116 MS 2 0 8 1 5 0 0 233 230 177 219 261 0.139511954
1 200
671 123 MS 2 0 8 0 5 0 0 233 264 176 226 271 0.265741455
1 24

210
672 124 MS 2 0 8 0 5 0 0 238 276 172 238 300 0.341871512
1 41
673 125 MS 2 0 8 0 5 1 0 230 300 174 256 300 0.278172688
1 197
674 126 MS 2 0 8 0 5 0 0 236 300 176 226 293 0.269725302
1 7
675 127 MS 2 0 8 1 5 0 0 251 202 173 242 237 0.184080111
1 174
677 129 MS 2 0 8 1 5 0 0 236 242 166 223 285 0.284044097
1 36
678 130 MS 2 0 8 1 5 0 0 241 270 167 238 244 0.265695378
1 136
680 134 MS 2 0 8 1 5 0 0 236 250 175 226 278 0.16318492
1 53
681 136 MS 2 0 8 0 5 0 0 243 264 167 226 300 0.430237717
1 77
682 137 MS 2 0 8 0 5 0 0 268 276 176 242 300 0.276200169
1 8
684 140 MS 2 0 8 0 5 0 0 244 300 175 242 300 0.292215537
1 35
685 141 MS 2 0 8 0 5 0 0 250 300 169 246 293 0.398402311
1 60
686 142 MS 2 0 8 0 5 0 0 257 300 175 223 300 0.285831721
1 218
687 143 MS 2 0 8 1 5 0 1 246 230 100 230 252 0.991219798
1 161
688 144 MS 2 0 8 1 5 0 0 232 276 171 213 266 0.205528013
1 230
689 145 MS 2 0 8 1 5 0 0 229 206 176 216 252 0.147565187
1 227
692 149 MS 2 0 8 0 5 0 0 272 250 179 234 300 0.229224851
1 89
694 151 MS 2 0 8 0 5 0 0 251 270 175 242 278 0.288030526
1 29
702 163 MS 2 0 8 0 5 0 0 246 255 177 250 278 0.259346152
1 146
703 164 MS 2 0 8 1 5 0 0 251 259 179 242 285 0.128190253
1 139
704 166 MS 2 0 8 0 5 0 0 257 290 158 234 300 0.608466174
1 94
707 173 MS 2 0 8 1 5 0 0 232 276 177 230 271 0.142812221
1 232
709 175 MS 2 0 8 1 5 0 0 235 238 176 242 227 0.150024997
1 204
710 177 MS 2 0 8 0 5 0 0 229 259 174 230 252 0.295282539
1 11
714 185 MS 2 0 8 0 5 0 0 250 276 179 238 293 0.229238077
1 15
715 186 MS 2 0 8 1 5 0 0 236 300 175 246 285 0.168604361
1 114
716 187 MS 2 0 8 0 5 0 1 239 300 178 223 285 0.333422945
1 47
719 191 MS 2 0 8 1 5 0 0 255 264 176 213 300 0.152594379
1 97
723 196 MS 2 0 8 0 5 0 0 244 300 175 230 293 0.286849431
1 79
725 199 MS 2 0 8 1 5 0 0 246 250 173 242 261 0.187432962
1 51
726 201 MS 2 0 8 1 5 0 0 243 276 178 242 278 0.136486918
1 82
727 203 MS 2 0 8 0 5 0 0 253 300 178 250 300 0.248283099
1 138
731 211 MS 2 0 8 0 5 0 0 263 300 177 280 300 0.272892724
1 87
732 213 MS 2 0 8 0 5 0 0 250 290 173 234 293 0.321538061
1 33
733 215 MS 2 0 8 1 5 0 0 239 270 173 230 261 0.184462878
1 186
734 216 MS 2 0 8 1 5 0 0 248 300 172 256 285 0.207021024
1 180
735 217 MS 2 0 8 0 5 0 0 251 283 176 250 300 0.278822884
1 57
738 221 MS 2 0 8 0 5 0 0 263 300 177 246 300 0.26200188
1 185
2 393 MS 3 1 6 0 1 0 0 246 238 108 239 253 0.98919924
1 161
49 188 MS 3 1 6 1 2 0 1 215 221 176 228 245 0.25104836
1 235
50 226 MS 3 1 6 0 2 0 0 221 259 176 208 300 0.3006108
1 236
51 314 MS 3 1 6 0 2 0 0 233 283 169 221 300 0.432429232
1 237
52 408 MS 3 1 6 1 2 0 0 250 259 167 228 295 0.307629413
1 238
53 448 MS 3 1 6 1 2 0 0 260 270 167 268 300 0.322741341
1 3
125 35 MS 3 1 6 0 3 0 1 181 209 167 166 229 0.550594455
1 1

211
126 58 MS 3 1 6 1 3 0 0 192 221 174 193 273 0.191551056
1 112
127 91 MS 3 1 6 0 3 1 0 198 181 157 200 215 0.596178769
1 162
128 121 MS 3 1 6 0 3 0 0 206 203 179 175 233 0.232105746
1 173
129 133 MS 3 1 6 0 3 1 1 208 170 177 224 186 0.331868342
1 184
130 174 MS 3 1 6 0 3 0 1 215 206 159 178 222 0.699760438
1 195
131 194 MS 3 1 6 1 3 0 0 217 206 176 228 241 0.172248739
1 206
132 211 MS 3 1 6 1 3 0 1 218 206 148 228 237 0.751070934
1 217
133 252 MS 3 1 6 1 3 0 0 225 221 170 200 241 0.241749783
1 228
134 253 MS 3 1 6 1 3 1 0 225 212 177 205 226 0.133483203
1 2
135 274 MS 3 1 6 0 3 0 0 228 300 161 217 280 0.582481383
1 13
136 313 MS 3 1 6 0 3 0 0 233 231 178 217 263 0.26476791
1 24
137 356 MS 3 1 6 0 3 0 0 240 238 176 196 273 0.291326258
1 35
138 366 MS 3 1 6 1 3 0 0 240 235 169 232 250 0.268208288
1 46
139 431 MS 3 1 6 0 3 0 0 254 238 177 221 245 0.278346783
1 57
338 5 MS 3 1 6 0 4 0 0 165 178 179 166 209 0.225596847
1 163
339 10 MS 3 1 6 1 4 1 0 168 194 172 181 202 0.176795427
1 164
340 11 MS 3 1 6 0 4 0 1 168 178 167 184 192 0.549420493
1 165
341 16 MS 3 1 6 0 4 0 0 170 174 175 193 182 0.289221248
1 166
342 19 MS 3 1 6 0 4 1 0 172 166 150 154 176 0.696252806
1 167
343 55 MS 3 1 6 0 4 1 1 192 191 174 184 202 0.37422114
1 168
344 100 MS 3 1 6 0 4 0 0 203 200 179 178 226 0.231827771
1 169
345 131 MS 3 1 6 0 4 0 1 208 206 171 208 273 0.499356277
1 170
346 142 MS 3 1 6 0 4 1 0 210 178 173 175 229 0.289413158
1 171
347 157 MS 3 1 6 0 4 0 0 213 203 167 202 253 0.452903963
1 172
348 189 MS 3 1 6 1 4 0 0 217 221 175 193 300 0.183357253
1 174
349 199 MS 3 1 6 1 4 0 0 218 215 150 202 253 0.609703401
1 175
350 206 MS 3 1 6 0 4 0 0 218 201 165 217 287 0.506117049
1 176
351 213 MS 3 1 6 0 4 0 1 219 238 179 172 263 0.331678154
1 177
352 236 MS 3 1 6 0 4 0 0 222 218 173 193 258 0.338163606
1 178
353 242 MS 3 1 6 0 4 1 0 224 224 175 200 215 0.263516438
1 179
354 296 MS 3 1 6 1 4 0 0 230 242 174 257 268 0.207521027
1 180
739 15 MS 3 1 6 0 5 0 1 170 201 173 190 268 0.451624875
1 17
740 47 MS 3 1 6 0 5 0 1 186 224 174 184 268 0.42980188
1 18
741 83 MS 3 1 6 0 5 0 1 196 194 172 214 229 0.471992733
1 19
742 110 MS 3 1 6 1 5 0 1 204 212 170 200 215 0.333126993
1 20
743 122 MS 3 1 6 0 5 0 0 206 221 166 178 245 0.460871284
1 21
744 148 MS 3 1 6 0 5 0 1 210 231 172 202 241 0.469865563
1 22
745 156 MS 3 1 6 0 5 0 1 213 209 169 200 250 0.530109016
1 23
746 166 MS 3 1 6 0 5 0 1 213 228 173 221 273 0.465355503
1 25
747 173 MS 3 1 6 0 5 0 0 214 264 172 235 273 0.37514262
1 26
748 197 MS 3 1 6 1 5 0 0 218 201 176 193 200 0.159108962
1 27
749 201 MS 3 1 6 0 5 0 0 218 251 177 208 273 0.279272924
1 28
750 249 MS 3 1 6 0 5 0 0 224 264 177 239 268 0.288639593
1 29
751 266 MS 3 1 6 0 5 0 1 227 218 172 211 253 0.476296809
1 30

212
752 270 MS 3 1 6 1 5 0 0 227 206 173 232 237 0.209042936
1 31
753 275 MS 3 1 6 0 5 0 0 228 228 176 268 253 0.312234041
1 32
754 315 MS 3 1 6 0 5 0 0 233 300 175 224 295 0.322106889
1 33
755 322 MS 3 1 6 1 5 0 1 233 212 167 252 263 0.418608057
1 34
756 327 MS 3 1 6 1 5 0 0 235 209 168 239 233 0.28307743
1 36
757 332 MS 3 1 6 1 5 0 0 236 215 168 211 280 0.282596429
1 37
758 334 MS 3 1 6 0 5 0 0 236 276 167 217 300 0.469785583
1 38
759 339 MS 3 1 6 0 5 0 0 236 251 178 239 263 0.271829582
1 39
760 345 MS 3 1 6 0 5 0 0 238 231 170 214 253 0.399980594
1 40
761 346 MS 3 1 6 0 5 0 0 238 231 165 217 287 0.506117049
1 41
762 350 MS 3 1 6 1 5 0 0 238 254 173 232 300 0.218827347
1 42
763 359 MS 3 1 6 0 5 1 1 240 238 158 217 233 0.695995347
1 43
764 367 MS 3 1 6 1 5 0 0 240 242 171 232 253 0.238950275
1 44
765 368 MS 3 1 6 1 5 0 0 240 254 158 232 250 0.46565911
1 45
766 371 MS 3 1 6 0 5 0 0 240 251 174 235 268 0.337978076
1 47
767 380 MS 3 1 6 1 5 0 0 242 201 169 235 250 0.269172175
1 48
768 384 MS 3 1 6 0 5 0 1 244 238 174 228 258 0.445232977
1 49
769 392 MS 3 1 6 1 5 0 0 246 228 167 232 258 0.301774815
1 50
770 396 MS 3 1 6 1 5 0 0 246 276 176 262 295 0.187810398
1 51
771 414 MS 3 1 6 0 5 0 0 250 259 173 243 280 0.361372614
1 52
772 415 MS 3 1 6 1 5 0 0 250 300 178 250 295 0.162274033
1 53
773 419 MS 3 1 6 0 5 0 0 252 228 171 224 280 0.391027118
1 54
774 421 MS 3 1 6 1 5 0 0 252 242 166 228 300 0.325663175
1 55
775 423 MS 3 1 6 1 5 0 0 252 270 174 232 287 0.203710676
1 56
776 426 MS 3 1 6 0 5 0 0 252 231 177 239 245 0.284297233
1 58
777 438 MS 3 1 6 1 5 0 0 256 300 173 232 300 0.218827347
1 59
778 447 MS 3 1 6 0 5 0 0 260 300 170 252 295 0.424429159
1 60
779 457 MS 3 1 6 0 5 0 0 266 238 168 252 300 0.464431003
1 61
54 110 MS 3 1 7 1 2 0 1 203 194 76 192 200 0.998632433
1 4
55 153 MS 3 1 7 0 2 0 0 236 252 166 204 263 0.453883326
1 5
56 161 MS 3 1 7 0 2 0 1 219 300 178 218 300 0.354396675
1 6
57 310 MS 3 1 7 0 2 0 0 251 286 177 215 300 0.269141549
1 7
58 372 MS 3 1 7 0 2 0 0 250 267 177 239 300 0.276930395
1 8
59 414 MS 3 1 7 0 2 0 0 246 236 168 250 274 0.436077107
1 9
140 11 MS 3 1 7 0 3 1 1 166 173 171 161 175 0.394658967
1 68
141 70 MS 3 1 7 0 3 1 0 184 214 173 215 242 0.287384833
1 79
142 150 MS 3 1 7 0 3 0 0 211 262 167 212 268 0.438799856
1 90
143 197 MS 3 1 7 1 3 0 1 234 236 170 206 219 0.316940779
1 101
144 280 MS 3 1 7 0 3 0 1 231 267 177 222 280 0.369826749
1 113
145 290 MS 3 1 7 1 3 0 1 265 267 169 235 296 0.361101928
1 124
146 320 MS 3 1 7 0 3 0 1 265 279 174 232 268 0.427644124
1 135
147 366 MS 3 1 7 0 3 0 0 215 225 177 215 250 0.26015452
1 146
148 450 MS 3 1 7 1 3 0 0 265 267 175 261 263 0.181822497
1 156
149 453 MS 3 1 7 1 3 0 0 290 300 169 272 300 0.273002932
1 157

213
355 2 MS 3 1 7 1 4 1 1 184 136 166 176 192 0.332383647
1 181
356 7 MS 3 1 7 0 4 1 1 153 129 176 158 175 0.304410883
1 182
357 19 MS 3 1 7 0 4 0 1 162 141 172 173 168 0.419987081
1 183
358 48 MS 3 1 7 0 4 1 1 157 156 179 173 182 0.262771813
1 185
359 55 MS 3 1 7 1 4 1 0 201 201 171 215 201 0.183607353
1 186
360 63 MS 3 1 7 1 4 1 1 169 146 168 181 213 0.304209207
1 187
361 69 MS 3 1 7 0 4 0 0 184 165 174 164 200 0.281199981
1 188
362 72 MS 3 1 7 0 4 1 0 171 191 173 167 222 0.26794405
1 189
363 75 MS 3 1 7 0 4 0 1 180 169 167 167 213 0.525635782
1 190
364 77 MS 3 1 7 1 4 0 1 181 169 178 192 185 0.189679867
1 191
365 78 MS 3 1 7 0 4 1 0 157 169 159 190 185 0.525160909
1 192
366 82 MS 3 1 7 0 4 1 1 185 180 175 170 164 0.323402593
1 193
367 97 MS 3 1 7 0 4 0 0 188 165 163 184 164 0.481779427
1 194
368 99 MS 3 1 7 0 4 0 0 177 180 169 181 185 0.370314116
1 196
369 108 MS 3 1 7 0 4 0 0 202 165 175 204 200 0.278512307
1 197
370 124 MS 3 1 7 0 4 1 0 217 228 167 212 268 0.397339497
1 198
371 144 MS 3 1 7 1 4 0 0 214 240 176 215 222 0.155004705
1 199
372 168 MS 3 1 7 1 4 0 0 234 243 177 184 232 0.139906233
1 200
373 170 MS 3 1 7 1 4 0 0 224 176 165 206 250 0.306065756
1 201
374 182 MS 3 1 7 0 4 1 1 225 191 174 252 229 0.385724838
1 202
375 230 MS 3 1 7 1 4 0 0 242 252 175 235 274 0.177059015
1 203
376 240 MS 3 1 7 1 4 0 0 211 200 177 218 254 0.149293372
1 204
377 256 MS 3 1 7 0 4 0 0 184 228 168 200 254 0.411606506
1 205
378 313 MS 3 1 7 0 4 0 0 238 194 164 228 258 0.501778601
1 207
379 346 MS 3 1 7 1 4 0 0 220 240 176 228 280 0.165060612
1 208
380 400 MS 3 1 7 0 4 0 0 267 257 170 239 232 0.38429418
1 209
780 106 MS 3 1 7 1 5 0 0 205 211 177 195 216 0.140292678
1 62
781 134 MS 3 1 7 0 5 0 1 219 252 162 218 287 0.65657794
1 63
782 154 MS 3 1 7 0 5 0 0 203 204 168 206 274 0.418473236
1 64
783 163 MS 3 1 7 0 5 0 0 188 201 166 201 232 0.445583524
1 65
784 169 MS 3 1 7 1 5 0 0 224 194 171 212 250 0.217343822
1 66
785 184 MS 3 1 7 0 5 0 1 222 243 169 204 250 0.509955253
1 67
786 186 MS 3 1 7 0 5 0 0 217 232 168 212 242 0.413675736
1 69
787 189 MS 3 1 7 0 5 0 0 208 194 169 215 258 0.399428331
1 70
788 198 MS 3 1 7 0 5 0 0 211 204 172 225 250 0.346353011
1 71
789 208 MS 3 1 7 0 5 0 1 227 214 177 206 242 0.355666849
1 72
790 229 MS 3 1 7 0 5 0 1 242 257 162 206 254 0.645193741
1 73
791 238 MS 3 1 7 1 5 0 0 253 214 176 209 225 0.154084885
1 74
792 239 MS 3 1 7 0 5 0 0 231 236 168 206 280 0.419822504
1 75
793 242 MS 3 1 7 1 5 0 0 240 232 170 222 263 0.236112352
1 76
794 255 MS 3 1 7 0 5 0 0 238 262 168 225 300 0.431934848
1 77
795 258 MS 3 1 7 0 5 0 0 242 250 148 222 258 0.778536996
1 78
796 269 MS 3 1 7 0 5 0 0 229 208 174 232 239 0.311888423
1 80
797 279 MS 3 1 7 0 5 1 0 214 267 180 222 280 0.195798821
1 81

214
798 302 MS 3 1 7 1 5 0 0 225 240 178 195 250 0.134680011
1 82
799 316 MS 3 1 7 0 5 0 0 224 211 158 235 287 0.626631572
1 83
800 325 MS 3 1 7 1 5 0 0 273 240 163 243 280 0.360571297
1 84
801 339 MS 3 1 7 0 5 0 0 234 262 171 239 296 0.379660972
1 85
802 354 MS 3 1 7 0 5 0 0 231 257 172 232 296 0.358662399
1 86
803 355 MS 3 1 7 0 5 0 0 267 273 177 228 296 0.272610044
1 87
804 361 MS 3 1 7 0 5 0 0 246 279 166 225 300 0.47091308
1 88
805 363 MS 3 1 7 1 5 0 0 238 250 171 239 280 0.229815272
1 89
806 370 MS 3 1 7 1 5 0 0 281 252 170 256 246 0.243382986
1 91
807 373 MS 3 1 7 0 5 0 0 278 273 166 256 274 0.477563696
1 92
808 381 MS 3 1 7 1 5 0 0 246 262 178 228 274 0.143801233
1 93
809 386 MS 3 1 7 0 5 0 0 257 273 151 232 300 0.745751995
1 94
810 397 MS 3 1 7 0 5 0 0 234 262 172 225 246 0.345517043
1 95
811 402 MS 3 1 7 0 5 0 0 257 267 174 225 300 0.321604518
1 96
812 408 MS 3 1 7 1 5 0 0 275 279 178 252 300 0.151766578
1 97
813 412 MS 3 1 7 0 5 0 0 255 252 174 215 300 0.318047532
1 98
814 416 MS 3 1 7 0 5 0 0 244 267 170 250 268 0.396487414
1 99
815 430 MS 3 1 7 1 5 0 0 278 252 170 266 268 0.250199415
1 100
816 434 MS 3 1 7 0 5 0 0 278 262 166 272 296 0.489170979
1 102
817 439 MS 3 1 7 1 5 0 0 275 252 160 239 300 0.419523594
1 103
818 443 MS 3 1 7 1 5 0 0 281 279 157 256 296 0.483904654
1 104
819 451 MS 3 1 7 1 5 0 0 300 252 141 256 287 0.766229286
1 105
60 385 MS 3 1 8 1 2 0 0 243 290 176 230 285 0.15440598
1 10
61 387 MS 3 1 8 0 2 0 0 230 238 174 223 261 0.294631028
1 11
62 389 MS 3 1 8 1 2 1 0 238 300 163 242 300 0.30706597
1 12
63 399 MS 3 1 8 0 2 0 0 244 290 162 230 256 0.519670674
1 14
64 417 MS 3 1 8 0 2 0 0 263 300 180 280 300 0.228602608
1 15
65 422 MS 3 1 8 0 2 0 0 250 300 176 238 293 0.273607642
1 16
150 375 MS 3 1 8 0 3 0 0 241 259 162 246 293 0.534709325
1 158
151 381 MS 3 1 8 0 3 1 0 228 223 177 201 250 0.209841293
1 159
152 386 MS 3 1 8 1 3 0 0 251 238 170 216 252 0.21731537
1 160
381 347 MS 3 1 8 1 4 1 1 180 129 180 147 164 0.123426312
1 210
382 349 MS 3 1 8 0 4 0 1 195 129 173 176 200 0.388314889
1 211
383 350 MS 3 1 8 0 4 1 1 156 165 171 150 161 0.366796682
1 212
384 351 MS 3 1 8 0 4 0 1 175 181 177 159 200 0.310632806
1 213
385 352 MS 3 1 8 0 4 0 1 165 129 143 193 233 0.877192619
1 214
386 353 MS 3 1 8 0 4 0 1 185 177 178 174 194 0.29798352
1 215
387 354 MS 3 1 8 1 4 0 1 191 173 169 150 203 0.292604611
1 216
388 355 MS 3 1 8 0 4 1 0 205 209 171 187 212 0.286707942
1 218
389 356 MS 3 1 8 0 4 0 0 205 219 164 210 237 0.467791906
1 219
390 358 MS 3 1 8 0 4 1 0 199 223 170 210 244 0.317448887
1 220
391 360 MS 3 1 8 1 4 0 0 213 181 172 200 227 0.184204666
1 221
392 361 MS 3 1 8 0 4 0 0 203 209 166 195 185 0.411189395
1 222
393 362 MS 3 1 8 0 4 1 0 209 216 175 213 266 0.243423672
1 223

215
394 365 MS 3 1 8 0 4 0 0 224 177 169 213 224 0.37055918
1 224
395 368 MS 3 1 8 1 4 0 0 224 209 170 226 194 0.21105106
1 225
396 369 MS 3 1 8 1 4 0 0 236 255 155 210 221 0.465378395
1 226
397 370 MS 3 1 8 1 4 0 0 233 212 176 207 261 0.146761551
1 227
398 373 MS 3 1 8 1 4 1 0 229 206 170 201 233 0.183324276
1 229
399 374 MS 3 1 8 0 4 0 0 207 250 179 174 261 0.206390116
1 230
400 376 MS 3 1 8 1 4 0 0 236 270 173 234 293 0.189955258
1 231
401 378 MS 3 1 8 1 4 0 0 230 216 176 219 203 0.142560897
1 232
402 398 MS 3 1 8 0 4 0 0 233 238 168 226 227 0.394830997
1 233
403 407 MS 3 1 8 0 4 0 0 224 264 172 242 300 0.343344615
1 234
820 348 MS 3 1 8 0 5 0 1 170 165 180 153 161 0.253653753
1 106
821 357 MS 3 1 8 1 5 0 0 218 219 175 216 244 0.156768023
1 107
822 359 MS 3 1 8 0 5 0 0 213 227 179 207 285 0.219138011
1 108
823 363 MS 3 1 8 0 5 0 0 230 238 173 201 250 0.30145281
1 109
824 364 MS 3 1 8 0 5 0 1 228 264 170 210 250 0.470932754
1 110
825 366 MS 3 1 8 0 5 0 1 218 219 173 213 240 0.411696937
1 111
826 367 MS 3 1 8 1 5 0 0 238 234 174 219 244 0.168145413
1 114
827 371 MS 3 1 8 0 5 0 0 235 300 164 210 252 0.471242761
1 115
828 372 MS 3 1 8 0 5 0 0 222 202 167 226 244 0.417606542
1 116
829 377 MS 3 1 8 0 5 0 0 230 290 171 238 300 0.359801883
1 117
830 379 MS 3 1 8 0 5 0 0 230 259 173 226 278 0.315690403
1 118
831 380 MS 3 1 8 0 5 0 0 218 250 158 242 300 0.611578072
1 119
832 382 MS 3 1 8 1 5 0 0 233 255 168 201 261 0.242299798
1 120
833 383 MS 3 1 8 1 5 0 0 222 259 170 230 278 0.225399477
1 121
834 384 MS 3 1 8 1 5 0 0 230 242 166 234 261 0.283194493
1 122
835 388 MS 3 1 8 1 5 0 0 220 300 168 219 293 0.253293666
1 123
836 390 MS 3 1 8 0 5 0 0 253 300 169 234 300 0.395253392
1 125
837 391 MS 3 1 8 0 5 0 0 228 300 174 216 285 0.296864221
1 126
838 392 MS 3 1 8 1 5 0 0 236 227 150 226 252 0.576834652
1 127
839 393 MS 3 1 8 0 5 0 0 259 250 166 234 278 0.447845433
1 128
840 394 MS 3 1 8 0 5 0 0 233 300 171 242 293 0.359819126
1 129
841 395 MS 3 1 8 0 5 0 0 226 300 175 226 285 0.284008331
1 130
842 396 MS 3 1 8 0 5 0 0 243 300 176 261 271 0.277056848
1 131
843 397 MS 3 1 8 0 5 0 0 261 300 174 226 300 0.303207789
1 132
844 400 MS 3 1 8 0 5 0 1 225 270 177 238 300 0.359940824
1 133
845 401 MS 3 1 8 1 5 0 0 251 300 160 226 250 0.382378353
1 134
846 402 MS 3 1 8 1 5 0 0 244 300 168 250 300 0.264255237
1 136
847 403 MS 3 1 8 0 5 0 0 250 290 179 238 300 0.23038248
1 137
848 404 MS 3 1 8 1 5 0 0 246 300 168 210 285 0.249135572
1 138
849 405 MS 3 1 8 1 5 0 0 246 283 178 216 240 0.12759497
1 139
850 406 MS 3 1 8 0 5 0 0 238 290 178 267 300 0.253507341
1 140
851 408 MS 3 1 8 0 5 0 0 238 300 167 230 271 0.425281976
1 141
852 409 MS 3 1 8 0 5 0 0 239 242 168 246 256 0.409130473
1 142
853 410 MS 3 1 8 0 5 0 0 248 283 170 256 300 0.385077707
1 143

216
0.0840 0.2780 0.0420 0.0000 0.0420 0.2059 0.4052 0.0084 0.0000 0.0084 R Console Page 4
> match.data=match.data(m2.out) > write.table(match.data, file="C:/data3-2.csv", sep=",",col.names=NA)
>
854 411 MS 3 1 8 0 5 0 0 241 300 175 250 300 0.294928362
1 144
855 412 MS 3 1 8 1 5 0 0 246 255 166 273 300 0.30388242
1 145
856 413 MS 3 1 8 1 5 0 0 230 242 174 242 300 0.181013597
1 147
857 414 MS 3 1 8 0 5 0 0 251 276 156 242 300 0.648267526
1 148
858 415 MS 3 1 8 1 5 0 0 275 300 168 261 300 0.267767029
1 149
859 416 MS 3 1 8 0 5 0 0 250 290 174 267 300 0.317555483
1 150
860 418 MS 3 1 8 1 5 0 0 257 300 178 261 278 0.140189992
1 151
861 419 MS 3 1 8 1 5 0 0 257 300 151 256 293 0.578830826
1 152
862 420 MS 3 1 8 1 5 0 0 236 255 172 242 252 0.198396097
1 153
863 421 MS 3 1 8 1 5 0 0 266 276 176 242 271 0.155281509
1 154
864 423 MS 3 1 8 0 5 0 0 257 300 175 256 293 0.29562444
1 155