
THE INDIRECT ACTION OF EXTERNAL FACTORS ON ...
132
THE INDIRECT ACTION OFEXTERNAL FACTORS ON PHOTOSYNTHESIS PROEFSCHRIFT TER VERKRIJGING VAN DEN GRAAD VAN DOCTOR IN DE WIS- EN NATUURKUNDE AAN DE RIJKSUNIVERSITEIT TE UTRECHT, OP GEZAG VAN DEN RECTOR-MAGNIFICUS, Dr. L. S. ORNSTEIN, HOOGLEERAAR IN DE FACULTEIT DER WIS- EN NATUURKUNDE, VOLGENS BESLUIT VAN DEN SENAAT DER UNIVERSITEIT TE VERDEDIGEN TEGEN DE BEDENKINGEN VAN DE FACULTEIT DER WIS- EN NATUURKUNDE OP MAANDAG 30 MEI 1932, DES NAMIDDAGS TE 4 UUR DOOR FRANS VAN DER PAAUW GEBOREN TE AMSTERDAM AMSTERDAM N.V.Drukkerij ="Uitgeverij MCMXXXII J. H- DE BUooY
-
Upload
khangminh22 -
Category
Documents
-
view
1 -
download
0
Transcript of THE INDIRECT ACTION OF EXTERNAL FACTORS ON ...

THE INDIRECT ACTION OF EXTERNAL FACTORS ON PHOTOSYNTHESIS
PROEFSCHRIFT TER VERKRIJGING VAN DEN GRAAD VAN DOCTOR IN DE WIS- EN NATUURKUNDE AAN DE RIJKSUNIVERSITEIT TE UTRECHT, OP GEZAG VAN DEN RECTOR-MAGNIFICUS, Dr. L. S. ORNSTEIN, HOOGLEERAAR IN DE FACULTEIT DER WIS- EN NATUURKUNDE, VOLGENS BESLUIT VAN DEN SENAAT DER UNIVERSITEIT TE VERDEDIGEN TEGEN DE BEDENKINGEN VAN DE FACULTEIT DER
WIS- EN NATUURKUNDE OP MAANDAG 30 MEI 1932, DES NAMIDDAGS TE 4 UUR
DOOR
FRANS VAN DER PAAUW GEBOREN TE AMSTERDAM
A M S T E R D A M N.V.Drukkerij =" Uitgeverij M C M X X X I I J. H- DE B U o o Y

2^^
AAN MIJN OUDERS

Nu het einde van mijn studietijd is aangebroken, is het mij een behoefte dank te peggen aan allen, die aan mijn wetenschappelijke vorming hebben meegewerkt.
Hooggeleerde Van Romburgh, Nierstrasz, Kruyt en Moll, zeer erkentelijk ben ik U voor de leiding, welke Gij mij gegeven hebt in mijn eerste studiejaren.
Hooggeleerde Jordan, het onder Uw leiding in aanraking komen met de dierlijke physiologie is voor mij van blijvende waarde geweest. Uw colleges, vooral het college over de theoretische grondslagen van de biologie, heb ik met groote belangstelling gevolgd.
Hooggeleerde Wester dijk, het verheugt mij, dat een diepere beschouwing van het ziekteprobleem niet aan mijn opleiding ontbroken heeft. Voor het vele dat ik op Uw laboratorium en Uw excursies geleerd heb, dank ik U zeer.
Hooggeleerde Pulle, U wekte mijn belangstelling voor de plantengeographie en de systematiek. Van Uw colleges en de excursies onder Uw leiding, heb ik een zeer aangename herinnering behouden.
Hooggeleerde Went, Hooggeachte Promotor, in groote mate gaan mijn gevoelens van dank naar U uit. Gij zijt het in de eerste plaats, die mij geleerd hebt zelfstandig te werken. Uw diep geworteld geloof in de beteekenis van de natuurwetenschap was mij steeds tot steun in tijden van tegenslag. Dat Gij mij toestond dit proefschrift buiten Uw laboratorium, te bewerken, heb ik opgevat als een groot blijk van vertrouwen. Ik ben U zeer erkentelijk voor de warme belangstelling, die U voor mijn werk bleef koesteren; na een bespreking met U was ik steeds met nieuwen moed bezield.
Hooggeleerde Van I terson, zonder Uw medewerking Zou de bewerking van dit proefschrift niet mogelijk geweest zijn. Ik ben U zeer dankbaar voor de onbekrompen wijze, waarop U mij in de gelegenheid hebt gesteld mijn

werk in Uw laboratorium uit te voeren. Voor Uw belangstelling en het vele, dat ik als Uw assistent van U heb geleerd, betuig ik U mijn hartelijken dank.
Waarde Van den Honert , ik ben niet vergeten, dat Gij, hoewel Uw tijd zeer beperkt was, nog gelegenheid wist te vinden om mij met de moeilijkheden van Uw apparaat bekend te maken. Hoewel ik in enkele opzichten tot een andere opvatting ben gekomen, vermindert dit niet de beteekenis, welke Uw werk voor mij heeft gehad.
Den Heer Kiers zeg ik dank voor de moeite aan de vertaling van dit proefschrift gegeven.
U, Waarde De Bouter, dank ik voor de met zorg uitgevoerde teekeningen.
Het personeel van het Laboratorium voor Technische Botanie te Delft wensch ik te bedanken voor de hulp mij bij mijn werk verleend, in het bijzonder ben ik U, Waarde Van Kampen, veel verplicht voor Uw kundige technische hulp. Ook het personeel van het Botanisch Laboratorium te Utrecht wensch ik mijn dank te betuigen voor de hulp, mij vroeger verleend.

Extrait du Recueil des Travaux botaniques néerlandais, Vol. XXIX {1932).
THE INDIRECT ACTION OF EXTERNAL FACTORS ON PHOTOSYNTHESIS
by
F. VAN DER PAAUW.
Contents. Chapter Page
I. INTRODUCTION . . . . . . . . . . . . . . . . . . . . . . . . . . . . . 500 A. Blackmail's Formula of Limiting Factors 500 B. Do the External Factors Act Directly on
the Photosynthetic Process, or Do Internal Protoplasmic Processes Interact? . . . . . . . 502
II. EXPERIMENTAL METHOD . . . . . . . . . . . . . . . . . . . . 509 A. Material . . . . . . . . . . . . . . . . . . . . . . . . . . . . 509 B. The Apparatus of Van den Honert Used
in my First Experiments . . . . . . . . . . . . . 511 C. The Apparatus Used in my Further Expe
riments.. . . . . . . . . . . . . . . . . . . . . . . . . . . . . 512 1. Description of the apparatus . . . . . . . 512 2. Fixation of the algal film on the glass
Lover • • •••+••*•*••*••••••••*••••* 3. The regulation of temperature. . . . . . 515 4. The regulation of COa concentratipn 516 5. Illumination . . . . . . . . . . . . . . . . . . . . . . 516
D. Course of an Experiment and Corrections 518-III . THE RESPIRATION DURING THE ASSIMILATION 522
A. I n t r o d u c t i o n . . . . . . . . . . . . . . . . . . . . . . . . . 522 B. Experiments . . . . . . . . . . . . . . . . . . . . . . . . . 524
IV. THE ASSIMILATORY QUOTIENT . . . . . . . . . . . . . . . 532 V. THE INFLUENCE OF CARBON DIOXIDE CONCEN
TRATION ON ASSIMILATION . . . . . . . . . . . . . . . . 534 32
514

H 498
Chapter Page A. The C0 2 Concentration-Assimilation
L * U r v C • + + + • • + «.• + ,.*. + + + + + + • • + + + + + + + * • • J J T
B. The Influence of Carbon Dioxide Concentration when the Assimilation has been Retarded by N a r c o t i c s . . . . . . . . . . . . . . . . 536
C. The Influence of Temperature on the C02 Concentration-Assimilation Curve when Phenylurethane has been Added 540
VI. THE INFLUENCE OF LIGHT INTENSITY ON ASSI
M I L A T I O N . . . . . . . . . . . . . . . . . . . . . . . . . . . 541 A. I n t r o d u c t i o n . . . . . . . . . . . . . . . . . . . . . . . . . 541 B. Experiments on the Influence of Light'
Intensity on the Assimilation of Hormi-dium Cultivated in Day l igh t . . . . . . . . . . . 543
C. Experiments on the Influence of Light Intensity on the Assimilation of Hormi-dium Cultivated in Weak Artificial Light 544
D. The Influence of Light Intensity on Assimilation at Different Temperatures.... 546
VII. THE INFLUENCE OF TEMPERATURE ON ASSIMIL
ATION AND RESPIRATION . . . . . . . . . . . . . . . . . . 550 A. Introduction .. . . . . . . . . . . . . . . . . . . . 550 B. The Influence of Temperature on Assi
milation . . . . . . . . . . . . . . . . . . . . . . . . . . . . . 555 C. The Influence of Temperature on Respir
ation . . . . . . . . . . . . . . . . . . . . . . . . . . . . . . . 560' VIII. THE INFLUENCE OF POTASSIUM CYANIDE ON ASSI
MILATION AND RESPIRATION . . . . . . . . . . . . . . . 564 A. Introduction . . . . . . . . . . . . . . . . . . . . . 564 B. Experiments with Low Concentrations of
KCN, Showing a Stimulating Influence 565 C. Experiments with Higher Concentrations
of KCN, Showing a Retarding Influence 570-D. Experiments, Showing a Complete Inhi-
gg

499
Chapter Page bition of Assimilation after the Addition of KCN 574
E. Discussion of the Experimental Results 576 IX. THE INFLUENCE OF PHENYLURETHANE ON ASSI
MILATION AND RESPIRATION . . . . . . . . . . . . . . . 578 X. THE INFLUENCE OF GLUCOSE AND FRUCTOSE ON
ASSIMILATION AND RESPIRATION . . . . . . . . . . . 585 XL THE INFLUENCE OF BaCl2 ON ASSIMILATION AND
RESPIRATION . . . . . . . . . . . . . . . . . . . . . . . . . . . . 590 XII. THE TIME,COURSE OF PHOTOSYNTHESIS... . . . 593
A. The Induction-Time of Photosynthesis 593 1. I n t r o d u c t i o n . . . . . . . . . . . . . . . . . . . . . . 593 2. Experiments on the Induction of Pho
tosynthesis at Different Temperatures 595 B. The Course of Photosynthesis after a
Long Period of Darkness . . . . . . . . . . . . . 599 XIII. DISCUSSION . . . . . . . . . . . . . . . . . . . . . . . . . . . . . . . 601
A. The Assimilation Reacts to the Addition of Uncommon Substances in the Same Way under Different Condit ions. . . . . . . 601
B. The Dependence of Photosynthesis of Internal Factors . . . . . . . . . . . . . . . . . . . . . 602
C. The Explanation of the Parallelism of Respiration and Photosynthesis . . . . . . . . 607
D. The Reaction of Photosynthesis to Injurious Influences . . . . . . . . . . . . . . . . . . .( , 610
E. An Attempt to Explain the too Large Deviations of Some Determinations on the Influence of Temperature on Photosynthesis from the Average, and a Few Remarks on Optimum C u r v e s . . . . . . . . . 612
F. Blackman's Rule of Limiting Factors.. 615 Summary of the Principal Results . . . . . . . . . . 616 Literature . . . . . . . . . . . . . . . . . . . . . . . . . . . . . . . . 618

500
CHAPTER I.
Introduction. In this chapter a full discussion of the literature will
not be aimed at. Very extensive surveys are a.o. to be found in the monographs of Stiles and Spoehr; I also refer to the short review of literature of van den Honert . In this place only that which pertains to the problem of this paper will be discussed.
A. Blackman's Formula of Limiting Factors. In the year 1905 Blackman stated in his well-known
paper: „When a process is conditioned as to its rapidity by a number of separate factors, the rate of the process is limited by the pace of the „slowest" factor." In Blackman's opinion the relation between an external factor and the rate of photosynthesis can be represented by a straight curve with a sharp break.
This statement is founded on experiments of Miss Mat thaei (1904), and is further supported by experiments of Blackman and Mat thaei (1905), and of Blackman and Smith (1911).
The accuracy of these experiments was of such a nature that a possibility of other interpretation remained (criticism of Brown and Heise (1917, 18). Experimental attacks on the theory of limiting factors came from the part of many investigators. Especially the paper of Harder (1921), which was altogether devoted to this question, is of importance. He stated that in case of low „concentration" of one factor, an increase in the concentration of the other (non-limiting) factor, will cause an acceleration of the process. According to Harder the relationship between photosynthesis and the external factors can be expressed by a smooth curve. • A theoretical paper against the theory was published by Romell (1926).
as a A

501
So, the problem seemed to be settled against Blackman's formulation, were it not that van den Honer t (1928, 30) seemed to have confirmed this theory experimentally, in very accurate experiments on the influence of the C02
factor, made with films of the filamentous alga Hormidium flaccidum. The relation between C02 concentration and assimilation, represented in a graph, shows a straight curve with a sharp break, resembling the scheme proposed by Blackman.
It must also be mentioned that Boysen Jensen and Müller (1929) discovered a Blackman curve for the action of light on shade plants of Marchantia polymorpha. The number of points, determined on this curve is, however, rather small.
The light intensity-assimilation curve of van den Honert , on the other hand, shows a logarithmic type (as Harder 's curve), but van den Honer t is of opinion that a better agreement with Blackman's scheme should be possible, if the light intensity on the light- and shade-side of the assimilating cells could be equalized.
A reliable curve of the Blackman-type obtained experimentally is an argument of more importance than ten curves showing a gradual course, and constitutes therefore a great support for the adherents of Blackman's formula. A smooth curve may also occur (even if Blackman's postulate were true), if the experimental technique were inexact and not all other factors than the one studied were kept constant (cf. also Boysen Jensen and Müller) .
The fact that van den Honer t did not find a Blackman-curve when the influence of light was studied, -therefore, does not preclude the possibility that under improved experimental conditions a Blackman-curve would indeed appear. It is true that van den Honer t worked with a film one-cell in thickness, but objections arise against the manner of illumination used. A solution of the
SfcÙ

502
question how Homidium behaves under improved experimental conditions has been sought in Chapter VL
Van den Honer t explains his C0 2 concentration-assimilation curve by assuming that in case of low C02
concentrations the diffusion of C02 will limit the assimilation, and that the direct proportionality arises from the quick absorption of C0 2 in the organism.
Van den Honer t succeeded in making it quite plausible that the diffusion process limits indeed, by showing that the process is not at all sensitive to temperature, which is in conformity with the properties of the diffusion of C0 2 in water (cf. also Bohr 1897 and 99).
Though van den Honer t has shown that a curve with a proper resemblance to the Blackman-scheme is obtainable, this may be a coincidence and an exception. The same opinion is held by van den Honer t in the theoretical discussion of his results (v. d. H. 1930, p. 245). The fact itself does not speak for the general validity of Blackman's theory.
In the experiments of Warburg (1919, 20), in which the diffusion plays no part, as he could prove by change in temperature, a logarithmic curve was obtained.
In other experiments Warburg ascertained that narcotics retard the assimilation. I, therefore, have asked myself how the C02 concentration-assimilation curve of narcotised Hormidium would proceed, and whether it would be possible in this way to cause the Blackman-type to disappear. It may be possible that the limiting action of diffusion of C02 will be excluded by this interference. This question will be treated in Chapter V.
B. Do the External Factors Act Directly on the Photo-synthetic Process, or Do Internal Protoplasmic Processes Interact?
Wills tä t ter and Stoll (1918) and O. Warburg

503
{1919, 20, 22, 24) have very thoroughly studied the assimilation of carbon dioxide, and they have arrived experimentally at a theory of photosynthesis. I am not going to consider the contents of these theories here, in which case the opinion of other investigators should have to be mentioned too, but only a tendency which these theories have in common.
Photosynthesis is considered here as a reaction in an „unalterable" system (test-tube), while the possibility that this system itself (the organism) changes under the influence of the varying factors, is ignored and not even suggested 1).
With high light intensity and high concentration of C02 , temperature is the limiting factor of photosythesis. It is supposed that under these conditions the rate of the whole process is controlled by the speed of a pure chemical part of it (Blackman reaction). In the theories of Wil ls tä t ter and Stoll, Warburg, a.o., this chemical reaction or reaction complex is, as a matter of fact, considered as a stage of the photosynthetic process itself. To be sure, this possibility may not be denied, but that it should be obvious is not at all evident. In fact it is possible, that internal processes determine the intensity of the assimilation, and that the accelerated action after an increase of temperature is merely based on the acceleration of these internal processes (alterations of the system in which the reaction occurs). In this case some „branch-chain" of the process will be studied, and not a part of the reaction: 6 C02 + 6 H20 - • C6 H1206 + 6 02 .
Quite another conception than the first mentioned, which we may call „chemical" (on account of the internal regulatory processes being neglected) we find in the work
1) I do not mean the „adaptation" to the factors of the milieu after a long time, which is certainly acknowledged by these investigators, but an immediate reaction of the plasma during the experiment.

504
of Spoehr and Mac Gee (1923), Kostytschew and his collaborators (1926—31), Harder (1930), and Arnold (1931). The first mentioned investigators assume a dependence of the assimilation on the respiration. They observed that after a long period of darkness, the assimilatory intensity ran parallel to that of the respiration and to the increase in sugar-content. From this they concluded that active products of carbohydrate-metabolism influenced assimilation. The experimental foundation of the theory is weak; but still the assimilation is looked upon as a physiological process being dependent on internal processes.
Kostytschew and collaborators published a series of investigations by which it was shown that assimilation is only slightly influenced by the prevailing external factors. Fluctuations occurred, without there being a noticeable external cause, so that they came to the theory (Kostytschew 1931), that assimilation is dependent on internal factors and on the after-effect of external factors („höchst komplizierte Reizketten"). The irregular assimilation they found appears partly to be under the influence of movements of the stomata, but can also appear when the stomata are quite open.
It was even shown that under very favourable circumstances an evolution of C02 may take place. Boonstra (1930), however, could not succeed in confirming in Holland this phenomenon, which has been observed in four different climates in Russia.
Kostytschew was also criticized by Boysen Jensen and Müller (1929), who observed a more regular course of the assimilation. According to them K o s t y ts chew's results are probably a consequence of experimental errors. We wonder indeed how it is possible that rather regular curves, as obtained by Mat thaei (1904), Wil ls tä t ter and Stoll (1918), Lundegârdh (1921), would have been possible if the assimilation would always be subject to

505
such large fluctuations. As a result of his opinion Ko-stytschew denies any value of experiments of short duration, in which external factors are varied.
Harder (1930) found that the intensity of assimilation in aquatics changes with time. He found no fluctuations as Kostytschew a.o. did, but a gradual increase of the assimilation in light, followed by a decrease. He explains his results by distinguishing a number of reaction swhich must all be of internal nature, called by him „Akti-ierung", „Gegenreaktion", „Ermüdung" and „Anpassung".
Arnold (1931), who almost at the same time arrived at similar results with Elodea, agrees with this opinion.
Other investigators, who did not find a constant course of the assimilation-intensity, are Ewart (1897, 98), Pantanel l i (1904), Lubimenko (1905), Wi l l s tä t t e r and Stoll (1918), Johansson (1923, 26), P lantefol (1927), Montfor t and Neydel (1928).
Wi l l s tä t ter and Stoll ascribed this fact to an accumulation of products of assimilation; the explanation is altogether „chemical".
Johansson explains the decrease in intensity by the closing of the stomata, so his explanation does not call real internal factors into play either. Of great importance is, therefore, the work of Mont for t
and Neydel (1928), who observed the same phenomena with leaves of Hydrophyllacea, in which stomata are wanting. They could show that neither accumulation of products of photosynthesis (a decrease began after/a short illumination), nor desiccation (the leaves were in water), nor alteration of the position of the chloroplasts (after change in position more light gave less assimilation) caused the decrease, so that it is obvious to account for these facts by means of internal reactions, the more so as the preliminary treatment also proved to have influenced the reaction. With strong light these investigators, too, did

506
find evolution of C02 , however, not alternating with periods of strong assimilation, as Kostytschew found.
Very large fluctuations within the lapse of an extremely short time were found by Maxi mow and Krassnos-selsky—Maximow (1928). They do not know, whether the cause is internal or a result of the movement of the stomata.
Beljakoff (1929), however, did not find these large „jumps", and ascribes them to experimental errors. Moreover he found that the stomata do not react rapidly on light, temperature and moisture, in contrast to the above-mentioned investigators.
Unusual assimilation-curves, which also point to a very complicated composition of the assimilatory-process were found by Lundegârdh and his collaborators Stocker (1927), Wal ther (1927), Yoshi i (1928). Their curves are characterised by several optima and minima.
Van den Honer t (1928, p. 9; 1930, p. 158), however, severely criticizes the apparatus of Lundegârdh and remarks that inasmuch the measurements are made immediately after the illumination, the absorption of C0 2 cannot be constant in the first minutes. To this I would add that for another reason it is undesirable to measure in the first minutes. The opinion that the assimilation is connected with very complicated processes, demands that the organism is allowed some time for the creation of a state of equilibrium. Though the truth of this assertion may be doubted, yet the possibility must be taken into account.
In connection with this last point the work of Ts i -Tung Li (1929) should also be mentioned, who found an immediate considerable increase of assimilation after altering the intensity of the light or its composition (red-white). T s i -Tung Li explains this by considering the available surface to be a limiting factor. When taken out of the darkness into light there will be a large surface available in the beginning, which will diminish later on.

507
So he explains the phenomenon by an internal limiting factor, though not an active internal one. The case maybe more complicated, but it clearly demonstrates the danger of premature measurements.
In the preceding pages we have mentioned a number of modern investigations, where there was more or less reason to consider the assimilation connected with other vital functions. The study of this correlation has become the principal object of the present paper.
In this the conception of Spo ehr and Mc Gee have served as a working-hypothesis. I have always asked myself how both assimilation and respiration behave under different conditions. I was led to their hypothesis, not because a direct relation between photosynthesis and respiration seemed likely a priori, but because of the fact that, if photosynthesis should be connected with protoplasmic activity, the oxygen consumption of the protoplasm could be taken as a fair measure of this activity.
For this reason the influence of temperature on photosynthesis is compared with the influence of this factor on respiration (Chapter VI). In itself the determination of the influence of temperature on assimilation is also of importance, because the literature shows, in addition to the none too reliable determinations with leaves of higher plants, only the data of Emerson (1929), who worked with Chlorella pyrenoidea. All other determinations are more or less fragmentary. /
The influence of four different substances on respiration and assimilation is investigated in the Chapters VIII—XI. -Since photosynthesis is considered to be a chain process by many investigators (a.o. Briggs, Warburg, van den Honer t ) and since different reactions possibly control the rate of photosynthesis under different conditions, the influence of these chemicals is determinined both in light of low and of high intensity.

508
Finally, in Chapter XII, I have tried to find an answer to the question whether any processes precede the assimilation. If the assimilation is really dependent on internal processes we may expect that the equilibrium will not be immediately established. We know already the so-called „photochemical induction" of assimilation since the inquiry of Warburg (1920), but it is doubtful whether we have really to do here with a photochemical phenomenon or with physiological reactions which must precede the assimilation. It has been tried to determine the nature of this „preceding" reaction.
In the course of the investigations the necessity became apparent to study respiration as well. Its magnitude during photosynthesis should be established. Fluctuations in the intensity of respiration might be the cause of fluctuations in our analytical results. The study of respiration becomes a necessity when a causal relation between this form of metabolism and assimilation is claimed (Spoehr and Mc Gee). This problem will be treated in Chapter III.
With the exception of a few, which are mentioned in Chapter V, and which were made with the apparatus of van den Honer t (1928, 30), the experiments were made in a new constructed, very simple, but at the same time very accurate apparatus, according to the manometrical method.
The advantage of van den Honert 's method, the experimentation with a film of Hormidium of one cell in thickness was maintained in it. The assimilation of this film is, according to van den Honer t very constant during a long time. K o s t y t s c h e w ' s objection against the determination of the influence of external factors, which would be impossible on account of the inconstant course, does not hold here.
The apparatus will be described in the following chapter.

509
The method is based on the measurement of the evolution of 02 .
In order to check my results with those of van den Honer t (analyses of C02 concentration) the assimilatory quotient was determined (Chapter IV). This was all the more necessary, because van den Honer t had found deviations of this quotient from unity in a few determinations.
CHAPTER II.
Experimental Method.
A. Material A strain of the filamentous alga Hormidium flaccidum
served as experimental object. The same strain was used by van den Honer t in his investigations. He determined the strain as H. flaccidum, which species is subdivided in in different sub-species in Pascher's Flora. This strain forms, when cultivated in a suitable way, a film of only a single cell layer on the nutrient solution and is, in this state, very suitable for the investigation of photosythesis. I obtained another strain, the sub-species Hormidium nitens from the collection of Dr. E. G. Pr ingsheim at Prague. This latter strain was free from bacteria, which is not the case with the former. With the latter strain it appeared more difficult to obtain „films". Moreover the film is less close, which causes loss of material when removed to other liquid culture media (which was necessary in the experiments of Ch. VIII, IX, XI). For these reasons I mostly used van den Honert 's strain; the quantity of bacteria is, moreover, small in a well growing culture. For the sake of comparison other organisms (Stichococcus bacillaris, Oocystis spec.) were tested occasionally.
The cultivation succeeds very well in Er lenmeyer flasks (contents 150 cm3), which, closed by a cotton-wool
fcii ' i

510
stopper, are placed in a cool room before a north-window; the conditions of cultivation were therefore not constant. In summer the light must be dimmed a little with white paper. Very good cultures were obtained at a temperature of 15°—18° C. A lower temperature is not directly injurious but the growth becomes very slow. At higher temperatures Pr ingsheim's strain soon forms less fine films; van den Honert 's strain may keep well, provided large quantities are constantly transferred. If this is not done, the alga gets overgrown with bacteria. At least once a week the cultures must be transferred; in winter this may be done less frequently. In the summer of 1930 I grew the algae in a He arson's cool biological incubator, in which the temperature was kept at 15°—16°. The flasks are filled with 20—30 cm3 nutrient solution of the following composition, given by van den Honer t ; water distilled from glass into glass, containing:
Fe S04 . . 0.001 % Mg S04 0.01 % Ca S0 4 0.004 % K N 0 3 0 . 1 % K H 2 P 0 4 0.02%
In this medium also other algae, such as Stichococcus bacillaris, S. minor and Oocystis spec, appeared to grow well.
Besides on the windowsill, I also cultivated the algae with a constant source of light. For this purpose E r len-meyer flasks (contents 1 litre) were used, shut at the top by a rubber stopper containing two passages. With the aid of an aquarium-pump indoorair continually bubbles through the liquid. The flasks were placed round a 75 Watt milkglass Philips lamp burning day and night and surrounded by a watercooler. After three or four weeks the liquid becomes darkgreen, Hormidium is in this case usually unicellular and forms no film.

511
B. The Apparatus of Van den Honert Used in my First Experiments.
A few experiments (those mentioned in Chapter V) were made with the apparatus of van den Honert . According to his method a current of air containing C0 2 is led at a great speed over a film of Hormidium. The used air is not directly removed, but is again led over the alga by-means of a small pump. The supply of air containing C0 2
and the removal of air samples for the analysis takes place very slowly in comparison to the speed of the circulating current of air. After some time a state of equilibrium is attained and the tension of C02 of the circulating air becomes rather constant. With the aid of a gasanalysis apparatus of Krogh the tension of C02 is determined accurately within 0.001 %. The same had been done before with the supplied air. From the quantity of air removed per unit of time and the difference in C02 contents between supplied and removed air the assimilation of carbon dioxide may be calculated.
We refrain here from an extensive description. The reader can find it in the publications o f v andenHone r t ( l 928,30).
The method is very accurate. An objection, however, is the long duration of the experiment; a disturbance in the intricate apparatus may easily set in. The greatest difficulty is the handling of the Krogh apparatus. This apparatus suffers greatly from leakages, which often occur, especially (as in my case), when it has already been used before, and the stopcocks become older and less true. Moreover the making of a great number of analyses is very trying work. Another drawback is that the apparatus soon gets dirty; the regular cleaning takes up much time. A last objection of the method is, in my opinion, that it may be called accurate, but it is not supple. The course of the process is difficult to follow. When the air is removed, one never knows if the equilibrium is already attained.

512
For all these reasons I have given up working with this apparatus, and constructed a new one, according to the manometrical method, which fitted better to the purpose of the investigation.
For the present a few more remarks about the apparatus of van den Honert . Some minor improvements have been introduced. The glass tube, numbered 23 in fig. 8 of van den Honer t (1928, 130) has been replaced by an unbreakable brass one. The valves, shown in fig. 9 are constructed more simply. Instead of string and a melted wax and resin mixture, a piece of rubber tube is used. This is put onto tube 1, after which tube 5 is passed round it, so that a watertight closure is^effected.
C. The Apparatus Used in my Further Experiments. 1. Description of the apparatus. This apparatus (cf. fig. 1)
is an application of the microrespirometer of Krogh for the assimilation of carbon dioxide. Two vessels (a and b) are connected by means of a manometer (c), one of these vessels (b) serves as control, and contains only air and water. It served only to enable us to compare the varying pressure of the air with the constant pressure in the other vessel, and to preclude the effect of slight fluctuations in temperature.
The principle of the method is to allow the alga to assimilate or respire in a space of constant C02 tension, so that only the oxygen tension changes. This change is indicated by the rise or fall of the liquid in the manometer. By adding mercury out of a calibrated capillary tube (d), the original pressure can be restored and the quantity of 0 2 evolved or absorbed, which is equal to the volume of mercury displaced can be read. The constant tension of C0 2 is reached with a so-called buffer-solution of Na2 C0 3
and Na HC03 . So the method, contrary to that of van den Honer t , is based on the measurement of alterations in the

513
tension of oxygen and not on the determination of the carbon dioxide concentration.
The assimilation- and the control-vessel are very shallow and made of nickel plated brass (cf. fig. 1 A). The inner diameter is 106 millimeter, and the outer 124, the height only 4 mm. They are covered with a glass plate (ƒ) 3 mm thick (a cover of a glass box). Between vessel and plate is a greased rubber ring (e). The plate is clasped on the
Fig. 1. Sketch of the apparatus. For description see text.
vessel with the aid of a brass ring (h) and five clamping-screws (;'). In order to prevent cracking of the glass there is also a rubber ring (g) between ring and glass.
On the bottom of the vessels we put 20 cubic centimetres of the buffer mixture. There is an opening in it leading through a twice bent glass tube to the manometer. To prevent the liquid from entering this opening a short tube 4 mm long (k) has been soldered on it. Besides the assimilation-vessel contains an opening (Z) communicating with the calibrated capillary tube (d). This connection is esta-
33

514
Wished by the twice bent tube (m), in which there is a small bulge (n), which serves as a mercury reservoir. The capillary tube (d) is a pipette of one cubic centimetre.
It is partly filled with water, partly with mercury. It is calibrated to 0.01 cm3 and can be read with an accuracy of 0.001 cm.3
The displacement of the mercury is effected by raising and lowering a level-glass with mercury (o), which glass communicates with the capillary tube.
The bent tube, which connects vessel and calibrated tube, contains also a three-way stopcock (p) connected with a side-tube (q). This tube (q) serves to drive gas through it, but was only
used in the experiments for the determination of the assimilatory-quotient and is further unnecessary.
The vessels are put on tripods (r), so that the water of the thermostat basin, in which the apparatus is put may freely circulate around them.
The manometer (c) is a U-shaped capillary tube, 0.5 mm wide, open at the top, and has a capillary connection (s) with the vessels. The opening at the top can be closed with rubber tubing and a clamping-screw (t).
As a manometer liquid paraffin oil coloured red with Sudan III is used. Behind the tube is a scale division on millimeter-paper.
Fig. 1A. Bottom of the assimila tory vessel (a) with glass-cover (ƒ), metal ring (ft), rubber rings (eand g), clamping-screw (ƒ)• For further
description see text.
2. Fixation of the algal film on the glass cover. The

515
algal film is fixed on the inside of the glass cover (ƒ) in the following way: A plate altogether free from grease is laid in a somewhat larger glass basin. This basin is filled with nutrient solution, so that the plate is a few millimeters below the surface of the liquid. On the water floats a paraffined paper ring (diam. ± 8 cm), within which a qua ntity of algae is transferred. The basin is put on the window-sill under a glass cover. After two or three days a round homogeneous film has formed itself, which is suitable for the experiment. The liquid is sucked away with a pipette, the film is pushed towards the middle of the plate, where it stays as a humid layer. The last liquid is removed by means of filter-paper and the paper ring taken away. The plate is placed upside down on the assimilation-vessel, after which this is shut. The film should not be too humid, as drops would form making contact with the buffer-mixture, neither may it be too dry lest the film should dry up.. After some practice this is easily performed. The vessel must also be placed strictly horizontal with the aid of a water-level in order to prevent the liquid from sinking to one side.
When unicellular algae serve as object, the cell-suspension is first centrifuged for some time; the clear liquid is poured off and the remaining thick suspension is removed to a clean glass plate with a brush.
3. The regulation of temperature. The contents oî the waterbasin, in which the apparatus stands, must be kept at a very constant temperature, as the method is highly sensitive to fluctuations in temperature, on account of the great volume of gas of the vessels. A toluol thermostate is practically not sufficient. I preferred to regulate the temperature by hand, as a reading had to take place every five minutes, and I had an opportunity to control the temperature at that moment. Under the water-basin there is a

516
miçro-burner (y) for heating purposes, while, in the basin, bent glass tubes (v), through which tapwater or ice-water streams, effect the cooling. By regulating the flame and the speed of the stream of cooling-water the temperature of the basin can be controlled very accurately. Slight fluctuations were compensated by keeping at hand little basins of warm and cold water or pieces of ice. The temperature is read from a thermometer with a scale division to 0.1°. The capacity of the basin is 70 litres. This regulation of temperature, which may seem to be primitive, allows an accuracy up to about 0.01° without any trouble, as within a short time a great skill is obtained. In the basin is a stirring-apparatus (H>) driven by an electro-motor.
4. The regulation of C02-concentration. In most cases a solution of the following composition was used as a C02-buffer:
NaHC0 3 0.375 mol. Na 2 C0 3 . . . . - 0.125 mol.
Such a solution is at 16° balanced with air containing 0.7 % C02, at 23° with 1.1 %, which was determined by means of the C0 2 generator of van den Honer t and the gas analysis apparatus of Krogh. With this concentration C02 is no more limiting; alteration of the C02 concentration from 0.2 % to 1.0 % did not give noticeable alteration of the C02 assimilation under the conditions of my experiments, as appeared from preliminary experiments.
5. Illumination. The light source was an ordinary 150 Watt Philips metal filament lamp (x), when experiments were made with the light-factor in maximum. At about 20° an alteration in the distance of the glowing filament of the lamp from 15 to 12 centimeters has no result at all. As a rule the distance was 13 or 14 cm. The lamp hangs halfway in the water; so between lamp and algae there is nothing else than a layer of water from 8 to 9 cm thickness.

517
When the influence of the light-factor was examined, a different arrangement was used. As a lightsource a Leybold projector lantern was used, in which, instead of carbön-points a Philips 1000 W. cinema-lamp was placed. The cone of light is vertically thrown on the assimilation-vessel with the aid of a 45° slanting mirror, while care should be taken that the axis of the cone falls on the centre of the vessel or close to it, so that the whole algal film is equally illuminated. In order to secure a uniform dimming of all wave-lengths the light of the lantern is weakened by means of so-called neutral light-filters (Plotnikov). These filters are made of fine mesh brass wire supplied to us by the Newark Wire Cloth Company, Newark, U.S.A. Other screens sold by the firm of F. Köhler, Leipzic, proved to be useless for my purposes.
The screens were coppered. Then they were hung on a copper wire in a 5 % solution of NaOH, to which 1 % potassiumpersulphate powder was added. After about 5 minutes the surface was dull black from the CuO formed. The screens were washed in water, dried with a soft piece of cloth and clasped between metal rings. The diameter of the screens is 10 cm. The following gauges were used:
mesh
24 x 24 30 X 30 35 X 35 40 X 40 45 x 45 50 x 50 55 x 55 60 x 60
diam. of wire (inches)
0.0100 0.0100 0.0080 0.0090 0.0090 0.0090 0.0090 0.0090
size of opening
0.0317 0.0233 0.0206 0.0160 0.0132/ 0.0110 0.0092 0.0077
The quantity of light which these screens allow to pass was determined by means of a Moll-thermo-element connected with a Moll-galvanometer and illuminating the element alternatively with or without a filter put before it. The relation of the galvanometer deflections gave the

518
percentage of light transmitted (with the filters used it varied between 32 and 61 %) . . By combining two filters a still lower intensity of light can be obtained. Hère great attention should be paid that the screens are parallel to one another, and that their wires do not run parallel, but form a certain angle (Plotnikóv), If this precaution is not taken, moiré-phenomena may be obtained and consequently a very irregular illumination. It appeared for this reason that the screens could be placed in one place only, viz. between the two sets of lenses of the Leybold projector lantern, in close proximity of the front lens. Images or shadows of the screens appeared when the screen was mounted in any other place.
A plane parallel cuvet filled with water is placed between the two lenses, 10 cm in diameter measuring.
The vessels are submerged in the water basin to a depth of 6 cm below the surface (in the experiments with the Leybold lantern).
The distance of the top of the light cone, which falls between the two lenses, to the alga is ± 95 cm.
The voltage fluctuated during my experiments between 218 and 225 V.; very often it was much more constant. The inconstant voltage is without any importance, when the work is done with a strong intensity of light; in case of weak intensity a correction must be made (cf. the experiments on the influence of light intensity, Ch. VI).
When measuring the respiration all light was shut off by means of an opaque round plate covering the glass plate.
D . Course of an Experiment and Corrections. After closing the vessels, filling the water-basin, turning
•on the screw clamp above the manometer, the experiment can begin. We must wait some time till the equilibrium lias been obtained. Any air-bubbles which there might

519
be under the vessels are removed with a bent pipette. It takes rather a long time before equilibrium has become established, at least 30 minutes. This is probably caused by the changes of temperature and by the changes of C02- and water-vapour tension. The absorption of light heats the vessel a little. The heating effect is about 1/6°, calculated from the expansion of the gas, when the lamp is at 13 cm distance.
Now the manometer is put at 0 and the level of the mercury in the calibrated tube is read. As a rule both manipulations are repeated every five minutes. We wait till a row of from 5 to 7 practically equal values have been read; the evolution of 0 2 is apparently constant now, and the assimilation per hour can be calculated. In case of low intensity of assimilation or when measuring respiration, the experiment lasts longer in order to decrease the chance of a faulty reading.
The quantity measured does not precisely correspond to the volume of gas evolved, as part of the oxygen dissolves in the buffer-liquid, and nitrogen escapes from it. Moreover, the newly formed oxygen mixes with escaping carbon dioxide and water vapour. The increase of the oxygen tension is not quite proportional to the formation of oxygen, because the total volume of gas becomes larger. This may practically be neglected, since the oxygen tension increases only by a few percents during the experiment. The dissolved quantity may therefore be taken as proportional to the volume formed. Since the absolute value of assimilatory C02 is of secondary importance to us, a correction is not _ necessary. The same may be said of the carbon dioxide and the water vapour. Consequently the measured amount of assimilation is somewhat too small, the measured amount of respiration too large.
The above remarks about the corrections do not pertain, when the investigations are made at various temperatures.

520
The calculation of the corrections in that case was done as follows.
The vessel, in which the first experiments were made (table 6), contained 37 cm3 of gas and 104 cm3 of liquid. When 370 mm* of gas had been formed, the tension of the oxygen had increased by 1 %, that of the nitrogen decreased by 1 %. Now oxygen dissolves in the buffer-mixture, and a little nitrogen escapes. (We consider the solubility of the gases in buffer-mixture to be equal to the solubility of gases in pure water). The solubility of oxygen is greater, consequently more gas dissolves than is given off. The higher the temperature the smaller this difference will be. At 10° the solubility of the two gases is 0.03802 and 0.01857, the difference 0.01945; at 20°; 0.03102 and 0.01542, the difference 0.01560. The second difference is 0.00385 smaller than the first, i.e. when the volume of gas increases by 1 %i P e r cubic centimetre of liquid 0.0385 mm3 less gas dissolves at 20° than at 10°. The total liquid contains, consequently,104 X 0.0385
4.00 = 4.004 mm3, less at 20°, or in percent. —— = 1.1 %. So, relatively, the assimilation at 20° has been determined too high, and this amount must be deduced.
COa and water vapour mix with this newly formed volume of oxygen. The tension of both gases is greater at the highest temperature. At 16°C the tension of C02 appeared to be 0.7 %, at 23°: 1.1 %. The difference in tension between 10° and 20° is 0.5 %; roughly estimated. The tension of water vapour is 9.1 mm and 17.4 mm at both temperatures; a difference of 8.3 mm or in per cent
8.3 of the total tension — = 1.1 %. These amounts too must be
7.6 deduced from the values found at 20°, so in total 1.1 + 0.5 + 1.1 = 2.7 %. The Q10 of photosynthesis found (2.30, cf table 7) will be corrected 2.30 — 0.06 = 2.24.
In case of the respiration this correction has to applied in opposite direction. The same amount must be added to the value found. But these determinations (table 9; and those of assimilation in May 1931, table 8) were made in smaller vessels, containing 20 cm3 of liquid and 32 cm8 of gas. The correction for the solubility of the gases is, therefore, about five times smaller, or 0.2 %, The correction for the C02 tension was 0.5 %, roughly estimated. In some experiments this tension was zero. Therefore, we put this correction at 0.3 %, on an average. Then the total correction becomes 0.2 + 0.3 + 1.1 =

521
1.6 %. The Q10 of respiration found (2.06, cf table 10) will be corrected 2.06 + 0.03=2.09.
These calculations make clear that the corrections are of no great importance.
Another correction to be made, when the influence of temperature is studied, is the one for the expansion of the gas in case of a rise of temperature. The volume is reduced to the lowest temperature of the experimental series, by-deducing ^JZ of this volume per degree of rise.
No further corrections of the apparatus seemed necessary.
According to van den Honer t a correction must be made for the increase of the material, a „growth-correction", which should be about 1 % per hour at 20°. I found a small increase indeed, which however, as van den Hone r t himself already stated was rather subject to variations. It appeared e.g. to be a little stronger in weak light, and so it seems that it is not exclusively founded on growth. Moreover I was faced by the difficulty, how to execute the correction at other temperatures. Since the duration of my experiments was on the whole shorter as those of van den Honert , it seemed warranted to drop the whole correction, which is moreover of little importance.
Operating with the apparatus as described above is very simple and not at all tiring for the investigator. An experiment hardly ever fails on account of technical difficulties. The accuracy of the method is, moreover, very great, the determination possible with an accuracy within a few • cubic millimeters. The course of the process can always be followed, so that the course of an experiment may be changed if it seems advisable. Moreover, incidental phenomena can readily be recognized as such. Besides the advantage of the method of van den Honert , the feature of the thin film of algae, has been preserved.

522
Changes in tHe solution of the cell-layer may be easily effected in the following simple manner: the glass plate is again placed in a basin, a paraffined paper ring is laid round the film and liquid is added (containing the factor studied e.g. a narcotic). The films are so tight that this manipulation can take place without loss of material.
CHAPTER III.
The Respiration During the Assimilation.
A. Introduction. On good grounds it has always been supposed that respiration goes on during assimilation. It appears that different processes as e.g. protoplasmic current keep going on. These processes cannot be imagined without respiration.
Whenever the amount of the assimilation is determined, the amount of the respiration must be added to the value measured, in order to evaluate the exact amount of photosynthesis« For want of a better standard the respiration is here determined in the dark before or after the determination of assimilation, under the supposition that the difference of respiratory activity in the light and in the dark would be slight.
Yet there are other possibilities, viz. that the respiration would have been changed by the supply of products of photosynthesis or by direct action of light on the protoplasm, or by an increase in temperature. The first possibilities were mentioned by Meijer.and Deleano (1911, 1913) and called the „ergastogeneous" action, and the „plasmo-geneous" action of the light. The third may especially be of interest in experiments made with leaves. Blackman and Miss Mat thaei (1905) found in sunlight temperature increases from 4° to 12°, which large differences, however, were later contradicted by Wil ls tä t ter andStoll (1918), Lundegârdh (1924) and Johansson (1926), who could

523
find but small differences of a few degrees at most, when the light passed water, and the transpiration of the leaves was not hindered.
That an „ergastogeneous" influence of light exists, is fairly certain. Borodin ascertained (1876, 81) that the respiration is stronger after an .exposure to light than before. Aereboe (1893) confirmed this. These investigators put this down to an increase of products of photosynthesis. An increase after an exposure, following a long period of darkness, was further observed by Mat thaei (1904), Meijer and Deleano (1911, 13), Kniep (1914), Pan-tanel l i (1915), Harder (1915), P laetzer (1917), Warbu rg and Negelein (1922), Spoehr and Mac Gee (1923). The last-mentioned authors were able to show that the increase of sugar content runs parallel to this. Warburg proved that an addition of glucose stimulates the respiration, which fact could be confirmed by Emerson (1927), Genevois (1927) and by myself (Chapter X).
Meyer and Deleano accentuated that these experiments do not prove that at the same time light could not exercise a plasmogeneous influence. Experiments made in air free from C02 , which had to solve this point, gave doubtful results. On the other hand these investigators did succeed in finding a plasmogeneous action of light on the respiration of another nature. By means of alternate exposures (in the day time light, at night dark) a rhythmic respiration was obtained. The rhythm continued when the leaf remained in the dark afterwards. x
Miss Plaetzer noticed that these rhythmic phenomena did not appear in Cladophora. With Spirogyra on the other hand, she found a rise at night, probably in connection with nuclear division.
The experiments on the influence of illumination on the respiration of non-chlorophyllaceous parts of plants give little .reason to believe in an important „plasmogeneous" influence

524
of light in case of green plants. The numerotas investigations-yielded few results, sometimes an increase, but mostly a slight decrease or no change was found. A slight increase may, moreover, have been caused by a rise of temperature-(Löwschin, 1908). A discussion of the literature on this-sübject is to be found with de Boer (1928).
A better insight into this problem is the more desirable if one considers that sometimes the assimilation is relatively-slight and only little larger than the respiration. Here the ignorance about the exact amount of respiration might be a dangerous source of errors.
B, Experiments. In the first place the intensity of respiration was determined before and after a period of illumination in which assimilation took place. The result
of this experiment, graphically represented in fig. 2, shows clearly that the respiration has increased markedly (from 13.5 mm3 to 27 per hour), to return to the old value after some
Fig. 2. Rate of respiration determined before time. Several ex-and after a period of assimilation. The full periments yielded, lines represent the experimental values, the ^ e same result as broken line the probable course of respiration. ,
the experiment represented in the figure.
More examples of this phenomenon are the experiments made in June 1931; see table 22 in Chapter XII. The respiration is very high after a long period of illumination, by daylight; it keeps decreasing during the determinations, of respiration in darkness.

525
GO
SO
|
1
L
l
i
i .X j /
f
I
,g/ht i
i '
\ \ \ -r
\ \ \ \
\
i i I Time
The result of the experiment, mentioned above, indicates that the respiration during the exposure to light had been at least twice as great as in the period before it» It stands to reason that this experiment does not show, whether this increase is of an ergastogeneous or plasmo geneous
nature, ac- cording to the conception of Meyer and Deleano.
In order to establish this the respiration was examined in a COa-free vessel over a
-is solution of 1 % Fig. 3. Increase of respiration in a C02-free KOH, instead of vessel after exposure to light. Full lines respi- over a buffer-mix-ration in the dark (experimental values); t u r e containing lines respiration in the light diminished with C O a . The following the assimilation of respiratory C02(exp.values); . , the broken line represents the probable course of e x P e n m e n t made respiration before, during, and after exposure, with Oocystis spec , In spite of the lack of C02 (no assimilation!) graphically repre-there is a remarkable increase of respiration sented in fig. 3
during and after the exposure. F . gives an impression
of the influence of exposure (lamp 150 W. at 13 cm). An increase of respiration may no doubt be concluded.
This experiment shows furthermore the remarkable feature that the respiration could also be determined during the exposure. The amount that is determined now is of course not the pure respiration, for part of the carbon dioxide formed by the respiration (x) will be assimilated once more, after which 0 2 evolves. The amount determined is, therefore, the respiration — x, the real respiration in this experiment amounted consequently to 51 + x per hour. This is already higher than the rate of respiration

526
before in the dark (39). For the rest this experiment shows the phenomenon much less beautifully than I always found it with Hormidium. I chose this experiment as an example, as the increase after the exposure is shown here very markedly.
100
90
BO
70
60
SO
Afl
30
70
? ~ - • / I 1 \
\\ n i — ' »
• * i i > ' i
•1--V f—\ 1 i V
1 1 I 1 1 J U9M \ Light i Light
§ if7'* \n \\ v> \ ! ! ! ! 1 i ;
\ y
i t i i
x
y i
/ / / /
Time
Fig. 4. Rate of respiration before, during, and after exposure to light in a C02-free vessel. Full lines respiration in the dark (exp. values) >r
—, lines respiration in the light diminished with the assimilation of respiratory COa (exp. values); the broken line shows the probable course of respiration. The amount of respiratory C02 which is assimilated again is unknown. Therefore the intensity of respiration in the light must be higher than is shown» by the experimental values (—•—-—).
A very beautiful example is given by e.g. experiment 5, made with a Hormidium strain of Pr ingsheim grown in constant light (fig. 4).

527
During the exposure the respiration rises from 39.5 to 87 + x, so the increase is at least more than 100 % here;. For the sake of control, the alteration in volume was also measured, after the equilibrium of temperature being re-established in the dark. This determination expresses the respiration during the time of exposure followed by 10 minutes of darkness; this value, too, is very high (80.5 + y). The rise after exposure is small, but visible. Again the experiment was repeated, first in light of lower intensity, then in the same. In the light of low intensity the rise is much smaller, in strong light it was almost as large as before.
Other experiments yielded similar results. The rise also takes place with the algae, cultivated on the
windowsill; both with Pringsheim's and van den Honert 's strain. A positive result was also obtained with a culture in constant light of Stichococcus bacillaris; increase from 40 to 48 -f- x.
These experiments distinctly show that the respiration during the illumination (assimilation) may be much greater than one would expect from a determination after or before the measuring of the assimilation. When we can make it clear, that the increase is not due to a rise of temperature, then the plasmogeneous action of light has been proved. In the first place, it be once more mentioned here, it can be ascertained from the expansion of the gas, that the assimilation-vessel becomes ± 1j6° warmer. The general heating can consequently be neglected. Also the film, attached to a thin glass plate, can hardly be warmer.
There may exist an unequal temperature in the different parts of the cells, but the probability of this supposition is not very great. The increase of respiration was sometimes twice or three times as much, or more. As we shall see in Chapter VII the Qi0 of respiration at higher temperatures is a little lower than 2. In order to explain such an increase

528
we should have to accept an average rise of temperature of 10° to 20° at the least. Now I noticed that owing to a short stay of 10 minutes in the dark at 41° the assimilation had afterwards considerably decreased at lower temperature. In the face of this, an almost constant assimilation at 34°, as we found in Chapter VII, would hardly be possible, if the alga had a temperature of from 44° to 54° on the average.
A second argument against a strong rise of temperature we meet in the light intensity-assimilation curve (Chapter VI) In strong light this curve runs parallel to the abscissa. Yet the assimilation in strong light is very sensitive to temperature (Chapter VII). It may be objected that the light intensity-assimilation curve in itself is possibly an optimum curve and that the fall may accidentally have been counterbalanced by the action of the temperature. This.does not seem to be very likely, and so this parallel course proves (when this subtle counterargument will be relinquished), that no heating (worth mentioning) takes place in case of an increase of light intensity.
In the third place the influence of red light on the respiration has been examined in experiment 9, where a material increase of respiration from 12 to 33 + x was met with. The Wratten filter 71 Aß was put on the vessel; this filter allowed about 64 % of the energy and only radiation > 600 m (x to pass (determined with thermopile). Yet the respiration was only 15.5 + x', and, therefore, as x' will be about equal to x (because C0 2 concentration is the limiting factor), much less than in white light. This seems to disprove the influence of temperature.
In the last place the after-effect of light on respiration, which is distinctly ascertainable even one hour after the exposure (fig. 3 and 4), seems to disprove a rise of temperature.
By these considerations the plasmogeneous influence of light on the examined algae is made very plausible.

529
The objection may be made that the respiration is measured in air, free from C02 , and the rise is wholly or partly due to the lack of the C02 factor 1). For this reason two experiments mentioned in Chapter VI (exp. 29 and 30) are of great importance. In a vessel containing C02 there appeared to be no assimilation in strong light, probably because the assimilation of the cells (cultivated in weak light) was hindered by very strong light. During the exposure the respiration proved to be 2—4 times as great as in the dark.
I have also tried to ascertain whether light may cause an increase of respiration in white plants, because an influence of temperature will be smaller here, though the literature gave me little hope. Yet in experiment 10, a suspension of Saccharomyces Vordermannii appeared to increase the respiration from 152 to 183. White leaves of Oplismenus from the hothouse, stuck on the glass with strips of paper, gave the following results:
Exp. 11, 19—3—31; 5 leaves; temp. 20.00°. Rate of respiration, in the dark: 49.5, 45;
„ „ „ , in the light: 63 + x; „ „ „ , in the dark: 46 per hour.
Exp. 12, 7—7—31; many leaves; temp. 24.00°. Rate of respiration, in the dark: 76, 62, 56;
„ „ „ , in the light: 61 + x; „ „ „ , in the dark: 49, 48, per hour.
It is not certain that these leaves do not contain any chlorophyll. In that case the result can at most be unfa-
*) Noack (1925) stated an increase of 0 2 absorption from leaves illuminated in absence of C0 2 after 84 hours, caused by photo-oxidative processes. Simultaneously the leaves grew yellow. These processes probably play no part in my experiments, as the cells proved to be quite normal after the experiment, and were able to assimilate normally.
34

530
vourably influenced. So these results also speak against heating.
When we closely consider the figures of the increase of respiration in glucose and fructose (Chapter X, table 20), it strikes us that this increase is only rather slight, usually no more than 50 %, often much less. So it is no exaggeration to say that the plasmogeneous action of light exceeds the influence of the ergastogeneous action by far.
The knowledge that there is a plasmogeneous action of light is, besides being important in itself, also significant for us in connection with the inquiry about the assimilation of C02 . In what follows we shall many times have to deal with the question, whether light (or other external factors) controls the intensity of assimilation directly as a factor in the photosynthetic process itself, or whether the action is indirect and is caused by the intermediary of the protoplasm. It goes without saying that the latter conception becomes more likely, now that we have ascertained a very strong influence of light on protoplasm.
The fact that the respiration has increased during the assimilation of C02 is of practical importance, especially for the method of determining the assimilation. A minimum value has only been ascertained; an exact quantitative determination will very likely be among the impossibilities. When the rate of assimilation is very high the respiration may be neglected, without a serious objection. Matters change, however, when the rate of assimilation is low. Especially in strong light the error will be very large, and may give rise to altogether wrong conclusions, so that this knowledge warns us at least to be cautious when we interpret the results. In the literature it is easy to find examples which are, for this reason, of doubtful value. One example I will mention.
Lundegârdh (1924) has found very interesting optimum curves. He found e.g. an optimum curve when

531
studying the influence of light intensity in case of low C02 concentration. In these experiments the assimilation was rather small. The decrease of assimilation in strong light may now well be explained by a large increase of respiration. I do not mean to say that Lundegâ rdh cannot be right, but I will only point out how cautious we must be in the explanation of such a case.
Notwithstanding the fact that there is an increase of respiration in light, yet in .my experiments I have stuck to the oldfashioned way of correcting the respiration. We had perhaps better multiply the values found by 1.5 or 2. But how does the respiration behave during an exposure with other intensities of light? We saw that, in strong light, there is a large increase, but how is the quantitative relation? I always determined the respiration after an exposure, except in the experiments in Chapter V, when I did not yet know this influence.
One remark should be made. The results recorded in the tables 15—23 of van den Honer t and in table 2 of myself (experiments made with the van den Honer t apparatus) seem at first to be little in conformity with those described above. A lower concentration of C02 is continually found in light than in darkness. The difference between the method of van den Honer t and my own method can account for this discrepancy. In the apparatus of van den Honer t a molecule COa formed by respiration, and afterwards evolved, is repeatedly offered to the cells and will have a great chance of being assimilated again; in other words: x will be very great. In my apparatus, as used in the above experiments, it will directly be bound by the alkali. The unknown x in my results will possibly be not very great. Moreover the light intensity in the experiments of van den Honer t is considerably lower, and consequently the increase of respiration rather slight (cf. fig. 4).

532
CHAPTER IV.
The Assimilatory Quotient.
By assimilatory quotient I mean, with Stiles (1925), the quotient of the volume Oa evolved and the absorbed C02, in contrast with Wi l l s tä t te r and Stoll (1918) who define the notion reversely. Stiles is quite right, when he observes that the reverse of a quotient, which is historically always used in this form, makes no sense.
The knowledge of this quotient was for me of importance for two reasons. In the first place because van den Honer t (1928, 30) contrary to Maquenne and Demoussy (1913), Wil ls tä t ter and Stoll (1918), and Johansson (1926), who had always found that the quotient approximates to unity, had noticed a deviating quotient of 1.1 with Hormidium. The second reason is that I would investigate to what extent my method, in which the assimilation of carbon dioxide is stated by measuring of the 0 2 evolved, is in conformity with the method of van den Honert , based on C02 determinations.
In order to determine the quotient the assimilation vessel is thoroughly cleaned from C02 buffer. In the vessel there is only air containing carbon dioxide and the algal film. The C02 concentration is increased by expired air blown, after deep breathing, through the tube q (Fig. 1) which has been inserted only for this purpose in the apparatus. Then follows an exposure to light. If the volumes of gas evolved and absorbed should be equal, the manometer liquid will have to remain at rest. If, on the other hand C02 absorption or 0 2 evolution predominates, a pressure difference will arise. When this difference has been determined, the vessel is opened and C02
buffer is added, after which the assimilation can be measured, i.e. the development of 02 . We now add to this

533
value the difference stated before and find the C02 absorption. In this way the quotient has been determined four times, cf. table L The respiratory quotient, which is perhaps very deviating from unity is not taken into account, which is admissible as the respiration is slight in proportion to the assimilation.
TABLE 1.
Determination of the assimilatory quotient.
Number of experiment
13 14 15 16
Date
11-9-30 16-9-30 19-9-30 10-7-31
Strain
Pringsheim's
v. d. Honert's
Temperature
22.00 22.00 22.00 21.50
O2 evolution per hour
192 1068 957 610
Difference between
0 2 evolution and CO2 ab
sorption per hour
- -18 + 66 — 6 + 28
Assimilatory Quotient O2/CO2
0.92 1.07 0.99 1.05
The quotient found deviates only little from unity. Van den Honer t found L09 and 1.13, amounts that are not very unlikely. Yet there seems to me to be no reason for the opinion of van den Honert , that there should be a connection between the high assimilatory quotient and the synthesis of oil as first product of assimilation. Moreover, I never succeeded in demonstrating fat in the Hormidium cell either with osmic acid or Sudan III. Pascher (1914) who describes the formation of reserve material in detail, tells nothing about such an oil synthesis.
The second conclusion that may be derived from these experiments, is that it is immaterial, whether the assimilation of C02 is determined by measuring the COa-absorp-tion or the 02-evolution.

534
CHAPTER V.
The Influence of Carbon Dioxide Concentration on Assimilation x).
A. The C02 Concentration-Assimilation Curve. Van den Honer t (1928, 30) investigated the influence
of C02 concentration on assimilation. His results deviated remarkably from those of other investigators. When the C0 2 concentration was low the assimilation rose directly proportionally to the tension of C02, when it was high it was altogether independent of it. Between the two regions
Fig. 5, Relation between C02 concentration and photosynthesis in Hormidium.
there was a small transition. The curve of van den Honer t therefore approximates the Blackman-scheme.
I have repeated this experiment with the pure Hormidium strain of E. G. Pr ingsheim. All corrections were carried
1) The experiments of this chapter were all made with the van den H o n e r t apparatus.

535
out as by van den Honert , The constant rate of assimilation at high C02 concentration has been put at 100. The illumination was effected by 6 lamps as used by van den Honer t in a row, with a reflector of white paper behind. The latter was absent in van den Honert 's experiments; the intensity of light was therefore somewhat higher.
Figure 5 gives the graphical representation of the experimental result. The curve perfectly agrees with the one found by van den Honer t .
Van den Honer t has been able to make it probable that the direct proportionality in low C02 concentration arises here, because a diffusion process controls the whole photosynthetic process, and that in case of high C02
concentration a chemical process is limiting. In the latter case a rise of temperature gives a considerable acceleration, in the former it remains without any influence. This is, as van den Honer t explained, in conformity with the properties of the (purely physical) C02 diffusion, taking into account the solubility of the gas at different temperatures.
According to van den Honer t the sharp break in the curve is caused by a rapid fixation of the C02 by the organism.
The curve found with Hormidium deviates altogether from those, determined by other investigators, e.g. from Warburg's curve, representing the relation between C02
concentration and assimilation in Chlorella. This /may be caused by the fact that, in the experiments of Warburg, the diffusion of C02 was no limiting factor. At least he found a great influence of temperature in low C02
concentrations. Finally it may be observed here, that it also appeared
from the preliminary experiments with the manometric method that in case of high C02 concentration (0.1—1.0 %)

536
the assimilation is quite independent of the concentration. No optimum curve has been found, as has been observed by Lundegâ rdh (1921, 24) for higher plants.
B. The Influence of Carbon Dioxide Concentration when the Assimilation has been Retarded by Narcotics.
It is a well-known fact that the assimilation may be depressed by the addition of narcotics. We may ask whether, by means of a suchlike retardation, we cannot eliminate the interference of the diffusion-process, and in this way measure the influence of C02 concentration on the assi-milatory process itself.
For this purpose I chose a concentration of phenylure-thane, which according to Warburg retards the assimilation: 2,0—2.4 x 10"4 mol. Moreover I made some experiments with antipyrin, examined by Ewart (1896) and Jacobi (1899) for its retarding action; I experimented with a weak concentration, viz. ± 0.001 mol.
TABLE 2.
The influence of C02 concentration on photosynthesis after the addition of a narcotic.
Exp. 18, 19-3-30. Pringsheim's strain, phenylurethane cone. 2.2 x 10"4 mol.
Time
11.50 14.25 16.00 17.10 19.00 20.45 22.00
Light
darkness strong light
„ „ « tr
tt
Assimilation
in mm3 per hour
-29 95
105 76.5 64 75
114
Corrected C0 2 cone, in 0.001 %
135 173 50.5 37 40.5
168
Corrected assimilation
92 100 72 59 68
102

537
Exp. 19, 27-3-30. Pringsheim's strain. Phenylurethane cone. 2.0 X 10"4 mol.
Time
10.45 13.45 15.10 16.15 17.20 19.15 20.50 22.00
Light
darkness strong light
» tt
tt
tt
tt
tt
Assimilation
in mm3 per hour
-20.5 108 146.5 121 97.5 65
167.5 152
Corrected
C0 2 cone, in 0.001 %
— 100 136 55 19 10.5
367 132
Corrected assimilation
— — 90 74 59 39
100 90
Exp. 20, 3-4-30. Pringsheim's strain. Phenylurethane cone.
10.30 15.40 16.40 19.30 21.00 22.45
darkness strong light
2;2 x lu"4 mol. -27 109 135 182 131 86
16.5 51
328 26 12
64 79
100 73 47
Exp. 21, 24-5-30. Pringsheim's strain. Antipyrin cone.
11.40 12.55 14.10 15.10 16.20 19.45 20.50 22.30
darkness strong light
darkness strong light
0.001 -33.5 188 149 122 110 200 -40 85
mol.
368 145 64 22
374
11
100 80 65 58
100
'43
Exp. 22, 3-6-30. Van den Honert's strain. Antipyrin cone.
12.20 13.45 15.00 16.20
darkness strong light
1
1300
-30 87
125 70
mol.
76.5 414 40
73 100 58

538
Table 2 shows the results of these experiments. It strikes us that the second observation in experiment 19 has yielded a rather low value. This is in accordance with the further experiments made with phenylurethane (Chapter IX), where it has been shown that the retardation is stronger at the outset, and diminishes in course of time. The rate of assimilation becomes rather constant some hours after the addition of the narcotic. All other observations fall in this constant region. The rate of assimilation in high concentration of C02 is again arbitrarily put as 100. Here we must, however, not forget that this 100 cannot be compared with the 100 of normal assimilation, as in higher COa concentration the assimilation is retarded as well as in low concentration.
Fig. 6. Relation between C0 2 concentration and photosynthesis in Hormidium when phenylurethane has been added to the algal film. The „Blackman-type" of the curve shown in fig. 5 has entirely disappeared. There is a striking resemblance between this curve and the curve published by Warburg, showing the relation between C0 2
concentration and photosynthesis in normal Chlorella (see fig. 7).
When we represent the result of exp. 19 graphically (fig. 6), a curve is obtained which deviates very considerably from the C0 3 concentration-assimilation curve found before. The „Blackman-type" has disappeared, the transition is very gradual. The rate of assimilation increases in case of high C0 2 concentrations where normally no increase takes place.
The curve very strongly calls to mind the curve of Warburg, represented in fig. 7. In order to make com-

539
parison easier the concentration of C0 2 is also given in 0.001 •%• It seems not unlikely that the same part of the process has been studied in both cases, possibly the chemical binding of the C02 .
Fig. 7. Relation between C0 2 concentration (expressed in 0.001 %) and photosynthesis in Chlorella, according to Warburg. The maximum
rate of assimilation has been put at 100.
Van den Hone r t is of opinion that a curve as I obtained in fig. 6 (represented in his publications in fig. 17), represents the quantity of the C02-assimilatory agent (probably C02-chlorophyll) at different C0 2 concentrations, and at the same time the rate of the limiting process. It is true that he speaks only of the photochemical part of the process, but from what follows it appears that this is presumably a slight error, and that the limiting process is meant, which may be chemical as well as photochemical. He thinks that the determination of this curve will enable us to find the sequence of the different parts of the chain process. If, he argues, a lowering of the C0 2 concentration should cause a retardation, when light were the limiting factor, then C0 2 would be a factor reacting in the photochemical process, whereas, should this lowering ,be of influence, when temperature were limiting, C0 2 would be a factor in the chemical process.
It will be seen below that the reaction is very sensitive to temperature. A lowering of the C0 2 tension acts, therefore, retarding, when a chemical process is limiting. When we apply van den H o n e r t ' s argument to my result, C0 2 would be a factor in the chemical process and this consequently would precede the photochemical one. Now, this would refute the theory of W i l l s t ä t t e r and S t o l l and agree with a theory as formulated by Wa rbu rg .

540
In my opinion this conclusion goes too far. It is certain that the chemical reaction is retarded by a lowering of the C02 concentration. But from this it does not follow that C02 itself takes part in this reaction. Let us imagine that a photochemical conversion of C02
precedes. This reaction is not limiting, (in the case considered here) goes „faster" than the other processes, and the product of this reaction will be dependent on the quantity of the C02 only (it being indifferent for my considerations if this C02 is free or bound to another substance, for instance to chlorophyll). The concentration of the latter is dependent on the C02-supply, so that the same will, therefore, hold good for the quantity of substance that has been converted photochemically. In this way the chemical reaction could consequently be dependent on the C02 concentration, even if COä
itself does not react in this chemical reaction. For that reason the problem of the sequence of the processes
must as yet in my opinion remain unsolved. I will also point out that it is not necessary that the chemical
reaction, which comes to the foreground here, is the same as the chemical reaction that is limiting in a normal organism when temperature is the limiting factor. Different parts of the chemical reaction complex may be unequally sensitive to these chemicals.
C. The Influence of Temperature on the C02 Concentration-Assimilation Curve when Phenylurethane has been Added.
In order to answer the question whether the reaction which controls the process after the addition of narcotics is sensitive to temperature, I have determined this COa concentration-assimilation curve at two temperatures. Now that we know the general trend of the curve the fixing of a few points suffices.
The results of both experiments have been recorded in table 3. In exp. 23 the temperatures 19.2° and 22.8° have been compared and in exp. 24 the temperatures 19.2° and 22.3°.
The few figures point to a strong increase at higher temperature. In later experiments (Chapter IX) it has been shown that the retardation, strong at the beginning, becomes less in course of time. Owing to this the values at the lower temperature have been found a little too low. Yet the third determination in exp. 23 falls already 5% hours after the beginning of the narcosis, the much higher 7th value must, therefore, for the greater part be explained by the rise in temperature, as the retardation is fairly well constant after 5 hours (cf. exp. 71 and 72).
We may, therefore, conclude that temperature is of great influence.

541
TABLE 3. The influence of the C02 concentration after the addition of phenyl-
urethane at different temperatures. Exp. 23, 14-4-1930. Van den Honert's strain. Phenylurethane-
concentration 2.2 X 10~4 mol.
Time
11.05 12.20 15.10 16.50 18.00 20.10 21.15
Temperature
19.2° tt
tt
22.8° tt
tt
tt
Light
darkness strong light
tt
darkness strong light
tt
tt
co2
concentration
425 90 — 397 154 71
Assimilation
-43 124 87
-62 193 159 137
Exp. 24,
11.40 14.50 '• 16.15 J 17.20 I 19.25 i
14-5-1930. Van den Honert's strain. Phenylurethane concentration 2.2 X 10"4 mol.
19.2 darkness ? ,
22.3 „ tt
strong light darkness
strong light tt
CHAPTE
— 174 — 158 405
R VI.
-29 90
-34 125 147
The Influence of Light Intensity on Assimilation.
A. Introduction. Already many investigators have examined the influence
of light intensity on C02 assimilation. This relation, represented graphically, usually yielded a curve of logarithmic type. Higher land plants and aquatics are unsuitable for this work as the light intensity will rapidly diminish in-the leaf. Such experiments do not prove that, if the illumination had been ideal, no curve agreeing with the Blackman-scheme, would have appeared. Boy sen Jensen and Müller (1929) lately drew the attention once more to this fact. This objection also perhaps pertains

542
to Harder 's experiments (1921) with Fontinalis. The same criticism was made by van den Honer t (1928, 30) against the experiments of Warburg (1919), in which thin cell-suspensions were employed, weakening the light only 10—20 %, but in which some cells would, however, be much less illuminated. The objection is perhaps not a serious one as the average diminution of the light is only 0 to about 15 %. Moreover the cells that receive less light, will be relatively small in number and exercise little influence on the total result. Van den Honer t has avoided this objection by using an algal film of one cell thickness where only the unequal illumination of light-and shade-side remains. Essentially the curve of van den Honer t does not deviate from that of other investigators. However I thought it desirable to reinvestigate the problem, as an objection may be raised against the way in which van den Honer t illuminated the algae.
He placed 1—6 incandescent lamps in a row. Using the same arrangement I determined the distribution of light intensity in the assimilation vessel of the apparatus of van den Hone r t (with the aid of a thermopile). Taking 10 for the light intensity in the middle of the vessel, and placing at first one lamp before the middle of that vessel, the intensity at 8 cm distance from the middle appears to be only 5. This is somewhat more unfavourable than in the experiments of van den H o n e r t , in which, only a central part of ± 11 cm in length is used. The distribution of light in the vessel shows to be unequal. Now when we put 6 lamps in a row the intensity in the middle of the vessel is about 40, and at 8 cm distance from the centre only 30.
For there reasons the illumination used proved to be improper.
In my experiments I used the arrangement described in Chapter II.
Equal distribution of the light intensity is attained by throwing the centre of the light cone of a Leybold projector lantern on the algal film. The variation of light intensity is obtained by placing wire cloth screens in the

543
bundle of light. The light intensity of the undimmed projection lamp is arbitrarily put as 1000. As a very strong light I used an ordinary 150 W. Philipslamp; the intensity of it at a distance of 14 cm agrees with about 2300 (1000 is i 3000 Lux, roughly determined with a photometer). The slight fluctuations in the voltage were measured with a voltmeter. According to Hoist (1920) a correction of 3.5 % for the light intensity must be made for each per cent variation of voltage.
B. Experiments on the Influence of Light Intensity on the Assimilation of Hormidium Cultivated in Daylight.
The experimental results are recorded in table 4. We find the result of exp. 27 graphically represented
in fig. 8. Evidently a curve of a logarithmic type has been obtained, notwithstanding the improved arrangement of
TABLE 4.
The influence of light intensity on photosynthesis. Exp. 25, 10-3-31. Van den Honert's strain. Temp. 22.00°.
Time
11.30 12.45 14.15 15.15 16.20 17.05 18.20
Light intensity
Transmitted
1000 611 415 254
2300 1000
0
Voltage
2191/2 222% 222y4
2221/2
2223/4
Corrected
952 609 413 254
2300 1004
Assimilation
171 136 102 66
211 171 -35
Exp. 26, 13-3-31. Pringsheim's strain. Temp. 20.00°
10.25 11.05 11.50 12.55 14.00 15.30
1000 611 415 254 174
0
221% 222 222 222% 222
—
611 415 256 174
0
493 351 271 181 134 -35

544
Exp. 27, 16-3-31, (fig. 8). Pringsheim's strain. Temp. 18.00°
Time Light intensity
Transmitted Voltage j Corrected Assimilation
11.00 ! 11.40 12.35 13.40 : 14.25 ! 15.30 !
611 335 174
1000 2300
0
1 220 y4
I 220 ! 220 y2
! 221% i — i —
613 335 175
1024 2300
0
350 213 120 465 539 -26
the experiment. The shape of the curve corresponds to those of Warburg (1919), Harder (1921), Bose (1924) a.o. An approximation of the Blackman-scheme is apparently out of the question.
500
ÙOO
300
200
100
-
•5 jS
-̂ y
%
Lightiiitensity \ r
Fig. 8. Relation between light intensity and rate of assimilation in an algal film cultivated in daylight. Light intensity „1000" = ± 3000 Lux. Though the experiment was carried out under improved experimental
conditions, the curve does not show the „Blackman-type".
C. Experiments on the Influence of Light Intensity on the Assimilation of Hormidium Cultivated in Weak Artificial Light.
The way of cultivation is of great influence on the shape of the curve. Experiment 28 has been made with a cell-

545
suspension, cultivated near a lamp of low intensity of light, burning continually. The distinguishing feature of this culture appeared to be that the assimilation optimum was reached at a much lower light intensity (611), which appears very distinctly from fig. 9. The alga has adapted itself to weak light, it has become a „shade plant". The curve shows a weak „optimum type". It is however not impossible that this is caused by an increase of respiration in the light of high intensity (cf. Chapter III).
300
200
fOO
5 jr
•
LigMinienaiiy 1
Fig. 9. Relation between light intensity and photosynthesis in a suspension of Hormidium cells cultivated in artificial light of low intensity. The curve shows the „shade-plant type". The optimum of photosynthesis is reached at a low light intensity („600"—„700"
= ± 2000 Lux).
Two remarkable results, which also demonstrate the influence of the preliminary treatment, were obtained with an algal culture, cultivated in the same way as mentioned above, a young cell-suspension, 17 days old. In light of the 150 W. lamp at 15 cm distance not the slightest assimilation appeared to take place; on the contrary the Oa
absorption was greatly enhanced. This experiment was repeated with the same result on the same day.
On the next day the experiment was repeated with another cell-suspension and with a similar result. I verified the apparatus with an algal film from the windowsill, which proved to assimilate in a normal way. What was the cause?
35

546
I supposed that the high intensity of light had been injurious to the cells, and an assimilation optimum would exist at very low light intensity. In order to settle this point exp. 30 was continued and a weaker light applied (lamp at 40 cm distance). It was remarkable that the great 0 2
absorption (—47) had totally disappeared and had passed into a very slight eyolution of 0 2 (+ 8). So the supposition proved to be correct.
This experiment is moreover a remarkable example of an increase of respiration in light, demonstrated in Chapter III. The absorption of oxygen had become at least from 2 to 4 times as great in the light.
I intended to determine the entire light-curve of this most interesting phenomenon. When, however, I wanted to repeat the experiment a month later, I could not get another result than that of figure 9, in spite of several attempts with old and young cultures. Without any doubt this diminishes the value of the discovery, and an explanation must be given with some restriction, though a mistake in the determinations is to be considered as out of the question.
The phenomenon calls to our mind the evolution of C0 2 so often found by Kostytschew and other Russian investigators, with favourable illumination, granting that the evolution or absorption of 0 2 is determined in my experiments.
The above instance remained exceptional. In all other experiments I found a strong assimilation which continued to exist for hours at a stretch without any variation worth mentioning.
D. The Influence of Light Intensity on Assimilation at Different Temperatures.
Harder (1921) investigated the behaviour of the assimilation in case of a simultaneous change of the factors

547
light and carbon dioxide. He found that an increase of COa also has got of influence when the light intensity is low and vice versa. A similar result was obtained by Lundegârdh (1921, 22).
We make a similar experiment for the factors light and temperature, when we deter mine the light intensity-curve at two different temperatures. The result, which we find in the graphical representation in fig. 10, is that in case of low light intensity, the influence of temperature is only slight. Another experiment gave a similar result.
It is certain that the curve never makes a much larger angle with the abscissa, when temperature is increased, as Harder had observed by varying the factors light and C02 . In this respect there is a greater agreement with the opinion of Blackman.
From both experiments it does not appear convincingly, whether there is still a small increase, or that it is totally absent. The question is for me of special interest, as it will appear from other experiments (Chapter VIII and Chapter X), that a stimulation of the assimilation in low light intensity is very well possible. Possibly the rate of assimilation is not in the first place determined by the quantity of light energy added to the assimil-atory apparatus, but internal factors may also control the rate of photosynthesis, also when light is the external limiting factor. Seeing that
Fig. 10. Relation between light intensity and photosynthesis at different tem
peratures.

548
temperature will influence these internal protoplasmic processes, it is of importance to look for a possible influence of temperature in case of weak light.
Van den Honer t has already made statements about this question. He found, however, a somewhat lower assimilation at higher temperatures.
Van den Honert thought he could prove by this, that the Q10
of the photochemical part of photosynthesis is ± 1 (Warburg is of the same opinion), in my opinion, however on insufficient grounds. If the velocity of the process should really be determined by the velocity of a photochemical reaction (let us suppose this to be the case), yet the sensitivy to temperature could not exercise any influence. At both temperatures an equal quantity of light energy is given, and in case all the absorbed light is photochemically at work, the coefficient of temperature found cannot be anything else but the quotient of the quantities of light supplied in both cases. In our instance this quotient will be 1, because the light intensities are equal.
Photochemistry is repeatedly faced by the same difficulty. Q10
must always be ascertained when the factor light is in maximum. It is then often an accompanying chemical process of which the Q10 is determined, but this difficulty cannot be overcome and the problem remains unsolved as yet.
As we stated before, it will appear in the following chapters that even when light intensity is the limiting factor, the intensity of assimilation may be varied through changes in the internal factors.
The supposition that the photochemical stage of photosynthesis controls the entire process exclusively, is therefore unwarranted.
Table 5 shows the results of a series of experiments, in which the problem is treated more accurately.
The voltage fluctuated a little. Therefore, the assimilation velocity is reduced to equal light intensity. The rate of assimilation is supposed to be proportional to the light intensity.
Experiment 33 seems to show a distinct increase at higher temperature. However, results of the experiments 34 and 35 are not so evident. But for a difference between the first and the second observation the assimilation is distinctly

549
constant. It rather seems that a kind of adaptation to the weak light takes place, than that temperature is of influence,
TABLE 5. The influence of temperature on photosynthesis in light
of low intensity.
Exp. 33, 22-5-31. Van den Honert's strain. Light intensity „153".
Time
11.35 13.55 16.15 18.25
Temperature
10.00 16.00 22.00 28.00
Voltage
220 22P/4
220% 223%.
Apparent assimilation +
respiration
93 + 17 95 + 30 97 + 43 95 + 59
Assimilation reduced to equal light intensity
110 122 139 146
Exp. 34, 27-5-31. Van den Honert's strain. Light intensity „140".
10.45 12.40 14.50 17.20
28.00 22.00 16.00 10.00
219 22314 221 y4 224
141 + 42 178 + 32 179 + 21 195 + 13 *)
186 200 196 195
10.25 12.30 14.40 16.30 17.30
11.25 I 13.25 15.45
Exp. 35, 3-6-31. Van den Honert's strain. Light intensity „140".
14.00 20.00 26.00 20.00 14.00
218V4 221 2183/4
218% 2221/4
132 + 24 134 + 40 112 + 56 128 + 40 !) 166 + 19
Exp.
20.00 20.00 20.00
! - I
36, 2-6-31. Van den Honert's strain. Light intensity „140".
220% 221 221
94 + 28 106 + 28 106 + 28 *)
159 171 172 173 179
121 132 132
1) Estimated.

550
A similar little jump is also to be seen in experiment 36, where I experimented under constant temperature. Experiment 33 is distinguished by a repetition of this jump. Adaptation and temperature are working here in the same direction.
At all events the influence of temperature at low light intensity is small. Yet the fact that adaptation and temperature together cause a rather considerable effect, proves that the assimilation is not exclusively dependent on the external factor light, but that the extent to which the light energy is used, is also under the influence of internal factors.
CHAPTER VII.
The Influence of Temperature on Assimilation and Respiration.
A. Introduction. The influence of the factor temperature on the assimi
lation, when neither light nor C02 are limiting, has also been repeatedly investigated. The result is often expressed in the coefficient Q10. Some American investigators as Crozier, Navez, Emerson (their works are especially to be found in The Journal of General Physiology) violently oppose the use of this coefficient, which they wish to replace by the temperature-characteristic \i, the energy of activation. It is true that Q10 is not a constant; log Qto is inversely proportionate to the product of the absolute temperatures. This seems no objection to me, as in biology only a rather limited range of temperature is studied, and a constant Q^, therefore, fairly well corresponds with a constant \i. The conclusion they try to get from the study of these coefficients, viz. whether one or more processes control the rate of the total process studied, is therefore equally possible whether the results are expressed in Q10 or in [A. SO there is no objection to
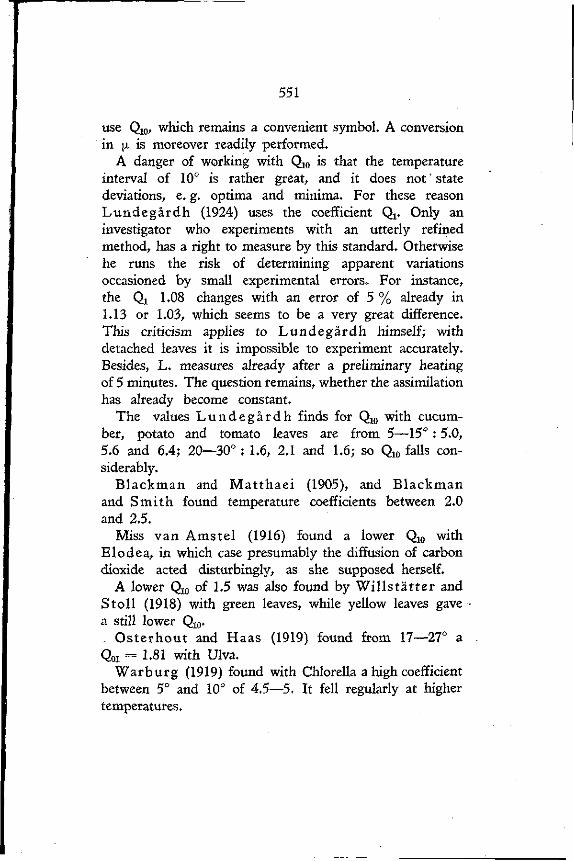
551
use Q10, which remains a convenient symbol. A conversion in p. is moreover readily performed.
A danger of working with Q10 is that the temperature interval of 10° is rather great, and it does not'state deviations, e. g. optima and minima. For these reason Lundegârdh (1924) uses the coefficient Qx. Only an investigator who experiments with an utterly refined method, has a right to measure by this standard. Otherwise he runs the risk of determining apparent variations occasioned by small experimental errors. For instance, the Qx 1.08 changes with an error of 5 % already in 1.13 or 1.03, which seems to be a very great difference. This criticism applies to Lundegârdh himself; with detached leaves it is impossible to experiment accurately. Besides, L. measures already after a preliminary heating of 5 minutes. The question remains, whether the assimilation has already become constant.
The values L u n d e g â r d h finds for Q10 with cucumber, potato and tomato leaves are from 5—15° : 5.0, 5.6 and 6.4; 20—30° : 1.6, 2.1 and 1.6; so Q10 falls considerably.
Blackman and Mat thaei (1905), and Blackman and Smith found temperature coefficients between 2.0 and 2.5.
Miss van Amstel (1916) found a lower Q10 with Elodea, in which case presumably the diffusion of carbon dioxide acted disturbingly, as she supposed herself.
A lower Q10 of 1.5 was also found by Wil ls tä t ter and S toll (1918) with green leaves, while yellow leaves gave a still lower Q10. .. Os terhout and Haas (1919) found from 17—27° a Q01 = 1.81 with Ulva.
Warburg (1919) found with Chlorella a high coefficient between 5° and 10° of 4.5—5. It fell regularly at higher temperatures.

552
The determinations of Yabusoe (1924) suffer from too great an interval of temperature. Emerson (1929) could prove that the direct proportionality between temperature and assimilation, as claimed by Yabusoe, is a result of this large interval and is therefore only imaginary. In reality the curve has a sigmoid shape.
The experiments of Emerson in this matter are the most important, as he determined complete temperature curves with an accurate method (of Warburg) with a lower plant (Chlorella), in which case the other factors may easily be brought in maximum, Emerson ' s result is in principle in accordance with that of Warburg, the increase of the assimilation diminishes with the rise of temperature, in other words (x, in which Emerson expresses his result, is not constant and falls gradually.
Finally van den Honer t (1928, 30) investigated the influence of temperature with Hormidium flaccidum. He found from 12° to 20° a Q10 of 1.87.
Ecological investigations about the influence of temperature under natural circumstances cannot of course be put on the same level with investigations where all factors are in maximum and will not be discussed here.
It has been my intention to study this temperature influence on a larger range with Hormidium.
Further I felt interested in the influence of temperature on respiration. It will appear later on (Ch. VIII—XI) that there are reasons to assume a connection between assimilation of carbon dioxide and respiration.
On the one hand the possibility exists that in case temperature is „limiting factor", in reality a part of the assimilatory chain process is investigated, viz. a dark chemical part of it (an opinion held by many investigators).
On the other hand the possibility must not be excluded, that, while the influence of temperature on assimilation

553
fs studied, yet nothing else is done than to determine the influence on the total life-intensity of the organism as a whole, namely when the vitality of the organism would primarily determine the intensity of assimilation. The intensity of respiration would in that case be the direct criterion of this influence of temperature on the organism, the intensity of assimilation on the other hand only an indirect result. Temperature would in this case act as an indirect factor only, viz. by means of accelerating protoplasmic processes, other than photosynthesis sensu stricto. This acceleration of the protoplasmic processes might then be the cause of the acceleration of photosynthesis.
It is quite imaginable that protoplasm produces an essential substance for the photosynthetic process, for instance an enzyme, and that it is the rate of this process that controls the total rate of assimilation, but there are other possibilities as well (cf. S p o e h r and Mac Gee) .
The conception given above would at once be refuted if the influence of temperature on assimilation and respiration should prove to be quite different, but it would be supported, though not proved, when both processes were influenced consistently. For these reasons an inquiry about the influence of temperature on respiration became necessary, in addition to that on assimilation.
A simultaneous investigation of the influence of temperature on assimilation and respiration has been carried out by Lundegârdh (1924). In his results nothing can be discovered of a parallelism between the two processes. The determination of the temperature coefficient of respi- -ration is, however, rather difficult in case of detached leaves. Respiration decreases in the dark, whereas, according to Meyer and Deleano (1911, 13), cutting causes a temporary rising, and a sudden increase of temperature would temporarily give too high a respiration as well.
One reason more made the determination of the coefficient

554
of temperature desirable. With each measurement of the assimilation a correction for the respiration must be made. Virtually a determination of respiration should be made after each measurement of assimilation. If the Q10 of the respiration is known one determination is sufficient. Moreover an unavoidable error is made, because it has been shown in Chapter III that respiration strongly increases in light. This correction would, however, be quite superfluous if the Q10 of both processes should prove to be equal. Anticipating my result, I may say already now that this is, approximately, the case. This conveys, therefore, a great simplification. It is sufficient to determine the influence of temperature on the apparent assimilation, which will be of the same order of magnitude as the influence on the real assimilation.
My method deviates from those of some other investigators. While Warburg, Lundegârdh, Emerson a, o. start their measurement, as soon as the temperature equilibrium has set in, I waited till the assimilation appeared to be constant, in other words, until the establishment of a physiological equilibrium.
According to Blackman the determination should have to be made in an infinitely short time. If the assimilation could be measured in this way, the temperature curve at injurious temperature, too, should be quite normal, according to Blackman's conception, and would not show any optimum-type. The injurious action of the high temperatures could be eliminated in the results in this way. The supposition underlying this would be right, if indeed we studied a purely chemical reaction. If, however, Harder (1930) and Kostytschew (1931) are right and „höchst komplizierte Reizketten" are connected with the assimilation, we may not at all expect that the final rate of assimilation would immediately set in. The alterations in the protoplasm, which would determine the

555
final rate of assimilation, would precede the establishment of the equilibrium. In order not to neglect this possibility, it is better always to check the constancy of the reaction.
B. The Influence of Temperature on Assimilation, The range of temperature investigated lies between
4° and 34°. Above 30° it is already difficult to observe a constant assimilation. It may be that secondary factors, as desiccation of the algal film are also responsible here.
The 150 W, lamp at 13 cm distance was always used for illumination. My results are to be found in table 6.
In a few series of experiments the- variations are rather great, much greater at any rate than might be expected with this accurate method. A possible explanation of these variations will follow later (Chapter XIII § E).
TABLE 6.
The influence of temperature on C0 2 assimilation (in November). Van den Honert's strain.
100 Exp. 37, 7-11-30. Conversion factor
420
Time
15.55 16.45 17.25 19.50 20.40
Temperature
20.00 24.00 28.00 31.00 34.00
Assimilation
420 542 736 928
1025
Assimilation converted
100 129 175 221 24^
Exp. 38, 11-11-30. Conversion factor 100
465~
10.30 11.30 14.00 14.55 16.35
17.00 21.00 25.00 29.00 21.00
390 483 646 818 499
84 104 139 176 107

556
Exp. 39, 13-11-30. Conversion factor JLOO^ ~3W
Time
10.20 12.10 14.20 15.25 16.35 17.35 20.05
Temperature
30.00 26.00 22.00 18.00 14.00 22.00 30.00
Assimilation
563 493 422 296 240 447 615
Assimilation converted
156 135 117 82 67
123 171
Exp. 40, 17-11-30. Conversion factor 100
47Ö"
10.50 11.50 14.25 15.30 16.55 18.25 20.25
29.00 24.00 19.00 14.00 9.00 4.00
14.00
572 544 447 307 194 115 294
Exp. 41, 25-11-30. Conversion factor 100
245~ 10.45 11.20 14.15 15.20 16.15 17.00 18.10 20.30
14.00 18.00 22.00 26.00 30.00 22.00 18.00 14.00
137 167 287 354 434 285 232 152
Exp. 42, 26-11-30. Conversion factor 100
34T 11.20 12.10 14.30 15.25 16.05 17.05 17.55
15.50 19.50 23.50 27.50 31.50 23.50 19.50
242 317 513 621 678 449 312
122 116 95 65 41 24 63
56 68
117 144 177 116 95 62
70 92
149 180 197 130 90

557
Exp. 43, 28-11-30. Conversion factor 100 455
Time
10.40 11.55 13.50 15.05 16.00 16.55 17.55 20.00
Temperature
16.00 12.00 12.00 8.00 4.50
12.50 17.50 22.50
Assimilation
360 233 226 154
± 8 4 260 384 531
Assimilation converted
79 51 50 34
± 1 8 57 84
117
I have represented this experimental series graphically and drawn a probable curve between the determined points. In this way the assimilation could be read off at 20°. In order to compare all experimental series with one other, the assimilation at 20° was put as 100. The rate of assimilation at 20° is a physiological measure for the quantity of material used. This measure was also taken by van den Hon er t. All values must consequently be multiplied by a conversion-factor (4th column of the table). The values calculated have been recorded in fig. 11. It appears that in spite of the individual variations a smooth curve can freely be drawn between the points. The increase of the rate of assimilation with the temperature is, consequently, very regular. Pronounced optima, as found byLundegârdh , are altogether wanting. /
Q10 can be calculated from the curve. These values have been combined in table 7. In the last column the determined Qi0 has been corrected in the way as discussed in the second chapter. At low temperatures Q10
is largest. Apart from this it is much more uniform than Emerson found with Chlorella. Above 10° it is fairly well constant. Since log Q10 is inversely proportional to the product of the absolute temperatures (log Q10 =

558
10 A T x (T 4- 10? ^ A = R ^ R = gasconstant, \k = energy
of activation), the characteristic \x is also nearly constant, [x calculated from this formula, usually put in the form:
2W
220
200
180
160
1U0
120
100
80
60
40
20
-
-
-
c:
'E - £
to
-
1
y<
i
y
/ •
1
' .
• /
i
•
/
/
•
i 1
• /
/ •
' •
•
Temperslure 1 1
2 't S 12 16 20 24 28 32 34
Fig. 11. The influence of temperature on photosynthesis in Hormi-dium (rate of assimilation at 20° put at 100).

559
T+To) x ^ = e R(T 1 -T 1 ) o r Q «» = e R ( T -from 15°—25°.
TABLE 7.
Temperature-coefficient of photosynthesis.
is 11400
Temperature
5—15 10—20 15—25 20—30
Qio determined
2.84 2.30 2.02 1.93
Qio corrected
2.77 2.24 1.96 1.87
Q10 being constant shows that the total chemical reaction complex is possibly determined by one part of the process.
These experiments were all made in the month of November 1930. A few experiments performed in May 1931 gave similar results, cf. table 8.
TABLE 8.
The influence of temperature on C0 2 assimilation in May.
Van den Honert's strain.
Exp. 44, 16-5-31.
Time
10.10 11.20 13.15 14.20
Temp.
13.40 18.40 23.40 28.40
Assim.
292 404 636 848
Qio determ.
[) 2.18-)> 2.10
10.55 13.45 14.50 16.05 17.20
Exp. 45, 10.00 15.00 20.00 25.00 30.00
19-5-31. 356 568 811
1177 1504
2.25 2.07 1.85

560
Exp. 46, 21-5-31.
Time
10.45 12.05 14.15 15.30 16.55
Temp.
11.00 16.00 21.00 26.00 16.00
Assim.
302 474 757
1089 484
Qio determ.
1
[) 2'51 ) \ 2.30
'J 2.25
It is of importance to know this, because it appears, that, in spite of the different properties which the way of cultivation can create (Chapters VI, VIII), the temperature coefficient of the reaction remains unchanged.
The experiments mentioned here have all been made with the Hormidium strain of van den Honer t . A similar result was obtained with P r ingshe im's strain.
It is remarkable that my results give a higher Q10 than van den Honer t found with the same alga, though the difference is not very large. He found from 12—20° 1.87, whereas I find 2.15. Deviating values were sometimes stated, so that this want of uniformity is apparently inherent in the material used.
C. The Influence of Temperature on Respiration. The measuring of Q10 of the respiration presents some
difficulties. A falling respiration will be found when algae are taken from the window and placed in darkness. To prevent this the culture was placed in the dark on the preceding evening.
Good results were also obtained by the experiments 33—-35 in Chapter VI, in which periods of darkness alternated with weak illumination.
In table 9 the results of the experiments are combined. Only with one experiment (50) the results deviate and a high Qio was found at a rather high temperature. In the other experiments the determined value was reduced

561
TABLE 9. The influence of temperature on respiration.
Van den Honert's strain. 100
Exp. 48, 20-11-30. Conversion factor — 138
Time
11.25 13.30 15.50
Temperature
8.00 13.00 18.00
Respiration
57 96
117
Respir. converted '
41 70 85
Exp.
10.50 12.10 13.30 14.50 16.05 17.10 18.30
11.10 12.40 14.20 15.30 16.50
Exp.
10.10 11.25 12.20 14.20
Exp.
11.15 13.35 14.55 16.15 17.25
49, 18-2-31. Conversion factor
9.00 14.00 19.00 24.00 29.00 34.00 19.00
Exp. 50, 33.50 28.50 23.50 18.50 28.50
51, 16-5-31. C
13.40 18.40 23.40 : 28.40
52, 19-5-31. C
10.00 15.00 20.00 25.00 30.00
24 37 40.5 67 92
125 40
5-3-31. 92 43 28.5 18 57
imversion factor
25 33 48 71
onversion factor
26.5 32.5 53 68 81
100
'~52
100
38
100
5T
46 71 78
129 177 240 77
— •
— — — —
66 J37 126 187
52 64
104 133 159
36

562
Exp. 53, 21-5-31. Conversion factor 100 34
Time
10.50 12.40 14.15 15.30 17.00
Temperature 11.00 16.00 21.00 26.00 16.00
Respiration 22.5 26.5 35.5 48 27.5
Respir. converted
66 78
104 141 81
Exp. 33, 22-5-31 (table 5). Conversion factor 100 38
11.35 13.55 16.15 18.25
10.00 16.00 22.00 28.00
Exp. 34, 27-5-31 (table 5
10.45 12.40 14.50
28.00 22.00 16.00
Exp. 35, 3-6-31 (table 5
10.25 12.30 14.40
14.00 20.00 26.00
16.30 j 20.00 17.30 14.00
17 30 43 59
). Conversion factor
42 32 21
i. Conversion factor
24 40 56 40 19
45 79
113 155
100 28
150 114 75
100 "38
63 105 147 105 50
again to a respiration of 100 at 20°. I thought it better to exclude from this the deviating result of exp. 50, which was possibly caused by too high heating. The values calculated are graphically represented in fig. 12.
The individual deviations are also very large here. The respiration is rather small, and the experimental error for that reason larger. Yet the curve can be pretty accurately determined. The great resemblance with the temperature

563
curve of the assimilation is very striking. Q^ has been determined from the curve, the values are to be found in table 10.
250
200 -
B 12 K 20 24 28 32 34
Fig. 12. The influence of temperature on respiration in Hor-midium (rate of respiration at 20° put at 100).
Q10 is but a little lower than the coefficient of the assimilation. This agreement is of course no proof that the assimilation proceeds under the control of other processes, connected with the respiration, but seeing that we shall

564
observe other points of agreement between the two processes later on, it is certainly important that the temperature coefficient does not speak against the idea of an indirect action of temperature on the assimilation.
It is interesting that with Hormidium the respiratory Q10
is even a little more constant than the Q10 of assimilation. This may point to the fact that the whole respiratory reaction complex at all temperatures is possibly controlled by one part of the process.
TABLE 10. Temperature-coefficient of respiration, compared with
the coefficient of assimilation.
Temperature
10—20 15—25 20—30
Q10 respiration determined
2.06 1.87 1.80
Q10 respiration corrected
2.09 1.91 1.85
Q10 assimilation corrected
2.24 1.96 1.87
The temperature characteristic \x is from 15° to 25° calculated at 11000.
CHAPTER VIII.
The Influence of Potassium Cyanide on Assimilation and Respiration.
A. Introduction. Warburg investigated the influence of prussic acid
on assimilation. He stated that pussic acid has, in a weak concentration, a retarding influence on assimilation, when temperature is the limiting external factor, that this retardation, however, does not appear when light is the limiting factor. From these facts Warburg concluded that photosynthesis is at least composed of two stages, one of which, the Blackman reaction (the chemical part of the assimilation), would be sensitive to H C N

565
only, and that this process would be brought about by a heavy metal catalysis. Another fact found by Warburg is that assimilation, in case of increasing concentration of the cyanide, cannot be retarded beyond a certain limit. This limit is the compensation point of carbon dioxide assimilation and respiration. Warburg is of opinion that a high prussic acid concentration completely retards the splitting off of the 0 2 from the C02 , but not of the 0 2
from the respiratory products. The photochemical mechanism remains, therefore, unimpaired, but only the dark reaction in which an active derivate of C02 is produced, is inhibited.
Warburg could not find a similar action on respiration. On the contrary, respiration appeared stimulated by concentrations where the assimilation became greatly retarded. Retardation does not set in until in a concentration of Vi« mol. (Warburg 1921).
Another investigator who made assimilation experiments with prussic acid was Emerson (1929). He found that Chlorella, grown in a nutrient solution deficient in Fe, are poor in chlorophyll, and more sensitive to H C N than normal cells. Therefore Emerson is of opinion that chlorophyll not only takes part in the photochemical reaction, but also in the chemical one. I would, however, observe that the chlorophyll content of cells grown in a solution deficient in Fe, is certainly the only visible point of difference, but that it is also to be expected that it is the Fe containing enzyme that will haye been diminished by this treatment.
I studied the influence of potassium cyanide on respiration. and assimilation with different light intensities again for Hormidium (van den Hone r t ' s strain).
B. Experiments with Low Concentrations of K C N, Showing a Stimulating Influence.
Vioooo mol. K C N is added to the algal film in experiment

566
54. This concentration will probably soon diminish by-evaporation. Table 26 gives the result, which appears even more clearly from fig. 13. It shows that the assimilation is increased by the addition of K C N. It is important that this does not occur only, when temperature is the limiting factor, but that the whole light intensity-assimilation curve rises to a higher level. In strong light the increase is 27 %, in weak light 18 %.
TABLE 11 (fig. 13).
Stimulating influence of a treatment with 1
mol. KCN at 10000
different light intensities.
Exp. 54, 26-3-31. Van den Honert's strain. Temp. 18.00°.
+
Solution
normal tt
tt
ft
^ mol.KCN
« « „ « „
Time
10.35 11.15 12.05 13.00
14.25
15.15 16.05 16.50 17.25 18.30
Light intensity
mitted
2300 611 205
0
1000
205 455
1000 2300
0
voltage
220 221%
—
—
223 223 223
— —
corrected
(2300) 611 210
0
(1040)
215 477
1048 (2400)
0
Assimil-
413 295 130
—29
488
158 316 478 526 -38.5
Increase
in per cent
+ 30
+ 18 + 25 + 27 + 27 + 33
The respiration has also increased; the increase is 33 %. In the following experiments, recorded in table 12, a
similar stimulation, both of assimilation and respiration is found.
Experiments 55 and 60 were carried out in the same way as exp. 54. The evaporation of prussic acid was prevented

567
in the other experiments by adding K C N in an equal concentration to the bufferj[mixture. In some experiments the increase is rather considerable. Both in experiment
.500
4/W
300
200
•wo
t:
't f
" //
^
1
with O'OOOI moi KCN
normal . §
C/gfifirttenstfy
Fig. 13. Stimulating influence of the addition of a low concentration of KCN on photosynthesis in Hormidium. The assimilation is increased in low and in high intensity of light; increase in respiration 33%.
TABLE 12.
The influence of low KCN concentrations, not added to the buffersolution.
Exp. 55, 30-3-31. Temp. 19.00°. KCN —— mol. F F 2000
Solution
normal
tt
+ ^ ^ mol. KCN 2000
tt
tt
tt
Time
11.15 12.00 12.55 13.45
15.20
16.20 17.10 18.20 19.30
Light intensity
transmitted
2300 611 205
0
1000
205 455
0 2300
voltage
222% 2213/„
223
222 223
corrected
(2300) 606 201
0
1000
202 455
0 2300
Assimilation
472 /
278 121 -38
397
135 254 -39 533
Increase in per cent
•
+ 6
+ 11 + 14 + 3 + 13

568
Exp. 56, 25-4-31. Temp. 19.00°. KCN 1
50000 mol.
Solution
normal ft
tt
tt
+. —[— mol. KCN 5Q000
it
>t
Time
10,15 11.00 11.45 12.40
14.00
14.45 15.30 16.25
Light intensity
transmitted
2300 611 181
0
2300
611 181
0
voltage
2221/2
223
—
224 224%
corrected
2300 606 181
0
2300
621 185
0
Assimilation
504 382 154 -42
541
408 165 -45.5
Increase in per cent
+ 7
+ 3 + 6 + 8
Exp. 57, 30-4-31. Temp. 19.00°. KCN 1
+ 20000
normal
mol. KCN
20000 mol.
10.25 11.05 11.55 13.00
14.40
15.20 16.10 17.10
2300 611 181
0
2300
611 181
0
— 224 2243/4
—
—
224 y2
224% —
(2300) 611 182
0
(2300)
616 182
o
595 410 139 -50
751
455 155 -55
+ 26
+ 11 + 12 + 10
Exp. 58, 11-5-31. Temp. 19.00°. KCN 1
10000 mol.
1 10000
)rmal tt
mol. KCN
tt
tt
•>
15.20 16.10
17.30
18.30 19.30 20.20
2300 0
2300
0 2300
0
— —
—
— —
— —
—
— — —
766 -63.5
659
-57 777 -61
— 14
— 10 + 1 — 4

569
Exp. 59, 13-5-31. Temp. 19.00°. KCN 1
40000 mol.
Solution Time Light intensity
transmitted
voltage corrected
Assimilation
Increase in per cent
normal
1 40000
mol. KCN
12.05 13.00
15.05
16.05 17.05 18.10
2300 0
2300
0 2300
0
10000 added to the buffer solution.
1 10000
Exp. 60, 15-5-31. Temp. 19.00°. KCN
normal it
mol. KCN
1
1132
-43
1167
-57 1140 -54
mol., not
+ 3
+ 33 + 1 + 26
11.30 12.30
14.50
15.55 16.55 17.50
2300 0
2300
0 2300
0
— —
—
— — —
— —
—
— — —
876 -46.5
919
-49 969 -45
+ 5 + 11 — 3
55 and in 57 the assimilation rises with the same amount in strong and weak light. In exp. 57 an initial strong increase seems gradually to become a little smaller. The fact, found in experiment 54, viz. that the respiration behaves like the assimilation, is generally confirmed. That the respiration cannot be determined with great precision must not be overlooked, however.
It appears in experiment 58, contrary to what was found in exp. 54, that the concentration 1/10000mol. already retards the assimilation. After the lapse of a few hours, however, a recovery sets in and the retardation passes into an acceleration. Later on we shall repeatedly meet with this phenomenon. Also the respiration recovers a little.
L

570
C. Experiments with Higher Concentrations of K CN, Showing a Retarding Influence,
In these experiments K C N was added, besides to the alga, also to the buffer-mixture.
In the first place I call the attention to exp. 61, which shows the same type as 58, described above, and even more distinctly. The addition of Viooo m°l* K C N causes an initial fall of 13 %, which, after some hours has changed into an increase of 21 %.
TABLE 13.
Retarding influence of KCN, changing in course of time into an increasing one. Van den Honert's strain.
Exp. 61, 5-5-31. Temp. 19.00°. KCN — - mol.
Solution
normal » tt
>i
+ ^ mol. KCN 5000
» tt
tt
tt
tt
Time
10.20 11.05 11.55 13.00
14.30
15.15 16.05 17.15 18.10 19.15
Light intensity
mitted
2300 611 205
0
2300
611 205
2300 0
2300
voltage
221 22P/4
—
—
2213/4 222
— — —
corrected
(2300) 604 205
0
(2300)
611 206
(2300) 0
(2300)
Assimil
ation
360 260 121 -28
313
248 128 405 -30 434
Increase in per cent
— 13
— 5 + 5 + 13 + 7 + 21
Most remarkable is the result of the experiments 62 and 63, which were made two days later, in quite the same way as exp. 61 (cf. table 14).
The retardation is extremely strong in exp. 62, somewhat less in 63. In both the assimilation does not show any inclination to recover; it has on the contrary, diminished

571
again after three hours in exp. 63. Respiration is little affected, in exp. 62 a slight decrease, in exp. 63 even an increase.
TABLE 14.
Strong retardation of photosynthesis after the addition
of —— mol. KCN. 5000
Exp. 62, 7-5-31. Temp. 19.00°. KCN — - mol. (addition at 13.03).
Solution
normal «
+ r ^ - mol. KCN 5000
„ „ „ it
il
Time
11.35 12.30
13.40
13.50 14.00 14.10 14.20 14.55
Light intensity
2300 0
2300
ty
tf
ft
tt
0
Assimilation
per hour
941 — 51
± 5 1 2
± 3 4 4 ± 2 3 0 ± 170 ± 1 5 2 — 44
Increase or decrease
in per cent
— 84 — 14
Exp. 63, 7-5-31. Temp. 19.00°. KCN —— mol. (addition at 17.25). 5000
normal
+^^ mol. KCN 5000
16.10 17.00
18.07
18.20 19.15 20.15 21.10
The momentary disposition of the alga is apparently of great influence on the rate of retardation. In those days warmer weather had set in. This remarkable behaviour
2300 0
2300
if
0 tt
2300
856 -46.5
438
365 -49.5 -53 311
^ - 49
— 57 + 7 + 14
— 64

F ' I I
572
TABLE 15. Retardation of assimilation and respiration by the addition
of higher KCN concentrations.
Exp. 64, 23-4-31, (fig. 14). Temp. 19.00°. KCN mol.
! h
Solution
normal tt
tt
*t
+m moL KCN
tt
tt
tt
normal tt
tt
tt
Time
10.25 11.35 12.20 13.20
14.50
15.45 16.35 17.15 19.55 20.40 34.00 35.05
Light intensity
transmitted
2300 611 181
0
1000
0 181
2300 2300
0 2300
0
voltage
221 223
—
223 y2
— 223%
— — — — —
corrected
(2300) 621 190
0
1056
0 191
(2400) (2400)
0 — —
Assimilation
826 506 201 -50
315
-18 100 230 476 -55.5 827 -55
Increase
decrease in
per cent
— 62
— 64 — 51 — 72 — 42 + 11 + 0 + 10
Exp. 65, 10-4-31. Temp. 19.00°. KCN —- mol. 400
normal
+—- mol. KCN 400
10.55 11.40 12.35 13.30
15.00
15.50 16.35 17.15 17.55 18.50 19.50
2300 611 205
0
1000
205 455
1000 2300 611
0
221 — —
218
219 220 223
— 223
(2300) • 621
( 205) 0
968
202 455
1048 (2400)
640 0
581 401 160 -43
111
69 106 98 78 88.5
-36
— 78
— 56 — 67 — 81 — 87 — 79 — 16

573
is all the more striking, when we compare it with exp. 64 and 65 of an earlier date. The concentration of K C N was much stronger, 1jmo and 1ji00 mol., the retardation not stronger than in exp. 62.
eoo
100
600
500
mo
200
iOO
-
-
C
" • I
/
ƒ
/ S
*W
I
amooi mol KCN
J0&^
1
0
" . „
lightintensify
Fig. 14. Retarding influence of the addition of KCN on photosynthesis in Hormidium. Contrary to Warburg's results with Chlorella, the assimilation in Hormidium is retarded in high as well as in low light intensity. Decrease of respiration 64 %. The „optimum type"
of the KCN-curve is possibly incidental. D Rate of assimilation 2 hours after the expulsion of KCN. O Rate of assimilation 16 hours after the expulsion of KCN.
Results of experiment 64 are given in table 15. Contrary to W a r b u r g ' s result with Chlorella, we find that the-assimilation is retarded in weak as well as in strong light, although to a somewhat smaller measure in weak light (fig. 14). Exp. 64 is the only example where a corresponding strong retardation of the respiration is found. In very strong light the assimilation seems to decrease. It is not settled yet, if this really points to the existence of a light-

574
assimilation optimum; perhaps the retardation had become a little stronger after some time.
It has been investigated whether the retardation is reversible. The respiration recovered immediately indeed, the assimilation increased, though a considerable retardation remained. The next morning, however,it appeared that also the assimilation had regained its old value.
In exp. 65 (table 15) the retardation is stronger, and, besides, increases a little in course of time. In weak light the retardation is distinct, though again somewhat smaller than in strong light. There is again a flat assimilation-optimum. We may perhaps explain this by an increase of respiration in the stronger light.
D. Experiments, Showing a Complete Inhibition of Assimilation after the Addition of K CN,
Finally, in two experiments, a complete stopping of the carbon dioxide assimilation was observed (table 16).
The concentrations V20C0 a«d V1000 mol., which were used, show how this phenomenon of retardation is independent of the concentration used, but seems to depend on the individual disposition of the alga. In the first experiment the respiration had not been changed; in the second it had been retarded, though not altogether wanting. In exp. 66 there is still at first some assimilation, which disappears gradually; in exp. 67 the assimilation is directly stopped altogether.
Both experiments are contradictory to the results of Warburg, as according to him the retardation would stop at the compensation point of assimilation and respiration. An explanation of this deviating result of Warburg may perhaps be attempted, when we observe that the assimilation under the influence of K C N was not directly brought to a standstill. When the assimilation is determined directly after the adding of K C N , as

575
TABLE 16. Complete inhibition of photosynthesis after the addition of KCN.
Exp. 66, 13-5-31. Temp. 19.00°. KCN - ^ - mol. 2000
Solution
normal »
+^^ mol. KCN 2000
« ft
it
tt
Time
12.05 13.00
14.45
15.05 16.10 17.10 18.10
Light intensity
2300 0
2300
tt
0 2300
0
Assimilation
per hour
769 -32
120
75 -33
7 -31
Increase or
decrease in
per cent
— 84
— 90 + 3
— 99 — 3
Exp. 67, 15-5-31. Temp. 19.00°. KCN ~j-~ mol.
normal
+ ̂ m ° 1 - K C N 1000
11.25 12.30
14.15
14.40 15.00 15.55 16.55 17.50
2300 0
2300
tt
tt
0 2300
0
844 -34
81
35 - 4.5 -21 - 6 -21
*)
*)
— 90
— 96 — 100 — 42 — 100 r- 42
W a r b u r g did, we may continually find a slight assimilation. As for the rest it is not excluded that Chlorella behaves otherwise than Hormidium.
J) Apparent assimilation (-25.5) + respiration in the dark (21) = — 4.5. The respiration in light is apparently stronger than in darkness.

576
E. Discussion of the Experimental Results. Let us combine the results of the above experiments
in a few words. It appeared that Warburg ' s results could not be confirmed. The addition of potassium cyanide caused a retardation not only when temperature, but also when light was the limiting factor. So on this ground it is not possible to distinguish two processes, one of which would be sensitive to K C N („Blackman reaction").
It is, moreover, important that this retardation may disappear in course of time, and pass into an increase. This speaks strongly against Warburg ' s conception. It seems to me that the action of the K C N is much more complicated.
The fact that the same concentration of K C N on different days, can influence Hormidium (cultivated under rather constant conditions before a north-window) very differently, seems unaccountable in a simple way. It cannot be assumed that the quantity of heavy metal, probably Fe, which is, no doubt, present in unlimiting amount, would be so highly subjected to fluctuations in the cells.
This is also a reason to doubt Emerson ' s results. Even small differences in the way of cultivation cause a much changed sensitivity. This may also be the cause of the different behaviour of normal-Chlorella and Chlorella cultivated in a sugar solution deficient in Fe.
Another fact on which Warburg has built up his theory, the impossibility to retard the assimilation below the compensation-point of assimilation and respiration, could not be confirmed with Hormidium.
It stands to reason that it is not excluded that Chlorella and Hormidium behave quite differently in this respect. At any rate it appears, however, that no general validity may be placed on these facts and the theory built up on them.

577
Moreover it is an important fact that the assimilation can be stimulated by a small dose of K C N and that to the same extent, no matter whether either temperature or light is the external factor which limits the process. This fact, added to the observation that a uniform retardation also enters under both conditions, speaks strongly against the conception that in both cases different processes govern the assimilation. On the contrary, the uniformity of the controlling process is made plausible by these facts.
The stimulation of the assimilation in weak light is also important for another reason, because it appears from it that it is not the available light energy as such that limits the rate of assimilation. If this were the case, a stimulation would be impossible. That this stimulation is possible shows us that the assimilation, also when light is limiting, is not exclusively dependent on the quantity of light energy added, but at the same time on internal processes. (It may be possible that they themselves are connected again with the light intensity). Consequently it is not true either that the photochemical part of the process exclusively controls the entire reaction-chain under these circumstances, as is now generally accepted.
Other investigators who found a stimulation of the assimilation, are Bose (1924), who obtained stimulation with much more diluted solutions, and Schmucker (1928), who discovered an increase of the assimilation of Cabomba aquatica in diluted ether of 0.125 % and alcohol 0.3—1 percent. Sabali tschka and Weidling (1926) found a 100 % increase in acetaldehyd; Schmucker could not confirm this statement (cf. further Ch. X).
We have seen that assimilation can be uniformly retarded and uniformly stimulated under different circumstances. In case of retardation, we might think of an injury of the assimilatory apparatus, in other words of direct
37

578
action of the poison on the assimilatory process. The fact that also stimulation has been found, and even a retardation may pass into a stimulation, points to the action being indirect, and that the assimilation is affected „from the interior". Therefore it is obvious that we must inquire into the other metabolic processes of the organism. The extent of the respiration can give us a hint on this metabolic state. We find indeed that a stimulation of the assimilation goes parallel with a stimulation of the respiration. When the assimilation was slightly retarded, the respiration too appeared to have decreased. These facts speak for the idea that the increase or decrease of assimilation is a result of the behaviour of other vital processes.
A strong retardation of the respiration accompanied a corresponding decrease of the assimilation only in one case (exp. 64). In the other experiments the contrary proved to be the case. This fact which is in accordance with the results of older investigations on the action of K C N and narcotics makes the above idea, which lays a connection between assimilation and other vital processes uncertain again. It does not imply a refutation, however. In order to escape this difficulty we need only take that in case of highly injurious stimuli a strong retardation arises through the direct action of the poison on the assimilatory apparatus. Another possibility is that a stronger poisoning calls into existence an increase in respiration, in the same way as e.g. wounding may act as a respiratory stimulus.
CHAPTER IX.
The Influence of Phenylurethane on Assimilation and Respiration.
It was Claude Bernard who discovered the retarding action of narcotics on the assimilation of carbon dioxide (1878). After him others, among whom Bonnier and

579
Mangin (1885), Ewart (1896, 97, 98), Jacobi (1899), I rv ing (1911), Thoday (1913), also dealt with this subject. As a result of these investigations it appeared a.o., that photosynthesis is retarded by concentrations that have no influence on respiration.
The question has been thoroughly reinvestigated by Warburg (1919, 20), who stated that the assimilation is retarded in about the same degree, whether light, C0 2 or temperature is the limiting factor of the process. From this Warburg concluded that photosynthesis is a surface-phenomenon, just like respiration. The action increases in a homologous series with the adsorbability. Warburg confirmed that higher concentrations are necessary to retard the respiratory process.
In Chapter V I discussed already some experiments in which the assimilation of C0 2 was investigated when phenylurethane or antipyrin had been added. Both substances appeared to retard the assimilation.
Though Warburg already showed that the assimilation altogether recovers after removal of the narcotic, I performed a few experiments on the matter.
The assimilation was measured before, during and after the narcosis. The narcotic was removed by transferring the alga on its old nutrient medium, part of which had been reserved for this purpose. This is not an absolute removal, but it is certainly a very strong dilution. The experiments showed that the recovery is perfect. There may even be a slight increase after the removal. This manifests itself distinctly in experiment 69. The increase amounts to 25 %, notwithstanding a slight loss of material during the transfer. This is much more than could be caused by „growth". According to van den Honer t the correction for growth should amount to 5.7 per cent in this experiment. We see the phenomenon is more complicated than a simple physical removal of the narcotic from the surfaces.

580
I thought it interesting to determine the action of phenyl -urethane on the whole light intensity-assimilation curve, just as was done when studying the influence of potassium cyanide. An example of such an experiment we find in table 17, graphically represented in fig, 15. In this figure the experimental points are numbered, the numbers indicating the time at which the determinations were made. It directly appears, in this and all following experiments, that the assimilation recovers from the first decrease, as
TABLE 17.
The influence of phenylurethane on the assimilation at different light intensities.
Exp. 71, 23-3-31, (fig. 15).
No.
1 2 3 4
— 5 6 7 8 9
—
Solution
normal
„ „ ,, „
4- phenylurethane
„ tf
tt
» tt
Time
11.30 12.35 13.35 14.15 15.10 16.15 17.00 18.20 19.30 20.10 21.00
Temp. 18.00°. Phenylurethane 2.4 X 10-
Light intensity
transmitted
2300 205 455
1000 0
1000 455 205
2300 1000
0
voltage
2221/2 222 y2
— —
222 222
— —
224 —
corrected
2300 207 459
1000 0
1000 455
(205) (2300) 1032
0
Assimilation
593 158 331 492 -31 246 165 110 428 346 -27
-4 mol.
Increase or
decrease in
per cent
— 50 — 51 — 30 — 28 — 31 — 13
will be clear from a comparison of the points 5 and 9. A curve has been drawn through the points 7, 8 and 9. The decrease appears to be uniform over the whole region, which is in accordance with Warburg's results with urethane, but also with my own results with potassium cyanide. Respiration has also diminished by 13 per cent.

581
Experiment 72 (table 18) gives the same results. Recovery is even more apparent. A comparison between the numbers 4, 7 and 9 shows this, but at the same time it is clear that the difference between 7 and 9 is not great, so that after some time a constant rate of assimilation seems to be reached. Retardation of respiration is as large as of assimilation. This points again to the possibility of a connection between the two processes, of which examples were also found in the preceding Chapters (VII and VIII).
Ugh tintensity
Fig. 15. Retardation of photosynthesis in Hormidium after the addition of phenylurethane. The figures 1—9 show the successive experimental values. In agreement with Warburg's results, the assimilation is retarded in high and in low intensity of light. There is a recovery of the assimilation as is shown by the difference of the values 5 and 9. Decrease
of respiration 13 %.
One may ask whether also respiration shows an initial strong retardation that decreases later on. An answer to this question is sought in experiments 73—76 recorded in table 19. In these experiments a recovery of respiration always occurred, though the results are not altogether convincing. The finest example is supplied by exp. 76. Retardation decreases uniformly, and the depression of the respiration is in an ideal way in accordance with that of the

582
assimilation. Whatever may be the cause of this recovery, it might be based on the urethane being oxidised, at any rate it is of importance, as the uniform retardation of assimilation and respiration is here illustrated in an unambiguous way.
This supposition of the oxidizing of the urethane is, however, unlikely on other grounds. In the first place it
TABLE 18.
The influence of phenylurethane on assimilation. Exp. 72, 24-3-31. Temp. 18.00°. Phenylurethane 2.4 x 10⁻⁴ mol.
No.
1 2 3
— 4 5 6 7
— 8 9
10
Solution
normal
„ „ »
+ phenylurethane » tt
tt
ft
tt
it
tt
Time
10.30 11.10 11.55 12.55 14.55 15.40 16.25 17.20 18.20 19.25 20.15 21.05
Light intensity
transmitted
2300 611 205
0 1000 455 205
1000 0
205 1000 2300
voltage
220 221%
— 221 y4
221 — — —
224 — —
corrected
611 210 —
1020 462 — — —
218 — —
Assimilation
718 430 173 -26.5 322 206 127 483 -22 169 522 584
Increase
decrease in
per cent
— 45 — 41 — 26 — 18 — 17 — 6 — 12 — 19
appears that the retardation has not quite disappeared even after several hours, but has only diminished. Also the experiments in Chapter V seem to contradict it. How could I have found the deviating result, represented in fig. 6, if the urethane had lost its efficacy? And finally there is the analogy with the action of KCN and Ba CI (Chapter VIII and XI), where oxidation is out of the question.

583
Exp.
TABLE 19. The influence of phenylurethane on assimilation and
respiration in course of time. 73, 22-4-31. Temp. 19.00°. Phenylurethane 2.9 x 10-* mol.
normal
Time
10.25 11.30
Assimilation
519
Respiration
54
Time
13.10 14.15 14.45 16.35 17.40
with phenylurethane
Assimilation
412
497
Respiration
48
52
51
Decrease in
per cent
— i l — 21 — 4 _ 4 — 6
580 29.5
14.15 15.15 16.35 17.30
257
389 20
22
11.30 12.30
619 26.5
13.50 14.40 15.55 16.30 17.25 18.25
318
453
524
22
21
24.5
Exp. 74, 27-4-31. Temp. 19.00°. Phenylurethane 2.8 x 10⁻⁴ mol. 11.00 1 580 I 14.15 257 I j — 56 12.10 ' 29.5 ! 15.15 ! 20 | —33
— 32 — 25
Exp. 75, 4-5-31. Temp. 19.00°. Phenylurethane 3.0 x 10⁻⁴ mol. — 49 — 17 — 21 — 21 — 15 — 8
Temp. 20.00°. Phenylurethane 2.7 x 10⁻⁴ mol. — 22 — 13 — 9 — 7 — 4
I consider this analogy of great importance. The assimilation reacts in all cases in a similar way, it does not matter which poison is the cause. The conclusion is evident that the initial large retardation is caused by a temporary lowering of the vital intensity of the protoplasm, which slowly recovers from the „shock". The decrease, and recovery
Exp. 76, 11.30 12.35
709 45
14.25 15.30 16.30 17.30 18.30
617
658
35
41
43

584
afterwards, of the respiration also points in this direction* So it is not a mere matter of course that the urethane exclusively acts by diminishing the available surface of the assimilatory apparatus. On the contrary, it appears that something may be said in favour of an indirect influence of the injurious substance. Also the above-mentioned fact that the assimilation has been accelerated after the removal of the narcotic, and not simply recovers its former rapidity, is an argument in favour of this conception.
I made another attempt to prove, in a more direct way, that the urethane is not oxidized by the cells (exp. 77). I applied to a recovering algal film the same dose of urethane. In case the assimilation did not fall again, I should have proved that the urethane was not oxidized. However, the reverse appeared to be true. The retardation of 26 % had fallen to 7 %, a new dose enhanced it to 30 %, after some time it was 15 %. Though the result is in accordance with the supposition of oxidation of urethane, it has not conclusively proved it. It is not at all unlikely, that, owing to the absorption of the alga, the concentration of urethane in the liquid of the film had quickly diminished, and that, therefore, the addition of fresh urethane had caused the new decrease of assimilation.
Experiments 78 and 79 give us an insight into the influence of other concentrations.
The very slight concentration in exp. 78 (2.4 X 10"5 mol.) causes a small decrease (ass. 5—14 %, resp. 10 %) , after which no noticeable recovery sets in. Stimulation does not occur here.
Exp. 79 is made with a stronger solution (1.2 X 10"3 mol.) The retardation is considerable, but diminishes gradually (from 77% to 50%). Respiration has been retarded less strongly, but recovers in the same way (from 15 % to 5 %) . This, too, is in accordance with the results with potassium cyanide; assimilation is more sensitive to high concentrations of the injurious substance than respiration.

585
CHAPTER X.
The Influence of Glucose and Fructose on Assimilation and Respiration.
The preceding three chapters more or less all point to a connection between photosynthesis and respiration. It was a matter of course that an investigation of the assimilation under circumstances under which respiration increases was now to be taken in hand.
A great many investigators, of whom Borodin (1876) was the first (further: Aereboe (1893) Meyer and Deleano (1911, 13), Kniep (1914), Pantanel l i (1914), Harder (1915), Plaetzer (1917) have shown the increase of respiration after illumination. This increase was ascribed to the production of oxidizable materials. Warburg (1922), Emerson (1927) and Genevois (1927) directly showed an increase of respiration by adding sugars to the algal suspension. In a preliminary experiment I could confirm this with Hormidium (a pure culture; increase 33 % in 0.7 % fructose). If I should also succeed in stimulating the assimilation under these conditions, then the relation between assimilation and respiration, or, at least, between assimilation and other protoplasmic processes connected with respiration, would be very convincingly obvious, because from a chemical point of view a retardation of assimilation should be expected rather than an acceleration, as sugars are indeed the final products of assimilation.
Spoehr and Mc Gee (1923) have observed that the, sugars disappear out of the leaves in darkness, and that after a long stay in the dark the rate of assimilation has diminished. After continued exposure to light, both the rates of assimilation (cf. also Os terhout and Haas, 1918; Harder , 1930; A r no l d 1931) and of respiration increase with time as the sugar content increases. They

586
consider this increase of assimilation as a result of the increase of sugar-content and respiration.
So the connection between assimilation and respiration, according to Spoehr and Mac Gee, consists in a dependence of the former on the latter. It would appear, however, even more convincingly, when the supply of sugar took place from the exterior, because in that case it would be proved that the increase of sugar content was really the cause of this phenomenon.
T reboux (1903) examined the action of sugars, and found that they lower assimilation in Elodea. The concentrations studied were high, and the lowering was probably caused by osmotic action, as T reboux thought.
I added the sugar by dropping a number of drops of a sugar solution on the algal film. Beforehand I removed the nutrient solution for the greater part by means of filter-paper, so that the final solution, was only a little more diluted than the solution added.
The sugars investigated were glucose and fructose. The action was investigated both in strong and in weak light. The Hormidium strains of Pr ingsheim and van den Honer t were both used. The results of the experiments are to be found in table 20.
From these experiments an increase of assimilation appears, when a sugar solution of a concentration of 0.7—1.0 % was added, both with the pure culture of P r ingsheim and van den Honert 's strain. In a 2 % solution Pringsheim's strain gave a slight lowering of C02 assimilation. In strong light the increase is, to be sure, not exceedingly large, the values found are 5, 12, 9, 12, 5 and 6 % ; but an increase of 655—730inexp. 82 and another of 1097—1199 and 1233 in exp. 83 far exceed any experimental error. I consider the increase in weak light of great importance. This result is a confirmation of the results of experiments communicated in Chapter VIII,

587
in which it has been proved that in low light intensity assimilation is stimulated by the addition of a small dose of KCN.
TABLE 20.
The influence of glucose and fructose on assimilation and respiration.
Exp. 80, 8-5-31. Pringsheim's strain. Temp. 19.00°. Glucose 1 %.
Solution
normal ft
+ glucose tt
Time
10.45 11.30 12.30 13.25
Light intensity
transmitted
2300 0
2300 0
voltage
=
corrected
—
Assimilation
422 -29 444 -44
Increase or
decrease in
per cent
+ 5 + 52
Exp. 81, 8-5-31. Pringsheim's strain. Temp. 19.00°. Glucose 2 %. normal
+ glucose
15.00 15.45 16.50 17.30
2300 0
2300 0
— — — —
— — — —
396 -24 372 50
— 6 + 108
Exp. 82, 9-5-31, Van den Honert's strain. Temp. 19.00°. Glucose 0.8 %.
normal tt
+ glucose
10.20 11.05 12.10 12.50
2300 0
2300 0
— — — —
— — — —
655 -56 730 -52
-I- 12 — 7
Exp. 83, 12-5-31. Van den Honert's strain. Temp. 20.00°. Glucose \ %.
normal tt
-t- glucose tt
tt
normal
11.40 12.35 13.50 14.45 15.50 17.15 18.20
2300 0
2300 0
2300 2300
0
— — — — — — —'
— — — — — — —
1097 -74
1199 -63
1233 1277 -78
+ 9 — 17 + 12 + 16 + 5

588
Exp. 84, 23-5-21. Pringsheim's strain. Temp. 20.00°. Glucose 0.7 %.
Solution
normal it
tt
+ glucose
»
Time
10.20 11.10 11.55 13.05 13.55 14.30
Light intensity
transmitted
2300 181
0 181
2300 0
voltage corrected
221%
223
181
186
Assimilation
570 190 -49 226 599 -50
Increase or
decrease in
per cent
+ 15 + 5 + 2
Exp. 85,25-5-normal
31. Van den Honert's strain. Temp. 20.00°. Fructose 0.7 '
fructose
Exp. 86, 29-5-normal
t*
+ fructose
15.15 16.05 17.00 18.45 19.55 21.00
2300 140
0 140
0 2300
— 218 y2
— 223%
— —
— 137 — 148 — —
860 181 -42 233 -62 914
+ 18 + 47 + 6
•31. Van den Honert's strain. Temp. 20.00°. Fructose 0.7 %. 14.50 15.35 16.40 17.10
140 0
140 0
2203/4
— 2203/4
—
140 — 140 —
198 -32 221 -37
12 15
It is peculiar that the respiration shows a decrease in two experiments. It is more or less clear that respiration decreases when the alga is taken away from daylight (Chapter III), but it is strange that an addition of the sugar does not counterbalance this effect.
Exp. 83, where I met with this phenomenon, has been continued. The sugar was removed and assimilation and respiration were again determined. The removal appeared to result in a new small increase. The assimilation rose from 1233 to 1277, and was now 16 % higher that in the beginning. Further the increase of respiration was noteworthy, which recovered from 63 to 78, and was now

589
even 5 % higher than at the outset. This may point to the action of the sugar being complicated, too. It may be that the stimulating action is checked by an injurious, possibly an osmotic, action, and that this accounts for the divergence of the results.
One more experiment was made with a culture (van den Honert 's strain) which had stood in the dark continually for 62 hours (exp. 87). The concentration added was 0.7 %. Contrary to the expectation, that now the influence would be great, it appeared not to be so. Respiration really increased by 90 %, but assimilation proved to diminish by 24 per cent.
These few deviating results may, however, not turn our attention from the important fact, that it has become evident in this chapter, that an addition of sugars, which in most cases brings about an increase of respiration, causes, at the same time, an increase of assimilation. This fact points to the assimilation being affected by the protoplasm. According to its being provided with more sugar the assimilation increases, altogether in accordance with the conception of Spoehr and Mac Gee.
The increase also takes place in weak light and this speaks in favour of the unity of the assimilatory process which in its entirety is controlled by internal processes, and not exclusively by external factors. • Now that it appears that the external factor light (when
it is limiting factor) alone does not determine the intensity of the assimilation, but that the effect is also dependent on internal factors, we have to consider the possibility, that the increase of assimilation in stronger light is not exclusively brought about by more energy available for the photosynthetic process, but that the protoplasm, too, is affected by the light intensity, and that the effect of stronger light on the protoplasm promotes the assimilation again. The protoplasm therefore may ultimately determine the rate of the assimilation; the action of the external factor

590
is possibly by means of it; its action may be indirect. This opinion is supported by the fact that light exerts
a strong influence- on the protoplasm (Chapter III). It appears that the organic system itself does not remain unaltered, that among the factors in the photosynthetic process, light is probably not the only variable.
In connection with the described increase of the assimilation by the addition of respiratory material, it should be noted here that S a b a l i t s c h k a and W e i d l i n g (1926) found a stimulation of the assimilation of as much as 100 % by the addition of acetaldehyde, which can also serve as respiratory material. The concentration was small (0.016—0.032 %) and the increase is, according to them, effected by a stimulating action of the substance. This result could not be confirmed by Schmucker (1928).
Finally it may be mentioned that attempts have been made to stimulate respiration and assimilation by putting the algal film in water distilled from glass into glass. After remaining there for some time, this water was again replaced by fresh. For Shibata (1929) has found with Chlorella, that washing with distilled water enhances respiration. In my experiment neither respiration nor assimilation was affected by this treatment,
CHAPTER XI.
The Influence of Ba Cl2 on Assimilation and Respiration.
While in the preceding chapter the question was treated, how carbon dioxide assimilation behaves under circumstances in which respiration is promoted, we shall now put the question how assimilation behaves if respiration has undergone a strong decrease. The reply to the first question appeared to be that under these conditions assimilation

591
was promoted as well. Will this parallelism also repeat itself in case of retardation?
In the preceding chapters we have found instances of a strong retardation of photosynthesis, but a great decrease of respiration is still wanting (except exp. 64 with KCN, where both processes appeared to be greatly retarded). We find the best example in the chapter on the influence of urethane, where both respiration and assimilation were slightly retarded.
The question was now to find a substance that has a retarding influence on the respiration. I found this substance in the paper of Sh iba ta on the antagonistic action of electrolytes on respiration (1929). According to this research the respiration of Chlorella in a solution of one mol. Ba Cl2 is diminished by 80 per cent. This substance seemed suitable to me for that reason, and also, because the depressed respiration, according to the statement of Shibata, remains rather constant, contrary to the result with (likewise strongly retarding) Ca-salts. The concentration I used in my experiments amounts to 0.5 mol.
In Chapter III the decrease of respiration in the dark has been stated. In order to prevent that a decrease of respiration could partly be caused by the influence of darkness (this influence being high in the month of June, as a result of the high light intensity), the algae were placed in the dark for some hours before the experiment.
The nutrient solution was removed by once washing the algal film with distilled water before the addition of Ba Cl2 solution. In table 21 the results of the experiments have been given.
Exp. 89 and 90 have been made in strong light, exp. 91 in weak light. In the former experiments, both respiration and assimilation appear to be strongly diminished, the former (40 and 56 %) even a little more than the latter (25 and 44 %) , but the agreement is nevertheless very sufficient.

592
TABLE 21.
The influence of 0.5 mol. Ba Cl2 on assimilation and respiration. Van den Honert's strain.
Exp. 89, 13-6-31. Temp. 21.00°.
Solution
normal tt
+ 0.5 mol. Ba Cl2
tt
tt
it
Time
10.10 10.55 12.15 12.55 14.00 14.40
Light intensity
._ , voltage corrected nutted ö
2300 0
2300 — —
0 — 2300
0 — —
— — — — —
Assimilation
555 -48 416 -29 478 -32
Increase or
decrease in
per cent
— 25 — 40 — 14 — 33
Exp. 90, 23-6-31. Temp. 21.00° normal
tt
+ 0.5mol.BaCl2
tt
aqua dest. tt
normal
0.5 mol. Ba Cl,
17.35 18.25 20.00 20.45 22.15 23.00
2300 0
2300 0
2300 0
— — — — — —
— — — — — —
1015 -66
± 5 6 9 -29 640 -70
.
Exp.
17.15 18.25 20.05 21.10
91, 25-6-31. Temp
139 0
139 0
221 y4
—
223 & —
. 21.00°.
139 0
143 0
158 -66 127 -29.5
— 44 — 56 — 37 + 6
— 22 — 48
Exp. 89 gives retardation as a function of time. Altogether in accordance with the results of the experiments with potassium cyanide and urethane, we see the recovery of both assimilation and respiration. So it seems that here we have a very general reaction before us, of respiration as well as of assimilation. In the uniform retardation of the two processes and the simultaneous recovery, I see an indication of a connection between both vital processes.

593
It is important that Shibata, too, regularly finds a recovery after an initially strong decrease, and that after the addition of very different electrolytes. From Shibata 's figures this is to be seen at a glance, Ca only excites a continual decrease in high concentrations. The activity of this substance is analogous to the action of higher KCN concentrations on the assimilation.
Ba Cl2 has been replaced again by distilled water in exp. 90. Respiration recovers altogether, assimilation only partly. We have already an example of this phenomenon in exp. 64, where the removal of KCN had a similar effect. We must admit that this certainly does not point to a direct connection between the processes of respiration and assimilation.
Exp. 91 has been carried out in weak light. The retardation of the assimilation seems to be a little smaller (analogy with action of KCN); against a retardation of respiration of 48 %, there is a decrease of 22 % only.
In the last experiment (92) the influence of 1 mol. Ba Cl2 was investigated. Here it appeared that the assimilation was totally, or almost totally inhibited (decrease 574 to 2). On the other hand the respiration still amounted to 23, against 48 before. To strong stimuli, therefore, assimilation is more sensitive than respiration. This also appeared to us when studying the influence ofhigher concentrations of KCN and of phenylurethane.
CHAPTER XII.
The Time Course of Photosynthesis.
A. The Induction-Time of Photosynthesis. 1. Introduction. In the preceding chapters we have
more than once been led to the conclusion that the influence of the external factors is not direct, but that the rate of the assimilation is determined by the inter-
38

594
mediary of the protoplasm. Even when light is limiting and the increase directly proportional to its intensity, it appeared that the assimilation could be stimulated by factors that may cause a similar increase in respiration. When this conception of the indirect action of external factors, is right, then it is to be expected that the assimilation will not reach its full rate directly after the beginning of the exposure to light, but that some time will pass before the protoplasm has adapted itself to the new conditions and the assimilation has come to a constant intensity.
Warburg (1920) already established that in Chlorella the assimilation is indeed smaller in the first minutes, and within a short time rises from nothing to the final value.
Quite in accordance with his physico-chemical conception of the assimilatory process Warburg is of opinion that this increase in assimilatory activity is due to the existence of a photochemical induction-time in photosynthesis.
He came to this discovery, because he began intentionally to investigate, whether photosynthesis is characterized by a photochemical induction period, as has been proved to be the case in other photochemical processes. Therefore, we can readily understand that, when he stated that photosynthesis, too, showed an induction period, he did not think of any other way of explanation of the induction phenomenon, though he remarked that the induction of photosynthesis is not quite identical with the induction of the photochemical reaction of hydrogen and chlorine.
Possibly the influence of light on assimilation is more or less indirect; a change of the protoplasmic structure might be caused by illumination, and of this protoplasmic change the start of the assimilatory process might partly, or totally, be the result.
Certainty is altogether wanting, and calling the phenomenon "photochemical induction" is consequently hypo-

595
thetical. An explanation as proposed here, by which the induction is explained by means of preceding protoplasmic processes that are induced by light, seems equally probable.
It seemed interesting to investigate whether this induction time could also be observed with Hormidium, in order to settle which of the two hypotheses was true. This could be done by investigating the influence of temperature on the phenomenon. If the process were of a physiological nature then temperature had to influence it, just as temperature affects other physiological processes, where light plays a part (e.g. phototropical phenomena). On the other hand no distinct influence of temperature is to be expected from a phenomenon that is merely photochemical.
2, Experiments on the Induction of Photosynthesis at Different Temperatures, The presence of the phenomenon was demonstrated at 20°. When this appeared to be entirely in accordance with Warburg ' s result, the experiment was repeated at 14° and 26°, in order to answer the second question. The experiment was made as follows. The algal film was repeatedly illuminated for 0.5, 1, 1.5, 2 or 3 minutes. Between the exposures the culture was in the dark for a much longer period. After due correction for respiration the assimilation during a period of exposure could be determined. The respiration was not constant but continually falling, and had to be determined several times during the experiment. The short exposures Had no observable influence on respiration (determined in the dark), so that an error was possibly not made in the respiration-correction (see Ch. I l l ; yet an increase of respiration during the short exposure, without an aftereffect on the respiration in darkness, is equally possible).
The illumination was effected with the projector lantarn at full capacity. A new lamp with a little more candle power had been placed in it. In spite of this fact the

596
light was no longer quite in maximum at 26° and the assimilation about 25 % lower than it could have been. Yet I gave the preference to this illumination, as in this case the light passed a layer of water of 16 cm thickness, by which desiccation of the algal film which can easily occur in a prolonged experiment at this temperature, could be prevented.
TABLE 22, (fig. 16).
The assimilation in the first minutes after the beginning of the illumination. Van den Honert's strain.
Exp. 93, 5-6-31. Temp. 20.00°. Assim. at 10.35 :795; per minute 13.25, reduced 10. Respir. at 11.20:73, at 12.50:54, at 15.47:50, at
18.35 :41.5.
Time
13.55 14.55 16.35 17.35 19.55
Duration in minutes
66 60 56 56 66
Exposure in minutes
6 x 1 5 x 2 4 x 3 8 x 0.5 6 x 1.5
Assimilation
24 81
115.5 11 59.5
Assim. in x minutes
4.0 16.2 28.9
1.4 9.9
Assim. reduced
3.0 12.2 21.8
1.1 7.5
Exp. 94, 8-6-31. Temp. 14.00°. Assim. at 11.25:549; per minute 9.15, reduced 6. Respir. at 12.55 : 46, at 15.50 : 38, at 18.35 : 32.
14.00 15.00 16.45 17.35 19.40
60 54 54 48 48
8 x 1 5 x 2
10 x 0.5 4 x 3 5 x 1.5
16 46 4.5 67 24
2.0 9.2 0.5
16.8 4.8
1.4 6.0 0.3
11.0 3.1
Exp. 95, 9-6-31. Temp. 26.00°. Assim. at 10.50:972; per minute 16.2, reduced 13. Respir. at 11.40:72, at 12.31:50, at 14.50:47, at
18.20 :42.5
13.25 14.05 15.40 16.30 17.20
43 46 48 50 48
4 x 2 6 x 1 8 x 0.5 4 x 3 5 x 1.5
85.5 57.5 29.5
174 93
21.4 9.6 3.7
43.5 18.6
17.2 7.8 3.0
34.9 14.9
ISL.

597
Before the periodical exposure the assimilation in constant light was determined. This is the optimum velocity which the assimilation can reach at alternative exposure.
In order to facilitate a comparison the optimum rate at 20° was put at 10 per minute. The optimum rate at 14° and 26° reduced to this value, can be calculated from fig. 11 in chapter VII. We find 5.75 and 14.8. Now that the light is not quite in maximum, the increase will be a little slighter, especially at high temperature. It seems to me better to round the numbers to 6, 10 and 13. The results of the three experiments are to be found in table 22.
The great accordance with the results of Warburg is evident from these data. This is distinctly shown by fig. 16. It appears that the final optimum rate is fairly well reached after two minutes. What strikes the eye most is the great difference between the three curves. At 26° already 1 mm3
has been assimilated after 12 seconds, at 14° this takes 55 seconds. This is certainly not a right measure for the induction process. If the possibility for assimilation is given as a result of the running down of the induction period, a larger quantity will be assimilated at higher temperatures, because the assimilation does proceed more rapidly at higher temperature. But this needs not point to a faster rate of the processes contributing the induction-chain.
In order to settle this point we have to see whether the optimum speed of the process is sooner reached at higher temperature than at lower. In practice it is difficult to state where the transition-point between curved and straight line is situated. It is much easier to fix another point; viz. the point at which the speed is one half of the final speed. A cross in- dicates this point in the figure.
This point is reached at 14° after 64, at 20° after 54, and at 26° after 24 seconds. A considerable difference is apparent. In spite of the fact that the optimum rate at 26° is much greater than at 14°, this higher rate of assi-

598
• (y
milation is reached much quicker than the lower at 14°. Therefore, the in- auction is greatly influenced by temperature, so that a chemical protoplasmic process plays a
part here; Warburg ' s idea of photochemical induction must be rejected.
We can also get an impression to what extent tem-peratur einfluences the induction, when we state the tem-peraturecoefficient from the values found at 14° and 26°. Qio appears to be 2.2 and is strikingly in accordance with the temperature-coefficients of respiration and photosynthesis. This affords a new argument for the conception that
induction is a process of a protoplasmic nature. It has been established, therefore, that, before assimilation
reaches its full intensity, a reaction takes place which is sensitive to temperature and caused by light. This points to a new indirect action of both factors in the photo-synthetic process. A chemical reaction must occur in the protoplasm under the influence of both factors, before the proper photosynthetic activity may begin.
Fig. 16. Assimilation in the first three minutes after the beginning of exposure to light at three different temperatures. The dots represent the rate of assimilation in 0.5, 1, 1.5, 2, and 3 minutes. The rate of assimilation rises to its full value (6, 10 and 13 per minute, represented by the lines in the right corner) in a few minutes. The crosses indicate the moment at which the speed of the process is half of the final speed. It takes ; a longer time before this point is reached at ( the lower temperature, which proves the sen- ) sitivy to temperature of the induction process.

599
B. The Course of Photosynthesis after a Long Period of Darkness.
The increase of assimilation, described above, must be distinguished from that which Os terhout and Haas (1918), Spoehr and Mac Gee (1923), Harder (1930) and Arnold (1931) observed during the course of the experiment.
Harder could demonstrate that the assimilation of Cladophora and Fontinalis sometimes kept increasing the whole day. This rise was not interrupted by periods of darkness, on the contrary this caused an increase of even longer duration. Finally an optimum was reached, and a decrease set in. Thus Harder showed that the assimilation under constant conditions is subject to alteration.
Os te rhout and Haas found a similar phenomenon with Ulva thallus. They stated, however, that the assimilation was already constant after 1% hours.
Finally, Spoehr and Mac Gee observed this increase with leaves which had been in the dark for a long space of time. As said before, this increase paralleled an increase in sugar content and respiration, and they pointed to the latter factors as the cause of the increase in assimilation.
It appeared already to van den Honer t (1928, 30) that an increase during the whole day, as was found by Harder , does not occur in Hormidium, and that the assimilation remains fairly constant. Only a slight increase of about 1 % an hour at 20° was stated. This result was regularly confirmed in my experiments. Van den Honer t thought that he could explain this by an increase of the living material.
However, when I look through my protocols, it is evident that there exists an initial increase, after a long stay in the dark and also in the dark wintermonths. A few examples will illustrate this:
Exp. 37, 7th Nov. 1930. First determination after 15 min.

600
exposure. Ass. at 20°, strong light: 22 in 5 min., 54 in 10, 29 in 5, 31, 32, 35, 34, 35, 37, 35, 34. The last 6 values are fairly constant; so the assimilation increased during 45 minutes.
Exp. 19th Nov. '30. Ass. per 5 min.: 28, 39, 44, 45, 43, 41, 42, 42. First determination after 10 minutes' exposure. After 20 min. the assimilation is constant.
Exp. 22nd Dec. '30. Exposure from 1.26 to 2.35; 1.40—1.50 : 23; then 28 in 10 min., 17 in 5, 82.5 in 30. Constant after 34 min. exposure.
Exp. 24th April '31. After 16 hours' darkness. First determination after 20 min. exposure. Ass. 56 in 5 min., 62 in 5, 62 in 5, 132 in 10, 127 in 10, 127 in 10; constant after ± 25 minutes.
The above examples, to which I could add a few more, give an impression of the assimilation during the first hour. There is, apparently also in Hormidium, an increase of assimilation, as Os terhout and Haas found in Ulva. The only difference is that the constant rate is reached earlier.
In the preceding chapters we have seen that, all other conditions being constant the assimilation can be stimulated by the addition of certain substances such as K C N, narcotics and sugars; so it is not at all impossible that substances formed during the assimilation, stimulate the assimilation, as Spoehr and Mac Gee think. I do not mean by this to give an explanation of the increase as found by Harder . It would seem to me very unlikely that this increase of long duration would entirely be a result of improved nutritional conditions. I only want to point here to one of the possible causes of this phenomenon.
It also appeared that the respiration increased during the exposure by purely plasmogeneous action of the light (Ch. III). If it is true that the assimilation can be influenced by other vital processes, the increase of assimilation may also be explained by this plasmogeneous influence of light.

601
CHAPTER XIIL Discussion.
It was mentioned before that some of Warburg ' s results are contradictory to mine. Of one of them we could say how Warburg might have arrived at his results, but not with any amount of certainty. It seems much more probable that the differences are due to the experimental material, and that Hormidium and Chlorella behave differently. x) Only a thorough, comparative study of the assimilation of these and other organisms, which I consider of the greatest importance, can throw light upon this subject.
Should my opinion be right, it seems better to base my considerations on my own results. It is of more importance that we understand the assimilation in one organism than that we attach too much importance to differences, possibly based on individual peculiarities. Especially if actually assimilation is controlled by other vital functions, there is no reason to be astonished at a different behaviour. There would be more reason for such astonishment if we had always studied the "real" photosynthesis, and the plasmatic factor had showed itself to be negligible.
We need not, therefore, to worry about the apparant discrepancy of our results and those of Warburg. It seems rather a support for the idea that photosynthesis is controlled by the organism which has an individuality of its own. /
A. The Assimilation Reacts to the Addition of Uncommon-Substances in a Similar Way under Different Conditions.
The following grounds may be given for this statement: I. The assimilation, when injurious materials are
1) The methods, too, are in principle the same.

602
added, is as much retarded in strong as in weak light (temperature or light intensity as limiting factors). We meet this in case of retardation owing to three altogether different causes, e.g. addition of a. phenylurethane, b. K C N, c. Ba Cl2. The recovery from this injury acts similarly, both in high and low light intensity.
II. The assimilation may be stimulated, and again the increase is of the same extent under both conditions, whether this stimulation is caused by a. diluted K C N, or b. glucose and fructose.
Therefore we may conclude that the assimilatory process behaves as a unity; it does not matter whether either light or temperature is the limiting factor.
In relation to this conclusion the work of Briggs may be mentioned here, Briggs (1922) found that the photo-synthetic activity of plants grown in culture solutions devoid of one of the elements necessary for normal growth was less than that of normal plants. This depression resulted whether light or temperature was the limiting factor. However, Br iggs ' results were contradicted by Gregory and Richards (1929). These investigators stated a slight depression of photosynthesis in light of low intensity, whereas the depression proved to be very marked in high light intensity. These very interesting results, however, may not be compared with the results of my experiments mentioned above, in which the immediate reaction of photosynthesis to the addition of unusual substances has been studied.
B. The Dependence of Photosynthesis of Internal Factors, A first argument for a dependence of the assimilatory
process on internal factors is the inconstancy of the assimilation while the external factors are kept constant,
Osterhout and Haas, Spoehr and Mac Gee, but especially Harder and Arnold have described this

603
phenomenon with other organisms. In Ha rde r ' s experiments the assimilation appeared to increase during the whole day. The decrease, which followed subsequently, and also the decrease that Ewart, Pantanel l i , Montfor t and Neydel, and Arnold could demonstrate, shows a similar dependence on internal factors. The results of Ewart and Pantanel l i are partly based on injury and accumulation of chloroplasts. An increase as described above also proved to exist in my experiments with Hormidium. The assimilation was inconstant after a long period of darkness. However, a constant rate of assimilation was reached after a rather short time ( ± % hour).
Another reason for the dependence of the assimilation on internal factors is the parallelism with the respiration (with Hormidium), which occurs in many cases.
The first striking parellelism between the two processes is that both assimilation and respiration may be stimulated with the same amount of greatly diluted K C N . Moreover, the assimilation is stimulated by the addition of sugars which in the first place may be looked upon as respiratory material, and usually stimulate the respiration. This seems to be important because it refutes a naive application of the mass-law to the process, according to which law a reaction product (sugar) should retard the reaction (photosynthesis) instead of stimulating it.
This parallelism is the more important as an increase in the rate of assimilation results, no matter whether the external conditions are such that light or temperature is limiting.
Other examples of a parallelism between the two processes are instances of a slight retardation of photo- synthesis (in weak and strong light!), which are always accompanied by a small decrease of respiration. This was found in case of retardation by K C N , phenylurethane and Ba Cl2. The recovery of a slight retardation, which always occurs in course of time, proceeds in a similar way in both processes.

604
The assimilation is more considerable in strong than in weak light. Nevertheless we have seen that it can increase in weak light under changed internal conditions (addition of sugars). So we supposed that the increased assimilation in strong light, besides being a result of the greater quantity of light that can do photosynthetic work (direct action), is also a result of internal factors, changed under the influence of light (indirect action). There is all the more reason for this opinion, as we were able to show that the protoplasm is strongly affected by light. Respiration increased considerably, which is, to be sure, caused by the formation of sugars (ergastogeneous action; at the same time a cause for greater assimilation), but for the greater part light affects the protoplasm directly (plasmogeneous action). The actively assimilating organism also respires actively.
Temperature affects both processes in a similar way. The idea of a possible connection between them would be rather untenable, if this had not been the case. Heating causes a very regular acceleration of the two processes, so that the types of the resulting curves are altogether the same. The coefficients of temperature differ only very little; from 15°— 2̂5° Q10 is 1.96 for the assimilation, 1.91 for the respiration. The resemblance is so great that it could be accounted for by a full dependence of assimilation on respiration (Spoehr and Mac Gee).
The optimum rate of photosynthesis does not set in immediately after the beginning of the exposure to light. Temperature is of great influence on the duration of this induction-period, by which it is proved that the phenomenon is not founded on photochemical induction (Warburg). So an internal chemical reaction (or a chain of reactions) must precede assimilation. The temperature coefficient of this induction time resembles the coefficient of respiration, though a very accurate determination seems impossible. From 14°—26° QN, amounts to about 2.2.

605
In addition to our statements of a correlation between assimilation and respiration in Hormidium, it may be mentioned here that P lester (1912), Boysen Jensen (1918), Henric i (1918), Spoehr and Mac Gee (1923), Gregory and Richards (1929), found a correlation between the intensity of assimilation and the intensity of respiration in other organisms.
These were the arguments in favour of a relation between assimilation and respiration, now a few will follow that seem to point in another direction. K C N, phenylurethane or BaCl2 in high concentrations, causing a strong decrease of assimilation, affect the respiration in quite another manner. An entire cessation of the first process may be accompanied by a rather strong or slight retardation, or even by a slight rise of the respiration. This result is in accordance with the results of other investigators (Jacobi, I rving, Thoday, Warburg).
Another discrepancy arose after removal of K C N or Ba Cl2 in my experiments. The respiration recovered in this case at once to the initial value, the assimilation recovered incompletely. In case o f K C N the assimilation also managed to recover after a longer period, but at all events there was a difference in the time in which a complete recovery set in.
A few more discrepancies were found in the experiments with sugars.
The parallelism of the two processes was to us a ground for the dependence of the assimilation on internal factors, and the few cases in which this parallelism did not hold, certainly cannot invalidate the occurrence of this phenomenon. It is plausible that, when an organism is injured in the first place the normal vital functions as metabolism, growth, propagation are stopped, without death following inevitably. On the contrary; the organism will defend itself against the injurious influences and

606
consequently may manifest an increased oxygen consumption. It is a well-known fact that e.g. wounding stimulates the consumption of oxygen.
In our case a high concentration of injurious material retards the normal function of the organism, the assimilatory apparatus (or perhaps also an internal regulatory process), suffers direct injury. But the organism is not yet dead, it can defy much larger doses of poison before respiration will at last come to a standstill.
If this opinion is correct the quantitative determination of respiration in these stronger concentrations has lost its importance for the study of photosynthesis.
In exp. 63 I even stated an increase of respiration of 14 % in high concentration of K C N. I rv ing (1911) and Warburg (1921) found a strong stimulation in high concentrations, in which assimilation is greatly retarded. They found, however, a gradual decrease of respiration after exposure to very high concentrations.
This may show the cause for the difference in Warburg ' s and my own results. The „pathological" rise of respiration may have started a little earlier in Chlorella, and may also be a little stronger than in Hormidium, so that a parallelism might have become totally hidden.
So the non-appearance of parallelism in case of strong retardation need not be contradictory to the parallelism observed in case of moderate retardation.
The other discrepancies are no more of great importance. The assimilation, after the poison being removed, did not recover directly, though the respiration had recovered. But ultimately we may also take this as an argument in favour of a connection with internal processes (recovery from injury, which takes time).
The discrepancy mentioned in the chapter on the influence of sugars — a retardation of respiration was

607
found twice, though the assimilation had increased — is neither very convincing. After the removal of the sugar the respiration appeared to increase, so that the presence of sugar, though beneficial to some processes, appeared to be injurious to others (perhaps osmotic action). So the influence is probably more complicated than one would superficially think (see also Genevois, 1927) and the deviation found is, therefore, no more an important argument.
C. The Explanation of the Parallelism of Respiration and Photosynthesis.
We now come to discuss the question in which way we must explain the parallelism of assimilation # and respiration.
1. Spoehr and Mac Gee think that the assimilation is directly dependent on the respiration, and that very active splitting products of carbohydrates, which arise by respiration, play a part in the assimilatory process. We shall see if there is any reason to accept such a direct connection.
2. One may also have the idea that assimilation does not depend directly on the respiratory processes themselves, but on some protoplasmic functions in general, and that, consequently, there is a certain parallelism with the consumption of oxygen, which is so to say a resultant of all protoplasmic functions.
3. Finally we may suppose that this parallelism is not based on a causal dependence of the assimilation on other processes, but that it is based on a joint cause, which acts on all processes in a similar way. We might for instance imagine that the colloidal structure of the plasmatic proteins changes, and consequently the processes which depend on such a structure.
Let us first consider the third case. We can easily see that a retardation of both processes may be caused by a

608
structural change. The surfaces where the vital processes occur may be destroyed, or taken up by strange substances by which essential substances are expelled.
In this connection it may be mentioned here that Briggs (1922) holds the opinion that the weaker assimilation of plants grown in insufficient nutrient solution, would be caused by a retarded development of the reactive surface.
The above theory could not, however, explain the recovery of a function. If this recovery had been found only once, another explanation would certainly have been possible. The phenylurethane might have been oxidized, the KCN dissociated otherwise under the influence of a changed pH (a result of paralysis of function), etc. The very fact that the recovery is the same under all influences (probably also after extreme temperature (cf. p. 612—613), addition of chloroform (Irving), or electrolytes (Shibata)—points, however, to an active interference of the organism.
That the alteration of the assimilation under uncommon influences would be simply caused by a passive structural change seems, therefore, very improbable. The organism must always assist with an action of its own, either passively (e.g. more,sugars, more oxidation), or actively, which will be the case in a recovery.
So the first mentioned two possibilities remain. Does the respiration supply the energy necessary for the assimi-latory process directly x) (1 ), or is the assimilation controlled by definite vital functions, which in their activity are more or less dependent on the total vitality, consequently also on the oxygen consumption, which we may take as a criterion of the vitality (2).
The temperature coefficients of assimilation and respiration do not conflict with the first opinion, as they are
1) Except, of course, the light energy which is necessary in the first place.

609
almost equal. The equality offers even a somewhat greater support for this opinion. Dependence on other vital functions might be in accordance with different Q10. It is inessential and improbable that all vital functions of the same organism are affected by temperature in the same way.
Neither does the dissimilar retardation in high concentrations of injurious substances speak against a direct relation, if we assume that the superficial functions are injured, and the increase of respiration has a quite different cause; it might be the result of the active reaction against the injurious influence.
Other facts, however, seem to contradict such a dependence. We found that light causes respiration to increase. However, in the experiments in Chapter XII the agreement is less satisfactory. In those experiments we started to determine both assimilation and respiration. The latter proved to be very high, which seems plausible, since in the month of June the alga got daylight already for a great many hours before the experiment began and the nights were short. It appeared now that respiration fell considerably in the course of the day, in spite of repeated illuminations of short duration. The assimilation, however, was able to rise nearly to the first stated level within a few minutes, without the respiration being interrupted appreciably in its fall. The possibility remains, however, that the respiration did indeed increase during the short period of illumination, but that this short exposure had no after-effect. But even if this is not the case, the hypothesis need not be abandoned yet, though it cannot be maintained unaltered. One may claim that a certain amount of respiration is' necessary, but that, as soon as it has been reached, a further increase can only be of little influence. Respiration is here considered to be a factor that can be limiting, or not.
The experiments on the influence of sugars, however, do not agree very well with this amended hypothesis.
39

610
Parallelism after a treatment with sugars was not clearly expressed. It is true that respiration increased in general, but this increase did not agree much with that of assimilation. However, it seems to me too early to reject the interesting hypothesis of Spoehr and Mc Gee in the face of my experiments.
Personally I am of the opinion that the remaining second case explains the facts in the most satisfactory way. There is no direct causality between assimilation and respiration, but a relation between assimilation and some protoplasmic functions, which are, however, (like all vital functions) closely connected with respiration. The connection between the two processes of assimilation and respiration may be less close now. We need not be surprised when, after KCN or Ba Cl2 being removed, respiration recovers more quickly than assimilation, while the somewhat irregular behaviour in sugar-solutions is no more disquieting.
Whatever the explanation of the parallelism of respiration and assimilation may be, we must claim a connection between photosynthesis and other protoplasmic processes. a. The equality of the temperature coefficients; b. the parallel stimulation or slight retardation after the
addition of chemicals; c. the parallel and simultaneous recovery after retardation; d. a chemical process preceding the assimilation of which
Q10 is almost equal to the coefficient of respiration; are all grounds for the assumption of a close connection between assimilation and other protoplasmic functions.
D. The Reaction of Photosynthesis to Injurious Influences. We have mentioned repeatedly the reaction to abnormal
influences. It may be well to discuss this again at the hand of the diagram represented in fig. 17. The lines 1 and 2 show the cessation of the assimilation after more

611
or less time. This happened in exp. 66 and 69 after the addi- tion of KCN in exp. 92 after the addition of Ba Cl2. A quick, and a successive slow, decrease (line 3) was also found with KCN. Type 4 was very frequently found, a rather strong retardation, followed by recovery. It manifested itself in experiments with the three substances investigated. Type 5, retardation, passing into an increase, resulted in experiments with KCN. Type 6 and type 7
give the experimental results with diluted KCN and sugars. The results obtained all show the gradual transitions between very strong- and almost immediate-retardation and stimulation.
The types 4—7 were also determined for the respiration. In case of a stronger injury of the assimilation, respiration behaves differently.
Another interesting fact was that in the experiments with KCN the effect did not depend on the concentration of this substance. A moderate retardation was obtained with a strong concen
tration, and a strong retardation another day with a weaker one. Consequently, the incidental disposition of the alga determines whether the effect will be strong or weak.
I had already drawn this diagram, when I was struck by the great resemblance with a figure in Miss Irving's work (1911; fig. 7, p. 1083). This diagram bears on the influence of chloroform on respiration of cherry-laurel leaves and young barley shoots. My types of curves are to be found back there. The concentrations used are rather high, and retarded the assimilation completely in her
Fig. 17. Diagram to illustrate the various types of reaction of the assimilatory and respiratory processes upon the addition of unusual substances. For explanation see text.

612
experiments. It is, however, of great interest that we find a similar mode of reaction for the respiration of these plants and for the assimilation of Hormidium, while this parallelism partly applies to the respiration of this alga,
Shibata (1929) too, gives curves that are fundamentally the same, and in which all my types can be found back. He investigated the antagonistic action of electrolytes on the respiration of Chlorella.
The deviations of some points on my temperature-assimilation curve will also be very plausibly explained by assuming the occurring of reaction-type 4, as a result of the action of high or low temperature (cf. the following paragraph).
So it seems that the diagram indicates a very general reaction of the organism on a factor, uncommon to its ordinary conditions of life.
B. An Attempt to Explain the too Large Deviations of Some Determinations on the Influence of Temperature on Photosynthesis from the Average, and a Few Remarks on Optimum Curves.
We saw in the chapter on the influence of temperature on assimilation (Chapter VII) that the deviations of the individual determinations from the average curve were in many cases larger than might be expected in connection with the accuracy of the method. When discussing this fact it was already pointed out that attempts would be made later on to account for these variations with the aid of other results. These results were obtained in the Chapters VIII, IX and XI. It has been discussed in the former paragraph that assimilation reacts in principle in the same way to injurious influences, however different they may be (addition of KCN, phenylurethane or Ba Cl2): after the initial strong decrease of assimilation a recovery of the function may start.

613
Now in the first place it strikes us while studying the results of experiments on the influence of temperature, when no high temperatures (30° and upwards) were investigated in the experimental series, deviations did not appear. This shows very distinctly from the experiments carried out in May 1931 (table 8), in which high temperatures were avoided, but also from exp. 38 and 43 (table 6).
An example of great variations is to be found in exp. 42. At 19.5° the assimilation is 317, at 23,5° it is 513, at 31.5° 678, at 23.5 again 449, as we see much lower, in spite of the difference in time of 2 h, 35 min. The last determination in this experiment, also at 19.5° gives 312, in other words the assimilation is again nearly as high as 5 h. 45 min. ago; the assimilation that had been found much too low at 23.5°, has almost completely recovered at 19.5. This bears a strong resemblance to the results obtained with poisons.
So I think I am able to explain this variation in the determinations from the normal reaction to the injurious influence which in this case had been the high temperature.
In exp. 41 we observe something similar, though a little less pronounced. After a rise of temperature to 30° the next determination at 22° is not higher than the one at 22°, booked 2 h. 45 min. earlier, while the following values at 18° and 14° were higher than before. (The first determination at 18° is rather a little too low)..
In experiments 39 and 40 the influence of a lowering in temperature has been investigated. The first values of these experiments are represented by the evidently lowest points at 30° and 29° in fig. 11. This is easy to understand. From the very cold windowsill the algae were suddenly exposed to these high temperatures, so it is a matter of
' course that the lowering action makes itself strongly felt now. In exp. 40 the low temperature at 4° has also been
investigated. The next reading at 14° turned out 4 % lower than the preceding one, in spite of a 5 hours' difference

614
in time. So a low temperature has apparently the same influence as higher ones. This is a new base for the generality of this reaction. There are, however, no observations as to the appearance of recovery after low temperatures. So we see that the deviations from the average curve can be explained from the physiological reaction to an injurious influence.
Not only the variations of individual determinations, but also the less steep course of the curve at higher temperature (fall of Q10) can be explained by the physiological reaction to injurious stimulants.
It may be mentioned here that, if my explanation is true, this might be to a certain extent a support for Black man's classical theory about the optimum.
Blackman (1905) is of opinion that a slighter increase of the rate of reaction at high temperature is a result of the injurious action of this temperature, and that in this way the optimum-curves, so often met with in physiology, might be explained. Even before the optimum were reached, a less strong rise of the curve might be caused by the influence of this injurious action.
Therefore, the lower intensity of assimilation when experimenting again at lower temperature might support Blackman's opinion. But the difference between this conception and my own results is, that in my experiments the injury is followed by a recovery.
Neydel (1930), working with Cladophora, noted an immediate recovery of the assimilation after the exposure to high temperature. In my own experiments the recovery takes a rather long time, but I believe this difference is not essential.
A transition between Blackman's theory and the conception of the real physiological optimum is apparent in my results. The reversibility of the optimum curve seems to be determined by the time wanted for the recovery,

615
which may vary between zero (Ne y del) and the infinite (Blackman).
I was not able to state a light-intensity optimum of photosynthesis in intensities up to 8000 Lux with algae cultivated in daylight. This is entirely in accordance with the results of van den Honert . However, algae cultivated in weak artificial light, showed a slight decrease of assimilation in high light intensity (fig. 9). In two other cases the assimilation was even brought to a standstill, and the absorption of oxygen began to predominate.
Finally, carbon dioxide did not show any influence in high concentrations in van den Honert 's experiments. I can confirm this altogether. Up to a concentration of 1 % the curve is quite parallel with the abscissa and does not show any tendency to fall.
F. Blackman's Rule of Limiting Factors. In the fifth chapter, in which the relation between C02
concentration and assimilation has been established, the peculiar Blackman curve seemed to disappear altogether, when the reaction was retarded by the addition of narcotics, and to show a logarithmic type, established by other investigators (e.g. Harder) . One may think here of a slower chemical combination of the C02 (or a product derived from it) with other substances. Complications might also be assumed. The question was put whether the respiration with different COa concentrations had perhaps become deviating, but this proved not to be the case in a testing experiment. Whatever the explanation of the C0 2 concentration-assimilation curve after the addition of urethane or antipyrin must be, the remarkable fact remains that the Blackman curve has altogether disappeared.
The light intensity-assimilation curve of van den Honer t and the criticism on his method of illumination led to the opinion that a better approach to the Blackman's

616
scheme might be possible. It is therefore of interest that this did not prove to be so and the curve kept a same logarithmic type with an improved experimental technique, and did not show any tendency to approach a straight curve with a sharp break.
The preceding considerations, in which the probability of an indirect action of external factors was claimed on more than one ground, makes it very unlikely that Blackman-curves will often be met with. These curves sometimes appear in incidental circumstances, such as the C02
concentration-assimilation curve of van den Honer t .
Summary of the Principal Results. A very simple, but at the same time very accurate
manometrical apparatus is described. Films of only a single cell layer of the filamentous alga Hormidium flaccidum or the sub-species H. nitens, served as experimental objects.
A parallelism between assimilation and respiration was repeatedly observed. Both processes can be stimulated by the addition of highly diluted K C N or of sugar to about the same degree. Not too strong a retardation of photosynthesis, caused by higher concentrated K C N, by Ba Cl2 or phenylurethane is accompanied by a decrease of respiration. This parallelism disappears in case of a strong retardation of assimilation. When the retardation is not too strong a recovery will follow. This occurs simultaneously and in about the same measure for both processes.
Temperature affects them both in a similar way; Q10
is at moderate temperatures rather constant: it is from 15° to 25° for the assimilation 1.96, for the respiration 1.91.
The influence of various substances on assimilation is of equal strength, whether light or temperature is the limiting factor, which for K C N is contrary to the results

617
of Warburg, whose theory, therefore, may not be said to be of general validity.
Another fact found by Warburg in the case of Chlorella, viz. the impossibility of retarding the assimilation below the compensation-point of assimilation and respiration by means of K C N , could not be confirmed with Hormidium.
It will last a few minutes before the assimilation after a period of darkness reaches a constant final speed. This phenomenon is highly sensitive to temperature, and consequently is not caused by photochemical induction (Warburg), A chemical process must precede the beginning of the assimilation. The Q10 of this process is, determined roughly, 2.2, and of about the same magnitude as that of respiration and assimilation.
After a long period of darkness an initial increase of photosynthesis, was found, but after half an hour it proved to be fairly constant.
The facts mentioned led to the conclusion that the assimilation is dependent on an internal factor. If this internal factor is the extent of the available, active surface — a supposition made by Briggs in order to explain subnormal assimilation of young and starving plants — then this factor is nevertheless directly dependent on other active internal factors (as was a.o. proved by the recovery of the function after the addition of toxic chemicals).
Respiration is increased during the exposure to light. It could be made plausible that this increase cannot be due to a rise in temperature. The increase is partially caused by the production of carbohydrates, but for the' most important part it is a result of the action of light on the protoplasm.
Light, therefore, causes other protoplasmic reactions in addition to photosynthetic. Consequently light may affect the assimilatory process indirectly.

618
The light intensity-assimilation curve showed, under improved experimental conditions, the normal image of a logarithmic curve. It does not at all approach the scheme proposed by Blackman.
The Blackman-curve, which was found by van den Honer t for the influence of C02, disappears when the assimilation is retarded by phenylurethane or antipyrin.
Finally the assimilatory-quotient of Hormidium approximates to unity.
I started this investigation at the Botanical Laboratory of Utrecht University and I should like to express my grateful thanks to Professor F. A. F. C. Went for the undiminished interest he took in my work up till the end.
By far the greater part of the investigation was carried out at the Laboratory of Technical Botany at Delft and I am very much obliged to Professor G. van I terson for his valuable help, wherefore I am thanking him particularly.
Literature. F. Aereboe, Forsch, a. d. Gebiete d. Agrikult. phys. 16, 429, 1893. J. E. van Amstel, Ree. trav. bot. néerl. 13, 1, 1916. A. Arnold , Planta 13, 529, 1931. E. Beljakoff, Planta 8, 269, 1929. C. Bernard, Leçons sur les phénomènes de la vie, etc. Paris, 1878. F. F. Blackman, Ann. of Bot. 19, 281, 1905.
and G. L. C. Matt ha ei, Proc. Roy. Soc. B, 76, 402, 1905. and A. M. Smith, Proc. Roy. Soc. B, 83, 374, 1911.
S. R. de Boer, Ree. trav. bot. néerl. 25, 117, 1927. Chr. Bohr, Ann. Physik u. Chem. N. F. 62, 644, 1897; Ann. Phys.
u. Chem. N. F. 68, 500, 1899. A. E. H. R. Boonstra, Planta 10, 108, 1930. J. Borodin, Just's Bot. Jahresber. 4, Abt. II, 919, 1876; Mém.
acad. imp. sei. St. Pétersbourg, Vile Sér. 28, No. 4, 1, 1881. J. C. Bose, The Physiology of Photosynthesis. London 1924. P. Boysen Jensen, Bot. Tidskr. 36, 219, 1918.
and D. Müller, Jahrb. f. wiss. Bot. 70, 493, 1929; Jahrb. f. wiss. Bot. 70, 503, 1929.

619 .
G. E. Br iggs , Proc. Roy. Soc. B, 94, 20, 1922. W. H. Brown, Philippine Journ. Sei. C. Bot. 13, 345, 1918.
— and G. W. Heise , Phil. Journ. Sei. C. Bot. 12, 1, 1917; Phil. Journ. Sei. C. Bot. 12, 85, 1917.
R. Emerson , Journ. Gen. Physiol. 10, 469, 1927; Journ. Gen. Physiol. 12, 609, 1929; Journ. Gen. Physiol. 12, 623, 1929.
A. J. Ewar t , Journ. Linn. Soc. Bot. 31, 364, 1896; Journ. Linn. Soc. Bot. 31, 554, 1897; Ann. of Bot. 12, 415, 1898. ,
L . Genevois , Biochem. Zeitschr. 186, 461, 1927. F . G. G rego ry and F . J. R i cha rds , Ann. of Bot, 43, 119, 1929. R. Ha rde r , Jahrb. f. wiss. Bot. 56, 254, 1915; Jahrb. f. wiss. Bot.
60, 531, 1921; Planta 11, 263, 1930. M. Hen r i c i , Verhandl. nat.-forsch. Ges. Basel, 30, 43, 1919. G. Ho l s t , Electrische lichtbronnen en haar eigenschappen. Haar
lem, 1920. T. H. van den Hone r t , Diss. Utrecht, 1928; Ree. trav. bot.
néerl. 27, 149, 1930. A. A. I rv ing , Ann. of Bot. 25, 1077, 1911. B. Jacobi , Flora 86, 289, 1899. N . J ohansson , Svensk Bot. Tidskr. 17, 215, 1923; Svensk Bot.
Tidskr. 20, 107, 1926. H. Kn i ep , Internat. Rev. Hydrobiol. u. Hydrogr. 7, 1, 1914. S. Kos ty t s chew, Planta 13, 778, 1931.
K. Bazyr ina and W. Tschesnokov , Planta 5, 696, 1928. and V. Berg, Planta 11, 144, 1930. and H. Kardo—Syssoiewa, Planta, 11, 117, 1930. M. Kudr i avzewa , W. Moisse jewa and M. Smi rnowa ,
Planta 1, 679, 1926. and S. So lda tenkow, Planta 2, 1, 1926. W. T s che snokov andK. Bazyr ina , Planta 11, 160, 1930.
A. K rogh , The Respiratory Exchange of Animals and Man. London 1916; Biochem. Journ. 14, 267, 1920.
T s i - T u n g L i , Ann. of Bot. 43, 587, 1929. A. Löwsch in , Beih. Bot. Centralbl. 23, Abt. I, 54, 1908. W. Lub imenko , Comp. rend. acad. sei. 143, 609, 1906. H. L u n d e g â r d h , Svensk Bot. Tidskr. 15, 46, 1921; Der Kreislauf
der Kohlensäure in der Natur. Jena 1924; Biochem. Zeitschr. 154, 195, 1924; Flora 121, 273, 1927.
L . M a q u e n n e and E. Demoussy , Comp. rend. acad. sei. 156, 506, 1913.
G. L . C. Ma t t hae i , Phil. Trans. Roy. Soc. London, B. 197, 47, 1904.

620
N. A. Maxiraow and T. A. Krasnosse l sky—Maximow, Ber. deuts. bot. Ges. 46, 383, 1928.
A. Meyer and N. T. De leano , Zeitschr. f. Bot. 3, 657, 1911; Zeitschr. f. Bot. 5, 225, 1913.
C. Mon t fo r t and K. Neyde l , Jahrb. f. wiss. Bot. 68, 801, 1928. K. Neyde l , Biochem. Zeitschr. 228, 451, 1930. K. Noack, Naturwiss. 14, 383, 1926. W. J. V. O s t e r hou t and A. R. C. Haas , Journ. Gen. Physiol.
1, 1, 1918; Journ. Gen. Physiol. 1, 295, 1918. E. Pan tane l l i , Jahrb. f. wiss. Bot. 39, 167, 1904; Ber. deuts. bot.
Ges. 32, 547, 1914. A. Pascher , Die Süsswasserflora Deutschlands, Oesterreichs und
der Schweiz. H. 6: Chlorophyceae I II . Jena, 1914. H. P lae tzer , Verhandl. phys. med. Ges. Würzburg, 45, 31, 1917. L. P lan tefo l , Ann. sei. nat. Bot. 10e Sér. 9, 1, 1927. W. P les ter , Beitr. Biol. Pflanzen, 11, 249, 1912. I. P lo tn ikow, Abderhalden Handb. Biol. Arbeitsmeth. I l l , A 2,
1653. Th . Saba l i t s chka and H. We id l ing , Biochem. Zeitschr. 176,
210, 1926. Th . Schmucker , Biochem. Zeitschr. 195, 149, 1928. M. Sh iba ta , Sei. Reports Tôhoku Imp. Univ. 4e Ser. 4, 431, 1929. H. A. Spoehr , Photosynthesis, New York 1926.
and J. M. Mc Gee, Carnegie Inst. Washington, Publ. 325, Washington 1923.
W. S t i les , Photosynthesis, London 1925. O. S tocker , Flora 121, 334, 1927. D. Thoday , Ann. of Bot. 27, 565, 1913. O. T r eboux , Flora 92, 49, 1903. O. A. Wal the r , Flora 121, 301, 1927. O. Wa rbu rg , Biochem. Zeitschr. 100, 230,1919; Biochem. Zeitschr.
103, 188, 1920; Biochem. Zeitschr. 119, 134, 1921; Naturwissenschaften 9, 354, 1921.
and E. Nege le in , Zeitschr. physik, Chem. 102, 236, 1922. and T . Uyesug i , Biochem. Zeitschr. 146, 486, 1924.
R. Wi l l s t ä t t e r and A. S to l l , Untersuchungen über die Assimilation der Kohlensäure, Berlin 1918.
M. Yabusoe , Biochem. Zeitschr. 152, 498, 1924. Y. Yoshi i , Planta 5, 681, 1928.
15

STELLINGEN
i
Bij de bcstudeering van levensprocessen moet
steeds de mogelijke actieve invloed van het
organisme op het bestudeerde proces in het oog
worden gevat.
II
Inwendige processen oefenen een sterken
invloed uit op de koolzuurassimilatie.
III
Het onderzoek van SMITH, DUSTMAN en SHULL
houdt geen weerlegging in van de meening van
SCHMUCKER, dat aan actieve (vitale) processen bij
de transpiratie van het blad een belangrijke rol
moet worden toegeschreven. F. Smith, R. B. Dustman en Ch. A. Shull, Bot. Gazette 9 1 , 395, 1931. Th . Schmucker, Jahrb. f. wiss. Bot. 6 8 , 771, 1928.

IV
De waarneming van NAVEZ, dat de tempera-
tuur-coëfBciënten van ademhaling en geotropischen
reactie- en presentatietijd overeenstemmen, wijst
op een indirecten invloed van de temperatuur op
het geotropisch proces, 0 -
A. E. Navez, Journ. Gen. Physiol 12, 641, 1929.
V
De zwaartekracht richt de autonome be
wegingen van de slingerplanten.
VI
Wanneer de invloed van een factor op de
ontwikkeling van microörganismen onderzocht
wordt, mag niet volstaan worden met de bepaling
van de „eindopbrengst", maar moet het geheele
verloop van de ontwikkeling worden nagegaan.
VII
Het is waarschijnlijk dat er zich tusschen den
primairen en den secundairen wand van het katoen-
haar een net van cellulose bevindt, waarvan de
draden in de richting van de as van het haar en
loodrecht op deze richting verloopen. A. P. Sakostschikoff en G. A. Korsheniovsky, Faser f or schung 9, 249, 1932.

L\j.at:\-Z^~-^y m
VIII
De veranderingen in de samenstelling van het
woud in den postglacialen tijd zijn in de eerste
plaats door wijzigingen van het klimaat veroorzaakt.
IX
De vaststelling van den phylogenetischen samen
hang van de soorten is wel een hulpmiddel, maar
niet het einddoel van de systematiek.
X
Aan het zoogenaamde compensatiepunt van
ademhaling en koolzuurassimilatie mag als oeco-
logische factor geen -groote waarde worden
toegekend.
XI
' ' Het is niet mogelijk soorten van het geslacht
Fusarium te identifleeeren naar hun gedrag tegen^
over groeivertragende stoffen (als malachiet-groen)
in den voedingsbodem, zooals door COONS en
STRONG is voorgesteld, G. H. Coons en M. C. Strong, Agric. Exp. Stat. Mich. St. Coll., Techn. Bull. No. 1 15 , 1931.

XII
Wegens het zwak-parasitaire karakter van
Cytospora zijn cultuurmaatregelen ter bestrijding
van Cytospora-ziekten van meer belang dan de
toepassing van directe bestrijdingsmiddelen.
XIII
De geleiding van een impuls door een zenuw
gaat met vermeerderd zuurstofverbruik gepaard.
XIV
De meening van MERKER, dat het aan de opper
vlakte verschijnen van aardwormen na een regenbui
door de afneming van het zuurstofgehalte van den
bodem veroorzaakt zou zijn, is door FOCKE
afdoende weerlegd.
E. Merker, Zool. Jahrb.; Abt. Zool. u. Physiol, d. Tiere. 4 2 , 487, 1926.
F . Focke, Zeitschr. f. wiss. Zool. 1 36 , 376, 1930.